Midway, LA Map & Demographics
Midway Map
Midway Overview
$16,524
PER CAPITA INCOME
$52,689
AVG FAMILY INCOME
0.42
INEQUALITY / GINI INDEX
749
TOTAL POPULATION
440
MALE POPULATION
309
FEMALE POPULATION
142.39
MALES / 100 FEMALES
70.23
FEMALES / 100 MALES
34.1
MEDIAN AGE
3.4
AVG FAMILY SIZE
2.5
AVG HOUSEHOLD SIZE
366
LABOR FORCE [ PEOPLE ]
60.1%
PERCENT IN LABOR FORCE
Income in Midway
Income Overview in Midway
| Characteristic | Number | Measure |
| Per Capita Income | 749 | $16,524 |
| Median Family Income | 193 | $52,689 |
| Mean Family Income | 193 | $47,274 |
| Median Household Income | 296 | $0 |
| Mean Household Income | 296 | $36,057 |
| Income Deficit | 193 | $0 |
| Wage / Income Gap (%) | 749 | 0.00% |
| Wage / Income Gap ($) | 749 | 100.00¢ per $1 |
| Gini / Inequality Index | 749 | 0.42 |
Earnings by Sex in Midway
| Sex | Number | Average Earnings |
| Male | 260 (68.4%) | $0 |
| Female | 120 (31.6%) | $0 |
| Total | 380 (100.0%) | $0 |
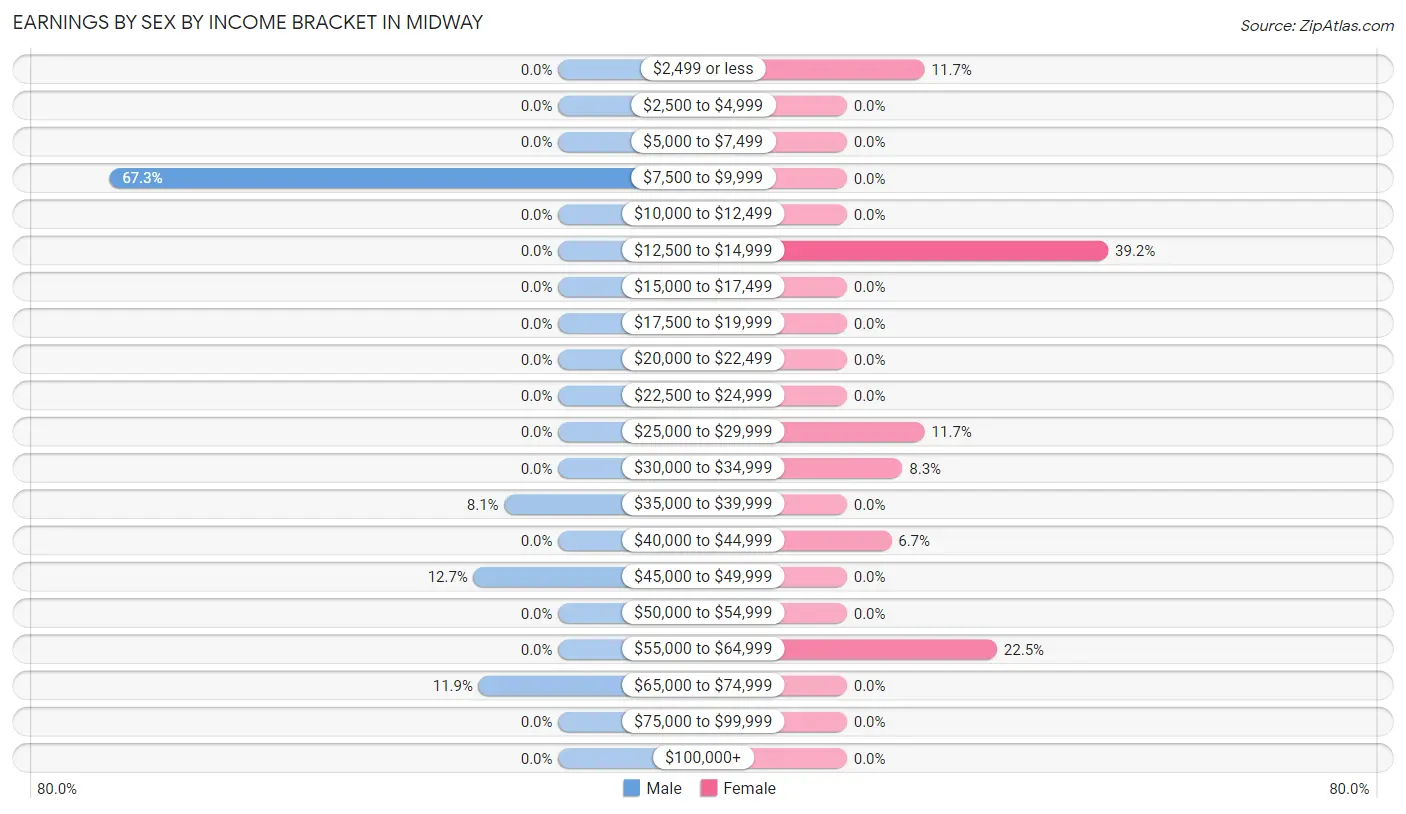
Earnings by Sex by Income Bracket in Midway
The most common earnings brackets in Midway are $7,500 to $9,999 for men (175 | 67.3%) and $12,500 to $14,999 for women (47 | 39.2%).
| Income | Male | Female |
| $2,499 or less | 0 (0.0%) | 14 (11.7%) |
| $2,500 to $4,999 | 0 (0.0%) | 0 (0.0%) |
| $5,000 to $7,499 | 0 (0.0%) | 0 (0.0%) |
| $7,500 to $9,999 | 175 (67.3%) | 0 (0.0%) |
| $10,000 to $12,499 | 0 (0.0%) | 0 (0.0%) |
| $12,500 to $14,999 | 0 (0.0%) | 47 (39.2%) |
| $15,000 to $17,499 | 0 (0.0%) | 0 (0.0%) |
| $17,500 to $19,999 | 0 (0.0%) | 0 (0.0%) |
| $20,000 to $22,499 | 0 (0.0%) | 0 (0.0%) |
| $22,500 to $24,999 | 0 (0.0%) | 0 (0.0%) |
| $25,000 to $29,999 | 0 (0.0%) | 14 (11.7%) |
| $30,000 to $34,999 | 0 (0.0%) | 10 (8.3%) |
| $35,000 to $39,999 | 21 (8.1%) | 0 (0.0%) |
| $40,000 to $44,999 | 0 (0.0%) | 8 (6.7%) |
| $45,000 to $49,999 | 33 (12.7%) | 0 (0.0%) |
| $50,000 to $54,999 | 0 (0.0%) | 0 (0.0%) |
| $55,000 to $64,999 | 0 (0.0%) | 27 (22.5%) |
| $65,000 to $74,999 | 31 (11.9%) | 0 (0.0%) |
| $75,000 to $99,999 | 0 (0.0%) | 0 (0.0%) |
| $100,000+ | 0 (0.0%) | 0 (0.0%) |
| Total | 260 (100.0%) | 120 (100.0%) |
Earnings by Sex by Educational Attainment in Midway
| Educational Attainment | Male Income | Female Income |
| Less than High School | - | - |
| High School Diploma | - | - |
| College or Associate's Degree | - | - |
| Bachelor's Degree | - | - |
| Graduate Degree | - | - |
| Total | $46,629 | $0 |
Family Income in Midway
Family Income Brackets in Midway
According to the Midway family income data, there are 60 families falling into the $50,000 to $74,999 income range, which is the most common income bracket and makes up 31.1% of all families.
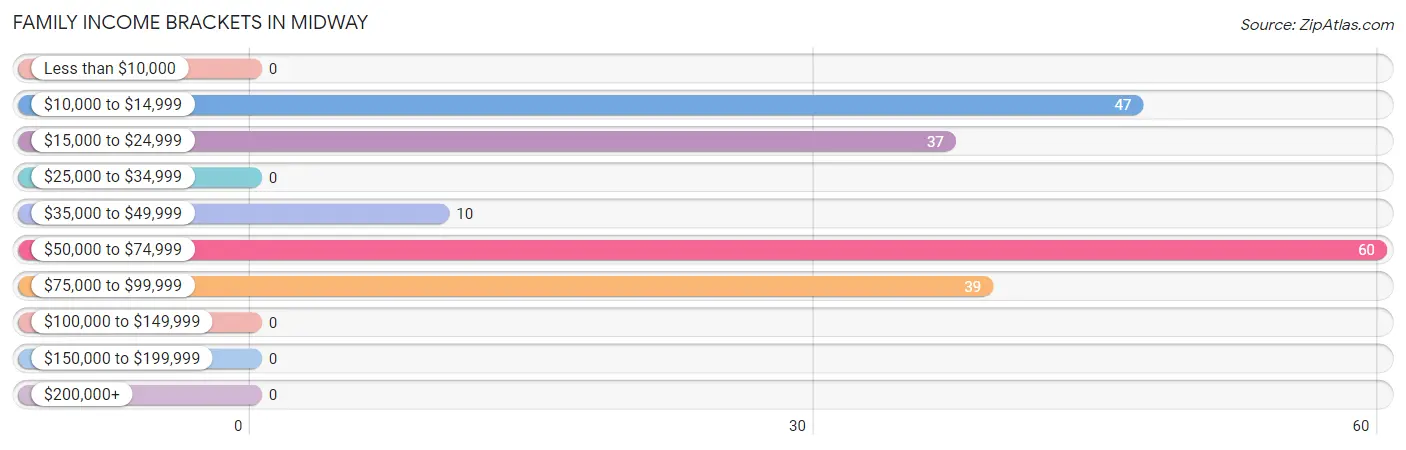
| Income Bracket | # Families | % Families |
| Less than $10,000 | 0 | 0.0% |
| $10,000 to $14,999 | 47 | 24.4% |
| $15,000 to $24,999 | 37 | 19.2% |
| $25,000 to $34,999 | 0 | 0.0% |
| $35,000 to $49,999 | 10 | 5.2% |
| $50,000 to $74,999 | 60 | 31.1% |
| $75,000 to $99,999 | 39 | 20.2% |
| $100,000 to $149,999 | 0 | 0.0% |
| $150,000 to $199,999 | 0 | 0.0% |
| $200,000+ | 0 | 0.0% |
Family Income by Famaliy Size in Midway
2-person families (101 | 52.3%) account for the highest median family income in Midway with $53,523 per family, while 2-person families (101 | 52.3%) have the highest median income of $26,762 per family member.
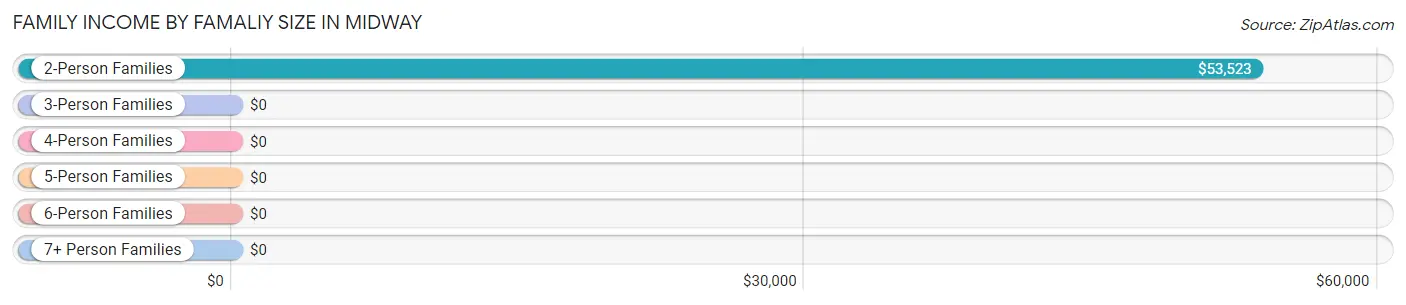
| Income Bracket | # Families | Median Income |
| 2-Person Families | 101 (52.3%) | $53,523 |
| 3-Person Families | 74 (38.3%) | $0 |
| 4-Person Families | 0 (0.0%) | $0 |
| 5-Person Families | 18 (9.3%) | $0 |
| 6-Person Families | 0 (0.0%) | $0 |
| 7+ Person Families | 0 (0.0%) | $0 |
| Total | 193 (100.0%) | $52,689 |
Family Income by Number of Earners in Midway
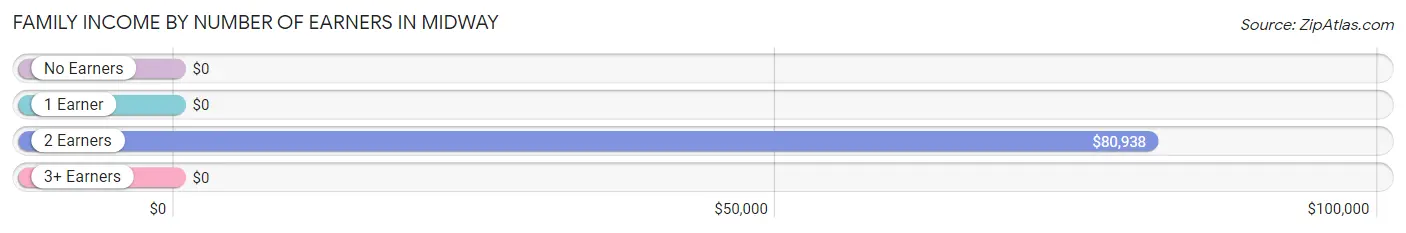
| Number of Earners | # Families | Median Income |
| No Earners | 37 (19.2%) | $0 |
| 1 Earner | 84 (43.5%) | $0 |
| 2 Earners | 72 (37.3%) | $80,938 |
| 3+ Earners | 0 (0.0%) | $0 |
| Total | 193 (100.0%) | $52,689 |
Household Income in Midway
Household Income Brackets in Midway
With 136 households falling in the category, the $10,000 to $14,999 income range is the most frequent in Midway, accounting for 46.0% of all households.
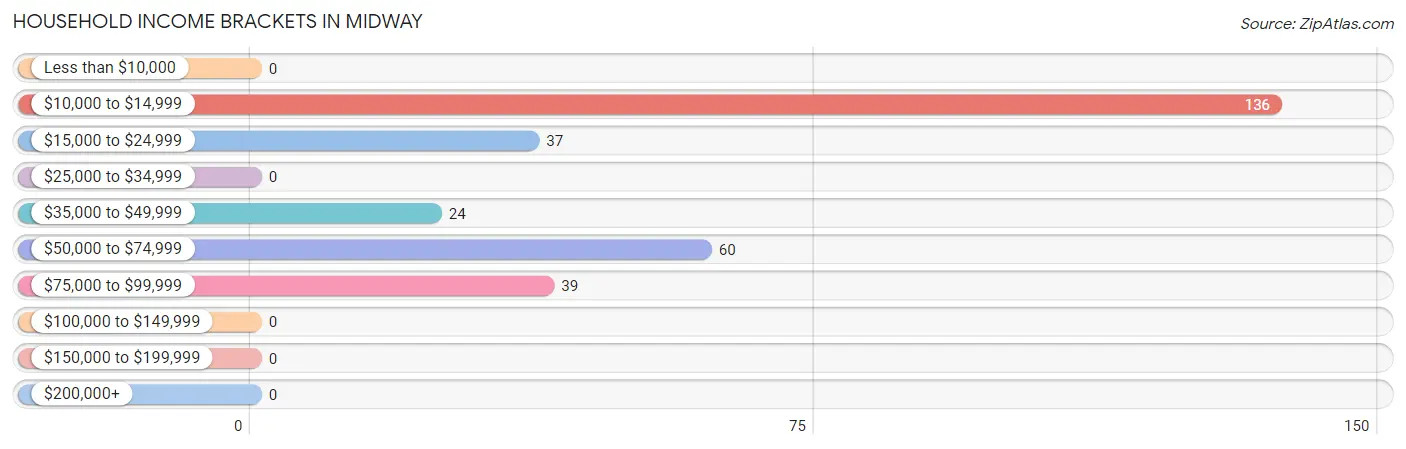
| Income Bracket | # Households | % Households |
| Less than $10,000 | 0 | 0.0% |
| $10,000 to $14,999 | 136 | 45.9% |
| $15,000 to $24,999 | 37 | 12.5% |
| $25,000 to $34,999 | 0 | 0.0% |
| $35,000 to $49,999 | 24 | 8.1% |
| $50,000 to $74,999 | 60 | 20.3% |
| $75,000 to $99,999 | 39 | 13.2% |
| $100,000 to $149,999 | 0 | 0.0% |
| $150,000 to $199,999 | 0 | 0.0% |
| $200,000+ | 0 | 0.0% |
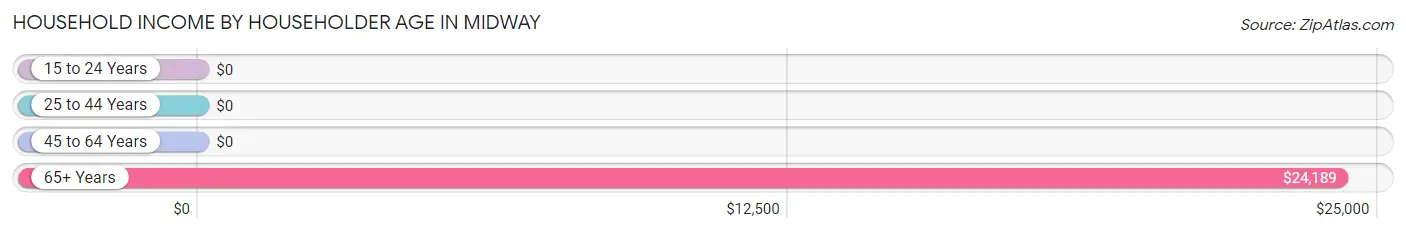
Household Income by Householder Age in Midway
The median household income in Midway is $0, with the highest median household income of $24,189 found in the 65+ years age bracket for the primary householder. A total of 52 households (17.6%) fall into this category.
| Income Bracket | # Households | Median Income |
| 15 to 24 Years | 0 (0.0%) | $0 |
| 25 to 44 Years | 153 (51.7%) | $0 |
| 45 to 64 Years | 91 (30.7%) | $0 |
| 65+ Years | 52 (17.6%) | $24,189 |
| Total | 296 (100.0%) | $0 |
Poverty in Midway
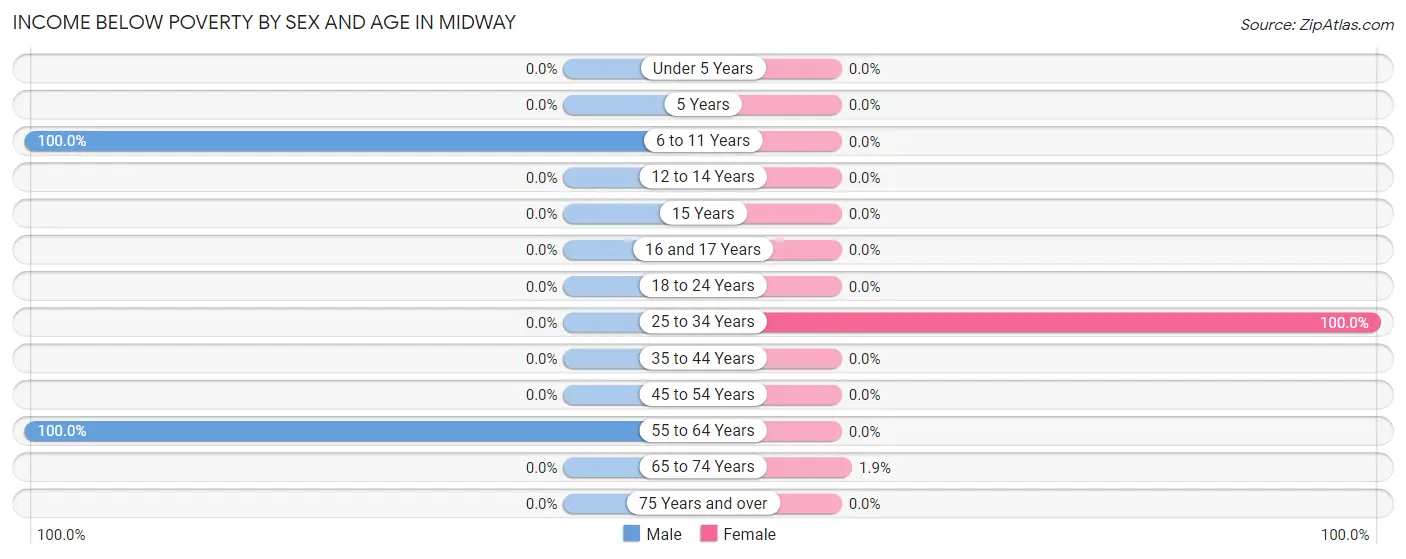
Income Below Poverty by Sex and Age in Midway
With 25.9% poverty level for males and 28.5% for females among the residents of Midway, 6 to 11 year old males and 25 to 34 year old females are the most vulnerable to poverty, with 66 males (100.0%) and 87 females (100.0%) in their respective age groups living below the poverty level.
| Age Bracket | Male | Female |
| Under 5 Years | 0 (0.0%) | 0 (0.0%) |
| 5 Years | 0 (0.0%) | 0 (0.0%) |
| 6 to 11 Years | 66 (100.0%) | 0 (0.0%) |
| 12 to 14 Years | 0 (0.0%) | 0 (0.0%) |
| 15 Years | 0 (0.0%) | 0 (0.0%) |
| 16 and 17 Years | 0 (0.0%) | 0 (0.0%) |
| 18 to 24 Years | 0 (0.0%) | 0 (0.0%) |
| 25 to 34 Years | 0 (0.0%) | 87 (100.0%) |
| 35 to 44 Years | 0 (0.0%) | 0 (0.0%) |
| 45 to 54 Years | 0 (0.0%) | 0 (0.0%) |
| 55 to 64 Years | 48 (100.0%) | 0 (0.0%) |
| 65 to 74 Years | 0 (0.0%) | 1 (1.9%) |
| 75 Years and over | 0 (0.0%) | 0 (0.0%) |
| Total | 114 (25.9%) | 88 (28.5%) |
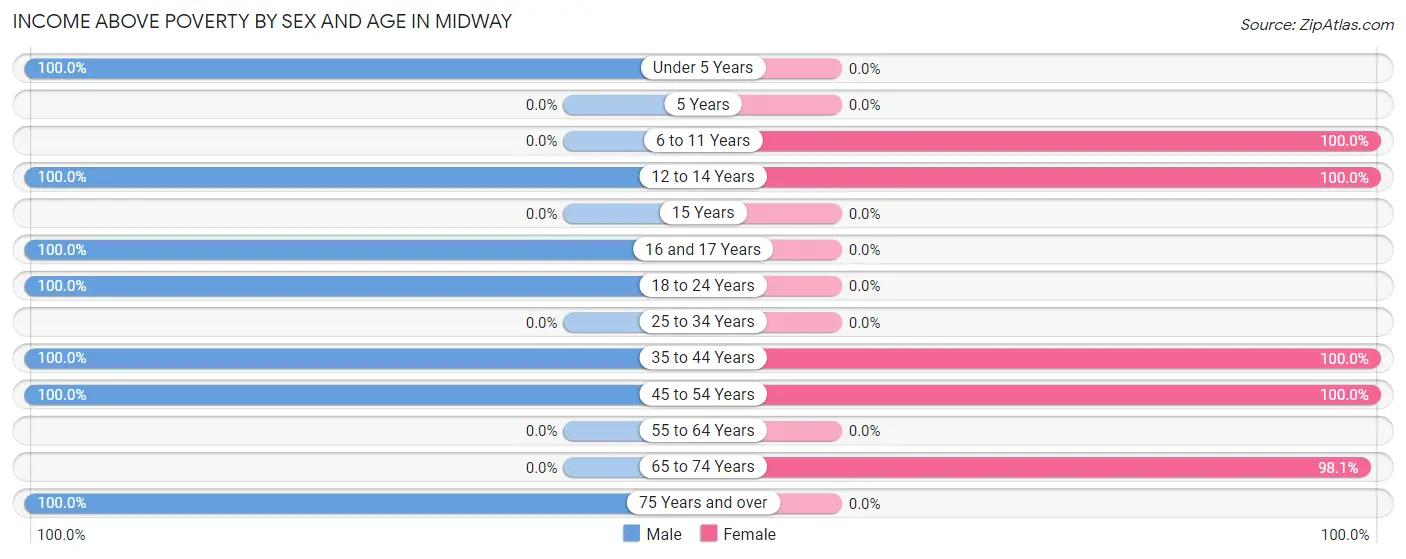
Income Above Poverty by Sex and Age in Midway
According to the poverty statistics in Midway, males aged under 5 years and females aged 6 to 11 years are the age groups that are most secure financially, with 100.0% of males and 100.0% of females in these age groups living above the poverty line.
| Age Bracket | Male | Female |
| Under 5 Years | 8 (100.0%) | 0 (0.0%) |
| 5 Years | 0 (0.0%) | 0 (0.0%) |
| 6 to 11 Years | 0 (0.0%) | 31 (100.0%) |
| 12 to 14 Years | 15 (100.0%) | 20 (100.0%) |
| 15 Years | 0 (0.0%) | 0 (0.0%) |
| 16 and 17 Years | 17 (100.0%) | 0 (0.0%) |
| 18 to 24 Years | 175 (100.0%) | 0 (0.0%) |
| 25 to 34 Years | 0 (0.0%) | 0 (0.0%) |
| 35 to 44 Years | 52 (100.0%) | 95 (100.0%) |
| 45 to 54 Years | 33 (100.0%) | 24 (100.0%) |
| 55 to 64 Years | 0 (0.0%) | 0 (0.0%) |
| 65 to 74 Years | 0 (0.0%) | 51 (98.1%) |
| 75 Years and over | 26 (100.0%) | 0 (0.0%) |
| Total | 326 (74.1%) | 221 (71.5%) |
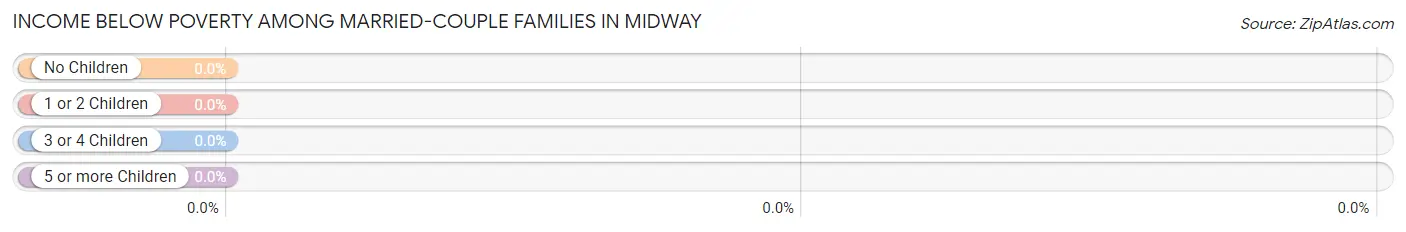
Income Below Poverty Among Married-Couple Families in Midway
| Children | Above Poverty | Below Poverty |
| No Children | 31 (100.0%) | 0 (0.0%) |
| 1 or 2 Children | 0 (0.0%) | 0 (0.0%) |
| 3 or 4 Children | 8 (100.0%) | 0 (0.0%) |
| 5 or more Children | 0 (0.0%) | 0 (0.0%) |
| Total | 39 (100.0%) | 0 (0.0%) |
Income Below Poverty Among Single-Parent Households in Midway
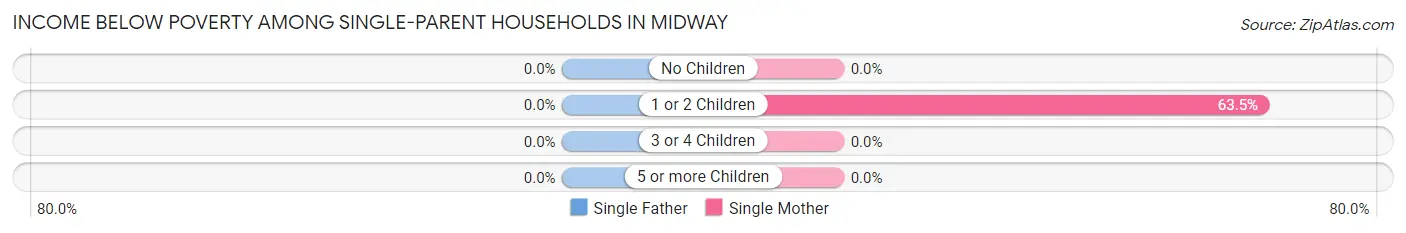
| Children | Single Father | Single Mother |
| No Children | 0 (0.0%) | 0 (0.0%) |
| 1 or 2 Children | 0 (0.0%) | 47 (63.5%) |
| 3 or 4 Children | 0 (0.0%) | 0 (0.0%) |
| 5 or more Children | 0 (0.0%) | 0 (0.0%) |
| Total | 0 (0.0%) | 47 (38.8%) |
Income Below Poverty Among Married-Couple vs Single-Parent Households in Midway
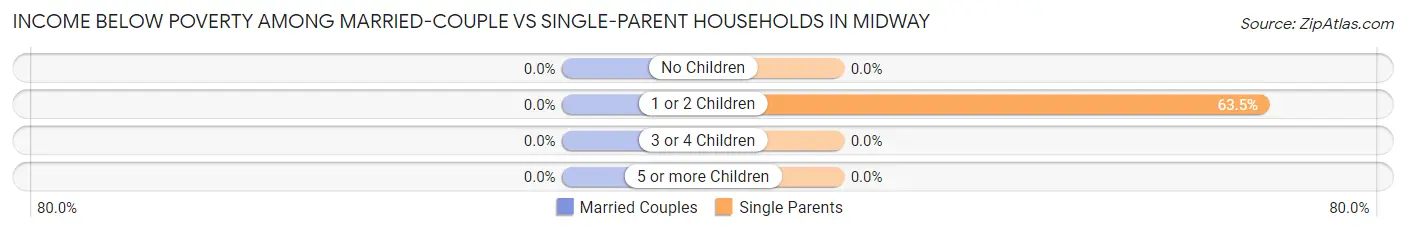
| Children | Married-Couple Families | Single-Parent Households |
| No Children | 0 (0.0%) | 0 (0.0%) |
| 1 or 2 Children | 0 (0.0%) | 47 (63.5%) |
| 3 or 4 Children | 0 (0.0%) | 0 (0.0%) |
| 5 or more Children | 0 (0.0%) | 0 (0.0%) |
| Total | 0 (0.0%) | 47 (30.5%) |
Race in Midway
The most populous races in Midway are Black / African American (440 | 58.7%), White / Caucasian (308 | 41.1%), and Two or more Races (1 | 0.1%).
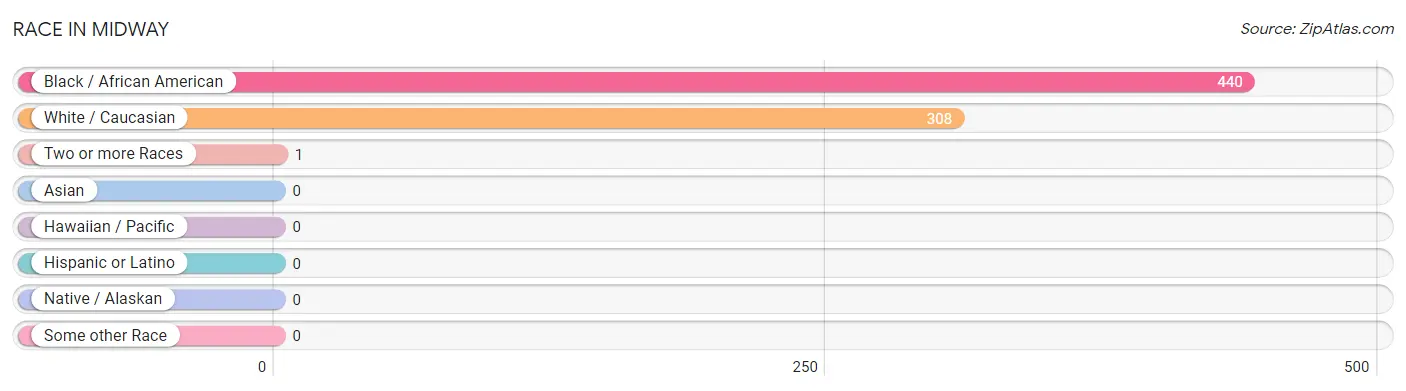
| Race | # Population | % Population |
| Asian | 0 | 0.0% |
| Black / African American | 440 | 58.7% |
| Hawaiian / Pacific | 0 | 0.0% |
| Hispanic or Latino | 0 | 0.0% |
| Native / Alaskan | 0 | 0.0% |
| White / Caucasian | 308 | 41.1% |
| Two or more Races | 1 | 0.1% |
| Some other Race | 0 | 0.0% |
| Total | 749 | 100.0% |
Ancestry in Midway
The most populous ancestries reported in Midway are American (428 | 57.1%), English (22 | 2.9%), French (14 | 1.9%), and German (8 | 1.1%), together accounting for 63.0% of all Midway residents.
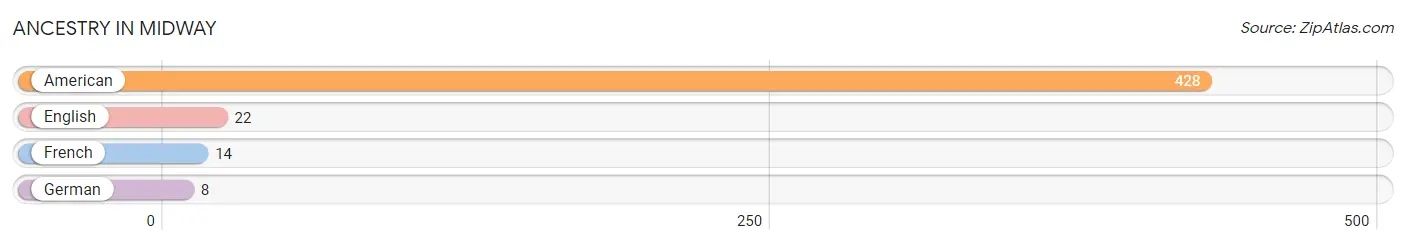
| Ancestry | # Population | % Population |
| American | 428 | 57.1% |
| English | 22 | 2.9% |
| French | 14 | 1.9% |
| German | 8 | 1.1% | View All 4 Rows |
Immigrants in Midway

| Immigration Origin | # Population | % Population | View All 0 Rows |
Sex and Age in Midway
Sex and Age in Midway
The most populous age groups in Midway are 20 to 24 Years (175 | 39.8%) for men and 40 to 44 Years (68 | 22.0%) for women.
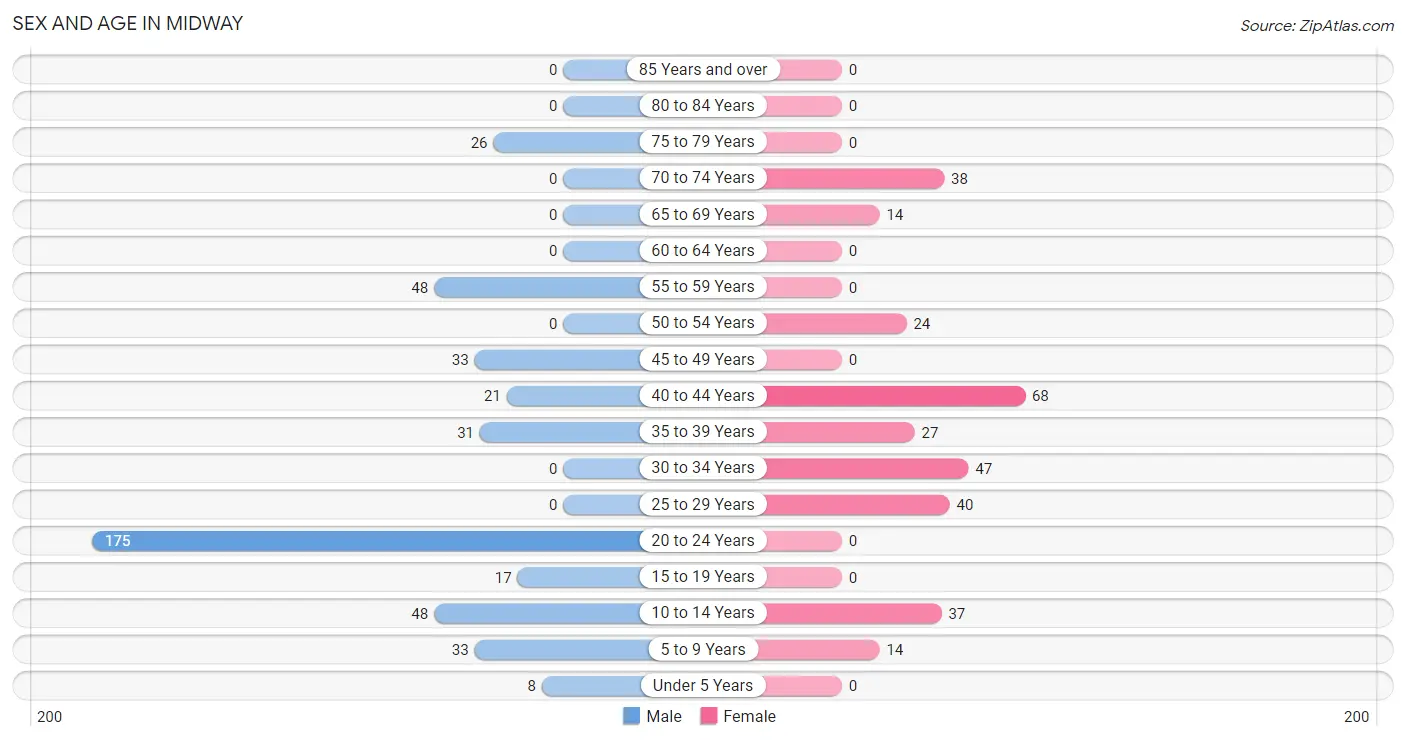
| Age Bracket | Male | Female |
| Under 5 Years | 8 (1.8%) | 0 (0.0%) |
| 5 to 9 Years | 33 (7.5%) | 14 (4.5%) |
| 10 to 14 Years | 48 (10.9%) | 37 (12.0%) |
| 15 to 19 Years | 17 (3.9%) | 0 (0.0%) |
| 20 to 24 Years | 175 (39.8%) | 0 (0.0%) |
| 25 to 29 Years | 0 (0.0%) | 40 (12.9%) |
| 30 to 34 Years | 0 (0.0%) | 47 (15.2%) |
| 35 to 39 Years | 31 (7.0%) | 27 (8.7%) |
| 40 to 44 Years | 21 (4.8%) | 68 (22.0%) |
| 45 to 49 Years | 33 (7.5%) | 0 (0.0%) |
| 50 to 54 Years | 0 (0.0%) | 24 (7.8%) |
| 55 to 59 Years | 48 (10.9%) | 0 (0.0%) |
| 60 to 64 Years | 0 (0.0%) | 0 (0.0%) |
| 65 to 69 Years | 0 (0.0%) | 14 (4.5%) |
| 70 to 74 Years | 0 (0.0%) | 38 (12.3%) |
| 75 to 79 Years | 26 (5.9%) | 0 (0.0%) |
| 80 to 84 Years | 0 (0.0%) | 0 (0.0%) |
| 85 Years and over | 0 (0.0%) | 0 (0.0%) |
| Total | 440 (100.0%) | 309 (100.0%) |
Families and Households in Midway
Median Family Size in Midway
The median family size in Midway is 3.35 persons per family, with single male/father families (33 | 17.1%) accounting for the largest median family size of 6.3 persons per family. On the other hand, single female/mother families (121 | 62.7%) represent the smallest median family size with 2.72 persons per family.
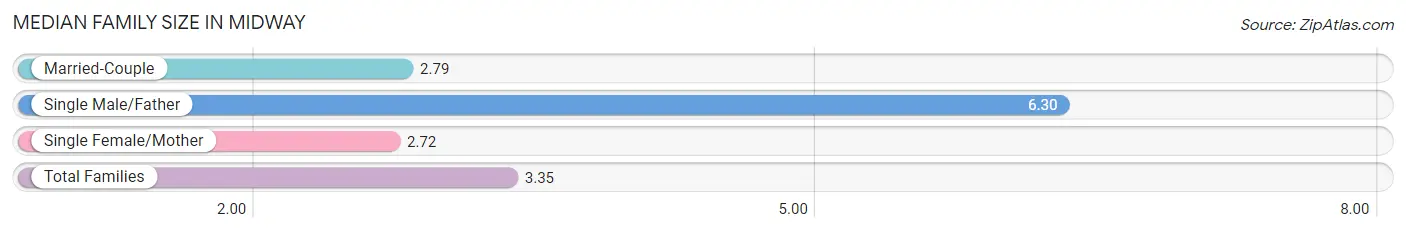
| Family Type | # Families | Family Size |
| Married-Couple | 39 (20.2%) | 2.79 |
| Single Male/Father | 33 (17.1%) | 6.30 |
| Single Female/Mother | 121 (62.7%) | 2.72 |
| Total Families | 193 (100.0%) | 3.35 |
Median Household Size in Midway
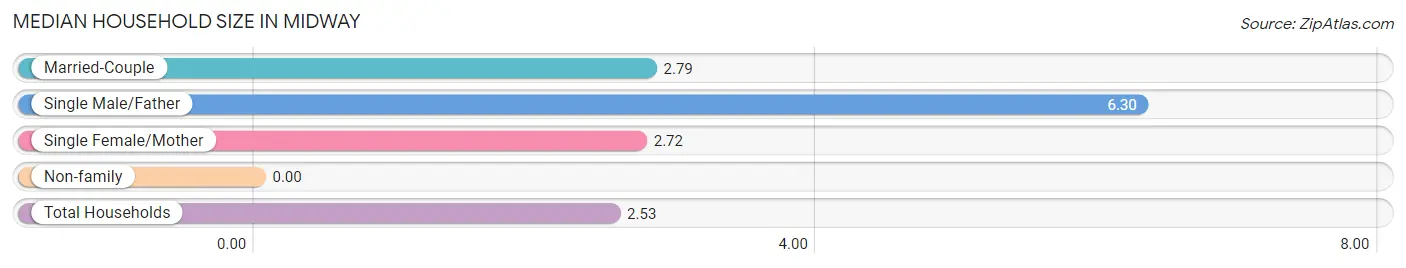
| Household Type | # Households | Household Size |
| Married-Couple | 39 (13.2%) | 2.79 |
| Single Male/Father | 33 (11.2%) | 6.30 |
| Single Female/Mother | 121 (40.9%) | 2.72 |
| Non-family | 103 (34.8%) | - |
| Total Households | 296 (100.0%) | 2.53 |
Household Size by Marriage Status in Midway
Out of a total of 296 households in Midway, 193 (65.2%) are family households, while 103 (34.8%) are nonfamily households. The most numerous type of family households are 2-person households, comprising 101, and the most common type of nonfamily households are 1-person households, comprising 103.
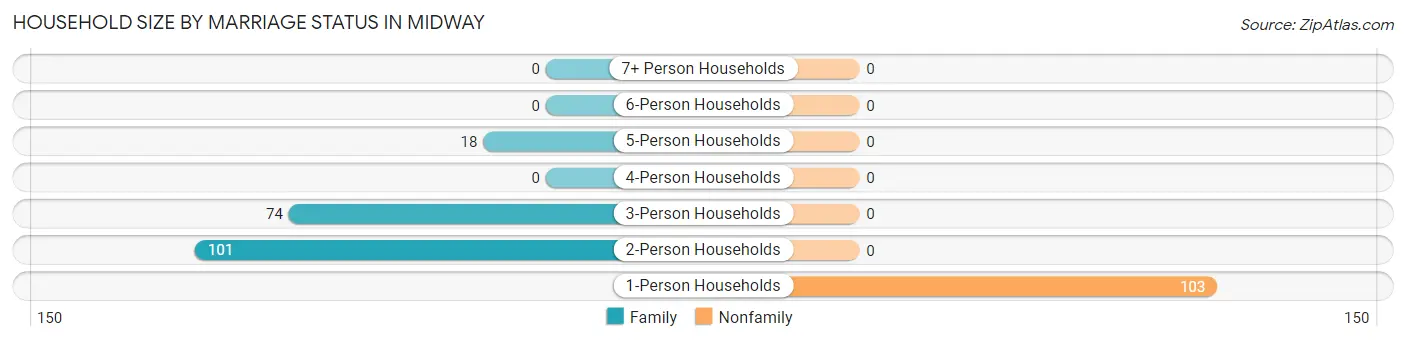
| Household Size | Family Households | Nonfamily Households |
| 1-Person Households | - | 103 (34.8%) |
| 2-Person Households | 101 (34.1%) | 0 (0.0%) |
| 3-Person Households | 74 (25.0%) | 0 (0.0%) |
| 4-Person Households | 0 (0.0%) | 0 (0.0%) |
| 5-Person Households | 18 (6.1%) | 0 (0.0%) |
| 6-Person Households | 0 (0.0%) | 0 (0.0%) |
| 7+ Person Households | 0 (0.0%) | 0 (0.0%) |
| Total | 193 (65.2%) | 103 (34.8%) |
Female Fertility in Midway
Fertility by Age in Midway
| Age Bracket | Women with Births | Births / 1,000 Women |
| 15 to 19 years | 0 (0.0%) | 0.0 |
| 20 to 34 years | 0 (0.0%) | 0.0 |
| 35 to 50 years | 0 (0.0%) | 0.0 |
| Total | 0 (0.0%) | 0.0 |
Fertility by Age by Marriage Status in Midway
| Age Bracket | Married | Unmarried |
| 15 to 19 years | 0 (0.0%) | 0 (0.0%) |
| 20 to 34 years | 0 (0.0%) | 0 (0.0%) |
| 35 to 50 years | 0 (0.0%) | 0 (0.0%) |
| Total | 0 (0.0%) | 0 (0.0%) |
Fertility by Education in Midway
| Educational Attainment | Women with Births | Births / 1,000 Women |
| Less than High School | 0 (0.0%) | 0.0 |
| High School Diploma | 0 (0.0%) | 0.0 |
| College or Associate's Degree | 0 (0.0%) | 0.0 |
| Bachelor's Degree | 0 (0.0%) | 0.0 |
| Graduate Degree | 0 (0.0%) | 0.0 |
| Total | 0 (0.0%) | 0.0 |
Fertility by Education by Marriage Status in Midway
| Educational Attainment | Married | Unmarried |
| Less than High School | 0 (0.0%) | 0 (0.0%) |
| High School Diploma | 0 (0.0%) | 0 (0.0%) |
| College or Associate's Degree | 0 (0.0%) | 0 (0.0%) |
| Bachelor's Degree | 0 (0.0%) | 0 (0.0%) |
| Graduate Degree | 0 (0.0%) | 0 (0.0%) |
| Total | 0 (0.0%) | 0 (0.0%) |
Employment Characteristics in Midway
Employment by Class of Employer in Midway
Among the 366 employed individuals in Midway, private company employees (268 | 73.2%), local government employees (51 | 13.9%), and not-for-profit organizations (47 | 12.8%) make up the most common classes of employment.
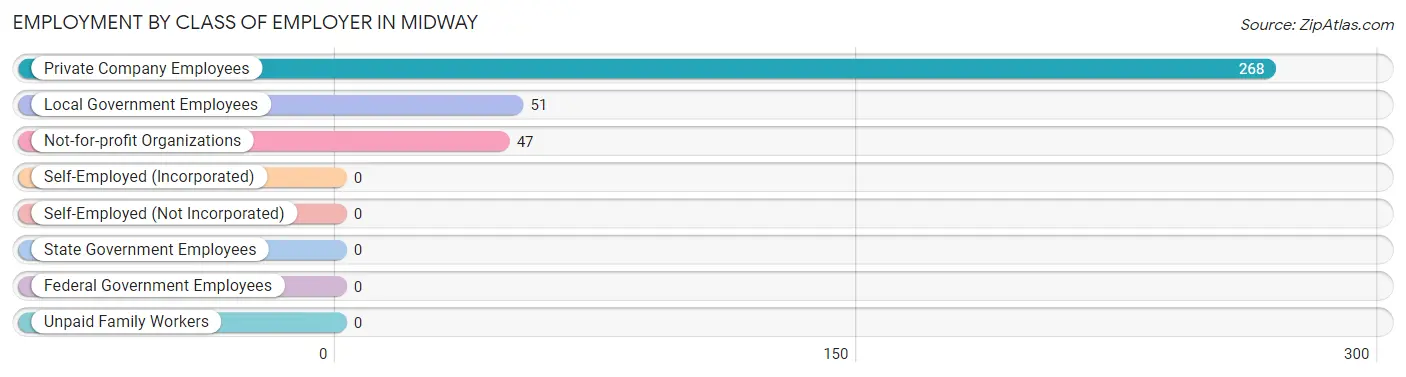
| Employer Class | # Employees | % Employees |
| Private Company Employees | 268 | 73.2% |
| Self-Employed (Incorporated) | 0 | 0.0% |
| Self-Employed (Not Incorporated) | 0 | 0.0% |
| Not-for-profit Organizations | 47 | 12.8% |
| Local Government Employees | 51 | 13.9% |
| State Government Employees | 0 | 0.0% |
| Federal Government Employees | 0 | 0.0% |
| Unpaid Family Workers | 0 | 0.0% |
| Total | 366 | 100.0% |
Employment Status by Age in Midway
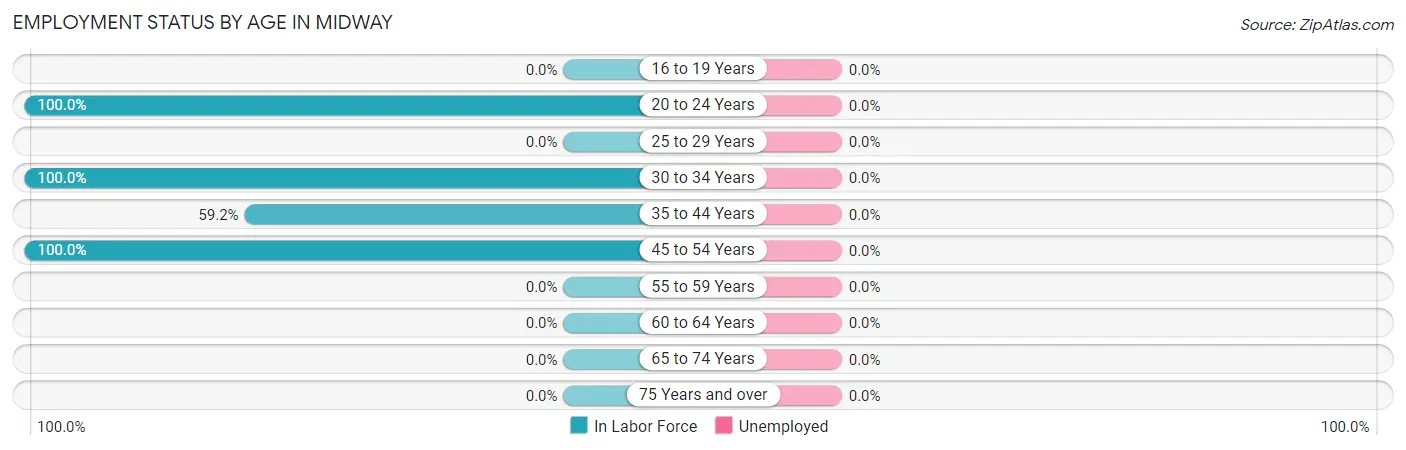
| Age Bracket | In Labor Force | Unemployed |
| 16 to 19 Years | 0 (0.0%) | 0 (0.0%) |
| 20 to 24 Years | 175 (100.0%) | 0 (0.0%) |
| 25 to 29 Years | 0 (0.0%) | 0 (0.0%) |
| 30 to 34 Years | 47 (100.0%) | 0 (0.0%) |
| 35 to 44 Years | 87 (59.2%) | 0 (0.0%) |
| 45 to 54 Years | 57 (100.0%) | 0 (0.0%) |
| 55 to 59 Years | 0 (0.0%) | 0 (0.0%) |
| 60 to 64 Years | 0 (0.0%) | 0 (0.0%) |
| 65 to 74 Years | 0 (0.0%) | 0 (0.0%) |
| 75 Years and over | 0 (0.0%) | 0 (0.0%) |
| Total | 366 (60.1%) | 0 (0.0%) |
Employment Status by Educational Attainment in Midway
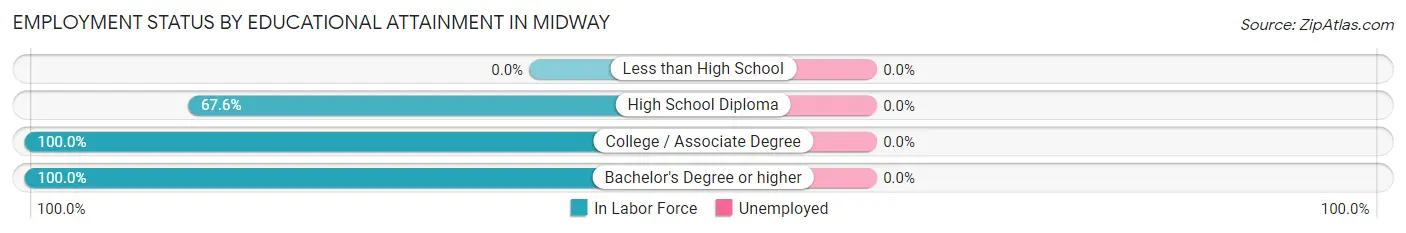
| Educational Attainment | In Labor Force | Unemployed |
| Less than High School | 0 (0.0%) | 0 (0.0%) |
| High School Diploma | 125 (67.6%) | 0 (0.0%) |
| College / Associate Degree | 58 (100.0%) | 0 (0.0%) |
| Bachelor's Degree or higher | 8 (100.0%) | 0 (0.0%) |
| Total | 191 (56.3%) | 0 (0.0%) |
Employment Occupations by Sex in Midway
Management, Business, Science and Arts Occupations
The most common Management, Business, Science and Arts occupations in Midway are Health Diagnosing & Treating (27 | 7.4%), Health Technologists (27 | 7.4%), Computers, Engineering & Science (21 | 5.7%), Architecture & Engineering (21 | 5.7%), and Community & Social Service (8 | 2.2%).
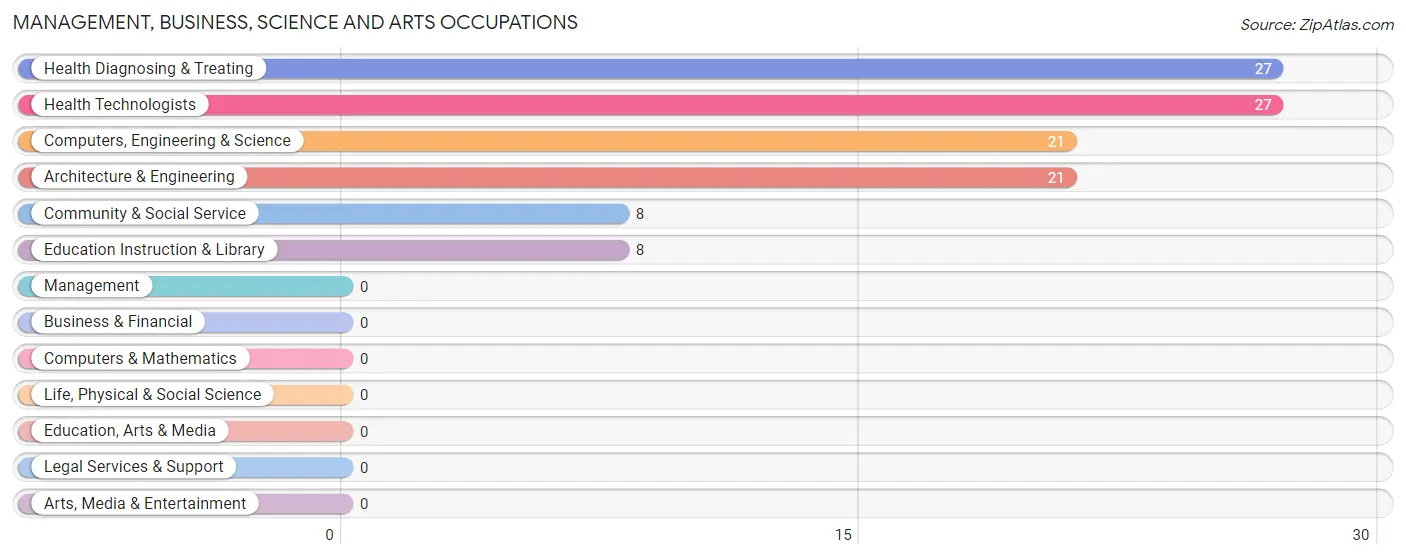
Management, Business, Science and Arts Occupations by Sex
Within the Management, Business, Science and Arts occupations in Midway, the most male-oriented occupations are Computers, Engineering & Science (100.0%), and Architecture & Engineering (100.0%), while the most female-oriented occupations are Community & Social Service (100.0%), Education Instruction & Library (100.0%), and Health Diagnosing & Treating (100.0%).
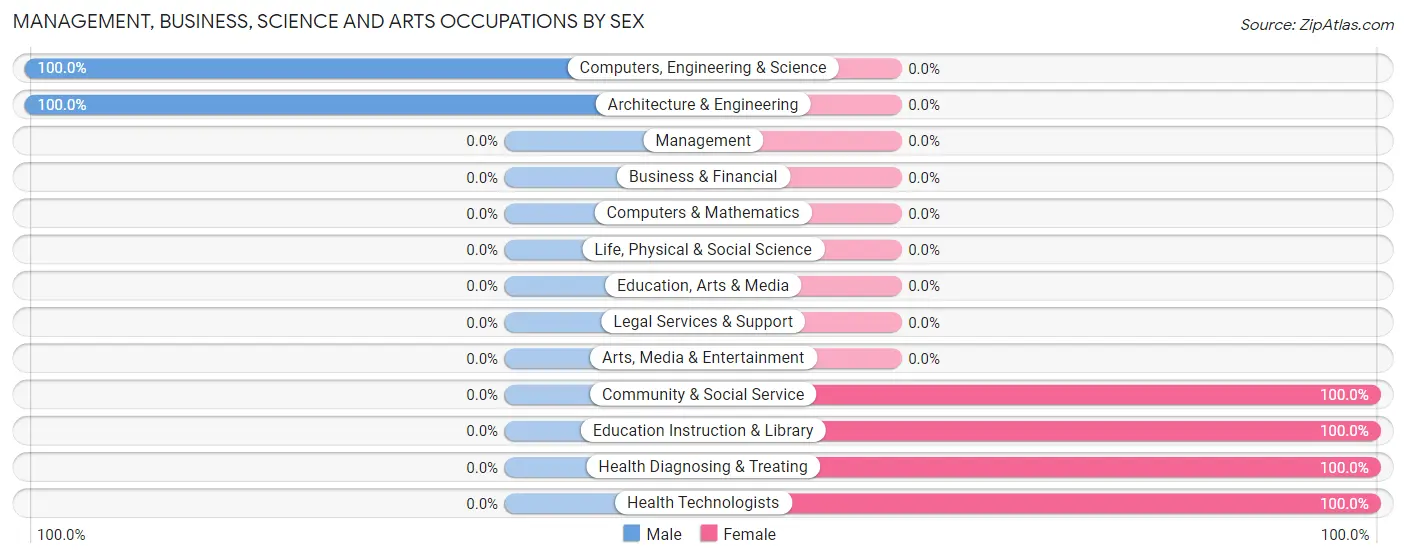
| Occupation | Male | Female |
| Management | 0 (0.0%) | 0 (0.0%) |
| Business & Financial | 0 (0.0%) | 0 (0.0%) |
| Computers, Engineering & Science | 21 (100.0%) | 0 (0.0%) |
| Computers & Mathematics | 0 (0.0%) | 0 (0.0%) |
| Architecture & Engineering | 21 (100.0%) | 0 (0.0%) |
| Life, Physical & Social Science | 0 (0.0%) | 0 (0.0%) |
| Community & Social Service | 0 (0.0%) | 8 (100.0%) |
| Education, Arts & Media | 0 (0.0%) | 0 (0.0%) |
| Legal Services & Support | 0 (0.0%) | 0 (0.0%) |
| Education Instruction & Library | 0 (0.0%) | 8 (100.0%) |
| Arts, Media & Entertainment | 0 (0.0%) | 0 (0.0%) |
| Health Diagnosing & Treating | 0 (0.0%) | 27 (100.0%) |
| Health Technologists | 0 (0.0%) | 27 (100.0%) |
| Total (Category) | 21 (37.5%) | 35 (62.5%) |
| Total (Overall) | 260 (71.0%) | 106 (29.0%) |
Services Occupations
The most common Services occupations in Midway are Healthcare Support (47 | 12.8%), Security & Protection (43 | 11.7%), and Law Enforcement (43 | 11.7%).
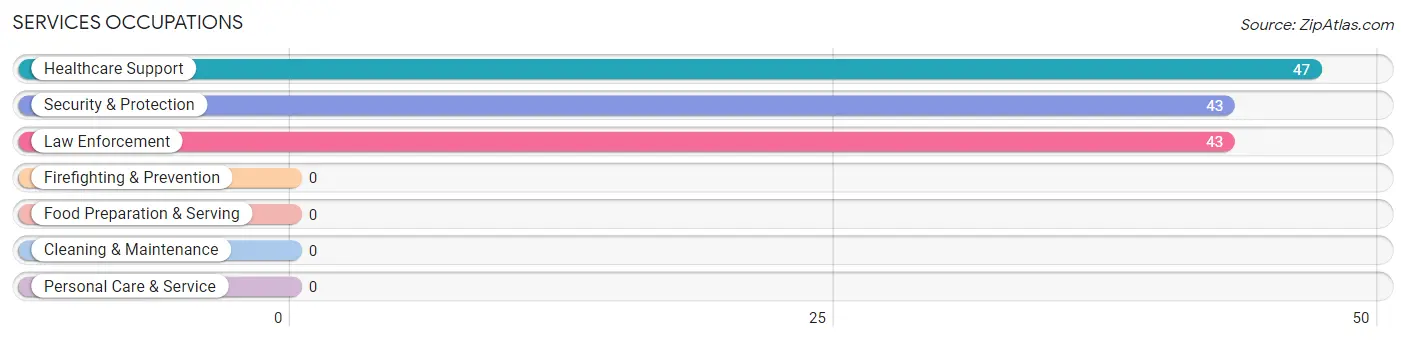
Services Occupations by Sex
Within the Services occupations in Midway, the most male-oriented occupations are Security & Protection (76.7%), and Law Enforcement (76.7%), while the most female-oriented occupations are Healthcare Support (100.0%), Security & Protection (23.3%), and Law Enforcement (23.3%).
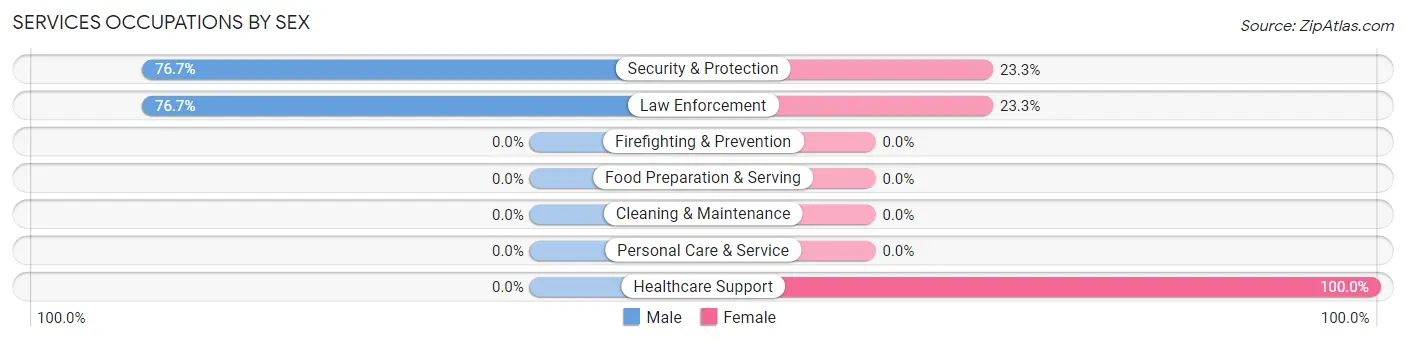
| Occupation | Male | Female |
| Healthcare Support | 0 (0.0%) | 47 (100.0%) |
| Security & Protection | 33 (76.7%) | 10 (23.3%) |
| Firefighting & Prevention | 0 (0.0%) | 0 (0.0%) |
| Law Enforcement | 33 (76.7%) | 10 (23.3%) |
| Food Preparation & Serving | 0 (0.0%) | 0 (0.0%) |
| Cleaning & Maintenance | 0 (0.0%) | 0 (0.0%) |
| Personal Care & Service | 0 (0.0%) | 0 (0.0%) |
| Total (Category) | 33 (36.7%) | 57 (63.3%) |
| Total (Overall) | 260 (71.0%) | 106 (29.0%) |
Sales and Office Occupations
The most common Sales and Office occupations in Midway are , and Office & Administration (14 | 3.8%).

Sales and Office Occupations by Sex

| Occupation | Male | Female |
| Sales & Related | 0 (0.0%) | 0 (0.0%) |
| Office & Administration | 0 (0.0%) | 14 (100.0%) |
| Total (Category) | 0 (0.0%) | 14 (100.0%) |
| Total (Overall) | 260 (71.0%) | 106 (29.0%) |
Natural Resources, Construction and Maintenance Occupations
The most common Natural Resources, Construction and Maintenance occupations in Midway are Installation, Maintenance & Repair (175 | 47.8%), and Construction & Extraction (31 | 8.5%).

Natural Resources, Construction and Maintenance Occupations by Sex

| Occupation | Male | Female |
| Farming, Fishing & Forestry | 0 (0.0%) | 0 (0.0%) |
| Construction & Extraction | 31 (100.0%) | 0 (0.0%) |
| Installation, Maintenance & Repair | 175 (100.0%) | 0 (0.0%) |
| Total (Category) | 206 (100.0%) | 0 (0.0%) |
| Total (Overall) | 260 (71.0%) | 106 (29.0%) |
Production, Transportation and Moving Occupations
Production, Transportation and Moving Occupations by Sex
| Occupation | Male | Female |
| Production | 0 (0.0%) | 0 (0.0%) |
| Transportation | 0 (0.0%) | 0 (0.0%) |
| Material Moving | 0 (0.0%) | 0 (0.0%) |
| Total (Category) | 0 (0.0%) | 0 (0.0%) |
| Total (Overall) | 260 (71.0%) | 106 (29.0%) |
Employment Industries by Sex in Midway
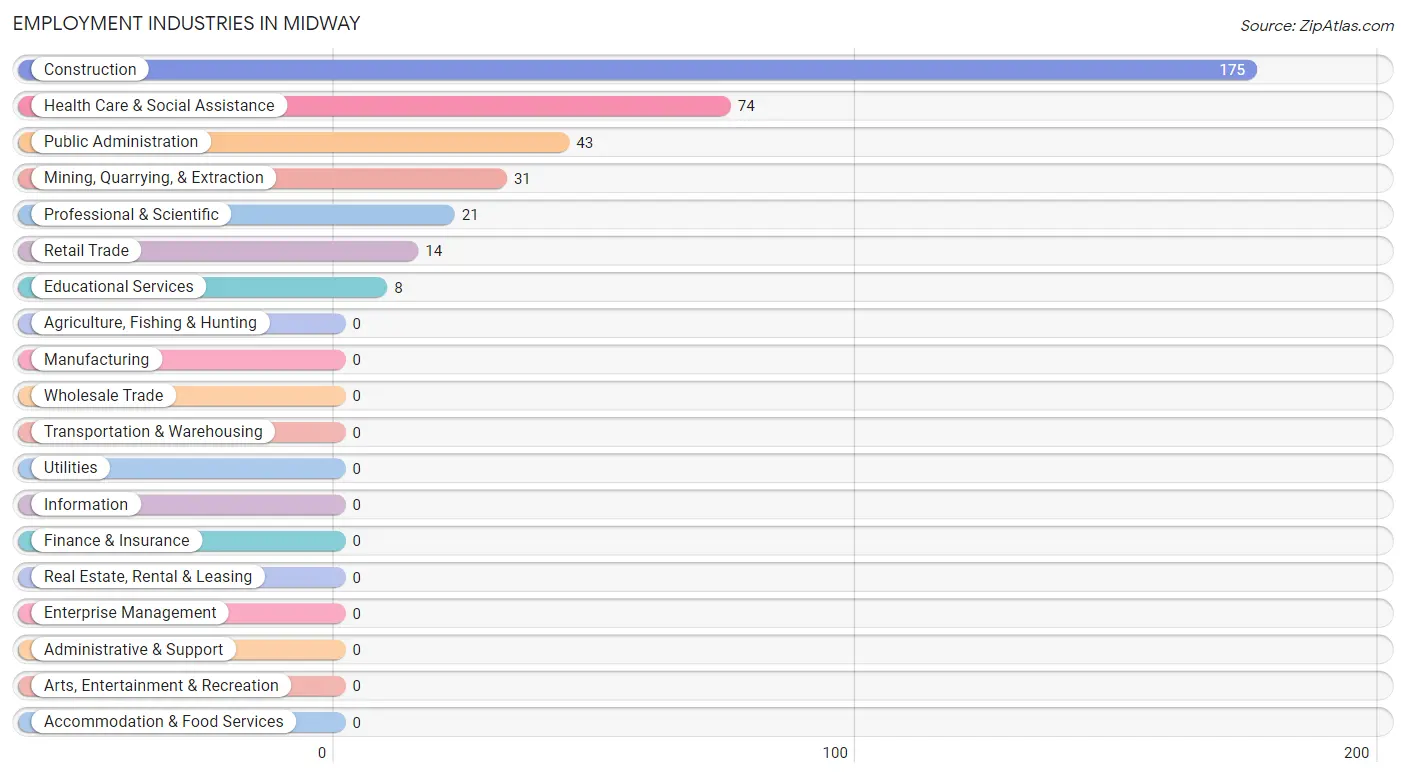
Employment Industries in Midway
The major employment industries in Midway include Construction (175 | 47.8%), Health Care & Social Assistance (74 | 20.2%), Public Administration (43 | 11.7%), Mining, Quarrying, & Extraction (31 | 8.5%), and Professional & Scientific (21 | 5.7%).
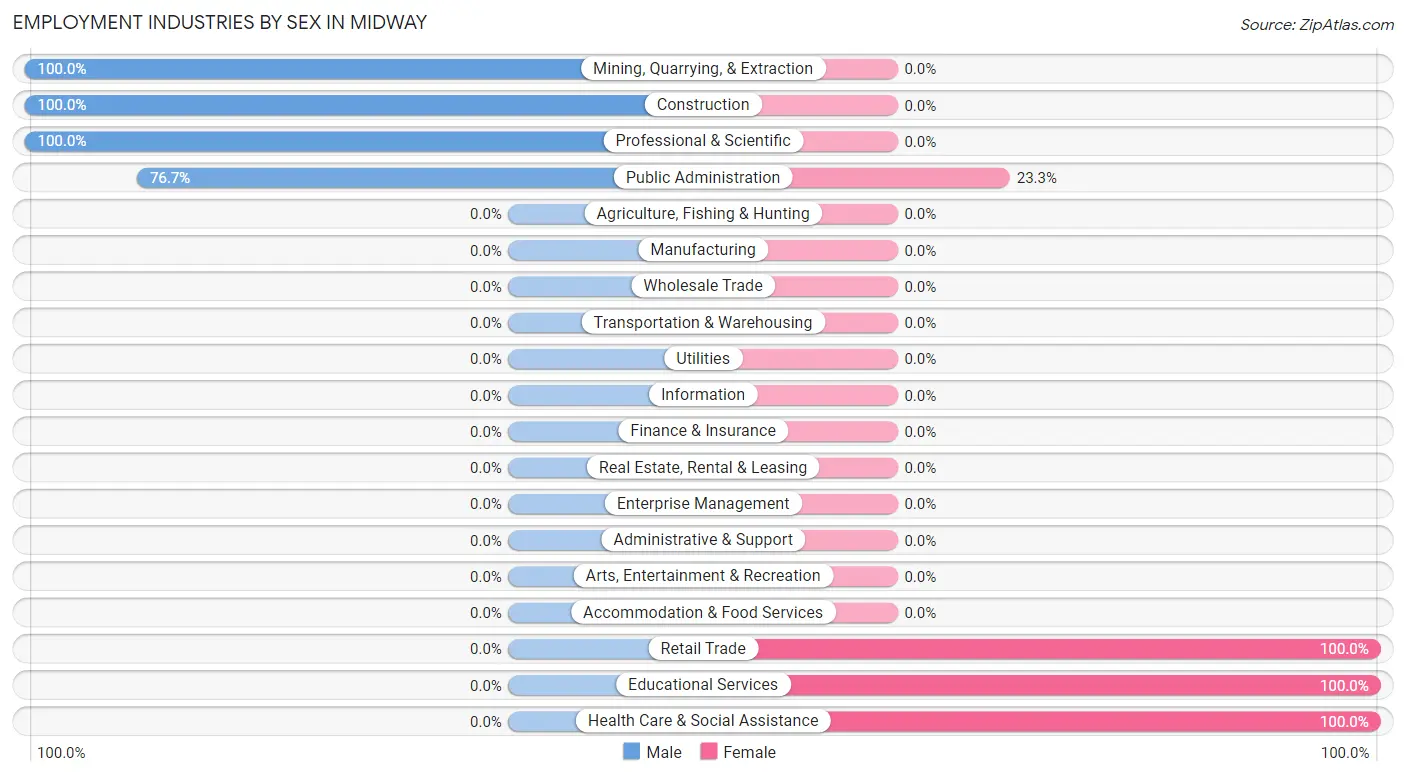
Employment Industries by Sex in Midway
The Midway industries that see more men than women are Mining, Quarrying, & Extraction (100.0%), Construction (100.0%), and Professional & Scientific (100.0%), whereas the industries that tend to have a higher number of women are Retail Trade (100.0%), Educational Services (100.0%), and Health Care & Social Assistance (100.0%).
| Industry | Male | Female |
| Agriculture, Fishing & Hunting | 0 (0.0%) | 0 (0.0%) |
| Mining, Quarrying, & Extraction | 31 (100.0%) | 0 (0.0%) |
| Construction | 175 (100.0%) | 0 (0.0%) |
| Manufacturing | 0 (0.0%) | 0 (0.0%) |
| Wholesale Trade | 0 (0.0%) | 0 (0.0%) |
| Retail Trade | 0 (0.0%) | 14 (100.0%) |
| Transportation & Warehousing | 0 (0.0%) | 0 (0.0%) |
| Utilities | 0 (0.0%) | 0 (0.0%) |
| Information | 0 (0.0%) | 0 (0.0%) |
| Finance & Insurance | 0 (0.0%) | 0 (0.0%) |
| Real Estate, Rental & Leasing | 0 (0.0%) | 0 (0.0%) |
| Professional & Scientific | 21 (100.0%) | 0 (0.0%) |
| Enterprise Management | 0 (0.0%) | 0 (0.0%) |
| Administrative & Support | 0 (0.0%) | 0 (0.0%) |
| Educational Services | 0 (0.0%) | 8 (100.0%) |
| Health Care & Social Assistance | 0 (0.0%) | 74 (100.0%) |
| Arts, Entertainment & Recreation | 0 (0.0%) | 0 (0.0%) |
| Accommodation & Food Services | 0 (0.0%) | 0 (0.0%) |
| Public Administration | 33 (76.7%) | 10 (23.3%) |
| Total | 260 (71.0%) | 106 (29.0%) |
Education in Midway
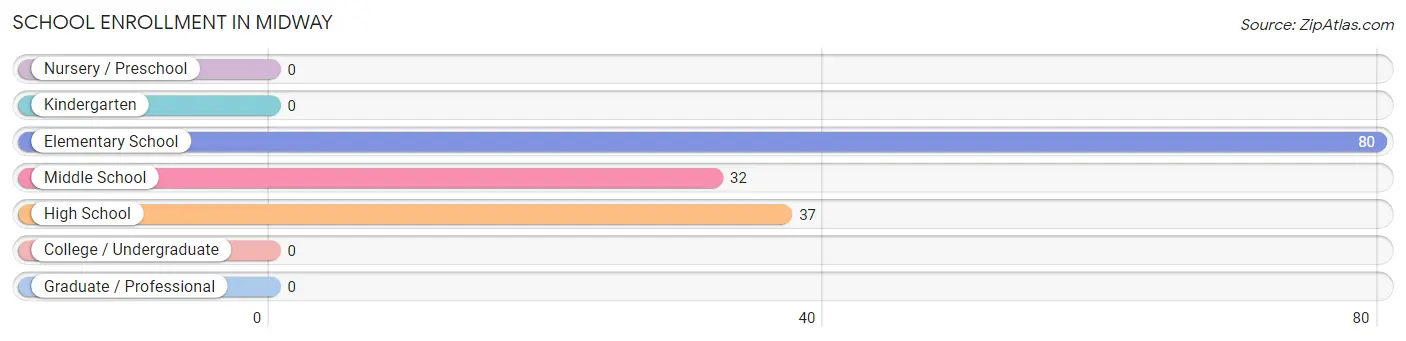
School Enrollment in Midway
The most common levels of schooling among the 149 students in Midway are elementary school (80 | 53.7%), high school (37 | 24.8%), and middle school (32 | 21.5%).
| School Level | # Students | % Students |
| Nursery / Preschool | 0 | 0.0% |
| Kindergarten | 0 | 0.0% |
| Elementary School | 80 | 53.7% |
| Middle School | 32 | 21.5% |
| High School | 37 | 24.8% |
| College / Undergraduate | 0 | 0.0% |
| Graduate / Professional | 0 | 0.0% |
| Total | 149 | 100.0% |
School Enrollment by Age by Funding Source in Midway
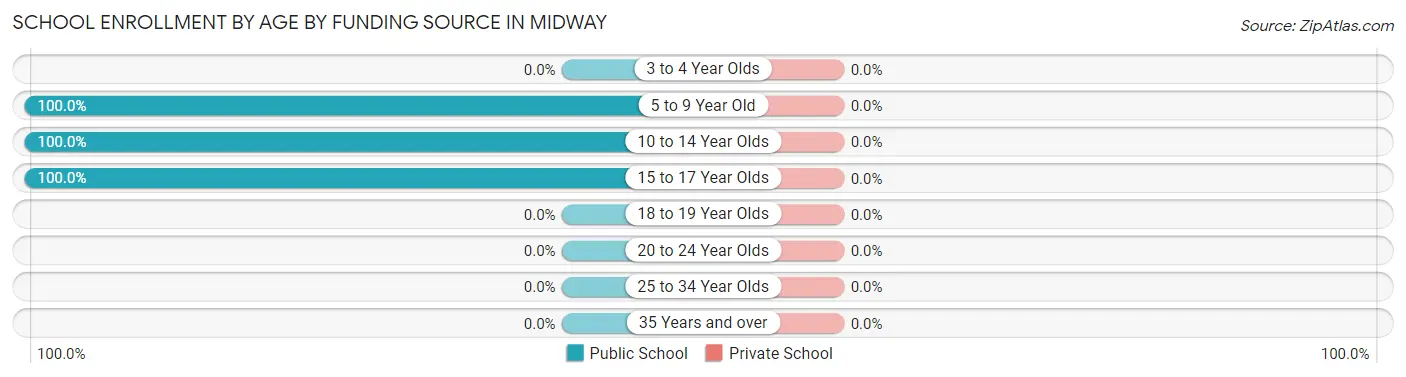
| Age Bracket | Public School | Private School |
| 3 to 4 Year Olds | 0 (0.0%) | 0 (0.0%) |
| 5 to 9 Year Old | 47 (100.0%) | 0 (0.0%) |
| 10 to 14 Year Olds | 85 (100.0%) | 0 (0.0%) |
| 15 to 17 Year Olds | 17 (100.0%) | 0 (0.0%) |
| 18 to 19 Year Olds | 0 (0.0%) | 0 (0.0%) |
| 20 to 24 Year Olds | 0 (0.0%) | 0 (0.0%) |
| 25 to 34 Year Olds | 0 (0.0%) | 0 (0.0%) |
| 35 Years and over | 0 (0.0%) | 0 (0.0%) |
| Total | 149 (100.0%) | 0 (0.0%) |
Educational Attainment by Field of Study in Midway
, and education (22 | 100.0%) are the most common fields of study among 22 individuals in Midway who have obtained a bachelor's degree or higher.
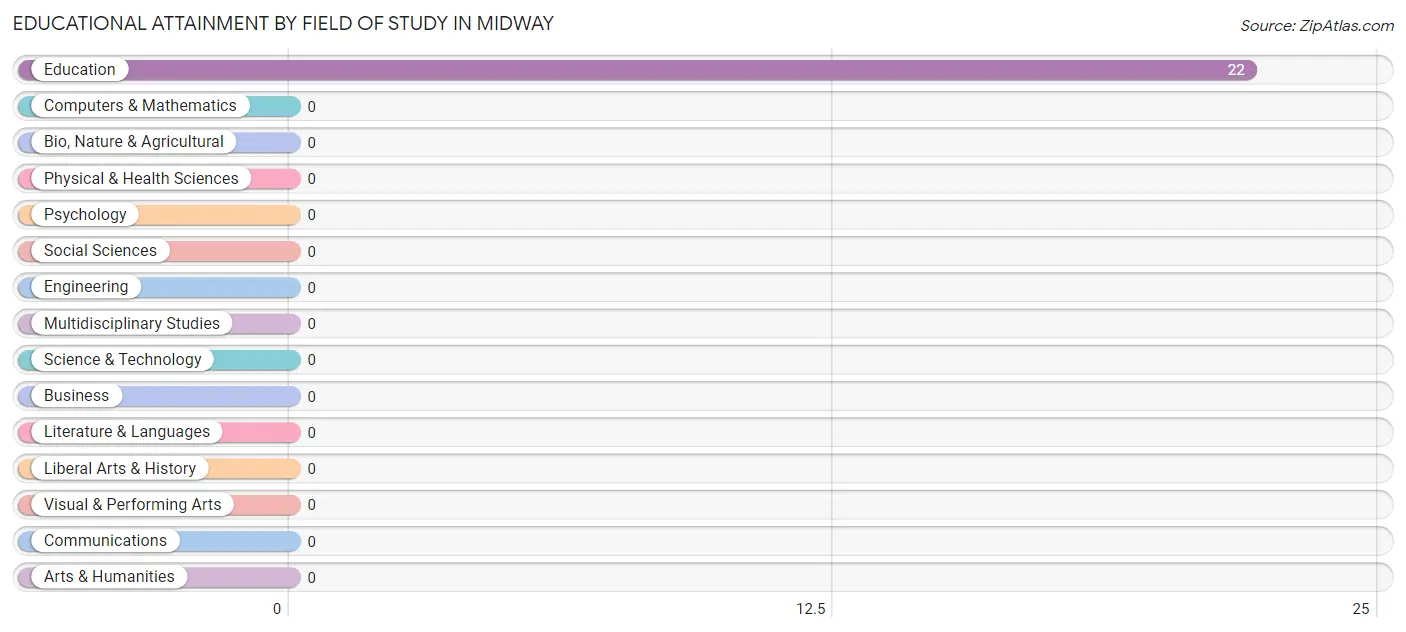
| Field of Study | # Graduates | % Graduates |
| Computers & Mathematics | 0 | 0.0% |
| Bio, Nature & Agricultural | 0 | 0.0% |
| Physical & Health Sciences | 0 | 0.0% |
| Psychology | 0 | 0.0% |
| Social Sciences | 0 | 0.0% |
| Engineering | 0 | 0.0% |
| Multidisciplinary Studies | 0 | 0.0% |
| Science & Technology | 0 | 0.0% |
| Business | 0 | 0.0% |
| Education | 22 | 100.0% |
| Literature & Languages | 0 | 0.0% |
| Liberal Arts & History | 0 | 0.0% |
| Visual & Performing Arts | 0 | 0.0% |
| Communications | 0 | 0.0% |
| Arts & Humanities | 0 | 0.0% |
| Total | 22 | 100.0% |
Transportation & Commute in Midway
Vehicle Availability by Sex in Midway
The most prevalent vehicle ownership categories in Midway are males with 2 vehicles (239, accounting for 91.9%) and females with 2 vehicles (24, making up 225.5%).
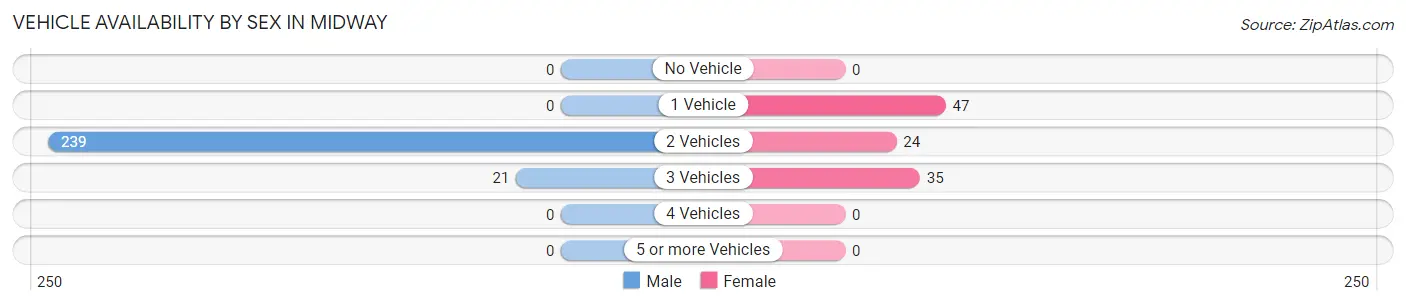
| Vehicles Available | Male | Female |
| No Vehicle | 0 (0.0%) | 0 (0.0%) |
| 1 Vehicle | 0 (0.0%) | 47 (44.3%) |
| 2 Vehicles | 239 (91.9%) | 24 (22.6%) |
| 3 Vehicles | 21 (8.1%) | 35 (33.0%) |
| 4 Vehicles | 0 (0.0%) | 0 (0.0%) |
| 5 or more Vehicles | 0 (0.0%) | 0 (0.0%) |
| Total | 260 (100.0%) | 106 (100.0%) |
Commute Time in Midway
The most frequently occuring commute durations in Midway are 45 to 59 minutes (175 commuters, 47.8%), 5 to 9 minutes (76 commuters, 20.8%), and less than 5 minutes (33 commuters, 9.0%).
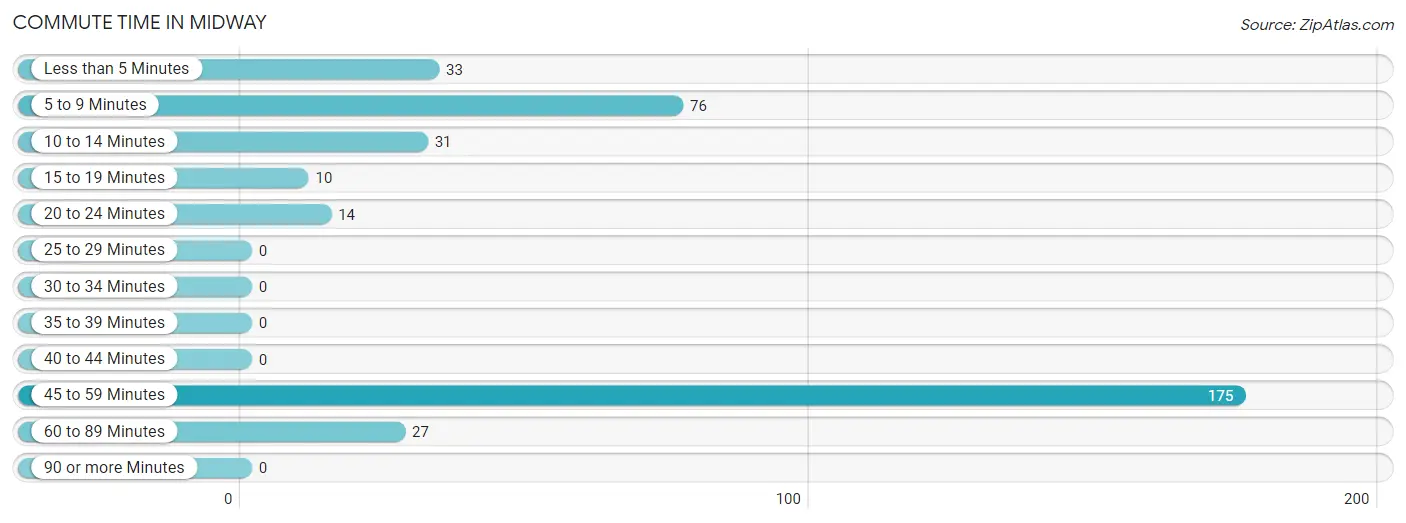
| Commute Time | # Commuters | % Commuters |
| Less than 5 Minutes | 33 | 9.0% |
| 5 to 9 Minutes | 76 | 20.8% |
| 10 to 14 Minutes | 31 | 8.5% |
| 15 to 19 Minutes | 10 | 2.7% |
| 20 to 24 Minutes | 14 | 3.8% |
| 25 to 29 Minutes | 0 | 0.0% |
| 30 to 34 Minutes | 0 | 0.0% |
| 35 to 39 Minutes | 0 | 0.0% |
| 40 to 44 Minutes | 0 | 0.0% |
| 45 to 59 Minutes | 175 | 47.8% |
| 60 to 89 Minutes | 27 | 7.4% |
| 90 or more Minutes | 0 | 0.0% |
Commute Time by Sex in Midway
The most common commute times in Midway are 45 to 59 minutes (175 commuters, 67.3%) for males and 5 to 9 minutes (55 commuters, 51.9%) for females.
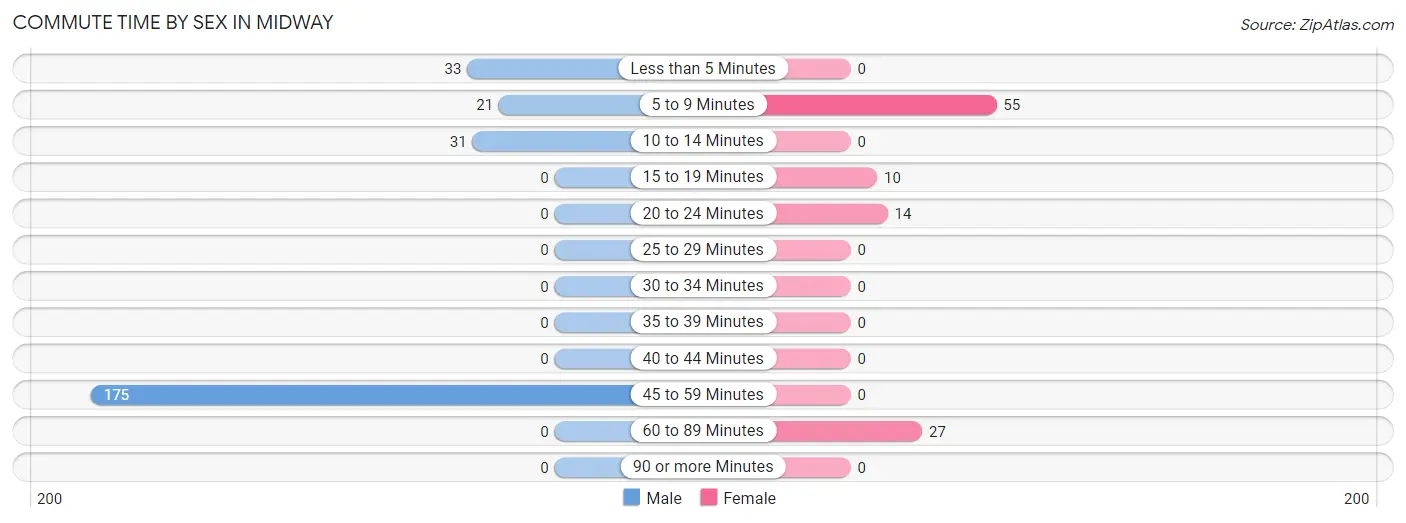
| Commute Time | Male | Female |
| Less than 5 Minutes | 33 (12.7%) | 0 (0.0%) |
| 5 to 9 Minutes | 21 (8.1%) | 55 (51.9%) |
| 10 to 14 Minutes | 31 (11.9%) | 0 (0.0%) |
| 15 to 19 Minutes | 0 (0.0%) | 10 (9.4%) |
| 20 to 24 Minutes | 0 (0.0%) | 14 (13.2%) |
| 25 to 29 Minutes | 0 (0.0%) | 0 (0.0%) |
| 30 to 34 Minutes | 0 (0.0%) | 0 (0.0%) |
| 35 to 39 Minutes | 0 (0.0%) | 0 (0.0%) |
| 40 to 44 Minutes | 0 (0.0%) | 0 (0.0%) |
| 45 to 59 Minutes | 175 (67.3%) | 0 (0.0%) |
| 60 to 89 Minutes | 0 (0.0%) | 27 (25.5%) |
| 90 or more Minutes | 0 (0.0%) | 0 (0.0%) |
Time of Departure to Work by Sex in Midway
The most frequent times of departure to work in Midway are 12:00 PM to 3:59 PM (175, 67.3%) for males and 6:00 AM to 6:29 AM (47, 44.3%) for females.
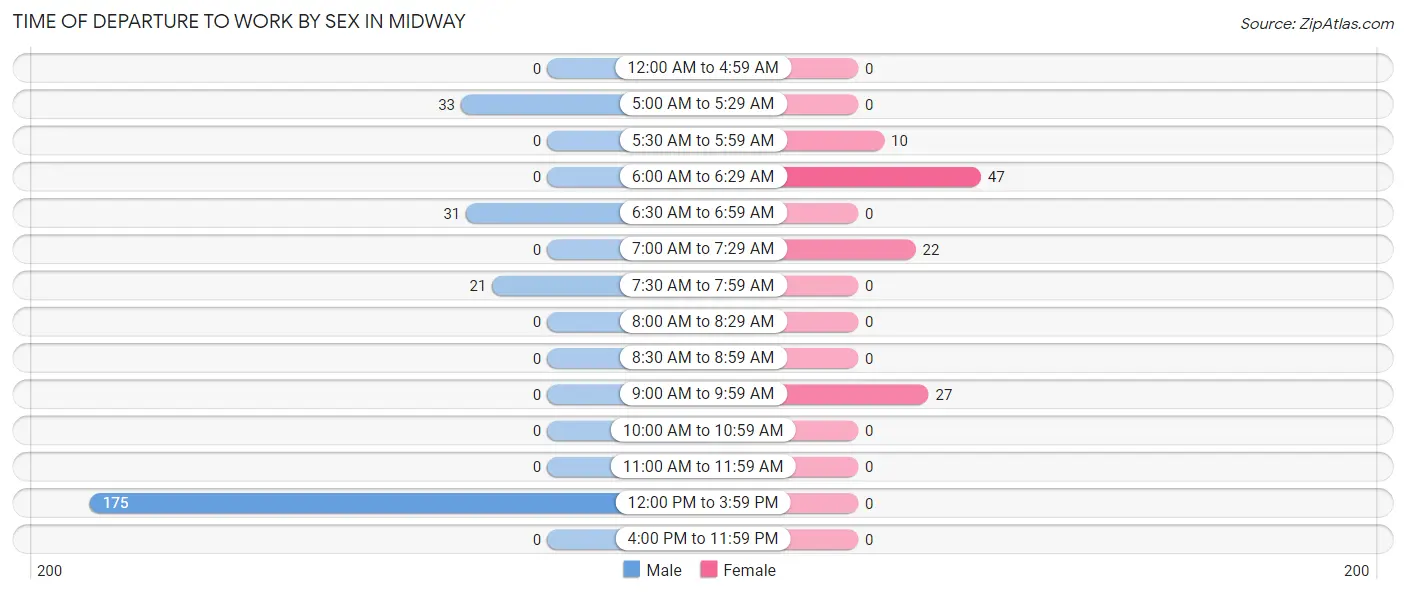
| Time of Departure | Male | Female |
| 12:00 AM to 4:59 AM | 0 (0.0%) | 0 (0.0%) |
| 5:00 AM to 5:29 AM | 33 (12.7%) | 0 (0.0%) |
| 5:30 AM to 5:59 AM | 0 (0.0%) | 10 (9.4%) |
| 6:00 AM to 6:29 AM | 0 (0.0%) | 47 (44.3%) |
| 6:30 AM to 6:59 AM | 31 (11.9%) | 0 (0.0%) |
| 7:00 AM to 7:29 AM | 0 (0.0%) | 22 (20.7%) |
| 7:30 AM to 7:59 AM | 21 (8.1%) | 0 (0.0%) |
| 8:00 AM to 8:29 AM | 0 (0.0%) | 0 (0.0%) |
| 8:30 AM to 8:59 AM | 0 (0.0%) | 0 (0.0%) |
| 9:00 AM to 9:59 AM | 0 (0.0%) | 27 (25.5%) |
| 10:00 AM to 10:59 AM | 0 (0.0%) | 0 (0.0%) |
| 11:00 AM to 11:59 AM | 0 (0.0%) | 0 (0.0%) |
| 12:00 PM to 3:59 PM | 175 (67.3%) | 0 (0.0%) |
| 4:00 PM to 11:59 PM | 0 (0.0%) | 0 (0.0%) |
| Total | 260 (100.0%) | 106 (100.0%) |
Housing Occupancy in Midway
Occupancy by Ownership in Midway
Of the total 296 dwellings in Midway, owner-occupied units account for 93 (31.4%), while renter-occupied units make up 203 (68.6%).
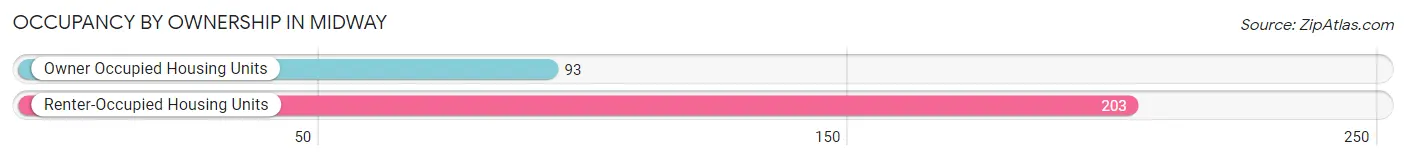
| Occupancy | # Housing Units | % Housing Units |
| Owner Occupied Housing Units | 93 | 31.4% |
| Renter-Occupied Housing Units | 203 | 68.6% |
| Total Occupied Housing Units | 296 | 100.0% |
Occupancy by Household Size in Midway
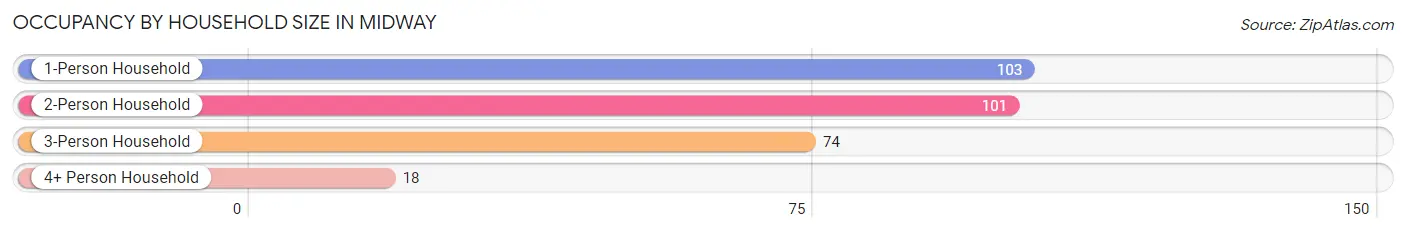
| Household Size | # Housing Units | % Housing Units |
| 1-Person Household | 103 | 34.8% |
| 2-Person Household | 101 | 34.1% |
| 3-Person Household | 74 | 25.0% |
| 4+ Person Household | 18 | 6.1% |
| Total Housing Units | 296 | 100.0% |
Occupancy by Ownership by Household Size in Midway
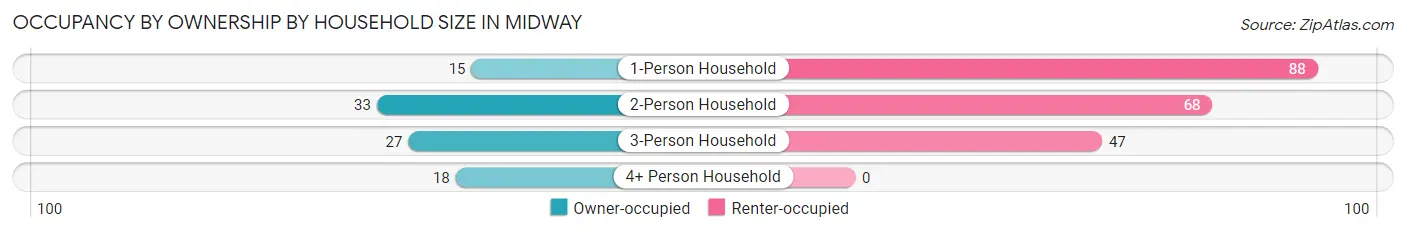
| Household Size | Owner-occupied | Renter-occupied |
| 1-Person Household | 15 (14.6%) | 88 (85.4%) |
| 2-Person Household | 33 (32.7%) | 68 (67.3%) |
| 3-Person Household | 27 (36.5%) | 47 (63.5%) |
| 4+ Person Household | 18 (100.0%) | 0 (0.0%) |
| Total Housing Units | 93 (31.4%) | 203 (68.6%) |
Occupancy by Educational Attainment in Midway
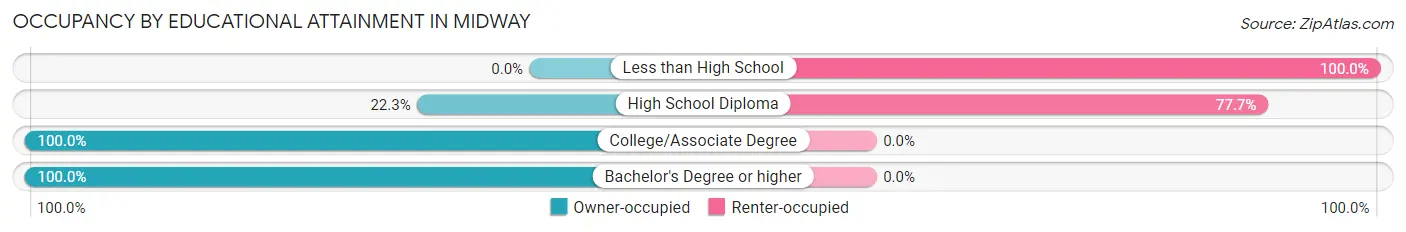
| Household Size | Owner-occupied | Renter-occupied |
| Less than High School | 0 (0.0%) | 88 (100.0%) |
| High School Diploma | 33 (22.3%) | 115 (77.7%) |
| College/Associate Degree | 38 (100.0%) | 0 (0.0%) |
| Bachelor's Degree or higher | 22 (100.0%) | 0 (0.0%) |
Occupancy by Age of Householder in Midway
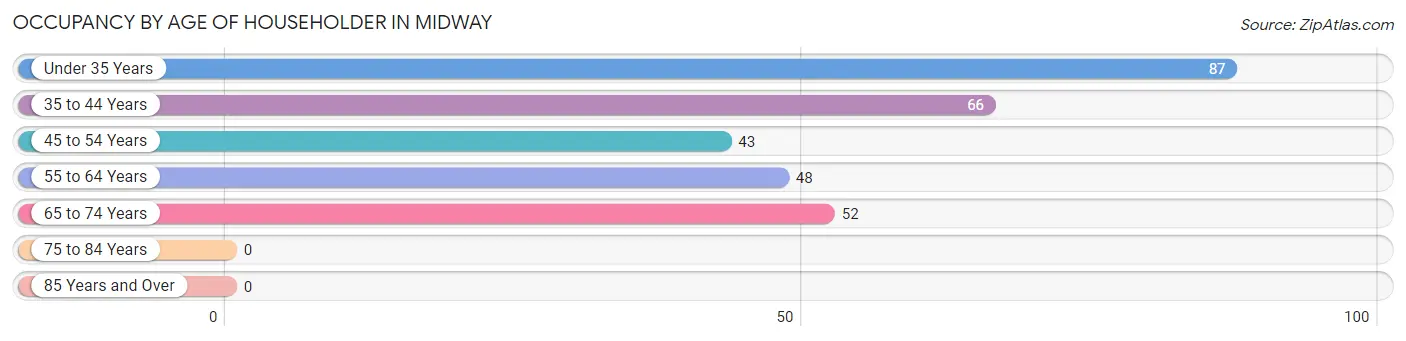
| Age Bracket | # Households | % Households |
| Under 35 Years | 87 | 29.4% |
| 35 to 44 Years | 66 | 22.3% |
| 45 to 54 Years | 43 | 14.5% |
| 55 to 64 Years | 48 | 16.2% |
| 65 to 74 Years | 52 | 17.6% |
| 75 to 84 Years | 0 | 0.0% |
| 85 Years and Over | 0 | 0.0% |
| Total | 296 | 100.0% |
Housing Finances in Midway
Median Income by Occupancy in Midway
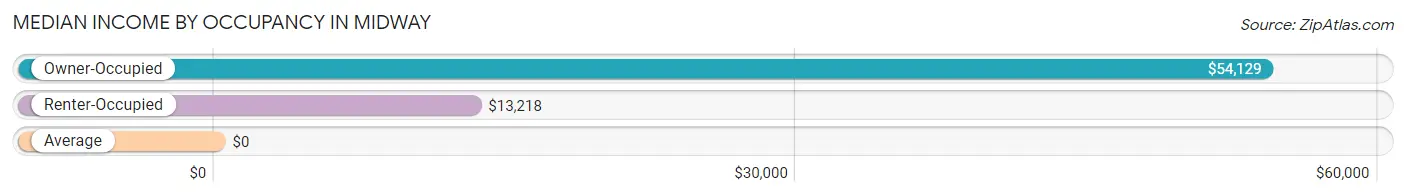
| Occupancy Type | # Households | Median Income |
| Owner-Occupied | 93 (31.4%) | $54,129 |
| Renter-Occupied | 203 (68.6%) | $13,218 |
| Average | 296 (100.0%) | $0 |
Occupancy by Householder Income Bracket in Midway
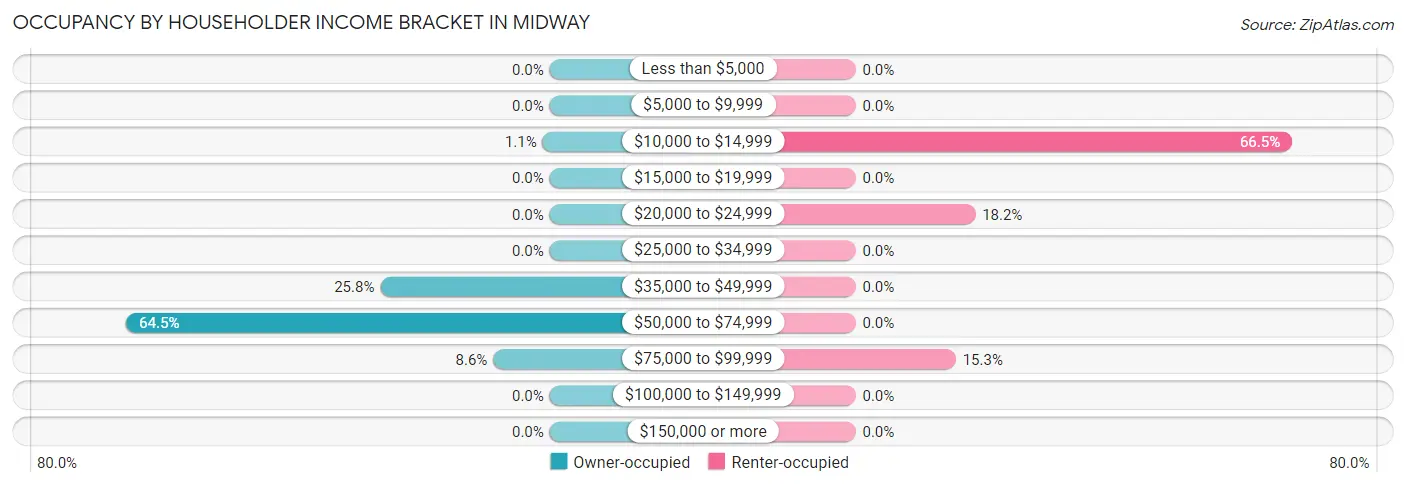
| Income Bracket | Owner-occupied | Renter-occupied |
| Less than $5,000 | 0 (0.0%) | 0 (0.0%) |
| $5,000 to $9,999 | 0 (0.0%) | 0 (0.0%) |
| $10,000 to $14,999 | 1 (1.1%) | 135 (66.5%) |
| $15,000 to $19,999 | 0 (0.0%) | 0 (0.0%) |
| $20,000 to $24,999 | 0 (0.0%) | 37 (18.2%) |
| $25,000 to $34,999 | 0 (0.0%) | 0 (0.0%) |
| $35,000 to $49,999 | 24 (25.8%) | 0 (0.0%) |
| $50,000 to $74,999 | 60 (64.5%) | 0 (0.0%) |
| $75,000 to $99,999 | 8 (8.6%) | 31 (15.3%) |
| $100,000 to $149,999 | 0 (0.0%) | 0 (0.0%) |
| $150,000 or more | 0 (0.0%) | 0 (0.0%) |
| Total | 93 (100.0%) | 203 (100.0%) |
Monthly Housing Cost Tiers in Midway
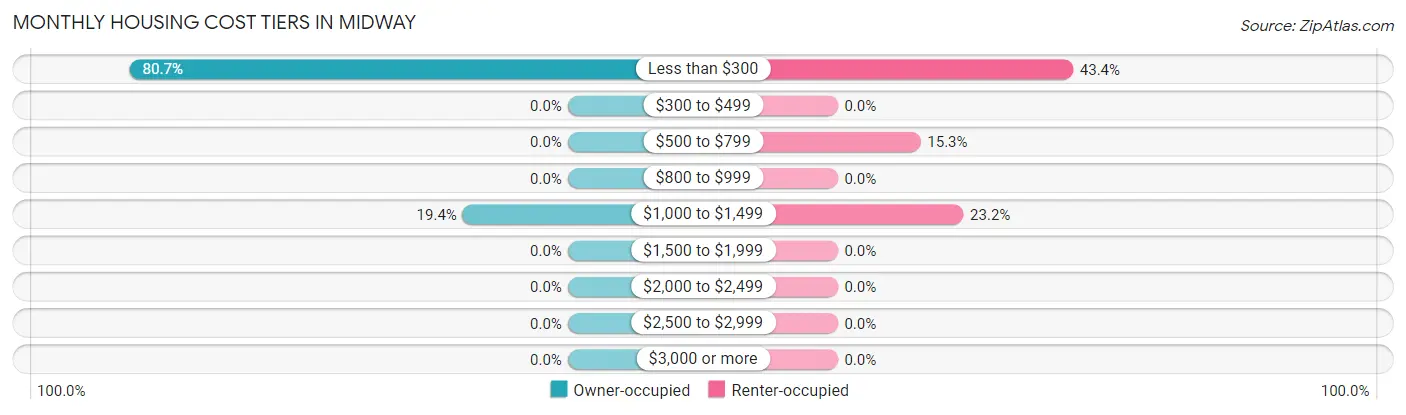
| Monthly Cost | Owner-occupied | Renter-occupied |
| Less than $300 | 75 (80.6%) | 88 (43.3%) |
| $300 to $499 | 0 (0.0%) | 0 (0.0%) |
| $500 to $799 | 0 (0.0%) | 31 (15.3%) |
| $800 to $999 | 0 (0.0%) | 0 (0.0%) |
| $1,000 to $1,499 | 18 (19.4%) | 47 (23.2%) |
| $1,500 to $1,999 | 0 (0.0%) | 0 (0.0%) |
| $2,000 to $2,499 | 0 (0.0%) | 0 (0.0%) |
| $2,500 to $2,999 | 0 (0.0%) | 0 (0.0%) |
| $3,000 or more | 0 (0.0%) | 0 (0.0%) |
| Total | 93 (100.0%) | 203 (100.0%) |
Physical Housing Characteristics in Midway
Housing Structures in Midway
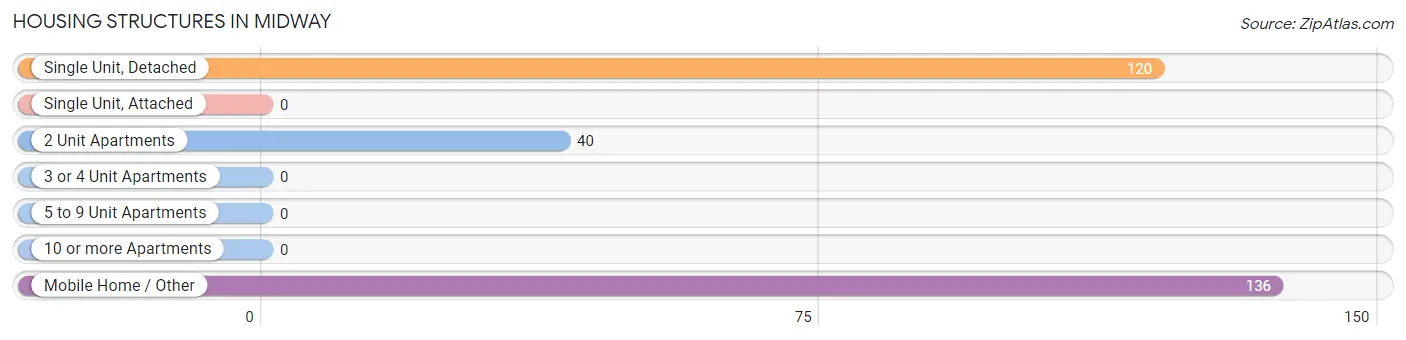
| Structure Type | # Housing Units | % Housing Units |
| Single Unit, Detached | 120 | 40.5% |
| Single Unit, Attached | 0 | 0.0% |
| 2 Unit Apartments | 40 | 13.5% |
| 3 or 4 Unit Apartments | 0 | 0.0% |
| 5 to 9 Unit Apartments | 0 | 0.0% |
| 10 or more Apartments | 0 | 0.0% |
| Mobile Home / Other | 136 | 46.0% |
| Total | 296 | 100.0% |
Housing Structures by Occupancy in Midway
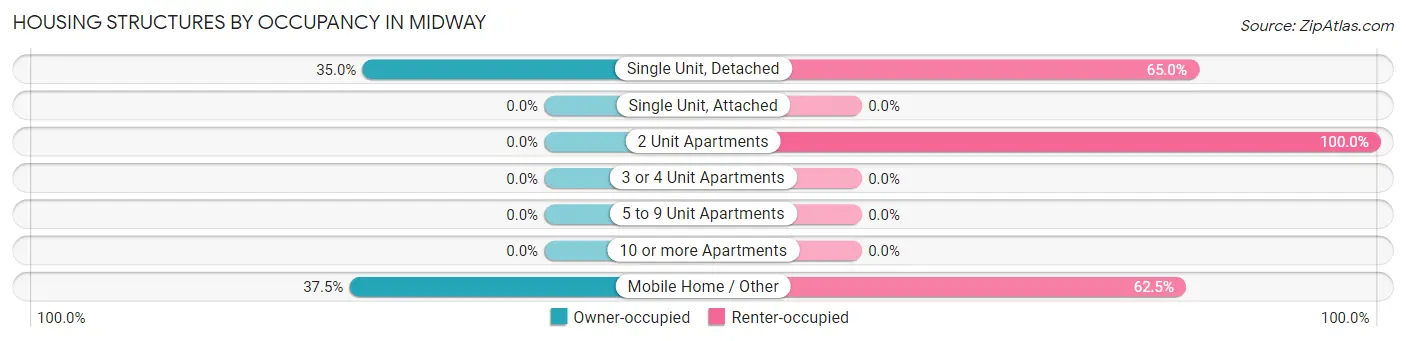
| Structure Type | Owner-occupied | Renter-occupied |
| Single Unit, Detached | 42 (35.0%) | 78 (65.0%) |
| Single Unit, Attached | 0 (0.0%) | 0 (0.0%) |
| 2 Unit Apartments | 0 (0.0%) | 40 (100.0%) |
| 3 or 4 Unit Apartments | 0 (0.0%) | 0 (0.0%) |
| 5 to 9 Unit Apartments | 0 (0.0%) | 0 (0.0%) |
| 10 or more Apartments | 0 (0.0%) | 0 (0.0%) |
| Mobile Home / Other | 51 (37.5%) | 85 (62.5%) |
| Total | 93 (31.4%) | 203 (68.6%) |
Housing Structures by Number of Rooms in Midway
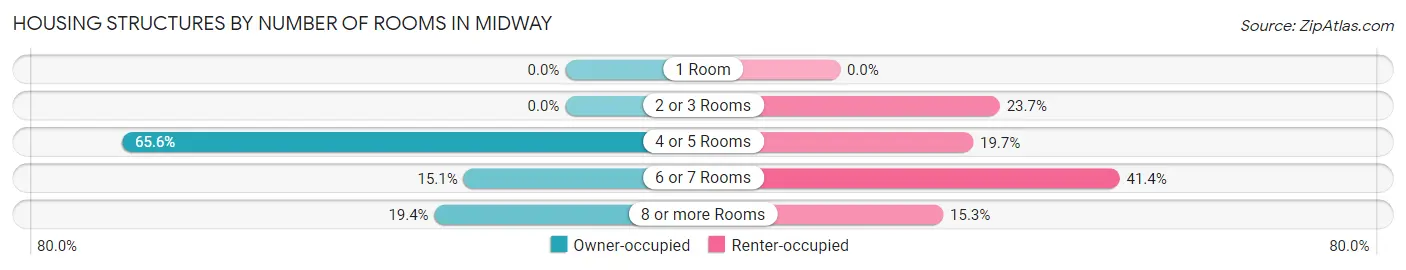
| Number of Rooms | Owner-occupied | Renter-occupied |
| 1 Room | 0 (0.0%) | 0 (0.0%) |
| 2 or 3 Rooms | 0 (0.0%) | 48 (23.6%) |
| 4 or 5 Rooms | 61 (65.6%) | 40 (19.7%) |
| 6 or 7 Rooms | 14 (15.0%) | 84 (41.4%) |
| 8 or more Rooms | 18 (19.4%) | 31 (15.3%) |
| Total | 93 (100.0%) | 203 (100.0%) |
Housing Structure by Heating Type in Midway
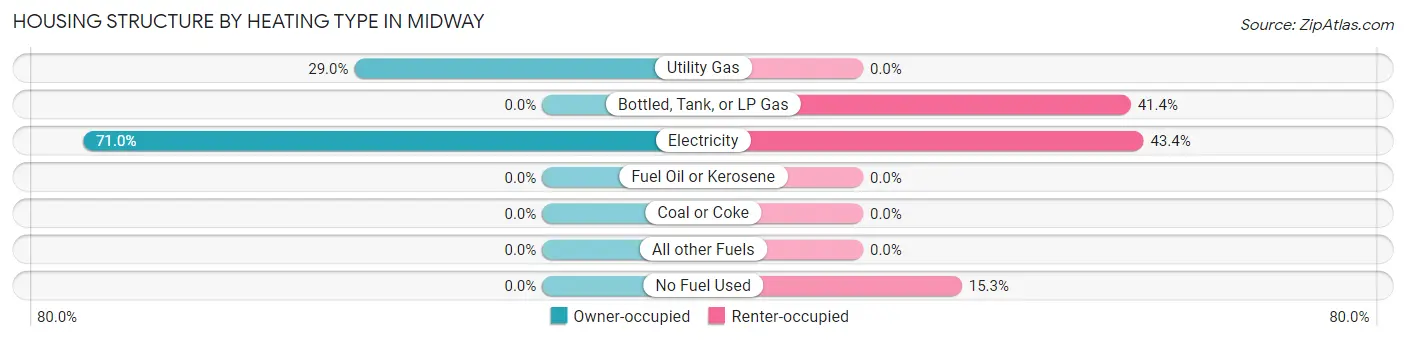
| Heating Type | Owner-occupied | Renter-occupied |
| Utility Gas | 27 (29.0%) | 0 (0.0%) |
| Bottled, Tank, or LP Gas | 0 (0.0%) | 84 (41.4%) |
| Electricity | 66 (71.0%) | 88 (43.3%) |
| Fuel Oil or Kerosene | 0 (0.0%) | 0 (0.0%) |
| Coal or Coke | 0 (0.0%) | 0 (0.0%) |
| All other Fuels | 0 (0.0%) | 0 (0.0%) |
| No Fuel Used | 0 (0.0%) | 31 (15.3%) |
| Total | 93 (100.0%) | 203 (100.0%) |
Household Vehicle Usage in Midway
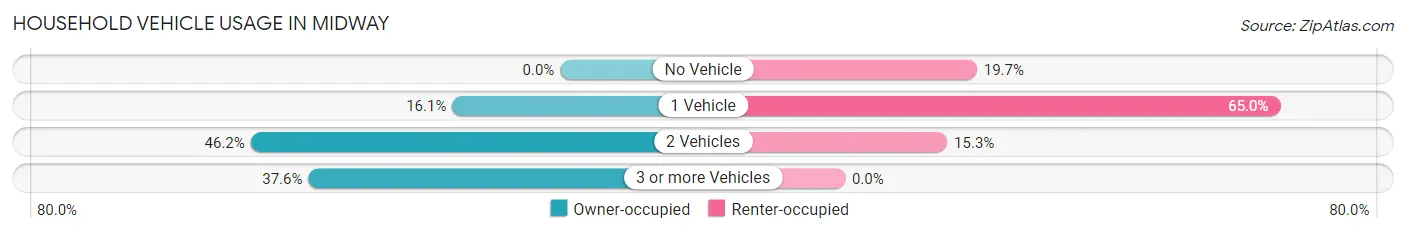
| Vehicles per Household | Owner-occupied | Renter-occupied |
| No Vehicle | 0 (0.0%) | 40 (19.7%) |
| 1 Vehicle | 15 (16.1%) | 132 (65.0%) |
| 2 Vehicles | 43 (46.2%) | 31 (15.3%) |
| 3 or more Vehicles | 35 (37.6%) | 0 (0.0%) |
| Total | 93 (100.0%) | 203 (100.0%) |
Real Estate & Mortgages in Midway
Real Estate and Mortgage Overview in Midway
| Characteristic | Without Mortgage | With Mortgage |
| Housing Units | 75 | 18 |
| Median Property Value | - | - |
| Median Household Income | $54,205 | $0 |
| Monthly Housing Costs | - | - |
| Real Estate Taxes | $199 | $18 |
Property Value by Mortgage Status in Midway
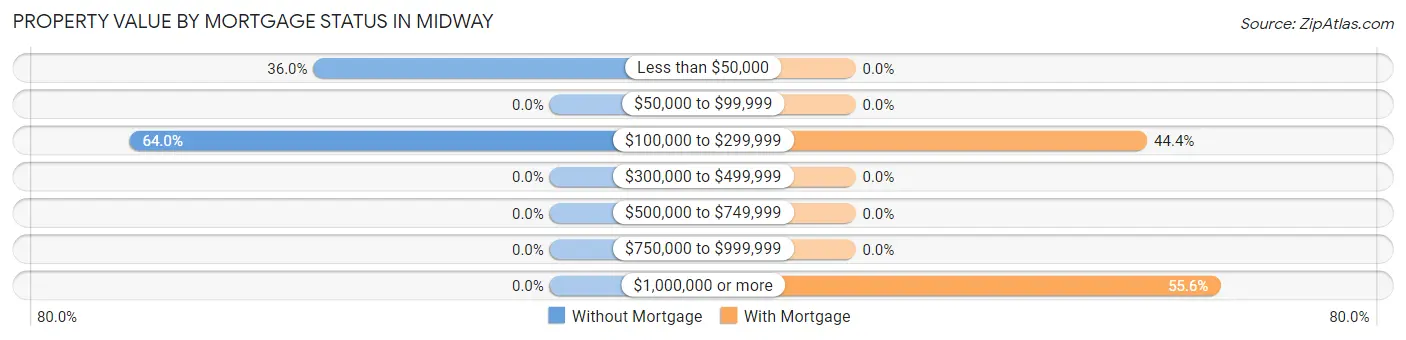
| Property Value | Without Mortgage | With Mortgage |
| Less than $50,000 | 27 (36.0%) | 0 (0.0%) |
| $50,000 to $99,999 | 0 (0.0%) | 0 (0.0%) |
| $100,000 to $299,999 | 48 (64.0%) | 8 (44.4%) |
| $300,000 to $499,999 | 0 (0.0%) | 0 (0.0%) |
| $500,000 to $749,999 | 0 (0.0%) | 0 (0.0%) |
| $750,000 to $999,999 | 0 (0.0%) | 0 (0.0%) |
| $1,000,000 or more | 0 (0.0%) | 10 (55.6%) |
| Total | 75 (100.0%) | 18 (100.0%) |
Household Income by Mortgage Status in Midway
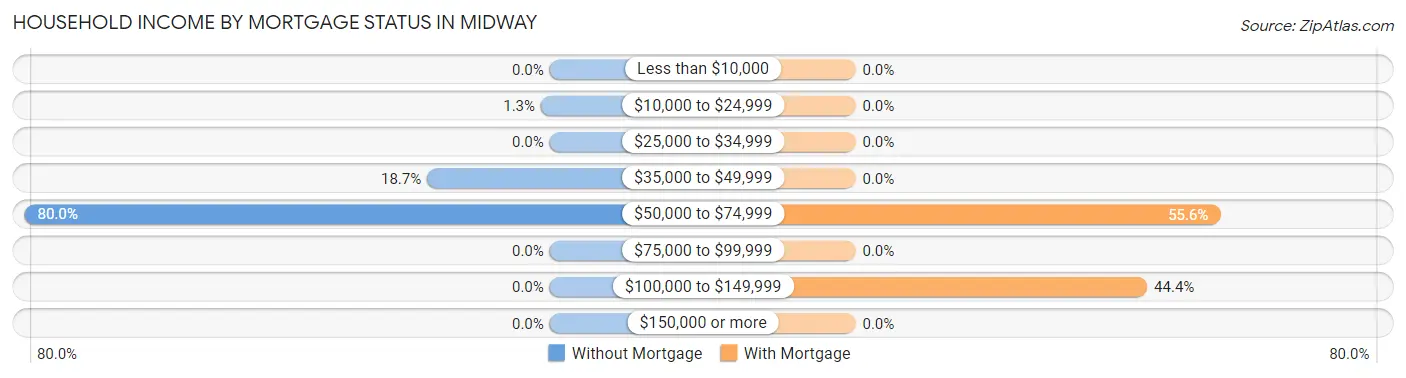
| Household Income | Without Mortgage | With Mortgage |
| Less than $10,000 | 0 (0.0%) | 0 (0.0%) |
| $10,000 to $24,999 | 1 (1.3%) | 0 (0.0%) |
| $25,000 to $34,999 | 0 (0.0%) | 0 (0.0%) |
| $35,000 to $49,999 | 14 (18.7%) | 0 (0.0%) |
| $50,000 to $74,999 | 60 (80.0%) | 10 (55.6%) |
| $75,000 to $99,999 | 0 (0.0%) | 0 (0.0%) |
| $100,000 to $149,999 | 0 (0.0%) | 8 (44.4%) |
| $150,000 or more | 0 (0.0%) | 0 (0.0%) |
| Total | 75 (100.0%) | 18 (100.0%) |
Property Value to Household Income Ratio in Midway
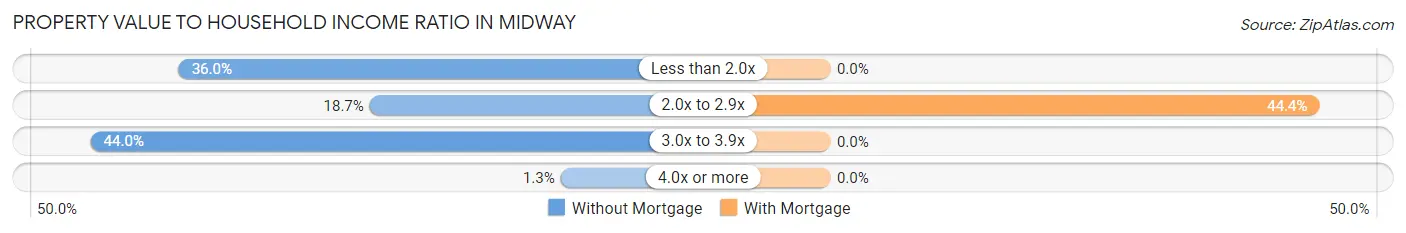
| Value-to-Income Ratio | Without Mortgage | With Mortgage |
| Less than 2.0x | 27 (36.0%) | 0 (0.0%) |
| 2.0x to 2.9x | 14 (18.7%) | 8 (44.4%) |
| 3.0x to 3.9x | 33 (44.0%) | 0 (0.0%) |
| 4.0x or more | 1 (1.3%) | 0 (0.0%) |
| Total | 75 (100.0%) | 18 (100.0%) |
Real Estate Taxes by Mortgage Status in Midway
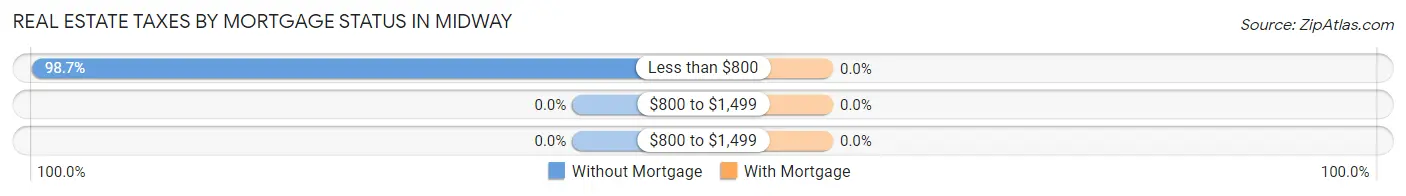
| Property Taxes | Without Mortgage | With Mortgage |
| Less than $800 | 74 (98.7%) | 0 (0.0%) |
| $800 to $1,499 | 0 (0.0%) | 0 (0.0%) |
| $800 to $1,499 | 0 (0.0%) | 0 (0.0%) |
| Total | 75 (100.0%) | 18 (100.0%) |
Health & Disability in Midway
Health Insurance Coverage by Age in Midway
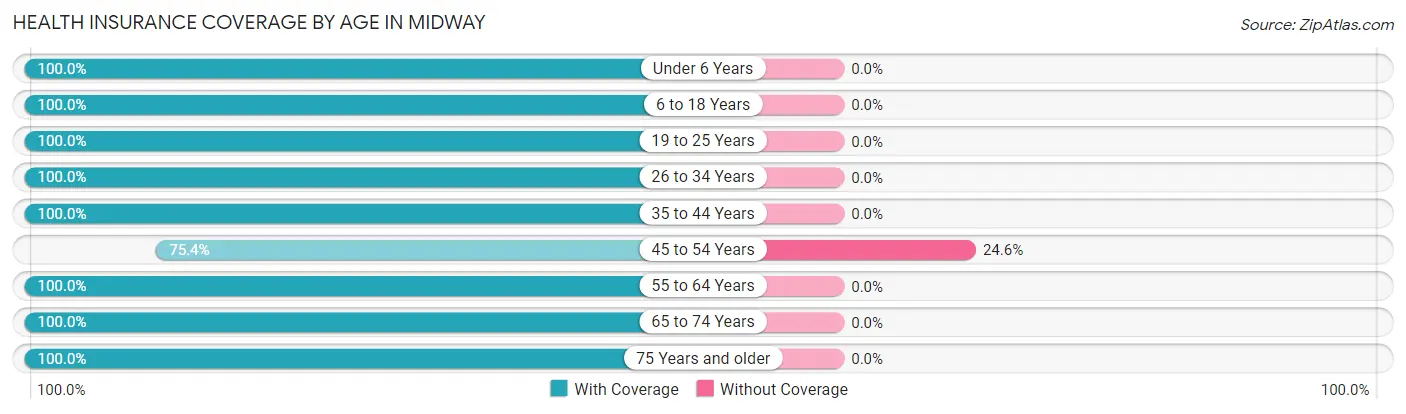
| Age Bracket | With Coverage | Without Coverage |
| Under 6 Years | 8 (100.0%) | 0 (0.0%) |
| 6 to 18 Years | 149 (100.0%) | 0 (0.0%) |
| 19 to 25 Years | 175 (100.0%) | 0 (0.0%) |
| 26 to 34 Years | 87 (100.0%) | 0 (0.0%) |
| 35 to 44 Years | 147 (100.0%) | 0 (0.0%) |
| 45 to 54 Years | 43 (75.4%) | 14 (24.6%) |
| 55 to 64 Years | 48 (100.0%) | 0 (0.0%) |
| 65 to 74 Years | 52 (100.0%) | 0 (0.0%) |
| 75 Years and older | 26 (100.0%) | 0 (0.0%) |
| Total | 735 (98.1%) | 14 (1.9%) |
Health Insurance Coverage by Citizenship Status in Midway

| Citizenship Status | With Coverage | Without Coverage |
| Native Born | 8 (100.0%) | 0 (0.0%) |
| Foreign Born, Citizen | 149 (100.0%) | 0 (0.0%) |
| Foreign Born, not a Citizen | 175 (100.0%) | 0 (0.0%) |
Health Insurance Coverage by Household Income in Midway
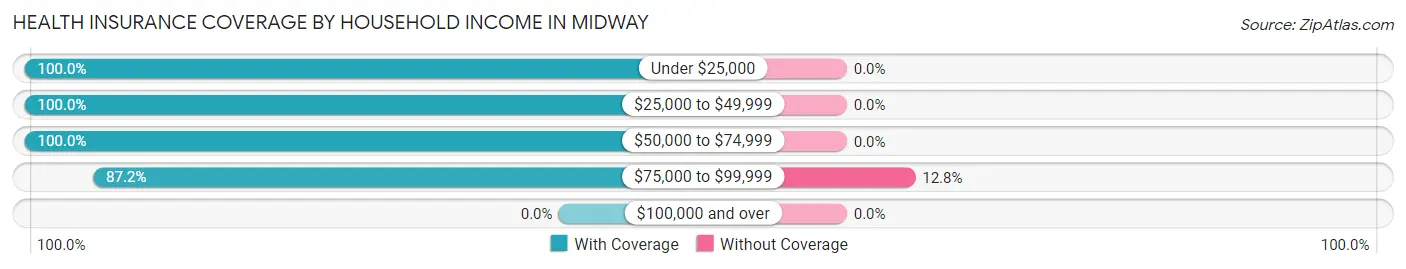
| Household Income | With Coverage | Without Coverage |
| Under $25,000 | 299 (100.0%) | 0 (0.0%) |
| $25,000 to $49,999 | 72 (100.0%) | 0 (0.0%) |
| $50,000 to $74,999 | 269 (100.0%) | 0 (0.0%) |
| $75,000 to $99,999 | 95 (87.2%) | 14 (12.8%) |
| $100,000 and over | 0 (0.0%) | 0 (0.0%) |
Public vs Private Health Insurance Coverage by Age in Midway
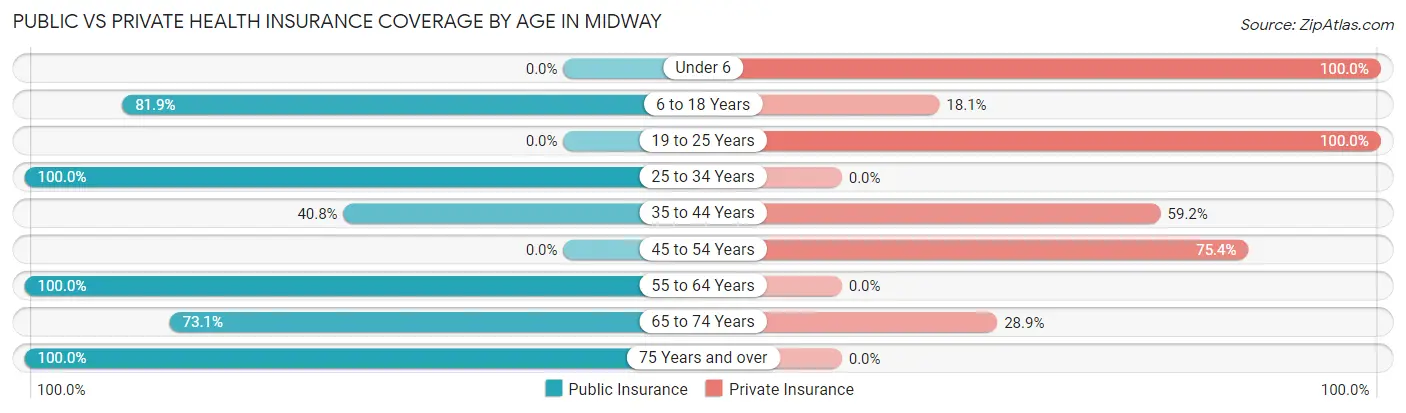
| Age Bracket | Public Insurance | Private Insurance |
| Under 6 | 0 (0.0%) | 8 (100.0%) |
| 6 to 18 Years | 122 (81.9%) | 27 (18.1%) |
| 19 to 25 Years | 0 (0.0%) | 175 (100.0%) |
| 25 to 34 Years | 87 (100.0%) | 0 (0.0%) |
| 35 to 44 Years | 60 (40.8%) | 87 (59.2%) |
| 45 to 54 Years | 0 (0.0%) | 43 (75.4%) |
| 55 to 64 Years | 48 (100.0%) | 0 (0.0%) |
| 65 to 74 Years | 38 (73.1%) | 15 (28.8%) |
| 75 Years and over | 26 (100.0%) | 0 (0.0%) |
| Total | 381 (50.9%) | 355 (47.4%) |
Disability Status by Sex by Age in Midway
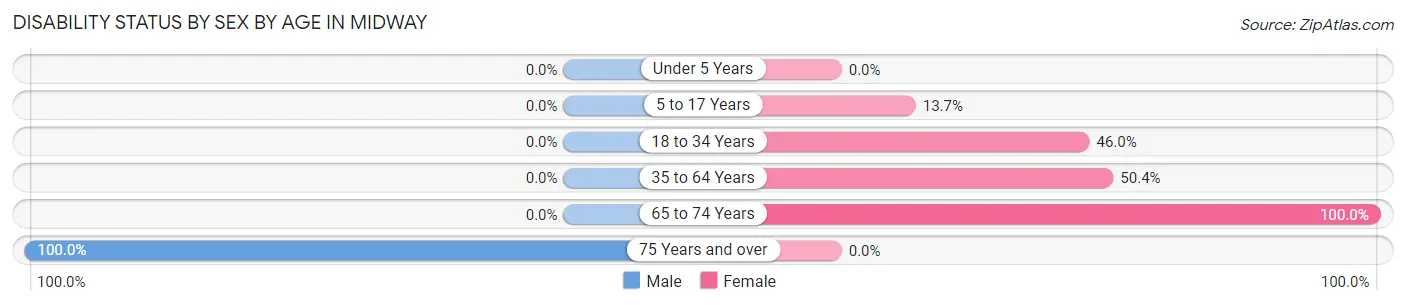
| Age Bracket | Male | Female |
| Under 5 Years | 0 (0.0%) | 0 (0.0%) |
| 5 to 17 Years | 0 (0.0%) | 7 (13.7%) |
| 18 to 34 Years | 0 (0.0%) | 40 (46.0%) |
| 35 to 64 Years | 0 (0.0%) | 60 (50.4%) |
| 65 to 74 Years | 0 (0.0%) | 52 (100.0%) |
| 75 Years and over | 26 (100.0%) | 0 (0.0%) |
Disability Class by Sex by Age in Midway
Disability Class: Hearing Difficulty
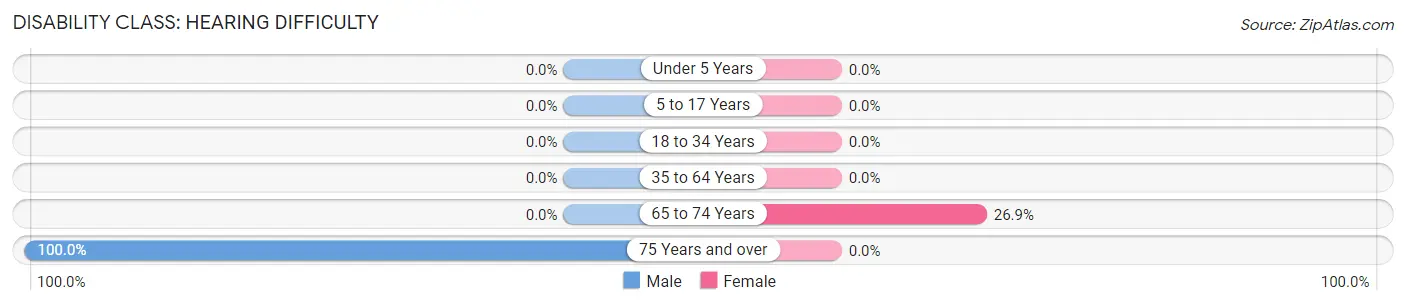
| Age Bracket | Male | Female |
| Under 5 Years | 0 (0.0%) | 0 (0.0%) |
| 5 to 17 Years | 0 (0.0%) | 0 (0.0%) |
| 18 to 34 Years | 0 (0.0%) | 0 (0.0%) |
| 35 to 64 Years | 0 (0.0%) | 0 (0.0%) |
| 65 to 74 Years | 0 (0.0%) | 14 (26.9%) |
| 75 Years and over | 26 (100.0%) | 0 (0.0%) |
Disability Class: Vision Difficulty
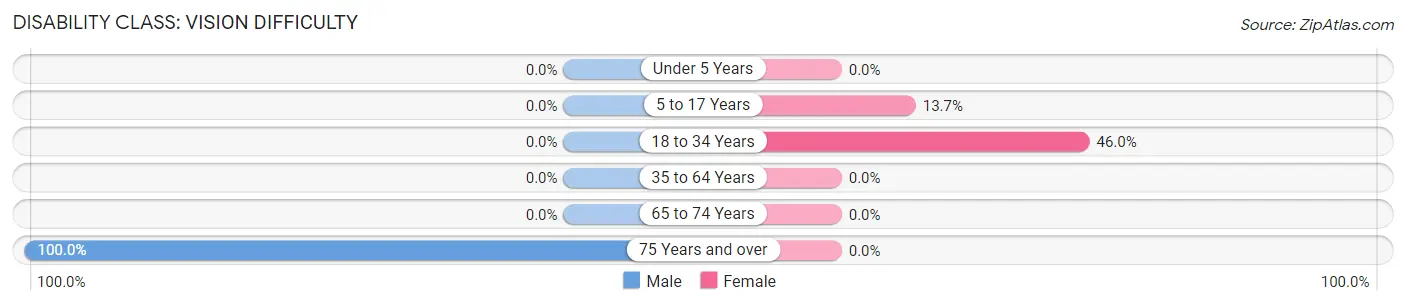
| Age Bracket | Male | Female |
| Under 5 Years | 0 (0.0%) | 0 (0.0%) |
| 5 to 17 Years | 0 (0.0%) | 7 (13.7%) |
| 18 to 34 Years | 0 (0.0%) | 40 (46.0%) |
| 35 to 64 Years | 0 (0.0%) | 0 (0.0%) |
| 65 to 74 Years | 0 (0.0%) | 0 (0.0%) |
| 75 Years and over | 26 (100.0%) | 0 (0.0%) |
Disability Class: Cognitive Difficulty
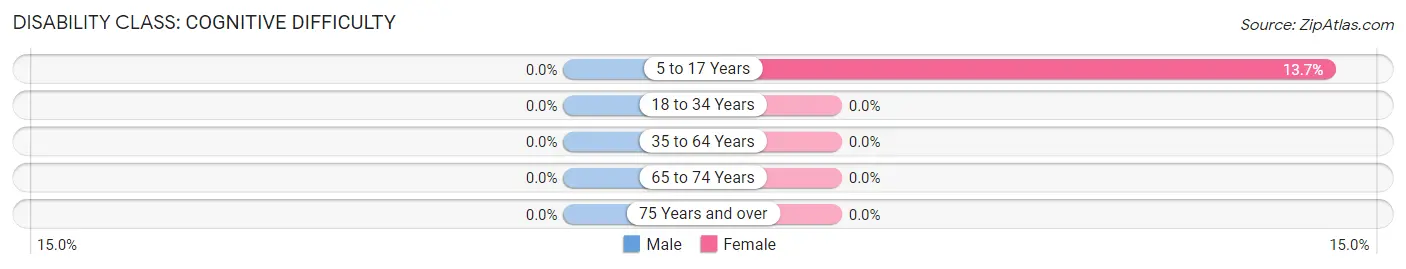
| Age Bracket | Male | Female |
| 5 to 17 Years | 0 (0.0%) | 7 (13.7%) |
| 18 to 34 Years | 0 (0.0%) | 0 (0.0%) |
| 35 to 64 Years | 0 (0.0%) | 0 (0.0%) |
| 65 to 74 Years | 0 (0.0%) | 0 (0.0%) |
| 75 Years and over | 0 (0.0%) | 0 (0.0%) |
Disability Class: Ambulatory Difficulty
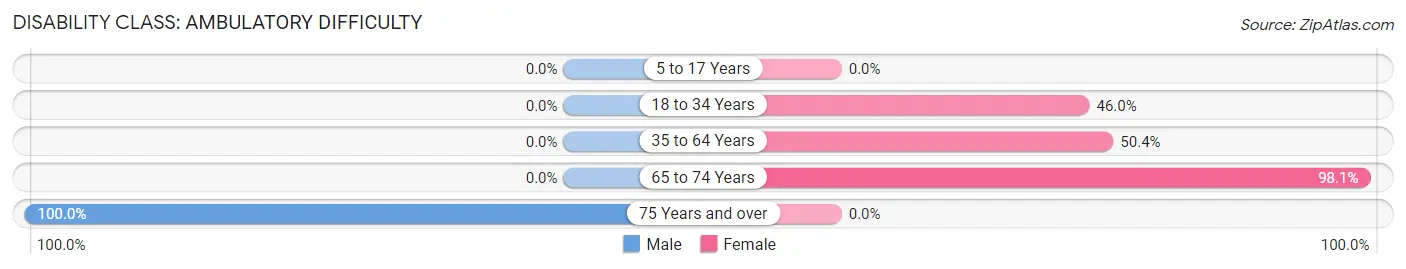
| Age Bracket | Male | Female |
| 5 to 17 Years | 0 (0.0%) | 0 (0.0%) |
| 18 to 34 Years | 0 (0.0%) | 40 (46.0%) |
| 35 to 64 Years | 0 (0.0%) | 60 (50.4%) |
| 65 to 74 Years | 0 (0.0%) | 51 (98.1%) |
| 75 Years and over | 26 (100.0%) | 0 (0.0%) |
Disability Class: Self-Care Difficulty
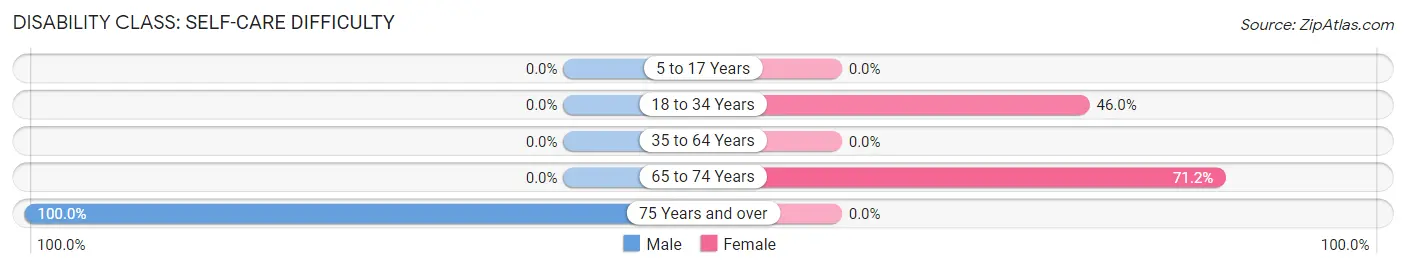
| Age Bracket | Male | Female |
| 5 to 17 Years | 0 (0.0%) | 0 (0.0%) |
| 18 to 34 Years | 0 (0.0%) | 40 (46.0%) |
| 35 to 64 Years | 0 (0.0%) | 0 (0.0%) |
| 65 to 74 Years | 0 (0.0%) | 37 (71.2%) |
| 75 Years and over | 26 (100.0%) | 0 (0.0%) |
Technology Access in Midway
Computing Device Access in Midway
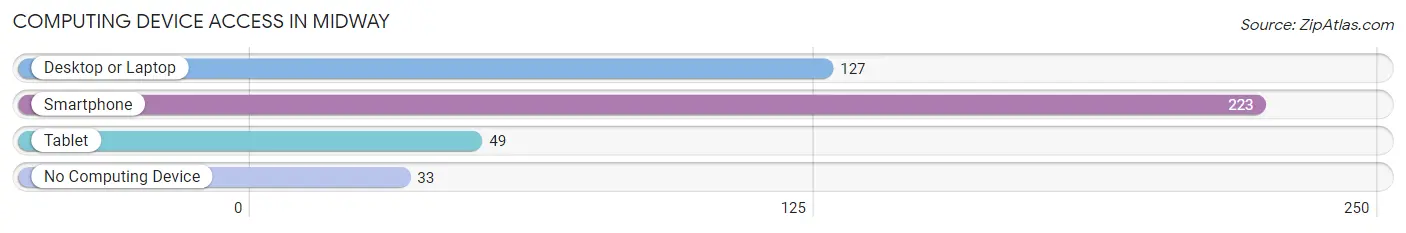
| Device Type | # Households | % Households |
| Desktop or Laptop | 127 | 42.9% |
| Smartphone | 223 | 75.3% |
| Tablet | 49 | 16.6% |
| No Computing Device | 33 | 11.2% |
| Total | 296 | 100.0% |
Internet Access in Midway
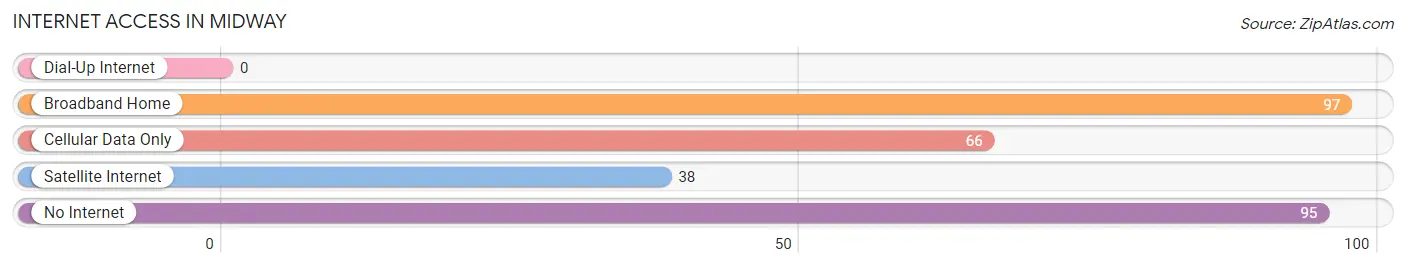
| Internet Type | # Households | % Households |
| Dial-Up Internet | 0 | 0.0% |
| Broadband Home | 97 | 32.8% |
| Cellular Data Only | 66 | 22.3% |
| Satellite Internet | 38 | 12.8% |
| No Internet | 95 | 32.1% |
| Total | 296 | 100.0% |
Midway Summary
Midway is a small town located in the northern part of Louisiana, in the United States. It is situated in the parish of Lincoln, and is part of the Ruston Metropolitan Statistical Area. The town has a population of approximately 1,000 people, and is known for its rural charm and friendly atmosphere.
History
Midway was founded in 1845 by a group of settlers from the nearby town of Ruston. The town was originally known as “Midway Station”, as it was located halfway between Ruston and Monroe. The town was officially incorporated in 1887, and the name was changed to “Midway”.
The town was an important stop on the Vicksburg, Shreveport and Texas Railroad, which ran through the area in the late 19th century. The railroad brought economic growth to the area, and the town soon became a hub for the timber and cotton industries.
In the early 20th century, Midway was home to a number of businesses, including a sawmill, a cotton gin, a grist mill, and a general store. The town also had a post office, a bank, and a hotel.
Geography
Midway is located in the northern part of Louisiana, in the United States. It is situated in the parish of Lincoln, and is part of the Ruston Metropolitan Statistical Area. The town is located at the intersection of Louisiana Highway 33 and Louisiana Highway 34.
The town is situated on the banks of the Ouachita River, and is surrounded by rolling hills and forests. The town is located approximately 30 miles north of Ruston, and approximately 50 miles south of Monroe.
Economy
Midway’s economy is largely based on agriculture and timber. The town is home to a number of farms, which produce a variety of crops, including cotton, corn, soybeans, and wheat. The town is also home to a number of timber companies, which harvest timber from the surrounding forests.
The town is also home to a number of small businesses, including restaurants, convenience stores, and gas stations. The town is also home to a number of manufacturing companies, which produce a variety of products, including furniture, clothing, and paper products.
Demographics
As of the 2010 census, Midway had a population of 1,000 people. The town is predominantly white, with approximately 90% of the population being white. The town is also home to a small African American population, with approximately 8% of the population being African American.
The town has a median household income of approximately $35,000, and a median home value of approximately $90,000. The town has a poverty rate of approximately 15%, and a high school graduation rate of approximately 80%.
Conclusion
Midway is a small town located in the northern part of Louisiana, in the United States. It is situated in the parish of Lincoln, and is part of the Ruston Metropolitan Statistical Area. The town has a population of approximately 1,000 people, and is known for its rural charm and friendly atmosphere. The town’s economy is largely based on agriculture and timber, and the town is home to a number of small businesses. The town is predominantly white, with approximately 90% of the population being white. The town has a median household income of approximately $35,000, and a median home value of approximately $90,000.
Common Questions
What is Per Capita Income in Midway?
Per Capita income in Midway is $16,524.
What is the Median Family Income in Midway?
Median Family Income in Midway is $52,689.
What is Inequality or Gini Index in Midway?
Inequality or Gini Index in Midway is 0.42.
What is the Total Population of Midway?
Total Population of Midway is 749.
What is the Total Male Population of Midway?
Total Male Population of Midway is 440.
What is the Total Female Population of Midway?
Total Female Population of Midway is 309.
What is the Ratio of Males per 100 Females in Midway?
There are 142.39 Males per 100 Females in Midway.
What is the Ratio of Females per 100 Males in Midway?
There are 70.23 Females per 100 Males in Midway.
What is the Median Population Age in Midway?
Median Population Age in Midway is 34.1 Years.
What is the Average Family Size in Midway
Average Family Size in Midway is 3.4 People.
What is the Average Household Size in Midway
Average Household Size in Midway is 2.5 People.
How Large is the Labor Force in Midway?
There are 366 People in the Labor Forcein in Midway.
What is the Percentage of People in the Labor Force in Midway?
60.1% of People are in the Labor Force in Midway.