Harts, WV Map & Demographics
Harts Map
Harts Overview
$17,298
PER CAPITA INCOME
$50,083
AVG FAMILY INCOME
$35,750
AVG HOUSEHOLD INCOME
0.43
INEQUALITY / GINI INDEX
436
TOTAL POPULATION
205
MALE POPULATION
231
FEMALE POPULATION
88.74
MALES / 100 FEMALES
112.68
FEMALES / 100 MALES
53.0
MEDIAN AGE
4.2
AVG FAMILY SIZE
3.2
AVG HOUSEHOLD SIZE
95
LABOR FORCE [ PEOPLE ]
30.0%
PERCENT IN LABOR FORCE
Harts Zip Codes
Harts Area Codes
Income in Harts
Income Overview in Harts
Per Capita Income in Harts is $17,298, while median incomes of families and households are $50,083 and $35,750 respectively.
| Characteristic | Number | Measure |
| Per Capita Income | 436 | $17,298 |
| Median Family Income | 83 | $50,083 |
| Mean Family Income | 83 | $60,054 |
| Median Household Income | 136 | $35,750 |
| Mean Household Income | 136 | $45,582 |
| Income Deficit | 83 | $0 |
| Wage / Income Gap (%) | 436 | 0.00% |
| Wage / Income Gap ($) | 436 | 100.00¢ per $1 |
| Gini / Inequality Index | 436 | 0.43 |
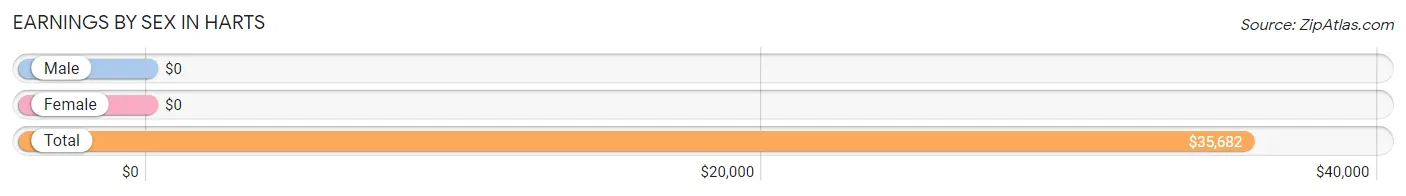
Earnings by Sex in Harts
| Sex | Number | Average Earnings |
| Male | 49 (46.2%) | $0 |
| Female | 57 (53.8%) | $0 |
| Total | 106 (100.0%) | $35,682 |
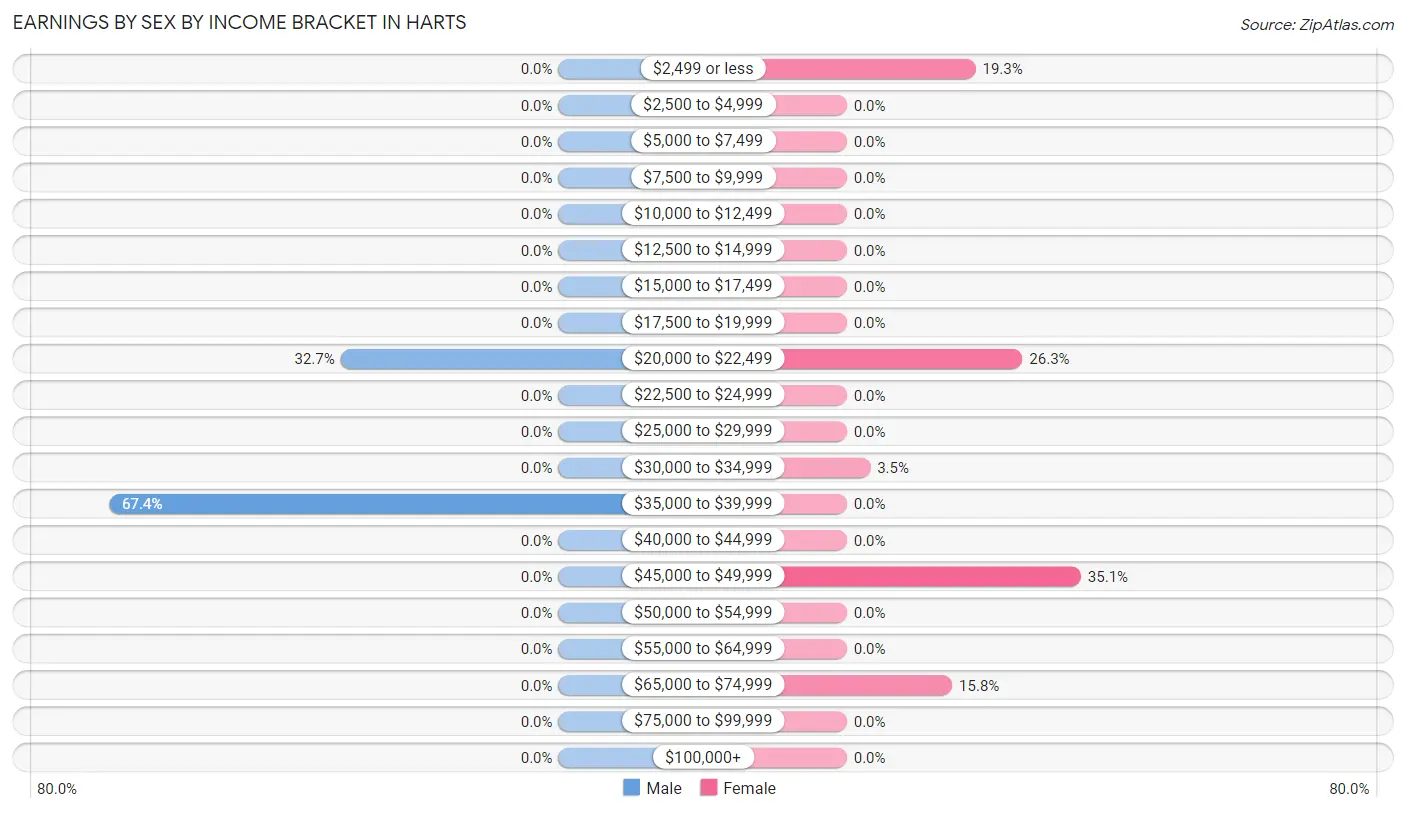
Earnings by Sex by Income Bracket in Harts
The most common earnings brackets in Harts are $35,000 to $39,999 for men (33 | 67.3%) and $45,000 to $49,999 for women (20 | 35.1%).
| Income | Male | Female |
| $2,499 or less | 0 (0.0%) | 11 (19.3%) |
| $2,500 to $4,999 | 0 (0.0%) | 0 (0.0%) |
| $5,000 to $7,499 | 0 (0.0%) | 0 (0.0%) |
| $7,500 to $9,999 | 0 (0.0%) | 0 (0.0%) |
| $10,000 to $12,499 | 0 (0.0%) | 0 (0.0%) |
| $12,500 to $14,999 | 0 (0.0%) | 0 (0.0%) |
| $15,000 to $17,499 | 0 (0.0%) | 0 (0.0%) |
| $17,500 to $19,999 | 0 (0.0%) | 0 (0.0%) |
| $20,000 to $22,499 | 16 (32.7%) | 15 (26.3%) |
| $22,500 to $24,999 | 0 (0.0%) | 0 (0.0%) |
| $25,000 to $29,999 | 0 (0.0%) | 0 (0.0%) |
| $30,000 to $34,999 | 0 (0.0%) | 2 (3.5%) |
| $35,000 to $39,999 | 33 (67.3%) | 0 (0.0%) |
| $40,000 to $44,999 | 0 (0.0%) | 0 (0.0%) |
| $45,000 to $49,999 | 0 (0.0%) | 20 (35.1%) |
| $50,000 to $54,999 | 0 (0.0%) | 0 (0.0%) |
| $55,000 to $64,999 | 0 (0.0%) | 0 (0.0%) |
| $65,000 to $74,999 | 0 (0.0%) | 9 (15.8%) |
| $75,000 to $99,999 | 0 (0.0%) | 0 (0.0%) |
| $100,000+ | 0 (0.0%) | 0 (0.0%) |
| Total | 49 (100.0%) | 57 (100.0%) |
Earnings by Sex by Educational Attainment in Harts
| Educational Attainment | Male Income | Female Income |
| Less than High School | - | - |
| High School Diploma | - | - |
| College or Associate's Degree | - | - |
| Bachelor's Degree | - | - |
| Graduate Degree | - | - |
| Total | - | - |
Family Income in Harts
Family Income Brackets in Harts
According to the Harts family income data, there are 35 families falling into the $50,000 to $74,999 income range, which is the most common income bracket and makes up 42.2% of all families.
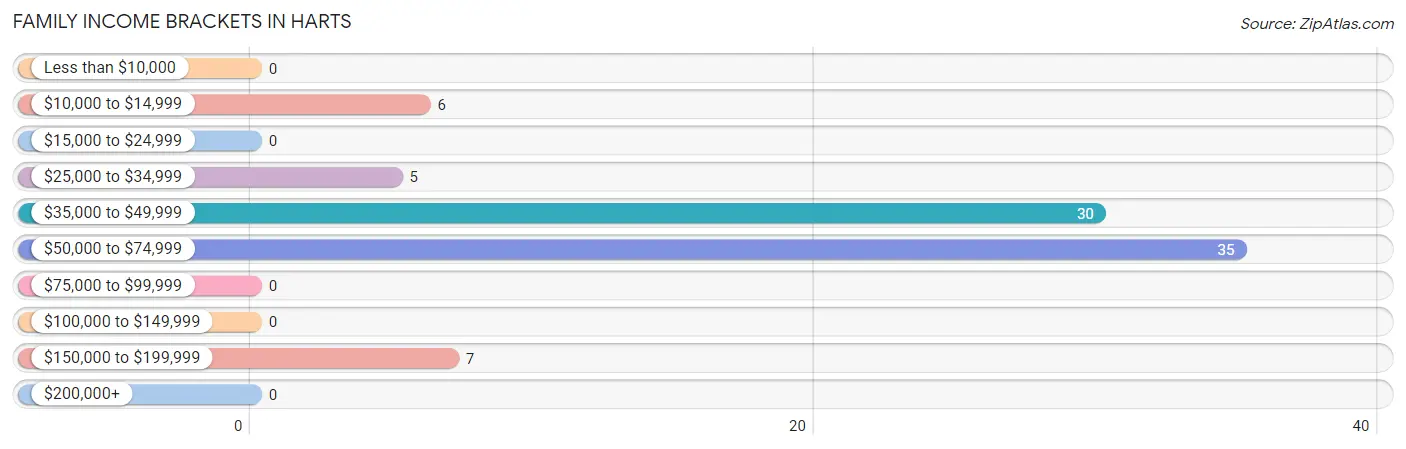
| Income Bracket | # Families | % Families |
| Less than $10,000 | 0 | 0.0% |
| $10,000 to $14,999 | 6 | 7.2% |
| $15,000 to $24,999 | 0 | 0.0% |
| $25,000 to $34,999 | 5 | 6.0% |
| $35,000 to $49,999 | 30 | 36.1% |
| $50,000 to $74,999 | 35 | 42.2% |
| $75,000 to $99,999 | 0 | 0.0% |
| $100,000 to $149,999 | 0 | 0.0% |
| $150,000 to $199,999 | 7 | 8.4% |
| $200,000+ | 0 | 0.0% |
Family Income by Famaliy Size in Harts
3-person families (38 | 45.8%) account for the highest median family income in Harts with $50,500 per family, while 3-person families (38 | 45.8%) have the highest median income of $16,833 per family member.
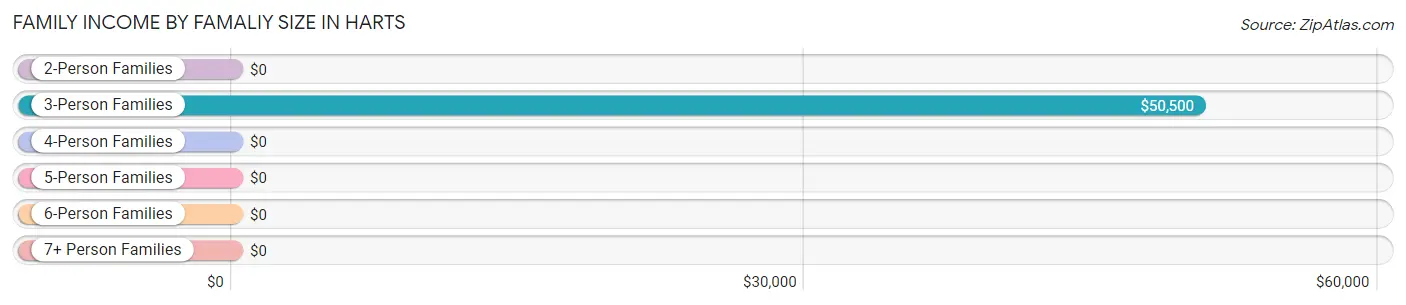
| Income Bracket | # Families | Median Income |
| 2-Person Families | 25 (30.1%) | $0 |
| 3-Person Families | 38 (45.8%) | $50,500 |
| 4-Person Families | 0 (0.0%) | $0 |
| 5-Person Families | 0 (0.0%) | $0 |
| 6-Person Families | 0 (0.0%) | $0 |
| 7+ Person Families | 20 (24.1%) | $0 |
| Total | 83 (100.0%) | $50,083 |
Family Income by Number of Earners in Harts
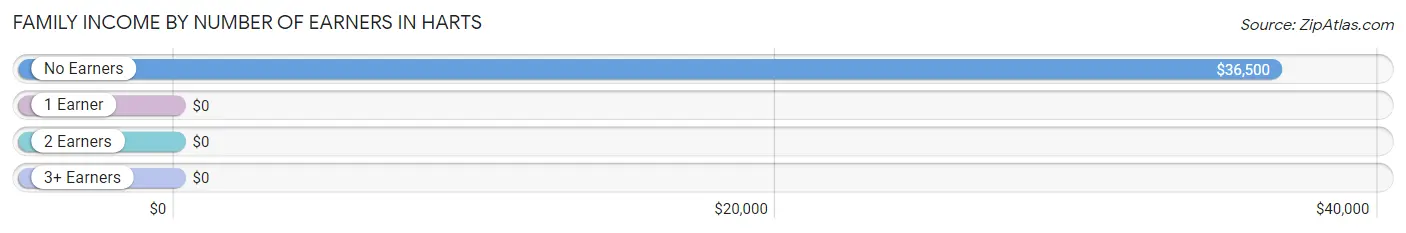
| Number of Earners | # Families | Median Income |
| No Earners | 46 (55.4%) | $36,500 |
| 1 Earner | 10 (12.0%) | $0 |
| 2 Earners | 27 (32.5%) | $0 |
| 3+ Earners | 0 (0.0%) | $0 |
| Total | 83 (100.0%) | $50,083 |
Household Income in Harts
Household Income Brackets in Harts
With 51 households falling in the category, the $15,000 to $24,999 income range is the most frequent in Harts, accounting for 37.5% of all households.
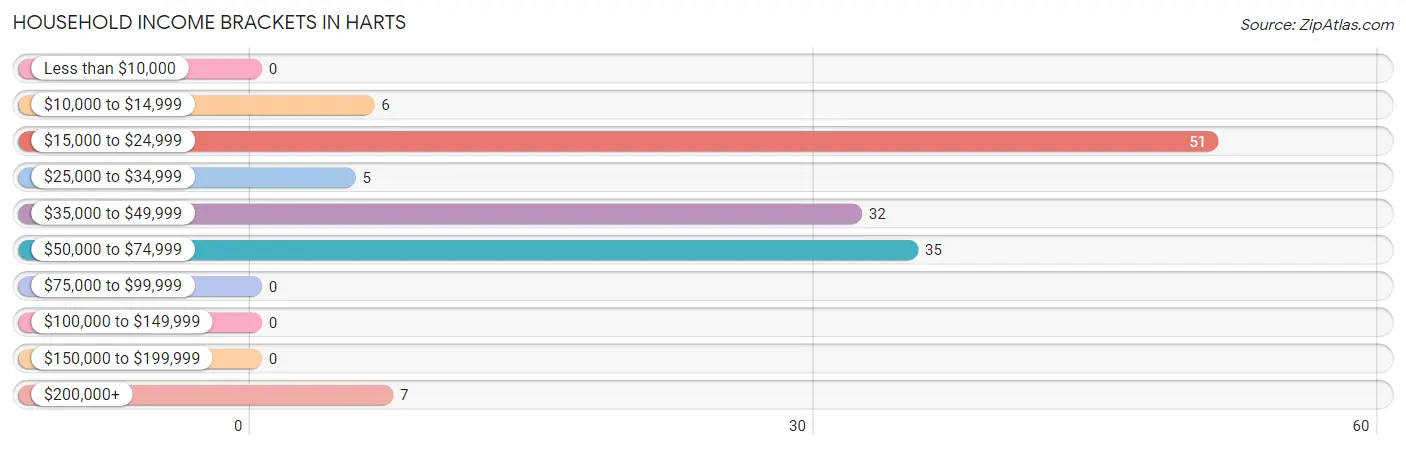
| Income Bracket | # Households | % Households |
| Less than $10,000 | 0 | 0.0% |
| $10,000 to $14,999 | 6 | 4.4% |
| $15,000 to $24,999 | 51 | 37.5% |
| $25,000 to $34,999 | 5 | 3.7% |
| $35,000 to $49,999 | 32 | 23.5% |
| $50,000 to $74,999 | 35 | 25.7% |
| $75,000 to $99,999 | 0 | 0.0% |
| $100,000 to $149,999 | 0 | 0.0% |
| $150,000 to $199,999 | 0 | 0.0% |
| $200,000+ | 7 | 5.1% |
Household Income by Householder Age in Harts
The median household income in Harts is $35,750, with the highest median household income of $36,125 found in the 65+ years age bracket for the primary householder. A total of 40 households (29.4%) fall into this category.
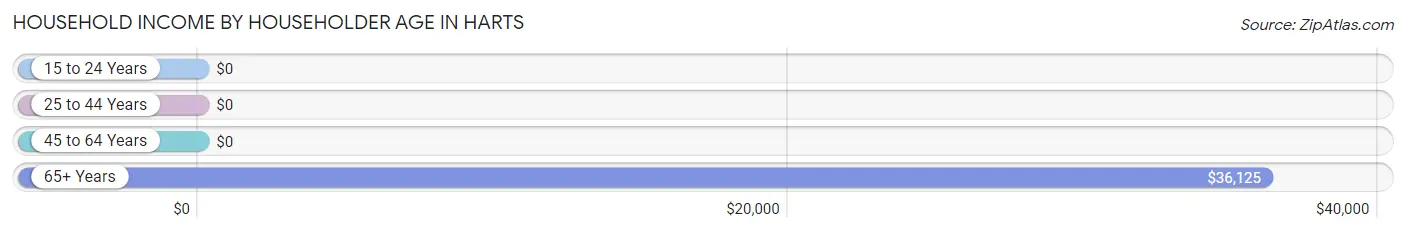
| Income Bracket | # Households | Median Income |
| 15 to 24 Years | 0 (0.0%) | $0 |
| 25 to 44 Years | 20 (14.7%) | $0 |
| 45 to 64 Years | 76 (55.9%) | $0 |
| 65+ Years | 40 (29.4%) | $36,125 |
| Total | 136 (100.0%) | $35,750 |
Poverty in Harts
Income Below Poverty by Sex and Age in Harts
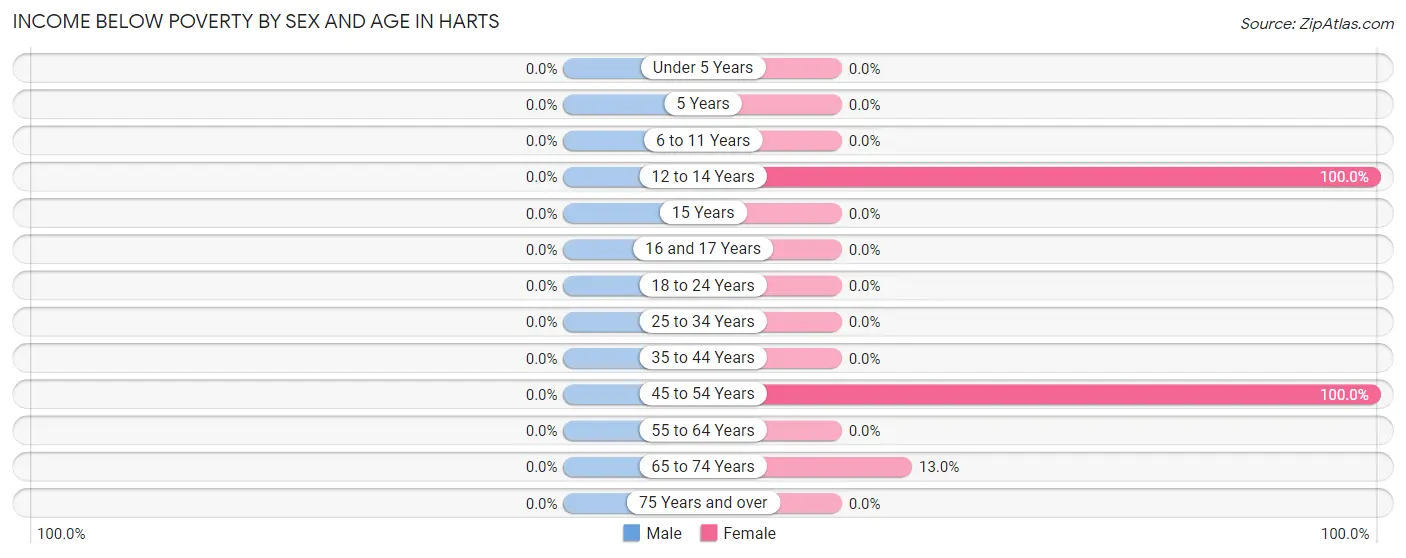
| Age Bracket | Male | Female |
| Under 5 Years | 0 (0.0%) | 0 (0.0%) |
| 5 Years | 0 (0.0%) | 0 (0.0%) |
| 6 to 11 Years | 0 (0.0%) | 0 (0.0%) |
| 12 to 14 Years | 0 (0.0%) | 8 (100.0%) |
| 15 Years | 0 (0.0%) | 0 (0.0%) |
| 16 and 17 Years | 0 (0.0%) | 0 (0.0%) |
| 18 to 24 Years | 0 (0.0%) | 0 (0.0%) |
| 25 to 34 Years | 0 (0.0%) | 0 (0.0%) |
| 35 to 44 Years | 0 (0.0%) | 0 (0.0%) |
| 45 to 54 Years | 0 (0.0%) | 14 (100.0%) |
| 55 to 64 Years | 0 (0.0%) | 0 (0.0%) |
| 65 to 74 Years | 0 (0.0%) | 6 (13.0%) |
| 75 Years and over | 0 (0.0%) | 0 (0.0%) |
| Total | 0 (0.0%) | 28 (12.1%) |
Income Above Poverty by Sex and Age in Harts
According to the poverty statistics in Harts, males aged 6 to 11 years and females aged 6 to 11 years are the age groups that are most secure financially, with 100.0% of males and 100.0% of females in these age groups living above the poverty line.
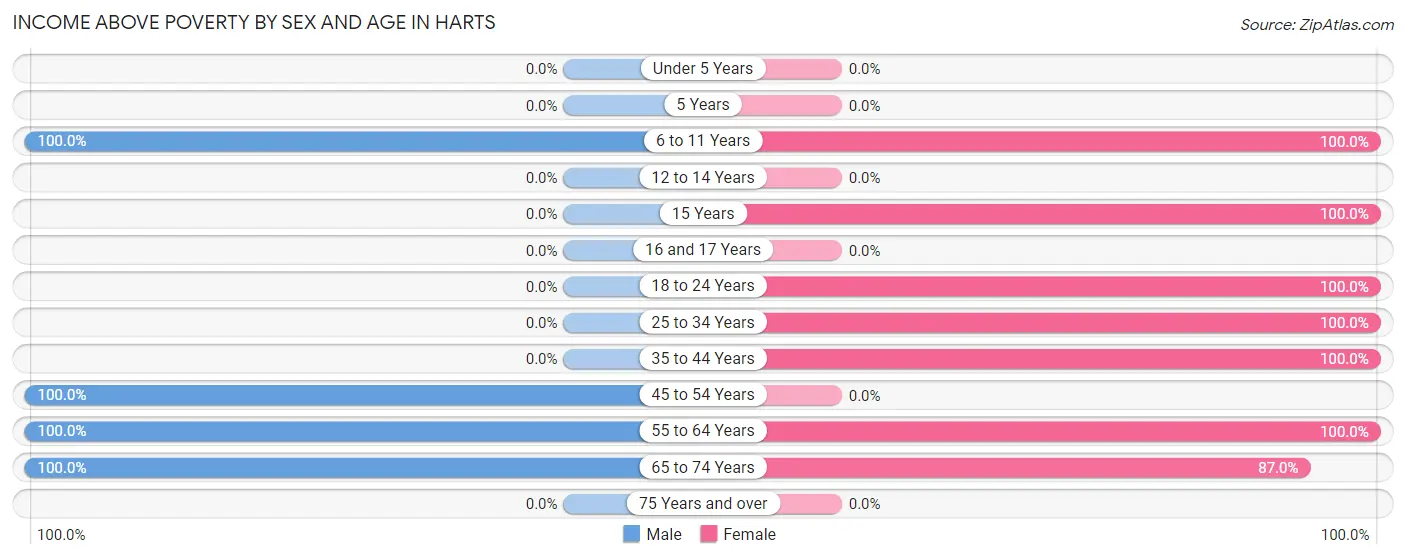
| Age Bracket | Male | Female |
| Under 5 Years | 0 (0.0%) | 0 (0.0%) |
| 5 Years | 0 (0.0%) | 0 (0.0%) |
| 6 to 11 Years | 73 (100.0%) | 21 (100.0%) |
| 12 to 14 Years | 0 (0.0%) | 0 (0.0%) |
| 15 Years | 0 (0.0%) | 17 (100.0%) |
| 16 and 17 Years | 0 (0.0%) | 0 (0.0%) |
| 18 to 24 Years | 0 (0.0%) | 11 (100.0%) |
| 25 to 34 Years | 0 (0.0%) | 38 (100.0%) |
| 35 to 44 Years | 0 (0.0%) | 20 (100.0%) |
| 45 to 54 Years | 16 (100.0%) | 0 (0.0%) |
| 55 to 64 Years | 84 (100.0%) | 56 (100.0%) |
| 65 to 74 Years | 32 (100.0%) | 40 (87.0%) |
| 75 Years and over | 0 (0.0%) | 0 (0.0%) |
| Total | 205 (100.0%) | 203 (87.9%) |
Income Below Poverty Among Married-Couple Families in Harts
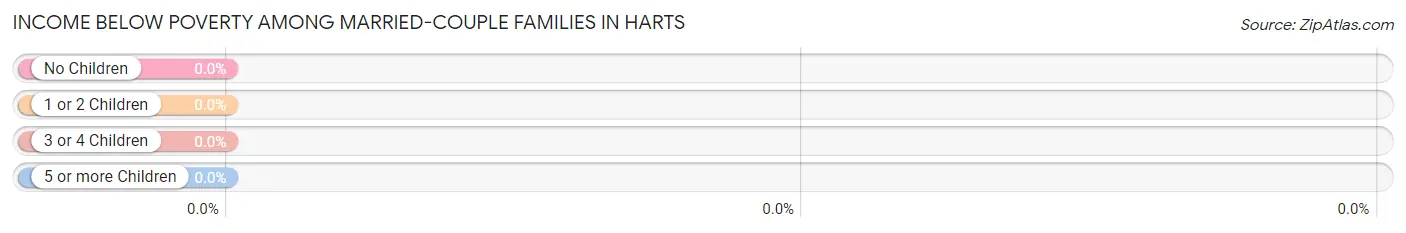
| Children | Above Poverty | Below Poverty |
| No Children | 57 (100.0%) | 0 (0.0%) |
| 1 or 2 Children | 0 (0.0%) | 0 (0.0%) |
| 3 or 4 Children | 0 (0.0%) | 0 (0.0%) |
| 5 or more Children | 20 (100.0%) | 0 (0.0%) |
| Total | 77 (100.0%) | 0 (0.0%) |
Income Below Poverty Among Single-Parent Households in Harts
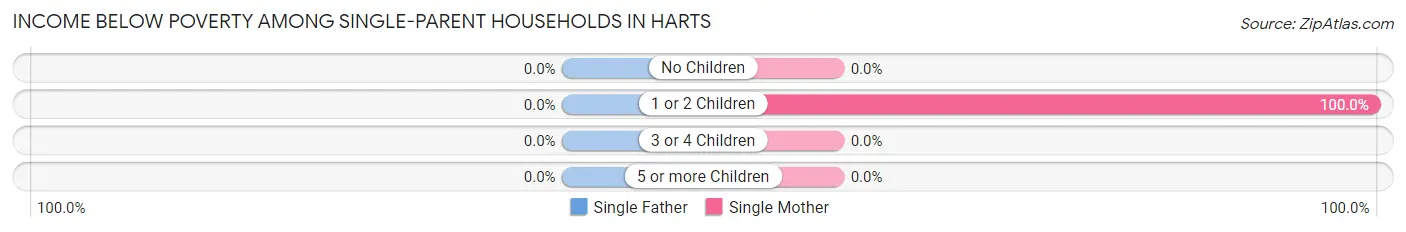
| Children | Single Father | Single Mother |
| No Children | 0 (0.0%) | 0 (0.0%) |
| 1 or 2 Children | 0 (0.0%) | 6 (100.0%) |
| 3 or 4 Children | 0 (0.0%) | 0 (0.0%) |
| 5 or more Children | 0 (0.0%) | 0 (0.0%) |
| Total | 0 (0.0%) | 6 (100.0%) |
Income Below Poverty Among Married-Couple vs Single-Parent Households in Harts
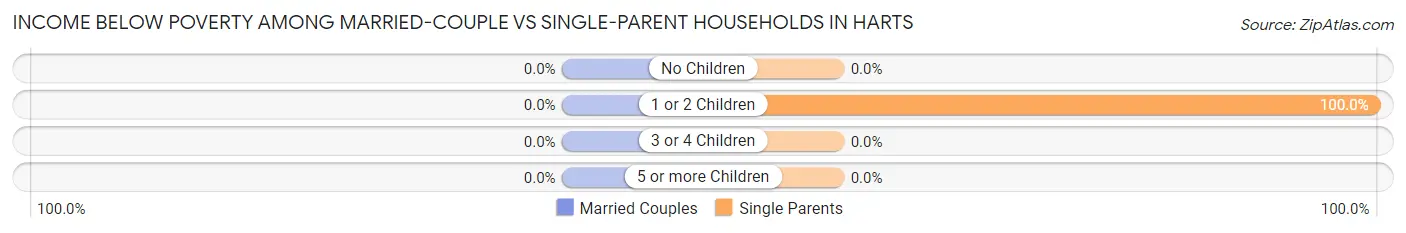
| Children | Married-Couple Families | Single-Parent Households |
| No Children | 0 (0.0%) | 0 (0.0%) |
| 1 or 2 Children | 0 (0.0%) | 6 (100.0%) |
| 3 or 4 Children | 0 (0.0%) | 0 (0.0%) |
| 5 or more Children | 0 (0.0%) | 0 (0.0%) |
| Total | 0 (0.0%) | 6 (100.0%) |
Race in Harts
The most populous races in Harts are , and White / Caucasian (436 | 100.0%).
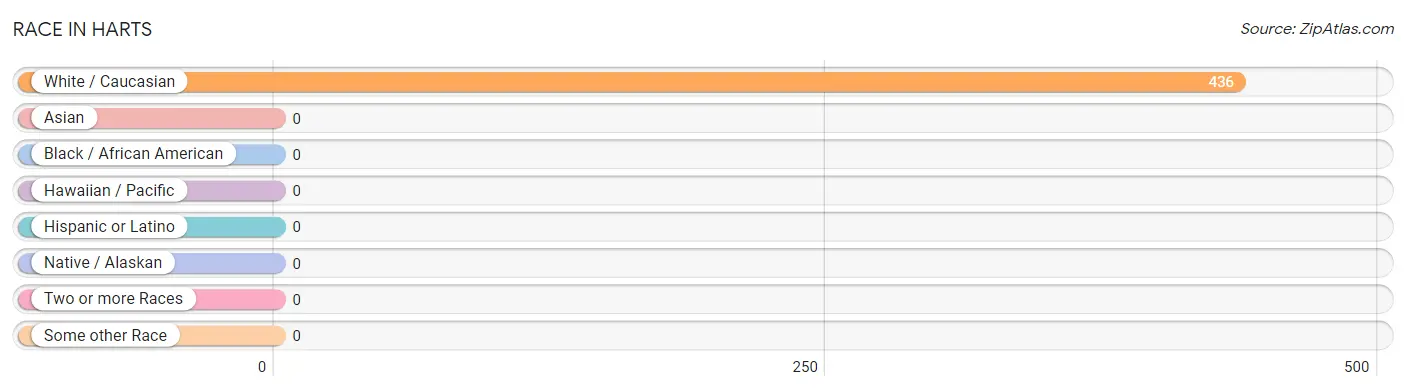
| Race | # Population | % Population |
| Asian | 0 | 0.0% |
| Black / African American | 0 | 0.0% |
| Hawaiian / Pacific | 0 | 0.0% |
| Hispanic or Latino | 0 | 0.0% |
| Native / Alaskan | 0 | 0.0% |
| White / Caucasian | 436 | 100.0% |
| Two or more Races | 0 | 0.0% |
| Some other Race | 0 | 0.0% |
| Total | 436 | 100.0% |
Ancestry in Harts
The most populous ancestries reported in Harts are English (31 | 7.1%), and American (30 | 6.9%), together accounting for 14.0% of all Harts residents.
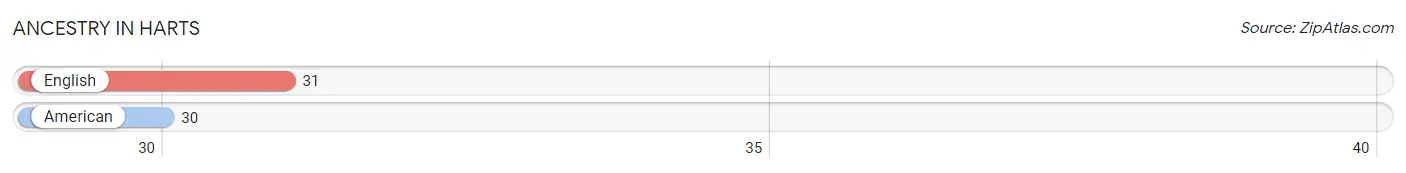
| Ancestry | # Population | % Population |
| American | 30 | 6.9% |
| English | 31 | 7.1% | View All 2 Rows |
Immigrants in Harts

| Immigration Origin | # Population | % Population | View All 0 Rows |
Sex and Age in Harts
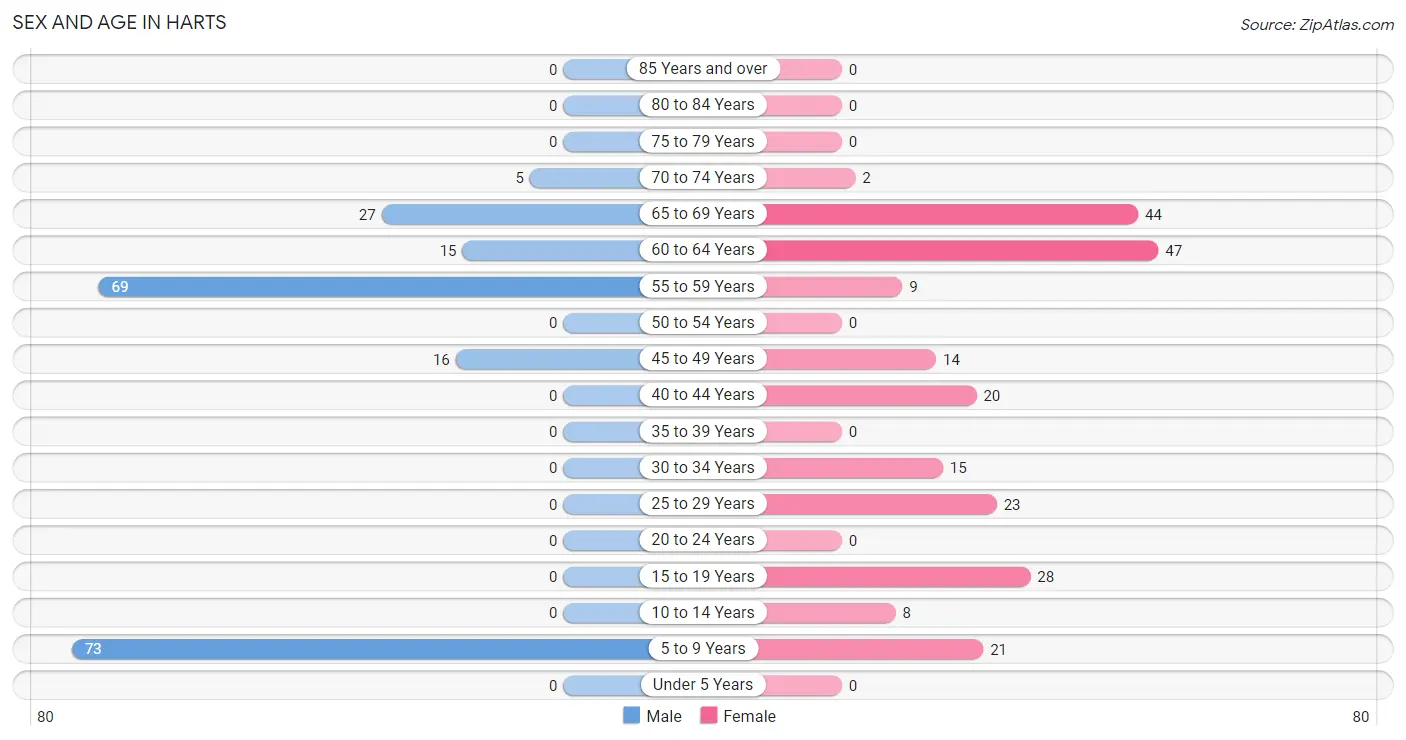
Sex and Age in Harts
The most populous age groups in Harts are 5 to 9 Years (73 | 35.6%) for men and 60 to 64 Years (47 | 20.3%) for women.
| Age Bracket | Male | Female |
| Under 5 Years | 0 (0.0%) | 0 (0.0%) |
| 5 to 9 Years | 73 (35.6%) | 21 (9.1%) |
| 10 to 14 Years | 0 (0.0%) | 8 (3.5%) |
| 15 to 19 Years | 0 (0.0%) | 28 (12.1%) |
| 20 to 24 Years | 0 (0.0%) | 0 (0.0%) |
| 25 to 29 Years | 0 (0.0%) | 23 (10.0%) |
| 30 to 34 Years | 0 (0.0%) | 15 (6.5%) |
| 35 to 39 Years | 0 (0.0%) | 0 (0.0%) |
| 40 to 44 Years | 0 (0.0%) | 20 (8.7%) |
| 45 to 49 Years | 16 (7.8%) | 14 (6.1%) |
| 50 to 54 Years | 0 (0.0%) | 0 (0.0%) |
| 55 to 59 Years | 69 (33.7%) | 9 (3.9%) |
| 60 to 64 Years | 15 (7.3%) | 47 (20.3%) |
| 65 to 69 Years | 27 (13.2%) | 44 (19.1%) |
| 70 to 74 Years | 5 (2.4%) | 2 (0.9%) |
| 75 to 79 Years | 0 (0.0%) | 0 (0.0%) |
| 80 to 84 Years | 0 (0.0%) | 0 (0.0%) |
| 85 Years and over | 0 (0.0%) | 0 (0.0%) |
| Total | 205 (100.0%) | 231 (100.0%) |
Families and Households in Harts
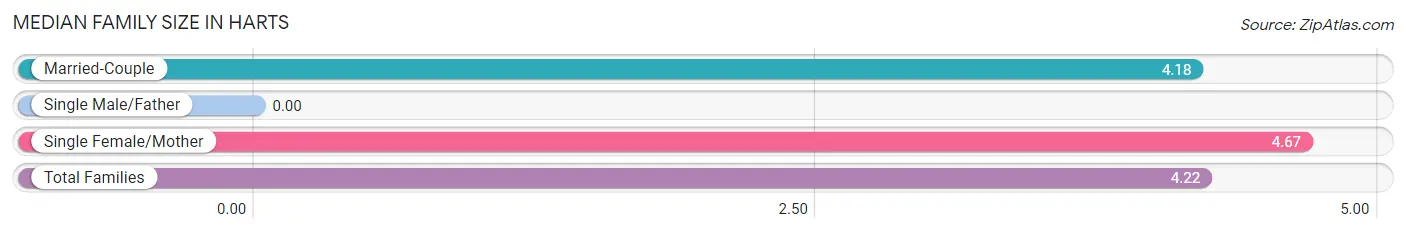
Median Family Size in Harts
| Family Type | # Families | Family Size |
| Married-Couple | 77 (92.8%) | 4.18 |
| Single Male/Father | 0 (0.0%) | - |
| Single Female/Mother | 6 (7.2%) | 4.67 |
| Total Families | 83 (100.0%) | 4.22 |
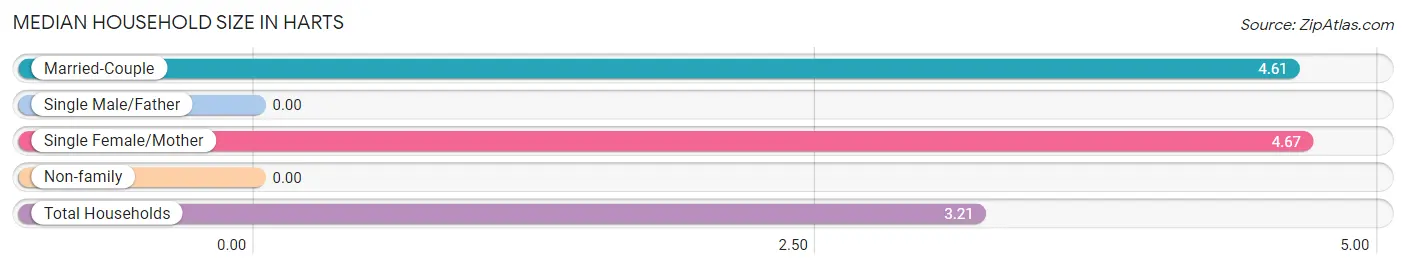
Median Household Size in Harts
| Household Type | # Households | Household Size |
| Married-Couple | 77 (56.6%) | 4.61 |
| Single Male/Father | 0 (0.0%) | - |
| Single Female/Mother | 6 (4.4%) | 4.67 |
| Non-family | 53 (39.0%) | - |
| Total Households | 136 (100.0%) | 3.21 |
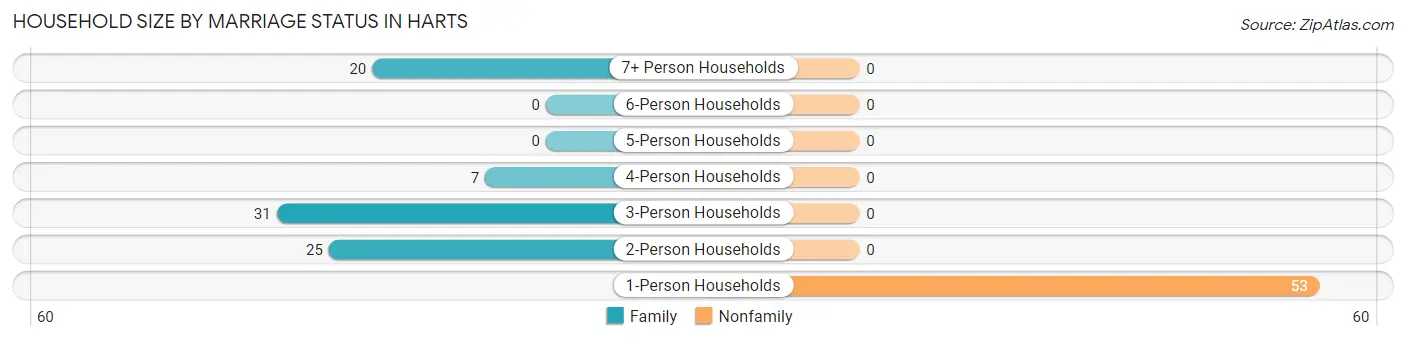
Household Size by Marriage Status in Harts
Out of a total of 136 households in Harts, 83 (61.0%) are family households, while 53 (39.0%) are nonfamily households. The most numerous type of family households are 3-person households, comprising 31, and the most common type of nonfamily households are 1-person households, comprising 53.
| Household Size | Family Households | Nonfamily Households |
| 1-Person Households | - | 53 (39.0%) |
| 2-Person Households | 25 (18.4%) | 0 (0.0%) |
| 3-Person Households | 31 (22.8%) | 0 (0.0%) |
| 4-Person Households | 7 (5.1%) | 0 (0.0%) |
| 5-Person Households | 0 (0.0%) | 0 (0.0%) |
| 6-Person Households | 0 (0.0%) | 0 (0.0%) |
| 7+ Person Households | 20 (14.7%) | 0 (0.0%) |
| Total | 83 (61.0%) | 53 (39.0%) |
Female Fertility in Harts
Fertility by Age in Harts
| Age Bracket | Women with Births | Births / 1,000 Women |
| 15 to 19 years | 0 (0.0%) | 0.0 |
| 20 to 34 years | 0 (0.0%) | 0.0 |
| 35 to 50 years | 0 (0.0%) | 0.0 |
| Total | 0 (0.0%) | 0.0 |
Fertility by Age by Marriage Status in Harts
| Age Bracket | Married | Unmarried |
| 15 to 19 years | 0 (0.0%) | 0 (0.0%) |
| 20 to 34 years | 0 (0.0%) | 0 (0.0%) |
| 35 to 50 years | 0 (0.0%) | 0 (0.0%) |
| Total | 0 (0.0%) | 0 (0.0%) |
Fertility by Education in Harts
| Educational Attainment | Women with Births | Births / 1,000 Women |
| Less than High School | 0 (0.0%) | 0.0 |
| High School Diploma | 0 (0.0%) | 0.0 |
| College or Associate's Degree | 0 (0.0%) | 0.0 |
| Bachelor's Degree | 0 (0.0%) | 0.0 |
| Graduate Degree | 0 (0.0%) | 0.0 |
| Total | 0 (0.0%) | 0.0 |
Fertility by Education by Marriage Status in Harts
| Educational Attainment | Married | Unmarried |
| Less than High School | 0 (0.0%) | 0 (0.0%) |
| High School Diploma | 0 (0.0%) | 0 (0.0%) |
| College or Associate's Degree | 0 (0.0%) | 0 (0.0%) |
| Bachelor's Degree | 0 (0.0%) | 0 (0.0%) |
| Graduate Degree | 0 (0.0%) | 0 (0.0%) |
| Total | 0 (0.0%) | 0 (0.0%) |
Employment Characteristics in Harts
Employment by Class of Employer in Harts
Among the 95 employed individuals in Harts, private company employees (48 | 50.5%), federal government employees (20 | 21.0%), and state government employees (16 | 16.8%) make up the most common classes of employment.
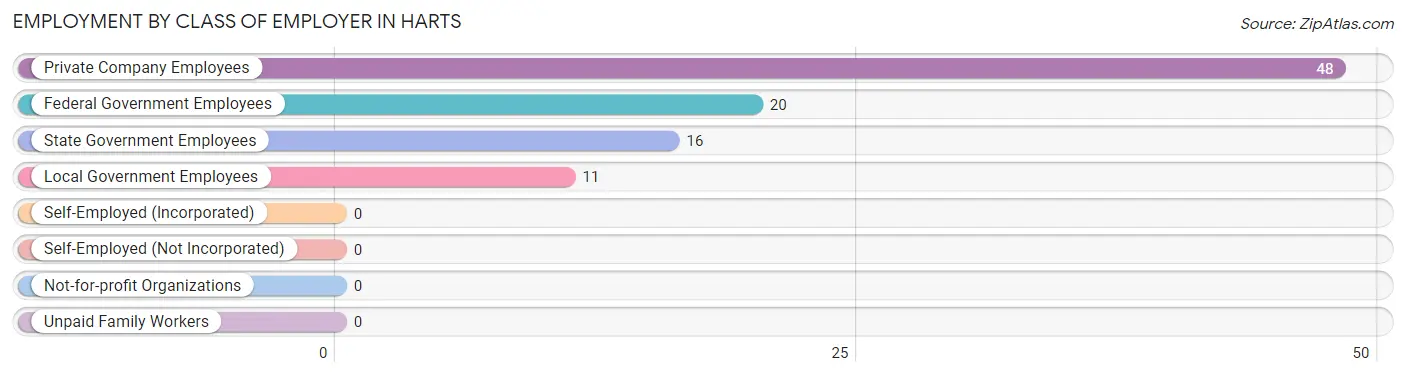
| Employer Class | # Employees | % Employees |
| Private Company Employees | 48 | 50.5% |
| Self-Employed (Incorporated) | 0 | 0.0% |
| Self-Employed (Not Incorporated) | 0 | 0.0% |
| Not-for-profit Organizations | 0 | 0.0% |
| Local Government Employees | 11 | 11.6% |
| State Government Employees | 16 | 16.8% |
| Federal Government Employees | 20 | 21.0% |
| Unpaid Family Workers | 0 | 0.0% |
| Total | 95 | 100.0% |
Employment Status by Age in Harts
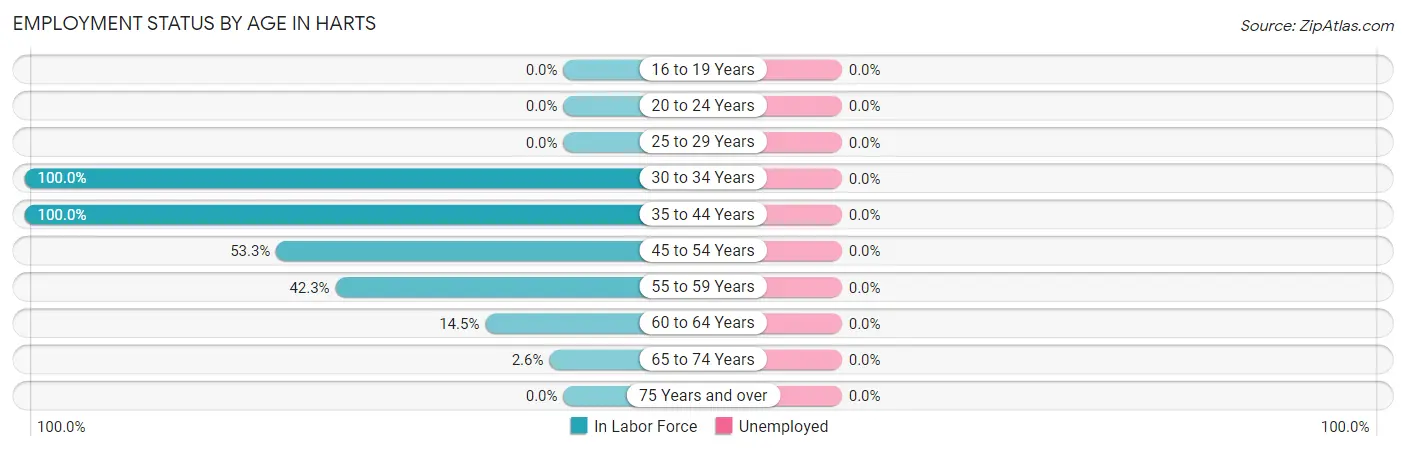
| Age Bracket | In Labor Force | Unemployed |
| 16 to 19 Years | 0 (0.0%) | 0 (0.0%) |
| 20 to 24 Years | 0 (0.0%) | 0 (0.0%) |
| 25 to 29 Years | 0 (0.0%) | 0 (0.0%) |
| 30 to 34 Years | 15 (100.0%) | 0 (0.0%) |
| 35 to 44 Years | 20 (100.0%) | 0 (0.0%) |
| 45 to 54 Years | 16 (53.3%) | 0 (0.0%) |
| 55 to 59 Years | 33 (42.3%) | 0 (0.0%) |
| 60 to 64 Years | 9 (14.5%) | 0 (0.0%) |
| 65 to 74 Years | 2 (2.6%) | 0 (0.0%) |
| 75 Years and over | 0 (0.0%) | 0 (0.0%) |
| Total | 95 (30.0%) | 0 (0.0%) |
Employment Status by Educational Attainment in Harts
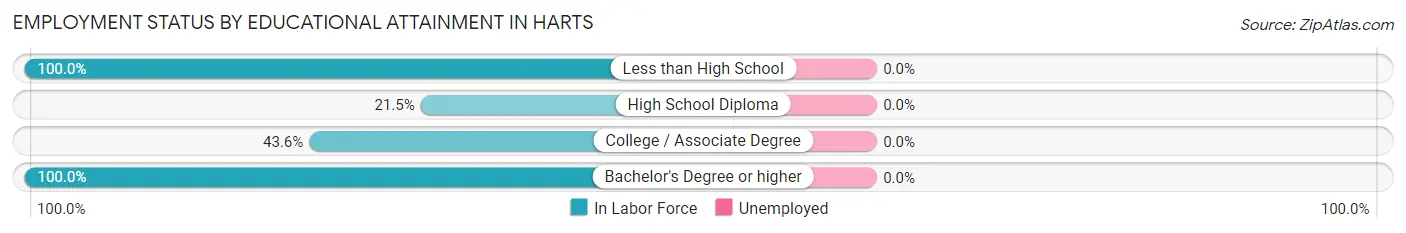
| Educational Attainment | In Labor Force | Unemployed |
| Less than High School | 16 (100.0%) | 0 (0.0%) |
| High School Diploma | 20 (21.5%) | 0 (0.0%) |
| College / Associate Degree | 48 (43.6%) | 0 (0.0%) |
| Bachelor's Degree or higher | 9 (100.0%) | 0 (0.0%) |
| Total | 93 (40.8%) | 0 (0.0%) |
Employment Occupations by Sex in Harts
Management, Business, Science and Arts Occupations
The most common Management, Business, Science and Arts occupations in Harts are Community & Social Service (9 | 9.5%), and Education Instruction & Library (9 | 9.5%).
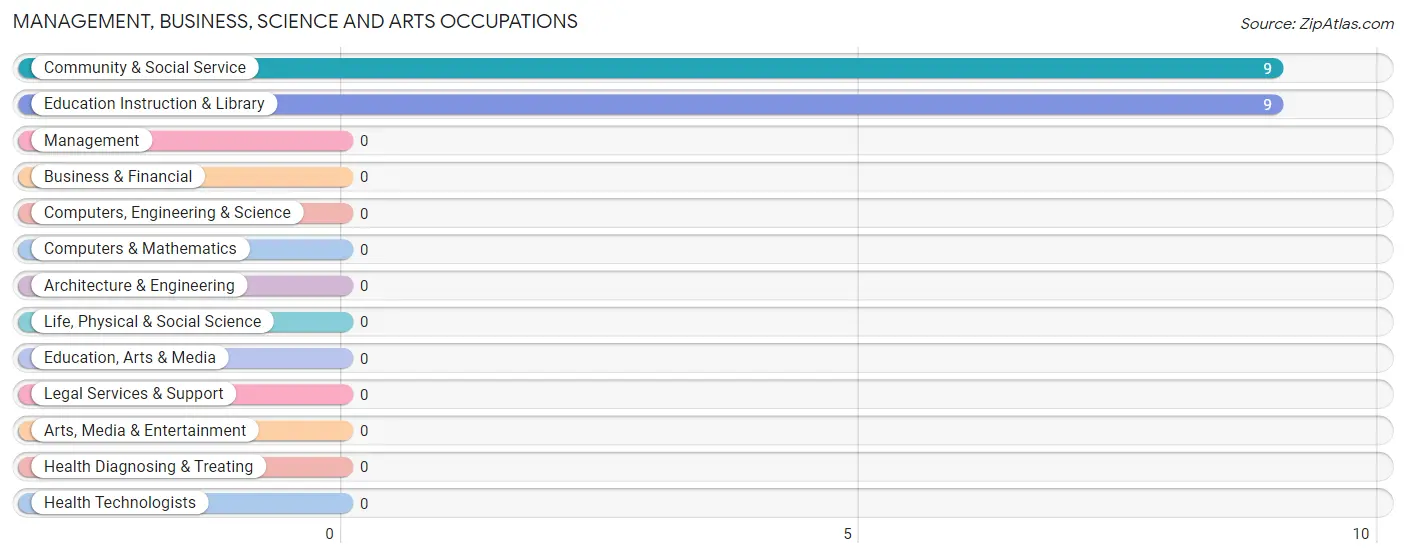
Management, Business, Science and Arts Occupations by Sex
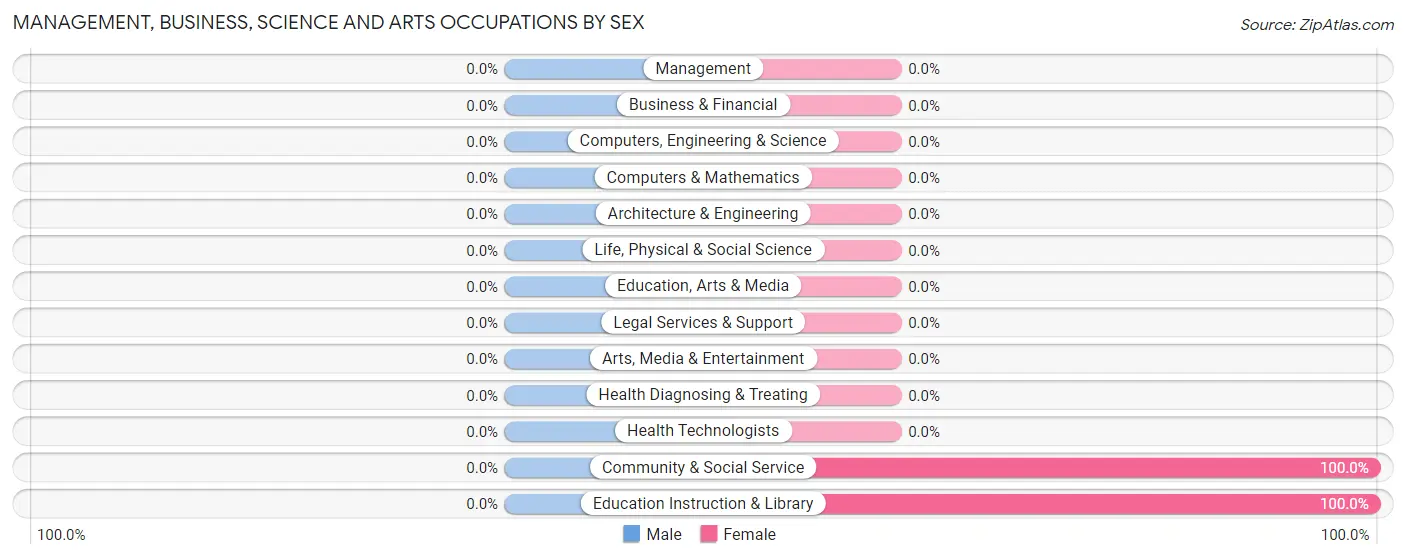
| Occupation | Male | Female |
| Management | 0 (0.0%) | 0 (0.0%) |
| Business & Financial | 0 (0.0%) | 0 (0.0%) |
| Computers, Engineering & Science | 0 (0.0%) | 0 (0.0%) |
| Computers & Mathematics | 0 (0.0%) | 0 (0.0%) |
| Architecture & Engineering | 0 (0.0%) | 0 (0.0%) |
| Life, Physical & Social Science | 0 (0.0%) | 0 (0.0%) |
| Community & Social Service | 0 (0.0%) | 9 (100.0%) |
| Education, Arts & Media | 0 (0.0%) | 0 (0.0%) |
| Legal Services & Support | 0 (0.0%) | 0 (0.0%) |
| Education Instruction & Library | 0 (0.0%) | 9 (100.0%) |
| Arts, Media & Entertainment | 0 (0.0%) | 0 (0.0%) |
| Health Diagnosing & Treating | 0 (0.0%) | 0 (0.0%) |
| Health Technologists | 0 (0.0%) | 0 (0.0%) |
| Total (Category) | 0 (0.0%) | 9 (100.0%) |
| Total (Overall) | 49 (51.6%) | 46 (48.4%) |
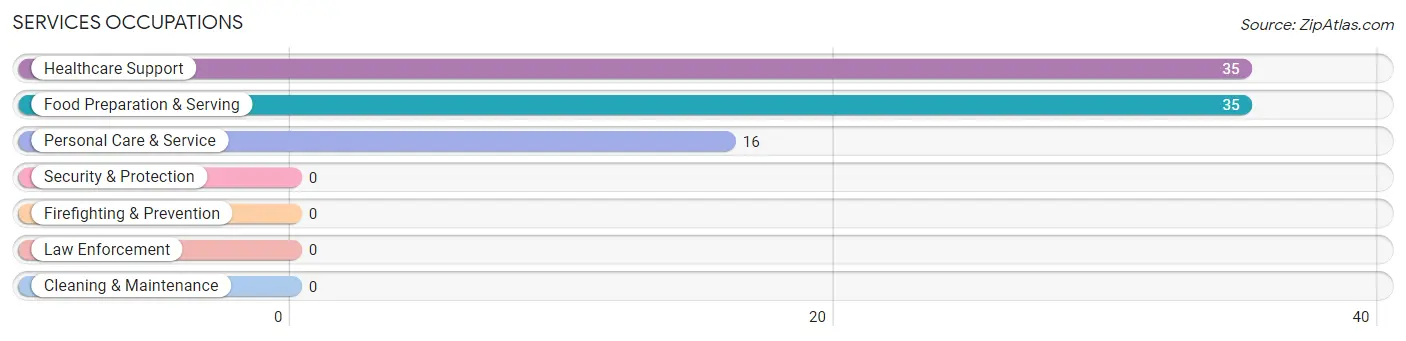
Services Occupations
The most common Services occupations in Harts are Healthcare Support (35 | 36.8%), Food Preparation & Serving (35 | 36.8%), and Personal Care & Service (16 | 16.8%).
Services Occupations by Sex
Within the Services occupations in Harts, the most male-oriented occupations are Personal Care & Service (100.0%), and Food Preparation & Serving (94.3%), while the most female-oriented occupations are Healthcare Support (100.0%), and Food Preparation & Serving (5.7%).
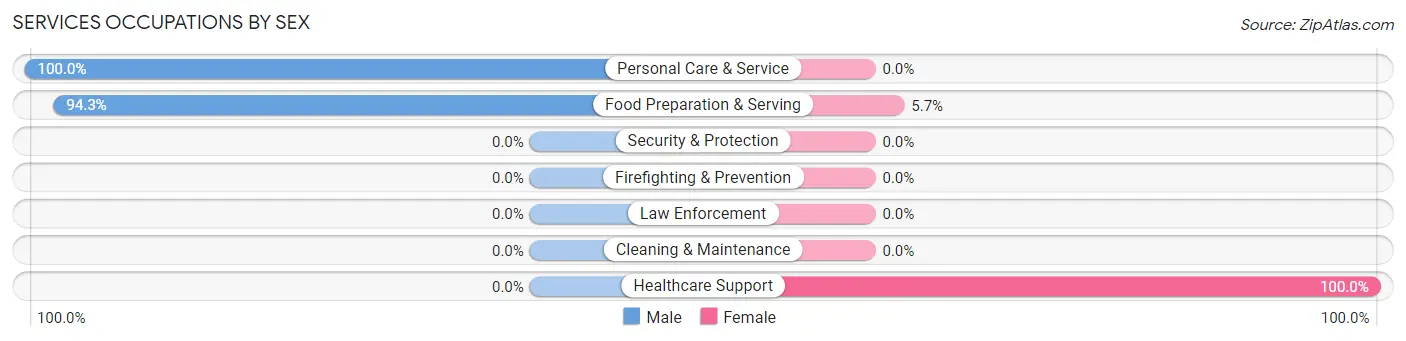
| Occupation | Male | Female |
| Healthcare Support | 0 (0.0%) | 35 (100.0%) |
| Security & Protection | 0 (0.0%) | 0 (0.0%) |
| Firefighting & Prevention | 0 (0.0%) | 0 (0.0%) |
| Law Enforcement | 0 (0.0%) | 0 (0.0%) |
| Food Preparation & Serving | 33 (94.3%) | 2 (5.7%) |
| Cleaning & Maintenance | 0 (0.0%) | 0 (0.0%) |
| Personal Care & Service | 16 (100.0%) | 0 (0.0%) |
| Total (Category) | 49 (57.0%) | 37 (43.0%) |
| Total (Overall) | 49 (51.6%) | 46 (48.4%) |
Sales and Office Occupations
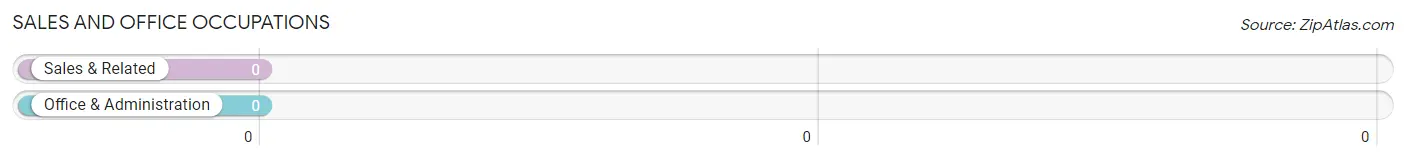
Sales and Office Occupations by Sex
| Occupation | Male | Female |
| Sales & Related | 0 (0.0%) | 0 (0.0%) |
| Office & Administration | 0 (0.0%) | 0 (0.0%) |
| Total (Category) | 0 (0.0%) | 0 (0.0%) |
| Total (Overall) | 49 (51.6%) | 46 (48.4%) |
Natural Resources, Construction and Maintenance Occupations
Natural Resources, Construction and Maintenance Occupations by Sex
| Occupation | Male | Female |
| Farming, Fishing & Forestry | 0 (0.0%) | 0 (0.0%) |
| Construction & Extraction | 0 (0.0%) | 0 (0.0%) |
| Installation, Maintenance & Repair | 0 (0.0%) | 0 (0.0%) |
| Total (Category) | 0 (0.0%) | 0 (0.0%) |
| Total (Overall) | 49 (51.6%) | 46 (48.4%) |
Production, Transportation and Moving Occupations
Production, Transportation and Moving Occupations by Sex
| Occupation | Male | Female |
| Production | 0 (0.0%) | 0 (0.0%) |
| Transportation | 0 (0.0%) | 0 (0.0%) |
| Material Moving | 0 (0.0%) | 0 (0.0%) |
| Total (Category) | 0 (0.0%) | 0 (0.0%) |
| Total (Overall) | 49 (51.6%) | 46 (48.4%) |
Employment Industries by Sex in Harts
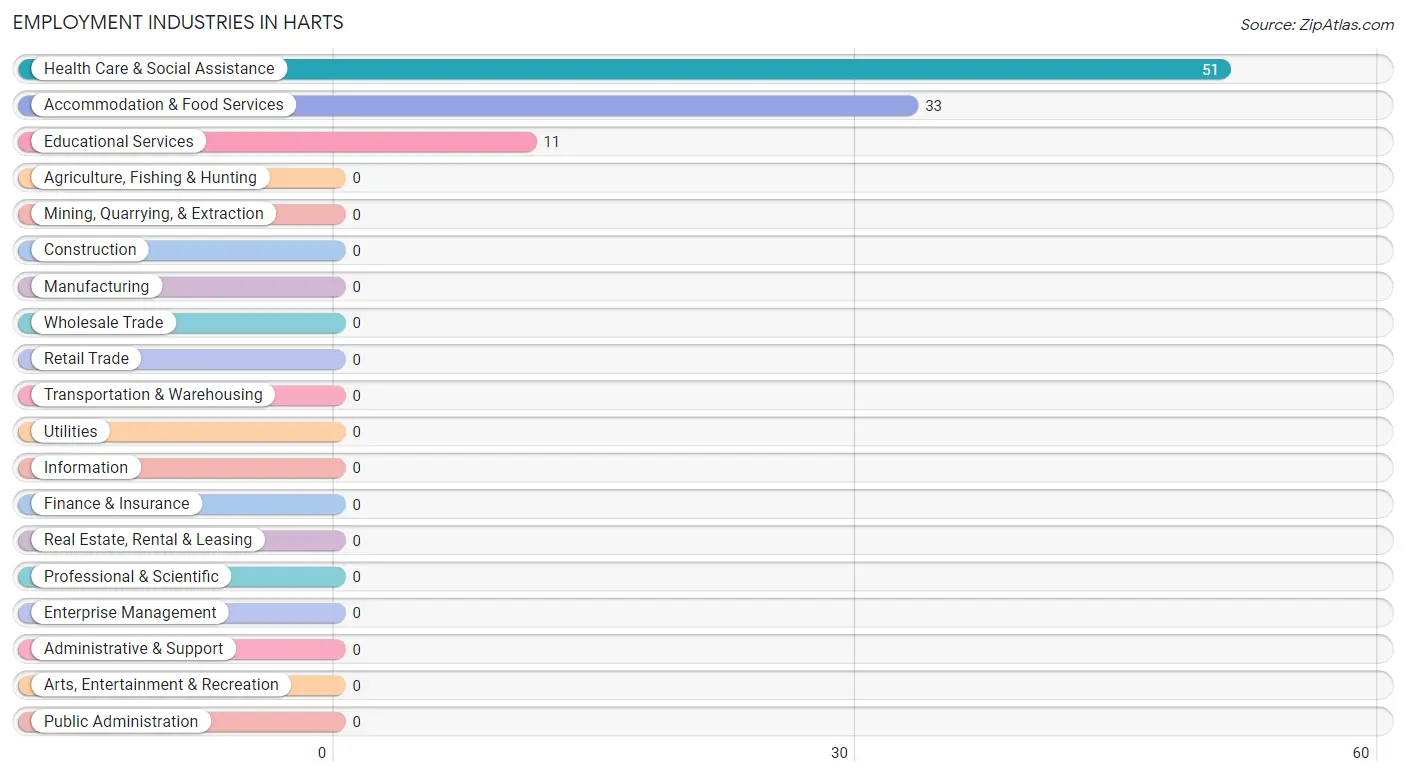
Employment Industries in Harts
The major employment industries in Harts include Health Care & Social Assistance (51 | 53.7%), Accommodation & Food Services (33 | 34.7%), and Educational Services (11 | 11.6%).
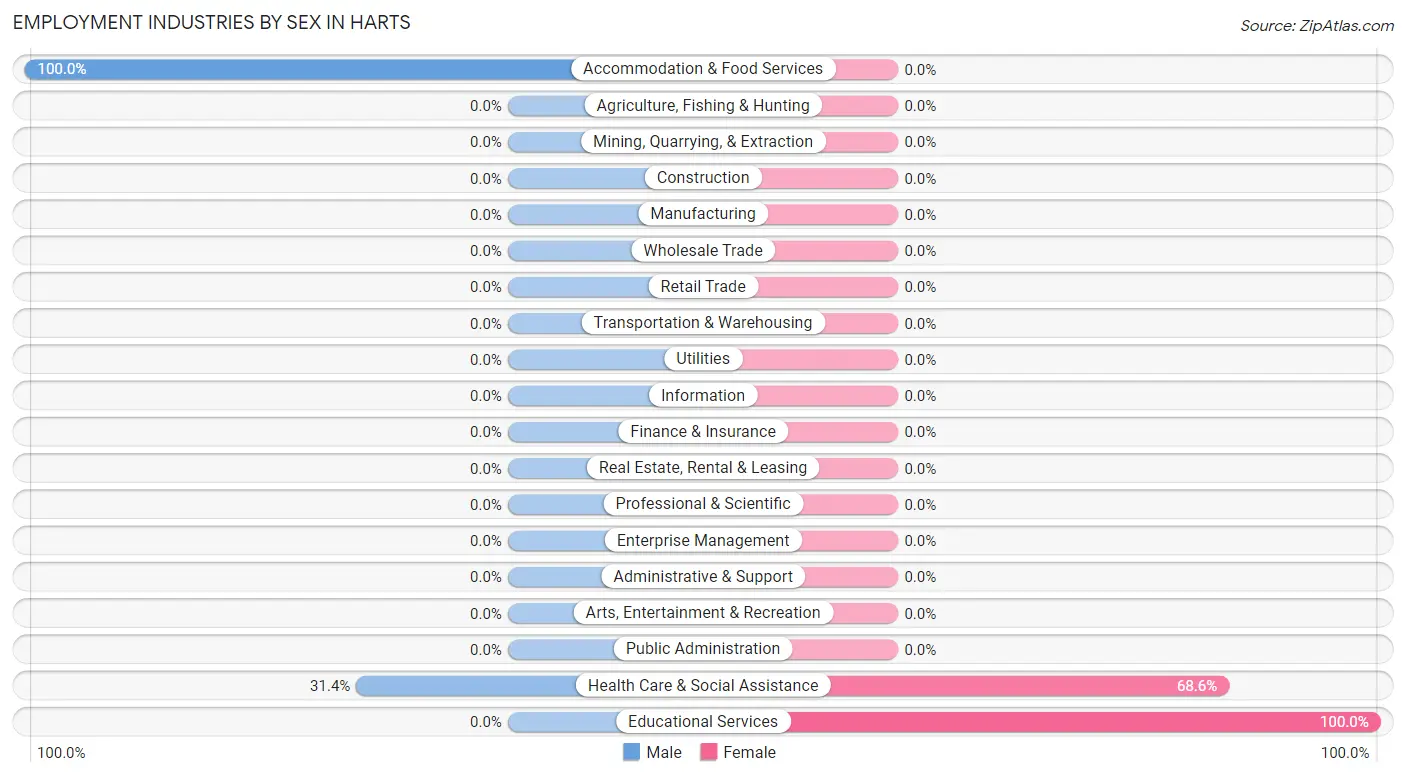
Employment Industries by Sex in Harts
The Harts industries that see more men than women are Accommodation & Food Services (100.0%), and Health Care & Social Assistance (31.4%), whereas the industries that tend to have a higher number of women are Educational Services (100.0%), and Health Care & Social Assistance (68.6%).
| Industry | Male | Female |
| Agriculture, Fishing & Hunting | 0 (0.0%) | 0 (0.0%) |
| Mining, Quarrying, & Extraction | 0 (0.0%) | 0 (0.0%) |
| Construction | 0 (0.0%) | 0 (0.0%) |
| Manufacturing | 0 (0.0%) | 0 (0.0%) |
| Wholesale Trade | 0 (0.0%) | 0 (0.0%) |
| Retail Trade | 0 (0.0%) | 0 (0.0%) |
| Transportation & Warehousing | 0 (0.0%) | 0 (0.0%) |
| Utilities | 0 (0.0%) | 0 (0.0%) |
| Information | 0 (0.0%) | 0 (0.0%) |
| Finance & Insurance | 0 (0.0%) | 0 (0.0%) |
| Real Estate, Rental & Leasing | 0 (0.0%) | 0 (0.0%) |
| Professional & Scientific | 0 (0.0%) | 0 (0.0%) |
| Enterprise Management | 0 (0.0%) | 0 (0.0%) |
| Administrative & Support | 0 (0.0%) | 0 (0.0%) |
| Educational Services | 0 (0.0%) | 11 (100.0%) |
| Health Care & Social Assistance | 16 (31.4%) | 35 (68.6%) |
| Arts, Entertainment & Recreation | 0 (0.0%) | 0 (0.0%) |
| Accommodation & Food Services | 33 (100.0%) | 0 (0.0%) |
| Public Administration | 0 (0.0%) | 0 (0.0%) |
| Total | 49 (51.6%) | 46 (48.4%) |
Education in Harts
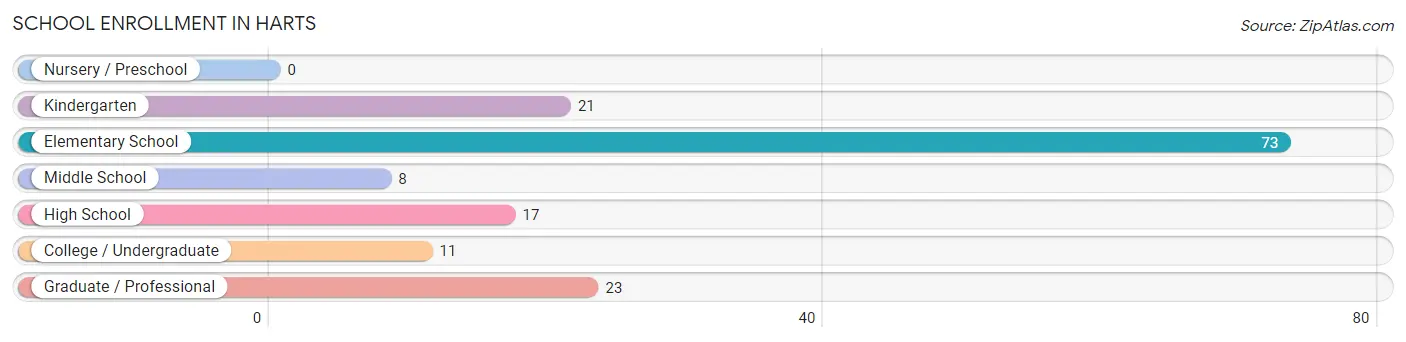
School Enrollment in Harts
The most common levels of schooling among the 153 students in Harts are elementary school (73 | 47.7%), graduate / professional (23 | 15.0%), and kindergarten (21 | 13.7%).
| School Level | # Students | % Students |
| Nursery / Preschool | 0 | 0.0% |
| Kindergarten | 21 | 13.7% |
| Elementary School | 73 | 47.7% |
| Middle School | 8 | 5.2% |
| High School | 17 | 11.1% |
| College / Undergraduate | 11 | 7.2% |
| Graduate / Professional | 23 | 15.0% |
| Total | 153 | 100.0% |
School Enrollment by Age by Funding Source in Harts
Out of a total of 153 students who are enrolled in schools in Harts, 90 (58.8%) attend a private institution, while the remaining 63 (41.2%) are enrolled in public schools. The age group of 15 to 17 year olds has the highest likelihood of being enrolled in private schools, with 17 (100.0% in the age bracket) enrolled. Conversely, the age group of 10 to 14 year olds has the lowest likelihood of being enrolled in a private school, with 8 (100.0% in the age bracket) attending a public institution.
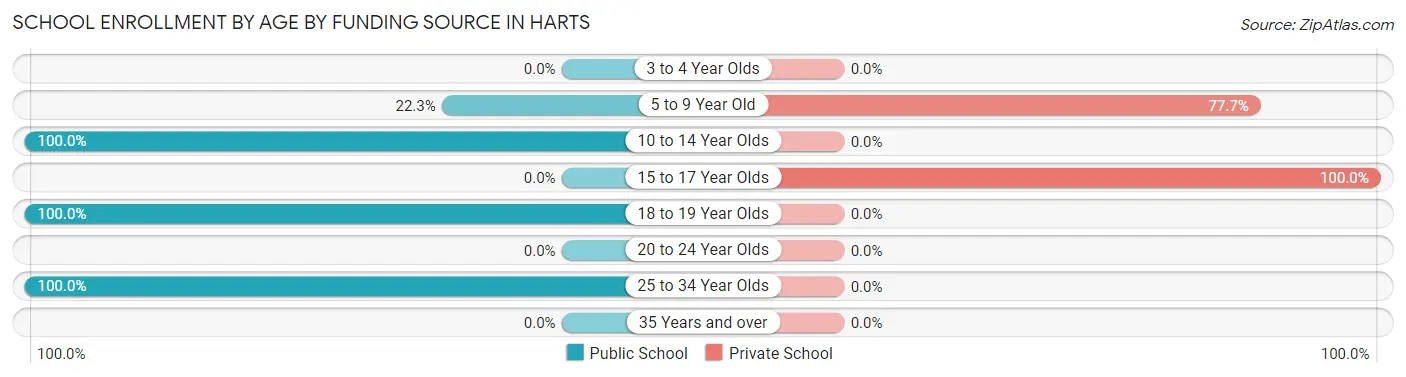
| Age Bracket | Public School | Private School |
| 3 to 4 Year Olds | 0 (0.0%) | 0 (0.0%) |
| 5 to 9 Year Old | 21 (22.3%) | 73 (77.7%) |
| 10 to 14 Year Olds | 8 (100.0%) | 0 (0.0%) |
| 15 to 17 Year Olds | 0 (0.0%) | 17 (100.0%) |
| 18 to 19 Year Olds | 11 (100.0%) | 0 (0.0%) |
| 20 to 24 Year Olds | 0 (0.0%) | 0 (0.0%) |
| 25 to 34 Year Olds | 23 (100.0%) | 0 (0.0%) |
| 35 Years and over | 0 (0.0%) | 0 (0.0%) |
| Total | 63 (41.2%) | 90 (58.8%) |
Educational Attainment by Field of Study in Harts
, and education (16 | 100.0%) are the most common fields of study among 16 individuals in Harts who have obtained a bachelor's degree or higher.
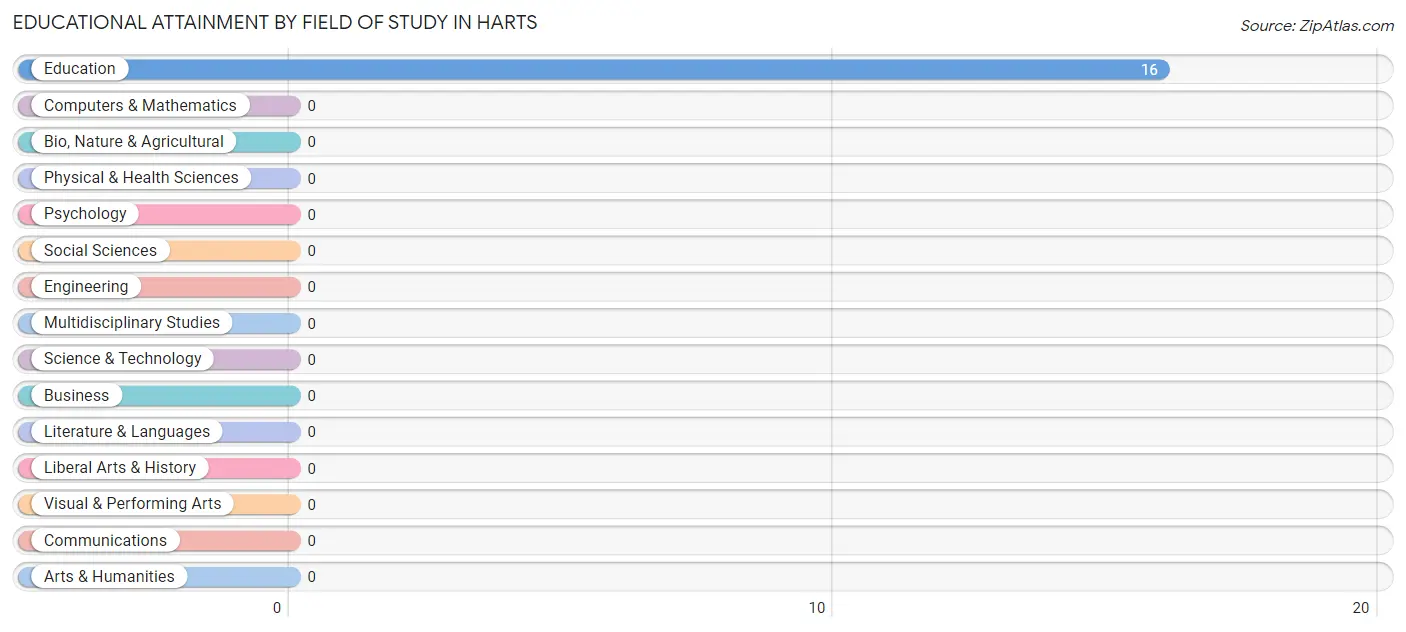
| Field of Study | # Graduates | % Graduates |
| Computers & Mathematics | 0 | 0.0% |
| Bio, Nature & Agricultural | 0 | 0.0% |
| Physical & Health Sciences | 0 | 0.0% |
| Psychology | 0 | 0.0% |
| Social Sciences | 0 | 0.0% |
| Engineering | 0 | 0.0% |
| Multidisciplinary Studies | 0 | 0.0% |
| Science & Technology | 0 | 0.0% |
| Business | 0 | 0.0% |
| Education | 16 | 100.0% |
| Literature & Languages | 0 | 0.0% |
| Liberal Arts & History | 0 | 0.0% |
| Visual & Performing Arts | 0 | 0.0% |
| Communications | 0 | 0.0% |
| Arts & Humanities | 0 | 0.0% |
| Total | 16 | 100.0% |
Transportation & Commute in Harts
Vehicle Availability by Sex in Harts
The most prevalent vehicle ownership categories in Harts are males with 4 vehicles (33, accounting for 67.3%) and females with 4 vehicles (24, making up 71.7%).
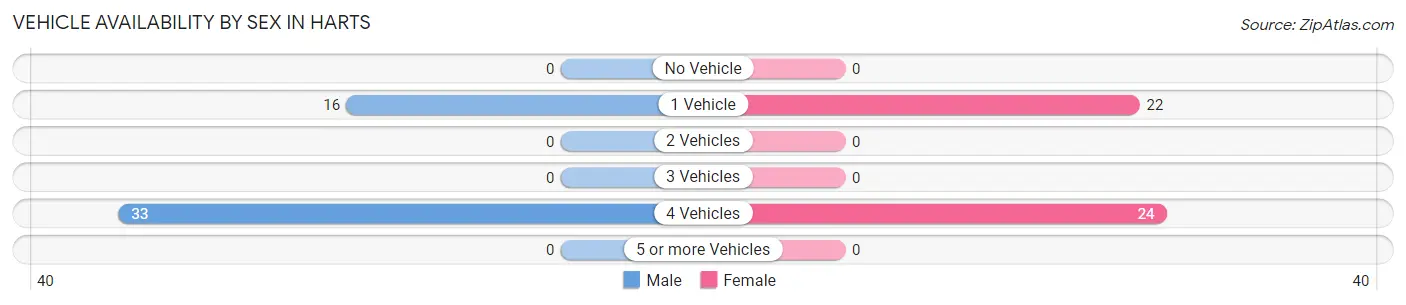
| Vehicles Available | Male | Female |
| No Vehicle | 0 (0.0%) | 0 (0.0%) |
| 1 Vehicle | 16 (32.7%) | 22 (47.8%) |
| 2 Vehicles | 0 (0.0%) | 0 (0.0%) |
| 3 Vehicles | 0 (0.0%) | 0 (0.0%) |
| 4 Vehicles | 33 (67.3%) | 24 (52.2%) |
| 5 or more Vehicles | 0 (0.0%) | 0 (0.0%) |
| Total | 49 (100.0%) | 46 (100.0%) |
Commute Time in Harts
The most frequently occuring commute durations in Harts are 45 to 59 minutes (33 commuters, 55.9%), 15 to 19 minutes (24 commuters, 40.7%), and 5 to 9 minutes (2 commuters, 3.4%).
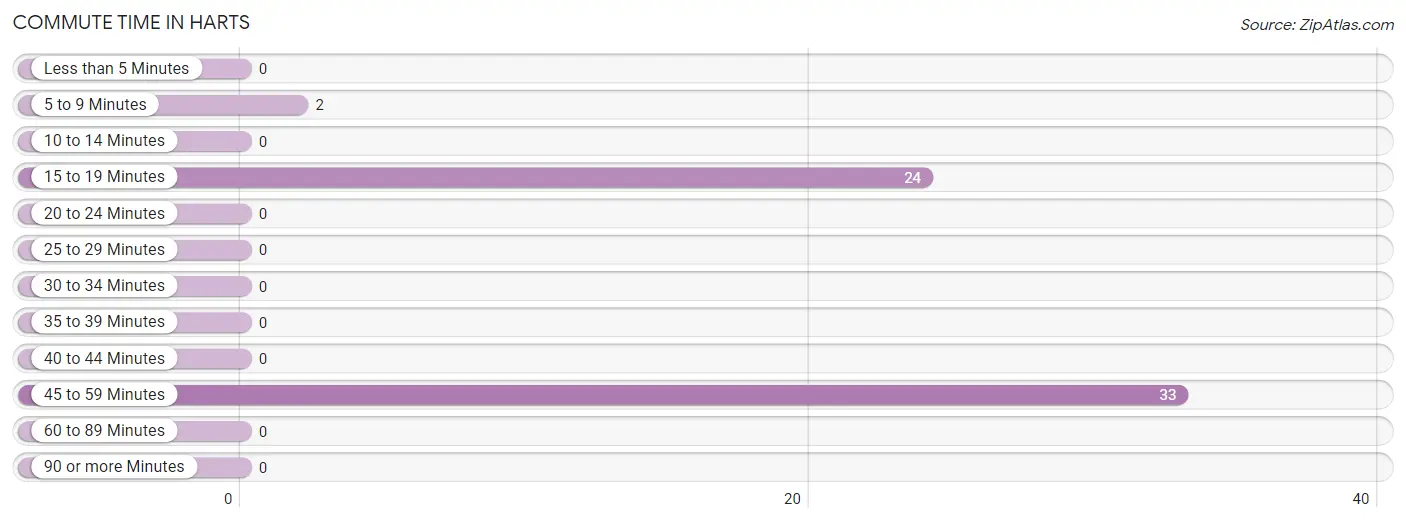
| Commute Time | # Commuters | % Commuters |
| Less than 5 Minutes | 0 | 0.0% |
| 5 to 9 Minutes | 2 | 3.4% |
| 10 to 14 Minutes | 0 | 0.0% |
| 15 to 19 Minutes | 24 | 40.7% |
| 20 to 24 Minutes | 0 | 0.0% |
| 25 to 29 Minutes | 0 | 0.0% |
| 30 to 34 Minutes | 0 | 0.0% |
| 35 to 39 Minutes | 0 | 0.0% |
| 40 to 44 Minutes | 0 | 0.0% |
| 45 to 59 Minutes | 33 | 55.9% |
| 60 to 89 Minutes | 0 | 0.0% |
| 90 or more Minutes | 0 | 0.0% |
Commute Time by Sex in Harts
The most common commute times in Harts are 45 to 59 minutes (33 commuters, 100.0%) for males and 15 to 19 minutes (24 commuters, 92.3%) for females.
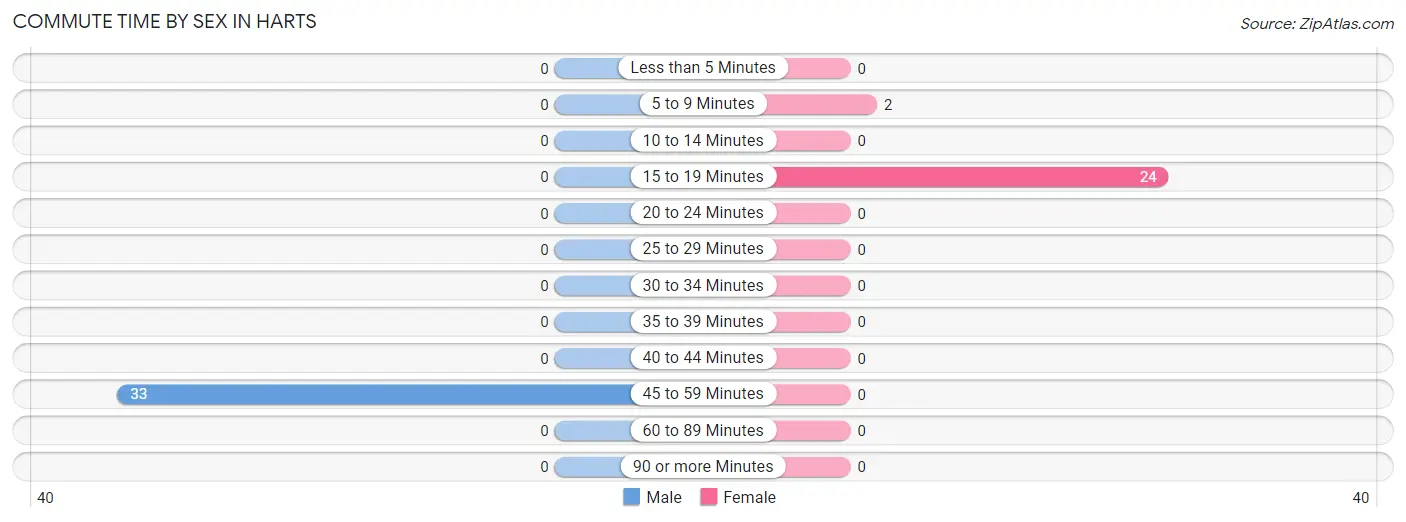
| Commute Time | Male | Female |
| Less than 5 Minutes | 0 (0.0%) | 0 (0.0%) |
| 5 to 9 Minutes | 0 (0.0%) | 2 (7.7%) |
| 10 to 14 Minutes | 0 (0.0%) | 0 (0.0%) |
| 15 to 19 Minutes | 0 (0.0%) | 24 (92.3%) |
| 20 to 24 Minutes | 0 (0.0%) | 0 (0.0%) |
| 25 to 29 Minutes | 0 (0.0%) | 0 (0.0%) |
| 30 to 34 Minutes | 0 (0.0%) | 0 (0.0%) |
| 35 to 39 Minutes | 0 (0.0%) | 0 (0.0%) |
| 40 to 44 Minutes | 0 (0.0%) | 0 (0.0%) |
| 45 to 59 Minutes | 33 (100.0%) | 0 (0.0%) |
| 60 to 89 Minutes | 0 (0.0%) | 0 (0.0%) |
| 90 or more Minutes | 0 (0.0%) | 0 (0.0%) |
Time of Departure to Work by Sex in Harts
The most frequent times of departure to work in Harts are 7:00 AM to 7:29 AM (33, 100.0%) for males and 7:00 AM to 7:29 AM (24, 92.3%) for females.
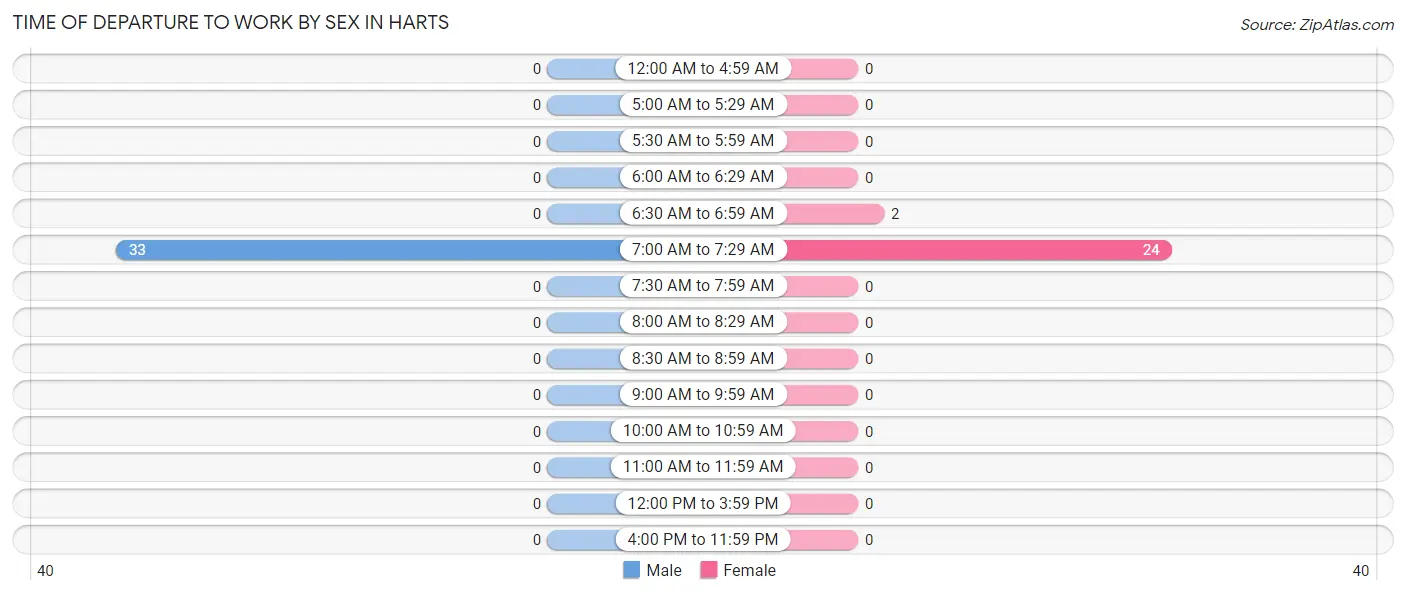
| Time of Departure | Male | Female |
| 12:00 AM to 4:59 AM | 0 (0.0%) | 0 (0.0%) |
| 5:00 AM to 5:29 AM | 0 (0.0%) | 0 (0.0%) |
| 5:30 AM to 5:59 AM | 0 (0.0%) | 0 (0.0%) |
| 6:00 AM to 6:29 AM | 0 (0.0%) | 0 (0.0%) |
| 6:30 AM to 6:59 AM | 0 (0.0%) | 2 (7.7%) |
| 7:00 AM to 7:29 AM | 33 (100.0%) | 24 (92.3%) |
| 7:30 AM to 7:59 AM | 0 (0.0%) | 0 (0.0%) |
| 8:00 AM to 8:29 AM | 0 (0.0%) | 0 (0.0%) |
| 8:30 AM to 8:59 AM | 0 (0.0%) | 0 (0.0%) |
| 9:00 AM to 9:59 AM | 0 (0.0%) | 0 (0.0%) |
| 10:00 AM to 10:59 AM | 0 (0.0%) | 0 (0.0%) |
| 11:00 AM to 11:59 AM | 0 (0.0%) | 0 (0.0%) |
| 12:00 PM to 3:59 PM | 0 (0.0%) | 0 (0.0%) |
| 4:00 PM to 11:59 PM | 0 (0.0%) | 0 (0.0%) |
| Total | 33 (100.0%) | 26 (100.0%) |
Housing Occupancy in Harts
Occupancy by Ownership in Harts
Of the total 136 dwellings in Harts, owner-occupied units account for 136 (100.0%), while renter-occupied units make up 0 (0.0%).
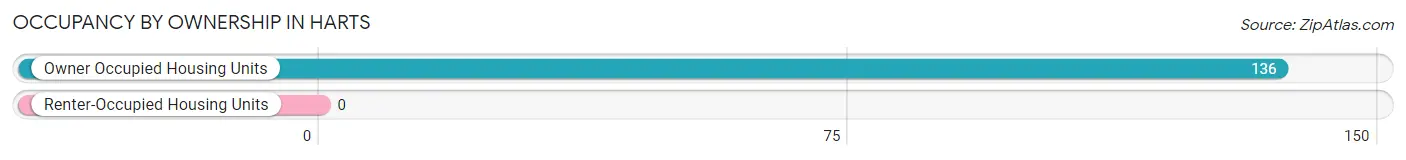
| Occupancy | # Housing Units | % Housing Units |
| Owner Occupied Housing Units | 136 | 100.0% |
| Renter-Occupied Housing Units | 0 | 0.0% |
| Total Occupied Housing Units | 136 | 100.0% |
Occupancy by Household Size in Harts
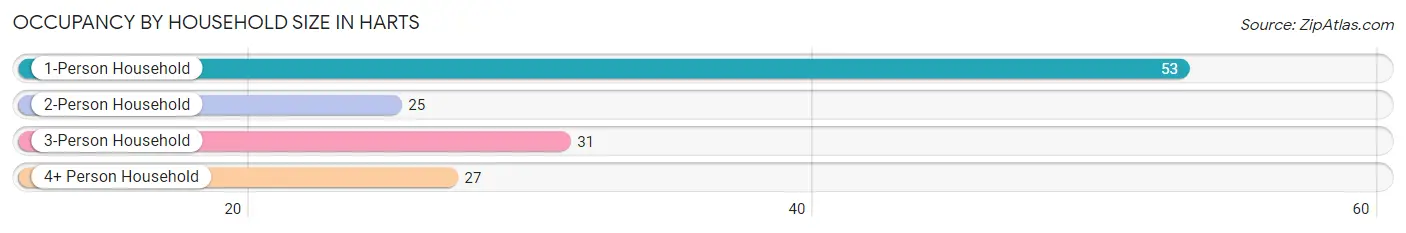
| Household Size | # Housing Units | % Housing Units |
| 1-Person Household | 53 | 39.0% |
| 2-Person Household | 25 | 18.4% |
| 3-Person Household | 31 | 22.8% |
| 4+ Person Household | 27 | 19.9% |
| Total Housing Units | 136 | 100.0% |
Occupancy by Ownership by Household Size in Harts
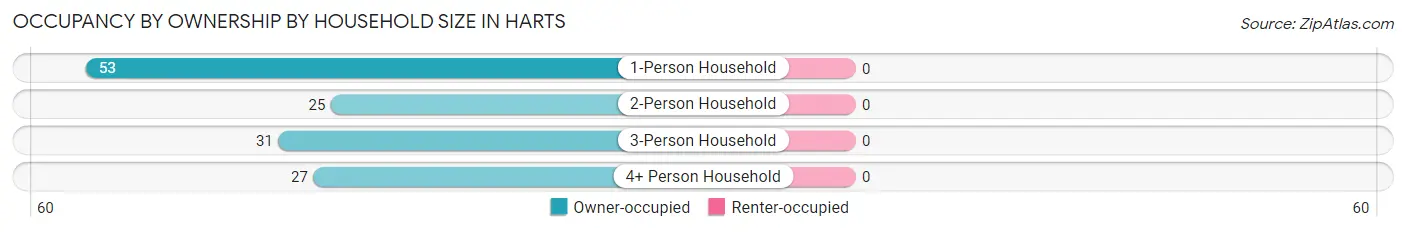
| Household Size | Owner-occupied | Renter-occupied |
| 1-Person Household | 53 (100.0%) | 0 (0.0%) |
| 2-Person Household | 25 (100.0%) | 0 (0.0%) |
| 3-Person Household | 31 (100.0%) | 0 (0.0%) |
| 4+ Person Household | 27 (100.0%) | 0 (0.0%) |
| Total Housing Units | 136 (100.0%) | 0 (0.0%) |
Occupancy by Educational Attainment in Harts
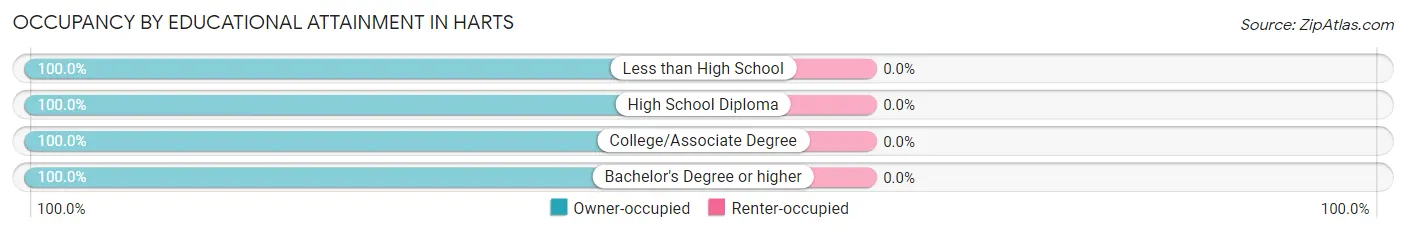
| Household Size | Owner-occupied | Renter-occupied |
| Less than High School | 5 (100.0%) | 0 (0.0%) |
| High School Diploma | 76 (100.0%) | 0 (0.0%) |
| College/Associate Degree | 48 (100.0%) | 0 (0.0%) |
| Bachelor's Degree or higher | 7 (100.0%) | 0 (0.0%) |
Occupancy by Age of Householder in Harts
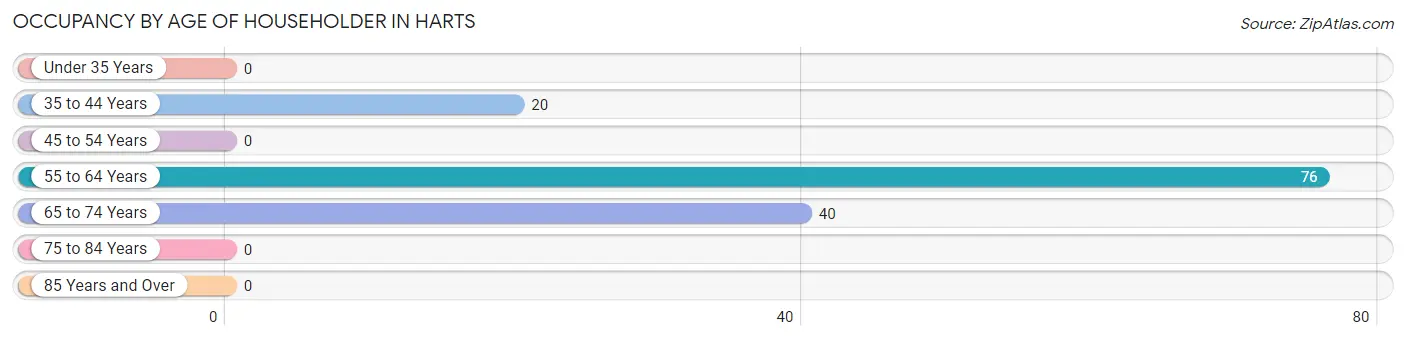
| Age Bracket | # Households | % Households |
| Under 35 Years | 0 | 0.0% |
| 35 to 44 Years | 20 | 14.7% |
| 45 to 54 Years | 0 | 0.0% |
| 55 to 64 Years | 76 | 55.9% |
| 65 to 74 Years | 40 | 29.4% |
| 75 to 84 Years | 0 | 0.0% |
| 85 Years and Over | 0 | 0.0% |
| Total | 136 | 100.0% |
Housing Finances in Harts
Median Income by Occupancy in Harts
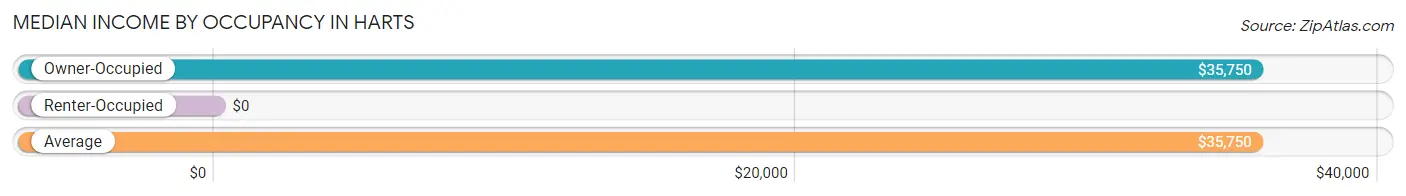
| Occupancy Type | # Households | Median Income |
| Owner-Occupied | 136 (100.0%) | $35,750 |
| Renter-Occupied | 0 (0.0%) | $0 |
| Average | 136 (100.0%) | $35,750 |
Occupancy by Householder Income Bracket in Harts
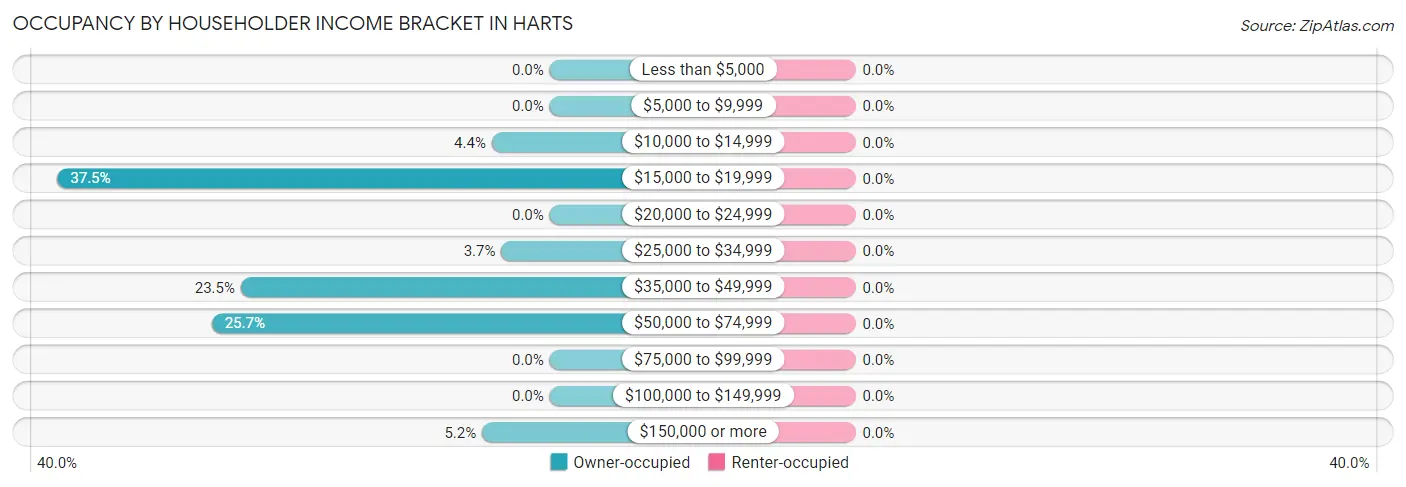
| Income Bracket | Owner-occupied | Renter-occupied |
| Less than $5,000 | 0 (0.0%) | 0 (0.0%) |
| $5,000 to $9,999 | 0 (0.0%) | 0 (0.0%) |
| $10,000 to $14,999 | 6 (4.4%) | 0 (0.0%) |
| $15,000 to $19,999 | 51 (37.5%) | 0 (0.0%) |
| $20,000 to $24,999 | 0 (0.0%) | 0 (0.0%) |
| $25,000 to $34,999 | 5 (3.7%) | 0 (0.0%) |
| $35,000 to $49,999 | 32 (23.5%) | 0 (0.0%) |
| $50,000 to $74,999 | 35 (25.7%) | 0 (0.0%) |
| $75,000 to $99,999 | 0 (0.0%) | 0 (0.0%) |
| $100,000 to $149,999 | 0 (0.0%) | 0 (0.0%) |
| $150,000 or more | 7 (5.1%) | 0 (0.0%) |
| Total | 136 (100.0%) | 0 (0.0%) |
Monthly Housing Cost Tiers in Harts
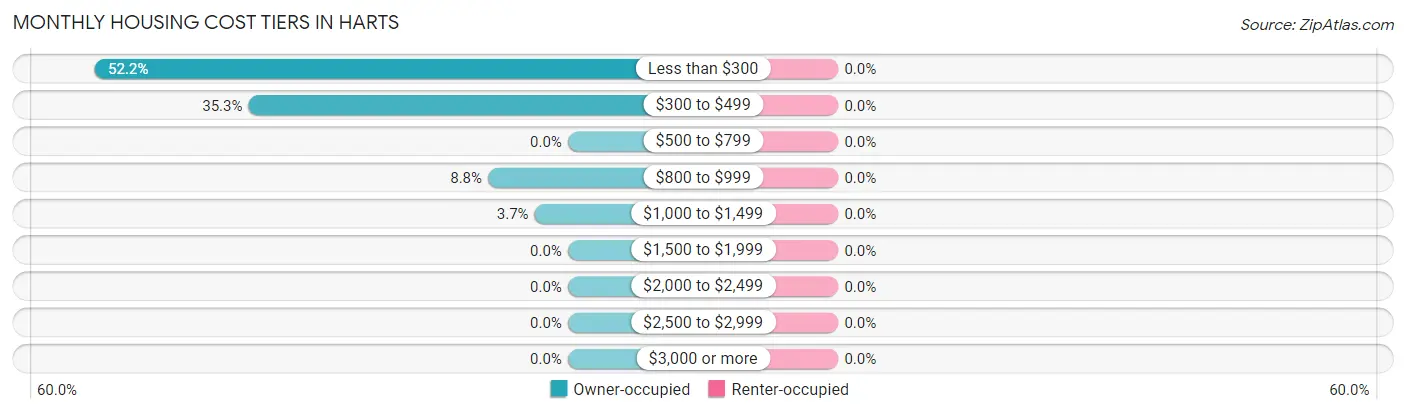
| Monthly Cost | Owner-occupied | Renter-occupied |
| Less than $300 | 71 (52.2%) | 0 (0.0%) |
| $300 to $499 | 48 (35.3%) | 0 (0.0%) |
| $500 to $799 | 0 (0.0%) | 0 (0.0%) |
| $800 to $999 | 12 (8.8%) | 0 (0.0%) |
| $1,000 to $1,499 | 5 (3.7%) | 0 (0.0%) |
| $1,500 to $1,999 | 0 (0.0%) | 0 (0.0%) |
| $2,000 to $2,499 | 0 (0.0%) | 0 (0.0%) |
| $2,500 to $2,999 | 0 (0.0%) | 0 (0.0%) |
| $3,000 or more | 0 (0.0%) | 0 (0.0%) |
| Total | 136 (100.0%) | 0 (0.0%) |
Physical Housing Characteristics in Harts
Housing Structures in Harts
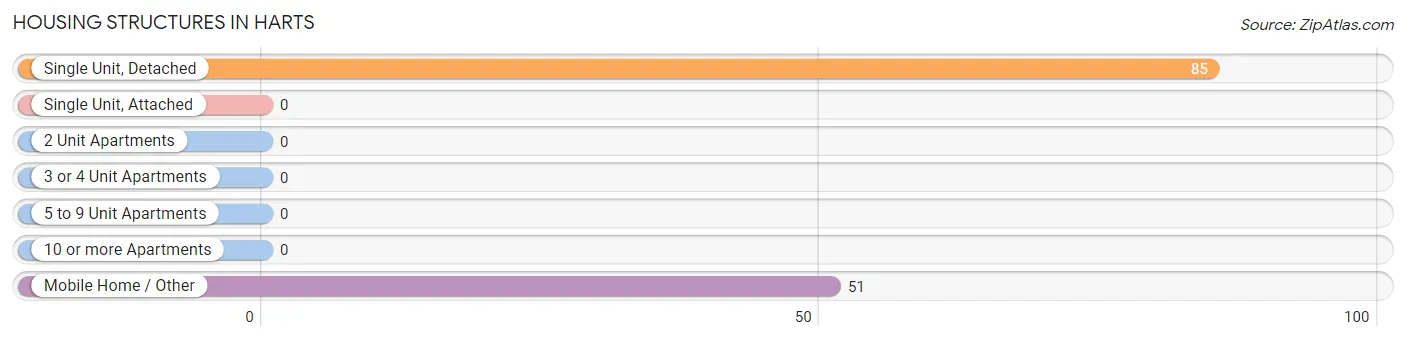
| Structure Type | # Housing Units | % Housing Units |
| Single Unit, Detached | 85 | 62.5% |
| Single Unit, Attached | 0 | 0.0% |
| 2 Unit Apartments | 0 | 0.0% |
| 3 or 4 Unit Apartments | 0 | 0.0% |
| 5 to 9 Unit Apartments | 0 | 0.0% |
| 10 or more Apartments | 0 | 0.0% |
| Mobile Home / Other | 51 | 37.5% |
| Total | 136 | 100.0% |
Housing Structures by Occupancy in Harts
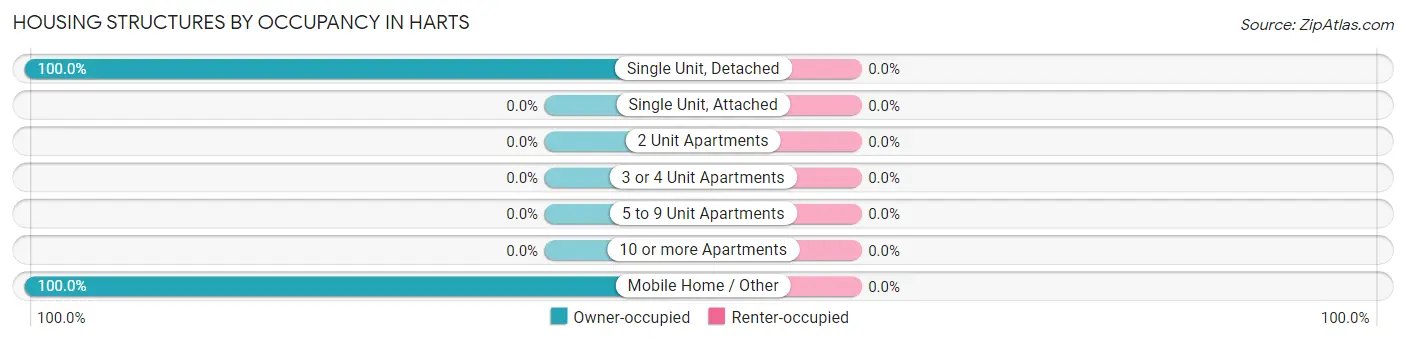
| Structure Type | Owner-occupied | Renter-occupied |
| Single Unit, Detached | 85 (100.0%) | 0 (0.0%) |
| Single Unit, Attached | 0 (0.0%) | 0 (0.0%) |
| 2 Unit Apartments | 0 (0.0%) | 0 (0.0%) |
| 3 or 4 Unit Apartments | 0 (0.0%) | 0 (0.0%) |
| 5 to 9 Unit Apartments | 0 (0.0%) | 0 (0.0%) |
| 10 or more Apartments | 0 (0.0%) | 0 (0.0%) |
| Mobile Home / Other | 51 (100.0%) | 0 (0.0%) |
| Total | 136 (100.0%) | 0 (0.0%) |
Housing Structures by Number of Rooms in Harts
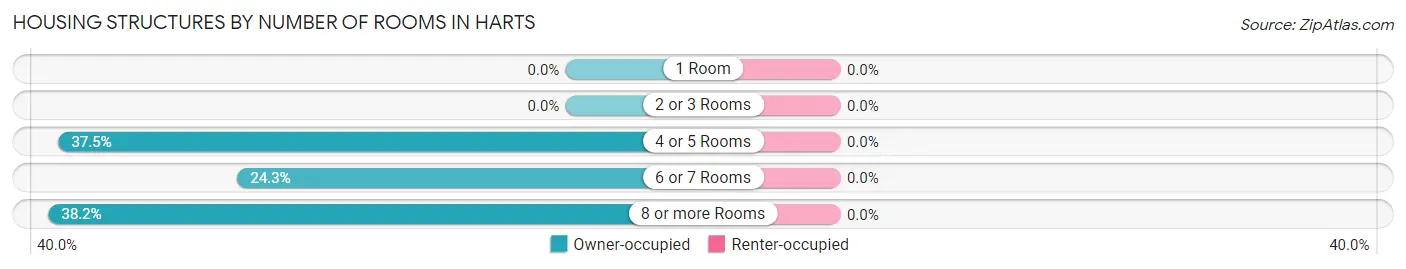
| Number of Rooms | Owner-occupied | Renter-occupied |
| 1 Room | 0 (0.0%) | 0 (0.0%) |
| 2 or 3 Rooms | 0 (0.0%) | 0 (0.0%) |
| 4 or 5 Rooms | 51 (37.5%) | 0 (0.0%) |
| 6 or 7 Rooms | 33 (24.3%) | 0 (0.0%) |
| 8 or more Rooms | 52 (38.2%) | 0 (0.0%) |
| Total | 136 (100.0%) | 0 (0.0%) |
Housing Structure by Heating Type in Harts
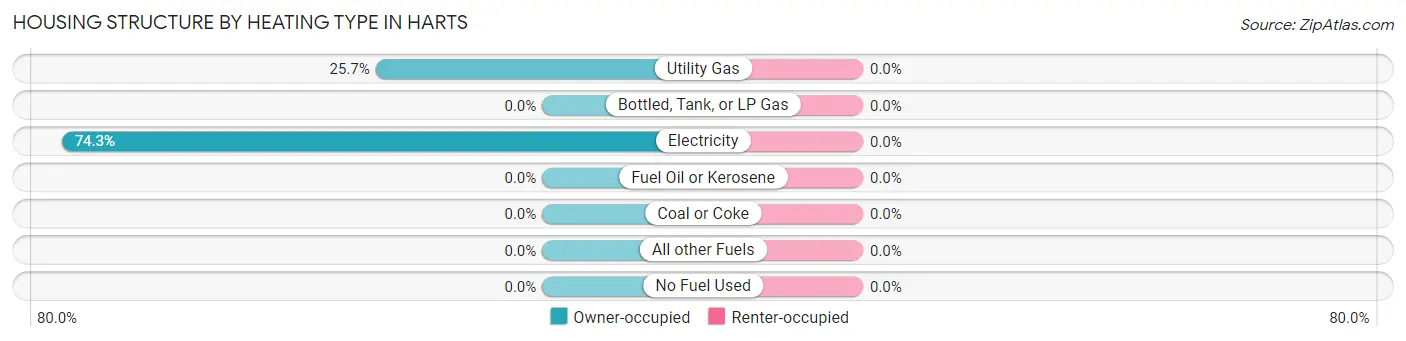
| Heating Type | Owner-occupied | Renter-occupied |
| Utility Gas | 35 (25.7%) | 0 (0.0%) |
| Bottled, Tank, or LP Gas | 0 (0.0%) | 0 (0.0%) |
| Electricity | 101 (74.3%) | 0 (0.0%) |
| Fuel Oil or Kerosene | 0 (0.0%) | 0 (0.0%) |
| Coal or Coke | 0 (0.0%) | 0 (0.0%) |
| All other Fuels | 0 (0.0%) | 0 (0.0%) |
| No Fuel Used | 0 (0.0%) | 0 (0.0%) |
| Total | 136 (100.0%) | 0 (0.0%) |
Household Vehicle Usage in Harts
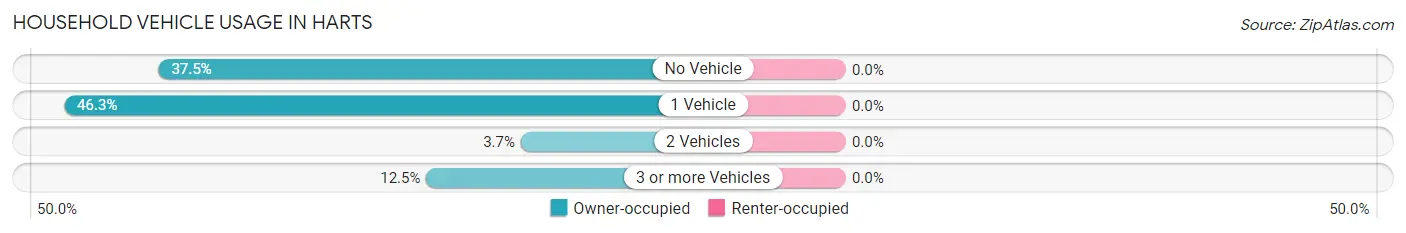
| Vehicles per Household | Owner-occupied | Renter-occupied |
| No Vehicle | 51 (37.5%) | 0 (0.0%) |
| 1 Vehicle | 63 (46.3%) | 0 (0.0%) |
| 2 Vehicles | 5 (3.7%) | 0 (0.0%) |
| 3 or more Vehicles | 17 (12.5%) | 0 (0.0%) |
| Total | 136 (100.0%) | 0 (0.0%) |
Real Estate & Mortgages in Harts
Real Estate and Mortgage Overview in Harts
| Characteristic | Without Mortgage | With Mortgage |
| Housing Units | 124 | 12 |
| Median Property Value | $19,100 | $0 |
| Median Household Income | - | - |
| Monthly Housing Costs | $294 | $0 |
| Real Estate Taxes | - | - |
Property Value by Mortgage Status in Harts
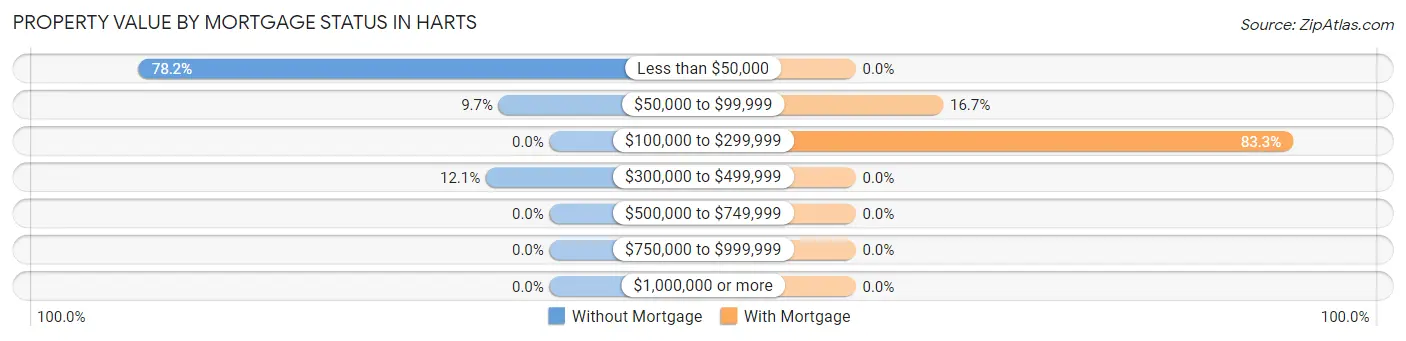
| Property Value | Without Mortgage | With Mortgage |
| Less than $50,000 | 97 (78.2%) | 0 (0.0%) |
| $50,000 to $99,999 | 12 (9.7%) | 2 (16.7%) |
| $100,000 to $299,999 | 0 (0.0%) | 10 (83.3%) |
| $300,000 to $499,999 | 15 (12.1%) | 0 (0.0%) |
| $500,000 to $749,999 | 0 (0.0%) | 0 (0.0%) |
| $750,000 to $999,999 | 0 (0.0%) | 0 (0.0%) |
| $1,000,000 or more | 0 (0.0%) | 0 (0.0%) |
| Total | 124 (100.0%) | 12 (100.0%) |
Household Income by Mortgage Status in Harts
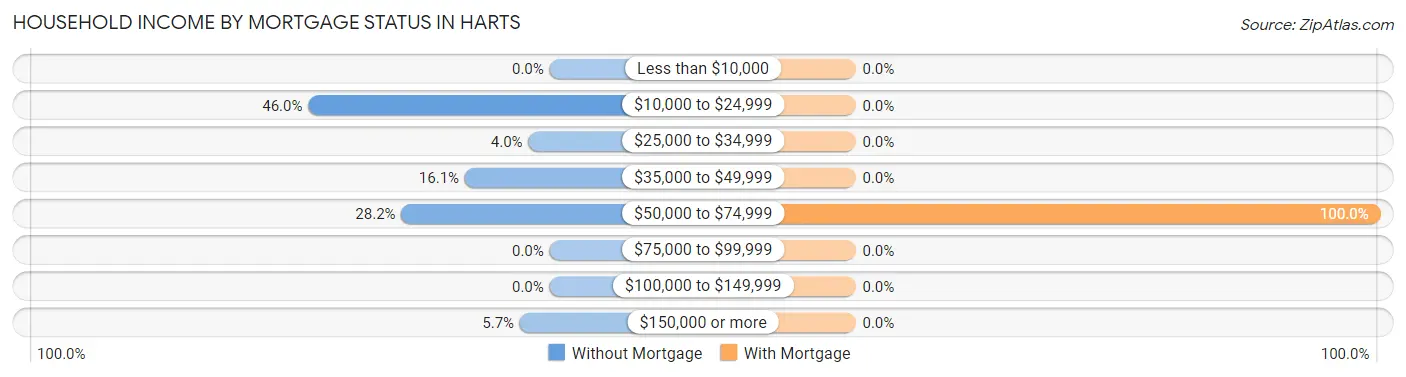
| Household Income | Without Mortgage | With Mortgage |
| Less than $10,000 | 0 (0.0%) | 0 (0.0%) |
| $10,000 to $24,999 | 57 (46.0%) | 0 (0.0%) |
| $25,000 to $34,999 | 5 (4.0%) | 0 (0.0%) |
| $35,000 to $49,999 | 20 (16.1%) | 0 (0.0%) |
| $50,000 to $74,999 | 35 (28.2%) | 12 (100.0%) |
| $75,000 to $99,999 | 0 (0.0%) | 0 (0.0%) |
| $100,000 to $149,999 | 0 (0.0%) | 0 (0.0%) |
| $150,000 or more | 7 (5.7%) | 0 (0.0%) |
| Total | 124 (100.0%) | 12 (100.0%) |
Property Value to Household Income Ratio in Harts
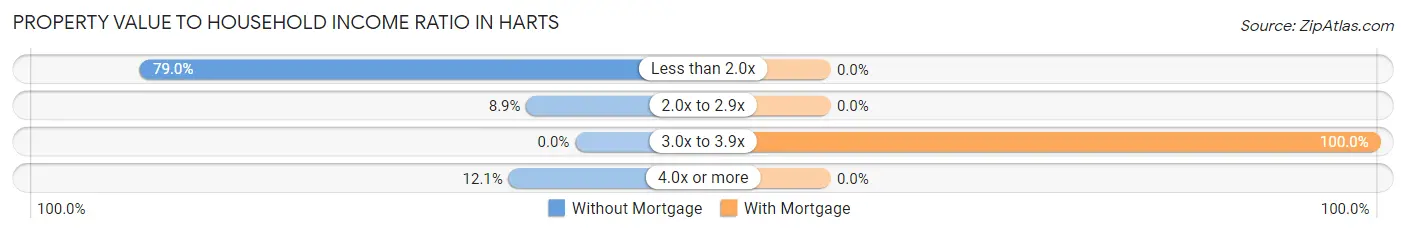
| Value-to-Income Ratio | Without Mortgage | With Mortgage |
| Less than 2.0x | 98 (79.0%) | 0 (0.0%) |
| 2.0x to 2.9x | 11 (8.9%) | 0 (0.0%) |
| 3.0x to 3.9x | 0 (0.0%) | 12 (100.0%) |
| 4.0x or more | 15 (12.1%) | 0 (0.0%) |
| Total | 124 (100.0%) | 12 (100.0%) |
Real Estate Taxes by Mortgage Status in Harts
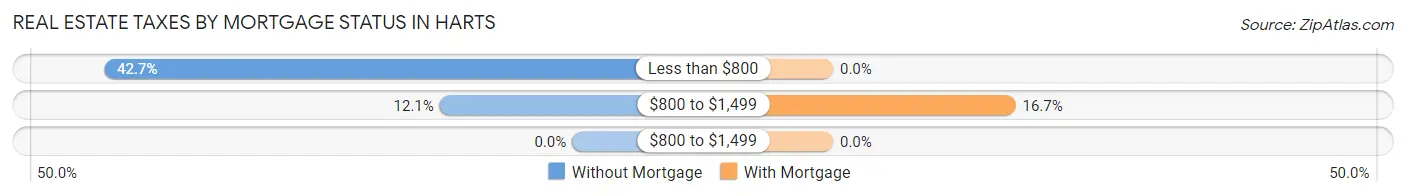
| Property Taxes | Without Mortgage | With Mortgage |
| Less than $800 | 53 (42.7%) | 0 (0.0%) |
| $800 to $1,499 | 15 (12.1%) | 2 (16.7%) |
| $800 to $1,499 | 0 (0.0%) | 0 (0.0%) |
| Total | 124 (100.0%) | 12 (100.0%) |
Health & Disability in Harts
Health Insurance Coverage by Age in Harts
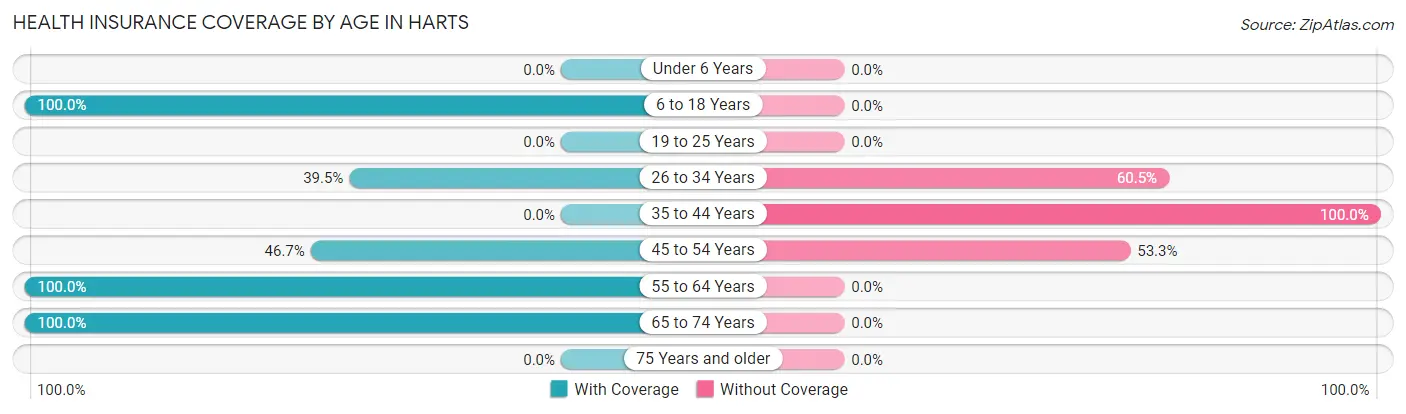
| Age Bracket | With Coverage | Without Coverage |
| Under 6 Years | 0 (0.0%) | 0 (0.0%) |
| 6 to 18 Years | 130 (100.0%) | 0 (0.0%) |
| 19 to 25 Years | 0 (0.0%) | 0 (0.0%) |
| 26 to 34 Years | 15 (39.5%) | 23 (60.5%) |
| 35 to 44 Years | 0 (0.0%) | 20 (100.0%) |
| 45 to 54 Years | 14 (46.7%) | 16 (53.3%) |
| 55 to 64 Years | 140 (100.0%) | 0 (0.0%) |
| 65 to 74 Years | 78 (100.0%) | 0 (0.0%) |
| 75 Years and older | 0 (0.0%) | 0 (0.0%) |
| Total | 377 (86.5%) | 59 (13.5%) |
Health Insurance Coverage by Citizenship Status in Harts
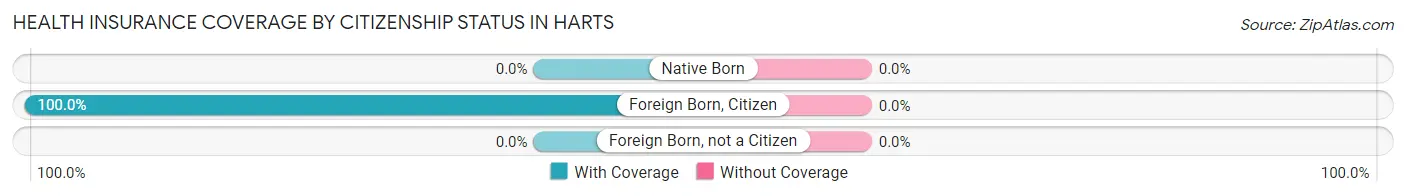
| Citizenship Status | With Coverage | Without Coverage |
| Native Born | 0 (0.0%) | 0 (0.0%) |
| Foreign Born, Citizen | 130 (100.0%) | 0 (0.0%) |
| Foreign Born, not a Citizen | 0 (0.0%) | 0 (0.0%) |
Health Insurance Coverage by Household Income in Harts
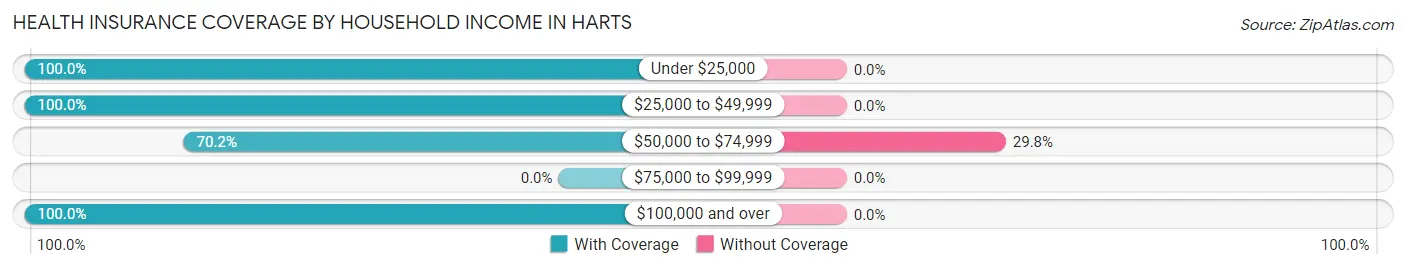
| Household Income | With Coverage | Without Coverage |
| Under $25,000 | 79 (100.0%) | 0 (0.0%) |
| $25,000 to $49,999 | 95 (100.0%) | 0 (0.0%) |
| $50,000 to $74,999 | 139 (70.2%) | 59 (29.8%) |
| $75,000 to $99,999 | 0 (0.0%) | 0 (0.0%) |
| $100,000 and over | 64 (100.0%) | 0 (0.0%) |
Public vs Private Health Insurance Coverage by Age in Harts
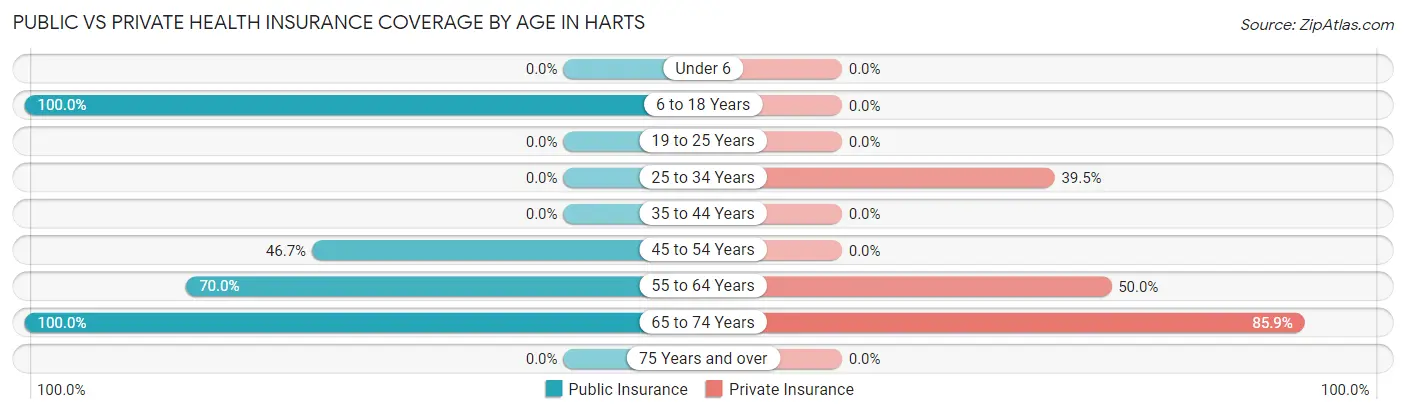
| Age Bracket | Public Insurance | Private Insurance |
| Under 6 | 0 (0.0%) | 0 (0.0%) |
| 6 to 18 Years | 130 (100.0%) | 0 (0.0%) |
| 19 to 25 Years | 0 (0.0%) | 0 (0.0%) |
| 25 to 34 Years | 0 (0.0%) | 15 (39.5%) |
| 35 to 44 Years | 0 (0.0%) | 0 (0.0%) |
| 45 to 54 Years | 14 (46.7%) | 0 (0.0%) |
| 55 to 64 Years | 98 (70.0%) | 70 (50.0%) |
| 65 to 74 Years | 78 (100.0%) | 67 (85.9%) |
| 75 Years and over | 0 (0.0%) | 0 (0.0%) |
| Total | 320 (73.4%) | 152 (34.9%) |
Disability Status by Sex by Age in Harts
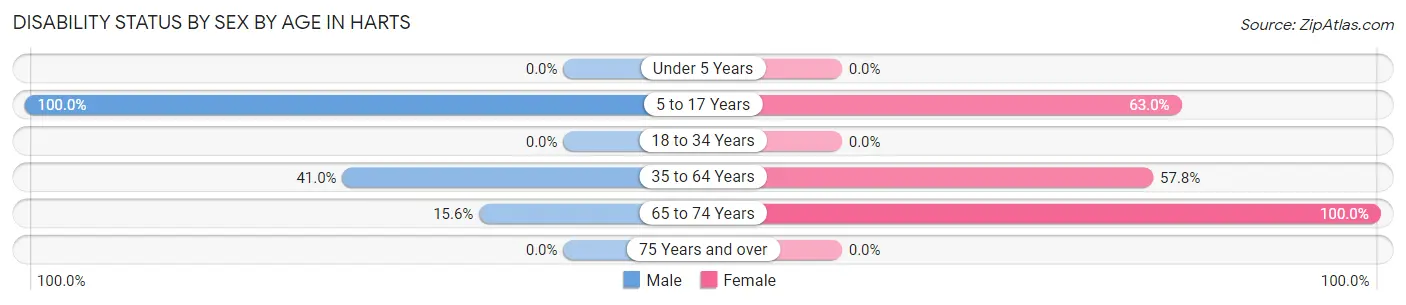
| Age Bracket | Male | Female |
| Under 5 Years | 0 (0.0%) | 0 (0.0%) |
| 5 to 17 Years | 73 (100.0%) | 29 (63.0%) |
| 18 to 34 Years | 0 (0.0%) | 0 (0.0%) |
| 35 to 64 Years | 41 (41.0%) | 52 (57.8%) |
| 65 to 74 Years | 5 (15.6%) | 46 (100.0%) |
| 75 Years and over | 0 (0.0%) | 0 (0.0%) |
Disability Class by Sex by Age in Harts
Disability Class: Hearing Difficulty
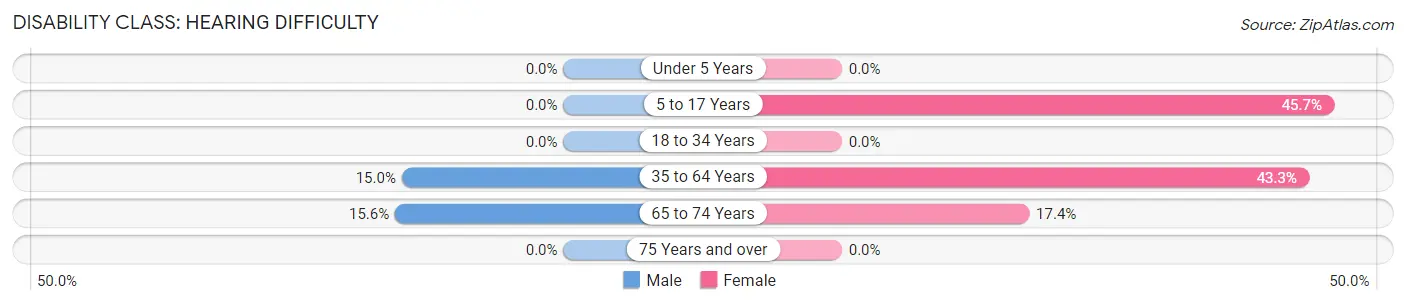
| Age Bracket | Male | Female |
| Under 5 Years | 0 (0.0%) | 0 (0.0%) |
| 5 to 17 Years | 0 (0.0%) | 21 (45.7%) |
| 18 to 34 Years | 0 (0.0%) | 0 (0.0%) |
| 35 to 64 Years | 15 (15.0%) | 39 (43.3%) |
| 65 to 74 Years | 5 (15.6%) | 8 (17.4%) |
| 75 Years and over | 0 (0.0%) | 0 (0.0%) |
Disability Class: Vision Difficulty
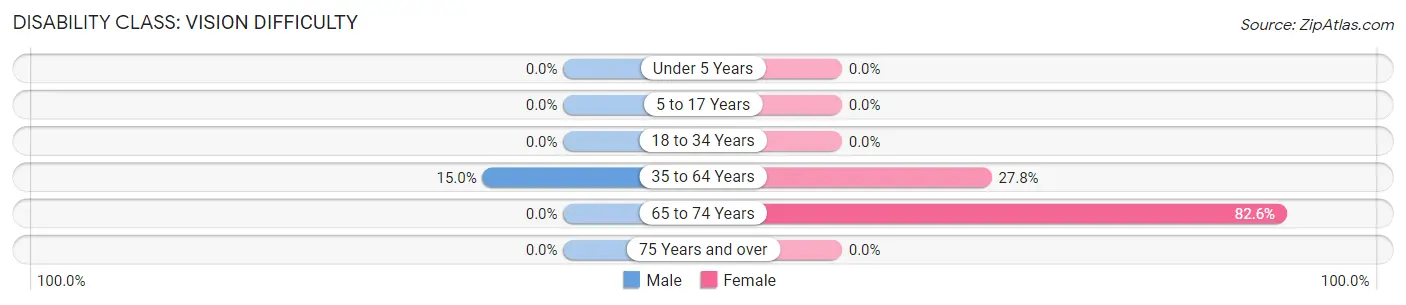
| Age Bracket | Male | Female |
| Under 5 Years | 0 (0.0%) | 0 (0.0%) |
| 5 to 17 Years | 0 (0.0%) | 0 (0.0%) |
| 18 to 34 Years | 0 (0.0%) | 0 (0.0%) |
| 35 to 64 Years | 15 (15.0%) | 25 (27.8%) |
| 65 to 74 Years | 0 (0.0%) | 38 (82.6%) |
| 75 Years and over | 0 (0.0%) | 0 (0.0%) |
Disability Class: Cognitive Difficulty
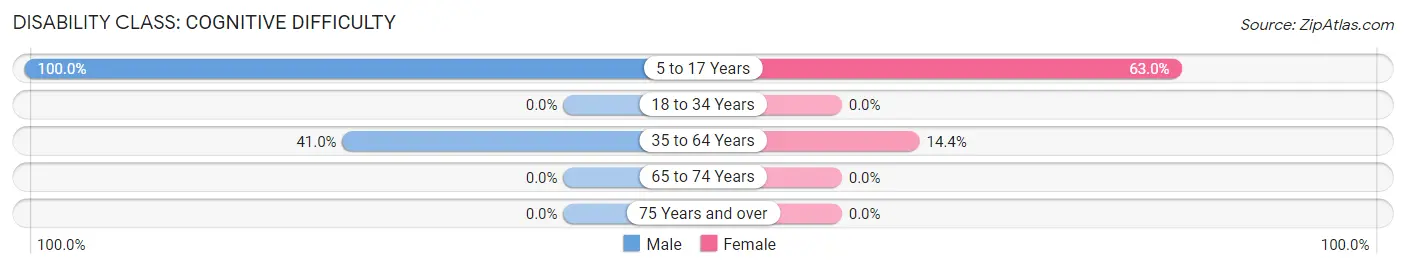
| Age Bracket | Male | Female |
| 5 to 17 Years | 73 (100.0%) | 29 (63.0%) |
| 18 to 34 Years | 0 (0.0%) | 0 (0.0%) |
| 35 to 64 Years | 41 (41.0%) | 13 (14.4%) |
| 65 to 74 Years | 0 (0.0%) | 0 (0.0%) |
| 75 Years and over | 0 (0.0%) | 0 (0.0%) |
Disability Class: Ambulatory Difficulty
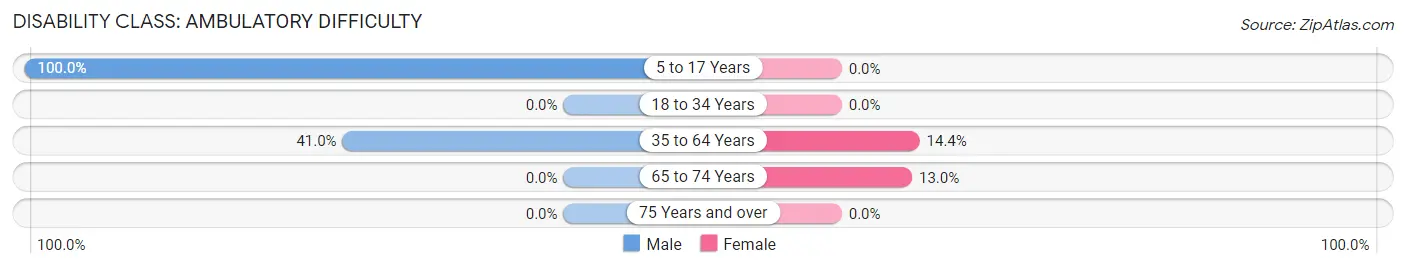
| Age Bracket | Male | Female |
| 5 to 17 Years | 73 (100.0%) | 0 (0.0%) |
| 18 to 34 Years | 0 (0.0%) | 0 (0.0%) |
| 35 to 64 Years | 41 (41.0%) | 13 (14.4%) |
| 65 to 74 Years | 0 (0.0%) | 6 (13.0%) |
| 75 Years and over | 0 (0.0%) | 0 (0.0%) |
Disability Class: Self-Care Difficulty
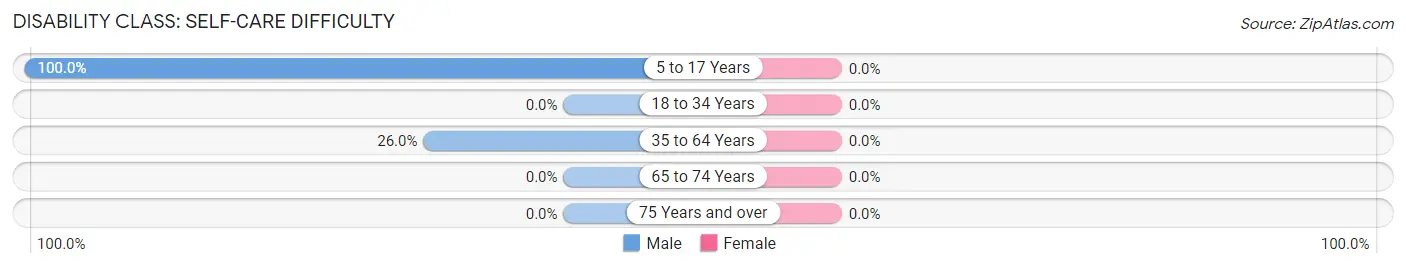
| Age Bracket | Male | Female |
| 5 to 17 Years | 73 (100.0%) | 0 (0.0%) |
| 18 to 34 Years | 0 (0.0%) | 0 (0.0%) |
| 35 to 64 Years | 26 (26.0%) | 0 (0.0%) |
| 65 to 74 Years | 0 (0.0%) | 0 (0.0%) |
| 75 Years and over | 0 (0.0%) | 0 (0.0%) |
Technology Access in Harts
Computing Device Access in Harts
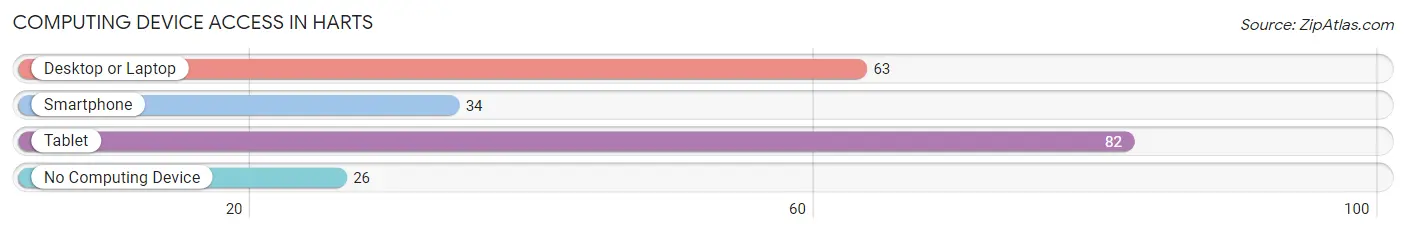
| Device Type | # Households | % Households |
| Desktop or Laptop | 63 | 46.3% |
| Smartphone | 34 | 25.0% |
| Tablet | 82 | 60.3% |
| No Computing Device | 26 | 19.1% |
| Total | 136 | 100.0% |
Internet Access in Harts
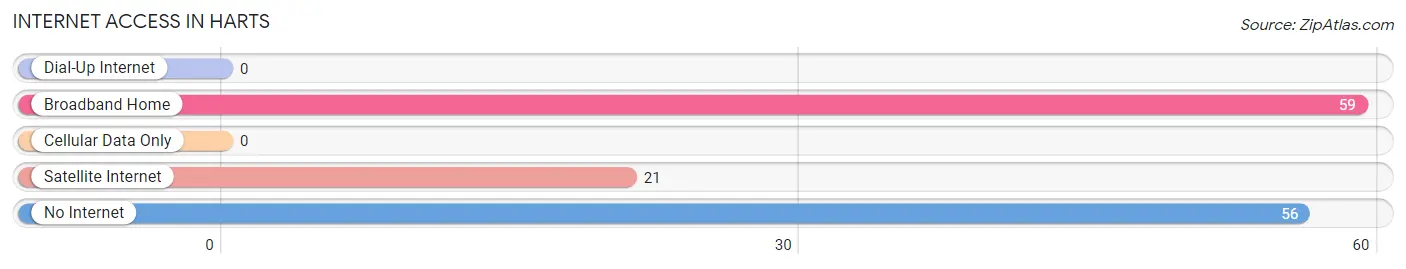
| Internet Type | # Households | % Households |
| Dial-Up Internet | 0 | 0.0% |
| Broadband Home | 59 | 43.4% |
| Cellular Data Only | 0 | 0.0% |
| Satellite Internet | 21 | 15.4% |
| No Internet | 56 | 41.2% |
| Total | 136 | 100.0% |
Harts Summary
Harts is a small unincorporated community located in Lincoln County, West Virginia. It is situated in the Appalachian Mountains, approximately 25 miles northeast of Charleston, the state capital. The population of Harts was estimated to be around 500 in 2020.
History
Harts was first settled in the late 1700s by a group of settlers from the nearby town of Logan. The town was named after the Hart family, who were among the first settlers. The town was officially incorporated in 1891.
The town was originally a farming community, with the main crops being corn, wheat, and tobacco. In the early 1900s, the town began to develop a coal mining industry, which provided jobs for many of the town's residents. The coal industry was the main source of income for the town until the 1950s, when the industry began to decline.
Geography
Harts is located in the Appalachian Mountains, in the southeastern part of West Virginia. The town is situated in a valley, surrounded by hills and mountains. The town is located near the Guyandotte River, which provides a source of water for the town.
The climate in Harts is humid subtropical, with hot summers and cold winters. The average annual temperature is around 55 degrees Fahrenheit. The average annual precipitation is around 40 inches.
Economy
The economy of Harts is largely based on agriculture and tourism. The town is home to several small farms, which produce a variety of crops, including corn, wheat, and tobacco. The town also has several small businesses, including restaurants, stores, and a gas station.
Tourism is an important part of the economy of Harts. The town is home to several attractions, including the Harts Historic District, which is listed on the National Register of Historic Places. The town also has several parks and recreational areas, including the Harts Mountain National Recreation Area.
Demographics
The population of Harts was estimated to be around 500 in 2020. The town is predominantly white, with a small African American population. The median household income in Harts is around $30,000, and the median home value is around $90,000. The town has a high rate of poverty, with around 25% of the population living below the poverty line.
Common Questions
What is Per Capita Income in Harts?
Per Capita income in Harts is $17,298.
What is the Median Family Income in Harts?
Median Family Income in Harts is $50,083.
What is the Median Household income in Harts?
Median Household Income in Harts is $35,750.
What is Inequality or Gini Index in Harts?
Inequality or Gini Index in Harts is 0.43.
What is the Total Population of Harts?
Total Population of Harts is 436.
What is the Total Male Population of Harts?
Total Male Population of Harts is 205.
What is the Total Female Population of Harts?
Total Female Population of Harts is 231.
What is the Ratio of Males per 100 Females in Harts?
There are 88.74 Males per 100 Females in Harts.
What is the Ratio of Females per 100 Males in Harts?
There are 112.68 Females per 100 Males in Harts.
What is the Median Population Age in Harts?
Median Population Age in Harts is 53.0 Years.
What is the Average Family Size in Harts
Average Family Size in Harts is 4.2 People.
What is the Average Household Size in Harts
Average Household Size in Harts is 3.2 People.
How Large is the Labor Force in Harts?
There are 95 People in the Labor Forcein in Harts.
What is the Percentage of People in the Labor Force in Harts?
30.0% of People are in the Labor Force in Harts.