Krotz Springs, LA Map & Demographics
Krotz Springs Map
Krotz Springs Overview
$29,053
PER CAPITA INCOME
$41,033
AVG HOUSEHOLD INCOME
46.9%
WAGE / INCOME GAP [ % ]
53.1¢/ $1
WAGE / INCOME GAP [ $ ]
0.59
INEQUALITY / GINI INDEX
915
TOTAL POPULATION
440
MALE POPULATION
475
FEMALE POPULATION
92.63
MALES / 100 FEMALES
107.95
FEMALES / 100 MALES
35.5
MEDIAN AGE
3.1
AVG FAMILY SIZE
2.6
AVG HOUSEHOLD SIZE
328
LABOR FORCE [ PEOPLE ]
47.7%
PERCENT IN LABOR FORCE
13.4%
UNEMPLOYMENT RATE
Krotz Springs Zip Codes
Krotz Springs Area Codes
Income in Krotz Springs
Income Overview in Krotz Springs
| Characteristic | Number | Measure |
| Per Capita Income | 915 | $29,053 |
| Median Family Income | 240 | $0 |
| Mean Family Income | 240 | $82,666 |
| Median Household Income | 353 | $41,033 |
| Mean Household Income | 353 | $75,096 |
| Income Deficit | 240 | $0 |
| Wage / Income Gap (%) | 915 | 46.88% |
| Wage / Income Gap ($) | 915 | 53.12¢ per $1 |
| Gini / Inequality Index | 915 | 0.59 |
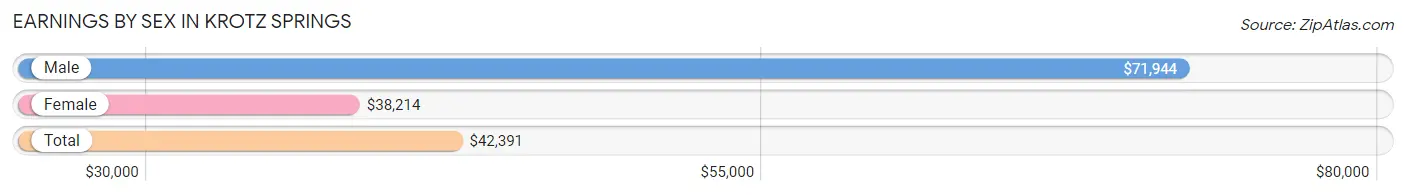
Earnings by Sex in Krotz Springs
Average Earnings in Krotz Springs are $42,391, $71,944 for men and $38,214 for women, a difference of 46.9%.
| Sex | Number | Average Earnings |
| Male | 176 (57.9%) | $71,944 |
| Female | 128 (42.1%) | $38,214 |
| Total | 304 (100.0%) | $42,391 |
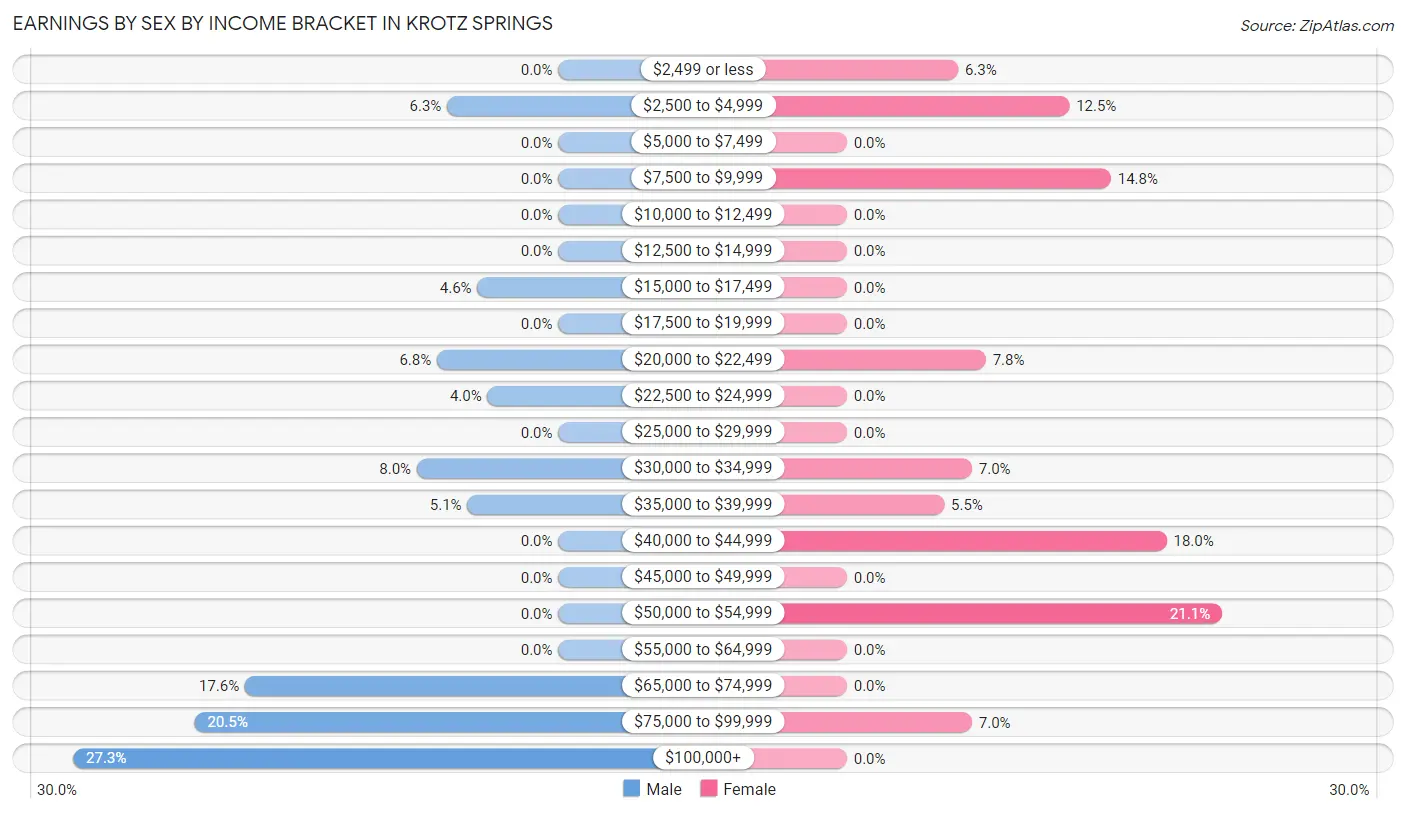
Earnings by Sex by Income Bracket in Krotz Springs
The most common earnings brackets in Krotz Springs are $100,000+ for men (48 | 27.3%) and $50,000 to $54,999 for women (27 | 21.1%).
| Income | Male | Female |
| $2,499 or less | 0 (0.0%) | 8 (6.2%) |
| $2,500 to $4,999 | 11 (6.2%) | 16 (12.5%) |
| $5,000 to $7,499 | 0 (0.0%) | 0 (0.0%) |
| $7,500 to $9,999 | 0 (0.0%) | 19 (14.8%) |
| $10,000 to $12,499 | 0 (0.0%) | 0 (0.0%) |
| $12,500 to $14,999 | 0 (0.0%) | 0 (0.0%) |
| $15,000 to $17,499 | 8 (4.5%) | 0 (0.0%) |
| $17,500 to $19,999 | 0 (0.0%) | 0 (0.0%) |
| $20,000 to $22,499 | 12 (6.8%) | 10 (7.8%) |
| $22,500 to $24,999 | 7 (4.0%) | 0 (0.0%) |
| $25,000 to $29,999 | 0 (0.0%) | 0 (0.0%) |
| $30,000 to $34,999 | 14 (8.0%) | 9 (7.0%) |
| $35,000 to $39,999 | 9 (5.1%) | 7 (5.5%) |
| $40,000 to $44,999 | 0 (0.0%) | 23 (18.0%) |
| $45,000 to $49,999 | 0 (0.0%) | 0 (0.0%) |
| $50,000 to $54,999 | 0 (0.0%) | 27 (21.1%) |
| $55,000 to $64,999 | 0 (0.0%) | 0 (0.0%) |
| $65,000 to $74,999 | 31 (17.6%) | 0 (0.0%) |
| $75,000 to $99,999 | 36 (20.4%) | 9 (7.0%) |
| $100,000+ | 48 (27.3%) | 0 (0.0%) |
| Total | 176 (100.0%) | 128 (100.0%) |
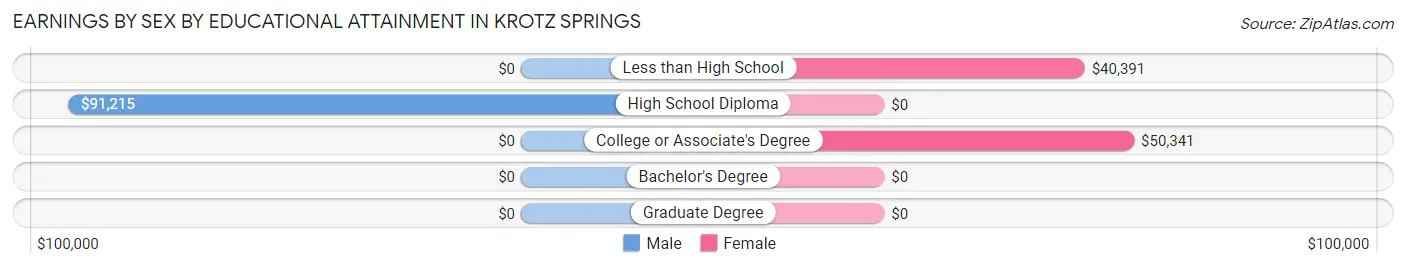
Earnings by Sex by Educational Attainment in Krotz Springs
Average earnings in Krotz Springs are $90,590 for men and $40,326 for women, a difference of 55.5%. Men with an educational attainment of high school diploma enjoy the highest average annual earnings of $91,215, while those with high school diploma education earn the least with $91,215. Women with an educational attainment of college or associate's degree earn the most with the average annual earnings of $50,341, while those with less than high school education have the smallest earnings of $40,391.
| Educational Attainment | Male Income | Female Income |
| Less than High School | - | - |
| High School Diploma | $91,215 | $0 |
| College or Associate's Degree | - | - |
| Bachelor's Degree | - | - |
| Graduate Degree | - | - |
| Total | $90,590 | $40,326 |
Family Income in Krotz Springs
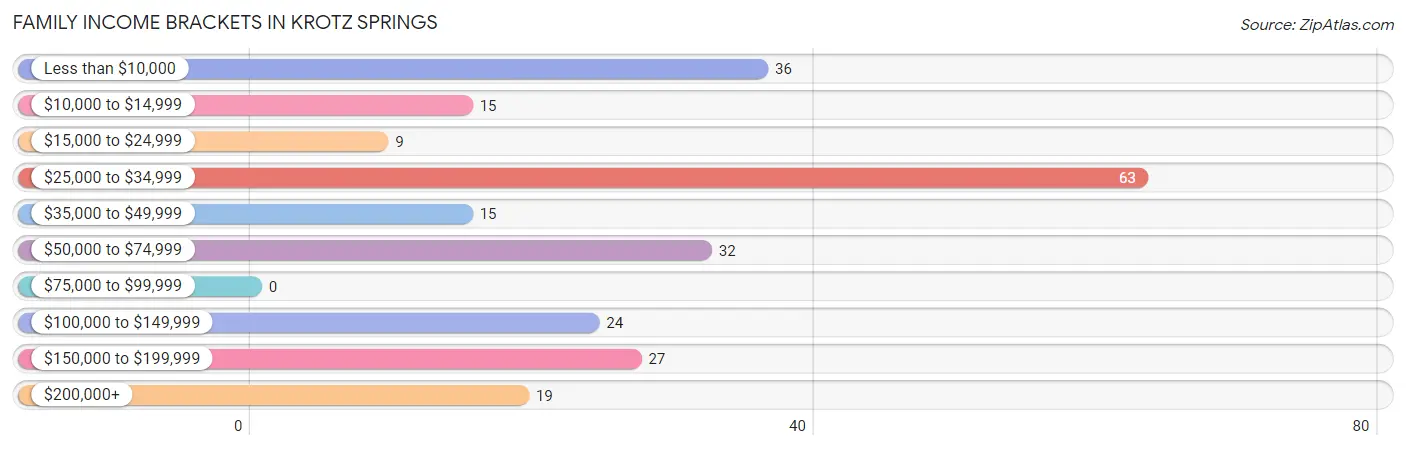
Family Income Brackets in Krotz Springs
According to the Krotz Springs family income data, there are 63 families falling into the $25,000 to $34,999 income range, which is the most common income bracket and makes up 26.3% of all families.
| Income Bracket | # Families | % Families |
| Less than $10,000 | 36 | 15.0% |
| $10,000 to $14,999 | 15 | 6.3% |
| $15,000 to $24,999 | 9 | 3.8% |
| $25,000 to $34,999 | 63 | 26.3% |
| $35,000 to $49,999 | 15 | 6.3% |
| $50,000 to $74,999 | 32 | 13.3% |
| $75,000 to $99,999 | 0 | 0.0% |
| $100,000 to $149,999 | 24 | 10.0% |
| $150,000 to $199,999 | 27 | 11.3% |
| $200,000+ | 19 | 7.9% |
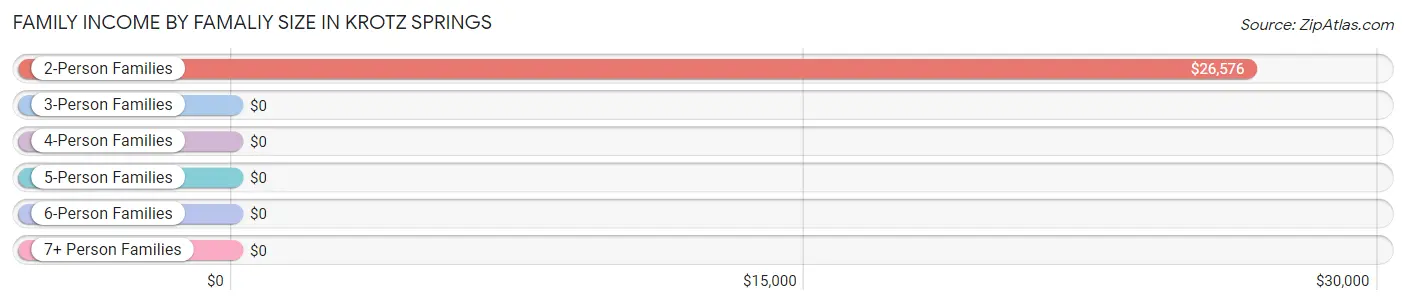
Family Income by Famaliy Size in Krotz Springs
2-person families (108 | 45.0%) account for the highest median family income in Krotz Springs with $26,576 per family, while 2-person families (108 | 45.0%) have the highest median income of $13,288 per family member.
| Income Bracket | # Families | Median Income |
| 2-Person Families | 108 (45.0%) | $26,576 |
| 3-Person Families | 54 (22.5%) | $0 |
| 4-Person Families | 44 (18.3%) | $0 |
| 5-Person Families | 34 (14.2%) | $0 |
| 6-Person Families | 0 (0.0%) | $0 |
| 7+ Person Families | 0 (0.0%) | $0 |
| Total | 240 (100.0%) | $0 |
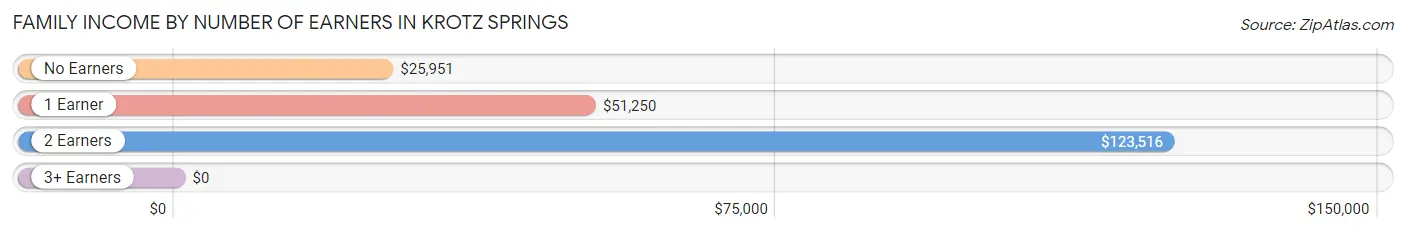
Family Income by Number of Earners in Krotz Springs
| Number of Earners | # Families | Median Income |
| No Earners | 103 (42.9%) | $25,951 |
| 1 Earner | 84 (35.0%) | $51,250 |
| 2 Earners | 33 (13.8%) | $123,516 |
| 3+ Earners | 20 (8.3%) | $0 |
| Total | 240 (100.0%) | $0 |
Household Income in Krotz Springs
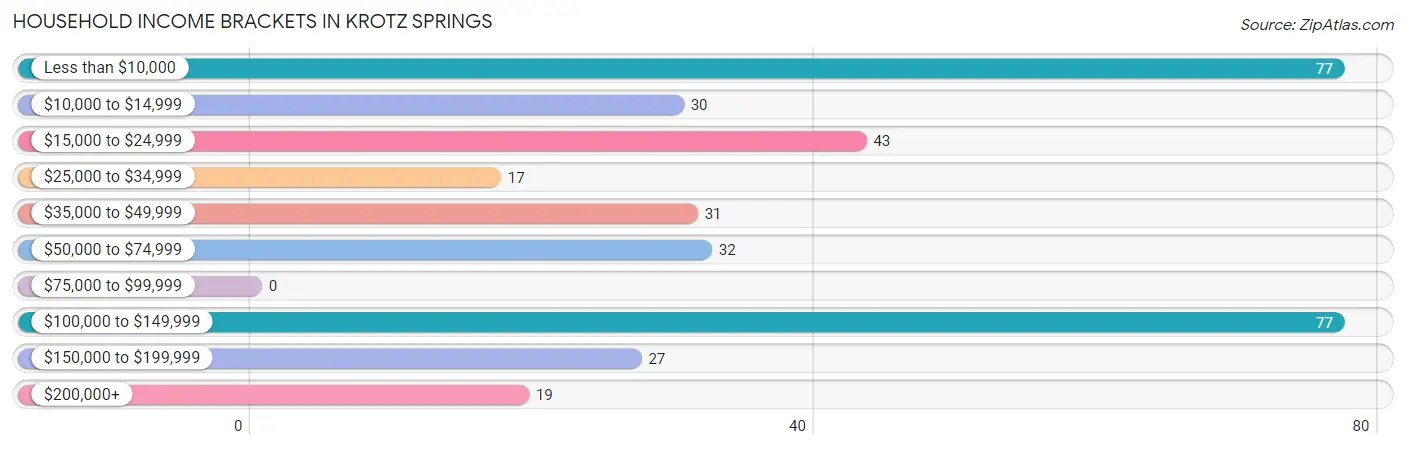
Household Income Brackets in Krotz Springs
With 77 households falling in the category, the less than $10,000 income range is the most frequent in Krotz Springs, accounting for 21.8% of all households.
| Income Bracket | # Households | % Households |
| Less than $10,000 | 77 | 21.8% |
| $10,000 to $14,999 | 30 | 8.5% |
| $15,000 to $24,999 | 43 | 12.2% |
| $25,000 to $34,999 | 17 | 4.8% |
| $35,000 to $49,999 | 31 | 8.8% |
| $50,000 to $74,999 | 32 | 9.1% |
| $75,000 to $99,999 | 0 | 0.0% |
| $100,000 to $149,999 | 77 | 21.8% |
| $150,000 to $199,999 | 27 | 7.6% |
| $200,000+ | 19 | 5.4% |
Household Income by Householder Age in Krotz Springs
The median household income in Krotz Springs is $41,033, with the highest median household income of $115,380 found in the 45 to 64 years age bracket for the primary householder. A total of 130 households (36.8%) fall into this category. Meanwhile, the 15 to 24 years age bracket for the primary householder has the lowest median household income of $0, with 9 households (2.5%) in this group.
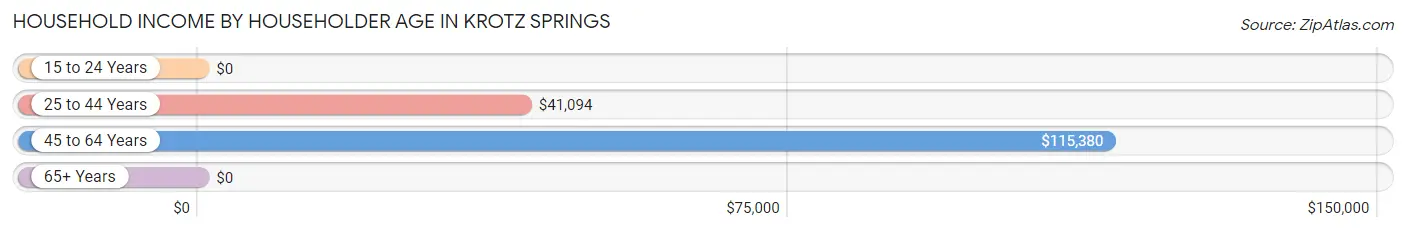
| Income Bracket | # Households | Median Income |
| 15 to 24 Years | 9 (2.5%) | $0 |
| 25 to 44 Years | 140 (39.7%) | $41,094 |
| 45 to 64 Years | 130 (36.8%) | $115,380 |
| 65+ Years | 74 (21.0%) | $0 |
| Total | 353 (100.0%) | $41,033 |
Poverty in Krotz Springs
Income Below Poverty by Sex and Age in Krotz Springs
With 31.1% poverty level for males and 32.0% for females among the residents of Krotz Springs, under 5 year old males and 5 year old females are the most vulnerable to poverty, with 35 males (100.0%) and 19 females (100.0%) in their respective age groups living below the poverty level.
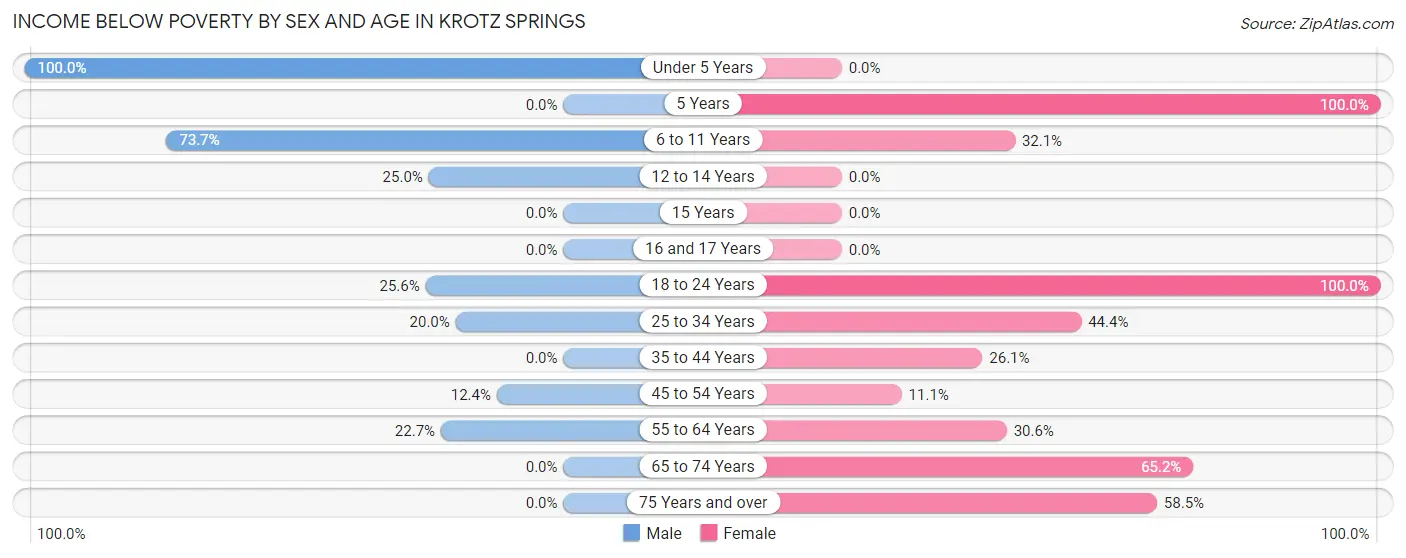
| Age Bracket | Male | Female |
| Under 5 Years | 35 (100.0%) | 0 (0.0%) |
| 5 Years | 0 (0.0%) | 19 (100.0%) |
| 6 to 11 Years | 42 (73.7%) | 9 (32.1%) |
| 12 to 14 Years | 10 (25.0%) | 0 (0.0%) |
| 15 Years | 0 (0.0%) | 0 (0.0%) |
| 16 and 17 Years | 0 (0.0%) | 0 (0.0%) |
| 18 to 24 Years | 11 (25.6%) | 9 (100.0%) |
| 25 to 34 Years | 13 (20.0%) | 28 (44.4%) |
| 35 to 44 Years | 0 (0.0%) | 18 (26.1%) |
| 45 to 54 Years | 11 (12.4%) | 8 (11.1%) |
| 55 to 64 Years | 15 (22.7%) | 15 (30.6%) |
| 65 to 74 Years | 0 (0.0%) | 15 (65.2%) |
| 75 Years and over | 0 (0.0%) | 31 (58.5%) |
| Total | 137 (31.1%) | 152 (32.0%) |
Income Above Poverty by Sex and Age in Krotz Springs
According to the poverty statistics in Krotz Springs, males aged 35 to 44 years and females aged under 5 years are the age groups that are most secure financially, with 100.0% of males and 100.0% of females in these age groups living above the poverty line.
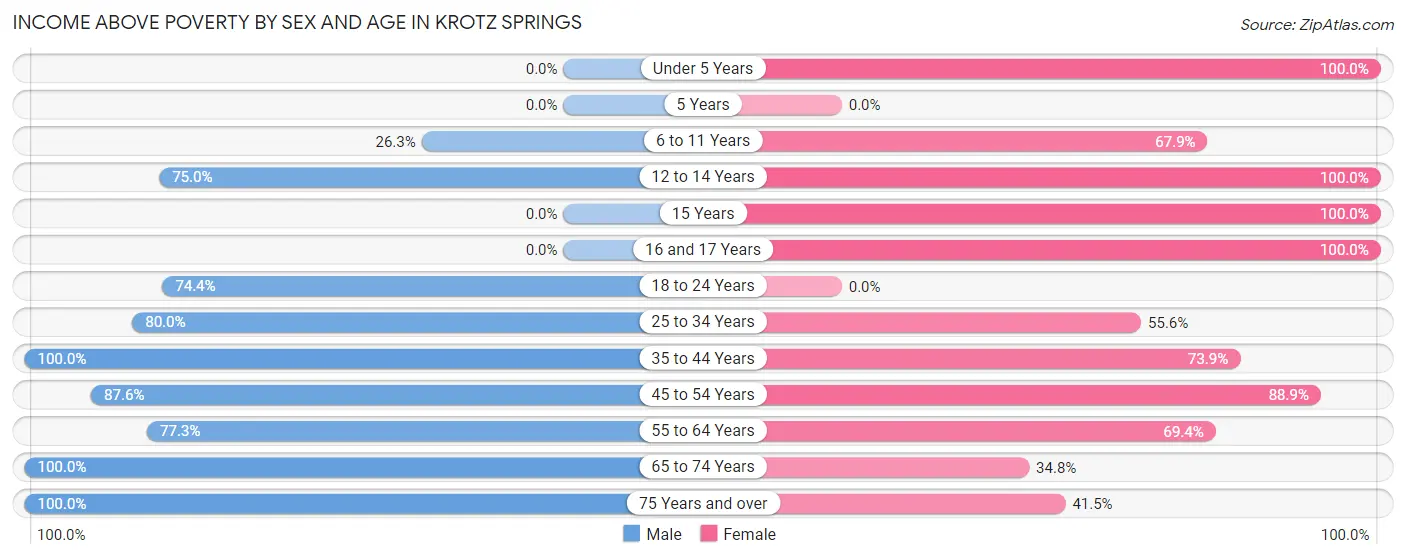
| Age Bracket | Male | Female |
| Under 5 Years | 0 (0.0%) | 6 (100.0%) |
| 5 Years | 0 (0.0%) | 0 (0.0%) |
| 6 to 11 Years | 15 (26.3%) | 19 (67.9%) |
| 12 to 14 Years | 30 (75.0%) | 10 (100.0%) |
| 15 Years | 0 (0.0%) | 33 (100.0%) |
| 16 and 17 Years | 0 (0.0%) | 41 (100.0%) |
| 18 to 24 Years | 32 (74.4%) | 0 (0.0%) |
| 25 to 34 Years | 52 (80.0%) | 35 (55.6%) |
| 35 to 44 Years | 8 (100.0%) | 51 (73.9%) |
| 45 to 54 Years | 78 (87.6%) | 64 (88.9%) |
| 55 to 64 Years | 51 (77.3%) | 34 (69.4%) |
| 65 to 74 Years | 12 (100.0%) | 8 (34.8%) |
| 75 Years and over | 25 (100.0%) | 22 (41.5%) |
| Total | 303 (68.9%) | 323 (68.0%) |
Income Below Poverty Among Married-Couple Families in Krotz Springs
The poverty statistics for married-couple families in Krotz Springs show that 13.3% or 17 of the total 128 families live below the poverty line. Families with 1 or 2 children have the highest poverty rate of 14.5%, comprising of 9 families. On the other hand, families with no children have the lowest poverty rate of 12.1%, which includes 8 families.
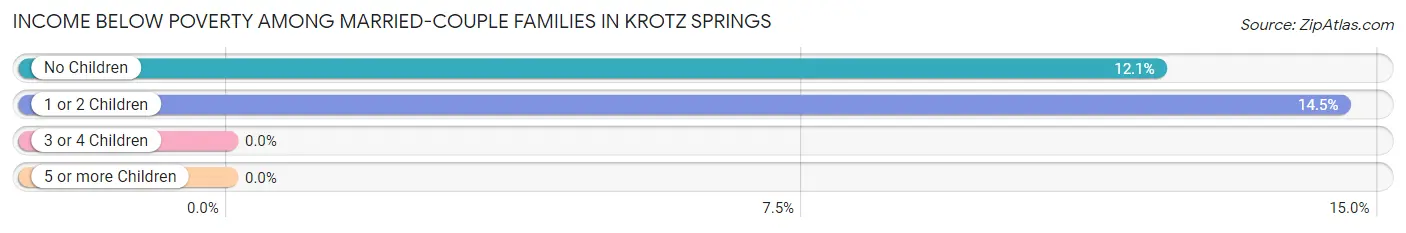
| Children | Above Poverty | Below Poverty |
| No Children | 58 (87.9%) | 8 (12.1%) |
| 1 or 2 Children | 53 (85.5%) | 9 (14.5%) |
| 3 or 4 Children | 0 (0.0%) | 0 (0.0%) |
| 5 or more Children | 0 (0.0%) | 0 (0.0%) |
| Total | 111 (86.7%) | 17 (13.3%) |
Income Below Poverty Among Single-Parent Households in Krotz Springs
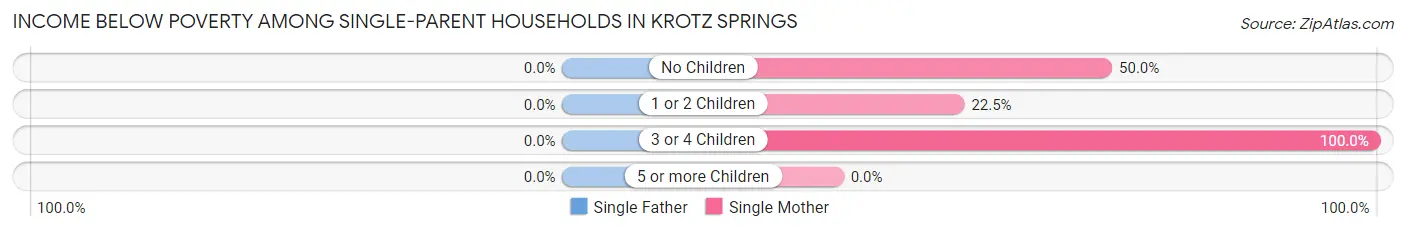
| Children | Single Father | Single Mother |
| No Children | 0 (0.0%) | 7 (50.0%) |
| 1 or 2 Children | 0 (0.0%) | 18 (22.5%) |
| 3 or 4 Children | 0 (0.0%) | 18 (100.0%) |
| 5 or more Children | 0 (0.0%) | 0 (0.0%) |
| Total | 0 (0.0%) | 43 (38.4%) |
Income Below Poverty Among Married-Couple vs Single-Parent Households in Krotz Springs
The poverty data for Krotz Springs shows that 17 of the married-couple family households (13.3%) and 43 of the single-parent households (38.4%) are living below the poverty level. Within the married-couple family households, those with 1 or 2 children have the highest poverty rate, with 9 households (14.5%) falling below the poverty line. Among the single-parent households, those with 3 or 4 children have the highest poverty rate, with 18 household (100.0%) living below poverty.
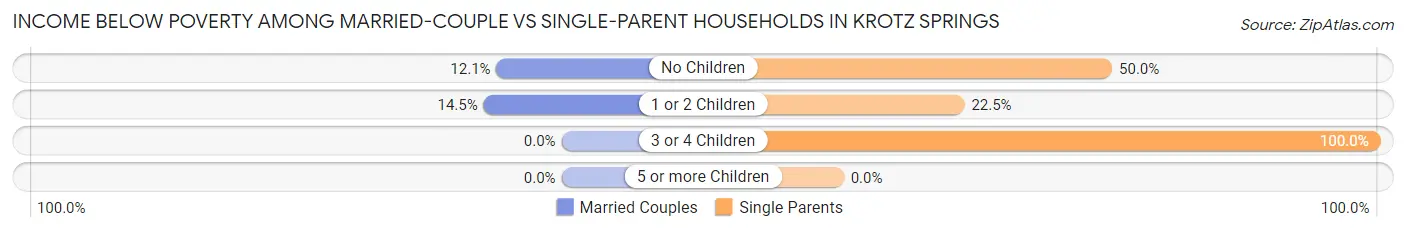
| Children | Married-Couple Families | Single-Parent Households |
| No Children | 8 (12.1%) | 7 (50.0%) |
| 1 or 2 Children | 9 (14.5%) | 18 (22.5%) |
| 3 or 4 Children | 0 (0.0%) | 18 (100.0%) |
| 5 or more Children | 0 (0.0%) | 0 (0.0%) |
| Total | 17 (13.3%) | 43 (38.4%) |
Race in Krotz Springs
The most populous races in Krotz Springs are White / Caucasian (887 | 96.9%), and Two or more Races (28 | 3.1%).
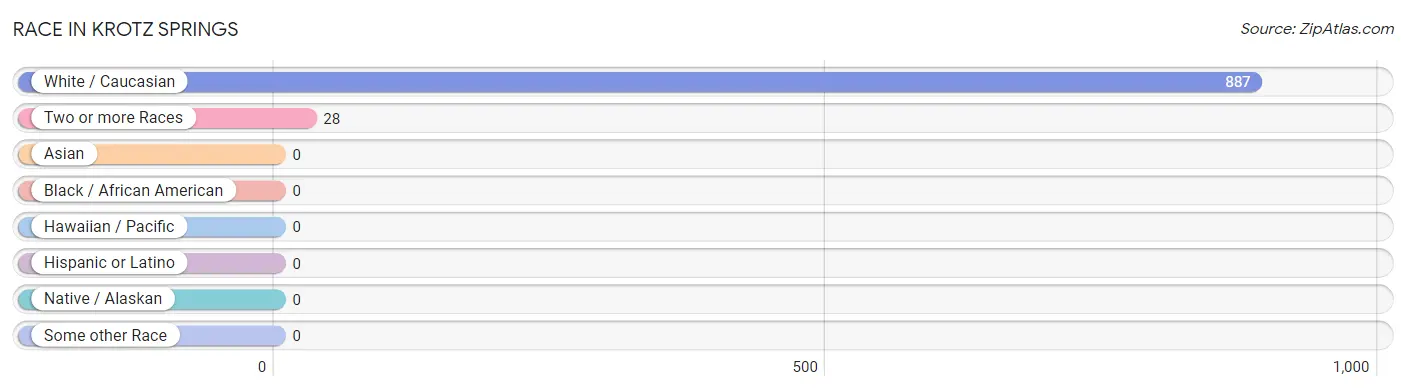
| Race | # Population | % Population |
| Asian | 0 | 0.0% |
| Black / African American | 0 | 0.0% |
| Hawaiian / Pacific | 0 | 0.0% |
| Hispanic or Latino | 0 | 0.0% |
| Native / Alaskan | 0 | 0.0% |
| White / Caucasian | 887 | 96.9% |
| Two or more Races | 28 | 3.1% |
| Some other Race | 0 | 0.0% |
| Total | 915 | 100.0% |
Ancestry in Krotz Springs
The most populous ancestries reported in Krotz Springs are French Canadian (507 | 55.4%), English (102 | 11.2%), Irish (77 | 8.4%), French (60 | 6.6%), and American (50 | 5.5%), together accounting for 87.0% of all Krotz Springs residents.
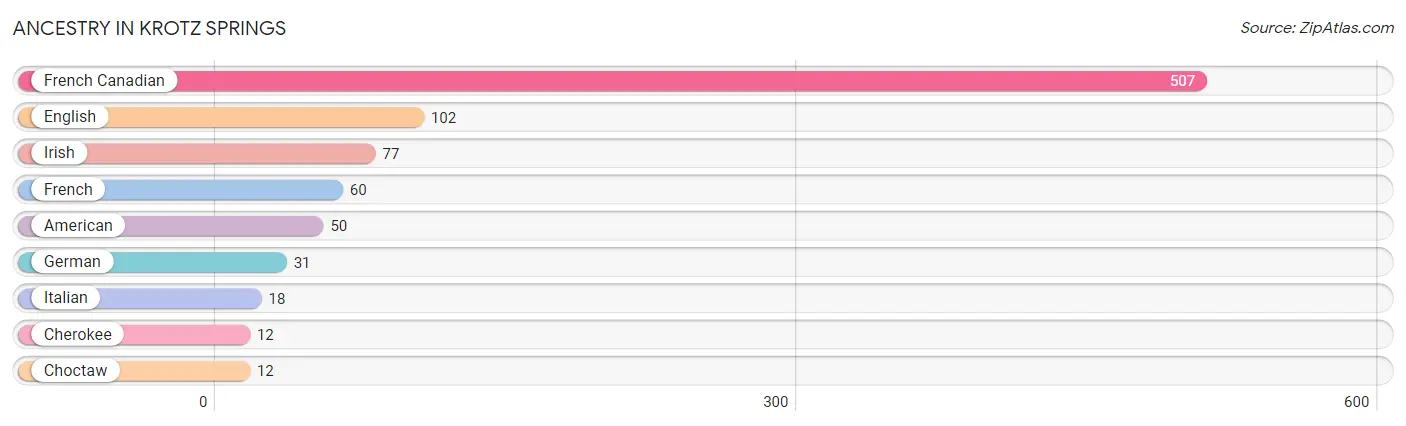
| Ancestry | # Population | % Population |
| American | 50 | 5.5% |
| Cherokee | 12 | 1.3% |
| Choctaw | 12 | 1.3% |
| English | 102 | 11.2% |
| French | 60 | 6.6% |
| French Canadian | 507 | 55.4% |
| German | 31 | 3.4% |
| Irish | 77 | 8.4% |
| Italian | 18 | 2.0% | View All 9 Rows |
Immigrants in Krotz Springs

| Immigration Origin | # Population | % Population | View All 0 Rows |
Sex and Age in Krotz Springs
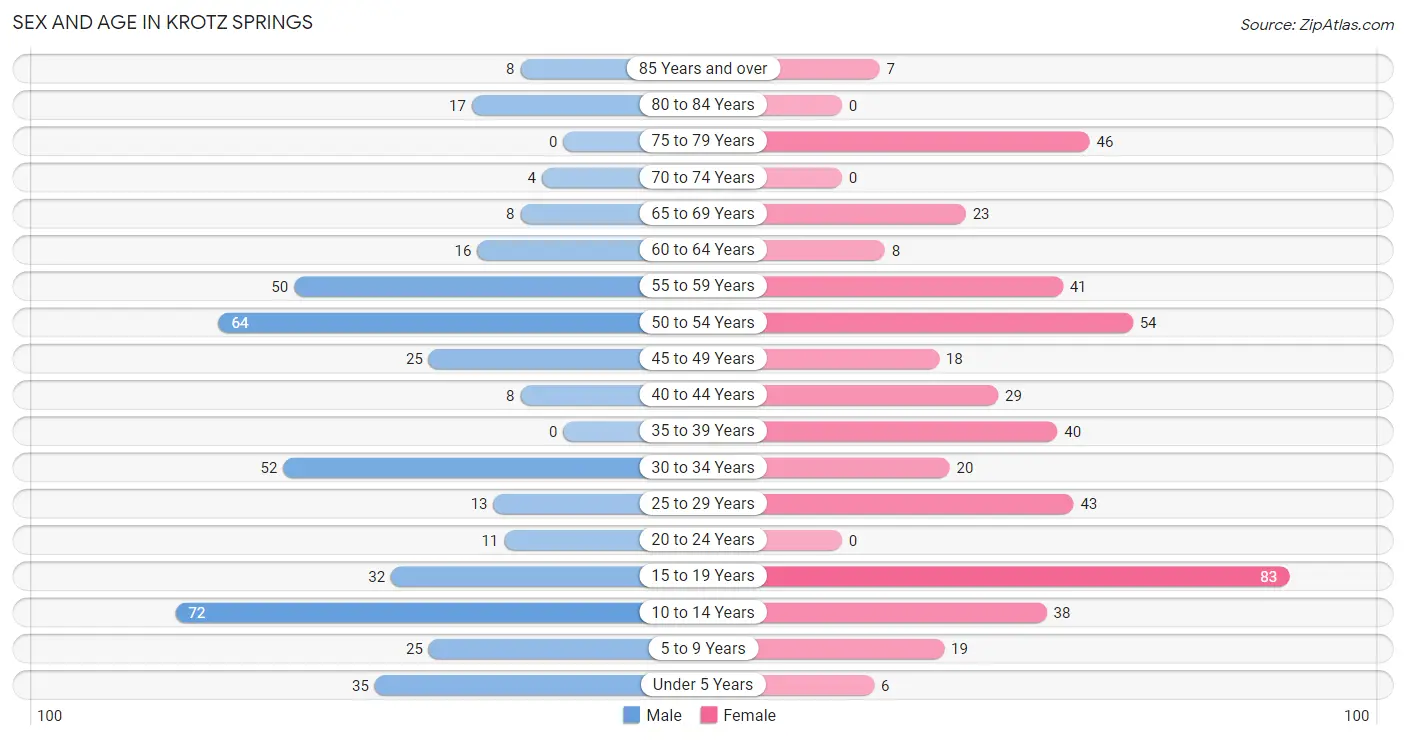
Sex and Age in Krotz Springs
The most populous age groups in Krotz Springs are 10 to 14 Years (72 | 16.4%) for men and 15 to 19 Years (83 | 17.5%) for women.
| Age Bracket | Male | Female |
| Under 5 Years | 35 (8.0%) | 6 (1.3%) |
| 5 to 9 Years | 25 (5.7%) | 19 (4.0%) |
| 10 to 14 Years | 72 (16.4%) | 38 (8.0%) |
| 15 to 19 Years | 32 (7.3%) | 83 (17.5%) |
| 20 to 24 Years | 11 (2.5%) | 0 (0.0%) |
| 25 to 29 Years | 13 (2.9%) | 43 (9.0%) |
| 30 to 34 Years | 52 (11.8%) | 20 (4.2%) |
| 35 to 39 Years | 0 (0.0%) | 40 (8.4%) |
| 40 to 44 Years | 8 (1.8%) | 29 (6.1%) |
| 45 to 49 Years | 25 (5.7%) | 18 (3.8%) |
| 50 to 54 Years | 64 (14.5%) | 54 (11.4%) |
| 55 to 59 Years | 50 (11.4%) | 41 (8.6%) |
| 60 to 64 Years | 16 (3.6%) | 8 (1.7%) |
| 65 to 69 Years | 8 (1.8%) | 23 (4.8%) |
| 70 to 74 Years | 4 (0.9%) | 0 (0.0%) |
| 75 to 79 Years | 0 (0.0%) | 46 (9.7%) |
| 80 to 84 Years | 17 (3.9%) | 0 (0.0%) |
| 85 Years and over | 8 (1.8%) | 7 (1.5%) |
| Total | 440 (100.0%) | 475 (100.0%) |
Families and Households in Krotz Springs
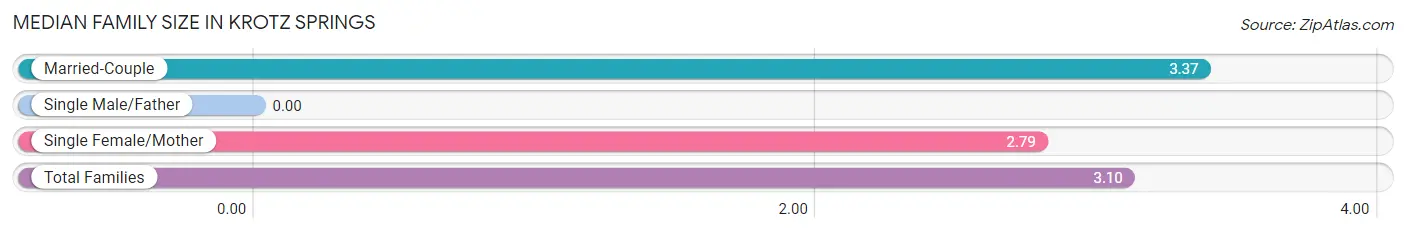
Median Family Size in Krotz Springs
| Family Type | # Families | Family Size |
| Married-Couple | 128 (53.3%) | 3.37 |
| Single Male/Father | 0 (0.0%) | - |
| Single Female/Mother | 112 (46.7%) | 2.79 |
| Total Families | 240 (100.0%) | 3.10 |
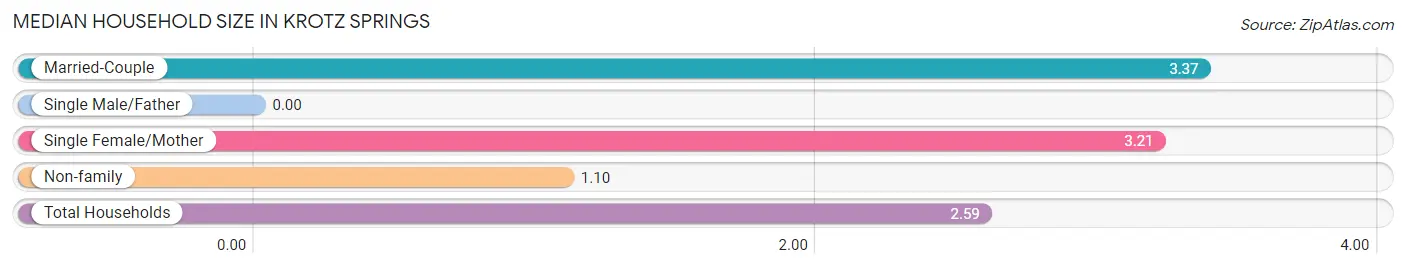
Median Household Size in Krotz Springs
| Household Type | # Households | Household Size |
| Married-Couple | 128 (36.3%) | 3.37 |
| Single Male/Father | 0 (0.0%) | - |
| Single Female/Mother | 112 (31.7%) | 3.21 |
| Non-family | 113 (32.0%) | 1.10 |
| Total Households | 353 (100.0%) | 2.59 |
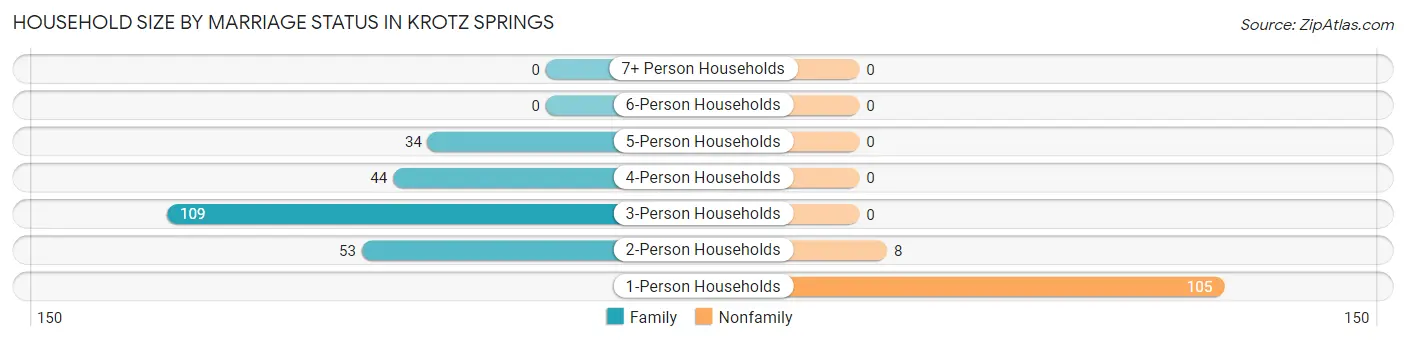
Household Size by Marriage Status in Krotz Springs
Out of a total of 353 households in Krotz Springs, 240 (68.0%) are family households, while 113 (32.0%) are nonfamily households. The most numerous type of family households are 3-person households, comprising 109, and the most common type of nonfamily households are 1-person households, comprising 105.
| Household Size | Family Households | Nonfamily Households |
| 1-Person Households | - | 105 (29.7%) |
| 2-Person Households | 53 (15.0%) | 8 (2.3%) |
| 3-Person Households | 109 (30.9%) | 0 (0.0%) |
| 4-Person Households | 44 (12.5%) | 0 (0.0%) |
| 5-Person Households | 34 (9.6%) | 0 (0.0%) |
| 6-Person Households | 0 (0.0%) | 0 (0.0%) |
| 7+ Person Households | 0 (0.0%) | 0 (0.0%) |
| Total | 240 (68.0%) | 113 (32.0%) |
Female Fertility in Krotz Springs
Fertility by Age in Krotz Springs
Average fertility rate in Krotz Springs is 57.0 births per 1,000 women. Women in the age bracket of 15 to 19 years have the highest fertility rate with 108.0 births per 1,000 women. Women in the age bracket of 15 to 19 years acount for 56.2% of all women with births.
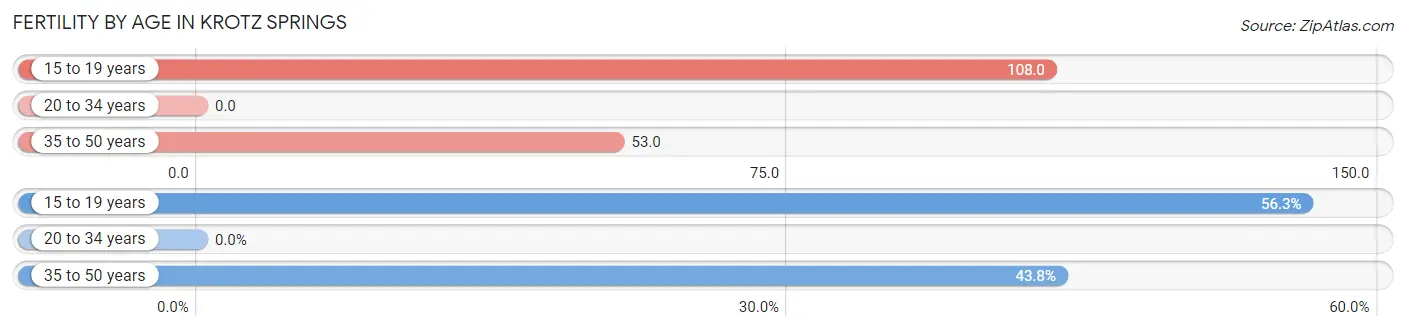
| Age Bracket | Women with Births | Births / 1,000 Women |
| 15 to 19 years | 9 (56.2%) | 108.0 |
| 20 to 34 years | 0 (0.0%) | 0.0 |
| 35 to 50 years | 7 (43.8%) | 53.0 |
| Total | 16 (100.0%) | 57.0 |
Fertility by Age by Marriage Status in Krotz Springs
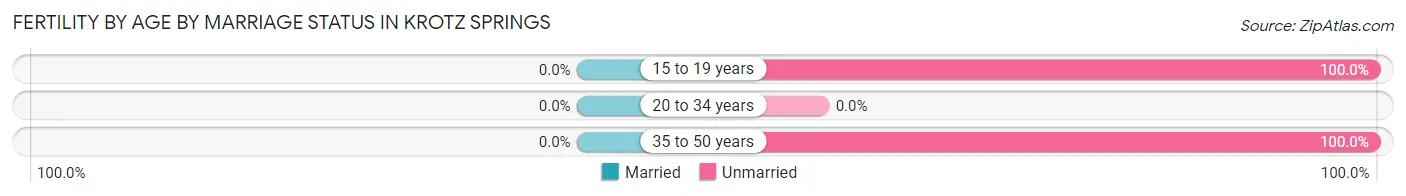
| Age Bracket | Married | Unmarried |
| 15 to 19 years | 0 (0.0%) | 9 (100.0%) |
| 20 to 34 years | 0 (0.0%) | 0 (0.0%) |
| 35 to 50 years | 0 (0.0%) | 7 (100.0%) |
| Total | 0 (0.0%) | 16 (100.0%) |
Fertility by Education in Krotz Springs
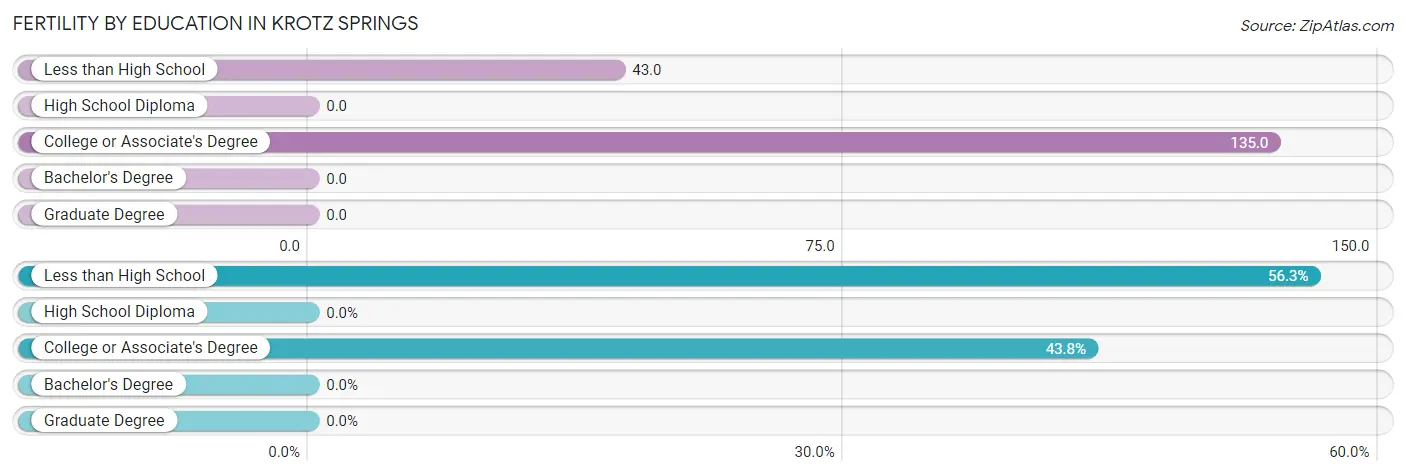
| Educational Attainment | Women with Births | Births / 1,000 Women |
| Less than High School | 9 (56.2%) | 43.0 |
| High School Diploma | 0 (0.0%) | 0.0 |
| College or Associate's Degree | 7 (43.8%) | 135.0 |
| Bachelor's Degree | 0 (0.0%) | 0.0 |
| Graduate Degree | 0 (0.0%) | 0.0 |
| Total | 16 (100.0%) | 57.0 |
Fertility by Education by Marriage Status in Krotz Springs
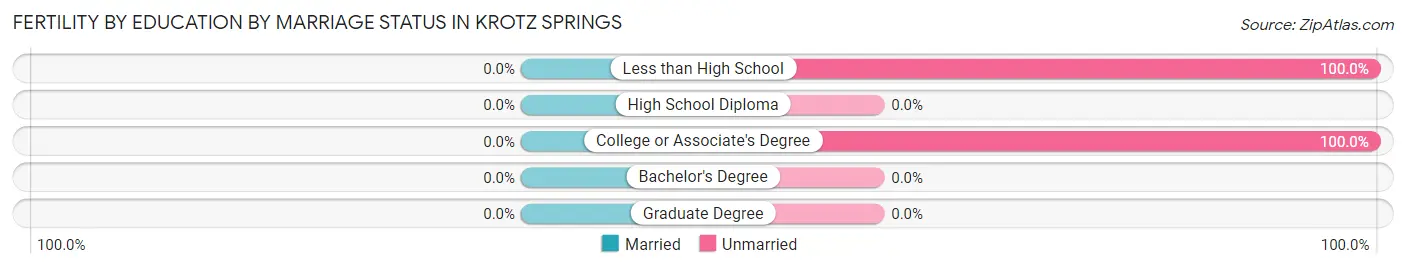
| Educational Attainment | Married | Unmarried |
| Less than High School | 0 (0.0%) | 9 (100.0%) |
| High School Diploma | 0 (0.0%) | 0 (0.0%) |
| College or Associate's Degree | 0 (0.0%) | 7 (100.0%) |
| Bachelor's Degree | 0 (0.0%) | 0 (0.0%) |
| Graduate Degree | 0 (0.0%) | 0 (0.0%) |
| Total | 0 (0.0%) | 16 (100.0%) |
Employment Characteristics in Krotz Springs
Employment by Class of Employer in Krotz Springs
Among the 284 employed individuals in Krotz Springs, private company employees (260 | 91.5%), local government employees (17 | 6.0%), and state government employees (7 | 2.5%) make up the most common classes of employment.
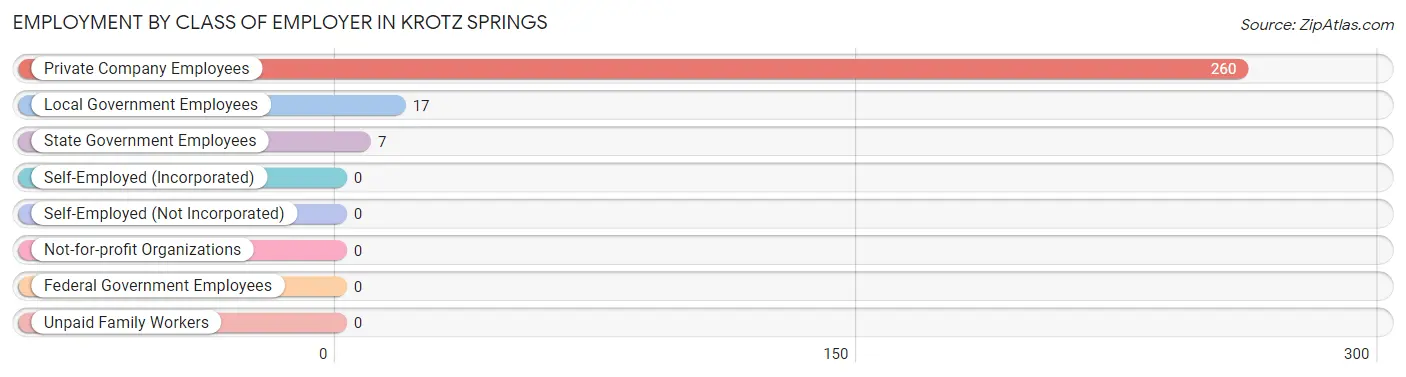
| Employer Class | # Employees | % Employees |
| Private Company Employees | 260 | 91.5% |
| Self-Employed (Incorporated) | 0 | 0.0% |
| Self-Employed (Not Incorporated) | 0 | 0.0% |
| Not-for-profit Organizations | 0 | 0.0% |
| Local Government Employees | 17 | 6.0% |
| State Government Employees | 7 | 2.5% |
| Federal Government Employees | 0 | 0.0% |
| Unpaid Family Workers | 0 | 0.0% |
| Total | 284 | 100.0% |
Employment Status by Age in Krotz Springs
According to the labor force statistics for Krotz Springs, out of the total population over 16 years of age (687), 47.7% or 328 individuals are in the labor force, with 13.4% or 44 of them unemployed. The age group with the highest labor force participation rate is 20 to 24 years, with 100.0% or 11 individuals in the labor force. Within the labor force, the 60 to 64 years age range has the highest percentage of unemployed individuals, with 100.0% or 8 of them being unemployed.
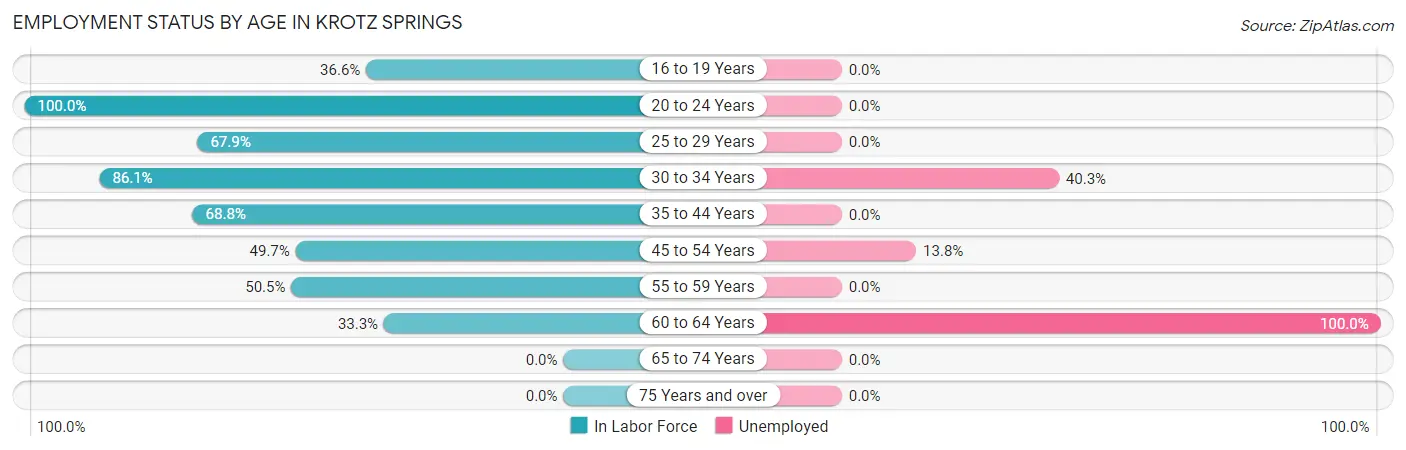
| Age Bracket | In Labor Force | Unemployed |
| 16 to 19 Years | 30 (36.6%) | 0 (0.0%) |
| 20 to 24 Years | 11 (100.0%) | 0 (0.0%) |
| 25 to 29 Years | 38 (67.9%) | 0 (0.0%) |
| 30 to 34 Years | 62 (86.1%) | 25 (40.3%) |
| 35 to 44 Years | 53 (68.8%) | 0 (0.0%) |
| 45 to 54 Years | 80 (49.7%) | 11 (13.8%) |
| 55 to 59 Years | 46 (50.5%) | 0 (0.0%) |
| 60 to 64 Years | 8 (33.3%) | 8 (100.0%) |
| 65 to 74 Years | 0 (0.0%) | 0 (0.0%) |
| 75 Years and over | 0 (0.0%) | 0 (0.0%) |
| Total | 328 (47.7%) | 44 (13.4%) |
Employment Status by Educational Attainment in Krotz Springs
According to labor force statistics for Krotz Springs, 59.7% of individuals (287) out of the total population between 25 and 64 years of age (481) are in the labor force, with 15.3% or 44 of them being unemployed. The group with the highest labor force participation rate are those with the educational attainment of high school diploma, with 93.4% or 128 individuals in the labor force. Within the labor force, individuals with less than high school education have the highest percentage of unemployment, with 19.7% or 13 of them being unemployed.
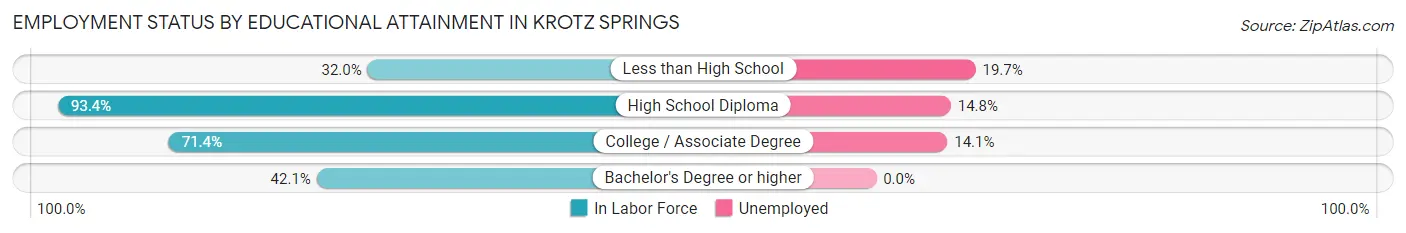
| Educational Attainment | In Labor Force | Unemployed |
| Less than High School | 66 (32.0%) | 41 (19.7%) |
| High School Diploma | 128 (93.4%) | 20 (14.8%) |
| College / Associate Degree | 85 (71.4%) | 17 (14.1%) |
| Bachelor's Degree or higher | 8 (42.1%) | 0 (0.0%) |
| Total | 287 (59.7%) | 74 (15.3%) |
Employment Occupations by Sex in Krotz Springs
Management, Business, Science and Arts Occupations
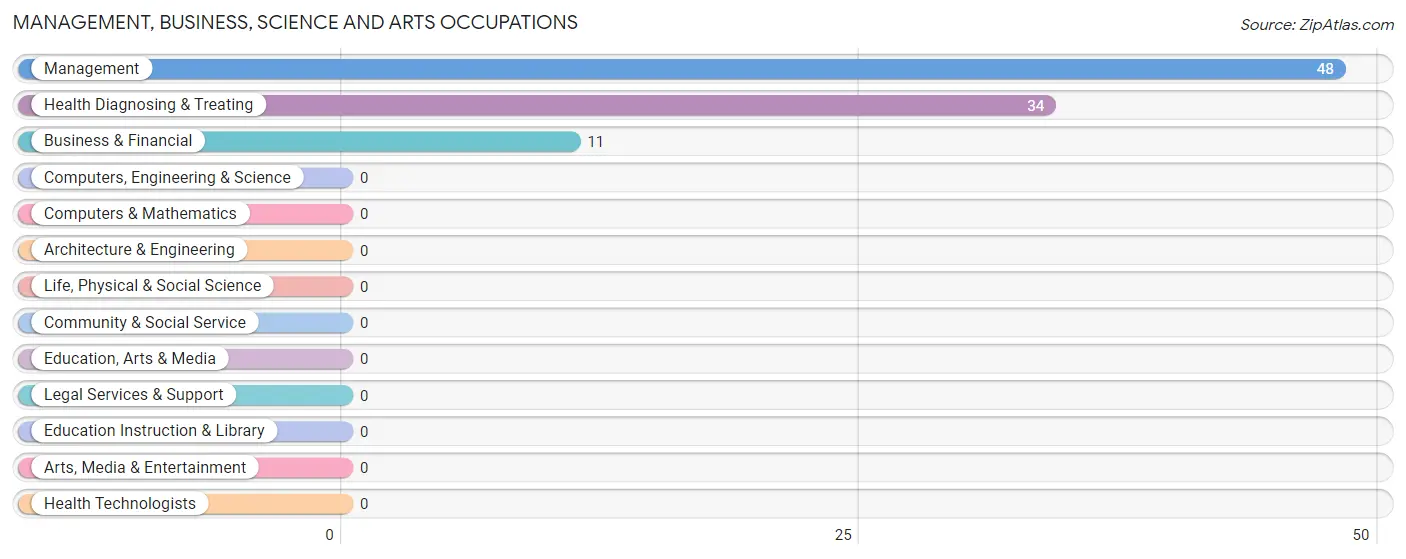
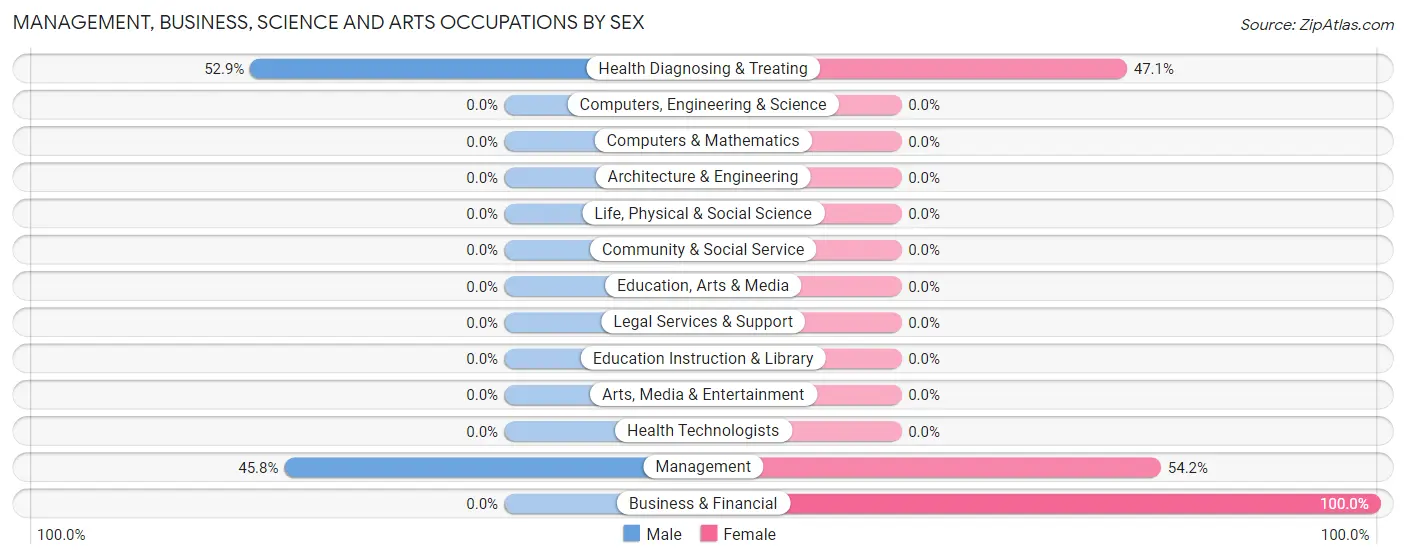
The most common Management, Business, Science and Arts occupations in Krotz Springs are Management (48 | 16.9%), Health Diagnosing & Treating (34 | 12.0%), and Business & Financial (11 | 3.9%).
Management, Business, Science and Arts Occupations by Sex
Within the Management, Business, Science and Arts occupations in Krotz Springs, the most male-oriented occupations are Health Diagnosing & Treating (52.9%), and Management (45.8%), while the most female-oriented occupations are Business & Financial (100.0%), Management (54.2%), and Health Diagnosing & Treating (47.1%).
| Occupation | Male | Female |
| Management | 22 (45.8%) | 26 (54.2%) |
| Business & Financial | 0 (0.0%) | 11 (100.0%) |
| Computers, Engineering & Science | 0 (0.0%) | 0 (0.0%) |
| Computers & Mathematics | 0 (0.0%) | 0 (0.0%) |
| Architecture & Engineering | 0 (0.0%) | 0 (0.0%) |
| Life, Physical & Social Science | 0 (0.0%) | 0 (0.0%) |
| Community & Social Service | 0 (0.0%) | 0 (0.0%) |
| Education, Arts & Media | 0 (0.0%) | 0 (0.0%) |
| Legal Services & Support | 0 (0.0%) | 0 (0.0%) |
| Education Instruction & Library | 0 (0.0%) | 0 (0.0%) |
| Arts, Media & Entertainment | 0 (0.0%) | 0 (0.0%) |
| Health Diagnosing & Treating | 18 (52.9%) | 16 (47.1%) |
| Health Technologists | 0 (0.0%) | 0 (0.0%) |
| Total (Category) | 40 (43.0%) | 53 (57.0%) |
| Total (Overall) | 164 (57.8%) | 120 (42.2%) |
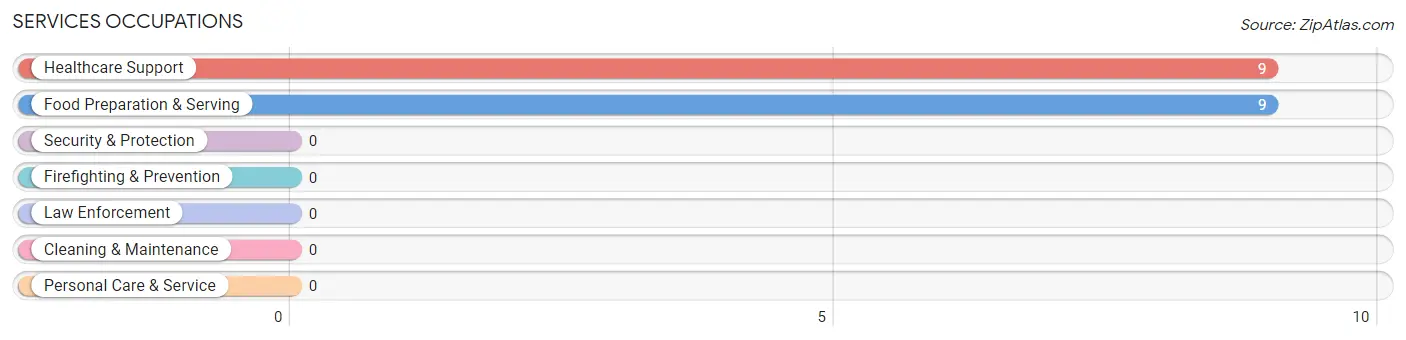
Services Occupations
The most common Services occupations in Krotz Springs are Healthcare Support (9 | 3.2%), and Food Preparation & Serving (9 | 3.2%).
Services Occupations by Sex
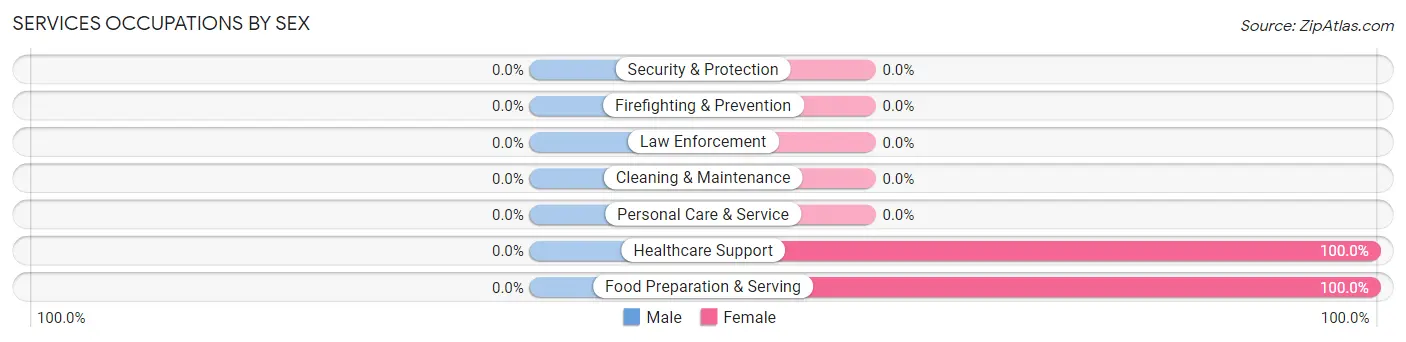
| Occupation | Male | Female |
| Healthcare Support | 0 (0.0%) | 9 (100.0%) |
| Security & Protection | 0 (0.0%) | 0 (0.0%) |
| Firefighting & Prevention | 0 (0.0%) | 0 (0.0%) |
| Law Enforcement | 0 (0.0%) | 0 (0.0%) |
| Food Preparation & Serving | 0 (0.0%) | 9 (100.0%) |
| Cleaning & Maintenance | 0 (0.0%) | 0 (0.0%) |
| Personal Care & Service | 0 (0.0%) | 0 (0.0%) |
| Total (Category) | 0 (0.0%) | 18 (100.0%) |
| Total (Overall) | 164 (57.8%) | 120 (42.2%) |
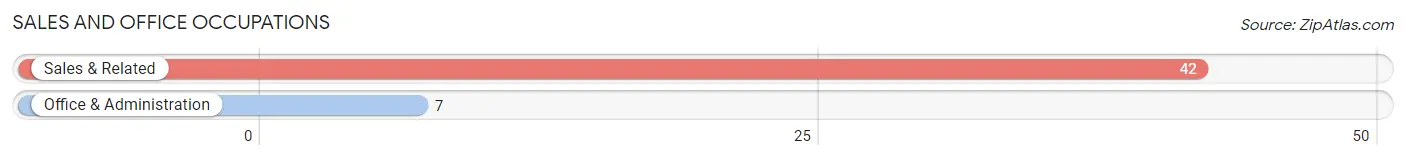
Sales and Office Occupations
The most common Sales and Office occupations in Krotz Springs are Sales & Related (42 | 14.8%), and Office & Administration (7 | 2.5%).
Sales and Office Occupations by Sex
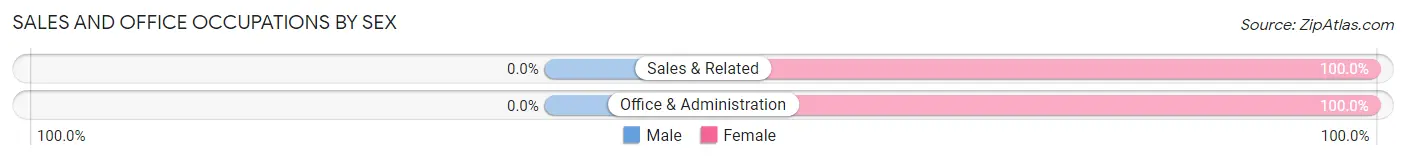
| Occupation | Male | Female |
| Sales & Related | 0 (0.0%) | 42 (100.0%) |
| Office & Administration | 0 (0.0%) | 7 (100.0%) |
| Total (Category) | 0 (0.0%) | 49 (100.0%) |
| Total (Overall) | 164 (57.8%) | 120 (42.2%) |
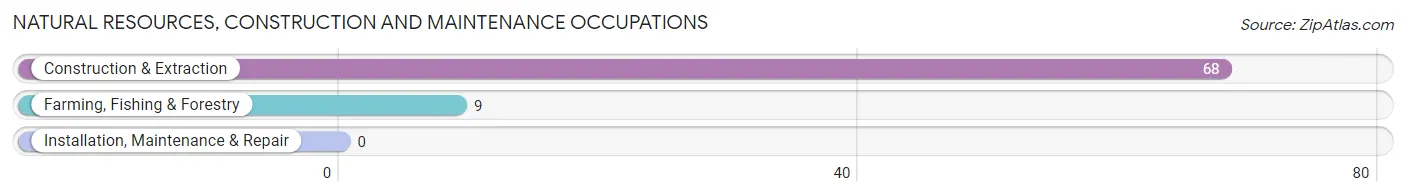
Natural Resources, Construction and Maintenance Occupations
The most common Natural Resources, Construction and Maintenance occupations in Krotz Springs are Construction & Extraction (68 | 23.9%), and Farming, Fishing & Forestry (9 | 3.2%).
Natural Resources, Construction and Maintenance Occupations by Sex
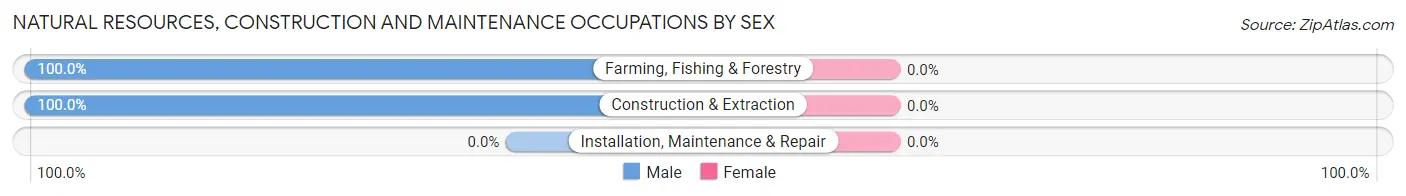
| Occupation | Male | Female |
| Farming, Fishing & Forestry | 9 (100.0%) | 0 (0.0%) |
| Construction & Extraction | 68 (100.0%) | 0 (0.0%) |
| Installation, Maintenance & Repair | 0 (0.0%) | 0 (0.0%) |
| Total (Category) | 77 (100.0%) | 0 (0.0%) |
| Total (Overall) | 164 (57.8%) | 120 (42.2%) |
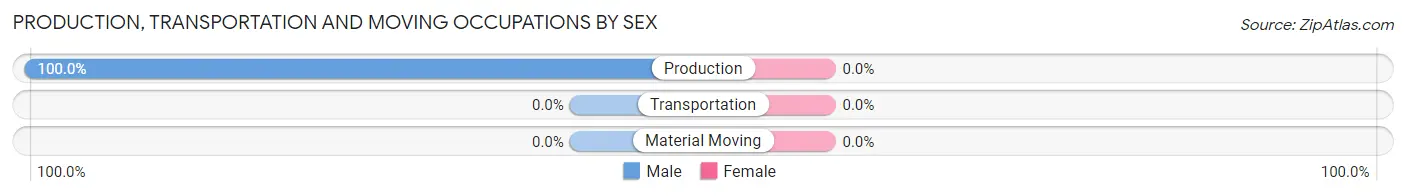
Production, Transportation and Moving Occupations
The most common Production, Transportation and Moving occupations in Krotz Springs are , and Production (47 | 16.6%).
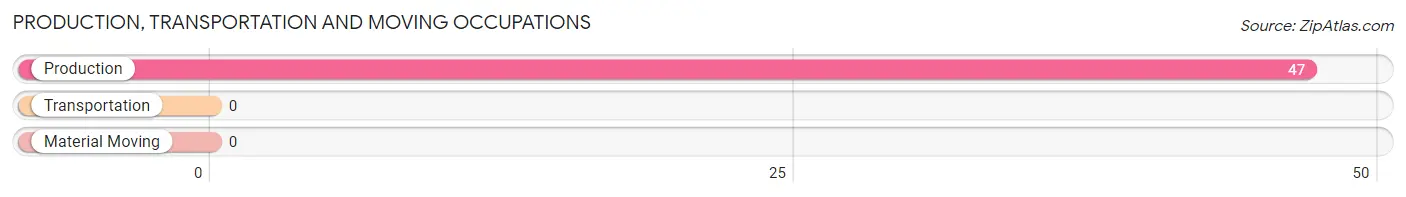
Production, Transportation and Moving Occupations by Sex
| Occupation | Male | Female |
| Production | 47 (100.0%) | 0 (0.0%) |
| Transportation | 0 (0.0%) | 0 (0.0%) |
| Material Moving | 0 (0.0%) | 0 (0.0%) |
| Total (Category) | 47 (100.0%) | 0 (0.0%) |
| Total (Overall) | 164 (57.8%) | 120 (42.2%) |
Employment Industries by Sex in Krotz Springs
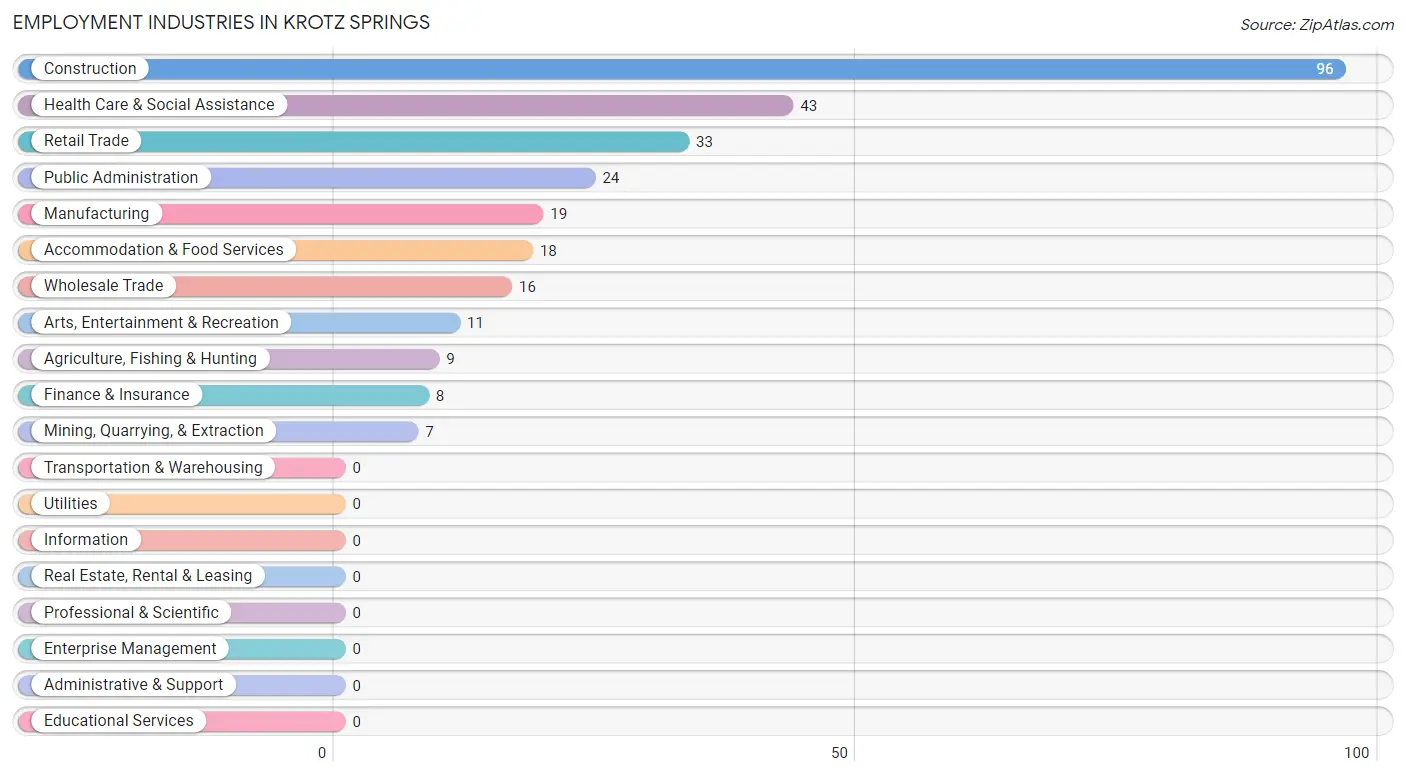
Employment Industries in Krotz Springs
The major employment industries in Krotz Springs include Construction (96 | 33.8%), Health Care & Social Assistance (43 | 15.1%), Retail Trade (33 | 11.6%), Public Administration (24 | 8.5%), and Manufacturing (19 | 6.7%).
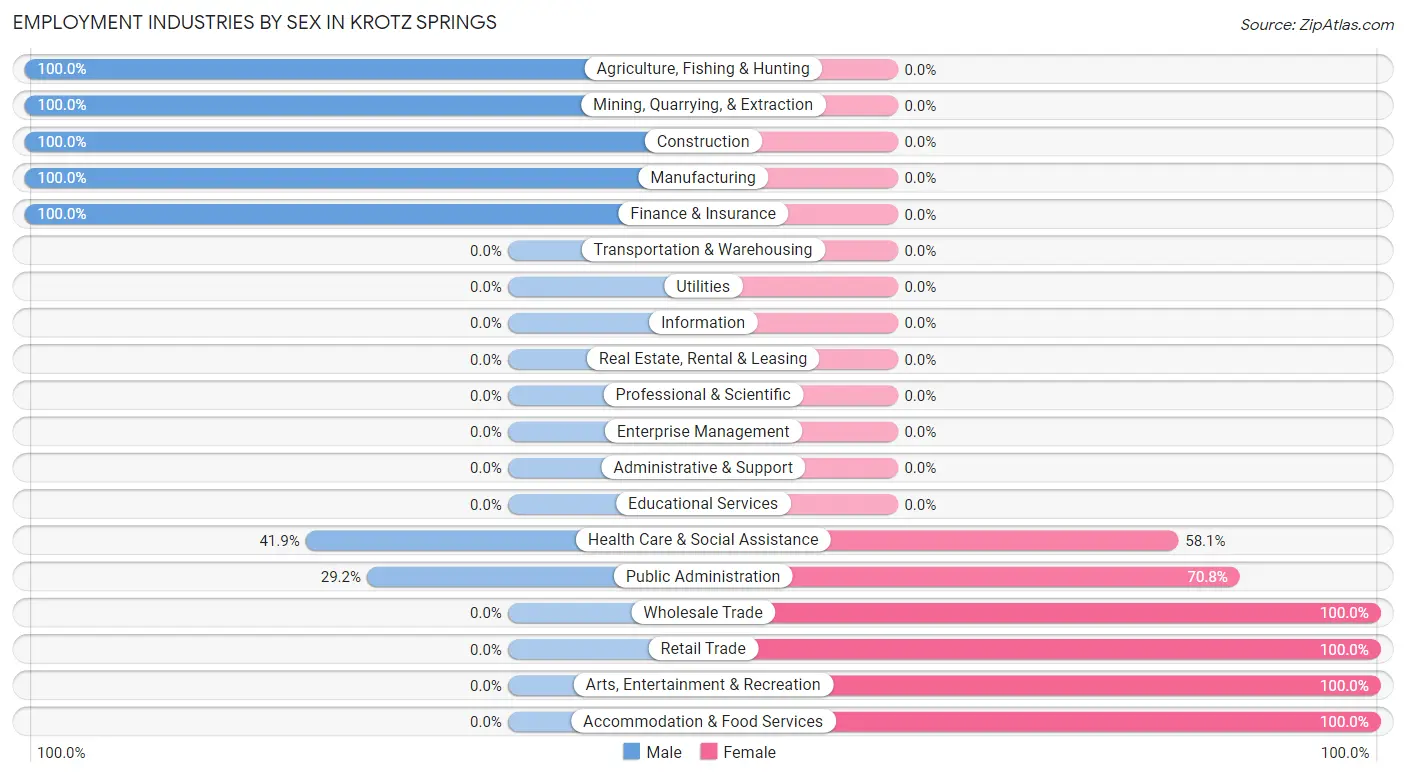
Employment Industries by Sex in Krotz Springs
The Krotz Springs industries that see more men than women are Agriculture, Fishing & Hunting (100.0%), Mining, Quarrying, & Extraction (100.0%), and Construction (100.0%), whereas the industries that tend to have a higher number of women are Wholesale Trade (100.0%), Retail Trade (100.0%), and Arts, Entertainment & Recreation (100.0%).
| Industry | Male | Female |
| Agriculture, Fishing & Hunting | 9 (100.0%) | 0 (0.0%) |
| Mining, Quarrying, & Extraction | 7 (100.0%) | 0 (0.0%) |
| Construction | 96 (100.0%) | 0 (0.0%) |
| Manufacturing | 19 (100.0%) | 0 (0.0%) |
| Wholesale Trade | 0 (0.0%) | 16 (100.0%) |
| Retail Trade | 0 (0.0%) | 33 (100.0%) |
| Transportation & Warehousing | 0 (0.0%) | 0 (0.0%) |
| Utilities | 0 (0.0%) | 0 (0.0%) |
| Information | 0 (0.0%) | 0 (0.0%) |
| Finance & Insurance | 8 (100.0%) | 0 (0.0%) |
| Real Estate, Rental & Leasing | 0 (0.0%) | 0 (0.0%) |
| Professional & Scientific | 0 (0.0%) | 0 (0.0%) |
| Enterprise Management | 0 (0.0%) | 0 (0.0%) |
| Administrative & Support | 0 (0.0%) | 0 (0.0%) |
| Educational Services | 0 (0.0%) | 0 (0.0%) |
| Health Care & Social Assistance | 18 (41.9%) | 25 (58.1%) |
| Arts, Entertainment & Recreation | 0 (0.0%) | 11 (100.0%) |
| Accommodation & Food Services | 0 (0.0%) | 18 (100.0%) |
| Public Administration | 7 (29.2%) | 17 (70.8%) |
| Total | 164 (57.8%) | 120 (42.2%) |
Education in Krotz Springs
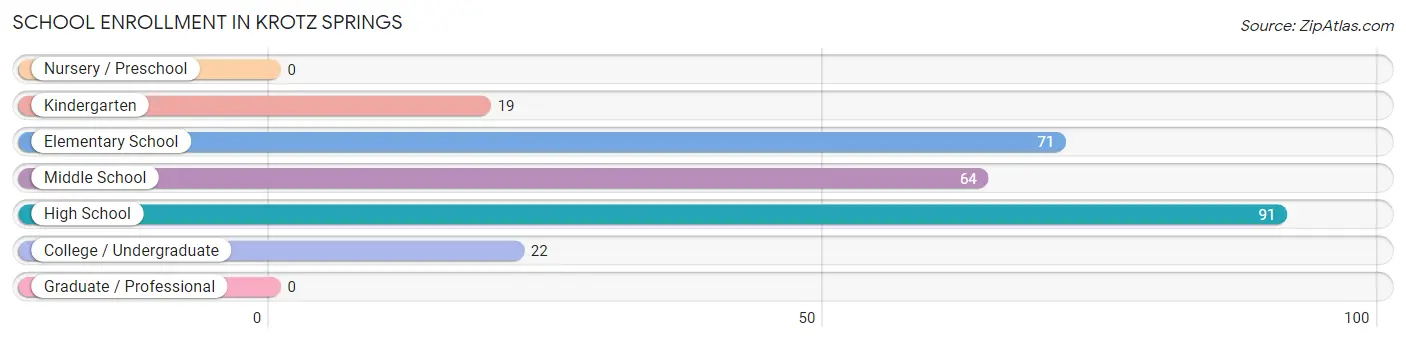
School Enrollment in Krotz Springs
The most common levels of schooling among the 267 students in Krotz Springs are high school (91 | 34.1%), elementary school (71 | 26.6%), and middle school (64 | 24.0%).
| School Level | # Students | % Students |
| Nursery / Preschool | 0 | 0.0% |
| Kindergarten | 19 | 7.1% |
| Elementary School | 71 | 26.6% |
| Middle School | 64 | 24.0% |
| High School | 91 | 34.1% |
| College / Undergraduate | 22 | 8.2% |
| Graduate / Professional | 0 | 0.0% |
| Total | 267 | 100.0% |
School Enrollment by Age by Funding Source in Krotz Springs
Out of a total of 267 students who are enrolled in schools in Krotz Springs, 28 (10.5%) attend a private institution, while the remaining 239 (89.5%) are enrolled in public schools. The age group of 18 to 19 year olds has the highest likelihood of being enrolled in private schools, with 9 (33.3% in the age bracket) enrolled. Conversely, the age group of 5 to 9 year old has the lowest likelihood of being enrolled in a private school, with 44 (100.0% in the age bracket) attending a public institution.
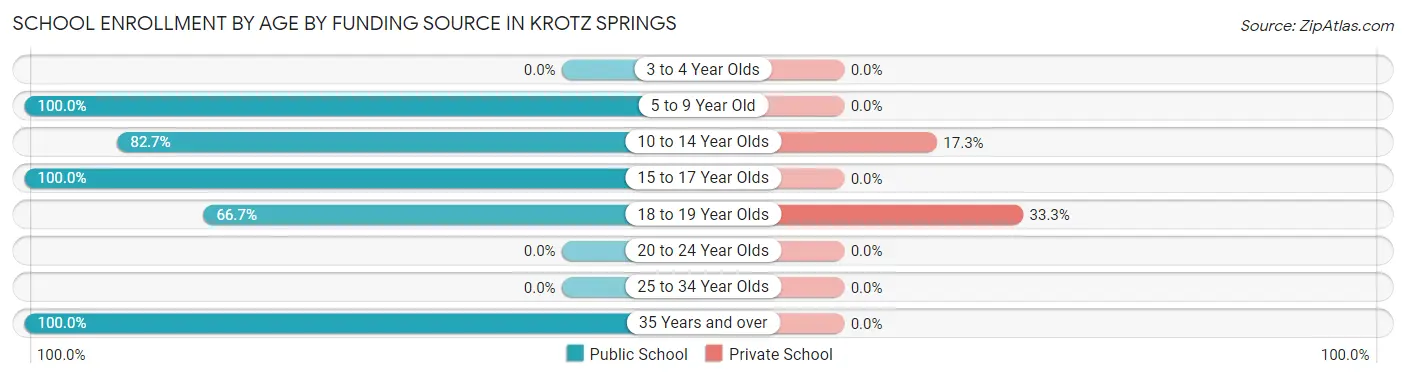
| Age Bracket | Public School | Private School |
| 3 to 4 Year Olds | 0 (0.0%) | 0 (0.0%) |
| 5 to 9 Year Old | 44 (100.0%) | 0 (0.0%) |
| 10 to 14 Year Olds | 91 (82.7%) | 19 (17.3%) |
| 15 to 17 Year Olds | 74 (100.0%) | 0 (0.0%) |
| 18 to 19 Year Olds | 18 (66.7%) | 9 (33.3%) |
| 20 to 24 Year Olds | 0 (0.0%) | 0 (0.0%) |
| 25 to 34 Year Olds | 0 (0.0%) | 0 (0.0%) |
| 35 Years and over | 12 (100.0%) | 0 (0.0%) |
| Total | 239 (89.5%) | 28 (10.5%) |
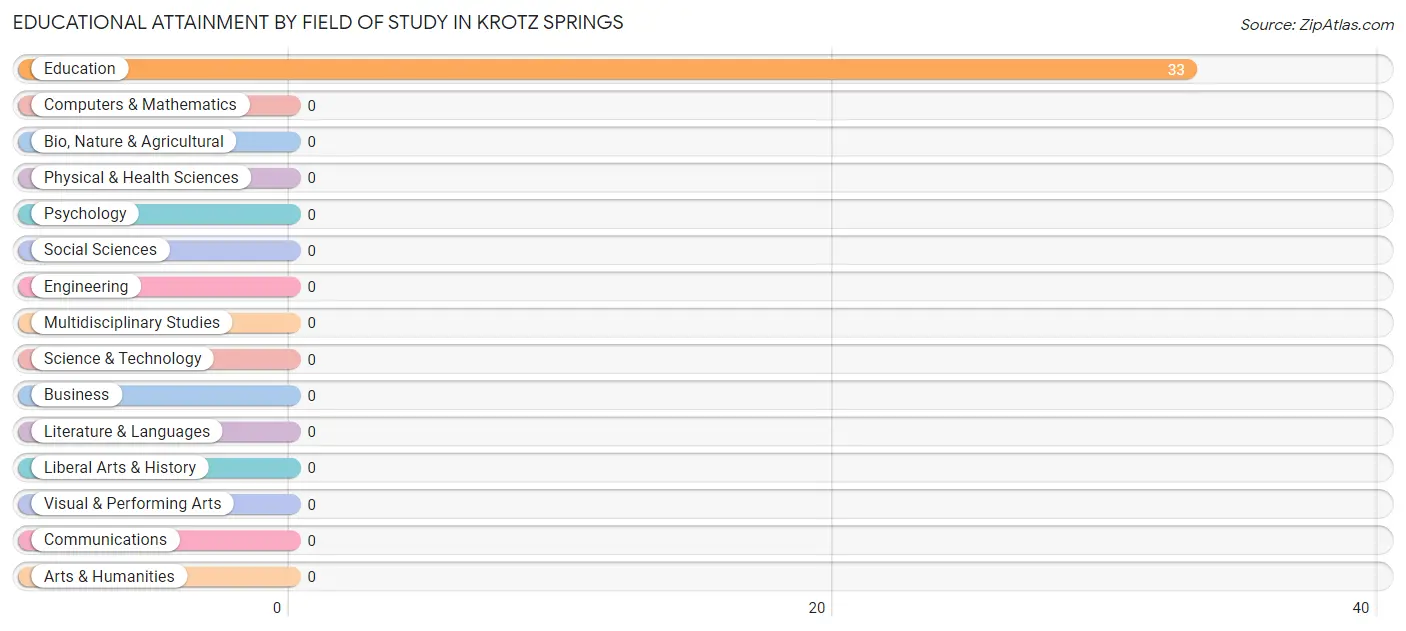
Educational Attainment by Field of Study in Krotz Springs
, and education (33 | 100.0%) are the most common fields of study among 33 individuals in Krotz Springs who have obtained a bachelor's degree or higher.
| Field of Study | # Graduates | % Graduates |
| Computers & Mathematics | 0 | 0.0% |
| Bio, Nature & Agricultural | 0 | 0.0% |
| Physical & Health Sciences | 0 | 0.0% |
| Psychology | 0 | 0.0% |
| Social Sciences | 0 | 0.0% |
| Engineering | 0 | 0.0% |
| Multidisciplinary Studies | 0 | 0.0% |
| Science & Technology | 0 | 0.0% |
| Business | 0 | 0.0% |
| Education | 33 | 100.0% |
| Literature & Languages | 0 | 0.0% |
| Liberal Arts & History | 0 | 0.0% |
| Visual & Performing Arts | 0 | 0.0% |
| Communications | 0 | 0.0% |
| Arts & Humanities | 0 | 0.0% |
| Total | 33 | 100.0% |
Transportation & Commute in Krotz Springs
Vehicle Availability by Sex in Krotz Springs
The most prevalent vehicle ownership categories in Krotz Springs are males with 2 vehicles (63, accounting for 38.4%) and females with 2 vehicles (33, making up 52.5%).
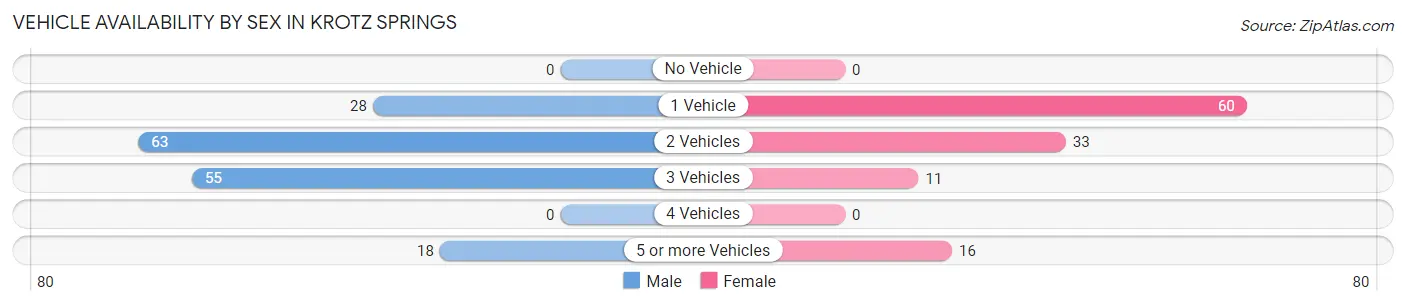
| Vehicles Available | Male | Female |
| No Vehicle | 0 (0.0%) | 0 (0.0%) |
| 1 Vehicle | 28 (17.1%) | 60 (50.0%) |
| 2 Vehicles | 63 (38.4%) | 33 (27.5%) |
| 3 Vehicles | 55 (33.5%) | 11 (9.2%) |
| 4 Vehicles | 0 (0.0%) | 0 (0.0%) |
| 5 or more Vehicles | 18 (11.0%) | 16 (13.3%) |
| Total | 164 (100.0%) | 120 (100.0%) |
Commute Time in Krotz Springs
The most frequently occuring commute durations in Krotz Springs are less than 5 minutes (48 commuters, 17.4%), 20 to 24 minutes (48 commuters, 17.4%), and 45 to 59 minutes (46 commuters, 16.7%).
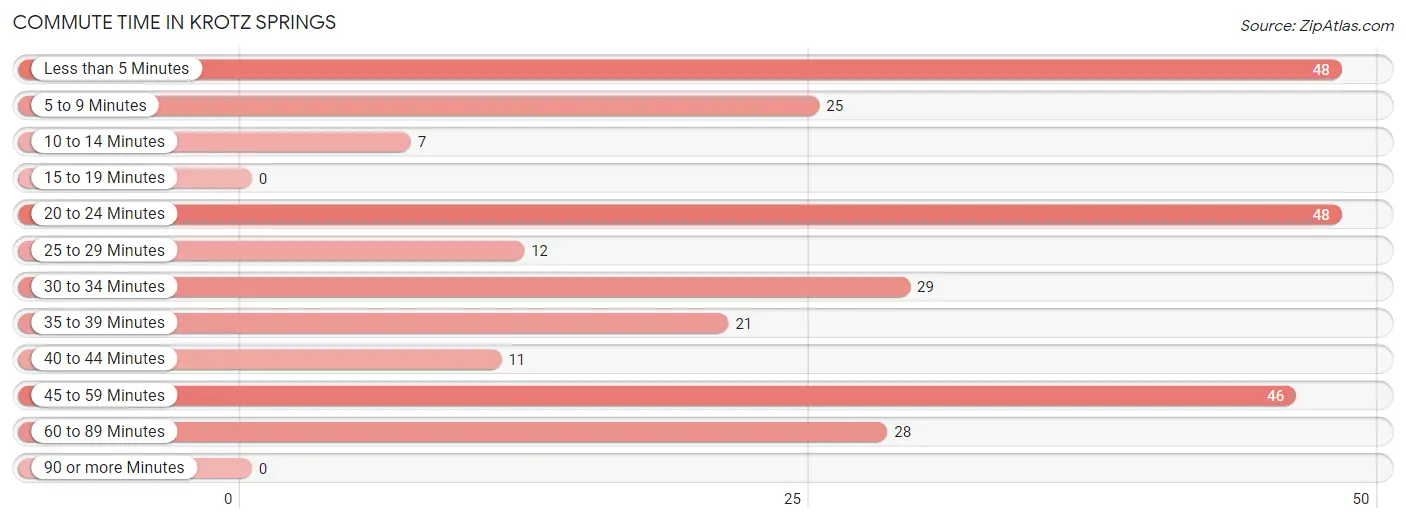
| Commute Time | # Commuters | % Commuters |
| Less than 5 Minutes | 48 | 17.4% |
| 5 to 9 Minutes | 25 | 9.1% |
| 10 to 14 Minutes | 7 | 2.5% |
| 15 to 19 Minutes | 0 | 0.0% |
| 20 to 24 Minutes | 48 | 17.4% |
| 25 to 29 Minutes | 12 | 4.4% |
| 30 to 34 Minutes | 29 | 10.5% |
| 35 to 39 Minutes | 21 | 7.6% |
| 40 to 44 Minutes | 11 | 4.0% |
| 45 to 59 Minutes | 46 | 16.7% |
| 60 to 89 Minutes | 28 | 10.2% |
| 90 or more Minutes | 0 | 0.0% |
Commute Time by Sex in Krotz Springs
The most common commute times in Krotz Springs are 45 to 59 minutes (36 commuters, 22.0%) for males and 20 to 24 minutes (41 commuters, 36.9%) for females.
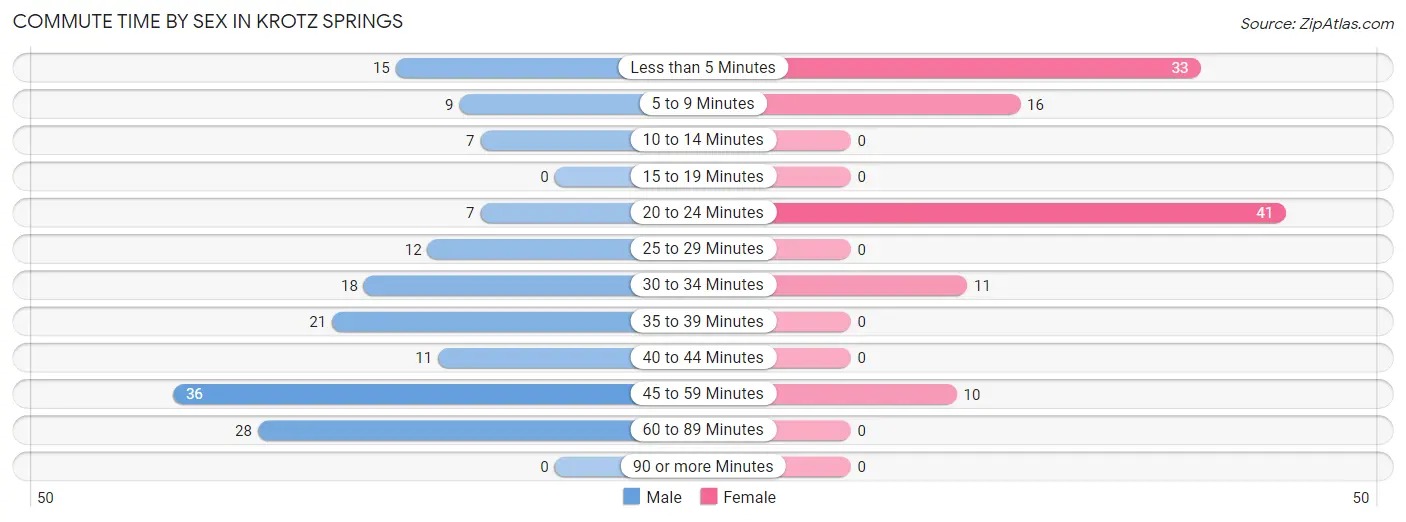
| Commute Time | Male | Female |
| Less than 5 Minutes | 15 (9.1%) | 33 (29.7%) |
| 5 to 9 Minutes | 9 (5.5%) | 16 (14.4%) |
| 10 to 14 Minutes | 7 (4.3%) | 0 (0.0%) |
| 15 to 19 Minutes | 0 (0.0%) | 0 (0.0%) |
| 20 to 24 Minutes | 7 (4.3%) | 41 (36.9%) |
| 25 to 29 Minutes | 12 (7.3%) | 0 (0.0%) |
| 30 to 34 Minutes | 18 (11.0%) | 11 (9.9%) |
| 35 to 39 Minutes | 21 (12.8%) | 0 (0.0%) |
| 40 to 44 Minutes | 11 (6.7%) | 0 (0.0%) |
| 45 to 59 Minutes | 36 (22.0%) | 10 (9.0%) |
| 60 to 89 Minutes | 28 (17.1%) | 0 (0.0%) |
| 90 or more Minutes | 0 (0.0%) | 0 (0.0%) |
Time of Departure to Work by Sex in Krotz Springs
The most frequent times of departure to work in Krotz Springs are 6:00 AM to 6:29 AM (68, 41.5%) for males and 12:00 PM to 3:59 PM (25, 22.5%) for females.
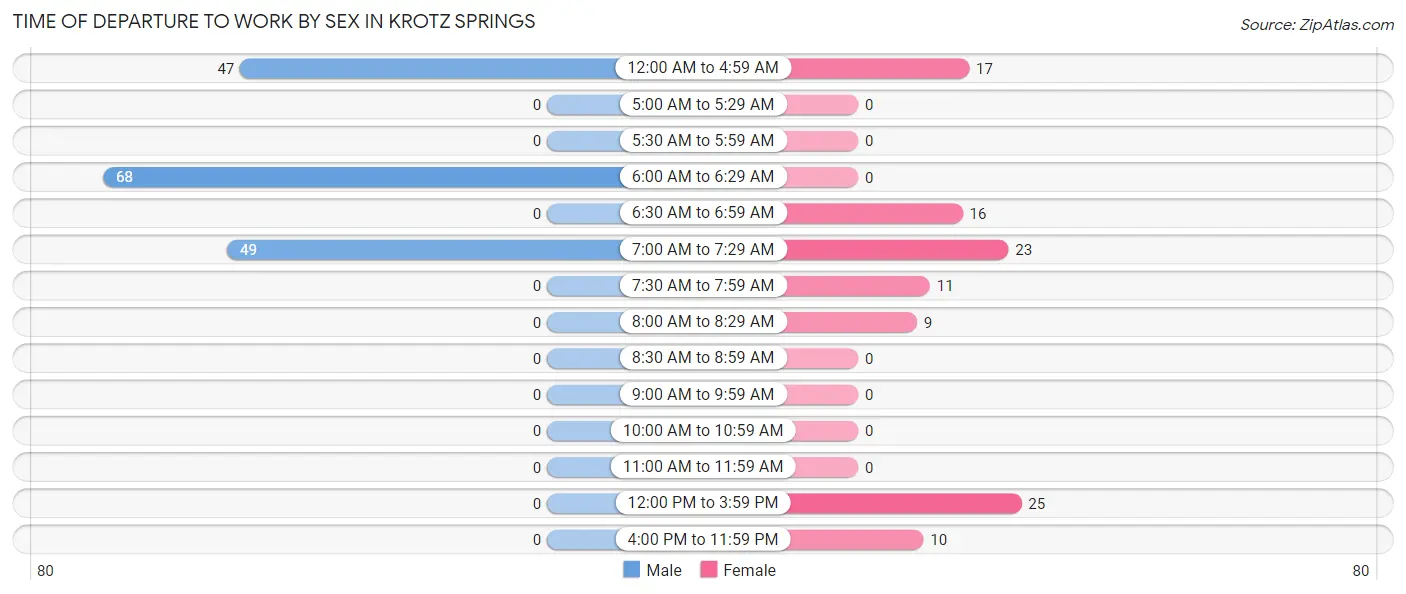
| Time of Departure | Male | Female |
| 12:00 AM to 4:59 AM | 47 (28.7%) | 17 (15.3%) |
| 5:00 AM to 5:29 AM | 0 (0.0%) | 0 (0.0%) |
| 5:30 AM to 5:59 AM | 0 (0.0%) | 0 (0.0%) |
| 6:00 AM to 6:29 AM | 68 (41.5%) | 0 (0.0%) |
| 6:30 AM to 6:59 AM | 0 (0.0%) | 16 (14.4%) |
| 7:00 AM to 7:29 AM | 49 (29.9%) | 23 (20.7%) |
| 7:30 AM to 7:59 AM | 0 (0.0%) | 11 (9.9%) |
| 8:00 AM to 8:29 AM | 0 (0.0%) | 9 (8.1%) |
| 8:30 AM to 8:59 AM | 0 (0.0%) | 0 (0.0%) |
| 9:00 AM to 9:59 AM | 0 (0.0%) | 0 (0.0%) |
| 10:00 AM to 10:59 AM | 0 (0.0%) | 0 (0.0%) |
| 11:00 AM to 11:59 AM | 0 (0.0%) | 0 (0.0%) |
| 12:00 PM to 3:59 PM | 0 (0.0%) | 25 (22.5%) |
| 4:00 PM to 11:59 PM | 0 (0.0%) | 10 (9.0%) |
| Total | 164 (100.0%) | 111 (100.0%) |
Housing Occupancy in Krotz Springs
Occupancy by Ownership in Krotz Springs
Of the total 353 dwellings in Krotz Springs, owner-occupied units account for 257 (72.8%), while renter-occupied units make up 96 (27.2%).
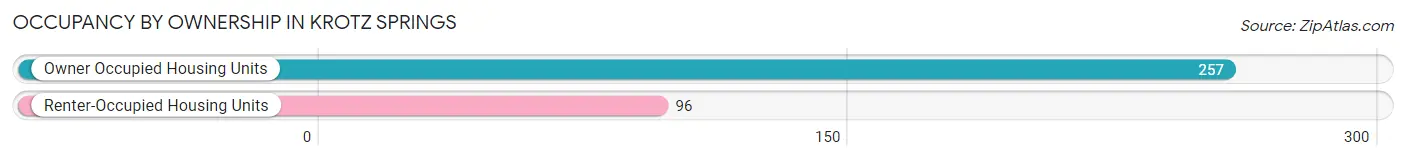
| Occupancy | # Housing Units | % Housing Units |
| Owner Occupied Housing Units | 257 | 72.8% |
| Renter-Occupied Housing Units | 96 | 27.2% |
| Total Occupied Housing Units | 353 | 100.0% |
Occupancy by Household Size in Krotz Springs
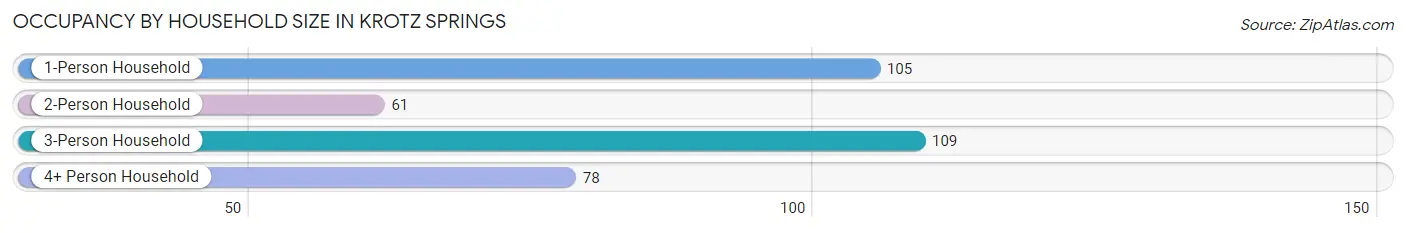
| Household Size | # Housing Units | % Housing Units |
| 1-Person Household | 105 | 29.7% |
| 2-Person Household | 61 | 17.3% |
| 3-Person Household | 109 | 30.9% |
| 4+ Person Household | 78 | 22.1% |
| Total Housing Units | 353 | 100.0% |
Occupancy by Ownership by Household Size in Krotz Springs
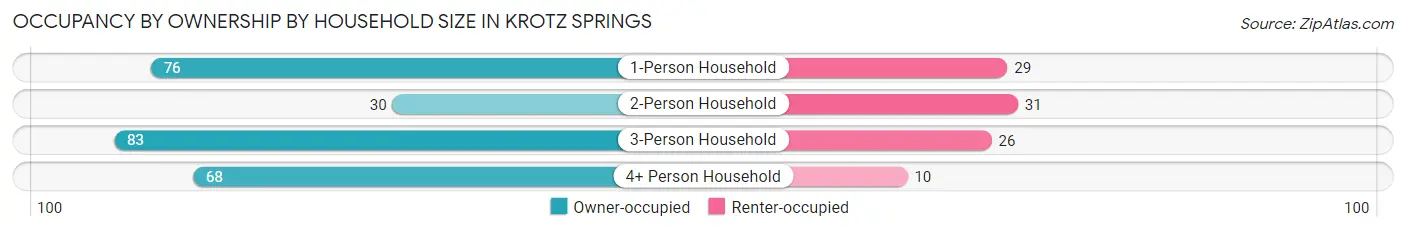
| Household Size | Owner-occupied | Renter-occupied |
| 1-Person Household | 76 (72.4%) | 29 (27.6%) |
| 2-Person Household | 30 (49.2%) | 31 (50.8%) |
| 3-Person Household | 83 (76.1%) | 26 (23.8%) |
| 4+ Person Household | 68 (87.2%) | 10 (12.8%) |
| Total Housing Units | 257 (72.8%) | 96 (27.2%) |
Occupancy by Educational Attainment in Krotz Springs
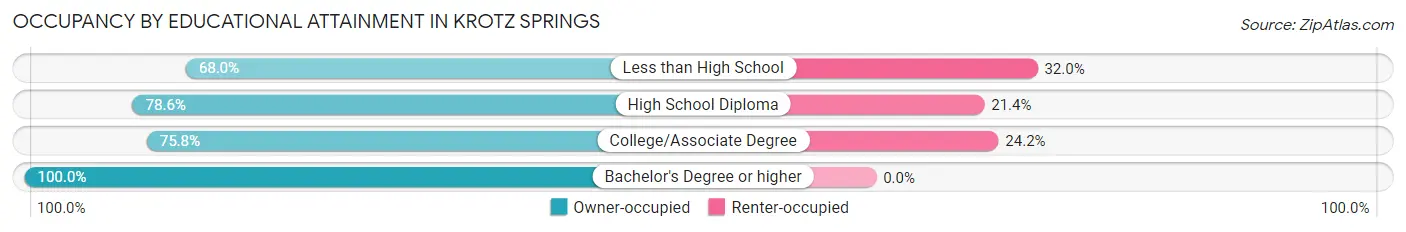
| Household Size | Owner-occupied | Renter-occupied |
| Less than High School | 134 (68.0%) | 63 (32.0%) |
| High School Diploma | 33 (78.6%) | 9 (21.4%) |
| College/Associate Degree | 75 (75.8%) | 24 (24.2%) |
| Bachelor's Degree or higher | 15 (100.0%) | 0 (0.0%) |
Occupancy by Age of Householder in Krotz Springs
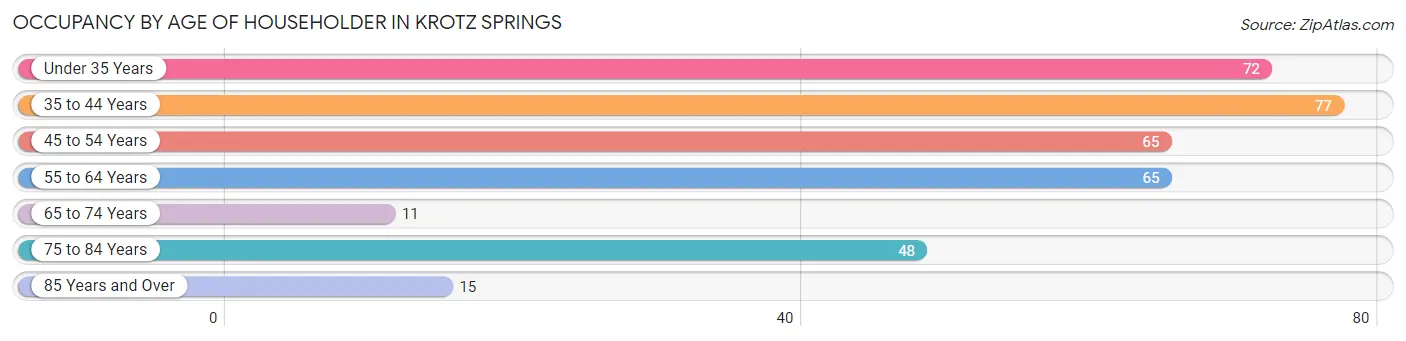
| Age Bracket | # Households | % Households |
| Under 35 Years | 72 | 20.4% |
| 35 to 44 Years | 77 | 21.8% |
| 45 to 54 Years | 65 | 18.4% |
| 55 to 64 Years | 65 | 18.4% |
| 65 to 74 Years | 11 | 3.1% |
| 75 to 84 Years | 48 | 13.6% |
| 85 Years and Over | 15 | 4.3% |
| Total | 353 | 100.0% |
Housing Finances in Krotz Springs
Median Income by Occupancy in Krotz Springs
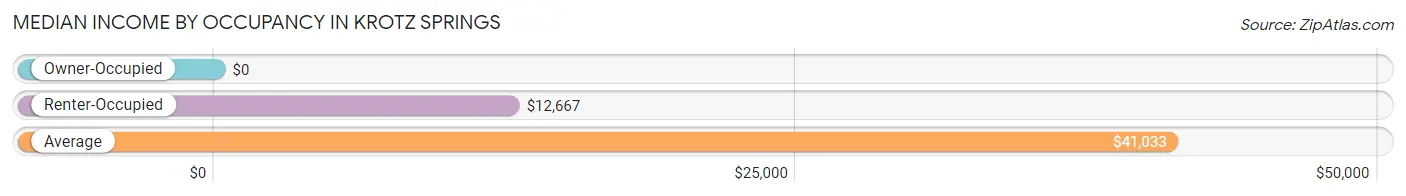
| Occupancy Type | # Households | Median Income |
| Owner-Occupied | 257 (72.8%) | $0 |
| Renter-Occupied | 96 (27.2%) | $12,667 |
| Average | 353 (100.0%) | $41,033 |
Occupancy by Householder Income Bracket in Krotz Springs
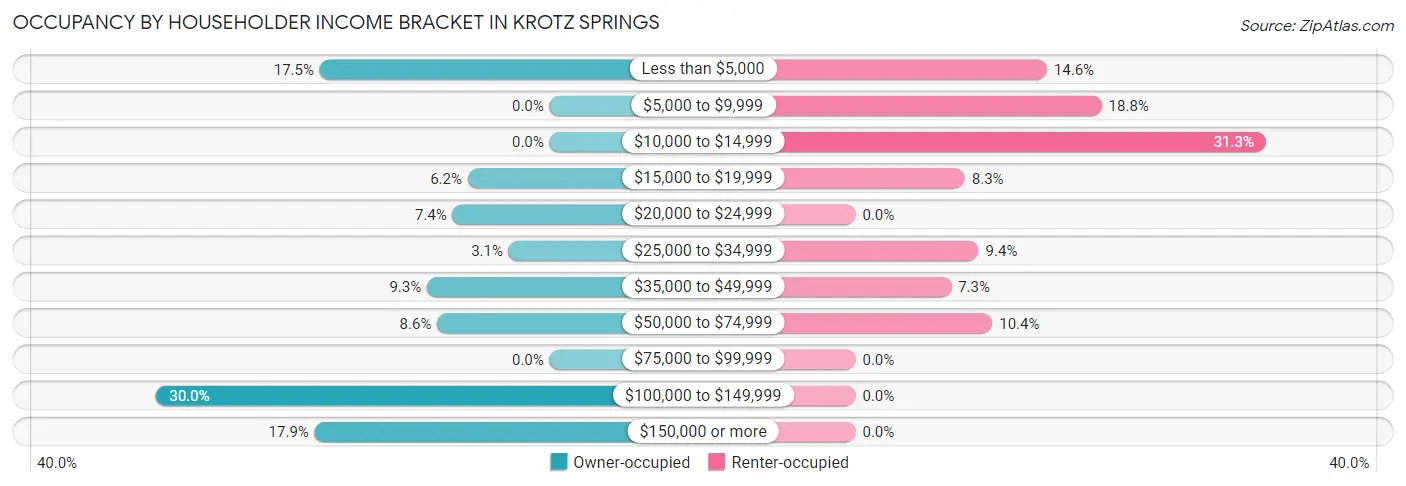
| Income Bracket | Owner-occupied | Renter-occupied |
| Less than $5,000 | 45 (17.5%) | 14 (14.6%) |
| $5,000 to $9,999 | 0 (0.0%) | 18 (18.8%) |
| $10,000 to $14,999 | 0 (0.0%) | 30 (31.2%) |
| $15,000 to $19,999 | 16 (6.2%) | 8 (8.3%) |
| $20,000 to $24,999 | 19 (7.4%) | 0 (0.0%) |
| $25,000 to $34,999 | 8 (3.1%) | 9 (9.4%) |
| $35,000 to $49,999 | 24 (9.3%) | 7 (7.3%) |
| $50,000 to $74,999 | 22 (8.6%) | 10 (10.4%) |
| $75,000 to $99,999 | 0 (0.0%) | 0 (0.0%) |
| $100,000 to $149,999 | 77 (30.0%) | 0 (0.0%) |
| $150,000 or more | 46 (17.9%) | 0 (0.0%) |
| Total | 257 (100.0%) | 96 (100.0%) |
Monthly Housing Cost Tiers in Krotz Springs
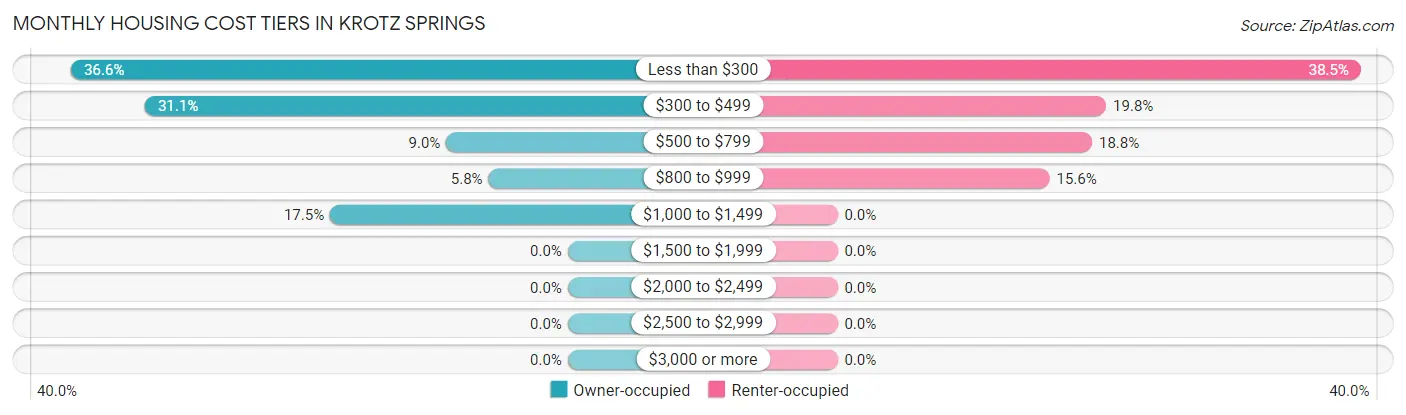
| Monthly Cost | Owner-occupied | Renter-occupied |
| Less than $300 | 94 (36.6%) | 37 (38.5%) |
| $300 to $499 | 80 (31.1%) | 19 (19.8%) |
| $500 to $799 | 23 (8.9%) | 18 (18.8%) |
| $800 to $999 | 15 (5.8%) | 15 (15.6%) |
| $1,000 to $1,499 | 45 (17.5%) | 0 (0.0%) |
| $1,500 to $1,999 | 0 (0.0%) | 0 (0.0%) |
| $2,000 to $2,499 | 0 (0.0%) | 0 (0.0%) |
| $2,500 to $2,999 | 0 (0.0%) | 0 (0.0%) |
| $3,000 or more | 0 (0.0%) | 0 (0.0%) |
| Total | 257 (100.0%) | 96 (100.0%) |
Physical Housing Characteristics in Krotz Springs
Housing Structures in Krotz Springs
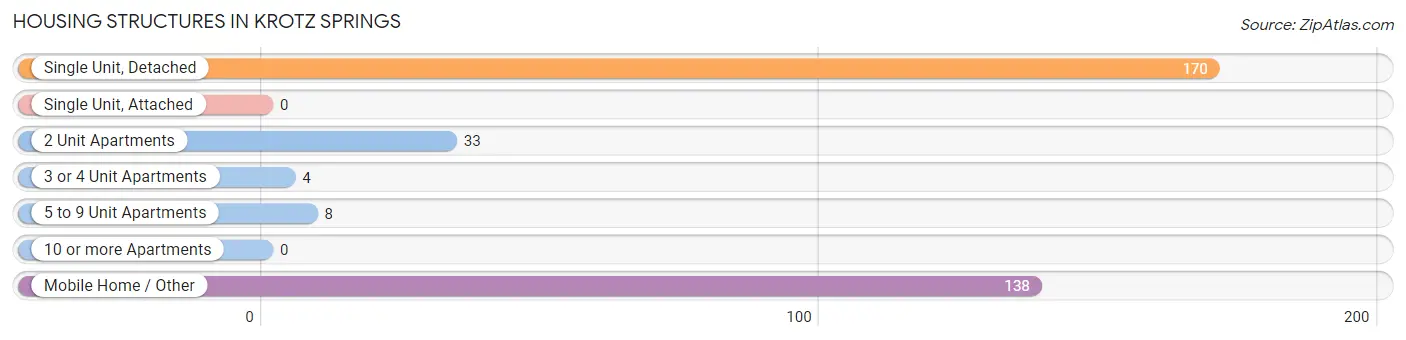
| Structure Type | # Housing Units | % Housing Units |
| Single Unit, Detached | 170 | 48.2% |
| Single Unit, Attached | 0 | 0.0% |
| 2 Unit Apartments | 33 | 9.3% |
| 3 or 4 Unit Apartments | 4 | 1.1% |
| 5 to 9 Unit Apartments | 8 | 2.3% |
| 10 or more Apartments | 0 | 0.0% |
| Mobile Home / Other | 138 | 39.1% |
| Total | 353 | 100.0% |
Housing Structures by Occupancy in Krotz Springs
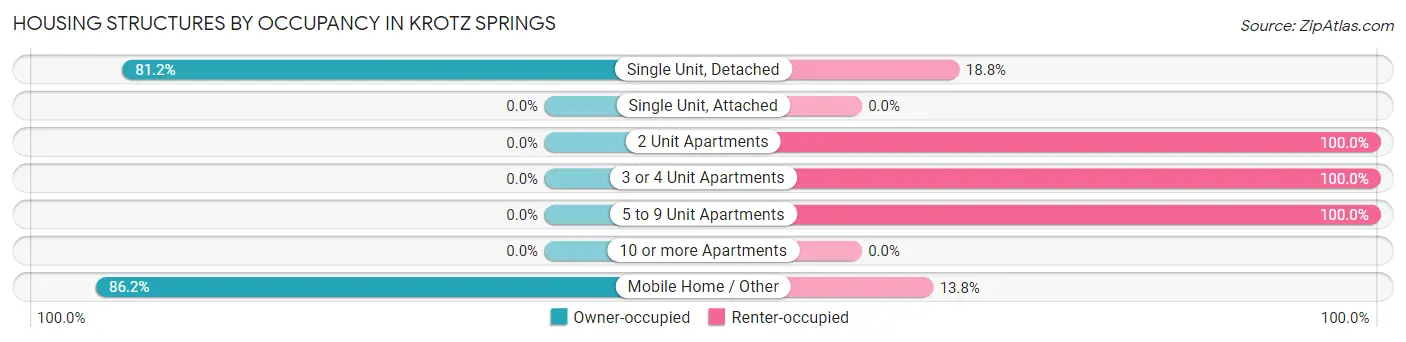
| Structure Type | Owner-occupied | Renter-occupied |
| Single Unit, Detached | 138 (81.2%) | 32 (18.8%) |
| Single Unit, Attached | 0 (0.0%) | 0 (0.0%) |
| 2 Unit Apartments | 0 (0.0%) | 33 (100.0%) |
| 3 or 4 Unit Apartments | 0 (0.0%) | 4 (100.0%) |
| 5 to 9 Unit Apartments | 0 (0.0%) | 8 (100.0%) |
| 10 or more Apartments | 0 (0.0%) | 0 (0.0%) |
| Mobile Home / Other | 119 (86.2%) | 19 (13.8%) |
| Total | 257 (72.8%) | 96 (27.2%) |
Housing Structures by Number of Rooms in Krotz Springs
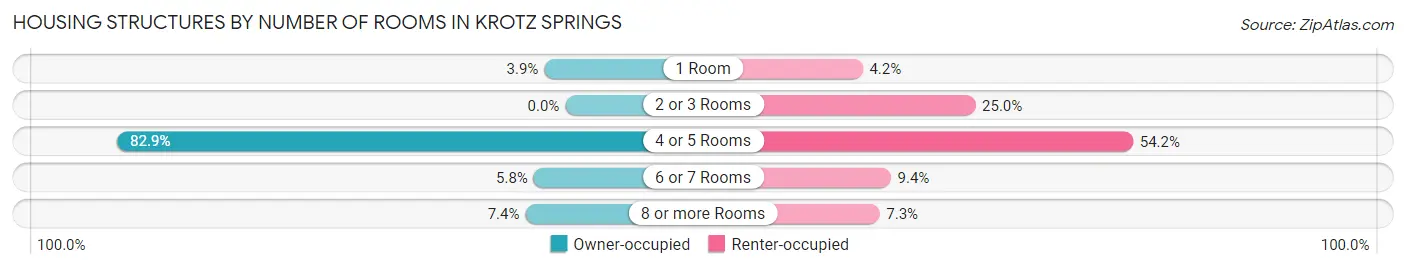
| Number of Rooms | Owner-occupied | Renter-occupied |
| 1 Room | 10 (3.9%) | 4 (4.2%) |
| 2 or 3 Rooms | 0 (0.0%) | 24 (25.0%) |
| 4 or 5 Rooms | 213 (82.9%) | 52 (54.2%) |
| 6 or 7 Rooms | 15 (5.8%) | 9 (9.4%) |
| 8 or more Rooms | 19 (7.4%) | 7 (7.3%) |
| Total | 257 (100.0%) | 96 (100.0%) |
Housing Structure by Heating Type in Krotz Springs
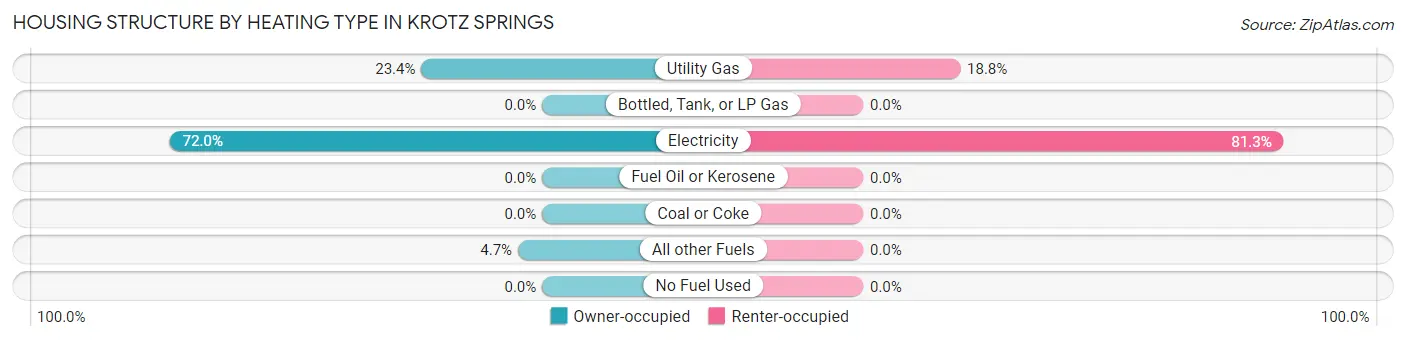
| Heating Type | Owner-occupied | Renter-occupied |
| Utility Gas | 60 (23.4%) | 18 (18.8%) |
| Bottled, Tank, or LP Gas | 0 (0.0%) | 0 (0.0%) |
| Electricity | 185 (72.0%) | 78 (81.2%) |
| Fuel Oil or Kerosene | 0 (0.0%) | 0 (0.0%) |
| Coal or Coke | 0 (0.0%) | 0 (0.0%) |
| All other Fuels | 12 (4.7%) | 0 (0.0%) |
| No Fuel Used | 0 (0.0%) | 0 (0.0%) |
| Total | 257 (100.0%) | 96 (100.0%) |
Household Vehicle Usage in Krotz Springs
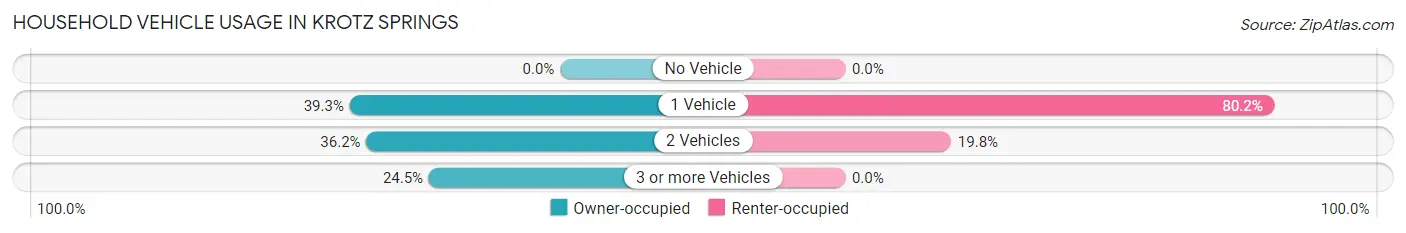
| Vehicles per Household | Owner-occupied | Renter-occupied |
| No Vehicle | 0 (0.0%) | 0 (0.0%) |
| 1 Vehicle | 101 (39.3%) | 77 (80.2%) |
| 2 Vehicles | 93 (36.2%) | 19 (19.8%) |
| 3 or more Vehicles | 63 (24.5%) | 0 (0.0%) |
| Total | 257 (100.0%) | 96 (100.0%) |
Real Estate & Mortgages in Krotz Springs
Real Estate and Mortgage Overview in Krotz Springs
| Characteristic | Without Mortgage | With Mortgage |
| Housing Units | 181 | 76 |
| Median Property Value | - | - |
| Median Household Income | - | - |
| Monthly Housing Costs | $297 | $0 |
| Real Estate Taxes | $675 | $50 |
Property Value by Mortgage Status in Krotz Springs
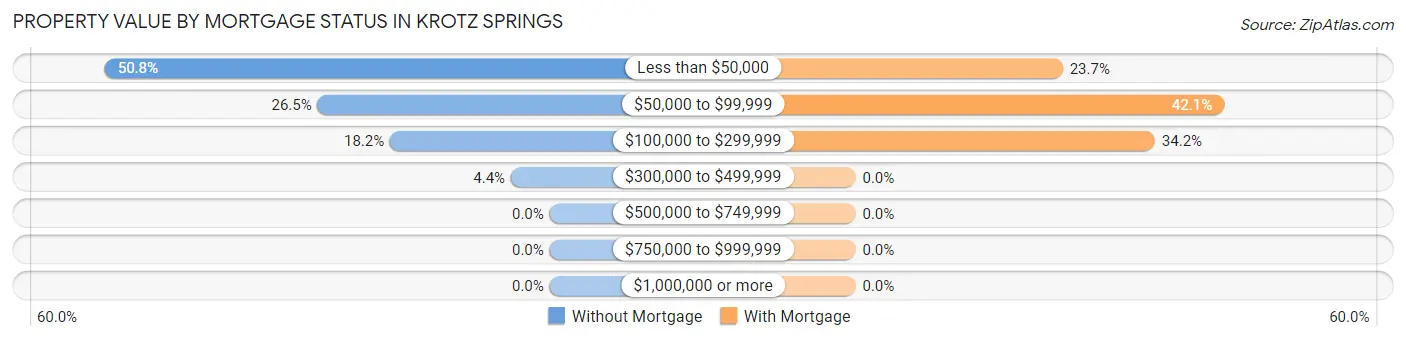
| Property Value | Without Mortgage | With Mortgage |
| Less than $50,000 | 92 (50.8%) | 18 (23.7%) |
| $50,000 to $99,999 | 48 (26.5%) | 32 (42.1%) |
| $100,000 to $299,999 | 33 (18.2%) | 26 (34.2%) |
| $300,000 to $499,999 | 8 (4.4%) | 0 (0.0%) |
| $500,000 to $749,999 | 0 (0.0%) | 0 (0.0%) |
| $750,000 to $999,999 | 0 (0.0%) | 0 (0.0%) |
| $1,000,000 or more | 0 (0.0%) | 0 (0.0%) |
| Total | 181 (100.0%) | 76 (100.0%) |
Household Income by Mortgage Status in Krotz Springs
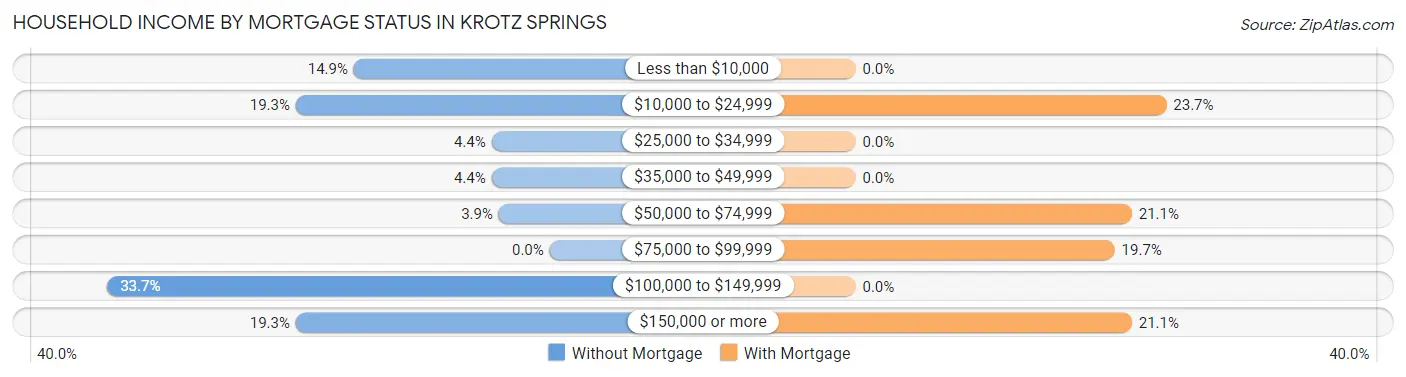
| Household Income | Without Mortgage | With Mortgage |
| Less than $10,000 | 27 (14.9%) | 0 (0.0%) |
| $10,000 to $24,999 | 35 (19.3%) | 18 (23.7%) |
| $25,000 to $34,999 | 8 (4.4%) | 0 (0.0%) |
| $35,000 to $49,999 | 8 (4.4%) | 0 (0.0%) |
| $50,000 to $74,999 | 7 (3.9%) | 16 (21.0%) |
| $75,000 to $99,999 | 0 (0.0%) | 15 (19.7%) |
| $100,000 to $149,999 | 61 (33.7%) | 0 (0.0%) |
| $150,000 or more | 35 (19.3%) | 16 (21.0%) |
| Total | 181 (100.0%) | 76 (100.0%) |
Property Value to Household Income Ratio in Krotz Springs
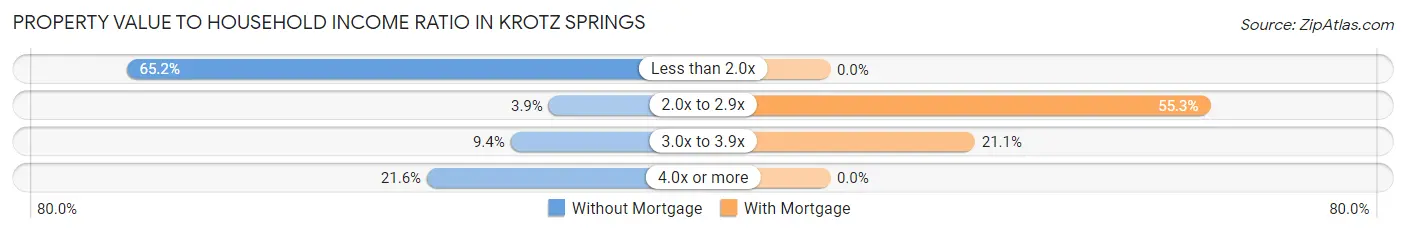
| Value-to-Income Ratio | Without Mortgage | With Mortgage |
| Less than 2.0x | 118 (65.2%) | 0 (0.0%) |
| 2.0x to 2.9x | 7 (3.9%) | 42 (55.3%) |
| 3.0x to 3.9x | 17 (9.4%) | 16 (21.0%) |
| 4.0x or more | 39 (21.5%) | 0 (0.0%) |
| Total | 181 (100.0%) | 76 (100.0%) |
Real Estate Taxes by Mortgage Status in Krotz Springs
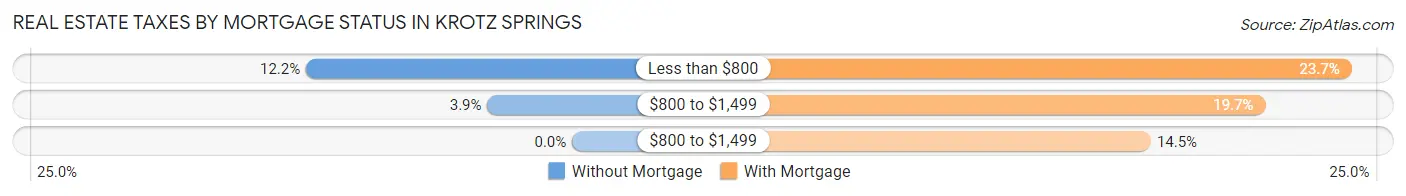
| Property Taxes | Without Mortgage | With Mortgage |
| Less than $800 | 22 (12.1%) | 18 (23.7%) |
| $800 to $1,499 | 7 (3.9%) | 15 (19.7%) |
| $800 to $1,499 | 0 (0.0%) | 11 (14.5%) |
| Total | 181 (100.0%) | 76 (100.0%) |
Health & Disability in Krotz Springs
Health Insurance Coverage by Age in Krotz Springs
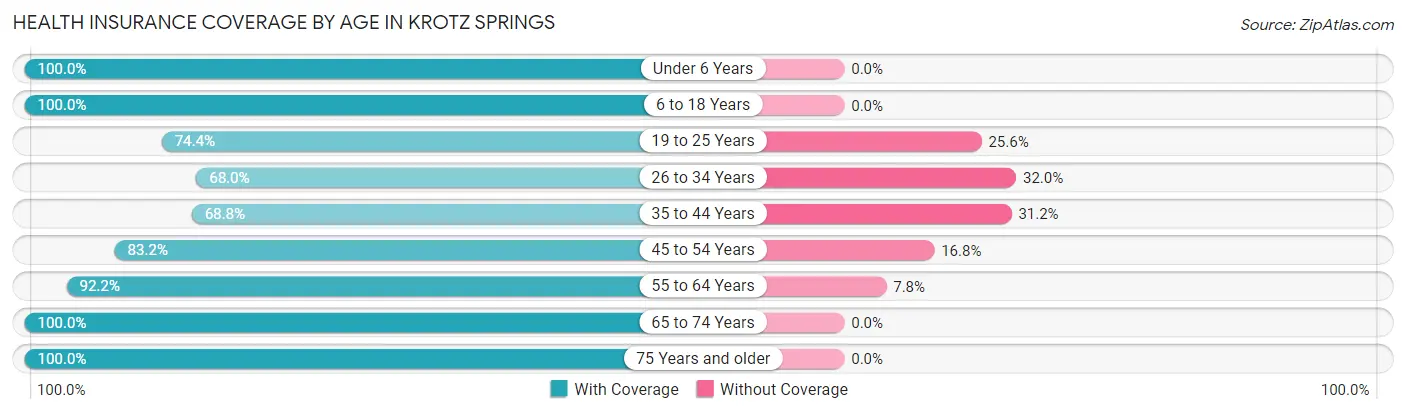
| Age Bracket | With Coverage | Without Coverage |
| Under 6 Years | 60 (100.0%) | 0 (0.0%) |
| 6 to 18 Years | 218 (100.0%) | 0 (0.0%) |
| 19 to 25 Years | 32 (74.4%) | 11 (25.6%) |
| 26 to 34 Years | 87 (68.0%) | 41 (32.0%) |
| 35 to 44 Years | 53 (68.8%) | 24 (31.2%) |
| 45 to 54 Years | 134 (83.2%) | 27 (16.8%) |
| 55 to 64 Years | 106 (92.2%) | 9 (7.8%) |
| 65 to 74 Years | 35 (100.0%) | 0 (0.0%) |
| 75 Years and older | 78 (100.0%) | 0 (0.0%) |
| Total | 803 (87.8%) | 112 (12.2%) |
Health Insurance Coverage by Citizenship Status in Krotz Springs
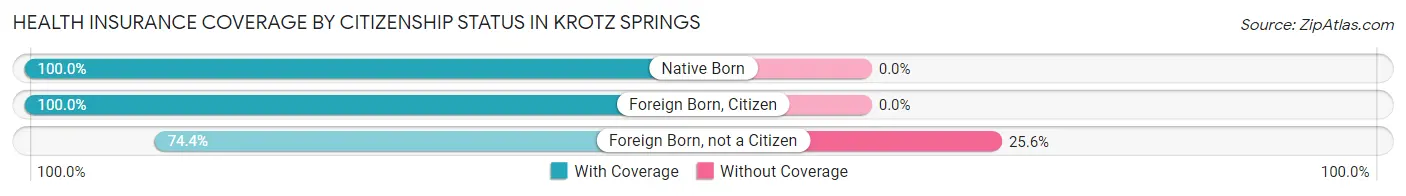
| Citizenship Status | With Coverage | Without Coverage |
| Native Born | 60 (100.0%) | 0 (0.0%) |
| Foreign Born, Citizen | 218 (100.0%) | 0 (0.0%) |
| Foreign Born, not a Citizen | 32 (74.4%) | 11 (25.6%) |
Health Insurance Coverage by Household Income in Krotz Springs
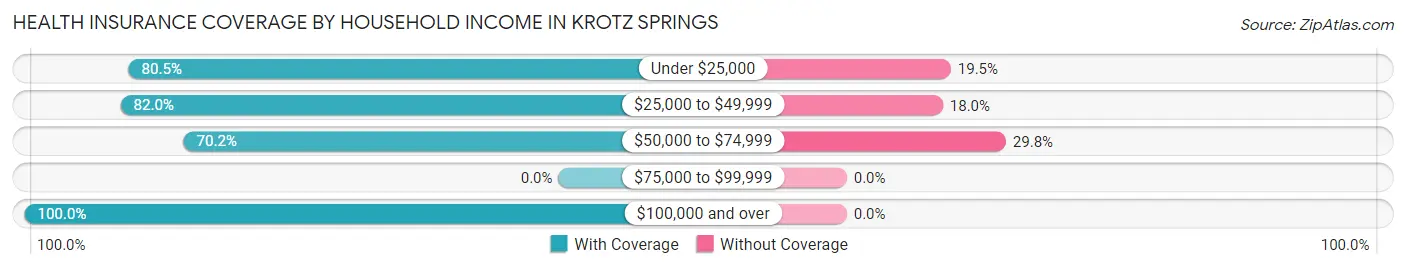
| Household Income | With Coverage | Without Coverage |
| Under $25,000 | 260 (80.5%) | 63 (19.5%) |
| $25,000 to $49,999 | 82 (82.0%) | 18 (18.0%) |
| $50,000 to $74,999 | 73 (70.2%) | 31 (29.8%) |
| $75,000 to $99,999 | 0 (0.0%) | 0 (0.0%) |
| $100,000 and over | 388 (100.0%) | 0 (0.0%) |
Public vs Private Health Insurance Coverage by Age in Krotz Springs
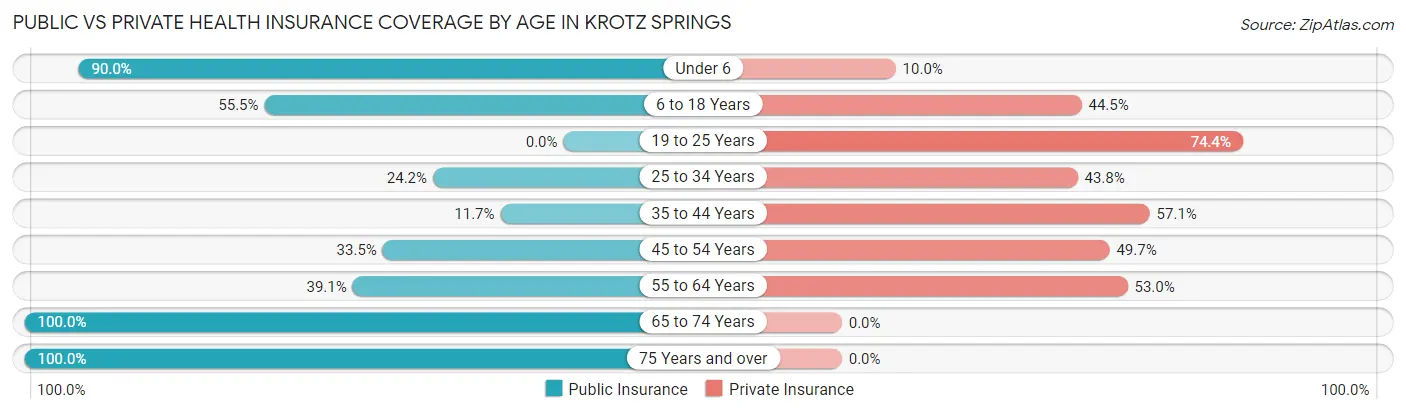
| Age Bracket | Public Insurance | Private Insurance |
| Under 6 | 54 (90.0%) | 6 (10.0%) |
| 6 to 18 Years | 121 (55.5%) | 97 (44.5%) |
| 19 to 25 Years | 0 (0.0%) | 32 (74.4%) |
| 25 to 34 Years | 31 (24.2%) | 56 (43.8%) |
| 35 to 44 Years | 9 (11.7%) | 44 (57.1%) |
| 45 to 54 Years | 54 (33.5%) | 80 (49.7%) |
| 55 to 64 Years | 45 (39.1%) | 61 (53.0%) |
| 65 to 74 Years | 35 (100.0%) | 0 (0.0%) |
| 75 Years and over | 78 (100.0%) | 0 (0.0%) |
| Total | 427 (46.7%) | 376 (41.1%) |
Disability Status by Sex by Age in Krotz Springs
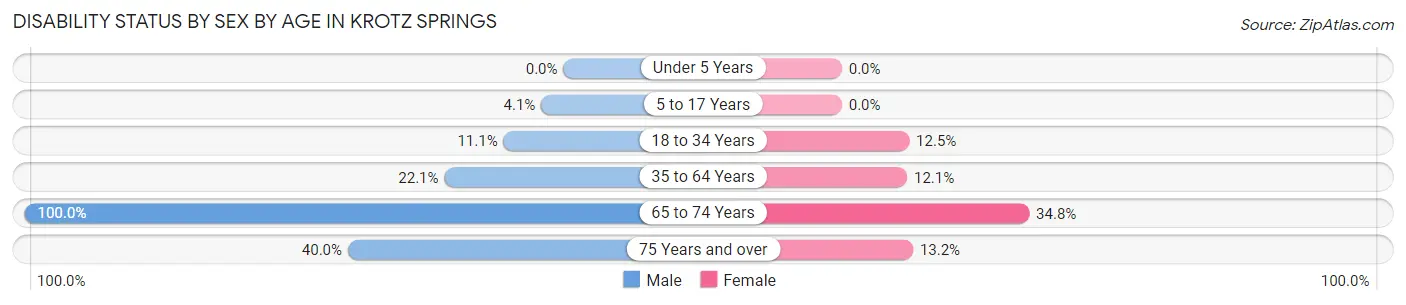
| Age Bracket | Male | Female |
| Under 5 Years | 0 (0.0%) | 0 (0.0%) |
| 5 to 17 Years | 4 (4.1%) | 0 (0.0%) |
| 18 to 34 Years | 12 (11.1%) | 9 (12.5%) |
| 35 to 64 Years | 36 (22.1%) | 23 (12.1%) |
| 65 to 74 Years | 12 (100.0%) | 8 (34.8%) |
| 75 Years and over | 10 (40.0%) | 7 (13.2%) |
Disability Class by Sex by Age in Krotz Springs
Disability Class: Hearing Difficulty
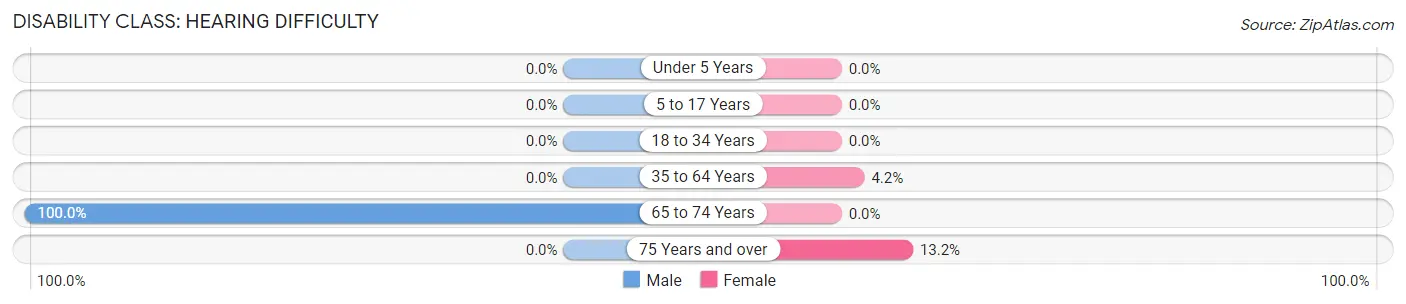
| Age Bracket | Male | Female |
| Under 5 Years | 0 (0.0%) | 0 (0.0%) |
| 5 to 17 Years | 0 (0.0%) | 0 (0.0%) |
| 18 to 34 Years | 0 (0.0%) | 0 (0.0%) |
| 35 to 64 Years | 0 (0.0%) | 8 (4.2%) |
| 65 to 74 Years | 12 (100.0%) | 0 (0.0%) |
| 75 Years and over | 0 (0.0%) | 7 (13.2%) |
Disability Class: Vision Difficulty
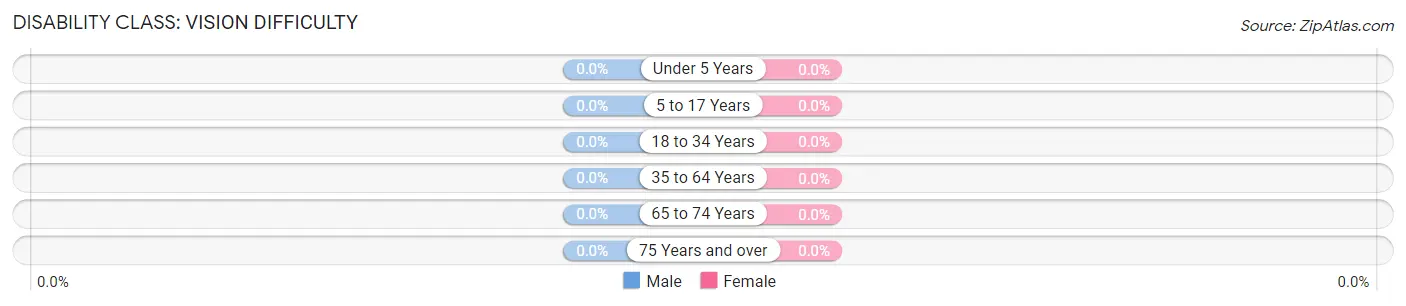
| Age Bracket | Male | Female |
| Under 5 Years | 0 (0.0%) | 0 (0.0%) |
| 5 to 17 Years | 0 (0.0%) | 0 (0.0%) |
| 18 to 34 Years | 0 (0.0%) | 0 (0.0%) |
| 35 to 64 Years | 0 (0.0%) | 0 (0.0%) |
| 65 to 74 Years | 0 (0.0%) | 0 (0.0%) |
| 75 Years and over | 0 (0.0%) | 0 (0.0%) |
Disability Class: Cognitive Difficulty
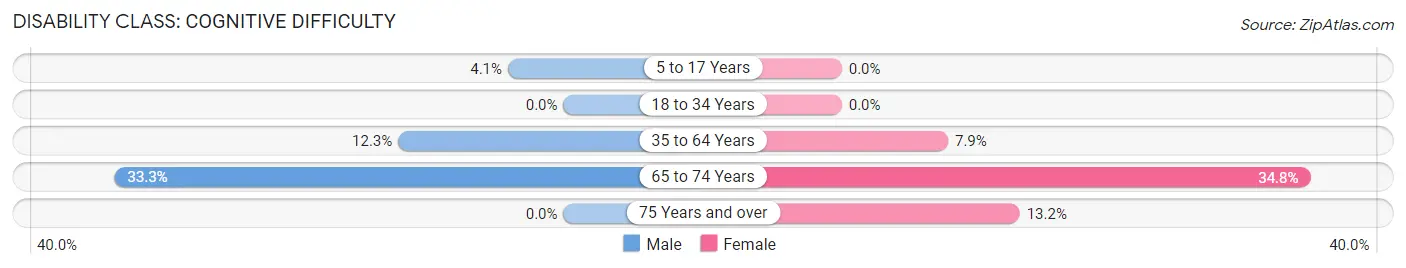
| Age Bracket | Male | Female |
| 5 to 17 Years | 4 (4.1%) | 0 (0.0%) |
| 18 to 34 Years | 0 (0.0%) | 0 (0.0%) |
| 35 to 64 Years | 20 (12.3%) | 15 (7.9%) |
| 65 to 74 Years | 4 (33.3%) | 8 (34.8%) |
| 75 Years and over | 0 (0.0%) | 7 (13.2%) |
Disability Class: Ambulatory Difficulty
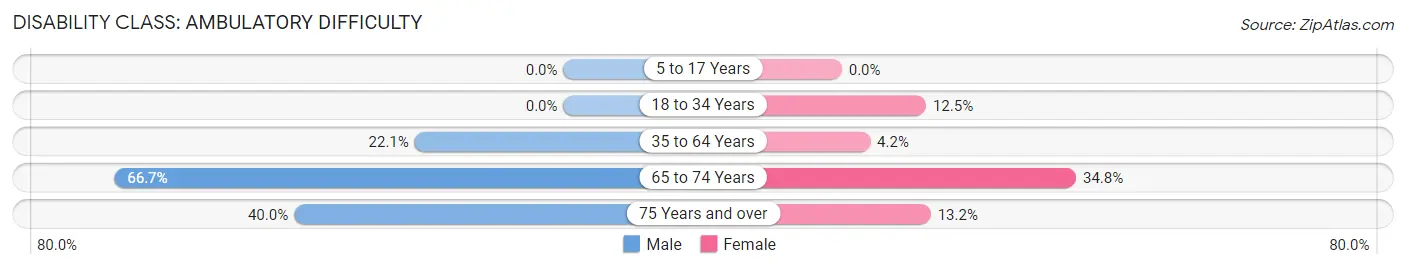
| Age Bracket | Male | Female |
| 5 to 17 Years | 0 (0.0%) | 0 (0.0%) |
| 18 to 34 Years | 0 (0.0%) | 9 (12.5%) |
| 35 to 64 Years | 36 (22.1%) | 8 (4.2%) |
| 65 to 74 Years | 8 (66.7%) | 8 (34.8%) |
| 75 Years and over | 10 (40.0%) | 7 (13.2%) |
Disability Class: Self-Care Difficulty
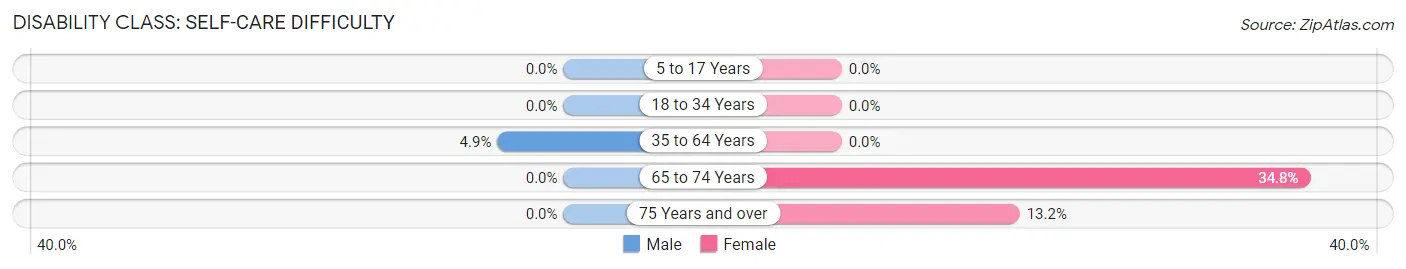
| Age Bracket | Male | Female |
| 5 to 17 Years | 0 (0.0%) | 0 (0.0%) |
| 18 to 34 Years | 0 (0.0%) | 0 (0.0%) |
| 35 to 64 Years | 8 (4.9%) | 0 (0.0%) |
| 65 to 74 Years | 0 (0.0%) | 8 (34.8%) |
| 75 Years and over | 0 (0.0%) | 7 (13.2%) |
Technology Access in Krotz Springs
Computing Device Access in Krotz Springs
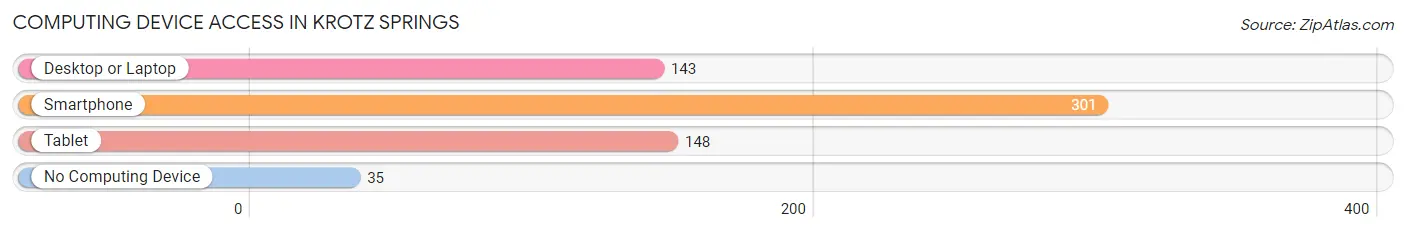
| Device Type | # Households | % Households |
| Desktop or Laptop | 143 | 40.5% |
| Smartphone | 301 | 85.3% |
| Tablet | 148 | 41.9% |
| No Computing Device | 35 | 9.9% |
| Total | 353 | 100.0% |
Internet Access in Krotz Springs
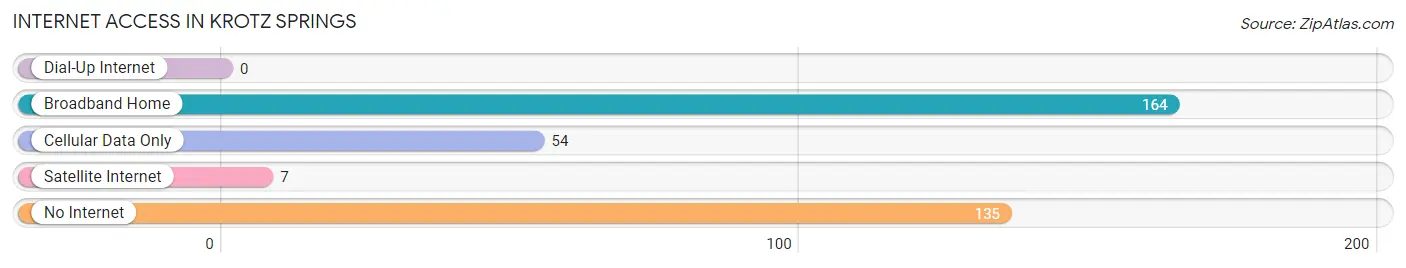
| Internet Type | # Households | % Households |
| Dial-Up Internet | 0 | 0.0% |
| Broadband Home | 164 | 46.5% |
| Cellular Data Only | 54 | 15.3% |
| Satellite Internet | 7 | 2.0% |
| No Internet | 135 | 38.2% |
| Total | 353 | 100.0% |
Krotz Springs Summary
Krotz Springs is a small town located in St. Landry Parish, Louisiana. It is situated on the banks of the Atchafalaya River, approximately 25 miles northwest of Lafayette. The town was founded in the early 1900s by German immigrant, Henry Krotz, who established a sawmill and lumber business in the area. The town was incorporated in 1912 and has since grown to a population of 1,845 as of the 2010 census.
History
Krotz Springs was founded in the early 1900s by German immigrant, Henry Krotz. Krotz had previously worked in the lumber industry in Wisconsin and decided to move to Louisiana to establish his own sawmill and lumber business. He purchased land along the Atchafalaya River and began to build the town. The town was officially incorporated in 1912 and was named after Krotz.
The town grew slowly over the years, but experienced a period of rapid growth in the 1950s and 1960s due to the oil and gas industry. The town was home to several oil and gas companies, including the Krotz Springs Oil Company, which was founded in 1952. The town also became a popular tourist destination due to its proximity to the Atchafalaya River and the nearby Lake Fausse Pointe State Park.
Geography
Krotz Springs is located in St. Landry Parish, Louisiana. It is situated on the banks of the Atchafalaya River, approximately 25 miles northwest of Lafayette. The town is located in the Atchafalaya Basin, which is the largest wetland and swamp in the United States. The town is surrounded by a mix of swamps, marshes, and bayous, as well as the Atchafalaya River.
The town has a total area of 1.3 square miles, all of which is land. The town is located at an elevation of 25 feet above sea level.
Economy
Krotz Springs is a small town with a population of 1,845 as of the 2010 census. The town’s economy is largely based on the oil and gas industry, as well as tourism. The town is home to several oil and gas companies, including the Krotz Springs Oil Company, which was founded in 1952. The town is also a popular tourist destination due to its proximity to the Atchafalaya River and the nearby Lake Fausse Pointe State Park.
Demographics
As of the 2010 census, Krotz Springs had a population of 1,845. The racial makeup of the town was 79.2% White, 17.7% African American, 0.2% Native American, 0.2% Asian, 0.1% Pacific Islander, 0.7% from other races, and 2.0% from two or more races. Hispanic or Latino of any race were 2.2% of the population.
The median income for a household in the town was $30,938, and the median income for a family was $37,500. The per capita income for the town was $15,945. About 17.2% of families and 20.2% of the population were below the poverty line, including 28.3% of those under age 18 and 15.2% of those age 65 or over.
Common Questions
What is Per Capita Income in Krotz Springs?
Per Capita income in Krotz Springs is $29,053.
What is the Median Household income in Krotz Springs?
Median Household Income in Krotz Springs is $41,033.
What is Income or Wage Gap in Krotz Springs?
Income or Wage Gap in Krotz Springs is 46.9%.
Women in Krotz Springs earn 53.1 cents for every dollar earned by a man.
What is Inequality or Gini Index in Krotz Springs?
Inequality or Gini Index in Krotz Springs is 0.59.
What is the Total Population of Krotz Springs?
Total Population of Krotz Springs is 915.
What is the Total Male Population of Krotz Springs?
Total Male Population of Krotz Springs is 440.
What is the Total Female Population of Krotz Springs?
Total Female Population of Krotz Springs is 475.
What is the Ratio of Males per 100 Females in Krotz Springs?
There are 92.63 Males per 100 Females in Krotz Springs.
What is the Ratio of Females per 100 Males in Krotz Springs?
There are 107.95 Females per 100 Males in Krotz Springs.
What is the Median Population Age in Krotz Springs?
Median Population Age in Krotz Springs is 35.5 Years.
What is the Average Family Size in Krotz Springs
Average Family Size in Krotz Springs is 3.1 People.
What is the Average Household Size in Krotz Springs
Average Household Size in Krotz Springs is 2.6 People.
How Large is the Labor Force in Krotz Springs?
There are 328 People in the Labor Forcein in Krotz Springs.
What is the Percentage of People in the Labor Force in Krotz Springs?
47.7% of People are in the Labor Force in Krotz Springs.
What is the Unemployment Rate in Krotz Springs?
Unemployment Rate in Krotz Springs is 13.4%.