Yarborough Landing, AR Map & Demographics
Yarborough Landing Map
Yarborough Landing Overview
$28,755
PER CAPITA INCOME
$78,080
AVG FAMILY INCOME
$51,542
AVG HOUSEHOLD INCOME
68.2%
WAGE / INCOME GAP [ % ]
31.8¢/ $1
WAGE / INCOME GAP [ $ ]
0.41
INEQUALITY / GINI INDEX
402
TOTAL POPULATION
219
MALE POPULATION
183
FEMALE POPULATION
119.67
MALES / 100 FEMALES
83.56
FEMALES / 100 MALES
61.8
MEDIAN AGE
2.5
AVG FAMILY SIZE
1.9
AVG HOUSEHOLD SIZE
187
LABOR FORCE [ PEOPLE ]
52.1%
PERCENT IN LABOR FORCE
Income in Yarborough Landing
Income Overview in Yarborough Landing
Per Capita Income in Yarborough Landing is $28,755, while median incomes of families and households are $78,080 and $51,542 respectively.
| Characteristic | Number | Measure |
| Per Capita Income | 402 | $28,755 |
| Median Family Income | 129 | $78,080 |
| Mean Family Income | 129 | $75,694 |
| Median Household Income | 211 | $51,542 |
| Mean Household Income | 211 | $54,503 |
| Income Deficit | 129 | $0 |
| Wage / Income Gap (%) | 402 | 68.18% |
| Wage / Income Gap ($) | 402 | 31.82¢ per $1 |
| Gini / Inequality Index | 402 | 0.41 |
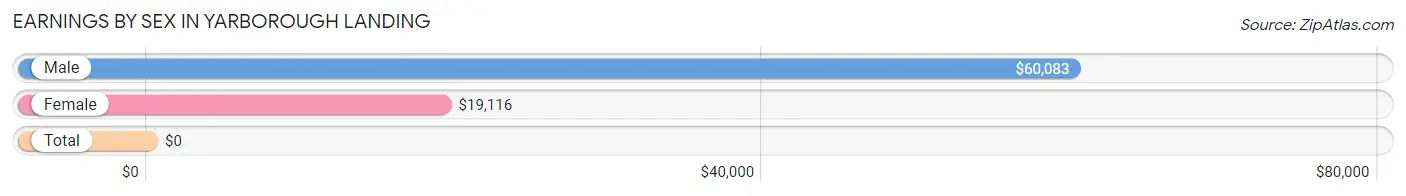
Earnings by Sex in Yarborough Landing
| Sex | Number | Average Earnings |
| Male | 58 (31.0%) | $60,083 |
| Female | 129 (69.0%) | $19,116 |
| Total | 187 (100.0%) | $0 |
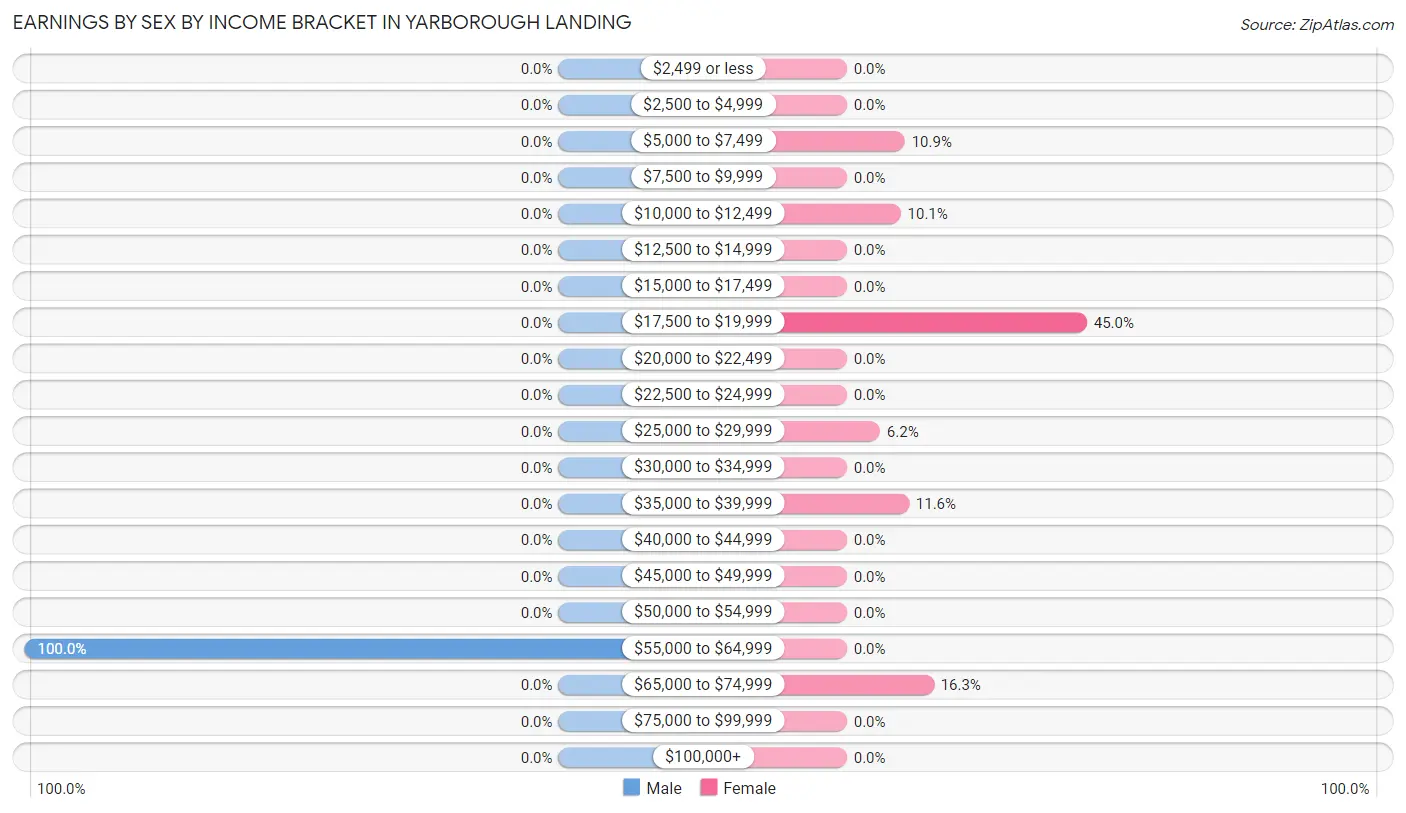
Earnings by Sex by Income Bracket in Yarborough Landing
The most common earnings brackets in Yarborough Landing are $55,000 to $64,999 for men (58 | 100.0%) and $17,500 to $19,999 for women (58 | 45.0%).
| Income | Male | Female |
| $2,499 or less | 0 (0.0%) | 0 (0.0%) |
| $2,500 to $4,999 | 0 (0.0%) | 0 (0.0%) |
| $5,000 to $7,499 | 0 (0.0%) | 14 (10.8%) |
| $7,500 to $9,999 | 0 (0.0%) | 0 (0.0%) |
| $10,000 to $12,499 | 0 (0.0%) | 13 (10.1%) |
| $12,500 to $14,999 | 0 (0.0%) | 0 (0.0%) |
| $15,000 to $17,499 | 0 (0.0%) | 0 (0.0%) |
| $17,500 to $19,999 | 0 (0.0%) | 58 (45.0%) |
| $20,000 to $22,499 | 0 (0.0%) | 0 (0.0%) |
| $22,500 to $24,999 | 0 (0.0%) | 0 (0.0%) |
| $25,000 to $29,999 | 0 (0.0%) | 8 (6.2%) |
| $30,000 to $34,999 | 0 (0.0%) | 0 (0.0%) |
| $35,000 to $39,999 | 0 (0.0%) | 15 (11.6%) |
| $40,000 to $44,999 | 0 (0.0%) | 0 (0.0%) |
| $45,000 to $49,999 | 0 (0.0%) | 0 (0.0%) |
| $50,000 to $54,999 | 0 (0.0%) | 0 (0.0%) |
| $55,000 to $64,999 | 58 (100.0%) | 0 (0.0%) |
| $65,000 to $74,999 | 0 (0.0%) | 21 (16.3%) |
| $75,000 to $99,999 | 0 (0.0%) | 0 (0.0%) |
| $100,000+ | 0 (0.0%) | 0 (0.0%) |
| Total | 58 (100.0%) | 129 (100.0%) |
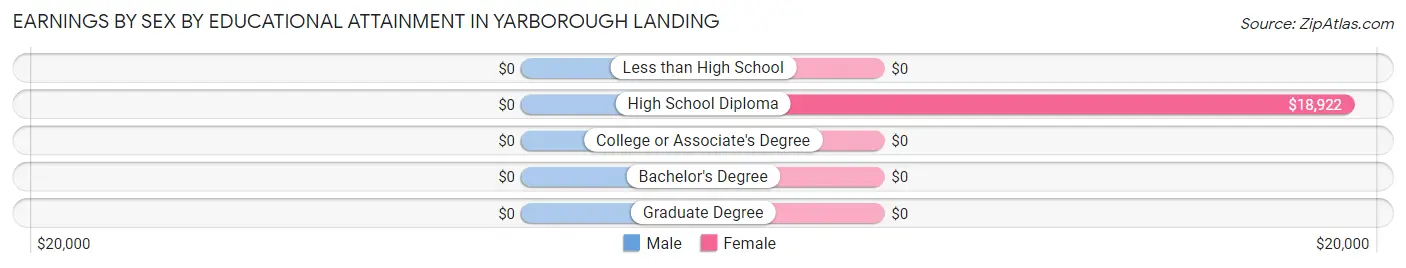
Earnings by Sex by Educational Attainment in Yarborough Landing
| Educational Attainment | Male Income | Female Income |
| Less than High School | - | - |
| High School Diploma | - | - |
| College or Associate's Degree | - | - |
| Bachelor's Degree | - | - |
| Graduate Degree | - | - |
| Total | $60,083 | $19,116 |
Family Income in Yarborough Landing
Family Income Brackets in Yarborough Landing
According to the Yarborough Landing family income data, there are 42 families falling into the $50,000 to $74,999 income range, which is the most common income bracket and makes up 32.6% of all families.
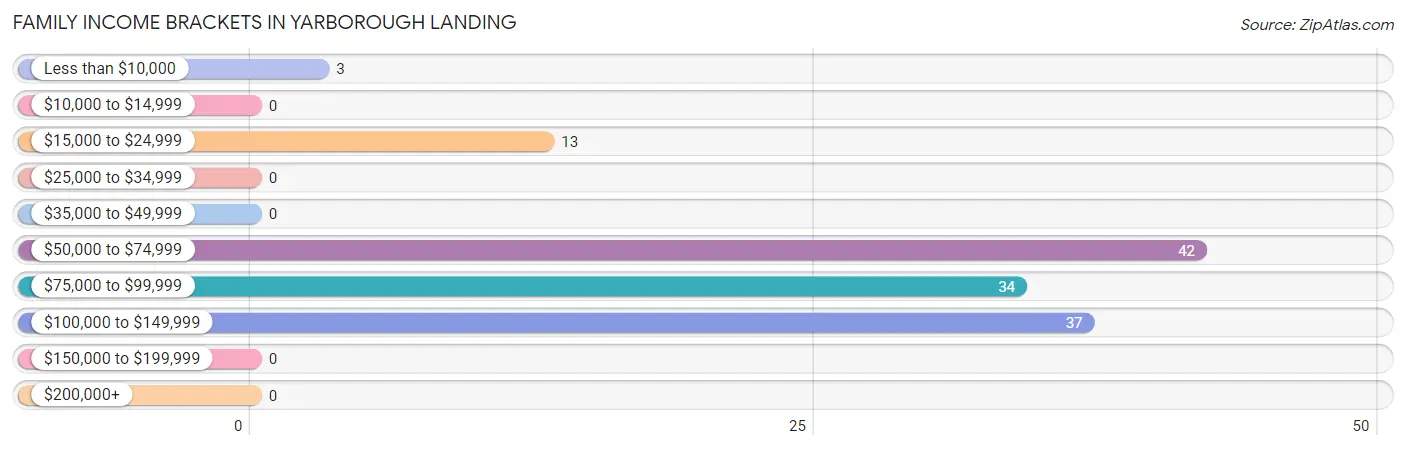
| Income Bracket | # Families | % Families |
| Less than $10,000 | 3 | 2.3% |
| $10,000 to $14,999 | 0 | 0.0% |
| $15,000 to $24,999 | 13 | 10.1% |
| $25,000 to $34,999 | 0 | 0.0% |
| $35,000 to $49,999 | 0 | 0.0% |
| $50,000 to $74,999 | 42 | 32.6% |
| $75,000 to $99,999 | 34 | 26.4% |
| $100,000 to $149,999 | 37 | 28.7% |
| $150,000 to $199,999 | 0 | 0.0% |
| $200,000+ | 0 | 0.0% |
Family Income by Famaliy Size in Yarborough Landing
2-person families (102 | 79.1%) account for the highest median family income in Yarborough Landing with $62,065 per family, while 2-person families (102 | 79.1%) have the highest median income of $31,032 per family member.
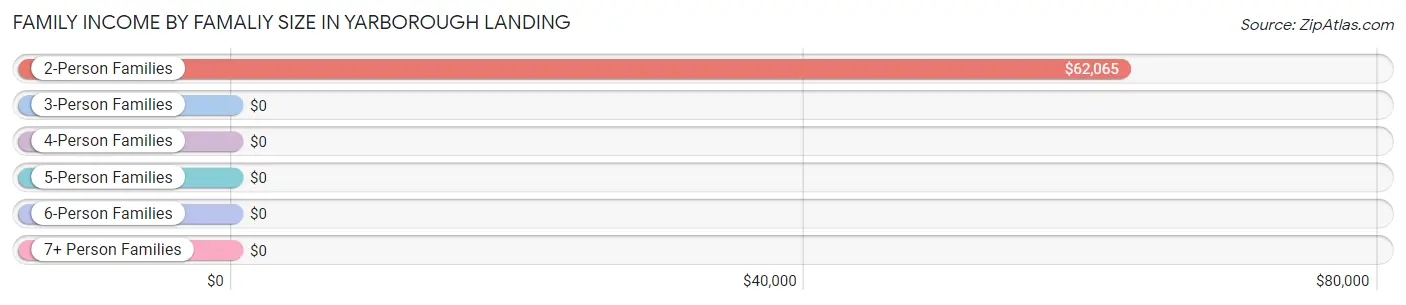
| Income Bracket | # Families | Median Income |
| 2-Person Families | 102 (79.1%) | $62,065 |
| 3-Person Families | 3 (2.3%) | $0 |
| 4-Person Families | 24 (18.6%) | $0 |
| 5-Person Families | 0 (0.0%) | $0 |
| 6-Person Families | 0 (0.0%) | $0 |
| 7+ Person Families | 0 (0.0%) | $0 |
| Total | 129 (100.0%) | $78,080 |
Family Income by Number of Earners in Yarborough Landing
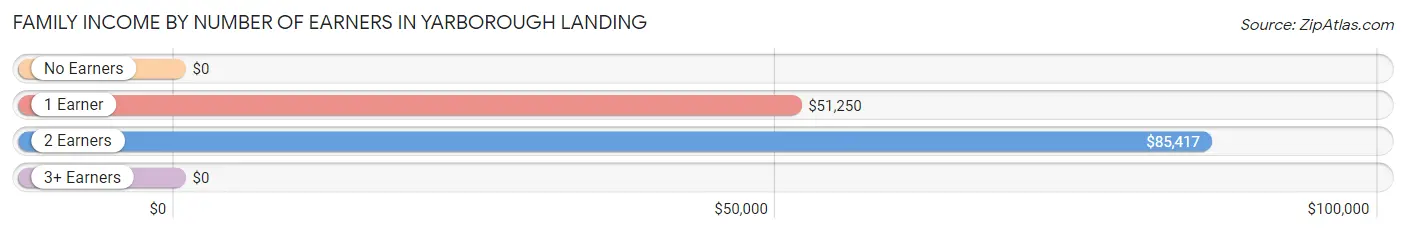
| Number of Earners | # Families | Median Income |
| No Earners | 26 (20.2%) | $0 |
| 1 Earner | 45 (34.9%) | $51,250 |
| 2 Earners | 58 (45.0%) | $85,417 |
| 3+ Earners | 0 (0.0%) | $0 |
| Total | 129 (100.0%) | $78,080 |
Household Income in Yarborough Landing
Household Income Brackets in Yarborough Landing
With 53 households falling in the category, the $50,000 to $74,999 income range is the most frequent in Yarborough Landing, accounting for 25.1% of all households.
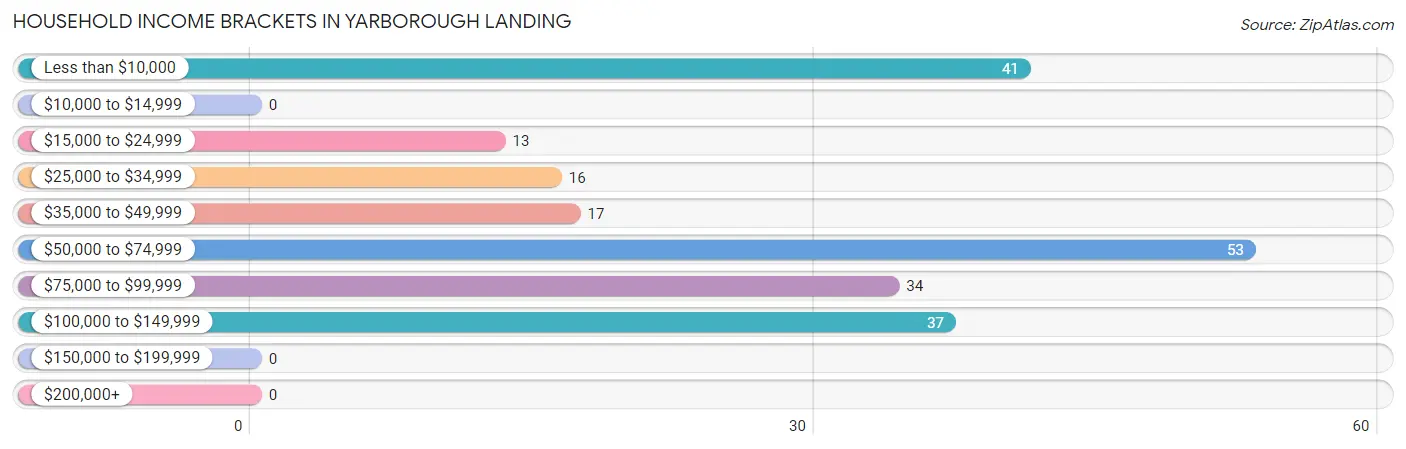
| Income Bracket | # Households | % Households |
| Less than $10,000 | 41 | 19.4% |
| $10,000 to $14,999 | 0 | 0.0% |
| $15,000 to $24,999 | 13 | 6.2% |
| $25,000 to $34,999 | 16 | 7.6% |
| $35,000 to $49,999 | 17 | 8.1% |
| $50,000 to $74,999 | 53 | 25.1% |
| $75,000 to $99,999 | 34 | 16.1% |
| $100,000 to $149,999 | 37 | 17.5% |
| $150,000 to $199,999 | 0 | 0.0% |
| $200,000+ | 0 | 0.0% |
Household Income by Householder Age in Yarborough Landing
The median household income in Yarborough Landing is $51,542, with the highest median household income of $77,768 found in the 45 to 64 years age bracket for the primary householder. A total of 62 households (29.4%) fall into this category.
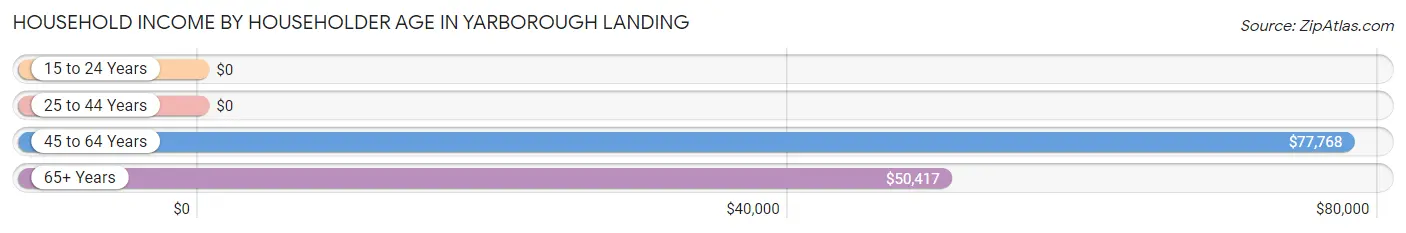
| Income Bracket | # Households | Median Income |
| 15 to 24 Years | 0 (0.0%) | $0 |
| 25 to 44 Years | 27 (12.8%) | $0 |
| 45 to 64 Years | 62 (29.4%) | $77,768 |
| 65+ Years | 122 (57.8%) | $50,417 |
| Total | 211 (100.0%) | $51,542 |
Poverty in Yarborough Landing
Income Below Poverty by Sex and Age in Yarborough Landing
With 25.1% poverty level for males and 11.5% for females among the residents of Yarborough Landing, 55 to 64 year old males and under 5 year old females are the most vulnerable to poverty, with 17 males (37.8%) and 2 females (100.0%) in their respective age groups living below the poverty level.
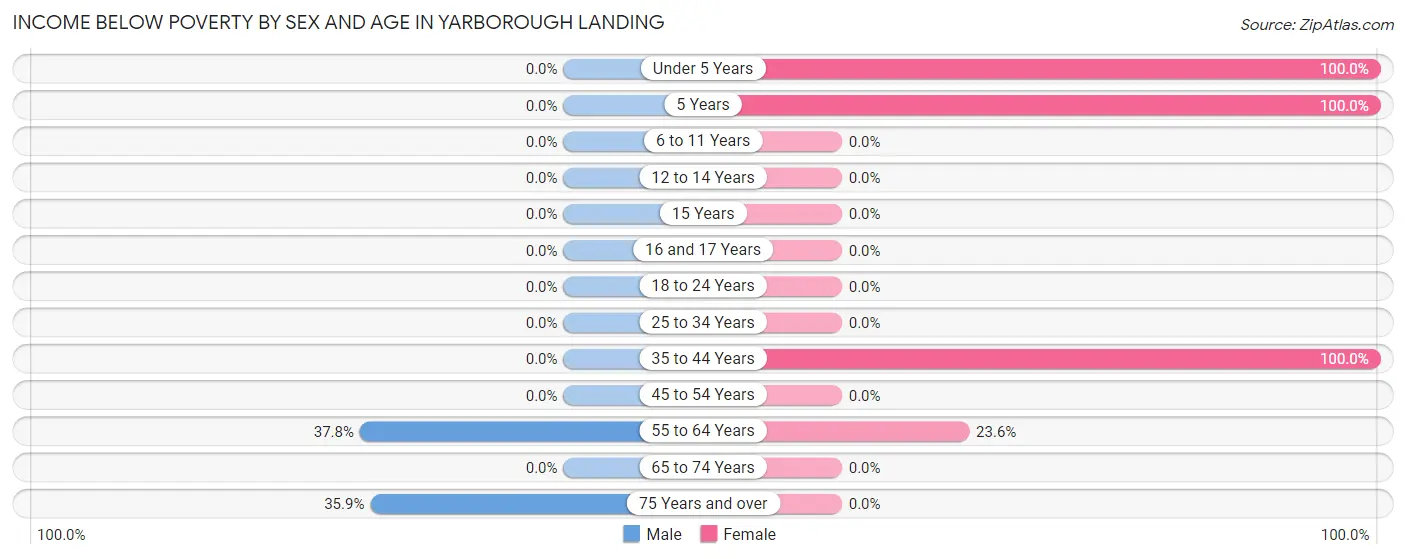
| Age Bracket | Male | Female |
| Under 5 Years | 0 (0.0%) | 2 (100.0%) |
| 5 Years | 0 (0.0%) | 3 (100.0%) |
| 6 to 11 Years | 0 (0.0%) | 0 (0.0%) |
| 12 to 14 Years | 0 (0.0%) | 0 (0.0%) |
| 15 Years | 0 (0.0%) | 0 (0.0%) |
| 16 and 17 Years | 0 (0.0%) | 0 (0.0%) |
| 18 to 24 Years | 0 (0.0%) | 0 (0.0%) |
| 25 to 34 Years | 0 (0.0%) | 0 (0.0%) |
| 35 to 44 Years | 0 (0.0%) | 3 (100.0%) |
| 45 to 54 Years | 0 (0.0%) | 0 (0.0%) |
| 55 to 64 Years | 17 (37.8%) | 13 (23.6%) |
| 65 to 74 Years | 0 (0.0%) | 0 (0.0%) |
| 75 Years and over | 38 (35.8%) | 0 (0.0%) |
| Total | 55 (25.1%) | 21 (11.5%) |
Income Above Poverty by Sex and Age in Yarborough Landing
According to the poverty statistics in Yarborough Landing, males aged 6 to 11 years and females aged 25 to 34 years are the age groups that are most secure financially, with 100.0% of males and 100.0% of females in these age groups living above the poverty line.
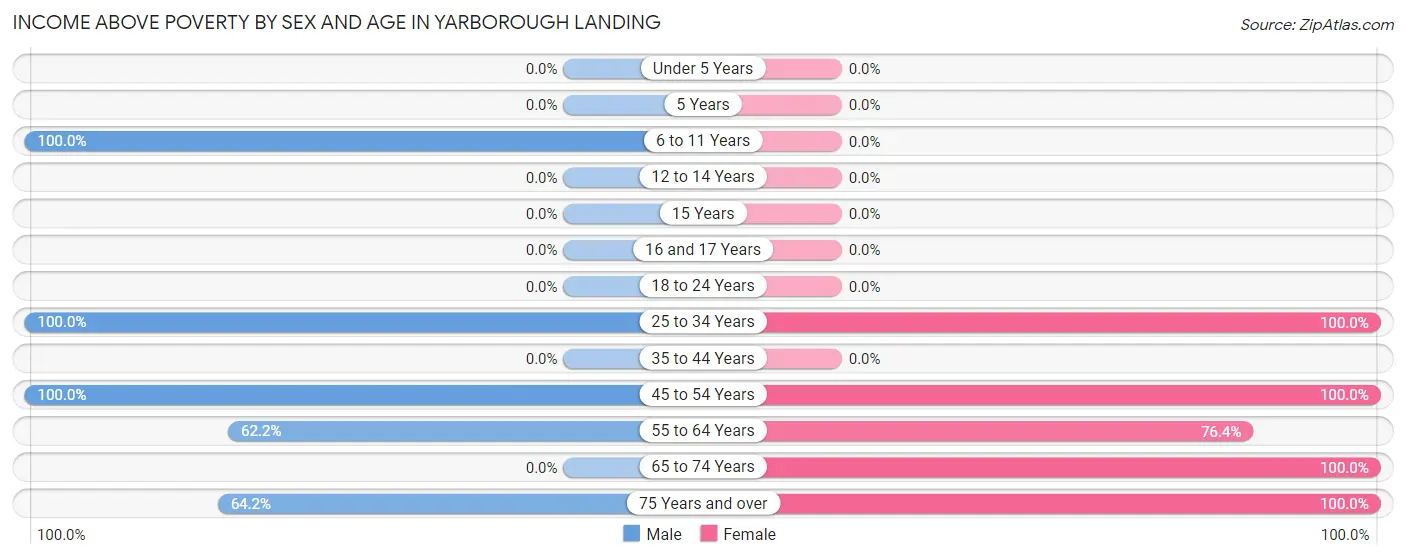
| Age Bracket | Male | Female |
| Under 5 Years | 0 (0.0%) | 0 (0.0%) |
| 5 Years | 0 (0.0%) | 0 (0.0%) |
| 6 to 11 Years | 38 (100.0%) | 0 (0.0%) |
| 12 to 14 Years | 0 (0.0%) | 0 (0.0%) |
| 15 Years | 0 (0.0%) | 0 (0.0%) |
| 16 and 17 Years | 0 (0.0%) | 0 (0.0%) |
| 18 to 24 Years | 0 (0.0%) | 0 (0.0%) |
| 25 to 34 Years | 24 (100.0%) | 21 (100.0%) |
| 35 to 44 Years | 0 (0.0%) | 0 (0.0%) |
| 45 to 54 Years | 6 (100.0%) | 23 (100.0%) |
| 55 to 64 Years | 28 (62.2%) | 42 (76.4%) |
| 65 to 74 Years | 0 (0.0%) | 30 (100.0%) |
| 75 Years and over | 68 (64.1%) | 46 (100.0%) |
| Total | 164 (74.9%) | 162 (88.5%) |
Income Below Poverty Among Married-Couple Families in Yarborough Landing
The poverty statistics for married-couple families in Yarborough Landing show that 10.3% or 13 of the total 126 families live below the poverty line. Families with no children have the highest poverty rate of 12.8%, comprising of 13 families. On the other hand, families with 1 or 2 children have the lowest poverty rate of 0.0%, which includes 0 families.
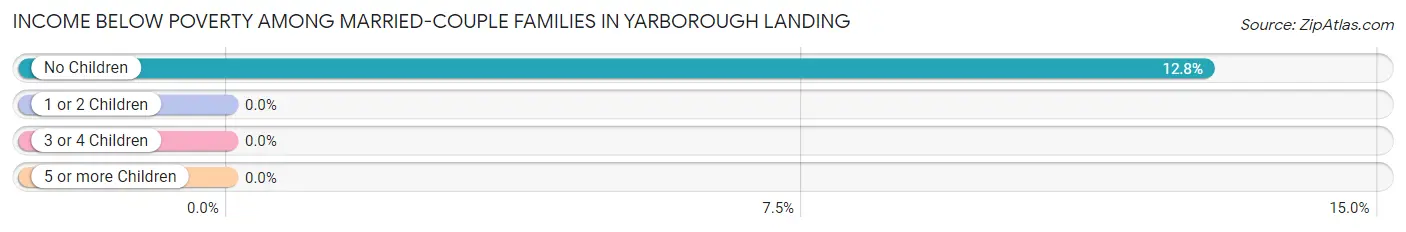
| Children | Above Poverty | Below Poverty |
| No Children | 89 (87.3%) | 13 (12.8%) |
| 1 or 2 Children | 24 (100.0%) | 0 (0.0%) |
| 3 or 4 Children | 0 (0.0%) | 0 (0.0%) |
| 5 or more Children | 0 (0.0%) | 0 (0.0%) |
| Total | 113 (89.7%) | 13 (10.3%) |
Income Below Poverty Among Single-Parent Households in Yarborough Landing
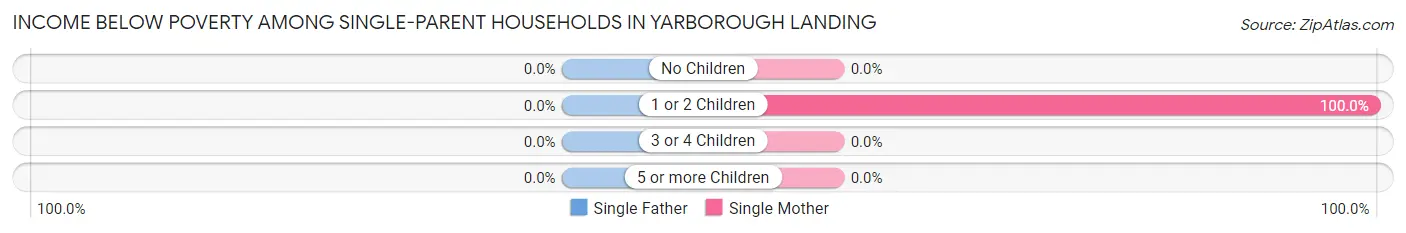
| Children | Single Father | Single Mother |
| No Children | 0 (0.0%) | 0 (0.0%) |
| 1 or 2 Children | 0 (0.0%) | 3 (100.0%) |
| 3 or 4 Children | 0 (0.0%) | 0 (0.0%) |
| 5 or more Children | 0 (0.0%) | 0 (0.0%) |
| Total | 0 (0.0%) | 3 (100.0%) |
Income Below Poverty Among Married-Couple vs Single-Parent Households in Yarborough Landing
The poverty data for Yarborough Landing shows that 13 of the married-couple family households (10.3%) and 3 of the single-parent households (100.0%) are living below the poverty level. Within the married-couple family households, those with no children have the highest poverty rate, with 13 households (12.8%) falling below the poverty line. Among the single-parent households, those with 1 or 2 children have the highest poverty rate, with 3 household (100.0%) living below poverty.
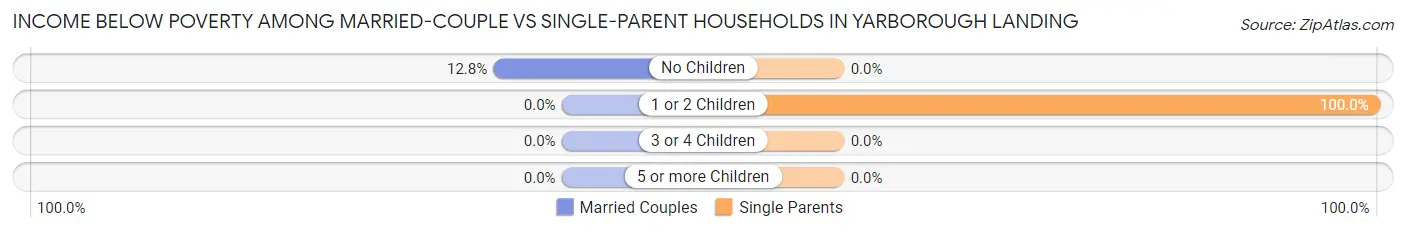
| Children | Married-Couple Families | Single-Parent Households |
| No Children | 13 (12.8%) | 0 (0.0%) |
| 1 or 2 Children | 0 (0.0%) | 3 (100.0%) |
| 3 or 4 Children | 0 (0.0%) | 0 (0.0%) |
| 5 or more Children | 0 (0.0%) | 0 (0.0%) |
| Total | 13 (10.3%) | 3 (100.0%) |
Race in Yarborough Landing
The most populous races in Yarborough Landing are , and White / Caucasian (402 | 100.0%).
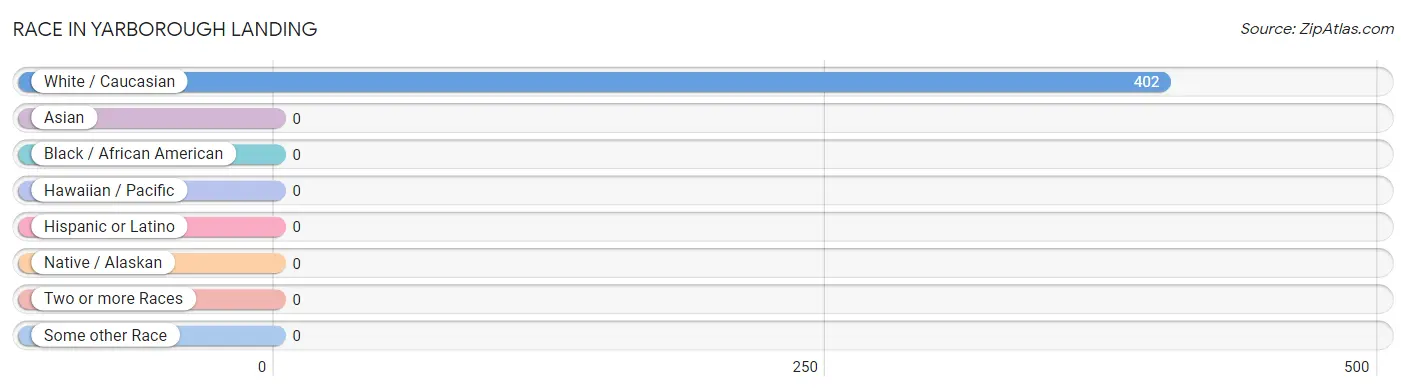
| Race | # Population | % Population |
| Asian | 0 | 0.0% |
| Black / African American | 0 | 0.0% |
| Hawaiian / Pacific | 0 | 0.0% |
| Hispanic or Latino | 0 | 0.0% |
| Native / Alaskan | 0 | 0.0% |
| White / Caucasian | 402 | 100.0% |
| Two or more Races | 0 | 0.0% |
| Some other Race | 0 | 0.0% |
| Total | 402 | 100.0% |
Ancestry in Yarborough Landing
The most populous ancestries reported in Yarborough Landing are American (70 | 17.4%), French (70 | 17.4%), Russian (28 | 7.0%), German (22 | 5.5%), and Irish (10 | 2.5%), together accounting for 49.7% of all Yarborough Landing residents.
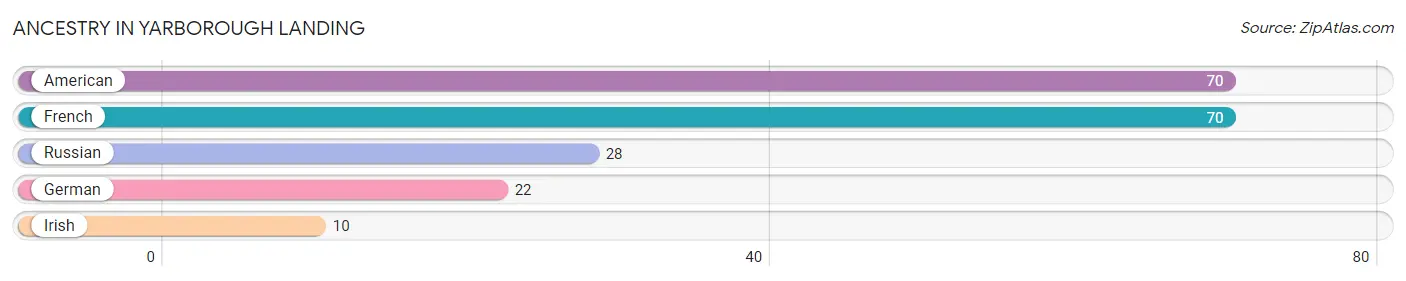
| Ancestry | # Population | % Population |
| American | 70 | 17.4% |
| French | 70 | 17.4% |
| German | 22 | 5.5% |
| Irish | 10 | 2.5% |
| Russian | 28 | 7.0% | View All 5 Rows |
Immigrants in Yarborough Landing

| Immigration Origin | # Population | % Population | View All 0 Rows |
Sex and Age in Yarborough Landing
Sex and Age in Yarborough Landing
The most populous age groups in Yarborough Landing are 75 to 79 Years (44 | 20.1%) for men and 75 to 79 Years (46 | 25.1%) for women.
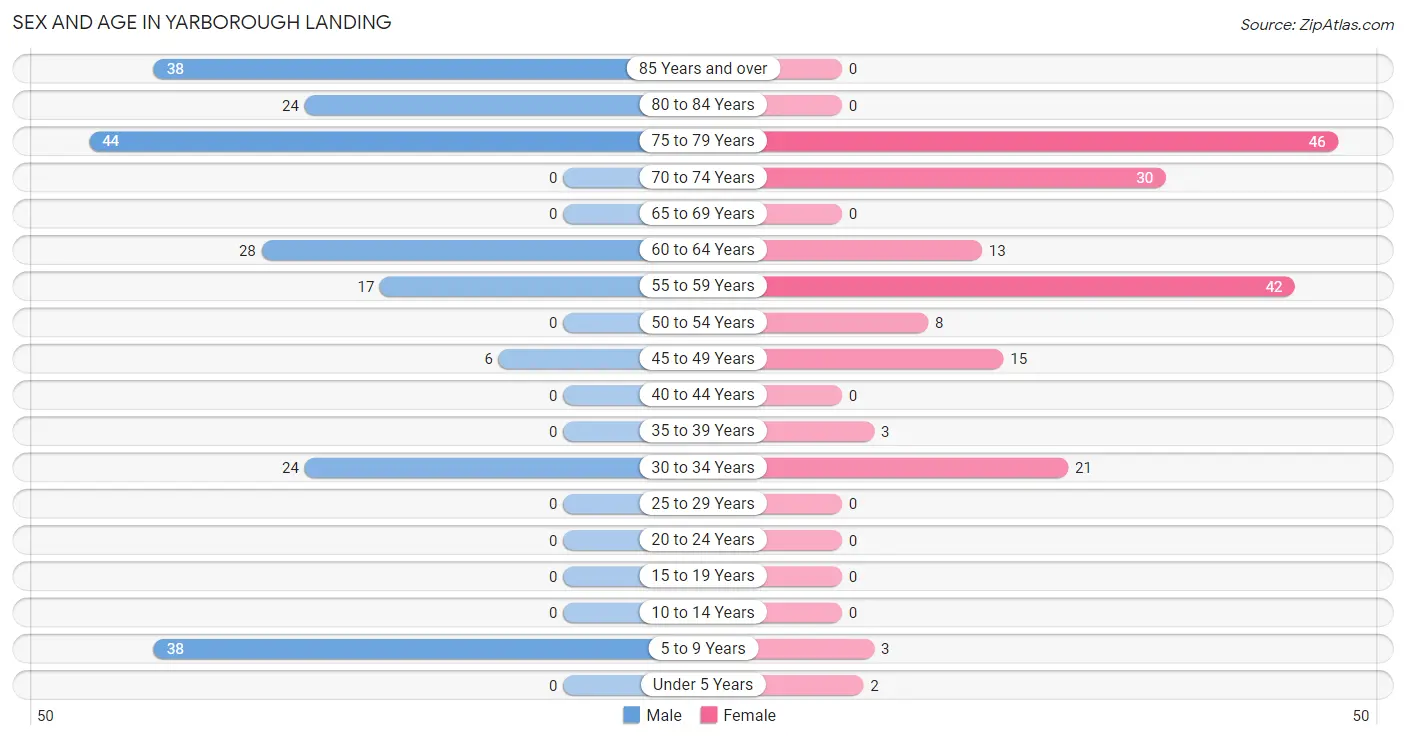
| Age Bracket | Male | Female |
| Under 5 Years | 0 (0.0%) | 2 (1.1%) |
| 5 to 9 Years | 38 (17.3%) | 3 (1.6%) |
| 10 to 14 Years | 0 (0.0%) | 0 (0.0%) |
| 15 to 19 Years | 0 (0.0%) | 0 (0.0%) |
| 20 to 24 Years | 0 (0.0%) | 0 (0.0%) |
| 25 to 29 Years | 0 (0.0%) | 0 (0.0%) |
| 30 to 34 Years | 24 (11.0%) | 21 (11.5%) |
| 35 to 39 Years | 0 (0.0%) | 3 (1.6%) |
| 40 to 44 Years | 0 (0.0%) | 0 (0.0%) |
| 45 to 49 Years | 6 (2.7%) | 15 (8.2%) |
| 50 to 54 Years | 0 (0.0%) | 8 (4.4%) |
| 55 to 59 Years | 17 (7.8%) | 42 (23.0%) |
| 60 to 64 Years | 28 (12.8%) | 13 (7.1%) |
| 65 to 69 Years | 0 (0.0%) | 0 (0.0%) |
| 70 to 74 Years | 0 (0.0%) | 30 (16.4%) |
| 75 to 79 Years | 44 (20.1%) | 46 (25.1%) |
| 80 to 84 Years | 24 (11.0%) | 0 (0.0%) |
| 85 Years and over | 38 (17.3%) | 0 (0.0%) |
| Total | 219 (100.0%) | 183 (100.0%) |
Families and Households in Yarborough Landing
Median Family Size in Yarborough Landing
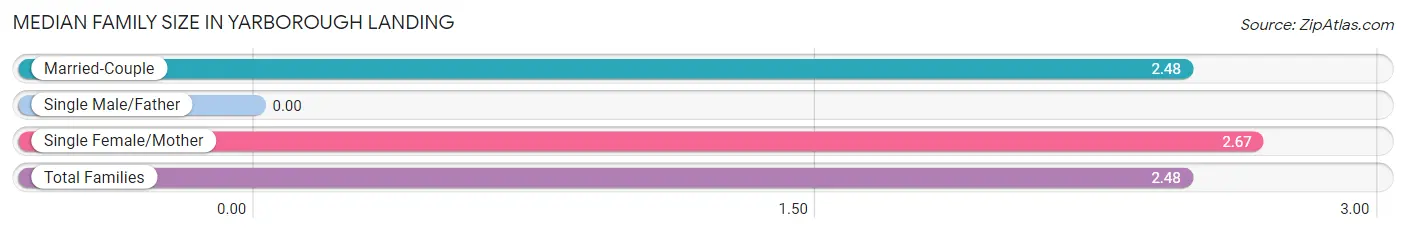
| Family Type | # Families | Family Size |
| Married-Couple | 126 (97.7%) | 2.48 |
| Single Male/Father | 0 (0.0%) | - |
| Single Female/Mother | 3 (2.3%) | 2.67 |
| Total Families | 129 (100.0%) | 2.48 |
Median Household Size in Yarborough Landing
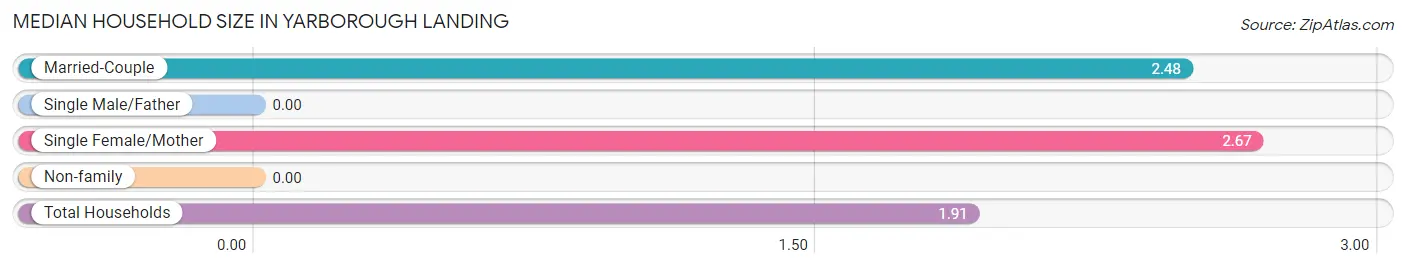
| Household Type | # Households | Household Size |
| Married-Couple | 126 (59.7%) | 2.48 |
| Single Male/Father | 0 (0.0%) | - |
| Single Female/Mother | 3 (1.4%) | 2.67 |
| Non-family | 82 (38.9%) | - |
| Total Households | 211 (100.0%) | 1.91 |
Household Size by Marriage Status in Yarborough Landing
Out of a total of 211 households in Yarborough Landing, 129 (61.1%) are family households, while 82 (38.9%) are nonfamily households. The most numerous type of family households are 2-person households, comprising 102, and the most common type of nonfamily households are 1-person households, comprising 82.
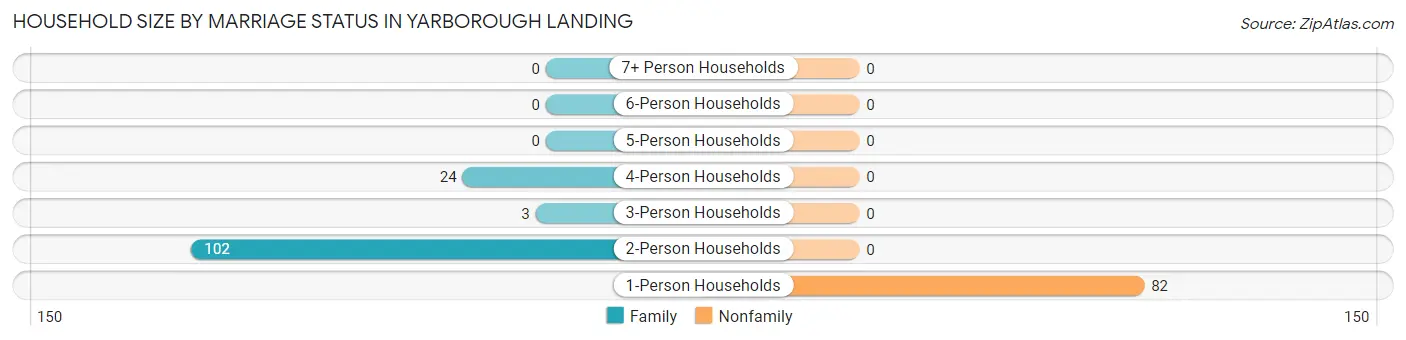
| Household Size | Family Households | Nonfamily Households |
| 1-Person Households | - | 82 (38.9%) |
| 2-Person Households | 102 (48.3%) | 0 (0.0%) |
| 3-Person Households | 3 (1.4%) | 0 (0.0%) |
| 4-Person Households | 24 (11.4%) | 0 (0.0%) |
| 5-Person Households | 0 (0.0%) | 0 (0.0%) |
| 6-Person Households | 0 (0.0%) | 0 (0.0%) |
| 7+ Person Households | 0 (0.0%) | 0 (0.0%) |
| Total | 129 (61.1%) | 82 (38.9%) |
Female Fertility in Yarborough Landing
Fertility by Age in Yarborough Landing
| Age Bracket | Women with Births | Births / 1,000 Women |
| 15 to 19 years | 0 (0.0%) | 0.0 |
| 20 to 34 years | 0 (0.0%) | 0.0 |
| 35 to 50 years | 0 (0.0%) | 0.0 |
| Total | 0 (0.0%) | 0.0 |
Fertility by Age by Marriage Status in Yarborough Landing
| Age Bracket | Married | Unmarried |
| 15 to 19 years | 0 (0.0%) | 0 (0.0%) |
| 20 to 34 years | 0 (0.0%) | 0 (0.0%) |
| 35 to 50 years | 0 (0.0%) | 0 (0.0%) |
| Total | 0 (0.0%) | 0 (0.0%) |
Fertility by Education in Yarborough Landing
| Educational Attainment | Women with Births | Births / 1,000 Women |
| Less than High School | 0 (0.0%) | 0.0 |
| High School Diploma | 0 (0.0%) | 0.0 |
| College or Associate's Degree | 0 (0.0%) | 0.0 |
| Bachelor's Degree | 0 (0.0%) | 0.0 |
| Graduate Degree | 0 (0.0%) | 0.0 |
| Total | 0 (0.0%) | 0.0 |
Fertility by Education by Marriage Status in Yarborough Landing
| Educational Attainment | Married | Unmarried |
| Less than High School | 0 (0.0%) | 0 (0.0%) |
| High School Diploma | 0 (0.0%) | 0 (0.0%) |
| College or Associate's Degree | 0 (0.0%) | 0 (0.0%) |
| Bachelor's Degree | 0 (0.0%) | 0 (0.0%) |
| Graduate Degree | 0 (0.0%) | 0 (0.0%) |
| Total | 0 (0.0%) | 0 (0.0%) |
Employment Characteristics in Yarborough Landing
Employment by Class of Employer in Yarborough Landing
Among the 187 employed individuals in Yarborough Landing, private company employees (108 | 57.8%), local government employees (48 | 25.7%), and self-employed (not incorporated) (16 | 8.6%) make up the most common classes of employment.
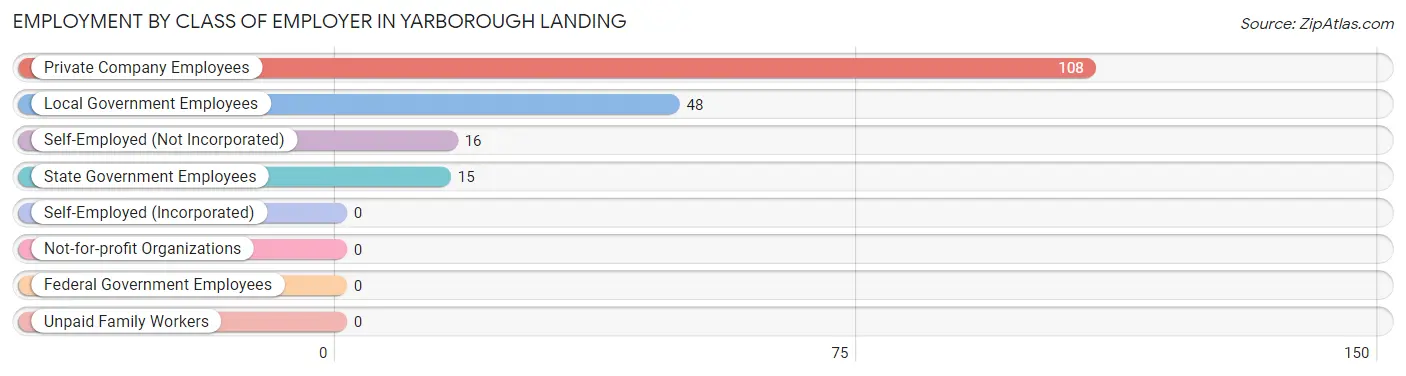
| Employer Class | # Employees | % Employees |
| Private Company Employees | 108 | 57.8% |
| Self-Employed (Incorporated) | 0 | 0.0% |
| Self-Employed (Not Incorporated) | 16 | 8.6% |
| Not-for-profit Organizations | 0 | 0.0% |
| Local Government Employees | 48 | 25.7% |
| State Government Employees | 15 | 8.0% |
| Federal Government Employees | 0 | 0.0% |
| Unpaid Family Workers | 0 | 0.0% |
| Total | 187 | 100.0% |
Employment Status by Age in Yarborough Landing
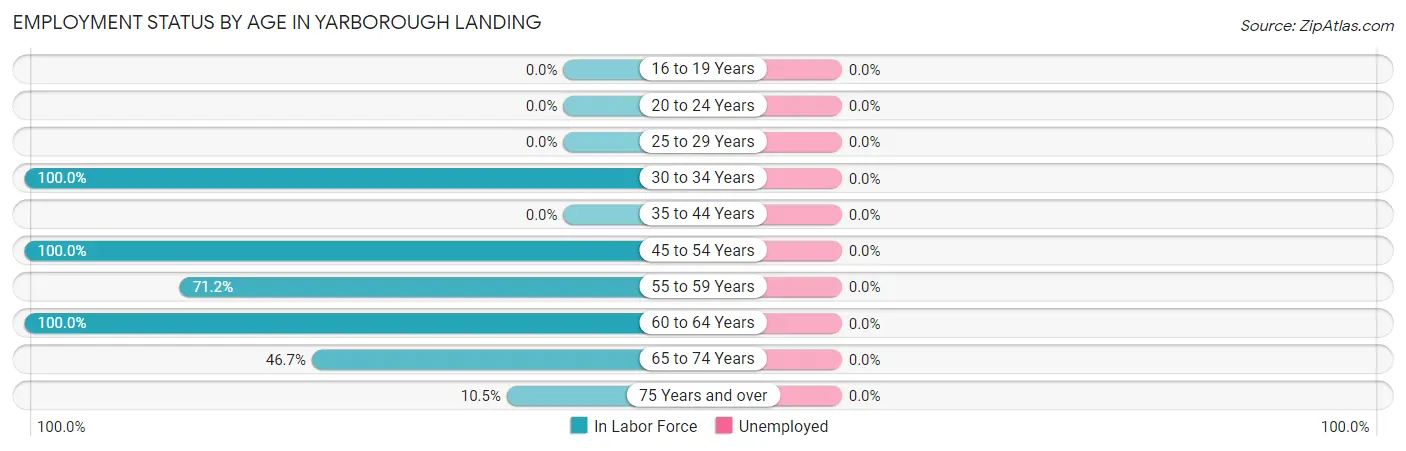
| Age Bracket | In Labor Force | Unemployed |
| 16 to 19 Years | 0 (0.0%) | 0 (0.0%) |
| 20 to 24 Years | 0 (0.0%) | 0 (0.0%) |
| 25 to 29 Years | 0 (0.0%) | 0 (0.0%) |
| 30 to 34 Years | 45 (100.0%) | 0 (0.0%) |
| 35 to 44 Years | 0 (0.0%) | 0 (0.0%) |
| 45 to 54 Years | 29 (100.0%) | 0 (0.0%) |
| 55 to 59 Years | 42 (71.2%) | 0 (0.0%) |
| 60 to 64 Years | 41 (100.0%) | 0 (0.0%) |
| 65 to 74 Years | 14 (46.7%) | 0 (0.0%) |
| 75 Years and over | 16 (10.5%) | 0 (0.0%) |
| Total | 187 (52.1%) | 0 (0.0%) |
Employment Status by Educational Attainment in Yarborough Landing
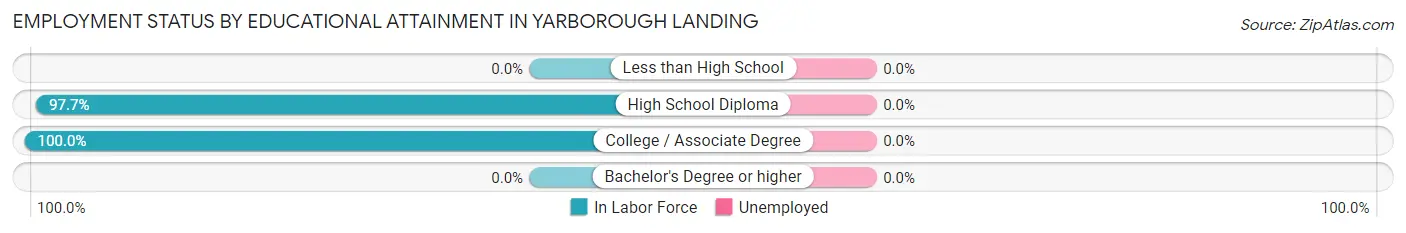
| Educational Attainment | In Labor Force | Unemployed |
| Less than High School | 0 (0.0%) | 0 (0.0%) |
| High School Diploma | 128 (97.7%) | 0 (0.0%) |
| College / Associate Degree | 29 (100.0%) | 0 (0.0%) |
| Bachelor's Degree or higher | 0 (0.0%) | 0 (0.0%) |
| Total | 157 (88.7%) | 0 (0.0%) |
Employment Occupations by Sex in Yarborough Landing
Management, Business, Science and Arts Occupations
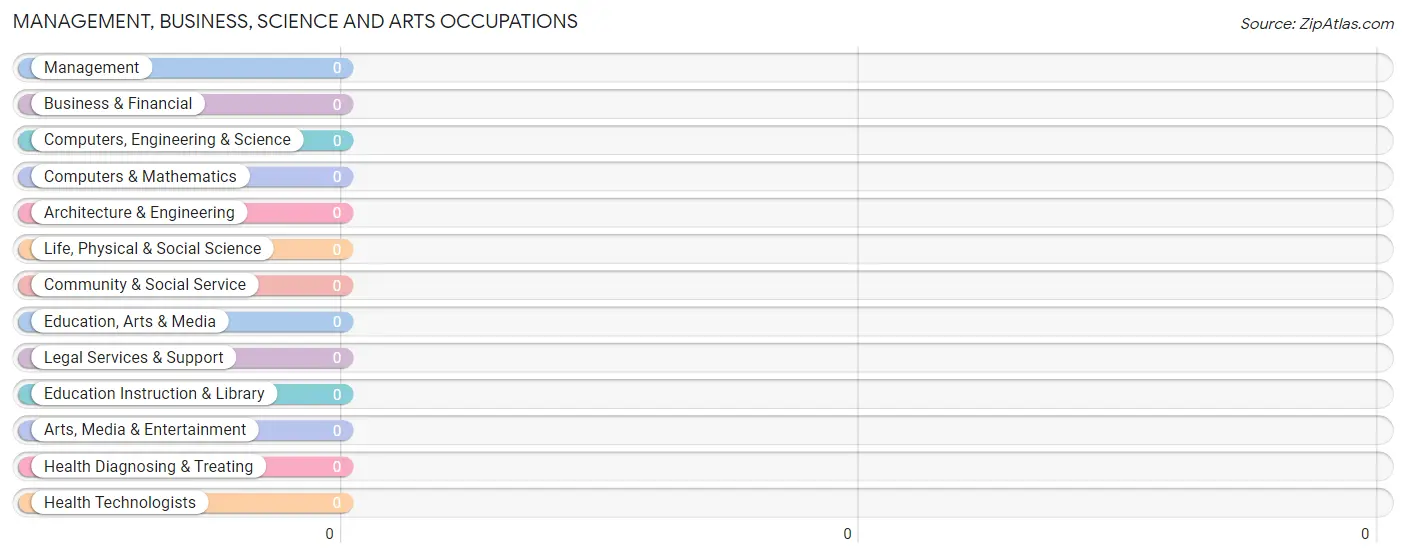
Management, Business, Science and Arts Occupations by Sex
| Occupation | Male | Female |
| Management | 0 (0.0%) | 0 (0.0%) |
| Business & Financial | 0 (0.0%) | 0 (0.0%) |
| Computers, Engineering & Science | 0 (0.0%) | 0 (0.0%) |
| Computers & Mathematics | 0 (0.0%) | 0 (0.0%) |
| Architecture & Engineering | 0 (0.0%) | 0 (0.0%) |
| Life, Physical & Social Science | 0 (0.0%) | 0 (0.0%) |
| Community & Social Service | 0 (0.0%) | 0 (0.0%) |
| Education, Arts & Media | 0 (0.0%) | 0 (0.0%) |
| Legal Services & Support | 0 (0.0%) | 0 (0.0%) |
| Education Instruction & Library | 0 (0.0%) | 0 (0.0%) |
| Arts, Media & Entertainment | 0 (0.0%) | 0 (0.0%) |
| Health Diagnosing & Treating | 0 (0.0%) | 0 (0.0%) |
| Health Technologists | 0 (0.0%) | 0 (0.0%) |
| Total (Category) | 0 (0.0%) | 0 (0.0%) |
| Total (Overall) | 58 (31.0%) | 129 (69.0%) |
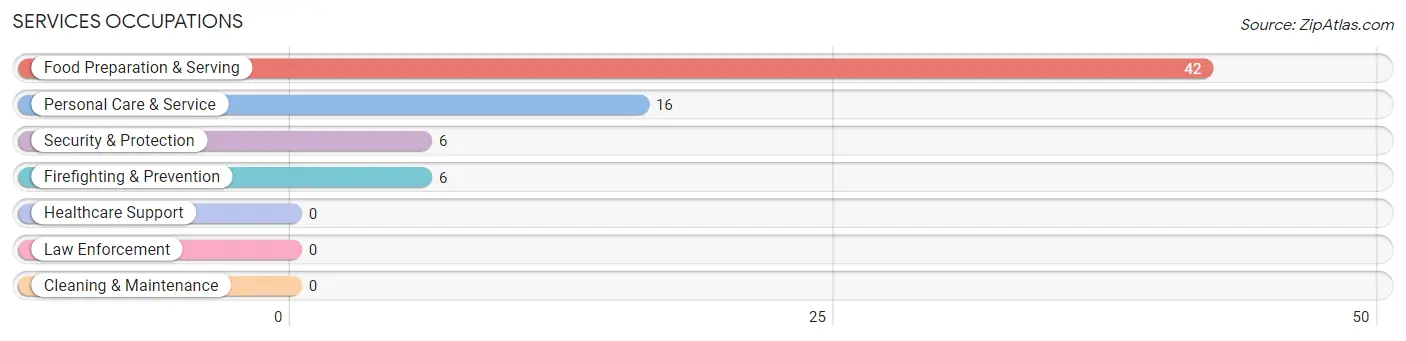
Services Occupations
The most common Services occupations in Yarborough Landing are Food Preparation & Serving (42 | 22.5%), Personal Care & Service (16 | 8.6%), Security & Protection (6 | 3.2%), and Firefighting & Prevention (6 | 3.2%).
Services Occupations by Sex
Within the Services occupations in Yarborough Landing, the most male-oriented occupations are Security & Protection (100.0%), and Firefighting & Prevention (100.0%), while the most female-oriented occupations are Food Preparation & Serving (100.0%), and Personal Care & Service (100.0%).
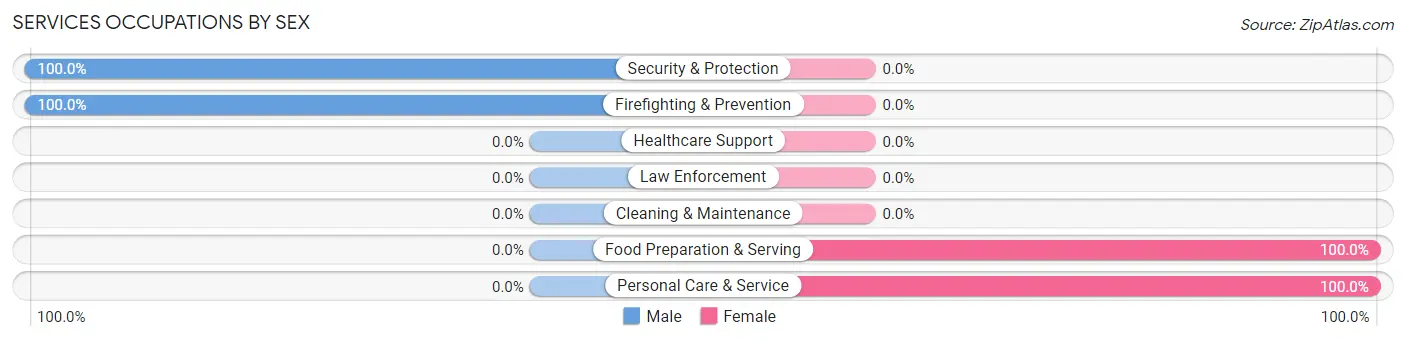
| Occupation | Male | Female |
| Healthcare Support | 0 (0.0%) | 0 (0.0%) |
| Security & Protection | 6 (100.0%) | 0 (0.0%) |
| Firefighting & Prevention | 6 (100.0%) | 0 (0.0%) |
| Law Enforcement | 0 (0.0%) | 0 (0.0%) |
| Food Preparation & Serving | 0 (0.0%) | 42 (100.0%) |
| Cleaning & Maintenance | 0 (0.0%) | 0 (0.0%) |
| Personal Care & Service | 0 (0.0%) | 16 (100.0%) |
| Total (Category) | 6 (9.4%) | 58 (90.6%) |
| Total (Overall) | 58 (31.0%) | 129 (69.0%) |
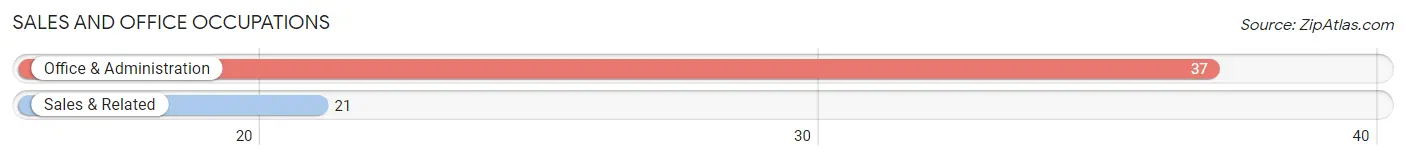
Sales and Office Occupations
The most common Sales and Office occupations in Yarborough Landing are Office & Administration (37 | 19.8%), and Sales & Related (21 | 11.2%).
Sales and Office Occupations by Sex
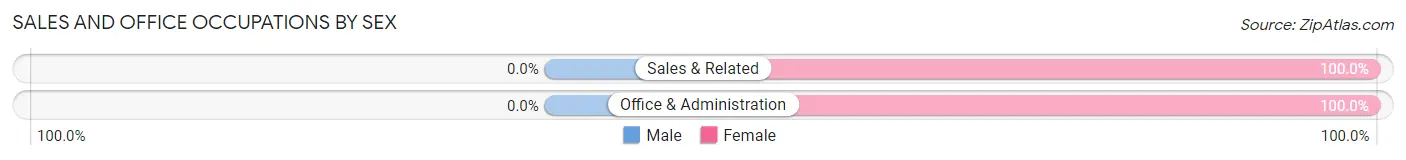
| Occupation | Male | Female |
| Sales & Related | 0 (0.0%) | 21 (100.0%) |
| Office & Administration | 0 (0.0%) | 37 (100.0%) |
| Total (Category) | 0 (0.0%) | 58 (100.0%) |
| Total (Overall) | 58 (31.0%) | 129 (69.0%) |
Natural Resources, Construction and Maintenance Occupations
The most common Natural Resources, Construction and Maintenance occupations in Yarborough Landing are , and Installation, Maintenance & Repair (52 | 27.8%).
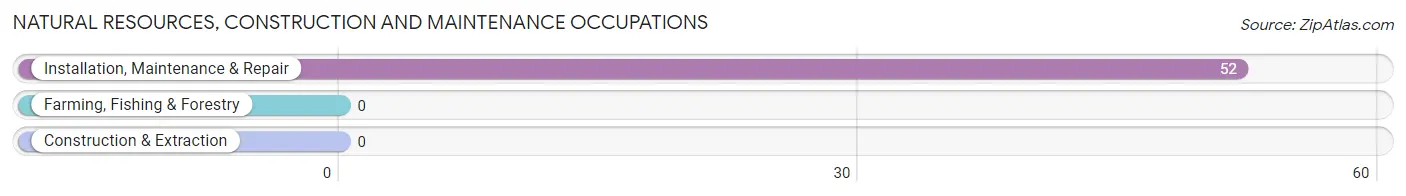
Natural Resources, Construction and Maintenance Occupations by Sex
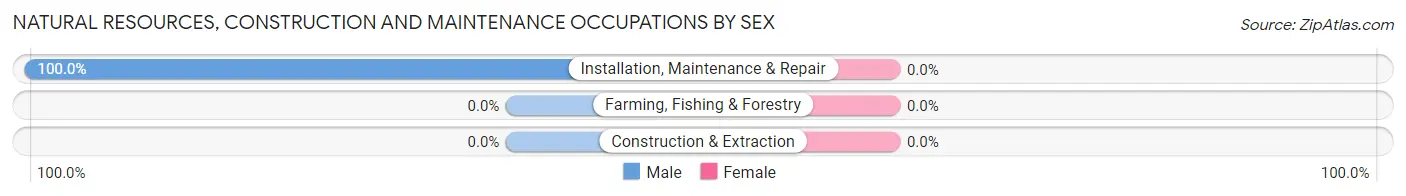
| Occupation | Male | Female |
| Farming, Fishing & Forestry | 0 (0.0%) | 0 (0.0%) |
| Construction & Extraction | 0 (0.0%) | 0 (0.0%) |
| Installation, Maintenance & Repair | 52 (100.0%) | 0 (0.0%) |
| Total (Category) | 52 (100.0%) | 0 (0.0%) |
| Total (Overall) | 58 (31.0%) | 129 (69.0%) |
Production, Transportation and Moving Occupations
The most common Production, Transportation and Moving occupations in Yarborough Landing are , and Material Moving (13 | 7.0%).
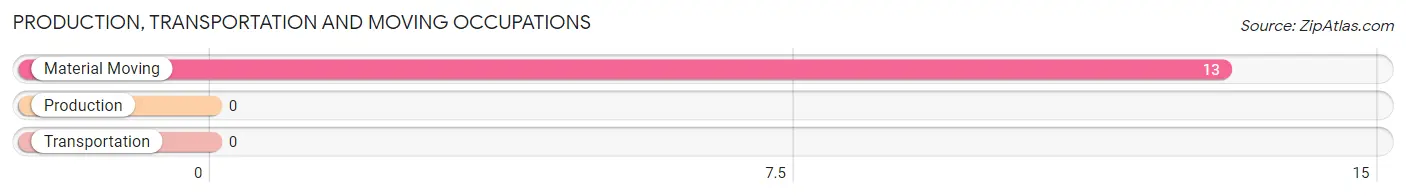
Production, Transportation and Moving Occupations by Sex
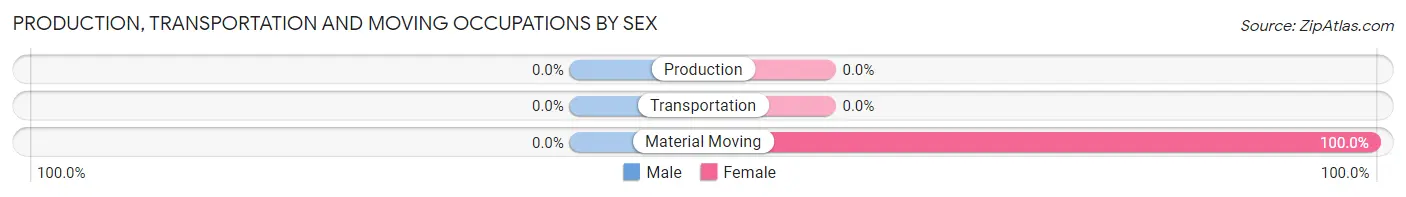
| Occupation | Male | Female |
| Production | 0 (0.0%) | 0 (0.0%) |
| Transportation | 0 (0.0%) | 0 (0.0%) |
| Material Moving | 0 (0.0%) | 13 (100.0%) |
| Total (Category) | 0 (0.0%) | 13 (100.0%) |
| Total (Overall) | 58 (31.0%) | 129 (69.0%) |
Employment Industries by Sex in Yarborough Landing
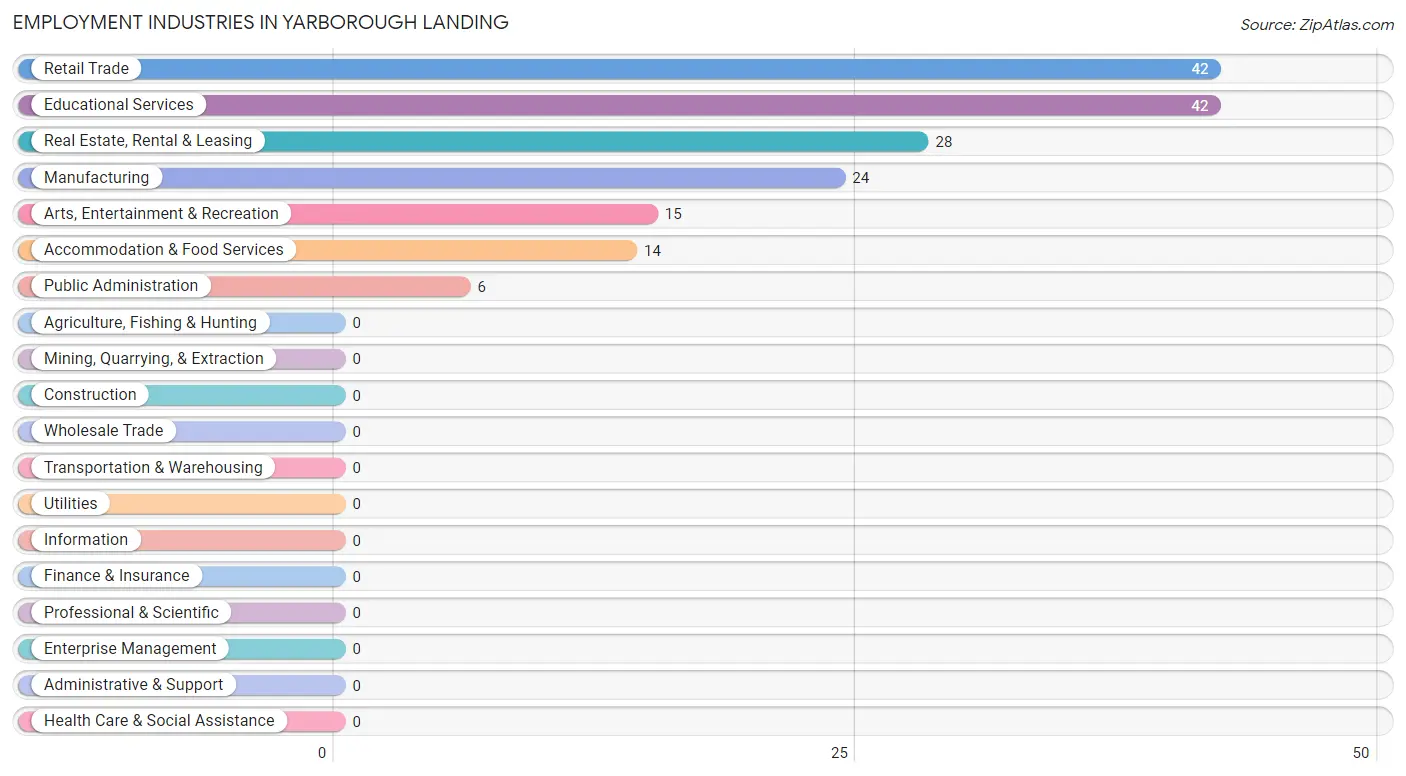
Employment Industries in Yarborough Landing
The major employment industries in Yarborough Landing include Retail Trade (42 | 22.5%), Educational Services (42 | 22.5%), Real Estate, Rental & Leasing (28 | 15.0%), Manufacturing (24 | 12.8%), and Arts, Entertainment & Recreation (15 | 8.0%).
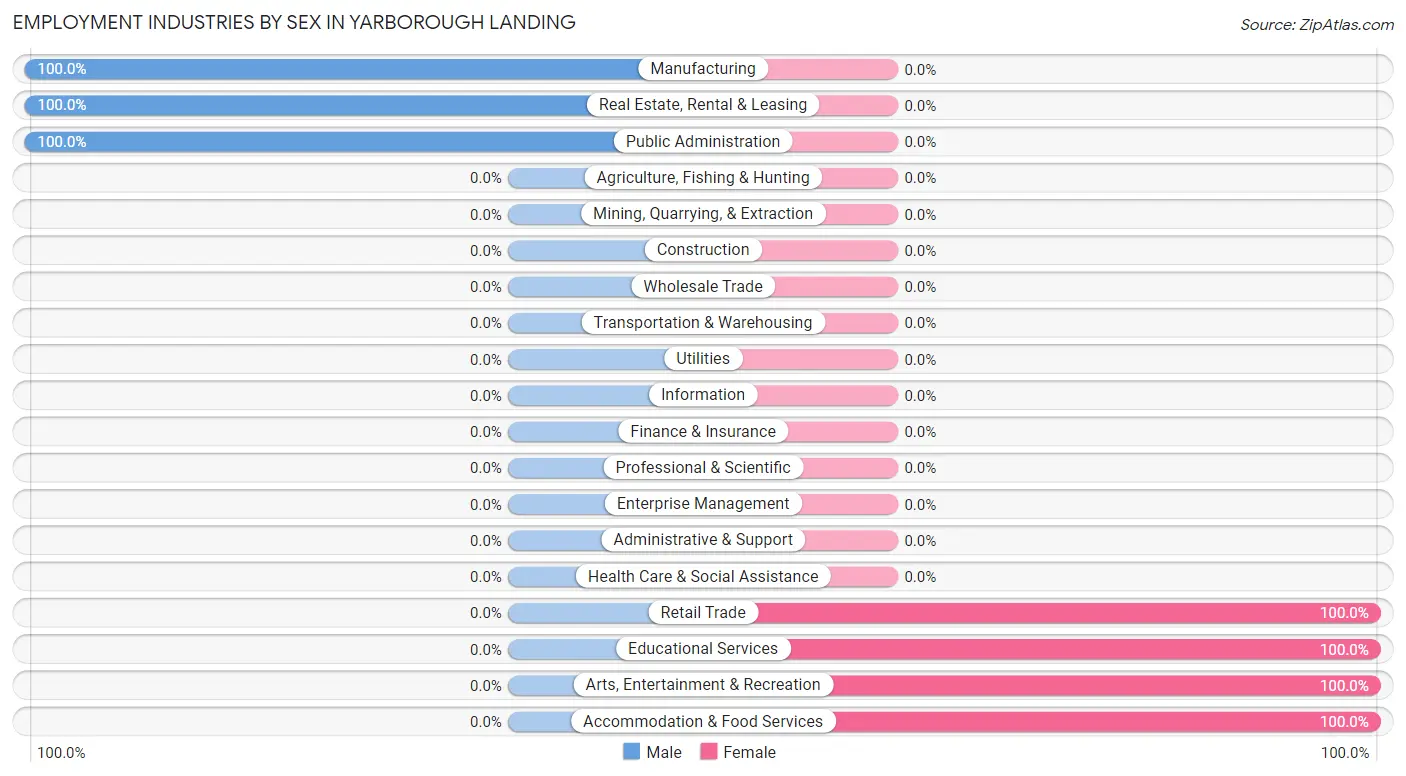
Employment Industries by Sex in Yarborough Landing
The Yarborough Landing industries that see more men than women are Manufacturing (100.0%), Real Estate, Rental & Leasing (100.0%), and Public Administration (100.0%), whereas the industries that tend to have a higher number of women are Retail Trade (100.0%), Educational Services (100.0%), and Arts, Entertainment & Recreation (100.0%).
| Industry | Male | Female |
| Agriculture, Fishing & Hunting | 0 (0.0%) | 0 (0.0%) |
| Mining, Quarrying, & Extraction | 0 (0.0%) | 0 (0.0%) |
| Construction | 0 (0.0%) | 0 (0.0%) |
| Manufacturing | 24 (100.0%) | 0 (0.0%) |
| Wholesale Trade | 0 (0.0%) | 0 (0.0%) |
| Retail Trade | 0 (0.0%) | 42 (100.0%) |
| Transportation & Warehousing | 0 (0.0%) | 0 (0.0%) |
| Utilities | 0 (0.0%) | 0 (0.0%) |
| Information | 0 (0.0%) | 0 (0.0%) |
| Finance & Insurance | 0 (0.0%) | 0 (0.0%) |
| Real Estate, Rental & Leasing | 28 (100.0%) | 0 (0.0%) |
| Professional & Scientific | 0 (0.0%) | 0 (0.0%) |
| Enterprise Management | 0 (0.0%) | 0 (0.0%) |
| Administrative & Support | 0 (0.0%) | 0 (0.0%) |
| Educational Services | 0 (0.0%) | 42 (100.0%) |
| Health Care & Social Assistance | 0 (0.0%) | 0 (0.0%) |
| Arts, Entertainment & Recreation | 0 (0.0%) | 15 (100.0%) |
| Accommodation & Food Services | 0 (0.0%) | 14 (100.0%) |
| Public Administration | 6 (100.0%) | 0 (0.0%) |
| Total | 58 (31.0%) | 129 (69.0%) |
Education in Yarborough Landing
School Enrollment in Yarborough Landing
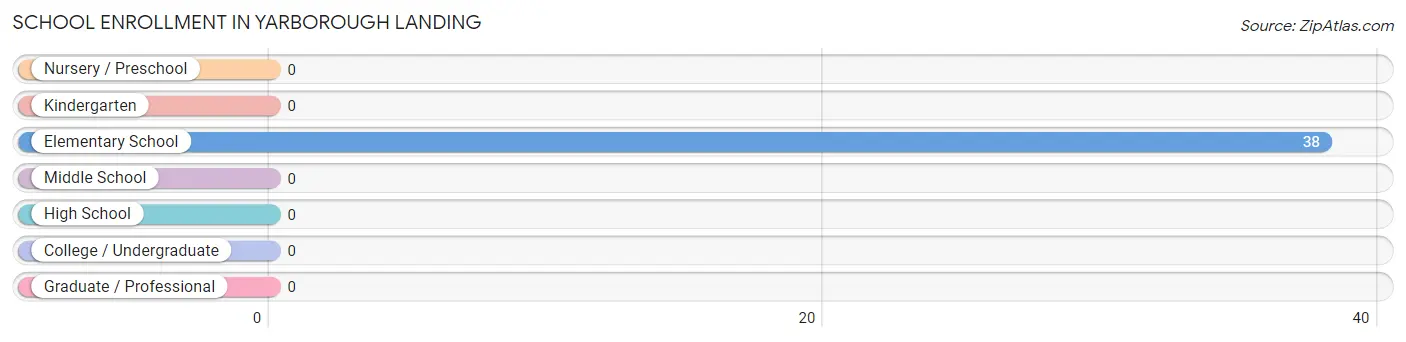
| School Level | # Students | % Students |
| Nursery / Preschool | 0 | 0.0% |
| Kindergarten | 0 | 0.0% |
| Elementary School | 38 | 100.0% |
| Middle School | 0 | 0.0% |
| High School | 0 | 0.0% |
| College / Undergraduate | 0 | 0.0% |
| Graduate / Professional | 0 | 0.0% |
| Total | 38 | 100.0% |
School Enrollment by Age by Funding Source in Yarborough Landing
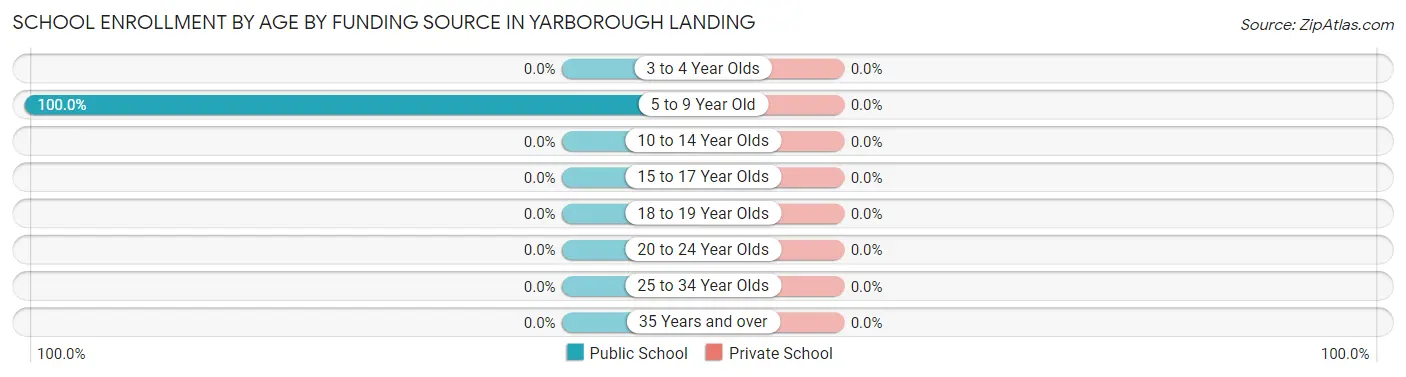
| Age Bracket | Public School | Private School |
| 3 to 4 Year Olds | 0 (0.0%) | 0 (0.0%) |
| 5 to 9 Year Old | 38 (100.0%) | 0 (0.0%) |
| 10 to 14 Year Olds | 0 (0.0%) | 0 (0.0%) |
| 15 to 17 Year Olds | 0 (0.0%) | 0 (0.0%) |
| 18 to 19 Year Olds | 0 (0.0%) | 0 (0.0%) |
| 20 to 24 Year Olds | 0 (0.0%) | 0 (0.0%) |
| 25 to 34 Year Olds | 0 (0.0%) | 0 (0.0%) |
| 35 Years and over | 0 (0.0%) | 0 (0.0%) |
| Total | 38 (100.0%) | 0 (0.0%) |
Educational Attainment by Field of Study in Yarborough Landing
, and education (30 | 100.0%) are the most common fields of study among 30 individuals in Yarborough Landing who have obtained a bachelor's degree or higher.
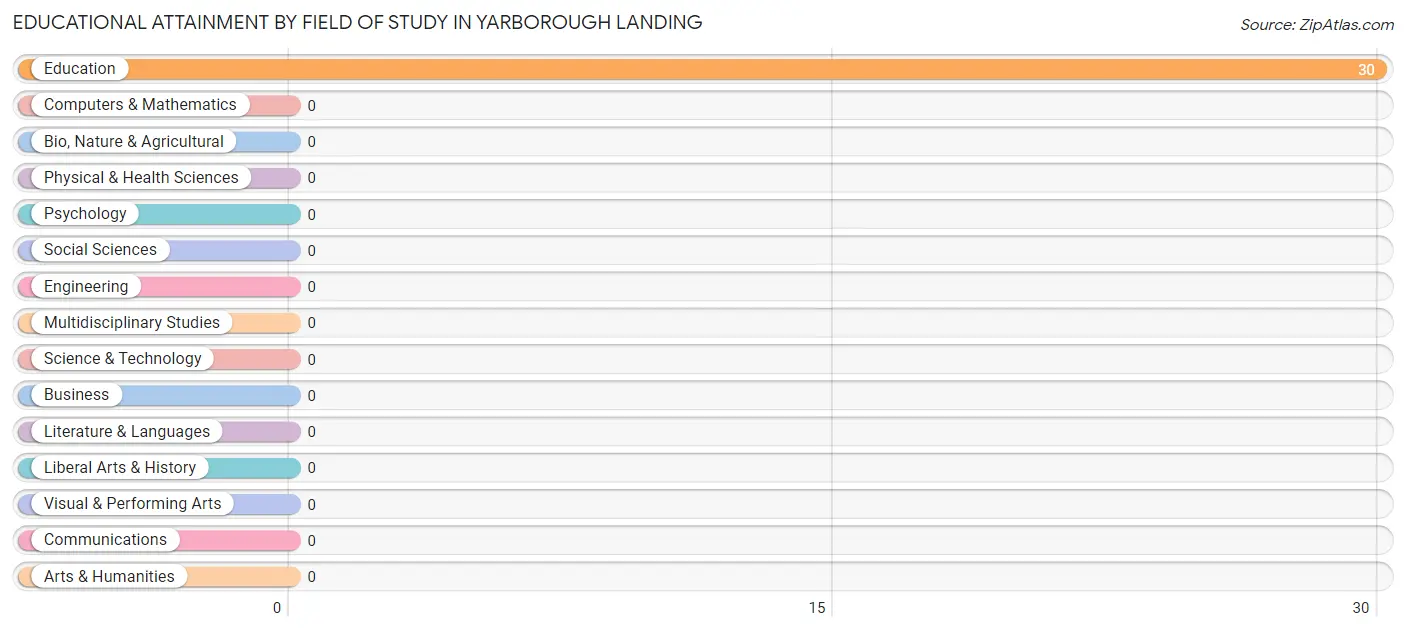
| Field of Study | # Graduates | % Graduates |
| Computers & Mathematics | 0 | 0.0% |
| Bio, Nature & Agricultural | 0 | 0.0% |
| Physical & Health Sciences | 0 | 0.0% |
| Psychology | 0 | 0.0% |
| Social Sciences | 0 | 0.0% |
| Engineering | 0 | 0.0% |
| Multidisciplinary Studies | 0 | 0.0% |
| Science & Technology | 0 | 0.0% |
| Business | 0 | 0.0% |
| Education | 30 | 100.0% |
| Literature & Languages | 0 | 0.0% |
| Liberal Arts & History | 0 | 0.0% |
| Visual & Performing Arts | 0 | 0.0% |
| Communications | 0 | 0.0% |
| Arts & Humanities | 0 | 0.0% |
| Total | 30 | 100.0% |
Transportation & Commute in Yarborough Landing
Vehicle Availability by Sex in Yarborough Landing
The most prevalent vehicle ownership categories in Yarborough Landing are males with 3 vehicles (34, accounting for 58.6%) and females with 3 vehicles (50, making up 26.4%).
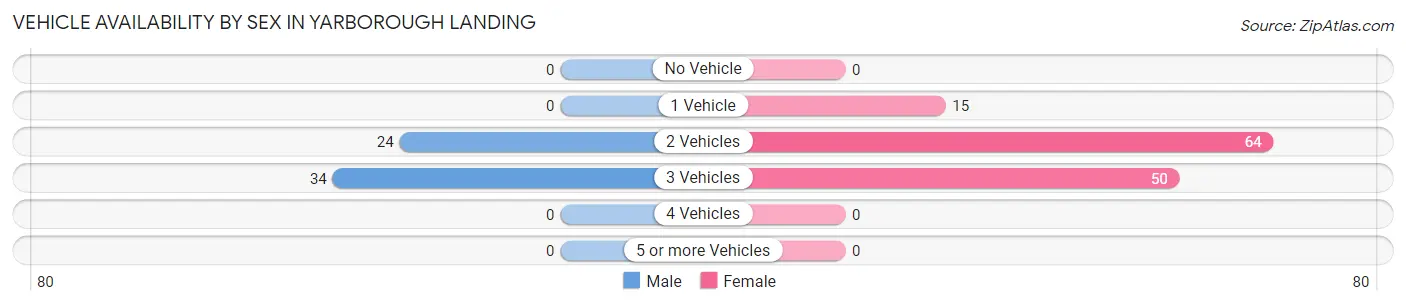
| Vehicles Available | Male | Female |
| No Vehicle | 0 (0.0%) | 0 (0.0%) |
| 1 Vehicle | 0 (0.0%) | 15 (11.6%) |
| 2 Vehicles | 24 (41.4%) | 64 (49.6%) |
| 3 Vehicles | 34 (58.6%) | 50 (38.8%) |
| 4 Vehicles | 0 (0.0%) | 0 (0.0%) |
| 5 or more Vehicles | 0 (0.0%) | 0 (0.0%) |
| Total | 58 (100.0%) | 129 (100.0%) |
Commute Time in Yarborough Landing
The most frequently occuring commute durations in Yarborough Landing are 45 to 59 minutes (94 commuters, 52.5%), 30 to 34 minutes (41 commuters, 22.9%), and 5 to 9 minutes (31 commuters, 17.3%).
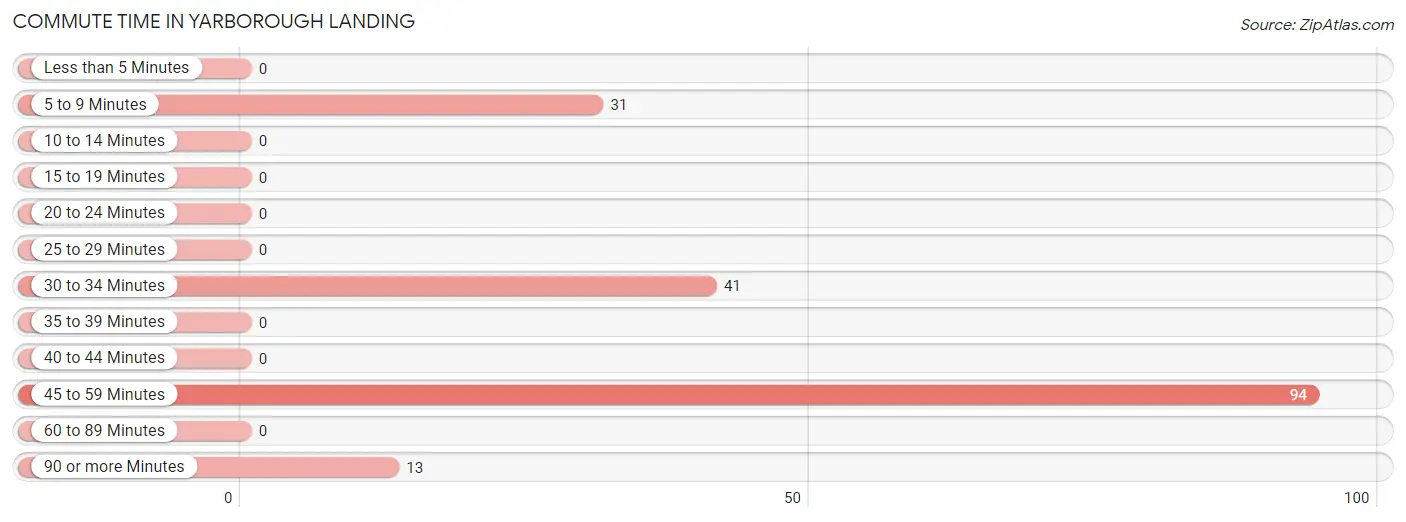
| Commute Time | # Commuters | % Commuters |
| Less than 5 Minutes | 0 | 0.0% |
| 5 to 9 Minutes | 31 | 17.3% |
| 10 to 14 Minutes | 0 | 0.0% |
| 15 to 19 Minutes | 0 | 0.0% |
| 20 to 24 Minutes | 0 | 0.0% |
| 25 to 29 Minutes | 0 | 0.0% |
| 30 to 34 Minutes | 41 | 22.9% |
| 35 to 39 Minutes | 0 | 0.0% |
| 40 to 44 Minutes | 0 | 0.0% |
| 45 to 59 Minutes | 94 | 52.5% |
| 60 to 89 Minutes | 0 | 0.0% |
| 90 or more Minutes | 13 | 7.3% |
Commute Time by Sex in Yarborough Landing
The most common commute times in Yarborough Landing are 45 to 59 minutes (52 commuters, 89.7%) for males and 45 to 59 minutes (42 commuters, 34.7%) for females.
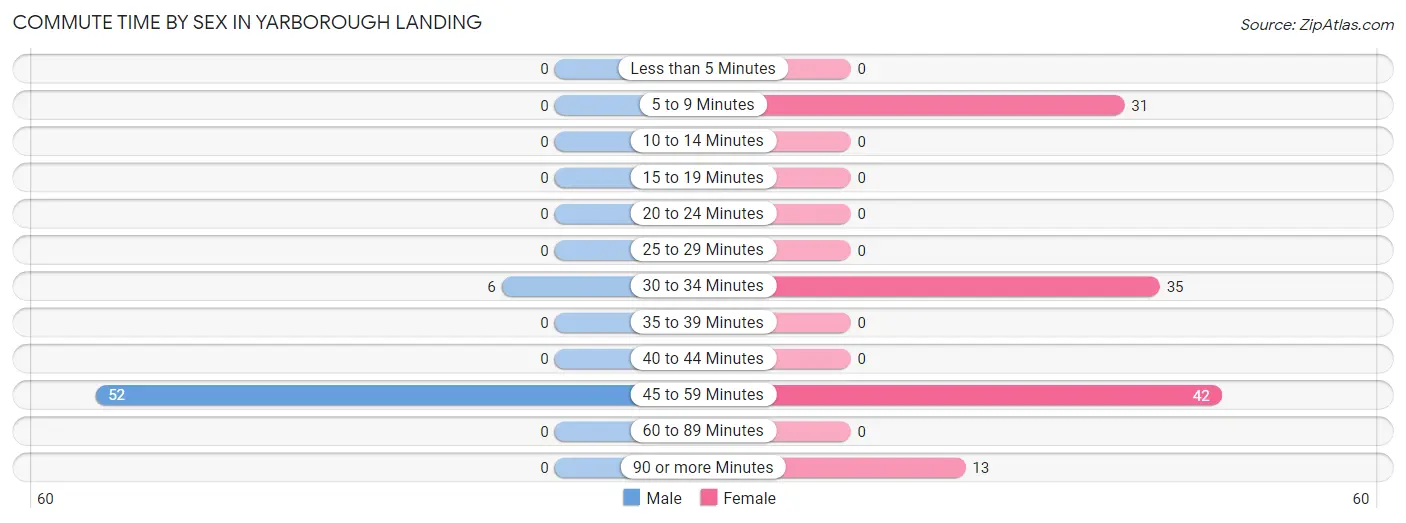
| Commute Time | Male | Female |
| Less than 5 Minutes | 0 (0.0%) | 0 (0.0%) |
| 5 to 9 Minutes | 0 (0.0%) | 31 (25.6%) |
| 10 to 14 Minutes | 0 (0.0%) | 0 (0.0%) |
| 15 to 19 Minutes | 0 (0.0%) | 0 (0.0%) |
| 20 to 24 Minutes | 0 (0.0%) | 0 (0.0%) |
| 25 to 29 Minutes | 0 (0.0%) | 0 (0.0%) |
| 30 to 34 Minutes | 6 (10.3%) | 35 (28.9%) |
| 35 to 39 Minutes | 0 (0.0%) | 0 (0.0%) |
| 40 to 44 Minutes | 0 (0.0%) | 0 (0.0%) |
| 45 to 59 Minutes | 52 (89.7%) | 42 (34.7%) |
| 60 to 89 Minutes | 0 (0.0%) | 0 (0.0%) |
| 90 or more Minutes | 0 (0.0%) | 13 (10.7%) |
Time of Departure to Work by Sex in Yarborough Landing
The most frequent times of departure to work in Yarborough Landing are 6:00 AM to 6:29 AM (34, 58.6%) for males and 5:00 AM to 5:29 AM (42, 34.7%) for females.
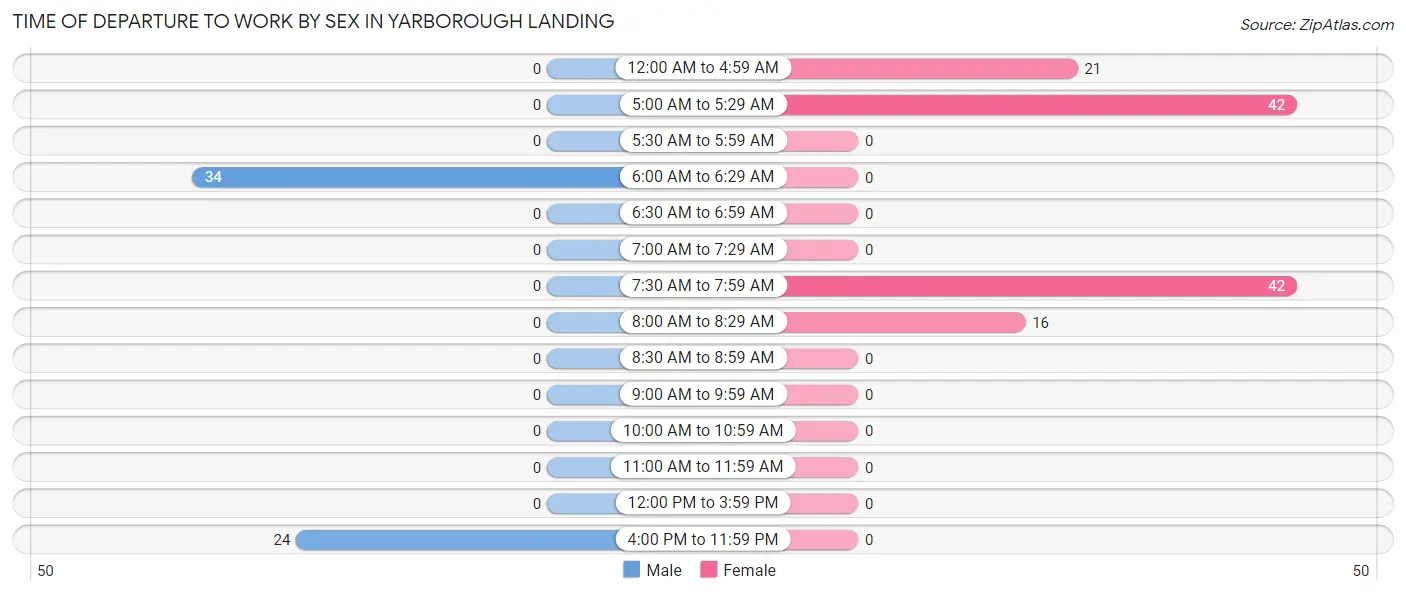
| Time of Departure | Male | Female |
| 12:00 AM to 4:59 AM | 0 (0.0%) | 21 (17.4%) |
| 5:00 AM to 5:29 AM | 0 (0.0%) | 42 (34.7%) |
| 5:30 AM to 5:59 AM | 0 (0.0%) | 0 (0.0%) |
| 6:00 AM to 6:29 AM | 34 (58.6%) | 0 (0.0%) |
| 6:30 AM to 6:59 AM | 0 (0.0%) | 0 (0.0%) |
| 7:00 AM to 7:29 AM | 0 (0.0%) | 0 (0.0%) |
| 7:30 AM to 7:59 AM | 0 (0.0%) | 42 (34.7%) |
| 8:00 AM to 8:29 AM | 0 (0.0%) | 16 (13.2%) |
| 8:30 AM to 8:59 AM | 0 (0.0%) | 0 (0.0%) |
| 9:00 AM to 9:59 AM | 0 (0.0%) | 0 (0.0%) |
| 10:00 AM to 10:59 AM | 0 (0.0%) | 0 (0.0%) |
| 11:00 AM to 11:59 AM | 0 (0.0%) | 0 (0.0%) |
| 12:00 PM to 3:59 PM | 0 (0.0%) | 0 (0.0%) |
| 4:00 PM to 11:59 PM | 24 (41.4%) | 0 (0.0%) |
| Total | 58 (100.0%) | 121 (100.0%) |
Housing Occupancy in Yarborough Landing
Occupancy by Ownership in Yarborough Landing
Of the total 211 dwellings in Yarborough Landing, owner-occupied units account for 208 (98.6%), while renter-occupied units make up 3 (1.4%).
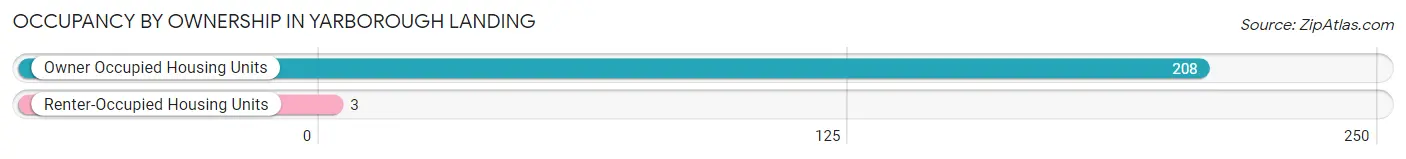
| Occupancy | # Housing Units | % Housing Units |
| Owner Occupied Housing Units | 208 | 98.6% |
| Renter-Occupied Housing Units | 3 | 1.4% |
| Total Occupied Housing Units | 211 | 100.0% |
Occupancy by Household Size in Yarborough Landing
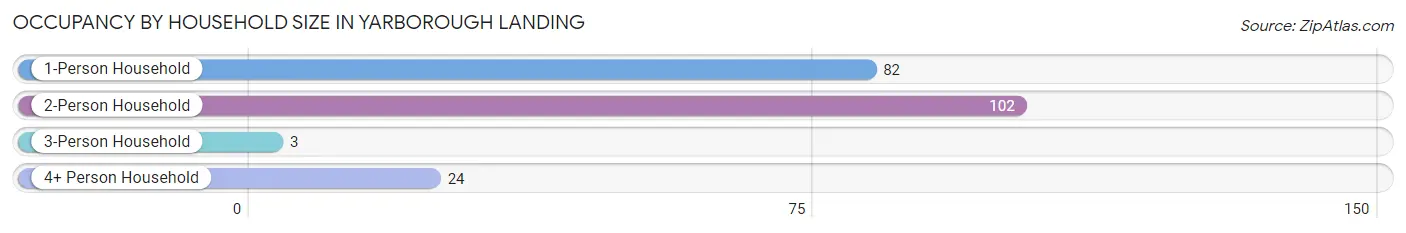
| Household Size | # Housing Units | % Housing Units |
| 1-Person Household | 82 | 38.9% |
| 2-Person Household | 102 | 48.3% |
| 3-Person Household | 3 | 1.4% |
| 4+ Person Household | 24 | 11.4% |
| Total Housing Units | 211 | 100.0% |
Occupancy by Ownership by Household Size in Yarborough Landing
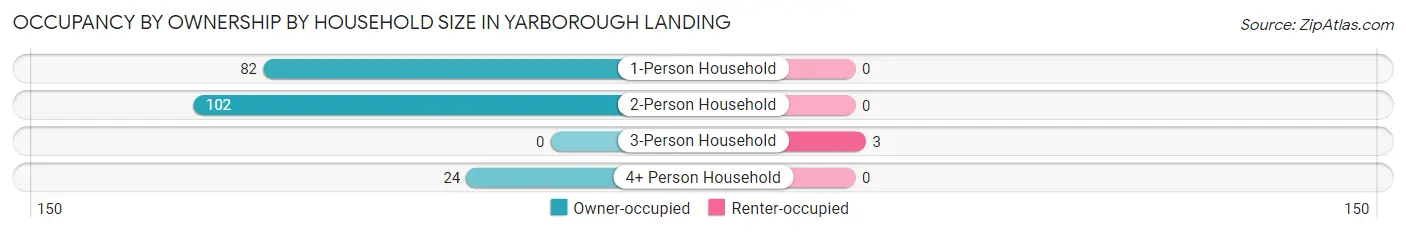
| Household Size | Owner-occupied | Renter-occupied |
| 1-Person Household | 82 (100.0%) | 0 (0.0%) |
| 2-Person Household | 102 (100.0%) | 0 (0.0%) |
| 3-Person Household | 0 (0.0%) | 3 (100.0%) |
| 4+ Person Household | 24 (100.0%) | 0 (0.0%) |
| Total Housing Units | 208 (98.6%) | 3 (1.4%) |
Occupancy by Educational Attainment in Yarborough Landing
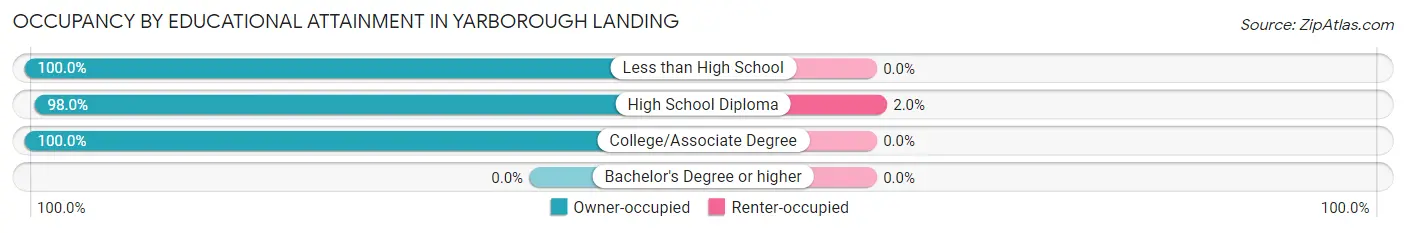
| Household Size | Owner-occupied | Renter-occupied |
| Less than High School | 11 (100.0%) | 0 (0.0%) |
| High School Diploma | 147 (98.0%) | 3 (2.0%) |
| College/Associate Degree | 50 (100.0%) | 0 (0.0%) |
| Bachelor's Degree or higher | 0 (0.0%) | 0 (0.0%) |
Occupancy by Age of Householder in Yarborough Landing
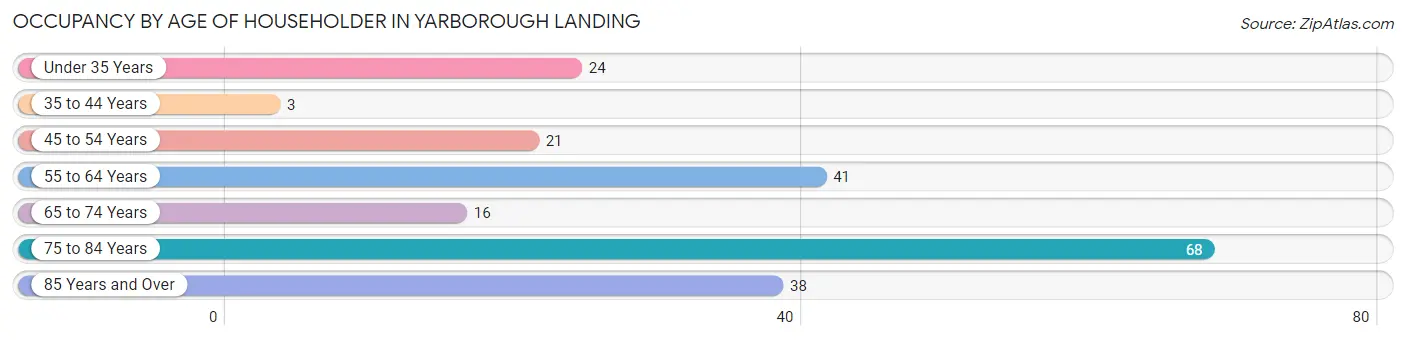
| Age Bracket | # Households | % Households |
| Under 35 Years | 24 | 11.4% |
| 35 to 44 Years | 3 | 1.4% |
| 45 to 54 Years | 21 | 10.0% |
| 55 to 64 Years | 41 | 19.4% |
| 65 to 74 Years | 16 | 7.6% |
| 75 to 84 Years | 68 | 32.2% |
| 85 Years and Over | 38 | 18.0% |
| Total | 211 | 100.0% |
Housing Finances in Yarborough Landing
Median Income by Occupancy in Yarborough Landing
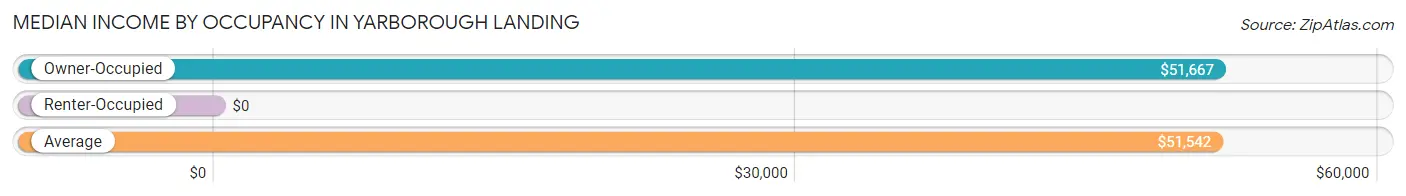
| Occupancy Type | # Households | Median Income |
| Owner-Occupied | 208 (98.6%) | $51,667 |
| Renter-Occupied | 3 (1.4%) | $0 |
| Average | 211 (100.0%) | $51,542 |
Occupancy by Householder Income Bracket in Yarborough Landing
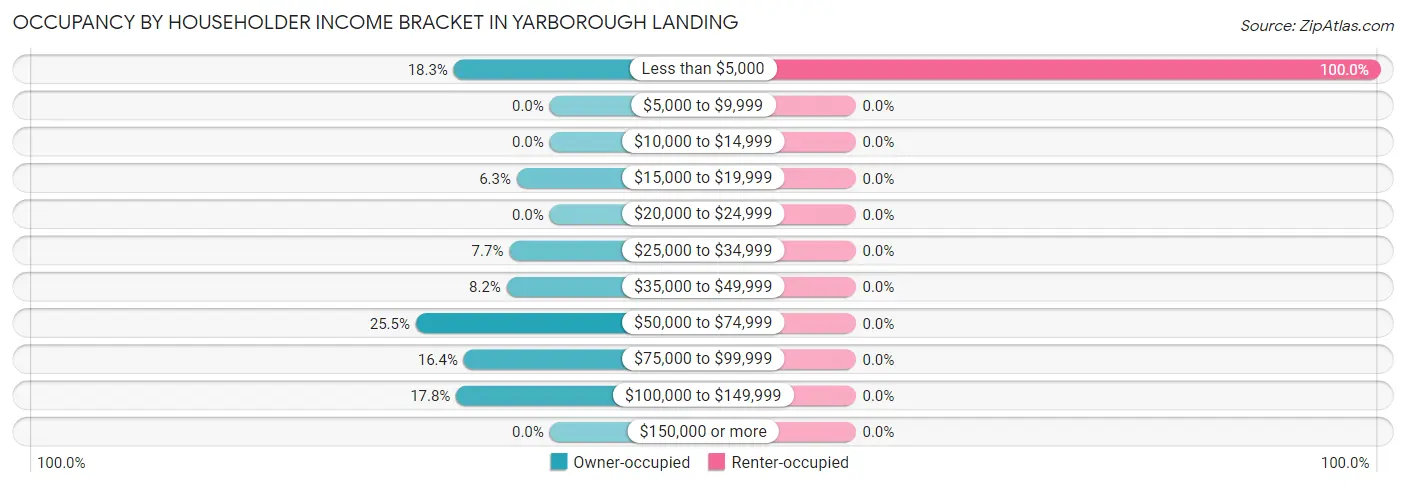
| Income Bracket | Owner-occupied | Renter-occupied |
| Less than $5,000 | 38 (18.3%) | 3 (100.0%) |
| $5,000 to $9,999 | 0 (0.0%) | 0 (0.0%) |
| $10,000 to $14,999 | 0 (0.0%) | 0 (0.0%) |
| $15,000 to $19,999 | 13 (6.2%) | 0 (0.0%) |
| $20,000 to $24,999 | 0 (0.0%) | 0 (0.0%) |
| $25,000 to $34,999 | 16 (7.7%) | 0 (0.0%) |
| $35,000 to $49,999 | 17 (8.2%) | 0 (0.0%) |
| $50,000 to $74,999 | 53 (25.5%) | 0 (0.0%) |
| $75,000 to $99,999 | 34 (16.4%) | 0 (0.0%) |
| $100,000 to $149,999 | 37 (17.8%) | 0 (0.0%) |
| $150,000 or more | 0 (0.0%) | 0 (0.0%) |
| Total | 208 (100.0%) | 3 (100.0%) |
Monthly Housing Cost Tiers in Yarborough Landing
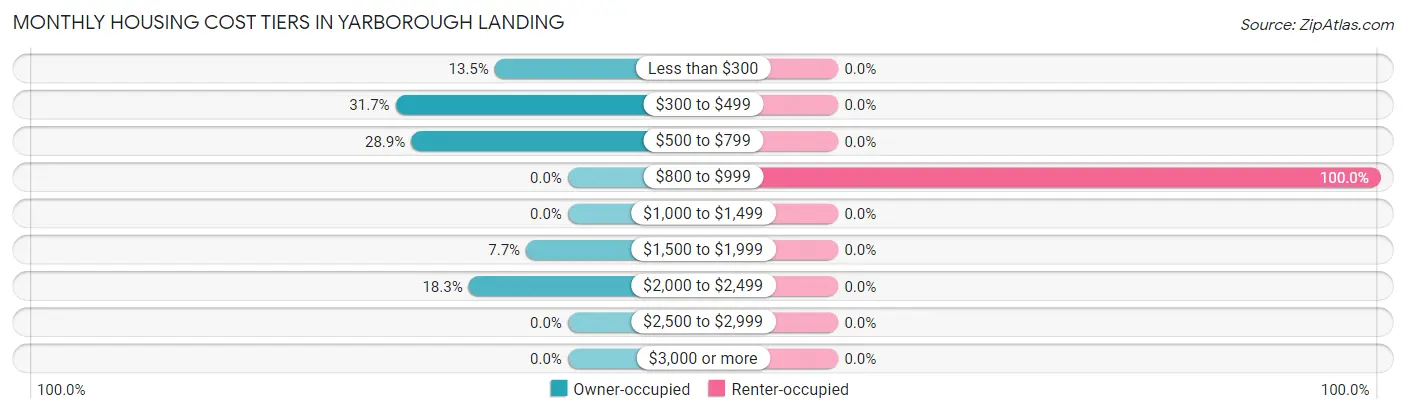
| Monthly Cost | Owner-occupied | Renter-occupied |
| Less than $300 | 28 (13.5%) | 0 (0.0%) |
| $300 to $499 | 66 (31.7%) | 0 (0.0%) |
| $500 to $799 | 60 (28.8%) | 0 (0.0%) |
| $800 to $999 | 0 (0.0%) | 3 (100.0%) |
| $1,000 to $1,499 | 0 (0.0%) | 0 (0.0%) |
| $1,500 to $1,999 | 16 (7.7%) | 0 (0.0%) |
| $2,000 to $2,499 | 38 (18.3%) | 0 (0.0%) |
| $2,500 to $2,999 | 0 (0.0%) | 0 (0.0%) |
| $3,000 or more | 0 (0.0%) | 0 (0.0%) |
| Total | 208 (100.0%) | 3 (100.0%) |
Physical Housing Characteristics in Yarborough Landing
Housing Structures in Yarborough Landing
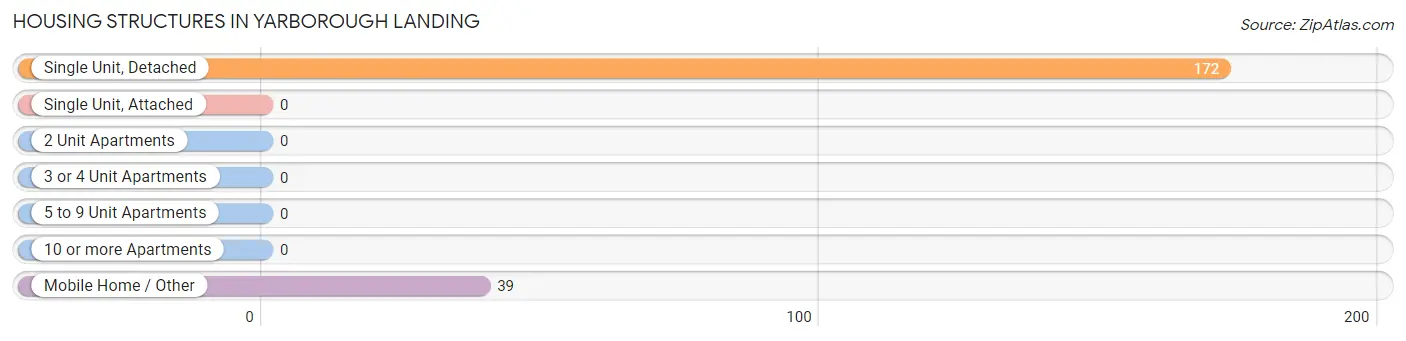
| Structure Type | # Housing Units | % Housing Units |
| Single Unit, Detached | 172 | 81.5% |
| Single Unit, Attached | 0 | 0.0% |
| 2 Unit Apartments | 0 | 0.0% |
| 3 or 4 Unit Apartments | 0 | 0.0% |
| 5 to 9 Unit Apartments | 0 | 0.0% |
| 10 or more Apartments | 0 | 0.0% |
| Mobile Home / Other | 39 | 18.5% |
| Total | 211 | 100.0% |
Housing Structures by Occupancy in Yarborough Landing
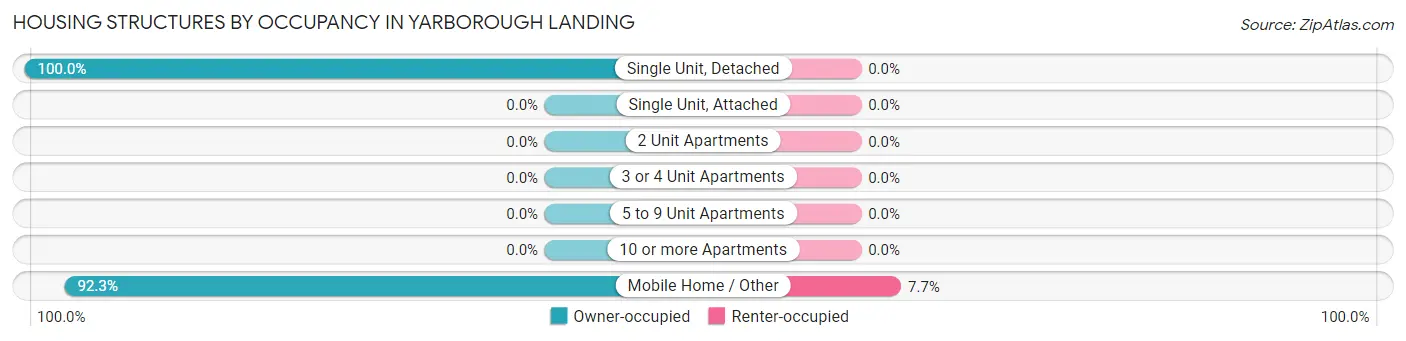
| Structure Type | Owner-occupied | Renter-occupied |
| Single Unit, Detached | 172 (100.0%) | 0 (0.0%) |
| Single Unit, Attached | 0 (0.0%) | 0 (0.0%) |
| 2 Unit Apartments | 0 (0.0%) | 0 (0.0%) |
| 3 or 4 Unit Apartments | 0 (0.0%) | 0 (0.0%) |
| 5 to 9 Unit Apartments | 0 (0.0%) | 0 (0.0%) |
| 10 or more Apartments | 0 (0.0%) | 0 (0.0%) |
| Mobile Home / Other | 36 (92.3%) | 3 (7.7%) |
| Total | 208 (98.6%) | 3 (1.4%) |
Housing Structures by Number of Rooms in Yarborough Landing
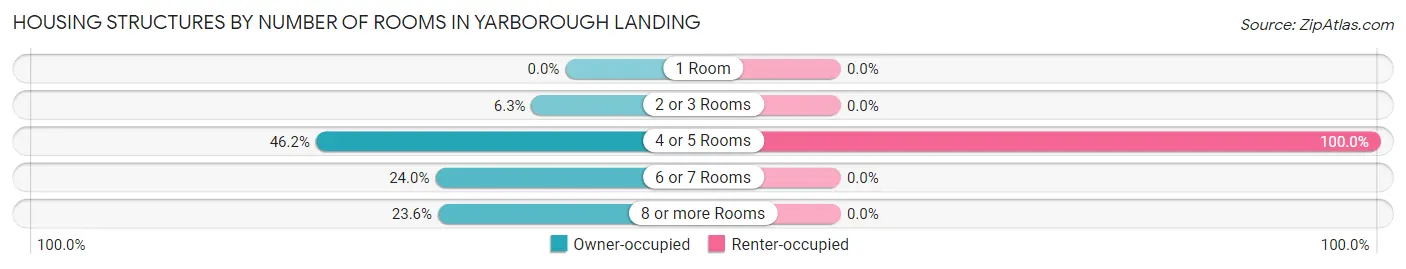
| Number of Rooms | Owner-occupied | Renter-occupied |
| 1 Room | 0 (0.0%) | 0 (0.0%) |
| 2 or 3 Rooms | 13 (6.2%) | 0 (0.0%) |
| 4 or 5 Rooms | 96 (46.2%) | 3 (100.0%) |
| 6 or 7 Rooms | 50 (24.0%) | 0 (0.0%) |
| 8 or more Rooms | 49 (23.6%) | 0 (0.0%) |
| Total | 208 (100.0%) | 3 (100.0%) |
Housing Structure by Heating Type in Yarborough Landing
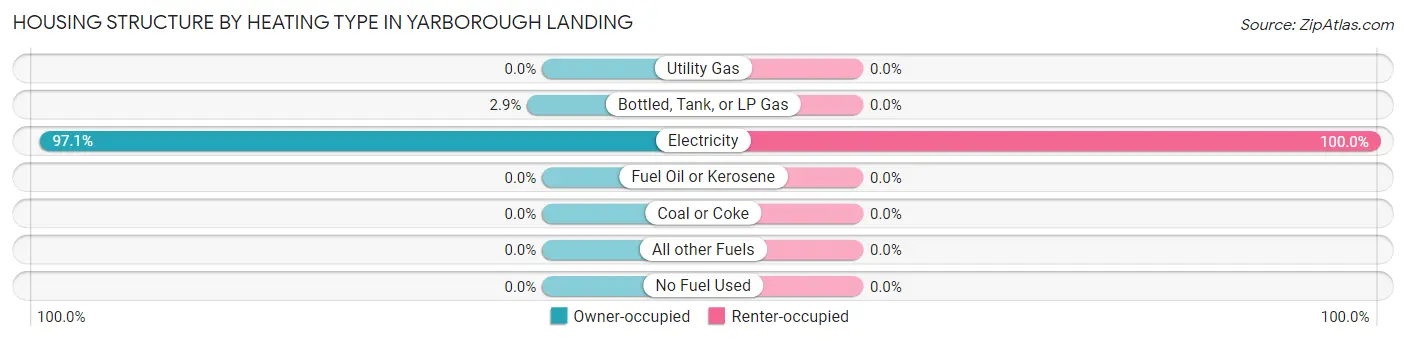
| Heating Type | Owner-occupied | Renter-occupied |
| Utility Gas | 0 (0.0%) | 0 (0.0%) |
| Bottled, Tank, or LP Gas | 6 (2.9%) | 0 (0.0%) |
| Electricity | 202 (97.1%) | 3 (100.0%) |
| Fuel Oil or Kerosene | 0 (0.0%) | 0 (0.0%) |
| Coal or Coke | 0 (0.0%) | 0 (0.0%) |
| All other Fuels | 0 (0.0%) | 0 (0.0%) |
| No Fuel Used | 0 (0.0%) | 0 (0.0%) |
| Total | 208 (100.0%) | 3 (100.0%) |
Household Vehicle Usage in Yarborough Landing
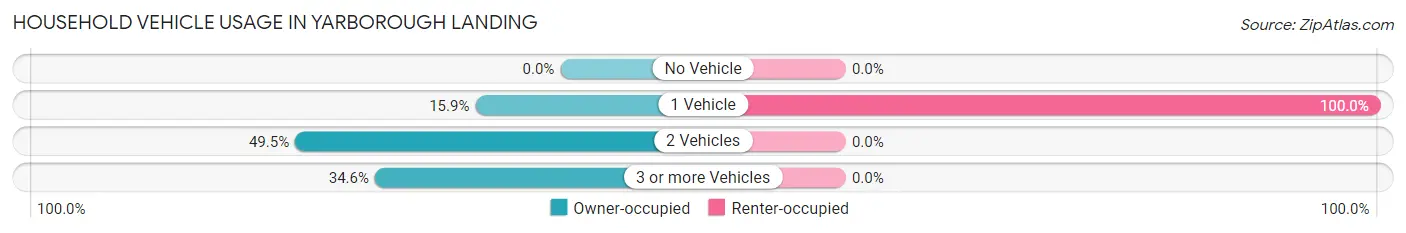
| Vehicles per Household | Owner-occupied | Renter-occupied |
| No Vehicle | 0 (0.0%) | 0 (0.0%) |
| 1 Vehicle | 33 (15.9%) | 3 (100.0%) |
| 2 Vehicles | 103 (49.5%) | 0 (0.0%) |
| 3 or more Vehicles | 72 (34.6%) | 0 (0.0%) |
| Total | 208 (100.0%) | 3 (100.0%) |
Real Estate & Mortgages in Yarborough Landing
Real Estate and Mortgage Overview in Yarborough Landing
| Characteristic | Without Mortgage | With Mortgage |
| Housing Units | 94 | 114 |
| Median Property Value | $93,900 | $95,000 |
| Median Household Income | $51,583 | $0 |
| Monthly Housing Costs | $367 | $0 |
| Real Estate Taxes | $300 | $54 |
Property Value by Mortgage Status in Yarborough Landing
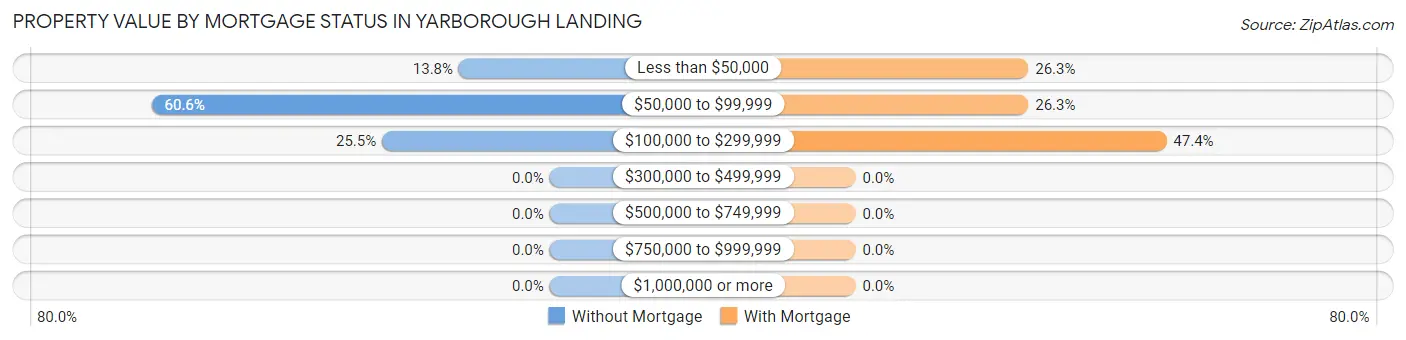
| Property Value | Without Mortgage | With Mortgage |
| Less than $50,000 | 13 (13.8%) | 30 (26.3%) |
| $50,000 to $99,999 | 57 (60.6%) | 30 (26.3%) |
| $100,000 to $299,999 | 24 (25.5%) | 54 (47.4%) |
| $300,000 to $499,999 | 0 (0.0%) | 0 (0.0%) |
| $500,000 to $749,999 | 0 (0.0%) | 0 (0.0%) |
| $750,000 to $999,999 | 0 (0.0%) | 0 (0.0%) |
| $1,000,000 or more | 0 (0.0%) | 0 (0.0%) |
| Total | 94 (100.0%) | 114 (100.0%) |
Household Income by Mortgage Status in Yarborough Landing
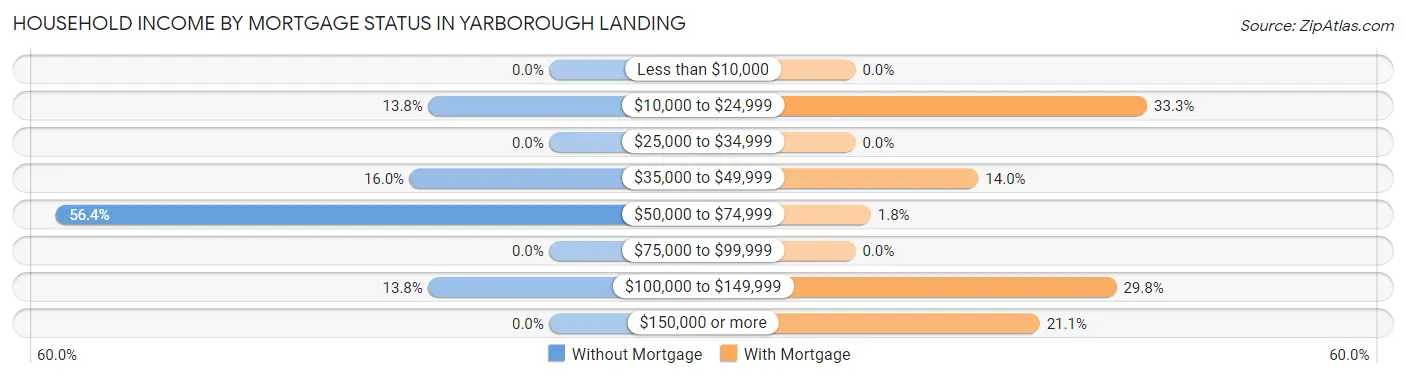
| Household Income | Without Mortgage | With Mortgage |
| Less than $10,000 | 0 (0.0%) | 0 (0.0%) |
| $10,000 to $24,999 | 13 (13.8%) | 38 (33.3%) |
| $25,000 to $34,999 | 0 (0.0%) | 0 (0.0%) |
| $35,000 to $49,999 | 15 (16.0%) | 16 (14.0%) |
| $50,000 to $74,999 | 53 (56.4%) | 2 (1.8%) |
| $75,000 to $99,999 | 0 (0.0%) | 0 (0.0%) |
| $100,000 to $149,999 | 13 (13.8%) | 34 (29.8%) |
| $150,000 or more | 0 (0.0%) | 24 (21.0%) |
| Total | 94 (100.0%) | 114 (100.0%) |
Property Value to Household Income Ratio in Yarborough Landing
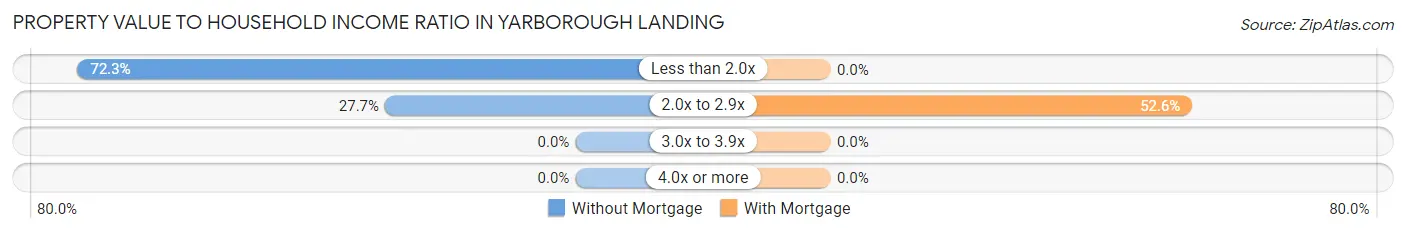
| Value-to-Income Ratio | Without Mortgage | With Mortgage |
| Less than 2.0x | 68 (72.3%) | 0 (0.0%) |
| 2.0x to 2.9x | 26 (27.7%) | 60 (52.6%) |
| 3.0x to 3.9x | 0 (0.0%) | 0 (0.0%) |
| 4.0x or more | 0 (0.0%) | 0 (0.0%) |
| Total | 94 (100.0%) | 114 (100.0%) |
Real Estate Taxes by Mortgage Status in Yarborough Landing
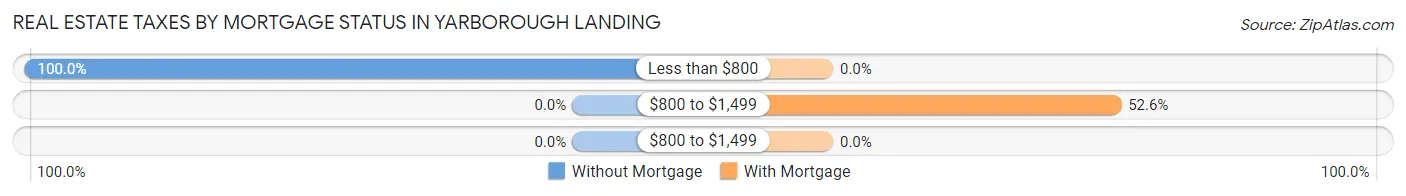
| Property Taxes | Without Mortgage | With Mortgage |
| Less than $800 | 94 (100.0%) | 0 (0.0%) |
| $800 to $1,499 | 0 (0.0%) | 60 (52.6%) |
| $800 to $1,499 | 0 (0.0%) | 0 (0.0%) |
| Total | 94 (100.0%) | 114 (100.0%) |
Health & Disability in Yarborough Landing
Health Insurance Coverage by Age in Yarborough Landing
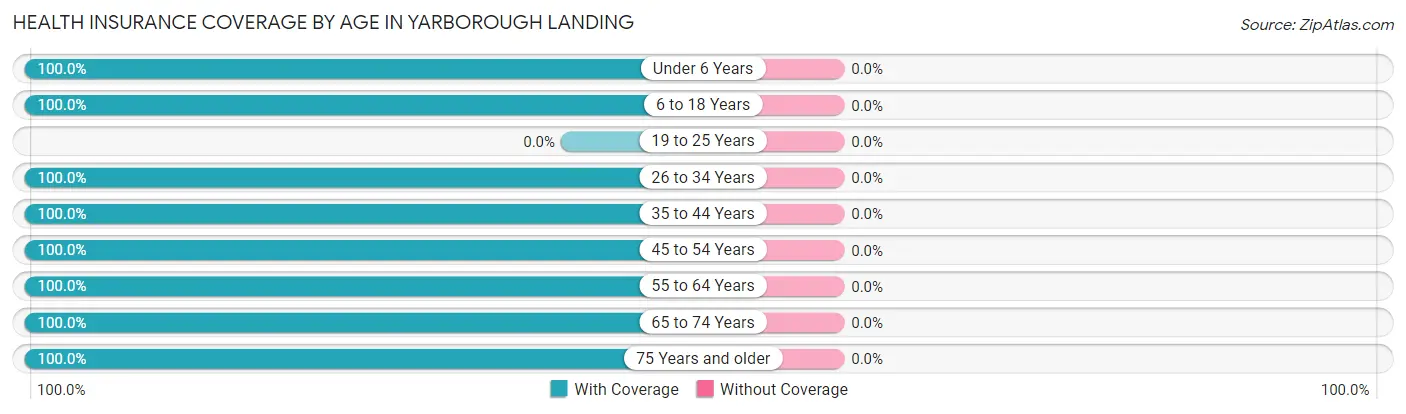
| Age Bracket | With Coverage | Without Coverage |
| Under 6 Years | 5 (100.0%) | 0 (0.0%) |
| 6 to 18 Years | 38 (100.0%) | 0 (0.0%) |
| 19 to 25 Years | 0 (0.0%) | 0 (0.0%) |
| 26 to 34 Years | 45 (100.0%) | 0 (0.0%) |
| 35 to 44 Years | 3 (100.0%) | 0 (0.0%) |
| 45 to 54 Years | 29 (100.0%) | 0 (0.0%) |
| 55 to 64 Years | 100 (100.0%) | 0 (0.0%) |
| 65 to 74 Years | 30 (100.0%) | 0 (0.0%) |
| 75 Years and older | 152 (100.0%) | 0 (0.0%) |
| Total | 402 (100.0%) | 0 (0.0%) |
Health Insurance Coverage by Citizenship Status in Yarborough Landing
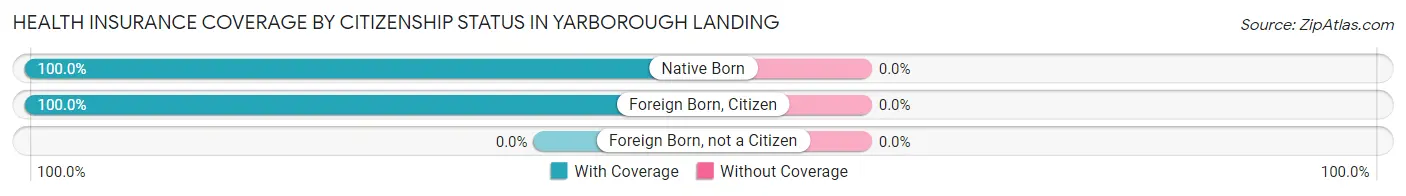
| Citizenship Status | With Coverage | Without Coverage |
| Native Born | 5 (100.0%) | 0 (0.0%) |
| Foreign Born, Citizen | 38 (100.0%) | 0 (0.0%) |
| Foreign Born, not a Citizen | 0 (0.0%) | 0 (0.0%) |
Health Insurance Coverage by Household Income in Yarborough Landing
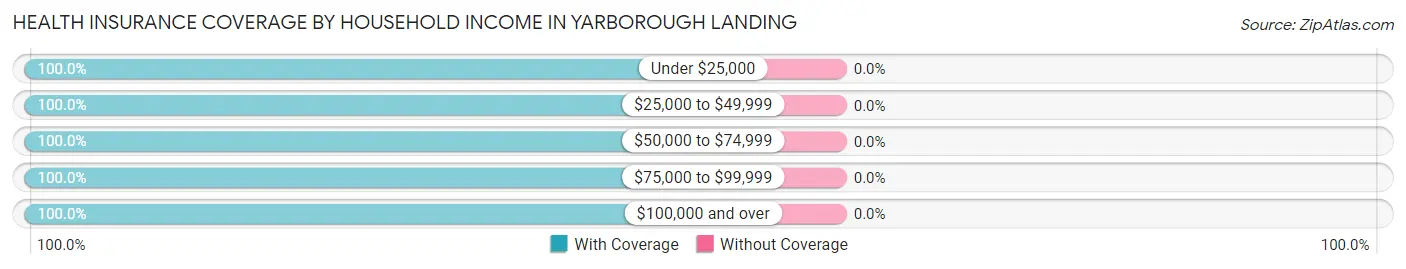
| Household Income | With Coverage | Without Coverage |
| Under $25,000 | 76 (100.0%) | 0 (0.0%) |
| $25,000 to $49,999 | 33 (100.0%) | 0 (0.0%) |
| $50,000 to $74,999 | 97 (100.0%) | 0 (0.0%) |
| $75,000 to $99,999 | 84 (100.0%) | 0 (0.0%) |
| $100,000 and over | 112 (100.0%) | 0 (0.0%) |
Public vs Private Health Insurance Coverage by Age in Yarborough Landing
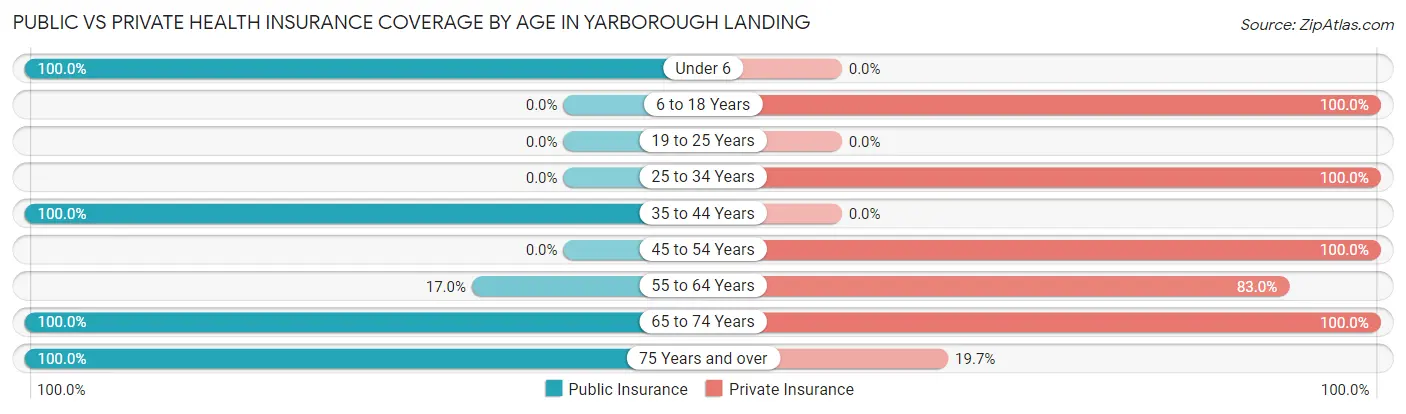
| Age Bracket | Public Insurance | Private Insurance |
| Under 6 | 5 (100.0%) | 0 (0.0%) |
| 6 to 18 Years | 0 (0.0%) | 38 (100.0%) |
| 19 to 25 Years | 0 (0.0%) | 0 (0.0%) |
| 25 to 34 Years | 0 (0.0%) | 45 (100.0%) |
| 35 to 44 Years | 3 (100.0%) | 0 (0.0%) |
| 45 to 54 Years | 0 (0.0%) | 29 (100.0%) |
| 55 to 64 Years | 17 (17.0%) | 83 (83.0%) |
| 65 to 74 Years | 30 (100.0%) | 30 (100.0%) |
| 75 Years and over | 152 (100.0%) | 30 (19.7%) |
| Total | 207 (51.5%) | 255 (63.4%) |
Disability Status by Sex by Age in Yarborough Landing
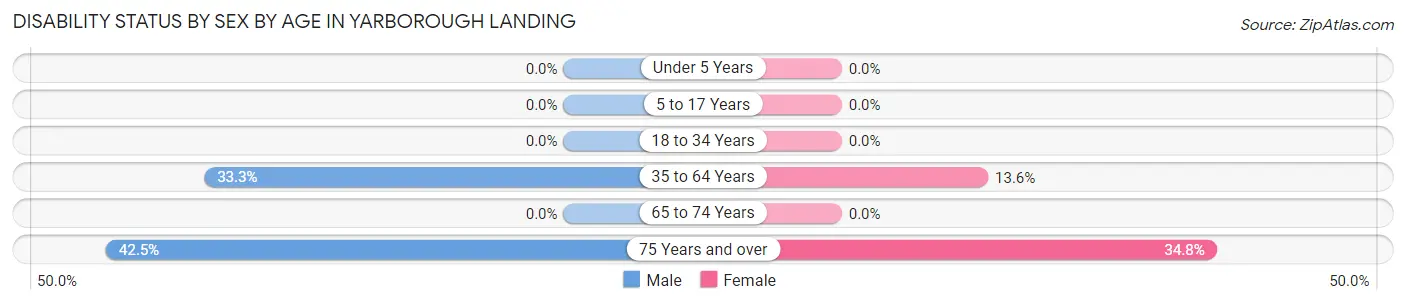
| Age Bracket | Male | Female |
| Under 5 Years | 0 (0.0%) | 0 (0.0%) |
| 5 to 17 Years | 0 (0.0%) | 0 (0.0%) |
| 18 to 34 Years | 0 (0.0%) | 0 (0.0%) |
| 35 to 64 Years | 17 (33.3%) | 11 (13.6%) |
| 65 to 74 Years | 0 (0.0%) | 0 (0.0%) |
| 75 Years and over | 45 (42.4%) | 16 (34.8%) |
Disability Class by Sex by Age in Yarborough Landing
Disability Class: Hearing Difficulty
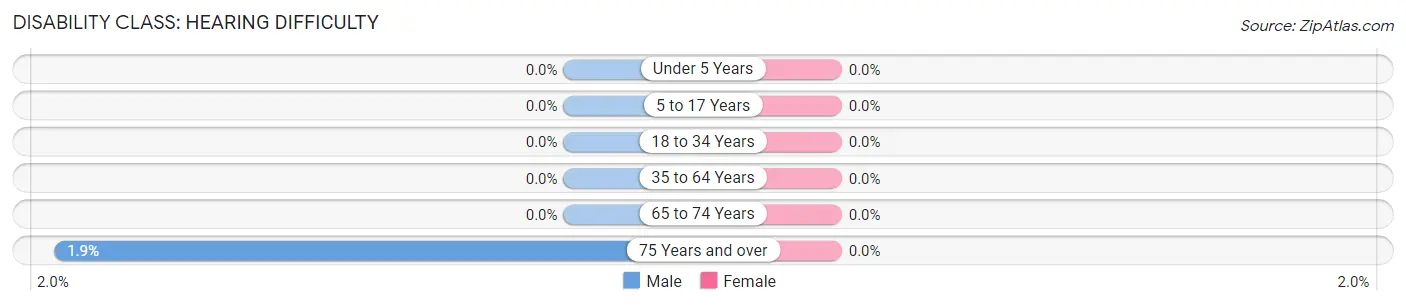
| Age Bracket | Male | Female |
| Under 5 Years | 0 (0.0%) | 0 (0.0%) |
| 5 to 17 Years | 0 (0.0%) | 0 (0.0%) |
| 18 to 34 Years | 0 (0.0%) | 0 (0.0%) |
| 35 to 64 Years | 0 (0.0%) | 0 (0.0%) |
| 65 to 74 Years | 0 (0.0%) | 0 (0.0%) |
| 75 Years and over | 2 (1.9%) | 0 (0.0%) |
Disability Class: Vision Difficulty
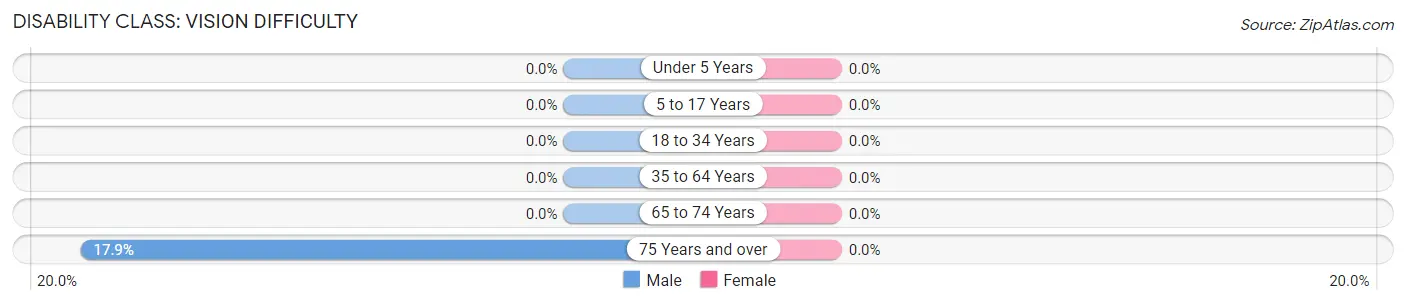
| Age Bracket | Male | Female |
| Under 5 Years | 0 (0.0%) | 0 (0.0%) |
| 5 to 17 Years | 0 (0.0%) | 0 (0.0%) |
| 18 to 34 Years | 0 (0.0%) | 0 (0.0%) |
| 35 to 64 Years | 0 (0.0%) | 0 (0.0%) |
| 65 to 74 Years | 0 (0.0%) | 0 (0.0%) |
| 75 Years and over | 19 (17.9%) | 0 (0.0%) |
Disability Class: Cognitive Difficulty
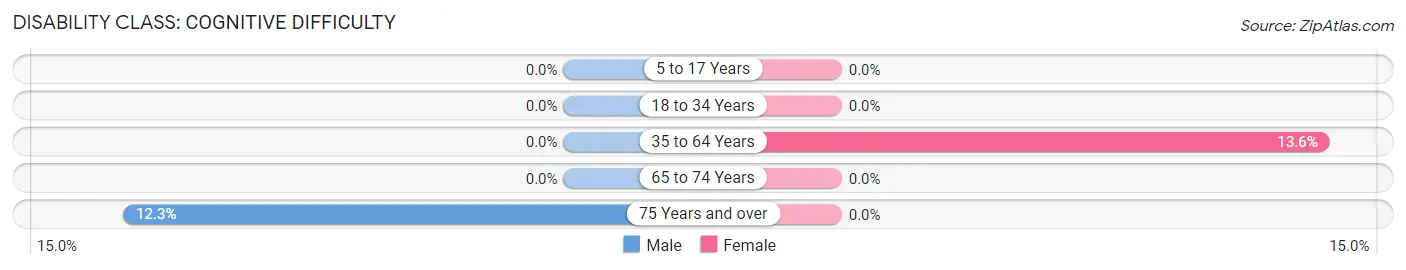
| Age Bracket | Male | Female |
| 5 to 17 Years | 0 (0.0%) | 0 (0.0%) |
| 18 to 34 Years | 0 (0.0%) | 0 (0.0%) |
| 35 to 64 Years | 0 (0.0%) | 11 (13.6%) |
| 65 to 74 Years | 0 (0.0%) | 0 (0.0%) |
| 75 Years and over | 13 (12.3%) | 0 (0.0%) |
Disability Class: Ambulatory Difficulty
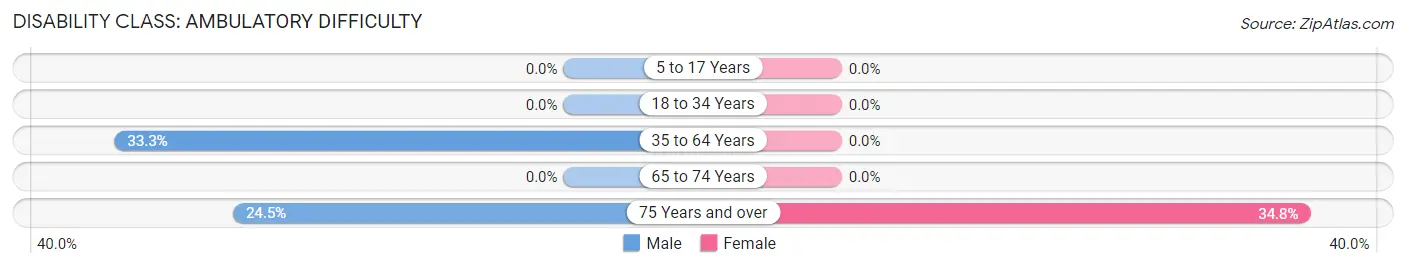
| Age Bracket | Male | Female |
| 5 to 17 Years | 0 (0.0%) | 0 (0.0%) |
| 18 to 34 Years | 0 (0.0%) | 0 (0.0%) |
| 35 to 64 Years | 17 (33.3%) | 0 (0.0%) |
| 65 to 74 Years | 0 (0.0%) | 0 (0.0%) |
| 75 Years and over | 26 (24.5%) | 16 (34.8%) |
Disability Class: Self-Care Difficulty
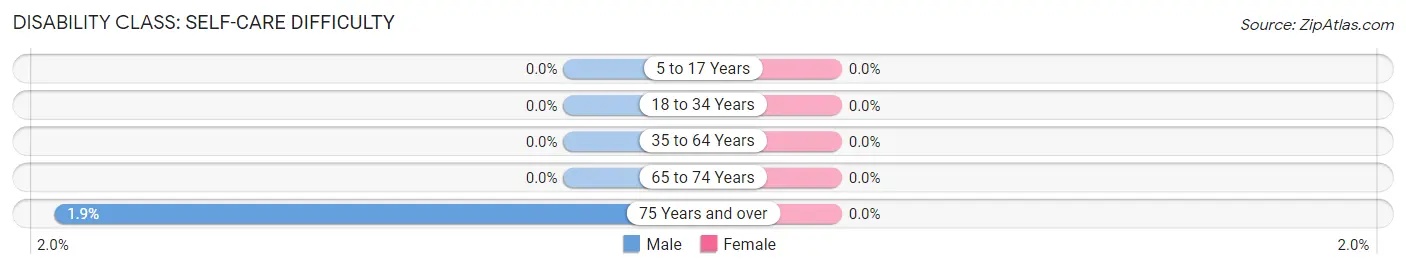
| Age Bracket | Male | Female |
| 5 to 17 Years | 0 (0.0%) | 0 (0.0%) |
| 18 to 34 Years | 0 (0.0%) | 0 (0.0%) |
| 35 to 64 Years | 0 (0.0%) | 0 (0.0%) |
| 65 to 74 Years | 0 (0.0%) | 0 (0.0%) |
| 75 Years and over | 2 (1.9%) | 0 (0.0%) |
Technology Access in Yarborough Landing
Computing Device Access in Yarborough Landing
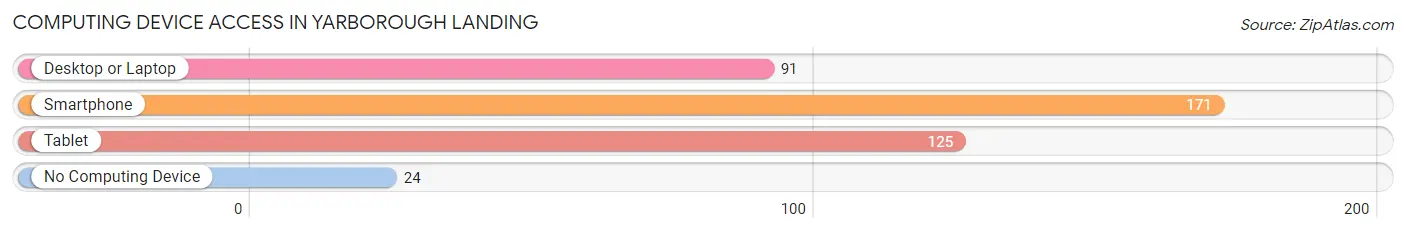
| Device Type | # Households | % Households |
| Desktop or Laptop | 91 | 43.1% |
| Smartphone | 171 | 81.0% |
| Tablet | 125 | 59.2% |
| No Computing Device | 24 | 11.4% |
| Total | 211 | 100.0% |
Internet Access in Yarborough Landing
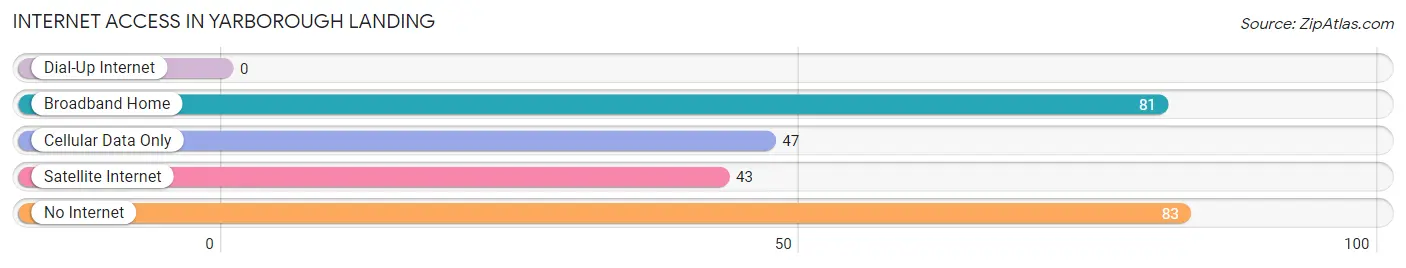
| Internet Type | # Households | % Households |
| Dial-Up Internet | 0 | 0.0% |
| Broadband Home | 81 | 38.4% |
| Cellular Data Only | 47 | 22.3% |
| Satellite Internet | 43 | 20.4% |
| No Internet | 83 | 39.3% |
| Total | 211 | 100.0% |
Yarborough Landing Summary
Yarborough Landing is a small unincorporated community located in Arkansas, United States. It is situated in the northern part of the state, in the Ozark Mountains region. The community is located in the foothills of the Ozarks, near the Buffalo National River. The nearest town is Jasper, which is located about 10 miles to the south.
History
Yarborough Landing was first settled in the early 1800s by the Yarborough family, who were among the first settlers in the area. The family built a log cabin near the banks of the Buffalo River, and the area became known as Yarborough Landing. The Yarboroughs were farmers and ranchers, and the area was used for grazing cattle and growing crops.
In the late 1800s, the area began to attract more settlers, and the community grew. A post office was established in 1891, and the town was officially incorporated in 1895. The town was named after the Yarborough family, who were the first settlers in the area.
Geography
Yarborough Landing is located in the northern part of Arkansas, in the Ozark Mountains region. The community is situated in the foothills of the Ozarks, near the Buffalo National River. The nearest town is Jasper, which is located about 10 miles to the south.
The area is characterized by rolling hills and valleys, with the Buffalo River running through the area. The climate is mild, with hot summers and cold winters. The average annual temperature is around 60 degrees Fahrenheit.
Economy
Yarborough Landing is a small, rural community with a limited economy. The main industries in the area are agriculture and tourism. The area is known for its scenic beauty, and the Buffalo National River attracts many visitors each year.
Agriculture is the main source of income for the community. The area is known for its cattle and dairy farms, as well as its fruit and vegetable farms. The area is also known for its timber production, and there are several sawmills in the area.
Demographics
As of the 2010 census, the population of Yarborough Landing was 1,072. The population is mostly white, with a small percentage of African Americans and Native Americans. The median household income is around $30,000, and the median age is around 40 years old.
Conclusion
Yarborough Landing is a small, rural community located in the Ozark Mountains region of Arkansas. The area is known for its scenic beauty and its agricultural production. The economy is mainly based on agriculture and tourism, and the population is mostly white. The area is a popular destination for visitors, and the Buffalo National River attracts many visitors each year.
Common Questions
What is Per Capita Income in Yarborough Landing?
Per Capita income in Yarborough Landing is $28,755.
What is the Median Family Income in Yarborough Landing?
Median Family Income in Yarborough Landing is $78,080.
What is the Median Household income in Yarborough Landing?
Median Household Income in Yarborough Landing is $51,542.
What is Income or Wage Gap in Yarborough Landing?
Income or Wage Gap in Yarborough Landing is 68.2%.
Women in Yarborough Landing earn 31.8 cents for every dollar earned by a man.
What is Inequality or Gini Index in Yarborough Landing?
Inequality or Gini Index in Yarborough Landing is 0.41.
What is the Total Population of Yarborough Landing?
Total Population of Yarborough Landing is 402.
What is the Total Male Population of Yarborough Landing?
Total Male Population of Yarborough Landing is 219.
What is the Total Female Population of Yarborough Landing?
Total Female Population of Yarborough Landing is 183.
What is the Ratio of Males per 100 Females in Yarborough Landing?
There are 119.67 Males per 100 Females in Yarborough Landing.
What is the Ratio of Females per 100 Males in Yarborough Landing?
There are 83.56 Females per 100 Males in Yarborough Landing.
What is the Median Population Age in Yarborough Landing?
Median Population Age in Yarborough Landing is 61.8 Years.
What is the Average Family Size in Yarborough Landing
Average Family Size in Yarborough Landing is 2.5 People.
What is the Average Household Size in Yarborough Landing
Average Household Size in Yarborough Landing is 1.9 People.
How Large is the Labor Force in Yarborough Landing?
There are 187 People in the Labor Forcein in Yarborough Landing.
What is the Percentage of People in the Labor Force in Yarborough Landing?
52.1% of People are in the Labor Force in Yarborough Landing.