Hatton, AL Map & Demographics
Hatton Map
Hatton Overview
$49,043
PER CAPITA INCOME
$250,001
AVG FAMILY INCOME
$250,001
AVG HOUSEHOLD INCOME
0.28
INEQUALITY / GINI INDEX
336
TOTAL POPULATION
113
MALE POPULATION
223
FEMALE POPULATION
50.67
MALES / 100 FEMALES
197.35
FEMALES / 100 MALES
22.9
MEDIAN AGE
4.1
AVG FAMILY SIZE
3.6
AVG HOUSEHOLD SIZE
148
LABOR FORCE [ PEOPLE ]
59.0%
PERCENT IN LABOR FORCE
Income in Hatton
Income Overview in Hatton
Per Capita Income in Hatton is $49,043, while median incomes of families and households are $250,001 and $250,001 respectively.
| Characteristic | Number | Measure |
| Per Capita Income | 336 | $49,043 |
| Median Family Income | 78 | $250,001 |
| Mean Family Income | 78 | $206,313 |
| Median Household Income | 92 | $250,001 |
| Mean Household Income | 92 | $184,299 |
| Income Deficit | 78 | $0 |
| Wage / Income Gap (%) | 336 | 0.00% |
| Wage / Income Gap ($) | 336 | 100.00¢ per $1 |
| Gini / Inequality Index | 336 | 0.28 |
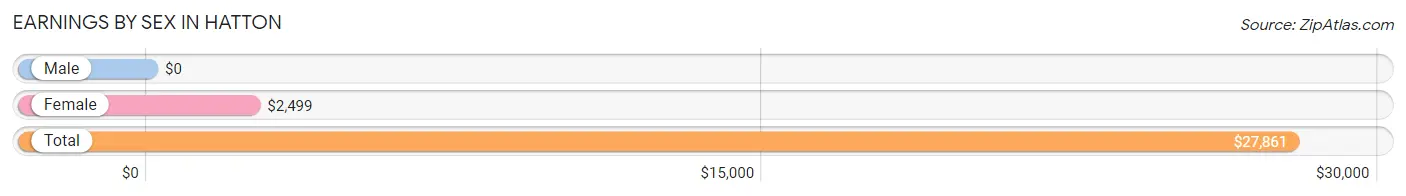
Earnings by Sex in Hatton
| Sex | Number | Average Earnings |
| Male | 67 (28.0%) | $0 |
| Female | 172 (72.0%) | $2,499 |
| Total | 239 (100.0%) | $27,861 |
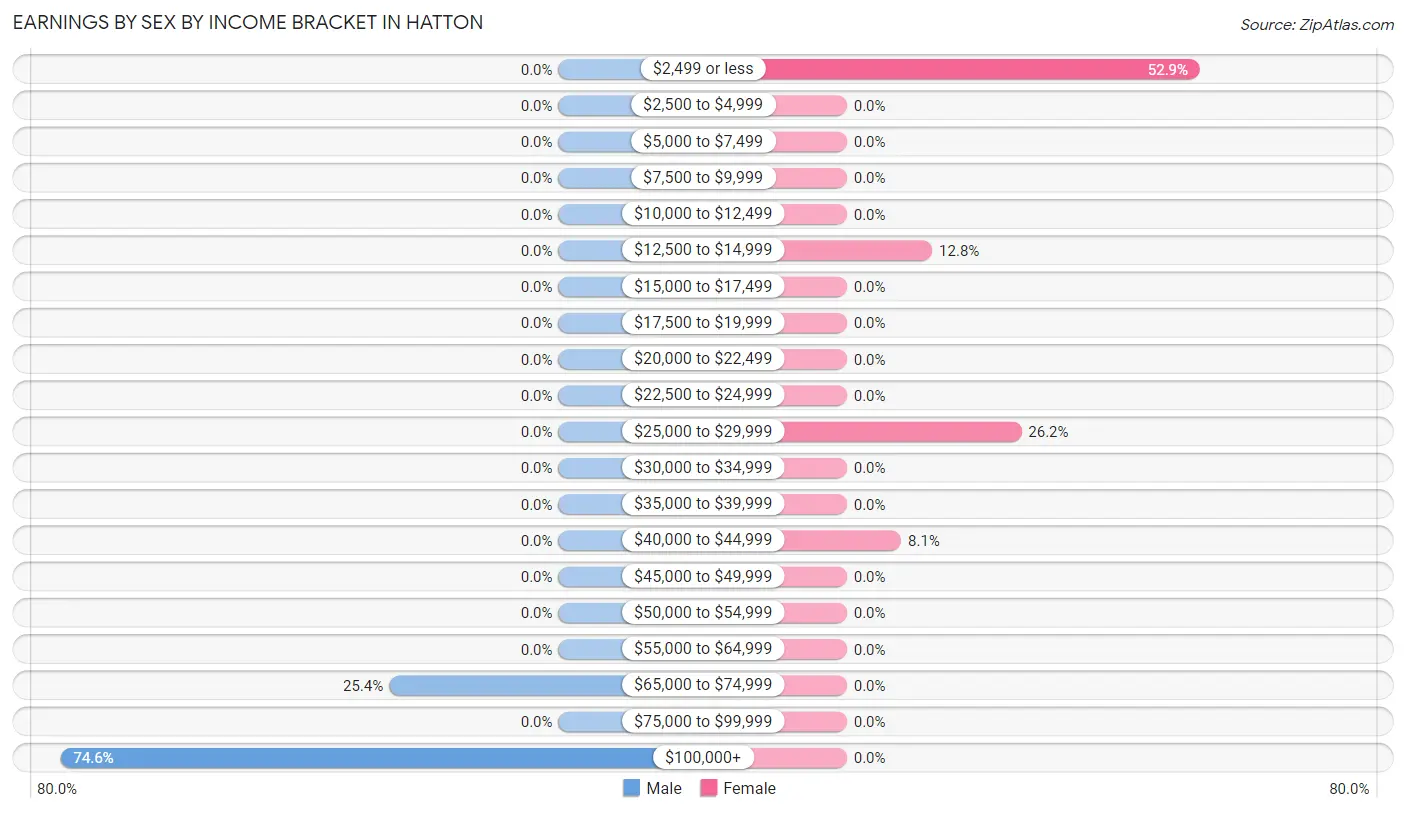
Earnings by Sex by Income Bracket in Hatton
The most common earnings brackets in Hatton are $100,000+ for men (50 | 74.6%) and $2,499 or less for women (91 | 52.9%).
| Income | Male | Female |
| $2,499 or less | 0 (0.0%) | 91 (52.9%) |
| $2,500 to $4,999 | 0 (0.0%) | 0 (0.0%) |
| $5,000 to $7,499 | 0 (0.0%) | 0 (0.0%) |
| $7,500 to $9,999 | 0 (0.0%) | 0 (0.0%) |
| $10,000 to $12,499 | 0 (0.0%) | 0 (0.0%) |
| $12,500 to $14,999 | 0 (0.0%) | 22 (12.8%) |
| $15,000 to $17,499 | 0 (0.0%) | 0 (0.0%) |
| $17,500 to $19,999 | 0 (0.0%) | 0 (0.0%) |
| $20,000 to $22,499 | 0 (0.0%) | 0 (0.0%) |
| $22,500 to $24,999 | 0 (0.0%) | 0 (0.0%) |
| $25,000 to $29,999 | 0 (0.0%) | 45 (26.2%) |
| $30,000 to $34,999 | 0 (0.0%) | 0 (0.0%) |
| $35,000 to $39,999 | 0 (0.0%) | 0 (0.0%) |
| $40,000 to $44,999 | 0 (0.0%) | 14 (8.1%) |
| $45,000 to $49,999 | 0 (0.0%) | 0 (0.0%) |
| $50,000 to $54,999 | 0 (0.0%) | 0 (0.0%) |
| $55,000 to $64,999 | 0 (0.0%) | 0 (0.0%) |
| $65,000 to $74,999 | 17 (25.4%) | 0 (0.0%) |
| $75,000 to $99,999 | 0 (0.0%) | 0 (0.0%) |
| $100,000+ | 50 (74.6%) | 0 (0.0%) |
| Total | 67 (100.0%) | 172 (100.0%) |
Earnings by Sex by Educational Attainment in Hatton
| Educational Attainment | Male Income | Female Income |
| Less than High School | - | - |
| High School Diploma | - | - |
| College or Associate's Degree | - | - |
| Bachelor's Degree | - | - |
| Graduate Degree | - | - |
| Total | - | - |
Family Income in Hatton
Family Income Brackets in Hatton
According to the Hatton family income data, there are 50 families falling into the $200,000+ income range, which is the most common income bracket and makes up 64.1% of all families.
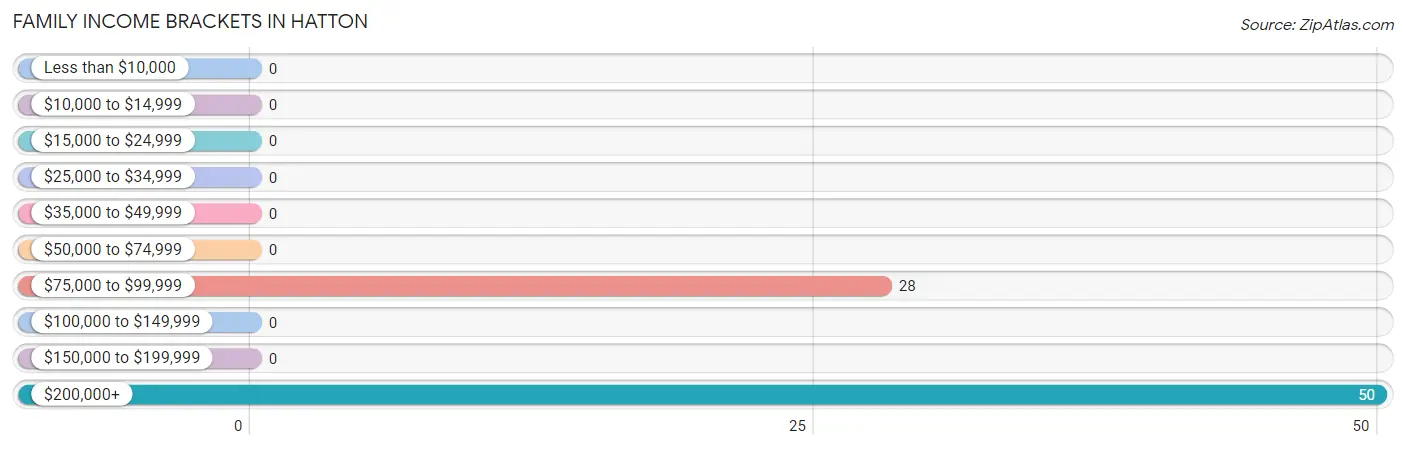
| Income Bracket | # Families | % Families |
| Less than $10,000 | 0 | 0.0% |
| $10,000 to $14,999 | 0 | 0.0% |
| $15,000 to $24,999 | 0 | 0.0% |
| $25,000 to $34,999 | 0 | 0.0% |
| $35,000 to $49,999 | 0 | 0.0% |
| $50,000 to $74,999 | 0 | 0.0% |
| $75,000 to $99,999 | 28 | 35.9% |
| $100,000 to $149,999 | 0 | 0.0% |
| $150,000 to $199,999 | 0 | 0.0% |
| $200,000+ | 50 | 64.1% |
Family Income by Famaliy Size in Hatton
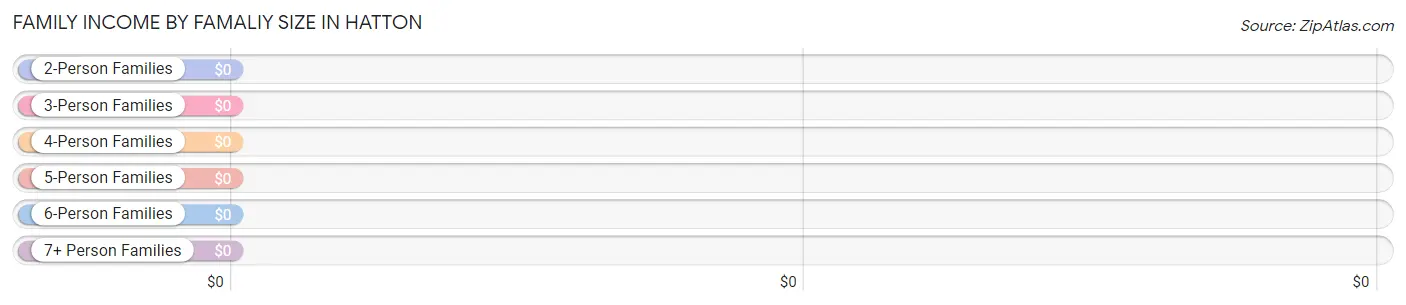
| Income Bracket | # Families | Median Income |
| 2-Person Families | 6 (7.7%) | $0 |
| 3-Person Families | 0 (0.0%) | $0 |
| 4-Person Families | 72 (92.3%) | $0 |
| 5-Person Families | 0 (0.0%) | $0 |
| 6-Person Families | 0 (0.0%) | $0 |
| 7+ Person Families | 0 (0.0%) | $0 |
| Total | 78 (100.0%) | $250,001 |
Family Income by Number of Earners in Hatton
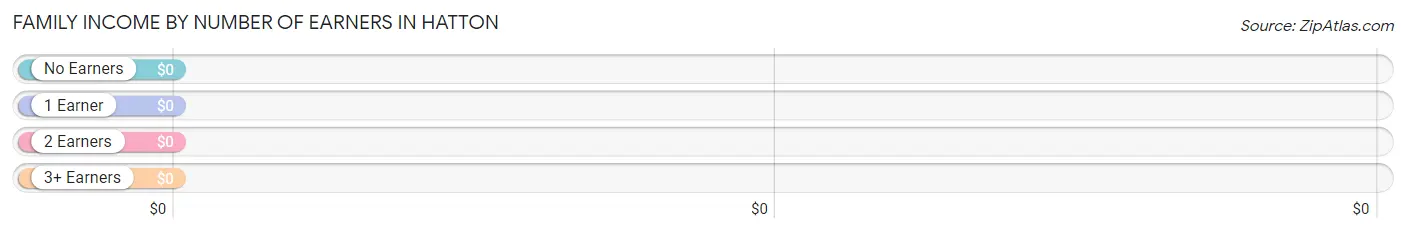
| Number of Earners | # Families | Median Income |
| No Earners | 6 (7.7%) | $0 |
| 1 Earner | 0 (0.0%) | $0 |
| 2 Earners | 22 (28.2%) | $0 |
| 3+ Earners | 50 (64.1%) | $0 |
| Total | 78 (100.0%) | $250,001 |
Household Income in Hatton
Household Income Brackets in Hatton
With 50 households falling in the category, the $200,000+ income range is the most frequent in Hatton, accounting for 54.3% of all households.
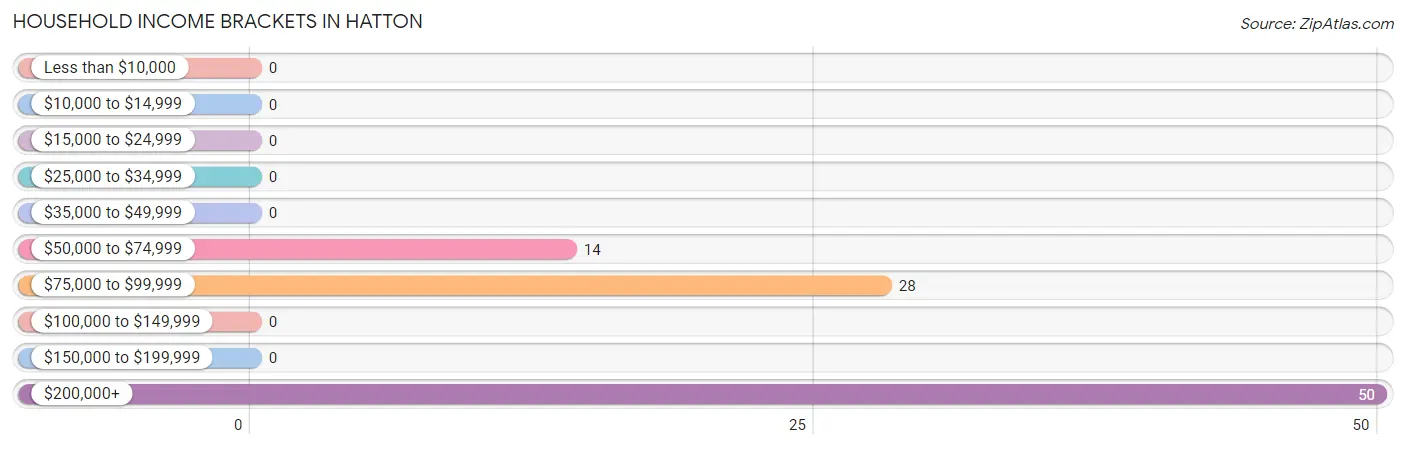
| Income Bracket | # Households | % Households |
| Less than $10,000 | 0 | 0.0% |
| $10,000 to $14,999 | 0 | 0.0% |
| $15,000 to $24,999 | 0 | 0.0% |
| $25,000 to $34,999 | 0 | 0.0% |
| $35,000 to $49,999 | 0 | 0.0% |
| $50,000 to $74,999 | 14 | 15.2% |
| $75,000 to $99,999 | 28 | 30.4% |
| $100,000 to $149,999 | 0 | 0.0% |
| $150,000 to $199,999 | 0 | 0.0% |
| $200,000+ | 50 | 54.3% |
Household Income by Householder Age in Hatton
| Income Bracket | # Households | Median Income |
| 15 to 24 Years | 0 (0.0%) | $0 |
| 25 to 44 Years | 22 (23.9%) | $0 |
| 45 to 64 Years | 50 (54.3%) | $0 |
| 65+ Years | 20 (21.7%) | $0 |
| Total | 92 (100.0%) | $250,001 |
Poverty in Hatton
Income Below Poverty by Sex and Age in Hatton
| Age Bracket | Male | Female |
| Under 5 Years | 0 (0.0%) | 0 (0.0%) |
| 5 Years | 0 (0.0%) | 0 (0.0%) |
| 6 to 11 Years | 0 (0.0%) | 0 (0.0%) |
| 12 to 14 Years | 0 (0.0%) | 0 (0.0%) |
| 15 Years | 0 (0.0%) | 0 (0.0%) |
| 16 and 17 Years | 0 (0.0%) | 0 (0.0%) |
| 18 to 24 Years | 0 (0.0%) | 0 (0.0%) |
| 25 to 34 Years | 0 (0.0%) | 0 (0.0%) |
| 35 to 44 Years | 0 (0.0%) | 0 (0.0%) |
| 45 to 54 Years | 0 (0.0%) | 0 (0.0%) |
| 55 to 64 Years | 0 (0.0%) | 0 (0.0%) |
| 65 to 74 Years | 0 (0.0%) | 0 (0.0%) |
| 75 Years and over | 0 (0.0%) | 0 (0.0%) |
| Total | 0 (0.0%) | 0 (0.0%) |
Income Above Poverty by Sex and Age in Hatton
According to the poverty statistics in Hatton, males aged 6 to 11 years and females aged 12 to 14 years are the age groups that are most secure financially, with 100.0% of males and 100.0% of females in these age groups living above the poverty line.
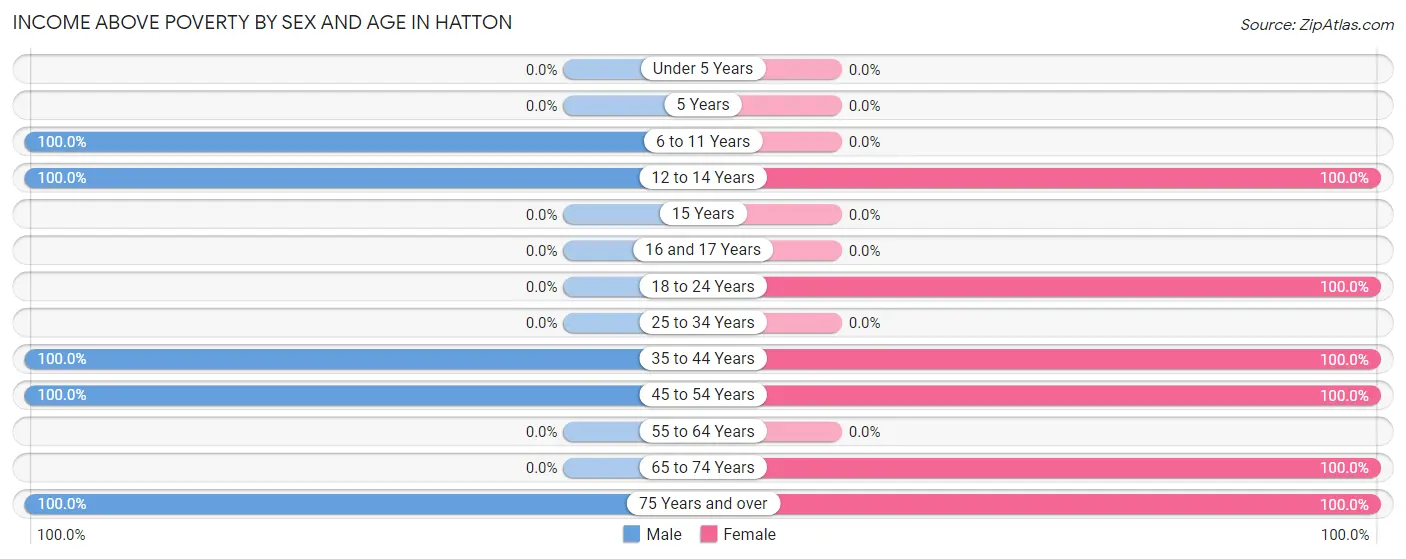
| Age Bracket | Male | Female |
| Under 5 Years | 0 (0.0%) | 0 (0.0%) |
| 5 Years | 0 (0.0%) | 0 (0.0%) |
| 6 to 11 Years | 20 (100.0%) | 0 (0.0%) |
| 12 to 14 Years | 20 (100.0%) | 45 (100.0%) |
| 15 Years | 0 (0.0%) | 0 (0.0%) |
| 16 and 17 Years | 0 (0.0%) | 0 (0.0%) |
| 18 to 24 Years | 0 (0.0%) | 91 (100.0%) |
| 25 to 34 Years | 0 (0.0%) | 0 (0.0%) |
| 35 to 44 Years | 17 (100.0%) | 22 (100.0%) |
| 45 to 54 Years | 50 (100.0%) | 45 (100.0%) |
| 55 to 64 Years | 0 (0.0%) | 0 (0.0%) |
| 65 to 74 Years | 0 (0.0%) | 14 (100.0%) |
| 75 Years and over | 6 (100.0%) | 6 (100.0%) |
| Total | 113 (100.0%) | 223 (100.0%) |
Income Below Poverty Among Married-Couple Families in Hatton
| Children | Above Poverty | Below Poverty |
| No Children | 6 (100.0%) | 0 (0.0%) |
| 1 or 2 Children | 72 (100.0%) | 0 (0.0%) |
| 3 or 4 Children | 0 (0.0%) | 0 (0.0%) |
| 5 or more Children | 0 (0.0%) | 0 (0.0%) |
| Total | 78 (100.0%) | 0 (0.0%) |
Income Below Poverty Among Single-Parent Households in Hatton
| Children | Single Father | Single Mother |
| No Children | 0 (0.0%) | 0 (0.0%) |
| 1 or 2 Children | 0 (0.0%) | 0 (0.0%) |
| 3 or 4 Children | 0 (0.0%) | 0 (0.0%) |
| 5 or more Children | 0 (0.0%) | 0 (0.0%) |
| Total | 0 (0.0%) | 0 (0.0%) |
Income Below Poverty Among Married-Couple vs Single-Parent Households in Hatton
| Children | Married-Couple Families | Single-Parent Households |
| No Children | 0 (0.0%) | 0 (0.0%) |
| 1 or 2 Children | 0 (0.0%) | 0 (0.0%) |
| 3 or 4 Children | 0 (0.0%) | 0 (0.0%) |
| 5 or more Children | 0 (0.0%) | 0 (0.0%) |
| Total | 0 (0.0%) | 0 (0.0%) |
Race in Hatton
The most populous races in Hatton are Two or more Races (231 | 68.8%), Native / Alaskan (62 | 18.4%), and White / Caucasian (43 | 12.8%).
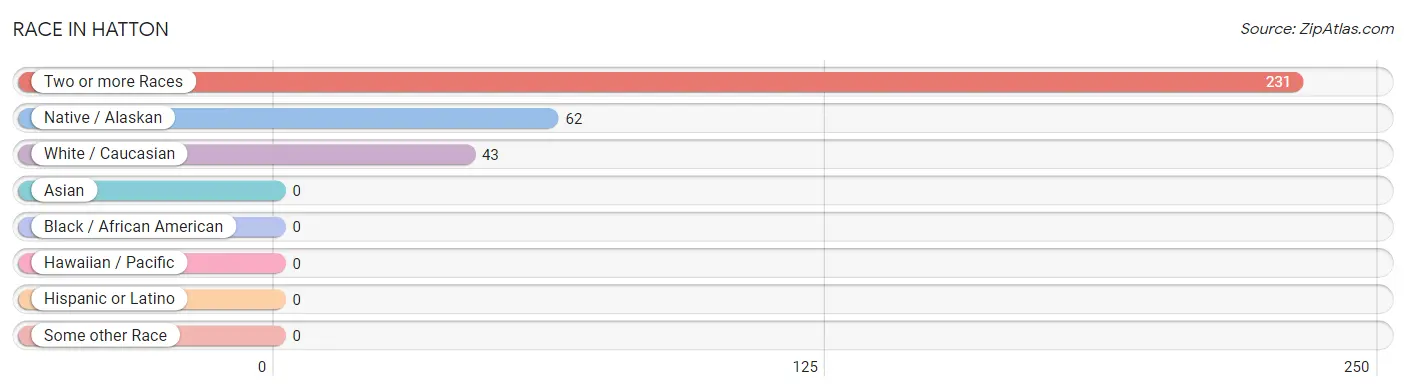
| Race | # Population | % Population |
| Asian | 0 | 0.0% |
| Black / African American | 0 | 0.0% |
| Hawaiian / Pacific | 0 | 0.0% |
| Hispanic or Latino | 0 | 0.0% |
| Native / Alaskan | 62 | 18.4% |
| White / Caucasian | 43 | 12.8% |
| Two or more Races | 231 | 68.8% |
| Some other Race | 0 | 0.0% |
| Total | 336 | 100.0% |
Ancestry in Hatton
The most populous ancestries reported in Hatton are Irish (231 | 68.8%), Cherokee (62 | 18.4%), and American (12 | 3.6%), together accounting for 90.8% of all Hatton residents.
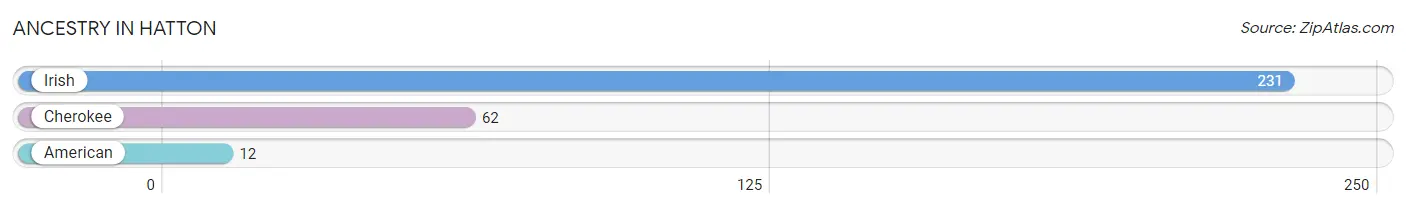
| Ancestry | # Population | % Population |
| American | 12 | 3.6% |
| Cherokee | 62 | 18.4% |
| Irish | 231 | 68.8% | View All 3 Rows |
Immigrants in Hatton

| Immigration Origin | # Population | % Population | View All 0 Rows |
Sex and Age in Hatton
Sex and Age in Hatton
The most populous age groups in Hatton are 50 to 54 Years (50 | 44.3%) for men and 20 to 24 Years (91 | 40.8%) for women.
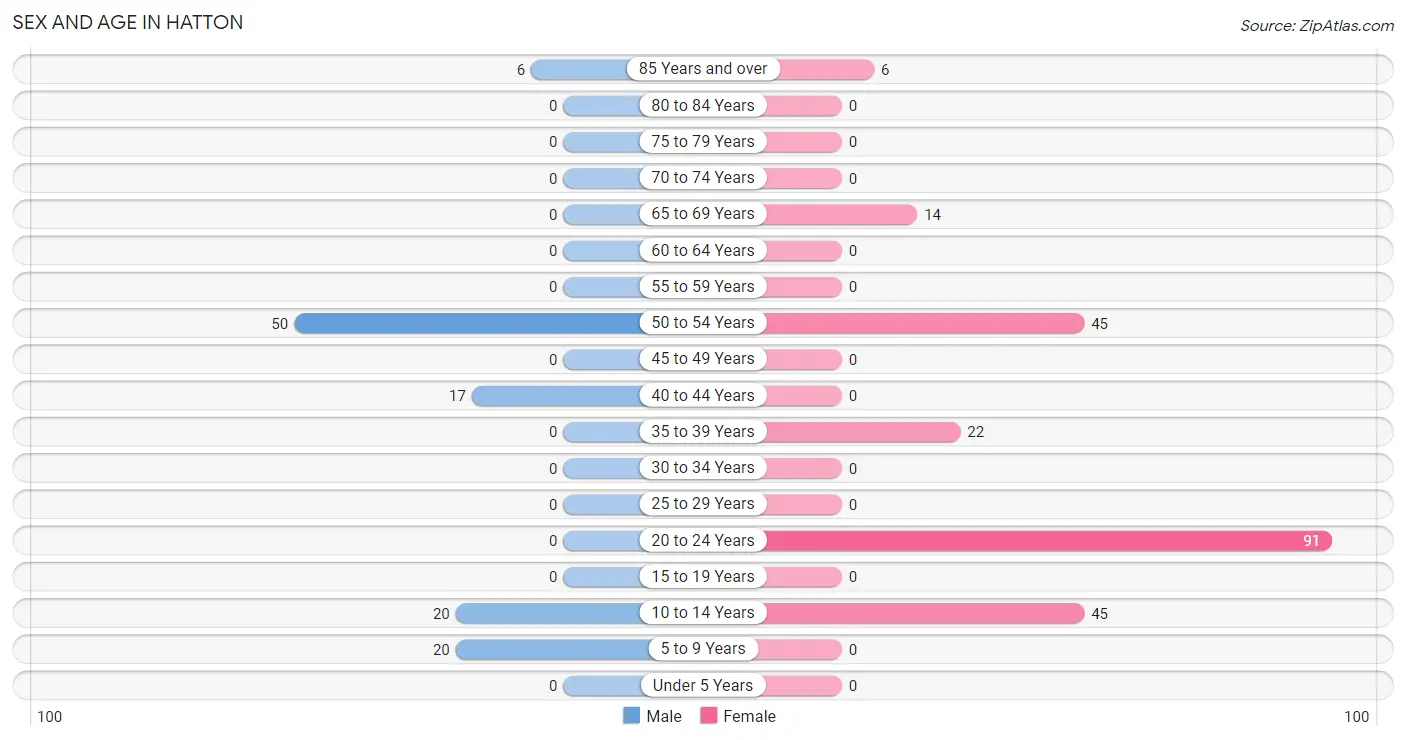
| Age Bracket | Male | Female |
| Under 5 Years | 0 (0.0%) | 0 (0.0%) |
| 5 to 9 Years | 20 (17.7%) | 0 (0.0%) |
| 10 to 14 Years | 20 (17.7%) | 45 (20.2%) |
| 15 to 19 Years | 0 (0.0%) | 0 (0.0%) |
| 20 to 24 Years | 0 (0.0%) | 91 (40.8%) |
| 25 to 29 Years | 0 (0.0%) | 0 (0.0%) |
| 30 to 34 Years | 0 (0.0%) | 0 (0.0%) |
| 35 to 39 Years | 0 (0.0%) | 22 (9.9%) |
| 40 to 44 Years | 17 (15.0%) | 0 (0.0%) |
| 45 to 49 Years | 0 (0.0%) | 0 (0.0%) |
| 50 to 54 Years | 50 (44.3%) | 45 (20.2%) |
| 55 to 59 Years | 0 (0.0%) | 0 (0.0%) |
| 60 to 64 Years | 0 (0.0%) | 0 (0.0%) |
| 65 to 69 Years | 0 (0.0%) | 14 (6.3%) |
| 70 to 74 Years | 0 (0.0%) | 0 (0.0%) |
| 75 to 79 Years | 0 (0.0%) | 0 (0.0%) |
| 80 to 84 Years | 0 (0.0%) | 0 (0.0%) |
| 85 Years and over | 6 (5.3%) | 6 (2.7%) |
| Total | 113 (100.0%) | 223 (100.0%) |
Families and Households in Hatton
Median Family Size in Hatton
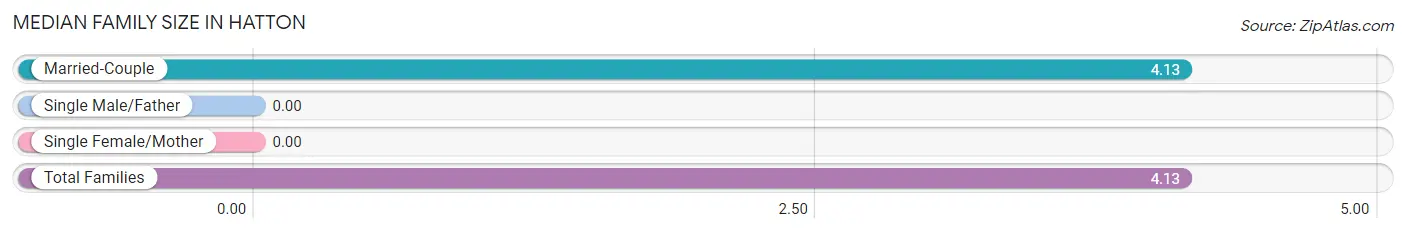
| Family Type | # Families | Family Size |
| Married-Couple | 78 (100.0%) | 4.13 |
| Single Male/Father | 0 (0.0%) | - |
| Single Female/Mother | 0 (0.0%) | - |
| Total Families | 78 (100.0%) | 4.13 |
Median Household Size in Hatton
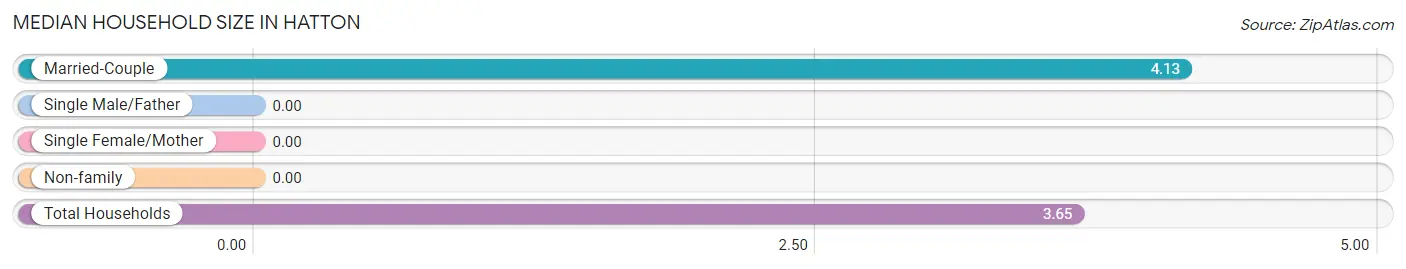
| Household Type | # Households | Household Size |
| Married-Couple | 78 (84.8%) | 4.13 |
| Single Male/Father | 0 (0.0%) | - |
| Single Female/Mother | 0 (0.0%) | - |
| Non-family | 14 (15.2%) | - |
| Total Households | 92 (100.0%) | 3.65 |
Household Size by Marriage Status in Hatton
Out of a total of 92 households in Hatton, 78 (84.8%) are family households, while 14 (15.2%) are nonfamily households. The most numerous type of family households are 4-person households, comprising 72, and the most common type of nonfamily households are 1-person households, comprising 14.
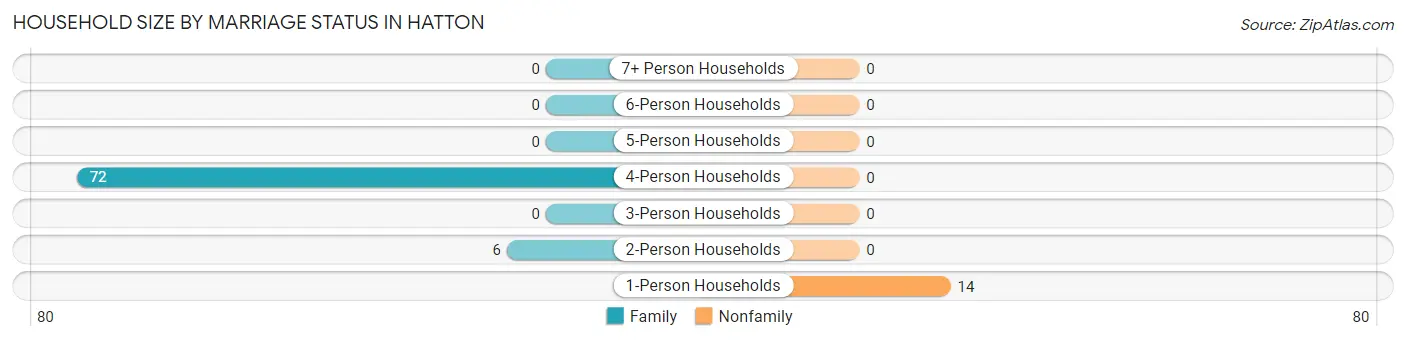
| Household Size | Family Households | Nonfamily Households |
| 1-Person Households | - | 14 (15.2%) |
| 2-Person Households | 6 (6.5%) | 0 (0.0%) |
| 3-Person Households | 0 (0.0%) | 0 (0.0%) |
| 4-Person Households | 72 (78.3%) | 0 (0.0%) |
| 5-Person Households | 0 (0.0%) | 0 (0.0%) |
| 6-Person Households | 0 (0.0%) | 0 (0.0%) |
| 7+ Person Households | 0 (0.0%) | 0 (0.0%) |
| Total | 78 (84.8%) | 14 (15.2%) |
Female Fertility in Hatton
Fertility by Age in Hatton
| Age Bracket | Women with Births | Births / 1,000 Women |
| 15 to 19 years | 0 (0.0%) | 0.0 |
| 20 to 34 years | 0 (0.0%) | 0.0 |
| 35 to 50 years | 0 (0.0%) | 0.0 |
| Total | 0 (0.0%) | 0.0 |
Fertility by Age by Marriage Status in Hatton
| Age Bracket | Married | Unmarried |
| 15 to 19 years | 0 (0.0%) | 0 (0.0%) |
| 20 to 34 years | 0 (0.0%) | 0 (0.0%) |
| 35 to 50 years | 0 (0.0%) | 0 (0.0%) |
| Total | 0 (0.0%) | 0 (0.0%) |
Fertility by Education in Hatton
| Educational Attainment | Women with Births | Births / 1,000 Women |
| Less than High School | 0 (0.0%) | 0.0 |
| High School Diploma | 0 (0.0%) | 0.0 |
| College or Associate's Degree | 0 (0.0%) | 0.0 |
| Bachelor's Degree | 0 (0.0%) | 0.0 |
| Graduate Degree | 0 (0.0%) | 0.0 |
| Total | 0 (0.0%) | 0.0 |
Fertility by Education by Marriage Status in Hatton
| Educational Attainment | Married | Unmarried |
| Less than High School | 0 (0.0%) | 0 (0.0%) |
| High School Diploma | 0 (0.0%) | 0 (0.0%) |
| College or Associate's Degree | 0 (0.0%) | 0 (0.0%) |
| Bachelor's Degree | 0 (0.0%) | 0 (0.0%) |
| Graduate Degree | 0 (0.0%) | 0 (0.0%) |
| Total | 0 (0.0%) | 0 (0.0%) |
Employment Characteristics in Hatton
Employment by Class of Employer in Hatton
Among the 148 employed individuals in Hatton, self-employed (not incorporated) (117 | 79.0%), and private company employees (31 | 20.9%) make up the most common classes of employment.
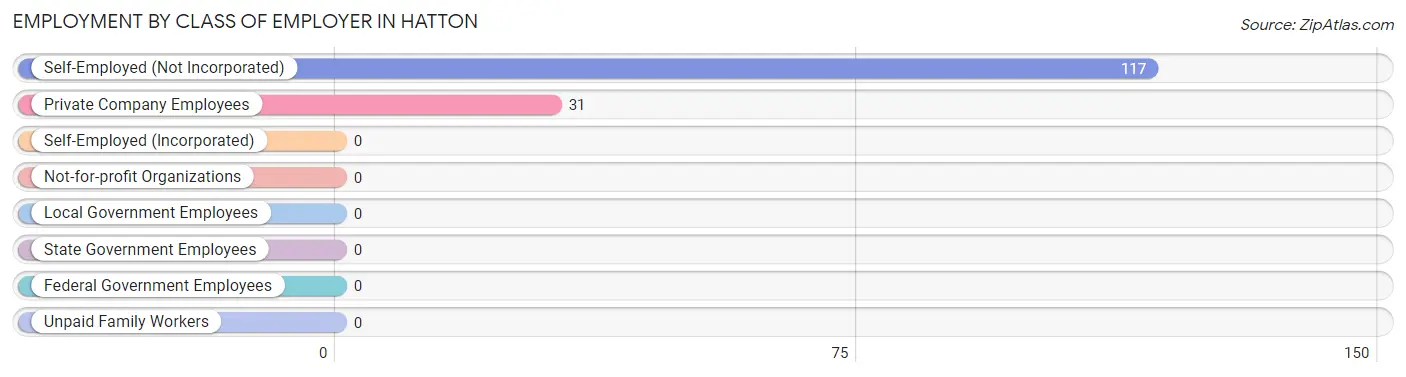
| Employer Class | # Employees | % Employees |
| Private Company Employees | 31 | 20.9% |
| Self-Employed (Incorporated) | 0 | 0.0% |
| Self-Employed (Not Incorporated) | 117 | 79.0% |
| Not-for-profit Organizations | 0 | 0.0% |
| Local Government Employees | 0 | 0.0% |
| State Government Employees | 0 | 0.0% |
| Federal Government Employees | 0 | 0.0% |
| Unpaid Family Workers | 0 | 0.0% |
| Total | 148 | 100.0% |
Employment Status by Age in Hatton
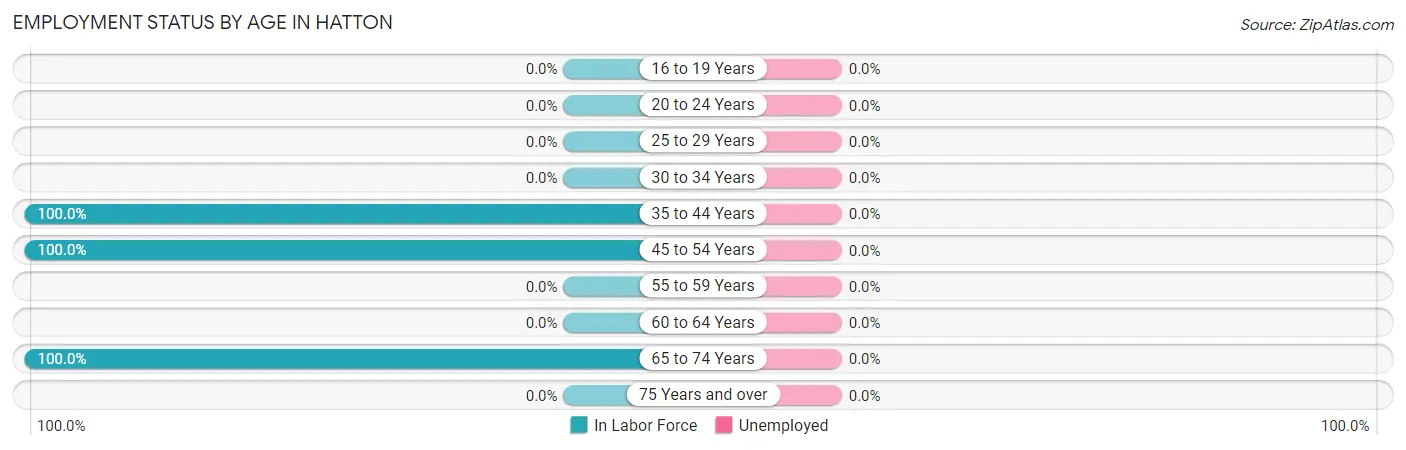
| Age Bracket | In Labor Force | Unemployed |
| 16 to 19 Years | 0 (0.0%) | 0 (0.0%) |
| 20 to 24 Years | 0 (0.0%) | 0 (0.0%) |
| 25 to 29 Years | 0 (0.0%) | 0 (0.0%) |
| 30 to 34 Years | 0 (0.0%) | 0 (0.0%) |
| 35 to 44 Years | 39 (100.0%) | 0 (0.0%) |
| 45 to 54 Years | 95 (100.0%) | 0 (0.0%) |
| 55 to 59 Years | 0 (0.0%) | 0 (0.0%) |
| 60 to 64 Years | 0 (0.0%) | 0 (0.0%) |
| 65 to 74 Years | 14 (100.0%) | 0 (0.0%) |
| 75 Years and over | 0 (0.0%) | 0 (0.0%) |
| Total | 148 (59.0%) | 0 (0.0%) |
Employment Status by Educational Attainment in Hatton
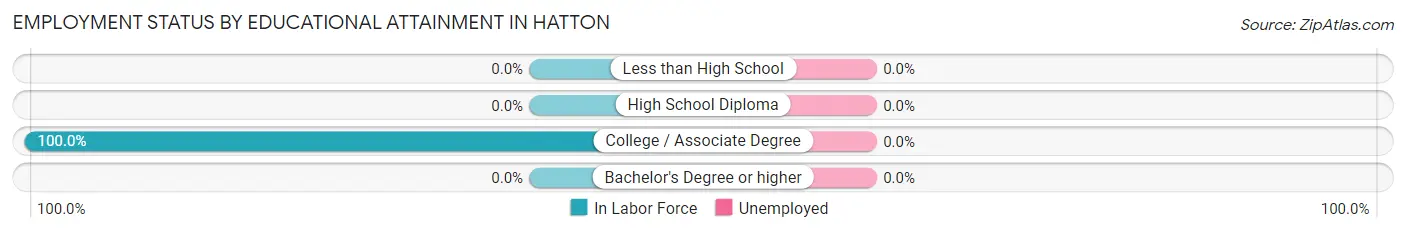
| Educational Attainment | In Labor Force | Unemployed |
| Less than High School | 0 (0.0%) | 0 (0.0%) |
| High School Diploma | 0 (0.0%) | 0 (0.0%) |
| College / Associate Degree | 134 (100.0%) | 0 (0.0%) |
| Bachelor's Degree or higher | 0 (0.0%) | 0 (0.0%) |
| Total | 134 (100.0%) | 0 (0.0%) |
Employment Occupations by Sex in Hatton
Management, Business, Science and Arts Occupations
The most common Management, Business, Science and Arts occupations in Hatton are Computers, Engineering & Science (17 | 11.5%), and Life, Physical & Social Science (17 | 11.5%).
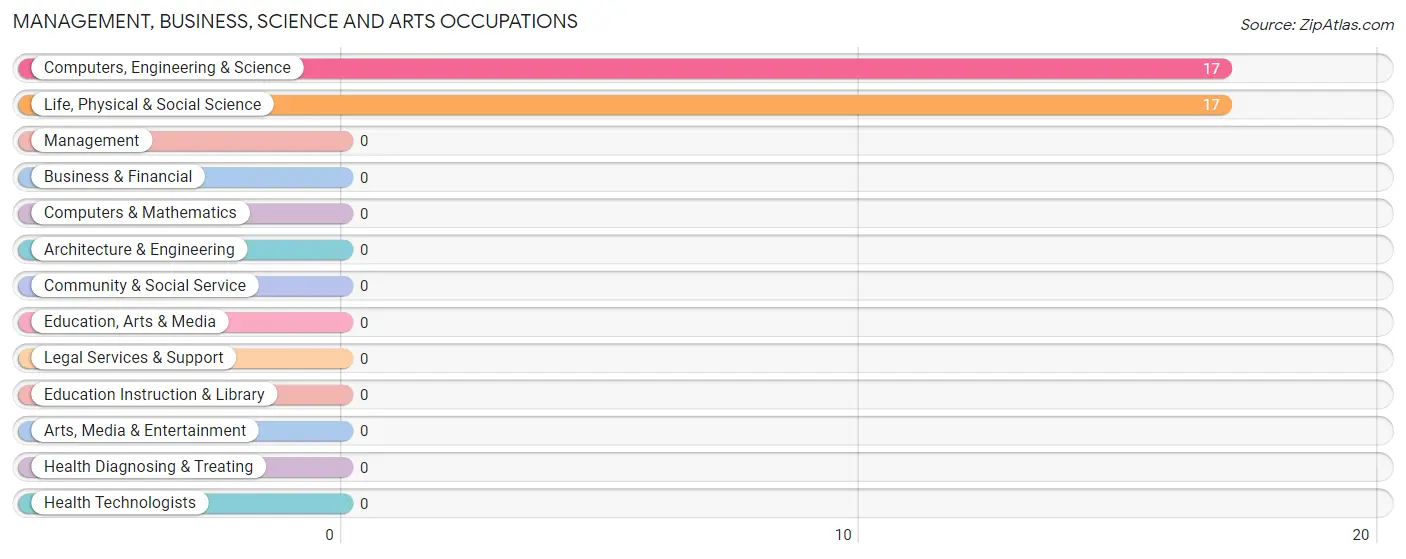
Management, Business, Science and Arts Occupations by Sex
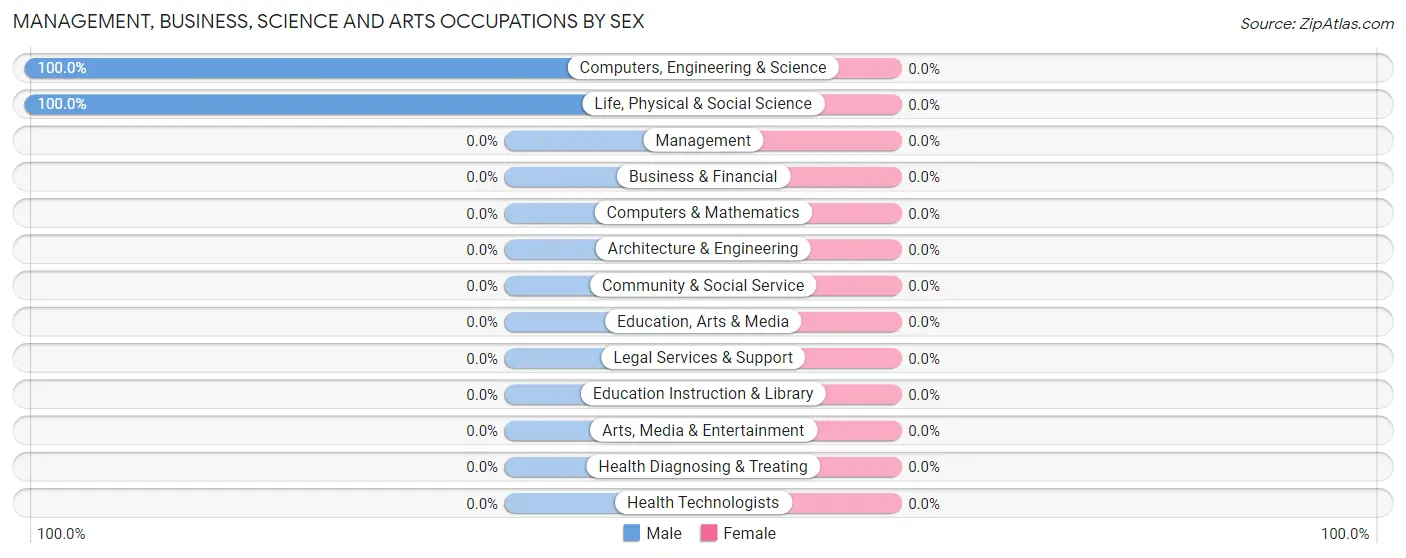
| Occupation | Male | Female |
| Management | 0 (0.0%) | 0 (0.0%) |
| Business & Financial | 0 (0.0%) | 0 (0.0%) |
| Computers, Engineering & Science | 17 (100.0%) | 0 (0.0%) |
| Computers & Mathematics | 0 (0.0%) | 0 (0.0%) |
| Architecture & Engineering | 0 (0.0%) | 0 (0.0%) |
| Life, Physical & Social Science | 17 (100.0%) | 0 (0.0%) |
| Community & Social Service | 0 (0.0%) | 0 (0.0%) |
| Education, Arts & Media | 0 (0.0%) | 0 (0.0%) |
| Legal Services & Support | 0 (0.0%) | 0 (0.0%) |
| Education Instruction & Library | 0 (0.0%) | 0 (0.0%) |
| Arts, Media & Entertainment | 0 (0.0%) | 0 (0.0%) |
| Health Diagnosing & Treating | 0 (0.0%) | 0 (0.0%) |
| Health Technologists | 0 (0.0%) | 0 (0.0%) |
| Total (Category) | 17 (100.0%) | 0 (0.0%) |
| Total (Overall) | 67 (45.3%) | 81 (54.7%) |
Services Occupations
The most common Services occupations in Hatton are , and Personal Care & Service (67 | 45.3%).
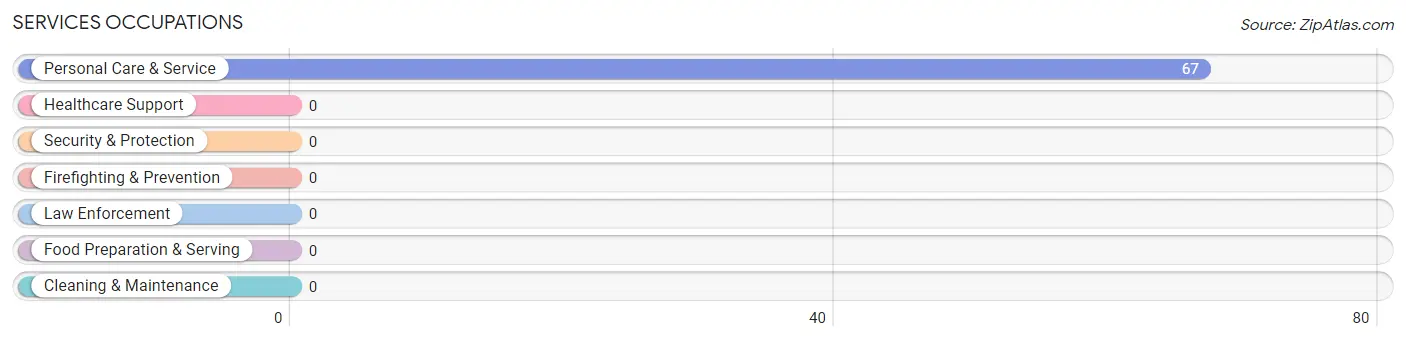
Services Occupations by Sex
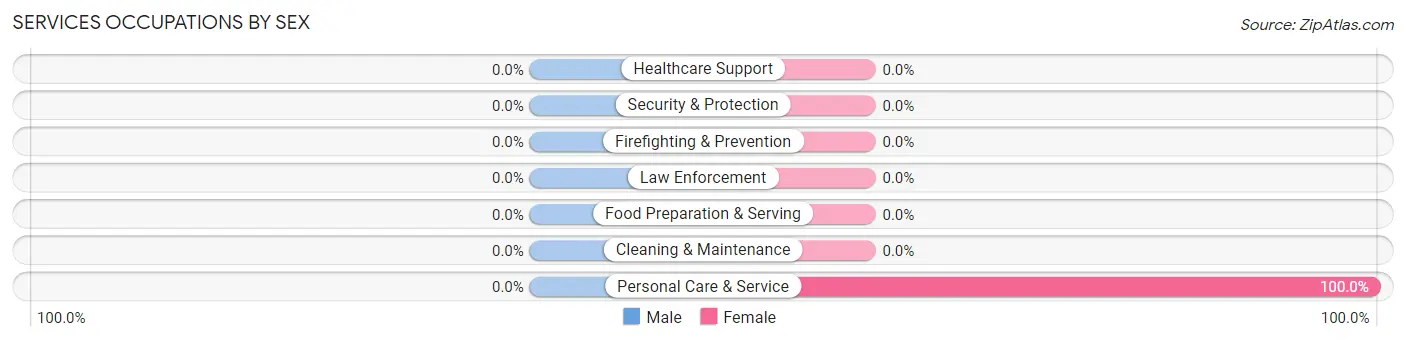
| Occupation | Male | Female |
| Healthcare Support | 0 (0.0%) | 0 (0.0%) |
| Security & Protection | 0 (0.0%) | 0 (0.0%) |
| Firefighting & Prevention | 0 (0.0%) | 0 (0.0%) |
| Law Enforcement | 0 (0.0%) | 0 (0.0%) |
| Food Preparation & Serving | 0 (0.0%) | 0 (0.0%) |
| Cleaning & Maintenance | 0 (0.0%) | 0 (0.0%) |
| Personal Care & Service | 0 (0.0%) | 67 (100.0%) |
| Total (Category) | 0 (0.0%) | 67 (100.0%) |
| Total (Overall) | 67 (45.3%) | 81 (54.7%) |
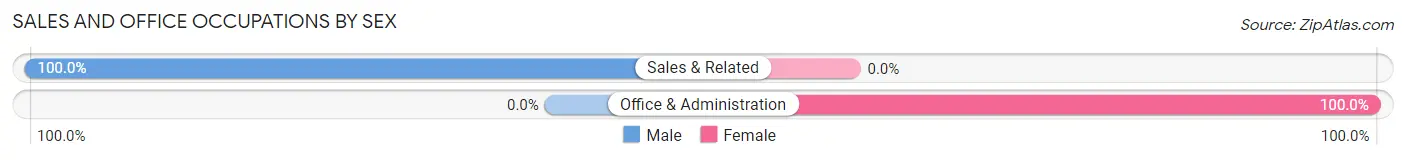
Sales and Office Occupations
The most common Sales and Office occupations in Hatton are Sales & Related (50 | 33.8%), and Office & Administration (14 | 9.5%).
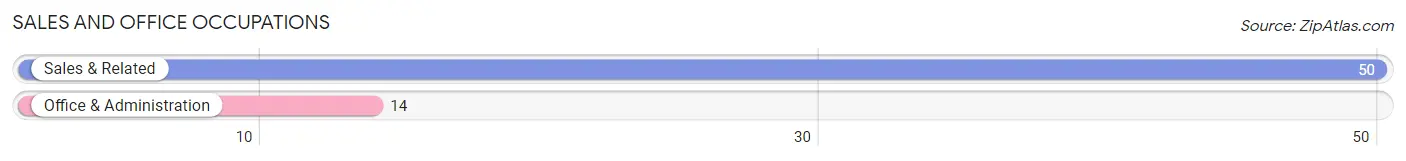
Sales and Office Occupations by Sex
| Occupation | Male | Female |
| Sales & Related | 50 (100.0%) | 0 (0.0%) |
| Office & Administration | 0 (0.0%) | 14 (100.0%) |
| Total (Category) | 50 (78.1%) | 14 (21.9%) |
| Total (Overall) | 67 (45.3%) | 81 (54.7%) |
Natural Resources, Construction and Maintenance Occupations
Natural Resources, Construction and Maintenance Occupations by Sex
| Occupation | Male | Female |
| Farming, Fishing & Forestry | 0 (0.0%) | 0 (0.0%) |
| Construction & Extraction | 0 (0.0%) | 0 (0.0%) |
| Installation, Maintenance & Repair | 0 (0.0%) | 0 (0.0%) |
| Total (Category) | 0 (0.0%) | 0 (0.0%) |
| Total (Overall) | 67 (45.3%) | 81 (54.7%) |
Production, Transportation and Moving Occupations
Production, Transportation and Moving Occupations by Sex
| Occupation | Male | Female |
| Production | 0 (0.0%) | 0 (0.0%) |
| Transportation | 0 (0.0%) | 0 (0.0%) |
| Material Moving | 0 (0.0%) | 0 (0.0%) |
| Total (Category) | 0 (0.0%) | 0 (0.0%) |
| Total (Overall) | 67 (45.3%) | 81 (54.7%) |
Employment Industries by Sex in Hatton
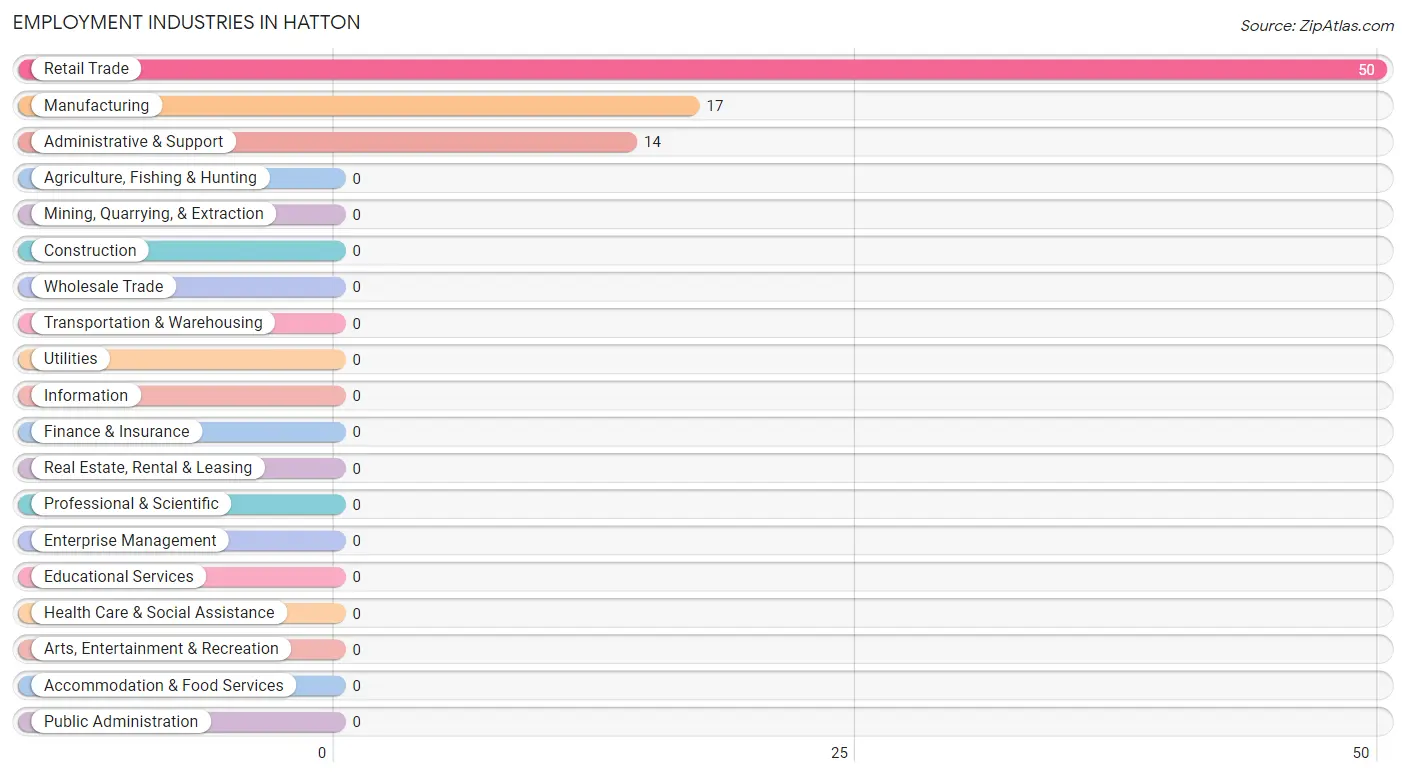
Employment Industries in Hatton
The major employment industries in Hatton include Retail Trade (50 | 33.8%), Manufacturing (17 | 11.5%), and Administrative & Support (14 | 9.5%).
Employment Industries by Sex in Hatton
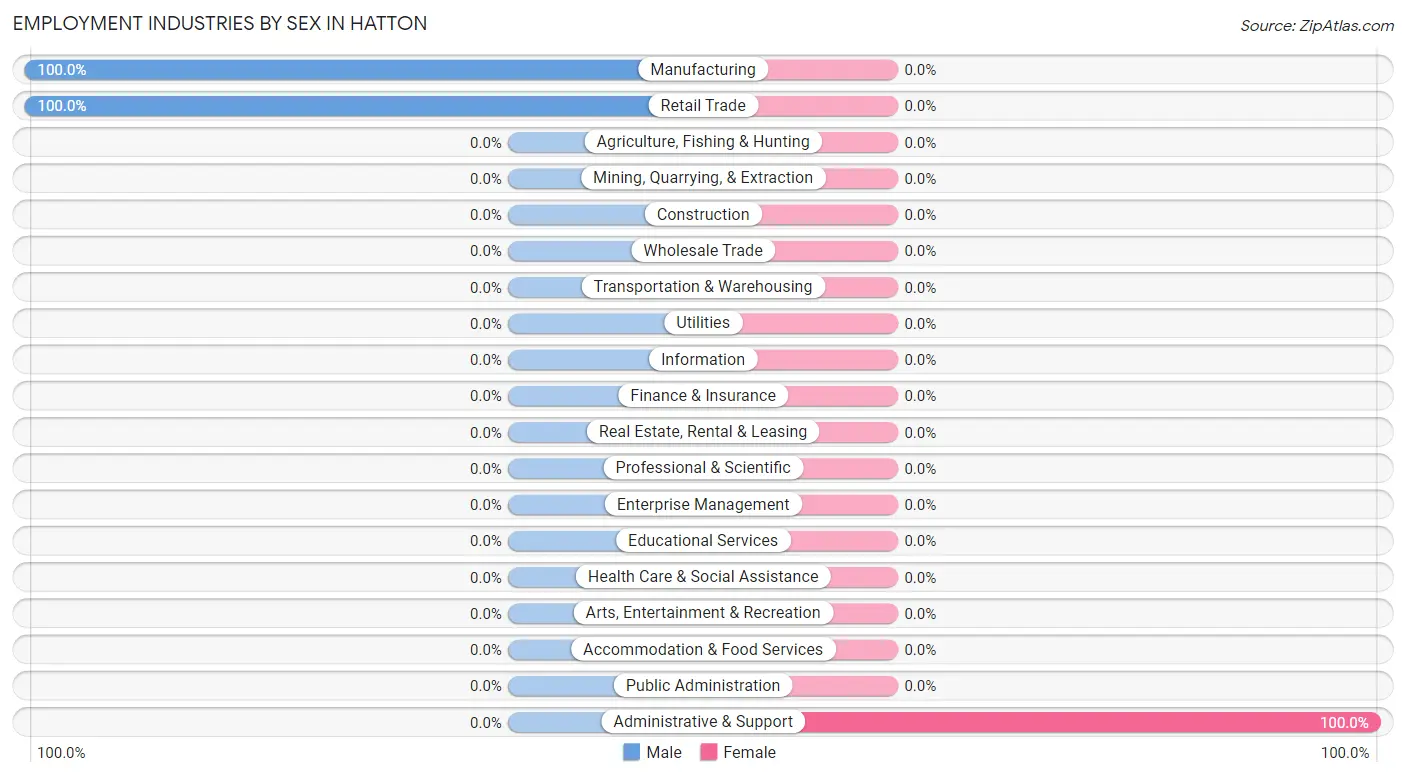
| Industry | Male | Female |
| Agriculture, Fishing & Hunting | 0 (0.0%) | 0 (0.0%) |
| Mining, Quarrying, & Extraction | 0 (0.0%) | 0 (0.0%) |
| Construction | 0 (0.0%) | 0 (0.0%) |
| Manufacturing | 17 (100.0%) | 0 (0.0%) |
| Wholesale Trade | 0 (0.0%) | 0 (0.0%) |
| Retail Trade | 50 (100.0%) | 0 (0.0%) |
| Transportation & Warehousing | 0 (0.0%) | 0 (0.0%) |
| Utilities | 0 (0.0%) | 0 (0.0%) |
| Information | 0 (0.0%) | 0 (0.0%) |
| Finance & Insurance | 0 (0.0%) | 0 (0.0%) |
| Real Estate, Rental & Leasing | 0 (0.0%) | 0 (0.0%) |
| Professional & Scientific | 0 (0.0%) | 0 (0.0%) |
| Enterprise Management | 0 (0.0%) | 0 (0.0%) |
| Administrative & Support | 0 (0.0%) | 14 (100.0%) |
| Educational Services | 0 (0.0%) | 0 (0.0%) |
| Health Care & Social Assistance | 0 (0.0%) | 0 (0.0%) |
| Arts, Entertainment & Recreation | 0 (0.0%) | 0 (0.0%) |
| Accommodation & Food Services | 0 (0.0%) | 0 (0.0%) |
| Public Administration | 0 (0.0%) | 0 (0.0%) |
| Total | 67 (45.3%) | 81 (54.7%) |
Education in Hatton
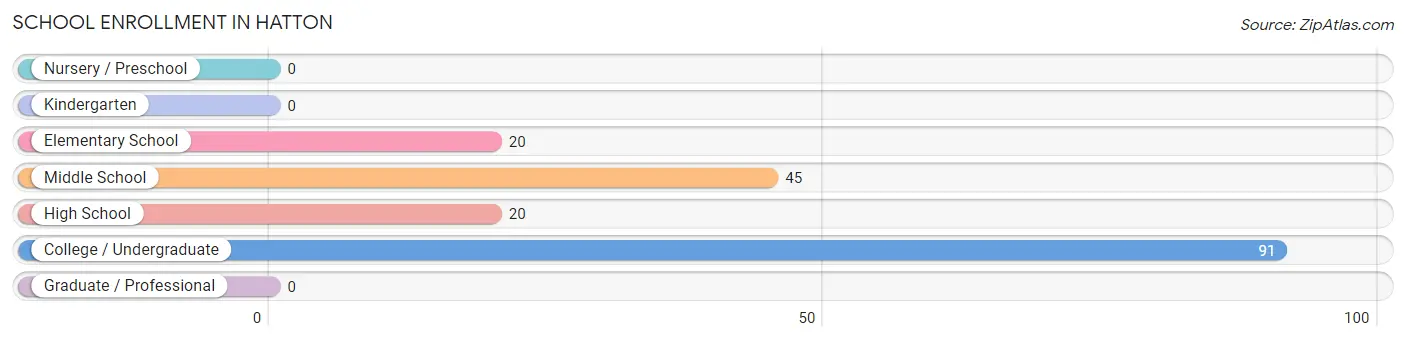
School Enrollment in Hatton
The most common levels of schooling among the 176 students in Hatton are college / undergraduate (91 | 51.7%), middle school (45 | 25.6%), and elementary school (20 | 11.4%).
| School Level | # Students | % Students |
| Nursery / Preschool | 0 | 0.0% |
| Kindergarten | 0 | 0.0% |
| Elementary School | 20 | 11.4% |
| Middle School | 45 | 25.6% |
| High School | 20 | 11.4% |
| College / Undergraduate | 91 | 51.7% |
| Graduate / Professional | 0 | 0.0% |
| Total | 176 | 100.0% |
School Enrollment by Age by Funding Source in Hatton
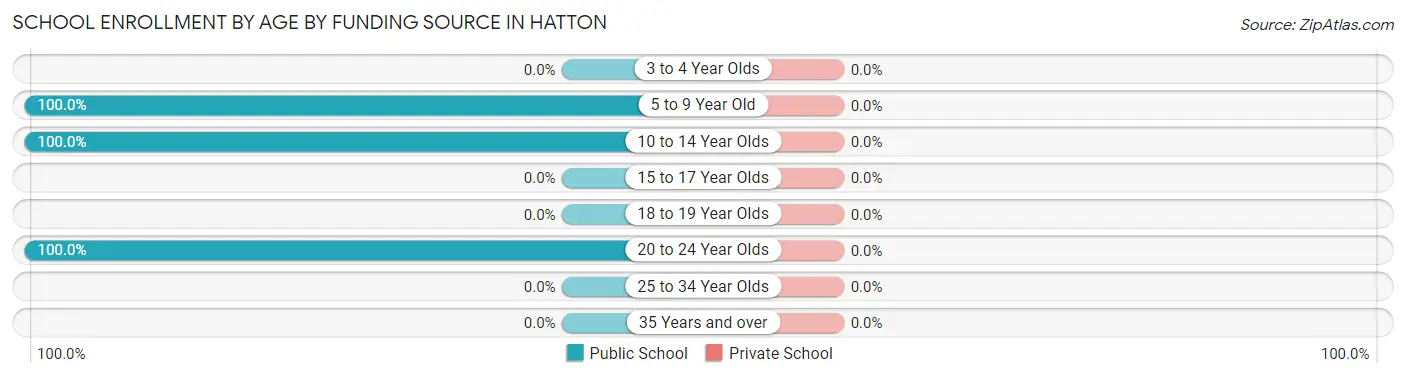
| Age Bracket | Public School | Private School |
| 3 to 4 Year Olds | 0 (0.0%) | 0 (0.0%) |
| 5 to 9 Year Old | 20 (100.0%) | 0 (0.0%) |
| 10 to 14 Year Olds | 65 (100.0%) | 0 (0.0%) |
| 15 to 17 Year Olds | 0 (0.0%) | 0 (0.0%) |
| 18 to 19 Year Olds | 0 (0.0%) | 0 (0.0%) |
| 20 to 24 Year Olds | 91 (100.0%) | 0 (0.0%) |
| 25 to 34 Year Olds | 0 (0.0%) | 0 (0.0%) |
| 35 Years and over | 0 (0.0%) | 0 (0.0%) |
| Total | 176 (100.0%) | 0 (0.0%) |
Educational Attainment by Field of Study in Hatton
, and education (6 | 100.0%) are the most common fields of study among 6 individuals in Hatton who have obtained a bachelor's degree or higher.
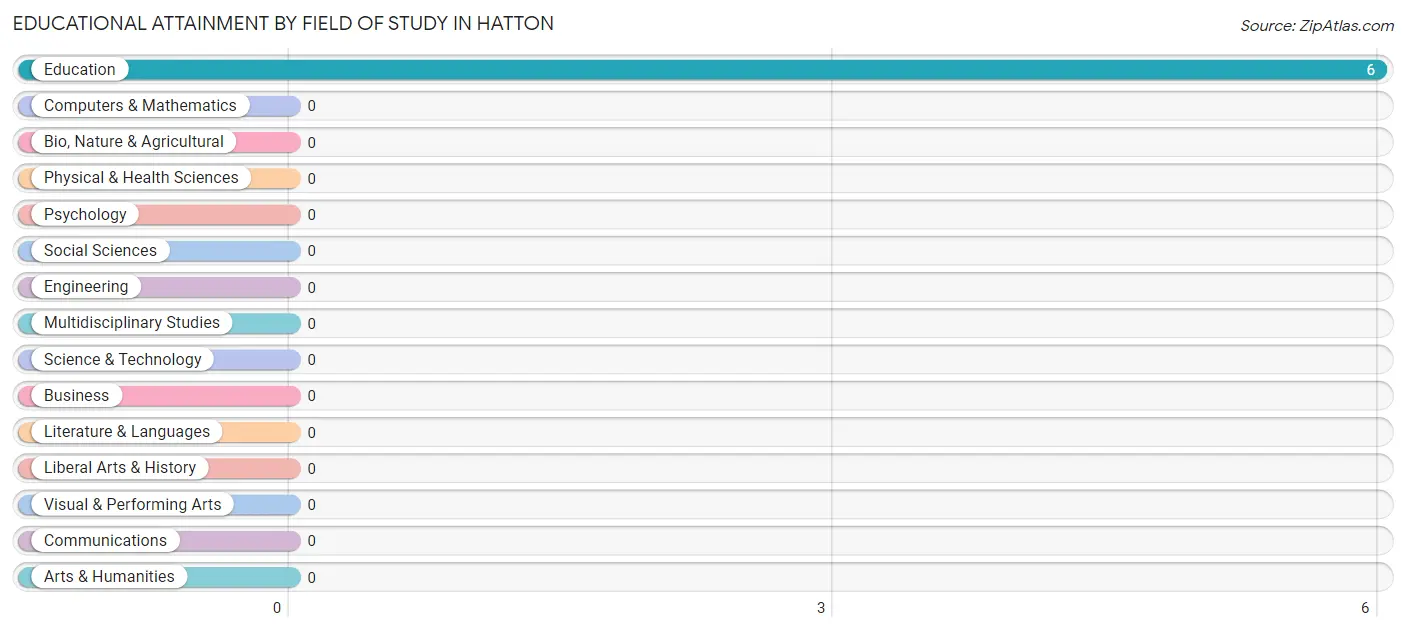
| Field of Study | # Graduates | % Graduates |
| Computers & Mathematics | 0 | 0.0% |
| Bio, Nature & Agricultural | 0 | 0.0% |
| Physical & Health Sciences | 0 | 0.0% |
| Psychology | 0 | 0.0% |
| Social Sciences | 0 | 0.0% |
| Engineering | 0 | 0.0% |
| Multidisciplinary Studies | 0 | 0.0% |
| Science & Technology | 0 | 0.0% |
| Business | 0 | 0.0% |
| Education | 6 | 100.0% |
| Literature & Languages | 0 | 0.0% |
| Liberal Arts & History | 0 | 0.0% |
| Visual & Performing Arts | 0 | 0.0% |
| Communications | 0 | 0.0% |
| Arts & Humanities | 0 | 0.0% |
| Total | 6 | 100.0% |
Transportation & Commute in Hatton
Vehicle Availability by Sex in Hatton
The most prevalent vehicle ownership categories in Hatton are males with 4 vehicles (50, accounting for 74.6%) and females with 4 vehicles (45, making up 61.7%).
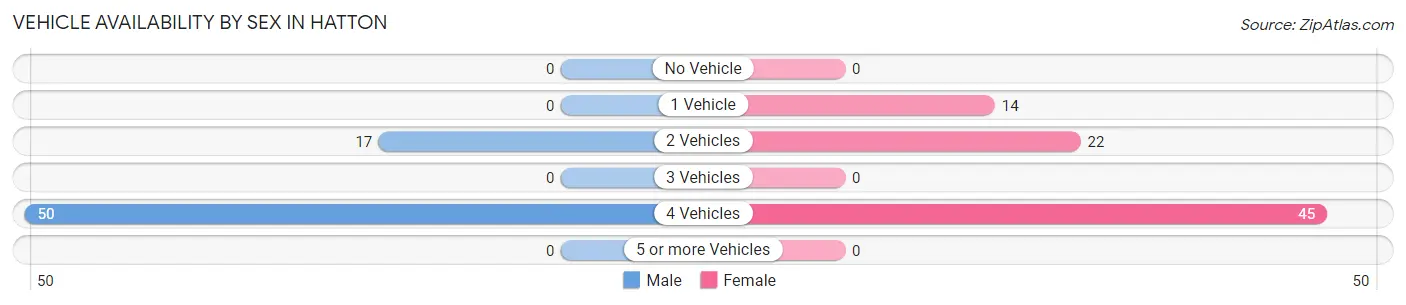
| Vehicles Available | Male | Female |
| No Vehicle | 0 (0.0%) | 0 (0.0%) |
| 1 Vehicle | 0 (0.0%) | 14 (17.3%) |
| 2 Vehicles | 17 (25.4%) | 22 (27.2%) |
| 3 Vehicles | 0 (0.0%) | 0 (0.0%) |
| 4 Vehicles | 50 (74.6%) | 45 (55.6%) |
| 5 or more Vehicles | 0 (0.0%) | 0 (0.0%) |
| Total | 67 (100.0%) | 81 (100.0%) |
Commute Time in Hatton
The most frequently occuring commute durations in Hatton are 5 to 9 minutes (109 commuters, 73.7%), less than 5 minutes (22 commuters, 14.9%), and 45 to 59 minutes (17 commuters, 11.5%).
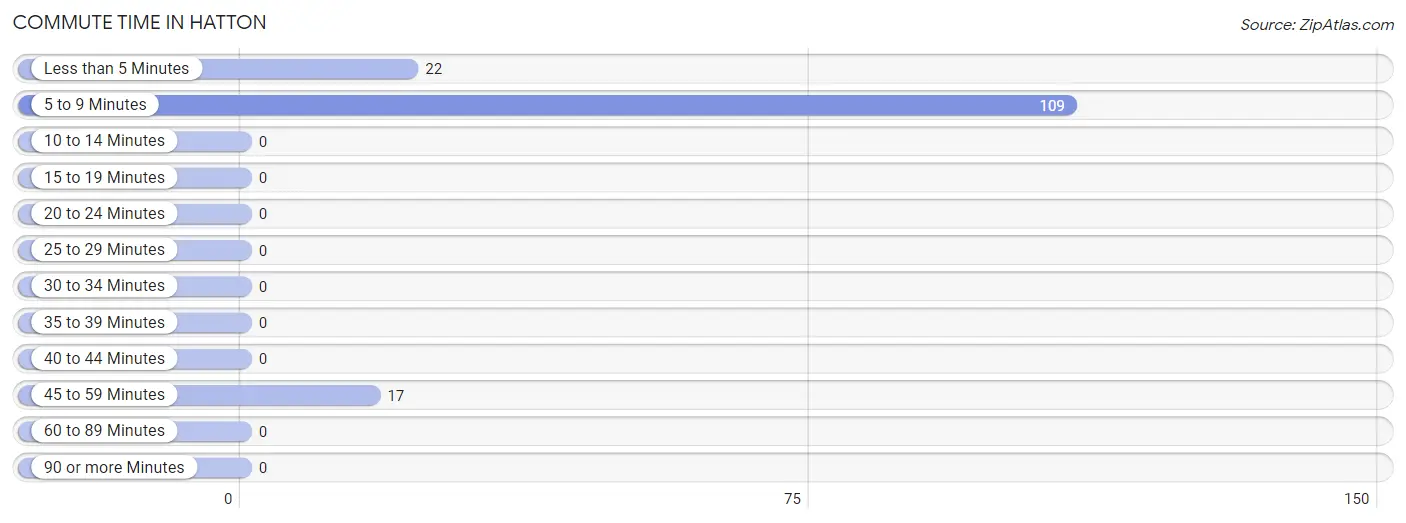
| Commute Time | # Commuters | % Commuters |
| Less than 5 Minutes | 22 | 14.9% |
| 5 to 9 Minutes | 109 | 73.7% |
| 10 to 14 Minutes | 0 | 0.0% |
| 15 to 19 Minutes | 0 | 0.0% |
| 20 to 24 Minutes | 0 | 0.0% |
| 25 to 29 Minutes | 0 | 0.0% |
| 30 to 34 Minutes | 0 | 0.0% |
| 35 to 39 Minutes | 0 | 0.0% |
| 40 to 44 Minutes | 0 | 0.0% |
| 45 to 59 Minutes | 17 | 11.5% |
| 60 to 89 Minutes | 0 | 0.0% |
| 90 or more Minutes | 0 | 0.0% |
Commute Time by Sex in Hatton
The most common commute times in Hatton are 5 to 9 minutes (50 commuters, 74.6%) for males and 5 to 9 minutes (59 commuters, 72.8%) for females.
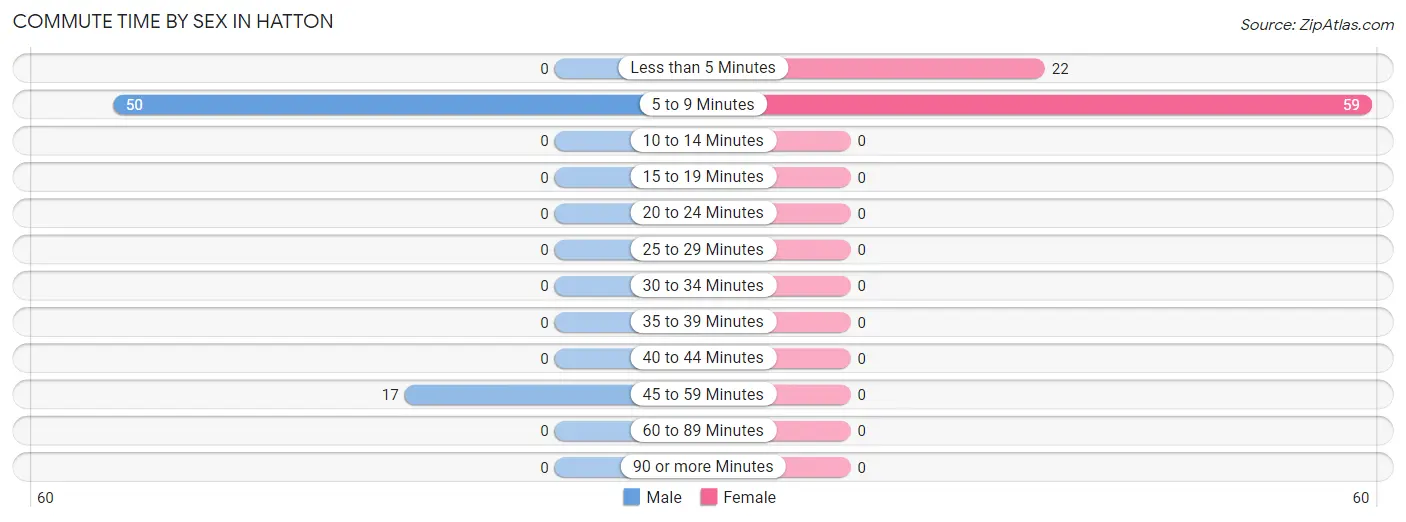
| Commute Time | Male | Female |
| Less than 5 Minutes | 0 (0.0%) | 22 (27.2%) |
| 5 to 9 Minutes | 50 (74.6%) | 59 (72.8%) |
| 10 to 14 Minutes | 0 (0.0%) | 0 (0.0%) |
| 15 to 19 Minutes | 0 (0.0%) | 0 (0.0%) |
| 20 to 24 Minutes | 0 (0.0%) | 0 (0.0%) |
| 25 to 29 Minutes | 0 (0.0%) | 0 (0.0%) |
| 30 to 34 Minutes | 0 (0.0%) | 0 (0.0%) |
| 35 to 39 Minutes | 0 (0.0%) | 0 (0.0%) |
| 40 to 44 Minutes | 0 (0.0%) | 0 (0.0%) |
| 45 to 59 Minutes | 17 (25.4%) | 0 (0.0%) |
| 60 to 89 Minutes | 0 (0.0%) | 0 (0.0%) |
| 90 or more Minutes | 0 (0.0%) | 0 (0.0%) |
Time of Departure to Work by Sex in Hatton
The most frequent times of departure to work in Hatton are 7:00 AM to 7:29 AM (50, 74.6%) for males and 9:00 AM to 9:59 AM (67, 82.7%) for females.
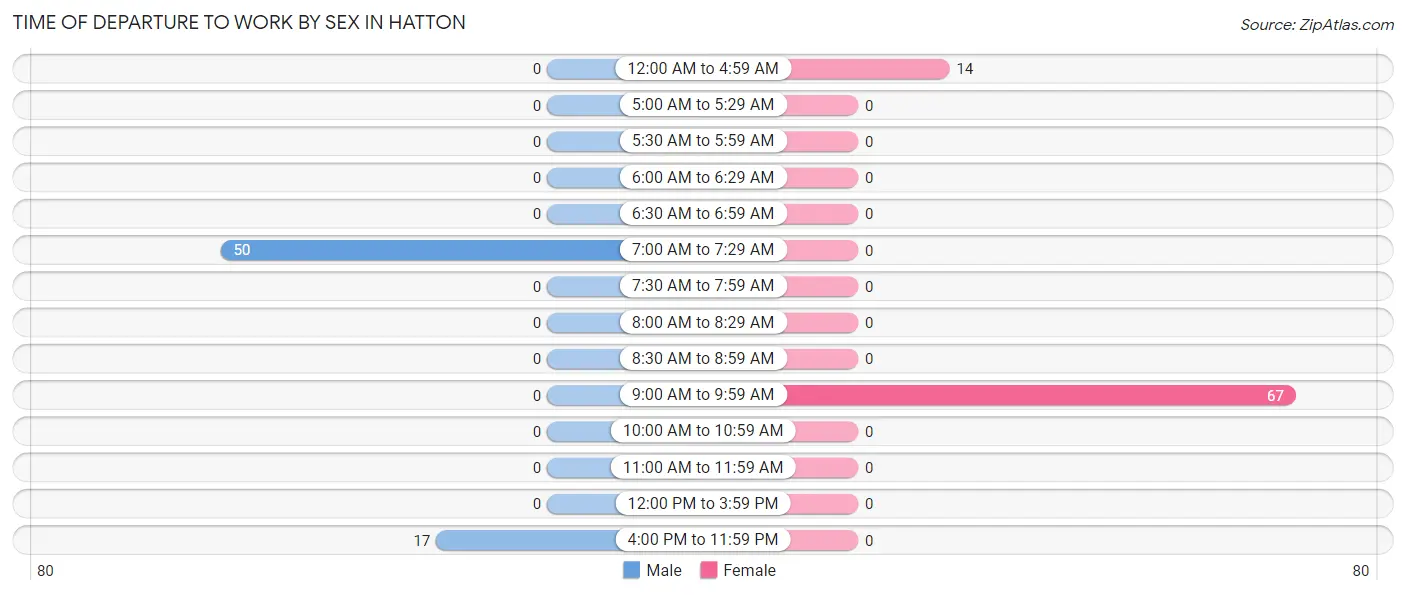
| Time of Departure | Male | Female |
| 12:00 AM to 4:59 AM | 0 (0.0%) | 14 (17.3%) |
| 5:00 AM to 5:29 AM | 0 (0.0%) | 0 (0.0%) |
| 5:30 AM to 5:59 AM | 0 (0.0%) | 0 (0.0%) |
| 6:00 AM to 6:29 AM | 0 (0.0%) | 0 (0.0%) |
| 6:30 AM to 6:59 AM | 0 (0.0%) | 0 (0.0%) |
| 7:00 AM to 7:29 AM | 50 (74.6%) | 0 (0.0%) |
| 7:30 AM to 7:59 AM | 0 (0.0%) | 0 (0.0%) |
| 8:00 AM to 8:29 AM | 0 (0.0%) | 0 (0.0%) |
| 8:30 AM to 8:59 AM | 0 (0.0%) | 0 (0.0%) |
| 9:00 AM to 9:59 AM | 0 (0.0%) | 67 (82.7%) |
| 10:00 AM to 10:59 AM | 0 (0.0%) | 0 (0.0%) |
| 11:00 AM to 11:59 AM | 0 (0.0%) | 0 (0.0%) |
| 12:00 PM to 3:59 PM | 0 (0.0%) | 0 (0.0%) |
| 4:00 PM to 11:59 PM | 17 (25.4%) | 0 (0.0%) |
| Total | 67 (100.0%) | 81 (100.0%) |
Housing Occupancy in Hatton
Occupancy by Ownership in Hatton
Of the total 92 dwellings in Hatton, owner-occupied units account for 42 (45.7%), while renter-occupied units make up 50 (54.3%).
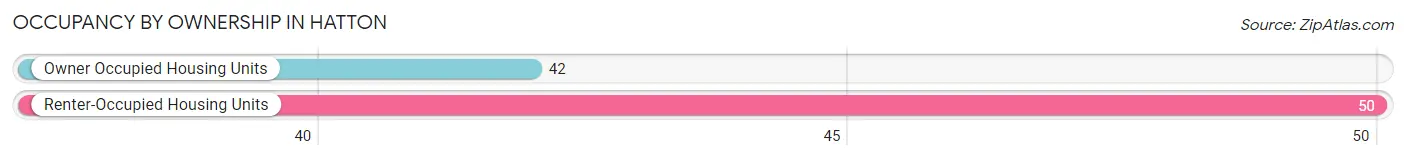
| Occupancy | # Housing Units | % Housing Units |
| Owner Occupied Housing Units | 42 | 45.7% |
| Renter-Occupied Housing Units | 50 | 54.3% |
| Total Occupied Housing Units | 92 | 100.0% |
Occupancy by Household Size in Hatton
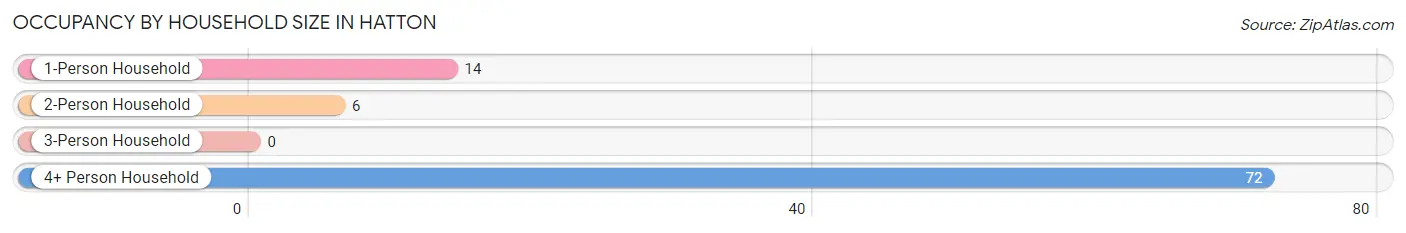
| Household Size | # Housing Units | % Housing Units |
| 1-Person Household | 14 | 15.2% |
| 2-Person Household | 6 | 6.5% |
| 3-Person Household | 0 | 0.0% |
| 4+ Person Household | 72 | 78.3% |
| Total Housing Units | 92 | 100.0% |
Occupancy by Ownership by Household Size in Hatton
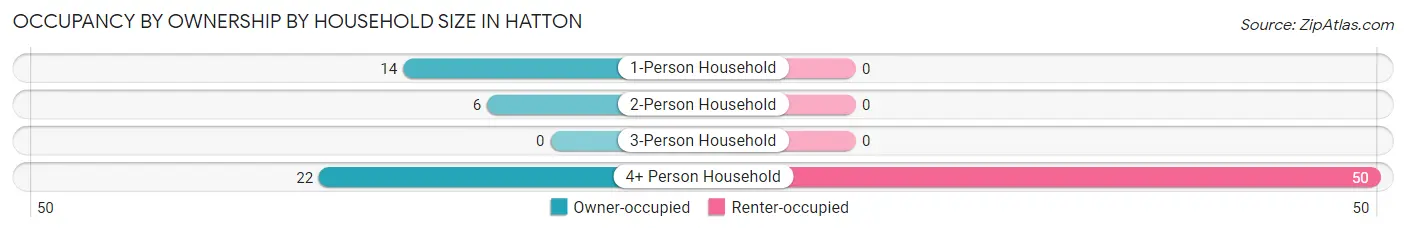
| Household Size | Owner-occupied | Renter-occupied |
| 1-Person Household | 14 (100.0%) | 0 (0.0%) |
| 2-Person Household | 6 (100.0%) | 0 (0.0%) |
| 3-Person Household | 0 (0.0%) | 0 (0.0%) |
| 4+ Person Household | 22 (30.6%) | 50 (69.4%) |
| Total Housing Units | 42 (45.7%) | 50 (54.3%) |
Occupancy by Educational Attainment in Hatton
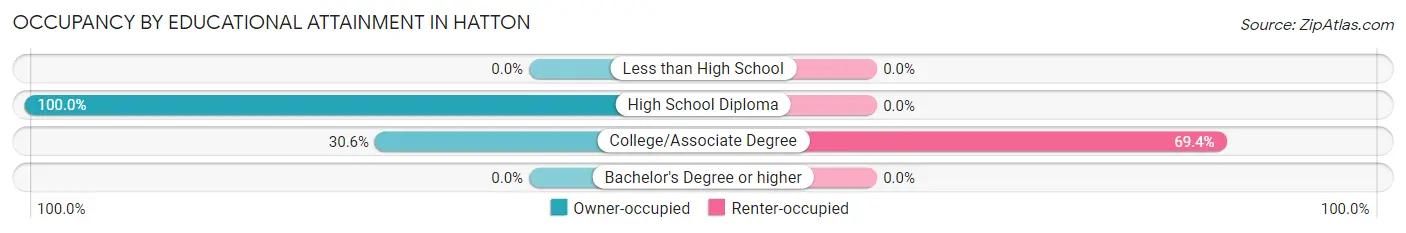
| Household Size | Owner-occupied | Renter-occupied |
| Less than High School | 0 (0.0%) | 0 (0.0%) |
| High School Diploma | 20 (100.0%) | 0 (0.0%) |
| College/Associate Degree | 22 (30.6%) | 50 (69.4%) |
| Bachelor's Degree or higher | 0 (0.0%) | 0 (0.0%) |
Occupancy by Age of Householder in Hatton
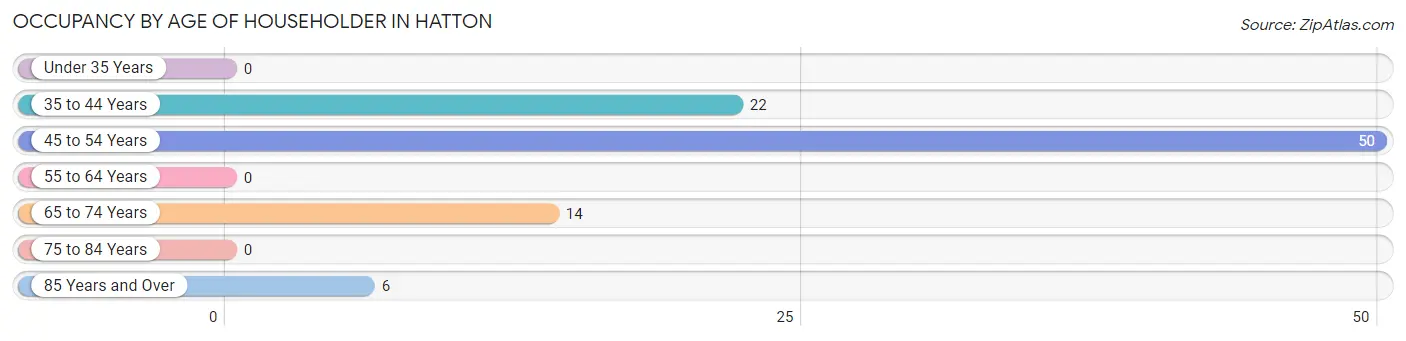
| Age Bracket | # Households | % Households |
| Under 35 Years | 0 | 0.0% |
| 35 to 44 Years | 22 | 23.9% |
| 45 to 54 Years | 50 | 54.3% |
| 55 to 64 Years | 0 | 0.0% |
| 65 to 74 Years | 14 | 15.2% |
| 75 to 84 Years | 0 | 0.0% |
| 85 Years and Over | 6 | 6.5% |
| Total | 92 | 100.0% |
Housing Finances in Hatton
Median Income by Occupancy in Hatton
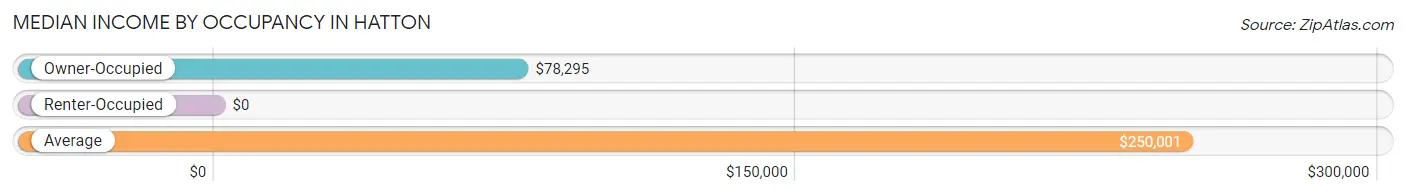
| Occupancy Type | # Households | Median Income |
| Owner-Occupied | 42 (45.7%) | $78,295 |
| Renter-Occupied | 50 (54.3%) | $0 |
| Average | 92 (100.0%) | $250,001 |
Occupancy by Householder Income Bracket in Hatton
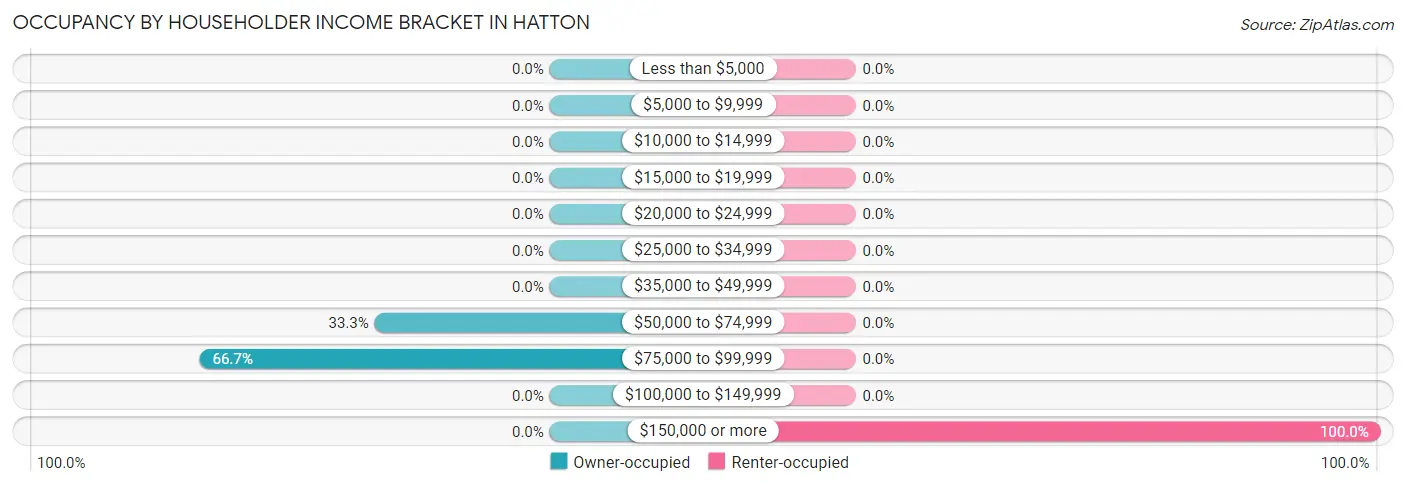
| Income Bracket | Owner-occupied | Renter-occupied |
| Less than $5,000 | 0 (0.0%) | 0 (0.0%) |
| $5,000 to $9,999 | 0 (0.0%) | 0 (0.0%) |
| $10,000 to $14,999 | 0 (0.0%) | 0 (0.0%) |
| $15,000 to $19,999 | 0 (0.0%) | 0 (0.0%) |
| $20,000 to $24,999 | 0 (0.0%) | 0 (0.0%) |
| $25,000 to $34,999 | 0 (0.0%) | 0 (0.0%) |
| $35,000 to $49,999 | 0 (0.0%) | 0 (0.0%) |
| $50,000 to $74,999 | 14 (33.3%) | 0 (0.0%) |
| $75,000 to $99,999 | 28 (66.7%) | 0 (0.0%) |
| $100,000 to $149,999 | 0 (0.0%) | 0 (0.0%) |
| $150,000 or more | 0 (0.0%) | 50 (100.0%) |
| Total | 42 (100.0%) | 50 (100.0%) |
Monthly Housing Cost Tiers in Hatton
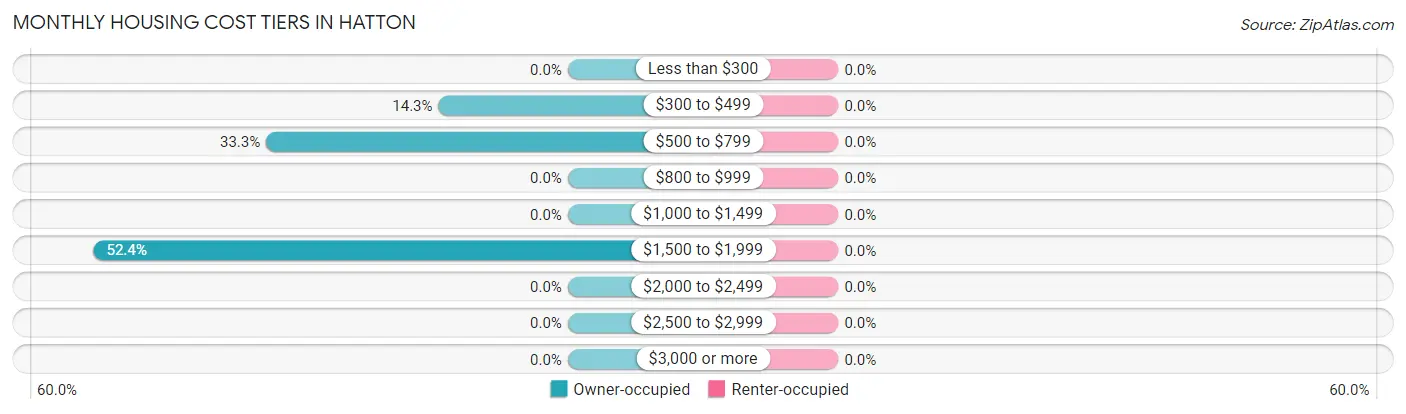
| Monthly Cost | Owner-occupied | Renter-occupied |
| Less than $300 | 0 (0.0%) | 0 (0.0%) |
| $300 to $499 | 6 (14.3%) | 0 (0.0%) |
| $500 to $799 | 14 (33.3%) | 0 (0.0%) |
| $800 to $999 | 0 (0.0%) | 0 (0.0%) |
| $1,000 to $1,499 | 0 (0.0%) | 0 (0.0%) |
| $1,500 to $1,999 | 22 (52.4%) | 0 (0.0%) |
| $2,000 to $2,499 | 0 (0.0%) | 0 (0.0%) |
| $2,500 to $2,999 | 0 (0.0%) | 0 (0.0%) |
| $3,000 or more | 0 (0.0%) | 0 (0.0%) |
| Total | 42 (100.0%) | 50 (100.0%) |
Physical Housing Characteristics in Hatton
Housing Structures in Hatton
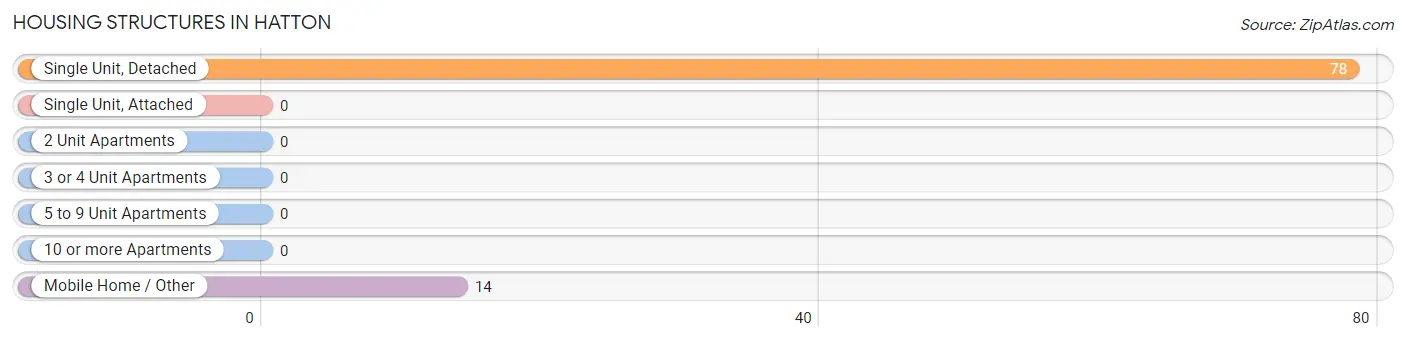
| Structure Type | # Housing Units | % Housing Units |
| Single Unit, Detached | 78 | 84.8% |
| Single Unit, Attached | 0 | 0.0% |
| 2 Unit Apartments | 0 | 0.0% |
| 3 or 4 Unit Apartments | 0 | 0.0% |
| 5 to 9 Unit Apartments | 0 | 0.0% |
| 10 or more Apartments | 0 | 0.0% |
| Mobile Home / Other | 14 | 15.2% |
| Total | 92 | 100.0% |
Housing Structures by Occupancy in Hatton
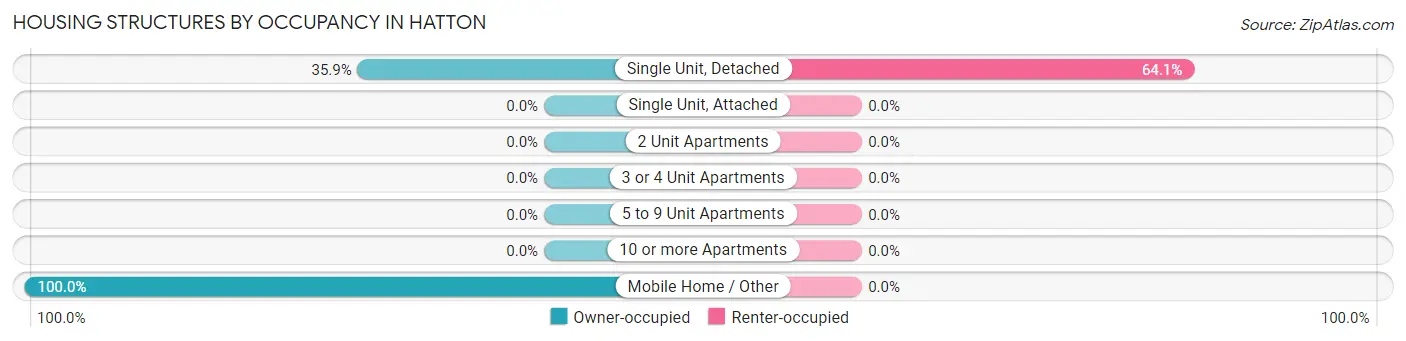
| Structure Type | Owner-occupied | Renter-occupied |
| Single Unit, Detached | 28 (35.9%) | 50 (64.1%) |
| Single Unit, Attached | 0 (0.0%) | 0 (0.0%) |
| 2 Unit Apartments | 0 (0.0%) | 0 (0.0%) |
| 3 or 4 Unit Apartments | 0 (0.0%) | 0 (0.0%) |
| 5 to 9 Unit Apartments | 0 (0.0%) | 0 (0.0%) |
| 10 or more Apartments | 0 (0.0%) | 0 (0.0%) |
| Mobile Home / Other | 14 (100.0%) | 0 (0.0%) |
| Total | 42 (45.7%) | 50 (54.3%) |
Housing Structures by Number of Rooms in Hatton
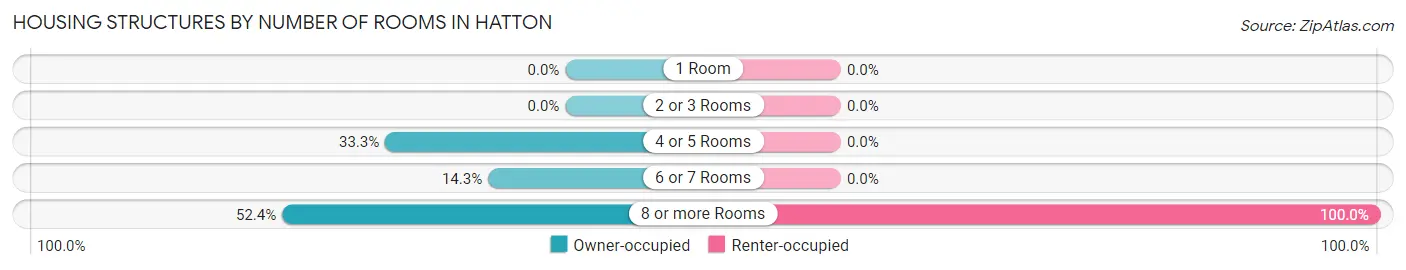
| Number of Rooms | Owner-occupied | Renter-occupied |
| 1 Room | 0 (0.0%) | 0 (0.0%) |
| 2 or 3 Rooms | 0 (0.0%) | 0 (0.0%) |
| 4 or 5 Rooms | 14 (33.3%) | 0 (0.0%) |
| 6 or 7 Rooms | 6 (14.3%) | 0 (0.0%) |
| 8 or more Rooms | 22 (52.4%) | 50 (100.0%) |
| Total | 42 (100.0%) | 50 (100.0%) |
Housing Structure by Heating Type in Hatton
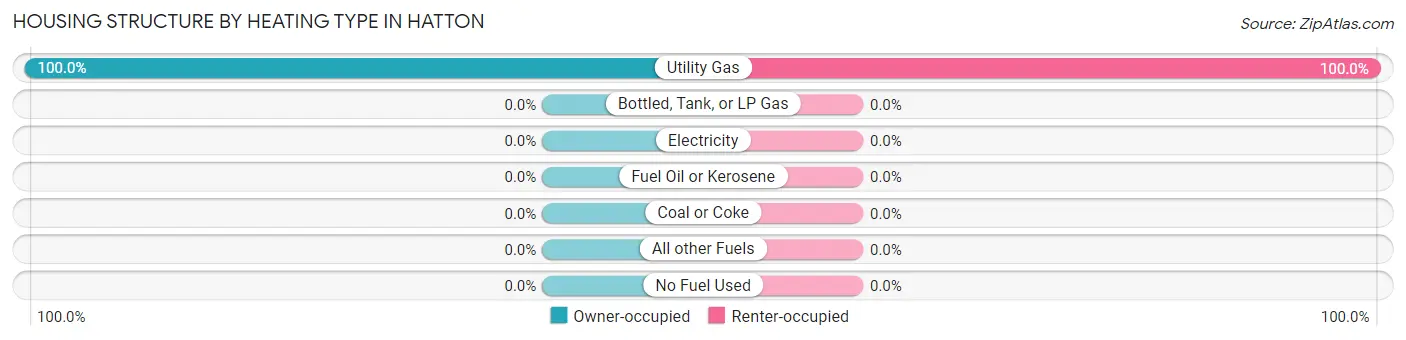
| Heating Type | Owner-occupied | Renter-occupied |
| Utility Gas | 42 (100.0%) | 50 (100.0%) |
| Bottled, Tank, or LP Gas | 0 (0.0%) | 0 (0.0%) |
| Electricity | 0 (0.0%) | 0 (0.0%) |
| Fuel Oil or Kerosene | 0 (0.0%) | 0 (0.0%) |
| Coal or Coke | 0 (0.0%) | 0 (0.0%) |
| All other Fuels | 0 (0.0%) | 0 (0.0%) |
| No Fuel Used | 0 (0.0%) | 0 (0.0%) |
| Total | 42 (100.0%) | 50 (100.0%) |
Household Vehicle Usage in Hatton
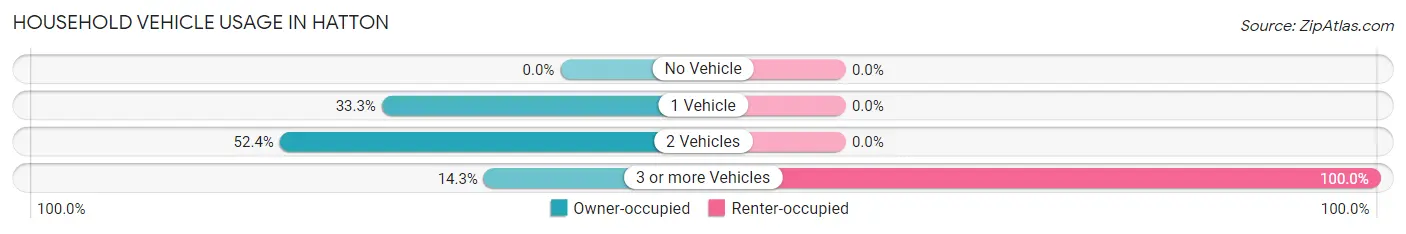
| Vehicles per Household | Owner-occupied | Renter-occupied |
| No Vehicle | 0 (0.0%) | 0 (0.0%) |
| 1 Vehicle | 14 (33.3%) | 0 (0.0%) |
| 2 Vehicles | 22 (52.4%) | 0 (0.0%) |
| 3 or more Vehicles | 6 (14.3%) | 50 (100.0%) |
| Total | 42 (100.0%) | 50 (100.0%) |
Real Estate & Mortgages in Hatton
Real Estate and Mortgage Overview in Hatton
| Characteristic | Without Mortgage | With Mortgage |
| Housing Units | 6 | 36 |
| Median Property Value | - | - |
| Median Household Income | - | - |
| Monthly Housing Costs | - | - |
| Real Estate Taxes | - | - |
Property Value by Mortgage Status in Hatton
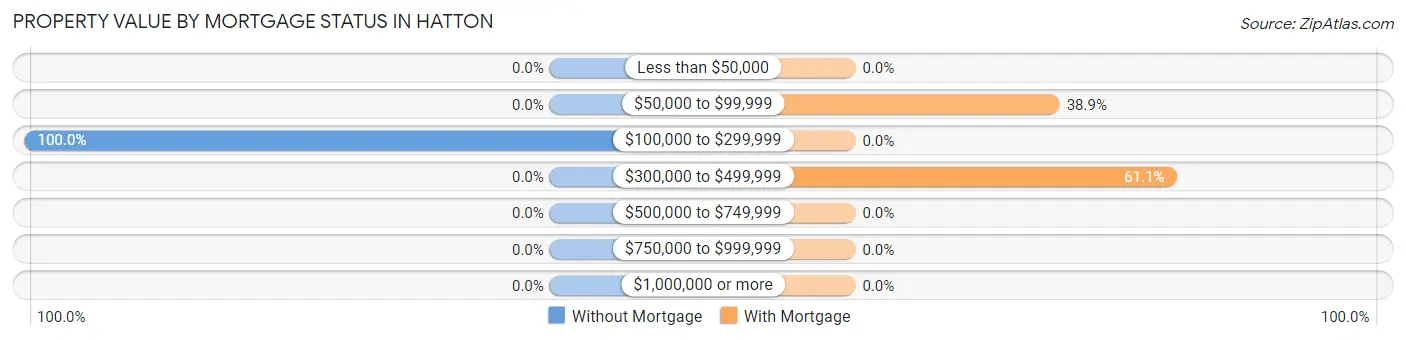
| Property Value | Without Mortgage | With Mortgage |
| Less than $50,000 | 0 (0.0%) | 0 (0.0%) |
| $50,000 to $99,999 | 0 (0.0%) | 14 (38.9%) |
| $100,000 to $299,999 | 6 (100.0%) | 0 (0.0%) |
| $300,000 to $499,999 | 0 (0.0%) | 22 (61.1%) |
| $500,000 to $749,999 | 0 (0.0%) | 0 (0.0%) |
| $750,000 to $999,999 | 0 (0.0%) | 0 (0.0%) |
| $1,000,000 or more | 0 (0.0%) | 0 (0.0%) |
| Total | 6 (100.0%) | 36 (100.0%) |
Household Income by Mortgage Status in Hatton
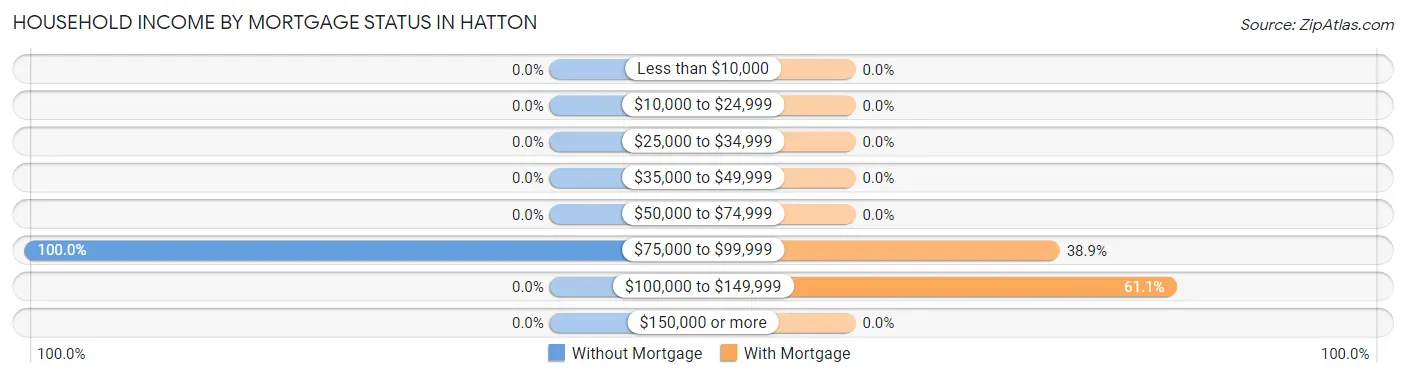
| Household Income | Without Mortgage | With Mortgage |
| Less than $10,000 | 0 (0.0%) | 0 (0.0%) |
| $10,000 to $24,999 | 0 (0.0%) | 0 (0.0%) |
| $25,000 to $34,999 | 0 (0.0%) | 0 (0.0%) |
| $35,000 to $49,999 | 0 (0.0%) | 0 (0.0%) |
| $50,000 to $74,999 | 0 (0.0%) | 0 (0.0%) |
| $75,000 to $99,999 | 6 (100.0%) | 14 (38.9%) |
| $100,000 to $149,999 | 0 (0.0%) | 22 (61.1%) |
| $150,000 or more | 0 (0.0%) | 0 (0.0%) |
| Total | 6 (100.0%) | 36 (100.0%) |
Property Value to Household Income Ratio in Hatton
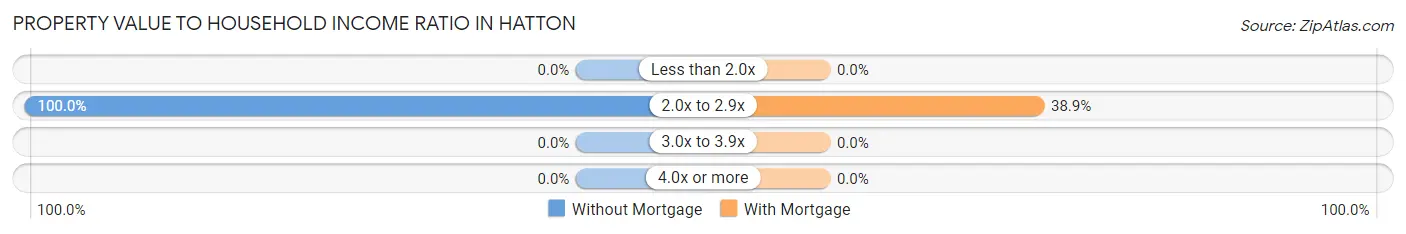
| Value-to-Income Ratio | Without Mortgage | With Mortgage |
| Less than 2.0x | 0 (0.0%) | 0 (0.0%) |
| 2.0x to 2.9x | 6 (100.0%) | 14 (38.9%) |
| 3.0x to 3.9x | 0 (0.0%) | 0 (0.0%) |
| 4.0x or more | 0 (0.0%) | 0 (0.0%) |
| Total | 6 (100.0%) | 36 (100.0%) |
Real Estate Taxes by Mortgage Status in Hatton
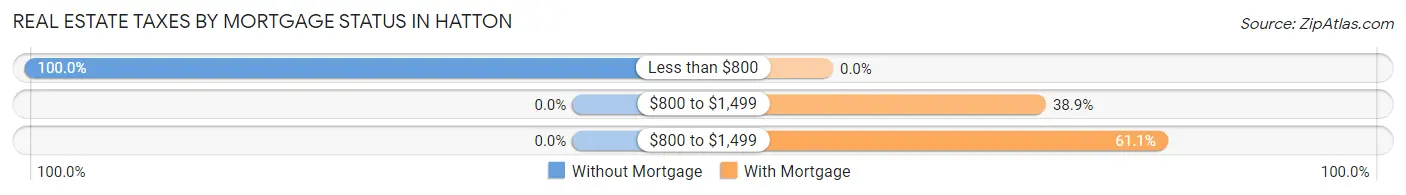
| Property Taxes | Without Mortgage | With Mortgage |
| Less than $800 | 6 (100.0%) | 0 (0.0%) |
| $800 to $1,499 | 0 (0.0%) | 14 (38.9%) |
| $800 to $1,499 | 0 (0.0%) | 22 (61.1%) |
| Total | 6 (100.0%) | 36 (100.0%) |
Health & Disability in Hatton
Health Insurance Coverage by Age in Hatton
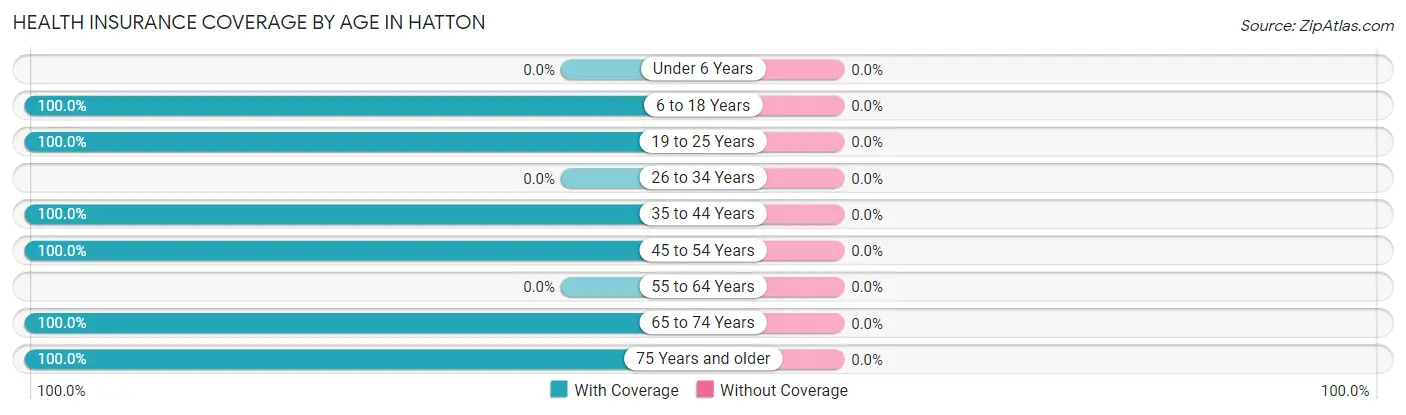
| Age Bracket | With Coverage | Without Coverage |
| Under 6 Years | 0 (0.0%) | 0 (0.0%) |
| 6 to 18 Years | 85 (100.0%) | 0 (0.0%) |
| 19 to 25 Years | 91 (100.0%) | 0 (0.0%) |
| 26 to 34 Years | 0 (0.0%) | 0 (0.0%) |
| 35 to 44 Years | 39 (100.0%) | 0 (0.0%) |
| 45 to 54 Years | 95 (100.0%) | 0 (0.0%) |
| 55 to 64 Years | 0 (0.0%) | 0 (0.0%) |
| 65 to 74 Years | 14 (100.0%) | 0 (0.0%) |
| 75 Years and older | 12 (100.0%) | 0 (0.0%) |
| Total | 336 (100.0%) | 0 (0.0%) |
Health Insurance Coverage by Citizenship Status in Hatton
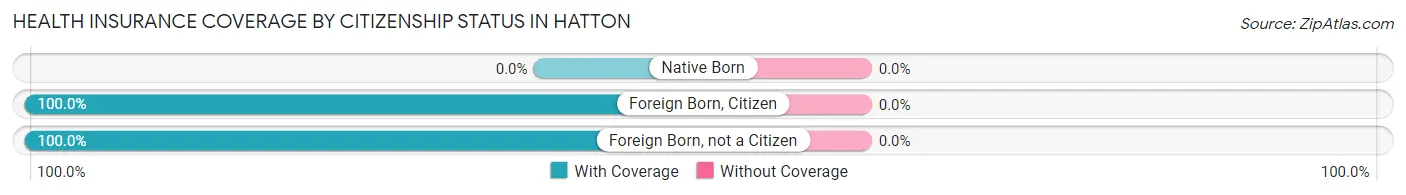
| Citizenship Status | With Coverage | Without Coverage |
| Native Born | 0 (0.0%) | 0 (0.0%) |
| Foreign Born, Citizen | 85 (100.0%) | 0 (0.0%) |
| Foreign Born, not a Citizen | 91 (100.0%) | 0 (0.0%) |
Health Insurance Coverage by Household Income in Hatton
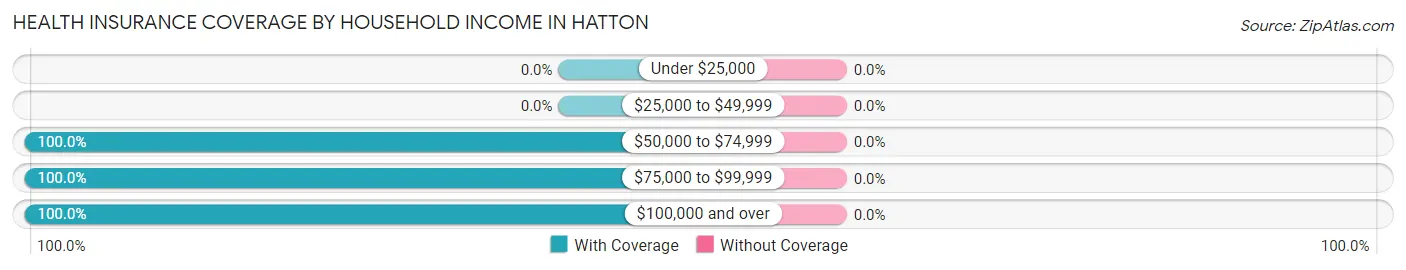
| Household Income | With Coverage | Without Coverage |
| Under $25,000 | 0 (0.0%) | 0 (0.0%) |
| $25,000 to $49,999 | 0 (0.0%) | 0 (0.0%) |
| $50,000 to $74,999 | 14 (100.0%) | 0 (0.0%) |
| $75,000 to $99,999 | 91 (100.0%) | 0 (0.0%) |
| $100,000 and over | 231 (100.0%) | 0 (0.0%) |
Public vs Private Health Insurance Coverage by Age in Hatton
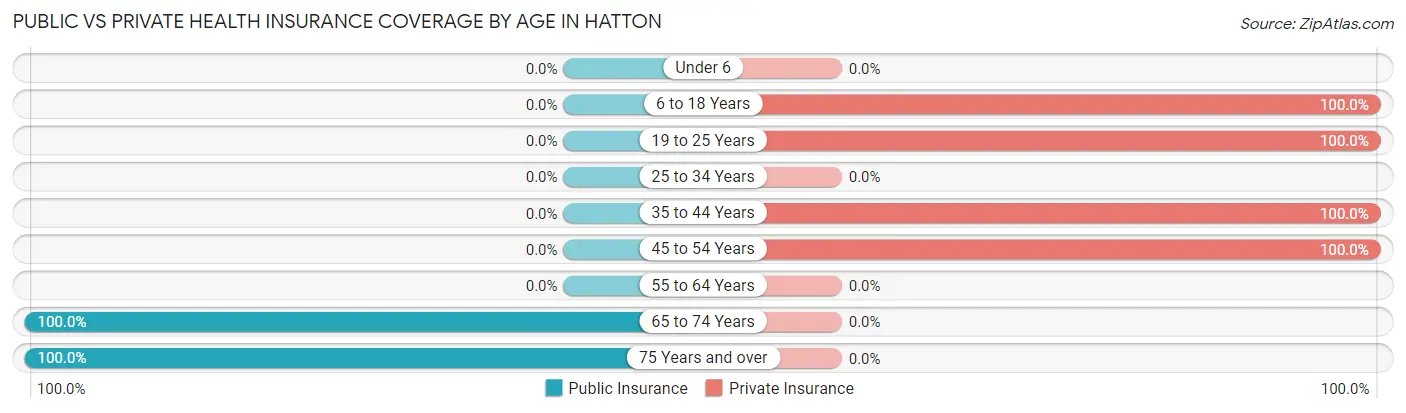
| Age Bracket | Public Insurance | Private Insurance |
| Under 6 | 0 (0.0%) | 0 (0.0%) |
| 6 to 18 Years | 0 (0.0%) | 85 (100.0%) |
| 19 to 25 Years | 0 (0.0%) | 91 (100.0%) |
| 25 to 34 Years | 0 (0.0%) | 0 (0.0%) |
| 35 to 44 Years | 0 (0.0%) | 39 (100.0%) |
| 45 to 54 Years | 0 (0.0%) | 95 (100.0%) |
| 55 to 64 Years | 0 (0.0%) | 0 (0.0%) |
| 65 to 74 Years | 14 (100.0%) | 0 (0.0%) |
| 75 Years and over | 12 (100.0%) | 0 (0.0%) |
| Total | 26 (7.7%) | 310 (92.3%) |
Disability Status by Sex by Age in Hatton
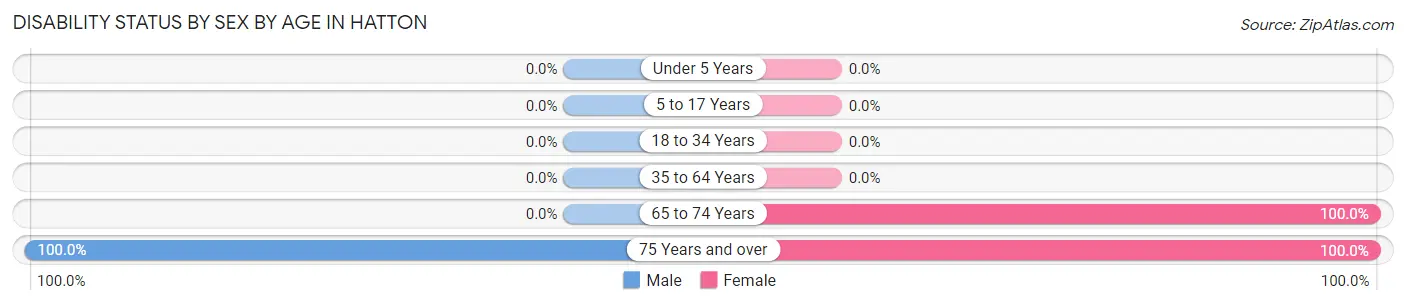
| Age Bracket | Male | Female |
| Under 5 Years | 0 (0.0%) | 0 (0.0%) |
| 5 to 17 Years | 0 (0.0%) | 0 (0.0%) |
| 18 to 34 Years | 0 (0.0%) | 0 (0.0%) |
| 35 to 64 Years | 0 (0.0%) | 0 (0.0%) |
| 65 to 74 Years | 0 (0.0%) | 14 (100.0%) |
| 75 Years and over | 6 (100.0%) | 6 (100.0%) |
Disability Class by Sex by Age in Hatton
Disability Class: Hearing Difficulty
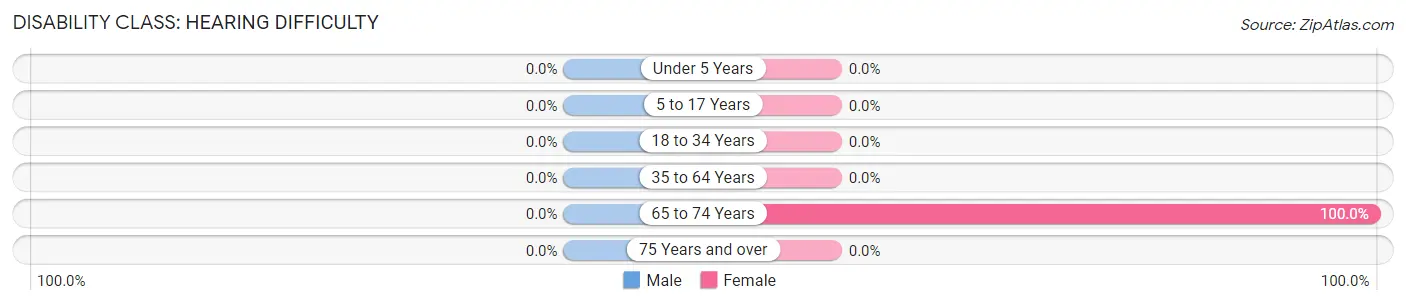
| Age Bracket | Male | Female |
| Under 5 Years | 0 (0.0%) | 0 (0.0%) |
| 5 to 17 Years | 0 (0.0%) | 0 (0.0%) |
| 18 to 34 Years | 0 (0.0%) | 0 (0.0%) |
| 35 to 64 Years | 0 (0.0%) | 0 (0.0%) |
| 65 to 74 Years | 0 (0.0%) | 14 (100.0%) |
| 75 Years and over | 0 (0.0%) | 0 (0.0%) |
Disability Class: Vision Difficulty
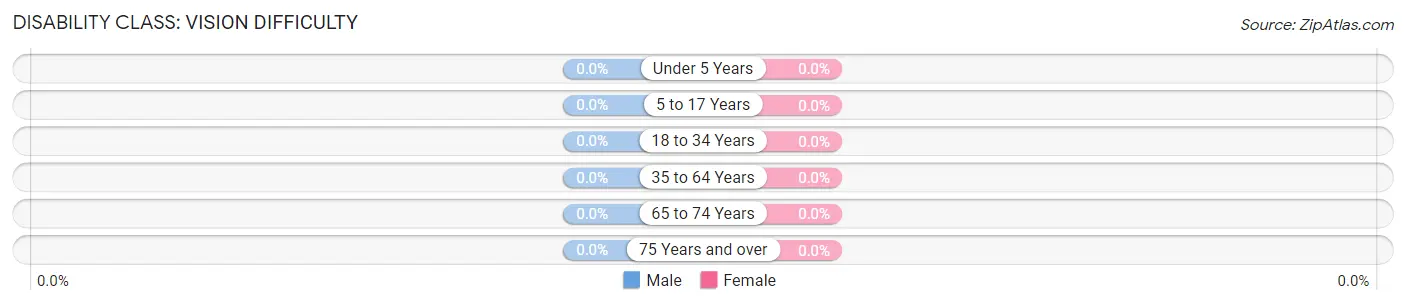
| Age Bracket | Male | Female |
| Under 5 Years | 0 (0.0%) | 0 (0.0%) |
| 5 to 17 Years | 0 (0.0%) | 0 (0.0%) |
| 18 to 34 Years | 0 (0.0%) | 0 (0.0%) |
| 35 to 64 Years | 0 (0.0%) | 0 (0.0%) |
| 65 to 74 Years | 0 (0.0%) | 0 (0.0%) |
| 75 Years and over | 0 (0.0%) | 0 (0.0%) |
Disability Class: Cognitive Difficulty
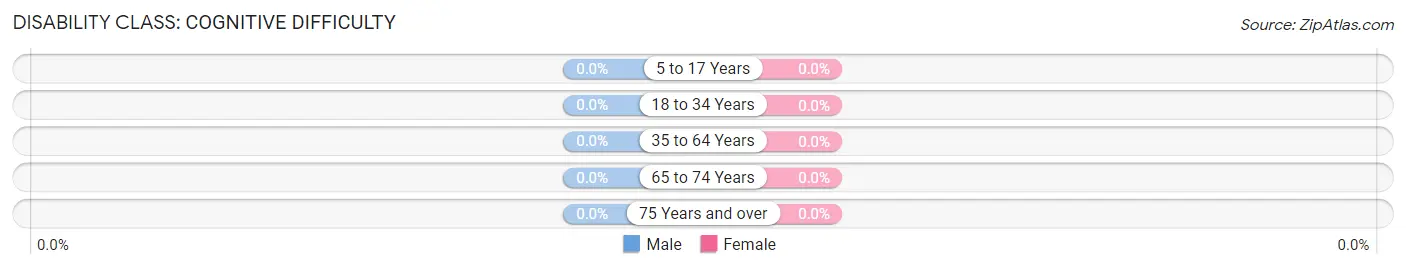
| Age Bracket | Male | Female |
| 5 to 17 Years | 0 (0.0%) | 0 (0.0%) |
| 18 to 34 Years | 0 (0.0%) | 0 (0.0%) |
| 35 to 64 Years | 0 (0.0%) | 0 (0.0%) |
| 65 to 74 Years | 0 (0.0%) | 0 (0.0%) |
| 75 Years and over | 0 (0.0%) | 0 (0.0%) |
Disability Class: Ambulatory Difficulty
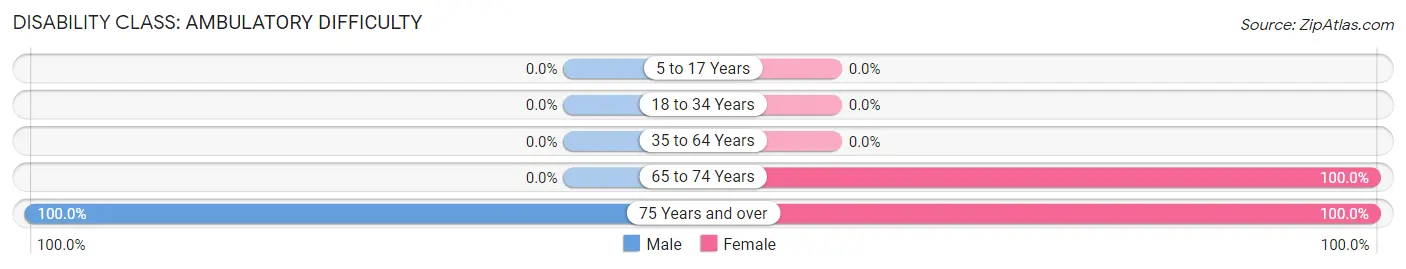
| Age Bracket | Male | Female |
| 5 to 17 Years | 0 (0.0%) | 0 (0.0%) |
| 18 to 34 Years | 0 (0.0%) | 0 (0.0%) |
| 35 to 64 Years | 0 (0.0%) | 0 (0.0%) |
| 65 to 74 Years | 0 (0.0%) | 14 (100.0%) |
| 75 Years and over | 6 (100.0%) | 6 (100.0%) |
Disability Class: Self-Care Difficulty
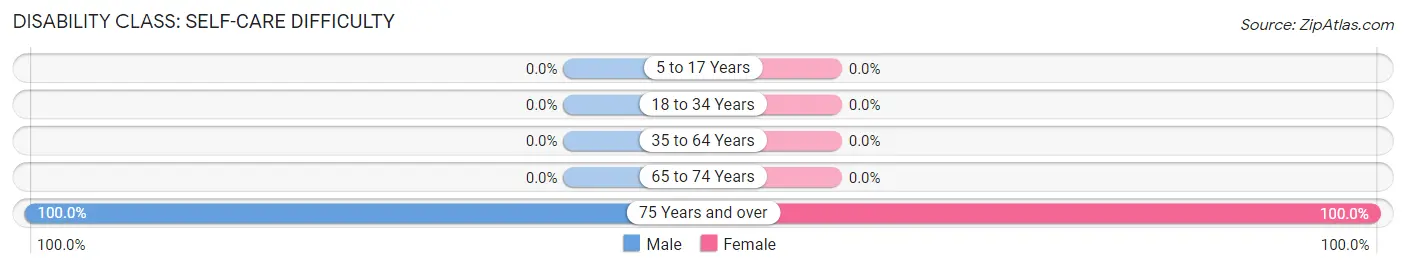
| Age Bracket | Male | Female |
| 5 to 17 Years | 0 (0.0%) | 0 (0.0%) |
| 18 to 34 Years | 0 (0.0%) | 0 (0.0%) |
| 35 to 64 Years | 0 (0.0%) | 0 (0.0%) |
| 65 to 74 Years | 0 (0.0%) | 0 (0.0%) |
| 75 Years and over | 6 (100.0%) | 6 (100.0%) |
Technology Access in Hatton
Computing Device Access in Hatton
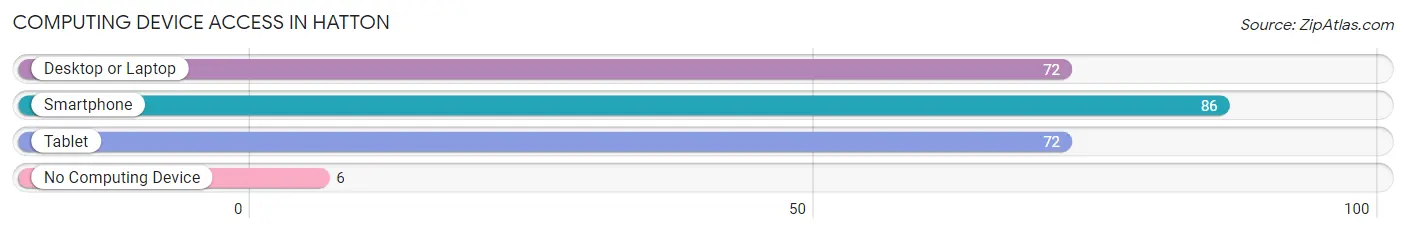
| Device Type | # Households | % Households |
| Desktop or Laptop | 72 | 78.3% |
| Smartphone | 86 | 93.5% |
| Tablet | 72 | 78.3% |
| No Computing Device | 6 | 6.5% |
| Total | 92 | 100.0% |
Internet Access in Hatton
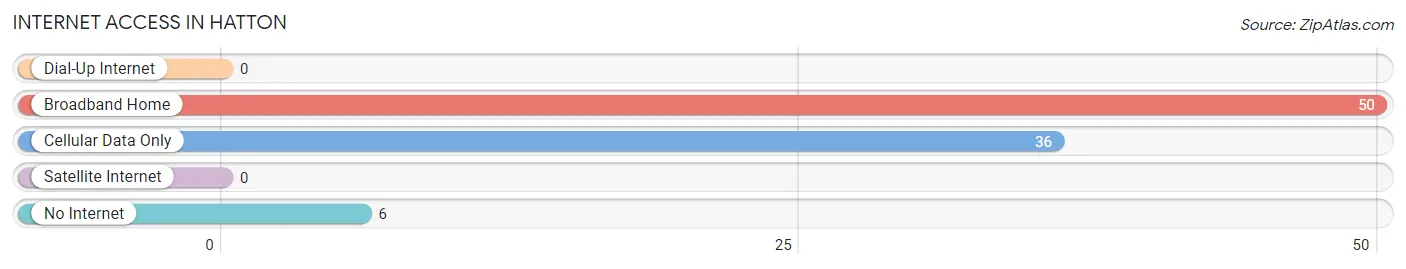
| Internet Type | # Households | % Households |
| Dial-Up Internet | 0 | 0.0% |
| Broadband Home | 50 | 54.3% |
| Cellular Data Only | 36 | 39.1% |
| Satellite Internet | 0 | 0.0% |
| No Internet | 6 | 6.5% |
| Total | 92 | 100.0% |
Hatton Summary
Hatton is a small town located in the northwest corner of Alabama, in Lawrence County. It is situated on the banks of the Tennessee River, and is part of the Florence-Muscle Shoals Metropolitan Statistical Area. The town has a population of approximately 1,000 people, and is known for its rural charm and friendly atmosphere.
History
Hatton was founded in 1818 by William Hatton, a Revolutionary War veteran. He purchased the land from the Chickasaw Indians and named the town after himself. The town was incorporated in 1820, and the first post office was established in 1821.
In the early days, Hatton was a thriving agricultural community, with cotton, corn, and tobacco being the main crops. The town also had a number of sawmills and gristmills, which provided lumber and grain for the local population.
In the late 19th century, the town began to experience a period of growth and prosperity. The railroad arrived in 1887, and the town was connected to the rest of the country. This allowed for the development of new industries, such as a cotton gin, a brick factory, and a furniture factory.
In the early 20th century, Hatton experienced a period of decline. The Great Depression hit the town hard, and many of the businesses closed. The town was also hit by a tornado in 1932, which destroyed many of the buildings.
Geography
Hatton is located in the northwest corner of Alabama, in Lawrence County. It is situated on the banks of the Tennessee River, and is part of the Florence-Muscle Shoals Metropolitan Statistical Area. The town is located at an elevation of 545 feet above sea level.
The climate in Hatton is humid subtropical, with hot summers and mild winters. The average annual temperature is around 68 degrees Fahrenheit, and the average annual precipitation is around 50 inches.
Economy
Hatton’s economy is largely based on agriculture. The town is home to a number of farms, which produce cotton, corn, soybeans, and other crops. The town also has a number of small businesses, including restaurants, retail stores, and service providers.
The town is also home to a number of manufacturing companies, including a furniture factory and a brick factory. The town is also home to a number of small businesses, such as auto repair shops, beauty salons, and other service providers.
Demographics
As of the 2010 census, the population of Hatton was 1,000 people. The racial makeup of the town was 97.2% White, 0.7% African American, 0.2% Native American, 0.2% Asian, and 1.7% from other races. The median household income was $31,250, and the median family income was $37,500.
Hatton is a small, rural town with a friendly atmosphere and a strong sense of community. The town is home to a number of churches, and there are a number of festivals and events held throughout the year. The town is also home to a number of parks and recreational areas, which provide a great place for residents to relax and enjoy the outdoors.
Common Questions
What is Per Capita Income in Hatton?
Per Capita income in Hatton is $49,043.
What is the Median Family Income in Hatton?
Median Family Income in Hatton is $250,001.
What is the Median Household income in Hatton?
Median Household Income in Hatton is $250,001.
What is Inequality or Gini Index in Hatton?
Inequality or Gini Index in Hatton is 0.28.
What is the Total Population of Hatton?
Total Population of Hatton is 336.
What is the Total Male Population of Hatton?
Total Male Population of Hatton is 113.
What is the Total Female Population of Hatton?
Total Female Population of Hatton is 223.
What is the Ratio of Males per 100 Females in Hatton?
There are 50.67 Males per 100 Females in Hatton.
What is the Ratio of Females per 100 Males in Hatton?
There are 197.35 Females per 100 Males in Hatton.
What is the Median Population Age in Hatton?
Median Population Age in Hatton is 22.9 Years.
What is the Average Family Size in Hatton
Average Family Size in Hatton is 4.1 People.
What is the Average Household Size in Hatton
Average Household Size in Hatton is 3.6 People.
How Large is the Labor Force in Hatton?
There are 148 People in the Labor Forcein in Hatton.
What is the Percentage of People in the Labor Force in Hatton?
59.0% of People are in the Labor Force in Hatton.