Coldiron, KY Map & Demographics
Coldiron Map
Coldiron Overview
$17,920
PER CAPITA INCOME
$53,565
AVG FAMILY INCOME
$78,708
AVG HOUSEHOLD INCOME
68.8%
WAGE / INCOME GAP [ % ]
31.2¢/ $1
WAGE / INCOME GAP [ $ ]
0.14
INEQUALITY / GINI INDEX
434
TOTAL POPULATION
160
MALE POPULATION
274
FEMALE POPULATION
58.39
MALES / 100 FEMALES
171.25
FEMALES / 100 MALES
29.2
MEDIAN AGE
3.6
AVG FAMILY SIZE
3.9
AVG HOUSEHOLD SIZE
175
LABOR FORCE [ PEOPLE ]
72.6%
PERCENT IN LABOR FORCE
Coldiron Zip Codes
Coldiron Area Codes
Income in Coldiron
Income Overview in Coldiron
Per Capita Income in Coldiron is $17,920, while median incomes of families and households are $53,565 and $78,708 respectively.
| Characteristic | Number | Measure |
| Per Capita Income | 434 | $17,920 |
| Median Family Income | 111 | $53,565 |
| Mean Family Income | 111 | $50,162 |
| Median Household Income | 111 | $78,708 |
| Mean Household Income | 111 | $67,963 |
| Income Deficit | 111 | $0 |
| Wage / Income Gap (%) | 434 | 68.82% |
| Wage / Income Gap ($) | 434 | 31.18¢ per $1 |
| Gini / Inequality Index | 434 | 0.14 |
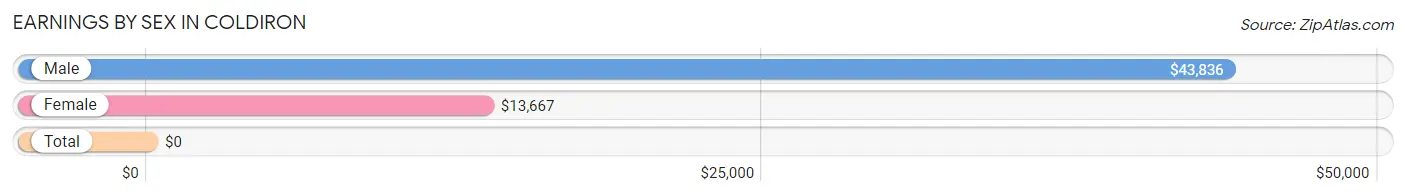
Earnings by Sex in Coldiron
| Sex | Number | Average Earnings |
| Male | 103 (55.7%) | $43,836 |
| Female | 82 (44.3%) | $13,667 |
| Total | 185 (100.0%) | $0 |
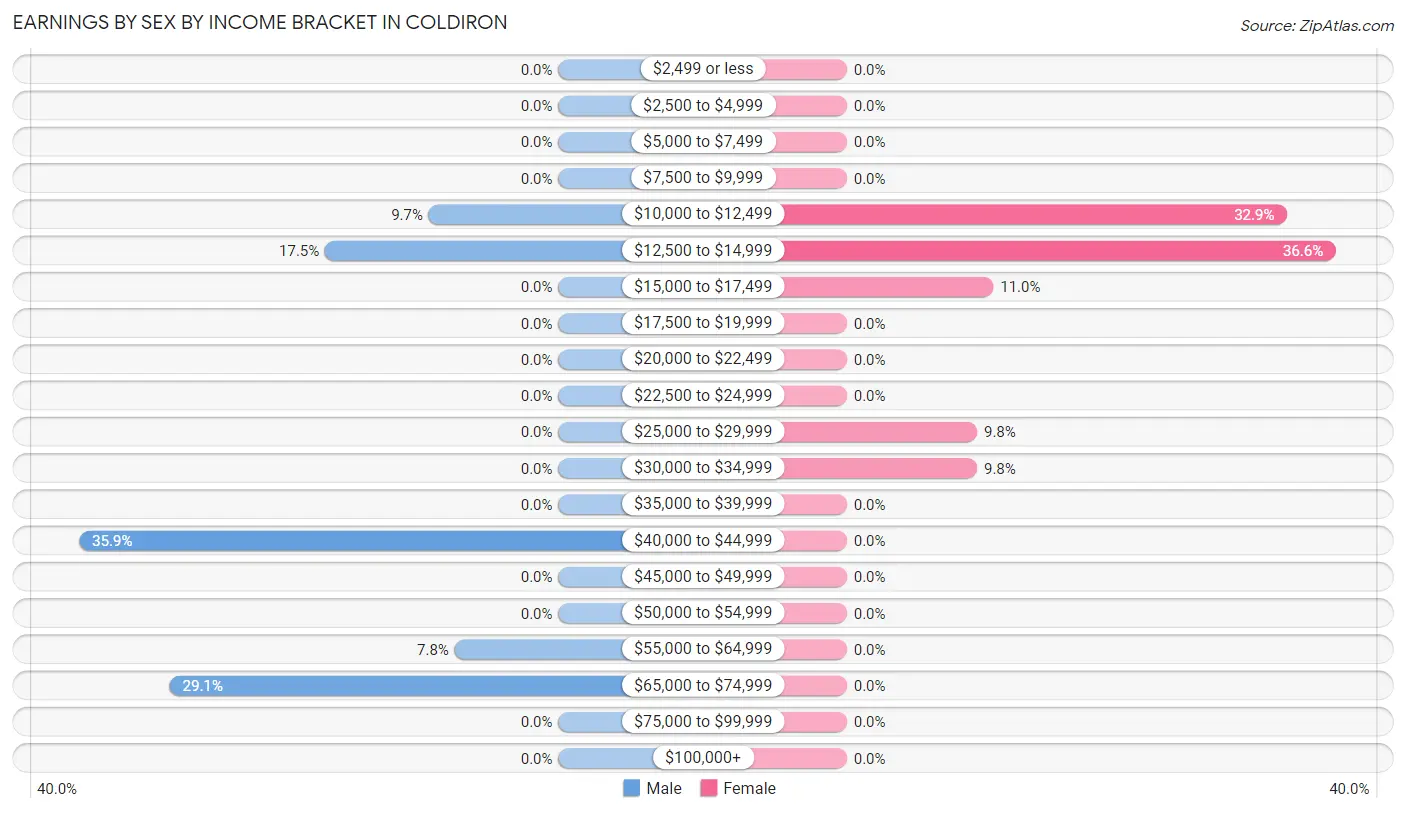
Earnings by Sex by Income Bracket in Coldiron
The most common earnings brackets in Coldiron are $40,000 to $44,999 for men (37 | 35.9%) and $12,500 to $14,999 for women (30 | 36.6%).
| Income | Male | Female |
| $2,499 or less | 0 (0.0%) | 0 (0.0%) |
| $2,500 to $4,999 | 0 (0.0%) | 0 (0.0%) |
| $5,000 to $7,499 | 0 (0.0%) | 0 (0.0%) |
| $7,500 to $9,999 | 0 (0.0%) | 0 (0.0%) |
| $10,000 to $12,499 | 10 (9.7%) | 27 (32.9%) |
| $12,500 to $14,999 | 18 (17.5%) | 30 (36.6%) |
| $15,000 to $17,499 | 0 (0.0%) | 9 (11.0%) |
| $17,500 to $19,999 | 0 (0.0%) | 0 (0.0%) |
| $20,000 to $22,499 | 0 (0.0%) | 0 (0.0%) |
| $22,500 to $24,999 | 0 (0.0%) | 0 (0.0%) |
| $25,000 to $29,999 | 0 (0.0%) | 8 (9.8%) |
| $30,000 to $34,999 | 0 (0.0%) | 8 (9.8%) |
| $35,000 to $39,999 | 0 (0.0%) | 0 (0.0%) |
| $40,000 to $44,999 | 37 (35.9%) | 0 (0.0%) |
| $45,000 to $49,999 | 0 (0.0%) | 0 (0.0%) |
| $50,000 to $54,999 | 0 (0.0%) | 0 (0.0%) |
| $55,000 to $64,999 | 8 (7.8%) | 0 (0.0%) |
| $65,000 to $74,999 | 30 (29.1%) | 0 (0.0%) |
| $75,000 to $99,999 | 0 (0.0%) | 0 (0.0%) |
| $100,000+ | 0 (0.0%) | 0 (0.0%) |
| Total | 103 (100.0%) | 82 (100.0%) |
Earnings by Sex by Educational Attainment in Coldiron
| Educational Attainment | Male Income | Female Income |
| Less than High School | - | - |
| High School Diploma | - | - |
| College or Associate's Degree | - | - |
| Bachelor's Degree | - | - |
| Graduate Degree | - | - |
| Total | $44,267 | $13,292 |
Family Income in Coldiron
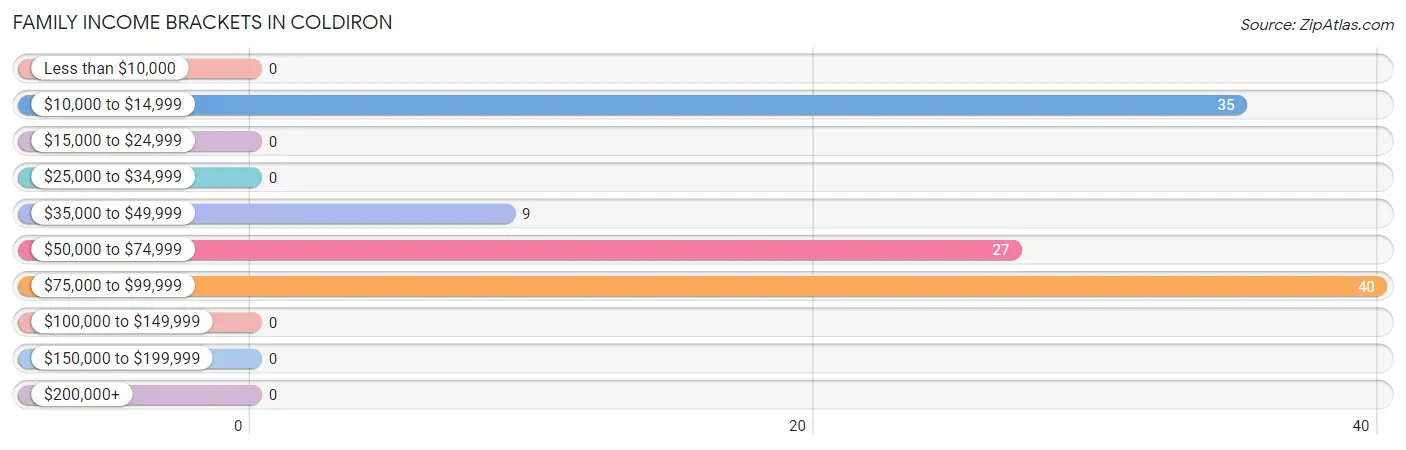
Family Income Brackets in Coldiron
According to the Coldiron family income data, there are 40 families falling into the $75,000 to $99,999 income range, which is the most common income bracket and makes up 36.0% of all families.
| Income Bracket | # Families | % Families |
| Less than $10,000 | 0 | 0.0% |
| $10,000 to $14,999 | 35 | 31.5% |
| $15,000 to $24,999 | 0 | 0.0% |
| $25,000 to $34,999 | 0 | 0.0% |
| $35,000 to $49,999 | 9 | 8.1% |
| $50,000 to $74,999 | 27 | 24.3% |
| $75,000 to $99,999 | 40 | 36.0% |
| $100,000 to $149,999 | 0 | 0.0% |
| $150,000 to $199,999 | 0 | 0.0% |
| $200,000+ | 0 | 0.0% |
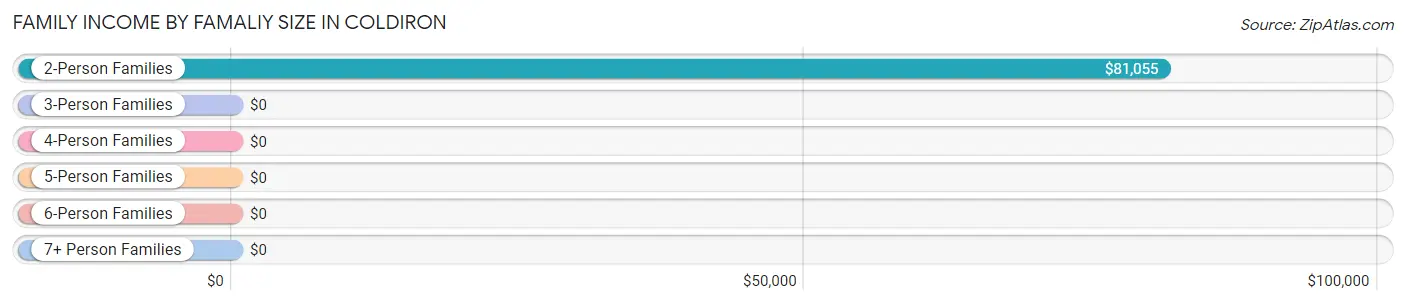
Family Income by Famaliy Size in Coldiron
2-person families (37 | 33.3%) account for the highest median family income in Coldiron with $81,055 per family, while 2-person families (37 | 33.3%) have the highest median income of $40,528 per family member.
| Income Bracket | # Families | Median Income |
| 2-Person Families | 37 (33.3%) | $81,055 |
| 3-Person Families | 8 (7.2%) | $0 |
| 4-Person Families | 39 (35.1%) | $0 |
| 5-Person Families | 27 (24.3%) | $0 |
| 6-Person Families | 0 (0.0%) | $0 |
| 7+ Person Families | 0 (0.0%) | $0 |
| Total | 111 (100.0%) | $53,565 |
Family Income by Number of Earners in Coldiron
| Number of Earners | # Families | Median Income |
| No Earners | 13 (11.7%) | $0 |
| 1 Earner | 55 (49.5%) | $0 |
| 2 Earners | 35 (31.5%) | $0 |
| 3+ Earners | 8 (7.2%) | $0 |
| Total | 111 (100.0%) | $53,565 |
Household Income in Coldiron
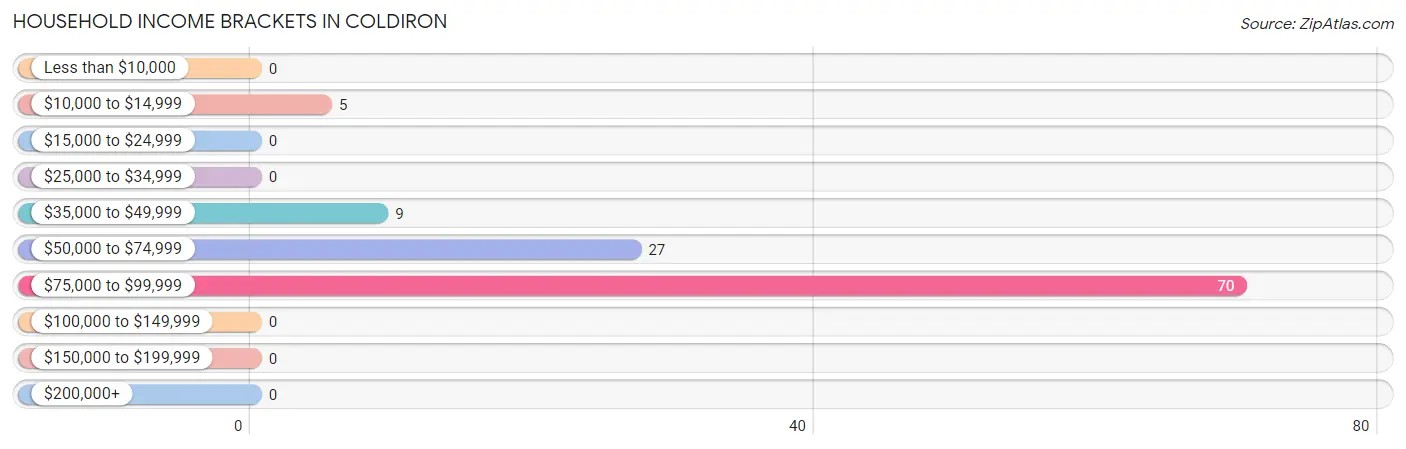
Household Income Brackets in Coldiron
With 70 households falling in the category, the $75,000 to $99,999 income range is the most frequent in Coldiron, accounting for 63.1% of all households.
| Income Bracket | # Households | % Households |
| Less than $10,000 | 0 | 0.0% |
| $10,000 to $14,999 | 5 | 4.5% |
| $15,000 to $24,999 | 0 | 0.0% |
| $25,000 to $34,999 | 0 | 0.0% |
| $35,000 to $49,999 | 9 | 8.1% |
| $50,000 to $74,999 | 27 | 24.3% |
| $75,000 to $99,999 | 70 | 63.1% |
| $100,000 to $149,999 | 0 | 0.0% |
| $150,000 to $199,999 | 0 | 0.0% |
| $200,000+ | 0 | 0.0% |
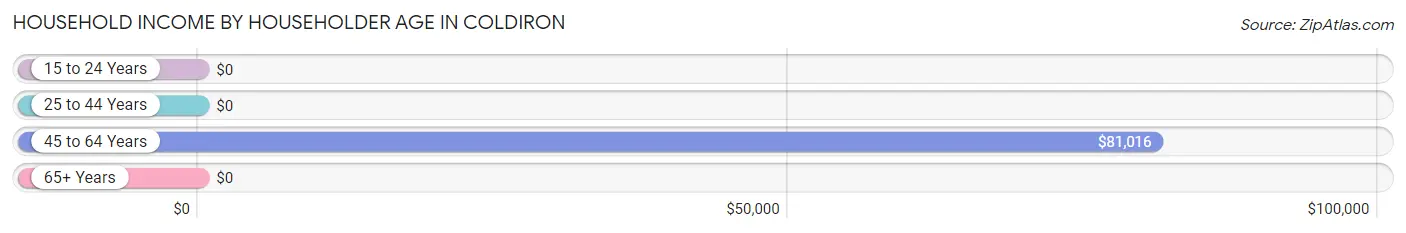
Household Income by Householder Age in Coldiron
The median household income in Coldiron is $78,708, with the highest median household income of $81,016 found in the 45 to 64 years age bracket for the primary householder. A total of 54 households (48.6%) fall into this category.
| Income Bracket | # Households | Median Income |
| 15 to 24 Years | 0 (0.0%) | $0 |
| 25 to 44 Years | 57 (51.3%) | $0 |
| 45 to 64 Years | 54 (48.6%) | $81,016 |
| 65+ Years | 0 (0.0%) | $0 |
| Total | 111 (100.0%) | $78,708 |
Poverty in Coldiron
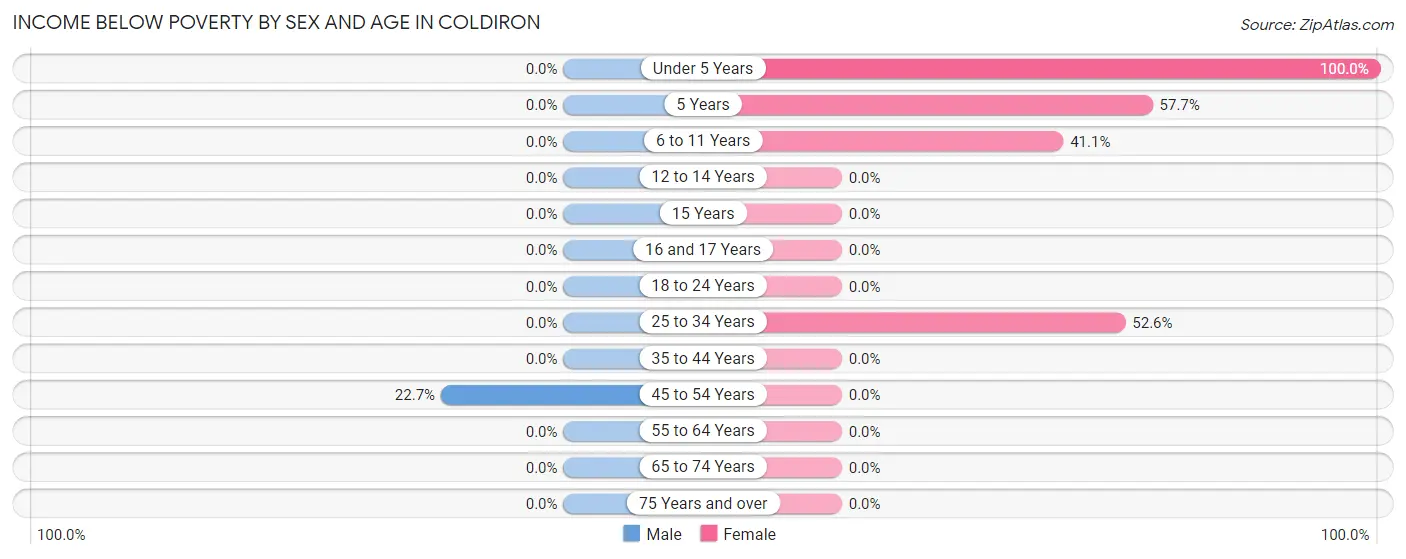
Income Below Poverty by Sex and Age in Coldiron
With 3.1% poverty level for males and 45.3% for females among the residents of Coldiron, 45 to 54 year old males and under 5 year old females are the most vulnerable to poverty, with 5 males (22.7%) and 34 females (100.0%) in their respective age groups living below the poverty level.
| Age Bracket | Male | Female |
| Under 5 Years | 0 (0.0%) | 34 (100.0%) |
| 5 Years | 0 (0.0%) | 30 (57.7%) |
| 6 to 11 Years | 0 (0.0%) | 30 (41.1%) |
| 12 to 14 Years | 0 (0.0%) | 0 (0.0%) |
| 15 Years | 0 (0.0%) | 0 (0.0%) |
| 16 and 17 Years | 0 (0.0%) | 0 (0.0%) |
| 18 to 24 Years | 0 (0.0%) | 0 (0.0%) |
| 25 to 34 Years | 0 (0.0%) | 30 (52.6%) |
| 35 to 44 Years | 0 (0.0%) | 0 (0.0%) |
| 45 to 54 Years | 5 (22.7%) | 0 (0.0%) |
| 55 to 64 Years | 0 (0.0%) | 0 (0.0%) |
| 65 to 74 Years | 0 (0.0%) | 0 (0.0%) |
| 75 Years and over | 0 (0.0%) | 0 (0.0%) |
| Total | 5 (3.1%) | 124 (45.3%) |
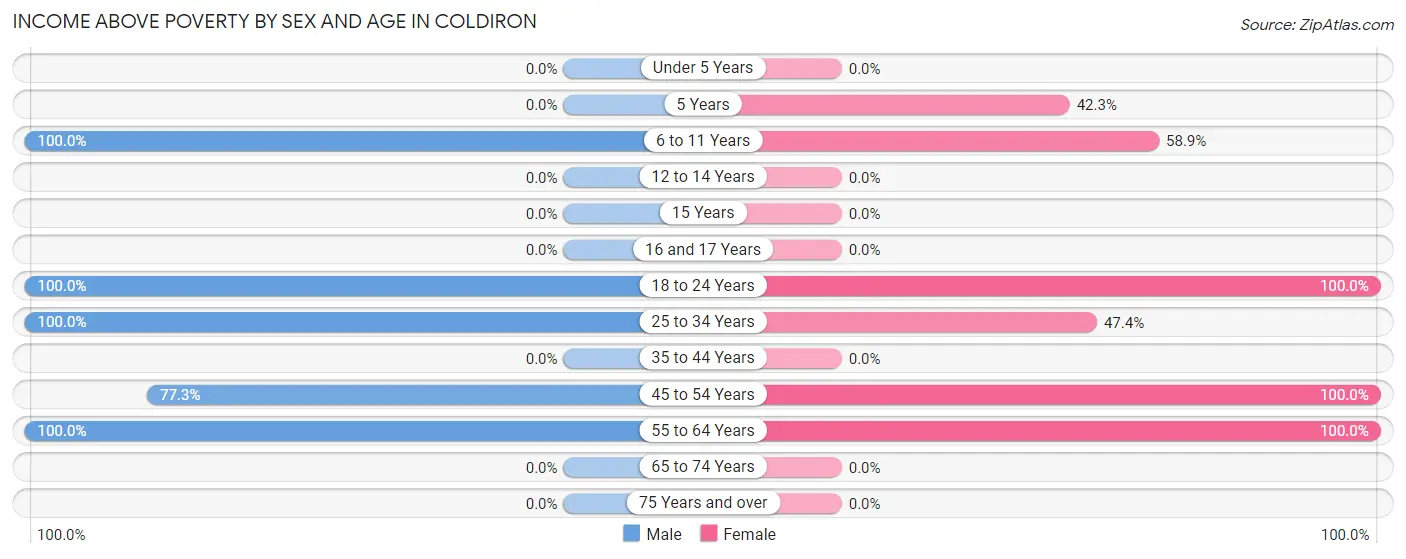
Income Above Poverty by Sex and Age in Coldiron
According to the poverty statistics in Coldiron, males aged 6 to 11 years and females aged 18 to 24 years are the age groups that are most secure financially, with 100.0% of males and 100.0% of females in these age groups living above the poverty line.
| Age Bracket | Male | Female |
| Under 5 Years | 0 (0.0%) | 0 (0.0%) |
| 5 Years | 0 (0.0%) | 22 (42.3%) |
| 6 to 11 Years | 34 (100.0%) | 43 (58.9%) |
| 12 to 14 Years | 0 (0.0%) | 0 (0.0%) |
| 15 Years | 0 (0.0%) | 0 (0.0%) |
| 16 and 17 Years | 0 (0.0%) | 0 (0.0%) |
| 18 to 24 Years | 10 (100.0%) | 9 (100.0%) |
| 25 to 34 Years | 59 (100.0%) | 27 (47.4%) |
| 35 to 44 Years | 0 (0.0%) | 0 (0.0%) |
| 45 to 54 Years | 17 (77.3%) | 17 (100.0%) |
| 55 to 64 Years | 35 (100.0%) | 32 (100.0%) |
| 65 to 74 Years | 0 (0.0%) | 0 (0.0%) |
| 75 Years and over | 0 (0.0%) | 0 (0.0%) |
| Total | 155 (96.9%) | 150 (54.7%) |
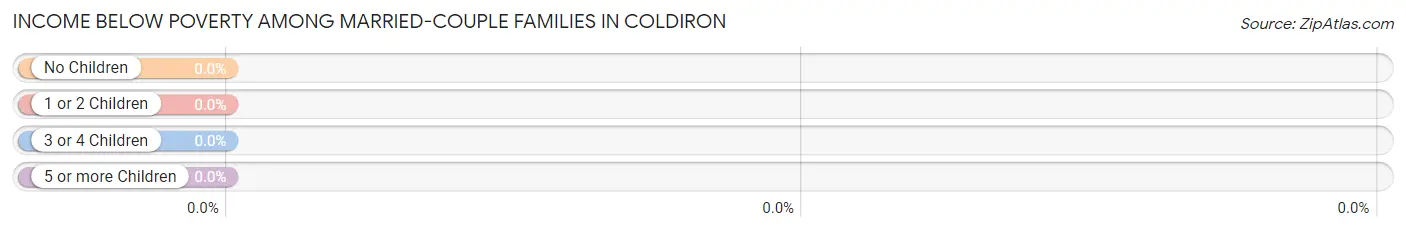
Income Below Poverty Among Married-Couple Families in Coldiron
| Children | Above Poverty | Below Poverty |
| No Children | 40 (100.0%) | 0 (0.0%) |
| 1 or 2 Children | 9 (100.0%) | 0 (0.0%) |
| 3 or 4 Children | 27 (100.0%) | 0 (0.0%) |
| 5 or more Children | 0 (0.0%) | 0 (0.0%) |
| Total | 76 (100.0%) | 0 (0.0%) |
Income Below Poverty Among Single-Parent Households in Coldiron
According to the poverty data in Coldiron, 100.0% or 5 single-father households and 100.0% or 30 single-mother households are living below the poverty line. Among single-father households, those with 1 or 2 children have the highest poverty rate, with 5 households (100.0%) experiencing poverty. Likewise, among single-mother households, those with 3 or 4 children have the highest poverty rate, with 30 households (100.0%) falling below the poverty line.
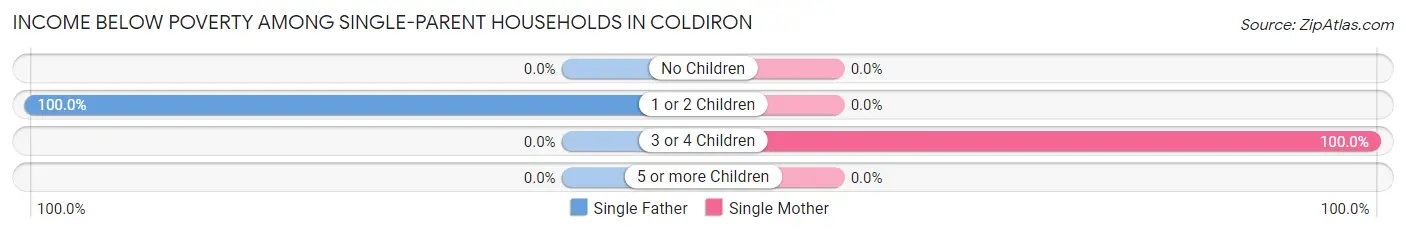
| Children | Single Father | Single Mother |
| No Children | 0 (0.0%) | 0 (0.0%) |
| 1 or 2 Children | 5 (100.0%) | 0 (0.0%) |
| 3 or 4 Children | 0 (0.0%) | 30 (100.0%) |
| 5 or more Children | 0 (0.0%) | 0 (0.0%) |
| Total | 5 (100.0%) | 30 (100.0%) |
Income Below Poverty Among Married-Couple vs Single-Parent Households in Coldiron
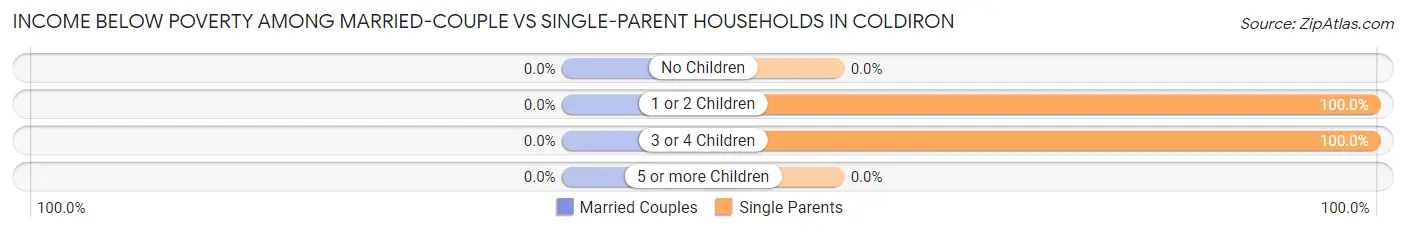
| Children | Married-Couple Families | Single-Parent Households |
| No Children | 0 (0.0%) | 0 (0.0%) |
| 1 or 2 Children | 0 (0.0%) | 5 (100.0%) |
| 3 or 4 Children | 0 (0.0%) | 30 (100.0%) |
| 5 or more Children | 0 (0.0%) | 0 (0.0%) |
| Total | 0 (0.0%) | 35 (100.0%) |
Race in Coldiron
The most populous races in Coldiron are White / Caucasian (428 | 98.6%), and Two or more Races (6 | 1.4%).
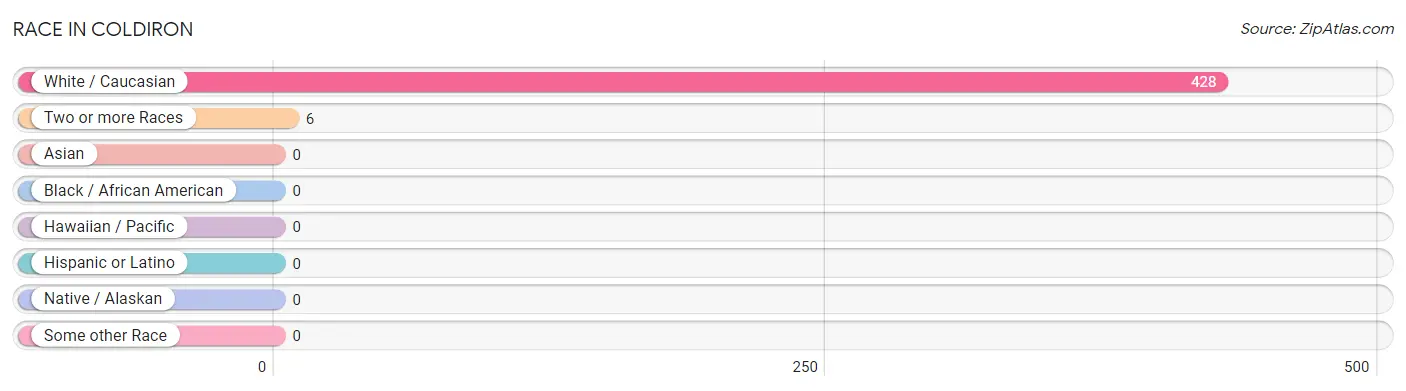
| Race | # Population | % Population |
| Asian | 0 | 0.0% |
| Black / African American | 0 | 0.0% |
| Hawaiian / Pacific | 0 | 0.0% |
| Hispanic or Latino | 0 | 0.0% |
| Native / Alaskan | 0 | 0.0% |
| White / Caucasian | 428 | 98.6% |
| Two or more Races | 6 | 1.4% |
| Some other Race | 0 | 0.0% |
| Total | 434 | 100.0% |
Ancestry in Coldiron
The most populous ancestries reported in Coldiron are Irish (56 | 12.9%), American (49 | 11.3%), Italian (30 | 6.9%), and Cherokee (6 | 1.4%), together accounting for 32.5% of all Coldiron residents.
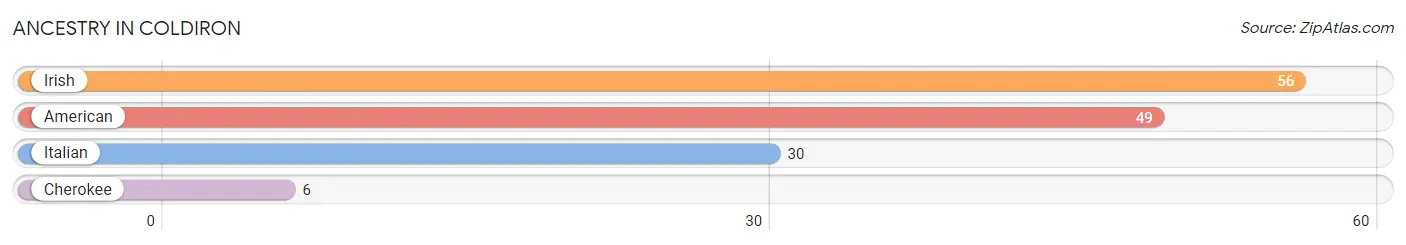
| Ancestry | # Population | % Population |
| American | 49 | 11.3% |
| Cherokee | 6 | 1.4% |
| Irish | 56 | 12.9% |
| Italian | 30 | 6.9% | View All 4 Rows |
Immigrants in Coldiron

| Immigration Origin | # Population | % Population | View All 0 Rows |
Sex and Age in Coldiron
Sex and Age in Coldiron
The most populous age groups in Coldiron are 5 to 9 Years (34 | 21.2%) for men and 10 to 14 Years (73 | 26.6%) for women.
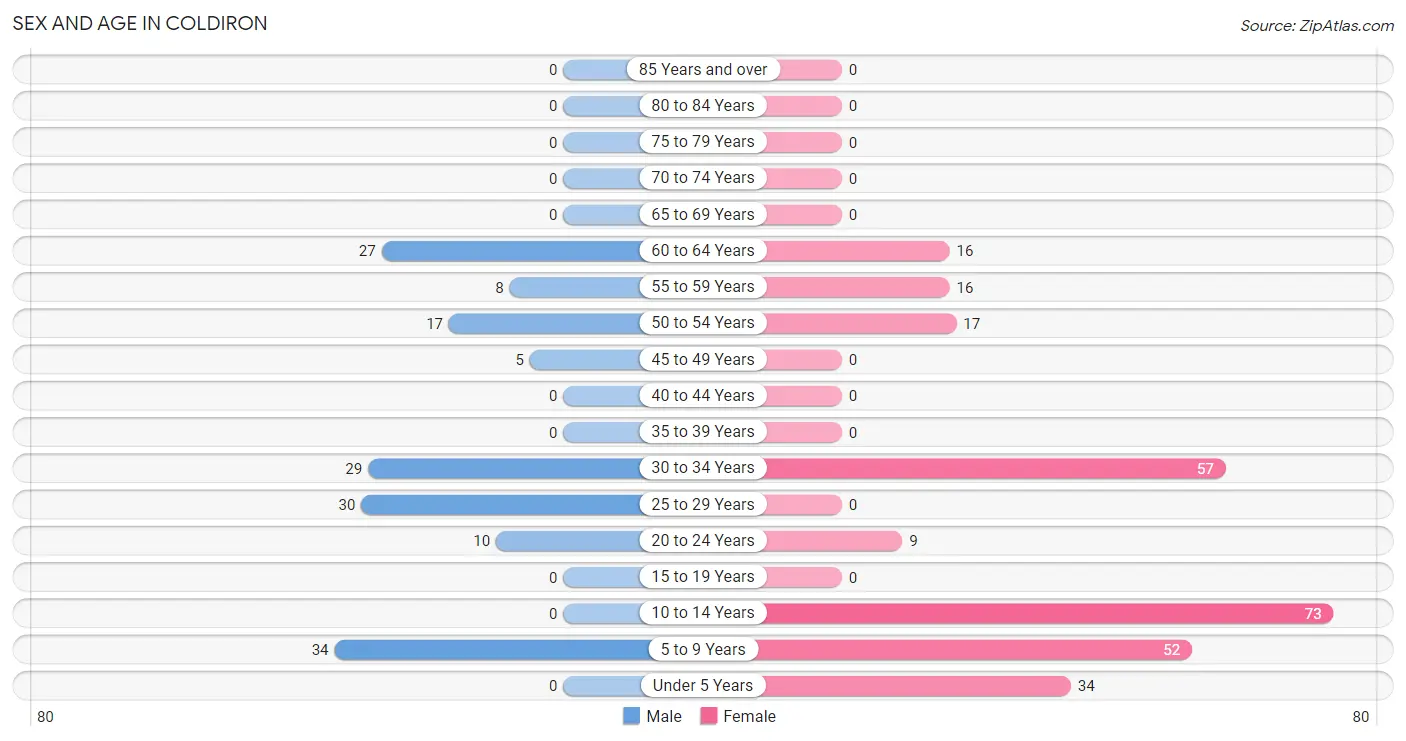
| Age Bracket | Male | Female |
| Under 5 Years | 0 (0.0%) | 34 (12.4%) |
| 5 to 9 Years | 34 (21.2%) | 52 (19.0%) |
| 10 to 14 Years | 0 (0.0%) | 73 (26.6%) |
| 15 to 19 Years | 0 (0.0%) | 0 (0.0%) |
| 20 to 24 Years | 10 (6.2%) | 9 (3.3%) |
| 25 to 29 Years | 30 (18.8%) | 0 (0.0%) |
| 30 to 34 Years | 29 (18.1%) | 57 (20.8%) |
| 35 to 39 Years | 0 (0.0%) | 0 (0.0%) |
| 40 to 44 Years | 0 (0.0%) | 0 (0.0%) |
| 45 to 49 Years | 5 (3.1%) | 0 (0.0%) |
| 50 to 54 Years | 17 (10.6%) | 17 (6.2%) |
| 55 to 59 Years | 8 (5.0%) | 16 (5.8%) |
| 60 to 64 Years | 27 (16.9%) | 16 (5.8%) |
| 65 to 69 Years | 0 (0.0%) | 0 (0.0%) |
| 70 to 74 Years | 0 (0.0%) | 0 (0.0%) |
| 75 to 79 Years | 0 (0.0%) | 0 (0.0%) |
| 80 to 84 Years | 0 (0.0%) | 0 (0.0%) |
| 85 Years and over | 0 (0.0%) | 0 (0.0%) |
| Total | 160 (100.0%) | 274 (100.0%) |
Families and Households in Coldiron
Median Family Size in Coldiron
The median family size in Coldiron is 3.64 persons per family, with single female/mother families (30 | 27.0%) accounting for the largest median family size of 4.1 persons per family. On the other hand, single male/father families (5 | 4.5%) represent the smallest median family size with 1.20 persons per family.
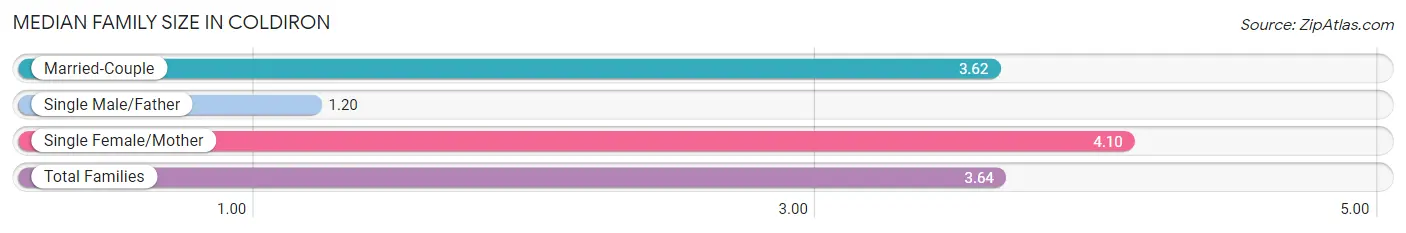
| Family Type | # Families | Family Size |
| Married-Couple | 76 (68.5%) | 3.62 |
| Single Male/Father | 5 (4.5%) | 1.20 |
| Single Female/Mother | 30 (27.0%) | 4.10 |
| Total Families | 111 (100.0%) | 3.64 |
Median Household Size in Coldiron
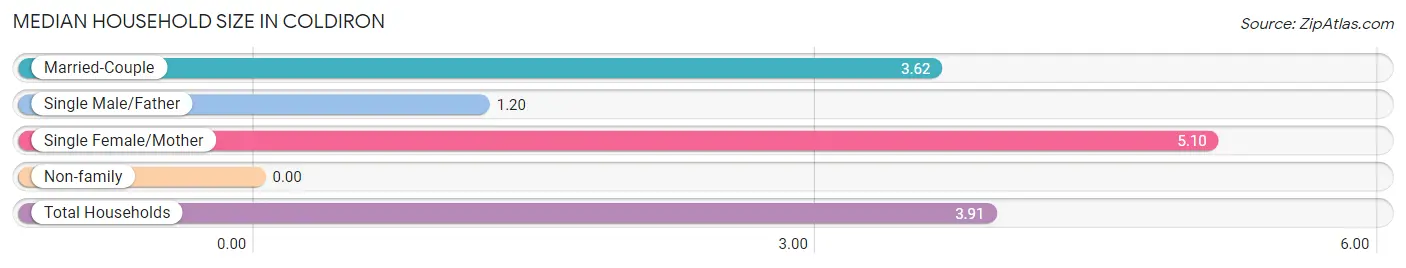
| Household Type | # Households | Household Size |
| Married-Couple | 76 (68.5%) | 3.62 |
| Single Male/Father | 5 (4.5%) | 1.20 |
| Single Female/Mother | 30 (27.0%) | 5.10 |
| Non-family | 0 (0.0%) | - |
| Total Households | 111 (100.0%) | 3.91 |
Household Size by Marriage Status in Coldiron
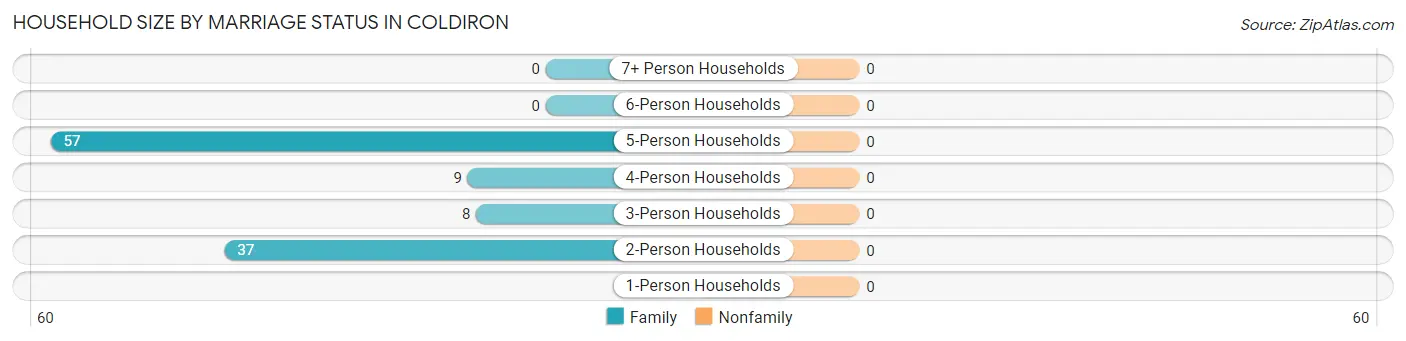
| Household Size | Family Households | Nonfamily Households |
| 1-Person Households | - | 0 (0.0%) |
| 2-Person Households | 37 (33.3%) | 0 (0.0%) |
| 3-Person Households | 8 (7.2%) | 0 (0.0%) |
| 4-Person Households | 9 (8.1%) | 0 (0.0%) |
| 5-Person Households | 57 (51.3%) | 0 (0.0%) |
| 6-Person Households | 0 (0.0%) | 0 (0.0%) |
| 7+ Person Households | 0 (0.0%) | 0 (0.0%) |
| Total | 111 (100.0%) | 0 (0.0%) |
Female Fertility in Coldiron
Fertility by Age in Coldiron
| Age Bracket | Women with Births | Births / 1,000 Women |
| 15 to 19 years | 0 (0.0%) | 0.0 |
| 20 to 34 years | 0 (0.0%) | 0.0 |
| 35 to 50 years | 0 (0.0%) | 0.0 |
| Total | 0 (0.0%) | 0.0 |
Fertility by Age by Marriage Status in Coldiron
| Age Bracket | Married | Unmarried |
| 15 to 19 years | 0 (0.0%) | 0 (0.0%) |
| 20 to 34 years | 0 (0.0%) | 0 (0.0%) |
| 35 to 50 years | 0 (0.0%) | 0 (0.0%) |
| Total | 0 (0.0%) | 0 (0.0%) |
Fertility by Education in Coldiron
| Educational Attainment | Women with Births | Births / 1,000 Women |
| Less than High School | 0 (0.0%) | 0.0 |
| High School Diploma | 0 (0.0%) | 0.0 |
| College or Associate's Degree | 0 (0.0%) | 0.0 |
| Bachelor's Degree | 0 (0.0%) | 0.0 |
| Graduate Degree | 0 (0.0%) | 0.0 |
| Total | 0 (0.0%) | 0.0 |
Fertility by Education by Marriage Status in Coldiron
| Educational Attainment | Married | Unmarried |
| Less than High School | 0 (0.0%) | 0 (0.0%) |
| High School Diploma | 0 (0.0%) | 0 (0.0%) |
| College or Associate's Degree | 0 (0.0%) | 0 (0.0%) |
| Bachelor's Degree | 0 (0.0%) | 0 (0.0%) |
| Graduate Degree | 0 (0.0%) | 0 (0.0%) |
| Total | 0 (0.0%) | 0 (0.0%) |
Employment Characteristics in Coldiron
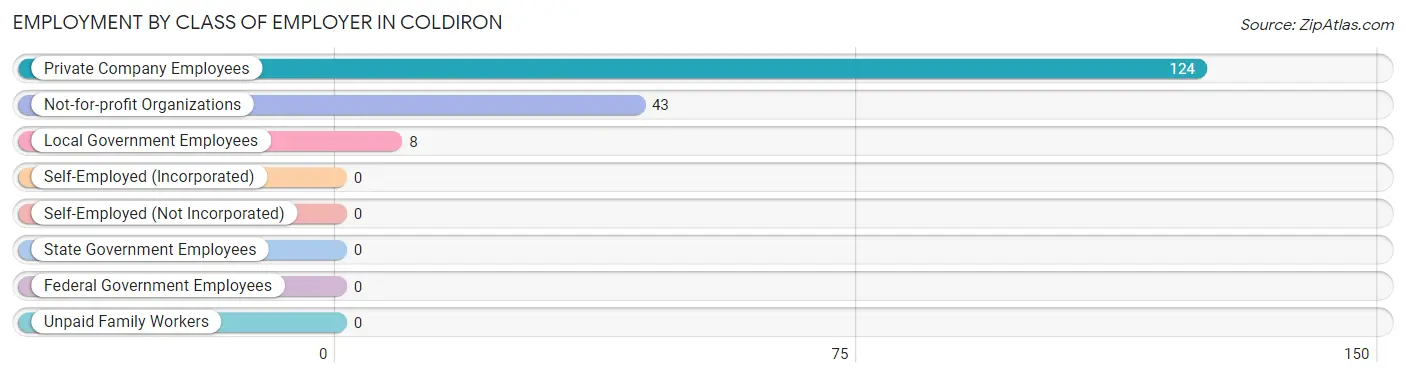
Employment by Class of Employer in Coldiron
Among the 175 employed individuals in Coldiron, private company employees (124 | 70.9%), not-for-profit organizations (43 | 24.6%), and local government employees (8 | 4.6%) make up the most common classes of employment.
| Employer Class | # Employees | % Employees |
| Private Company Employees | 124 | 70.9% |
| Self-Employed (Incorporated) | 0 | 0.0% |
| Self-Employed (Not Incorporated) | 0 | 0.0% |
| Not-for-profit Organizations | 43 | 24.6% |
| Local Government Employees | 8 | 4.6% |
| State Government Employees | 0 | 0.0% |
| Federal Government Employees | 0 | 0.0% |
| Unpaid Family Workers | 0 | 0.0% |
| Total | 175 | 100.0% |
Employment Status by Age in Coldiron
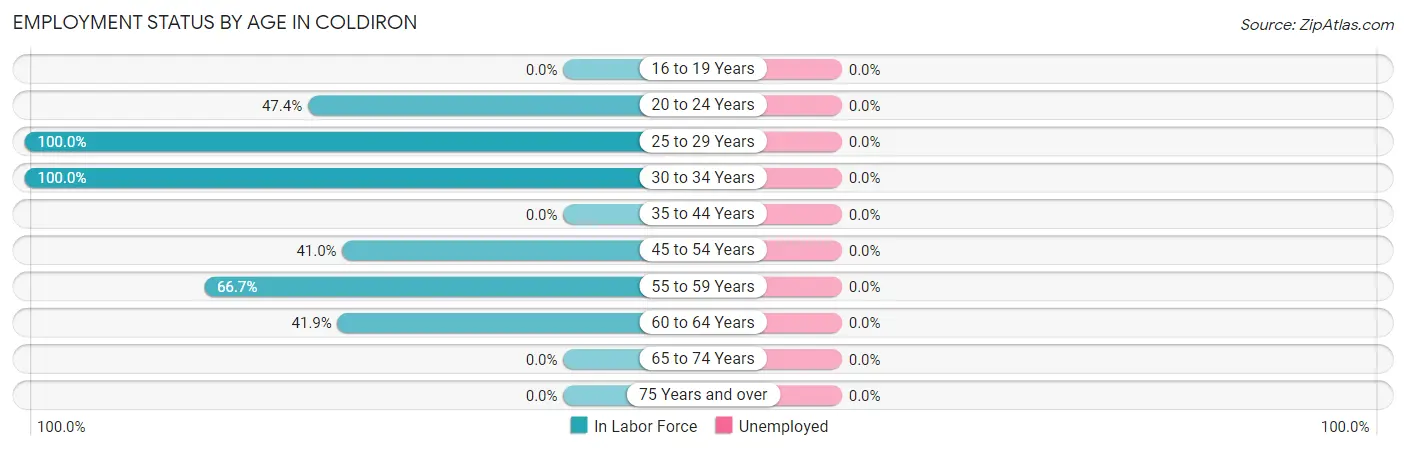
| Age Bracket | In Labor Force | Unemployed |
| 16 to 19 Years | 0 (0.0%) | 0 (0.0%) |
| 20 to 24 Years | 9 (47.4%) | 0 (0.0%) |
| 25 to 29 Years | 30 (100.0%) | 0 (0.0%) |
| 30 to 34 Years | 86 (100.0%) | 0 (0.0%) |
| 35 to 44 Years | 0 (0.0%) | 0 (0.0%) |
| 45 to 54 Years | 16 (41.0%) | 0 (0.0%) |
| 55 to 59 Years | 16 (66.7%) | 0 (0.0%) |
| 60 to 64 Years | 18 (41.9%) | 0 (0.0%) |
| 65 to 74 Years | 0 (0.0%) | 0 (0.0%) |
| 75 Years and over | 0 (0.0%) | 0 (0.0%) |
| Total | 175 (72.6%) | 0 (0.0%) |
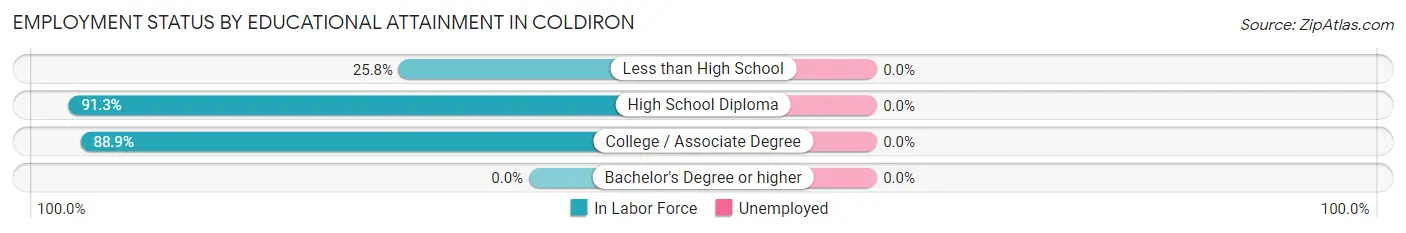
Employment Status by Educational Attainment in Coldiron
| Educational Attainment | In Labor Force | Unemployed |
| Less than High School | 8 (25.8%) | 0 (0.0%) |
| High School Diploma | 94 (91.3%) | 0 (0.0%) |
| College / Associate Degree | 64 (88.9%) | 0 (0.0%) |
| Bachelor's Degree or higher | 0 (0.0%) | 0 (0.0%) |
| Total | 166 (74.8%) | 0 (0.0%) |
Employment Occupations by Sex in Coldiron
Management, Business, Science and Arts Occupations
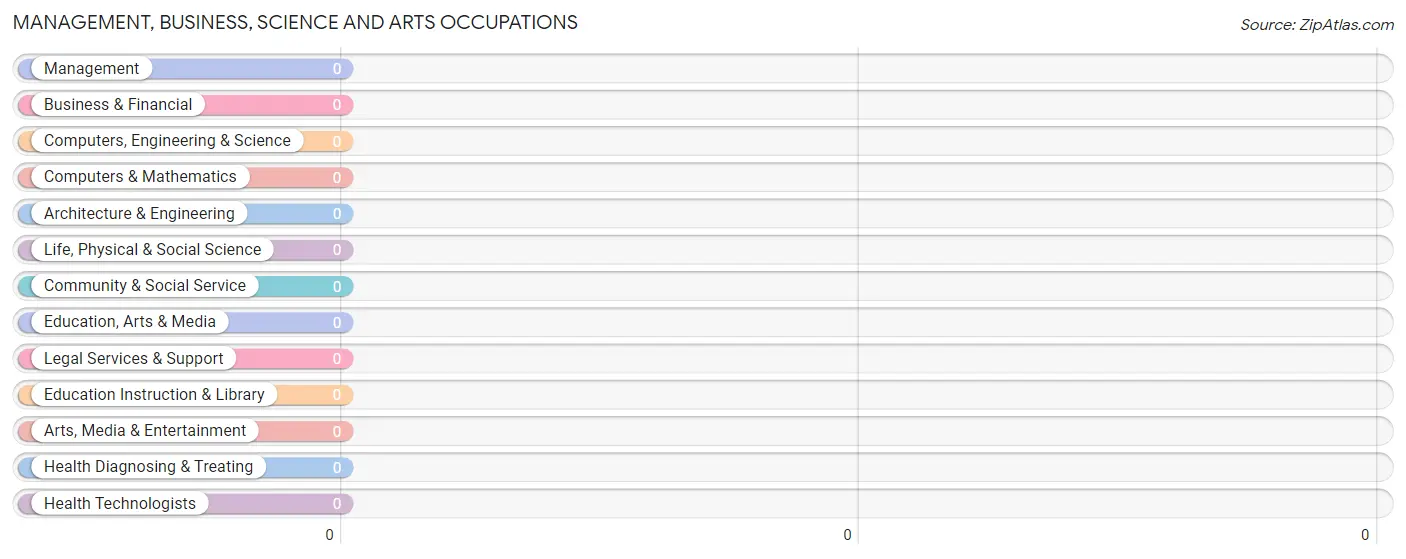
Management, Business, Science and Arts Occupations by Sex
| Occupation | Male | Female |
| Management | 0 (0.0%) | 0 (0.0%) |
| Business & Financial | 0 (0.0%) | 0 (0.0%) |
| Computers, Engineering & Science | 0 (0.0%) | 0 (0.0%) |
| Computers & Mathematics | 0 (0.0%) | 0 (0.0%) |
| Architecture & Engineering | 0 (0.0%) | 0 (0.0%) |
| Life, Physical & Social Science | 0 (0.0%) | 0 (0.0%) |
| Community & Social Service | 0 (0.0%) | 0 (0.0%) |
| Education, Arts & Media | 0 (0.0%) | 0 (0.0%) |
| Legal Services & Support | 0 (0.0%) | 0 (0.0%) |
| Education Instruction & Library | 0 (0.0%) | 0 (0.0%) |
| Arts, Media & Entertainment | 0 (0.0%) | 0 (0.0%) |
| Health Diagnosing & Treating | 0 (0.0%) | 0 (0.0%) |
| Health Technologists | 0 (0.0%) | 0 (0.0%) |
| Total (Category) | 0 (0.0%) | 0 (0.0%) |
| Total (Overall) | 93 (53.1%) | 82 (46.9%) |
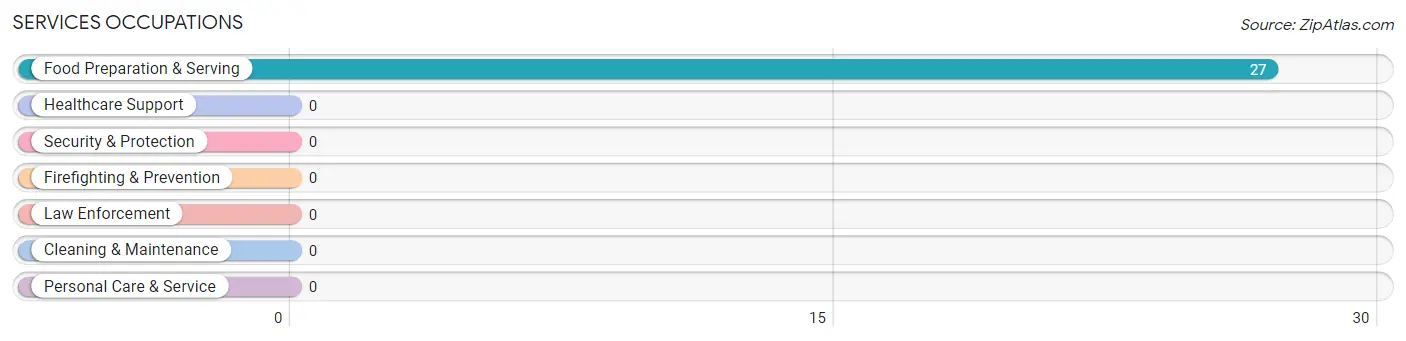
Services Occupations
The most common Services occupations in Coldiron are , and Food Preparation & Serving (27 | 15.4%).
Services Occupations by Sex
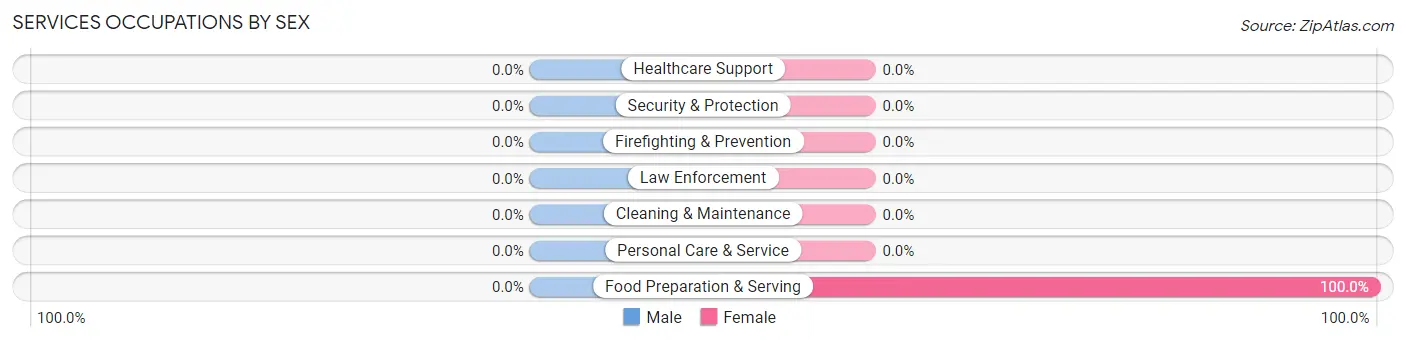
| Occupation | Male | Female |
| Healthcare Support | 0 (0.0%) | 0 (0.0%) |
| Security & Protection | 0 (0.0%) | 0 (0.0%) |
| Firefighting & Prevention | 0 (0.0%) | 0 (0.0%) |
| Law Enforcement | 0 (0.0%) | 0 (0.0%) |
| Food Preparation & Serving | 0 (0.0%) | 27 (100.0%) |
| Cleaning & Maintenance | 0 (0.0%) | 0 (0.0%) |
| Personal Care & Service | 0 (0.0%) | 0 (0.0%) |
| Total (Category) | 0 (0.0%) | 27 (100.0%) |
| Total (Overall) | 93 (53.1%) | 82 (46.9%) |
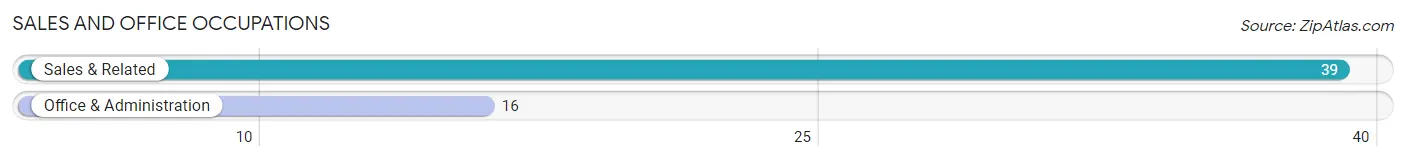
Sales and Office Occupations
The most common Sales and Office occupations in Coldiron are Sales & Related (39 | 22.3%), and Office & Administration (16 | 9.1%).
Sales and Office Occupations by Sex
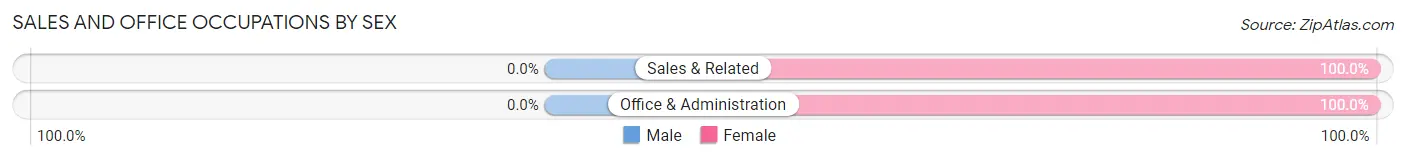
| Occupation | Male | Female |
| Sales & Related | 0 (0.0%) | 39 (100.0%) |
| Office & Administration | 0 (0.0%) | 16 (100.0%) |
| Total (Category) | 0 (0.0%) | 55 (100.0%) |
| Total (Overall) | 93 (53.1%) | 82 (46.9%) |
Natural Resources, Construction and Maintenance Occupations
The most common Natural Resources, Construction and Maintenance occupations in Coldiron are , and Construction & Extraction (38 | 21.7%).
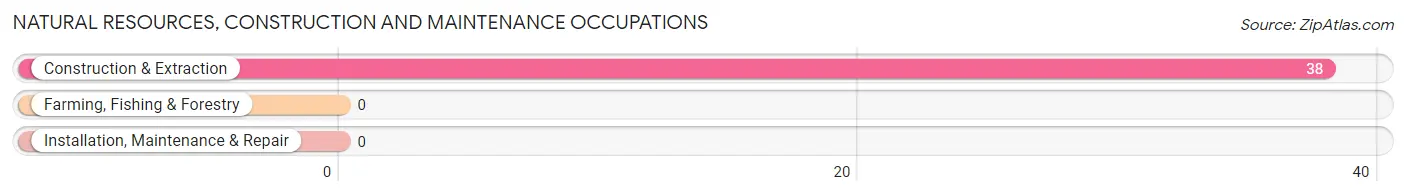
Natural Resources, Construction and Maintenance Occupations by Sex
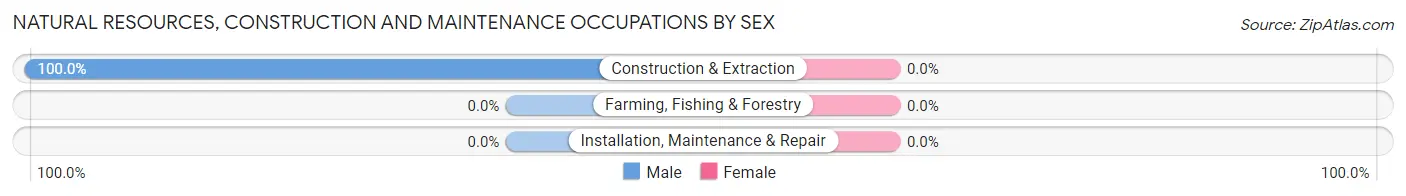
| Occupation | Male | Female |
| Farming, Fishing & Forestry | 0 (0.0%) | 0 (0.0%) |
| Construction & Extraction | 38 (100.0%) | 0 (0.0%) |
| Installation, Maintenance & Repair | 0 (0.0%) | 0 (0.0%) |
| Total (Category) | 38 (100.0%) | 0 (0.0%) |
| Total (Overall) | 93 (53.1%) | 82 (46.9%) |
Production, Transportation and Moving Occupations
The most common Production, Transportation and Moving occupations in Coldiron are Material Moving (29 | 16.6%), and Transportation (26 | 14.9%).
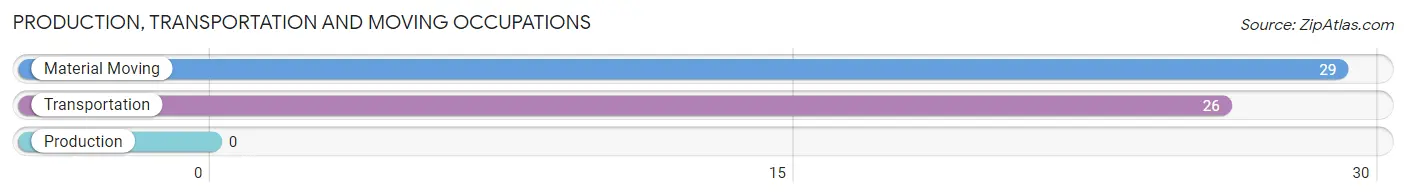
Production, Transportation and Moving Occupations by Sex
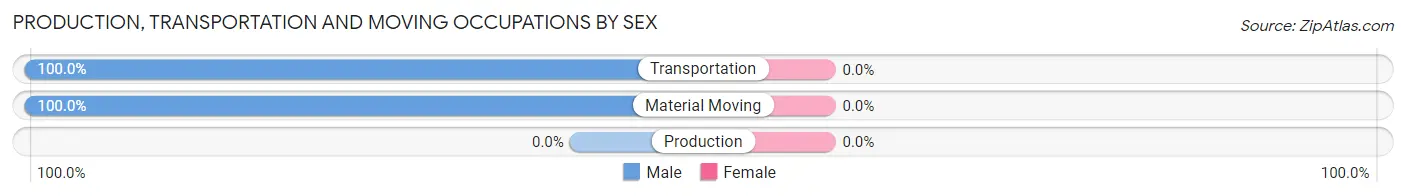
| Occupation | Male | Female |
| Production | 0 (0.0%) | 0 (0.0%) |
| Transportation | 26 (100.0%) | 0 (0.0%) |
| Material Moving | 29 (100.0%) | 0 (0.0%) |
| Total (Category) | 55 (100.0%) | 0 (0.0%) |
| Total (Overall) | 93 (53.1%) | 82 (46.9%) |
Employment Industries by Sex in Coldiron
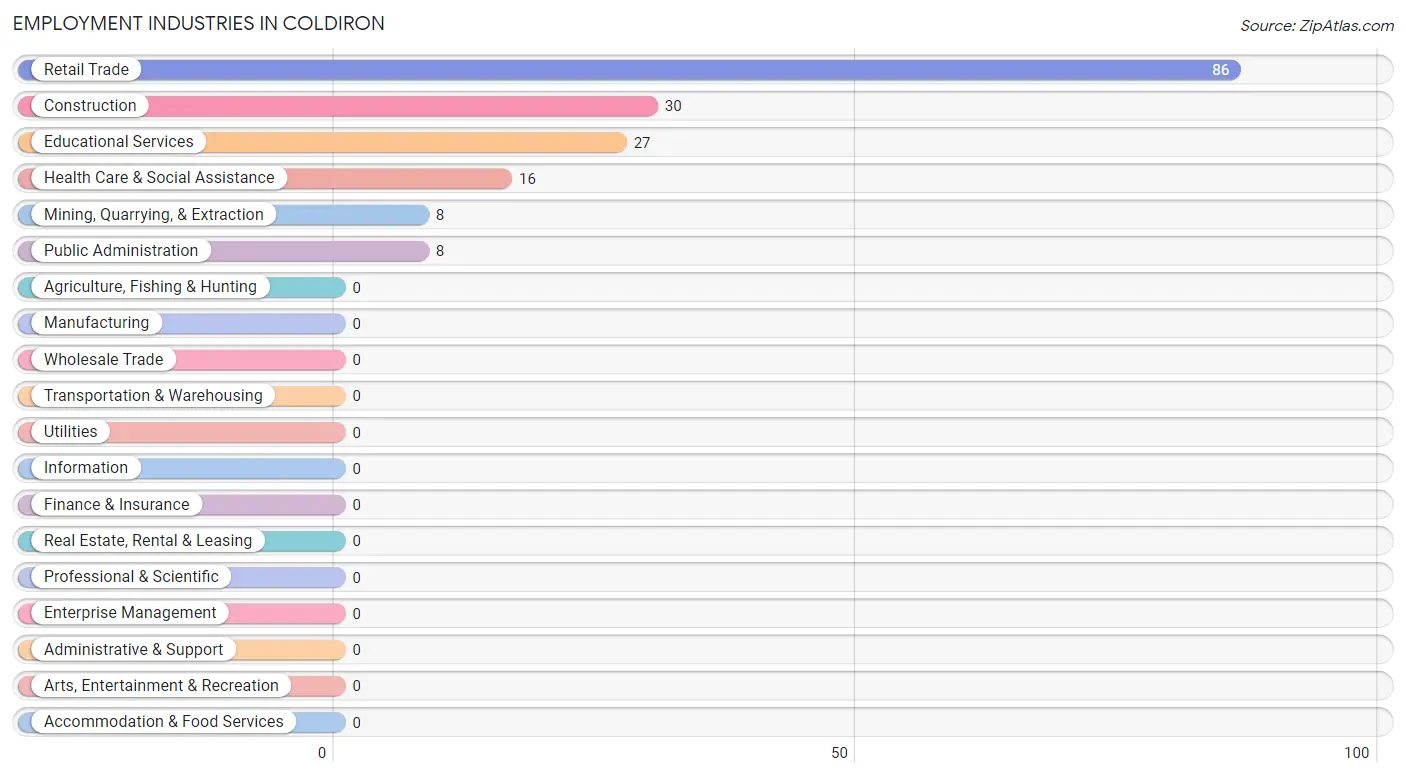
Employment Industries in Coldiron
The major employment industries in Coldiron include Retail Trade (86 | 49.1%), Construction (30 | 17.1%), Educational Services (27 | 15.4%), Health Care & Social Assistance (16 | 9.1%), and Mining, Quarrying, & Extraction (8 | 4.6%).
Employment Industries by Sex in Coldiron
The Coldiron industries that see more men than women are Mining, Quarrying, & Extraction (100.0%), Construction (100.0%), and Retail Trade (54.6%), whereas the industries that tend to have a higher number of women are Educational Services (100.0%), Public Administration (100.0%), and Health Care & Social Assistance (50.0%).
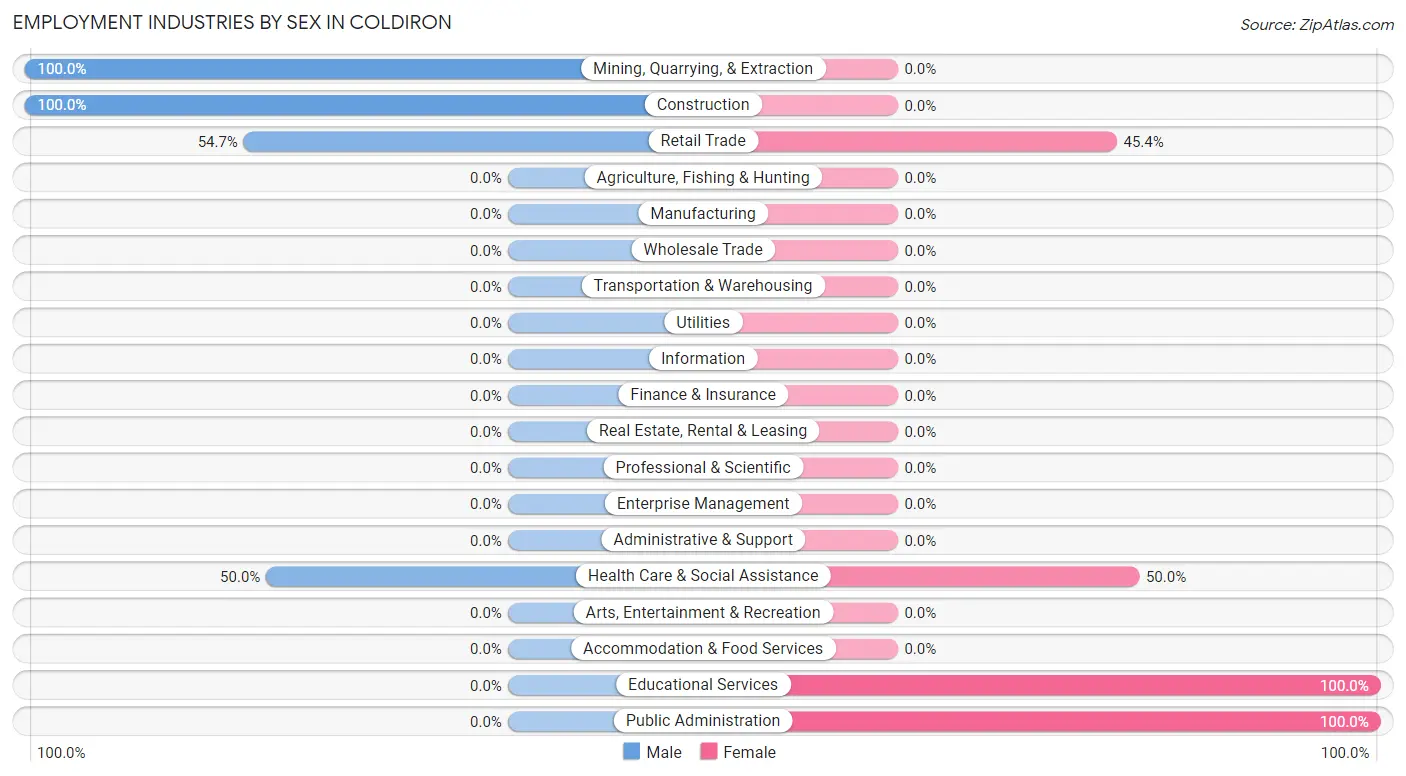
| Industry | Male | Female |
| Agriculture, Fishing & Hunting | 0 (0.0%) | 0 (0.0%) |
| Mining, Quarrying, & Extraction | 8 (100.0%) | 0 (0.0%) |
| Construction | 30 (100.0%) | 0 (0.0%) |
| Manufacturing | 0 (0.0%) | 0 (0.0%) |
| Wholesale Trade | 0 (0.0%) | 0 (0.0%) |
| Retail Trade | 47 (54.6%) | 39 (45.4%) |
| Transportation & Warehousing | 0 (0.0%) | 0 (0.0%) |
| Utilities | 0 (0.0%) | 0 (0.0%) |
| Information | 0 (0.0%) | 0 (0.0%) |
| Finance & Insurance | 0 (0.0%) | 0 (0.0%) |
| Real Estate, Rental & Leasing | 0 (0.0%) | 0 (0.0%) |
| Professional & Scientific | 0 (0.0%) | 0 (0.0%) |
| Enterprise Management | 0 (0.0%) | 0 (0.0%) |
| Administrative & Support | 0 (0.0%) | 0 (0.0%) |
| Educational Services | 0 (0.0%) | 27 (100.0%) |
| Health Care & Social Assistance | 8 (50.0%) | 8 (50.0%) |
| Arts, Entertainment & Recreation | 0 (0.0%) | 0 (0.0%) |
| Accommodation & Food Services | 0 (0.0%) | 0 (0.0%) |
| Public Administration | 0 (0.0%) | 8 (100.0%) |
| Total | 93 (53.1%) | 82 (46.9%) |
Education in Coldiron
School Enrollment in Coldiron
The most common levels of schooling among the 234 students in Coldiron are elementary school (105 | 44.9%), college / undergraduate (75 | 32.1%), and middle school (32 | 13.7%).
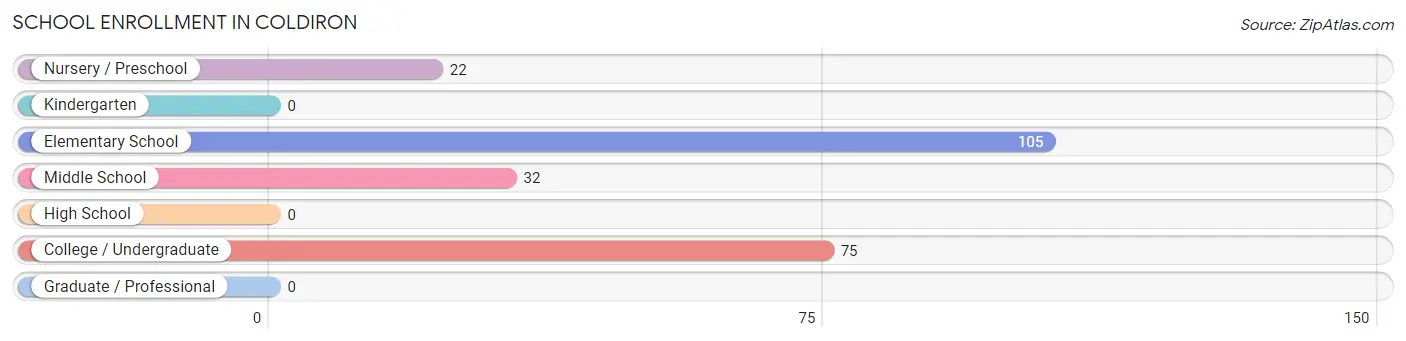
| School Level | # Students | % Students |
| Nursery / Preschool | 22 | 9.4% |
| Kindergarten | 0 | 0.0% |
| Elementary School | 105 | 44.9% |
| Middle School | 32 | 13.7% |
| High School | 0 | 0.0% |
| College / Undergraduate | 75 | 32.1% |
| Graduate / Professional | 0 | 0.0% |
| Total | 234 | 100.0% |
School Enrollment by Age by Funding Source in Coldiron
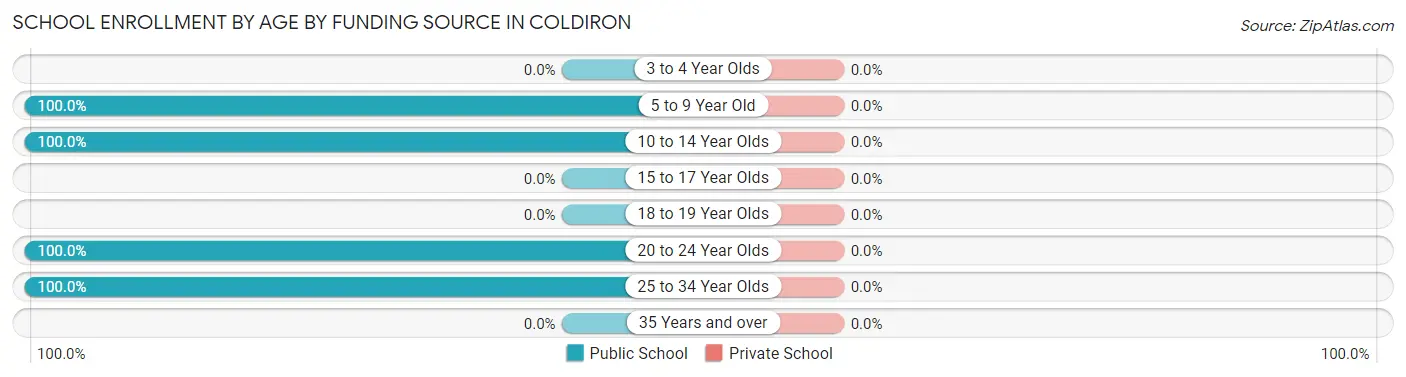
| Age Bracket | Public School | Private School |
| 3 to 4 Year Olds | 0 (0.0%) | 0 (0.0%) |
| 5 to 9 Year Old | 86 (100.0%) | 0 (0.0%) |
| 10 to 14 Year Olds | 73 (100.0%) | 0 (0.0%) |
| 15 to 17 Year Olds | 0 (0.0%) | 0 (0.0%) |
| 18 to 19 Year Olds | 0 (0.0%) | 0 (0.0%) |
| 20 to 24 Year Olds | 19 (100.0%) | 0 (0.0%) |
| 25 to 34 Year Olds | 56 (100.0%) | 0 (0.0%) |
| 35 Years and over | 0 (0.0%) | 0 (0.0%) |
| Total | 234 (100.0%) | 0 (0.0%) |
Educational Attainment by Field of Study in Coldiron
, and education (16 | 100.0%) are the most common fields of study among 16 individuals in Coldiron who have obtained a bachelor's degree or higher.
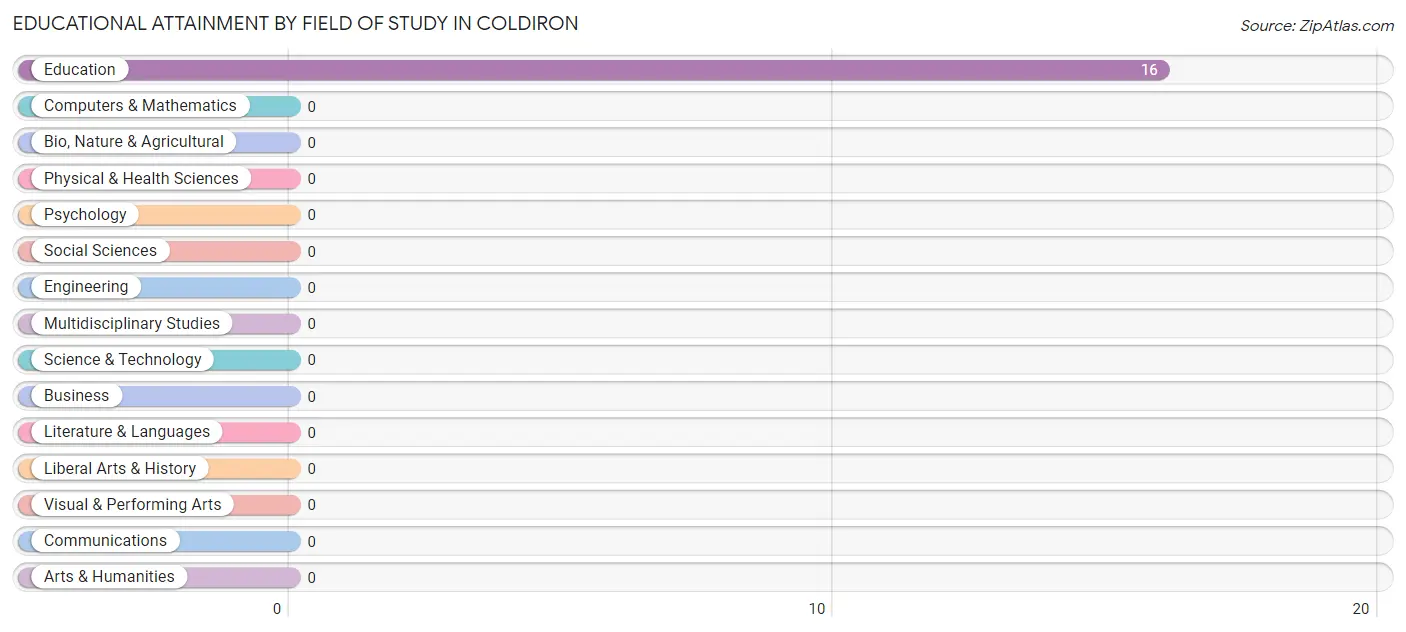
| Field of Study | # Graduates | % Graduates |
| Computers & Mathematics | 0 | 0.0% |
| Bio, Nature & Agricultural | 0 | 0.0% |
| Physical & Health Sciences | 0 | 0.0% |
| Psychology | 0 | 0.0% |
| Social Sciences | 0 | 0.0% |
| Engineering | 0 | 0.0% |
| Multidisciplinary Studies | 0 | 0.0% |
| Science & Technology | 0 | 0.0% |
| Business | 0 | 0.0% |
| Education | 16 | 100.0% |
| Literature & Languages | 0 | 0.0% |
| Liberal Arts & History | 0 | 0.0% |
| Visual & Performing Arts | 0 | 0.0% |
| Communications | 0 | 0.0% |
| Arts & Humanities | 0 | 0.0% |
| Total | 16 | 100.0% |
Transportation & Commute in Coldiron
Vehicle Availability by Sex in Coldiron
The most prevalent vehicle ownership categories in Coldiron are males with 2 vehicles (67, accounting for 72.0%) and females with 2 vehicles (74, making up 81.7%).
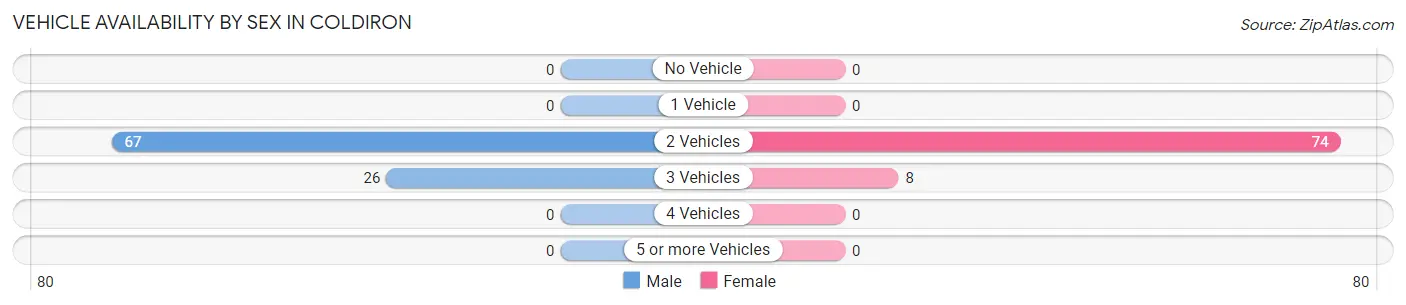
| Vehicles Available | Male | Female |
| No Vehicle | 0 (0.0%) | 0 (0.0%) |
| 1 Vehicle | 0 (0.0%) | 0 (0.0%) |
| 2 Vehicles | 67 (72.0%) | 74 (90.2%) |
| 3 Vehicles | 26 (28.0%) | 8 (9.8%) |
| 4 Vehicles | 0 (0.0%) | 0 (0.0%) |
| 5 or more Vehicles | 0 (0.0%) | 0 (0.0%) |
| Total | 93 (100.0%) | 82 (100.0%) |
Commute Time in Coldiron
The most frequently occuring commute durations in Coldiron are 20 to 24 minutes (111 commuters, 63.4%), 35 to 39 minutes (38 commuters, 21.7%), and 5 to 9 minutes (18 commuters, 10.3%).
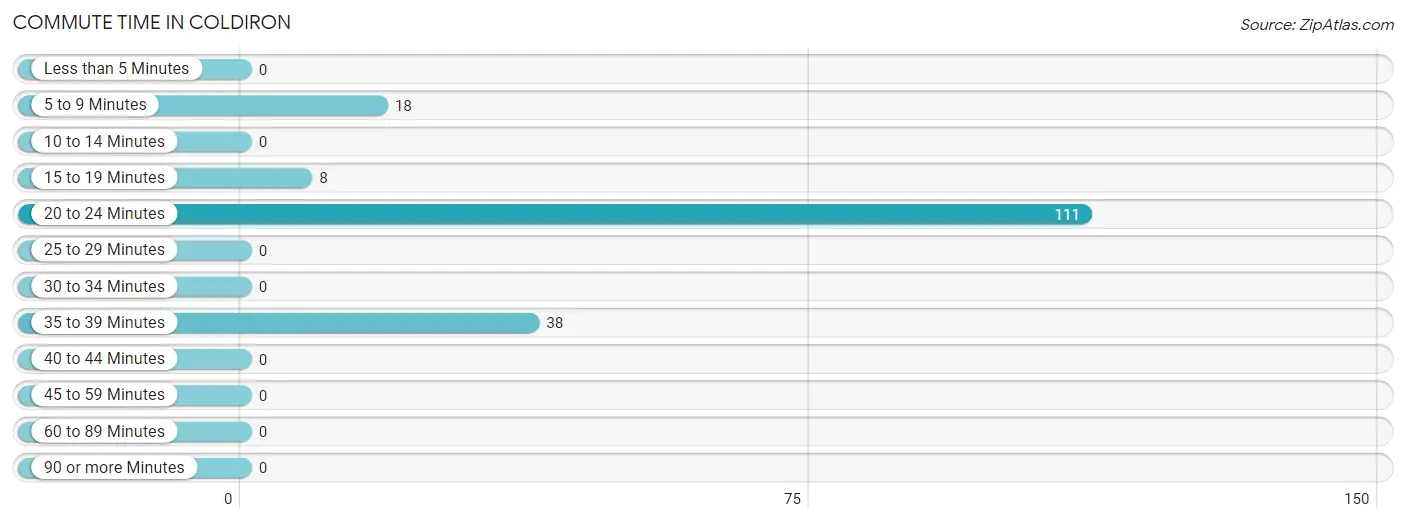
| Commute Time | # Commuters | % Commuters |
| Less than 5 Minutes | 0 | 0.0% |
| 5 to 9 Minutes | 18 | 10.3% |
| 10 to 14 Minutes | 0 | 0.0% |
| 15 to 19 Minutes | 8 | 4.6% |
| 20 to 24 Minutes | 111 | 63.4% |
| 25 to 29 Minutes | 0 | 0.0% |
| 30 to 34 Minutes | 0 | 0.0% |
| 35 to 39 Minutes | 38 | 21.7% |
| 40 to 44 Minutes | 0 | 0.0% |
| 45 to 59 Minutes | 0 | 0.0% |
| 60 to 89 Minutes | 0 | 0.0% |
| 90 or more Minutes | 0 | 0.0% |
Commute Time by Sex in Coldiron
The most common commute times in Coldiron are 35 to 39 minutes (38 commuters, 40.9%) for males and 20 to 24 minutes (82 commuters, 100.0%) for females.
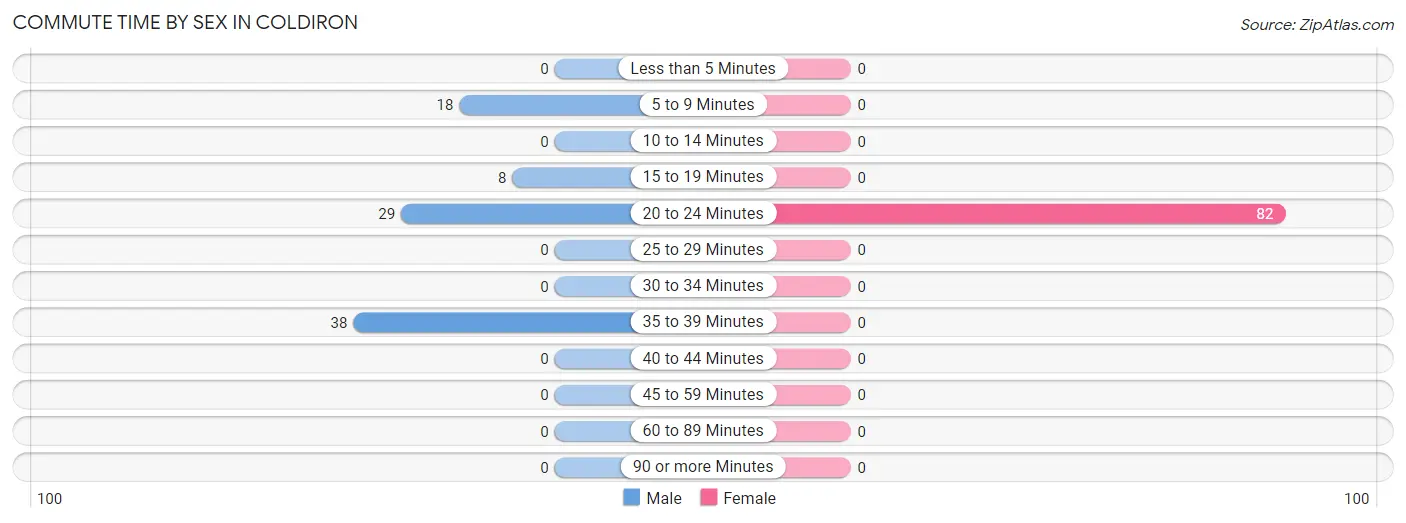
| Commute Time | Male | Female |
| Less than 5 Minutes | 0 (0.0%) | 0 (0.0%) |
| 5 to 9 Minutes | 18 (19.4%) | 0 (0.0%) |
| 10 to 14 Minutes | 0 (0.0%) | 0 (0.0%) |
| 15 to 19 Minutes | 8 (8.6%) | 0 (0.0%) |
| 20 to 24 Minutes | 29 (31.2%) | 82 (100.0%) |
| 25 to 29 Minutes | 0 (0.0%) | 0 (0.0%) |
| 30 to 34 Minutes | 0 (0.0%) | 0 (0.0%) |
| 35 to 39 Minutes | 38 (40.9%) | 0 (0.0%) |
| 40 to 44 Minutes | 0 (0.0%) | 0 (0.0%) |
| 45 to 59 Minutes | 0 (0.0%) | 0 (0.0%) |
| 60 to 89 Minutes | 0 (0.0%) | 0 (0.0%) |
| 90 or more Minutes | 0 (0.0%) | 0 (0.0%) |
Time of Departure to Work by Sex in Coldiron
The most frequent times of departure to work in Coldiron are 12:00 AM to 4:59 AM (67, 72.0%) for males and 10:00 AM to 10:59 AM (30, 36.6%) for females.
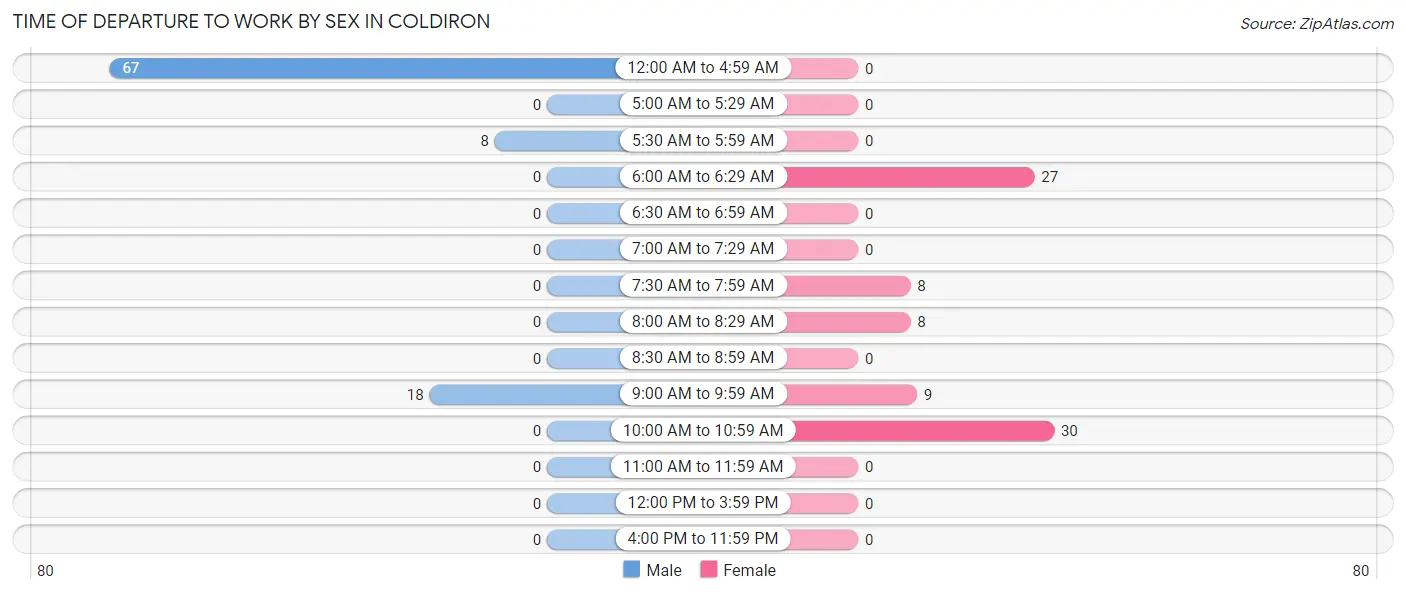
| Time of Departure | Male | Female |
| 12:00 AM to 4:59 AM | 67 (72.0%) | 0 (0.0%) |
| 5:00 AM to 5:29 AM | 0 (0.0%) | 0 (0.0%) |
| 5:30 AM to 5:59 AM | 8 (8.6%) | 0 (0.0%) |
| 6:00 AM to 6:29 AM | 0 (0.0%) | 27 (32.9%) |
| 6:30 AM to 6:59 AM | 0 (0.0%) | 0 (0.0%) |
| 7:00 AM to 7:29 AM | 0 (0.0%) | 0 (0.0%) |
| 7:30 AM to 7:59 AM | 0 (0.0%) | 8 (9.8%) |
| 8:00 AM to 8:29 AM | 0 (0.0%) | 8 (9.8%) |
| 8:30 AM to 8:59 AM | 0 (0.0%) | 0 (0.0%) |
| 9:00 AM to 9:59 AM | 18 (19.4%) | 9 (11.0%) |
| 10:00 AM to 10:59 AM | 0 (0.0%) | 30 (36.6%) |
| 11:00 AM to 11:59 AM | 0 (0.0%) | 0 (0.0%) |
| 12:00 PM to 3:59 PM | 0 (0.0%) | 0 (0.0%) |
| 4:00 PM to 11:59 PM | 0 (0.0%) | 0 (0.0%) |
| Total | 93 (100.0%) | 82 (100.0%) |
Housing Occupancy in Coldiron
Occupancy by Ownership in Coldiron
Of the total 111 dwellings in Coldiron, owner-occupied units account for 102 (91.9%), while renter-occupied units make up 9 (8.1%).
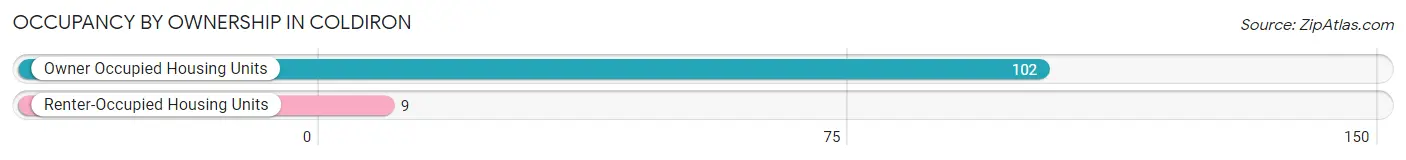
| Occupancy | # Housing Units | % Housing Units |
| Owner Occupied Housing Units | 102 | 91.9% |
| Renter-Occupied Housing Units | 9 | 8.1% |
| Total Occupied Housing Units | 111 | 100.0% |
Occupancy by Household Size in Coldiron
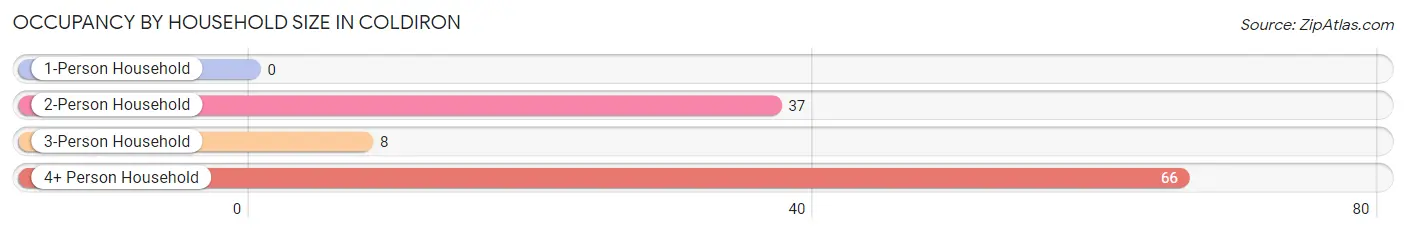
| Household Size | # Housing Units | % Housing Units |
| 1-Person Household | 0 | 0.0% |
| 2-Person Household | 37 | 33.3% |
| 3-Person Household | 8 | 7.2% |
| 4+ Person Household | 66 | 59.5% |
| Total Housing Units | 111 | 100.0% |
Occupancy by Ownership by Household Size in Coldiron
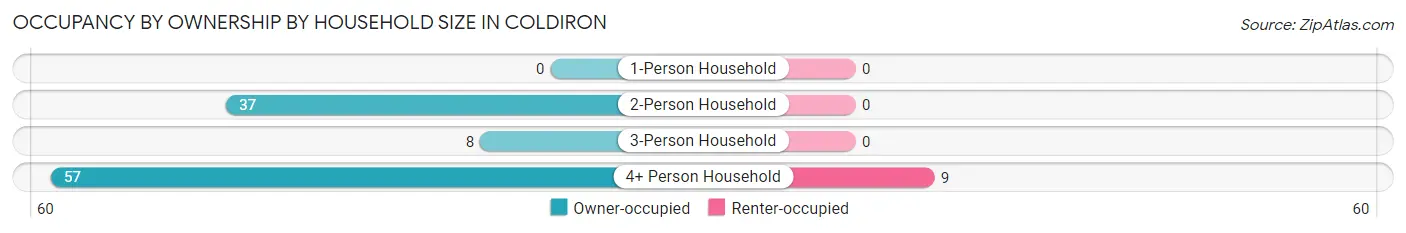
| Household Size | Owner-occupied | Renter-occupied |
| 1-Person Household | 0 (0.0%) | 0 (0.0%) |
| 2-Person Household | 37 (100.0%) | 0 (0.0%) |
| 3-Person Household | 8 (100.0%) | 0 (0.0%) |
| 4+ Person Household | 57 (86.4%) | 9 (13.6%) |
| Total Housing Units | 102 (91.9%) | 9 (8.1%) |
Occupancy by Educational Attainment in Coldiron
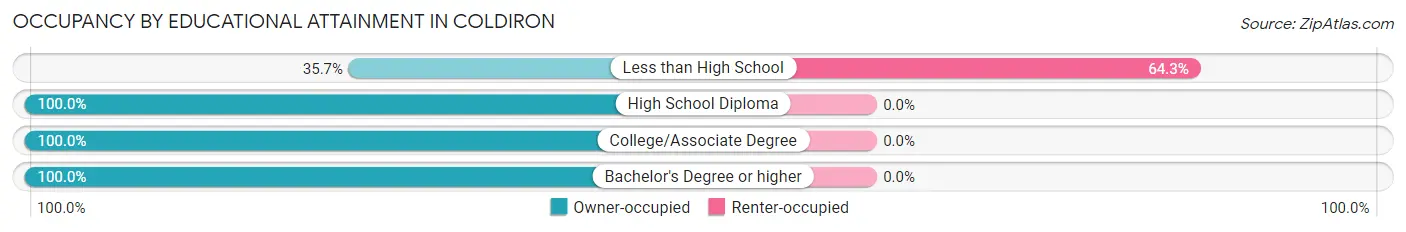
| Household Size | Owner-occupied | Renter-occupied |
| Less than High School | 5 (35.7%) | 9 (64.3%) |
| High School Diploma | 38 (100.0%) | 0 (0.0%) |
| College/Associate Degree | 43 (100.0%) | 0 (0.0%) |
| Bachelor's Degree or higher | 16 (100.0%) | 0 (0.0%) |
Occupancy by Age of Householder in Coldiron
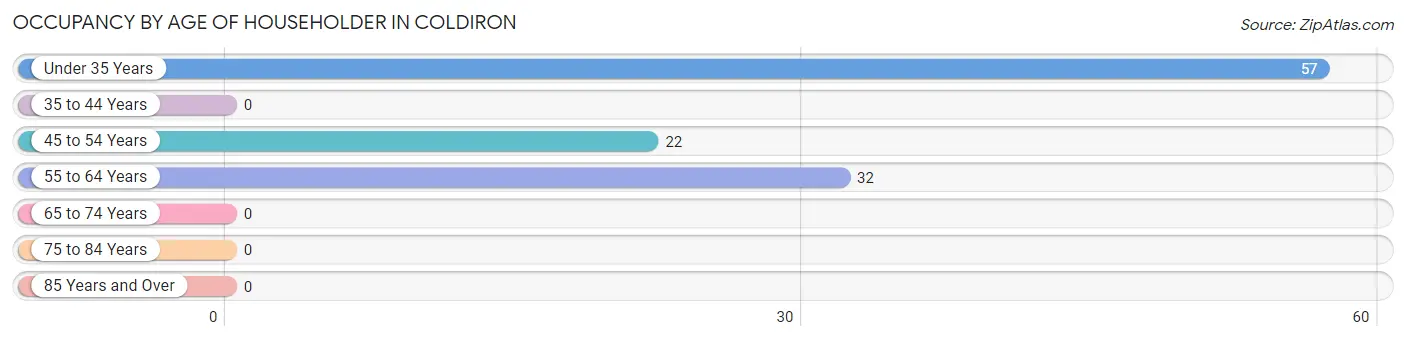
| Age Bracket | # Households | % Households |
| Under 35 Years | 57 | 51.3% |
| 35 to 44 Years | 0 | 0.0% |
| 45 to 54 Years | 22 | 19.8% |
| 55 to 64 Years | 32 | 28.8% |
| 65 to 74 Years | 0 | 0.0% |
| 75 to 84 Years | 0 | 0.0% |
| 85 Years and Over | 0 | 0.0% |
| Total | 111 | 100.0% |
Housing Finances in Coldiron
Median Income by Occupancy in Coldiron
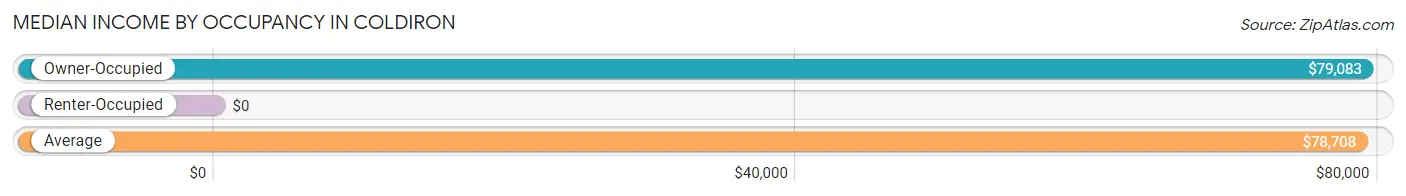
| Occupancy Type | # Households | Median Income |
| Owner-Occupied | 102 (91.9%) | $79,083 |
| Renter-Occupied | 9 (8.1%) | $0 |
| Average | 111 (100.0%) | $78,708 |
Occupancy by Householder Income Bracket in Coldiron
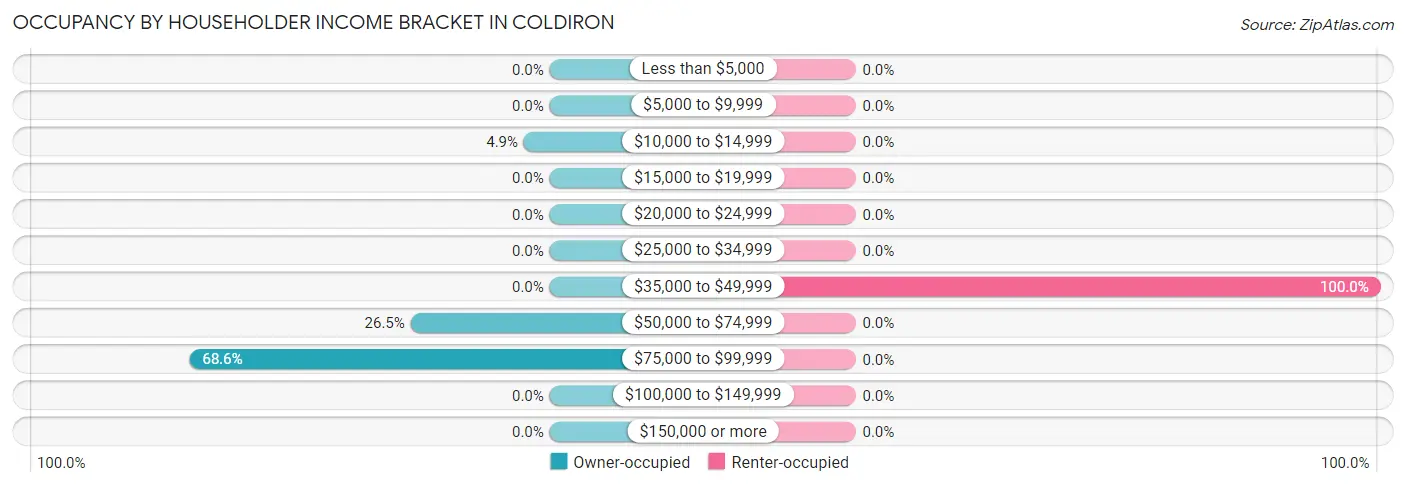
| Income Bracket | Owner-occupied | Renter-occupied |
| Less than $5,000 | 0 (0.0%) | 0 (0.0%) |
| $5,000 to $9,999 | 0 (0.0%) | 0 (0.0%) |
| $10,000 to $14,999 | 5 (4.9%) | 0 (0.0%) |
| $15,000 to $19,999 | 0 (0.0%) | 0 (0.0%) |
| $20,000 to $24,999 | 0 (0.0%) | 0 (0.0%) |
| $25,000 to $34,999 | 0 (0.0%) | 0 (0.0%) |
| $35,000 to $49,999 | 0 (0.0%) | 9 (100.0%) |
| $50,000 to $74,999 | 27 (26.5%) | 0 (0.0%) |
| $75,000 to $99,999 | 70 (68.6%) | 0 (0.0%) |
| $100,000 to $149,999 | 0 (0.0%) | 0 (0.0%) |
| $150,000 or more | 0 (0.0%) | 0 (0.0%) |
| Total | 102 (100.0%) | 9 (100.0%) |
Monthly Housing Cost Tiers in Coldiron
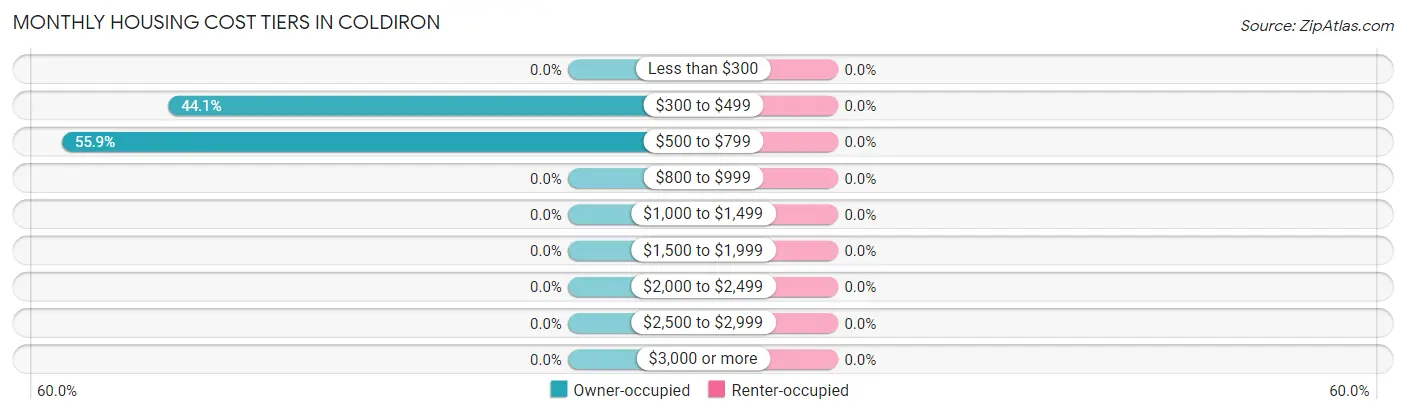
| Monthly Cost | Owner-occupied | Renter-occupied |
| Less than $300 | 0 (0.0%) | 0 (0.0%) |
| $300 to $499 | 45 (44.1%) | 0 (0.0%) |
| $500 to $799 | 57 (55.9%) | 0 (0.0%) |
| $800 to $999 | 0 (0.0%) | 0 (0.0%) |
| $1,000 to $1,499 | 0 (0.0%) | 0 (0.0%) |
| $1,500 to $1,999 | 0 (0.0%) | 0 (0.0%) |
| $2,000 to $2,499 | 0 (0.0%) | 0 (0.0%) |
| $2,500 to $2,999 | 0 (0.0%) | 0 (0.0%) |
| $3,000 or more | 0 (0.0%) | 0 (0.0%) |
| Total | 102 (100.0%) | 9 (100.0%) |
Physical Housing Characteristics in Coldiron
Housing Structures in Coldiron
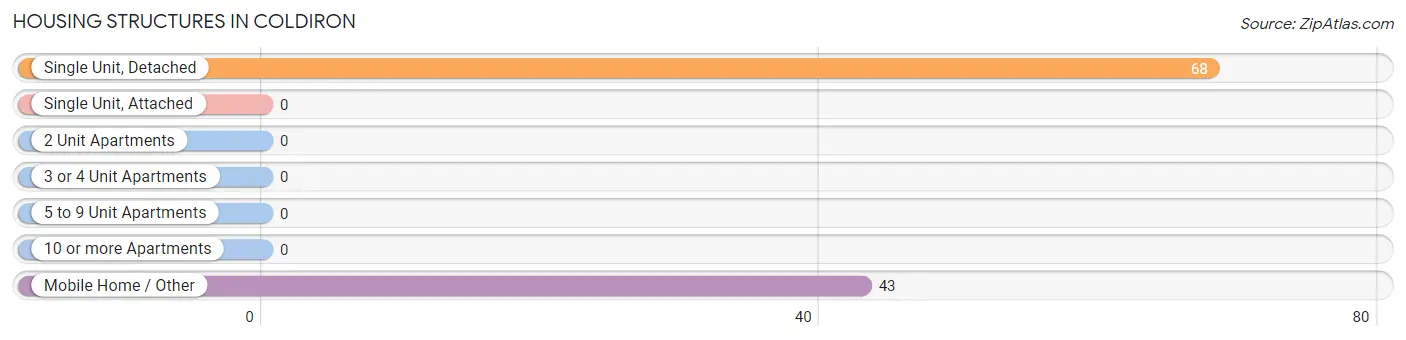
| Structure Type | # Housing Units | % Housing Units |
| Single Unit, Detached | 68 | 61.3% |
| Single Unit, Attached | 0 | 0.0% |
| 2 Unit Apartments | 0 | 0.0% |
| 3 or 4 Unit Apartments | 0 | 0.0% |
| 5 to 9 Unit Apartments | 0 | 0.0% |
| 10 or more Apartments | 0 | 0.0% |
| Mobile Home / Other | 43 | 38.7% |
| Total | 111 | 100.0% |
Housing Structures by Occupancy in Coldiron
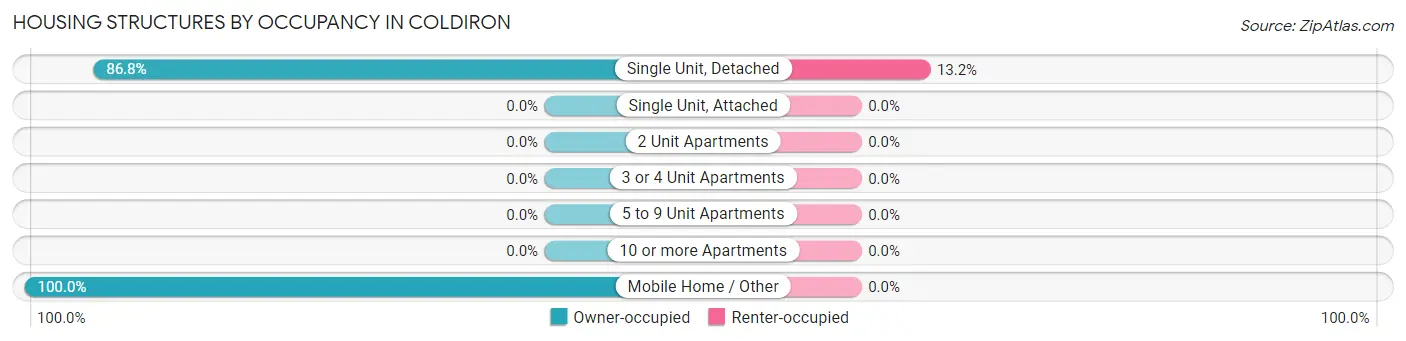
| Structure Type | Owner-occupied | Renter-occupied |
| Single Unit, Detached | 59 (86.8%) | 9 (13.2%) |
| Single Unit, Attached | 0 (0.0%) | 0 (0.0%) |
| 2 Unit Apartments | 0 (0.0%) | 0 (0.0%) |
| 3 or 4 Unit Apartments | 0 (0.0%) | 0 (0.0%) |
| 5 to 9 Unit Apartments | 0 (0.0%) | 0 (0.0%) |
| 10 or more Apartments | 0 (0.0%) | 0 (0.0%) |
| Mobile Home / Other | 43 (100.0%) | 0 (0.0%) |
| Total | 102 (91.9%) | 9 (8.1%) |
Housing Structures by Number of Rooms in Coldiron
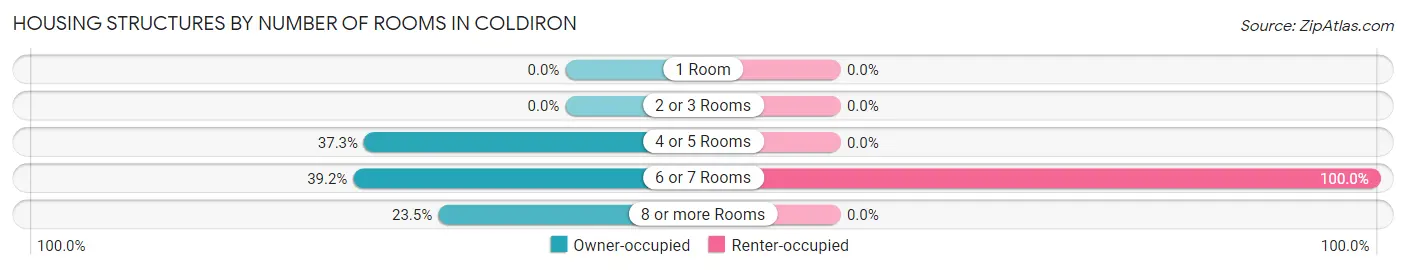
| Number of Rooms | Owner-occupied | Renter-occupied |
| 1 Room | 0 (0.0%) | 0 (0.0%) |
| 2 or 3 Rooms | 0 (0.0%) | 0 (0.0%) |
| 4 or 5 Rooms | 38 (37.2%) | 0 (0.0%) |
| 6 or 7 Rooms | 40 (39.2%) | 9 (100.0%) |
| 8 or more Rooms | 24 (23.5%) | 0 (0.0%) |
| Total | 102 (100.0%) | 9 (100.0%) |
Housing Structure by Heating Type in Coldiron
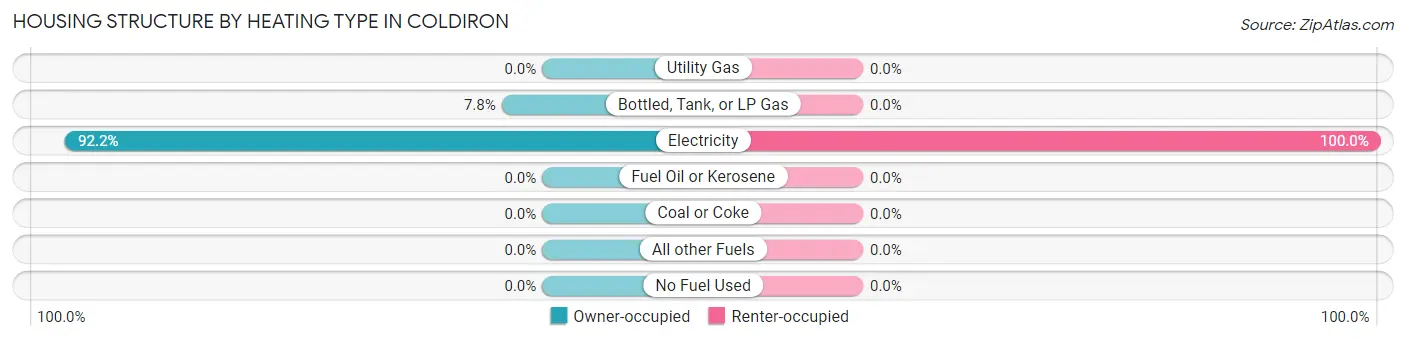
| Heating Type | Owner-occupied | Renter-occupied |
| Utility Gas | 0 (0.0%) | 0 (0.0%) |
| Bottled, Tank, or LP Gas | 8 (7.8%) | 0 (0.0%) |
| Electricity | 94 (92.2%) | 9 (100.0%) |
| Fuel Oil or Kerosene | 0 (0.0%) | 0 (0.0%) |
| Coal or Coke | 0 (0.0%) | 0 (0.0%) |
| All other Fuels | 0 (0.0%) | 0 (0.0%) |
| No Fuel Used | 0 (0.0%) | 0 (0.0%) |
| Total | 102 (100.0%) | 9 (100.0%) |
Household Vehicle Usage in Coldiron
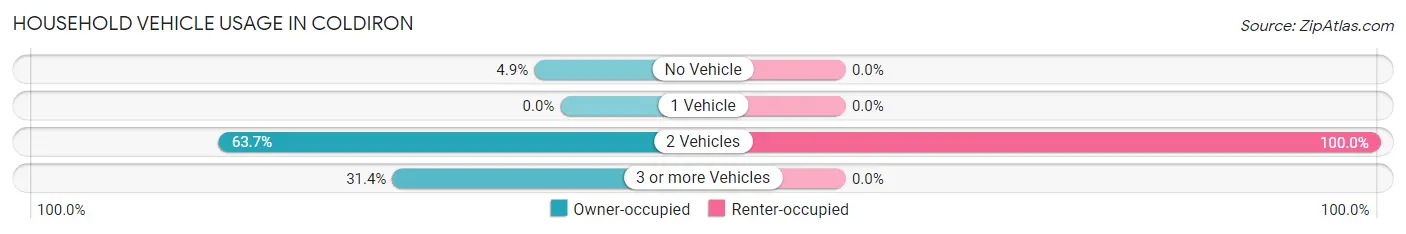
| Vehicles per Household | Owner-occupied | Renter-occupied |
| No Vehicle | 5 (4.9%) | 0 (0.0%) |
| 1 Vehicle | 0 (0.0%) | 0 (0.0%) |
| 2 Vehicles | 65 (63.7%) | 9 (100.0%) |
| 3 or more Vehicles | 32 (31.4%) | 0 (0.0%) |
| Total | 102 (100.0%) | 9 (100.0%) |
Real Estate & Mortgages in Coldiron
Real Estate and Mortgage Overview in Coldiron
| Characteristic | Without Mortgage | With Mortgage |
| Housing Units | 40 | 62 |
| Median Property Value | - | - |
| Median Household Income | $81,563 | $0 |
| Monthly Housing Costs | $417 | $0 |
| Real Estate Taxes | - | - |
Property Value by Mortgage Status in Coldiron
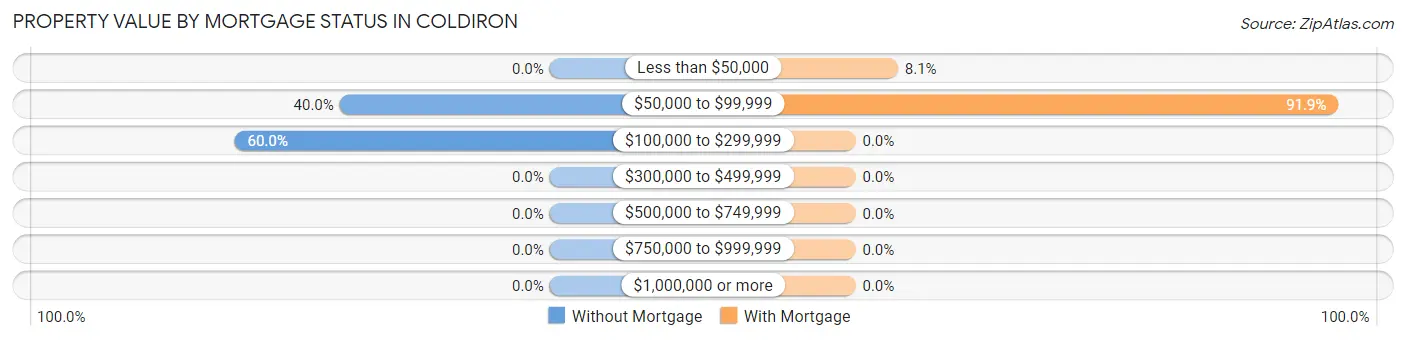
| Property Value | Without Mortgage | With Mortgage |
| Less than $50,000 | 0 (0.0%) | 5 (8.1%) |
| $50,000 to $99,999 | 16 (40.0%) | 57 (91.9%) |
| $100,000 to $299,999 | 24 (60.0%) | 0 (0.0%) |
| $300,000 to $499,999 | 0 (0.0%) | 0 (0.0%) |
| $500,000 to $749,999 | 0 (0.0%) | 0 (0.0%) |
| $750,000 to $999,999 | 0 (0.0%) | 0 (0.0%) |
| $1,000,000 or more | 0 (0.0%) | 0 (0.0%) |
| Total | 40 (100.0%) | 62 (100.0%) |
Household Income by Mortgage Status in Coldiron
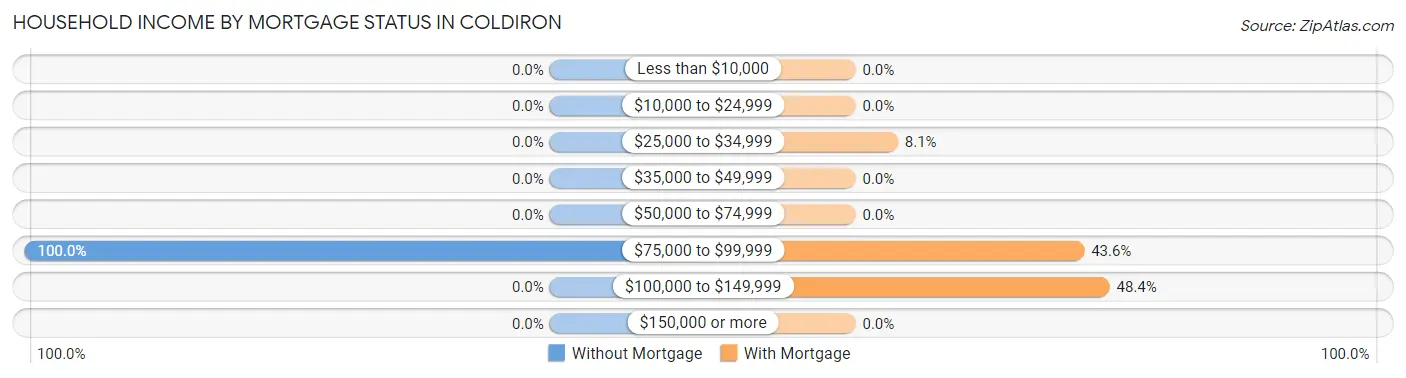
| Household Income | Without Mortgage | With Mortgage |
| Less than $10,000 | 0 (0.0%) | 0 (0.0%) |
| $10,000 to $24,999 | 0 (0.0%) | 0 (0.0%) |
| $25,000 to $34,999 | 0 (0.0%) | 5 (8.1%) |
| $35,000 to $49,999 | 0 (0.0%) | 0 (0.0%) |
| $50,000 to $74,999 | 0 (0.0%) | 0 (0.0%) |
| $75,000 to $99,999 | 40 (100.0%) | 27 (43.5%) |
| $100,000 to $149,999 | 0 (0.0%) | 30 (48.4%) |
| $150,000 or more | 0 (0.0%) | 0 (0.0%) |
| Total | 40 (100.0%) | 62 (100.0%) |
Property Value to Household Income Ratio in Coldiron
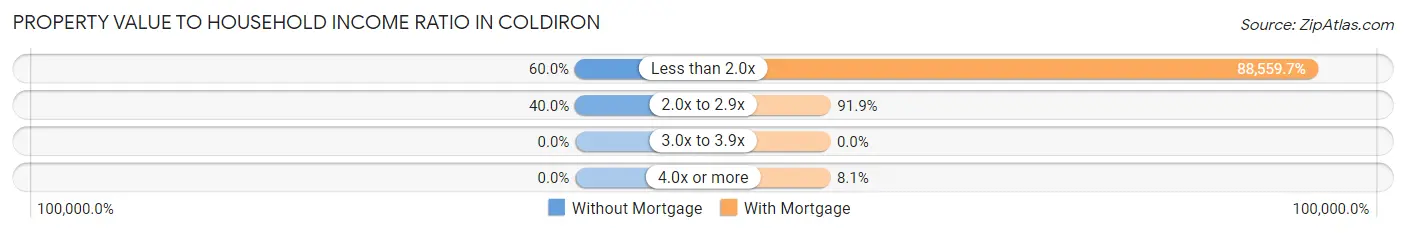
| Value-to-Income Ratio | Without Mortgage | With Mortgage |
| Less than 2.0x | 24 (60.0%) | 54,907 (88,559.7%) |
| 2.0x to 2.9x | 16 (40.0%) | 57 (91.9%) |
| 3.0x to 3.9x | 0 (0.0%) | 0 (0.0%) |
| 4.0x or more | 0 (0.0%) | 5 (8.1%) |
| Total | 40 (100.0%) | 62 (100.0%) |
Real Estate Taxes by Mortgage Status in Coldiron
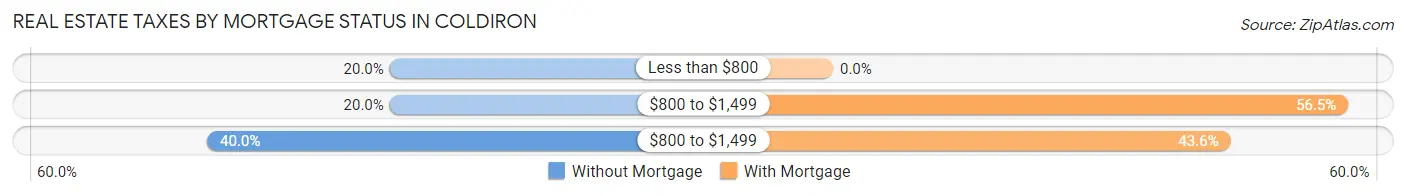
| Property Taxes | Without Mortgage | With Mortgage |
| Less than $800 | 8 (20.0%) | 0 (0.0%) |
| $800 to $1,499 | 8 (20.0%) | 35 (56.5%) |
| $800 to $1,499 | 16 (40.0%) | 27 (43.5%) |
| Total | 40 (100.0%) | 62 (100.0%) |
Health & Disability in Coldiron
Health Insurance Coverage by Age in Coldiron
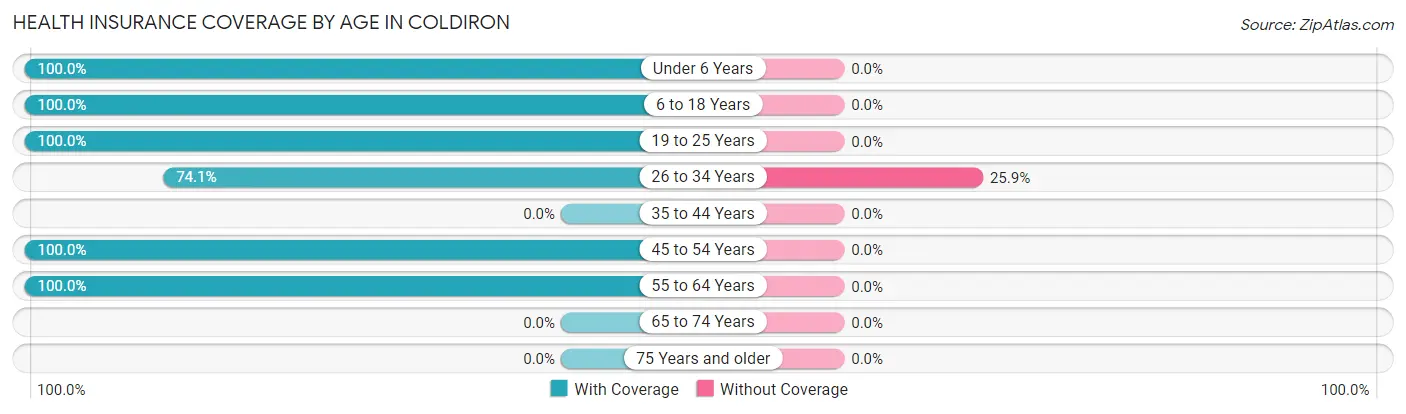
| Age Bracket | With Coverage | Without Coverage |
| Under 6 Years | 86 (100.0%) | 0 (0.0%) |
| 6 to 18 Years | 107 (100.0%) | 0 (0.0%) |
| 19 to 25 Years | 19 (100.0%) | 0 (0.0%) |
| 26 to 34 Years | 86 (74.1%) | 30 (25.9%) |
| 35 to 44 Years | 0 (0.0%) | 0 (0.0%) |
| 45 to 54 Years | 39 (100.0%) | 0 (0.0%) |
| 55 to 64 Years | 67 (100.0%) | 0 (0.0%) |
| 65 to 74 Years | 0 (0.0%) | 0 (0.0%) |
| 75 Years and older | 0 (0.0%) | 0 (0.0%) |
| Total | 404 (93.1%) | 30 (6.9%) |
Health Insurance Coverage by Citizenship Status in Coldiron
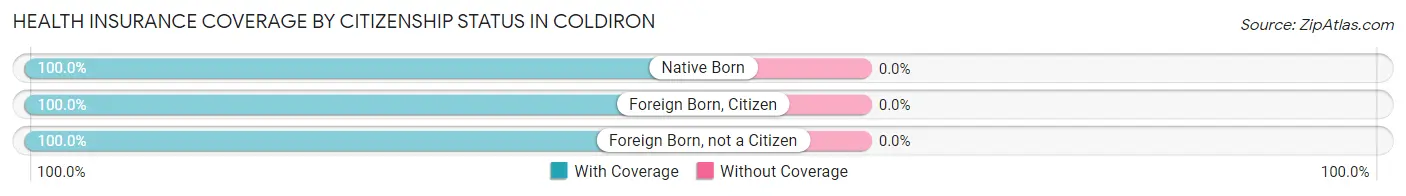
| Citizenship Status | With Coverage | Without Coverage |
| Native Born | 86 (100.0%) | 0 (0.0%) |
| Foreign Born, Citizen | 107 (100.0%) | 0 (0.0%) |
| Foreign Born, not a Citizen | 19 (100.0%) | 0 (0.0%) |
Health Insurance Coverage by Household Income in Coldiron
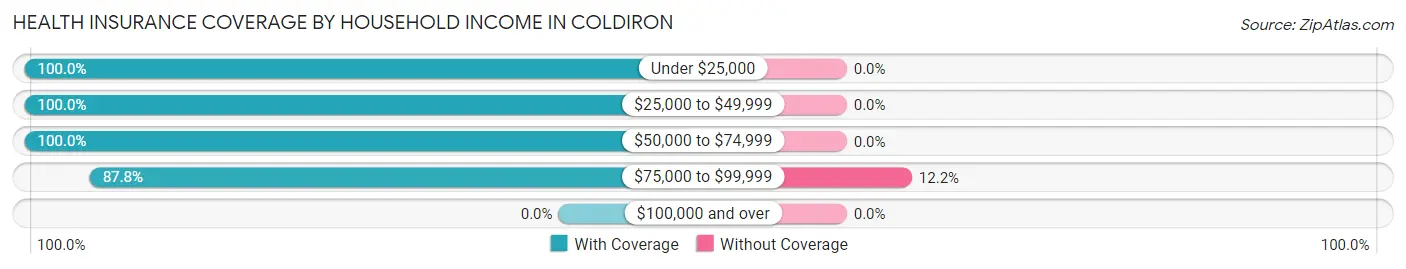
| Household Income | With Coverage | Without Coverage |
| Under $25,000 | 6 (100.0%) | 0 (0.0%) |
| $25,000 to $49,999 | 38 (100.0%) | 0 (0.0%) |
| $50,000 to $74,999 | 144 (100.0%) | 0 (0.0%) |
| $75,000 to $99,999 | 216 (87.8%) | 30 (12.2%) |
| $100,000 and over | 0 (0.0%) | 0 (0.0%) |
Public vs Private Health Insurance Coverage by Age in Coldiron
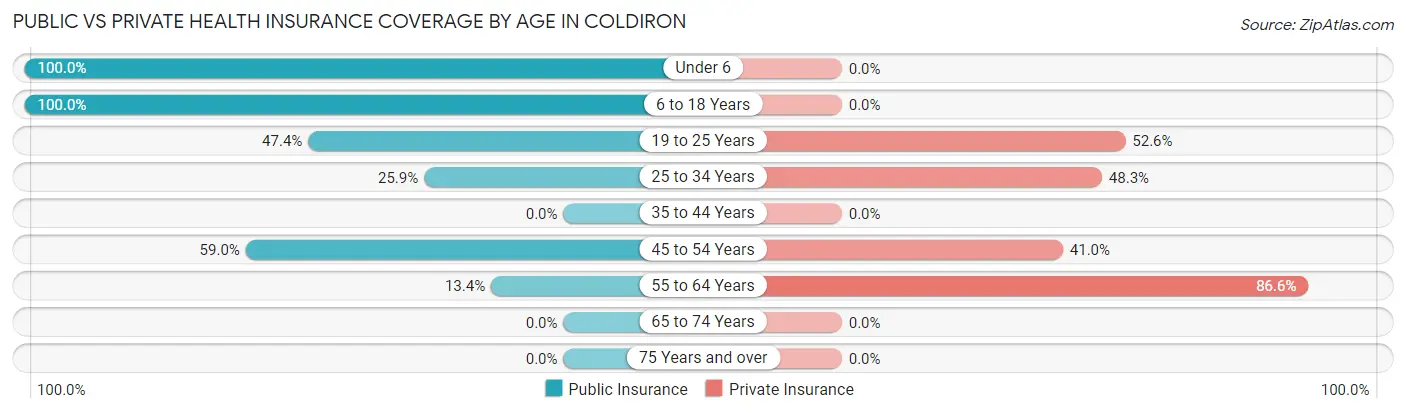
| Age Bracket | Public Insurance | Private Insurance |
| Under 6 | 86 (100.0%) | 0 (0.0%) |
| 6 to 18 Years | 107 (100.0%) | 0 (0.0%) |
| 19 to 25 Years | 9 (47.4%) | 10 (52.6%) |
| 25 to 34 Years | 30 (25.9%) | 56 (48.3%) |
| 35 to 44 Years | 0 (0.0%) | 0 (0.0%) |
| 45 to 54 Years | 23 (59.0%) | 16 (41.0%) |
| 55 to 64 Years | 9 (13.4%) | 58 (86.6%) |
| 65 to 74 Years | 0 (0.0%) | 0 (0.0%) |
| 75 Years and over | 0 (0.0%) | 0 (0.0%) |
| Total | 264 (60.8%) | 140 (32.3%) |
Disability Status by Sex by Age in Coldiron
| Age Bracket | Male | Female |
| Under 5 Years | 0 (0.0%) | 0 (0.0%) |
| 5 to 17 Years | 0 (0.0%) | 0 (0.0%) |
| 18 to 34 Years | 0 (0.0%) | 0 (0.0%) |
| 35 to 64 Years | 0 (0.0%) | 0 (0.0%) |
| 65 to 74 Years | 0 (0.0%) | 0 (0.0%) |
| 75 Years and over | 0 (0.0%) | 0 (0.0%) |
Disability Class by Sex by Age in Coldiron
Disability Class: Hearing Difficulty
| Age Bracket | Male | Female |
| Under 5 Years | 0 (0.0%) | 0 (0.0%) |
| 5 to 17 Years | 0 (0.0%) | 0 (0.0%) |
| 18 to 34 Years | 0 (0.0%) | 0 (0.0%) |
| 35 to 64 Years | 0 (0.0%) | 0 (0.0%) |
| 65 to 74 Years | 0 (0.0%) | 0 (0.0%) |
| 75 Years and over | 0 (0.0%) | 0 (0.0%) |
Disability Class: Vision Difficulty
| Age Bracket | Male | Female |
| Under 5 Years | 0 (0.0%) | 0 (0.0%) |
| 5 to 17 Years | 0 (0.0%) | 0 (0.0%) |
| 18 to 34 Years | 0 (0.0%) | 0 (0.0%) |
| 35 to 64 Years | 0 (0.0%) | 0 (0.0%) |
| 65 to 74 Years | 0 (0.0%) | 0 (0.0%) |
| 75 Years and over | 0 (0.0%) | 0 (0.0%) |
Disability Class: Cognitive Difficulty
| Age Bracket | Male | Female |
| 5 to 17 Years | 0 (0.0%) | 0 (0.0%) |
| 18 to 34 Years | 0 (0.0%) | 0 (0.0%) |
| 35 to 64 Years | 0 (0.0%) | 0 (0.0%) |
| 65 to 74 Years | 0 (0.0%) | 0 (0.0%) |
| 75 Years and over | 0 (0.0%) | 0 (0.0%) |
Disability Class: Ambulatory Difficulty

| Age Bracket | Male | Female |
| 5 to 17 Years | 0 (0.0%) | 0 (0.0%) |
| 18 to 34 Years | 0 (0.0%) | 0 (0.0%) |
| 35 to 64 Years | 0 (0.0%) | 0 (0.0%) |
| 65 to 74 Years | 0 (0.0%) | 0 (0.0%) |
| 75 Years and over | 0 (0.0%) | 0 (0.0%) |
Disability Class: Self-Care Difficulty

| Age Bracket | Male | Female |
| 5 to 17 Years | 0 (0.0%) | 0 (0.0%) |
| 18 to 34 Years | 0 (0.0%) | 0 (0.0%) |
| 35 to 64 Years | 0 (0.0%) | 0 (0.0%) |
| 65 to 74 Years | 0 (0.0%) | 0 (0.0%) |
| 75 Years and over | 0 (0.0%) | 0 (0.0%) |
Technology Access in Coldiron
Computing Device Access in Coldiron
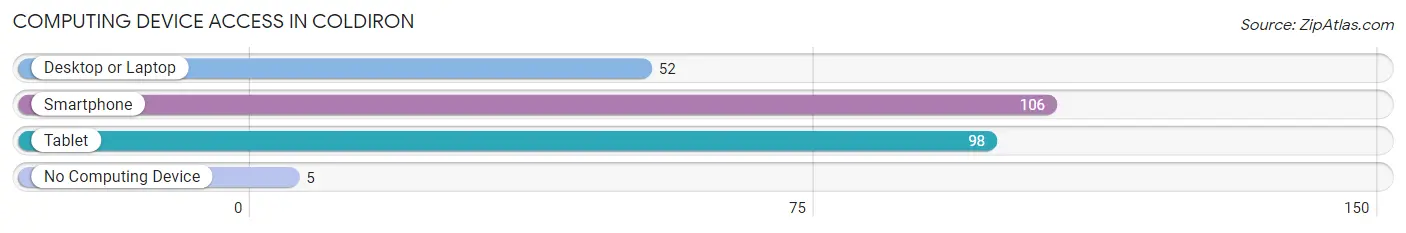
| Device Type | # Households | % Households |
| Desktop or Laptop | 52 | 46.9% |
| Smartphone | 106 | 95.5% |
| Tablet | 98 | 88.3% |
| No Computing Device | 5 | 4.5% |
| Total | 111 | 100.0% |
Internet Access in Coldiron
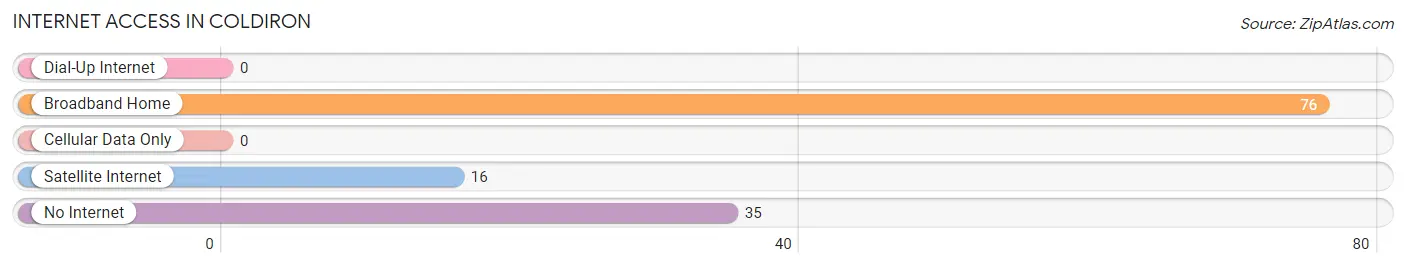
| Internet Type | # Households | % Households |
| Dial-Up Internet | 0 | 0.0% |
| Broadband Home | 76 | 68.5% |
| Cellular Data Only | 0 | 0.0% |
| Satellite Internet | 16 | 14.4% |
| No Internet | 35 | 31.5% |
| Total | 111 | 100.0% |
Coldiron Summary
Iron Coldiron is a small unincorporated community located in Harlan County, Kentucky. It is situated in the Appalachian Mountains, and is surrounded by the towns of Lynch, Cumberland, and Harlan. The population of Iron Coldiron was estimated to be around 200 people in 2000.
History
Iron Coldiron was founded in the late 1800s by a group of miners who were looking for coal. The town was named after the iron ore that was found in the area. The miners built a small settlement and began to mine the coal. The town grew slowly over the years, and by the early 1900s, it had become a thriving community.
The town was home to several businesses, including a general store, a blacksmith, a post office, and a school. The town also had a church and a cemetery. The town was known for its coal mining, and the miners worked hard to provide for their families.
In the 1950s, the coal industry began to decline, and many of the miners moved away. The town slowly began to decline, and by the late 1970s, it had become a ghost town. In the 1980s, the town was revitalized by the arrival of new residents. The town has since become a popular tourist destination, and it is now home to several businesses, including a restaurant, a bed and breakfast, and a gift shop.
Geography
Iron Coldiron is located in the Appalachian Mountains of southeastern Kentucky. The town is situated in a valley, and is surrounded by hills and mountains. The town is located near the Cumberland River, and is close to the towns of Lynch, Cumberland, and Harlan. The climate in Iron Coldiron is humid and subtropical, with hot summers and mild winters.
Economy
The economy of Iron Coldiron is largely based on tourism. The town is home to several businesses, including a restaurant, a bed and breakfast, and a gift shop. The town also has a small coal mining operation, which provides jobs for some of the residents.
Demographics
The population of Iron Coldiron was estimated to be around 200 people in 2000. The town is predominantly white, with a small African American population. The median household income in Iron Coldiron is around $30,000, and the median home value is around $50,000. The town has a high rate of poverty, with around 40% of the population living below the poverty line.
Common Questions
What is Per Capita Income in Coldiron?
Per Capita income in Coldiron is $17,920.
What is the Median Family Income in Coldiron?
Median Family Income in Coldiron is $53,565.
What is the Median Household income in Coldiron?
Median Household Income in Coldiron is $78,708.
What is Income or Wage Gap in Coldiron?
Income or Wage Gap in Coldiron is 68.8%.
Women in Coldiron earn 31.2 cents for every dollar earned by a man.
What is Inequality or Gini Index in Coldiron?
Inequality or Gini Index in Coldiron is 0.14.
What is the Total Population of Coldiron?
Total Population of Coldiron is 434.
What is the Total Male Population of Coldiron?
Total Male Population of Coldiron is 160.
What is the Total Female Population of Coldiron?
Total Female Population of Coldiron is 274.
What is the Ratio of Males per 100 Females in Coldiron?
There are 58.39 Males per 100 Females in Coldiron.
What is the Ratio of Females per 100 Males in Coldiron?
There are 171.25 Females per 100 Males in Coldiron.
What is the Median Population Age in Coldiron?
Median Population Age in Coldiron is 29.2 Years.
What is the Average Family Size in Coldiron
Average Family Size in Coldiron is 3.6 People.
What is the Average Household Size in Coldiron
Average Household Size in Coldiron is 3.9 People.
How Large is the Labor Force in Coldiron?
There are 175 People in the Labor Forcein in Coldiron.
What is the Percentage of People in the Labor Force in Coldiron?
72.6% of People are in the Labor Force in Coldiron.