Heidelberg, TX Map & Demographics
Heidelberg Map
Heidelberg Overview
$9,513
PER CAPITA INCOME
$31,921
AVG FAMILY INCOME
$31,123
AVG HOUSEHOLD INCOME
30.5%
WAGE / INCOME GAP [ % ]
69.5¢/ $1
WAGE / INCOME GAP [ $ ]
0.29
INEQUALITY / GINI INDEX
1,703
TOTAL POPULATION
836
MALE POPULATION
867
FEMALE POPULATION
96.42
MALES / 100 FEMALES
103.71
FEMALES / 100 MALES
31.1
MEDIAN AGE
4.3
AVG FAMILY SIZE
3.6
AVG HOUSEHOLD SIZE
1,107
LABOR FORCE [ PEOPLE ]
75.8%
PERCENT IN LABOR FORCE
35.2%
UNEMPLOYMENT RATE
Income in Heidelberg
Income Overview in Heidelberg
Per Capita Income in Heidelberg is $9,513, while median incomes of families and households are $31,921 and $31,123 respectively.
| Characteristic | Number | Measure |
| Per Capita Income | 1,703 | $9,513 |
| Median Family Income | 354 | $31,921 |
| Mean Family Income | 354 | $39,431 |
| Median Household Income | 467 | $31,123 |
| Mean Household Income | 467 | $33,675 |
| Income Deficit | 354 | $0 |
| Wage / Income Gap (%) | 1,703 | 30.50% |
| Wage / Income Gap ($) | 1,703 | 69.50¢ per $1 |
| Gini / Inequality Index | 1,703 | 0.29 |
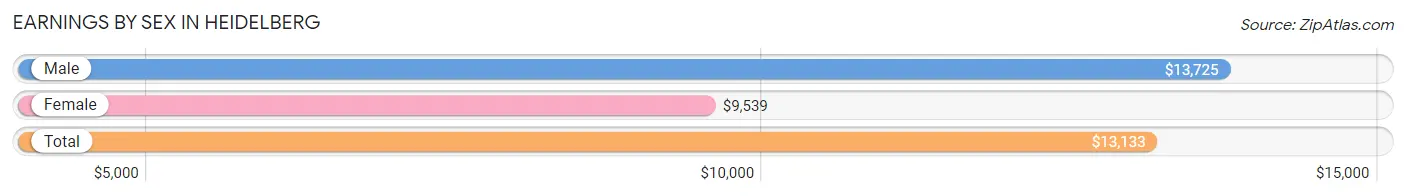
Earnings by Sex in Heidelberg
Average Earnings in Heidelberg are $13,133, $13,725 for men and $9,539 for women, a difference of 30.5%.
| Sex | Number | Average Earnings |
| Male | 416 (44.6%) | $13,725 |
| Female | 517 (55.4%) | $9,539 |
| Total | 933 (100.0%) | $13,133 |
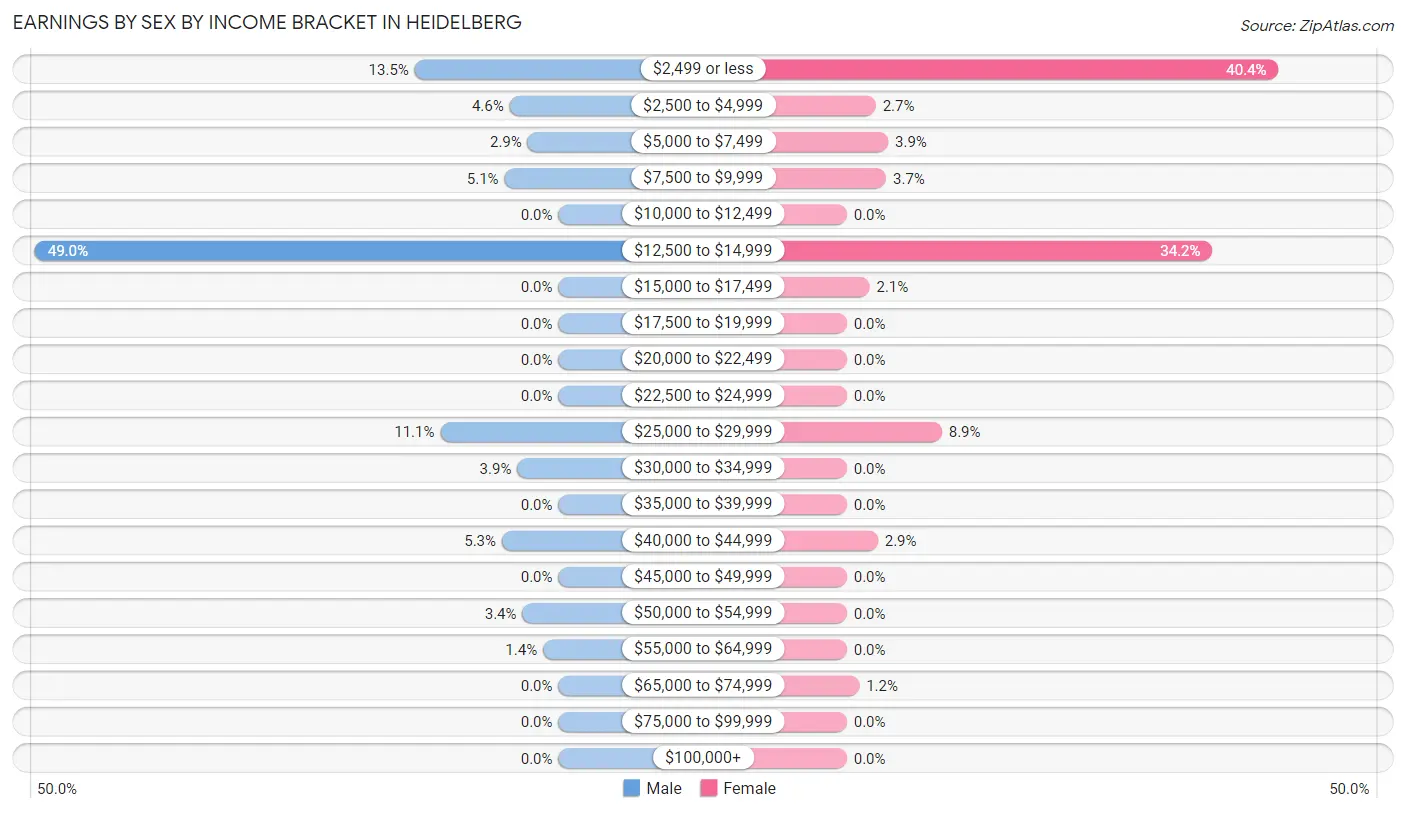
Earnings by Sex by Income Bracket in Heidelberg
The most common earnings brackets in Heidelberg are $12,500 to $14,999 for men (204 | 49.0%) and $2,499 or less for women (209 | 40.4%).
| Income | Male | Female |
| $2,499 or less | 56 (13.5%) | 209 (40.4%) |
| $2,500 to $4,999 | 19 (4.6%) | 14 (2.7%) |
| $5,000 to $7,499 | 12 (2.9%) | 20 (3.9%) |
| $7,500 to $9,999 | 21 (5.1%) | 19 (3.7%) |
| $10,000 to $12,499 | 0 (0.0%) | 0 (0.0%) |
| $12,500 to $14,999 | 204 (49.0%) | 177 (34.2%) |
| $15,000 to $17,499 | 0 (0.0%) | 11 (2.1%) |
| $17,500 to $19,999 | 0 (0.0%) | 0 (0.0%) |
| $20,000 to $22,499 | 0 (0.0%) | 0 (0.0%) |
| $22,500 to $24,999 | 0 (0.0%) | 0 (0.0%) |
| $25,000 to $29,999 | 46 (11.1%) | 46 (8.9%) |
| $30,000 to $34,999 | 16 (3.8%) | 0 (0.0%) |
| $35,000 to $39,999 | 0 (0.0%) | 0 (0.0%) |
| $40,000 to $44,999 | 22 (5.3%) | 15 (2.9%) |
| $45,000 to $49,999 | 0 (0.0%) | 0 (0.0%) |
| $50,000 to $54,999 | 14 (3.4%) | 0 (0.0%) |
| $55,000 to $64,999 | 6 (1.4%) | 0 (0.0%) |
| $65,000 to $74,999 | 0 (0.0%) | 6 (1.2%) |
| $75,000 to $99,999 | 0 (0.0%) | 0 (0.0%) |
| $100,000+ | 0 (0.0%) | 0 (0.0%) |
| Total | 416 (100.0%) | 517 (100.0%) |
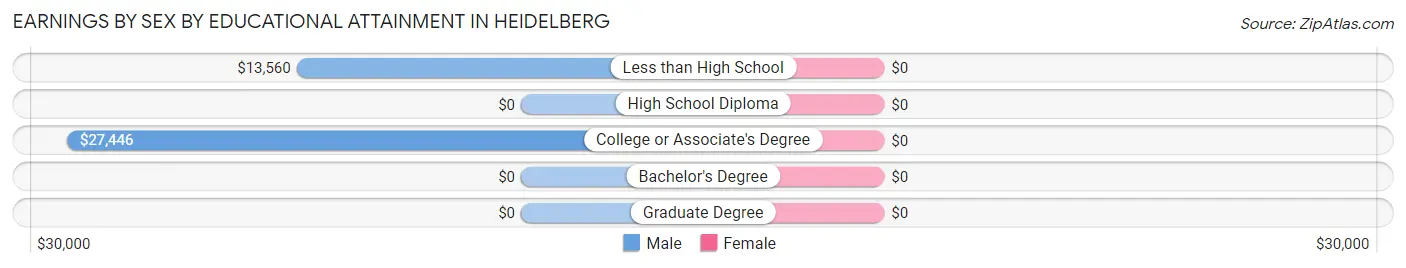
Earnings by Sex by Educational Attainment in Heidelberg
| Educational Attainment | Male Income | Female Income |
| Less than High School | $13,560 | $0 |
| High School Diploma | - | - |
| College or Associate's Degree | $27,446 | $0 |
| Bachelor's Degree | - | - |
| Graduate Degree | - | - |
| Total | - | - |
Family Income in Heidelberg
Family Income Brackets in Heidelberg
According to the Heidelberg family income data, there are 186 families falling into the $25,000 to $34,999 income range, which is the most common income bracket and makes up 52.5% of all families.
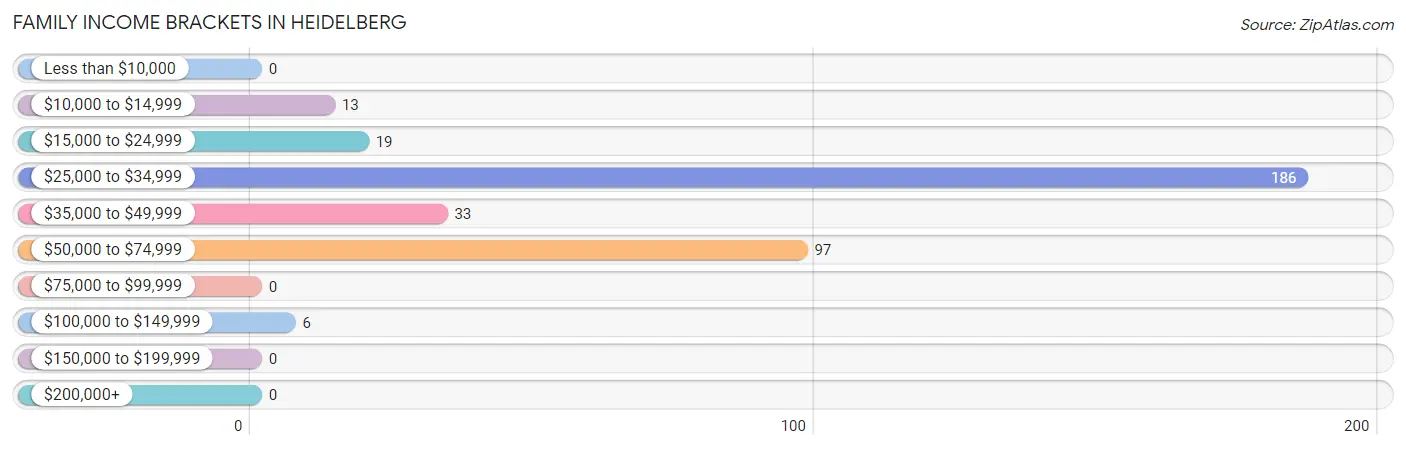
| Income Bracket | # Families | % Families |
| Less than $10,000 | 0 | 0.0% |
| $10,000 to $14,999 | 13 | 3.7% |
| $15,000 to $24,999 | 19 | 5.4% |
| $25,000 to $34,999 | 186 | 52.5% |
| $35,000 to $49,999 | 33 | 9.3% |
| $50,000 to $74,999 | 97 | 27.4% |
| $75,000 to $99,999 | 0 | 0.0% |
| $100,000 to $149,999 | 6 | 1.7% |
| $150,000 to $199,999 | 0 | 0.0% |
| $200,000+ | 0 | 0.0% |
Family Income by Famaliy Size in Heidelberg
4-person families (226 | 63.8%) account for the highest median family income in Heidelberg with $31,412 per family, while 4-person families (226 | 63.8%) have the highest median income of $7,853 per family member.
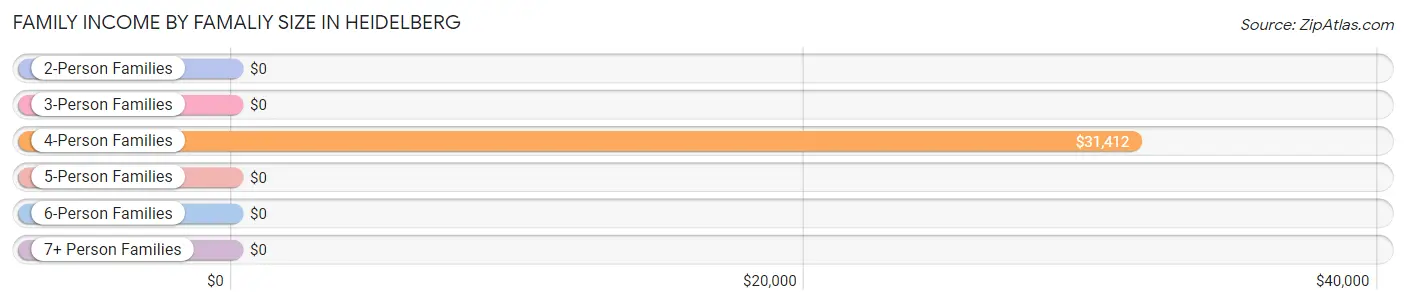
| Income Bracket | # Families | Median Income |
| 2-Person Families | 38 (10.7%) | $0 |
| 3-Person Families | 15 (4.2%) | $0 |
| 4-Person Families | 226 (63.8%) | $31,412 |
| 5-Person Families | 52 (14.7%) | $0 |
| 6-Person Families | 23 (6.5%) | $0 |
| 7+ Person Families | 0 (0.0%) | $0 |
| Total | 354 (100.0%) | $31,921 |
Family Income by Number of Earners in Heidelberg
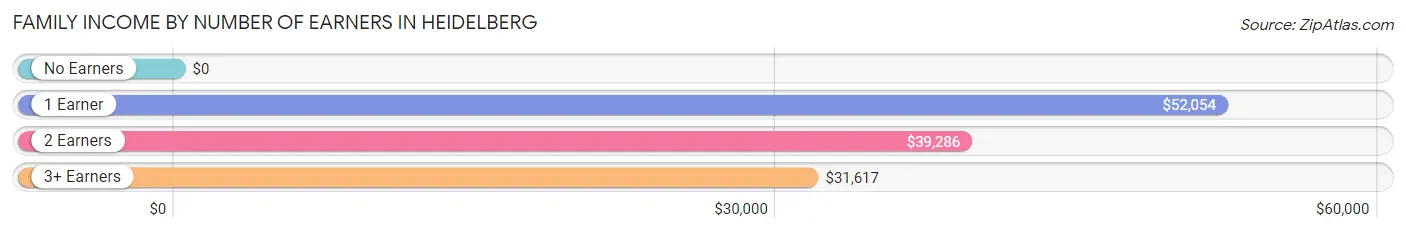
| Number of Earners | # Families | Median Income |
| No Earners | 38 (10.7%) | $0 |
| 1 Earner | 49 (13.8%) | $52,054 |
| 2 Earners | 38 (10.7%) | $39,286 |
| 3+ Earners | 229 (64.7%) | $31,617 |
| Total | 354 (100.0%) | $31,921 |
Household Income in Heidelberg
Household Income Brackets in Heidelberg
With 186 households falling in the category, the $25,000 to $34,999 income range is the most frequent in Heidelberg, accounting for 39.8% of all households.
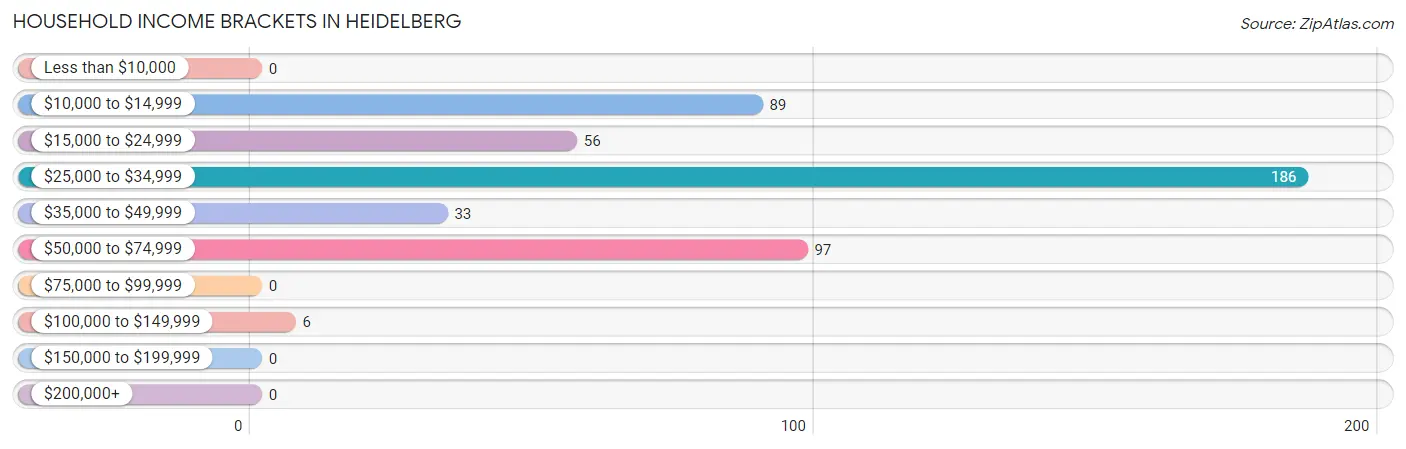
| Income Bracket | # Households | % Households |
| Less than $10,000 | 0 | 0.0% |
| $10,000 to $14,999 | 89 | 19.1% |
| $15,000 to $24,999 | 56 | 12.0% |
| $25,000 to $34,999 | 186 | 39.8% |
| $35,000 to $49,999 | 33 | 7.1% |
| $50,000 to $74,999 | 97 | 20.8% |
| $75,000 to $99,999 | 0 | 0.0% |
| $100,000 to $149,999 | 6 | 1.3% |
| $150,000 to $199,999 | 0 | 0.0% |
| $200,000+ | 0 | 0.0% |
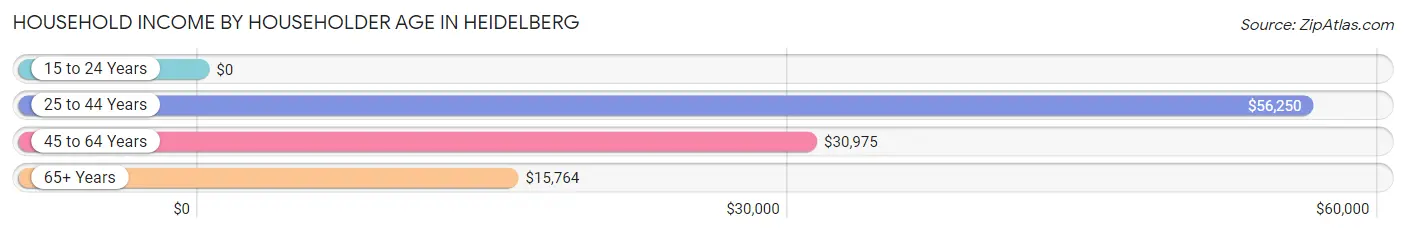
Household Income by Householder Age in Heidelberg
The median household income in Heidelberg is $31,123, with the highest median household income of $56,250 found in the 25 to 44 years age bracket for the primary householder. A total of 102 households (21.8%) fall into this category.
| Income Bracket | # Households | Median Income |
| 15 to 24 Years | 0 (0.0%) | $0 |
| 25 to 44 Years | 102 (21.8%) | $56,250 |
| 45 to 64 Years | 246 (52.7%) | $30,975 |
| 65+ Years | 119 (25.5%) | $15,764 |
| Total | 467 (100.0%) | $31,123 |
Poverty in Heidelberg
Income Below Poverty by Sex and Age in Heidelberg
With 20.8% poverty level for males and 24.9% for females among the residents of Heidelberg, 12 to 14 year old males and under 5 year old females are the most vulnerable to poverty, with 16 males (100.0%) and 18 females (100.0%) in their respective age groups living below the poverty level.
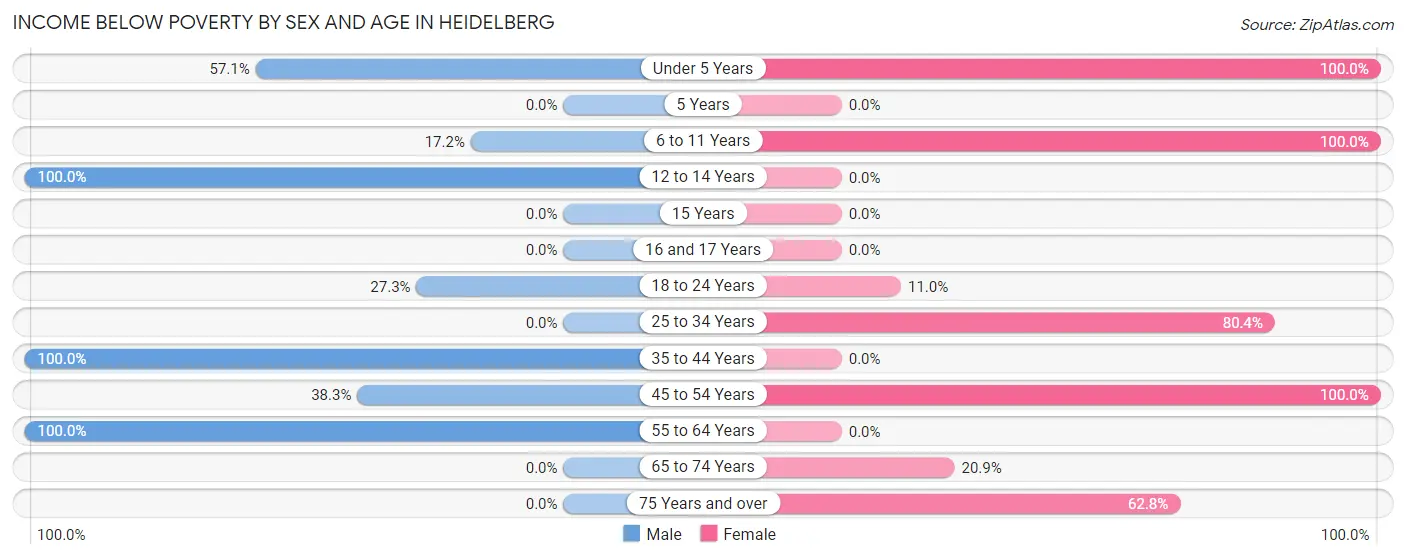
| Age Bracket | Male | Female |
| Under 5 Years | 32 (57.1%) | 18 (100.0%) |
| 5 Years | 0 (0.0%) | 0 (0.0%) |
| 6 to 11 Years | 11 (17.2%) | 25 (100.0%) |
| 12 to 14 Years | 16 (100.0%) | 0 (0.0%) |
| 15 Years | 0 (0.0%) | 0 (0.0%) |
| 16 and 17 Years | 0 (0.0%) | 0 (0.0%) |
| 18 to 24 Years | 21 (27.3%) | 33 (11.0%) |
| 25 to 34 Years | 0 (0.0%) | 45 (80.4%) |
| 35 to 44 Years | 28 (100.0%) | 0 (0.0%) |
| 45 to 54 Years | 44 (38.3%) | 32 (100.0%) |
| 55 to 64 Years | 22 (100.0%) | 0 (0.0%) |
| 65 to 74 Years | 0 (0.0%) | 9 (20.9%) |
| 75 Years and over | 0 (0.0%) | 54 (62.8%) |
| Total | 174 (20.8%) | 216 (24.9%) |
Income Above Poverty by Sex and Age in Heidelberg
According to the poverty statistics in Heidelberg, males aged 16 and 17 years and females aged 5 years are the age groups that are most secure financially, with 100.0% of males and 100.0% of females in these age groups living above the poverty line.
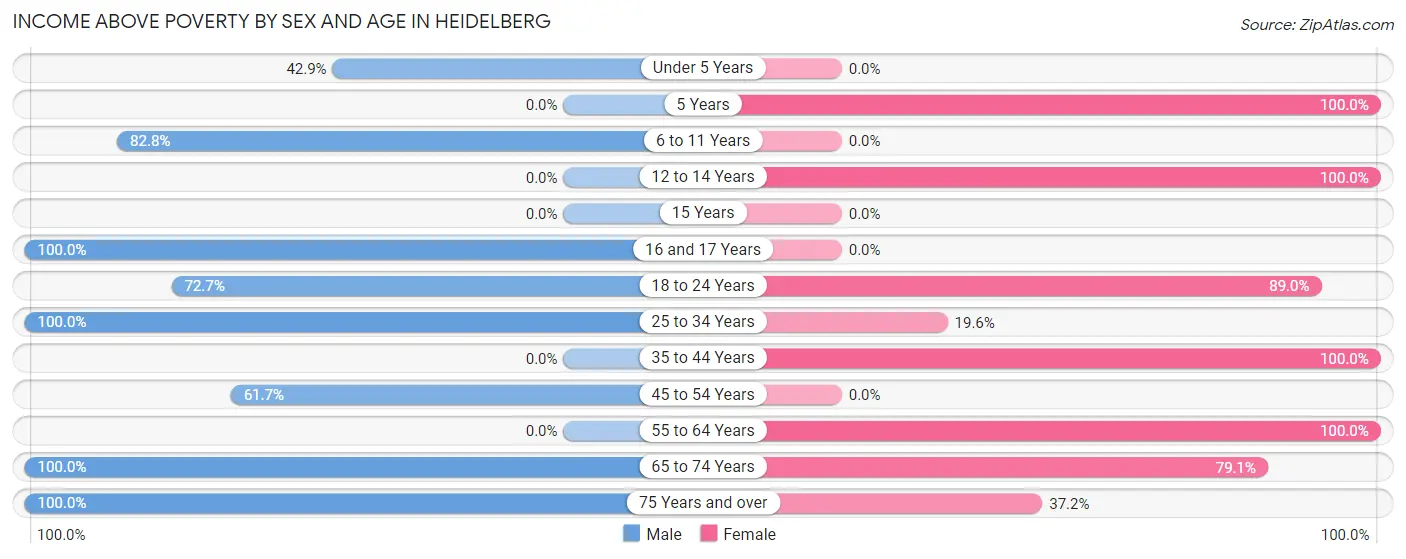
| Age Bracket | Male | Female |
| Under 5 Years | 24 (42.9%) | 0 (0.0%) |
| 5 Years | 0 (0.0%) | 12 (100.0%) |
| 6 to 11 Years | 53 (82.8%) | 0 (0.0%) |
| 12 to 14 Years | 0 (0.0%) | 51 (100.0%) |
| 15 Years | 0 (0.0%) | 0 (0.0%) |
| 16 and 17 Years | 6 (100.0%) | 0 (0.0%) |
| 18 to 24 Years | 56 (72.7%) | 267 (89.0%) |
| 25 to 34 Years | 396 (100.0%) | 11 (19.6%) |
| 35 to 44 Years | 0 (0.0%) | 52 (100.0%) |
| 45 to 54 Years | 71 (61.7%) | 0 (0.0%) |
| 55 to 64 Years | 0 (0.0%) | 192 (100.0%) |
| 65 to 74 Years | 37 (100.0%) | 34 (79.1%) |
| 75 Years and over | 19 (100.0%) | 32 (37.2%) |
| Total | 662 (79.2%) | 651 (75.1%) |
Income Below Poverty Among Married-Couple Families in Heidelberg
The poverty statistics for married-couple families in Heidelberg show that 20.6% or 27 of the total 131 families live below the poverty line. Families with 3 or 4 children have the highest poverty rate of 100.0%, comprising of 14 families. On the other hand, families with 1 or 2 children have the lowest poverty rate of 0.0%, which includes 0 families.
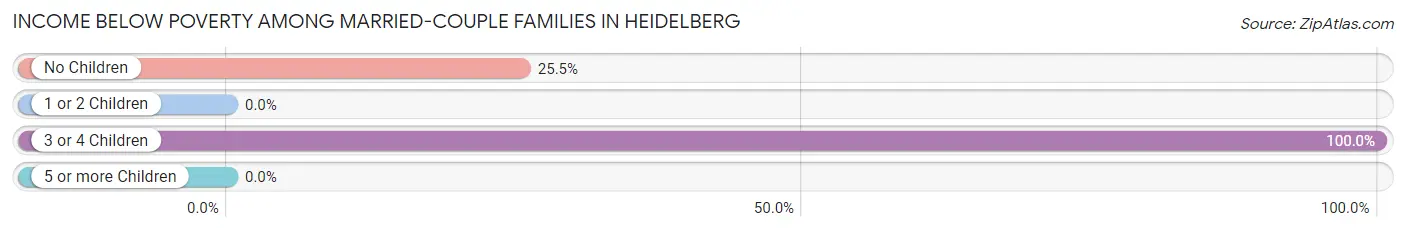
| Children | Above Poverty | Below Poverty |
| No Children | 38 (74.5%) | 13 (25.5%) |
| 1 or 2 Children | 66 (100.0%) | 0 (0.0%) |
| 3 or 4 Children | 0 (0.0%) | 14 (100.0%) |
| 5 or more Children | 0 (0.0%) | 0 (0.0%) |
| Total | 104 (79.4%) | 27 (20.6%) |
Income Below Poverty Among Single-Parent Households in Heidelberg
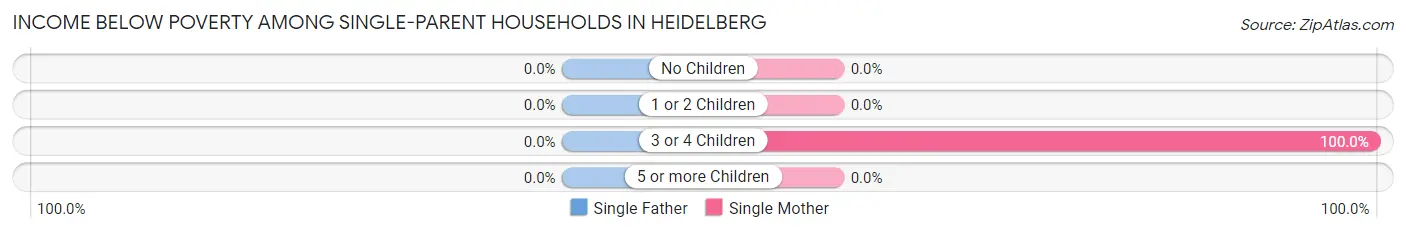
| Children | Single Father | Single Mother |
| No Children | 0 (0.0%) | 0 (0.0%) |
| 1 or 2 Children | 0 (0.0%) | 0 (0.0%) |
| 3 or 4 Children | 0 (0.0%) | 9 (100.0%) |
| 5 or more Children | 0 (0.0%) | 0 (0.0%) |
| Total | 0 (0.0%) | 9 (4.5%) |
Income Below Poverty Among Married-Couple vs Single-Parent Households in Heidelberg
The poverty data for Heidelberg shows that 27 of the married-couple family households (20.6%) and 9 of the single-parent households (4.0%) are living below the poverty level. Within the married-couple family households, those with 3 or 4 children have the highest poverty rate, with 14 households (100.0%) falling below the poverty line. Among the single-parent households, those with 3 or 4 children have the highest poverty rate, with 9 household (29.0%) living below poverty.
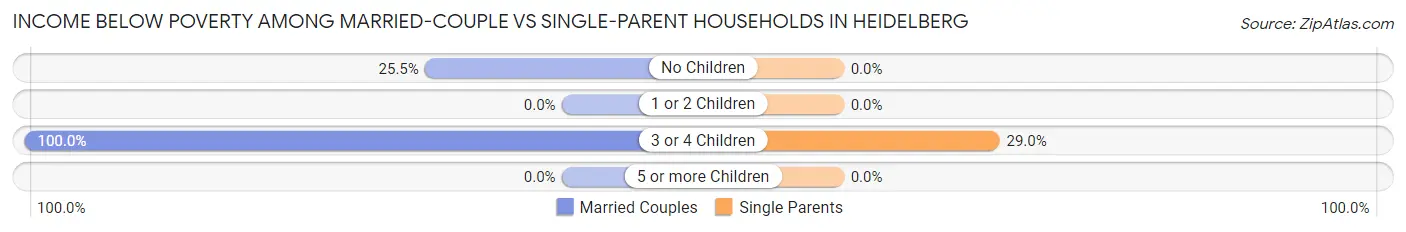
| Children | Married-Couple Families | Single-Parent Households |
| No Children | 13 (25.5%) | 0 (0.0%) |
| 1 or 2 Children | 0 (0.0%) | 0 (0.0%) |
| 3 or 4 Children | 14 (100.0%) | 9 (29.0%) |
| 5 or more Children | 0 (0.0%) | 0 (0.0%) |
| Total | 27 (20.6%) | 9 (4.0%) |
Race in Heidelberg
The most populous races in Heidelberg are Hispanic or Latino (1,703 | 100.0%), Two or more Races (1,024 | 60.1%), and White / Caucasian (586 | 34.4%).
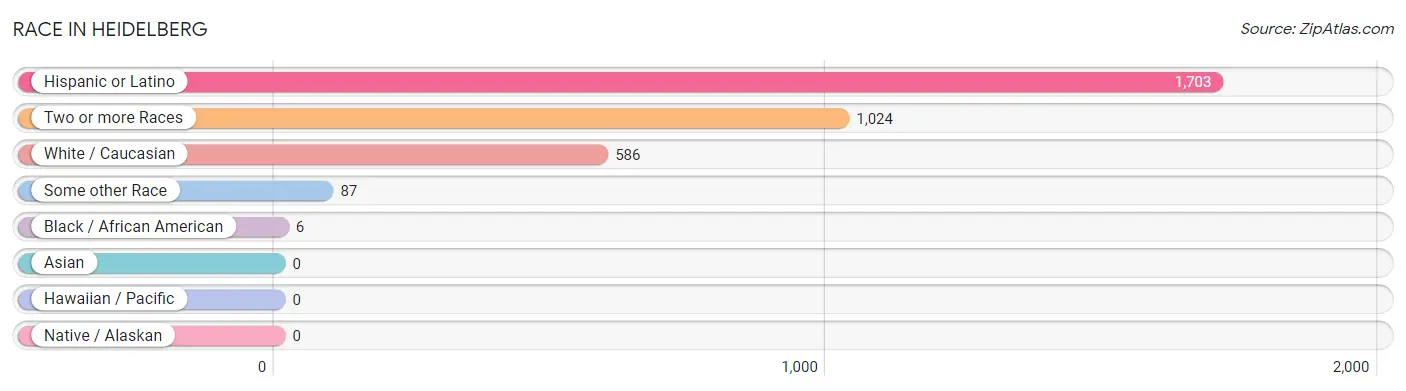
| Race | # Population | % Population |
| Asian | 0 | 0.0% |
| Black / African American | 6 | 0.4% |
| Hawaiian / Pacific | 0 | 0.0% |
| Hispanic or Latino | 1,703 | 100.0% |
| Native / Alaskan | 0 | 0.0% |
| White / Caucasian | 586 | 34.4% |
| Two or more Races | 1,024 | 60.1% |
| Some other Race | 87 | 5.1% |
| Total | 1,703 | 100.0% |
Ancestry in Heidelberg
The most populous ancestries reported in Heidelberg are Mexican (1,684 | 98.9%), and Puerto Rican (19 | 1.1%), together accounting for 100.0% of all Heidelberg residents.
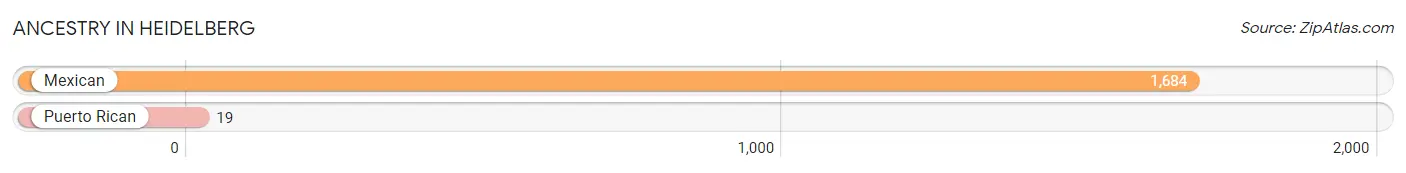
| Ancestry | # Population | % Population |
| Mexican | 1,684 | 98.9% |
| Puerto Rican | 19 | 1.1% | View All 2 Rows |
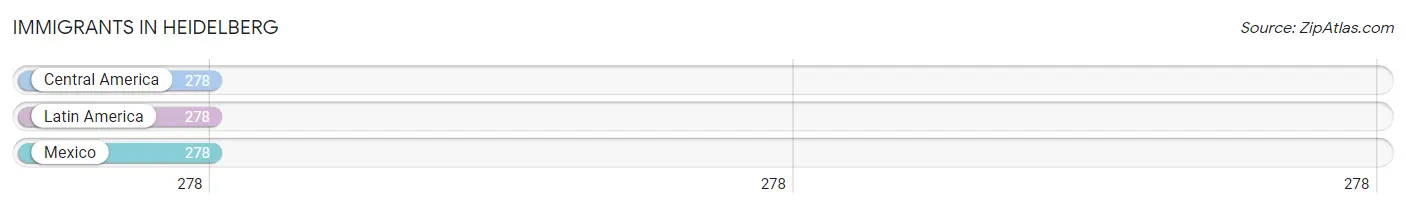
Immigrants in Heidelberg
The most numerous immigrant groups reported in Heidelberg came from Central America (278 | 16.3%), Latin America (278 | 16.3%), and Mexico (278 | 16.3%), together accounting for 49.0% of all Heidelberg residents.
| Immigration Origin | # Population | % Population |
| Central America | 278 | 16.3% |
| Latin America | 278 | 16.3% |
| Mexico | 278 | 16.3% | View All 3 Rows |
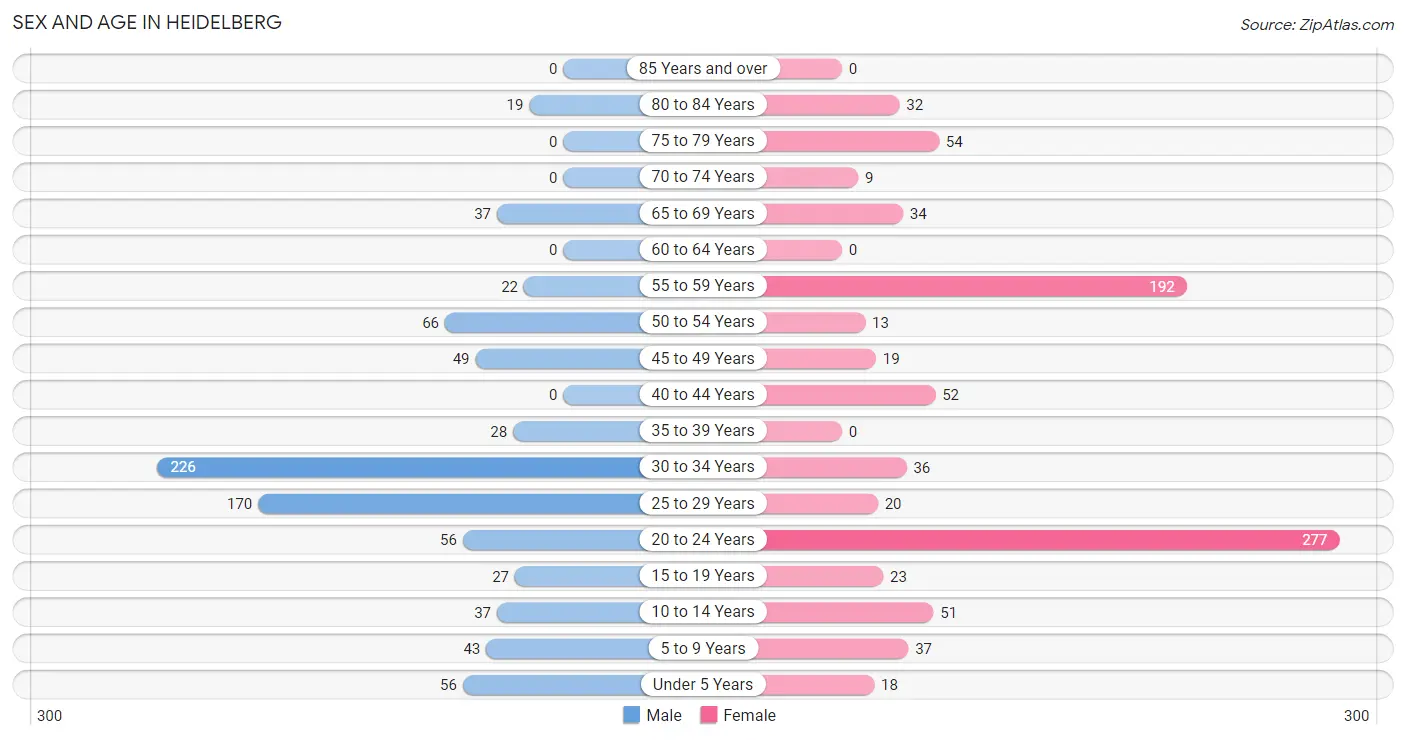
Sex and Age in Heidelberg
Sex and Age in Heidelberg
The most populous age groups in Heidelberg are 30 to 34 Years (226 | 27.0%) for men and 20 to 24 Years (277 | 32.0%) for women.
| Age Bracket | Male | Female |
| Under 5 Years | 56 (6.7%) | 18 (2.1%) |
| 5 to 9 Years | 43 (5.1%) | 37 (4.3%) |
| 10 to 14 Years | 37 (4.4%) | 51 (5.9%) |
| 15 to 19 Years | 27 (3.2%) | 23 (2.6%) |
| 20 to 24 Years | 56 (6.7%) | 277 (32.0%) |
| 25 to 29 Years | 170 (20.3%) | 20 (2.3%) |
| 30 to 34 Years | 226 (27.0%) | 36 (4.2%) |
| 35 to 39 Years | 28 (3.4%) | 0 (0.0%) |
| 40 to 44 Years | 0 (0.0%) | 52 (6.0%) |
| 45 to 49 Years | 49 (5.9%) | 19 (2.2%) |
| 50 to 54 Years | 66 (7.9%) | 13 (1.5%) |
| 55 to 59 Years | 22 (2.6%) | 192 (22.2%) |
| 60 to 64 Years | 0 (0.0%) | 0 (0.0%) |
| 65 to 69 Years | 37 (4.4%) | 34 (3.9%) |
| 70 to 74 Years | 0 (0.0%) | 9 (1.0%) |
| 75 to 79 Years | 0 (0.0%) | 54 (6.2%) |
| 80 to 84 Years | 19 (2.3%) | 32 (3.7%) |
| 85 Years and over | 0 (0.0%) | 0 (0.0%) |
| Total | 836 (100.0%) | 867 (100.0%) |
Families and Households in Heidelberg
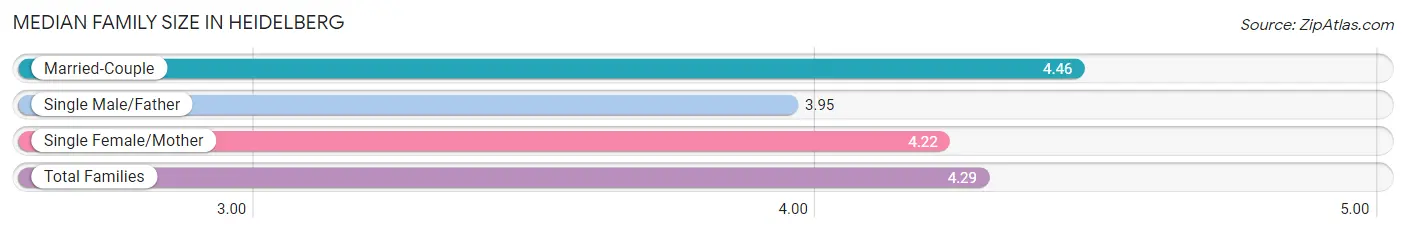
Median Family Size in Heidelberg
The median family size in Heidelberg is 4.29 persons per family, with married-couple families (131 | 37.0%) accounting for the largest median family size of 4.46 persons per family. On the other hand, single male/father families (22 | 6.2%) represent the smallest median family size with 3.95 persons per family.
| Family Type | # Families | Family Size |
| Married-Couple | 131 (37.0%) | 4.46 |
| Single Male/Father | 22 (6.2%) | 3.95 |
| Single Female/Mother | 201 (56.8%) | 4.22 |
| Total Families | 354 (100.0%) | 4.29 |
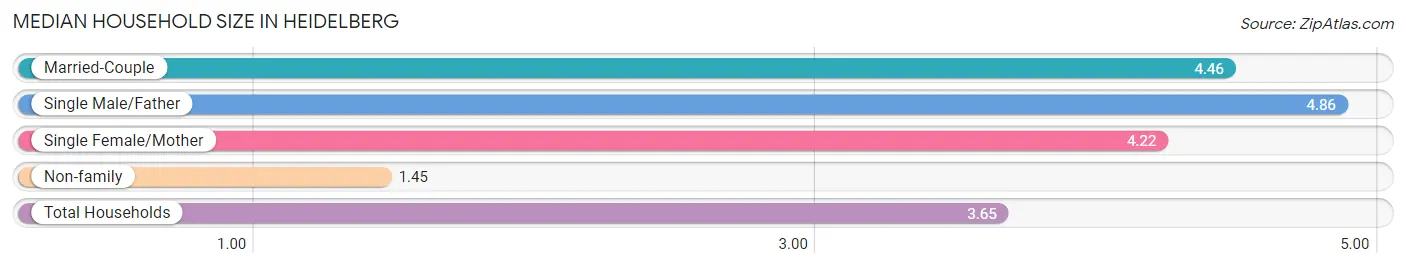
Median Household Size in Heidelberg
The median household size in Heidelberg is 3.65 persons per household, with single male/father households (22 | 4.7%) accounting for the largest median household size of 4.86 persons per household. non-family households (113 | 24.2%) represent the smallest median household size with 1.45 persons per household.
| Household Type | # Households | Household Size |
| Married-Couple | 131 (28.1%) | 4.46 |
| Single Male/Father | 22 (4.7%) | 4.86 |
| Single Female/Mother | 201 (43.0%) | 4.22 |
| Non-family | 113 (24.2%) | 1.45 |
| Total Households | 467 (100.0%) | 3.65 |
Household Size by Marriage Status in Heidelberg
Out of a total of 467 households in Heidelberg, 354 (75.8%) are family households, while 113 (24.2%) are nonfamily households. The most numerous type of family households are 4-person households, comprising 204, and the most common type of nonfamily households are 1-person households, comprising 94.
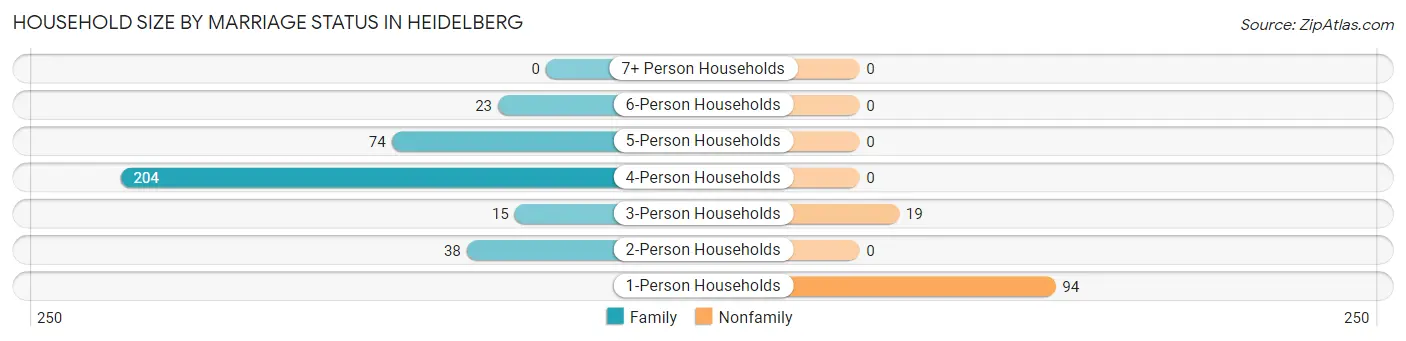
| Household Size | Family Households | Nonfamily Households |
| 1-Person Households | - | 94 (20.1%) |
| 2-Person Households | 38 (8.1%) | 0 (0.0%) |
| 3-Person Households | 15 (3.2%) | 19 (4.1%) |
| 4-Person Households | 204 (43.7%) | 0 (0.0%) |
| 5-Person Households | 74 (15.9%) | 0 (0.0%) |
| 6-Person Households | 23 (4.9%) | 0 (0.0%) |
| 7+ Person Households | 0 (0.0%) | 0 (0.0%) |
| Total | 354 (75.8%) | 113 (24.2%) |
Female Fertility in Heidelberg
Fertility by Age in Heidelberg
Average fertility rate in Heidelberg is 80.0 births per 1,000 women. Women in the age bracket of 20 to 34 years have the highest fertility rate with 102.0 births per 1,000 women. Women in the age bracket of 20 to 34 years acount for 100.0% of all women with births.
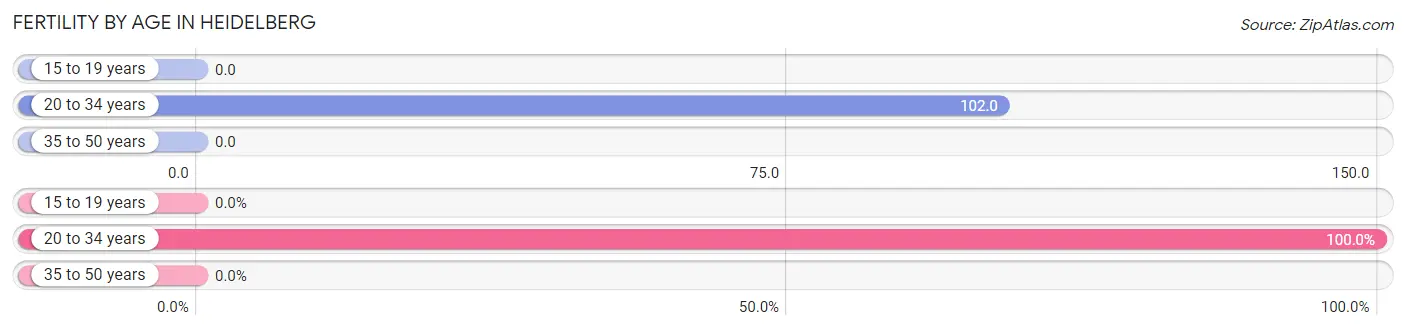
| Age Bracket | Women with Births | Births / 1,000 Women |
| 15 to 19 years | 0 (0.0%) | 0.0 |
| 20 to 34 years | 34 (100.0%) | 102.0 |
| 35 to 50 years | 0 (0.0%) | 0.0 |
| Total | 34 (100.0%) | 80.0 |
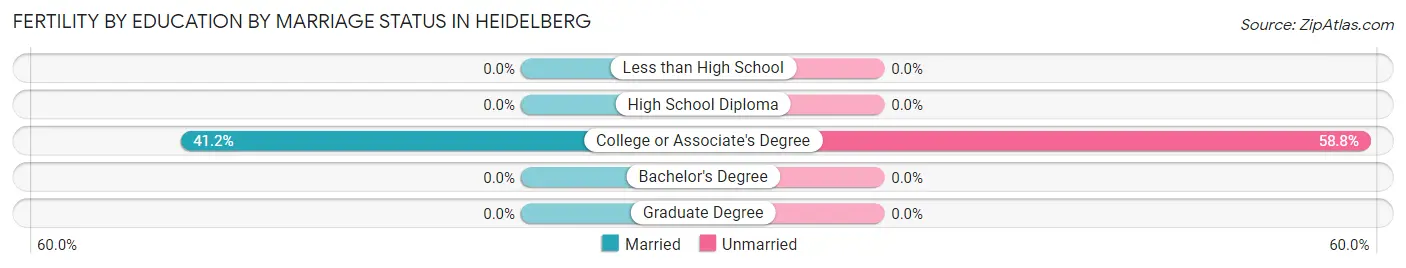
Fertility by Age by Marriage Status in Heidelberg
41.2% of women with births (34) in Heidelberg are married. The highest percentage of unmarried women with births falls into 20 to 34 years age bracket with 58.8% of them unmarried at the time of birth, while the lowest percentage of unmarried women with births belong to 20 to 34 years age bracket with 58.8% of them unmarried.
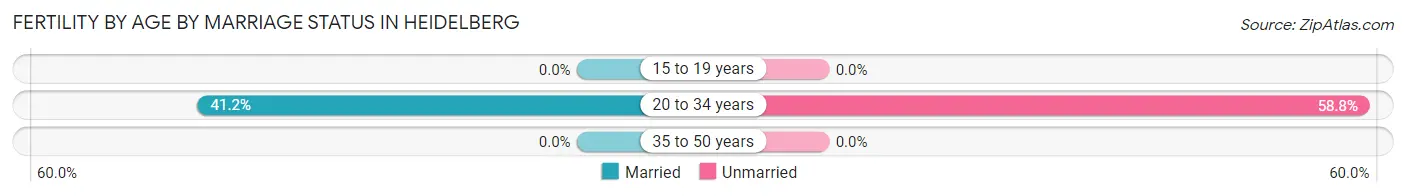
| Age Bracket | Married | Unmarried |
| 15 to 19 years | 0 (0.0%) | 0 (0.0%) |
| 20 to 34 years | 14 (41.2%) | 20 (58.8%) |
| 35 to 50 years | 0 (0.0%) | 0 (0.0%) |
| Total | 14 (41.2%) | 20 (58.8%) |
Fertility by Education in Heidelberg
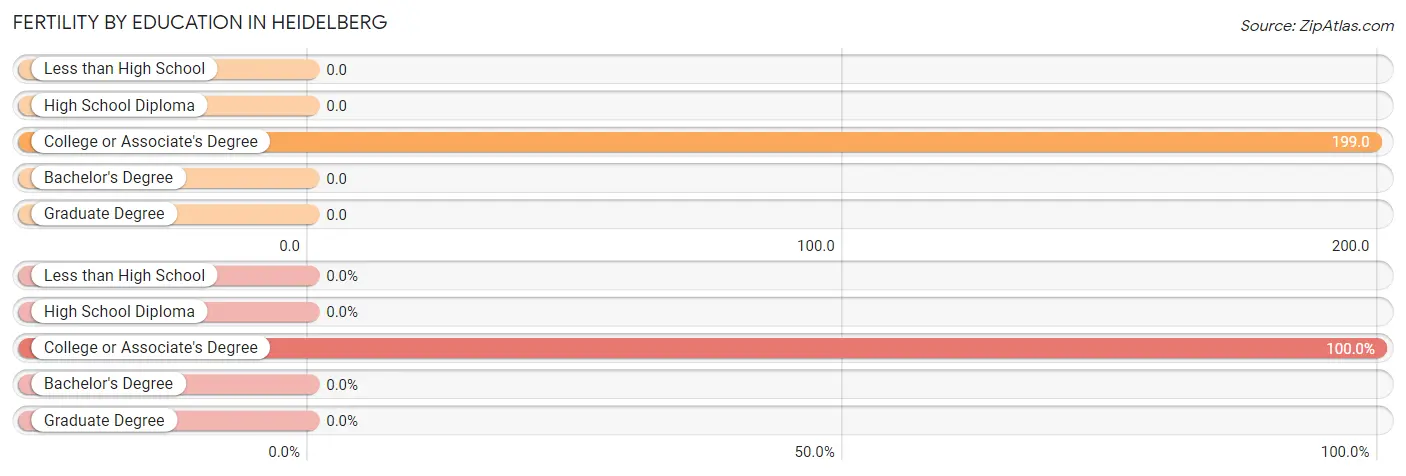
| Educational Attainment | Women with Births | Births / 1,000 Women |
| Less than High School | 0 (0.0%) | 0.0 |
| High School Diploma | 0 (0.0%) | 0.0 |
| College or Associate's Degree | 34 (100.0%) | 199.0 |
| Bachelor's Degree | 0 (0.0%) | 0.0 |
| Graduate Degree | 0 (0.0%) | 0.0 |
| Total | 34 (100.0%) | 80.0 |
Fertility by Education by Marriage Status in Heidelberg
58.8% of women with births in Heidelberg are unmarried. Women with the educational attainment of college or associate's degree are most likely to be married with 41.2% of them married at childbirth, while women with the educational attainment of college or associate's degree are least likely to be married with 58.8% of them unmarried at childbirth.
| Educational Attainment | Married | Unmarried |
| Less than High School | 0 (0.0%) | 0 (0.0%) |
| High School Diploma | 0 (0.0%) | 0 (0.0%) |
| College or Associate's Degree | 14 (41.2%) | 20 (58.8%) |
| Bachelor's Degree | 0 (0.0%) | 0 (0.0%) |
| Graduate Degree | 0 (0.0%) | 0 (0.0%) |
| Total | 14 (41.2%) | 20 (58.8%) |
Employment Characteristics in Heidelberg
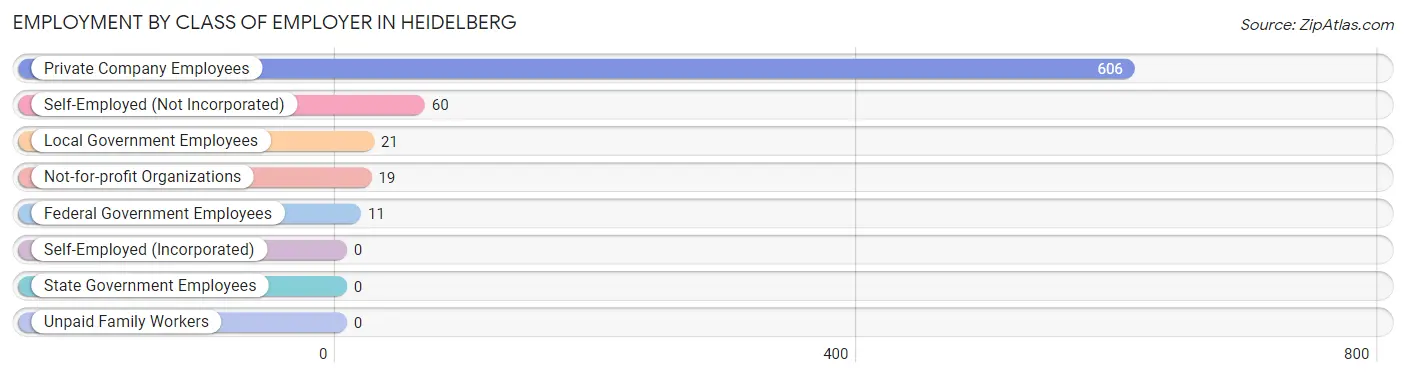
Employment by Class of Employer in Heidelberg
Among the 717 employed individuals in Heidelberg, private company employees (606 | 84.5%), self-employed (not incorporated) (60 | 8.4%), and local government employees (21 | 2.9%) make up the most common classes of employment.
| Employer Class | # Employees | % Employees |
| Private Company Employees | 606 | 84.5% |
| Self-Employed (Incorporated) | 0 | 0.0% |
| Self-Employed (Not Incorporated) | 60 | 8.4% |
| Not-for-profit Organizations | 19 | 2.6% |
| Local Government Employees | 21 | 2.9% |
| State Government Employees | 0 | 0.0% |
| Federal Government Employees | 11 | 1.5% |
| Unpaid Family Workers | 0 | 0.0% |
| Total | 717 | 100.0% |
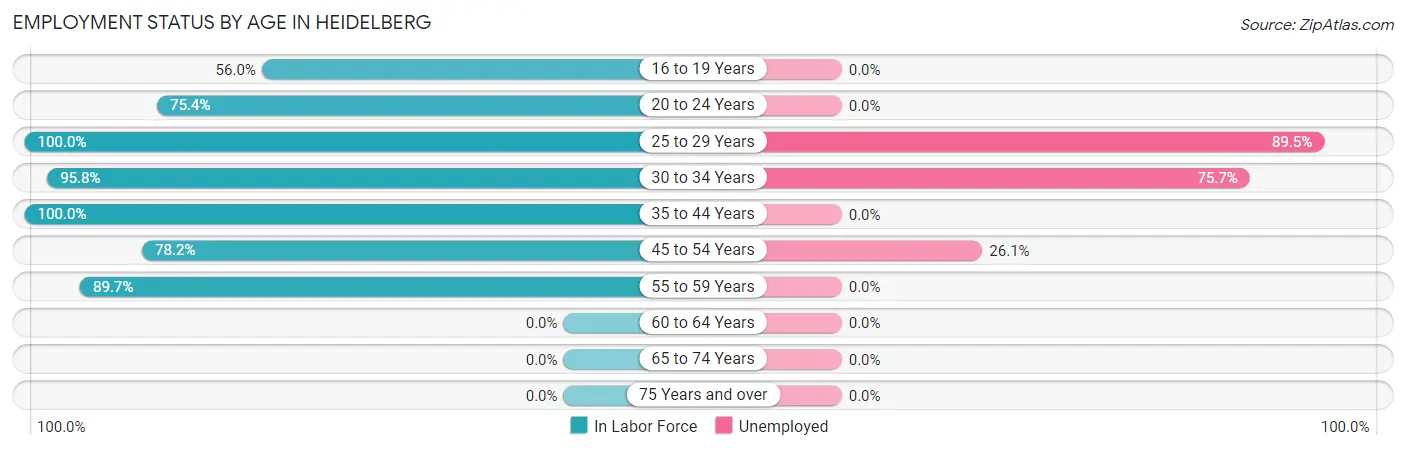
Employment Status by Age in Heidelberg
According to the labor force statistics for Heidelberg, out of the total population over 16 years of age (1,461), 75.8% or 1,107 individuals are in the labor force, with 35.2% or 390 of them unemployed. The age group with the highest labor force participation rate is 25 to 29 years, with 100.0% or 190 individuals in the labor force. Within the labor force, the 25 to 29 years age range has the highest percentage of unemployed individuals, with 89.5% or 170 of them being unemployed.
| Age Bracket | In Labor Force | Unemployed |
| 16 to 19 Years | 28 (56.0%) | 0 (0.0%) |
| 20 to 24 Years | 251 (75.4%) | 0 (0.0%) |
| 25 to 29 Years | 190 (100.0%) | 170 (89.5%) |
| 30 to 34 Years | 251 (95.8%) | 190 (75.7%) |
| 35 to 44 Years | 80 (100.0%) | 0 (0.0%) |
| 45 to 54 Years | 115 (78.2%) | 30 (26.1%) |
| 55 to 59 Years | 192 (89.7%) | 0 (0.0%) |
| 60 to 64 Years | 0 (0.0%) | 0 (0.0%) |
| 65 to 74 Years | 0 (0.0%) | 0 (0.0%) |
| 75 Years and over | 0 (0.0%) | 0 (0.0%) |
| Total | 1,107 (75.8%) | 390 (35.2%) |
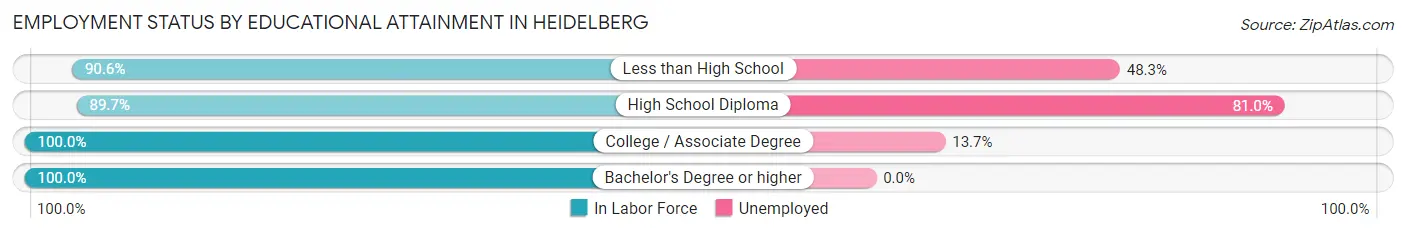
Employment Status by Educational Attainment in Heidelberg
According to labor force statistics for Heidelberg, 92.7% of individuals (828) out of the total population between 25 and 64 years of age (893) are in the labor force, with 47.1% or 390 of them being unemployed. The group with the highest labor force participation rate are those with the educational attainment of college / associate degree, with 100.0% or 219 individuals in the labor force. Within the labor force, individuals with high school diploma education have the highest percentage of unemployment, with 81.0% or 170 of them being unemployed.
| Educational Attainment | In Labor Force | Unemployed |
| Less than High School | 393 (90.6%) | 210 (48.3%) |
| High School Diploma | 210 (89.7%) | 190 (81.0%) |
| College / Associate Degree | 219 (100.0%) | 30 (13.7%) |
| Bachelor's Degree or higher | 6 (100.0%) | 0 (0.0%) |
| Total | 828 (92.7%) | 421 (47.1%) |
Employment Occupations by Sex in Heidelberg
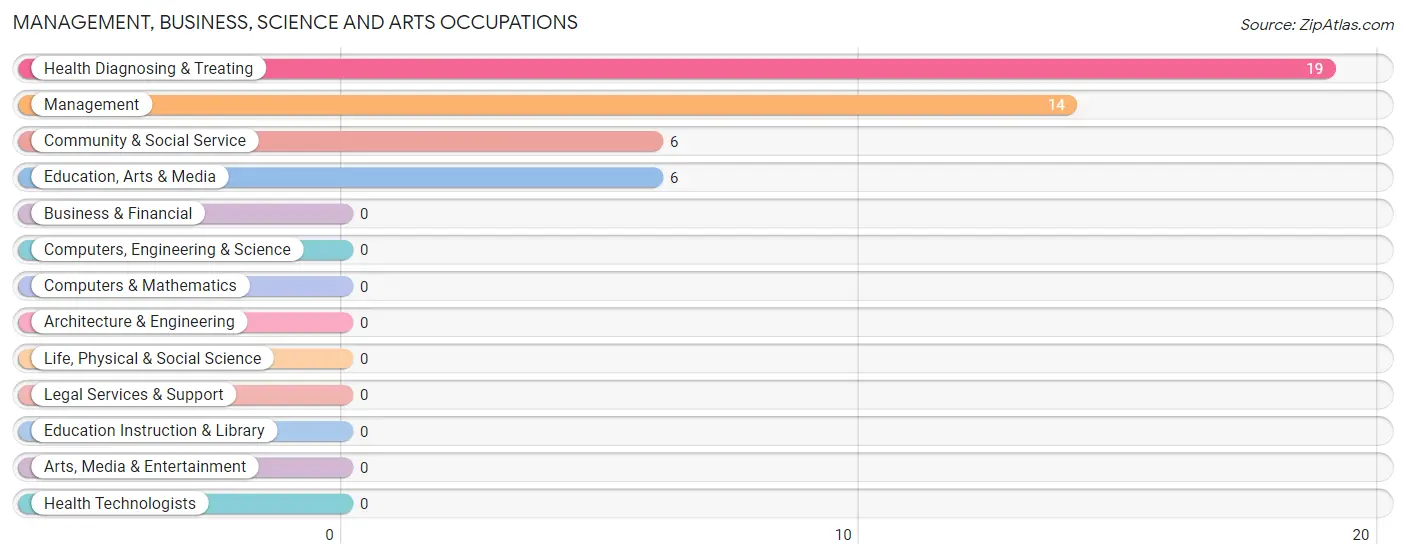
Management, Business, Science and Arts Occupations
The most common Management, Business, Science and Arts occupations in Heidelberg are Health Diagnosing & Treating (19 | 2.6%), Management (14 | 1.9%), Community & Social Service (6 | 0.8%), and Education, Arts & Media (6 | 0.8%).
Management, Business, Science and Arts Occupations by Sex
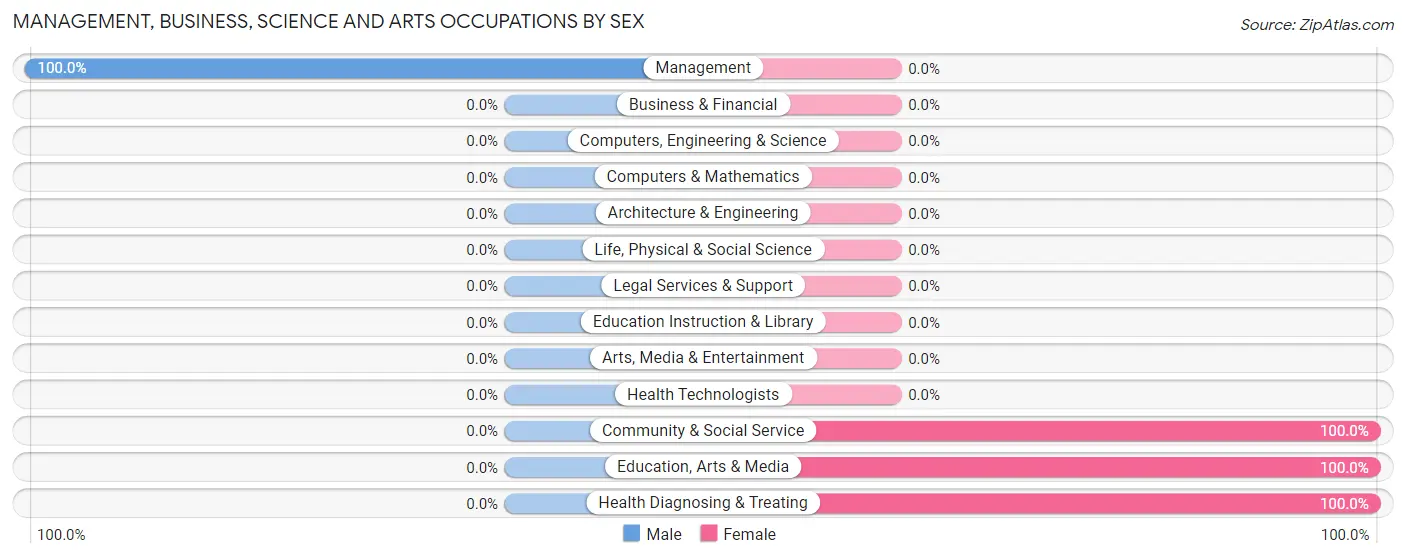
| Occupation | Male | Female |
| Management | 14 (100.0%) | 0 (0.0%) |
| Business & Financial | 0 (0.0%) | 0 (0.0%) |
| Computers, Engineering & Science | 0 (0.0%) | 0 (0.0%) |
| Computers & Mathematics | 0 (0.0%) | 0 (0.0%) |
| Architecture & Engineering | 0 (0.0%) | 0 (0.0%) |
| Life, Physical & Social Science | 0 (0.0%) | 0 (0.0%) |
| Community & Social Service | 0 (0.0%) | 6 (100.0%) |
| Education, Arts & Media | 0 (0.0%) | 6 (100.0%) |
| Legal Services & Support | 0 (0.0%) | 0 (0.0%) |
| Education Instruction & Library | 0 (0.0%) | 0 (0.0%) |
| Arts, Media & Entertainment | 0 (0.0%) | 0 (0.0%) |
| Health Diagnosing & Treating | 0 (0.0%) | 19 (100.0%) |
| Health Technologists | 0 (0.0%) | 0 (0.0%) |
| Total (Category) | 14 (35.9%) | 25 (64.1%) |
| Total (Overall) | 207 (28.9%) | 510 (71.1%) |
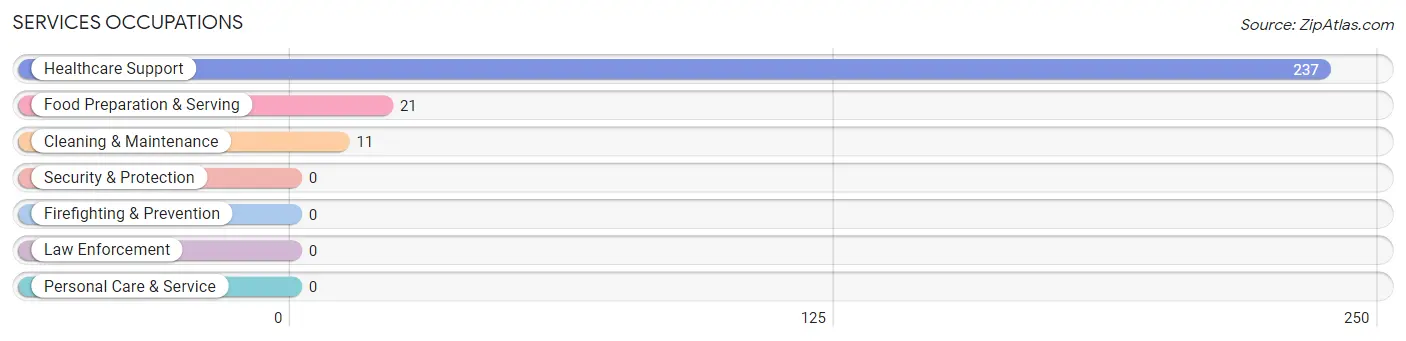
Services Occupations
The most common Services occupations in Heidelberg are Healthcare Support (237 | 33.1%), Food Preparation & Serving (21 | 2.9%), and Cleaning & Maintenance (11 | 1.5%).
Services Occupations by Sex
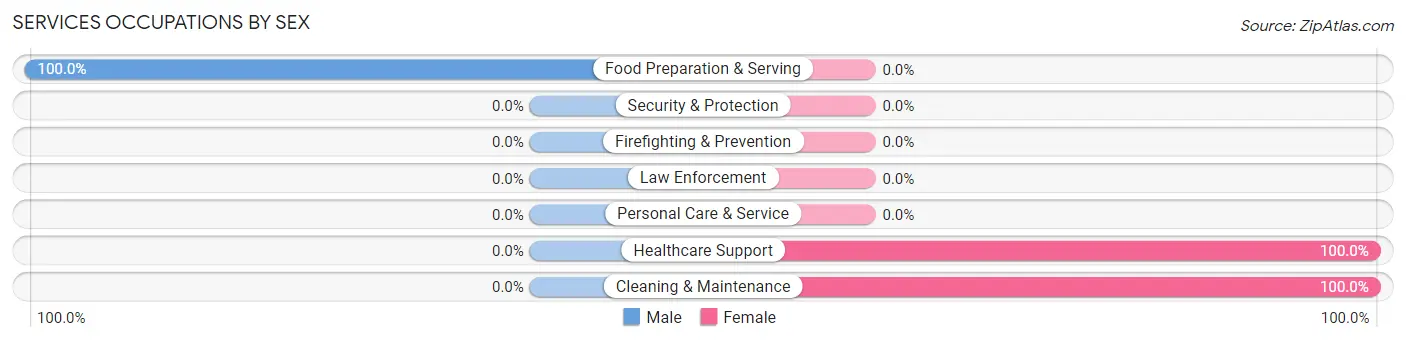
| Occupation | Male | Female |
| Healthcare Support | 0 (0.0%) | 237 (100.0%) |
| Security & Protection | 0 (0.0%) | 0 (0.0%) |
| Firefighting & Prevention | 0 (0.0%) | 0 (0.0%) |
| Law Enforcement | 0 (0.0%) | 0 (0.0%) |
| Food Preparation & Serving | 21 (100.0%) | 0 (0.0%) |
| Cleaning & Maintenance | 0 (0.0%) | 11 (100.0%) |
| Personal Care & Service | 0 (0.0%) | 0 (0.0%) |
| Total (Category) | 21 (7.8%) | 248 (92.2%) |
| Total (Overall) | 207 (28.9%) | 510 (71.1%) |
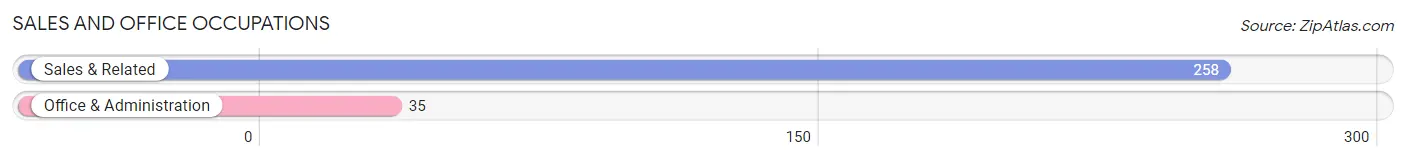
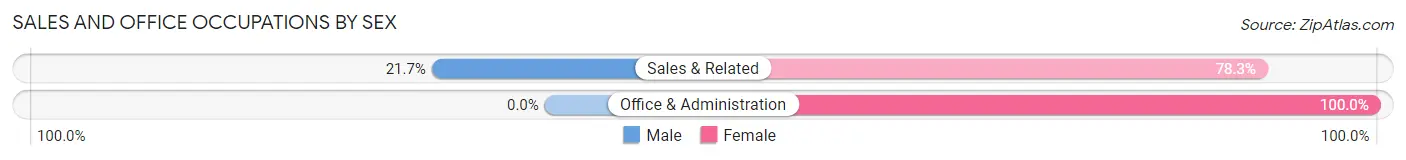
Sales and Office Occupations
The most common Sales and Office occupations in Heidelberg are Sales & Related (258 | 36.0%), and Office & Administration (35 | 4.9%).
Sales and Office Occupations by Sex
| Occupation | Male | Female |
| Sales & Related | 56 (21.7%) | 202 (78.3%) |
| Office & Administration | 0 (0.0%) | 35 (100.0%) |
| Total (Category) | 56 (19.1%) | 237 (80.9%) |
| Total (Overall) | 207 (28.9%) | 510 (71.1%) |
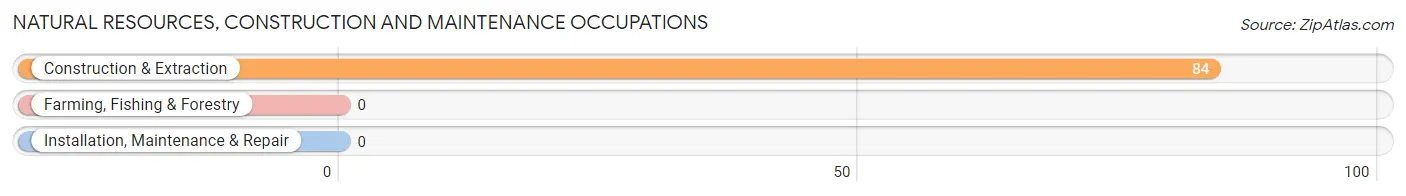
Natural Resources, Construction and Maintenance Occupations
The most common Natural Resources, Construction and Maintenance occupations in Heidelberg are , and Construction & Extraction (84 | 11.7%).
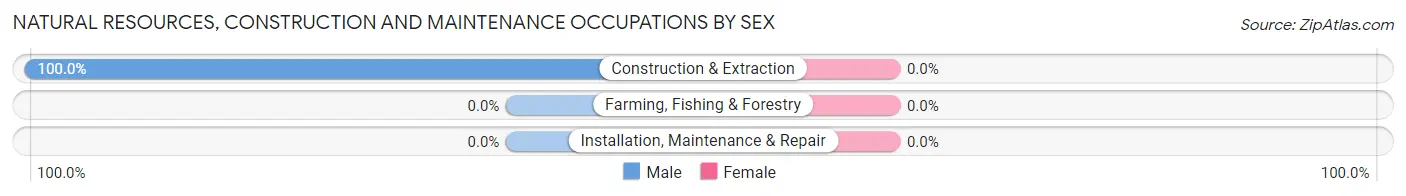
Natural Resources, Construction and Maintenance Occupations by Sex
| Occupation | Male | Female |
| Farming, Fishing & Forestry | 0 (0.0%) | 0 (0.0%) |
| Construction & Extraction | 84 (100.0%) | 0 (0.0%) |
| Installation, Maintenance & Repair | 0 (0.0%) | 0 (0.0%) |
| Total (Category) | 84 (100.0%) | 0 (0.0%) |
| Total (Overall) | 207 (28.9%) | 510 (71.1%) |
Production, Transportation and Moving Occupations
The most common Production, Transportation and Moving occupations in Heidelberg are , and Transportation (32 | 4.5%).
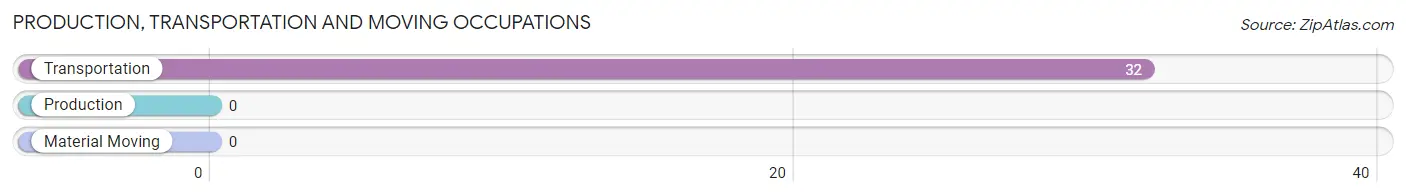
Production, Transportation and Moving Occupations by Sex
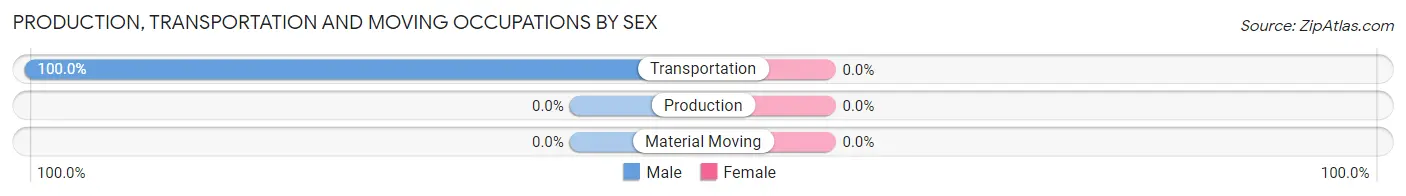
| Occupation | Male | Female |
| Production | 0 (0.0%) | 0 (0.0%) |
| Transportation | 32 (100.0%) | 0 (0.0%) |
| Material Moving | 0 (0.0%) | 0 (0.0%) |
| Total (Category) | 32 (100.0%) | 0 (0.0%) |
| Total (Overall) | 207 (28.9%) | 510 (71.1%) |
Employment Industries by Sex in Heidelberg
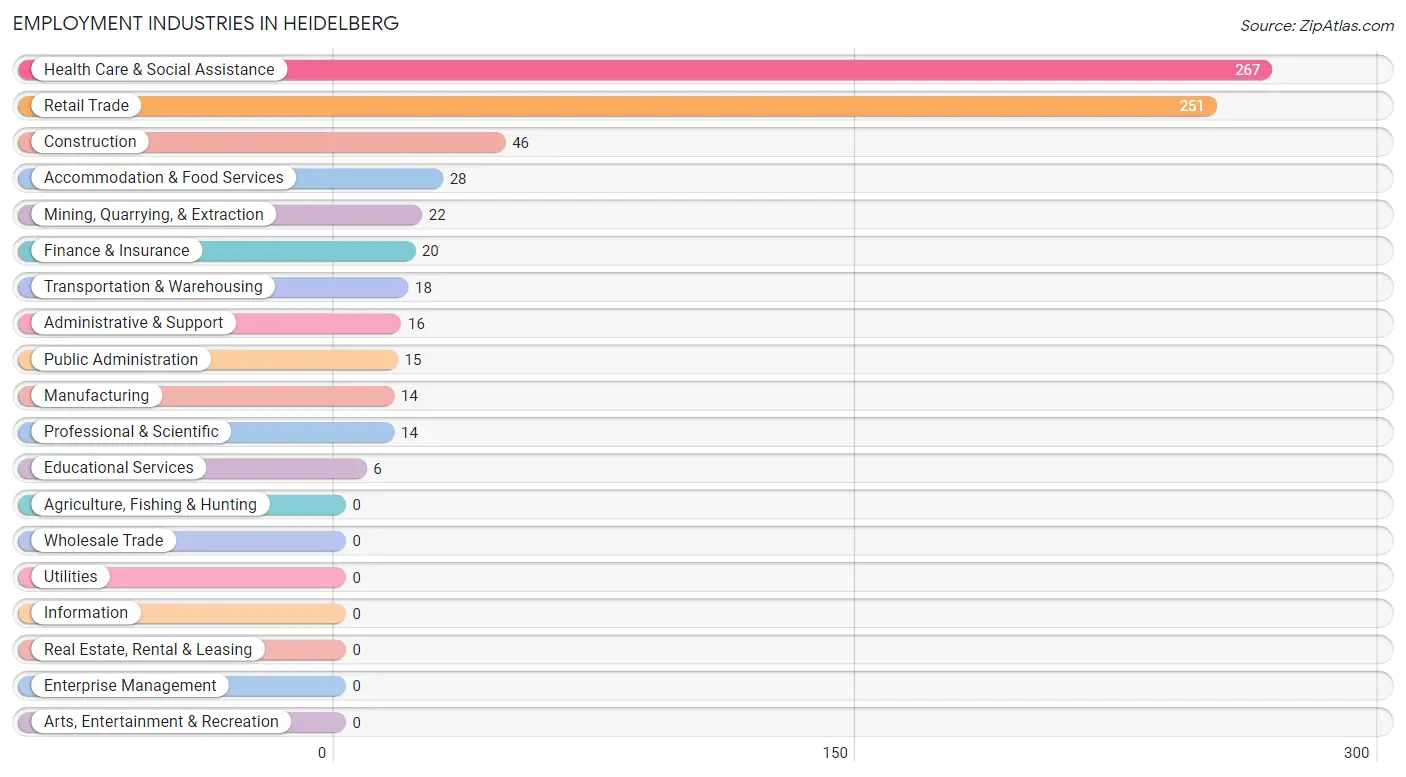
Employment Industries in Heidelberg
The major employment industries in Heidelberg include Health Care & Social Assistance (267 | 37.2%), Retail Trade (251 | 35.0%), Construction (46 | 6.4%), Accommodation & Food Services (28 | 3.9%), and Mining, Quarrying, & Extraction (22 | 3.1%).
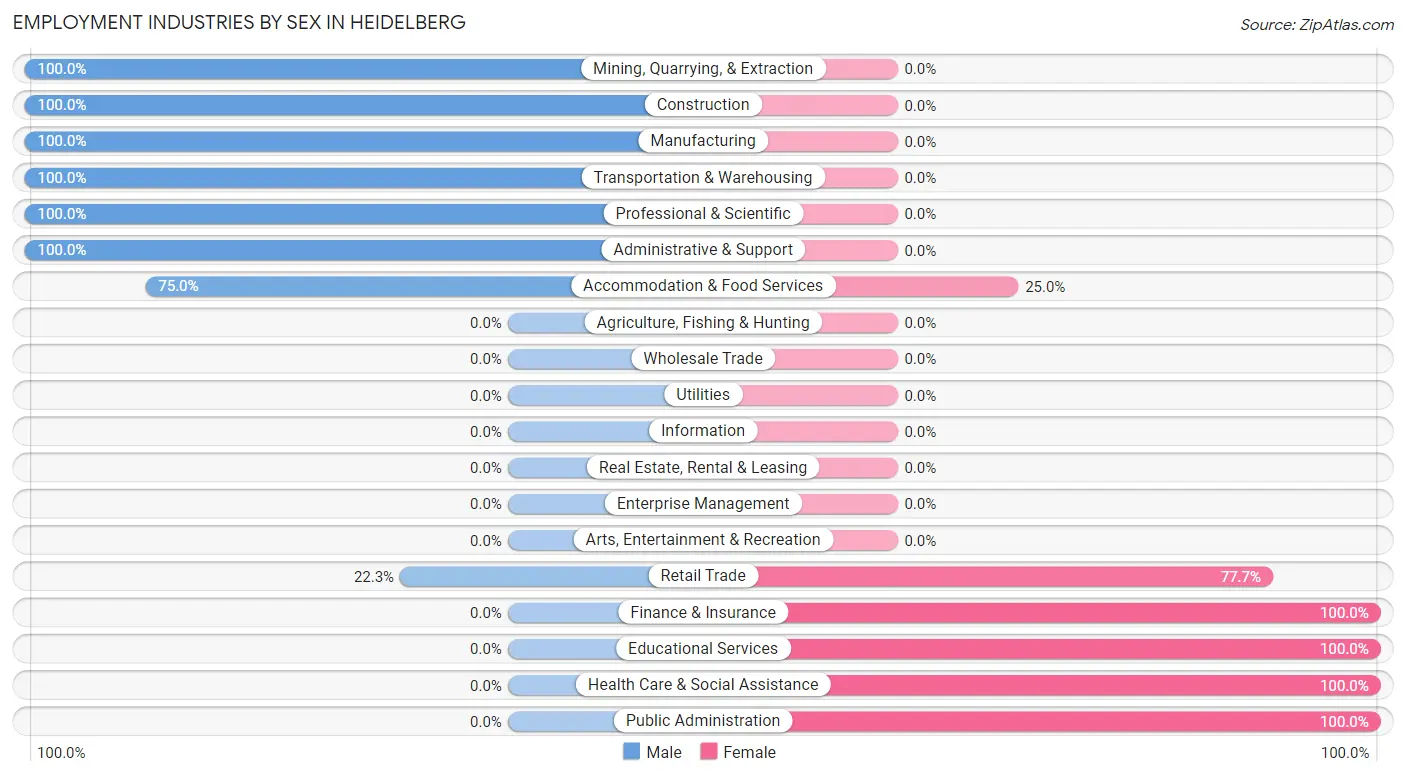
Employment Industries by Sex in Heidelberg
The Heidelberg industries that see more men than women are Mining, Quarrying, & Extraction (100.0%), Construction (100.0%), and Manufacturing (100.0%), whereas the industries that tend to have a higher number of women are Finance & Insurance (100.0%), Educational Services (100.0%), and Health Care & Social Assistance (100.0%).
| Industry | Male | Female |
| Agriculture, Fishing & Hunting | 0 (0.0%) | 0 (0.0%) |
| Mining, Quarrying, & Extraction | 22 (100.0%) | 0 (0.0%) |
| Construction | 46 (100.0%) | 0 (0.0%) |
| Manufacturing | 14 (100.0%) | 0 (0.0%) |
| Wholesale Trade | 0 (0.0%) | 0 (0.0%) |
| Retail Trade | 56 (22.3%) | 195 (77.7%) |
| Transportation & Warehousing | 18 (100.0%) | 0 (0.0%) |
| Utilities | 0 (0.0%) | 0 (0.0%) |
| Information | 0 (0.0%) | 0 (0.0%) |
| Finance & Insurance | 0 (0.0%) | 20 (100.0%) |
| Real Estate, Rental & Leasing | 0 (0.0%) | 0 (0.0%) |
| Professional & Scientific | 14 (100.0%) | 0 (0.0%) |
| Enterprise Management | 0 (0.0%) | 0 (0.0%) |
| Administrative & Support | 16 (100.0%) | 0 (0.0%) |
| Educational Services | 0 (0.0%) | 6 (100.0%) |
| Health Care & Social Assistance | 0 (0.0%) | 267 (100.0%) |
| Arts, Entertainment & Recreation | 0 (0.0%) | 0 (0.0%) |
| Accommodation & Food Services | 21 (75.0%) | 7 (25.0%) |
| Public Administration | 0 (0.0%) | 15 (100.0%) |
| Total | 207 (28.9%) | 510 (71.1%) |
Education in Heidelberg
School Enrollment in Heidelberg
The most common levels of schooling among the 262 students in Heidelberg are middle school (88 | 33.6%), college / undergraduate (72 | 27.5%), and kindergarten (42 | 16.0%).
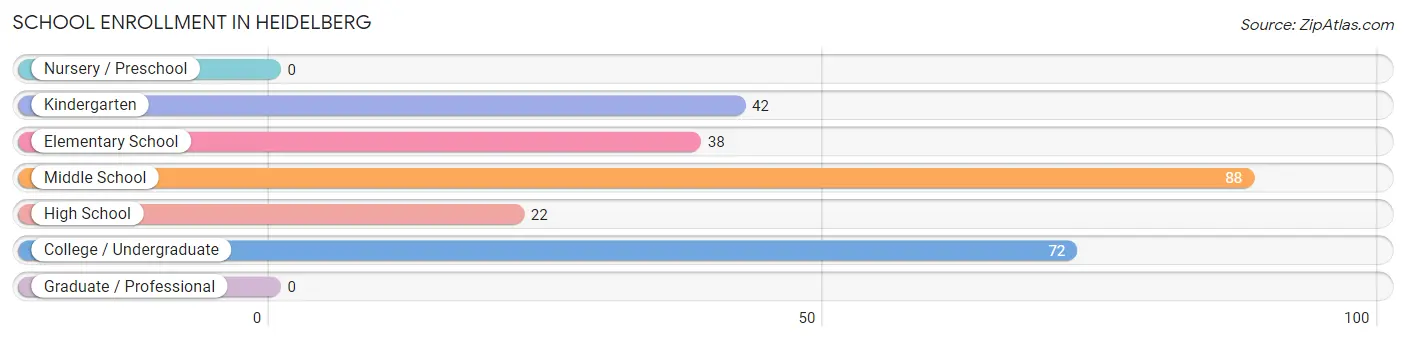
| School Level | # Students | % Students |
| Nursery / Preschool | 0 | 0.0% |
| Kindergarten | 42 | 16.0% |
| Elementary School | 38 | 14.5% |
| Middle School | 88 | 33.6% |
| High School | 22 | 8.4% |
| College / Undergraduate | 72 | 27.5% |
| Graduate / Professional | 0 | 0.0% |
| Total | 262 | 100.0% |
School Enrollment by Age by Funding Source in Heidelberg
Out of a total of 262 students who are enrolled in schools in Heidelberg, 65 (24.8%) attend a private institution, while the remaining 197 (75.2%) are enrolled in public schools. The age group of 20 to 24 year olds has the highest likelihood of being enrolled in private schools, with 65 (100.0% in the age bracket) enrolled. Conversely, the age group of 5 to 9 year old has the lowest likelihood of being enrolled in a private school, with 80 (100.0% in the age bracket) attending a public institution.
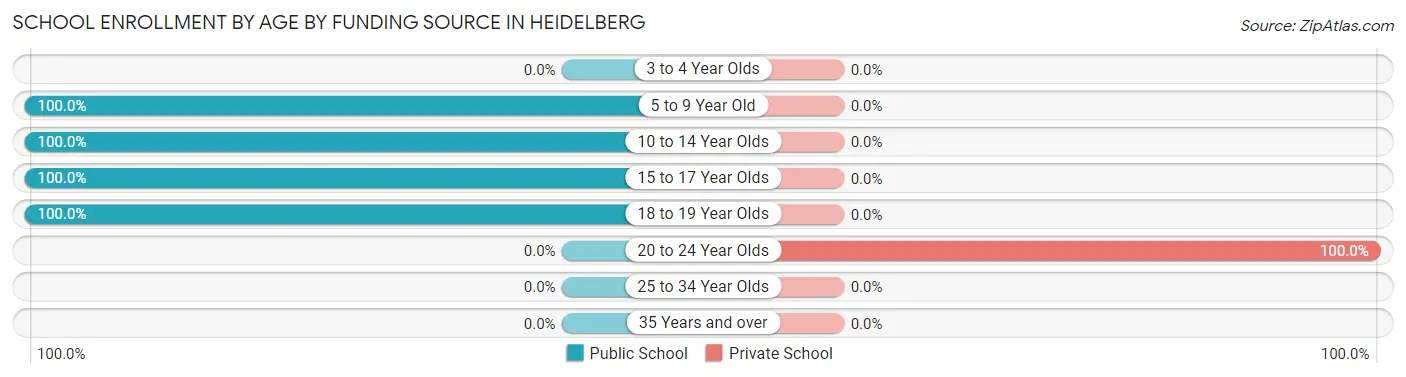
| Age Bracket | Public School | Private School |
| 3 to 4 Year Olds | 0 (0.0%) | 0 (0.0%) |
| 5 to 9 Year Old | 80 (100.0%) | 0 (0.0%) |
| 10 to 14 Year Olds | 88 (100.0%) | 0 (0.0%) |
| 15 to 17 Year Olds | 6 (100.0%) | 0 (0.0%) |
| 18 to 19 Year Olds | 23 (100.0%) | 0 (0.0%) |
| 20 to 24 Year Olds | 0 (0.0%) | 65 (100.0%) |
| 25 to 34 Year Olds | 0 (0.0%) | 0 (0.0%) |
| 35 Years and over | 0 (0.0%) | 0 (0.0%) |
| Total | 197 (75.2%) | 65 (24.8%) |
Educational Attainment by Field of Study in Heidelberg
, and education (6 | 100.0%) are the most common fields of study among 6 individuals in Heidelberg who have obtained a bachelor's degree or higher.
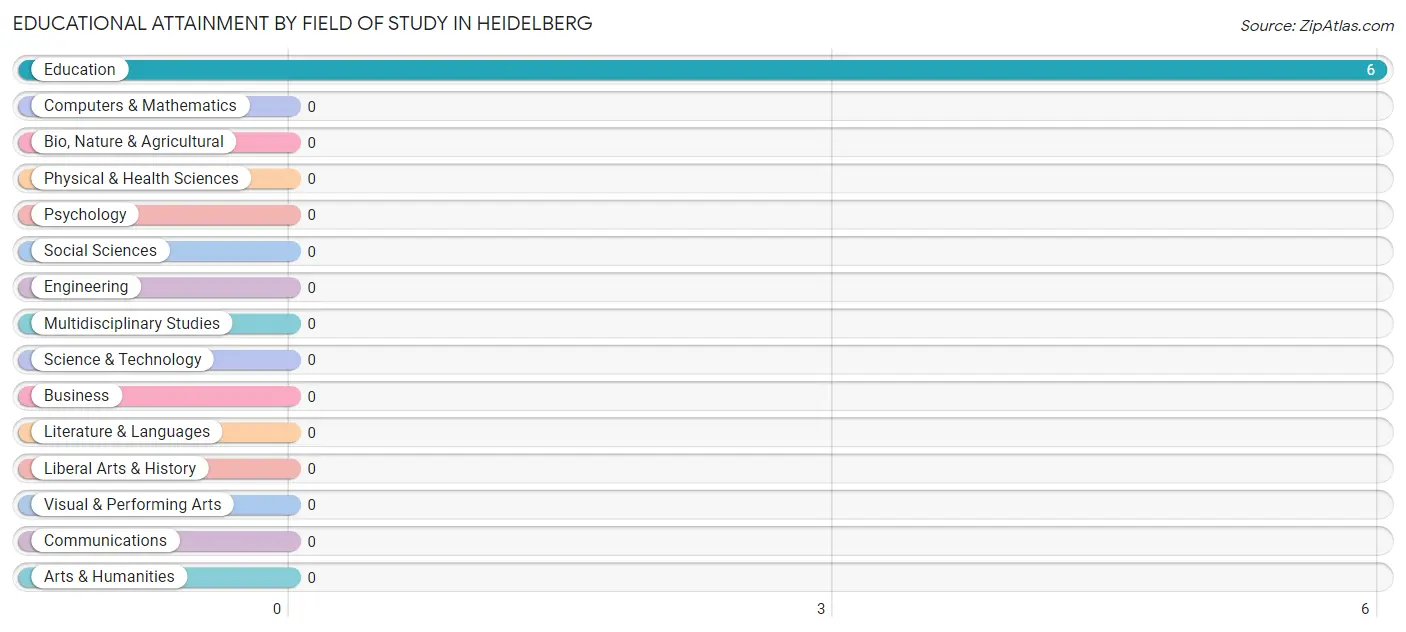
| Field of Study | # Graduates | % Graduates |
| Computers & Mathematics | 0 | 0.0% |
| Bio, Nature & Agricultural | 0 | 0.0% |
| Physical & Health Sciences | 0 | 0.0% |
| Psychology | 0 | 0.0% |
| Social Sciences | 0 | 0.0% |
| Engineering | 0 | 0.0% |
| Multidisciplinary Studies | 0 | 0.0% |
| Science & Technology | 0 | 0.0% |
| Business | 0 | 0.0% |
| Education | 6 | 100.0% |
| Literature & Languages | 0 | 0.0% |
| Liberal Arts & History | 0 | 0.0% |
| Visual & Performing Arts | 0 | 0.0% |
| Communications | 0 | 0.0% |
| Arts & Humanities | 0 | 0.0% |
| Total | 6 | 100.0% |
Transportation & Commute in Heidelberg
Vehicle Availability by Sex in Heidelberg
The most prevalent vehicle ownership categories in Heidelberg are males with 3 vehicles (129, accounting for 62.3%) and females with 3 vehicles (78, making up 25.3%).
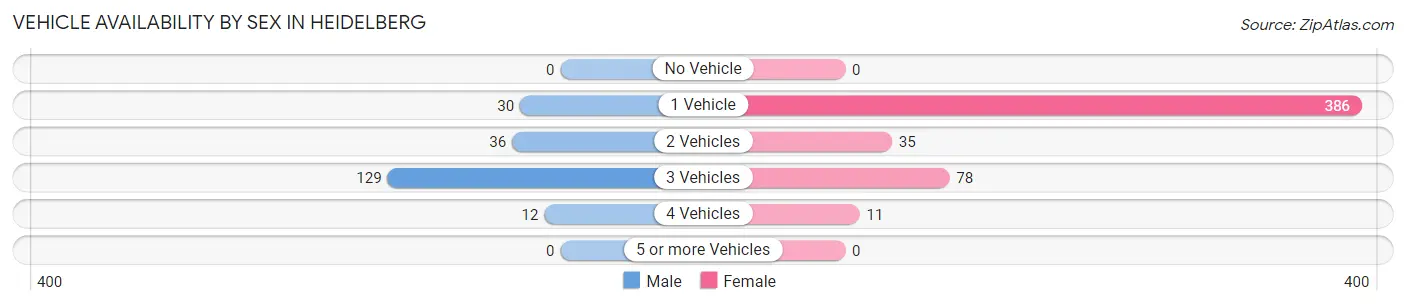
| Vehicles Available | Male | Female |
| No Vehicle | 0 (0.0%) | 0 (0.0%) |
| 1 Vehicle | 30 (14.5%) | 386 (75.7%) |
| 2 Vehicles | 36 (17.4%) | 35 (6.9%) |
| 3 Vehicles | 129 (62.3%) | 78 (15.3%) |
| 4 Vehicles | 12 (5.8%) | 11 (2.2%) |
| 5 or more Vehicles | 0 (0.0%) | 0 (0.0%) |
| Total | 207 (100.0%) | 510 (100.0%) |
Commute Time in Heidelberg
The most frequently occuring commute durations in Heidelberg are 10 to 14 minutes (241 commuters, 36.7%), less than 5 minutes (177 commuters, 26.9%), and 5 to 9 minutes (71 commuters, 10.8%).
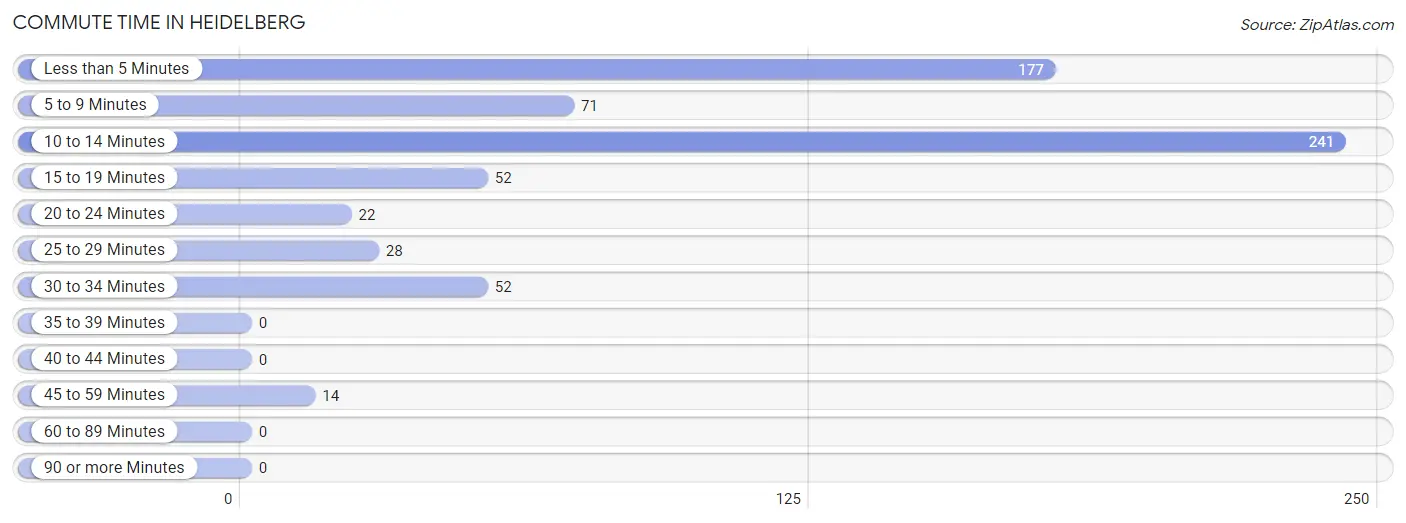
| Commute Time | # Commuters | % Commuters |
| Less than 5 Minutes | 177 | 26.9% |
| 5 to 9 Minutes | 71 | 10.8% |
| 10 to 14 Minutes | 241 | 36.7% |
| 15 to 19 Minutes | 52 | 7.9% |
| 20 to 24 Minutes | 22 | 3.4% |
| 25 to 29 Minutes | 28 | 4.3% |
| 30 to 34 Minutes | 52 | 7.9% |
| 35 to 39 Minutes | 0 | 0.0% |
| 40 to 44 Minutes | 0 | 0.0% |
| 45 to 59 Minutes | 14 | 2.1% |
| 60 to 89 Minutes | 0 | 0.0% |
| 90 or more Minutes | 0 | 0.0% |
Commute Time by Sex in Heidelberg
The most common commute times in Heidelberg are 5 to 9 minutes (56 commuters, 38.1%) for males and 10 to 14 minutes (241 commuters, 47.2%) for females.
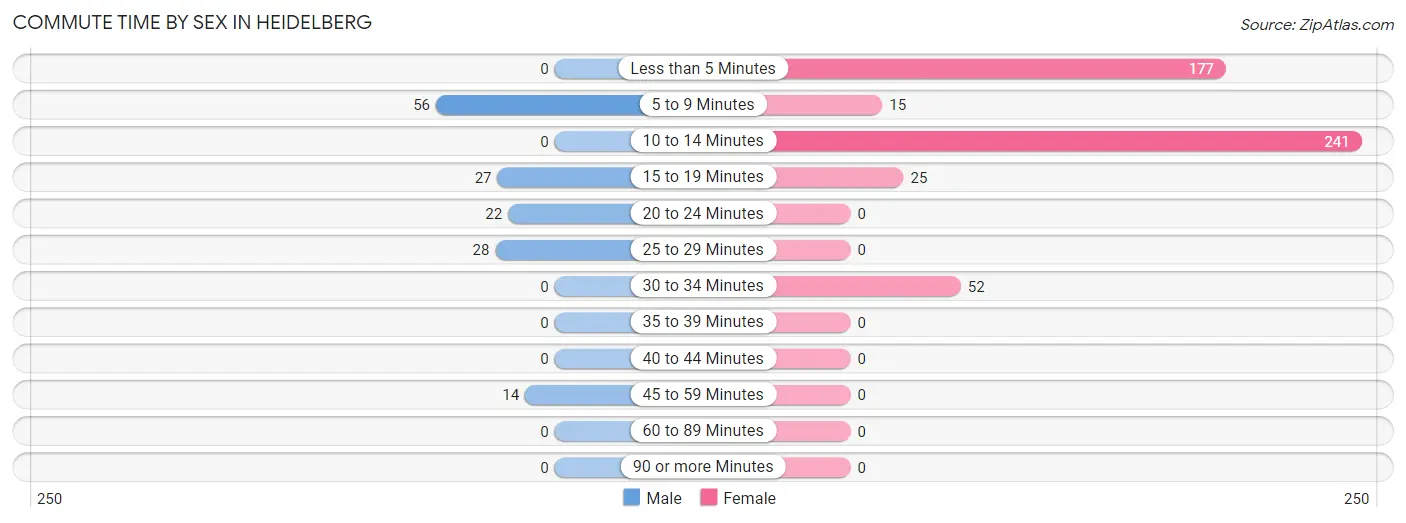
| Commute Time | Male | Female |
| Less than 5 Minutes | 0 (0.0%) | 177 (34.7%) |
| 5 to 9 Minutes | 56 (38.1%) | 15 (2.9%) |
| 10 to 14 Minutes | 0 (0.0%) | 241 (47.2%) |
| 15 to 19 Minutes | 27 (18.4%) | 25 (4.9%) |
| 20 to 24 Minutes | 22 (15.0%) | 0 (0.0%) |
| 25 to 29 Minutes | 28 (19.1%) | 0 (0.0%) |
| 30 to 34 Minutes | 0 (0.0%) | 52 (10.2%) |
| 35 to 39 Minutes | 0 (0.0%) | 0 (0.0%) |
| 40 to 44 Minutes | 0 (0.0%) | 0 (0.0%) |
| 45 to 59 Minutes | 14 (9.5%) | 0 (0.0%) |
| 60 to 89 Minutes | 0 (0.0%) | 0 (0.0%) |
| 90 or more Minutes | 0 (0.0%) | 0 (0.0%) |
Time of Departure to Work by Sex in Heidelberg
The most frequent times of departure to work in Heidelberg are 11:00 AM to 11:59 AM (56, 38.1%) for males and 8:30 AM to 8:59 AM (223, 43.7%) for females.
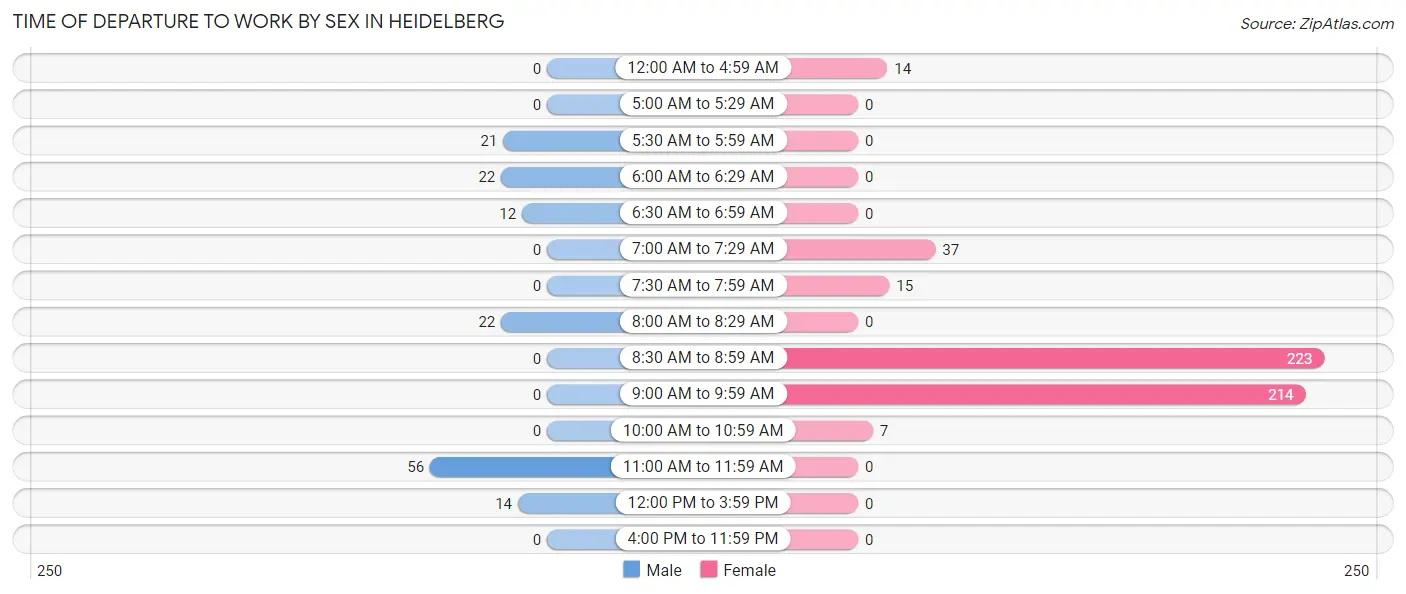
| Time of Departure | Male | Female |
| 12:00 AM to 4:59 AM | 0 (0.0%) | 14 (2.8%) |
| 5:00 AM to 5:29 AM | 0 (0.0%) | 0 (0.0%) |
| 5:30 AM to 5:59 AM | 21 (14.3%) | 0 (0.0%) |
| 6:00 AM to 6:29 AM | 22 (15.0%) | 0 (0.0%) |
| 6:30 AM to 6:59 AM | 12 (8.2%) | 0 (0.0%) |
| 7:00 AM to 7:29 AM | 0 (0.0%) | 37 (7.2%) |
| 7:30 AM to 7:59 AM | 0 (0.0%) | 15 (2.9%) |
| 8:00 AM to 8:29 AM | 22 (15.0%) | 0 (0.0%) |
| 8:30 AM to 8:59 AM | 0 (0.0%) | 223 (43.7%) |
| 9:00 AM to 9:59 AM | 0 (0.0%) | 214 (42.0%) |
| 10:00 AM to 10:59 AM | 0 (0.0%) | 7 (1.4%) |
| 11:00 AM to 11:59 AM | 56 (38.1%) | 0 (0.0%) |
| 12:00 PM to 3:59 PM | 14 (9.5%) | 0 (0.0%) |
| 4:00 PM to 11:59 PM | 0 (0.0%) | 0 (0.0%) |
| Total | 147 (100.0%) | 510 (100.0%) |
Housing Occupancy in Heidelberg
Occupancy by Ownership in Heidelberg
Of the total 467 dwellings in Heidelberg, owner-occupied units account for 426 (91.2%), while renter-occupied units make up 41 (8.8%).
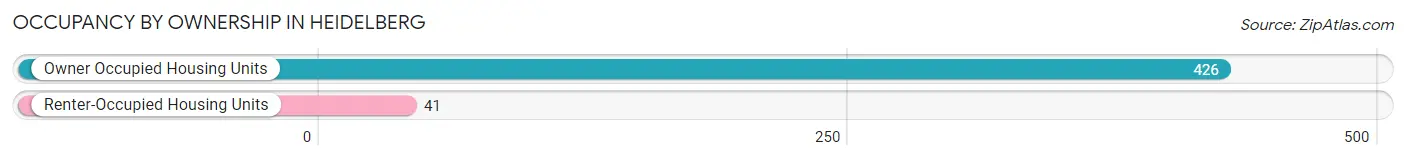
| Occupancy | # Housing Units | % Housing Units |
| Owner Occupied Housing Units | 426 | 91.2% |
| Renter-Occupied Housing Units | 41 | 8.8% |
| Total Occupied Housing Units | 467 | 100.0% |
Occupancy by Household Size in Heidelberg
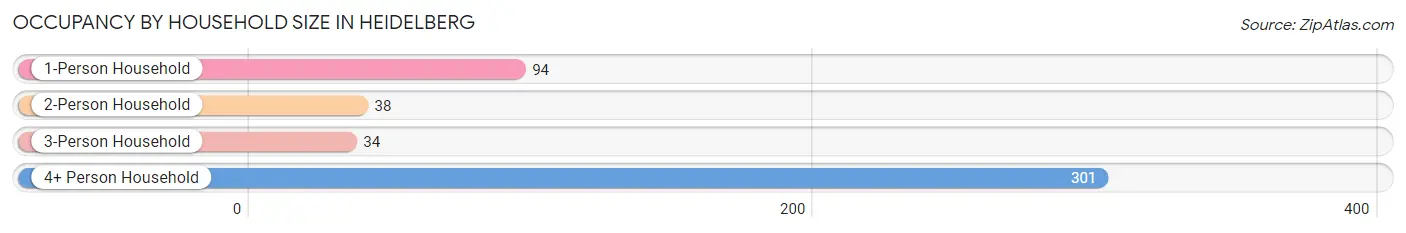
| Household Size | # Housing Units | % Housing Units |
| 1-Person Household | 94 | 20.1% |
| 2-Person Household | 38 | 8.1% |
| 3-Person Household | 34 | 7.3% |
| 4+ Person Household | 301 | 64.4% |
| Total Housing Units | 467 | 100.0% |
Occupancy by Ownership by Household Size in Heidelberg
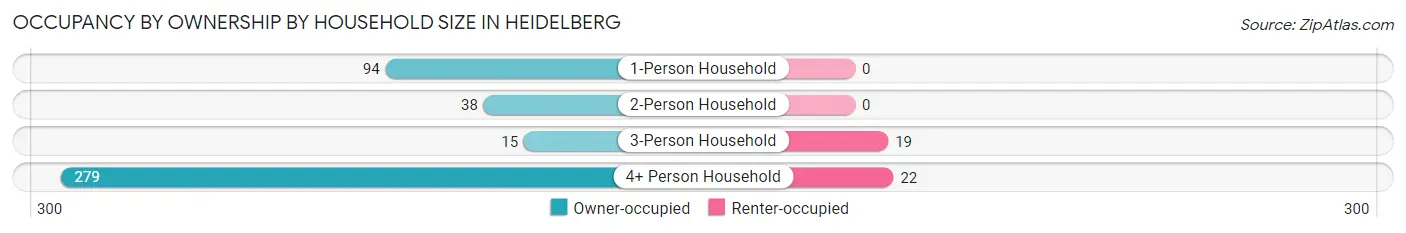
| Household Size | Owner-occupied | Renter-occupied |
| 1-Person Household | 94 (100.0%) | 0 (0.0%) |
| 2-Person Household | 38 (100.0%) | 0 (0.0%) |
| 3-Person Household | 15 (44.1%) | 19 (55.9%) |
| 4+ Person Household | 279 (92.7%) | 22 (7.3%) |
| Total Housing Units | 426 (91.2%) | 41 (8.8%) |
Occupancy by Educational Attainment in Heidelberg
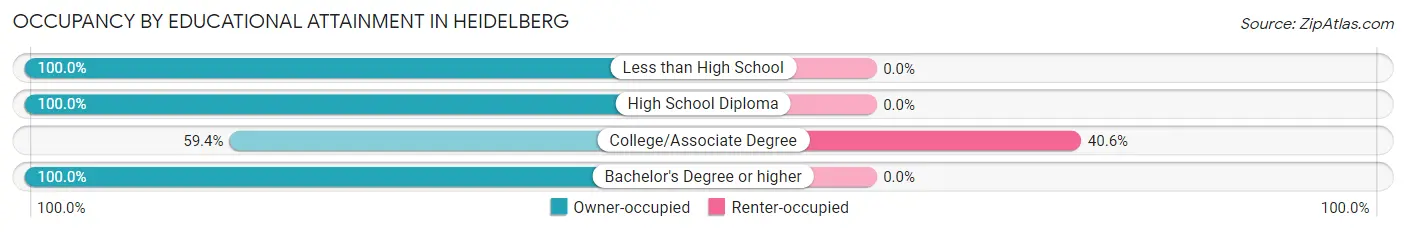
| Household Size | Owner-occupied | Renter-occupied |
| Less than High School | 299 (100.0%) | 0 (0.0%) |
| High School Diploma | 61 (100.0%) | 0 (0.0%) |
| College/Associate Degree | 60 (59.4%) | 41 (40.6%) |
| Bachelor's Degree or higher | 6 (100.0%) | 0 (0.0%) |
Occupancy by Age of Householder in Heidelberg
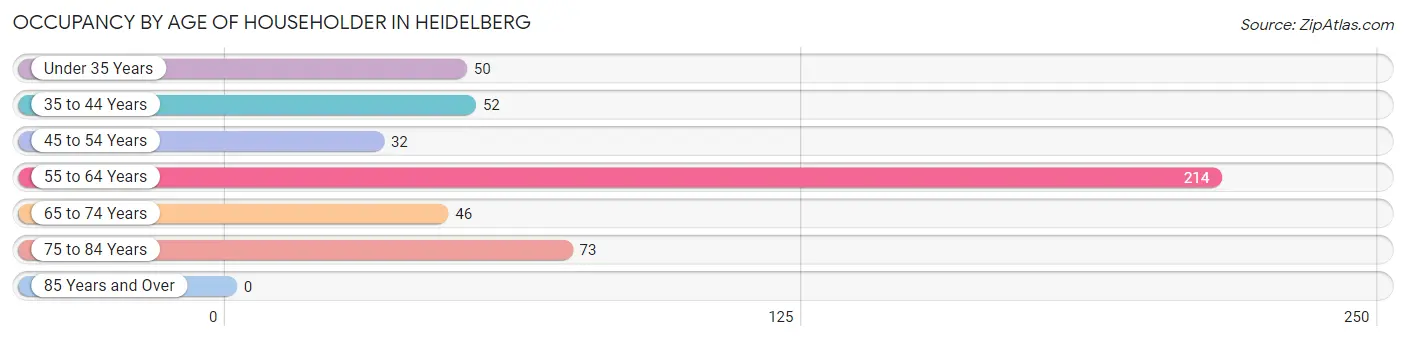
| Age Bracket | # Households | % Households |
| Under 35 Years | 50 | 10.7% |
| 35 to 44 Years | 52 | 11.1% |
| 45 to 54 Years | 32 | 6.9% |
| 55 to 64 Years | 214 | 45.8% |
| 65 to 74 Years | 46 | 9.9% |
| 75 to 84 Years | 73 | 15.6% |
| 85 Years and Over | 0 | 0.0% |
| Total | 467 | 100.0% |
Housing Finances in Heidelberg
Median Income by Occupancy in Heidelberg
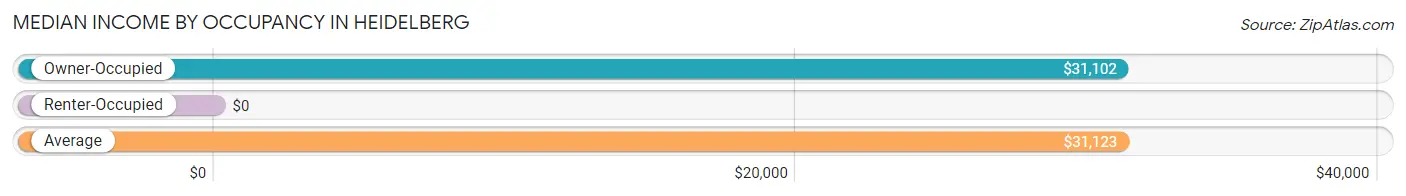
| Occupancy Type | # Households | Median Income |
| Owner-Occupied | 426 (91.2%) | $31,102 |
| Renter-Occupied | 41 (8.8%) | $0 |
| Average | 467 (100.0%) | $31,123 |
Occupancy by Householder Income Bracket in Heidelberg
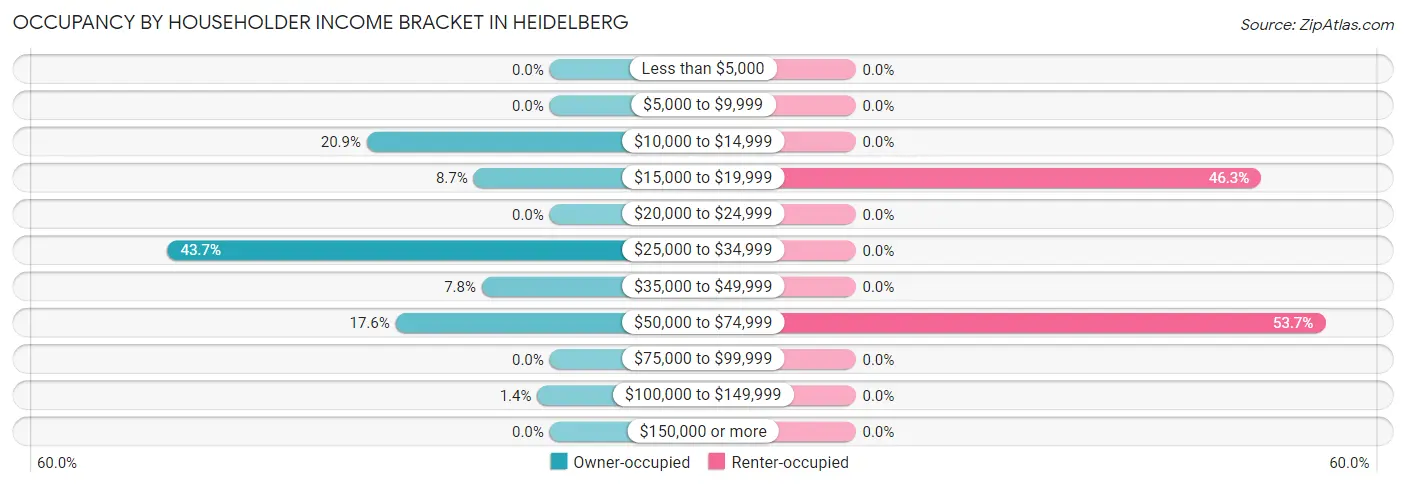
| Income Bracket | Owner-occupied | Renter-occupied |
| Less than $5,000 | 0 (0.0%) | 0 (0.0%) |
| $5,000 to $9,999 | 0 (0.0%) | 0 (0.0%) |
| $10,000 to $14,999 | 89 (20.9%) | 0 (0.0%) |
| $15,000 to $19,999 | 37 (8.7%) | 19 (46.3%) |
| $20,000 to $24,999 | 0 (0.0%) | 0 (0.0%) |
| $25,000 to $34,999 | 186 (43.7%) | 0 (0.0%) |
| $35,000 to $49,999 | 33 (7.7%) | 0 (0.0%) |
| $50,000 to $74,999 | 75 (17.6%) | 22 (53.7%) |
| $75,000 to $99,999 | 0 (0.0%) | 0 (0.0%) |
| $100,000 to $149,999 | 6 (1.4%) | 0 (0.0%) |
| $150,000 or more | 0 (0.0%) | 0 (0.0%) |
| Total | 426 (100.0%) | 41 (100.0%) |
Monthly Housing Cost Tiers in Heidelberg
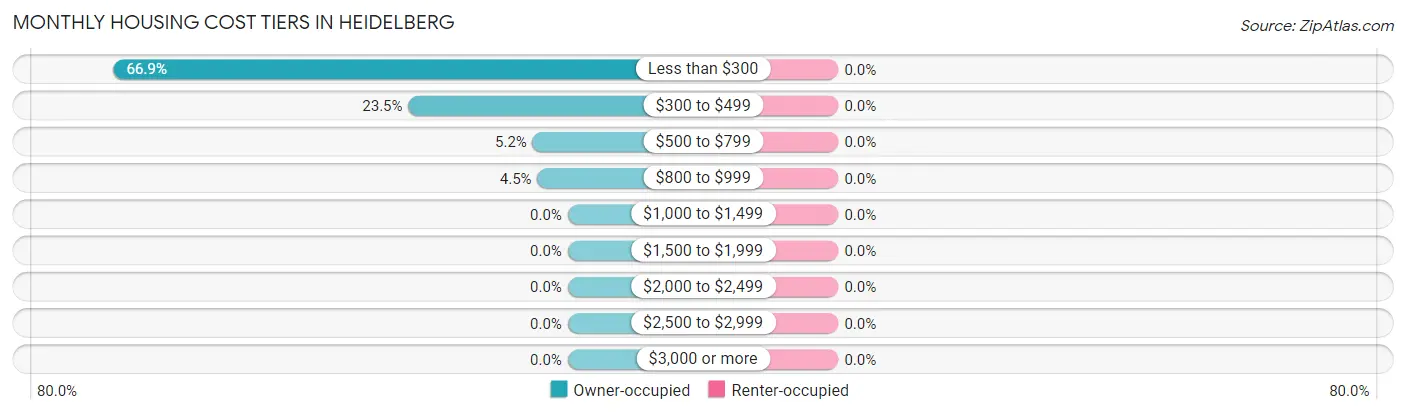
| Monthly Cost | Owner-occupied | Renter-occupied |
| Less than $300 | 285 (66.9%) | 0 (0.0%) |
| $300 to $499 | 100 (23.5%) | 0 (0.0%) |
| $500 to $799 | 22 (5.2%) | 0 (0.0%) |
| $800 to $999 | 19 (4.5%) | 0 (0.0%) |
| $1,000 to $1,499 | 0 (0.0%) | 0 (0.0%) |
| $1,500 to $1,999 | 0 (0.0%) | 0 (0.0%) |
| $2,000 to $2,499 | 0 (0.0%) | 0 (0.0%) |
| $2,500 to $2,999 | 0 (0.0%) | 0 (0.0%) |
| $3,000 or more | 0 (0.0%) | 0 (0.0%) |
| Total | 426 (100.0%) | 41 (100.0%) |
Physical Housing Characteristics in Heidelberg
Housing Structures in Heidelberg
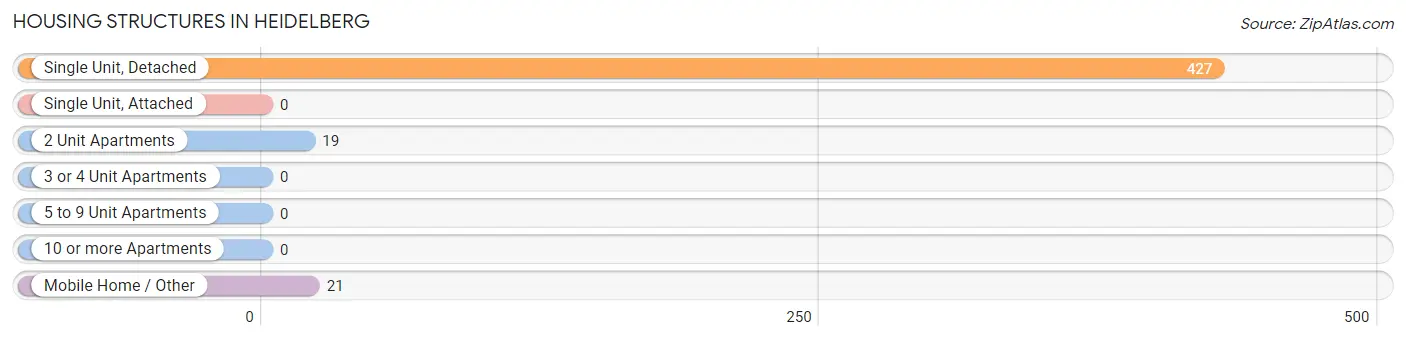
| Structure Type | # Housing Units | % Housing Units |
| Single Unit, Detached | 427 | 91.4% |
| Single Unit, Attached | 0 | 0.0% |
| 2 Unit Apartments | 19 | 4.1% |
| 3 or 4 Unit Apartments | 0 | 0.0% |
| 5 to 9 Unit Apartments | 0 | 0.0% |
| 10 or more Apartments | 0 | 0.0% |
| Mobile Home / Other | 21 | 4.5% |
| Total | 467 | 100.0% |
Housing Structures by Occupancy in Heidelberg
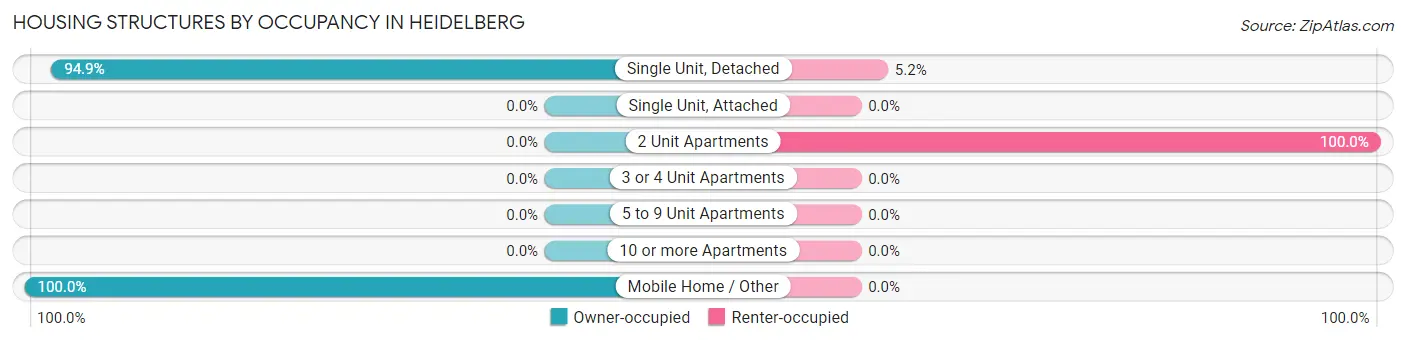
| Structure Type | Owner-occupied | Renter-occupied |
| Single Unit, Detached | 405 (94.9%) | 22 (5.1%) |
| Single Unit, Attached | 0 (0.0%) | 0 (0.0%) |
| 2 Unit Apartments | 0 (0.0%) | 19 (100.0%) |
| 3 or 4 Unit Apartments | 0 (0.0%) | 0 (0.0%) |
| 5 to 9 Unit Apartments | 0 (0.0%) | 0 (0.0%) |
| 10 or more Apartments | 0 (0.0%) | 0 (0.0%) |
| Mobile Home / Other | 21 (100.0%) | 0 (0.0%) |
| Total | 426 (91.2%) | 41 (8.8%) |
Housing Structures by Number of Rooms in Heidelberg
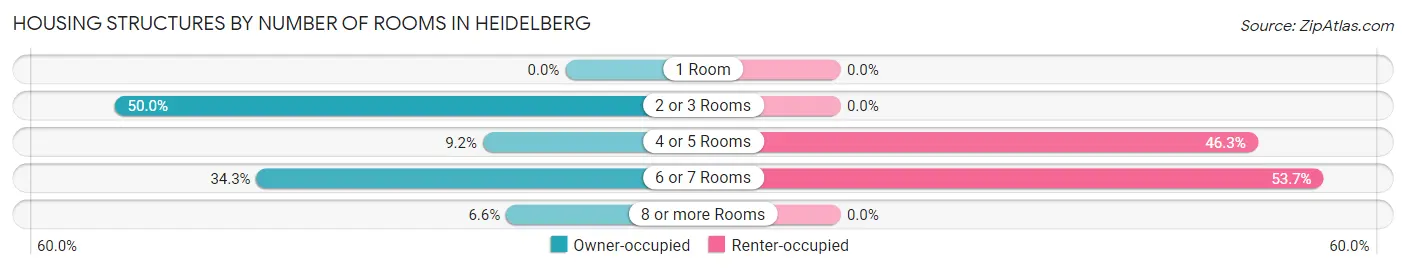
| Number of Rooms | Owner-occupied | Renter-occupied |
| 1 Room | 0 (0.0%) | 0 (0.0%) |
| 2 or 3 Rooms | 213 (50.0%) | 0 (0.0%) |
| 4 or 5 Rooms | 39 (9.1%) | 19 (46.3%) |
| 6 or 7 Rooms | 146 (34.3%) | 22 (53.7%) |
| 8 or more Rooms | 28 (6.6%) | 0 (0.0%) |
| Total | 426 (100.0%) | 41 (100.0%) |
Housing Structure by Heating Type in Heidelberg
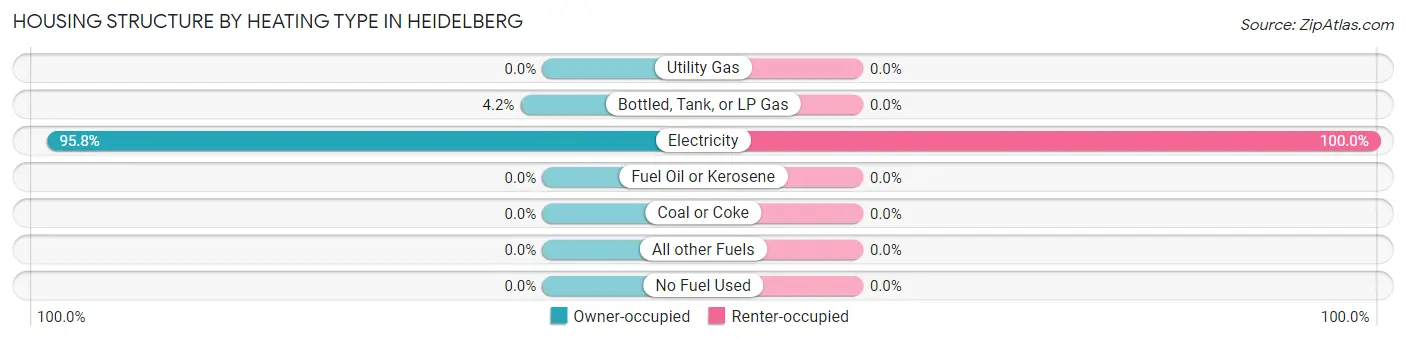
| Heating Type | Owner-occupied | Renter-occupied |
| Utility Gas | 0 (0.0%) | 0 (0.0%) |
| Bottled, Tank, or LP Gas | 18 (4.2%) | 0 (0.0%) |
| Electricity | 408 (95.8%) | 41 (100.0%) |
| Fuel Oil or Kerosene | 0 (0.0%) | 0 (0.0%) |
| Coal or Coke | 0 (0.0%) | 0 (0.0%) |
| All other Fuels | 0 (0.0%) | 0 (0.0%) |
| No Fuel Used | 0 (0.0%) | 0 (0.0%) |
| Total | 426 (100.0%) | 41 (100.0%) |
Household Vehicle Usage in Heidelberg
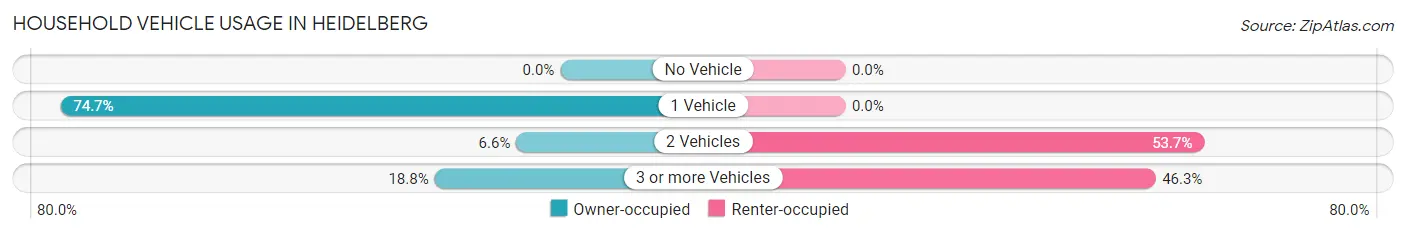
| Vehicles per Household | Owner-occupied | Renter-occupied |
| No Vehicle | 0 (0.0%) | 0 (0.0%) |
| 1 Vehicle | 318 (74.7%) | 0 (0.0%) |
| 2 Vehicles | 28 (6.6%) | 22 (53.7%) |
| 3 or more Vehicles | 80 (18.8%) | 19 (46.3%) |
| Total | 426 (100.0%) | 41 (100.0%) |
Real Estate & Mortgages in Heidelberg
Real Estate and Mortgage Overview in Heidelberg
| Characteristic | Without Mortgage | With Mortgage |
| Housing Units | 426 | 0 |
| Median Property Value | $58,700 | $0 |
| Median Household Income | $31,102 | $0 |
| Monthly Housing Costs | $243 | $0 |
| Real Estate Taxes | $518 | $0 |
Property Value by Mortgage Status in Heidelberg
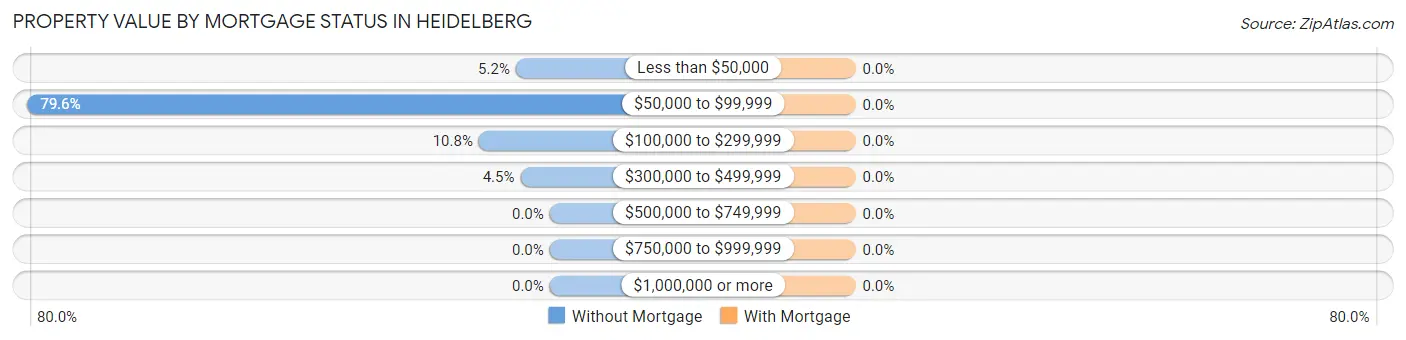
| Property Value | Without Mortgage | With Mortgage |
| Less than $50,000 | 22 (5.2%) | 0 (0.0%) |
| $50,000 to $99,999 | 339 (79.6%) | 0 (0.0%) |
| $100,000 to $299,999 | 46 (10.8%) | 0 (0.0%) |
| $300,000 to $499,999 | 19 (4.5%) | 0 (0.0%) |
| $500,000 to $749,999 | 0 (0.0%) | 0 (0.0%) |
| $750,000 to $999,999 | 0 (0.0%) | 0 (0.0%) |
| $1,000,000 or more | 0 (0.0%) | 0 (0.0%) |
| Total | 426 (100.0%) | 0 (0.0%) |
Household Income by Mortgage Status in Heidelberg
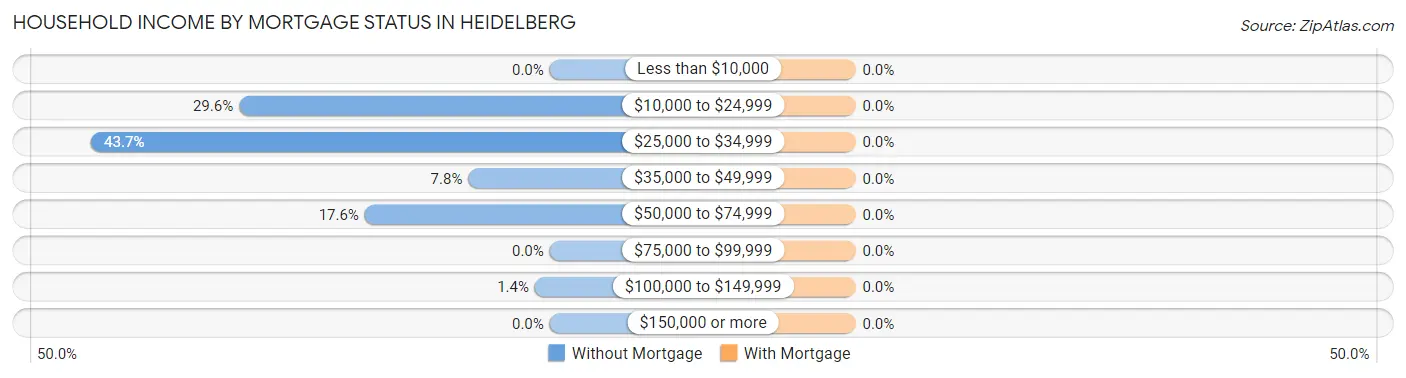
| Household Income | Without Mortgage | With Mortgage |
| Less than $10,000 | 0 (0.0%) | 0 (0.0%) |
| $10,000 to $24,999 | 126 (29.6%) | 0 (0.0%) |
| $25,000 to $34,999 | 186 (43.7%) | 0 (0.0%) |
| $35,000 to $49,999 | 33 (7.7%) | 0 (0.0%) |
| $50,000 to $74,999 | 75 (17.6%) | 0 (0.0%) |
| $75,000 to $99,999 | 0 (0.0%) | 0 (0.0%) |
| $100,000 to $149,999 | 6 (1.4%) | 0 (0.0%) |
| $150,000 or more | 0 (0.0%) | 0 (0.0%) |
| Total | 426 (100.0%) | 0 (0.0%) |
Property Value to Household Income Ratio in Heidelberg
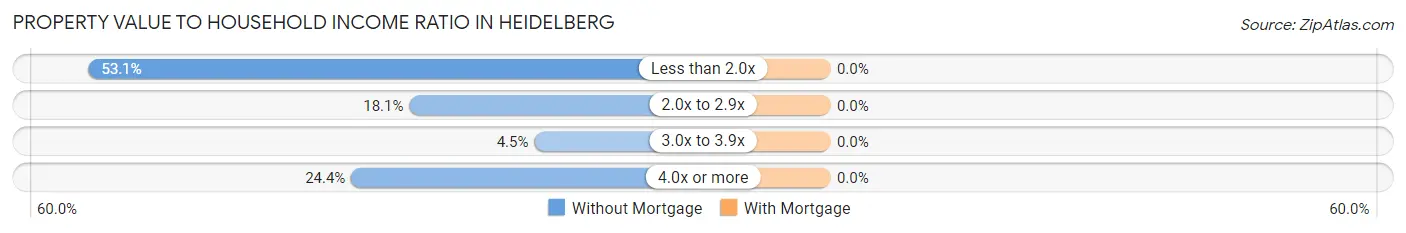
| Value-to-Income Ratio | Without Mortgage | With Mortgage |
| Less than 2.0x | 226 (53.0%) | 0 (0.0%) |
| 2.0x to 2.9x | 77 (18.1%) | 0 (0.0%) |
| 3.0x to 3.9x | 19 (4.5%) | 0 (0.0%) |
| 4.0x or more | 104 (24.4%) | 0 (0.0%) |
| Total | 426 (100.0%) | 0 (0.0%) |
Real Estate Taxes by Mortgage Status in Heidelberg
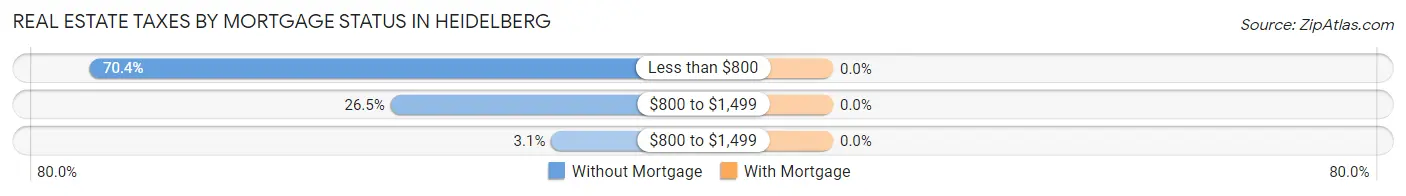
| Property Taxes | Without Mortgage | With Mortgage |
| Less than $800 | 300 (70.4%) | 0 (0.0%) |
| $800 to $1,499 | 113 (26.5%) | 0 (0.0%) |
| $800 to $1,499 | 13 (3.0%) | 0 (0.0%) |
| Total | 426 (100.0%) | 0 (0.0%) |
Health & Disability in Heidelberg
Health Insurance Coverage by Age in Heidelberg
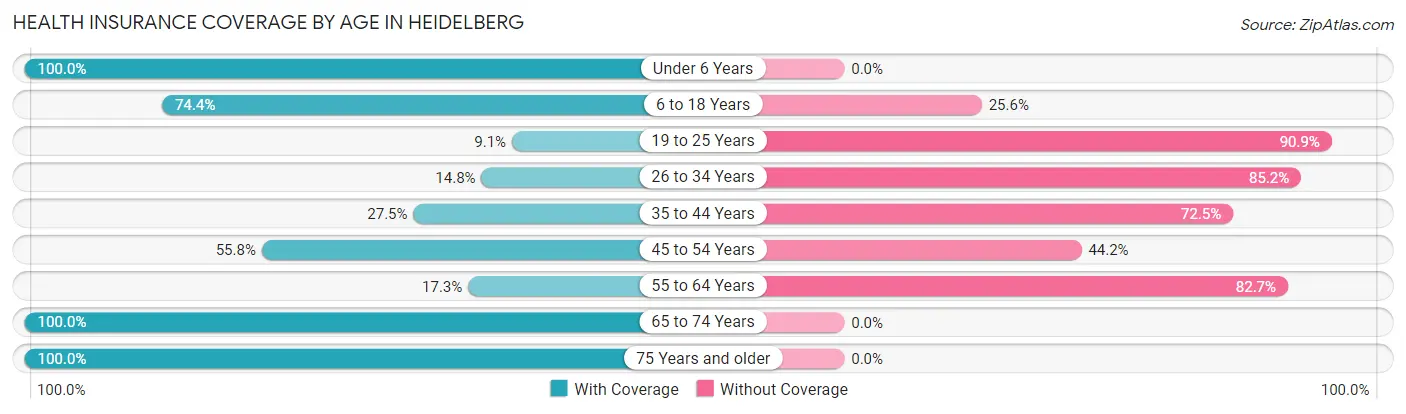
| Age Bracket | With Coverage | Without Coverage |
| Under 6 Years | 86 (100.0%) | 0 (0.0%) |
| 6 to 18 Years | 148 (74.4%) | 51 (25.6%) |
| 19 to 25 Years | 31 (9.1%) | 309 (90.9%) |
| 26 to 34 Years | 67 (14.8%) | 385 (85.2%) |
| 35 to 44 Years | 22 (27.5%) | 58 (72.5%) |
| 45 to 54 Years | 82 (55.8%) | 65 (44.2%) |
| 55 to 64 Years | 37 (17.3%) | 177 (82.7%) |
| 65 to 74 Years | 80 (100.0%) | 0 (0.0%) |
| 75 Years and older | 105 (100.0%) | 0 (0.0%) |
| Total | 658 (38.6%) | 1,045 (61.4%) |
Health Insurance Coverage by Citizenship Status in Heidelberg
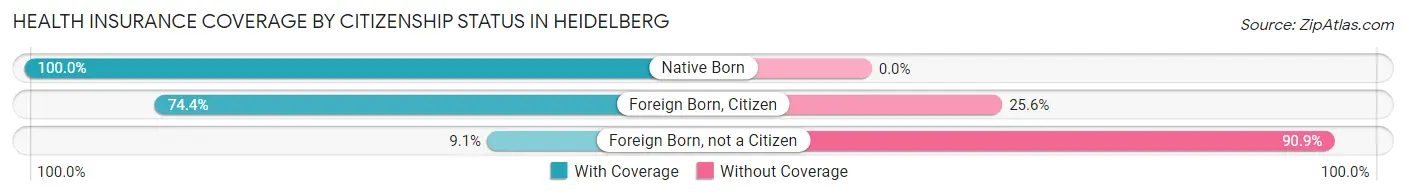
| Citizenship Status | With Coverage | Without Coverage |
| Native Born | 86 (100.0%) | 0 (0.0%) |
| Foreign Born, Citizen | 148 (74.4%) | 51 (25.6%) |
| Foreign Born, not a Citizen | 31 (9.1%) | 309 (90.9%) |
Health Insurance Coverage by Household Income in Heidelberg
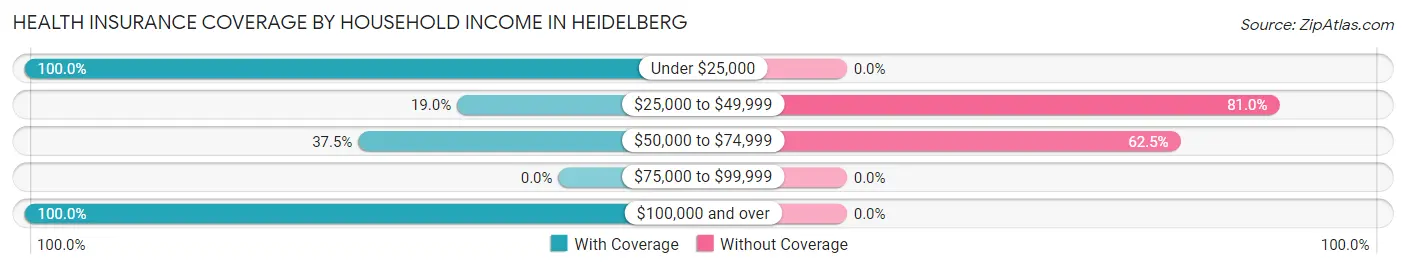
| Household Income | With Coverage | Without Coverage |
| Under $25,000 | 275 (100.0%) | 0 (0.0%) |
| $25,000 to $49,999 | 177 (19.0%) | 755 (81.0%) |
| $50,000 to $74,999 | 174 (37.5%) | 290 (62.5%) |
| $75,000 to $99,999 | 0 (0.0%) | 0 (0.0%) |
| $100,000 and over | 32 (100.0%) | 0 (0.0%) |
Public vs Private Health Insurance Coverage by Age in Heidelberg
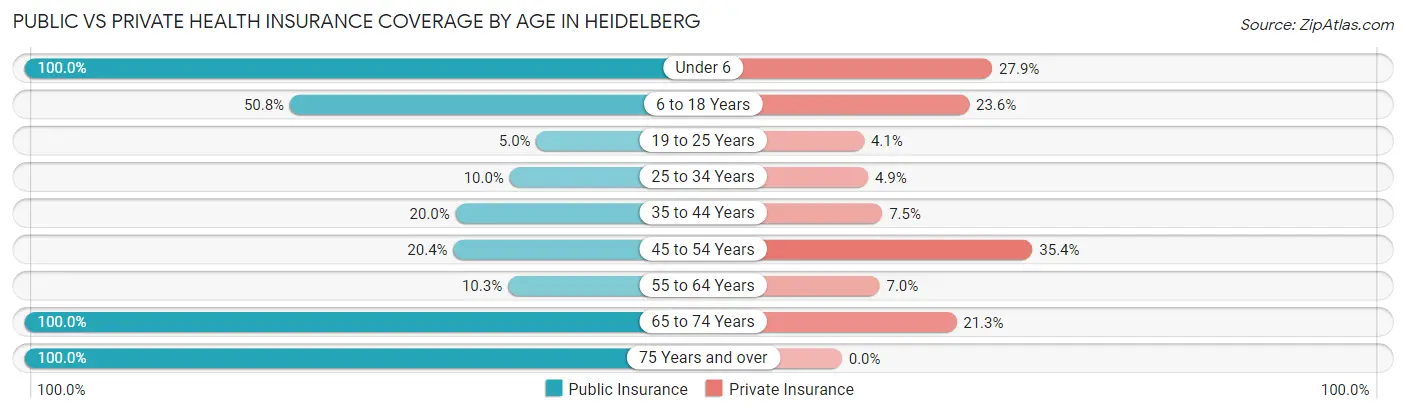
| Age Bracket | Public Insurance | Private Insurance |
| Under 6 | 86 (100.0%) | 24 (27.9%) |
| 6 to 18 Years | 101 (50.7%) | 47 (23.6%) |
| 19 to 25 Years | 17 (5.0%) | 14 (4.1%) |
| 25 to 34 Years | 45 (10.0%) | 22 (4.9%) |
| 35 to 44 Years | 16 (20.0%) | 6 (7.5%) |
| 45 to 54 Years | 30 (20.4%) | 52 (35.4%) |
| 55 to 64 Years | 22 (10.3%) | 15 (7.0%) |
| 65 to 74 Years | 80 (100.0%) | 17 (21.2%) |
| 75 Years and over | 105 (100.0%) | 0 (0.0%) |
| Total | 502 (29.5%) | 197 (11.6%) |
Disability Status by Sex by Age in Heidelberg
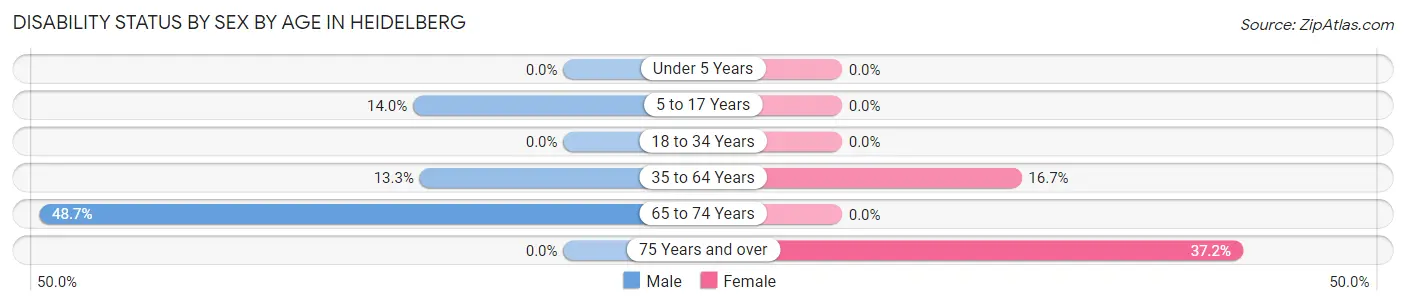
| Age Bracket | Male | Female |
| Under 5 Years | 0 (0.0%) | 0 (0.0%) |
| 5 to 17 Years | 12 (14.0%) | 0 (0.0%) |
| 18 to 34 Years | 0 (0.0%) | 0 (0.0%) |
| 35 to 64 Years | 22 (13.3%) | 46 (16.7%) |
| 65 to 74 Years | 18 (48.6%) | 0 (0.0%) |
| 75 Years and over | 0 (0.0%) | 32 (37.2%) |
Disability Class by Sex by Age in Heidelberg
Disability Class: Hearing Difficulty
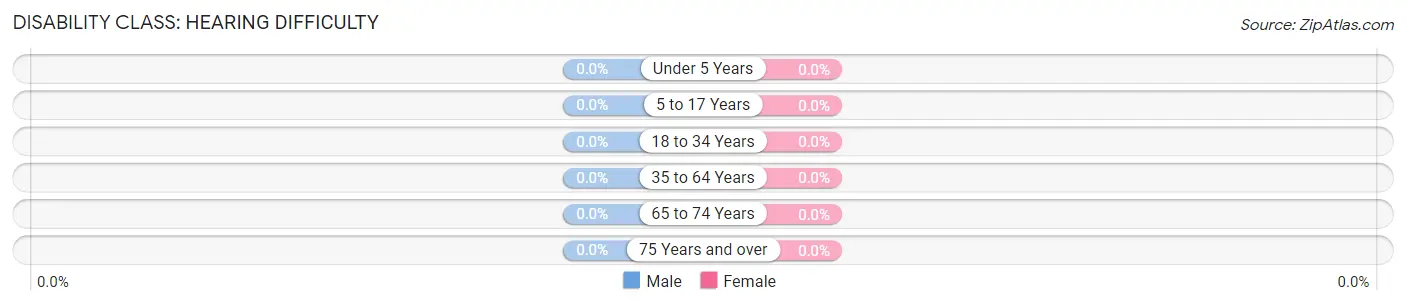
| Age Bracket | Male | Female |
| Under 5 Years | 0 (0.0%) | 0 (0.0%) |
| 5 to 17 Years | 0 (0.0%) | 0 (0.0%) |
| 18 to 34 Years | 0 (0.0%) | 0 (0.0%) |
| 35 to 64 Years | 0 (0.0%) | 0 (0.0%) |
| 65 to 74 Years | 0 (0.0%) | 0 (0.0%) |
| 75 Years and over | 0 (0.0%) | 0 (0.0%) |
Disability Class: Vision Difficulty
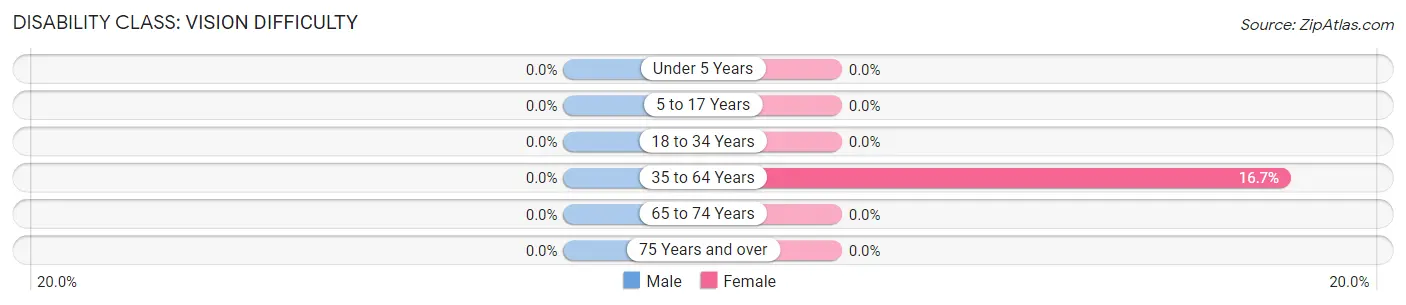
| Age Bracket | Male | Female |
| Under 5 Years | 0 (0.0%) | 0 (0.0%) |
| 5 to 17 Years | 0 (0.0%) | 0 (0.0%) |
| 18 to 34 Years | 0 (0.0%) | 0 (0.0%) |
| 35 to 64 Years | 0 (0.0%) | 46 (16.7%) |
| 65 to 74 Years | 0 (0.0%) | 0 (0.0%) |
| 75 Years and over | 0 (0.0%) | 0 (0.0%) |
Disability Class: Cognitive Difficulty
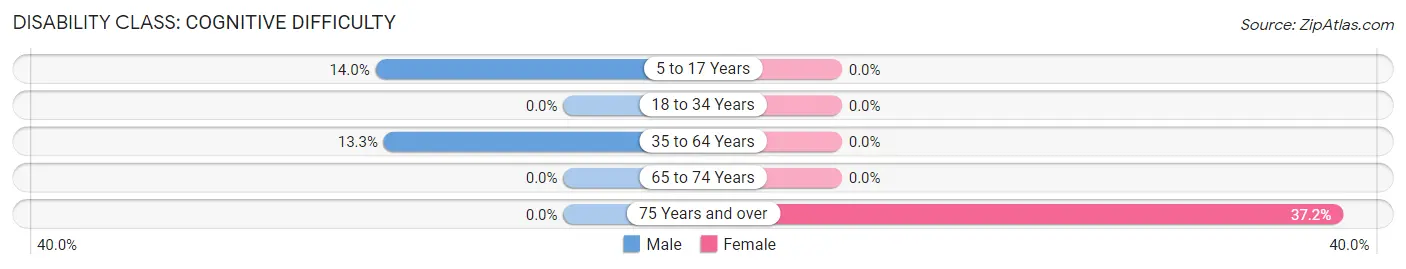
| Age Bracket | Male | Female |
| 5 to 17 Years | 12 (14.0%) | 0 (0.0%) |
| 18 to 34 Years | 0 (0.0%) | 0 (0.0%) |
| 35 to 64 Years | 22 (13.3%) | 0 (0.0%) |
| 65 to 74 Years | 0 (0.0%) | 0 (0.0%) |
| 75 Years and over | 0 (0.0%) | 32 (37.2%) |
Disability Class: Ambulatory Difficulty
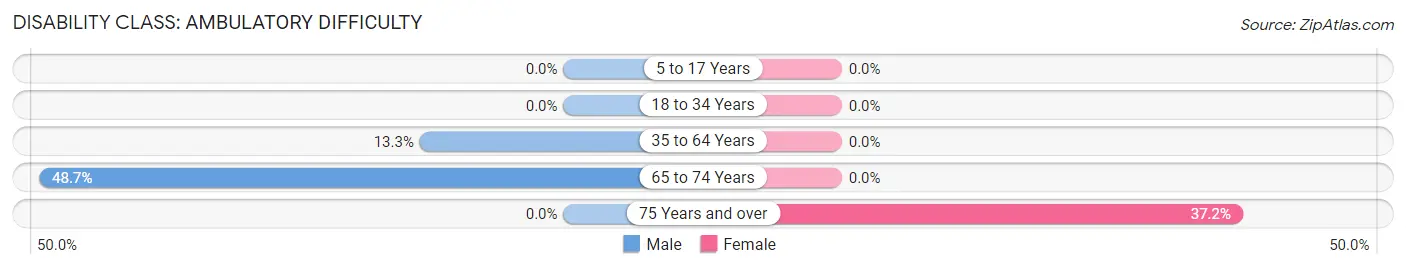
| Age Bracket | Male | Female |
| 5 to 17 Years | 0 (0.0%) | 0 (0.0%) |
| 18 to 34 Years | 0 (0.0%) | 0 (0.0%) |
| 35 to 64 Years | 22 (13.3%) | 0 (0.0%) |
| 65 to 74 Years | 18 (48.6%) | 0 (0.0%) |
| 75 Years and over | 0 (0.0%) | 32 (37.2%) |
Disability Class: Self-Care Difficulty
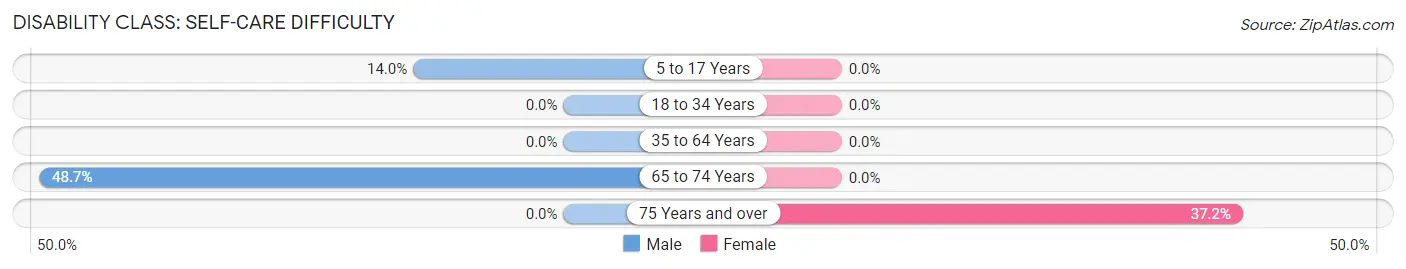
| Age Bracket | Male | Female |
| 5 to 17 Years | 12 (14.0%) | 0 (0.0%) |
| 18 to 34 Years | 0 (0.0%) | 0 (0.0%) |
| 35 to 64 Years | 0 (0.0%) | 0 (0.0%) |
| 65 to 74 Years | 18 (48.6%) | 0 (0.0%) |
| 75 Years and over | 0 (0.0%) | 32 (37.2%) |
Technology Access in Heidelberg
Computing Device Access in Heidelberg
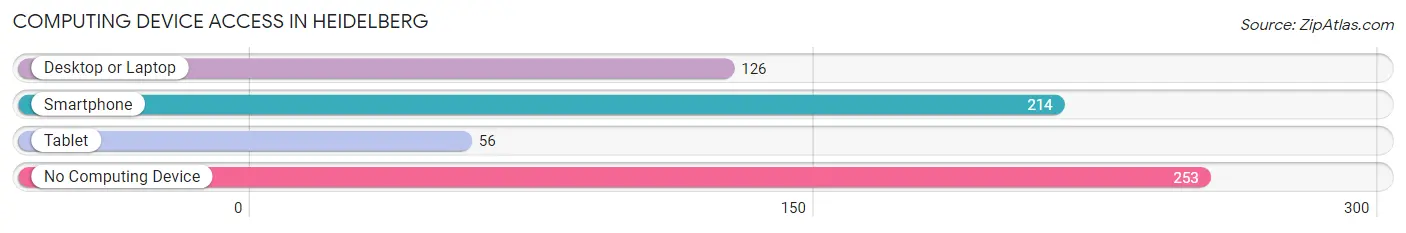
| Device Type | # Households | % Households |
| Desktop or Laptop | 126 | 27.0% |
| Smartphone | 214 | 45.8% |
| Tablet | 56 | 12.0% |
| No Computing Device | 253 | 54.2% |
| Total | 467 | 100.0% |
Internet Access in Heidelberg
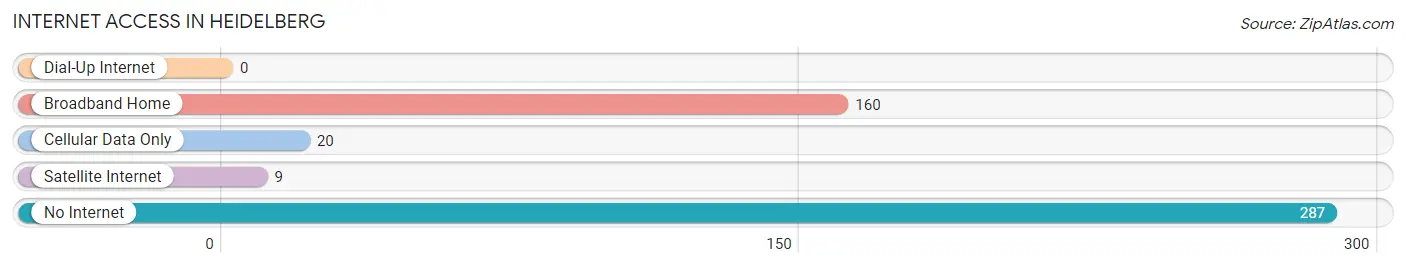
| Internet Type | # Households | % Households |
| Dial-Up Internet | 0 | 0.0% |
| Broadband Home | 160 | 34.3% |
| Cellular Data Only | 20 | 4.3% |
| Satellite Internet | 9 | 1.9% |
| No Internet | 287 | 61.5% |
| Total | 467 | 100.0% |
Heidelberg Summary
Heidelberg, Texas is a small town located in the southeastern corner of Texas, in the county of Fayette. It is situated on the banks of the Colorado River, and is part of the Austin-Round Rock metropolitan area. The town has a population of just over 1,000 people, and is known for its rural charm and small-town atmosphere.
History
Heidelberg was founded in 1845 by German immigrants who had come to the area in search of a new life. The town was named after the German city of Heidelberg, and the settlers quickly established a thriving community. The town was incorporated in 1876, and the first post office was established in 1877.
In the early 1900s, Heidelberg was a thriving agricultural community, with cotton, corn, and other crops being grown in the area. The town also had a number of businesses, including a general store, a blacksmith shop, and a hotel.
In the 1950s, the town began to decline as many of the residents moved away in search of better opportunities. The population dropped to just over 500 by the 1970s, and the town was in danger of becoming a ghost town. However, in the 1980s, the town began to experience a resurgence, as new businesses and residents moved into the area.
Geography
Heidelberg is located in the southeastern corner of Texas, in the county of Fayette. It is situated on the banks of the Colorado River, and is part of the Austin-Round Rock metropolitan area. The town is located about 50 miles east of Austin, and about 30 miles west of Houston.
The town is situated on a flat plain, with the Colorado River running through the center of town. The terrain is mostly flat, with some rolling hills in the surrounding area. The climate is hot and humid in the summer, and mild in the winter.
Economy
Heidelberg’s economy is largely based on agriculture, with cotton, corn, and other crops being grown in the area. The town also has a number of small businesses, including a general store, a blacksmith shop, and a hotel.
The town is also home to a number of manufacturing companies, including a furniture factory and a plastics factory. The town also has a number of restaurants and bars, as well as a few small shops.
Demographics
As of the 2010 census, the population of Heidelberg was 1,072. The racial makeup of the town was 94.3% White, 0.7% African American, 0.2% Native American, 0.2% Asian, 0.1% Pacific Islander, 3.2% from other races, and 1.4% from two or more races. Hispanic or Latino of any race were 6.2% of the population.
The median household income in Heidelberg was $37,500, and the median family income was $41,250. The per capita income was $17,845. About 11.2% of families and 13.2% of the population were below the poverty line, including 17.2% of those under age 18 and 8.3% of those age 65 or over.
Common Questions
What is Per Capita Income in Heidelberg?
Per Capita income in Heidelberg is $9,513.
What is the Median Family Income in Heidelberg?
Median Family Income in Heidelberg is $31,921.
What is the Median Household income in Heidelberg?
Median Household Income in Heidelberg is $31,123.
What is Income or Wage Gap in Heidelberg?
Income or Wage Gap in Heidelberg is 30.5%.
Women in Heidelberg earn 69.5 cents for every dollar earned by a man.
What is Inequality or Gini Index in Heidelberg?
Inequality or Gini Index in Heidelberg is 0.29.
What is the Total Population of Heidelberg?
Total Population of Heidelberg is 1,703.
What is the Total Male Population of Heidelberg?
Total Male Population of Heidelberg is 836.
What is the Total Female Population of Heidelberg?
Total Female Population of Heidelberg is 867.
What is the Ratio of Males per 100 Females in Heidelberg?
There are 96.42 Males per 100 Females in Heidelberg.
What is the Ratio of Females per 100 Males in Heidelberg?
There are 103.71 Females per 100 Males in Heidelberg.
What is the Median Population Age in Heidelberg?
Median Population Age in Heidelberg is 31.1 Years.
What is the Average Family Size in Heidelberg
Average Family Size in Heidelberg is 4.3 People.
What is the Average Household Size in Heidelberg
Average Household Size in Heidelberg is 3.6 People.
How Large is the Labor Force in Heidelberg?
There are 1,107 People in the Labor Forcein in Heidelberg.
What is the Percentage of People in the Labor Force in Heidelberg?
75.8% of People are in the Labor Force in Heidelberg.
What is the Unemployment Rate in Heidelberg?
Unemployment Rate in Heidelberg is 35.2%.