Siesta Shores, TX Map & Demographics
Siesta Shores Map
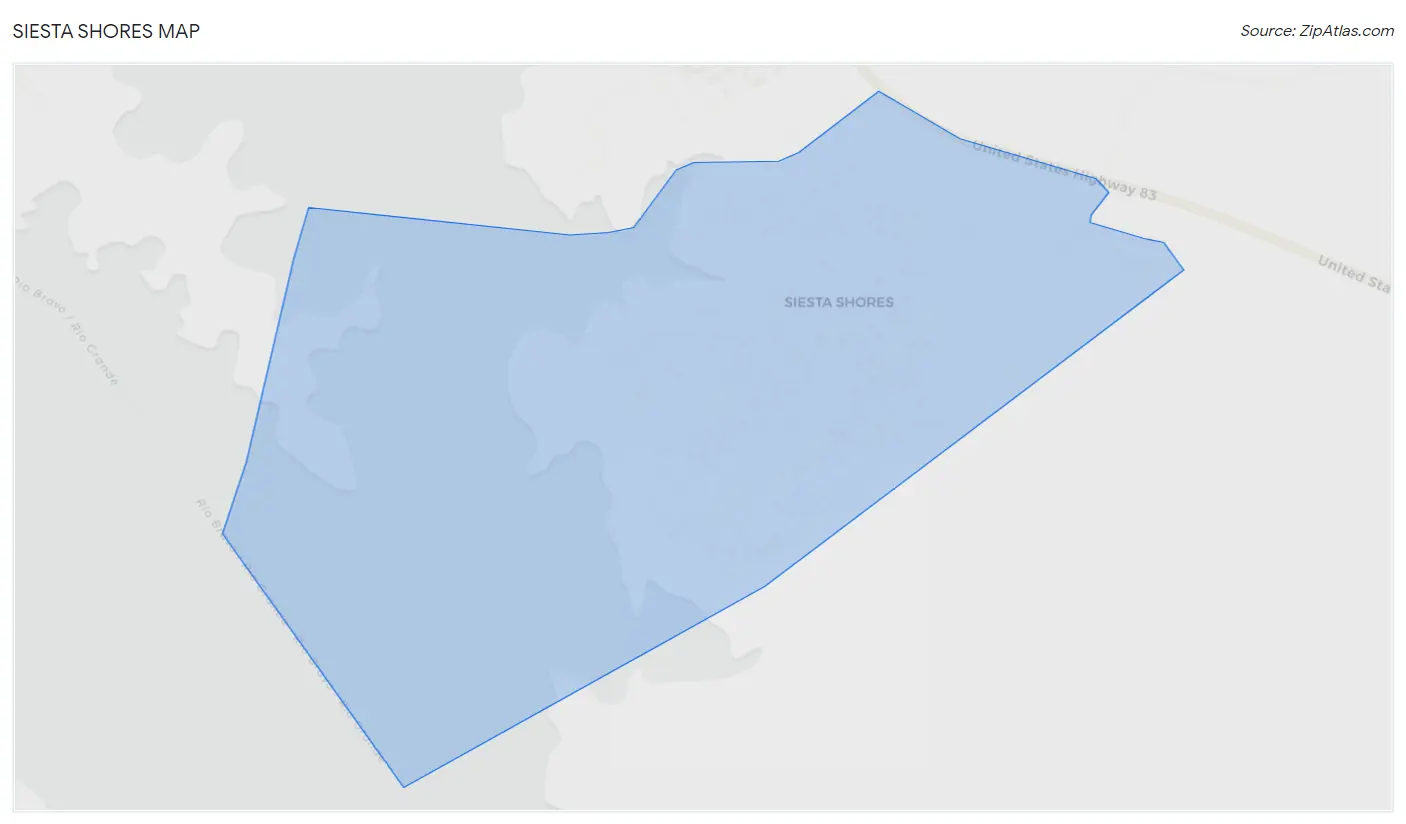
Siesta Shores Overview
$12,125
PER CAPITA INCOME
$33,750
AVG FAMILY INCOME
$34,733
AVG HOUSEHOLD INCOME
0.36
INEQUALITY / GINI INDEX
1,619
TOTAL POPULATION
950
MALE POPULATION
669
FEMALE POPULATION
142.00
MALES / 100 FEMALES
70.42
FEMALES / 100 MALES
21.4
MEDIAN AGE
4.5
AVG FAMILY SIZE
3.8
AVG HOUSEHOLD SIZE
528
LABOR FORCE [ PEOPLE ]
56.2%
PERCENT IN LABOR FORCE
18.4%
UNEMPLOYMENT RATE
Income in Siesta Shores
Income Overview in Siesta Shores
Per Capita Income in Siesta Shores is $12,125, while median incomes of families and households are $33,750 and $34,733 respectively.
| Characteristic | Number | Measure |
| Per Capita Income | 1,619 | $12,125 |
| Median Family Income | 311 | $33,750 |
| Mean Family Income | 311 | $34,830 |
| Median Household Income | 427 | $34,733 |
| Mean Household Income | 427 | $42,378 |
| Income Deficit | 311 | $0 |
| Wage / Income Gap (%) | 1,619 | 0.00% |
| Wage / Income Gap ($) | 1,619 | 100.00¢ per $1 |
| Gini / Inequality Index | 1,619 | 0.36 |
Earnings by Sex in Siesta Shores
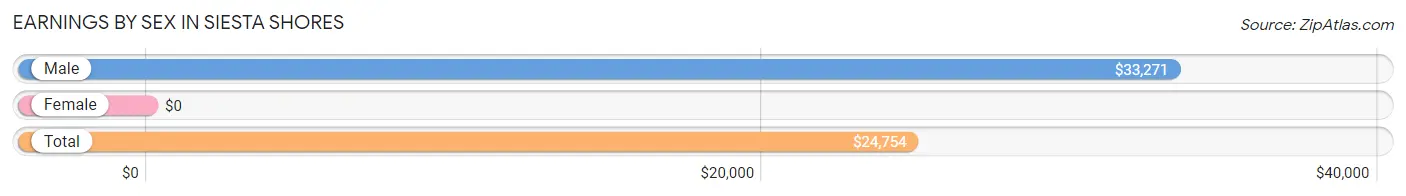
| Sex | Number | Average Earnings |
| Male | 319 (74.0%) | $33,271 |
| Female | 112 (26.0%) | $0 |
| Total | 431 (100.0%) | $24,754 |
Earnings by Sex by Income Bracket in Siesta Shores
The most common earnings brackets in Siesta Shores are $22,500 to $24,999 for men (56 | 17.5%) and $2,500 to $4,999 for women (53 | 47.3%).
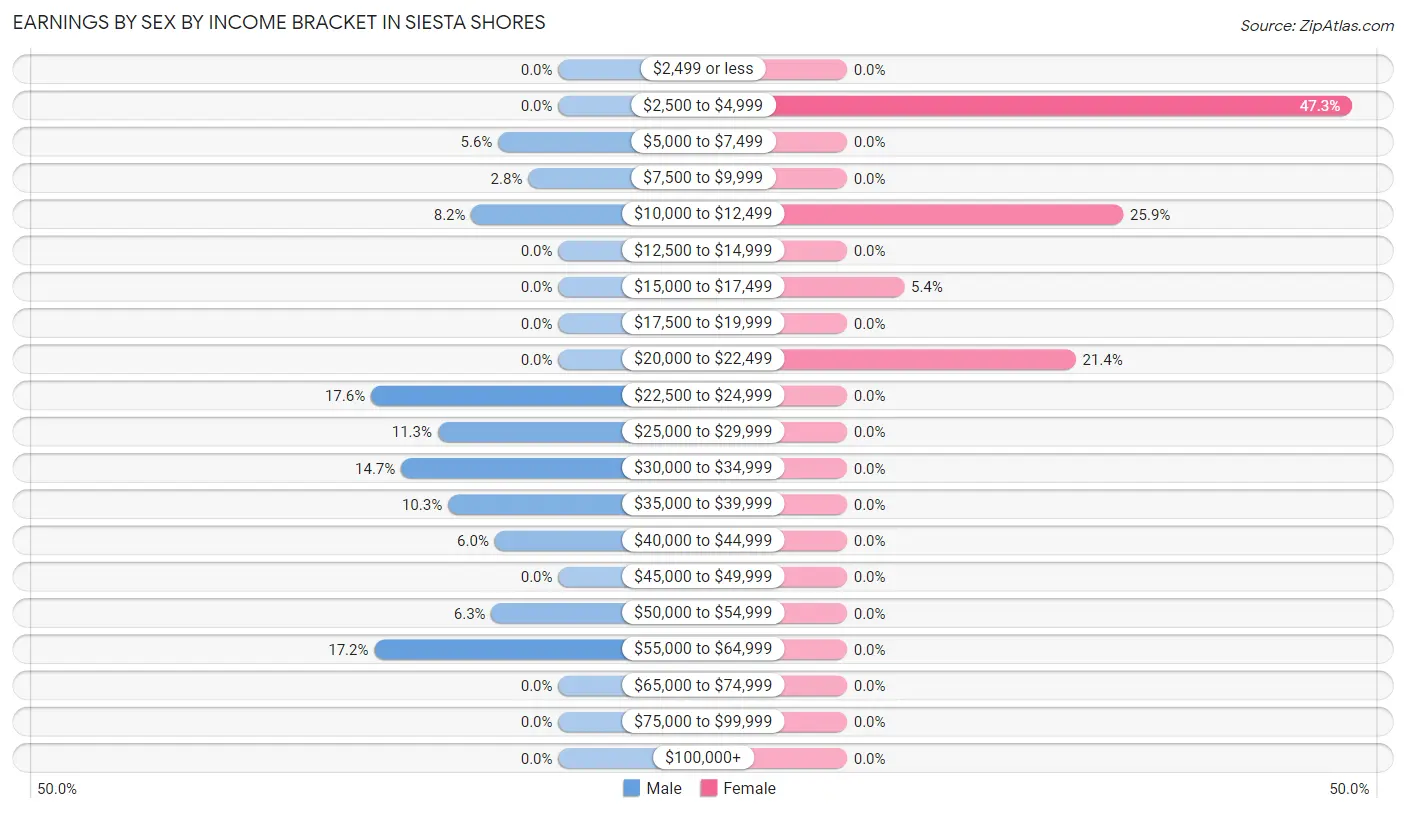
| Income | Male | Female |
| $2,499 or less | 0 (0.0%) | 0 (0.0%) |
| $2,500 to $4,999 | 0 (0.0%) | 53 (47.3%) |
| $5,000 to $7,499 | 18 (5.6%) | 0 (0.0%) |
| $7,500 to $9,999 | 9 (2.8%) | 0 (0.0%) |
| $10,000 to $12,499 | 26 (8.2%) | 29 (25.9%) |
| $12,500 to $14,999 | 0 (0.0%) | 0 (0.0%) |
| $15,000 to $17,499 | 0 (0.0%) | 6 (5.4%) |
| $17,500 to $19,999 | 0 (0.0%) | 0 (0.0%) |
| $20,000 to $22,499 | 0 (0.0%) | 24 (21.4%) |
| $22,500 to $24,999 | 56 (17.5%) | 0 (0.0%) |
| $25,000 to $29,999 | 36 (11.3%) | 0 (0.0%) |
| $30,000 to $34,999 | 47 (14.7%) | 0 (0.0%) |
| $35,000 to $39,999 | 33 (10.3%) | 0 (0.0%) |
| $40,000 to $44,999 | 19 (6.0%) | 0 (0.0%) |
| $45,000 to $49,999 | 0 (0.0%) | 0 (0.0%) |
| $50,000 to $54,999 | 20 (6.3%) | 0 (0.0%) |
| $55,000 to $64,999 | 55 (17.2%) | 0 (0.0%) |
| $65,000 to $74,999 | 0 (0.0%) | 0 (0.0%) |
| $75,000 to $99,999 | 0 (0.0%) | 0 (0.0%) |
| $100,000+ | 0 (0.0%) | 0 (0.0%) |
| Total | 319 (100.0%) | 112 (100.0%) |
Earnings by Sex by Educational Attainment in Siesta Shores
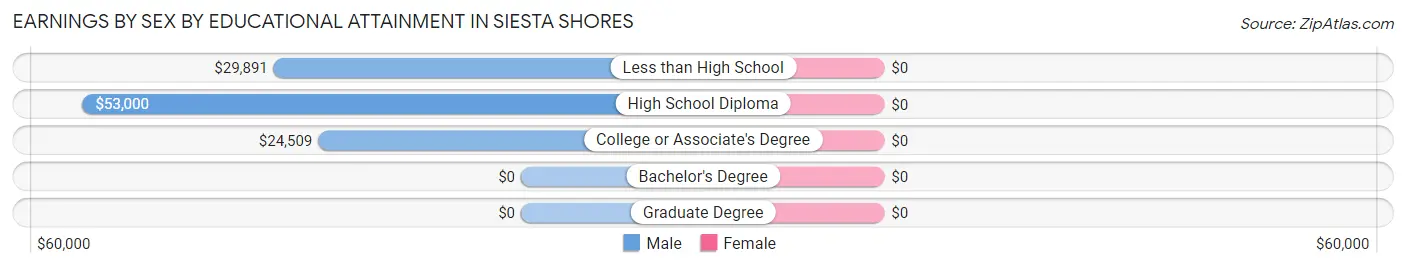
| Educational Attainment | Male Income | Female Income |
| Less than High School | $29,891 | $0 |
| High School Diploma | $53,000 | $0 |
| College or Associate's Degree | $24,509 | $0 |
| Bachelor's Degree | - | - |
| Graduate Degree | - | - |
| Total | $29,861 | $0 |
Family Income in Siesta Shores
Family Income Brackets in Siesta Shores
According to the Siesta Shores family income data, there are 77 families falling into the $25,000 to $34,999 income range, which is the most common income bracket and makes up 24.8% of all families.
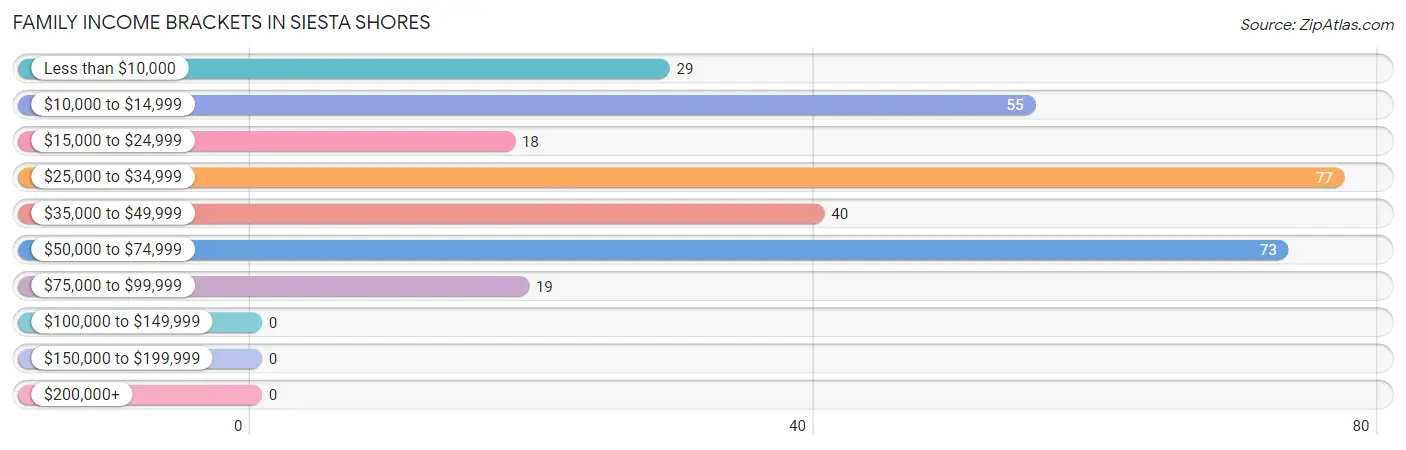
| Income Bracket | # Families | % Families |
| Less than $10,000 | 29 | 9.3% |
| $10,000 to $14,999 | 55 | 17.7% |
| $15,000 to $24,999 | 18 | 5.8% |
| $25,000 to $34,999 | 77 | 24.8% |
| $35,000 to $49,999 | 40 | 12.9% |
| $50,000 to $74,999 | 73 | 23.5% |
| $75,000 to $99,999 | 19 | 6.1% |
| $100,000 to $149,999 | 0 | 0.0% |
| $150,000 to $199,999 | 0 | 0.0% |
| $200,000+ | 0 | 0.0% |
Family Income by Famaliy Size in Siesta Shores
3-person families (68 | 21.9%) account for the highest median family income in Siesta Shores with $38,188 per family, while 3-person families (68 | 21.9%) have the highest median income of $12,729 per family member.
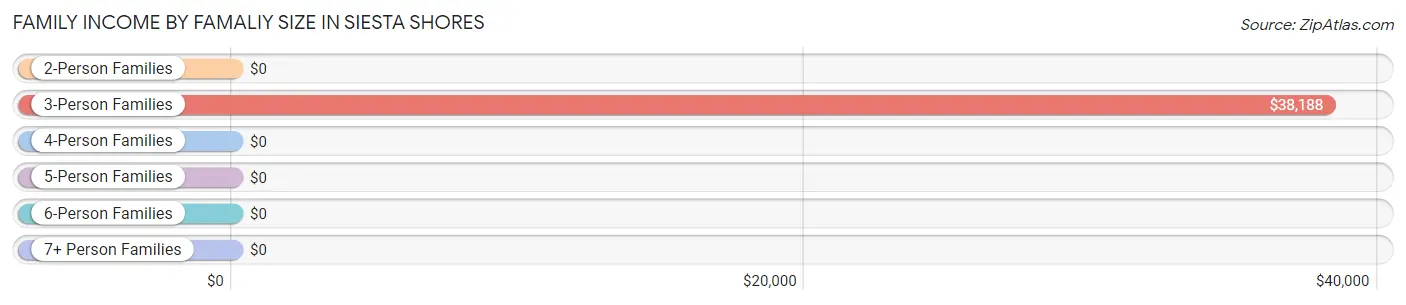
| Income Bracket | # Families | Median Income |
| 2-Person Families | 96 (30.9%) | $0 |
| 3-Person Families | 68 (21.9%) | $38,188 |
| 4-Person Families | 29 (9.3%) | $0 |
| 5-Person Families | 73 (23.5%) | $0 |
| 6-Person Families | 19 (6.1%) | $0 |
| 7+ Person Families | 26 (8.4%) | $0 |
| Total | 311 (100.0%) | $33,750 |
Family Income by Number of Earners in Siesta Shores
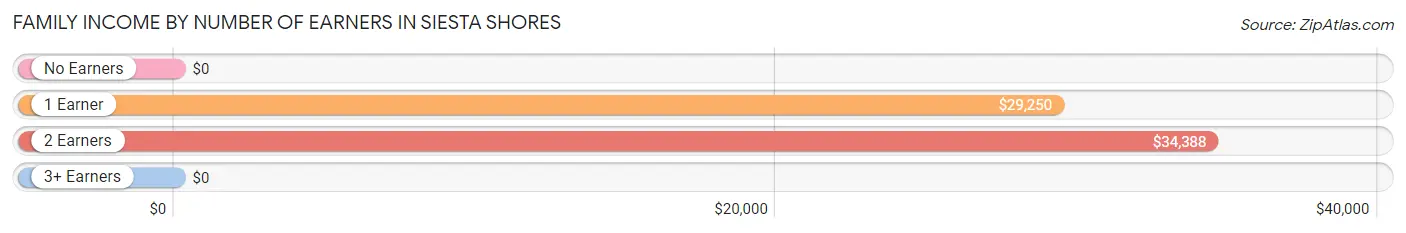
| Number of Earners | # Families | Median Income |
| No Earners | 52 (16.7%) | $0 |
| 1 Earner | 188 (60.5%) | $29,250 |
| 2 Earners | 71 (22.8%) | $34,388 |
| 3+ Earners | 0 (0.0%) | $0 |
| Total | 311 (100.0%) | $33,750 |
Household Income in Siesta Shores
Household Income Brackets in Siesta Shores
With 119 households falling in the category, the $25,000 to $34,999 income range is the most frequent in Siesta Shores, accounting for 27.9% of all households.
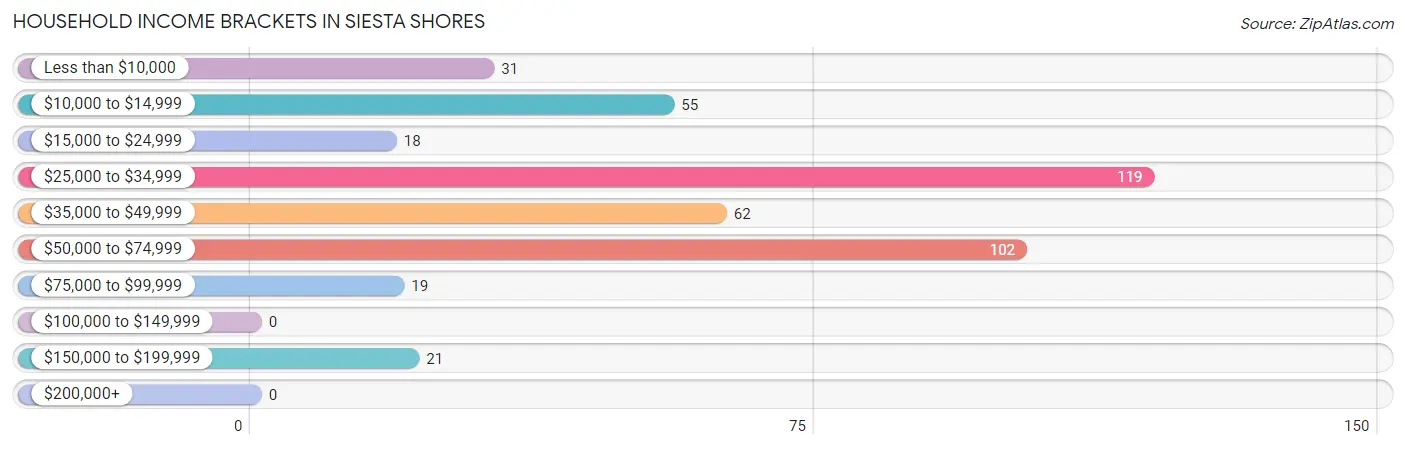
| Income Bracket | # Households | % Households |
| Less than $10,000 | 31 | 7.3% |
| $10,000 to $14,999 | 55 | 12.9% |
| $15,000 to $24,999 | 18 | 4.2% |
| $25,000 to $34,999 | 119 | 27.9% |
| $35,000 to $49,999 | 62 | 14.5% |
| $50,000 to $74,999 | 102 | 23.9% |
| $75,000 to $99,999 | 19 | 4.4% |
| $100,000 to $149,999 | 0 | 0.0% |
| $150,000 to $199,999 | 21 | 4.9% |
| $200,000+ | 0 | 0.0% |
Household Income by Householder Age in Siesta Shores
The median household income in Siesta Shores is $34,733, with the highest median household income of $36,250 found in the 65+ years age bracket for the primary householder. A total of 110 households (25.8%) fall into this category. Meanwhile, the 15 to 24 years age bracket for the primary householder has the lowest median household income of $0, with 48 households (11.2%) in this group.
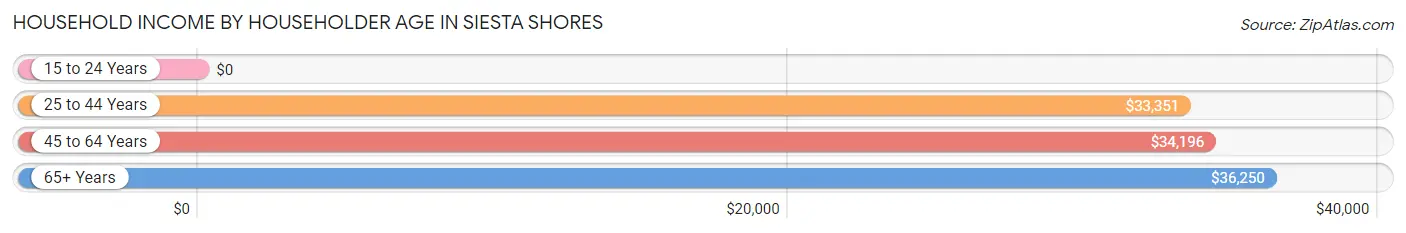
| Income Bracket | # Households | Median Income |
| 15 to 24 Years | 48 (11.2%) | $0 |
| 25 to 44 Years | 142 (33.3%) | $33,351 |
| 45 to 64 Years | 127 (29.7%) | $34,196 |
| 65+ Years | 110 (25.8%) | $36,250 |
| Total | 427 (100.0%) | $34,733 |
Poverty in Siesta Shores
Income Below Poverty by Sex and Age in Siesta Shores
With 48.5% poverty level for males and 42.3% for females among the residents of Siesta Shores, 6 to 11 year old males and under 5 year old females are the most vulnerable to poverty, with 236 males (100.0%) and 28 females (100.0%) in their respective age groups living below the poverty level.
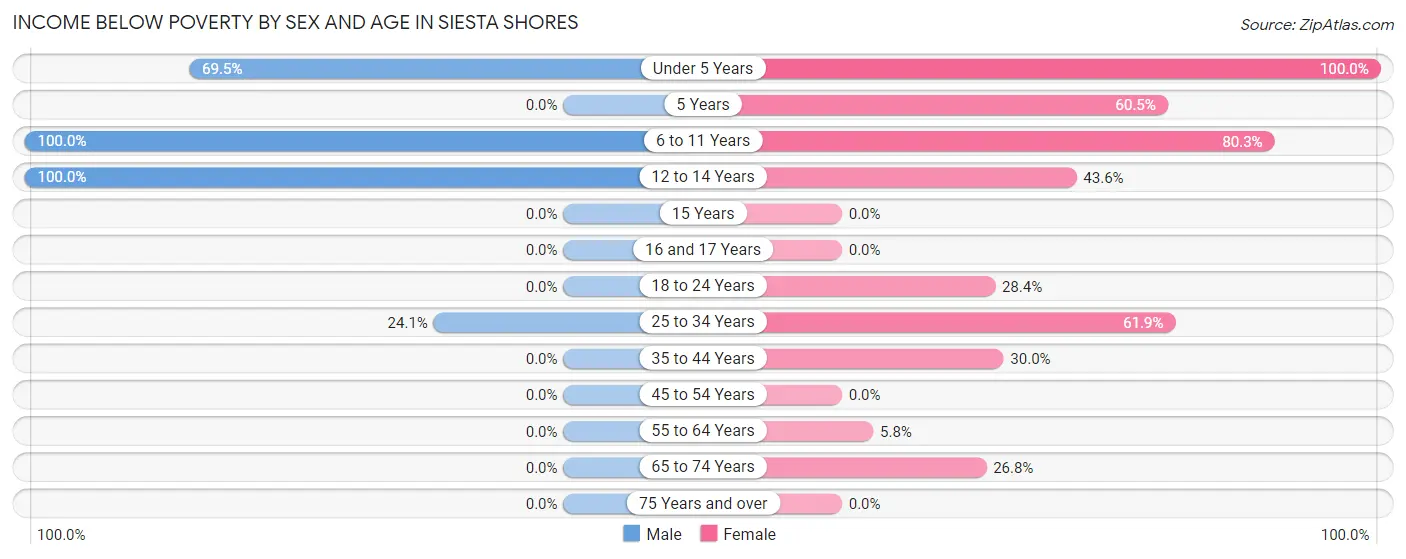
| Age Bracket | Male | Female |
| Under 5 Years | 132 (69.5%) | 28 (100.0%) |
| 5 Years | 0 (0.0%) | 26 (60.5%) |
| 6 to 11 Years | 236 (100.0%) | 53 (80.3%) |
| 12 to 14 Years | 54 (100.0%) | 27 (43.5%) |
| 15 Years | 0 (0.0%) | 0 (0.0%) |
| 16 and 17 Years | 0 (0.0%) | 0 (0.0%) |
| 18 to 24 Years | 0 (0.0%) | 29 (28.4%) |
| 25 to 34 Years | 39 (24.1%) | 65 (61.9%) |
| 35 to 44 Years | 0 (0.0%) | 24 (30.0%) |
| 45 to 54 Years | 0 (0.0%) | 0 (0.0%) |
| 55 to 64 Years | 0 (0.0%) | 5 (5.8%) |
| 65 to 74 Years | 0 (0.0%) | 26 (26.8%) |
| 75 Years and over | 0 (0.0%) | 0 (0.0%) |
| Total | 461 (48.5%) | 283 (42.3%) |
Income Above Poverty by Sex and Age in Siesta Shores
According to the poverty statistics in Siesta Shores, males aged 18 to 24 years and females aged 55 to 64 years are the age groups that are most secure financially, with 100.0% of males and 94.2% of females in these age groups living above the poverty line.
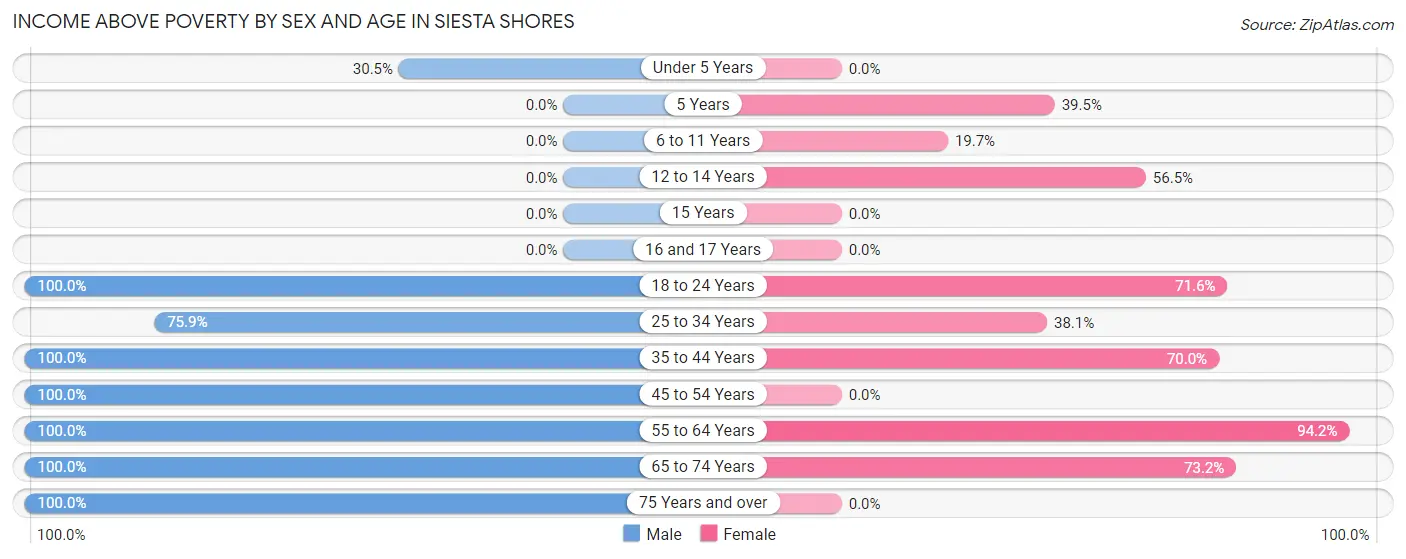
| Age Bracket | Male | Female |
| Under 5 Years | 58 (30.5%) | 0 (0.0%) |
| 5 Years | 0 (0.0%) | 17 (39.5%) |
| 6 to 11 Years | 0 (0.0%) | 13 (19.7%) |
| 12 to 14 Years | 0 (0.0%) | 35 (56.5%) |
| 15 Years | 0 (0.0%) | 0 (0.0%) |
| 16 and 17 Years | 0 (0.0%) | 0 (0.0%) |
| 18 to 24 Years | 130 (100.0%) | 73 (71.6%) |
| 25 to 34 Years | 123 (75.9%) | 40 (38.1%) |
| 35 to 44 Years | 23 (100.0%) | 56 (70.0%) |
| 45 to 54 Years | 62 (100.0%) | 0 (0.0%) |
| 55 to 64 Years | 30 (100.0%) | 81 (94.2%) |
| 65 to 74 Years | 27 (100.0%) | 71 (73.2%) |
| 75 Years and over | 36 (100.0%) | 0 (0.0%) |
| Total | 489 (51.5%) | 386 (57.7%) |
Income Below Poverty Among Married-Couple Families in Siesta Shores
The poverty statistics for married-couple families in Siesta Shores show that 13.8% or 24 of the total 174 families live below the poverty line. Families with 3 or 4 children have the highest poverty rate of 38.1%, comprising of 24 families. On the other hand, families with no children have the lowest poverty rate of 0.0%, which includes 0 families.
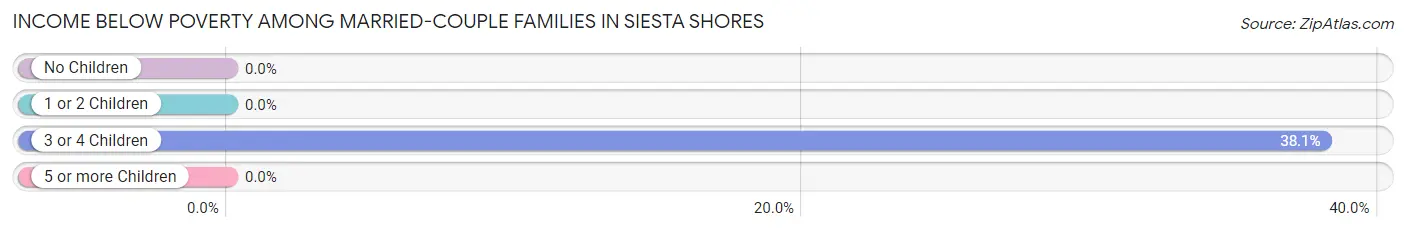
| Children | Above Poverty | Below Poverty |
| No Children | 88 (100.0%) | 0 (0.0%) |
| 1 or 2 Children | 23 (100.0%) | 0 (0.0%) |
| 3 or 4 Children | 39 (61.9%) | 24 (38.1%) |
| 5 or more Children | 0 (0.0%) | 0 (0.0%) |
| Total | 150 (86.2%) | 24 (13.8%) |
Income Below Poverty Among Single-Parent Households in Siesta Shores
According to the poverty data in Siesta Shores, 53.1% or 26 single-father households and 65.9% or 58 single-mother households are living below the poverty line. Among single-father households, those with 5 or more children have the highest poverty rate, with 26 households (100.0%) experiencing poverty. Likewise, among single-mother households, those with 3 or 4 children have the highest poverty rate, with 58 households (100.0%) falling below the poverty line.
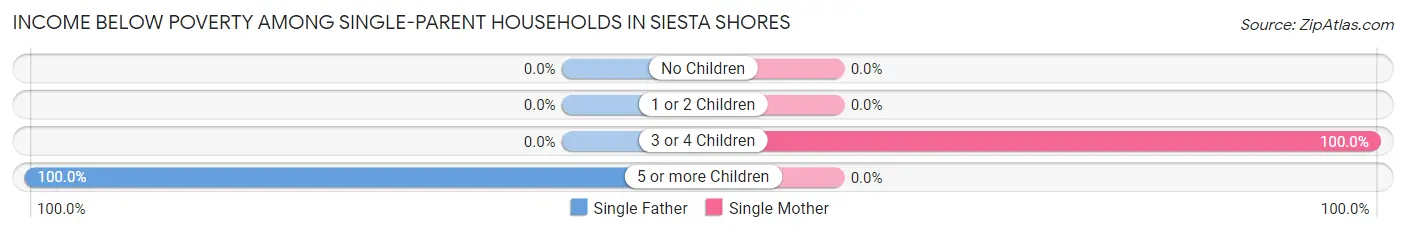
| Children | Single Father | Single Mother |
| No Children | 0 (0.0%) | 0 (0.0%) |
| 1 or 2 Children | 0 (0.0%) | 0 (0.0%) |
| 3 or 4 Children | 0 (0.0%) | 58 (100.0%) |
| 5 or more Children | 26 (100.0%) | 0 (0.0%) |
| Total | 26 (53.1%) | 58 (65.9%) |
Income Below Poverty Among Married-Couple vs Single-Parent Households in Siesta Shores
The poverty data for Siesta Shores shows that 24 of the married-couple family households (13.8%) and 84 of the single-parent households (61.3%) are living below the poverty level. Within the married-couple family households, those with 3 or 4 children have the highest poverty rate, with 24 households (38.1%) falling below the poverty line. Among the single-parent households, those with 3 or 4 children have the highest poverty rate, with 58 household (100.0%) living below poverty.
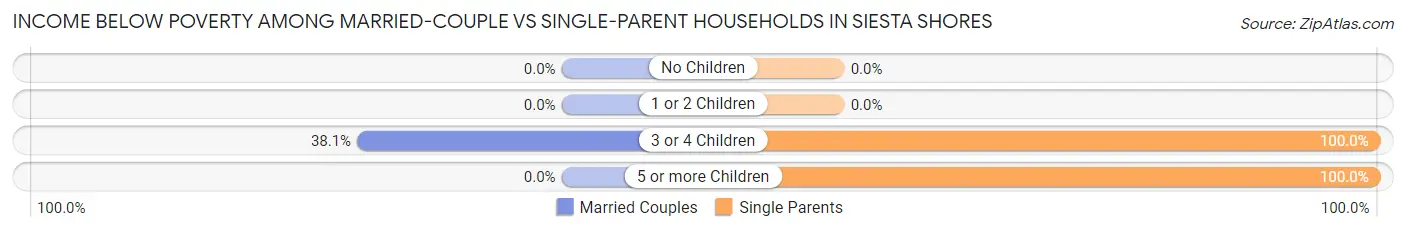
| Children | Married-Couple Families | Single-Parent Households |
| No Children | 0 (0.0%) | 0 (0.0%) |
| 1 or 2 Children | 0 (0.0%) | 0 (0.0%) |
| 3 or 4 Children | 24 (38.1%) | 58 (100.0%) |
| 5 or more Children | 0 (0.0%) | 26 (100.0%) |
| Total | 24 (13.8%) | 84 (61.3%) |
Race in Siesta Shores
The most populous races in Siesta Shores are Hispanic or Latino (1,619 | 100.0%), White / Caucasian (1,090 | 67.3%), and Two or more Races (529 | 32.7%).
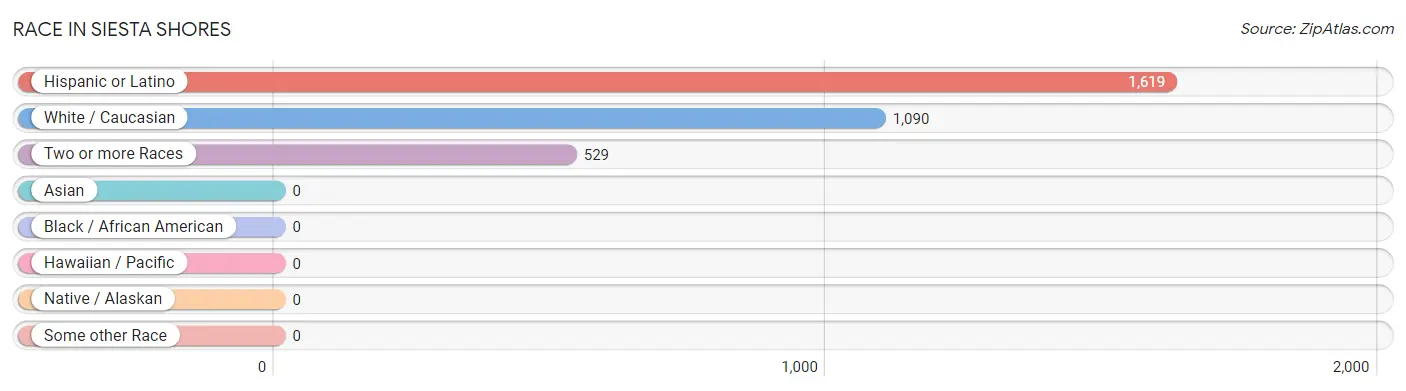
| Race | # Population | % Population |
| Asian | 0 | 0.0% |
| Black / African American | 0 | 0.0% |
| Hawaiian / Pacific | 0 | 0.0% |
| Hispanic or Latino | 1,619 | 100.0% |
| Native / Alaskan | 0 | 0.0% |
| White / Caucasian | 1,090 | 67.3% |
| Two or more Races | 529 | 32.7% |
| Some other Race | 0 | 0.0% |
| Total | 1,619 | 100.0% |
Ancestry in Siesta Shores
The most populous ancestries reported in Siesta Shores are , and Mexican (1,595 | 98.5%), together accounting for 98.5% of all Siesta Shores residents.

| Ancestry | # Population | % Population |
| Mexican | 1,595 | 98.5% | View All 1 Rows |
Immigrants in Siesta Shores
The most numerous immigrant groups reported in Siesta Shores came from Central America (243 | 15.0%), Latin America (243 | 15.0%), Mexico (215 | 13.3%), and Guatemala (28 | 1.7%), together accounting for 45.0% of all Siesta Shores residents.
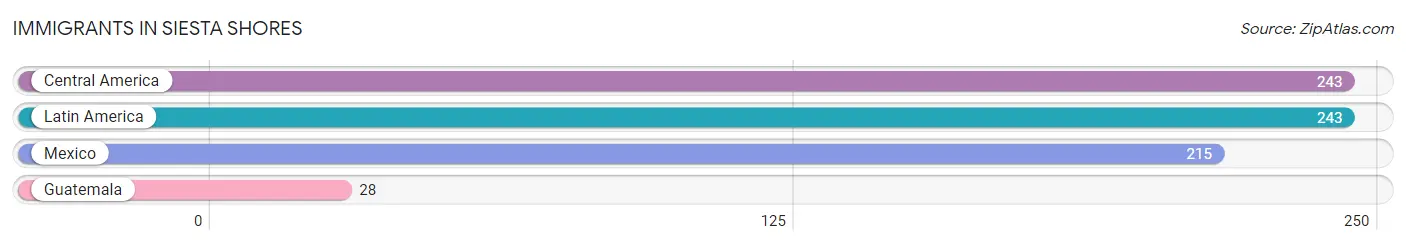
| Immigration Origin | # Population | % Population |
| Central America | 243 | 15.0% |
| Guatemala | 28 | 1.7% |
| Latin America | 243 | 15.0% |
| Mexico | 215 | 13.3% | View All 4 Rows |
Sex and Age in Siesta Shores
Sex and Age in Siesta Shores
The most populous age groups in Siesta Shores are Under 5 Years (190 | 20.0%) for men and 20 to 24 Years (102 | 15.2%) for women.
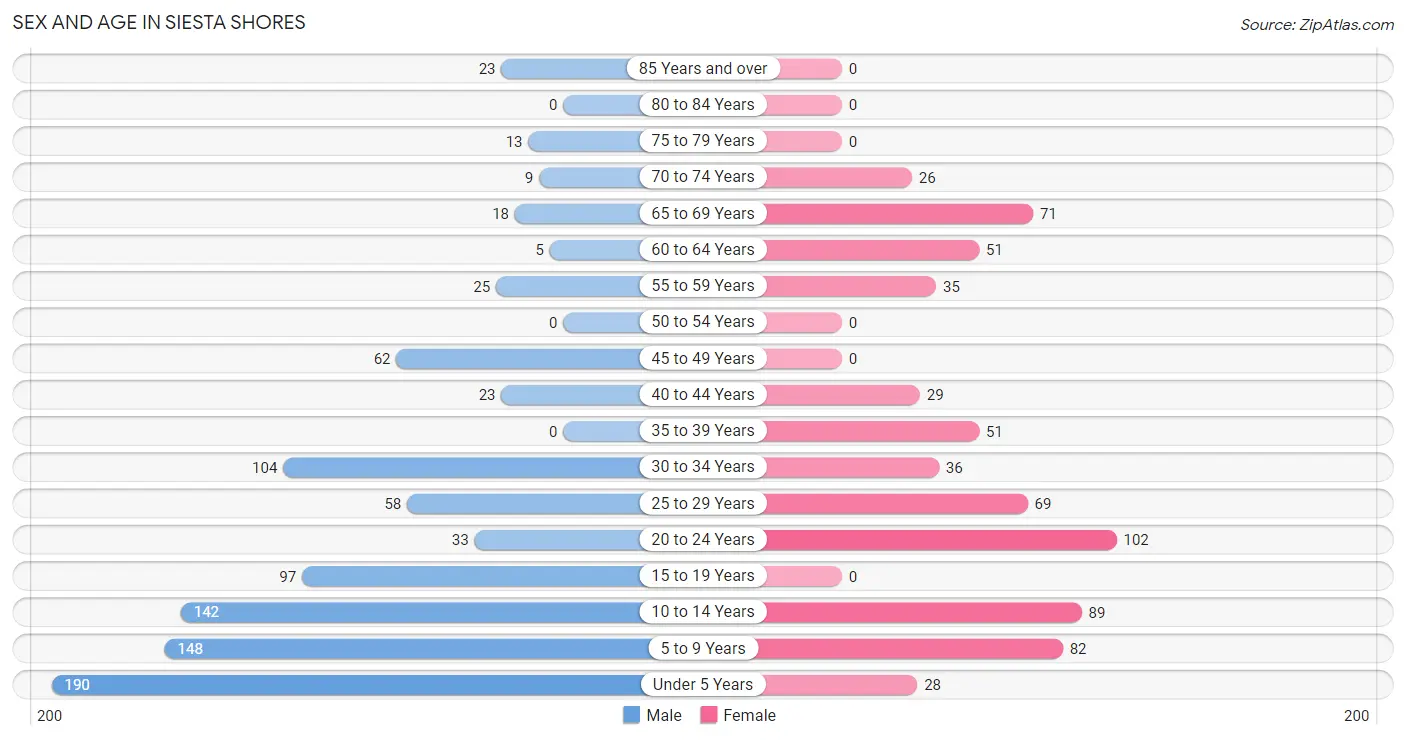
| Age Bracket | Male | Female |
| Under 5 Years | 190 (20.0%) | 28 (4.2%) |
| 5 to 9 Years | 148 (15.6%) | 82 (12.3%) |
| 10 to 14 Years | 142 (14.9%) | 89 (13.3%) |
| 15 to 19 Years | 97 (10.2%) | 0 (0.0%) |
| 20 to 24 Years | 33 (3.5%) | 102 (15.2%) |
| 25 to 29 Years | 58 (6.1%) | 69 (10.3%) |
| 30 to 34 Years | 104 (11.0%) | 36 (5.4%) |
| 35 to 39 Years | 0 (0.0%) | 51 (7.6%) |
| 40 to 44 Years | 23 (2.4%) | 29 (4.3%) |
| 45 to 49 Years | 62 (6.5%) | 0 (0.0%) |
| 50 to 54 Years | 0 (0.0%) | 0 (0.0%) |
| 55 to 59 Years | 25 (2.6%) | 35 (5.2%) |
| 60 to 64 Years | 5 (0.5%) | 51 (7.6%) |
| 65 to 69 Years | 18 (1.9%) | 71 (10.6%) |
| 70 to 74 Years | 9 (0.9%) | 26 (3.9%) |
| 75 to 79 Years | 13 (1.4%) | 0 (0.0%) |
| 80 to 84 Years | 0 (0.0%) | 0 (0.0%) |
| 85 Years and over | 23 (2.4%) | 0 (0.0%) |
| Total | 950 (100.0%) | 669 (100.0%) |
Families and Households in Siesta Shores
Median Family Size in Siesta Shores
The median family size in Siesta Shores is 4.53 persons per family, with single male/father families (49 | 15.8%) accounting for the largest median family size of 7.8 persons per family. On the other hand, married-couple families (174 | 55.9%) represent the smallest median family size with 3.89 persons per family.
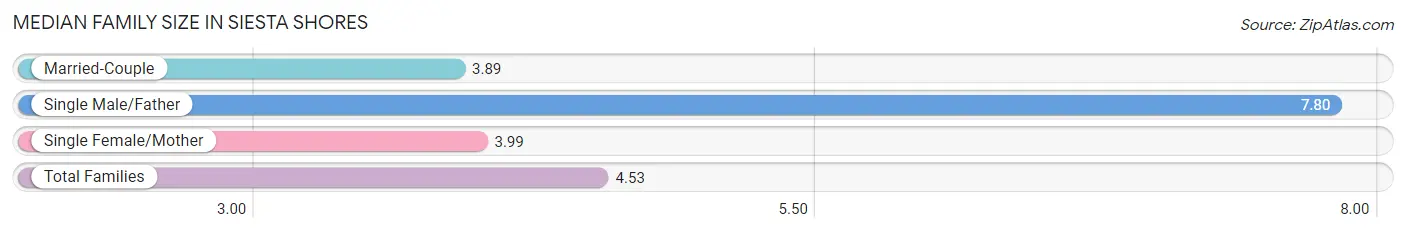
| Family Type | # Families | Family Size |
| Married-Couple | 174 (55.9%) | 3.89 |
| Single Male/Father | 49 (15.8%) | 7.80 |
| Single Female/Mother | 88 (28.3%) | 3.99 |
| Total Families | 311 (100.0%) | 4.53 |
Median Household Size in Siesta Shores
The median household size in Siesta Shores is 3.79 persons per household, with single male/father households (49 | 11.5%) accounting for the largest median household size of 8.53 persons per household. non-family households (116 | 27.2%) represent the smallest median household size with 1.24 persons per household.
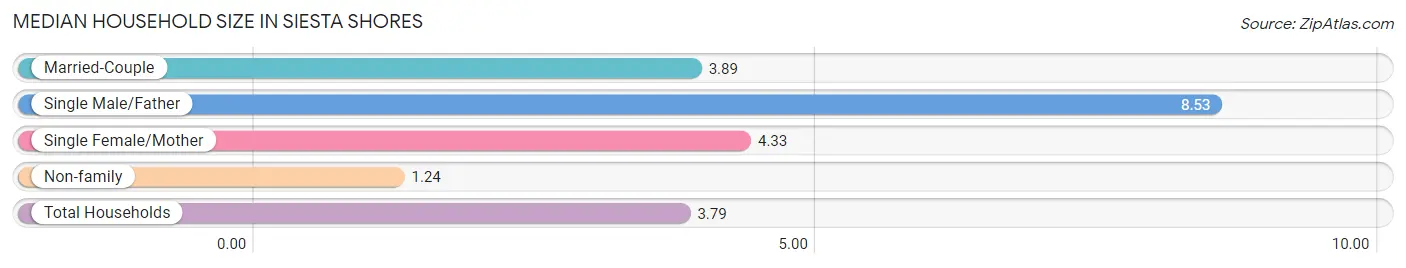
| Household Type | # Households | Household Size |
| Married-Couple | 174 (40.7%) | 3.89 |
| Single Male/Father | 49 (11.5%) | 8.53 |
| Single Female/Mother | 88 (20.6%) | 4.33 |
| Non-family | 116 (27.2%) | 1.24 |
| Total Households | 427 (100.0%) | 3.79 |
Household Size by Marriage Status in Siesta Shores
Out of a total of 427 households in Siesta Shores, 311 (72.8%) are family households, while 116 (27.2%) are nonfamily households. The most numerous type of family households are 5-person households, comprising 102, and the most common type of nonfamily households are 1-person households, comprising 103.
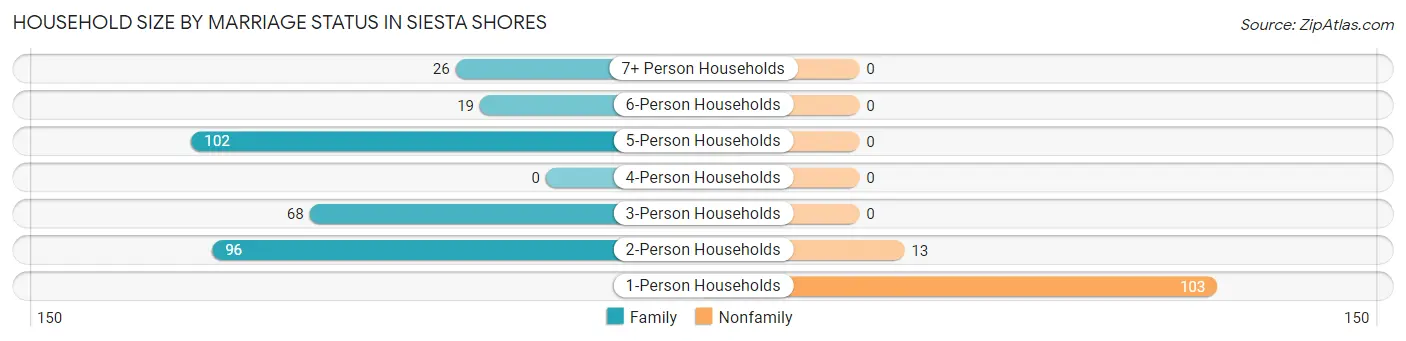
| Household Size | Family Households | Nonfamily Households |
| 1-Person Households | - | 103 (24.1%) |
| 2-Person Households | 96 (22.5%) | 13 (3.0%) |
| 3-Person Households | 68 (15.9%) | 0 (0.0%) |
| 4-Person Households | 0 (0.0%) | 0 (0.0%) |
| 5-Person Households | 102 (23.9%) | 0 (0.0%) |
| 6-Person Households | 19 (4.4%) | 0 (0.0%) |
| 7+ Person Households | 26 (6.1%) | 0 (0.0%) |
| Total | 311 (72.8%) | 116 (27.2%) |
Female Fertility in Siesta Shores
Fertility by Age in Siesta Shores
Average fertility rate in Siesta Shores is 167.0 births per 1,000 women. Women in the age bracket of 20 to 34 years have the highest fertility rate with 232.0 births per 1,000 women. Women in the age bracket of 20 to 34 years acount for 100.0% of all women with births.
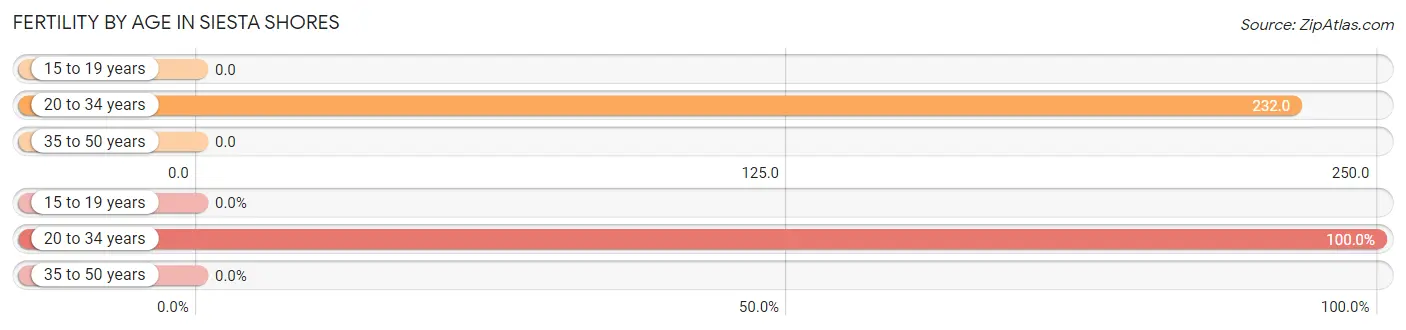
| Age Bracket | Women with Births | Births / 1,000 Women |
| 15 to 19 years | 0 (0.0%) | 0.0 |
| 20 to 34 years | 48 (100.0%) | 232.0 |
| 35 to 50 years | 0 (0.0%) | 0.0 |
| Total | 48 (100.0%) | 167.0 |
Fertility by Age by Marriage Status in Siesta Shores
39.6% of women with births (48) in Siesta Shores are married. The highest percentage of unmarried women with births falls into 20 to 34 years age bracket with 60.4% of them unmarried at the time of birth, while the lowest percentage of unmarried women with births belong to 20 to 34 years age bracket with 60.4% of them unmarried.
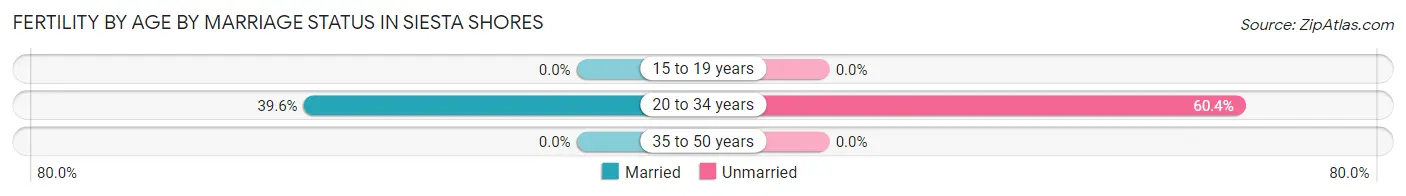
| Age Bracket | Married | Unmarried |
| 15 to 19 years | 0 (0.0%) | 0 (0.0%) |
| 20 to 34 years | 19 (39.6%) | 29 (60.4%) |
| 35 to 50 years | 0 (0.0%) | 0 (0.0%) |
| Total | 19 (39.6%) | 29 (60.4%) |
Fertility by Education in Siesta Shores
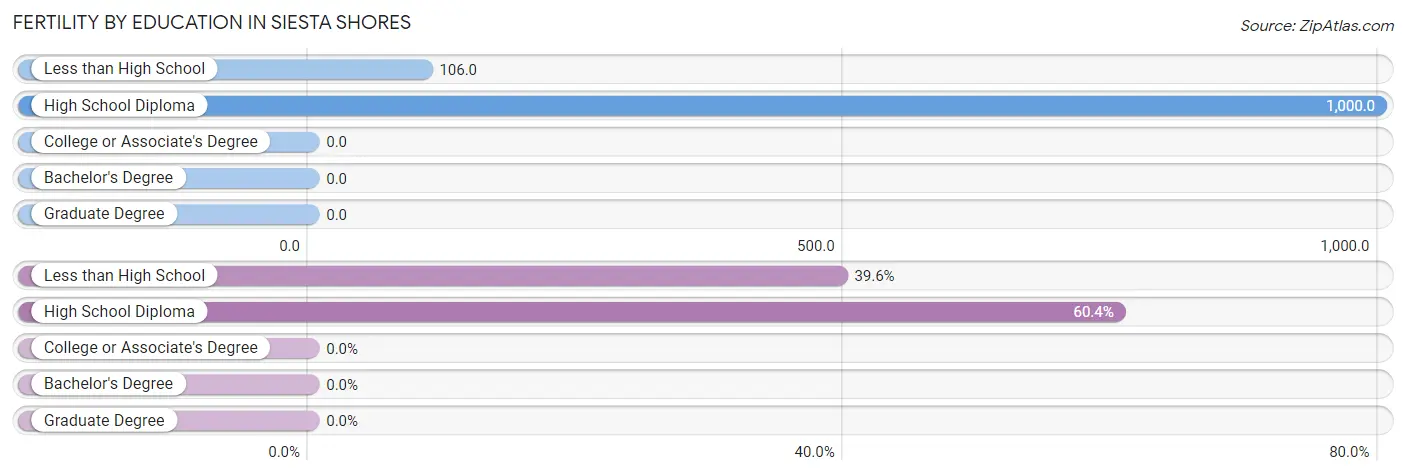
| Educational Attainment | Women with Births | Births / 1,000 Women |
| Less than High School | 19 (39.6%) | 106.0 |
| High School Diploma | 29 (60.4%) | 1,000.0 |
| College or Associate's Degree | 0 (0.0%) | 0.0 |
| Bachelor's Degree | 0 (0.0%) | 0.0 |
| Graduate Degree | 0 (0.0%) | 0.0 |
| Total | 48 (100.0%) | 167.0 |
Fertility by Education by Marriage Status in Siesta Shores
60.4% of women with births in Siesta Shores are unmarried. Women with the educational attainment of less than high school are most likely to be married with 100.0% of them married at childbirth, while women with the educational attainment of high school diploma are least likely to be married with 100.0% of them unmarried at childbirth.
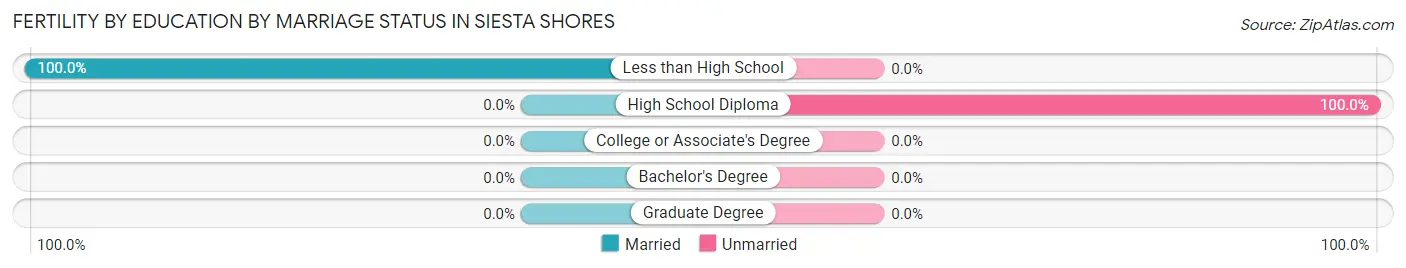
| Educational Attainment | Married | Unmarried |
| Less than High School | 19 (100.0%) | 0 (0.0%) |
| High School Diploma | 0 (0.0%) | 29 (100.0%) |
| College or Associate's Degree | 0 (0.0%) | 0 (0.0%) |
| Bachelor's Degree | 0 (0.0%) | 0 (0.0%) |
| Graduate Degree | 0 (0.0%) | 0 (0.0%) |
| Total | 19 (39.6%) | 29 (60.4%) |
Employment Characteristics in Siesta Shores
Employment by Class of Employer in Siesta Shores
Among the 431 employed individuals in Siesta Shores, private company employees (213 | 49.4%), self-employed (not incorporated) (134 | 31.1%), and local government employees (84 | 19.5%) make up the most common classes of employment.
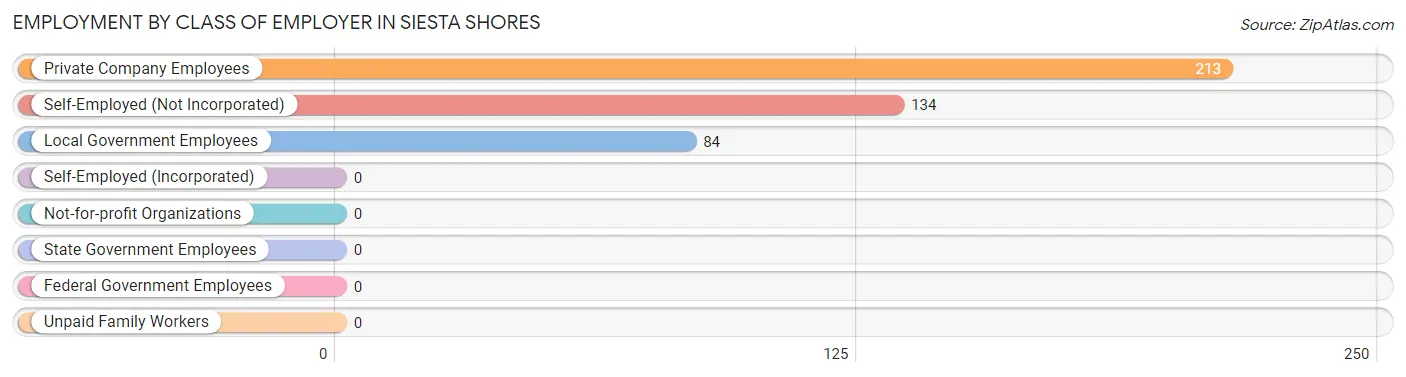
| Employer Class | # Employees | % Employees |
| Private Company Employees | 213 | 49.4% |
| Self-Employed (Incorporated) | 0 | 0.0% |
| Self-Employed (Not Incorporated) | 134 | 31.1% |
| Not-for-profit Organizations | 0 | 0.0% |
| Local Government Employees | 84 | 19.5% |
| State Government Employees | 0 | 0.0% |
| Federal Government Employees | 0 | 0.0% |
| Unpaid Family Workers | 0 | 0.0% |
| Total | 431 | 100.0% |
Employment Status by Age in Siesta Shores
According to the labor force statistics for Siesta Shores, out of the total population over 16 years of age (940), 56.2% or 528 individuals are in the labor force, with 18.4% or 97 of them unemployed. The age group with the highest labor force participation rate is 16 to 19 years, with 100.0% or 97 individuals in the labor force. Within the labor force, the 16 to 19 years age range has the highest percentage of unemployed individuals, with 100.0% or 97 of them being unemployed.
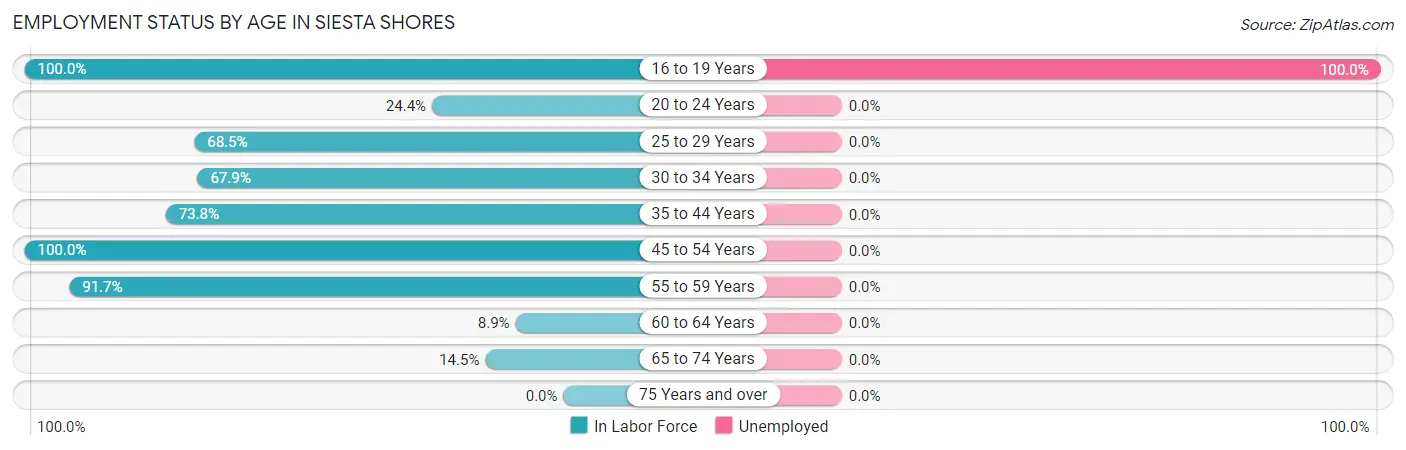
| Age Bracket | In Labor Force | Unemployed |
| 16 to 19 Years | 97 (100.0%) | 97 (100.0%) |
| 20 to 24 Years | 33 (24.4%) | 0 (0.0%) |
| 25 to 29 Years | 87 (68.5%) | 0 (0.0%) |
| 30 to 34 Years | 95 (67.9%) | 0 (0.0%) |
| 35 to 44 Years | 76 (73.8%) | 0 (0.0%) |
| 45 to 54 Years | 62 (100.0%) | 0 (0.0%) |
| 55 to 59 Years | 55 (91.7%) | 0 (0.0%) |
| 60 to 64 Years | 5 (8.9%) | 0 (0.0%) |
| 65 to 74 Years | 18 (14.5%) | 0 (0.0%) |
| 75 Years and over | 0 (0.0%) | 0 (0.0%) |
| Total | 528 (56.2%) | 97 (18.4%) |
Employment Status by Educational Attainment in Siesta Shores
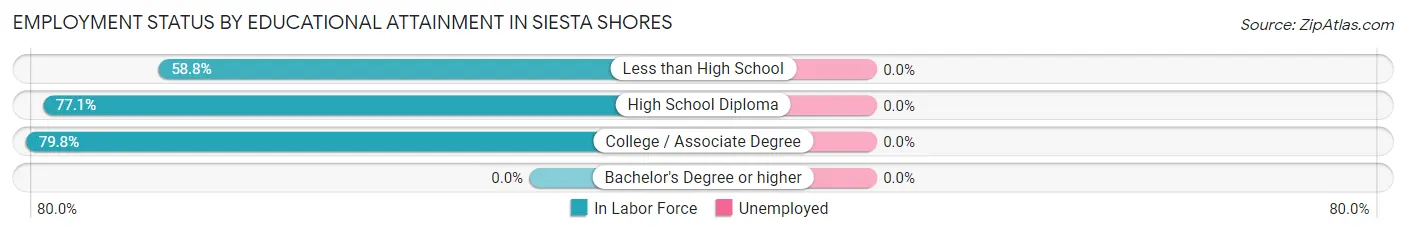
| Educational Attainment | In Labor Force | Unemployed |
| Less than High School | 154 (58.8%) | 0 (0.0%) |
| High School Diploma | 64 (77.1%) | 0 (0.0%) |
| College / Associate Degree | 162 (79.8%) | 0 (0.0%) |
| Bachelor's Degree or higher | 0 (0.0%) | 0 (0.0%) |
| Total | 380 (69.3%) | 0 (0.0%) |
Employment Occupations by Sex in Siesta Shores
Management, Business, Science and Arts Occupations
The most common Management, Business, Science and Arts occupations in Siesta Shores are Business & Financial (24 | 5.6%), and Health Diagnosing & Treating (6 | 1.4%).
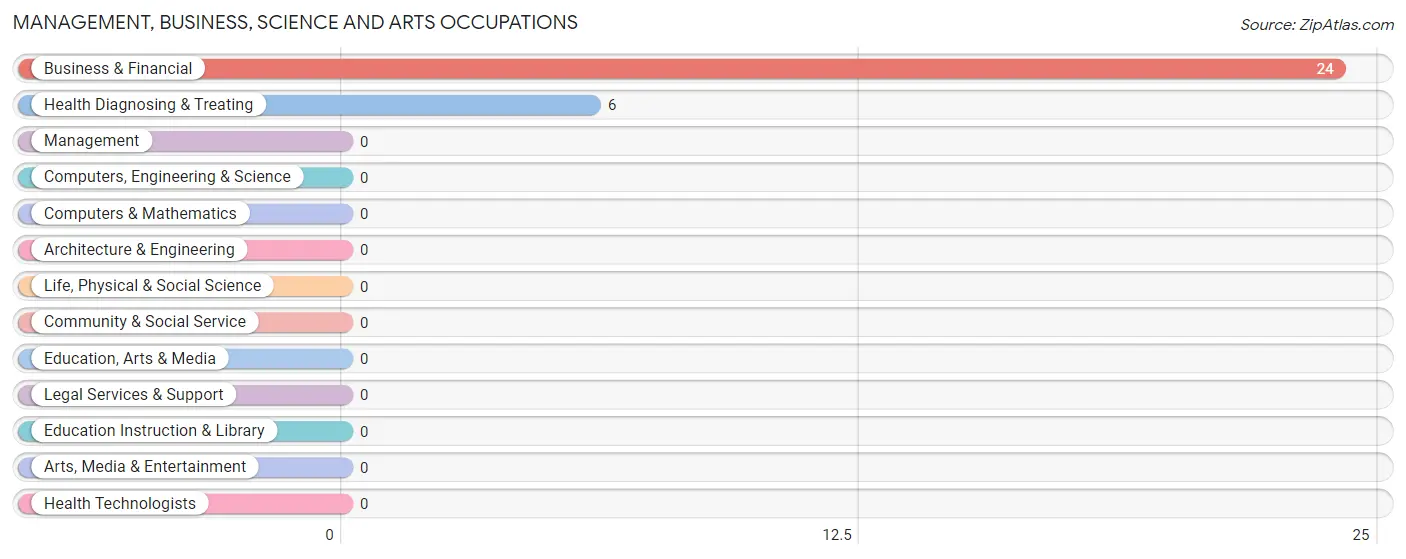
Management, Business, Science and Arts Occupations by Sex
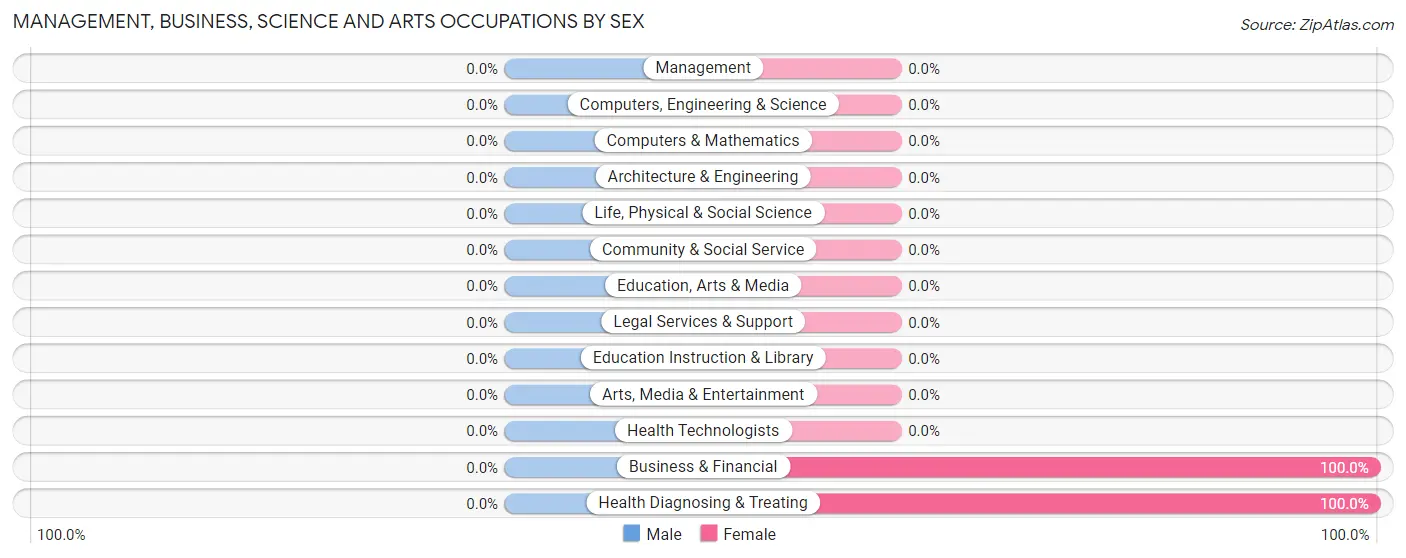
| Occupation | Male | Female |
| Management | 0 (0.0%) | 0 (0.0%) |
| Business & Financial | 0 (0.0%) | 24 (100.0%) |
| Computers, Engineering & Science | 0 (0.0%) | 0 (0.0%) |
| Computers & Mathematics | 0 (0.0%) | 0 (0.0%) |
| Architecture & Engineering | 0 (0.0%) | 0 (0.0%) |
| Life, Physical & Social Science | 0 (0.0%) | 0 (0.0%) |
| Community & Social Service | 0 (0.0%) | 0 (0.0%) |
| Education, Arts & Media | 0 (0.0%) | 0 (0.0%) |
| Legal Services & Support | 0 (0.0%) | 0 (0.0%) |
| Education Instruction & Library | 0 (0.0%) | 0 (0.0%) |
| Arts, Media & Entertainment | 0 (0.0%) | 0 (0.0%) |
| Health Diagnosing & Treating | 0 (0.0%) | 6 (100.0%) |
| Health Technologists | 0 (0.0%) | 0 (0.0%) |
| Total (Category) | 0 (0.0%) | 30 (100.0%) |
| Total (Overall) | 319 (74.0%) | 112 (26.0%) |
Services Occupations
The most common Services occupations in Siesta Shores are , and Cleaning & Maintenance (29 | 6.7%).
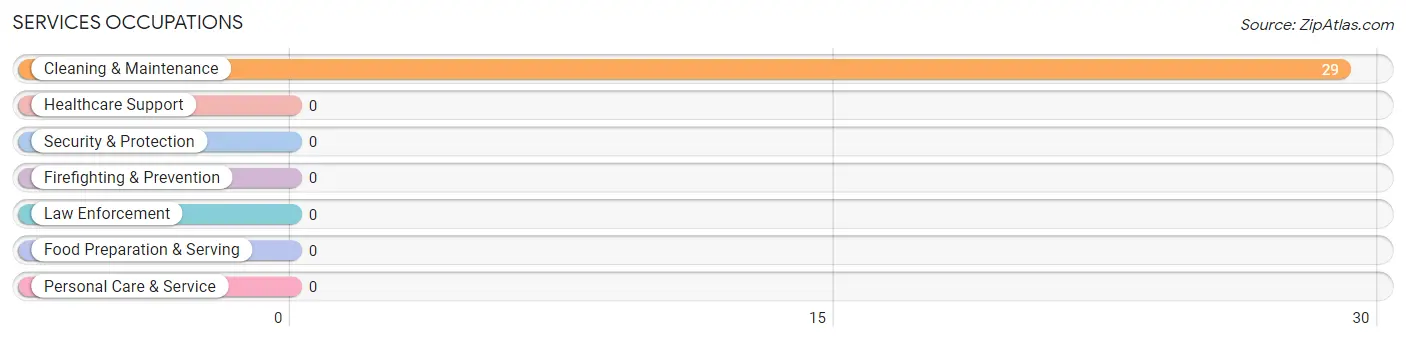
Services Occupations by Sex
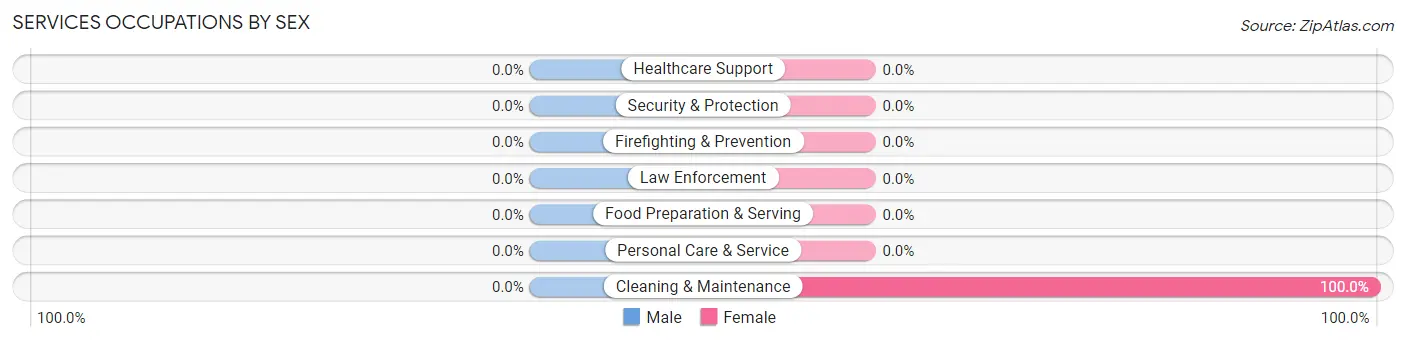
| Occupation | Male | Female |
| Healthcare Support | 0 (0.0%) | 0 (0.0%) |
| Security & Protection | 0 (0.0%) | 0 (0.0%) |
| Firefighting & Prevention | 0 (0.0%) | 0 (0.0%) |
| Law Enforcement | 0 (0.0%) | 0 (0.0%) |
| Food Preparation & Serving | 0 (0.0%) | 0 (0.0%) |
| Cleaning & Maintenance | 0 (0.0%) | 29 (100.0%) |
| Personal Care & Service | 0 (0.0%) | 0 (0.0%) |
| Total (Category) | 0 (0.0%) | 29 (100.0%) |
| Total (Overall) | 319 (74.0%) | 112 (26.0%) |
Sales and Office Occupations
The most common Sales and Office occupations in Siesta Shores are Sales & Related (13 | 3.0%), and Office & Administration (9 | 2.1%).
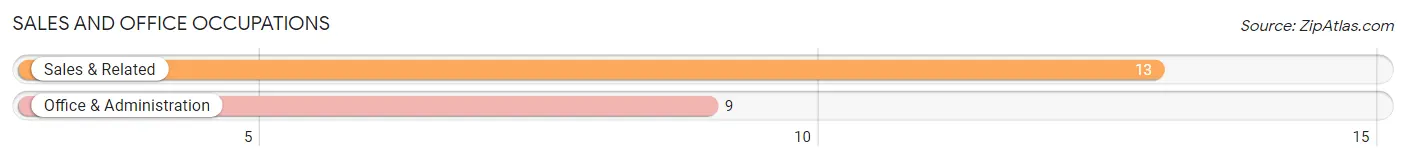
Sales and Office Occupations by Sex
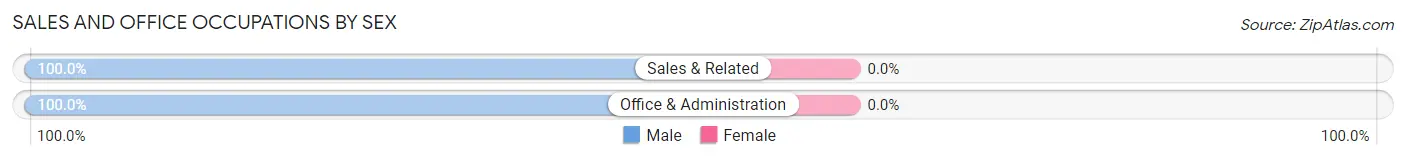
| Occupation | Male | Female |
| Sales & Related | 13 (100.0%) | 0 (0.0%) |
| Office & Administration | 9 (100.0%) | 0 (0.0%) |
| Total (Category) | 22 (100.0%) | 0 (0.0%) |
| Total (Overall) | 319 (74.0%) | 112 (26.0%) |
Natural Resources, Construction and Maintenance Occupations
The most common Natural Resources, Construction and Maintenance occupations in Siesta Shores are Construction & Extraction (98 | 22.7%), Installation, Maintenance & Repair (26 | 6.0%), and Farming, Fishing & Forestry (18 | 4.2%).
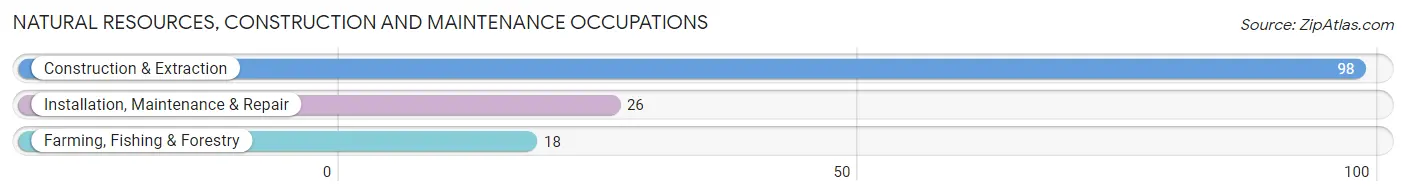
Natural Resources, Construction and Maintenance Occupations by Sex
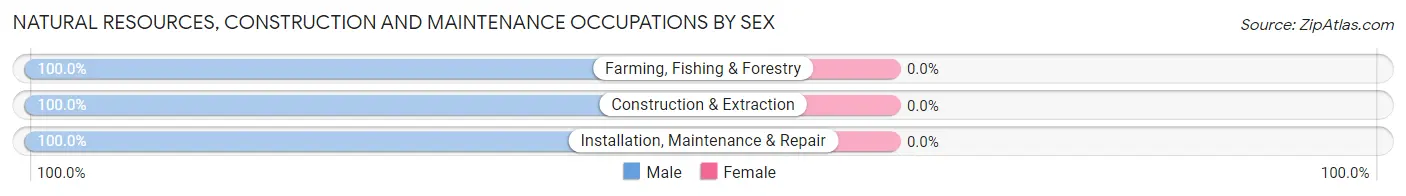
| Occupation | Male | Female |
| Farming, Fishing & Forestry | 18 (100.0%) | 0 (0.0%) |
| Construction & Extraction | 98 (100.0%) | 0 (0.0%) |
| Installation, Maintenance & Repair | 26 (100.0%) | 0 (0.0%) |
| Total (Category) | 142 (100.0%) | 0 (0.0%) |
| Total (Overall) | 319 (74.0%) | 112 (26.0%) |
Production, Transportation and Moving Occupations
The most common Production, Transportation and Moving occupations in Siesta Shores are Production (122 | 28.3%), and Transportation (86 | 20.0%).
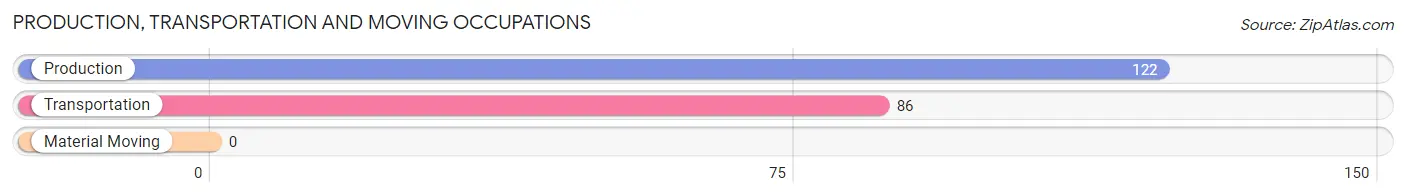
Production, Transportation and Moving Occupations by Sex
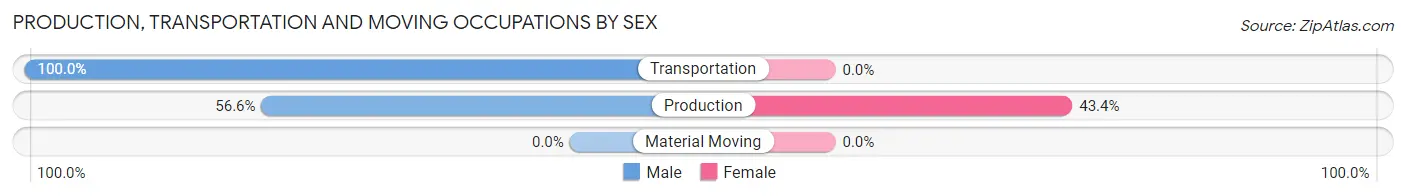
| Occupation | Male | Female |
| Production | 69 (56.6%) | 53 (43.4%) |
| Transportation | 86 (100.0%) | 0 (0.0%) |
| Material Moving | 0 (0.0%) | 0 (0.0%) |
| Total (Category) | 155 (74.5%) | 53 (25.5%) |
| Total (Overall) | 319 (74.0%) | 112 (26.0%) |
Employment Industries by Sex in Siesta Shores
Employment Industries in Siesta Shores
The major employment industries in Siesta Shores include Manufacturing (139 | 32.3%), Mining, Quarrying, & Extraction (72 | 16.7%), Construction (42 | 9.7%), Administrative & Support (26 | 6.0%), and Utilities (25 | 5.8%).
Employment Industries by Sex in Siesta Shores
The Siesta Shores industries that see more men than women are Agriculture, Fishing & Hunting (100.0%), Mining, Quarrying, & Extraction (100.0%), and Construction (100.0%), whereas the industries that tend to have a higher number of women are Health Care & Social Assistance (100.0%), Public Administration (100.0%), and Manufacturing (38.1%).
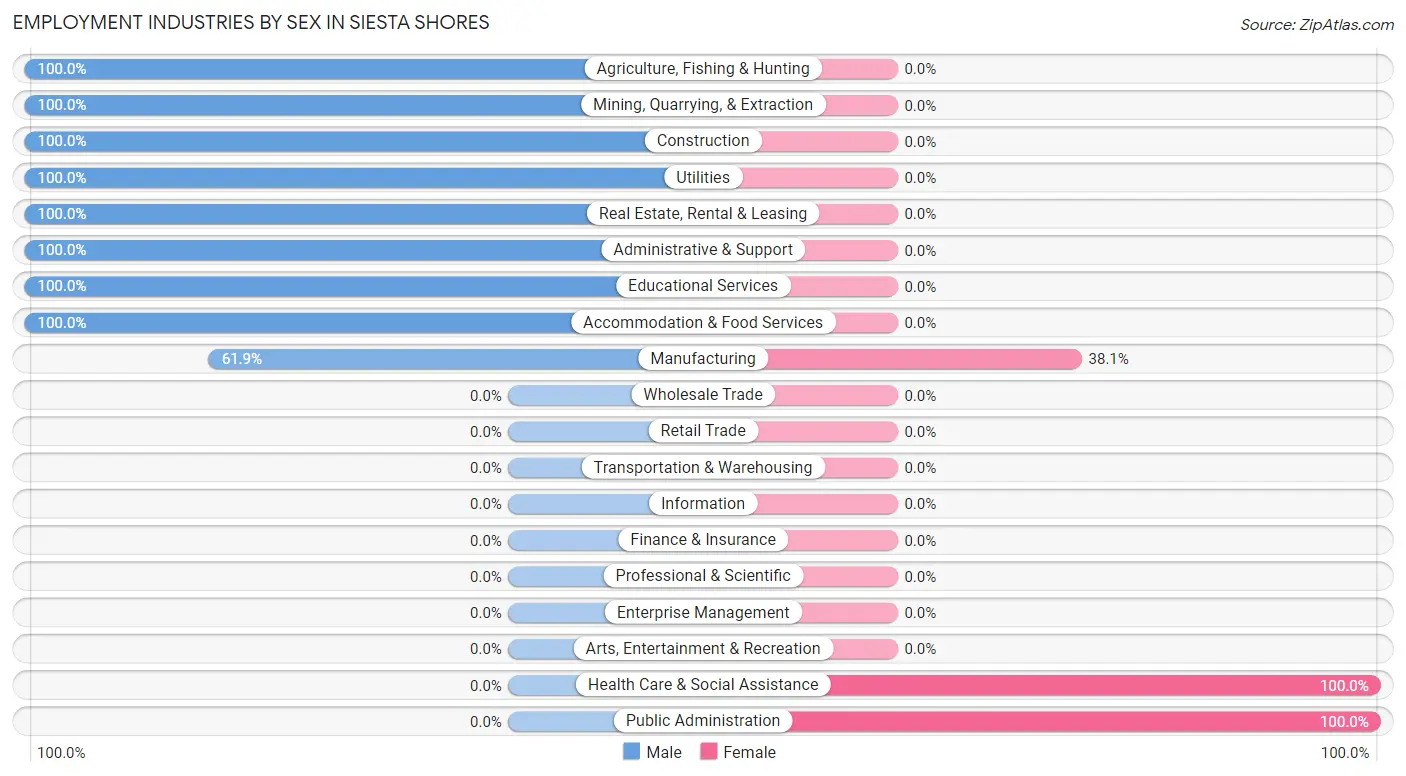
| Industry | Male | Female |
| Agriculture, Fishing & Hunting | 18 (100.0%) | 0 (0.0%) |
| Mining, Quarrying, & Extraction | 72 (100.0%) | 0 (0.0%) |
| Construction | 42 (100.0%) | 0 (0.0%) |
| Manufacturing | 86 (61.9%) | 53 (38.1%) |
| Wholesale Trade | 0 (0.0%) | 0 (0.0%) |
| Retail Trade | 0 (0.0%) | 0 (0.0%) |
| Transportation & Warehousing | 0 (0.0%) | 0 (0.0%) |
| Utilities | 25 (100.0%) | 0 (0.0%) |
| Information | 0 (0.0%) | 0 (0.0%) |
| Finance & Insurance | 0 (0.0%) | 0 (0.0%) |
| Real Estate, Rental & Leasing | 23 (100.0%) | 0 (0.0%) |
| Professional & Scientific | 0 (0.0%) | 0 (0.0%) |
| Enterprise Management | 0 (0.0%) | 0 (0.0%) |
| Administrative & Support | 26 (100.0%) | 0 (0.0%) |
| Educational Services | 5 (100.0%) | 0 (0.0%) |
| Health Care & Social Assistance | 0 (0.0%) | 6 (100.0%) |
| Arts, Entertainment & Recreation | 0 (0.0%) | 0 (0.0%) |
| Accommodation & Food Services | 9 (100.0%) | 0 (0.0%) |
| Public Administration | 0 (0.0%) | 24 (100.0%) |
| Total | 319 (74.0%) | 112 (26.0%) |
Education in Siesta Shores
School Enrollment in Siesta Shores
The most common levels of schooling among the 650 students in Siesta Shores are elementary school (242 | 37.2%), college / undergraduate (151 | 23.2%), and middle school (123 | 18.9%).
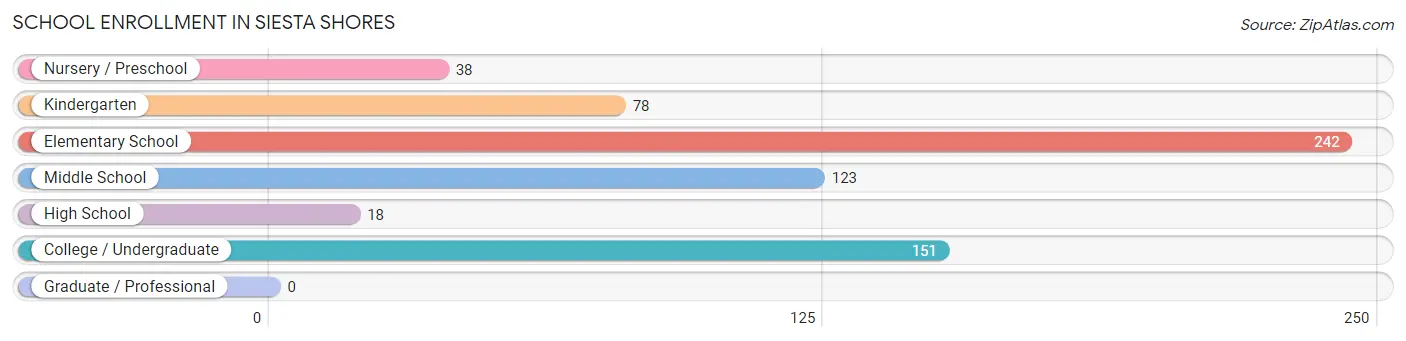
| School Level | # Students | % Students |
| Nursery / Preschool | 38 | 5.9% |
| Kindergarten | 78 | 12.0% |
| Elementary School | 242 | 37.2% |
| Middle School | 123 | 18.9% |
| High School | 18 | 2.8% |
| College / Undergraduate | 151 | 23.2% |
| Graduate / Professional | 0 | 0.0% |
| Total | 650 | 100.0% |
School Enrollment by Age by Funding Source in Siesta Shores
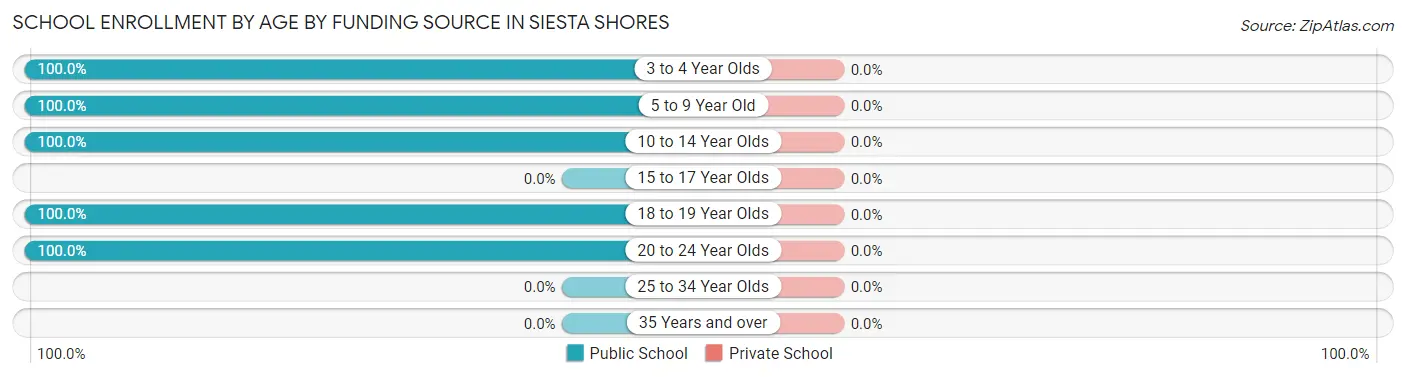
| Age Bracket | Public School | Private School |
| 3 to 4 Year Olds | 38 (100.0%) | 0 (0.0%) |
| 5 to 9 Year Old | 230 (100.0%) | 0 (0.0%) |
| 10 to 14 Year Olds | 231 (100.0%) | 0 (0.0%) |
| 15 to 17 Year Olds | 0 (0.0%) | 0 (0.0%) |
| 18 to 19 Year Olds | 97 (100.0%) | 0 (0.0%) |
| 20 to 24 Year Olds | 54 (100.0%) | 0 (0.0%) |
| 25 to 34 Year Olds | 0 (0.0%) | 0 (0.0%) |
| 35 Years and over | 0 (0.0%) | 0 (0.0%) |
| Total | 650 (100.0%) | 0 (0.0%) |
Educational Attainment by Field of Study in Siesta Shores
, and education (21 | 100.0%) are the most common fields of study among 21 individuals in Siesta Shores who have obtained a bachelor's degree or higher.
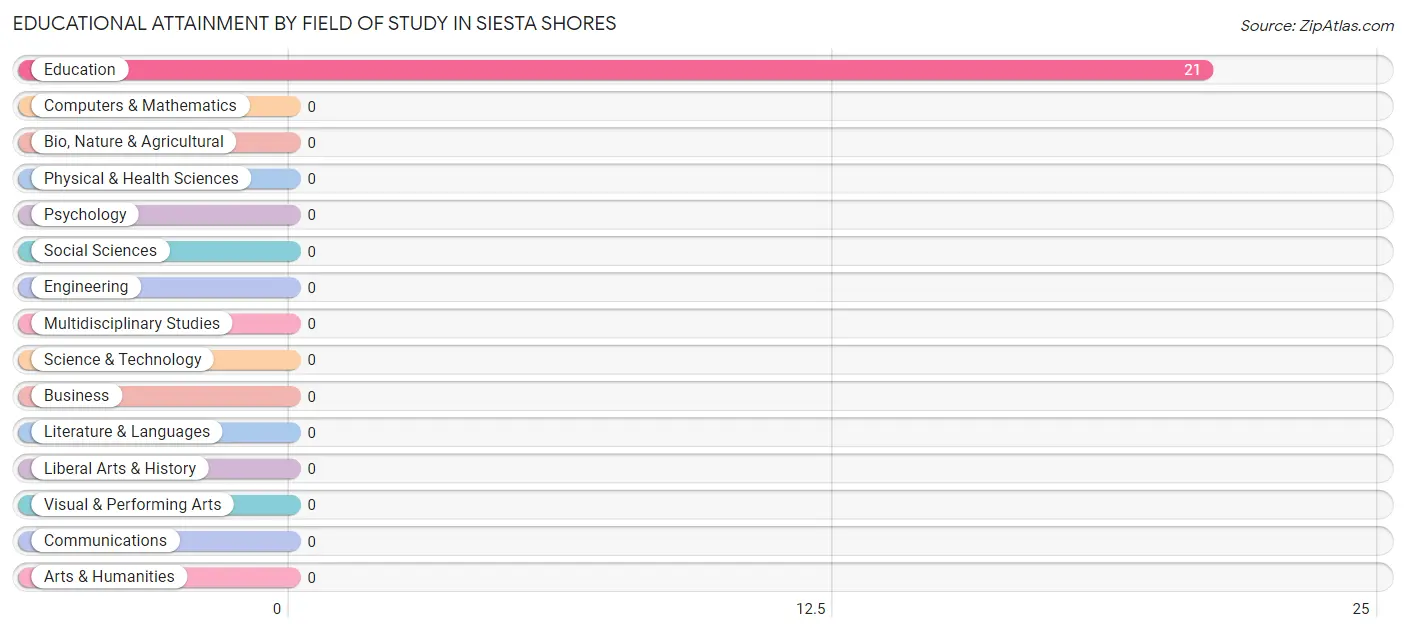
| Field of Study | # Graduates | % Graduates |
| Computers & Mathematics | 0 | 0.0% |
| Bio, Nature & Agricultural | 0 | 0.0% |
| Physical & Health Sciences | 0 | 0.0% |
| Psychology | 0 | 0.0% |
| Social Sciences | 0 | 0.0% |
| Engineering | 0 | 0.0% |
| Multidisciplinary Studies | 0 | 0.0% |
| Science & Technology | 0 | 0.0% |
| Business | 0 | 0.0% |
| Education | 21 | 100.0% |
| Literature & Languages | 0 | 0.0% |
| Liberal Arts & History | 0 | 0.0% |
| Visual & Performing Arts | 0 | 0.0% |
| Communications | 0 | 0.0% |
| Arts & Humanities | 0 | 0.0% |
| Total | 21 | 100.0% |
Transportation & Commute in Siesta Shores
Vehicle Availability by Sex in Siesta Shores
The most prevalent vehicle ownership categories in Siesta Shores are males with 2 vehicles (147, accounting for 46.1%) and females with 2 vehicles (29, making up 131.2%).
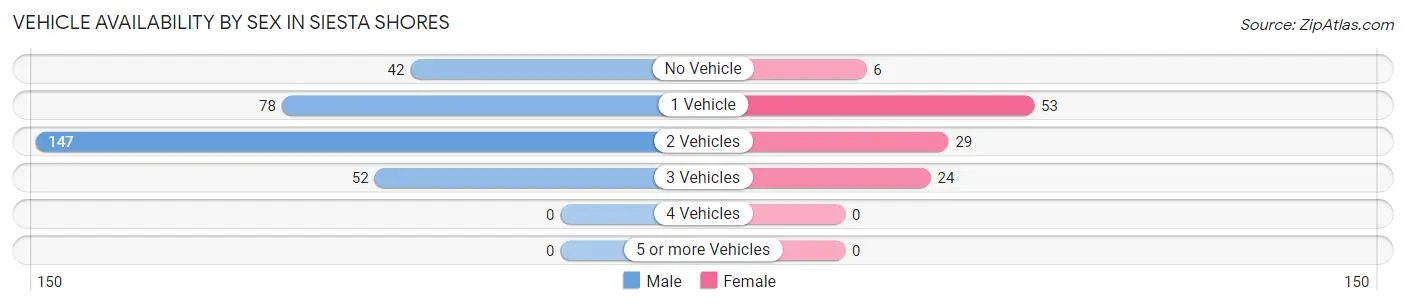
| Vehicles Available | Male | Female |
| No Vehicle | 42 (13.2%) | 6 (5.4%) |
| 1 Vehicle | 78 (24.4%) | 53 (47.3%) |
| 2 Vehicles | 147 (46.1%) | 29 (25.9%) |
| 3 Vehicles | 52 (16.3%) | 24 (21.4%) |
| 4 Vehicles | 0 (0.0%) | 0 (0.0%) |
| 5 or more Vehicles | 0 (0.0%) | 0 (0.0%) |
| Total | 319 (100.0%) | 112 (100.0%) |
Commute Time in Siesta Shores
The most frequently occuring commute durations in Siesta Shores are 90 or more minutes (82 commuters, 21.4%), 15 to 19 minutes (71 commuters, 18.5%), and 20 to 24 minutes (61 commuters, 15.9%).
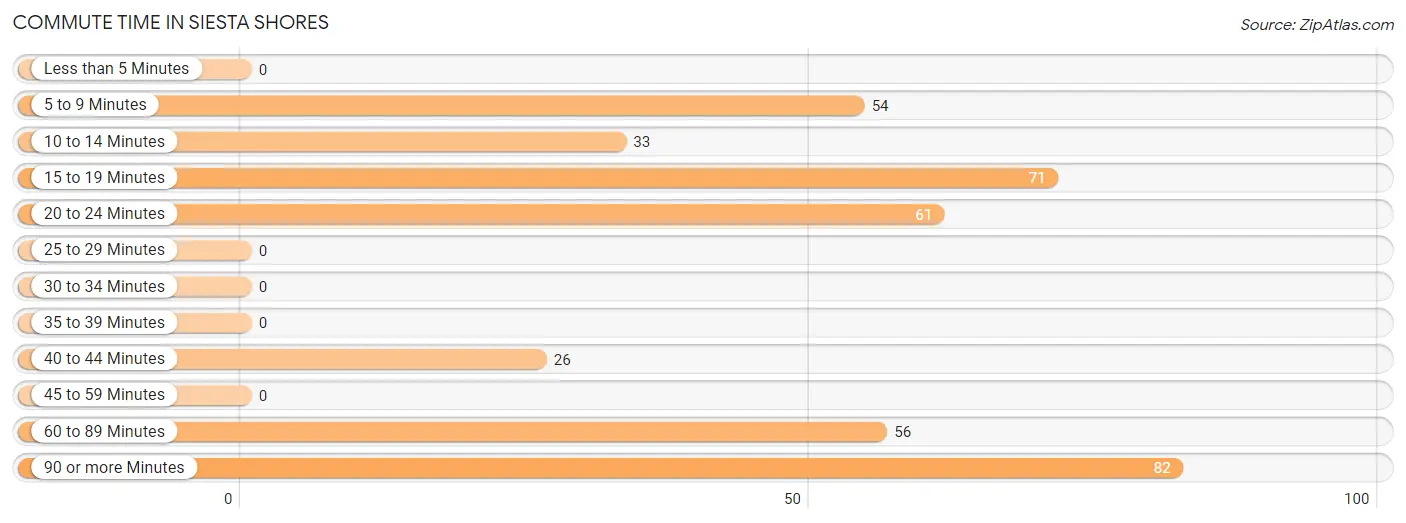
| Commute Time | # Commuters | % Commuters |
| Less than 5 Minutes | 0 | 0.0% |
| 5 to 9 Minutes | 54 | 14.1% |
| 10 to 14 Minutes | 33 | 8.6% |
| 15 to 19 Minutes | 71 | 18.5% |
| 20 to 24 Minutes | 61 | 15.9% |
| 25 to 29 Minutes | 0 | 0.0% |
| 30 to 34 Minutes | 0 | 0.0% |
| 35 to 39 Minutes | 0 | 0.0% |
| 40 to 44 Minutes | 26 | 6.8% |
| 45 to 59 Minutes | 0 | 0.0% |
| 60 to 89 Minutes | 56 | 14.6% |
| 90 or more Minutes | 82 | 21.4% |
Commute Time by Sex in Siesta Shores
The most common commute times in Siesta Shores are 90 or more minutes (82 commuters, 29.6%) for males and 15 to 19 minutes (53 commuters, 50.0%) for females.
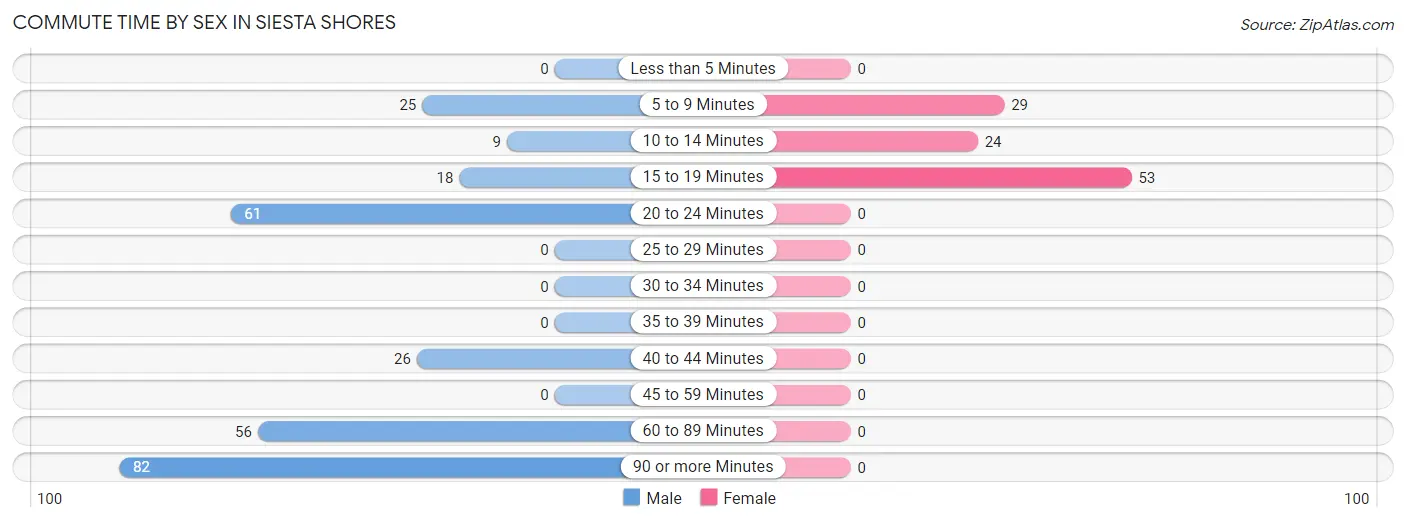
| Commute Time | Male | Female |
| Less than 5 Minutes | 0 (0.0%) | 0 (0.0%) |
| 5 to 9 Minutes | 25 (9.0%) | 29 (27.4%) |
| 10 to 14 Minutes | 9 (3.3%) | 24 (22.6%) |
| 15 to 19 Minutes | 18 (6.5%) | 53 (50.0%) |
| 20 to 24 Minutes | 61 (22.0%) | 0 (0.0%) |
| 25 to 29 Minutes | 0 (0.0%) | 0 (0.0%) |
| 30 to 34 Minutes | 0 (0.0%) | 0 (0.0%) |
| 35 to 39 Minutes | 0 (0.0%) | 0 (0.0%) |
| 40 to 44 Minutes | 26 (9.4%) | 0 (0.0%) |
| 45 to 59 Minutes | 0 (0.0%) | 0 (0.0%) |
| 60 to 89 Minutes | 56 (20.2%) | 0 (0.0%) |
| 90 or more Minutes | 82 (29.6%) | 0 (0.0%) |
Time of Departure to Work by Sex in Siesta Shores
The most frequent times of departure to work in Siesta Shores are 7:30 AM to 7:59 AM (92, 33.2%) for males and 7:30 AM to 7:59 AM (53, 50.0%) for females.
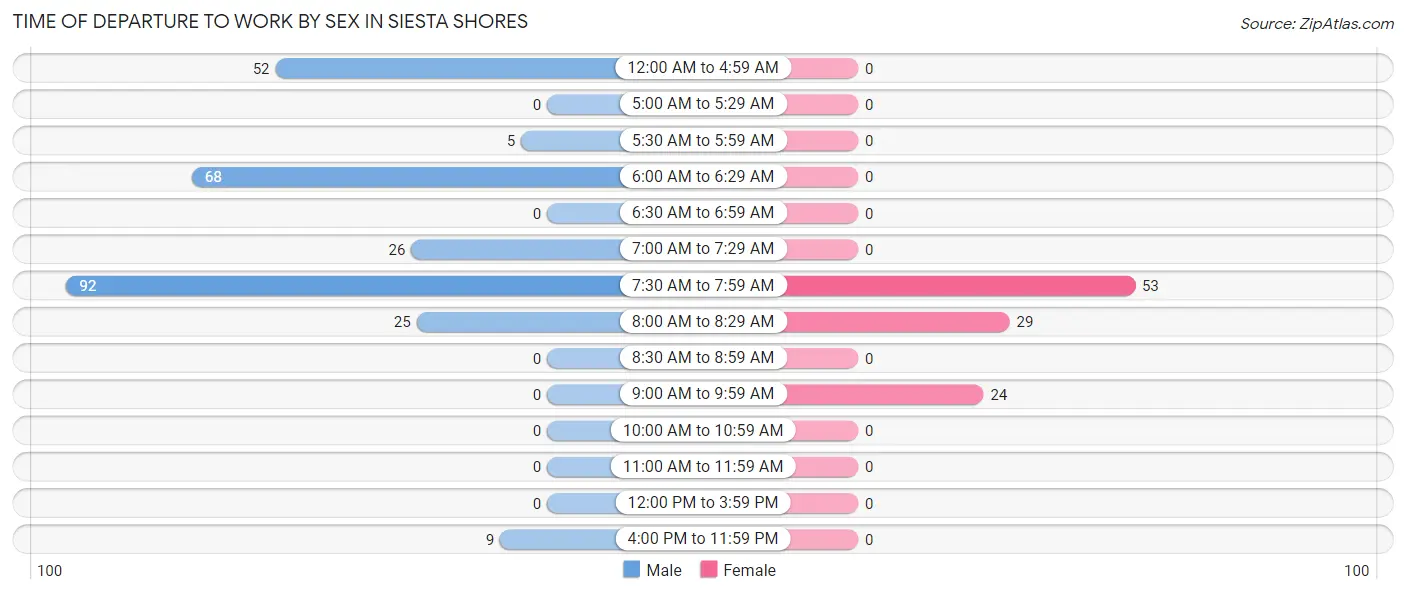
| Time of Departure | Male | Female |
| 12:00 AM to 4:59 AM | 52 (18.8%) | 0 (0.0%) |
| 5:00 AM to 5:29 AM | 0 (0.0%) | 0 (0.0%) |
| 5:30 AM to 5:59 AM | 5 (1.8%) | 0 (0.0%) |
| 6:00 AM to 6:29 AM | 68 (24.5%) | 0 (0.0%) |
| 6:30 AM to 6:59 AM | 0 (0.0%) | 0 (0.0%) |
| 7:00 AM to 7:29 AM | 26 (9.4%) | 0 (0.0%) |
| 7:30 AM to 7:59 AM | 92 (33.2%) | 53 (50.0%) |
| 8:00 AM to 8:29 AM | 25 (9.0%) | 29 (27.4%) |
| 8:30 AM to 8:59 AM | 0 (0.0%) | 0 (0.0%) |
| 9:00 AM to 9:59 AM | 0 (0.0%) | 24 (22.6%) |
| 10:00 AM to 10:59 AM | 0 (0.0%) | 0 (0.0%) |
| 11:00 AM to 11:59 AM | 0 (0.0%) | 0 (0.0%) |
| 12:00 PM to 3:59 PM | 0 (0.0%) | 0 (0.0%) |
| 4:00 PM to 11:59 PM | 9 (3.3%) | 0 (0.0%) |
| Total | 277 (100.0%) | 106 (100.0%) |
Housing Occupancy in Siesta Shores
Occupancy by Ownership in Siesta Shores
Of the total 427 dwellings in Siesta Shores, owner-occupied units account for 277 (64.9%), while renter-occupied units make up 150 (35.1%).
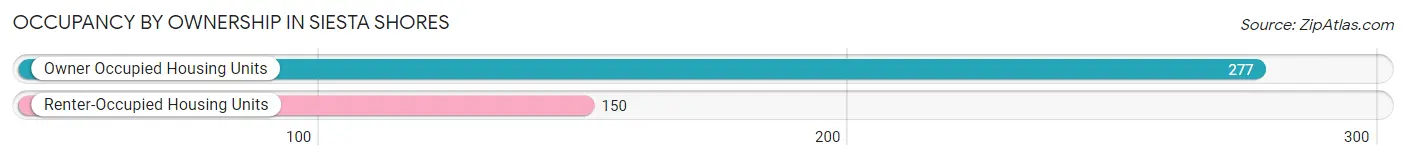
| Occupancy | # Housing Units | % Housing Units |
| Owner Occupied Housing Units | 277 | 64.9% |
| Renter-Occupied Housing Units | 150 | 35.1% |
| Total Occupied Housing Units | 427 | 100.0% |
Occupancy by Household Size in Siesta Shores
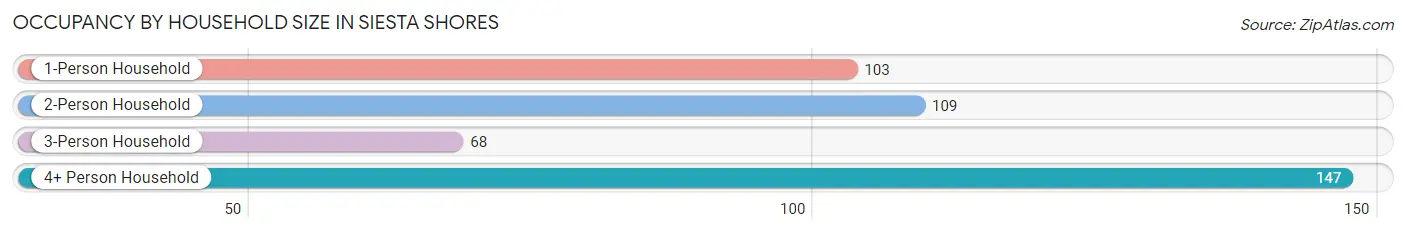
| Household Size | # Housing Units | % Housing Units |
| 1-Person Household | 103 | 24.1% |
| 2-Person Household | 109 | 25.5% |
| 3-Person Household | 68 | 15.9% |
| 4+ Person Household | 147 | 34.4% |
| Total Housing Units | 427 | 100.0% |
Occupancy by Ownership by Household Size in Siesta Shores
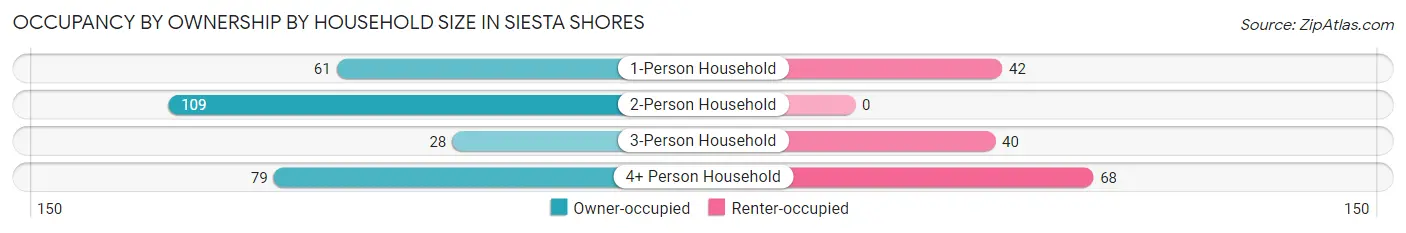
| Household Size | Owner-occupied | Renter-occupied |
| 1-Person Household | 61 (59.2%) | 42 (40.8%) |
| 2-Person Household | 109 (100.0%) | 0 (0.0%) |
| 3-Person Household | 28 (41.2%) | 40 (58.8%) |
| 4+ Person Household | 79 (53.7%) | 68 (46.3%) |
| Total Housing Units | 277 (64.9%) | 150 (35.1%) |
Occupancy by Educational Attainment in Siesta Shores
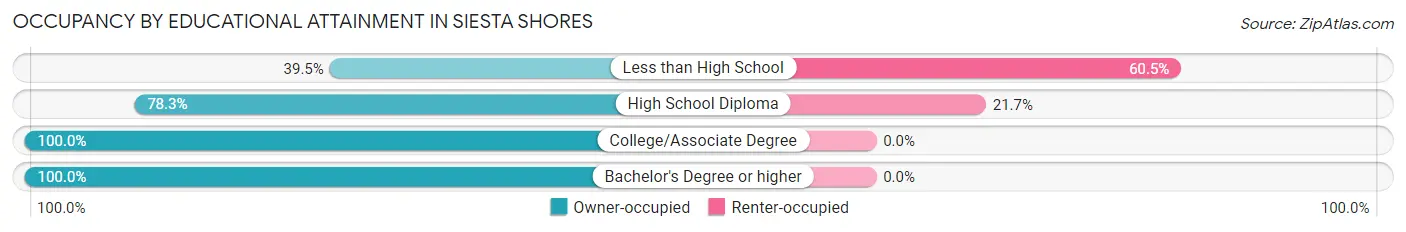
| Household Size | Owner-occupied | Renter-occupied |
| Less than High School | 85 (39.5%) | 130 (60.5%) |
| High School Diploma | 72 (78.3%) | 20 (21.7%) |
| College/Associate Degree | 99 (100.0%) | 0 (0.0%) |
| Bachelor's Degree or higher | 21 (100.0%) | 0 (0.0%) |
Occupancy by Age of Householder in Siesta Shores
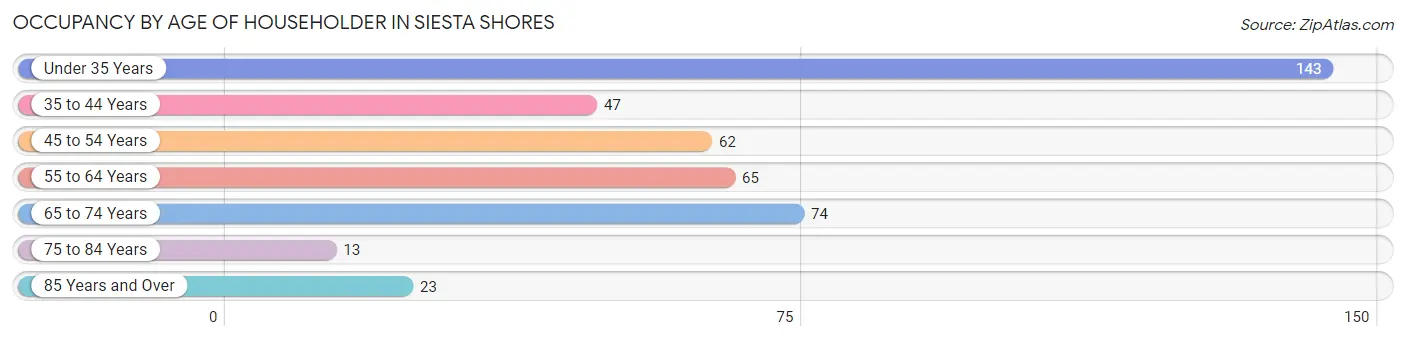
| Age Bracket | # Households | % Households |
| Under 35 Years | 143 | 33.5% |
| 35 to 44 Years | 47 | 11.0% |
| 45 to 54 Years | 62 | 14.5% |
| 55 to 64 Years | 65 | 15.2% |
| 65 to 74 Years | 74 | 17.3% |
| 75 to 84 Years | 13 | 3.0% |
| 85 Years and Over | 23 | 5.4% |
| Total | 427 | 100.0% |
Housing Finances in Siesta Shores
Median Income by Occupancy in Siesta Shores
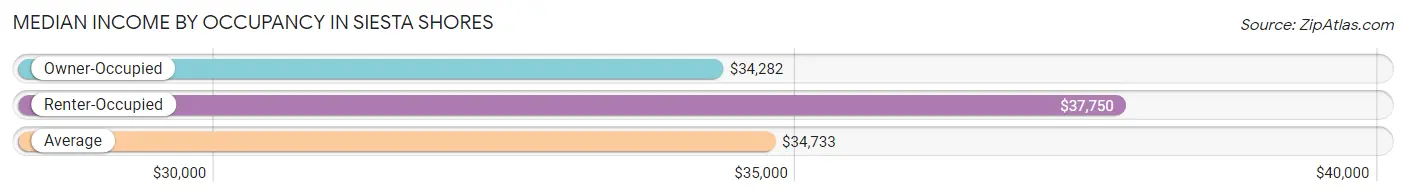
| Occupancy Type | # Households | Median Income |
| Owner-Occupied | 277 (64.9%) | $34,282 |
| Renter-Occupied | 150 (35.1%) | $37,750 |
| Average | 427 (100.0%) | $34,733 |
Occupancy by Householder Income Bracket in Siesta Shores
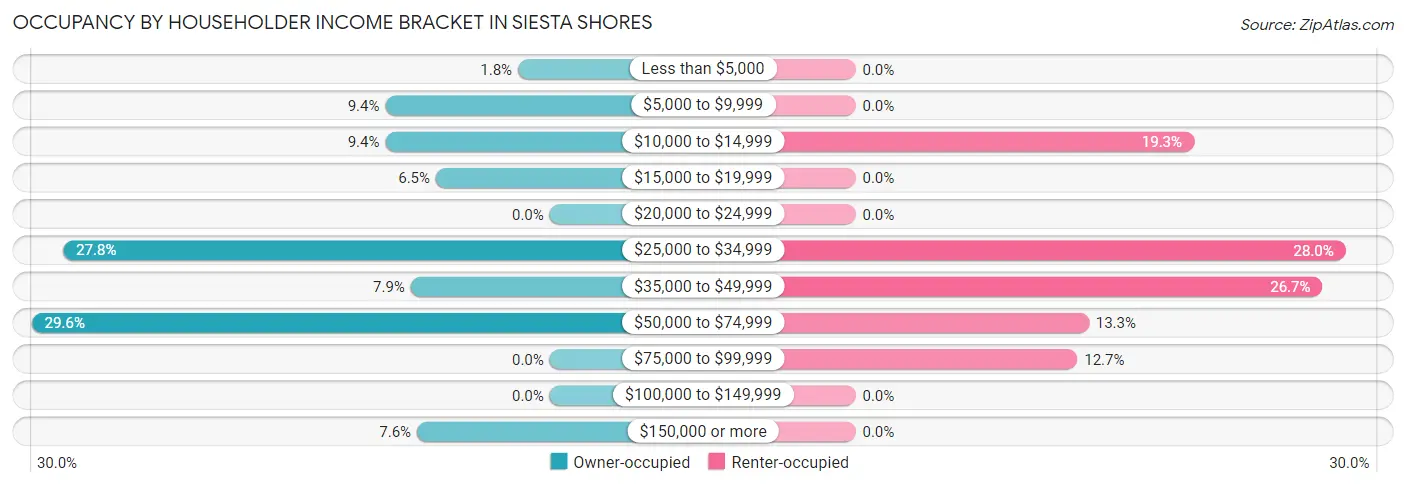
| Income Bracket | Owner-occupied | Renter-occupied |
| Less than $5,000 | 5 (1.8%) | 0 (0.0%) |
| $5,000 to $9,999 | 26 (9.4%) | 0 (0.0%) |
| $10,000 to $14,999 | 26 (9.4%) | 29 (19.3%) |
| $15,000 to $19,999 | 18 (6.5%) | 0 (0.0%) |
| $20,000 to $24,999 | 0 (0.0%) | 0 (0.0%) |
| $25,000 to $34,999 | 77 (27.8%) | 42 (28.0%) |
| $35,000 to $49,999 | 22 (7.9%) | 40 (26.7%) |
| $50,000 to $74,999 | 82 (29.6%) | 20 (13.3%) |
| $75,000 to $99,999 | 0 (0.0%) | 19 (12.7%) |
| $100,000 to $149,999 | 0 (0.0%) | 0 (0.0%) |
| $150,000 or more | 21 (7.6%) | 0 (0.0%) |
| Total | 277 (100.0%) | 150 (100.0%) |
Monthly Housing Cost Tiers in Siesta Shores
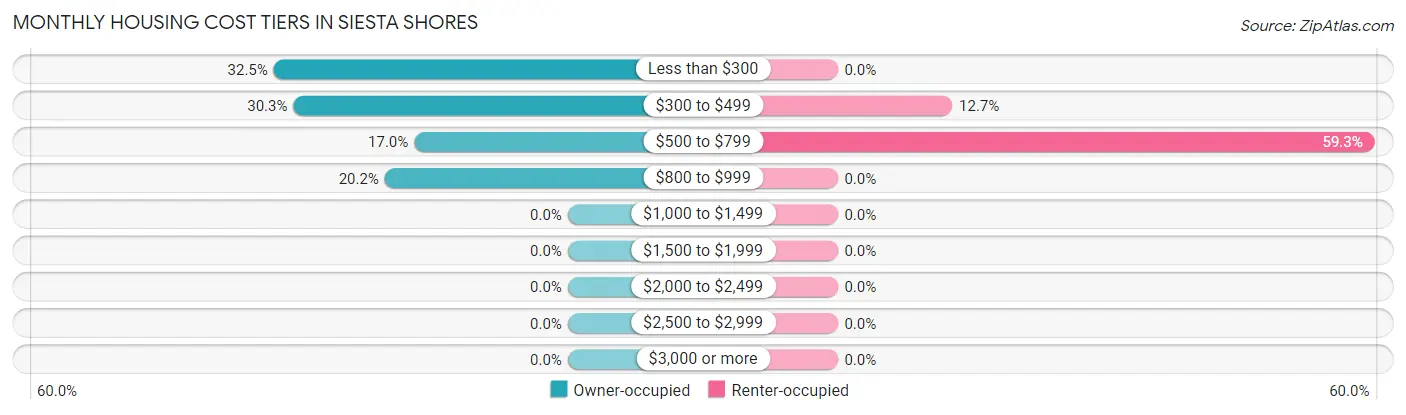
| Monthly Cost | Owner-occupied | Renter-occupied |
| Less than $300 | 90 (32.5%) | 0 (0.0%) |
| $300 to $499 | 84 (30.3%) | 19 (12.7%) |
| $500 to $799 | 47 (17.0%) | 89 (59.3%) |
| $800 to $999 | 56 (20.2%) | 0 (0.0%) |
| $1,000 to $1,499 | 0 (0.0%) | 0 (0.0%) |
| $1,500 to $1,999 | 0 (0.0%) | 0 (0.0%) |
| $2,000 to $2,499 | 0 (0.0%) | 0 (0.0%) |
| $2,500 to $2,999 | 0 (0.0%) | 0 (0.0%) |
| $3,000 or more | 0 (0.0%) | 0 (0.0%) |
| Total | 277 (100.0%) | 150 (100.0%) |
Physical Housing Characteristics in Siesta Shores
Housing Structures in Siesta Shores
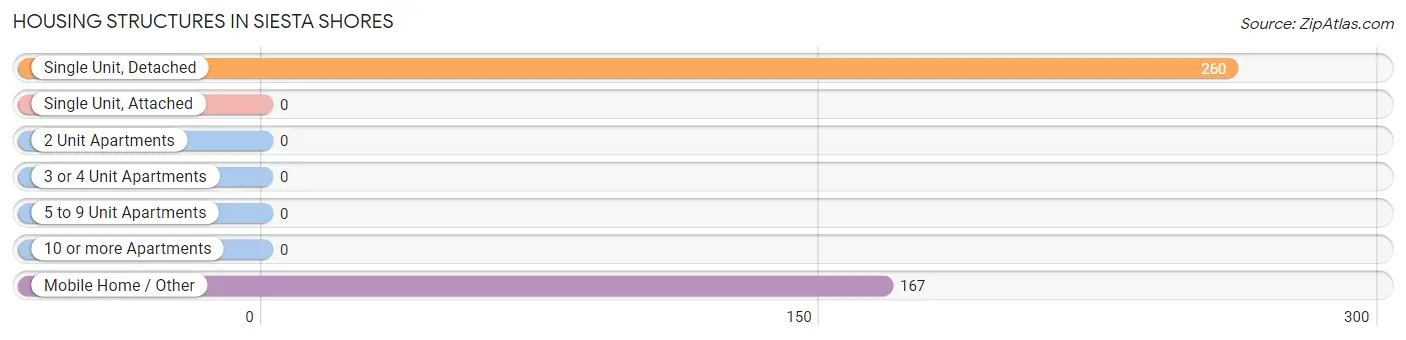
| Structure Type | # Housing Units | % Housing Units |
| Single Unit, Detached | 260 | 60.9% |
| Single Unit, Attached | 0 | 0.0% |
| 2 Unit Apartments | 0 | 0.0% |
| 3 or 4 Unit Apartments | 0 | 0.0% |
| 5 to 9 Unit Apartments | 0 | 0.0% |
| 10 or more Apartments | 0 | 0.0% |
| Mobile Home / Other | 167 | 39.1% |
| Total | 427 | 100.0% |
Housing Structures by Occupancy in Siesta Shores
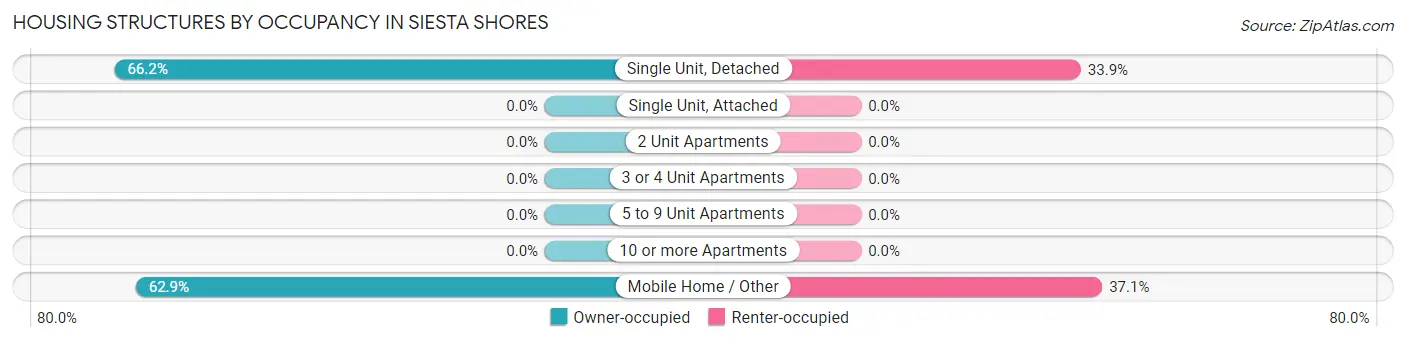
| Structure Type | Owner-occupied | Renter-occupied |
| Single Unit, Detached | 172 (66.1%) | 88 (33.9%) |
| Single Unit, Attached | 0 (0.0%) | 0 (0.0%) |
| 2 Unit Apartments | 0 (0.0%) | 0 (0.0%) |
| 3 or 4 Unit Apartments | 0 (0.0%) | 0 (0.0%) |
| 5 to 9 Unit Apartments | 0 (0.0%) | 0 (0.0%) |
| 10 or more Apartments | 0 (0.0%) | 0 (0.0%) |
| Mobile Home / Other | 105 (62.9%) | 62 (37.1%) |
| Total | 277 (64.9%) | 150 (35.1%) |
Housing Structures by Number of Rooms in Siesta Shores
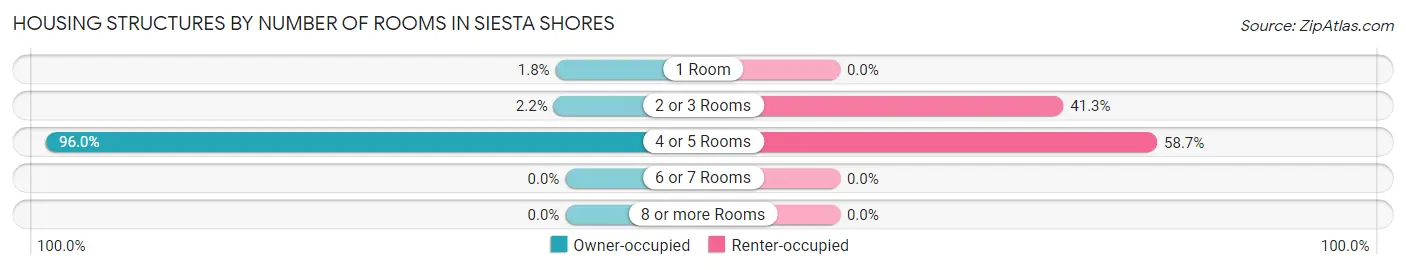
| Number of Rooms | Owner-occupied | Renter-occupied |
| 1 Room | 5 (1.8%) | 0 (0.0%) |
| 2 or 3 Rooms | 6 (2.2%) | 62 (41.3%) |
| 4 or 5 Rooms | 266 (96.0%) | 88 (58.7%) |
| 6 or 7 Rooms | 0 (0.0%) | 0 (0.0%) |
| 8 or more Rooms | 0 (0.0%) | 0 (0.0%) |
| Total | 277 (100.0%) | 150 (100.0%) |
Housing Structure by Heating Type in Siesta Shores
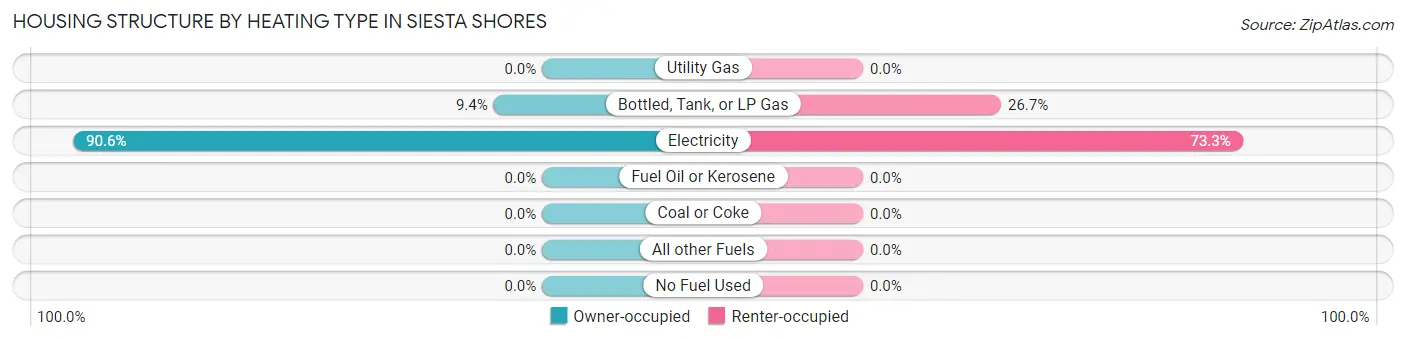
| Heating Type | Owner-occupied | Renter-occupied |
| Utility Gas | 0 (0.0%) | 0 (0.0%) |
| Bottled, Tank, or LP Gas | 26 (9.4%) | 40 (26.7%) |
| Electricity | 251 (90.6%) | 110 (73.3%) |
| Fuel Oil or Kerosene | 0 (0.0%) | 0 (0.0%) |
| Coal or Coke | 0 (0.0%) | 0 (0.0%) |
| All other Fuels | 0 (0.0%) | 0 (0.0%) |
| No Fuel Used | 0 (0.0%) | 0 (0.0%) |
| Total | 277 (100.0%) | 150 (100.0%) |
Household Vehicle Usage in Siesta Shores
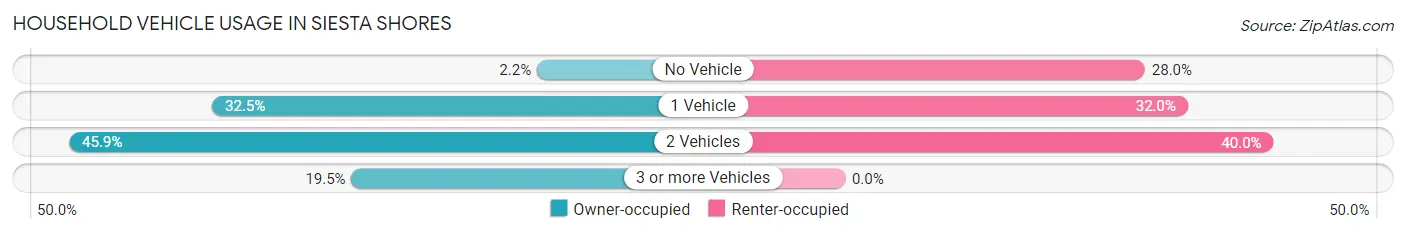
| Vehicles per Household | Owner-occupied | Renter-occupied |
| No Vehicle | 6 (2.2%) | 42 (28.0%) |
| 1 Vehicle | 90 (32.5%) | 48 (32.0%) |
| 2 Vehicles | 127 (45.9%) | 60 (40.0%) |
| 3 or more Vehicles | 54 (19.5%) | 0 (0.0%) |
| Total | 277 (100.0%) | 150 (100.0%) |
Real Estate & Mortgages in Siesta Shores
Real Estate and Mortgage Overview in Siesta Shores
| Characteristic | Without Mortgage | With Mortgage |
| Housing Units | 242 | 35 |
| Median Property Value | $80,400 | $0 |
| Median Household Income | $34,734 | $0 |
| Monthly Housing Costs | $318 | $0 |
| Real Estate Taxes | - | - |
Property Value by Mortgage Status in Siesta Shores
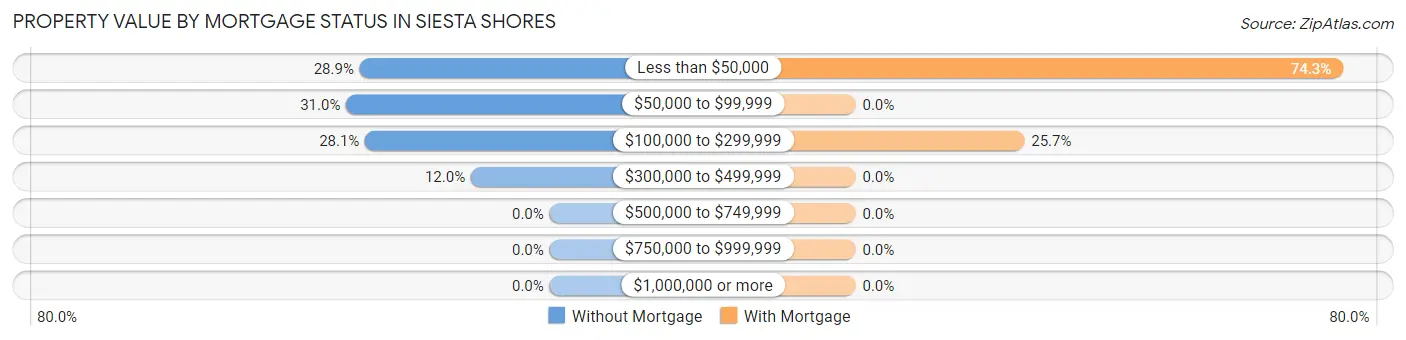
| Property Value | Without Mortgage | With Mortgage |
| Less than $50,000 | 70 (28.9%) | 26 (74.3%) |
| $50,000 to $99,999 | 75 (31.0%) | 0 (0.0%) |
| $100,000 to $299,999 | 68 (28.1%) | 9 (25.7%) |
| $300,000 to $499,999 | 29 (12.0%) | 0 (0.0%) |
| $500,000 to $749,999 | 0 (0.0%) | 0 (0.0%) |
| $750,000 to $999,999 | 0 (0.0%) | 0 (0.0%) |
| $1,000,000 or more | 0 (0.0%) | 0 (0.0%) |
| Total | 242 (100.0%) | 35 (100.0%) |
Household Income by Mortgage Status in Siesta Shores
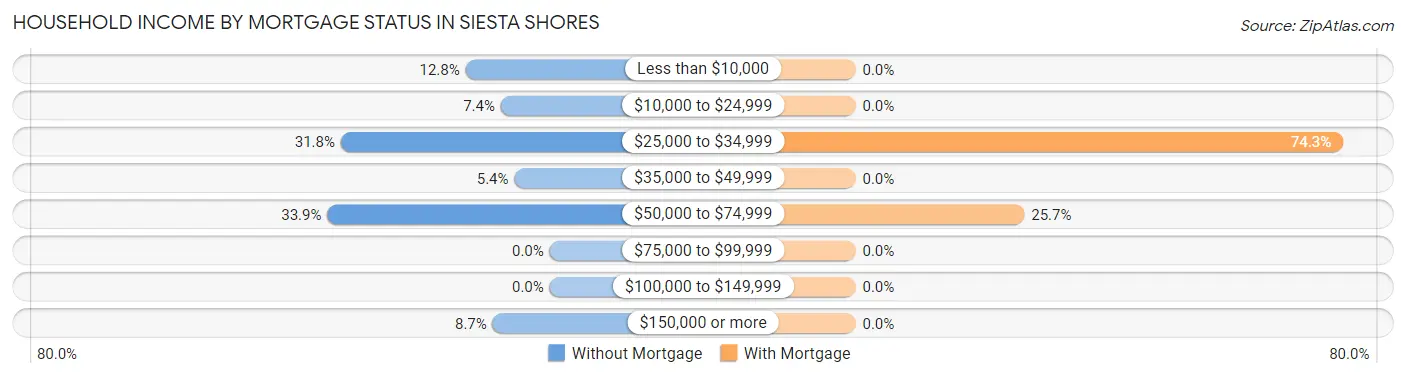
| Household Income | Without Mortgage | With Mortgage |
| Less than $10,000 | 31 (12.8%) | 0 (0.0%) |
| $10,000 to $24,999 | 18 (7.4%) | 0 (0.0%) |
| $25,000 to $34,999 | 77 (31.8%) | 26 (74.3%) |
| $35,000 to $49,999 | 13 (5.4%) | 0 (0.0%) |
| $50,000 to $74,999 | 82 (33.9%) | 9 (25.7%) |
| $75,000 to $99,999 | 0 (0.0%) | 0 (0.0%) |
| $100,000 to $149,999 | 0 (0.0%) | 0 (0.0%) |
| $150,000 or more | 21 (8.7%) | 0 (0.0%) |
| Total | 242 (100.0%) | 35 (100.0%) |
Property Value to Household Income Ratio in Siesta Shores
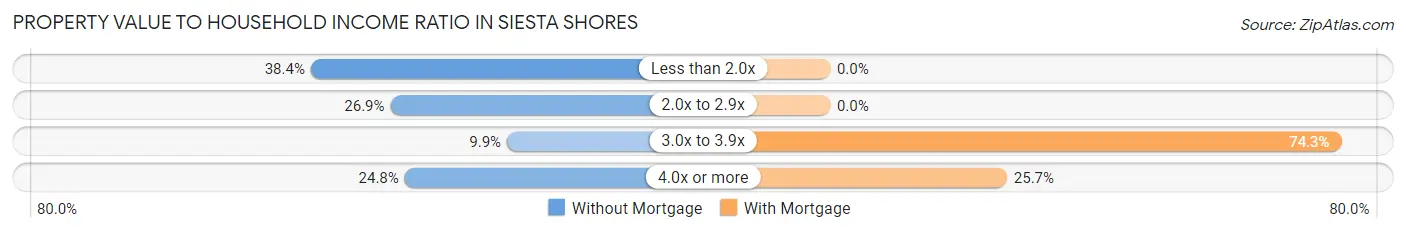
| Value-to-Income Ratio | Without Mortgage | With Mortgage |
| Less than 2.0x | 93 (38.4%) | 0 (0.0%) |
| 2.0x to 2.9x | 65 (26.9%) | 0 (0.0%) |
| 3.0x to 3.9x | 24 (9.9%) | 26 (74.3%) |
| 4.0x or more | 60 (24.8%) | 9 (25.7%) |
| Total | 242 (100.0%) | 35 (100.0%) |
Real Estate Taxes by Mortgage Status in Siesta Shores
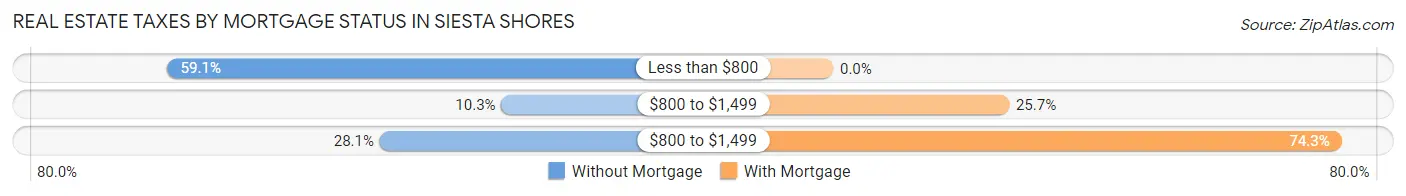
| Property Taxes | Without Mortgage | With Mortgage |
| Less than $800 | 143 (59.1%) | 0 (0.0%) |
| $800 to $1,499 | 25 (10.3%) | 9 (25.7%) |
| $800 to $1,499 | 68 (28.1%) | 26 (74.3%) |
| Total | 242 (100.0%) | 35 (100.0%) |
Health & Disability in Siesta Shores
Health Insurance Coverage by Age in Siesta Shores
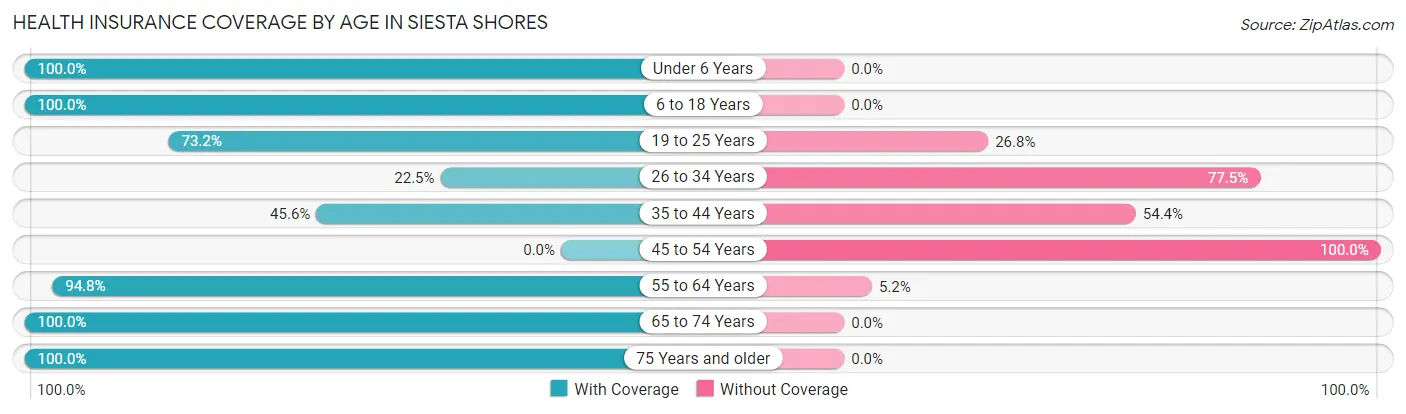
| Age Bracket | With Coverage | Without Coverage |
| Under 6 Years | 261 (100.0%) | 0 (0.0%) |
| 6 to 18 Years | 418 (100.0%) | 0 (0.0%) |
| 19 to 25 Years | 199 (73.2%) | 73 (26.8%) |
| 26 to 34 Years | 51 (22.5%) | 176 (77.5%) |
| 35 to 44 Years | 47 (45.6%) | 56 (54.4%) |
| 45 to 54 Years | 0 (0.0%) | 62 (100.0%) |
| 55 to 64 Years | 110 (94.8%) | 6 (5.2%) |
| 65 to 74 Years | 124 (100.0%) | 0 (0.0%) |
| 75 Years and older | 36 (100.0%) | 0 (0.0%) |
| Total | 1,246 (77.0%) | 373 (23.0%) |
Health Insurance Coverage by Citizenship Status in Siesta Shores
| Citizenship Status | With Coverage | Without Coverage |
| Native Born | 261 (100.0%) | 0 (0.0%) |
| Foreign Born, Citizen | 418 (100.0%) | 0 (0.0%) |
| Foreign Born, not a Citizen | 199 (73.2%) | 73 (26.8%) |
Health Insurance Coverage by Household Income in Siesta Shores
| Household Income | With Coverage | Without Coverage |
| Under $25,000 | 514 (89.2%) | 62 (10.8%) |
| $25,000 to $49,999 | 367 (68.0%) | 173 (32.0%) |
| $50,000 to $74,999 | 277 (76.3%) | 86 (23.7%) |
| $75,000 to $99,999 | 67 (56.3%) | 52 (43.7%) |
| $100,000 and over | 21 (100.0%) | 0 (0.0%) |
Public vs Private Health Insurance Coverage by Age in Siesta Shores
| Age Bracket | Public Insurance | Private Insurance |
| Under 6 | 261 (100.0%) | 0 (0.0%) |
| 6 to 18 Years | 418 (100.0%) | 0 (0.0%) |
| 19 to 25 Years | 199 (73.2%) | 0 (0.0%) |
| 25 to 34 Years | 22 (9.7%) | 29 (12.8%) |
| 35 to 44 Years | 24 (23.3%) | 23 (22.3%) |
| 45 to 54 Years | 0 (0.0%) | 0 (0.0%) |
| 55 to 64 Years | 0 (0.0%) | 110 (94.8%) |
| 65 to 74 Years | 124 (100.0%) | 47 (37.9%) |
| 75 Years and over | 36 (100.0%) | 0 (0.0%) |
| Total | 1,084 (66.9%) | 209 (12.9%) |
Disability Status by Sex by Age in Siesta Shores
| Age Bracket | Male | Female |
| Under 5 Years | 38 (20.0%) | 0 (0.0%) |
| 5 to 17 Years | 36 (12.4%) | 27 (15.8%) |
| 18 to 34 Years | 9 (3.1%) | 54 (26.1%) |
| 35 to 64 Years | 90 (78.3%) | 72 (43.4%) |
| 65 to 74 Years | 0 (0.0%) | 26 (26.8%) |
| 75 Years and over | 36 (100.0%) | 0 (0.0%) |
Disability Class by Sex by Age in Siesta Shores
Disability Class: Hearing Difficulty
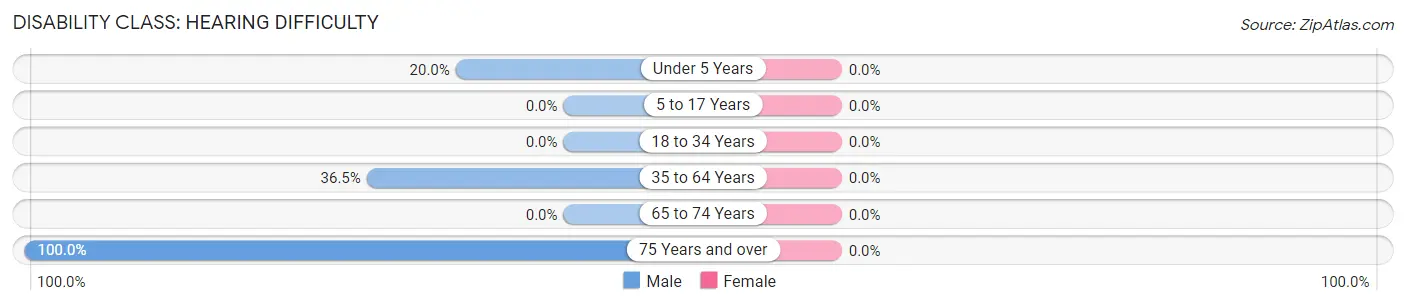
| Age Bracket | Male | Female |
| Under 5 Years | 38 (20.0%) | 0 (0.0%) |
| 5 to 17 Years | 0 (0.0%) | 0 (0.0%) |
| 18 to 34 Years | 0 (0.0%) | 0 (0.0%) |
| 35 to 64 Years | 42 (36.5%) | 0 (0.0%) |
| 65 to 74 Years | 0 (0.0%) | 0 (0.0%) |
| 75 Years and over | 36 (100.0%) | 0 (0.0%) |
Disability Class: Vision Difficulty
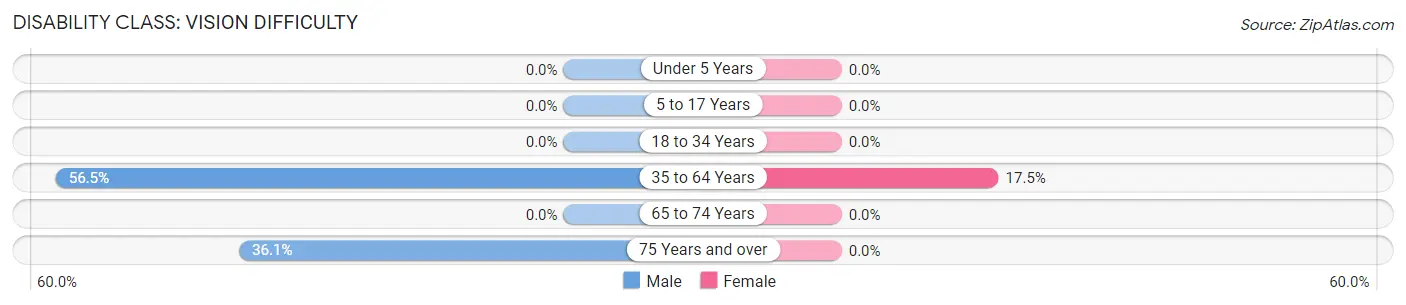
| Age Bracket | Male | Female |
| Under 5 Years | 0 (0.0%) | 0 (0.0%) |
| 5 to 17 Years | 0 (0.0%) | 0 (0.0%) |
| 18 to 34 Years | 0 (0.0%) | 0 (0.0%) |
| 35 to 64 Years | 65 (56.5%) | 29 (17.5%) |
| 65 to 74 Years | 0 (0.0%) | 0 (0.0%) |
| 75 Years and over | 13 (36.1%) | 0 (0.0%) |
Disability Class: Cognitive Difficulty
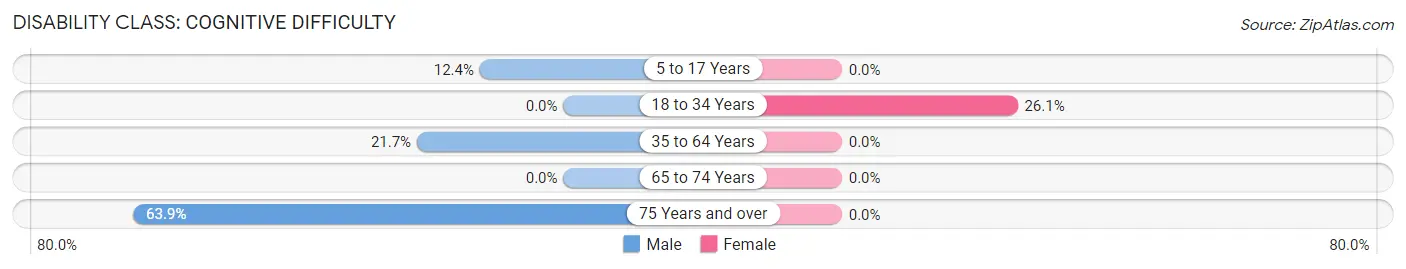
| Age Bracket | Male | Female |
| 5 to 17 Years | 36 (12.4%) | 0 (0.0%) |
| 18 to 34 Years | 0 (0.0%) | 54 (26.1%) |
| 35 to 64 Years | 25 (21.7%) | 0 (0.0%) |
| 65 to 74 Years | 0 (0.0%) | 0 (0.0%) |
| 75 Years and over | 23 (63.9%) | 0 (0.0%) |
Disability Class: Ambulatory Difficulty
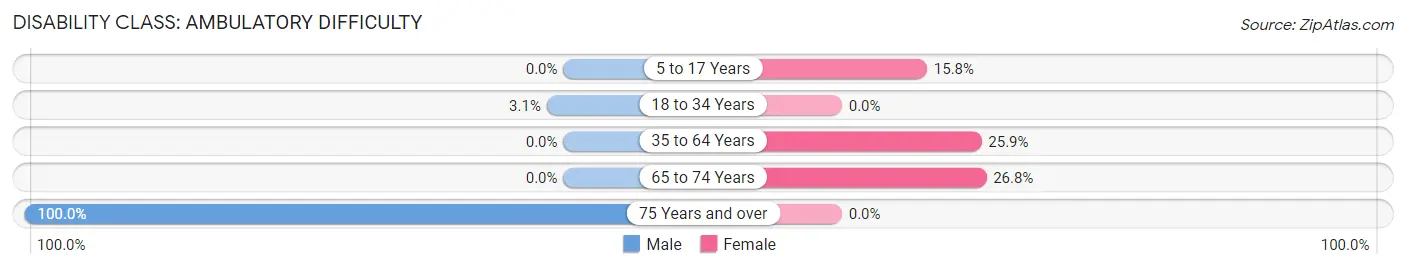
| Age Bracket | Male | Female |
| 5 to 17 Years | 0 (0.0%) | 27 (15.8%) |
| 18 to 34 Years | 9 (3.1%) | 0 (0.0%) |
| 35 to 64 Years | 0 (0.0%) | 43 (25.9%) |
| 65 to 74 Years | 0 (0.0%) | 26 (26.8%) |
| 75 Years and over | 36 (100.0%) | 0 (0.0%) |
Disability Class: Self-Care Difficulty
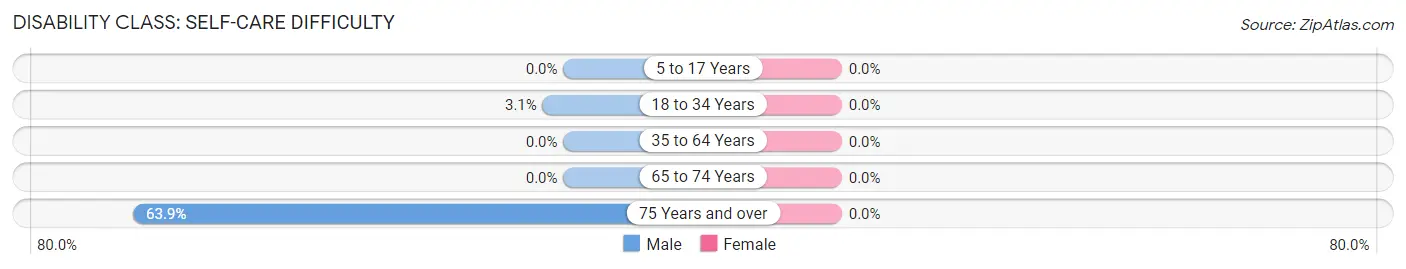
| Age Bracket | Male | Female |
| 5 to 17 Years | 0 (0.0%) | 0 (0.0%) |
| 18 to 34 Years | 9 (3.1%) | 0 (0.0%) |
| 35 to 64 Years | 0 (0.0%) | 0 (0.0%) |
| 65 to 74 Years | 0 (0.0%) | 0 (0.0%) |
| 75 Years and over | 23 (63.9%) | 0 (0.0%) |
Technology Access in Siesta Shores
Computing Device Access in Siesta Shores
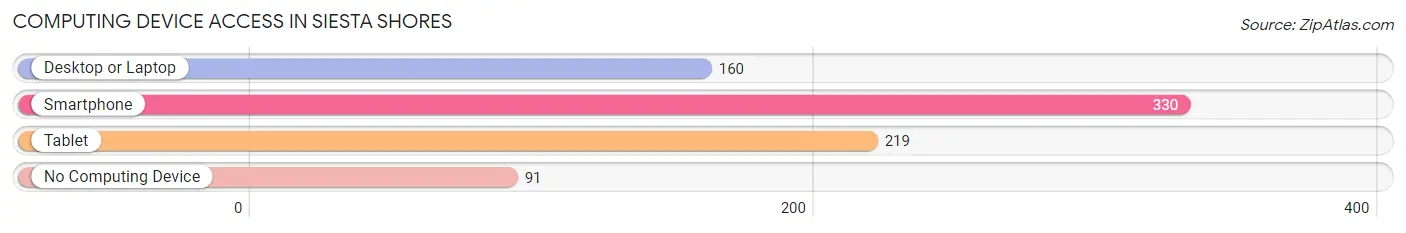
| Device Type | # Households | % Households |
| Desktop or Laptop | 160 | 37.5% |
| Smartphone | 330 | 77.3% |
| Tablet | 219 | 51.3% |
| No Computing Device | 91 | 21.3% |
| Total | 427 | 100.0% |
Internet Access in Siesta Shores
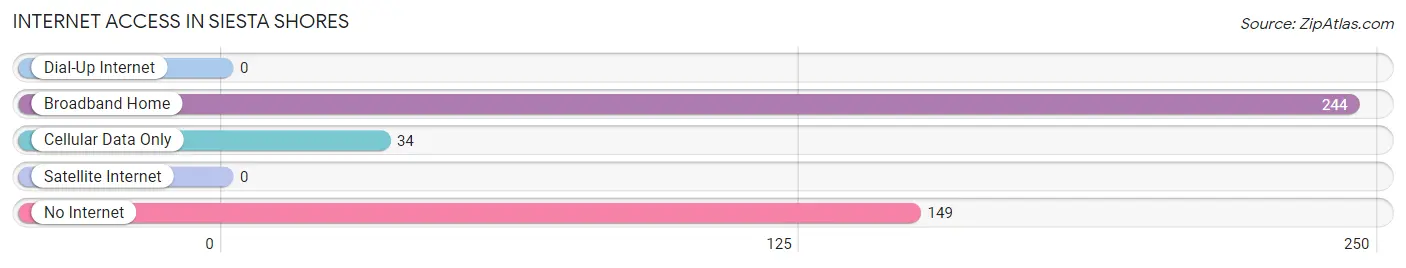
| Internet Type | # Households | % Households |
| Dial-Up Internet | 0 | 0.0% |
| Broadband Home | 244 | 57.1% |
| Cellular Data Only | 34 | 8.0% |
| Satellite Internet | 0 | 0.0% |
| No Internet | 149 | 34.9% |
| Total | 427 | 100.0% |
Siesta Shores Summary
Siesta Shores is a small town located in the state of Texas, United States. It is situated in the county of Nueces, and is part of the Corpus Christi Metropolitan Statistical Area. The town has a population of approximately 1,500 people, and is known for its beautiful beaches and laid-back atmosphere.
History
Siesta Shores was founded in the late 1800s by a group of settlers from the nearby town of Corpus Christi. The settlers were looking for a place to settle down and start a new life, and they found the perfect spot in Siesta Shores. The town was originally called “Siesta Beach”, and was a popular destination for vacationers from all over the country.
In the early 1900s, the town was renamed “Siesta Shores”, and the population began to grow. The town was known for its fishing industry, and many of the locals made their living by fishing in the nearby waters. The town also had a thriving tourism industry, and many visitors came to enjoy the beautiful beaches and laid-back atmosphere.
In the 1950s, the town began to experience a decline in population as many of the locals moved away in search of better opportunities. However, the town was able to maintain its small-town charm, and it remains a popular destination for tourists and locals alike.
Geography
Siesta Shores is located in the county of Nueces, and is part of the Corpus Christi Metropolitan Statistical Area. The town is situated on the Gulf of Mexico, and is surrounded by the cities of Corpus Christi, Port Aransas, and Mustang Island. The town is located on the western side of the Nueces Bay, and is approximately 25 miles from the city of Corpus Christi.
The town has a total area of 1.2 square miles, and is home to a variety of wildlife, including deer, coyotes, and various species of birds. The town is also home to a variety of plants, including cacti, mesquite, and various types of grasses.
Economy
The economy of Siesta Shores is largely based on tourism and fishing. The town is home to a variety of hotels, restaurants, and other businesses that cater to tourists. The town also has a thriving fishing industry, and many of the locals make their living by fishing in the nearby waters.
The town also has a number of small businesses, including convenience stores, gas stations, and other retail outlets. The town is also home to a number of art galleries, and is a popular destination for art lovers.
Demographics
As of the 2010 census, the population of Siesta Shores was 1,500 people. The town has a median age of 44.7 years, and the median household income is $41,250. The town is predominantly white, with approximately 75% of the population identifying as white. The town also has a small Hispanic population, with approximately 15% of the population identifying as Hispanic. The town also has a small African American population, with approximately 5% of the population identifying as African American.
Common Questions
What is Per Capita Income in Siesta Shores?
Per Capita income in Siesta Shores is $12,125.
What is the Median Family Income in Siesta Shores?
Median Family Income in Siesta Shores is $33,750.
What is the Median Household income in Siesta Shores?
Median Household Income in Siesta Shores is $34,733.
What is Inequality or Gini Index in Siesta Shores?
Inequality or Gini Index in Siesta Shores is 0.36.
What is the Total Population of Siesta Shores?
Total Population of Siesta Shores is 1,619.
What is the Total Male Population of Siesta Shores?
Total Male Population of Siesta Shores is 950.
What is the Total Female Population of Siesta Shores?
Total Female Population of Siesta Shores is 669.
What is the Ratio of Males per 100 Females in Siesta Shores?
There are 142.00 Males per 100 Females in Siesta Shores.
What is the Ratio of Females per 100 Males in Siesta Shores?
There are 70.42 Females per 100 Males in Siesta Shores.
What is the Median Population Age in Siesta Shores?
Median Population Age in Siesta Shores is 21.4 Years.
What is the Average Family Size in Siesta Shores
Average Family Size in Siesta Shores is 4.5 People.
What is the Average Household Size in Siesta Shores
Average Household Size in Siesta Shores is 3.8 People.
How Large is the Labor Force in Siesta Shores?
There are 528 People in the Labor Forcein in Siesta Shores.
What is the Percentage of People in the Labor Force in Siesta Shores?
56.2% of People are in the Labor Force in Siesta Shores.
What is the Unemployment Rate in Siesta Shores?
Unemployment Rate in Siesta Shores is 18.4%.