White Haven, MT Map & Demographics
White Haven Map
White Haven Overview
$31,440
PER CAPITA INCOME
$110,341
AVG FAMILY INCOME
$33,641
AVG HOUSEHOLD INCOME
0.55
INEQUALITY / GINI INDEX
699
TOTAL POPULATION
485
MALE POPULATION
214
FEMALE POPULATION
226.64
MALES / 100 FEMALES
44.12
FEMALES / 100 MALES
44.6
MEDIAN AGE
3.3
AVG FAMILY SIZE
2.6
AVG HOUSEHOLD SIZE
334
LABOR FORCE [ PEOPLE ]
54.0%
PERCENT IN LABOR FORCE
13.2%
UNEMPLOYMENT RATE
Income in White Haven
Income Overview in White Haven
Per Capita Income in White Haven is $31,440, while median incomes of families and households are $110,341 and $33,641 respectively.
| Characteristic | Number | Measure |
| Per Capita Income | 699 | $31,440 |
| Median Family Income | 147 | $110,341 |
| Mean Family Income | 147 | $105,073 |
| Median Household Income | 273 | $33,641 |
| Mean Household Income | 273 | $65,318 |
| Income Deficit | 147 | $0 |
| Wage / Income Gap (%) | 699 | 0.00% |
| Wage / Income Gap ($) | 699 | 100.00¢ per $1 |
| Gini / Inequality Index | 699 | 0.55 |
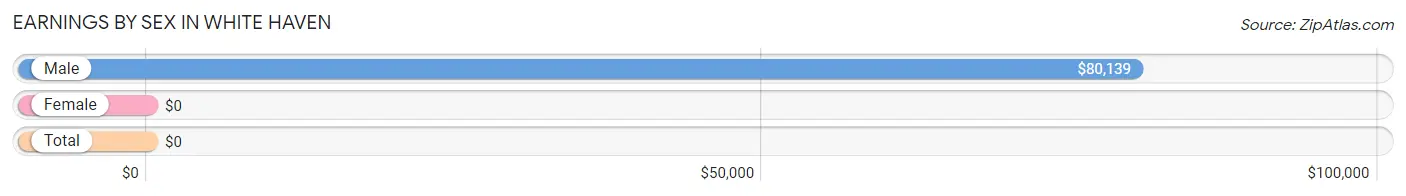
Earnings by Sex in White Haven
| Sex | Number | Average Earnings |
| Male | 261 (75.9%) | $80,139 |
| Female | 83 (24.1%) | $0 |
| Total | 344 (100.0%) | $0 |
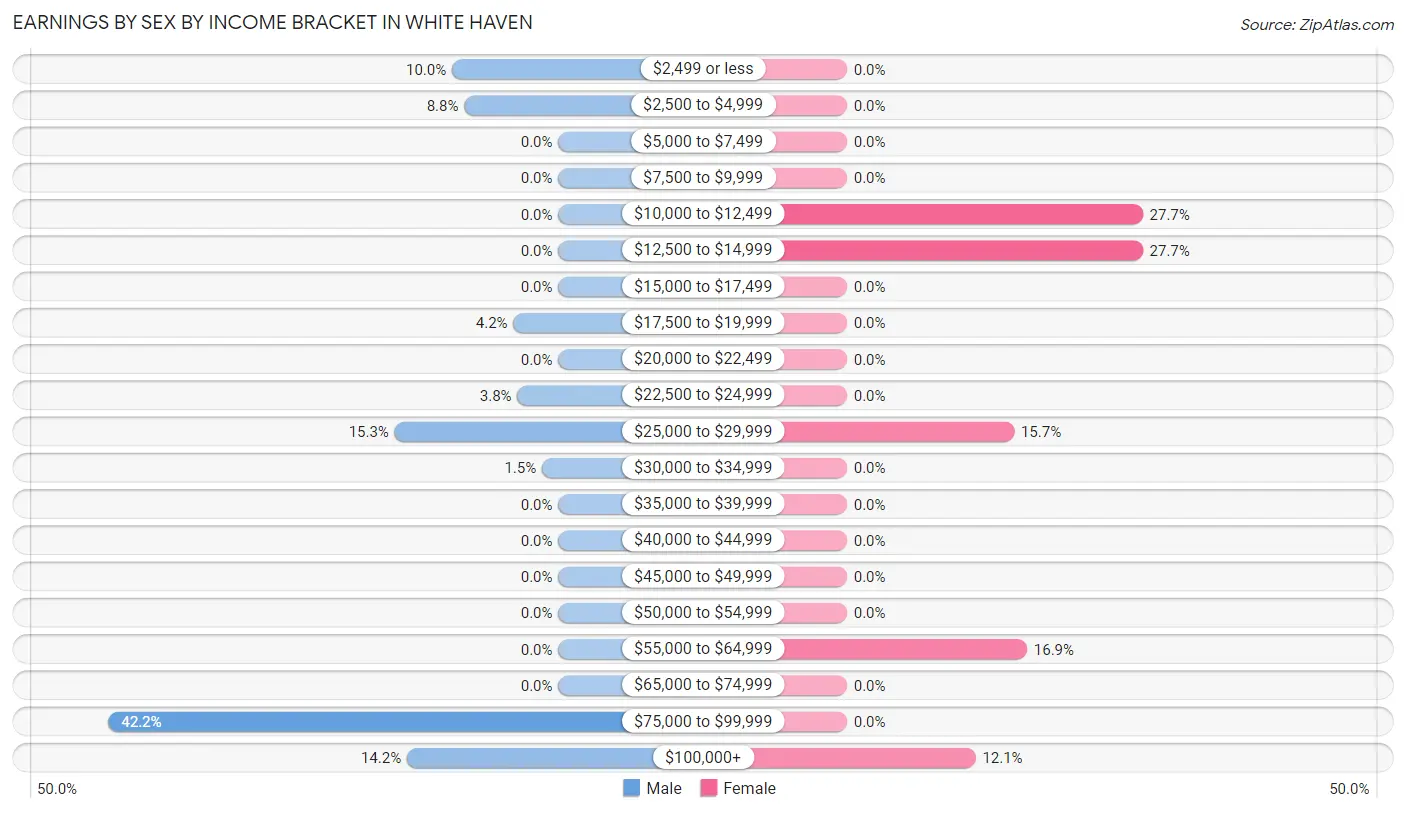
Earnings by Sex by Income Bracket in White Haven
The most common earnings brackets in White Haven are $75,000 to $99,999 for men (110 | 42.1%) and $10,000 to $12,499 for women (23 | 27.7%).
| Income | Male | Female |
| $2,499 or less | 26 (10.0%) | 0 (0.0%) |
| $2,500 to $4,999 | 23 (8.8%) | 0 (0.0%) |
| $5,000 to $7,499 | 0 (0.0%) | 0 (0.0%) |
| $7,500 to $9,999 | 0 (0.0%) | 0 (0.0%) |
| $10,000 to $12,499 | 0 (0.0%) | 23 (27.7%) |
| $12,500 to $14,999 | 0 (0.0%) | 23 (27.7%) |
| $15,000 to $17,499 | 0 (0.0%) | 0 (0.0%) |
| $17,500 to $19,999 | 11 (4.2%) | 0 (0.0%) |
| $20,000 to $22,499 | 0 (0.0%) | 0 (0.0%) |
| $22,500 to $24,999 | 10 (3.8%) | 0 (0.0%) |
| $25,000 to $29,999 | 40 (15.3%) | 13 (15.7%) |
| $30,000 to $34,999 | 4 (1.5%) | 0 (0.0%) |
| $35,000 to $39,999 | 0 (0.0%) | 0 (0.0%) |
| $40,000 to $44,999 | 0 (0.0%) | 0 (0.0%) |
| $45,000 to $49,999 | 0 (0.0%) | 0 (0.0%) |
| $50,000 to $54,999 | 0 (0.0%) | 0 (0.0%) |
| $55,000 to $64,999 | 0 (0.0%) | 14 (16.9%) |
| $65,000 to $74,999 | 0 (0.0%) | 0 (0.0%) |
| $75,000 to $99,999 | 110 (42.1%) | 0 (0.0%) |
| $100,000+ | 37 (14.2%) | 10 (12.0%) |
| Total | 261 (100.0%) | 83 (100.0%) |
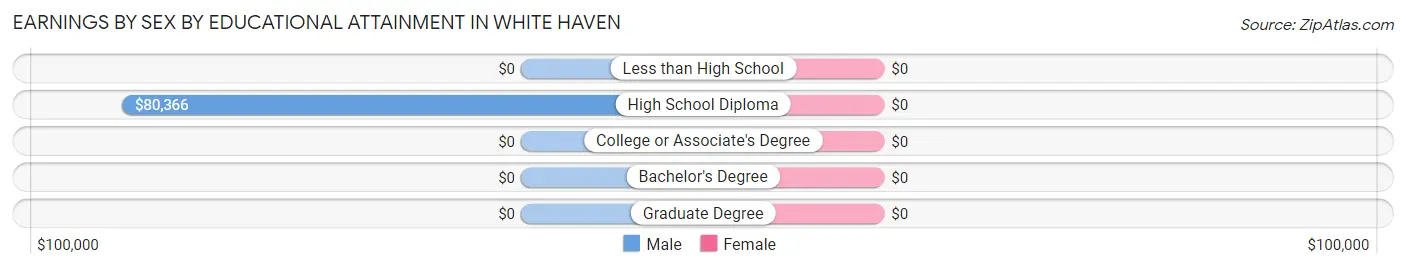
Earnings by Sex by Educational Attainment in White Haven
| Educational Attainment | Male Income | Female Income |
| Less than High School | - | - |
| High School Diploma | $80,366 | $0 |
| College or Associate's Degree | - | - |
| Bachelor's Degree | - | - |
| Graduate Degree | - | - |
| Total | $80,530 | $0 |
Family Income in White Haven
Family Income Brackets in White Haven
According to the White Haven family income data, there are 41 families falling into the $100,000 to $149,999 income range, which is the most common income bracket and makes up 27.9% of all families.
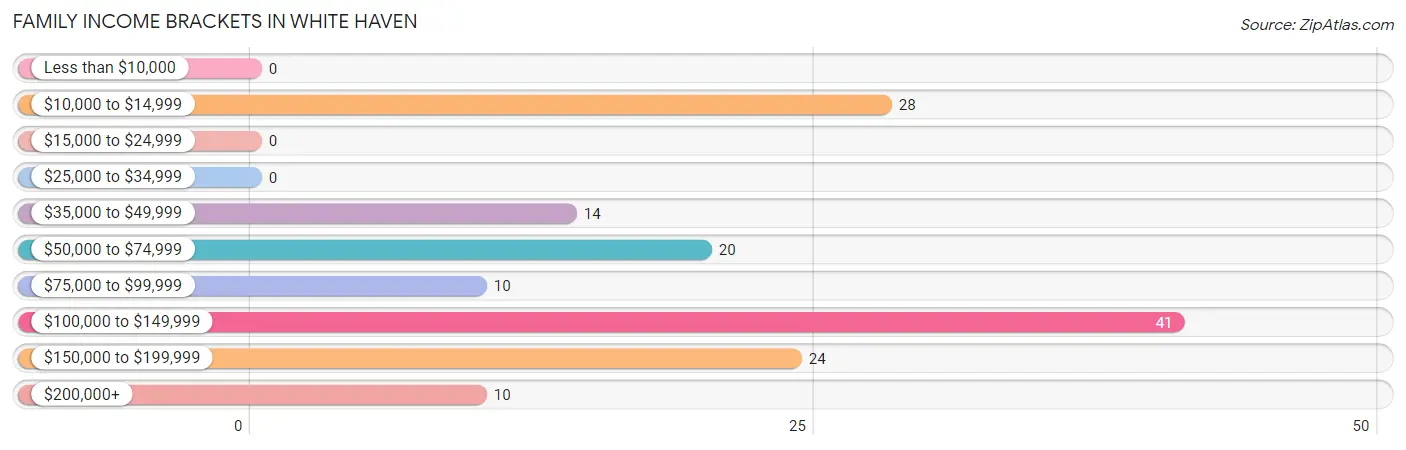
| Income Bracket | # Families | % Families |
| Less than $10,000 | 0 | 0.0% |
| $10,000 to $14,999 | 28 | 19.0% |
| $15,000 to $24,999 | 0 | 0.0% |
| $25,000 to $34,999 | 0 | 0.0% |
| $35,000 to $49,999 | 14 | 9.5% |
| $50,000 to $74,999 | 20 | 13.6% |
| $75,000 to $99,999 | 10 | 6.8% |
| $100,000 to $149,999 | 41 | 27.9% |
| $150,000 to $199,999 | 24 | 16.3% |
| $200,000+ | 10 | 6.8% |
Family Income by Famaliy Size in White Haven
3-person families (112 | 76.2%) account for the highest median family income in White Haven with $130,667 per family, while 3-person families (112 | 76.2%) have the highest median income of $43,556 per family member.
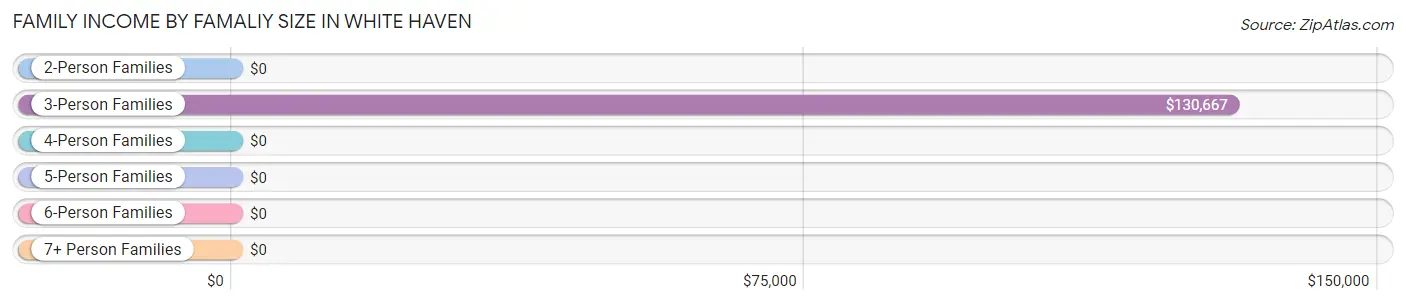
| Income Bracket | # Families | Median Income |
| 2-Person Families | 29 (19.7%) | $0 |
| 3-Person Families | 112 (76.2%) | $130,667 |
| 4-Person Families | 6 (4.1%) | $0 |
| 5-Person Families | 0 (0.0%) | $0 |
| 6-Person Families | 0 (0.0%) | $0 |
| 7+ Person Families | 0 (0.0%) | $0 |
| Total | 147 (100.0%) | $110,341 |
Family Income by Number of Earners in White Haven
| Number of Earners | # Families | Median Income |
| No Earners | 24 (16.3%) | $0 |
| 1 Earner | 53 (36.0%) | $0 |
| 2 Earners | 59 (40.1%) | $0 |
| 3+ Earners | 11 (7.5%) | $0 |
| Total | 147 (100.0%) | $110,341 |
Household Income in White Haven
Household Income Brackets in White Haven
With 63 households falling in the category, the $25,000 to $34,999 income range is the most frequent in White Haven, accounting for 23.1% of all households. In contrast, only 8 households (2.9%) fall into the $10,000 to $14,999 income bracket, making it the least populous group.
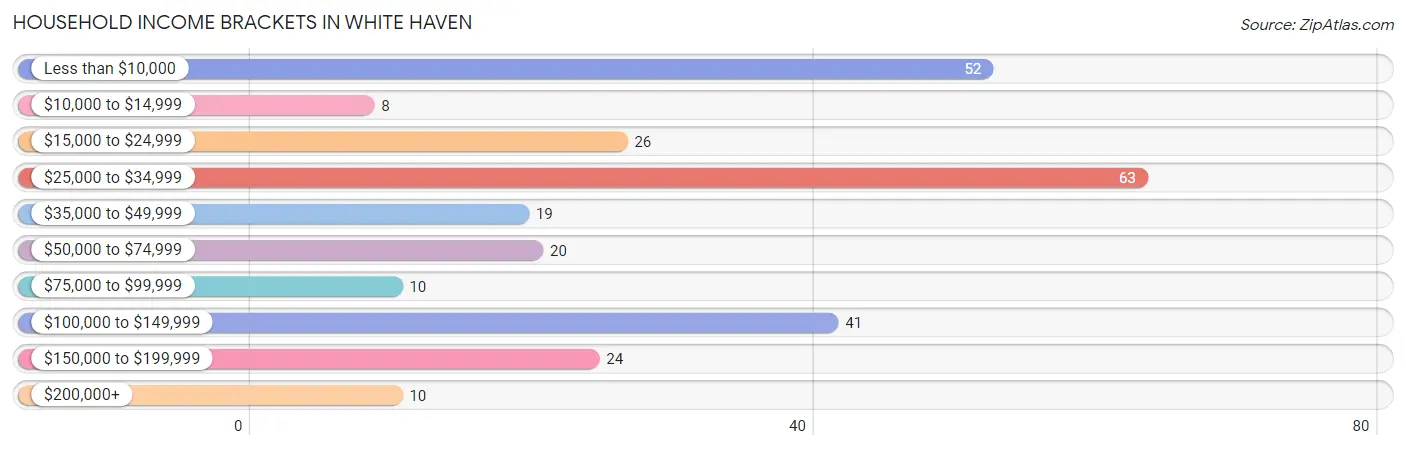
| Income Bracket | # Households | % Households |
| Less than $10,000 | 52 | 19.0% |
| $10,000 to $14,999 | 8 | 2.9% |
| $15,000 to $24,999 | 26 | 9.5% |
| $25,000 to $34,999 | 63 | 23.1% |
| $35,000 to $49,999 | 19 | 7.0% |
| $50,000 to $74,999 | 20 | 7.3% |
| $75,000 to $99,999 | 10 | 3.7% |
| $100,000 to $149,999 | 41 | 15.0% |
| $150,000 to $199,999 | 24 | 8.8% |
| $200,000+ | 10 | 3.7% |
Household Income by Householder Age in White Haven
The median household income in White Haven is $33,641, with the highest median household income of $26,750 found in the 45 to 64 years age bracket for the primary householder. A total of 124 households (45.4%) fall into this category. Meanwhile, the 15 to 24 years age bracket for the primary householder has the lowest median household income of $0, with 10 households (3.7%) in this group.
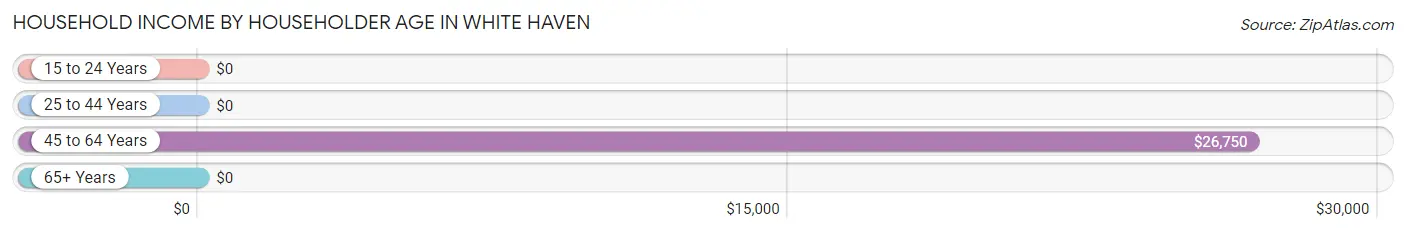
| Income Bracket | # Households | Median Income |
| 15 to 24 Years | 10 (3.7%) | $0 |
| 25 to 44 Years | 81 (29.7%) | $0 |
| 45 to 64 Years | 124 (45.4%) | $26,750 |
| 65+ Years | 58 (21.2%) | $0 |
| Total | 273 (100.0%) | $33,641 |
Poverty in White Haven
Income Below Poverty by Sex and Age in White Haven
With 18.0% poverty level for males and 41.1% for females among the residents of White Haven, 55 to 64 year old males and under 5 year old females are the most vulnerable to poverty, with 79 males (87.8%) and 20 females (100.0%) in their respective age groups living below the poverty level.
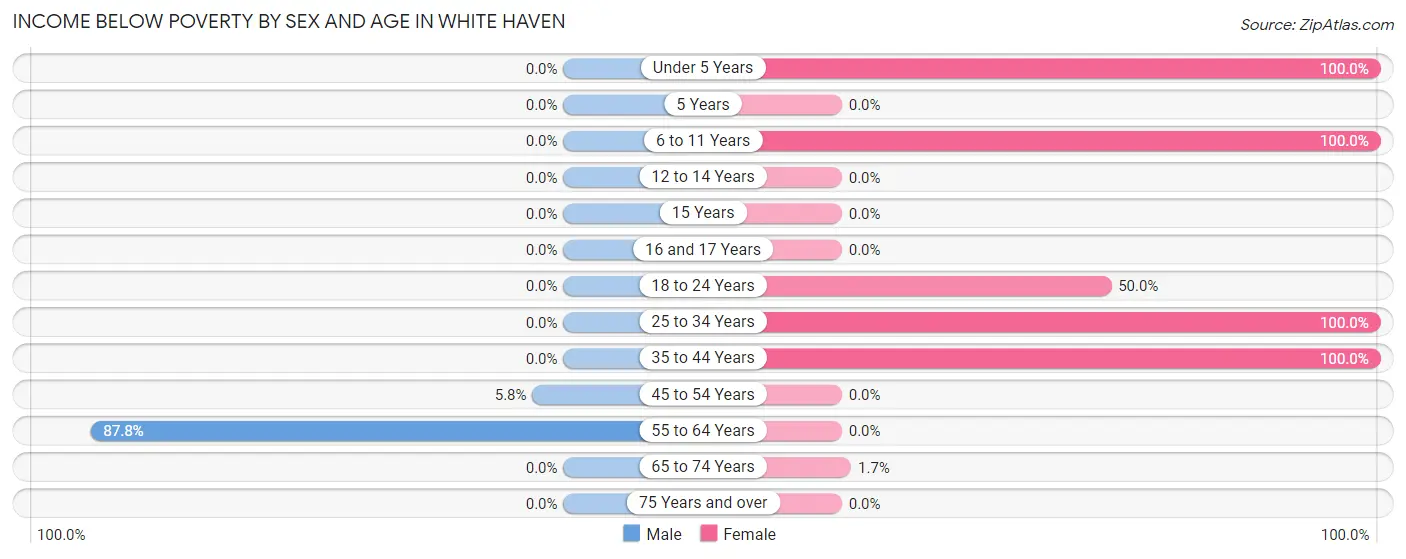
| Age Bracket | Male | Female |
| Under 5 Years | 0 (0.0%) | 20 (100.0%) |
| 5 Years | 0 (0.0%) | 0 (0.0%) |
| 6 to 11 Years | 0 (0.0%) | 11 (100.0%) |
| 12 to 14 Years | 0 (0.0%) | 0 (0.0%) |
| 15 Years | 0 (0.0%) | 0 (0.0%) |
| 16 and 17 Years | 0 (0.0%) | 0 (0.0%) |
| 18 to 24 Years | 0 (0.0%) | 10 (50.0%) |
| 25 to 34 Years | 0 (0.0%) | 23 (100.0%) |
| 35 to 44 Years | 0 (0.0%) | 23 (100.0%) |
| 45 to 54 Years | 5 (5.8%) | 0 (0.0%) |
| 55 to 64 Years | 79 (87.8%) | 0 (0.0%) |
| 65 to 74 Years | 0 (0.0%) | 1 (1.7%) |
| 75 Years and over | 0 (0.0%) | 0 (0.0%) |
| Total | 84 (18.0%) | 88 (41.1%) |
Income Above Poverty by Sex and Age in White Haven
According to the poverty statistics in White Haven, males aged under 5 years and females aged 45 to 54 years are the age groups that are most secure financially, with 100.0% of males and 100.0% of females in these age groups living above the poverty line.
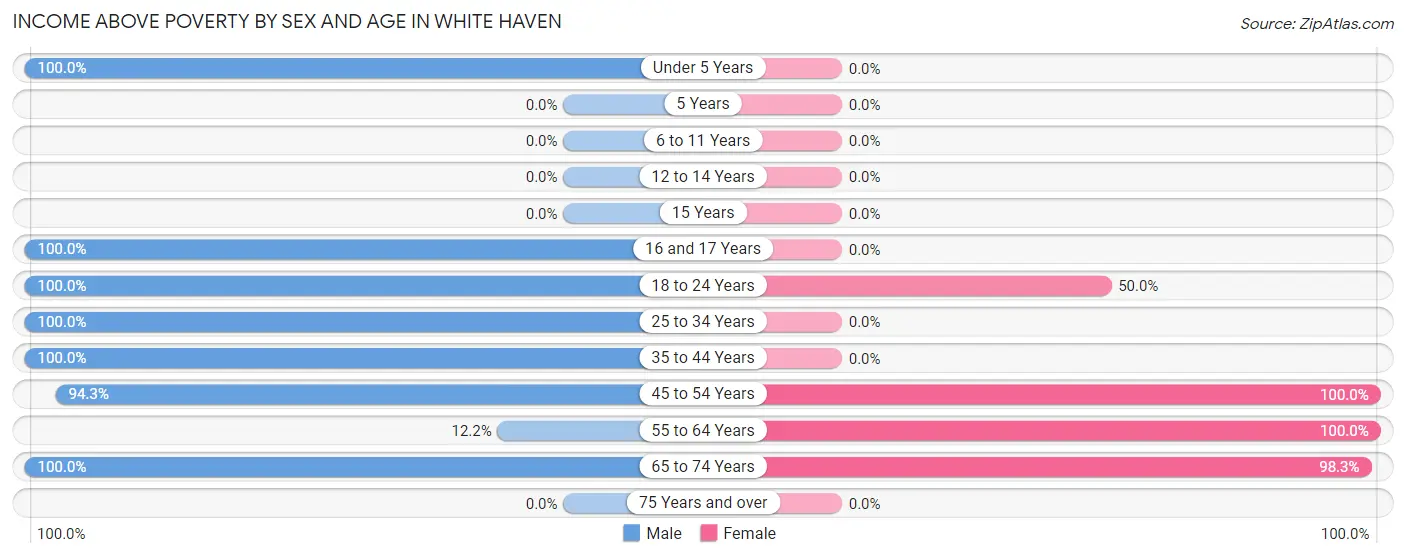
| Age Bracket | Male | Female |
| Under 5 Years | 31 (100.0%) | 0 (0.0%) |
| 5 Years | 0 (0.0%) | 0 (0.0%) |
| 6 to 11 Years | 0 (0.0%) | 0 (0.0%) |
| 12 to 14 Years | 0 (0.0%) | 0 (0.0%) |
| 15 Years | 0 (0.0%) | 0 (0.0%) |
| 16 and 17 Years | 28 (100.0%) | 0 (0.0%) |
| 18 to 24 Years | 62 (100.0%) | 10 (50.0%) |
| 25 to 34 Years | 99 (100.0%) | 0 (0.0%) |
| 35 to 44 Years | 24 (100.0%) | 0 (0.0%) |
| 45 to 54 Years | 82 (94.3%) | 40 (100.0%) |
| 55 to 64 Years | 11 (12.2%) | 19 (100.0%) |
| 65 to 74 Years | 45 (100.0%) | 57 (98.3%) |
| 75 Years and over | 0 (0.0%) | 0 (0.0%) |
| Total | 382 (82.0%) | 126 (58.9%) |
Income Below Poverty Among Married-Couple Families in White Haven
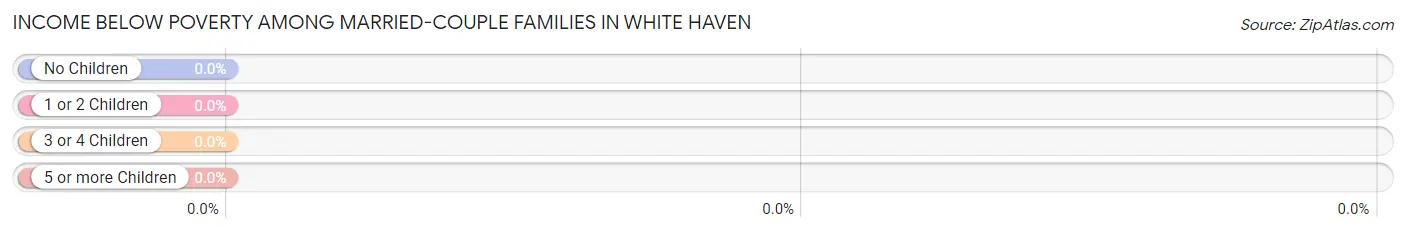
| Children | Above Poverty | Below Poverty |
| No Children | 85 (100.0%) | 0 (0.0%) |
| 1 or 2 Children | 10 (100.0%) | 0 (0.0%) |
| 3 or 4 Children | 0 (0.0%) | 0 (0.0%) |
| 5 or more Children | 0 (0.0%) | 0 (0.0%) |
| Total | 95 (100.0%) | 0 (0.0%) |
Income Below Poverty Among Single-Parent Households in White Haven
According to the poverty data in White Haven, 17.2% or 5 single-father households and 100.0% or 23 single-mother households are living below the poverty line. Among single-father households, those with no children have the highest poverty rate, with 5 households (100.0%) experiencing poverty. Likewise, among single-mother households, those with 1 or 2 children have the highest poverty rate, with 23 households (100.0%) falling below the poverty line.
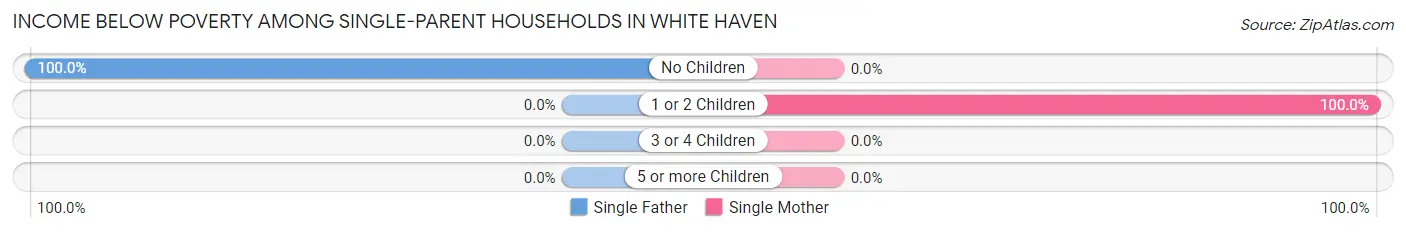
| Children | Single Father | Single Mother |
| No Children | 5 (100.0%) | 0 (0.0%) |
| 1 or 2 Children | 0 (0.0%) | 23 (100.0%) |
| 3 or 4 Children | 0 (0.0%) | 0 (0.0%) |
| 5 or more Children | 0 (0.0%) | 0 (0.0%) |
| Total | 5 (17.2%) | 23 (100.0%) |
Income Below Poverty Among Married-Couple vs Single-Parent Households in White Haven
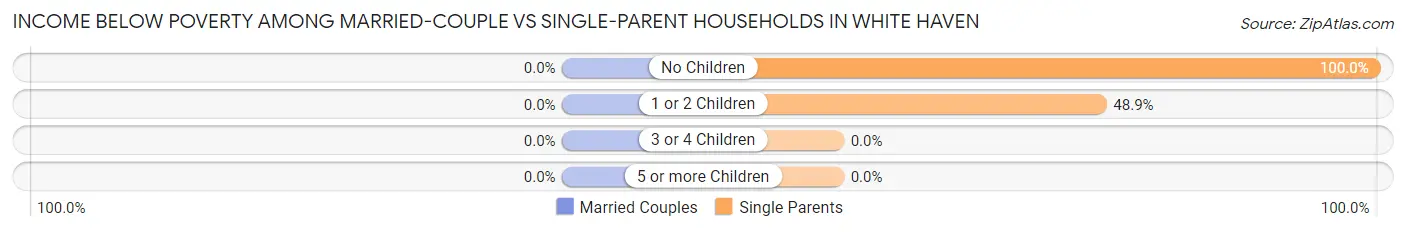
| Children | Married-Couple Families | Single-Parent Households |
| No Children | 0 (0.0%) | 5 (100.0%) |
| 1 or 2 Children | 0 (0.0%) | 23 (48.9%) |
| 3 or 4 Children | 0 (0.0%) | 0 (0.0%) |
| 5 or more Children | 0 (0.0%) | 0 (0.0%) |
| Total | 0 (0.0%) | 28 (53.8%) |
Race in White Haven
The most populous races in White Haven are White / Caucasian (617 | 88.3%), Two or more Races (70 | 10.0%), and Asian (12 | 1.7%).
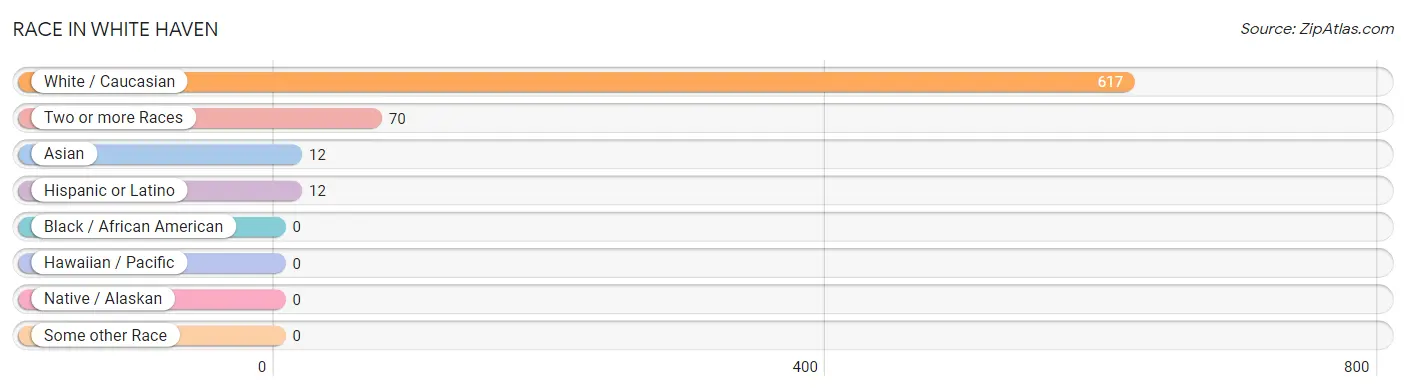
| Race | # Population | % Population |
| Asian | 12 | 1.7% |
| Black / African American | 0 | 0.0% |
| Hawaiian / Pacific | 0 | 0.0% |
| Hispanic or Latino | 12 | 1.7% |
| Native / Alaskan | 0 | 0.0% |
| White / Caucasian | 617 | 88.3% |
| Two or more Races | 70 | 10.0% |
| Some other Race | 0 | 0.0% |
| Total | 699 | 100.0% |
Ancestry in White Haven
The most populous ancestries reported in White Haven are Irish (203 | 29.0%), German (70 | 10.0%), English (66 | 9.4%), Dutch (50 | 7.1%), and Swedish (50 | 7.1%), together accounting for 62.8% of all White Haven residents.
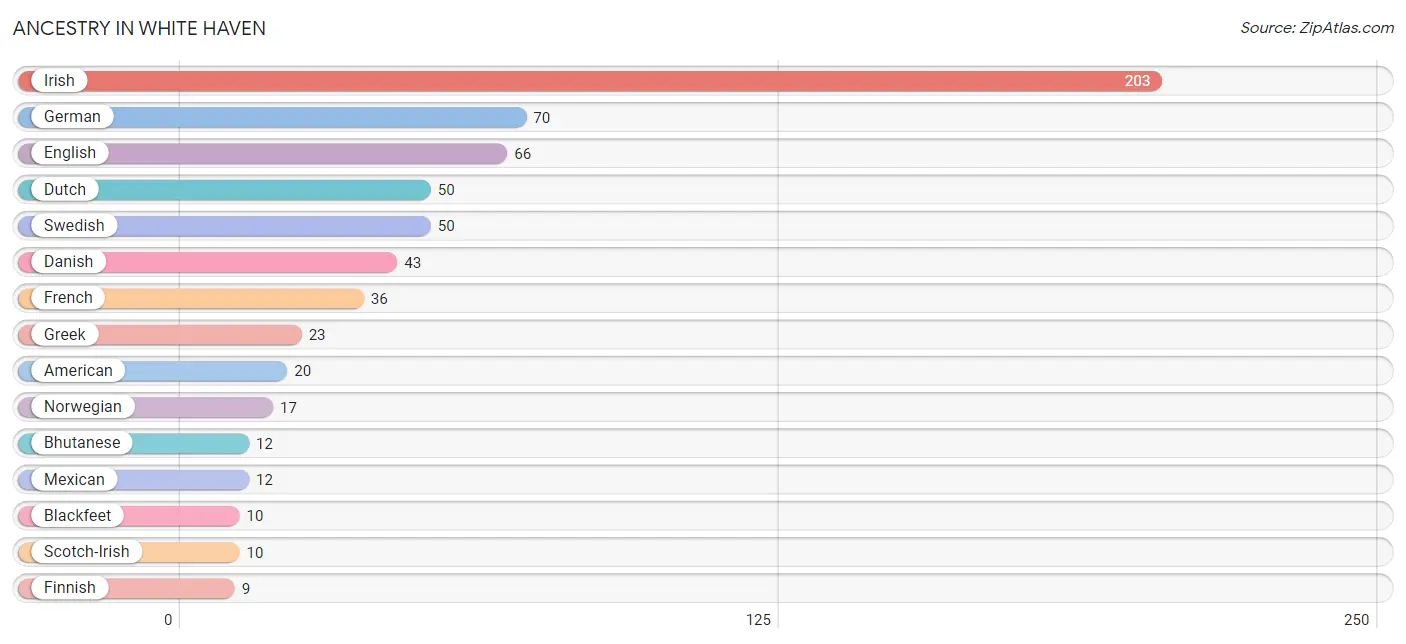
| Ancestry | # Population | % Population |
| American | 20 | 2.9% |
| Bhutanese | 12 | 1.7% |
| Blackfeet | 10 | 1.4% |
| Danish | 43 | 6.1% |
| Dutch | 50 | 7.1% |
| English | 66 | 9.4% |
| Finnish | 9 | 1.3% |
| French | 36 | 5.1% |
| German | 70 | 10.0% |
| Greek | 23 | 3.3% |
| Irish | 203 | 29.0% |
| Italian | 5 | 0.7% |
| Mexican | 12 | 1.7% |
| Norwegian | 17 | 2.4% |
| Scotch-Irish | 10 | 1.4% |
| Swedish | 50 | 7.1% | View All 16 Rows |
Immigrants in White Haven

| Immigration Origin | # Population | % Population | View All 0 Rows |
Sex and Age in White Haven
Sex and Age in White Haven
The most populous age groups in White Haven are 60 to 64 Years (79 | 16.3%) for men and 65 to 69 Years (48 | 22.4%) for women.
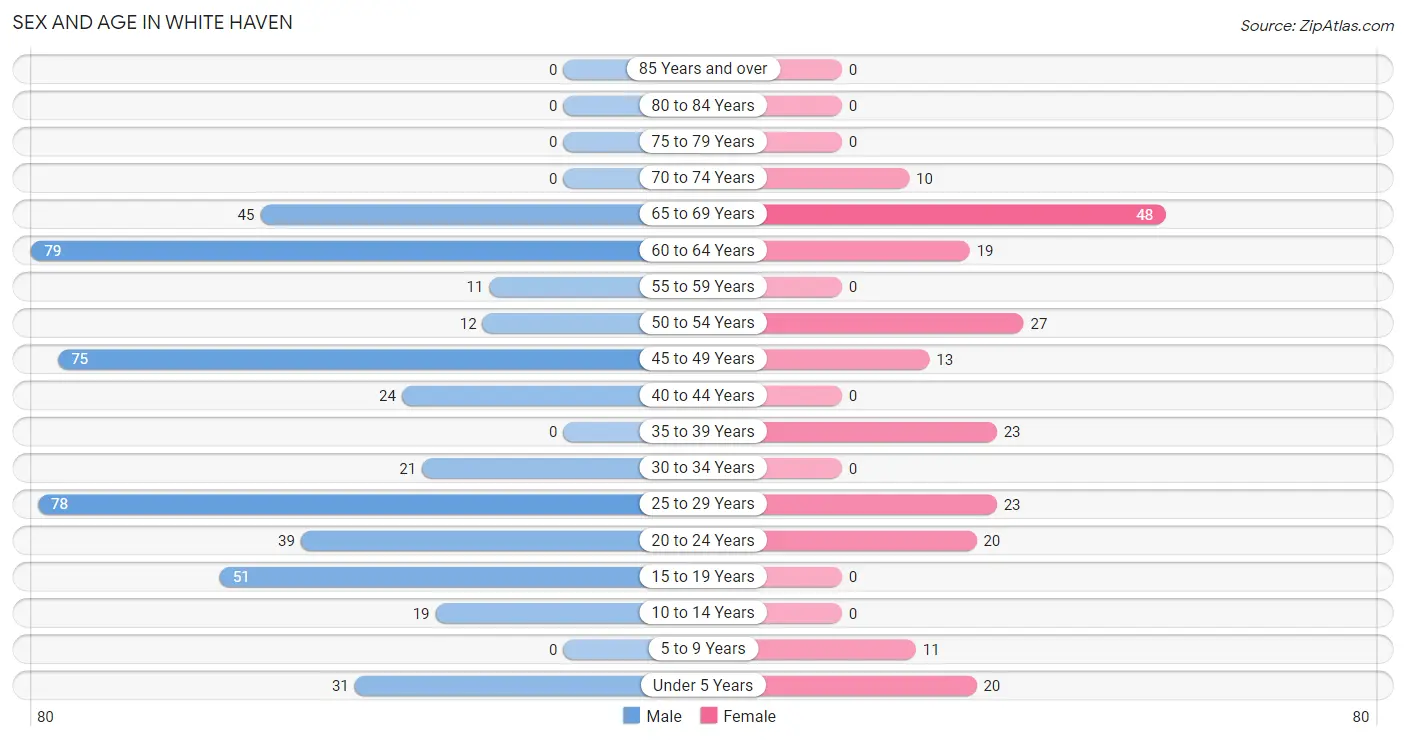
| Age Bracket | Male | Female |
| Under 5 Years | 31 (6.4%) | 20 (9.3%) |
| 5 to 9 Years | 0 (0.0%) | 11 (5.1%) |
| 10 to 14 Years | 19 (3.9%) | 0 (0.0%) |
| 15 to 19 Years | 51 (10.5%) | 0 (0.0%) |
| 20 to 24 Years | 39 (8.0%) | 20 (9.3%) |
| 25 to 29 Years | 78 (16.1%) | 23 (10.7%) |
| 30 to 34 Years | 21 (4.3%) | 0 (0.0%) |
| 35 to 39 Years | 0 (0.0%) | 23 (10.7%) |
| 40 to 44 Years | 24 (5.0%) | 0 (0.0%) |
| 45 to 49 Years | 75 (15.5%) | 13 (6.1%) |
| 50 to 54 Years | 12 (2.5%) | 27 (12.6%) |
| 55 to 59 Years | 11 (2.3%) | 0 (0.0%) |
| 60 to 64 Years | 79 (16.3%) | 19 (8.9%) |
| 65 to 69 Years | 45 (9.3%) | 48 (22.4%) |
| 70 to 74 Years | 0 (0.0%) | 10 (4.7%) |
| 75 to 79 Years | 0 (0.0%) | 0 (0.0%) |
| 80 to 84 Years | 0 (0.0%) | 0 (0.0%) |
| 85 Years and over | 0 (0.0%) | 0 (0.0%) |
| Total | 485 (100.0%) | 214 (100.0%) |
Families and Households in White Haven
Median Family Size in White Haven
The median family size in White Haven is 3.31 persons per family, with married-couple families (95 | 64.6%) accounting for the largest median family size of 3.58 persons per family. On the other hand, single female/mother families (23 | 15.7%) represent the smallest median family size with 2.35 persons per family.
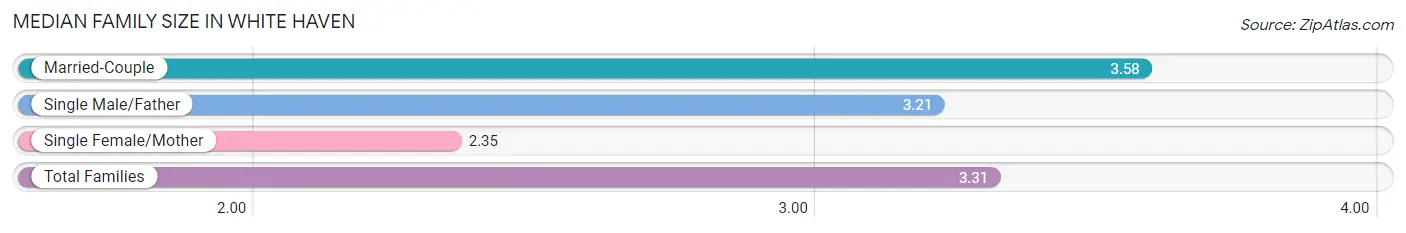
| Family Type | # Families | Family Size |
| Married-Couple | 95 (64.6%) | 3.58 |
| Single Male/Father | 29 (19.7%) | 3.21 |
| Single Female/Mother | 23 (15.7%) | 2.35 |
| Total Families | 147 (100.0%) | 3.31 |
Median Household Size in White Haven
The median household size in White Haven is 2.56 persons per household, with single female/mother households (23 | 8.4%) accounting for the largest median household size of 3.61 persons per household. non-family households (126 | 46.2%) represent the smallest median household size with 1.40 persons per household.
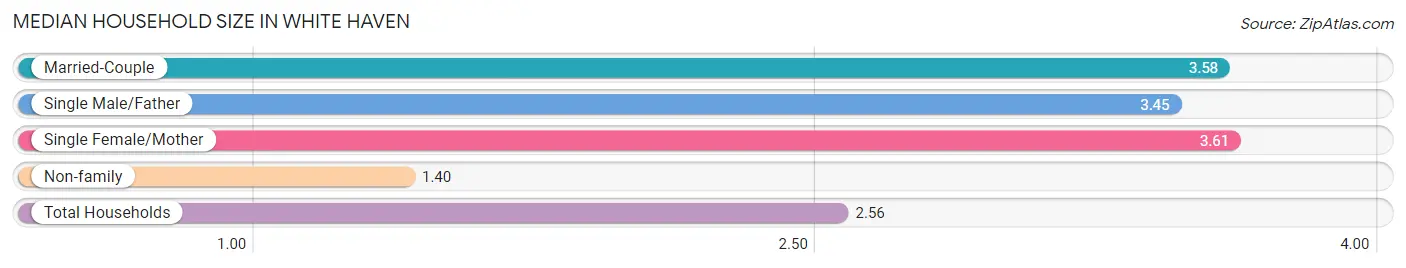
| Household Type | # Households | Household Size |
| Married-Couple | 95 (34.8%) | 3.58 |
| Single Male/Father | 29 (10.6%) | 3.45 |
| Single Female/Mother | 23 (8.4%) | 3.61 |
| Non-family | 126 (46.2%) | 1.40 |
| Total Households | 273 (100.0%) | 2.56 |
Household Size by Marriage Status in White Haven
Out of a total of 273 households in White Haven, 147 (53.8%) are family households, while 126 (46.2%) are nonfamily households. The most numerous type of family households are 3-person households, comprising 94, and the most common type of nonfamily households are 1-person households, comprising 125.
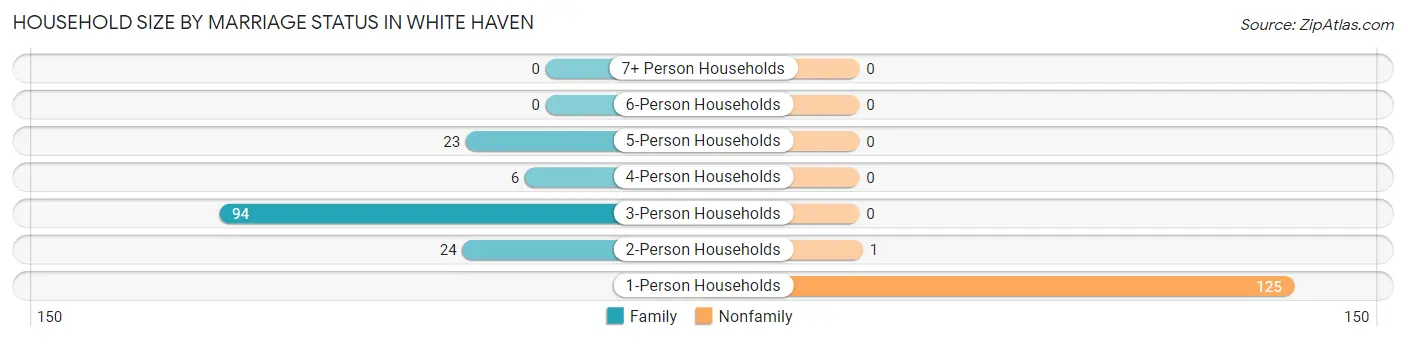
| Household Size | Family Households | Nonfamily Households |
| 1-Person Households | - | 125 (45.8%) |
| 2-Person Households | 24 (8.8%) | 1 (0.4%) |
| 3-Person Households | 94 (34.4%) | 0 (0.0%) |
| 4-Person Households | 6 (2.2%) | 0 (0.0%) |
| 5-Person Households | 23 (8.4%) | 0 (0.0%) |
| 6-Person Households | 0 (0.0%) | 0 (0.0%) |
| 7+ Person Households | 0 (0.0%) | 0 (0.0%) |
| Total | 147 (53.8%) | 126 (46.2%) |
Female Fertility in White Haven
Fertility by Age in White Haven
Average fertility rate in White Haven is 291.0 births per 1,000 women. Women in the age bracket of 20 to 34 years have the highest fertility rate with 535.0 births per 1,000 women. Women in the age bracket of 20 to 34 years acount for 100.0% of all women with births.
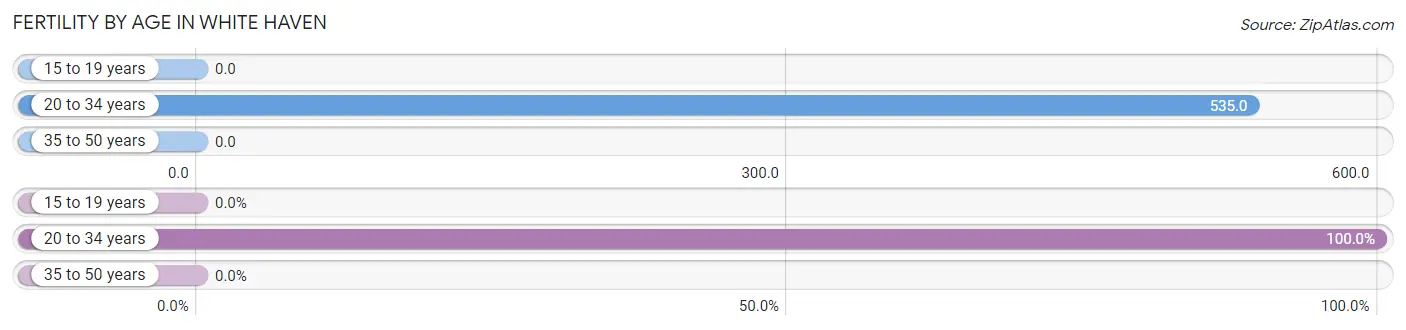
| Age Bracket | Women with Births | Births / 1,000 Women |
| 15 to 19 years | 0 (0.0%) | 0.0 |
| 20 to 34 years | 23 (100.0%) | 535.0 |
| 35 to 50 years | 0 (0.0%) | 0.0 |
| Total | 23 (100.0%) | 291.0 |
Fertility by Age by Marriage Status in White Haven
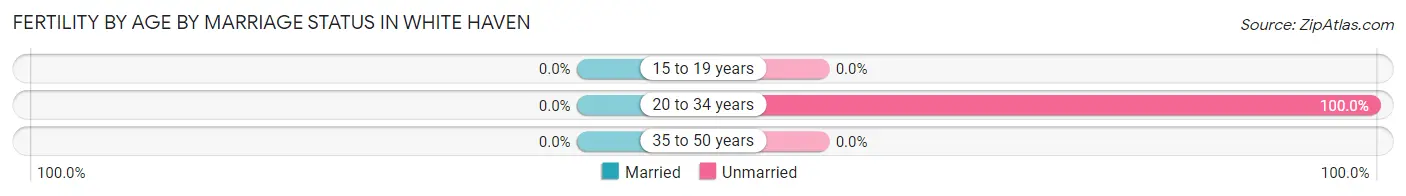
| Age Bracket | Married | Unmarried |
| 15 to 19 years | 0 (0.0%) | 0 (0.0%) |
| 20 to 34 years | 0 (0.0%) | 23 (100.0%) |
| 35 to 50 years | 0 (0.0%) | 0 (0.0%) |
| Total | 0 (0.0%) | 23 (100.0%) |
Fertility by Education in White Haven
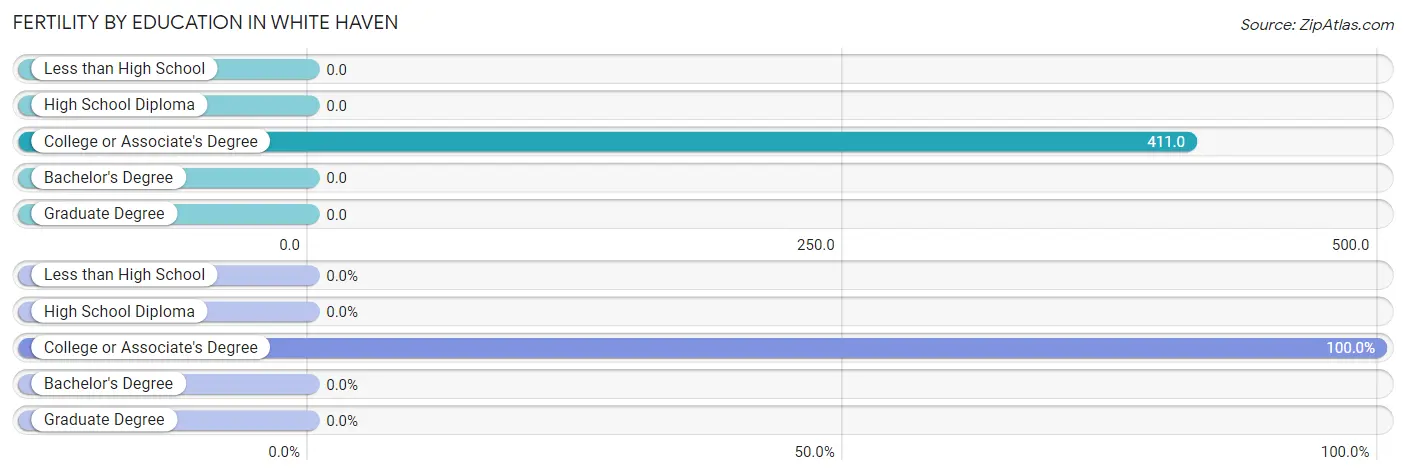
| Educational Attainment | Women with Births | Births / 1,000 Women |
| Less than High School | 0 (0.0%) | 0.0 |
| High School Diploma | 0 (0.0%) | 0.0 |
| College or Associate's Degree | 23 (100.0%) | 411.0 |
| Bachelor's Degree | 0 (0.0%) | 0.0 |
| Graduate Degree | 0 (0.0%) | 0.0 |
| Total | 23 (100.0%) | 291.0 |
Fertility by Education by Marriage Status in White Haven
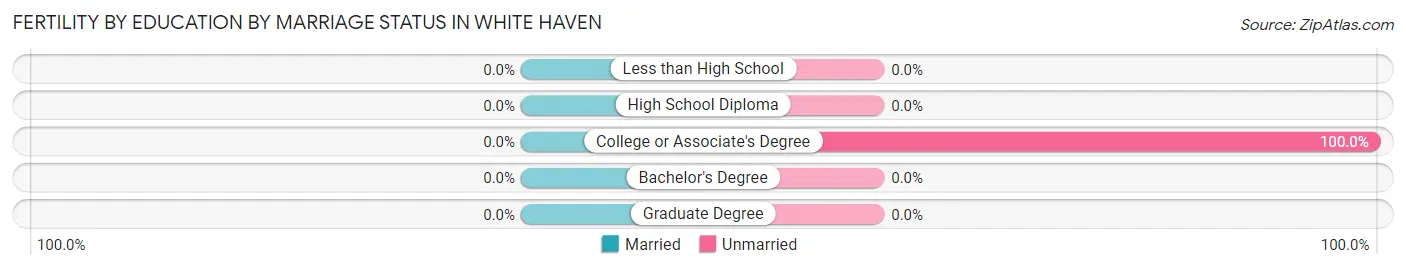
| Educational Attainment | Married | Unmarried |
| Less than High School | 0 (0.0%) | 0 (0.0%) |
| High School Diploma | 0 (0.0%) | 0 (0.0%) |
| College or Associate's Degree | 0 (0.0%) | 23 (100.0%) |
| Bachelor's Degree | 0 (0.0%) | 0 (0.0%) |
| Graduate Degree | 0 (0.0%) | 0 (0.0%) |
| Total | 0 (0.0%) | 23 (100.0%) |
Employment Characteristics in White Haven
Employment by Class of Employer in White Haven
Among the 290 employed individuals in White Haven, private company employees (198 | 68.3%), self-employed (incorporated) (35 | 12.1%), and state government employees (24 | 8.3%) make up the most common classes of employment.
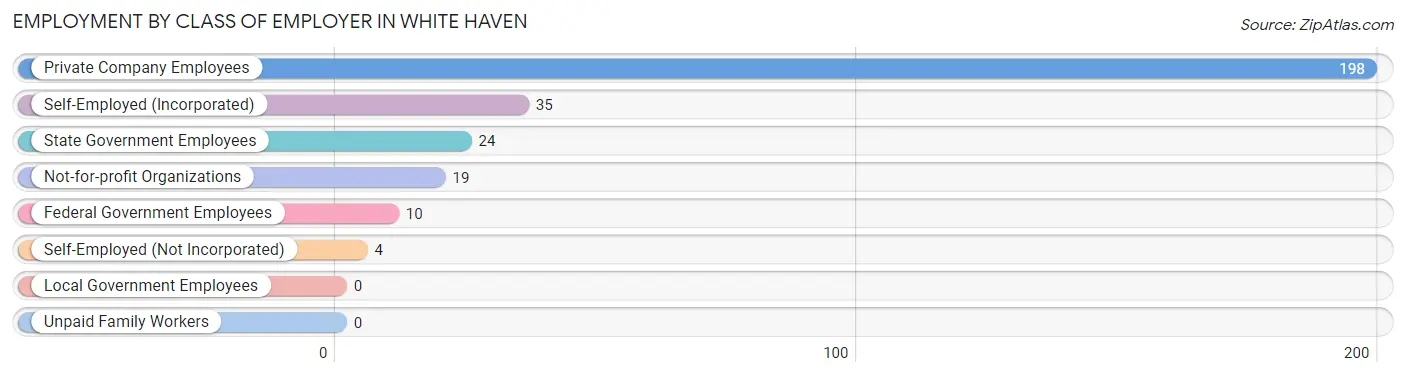
| Employer Class | # Employees | % Employees |
| Private Company Employees | 198 | 68.3% |
| Self-Employed (Incorporated) | 35 | 12.1% |
| Self-Employed (Not Incorporated) | 4 | 1.4% |
| Not-for-profit Organizations | 19 | 6.6% |
| Local Government Employees | 0 | 0.0% |
| State Government Employees | 24 | 8.3% |
| Federal Government Employees | 10 | 3.5% |
| Unpaid Family Workers | 0 | 0.0% |
| Total | 290 | 100.0% |
Employment Status by Age in White Haven
According to the labor force statistics for White Haven, out of the total population over 16 years of age (618), 54.0% or 334 individuals are in the labor force, with 13.2% or 44 of them unemployed. The age group with the highest labor force participation rate is 20 to 24 years, with 100.0% or 59 individuals in the labor force. Within the labor force, the 65 to 74 years age range has the highest percentage of unemployed individuals, with 100.0% or 8 of them being unemployed.
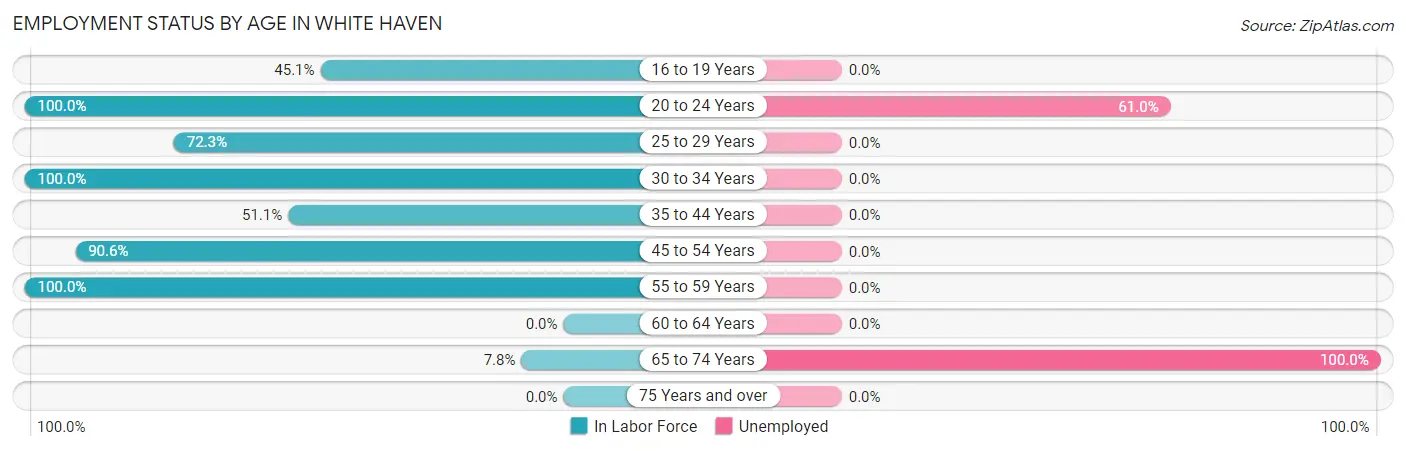
| Age Bracket | In Labor Force | Unemployed |
| 16 to 19 Years | 23 (45.1%) | 0 (0.0%) |
| 20 to 24 Years | 59 (100.0%) | 36 (61.0%) |
| 25 to 29 Years | 73 (72.3%) | 0 (0.0%) |
| 30 to 34 Years | 21 (100.0%) | 0 (0.0%) |
| 35 to 44 Years | 24 (51.1%) | 0 (0.0%) |
| 45 to 54 Years | 115 (90.6%) | 0 (0.0%) |
| 55 to 59 Years | 11 (100.0%) | 0 (0.0%) |
| 60 to 64 Years | 0 (0.0%) | 0 (0.0%) |
| 65 to 74 Years | 8 (7.8%) | 8 (100.0%) |
| 75 Years and over | 0 (0.0%) | 0 (0.0%) |
| Total | 334 (54.0%) | 44 (13.2%) |
Employment Status by Educational Attainment in White Haven
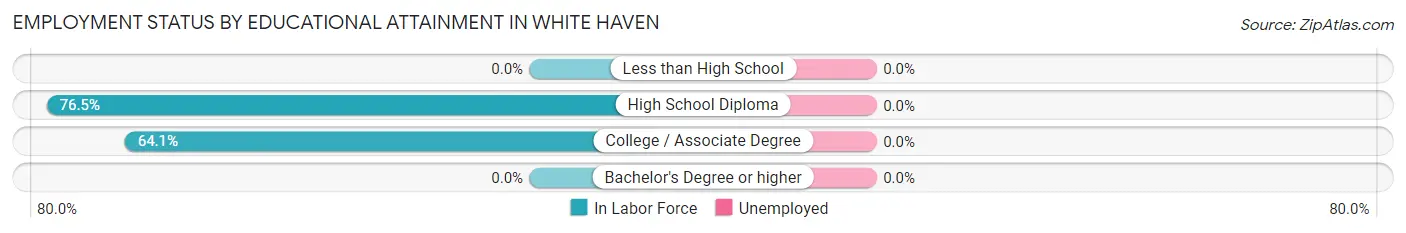
| Educational Attainment | In Labor Force | Unemployed |
| Less than High School | 0 (0.0%) | 0 (0.0%) |
| High School Diploma | 169 (76.5%) | 0 (0.0%) |
| College / Associate Degree | 75 (64.1%) | 0 (0.0%) |
| Bachelor's Degree or higher | 0 (0.0%) | 0 (0.0%) |
| Total | 244 (60.2%) | 0 (0.0%) |
Employment Occupations by Sex in White Haven
Management, Business, Science and Arts Occupations
The most common Management, Business, Science and Arts occupations in White Haven are Computers, Engineering & Science (34 | 11.7%), Computers & Mathematics (24 | 8.3%), Health Diagnosing & Treating (14 | 4.8%), Life, Physical & Social Science (10 | 3.5%), and Community & Social Service (6 | 2.1%).
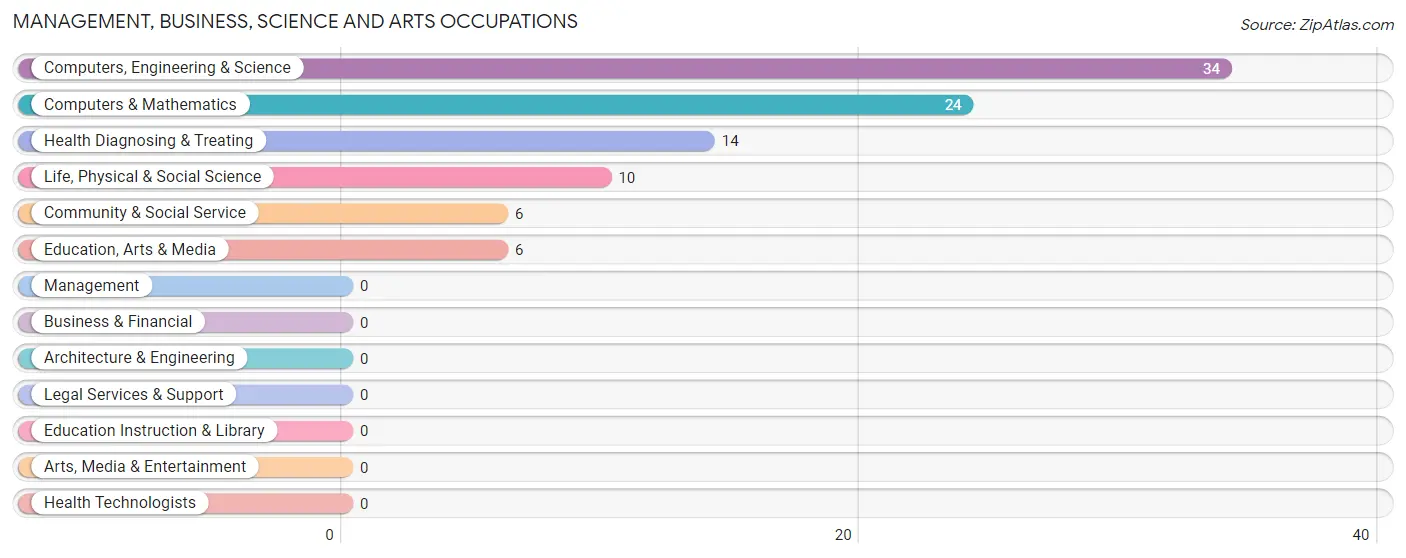
Management, Business, Science and Arts Occupations by Sex
Within the Management, Business, Science and Arts occupations in White Haven, the most male-oriented occupations are Computers & Mathematics (100.0%), and Computers, Engineering & Science (70.6%), while the most female-oriented occupations are Life, Physical & Social Science (100.0%), Community & Social Service (100.0%), and Education, Arts & Media (100.0%).
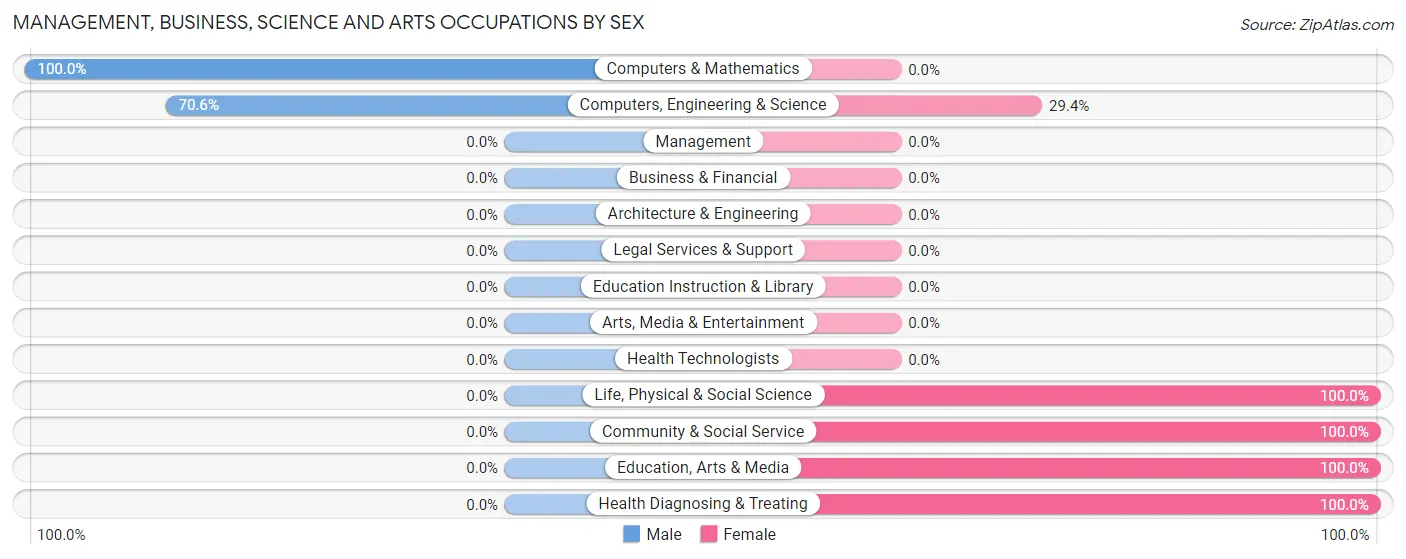
| Occupation | Male | Female |
| Management | 0 (0.0%) | 0 (0.0%) |
| Business & Financial | 0 (0.0%) | 0 (0.0%) |
| Computers, Engineering & Science | 24 (70.6%) | 10 (29.4%) |
| Computers & Mathematics | 24 (100.0%) | 0 (0.0%) |
| Architecture & Engineering | 0 (0.0%) | 0 (0.0%) |
| Life, Physical & Social Science | 0 (0.0%) | 10 (100.0%) |
| Community & Social Service | 0 (0.0%) | 6 (100.0%) |
| Education, Arts & Media | 0 (0.0%) | 6 (100.0%) |
| Legal Services & Support | 0 (0.0%) | 0 (0.0%) |
| Education Instruction & Library | 0 (0.0%) | 0 (0.0%) |
| Arts, Media & Entertainment | 0 (0.0%) | 0 (0.0%) |
| Health Diagnosing & Treating | 0 (0.0%) | 14 (100.0%) |
| Health Technologists | 0 (0.0%) | 0 (0.0%) |
| Total (Category) | 24 (44.4%) | 30 (55.6%) |
| Total (Overall) | 240 (82.8%) | 50 (17.2%) |
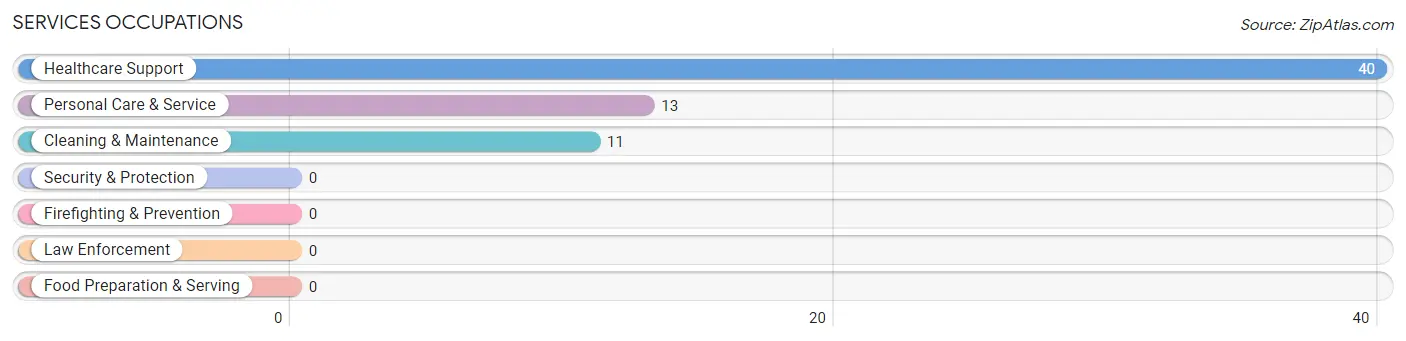
Services Occupations
The most common Services occupations in White Haven are Healthcare Support (40 | 13.8%), Personal Care & Service (13 | 4.5%), and Cleaning & Maintenance (11 | 3.8%).
Services Occupations by Sex
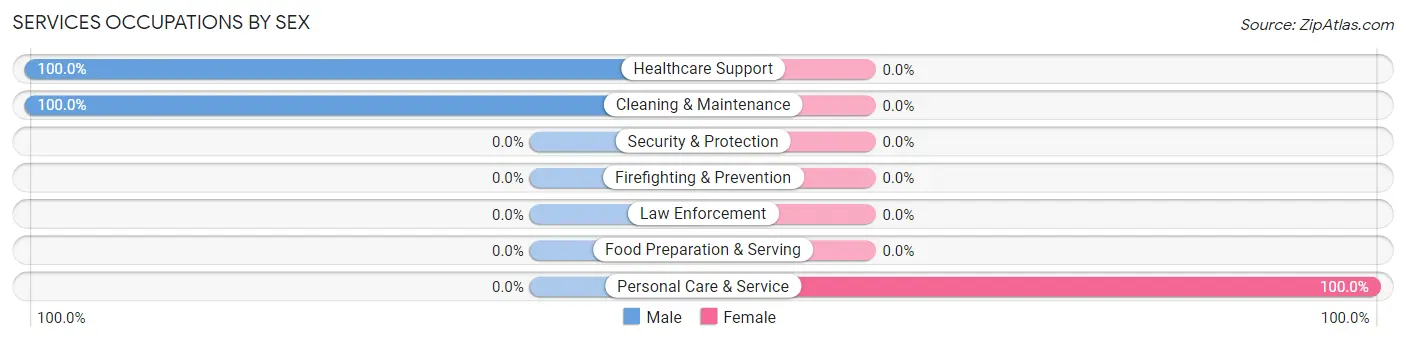
| Occupation | Male | Female |
| Healthcare Support | 40 (100.0%) | 0 (0.0%) |
| Security & Protection | 0 (0.0%) | 0 (0.0%) |
| Firefighting & Prevention | 0 (0.0%) | 0 (0.0%) |
| Law Enforcement | 0 (0.0%) | 0 (0.0%) |
| Food Preparation & Serving | 0 (0.0%) | 0 (0.0%) |
| Cleaning & Maintenance | 11 (100.0%) | 0 (0.0%) |
| Personal Care & Service | 0 (0.0%) | 13 (100.0%) |
| Total (Category) | 51 (79.7%) | 13 (20.3%) |
| Total (Overall) | 240 (82.8%) | 50 (17.2%) |
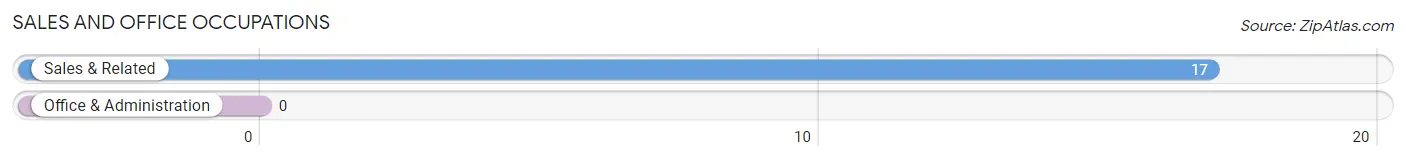
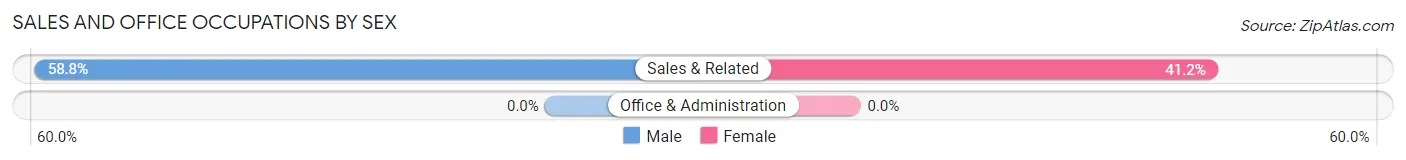
Sales and Office Occupations
The most common Sales and Office occupations in White Haven are , and Sales & Related (17 | 5.9%).
Sales and Office Occupations by Sex
| Occupation | Male | Female |
| Sales & Related | 10 (58.8%) | 7 (41.2%) |
| Office & Administration | 0 (0.0%) | 0 (0.0%) |
| Total (Category) | 10 (58.8%) | 7 (41.2%) |
| Total (Overall) | 240 (82.8%) | 50 (17.2%) |
Natural Resources, Construction and Maintenance Occupations
The most common Natural Resources, Construction and Maintenance occupations in White Haven are , and Construction & Extraction (30 | 10.3%).
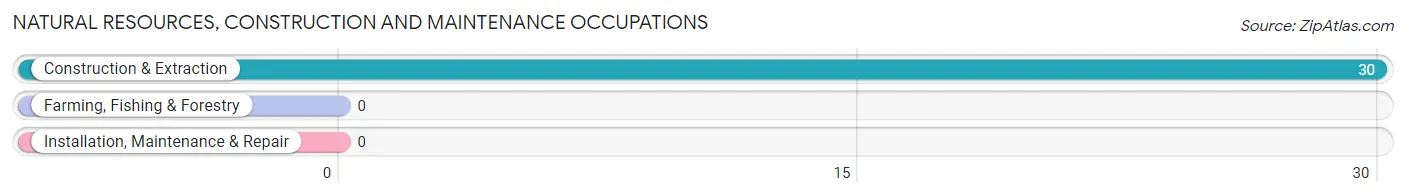
Natural Resources, Construction and Maintenance Occupations by Sex
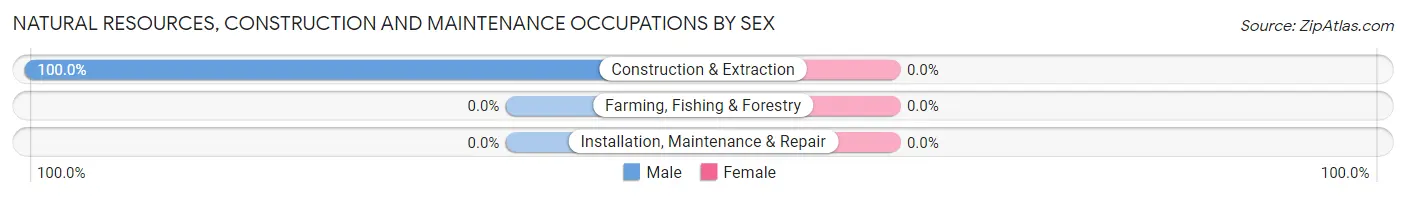
| Occupation | Male | Female |
| Farming, Fishing & Forestry | 0 (0.0%) | 0 (0.0%) |
| Construction & Extraction | 30 (100.0%) | 0 (0.0%) |
| Installation, Maintenance & Repair | 0 (0.0%) | 0 (0.0%) |
| Total (Category) | 30 (100.0%) | 0 (0.0%) |
| Total (Overall) | 240 (82.8%) | 50 (17.2%) |
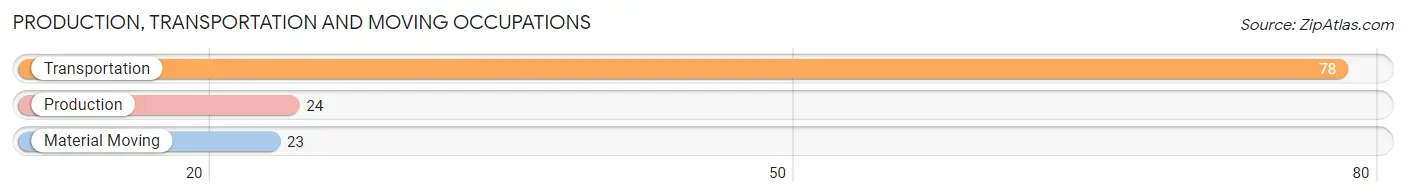
Production, Transportation and Moving Occupations
The most common Production, Transportation and Moving occupations in White Haven are Transportation (78 | 26.9%), Production (24 | 8.3%), and Material Moving (23 | 7.9%).
Production, Transportation and Moving Occupations by Sex
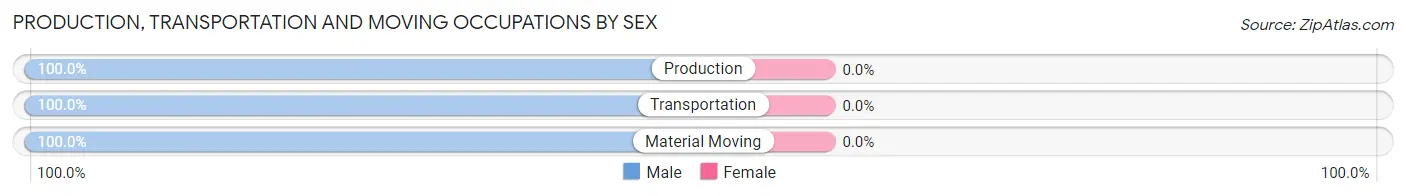
| Occupation | Male | Female |
| Production | 24 (100.0%) | 0 (0.0%) |
| Transportation | 78 (100.0%) | 0 (0.0%) |
| Material Moving | 23 (100.0%) | 0 (0.0%) |
| Total (Category) | 125 (100.0%) | 0 (0.0%) |
| Total (Overall) | 240 (82.8%) | 50 (17.2%) |
Employment Industries by Sex in White Haven
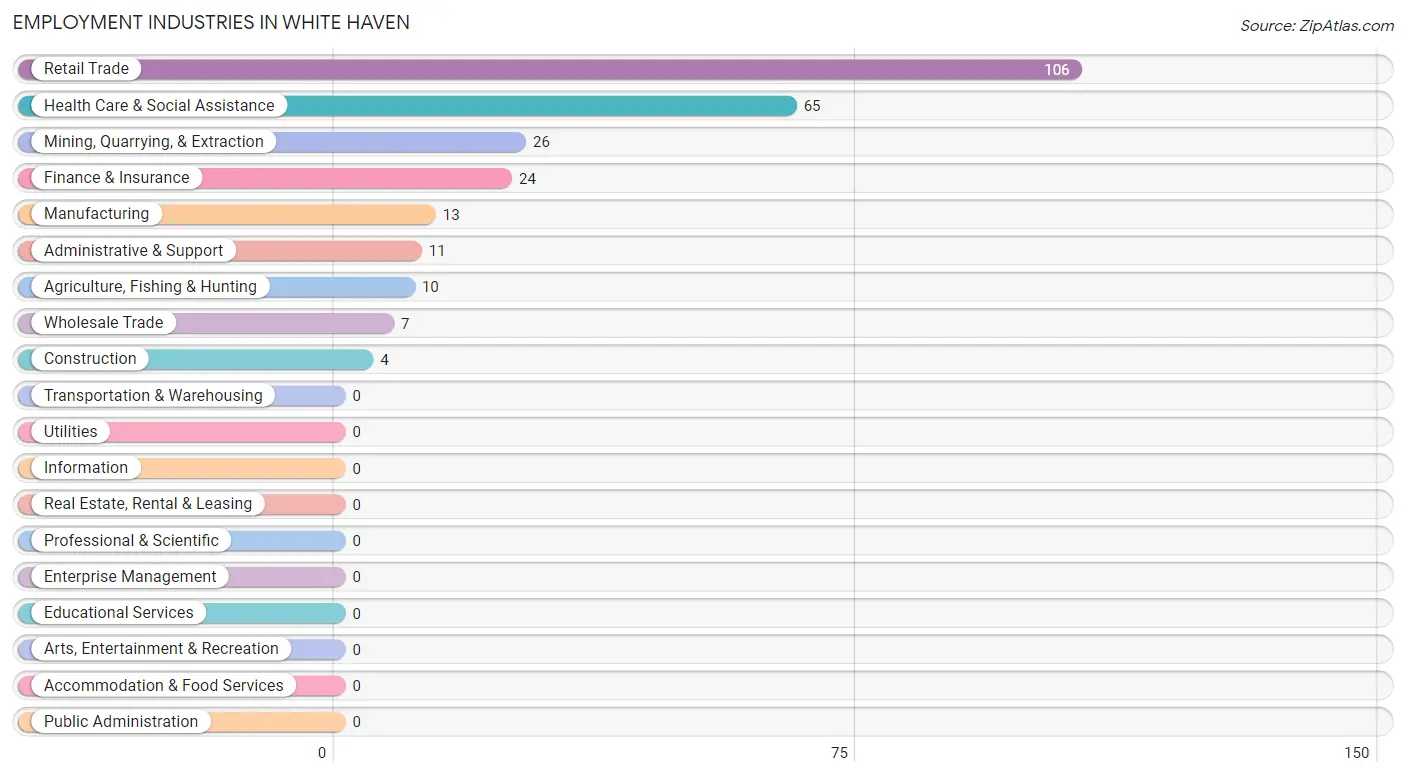
Employment Industries in White Haven
The major employment industries in White Haven include Retail Trade (106 | 36.5%), Health Care & Social Assistance (65 | 22.4%), Mining, Quarrying, & Extraction (26 | 9.0%), Finance & Insurance (24 | 8.3%), and Manufacturing (13 | 4.5%).
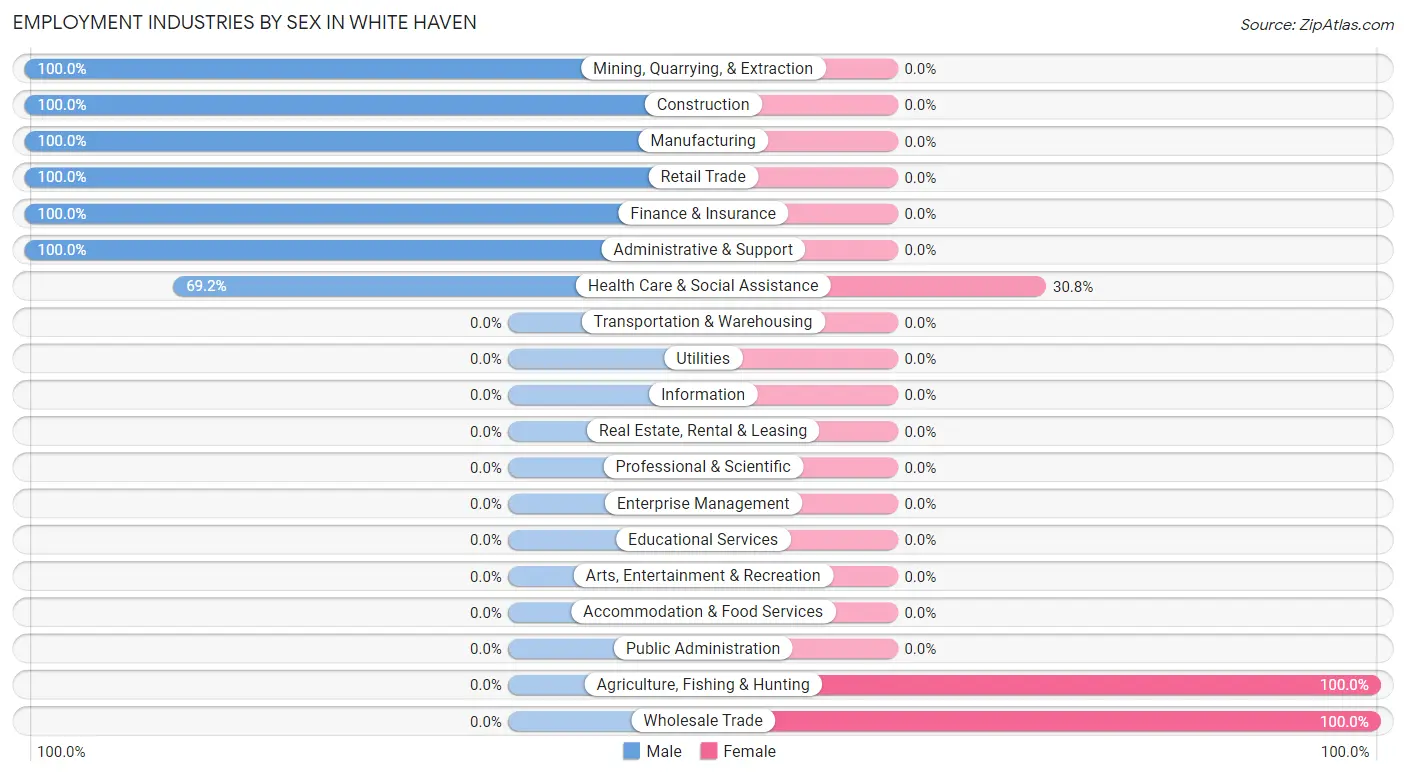
Employment Industries by Sex in White Haven
The White Haven industries that see more men than women are Mining, Quarrying, & Extraction (100.0%), Construction (100.0%), and Manufacturing (100.0%), whereas the industries that tend to have a higher number of women are Agriculture, Fishing & Hunting (100.0%), Wholesale Trade (100.0%), and Health Care & Social Assistance (30.8%).
| Industry | Male | Female |
| Agriculture, Fishing & Hunting | 0 (0.0%) | 10 (100.0%) |
| Mining, Quarrying, & Extraction | 26 (100.0%) | 0 (0.0%) |
| Construction | 4 (100.0%) | 0 (0.0%) |
| Manufacturing | 13 (100.0%) | 0 (0.0%) |
| Wholesale Trade | 0 (0.0%) | 7 (100.0%) |
| Retail Trade | 106 (100.0%) | 0 (0.0%) |
| Transportation & Warehousing | 0 (0.0%) | 0 (0.0%) |
| Utilities | 0 (0.0%) | 0 (0.0%) |
| Information | 0 (0.0%) | 0 (0.0%) |
| Finance & Insurance | 24 (100.0%) | 0 (0.0%) |
| Real Estate, Rental & Leasing | 0 (0.0%) | 0 (0.0%) |
| Professional & Scientific | 0 (0.0%) | 0 (0.0%) |
| Enterprise Management | 0 (0.0%) | 0 (0.0%) |
| Administrative & Support | 11 (100.0%) | 0 (0.0%) |
| Educational Services | 0 (0.0%) | 0 (0.0%) |
| Health Care & Social Assistance | 45 (69.2%) | 20 (30.8%) |
| Arts, Entertainment & Recreation | 0 (0.0%) | 0 (0.0%) |
| Accommodation & Food Services | 0 (0.0%) | 0 (0.0%) |
| Public Administration | 0 (0.0%) | 0 (0.0%) |
| Total | 240 (82.8%) | 50 (17.2%) |
Education in White Haven
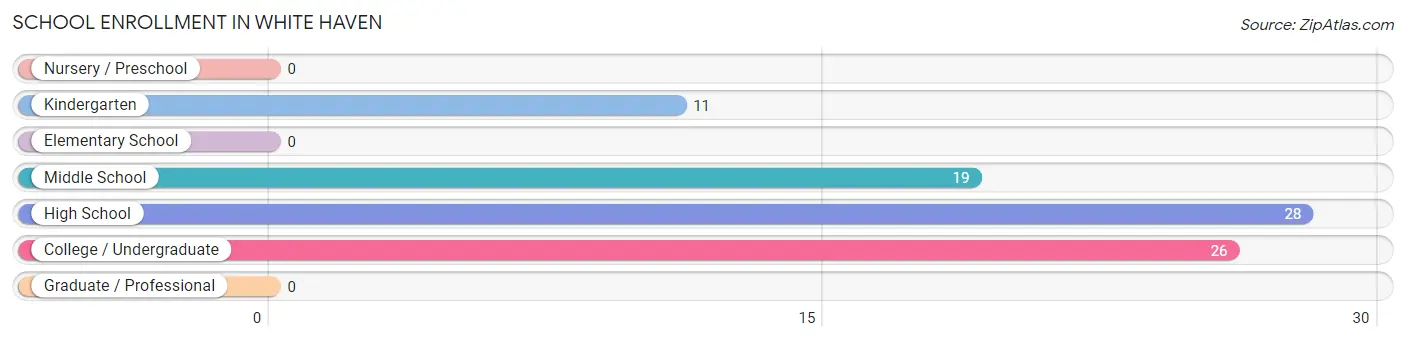
School Enrollment in White Haven
The most common levels of schooling among the 84 students in White Haven are high school (28 | 33.3%), college / undergraduate (26 | 30.9%), and middle school (19 | 22.6%).
| School Level | # Students | % Students |
| Nursery / Preschool | 0 | 0.0% |
| Kindergarten | 11 | 13.1% |
| Elementary School | 0 | 0.0% |
| Middle School | 19 | 22.6% |
| High School | 28 | 33.3% |
| College / Undergraduate | 26 | 30.9% |
| Graduate / Professional | 0 | 0.0% |
| Total | 84 | 100.0% |
School Enrollment by Age by Funding Source in White Haven
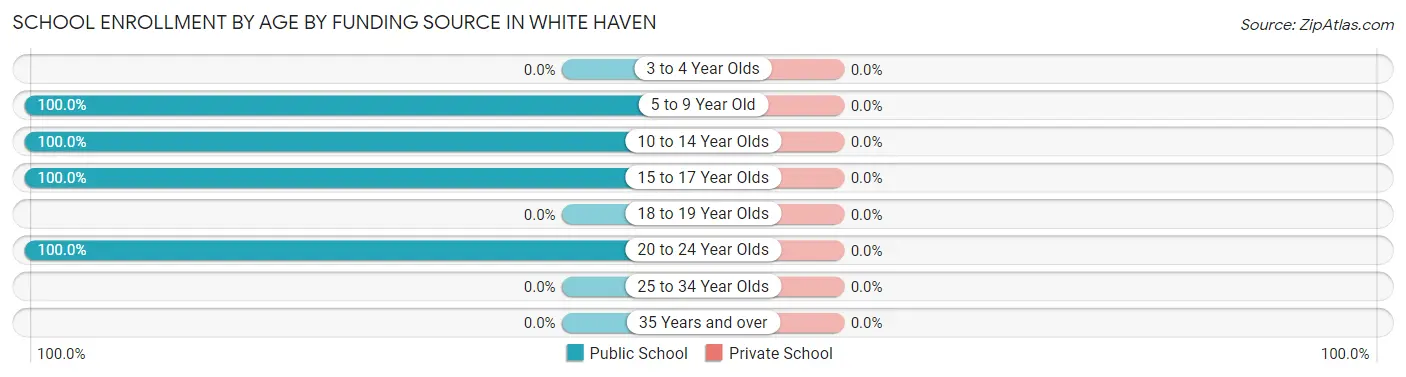
| Age Bracket | Public School | Private School |
| 3 to 4 Year Olds | 0 (0.0%) | 0 (0.0%) |
| 5 to 9 Year Old | 11 (100.0%) | 0 (0.0%) |
| 10 to 14 Year Olds | 19 (100.0%) | 0 (0.0%) |
| 15 to 17 Year Olds | 28 (100.0%) | 0 (0.0%) |
| 18 to 19 Year Olds | 0 (0.0%) | 0 (0.0%) |
| 20 to 24 Year Olds | 26 (100.0%) | 0 (0.0%) |
| 25 to 34 Year Olds | 0 (0.0%) | 0 (0.0%) |
| 35 Years and over | 0 (0.0%) | 0 (0.0%) |
| Total | 84 (100.0%) | 0 (0.0%) |
Educational Attainment by Field of Study in White Haven
, and education (8 | 100.0%) are the most common fields of study among 8 individuals in White Haven who have obtained a bachelor's degree or higher.
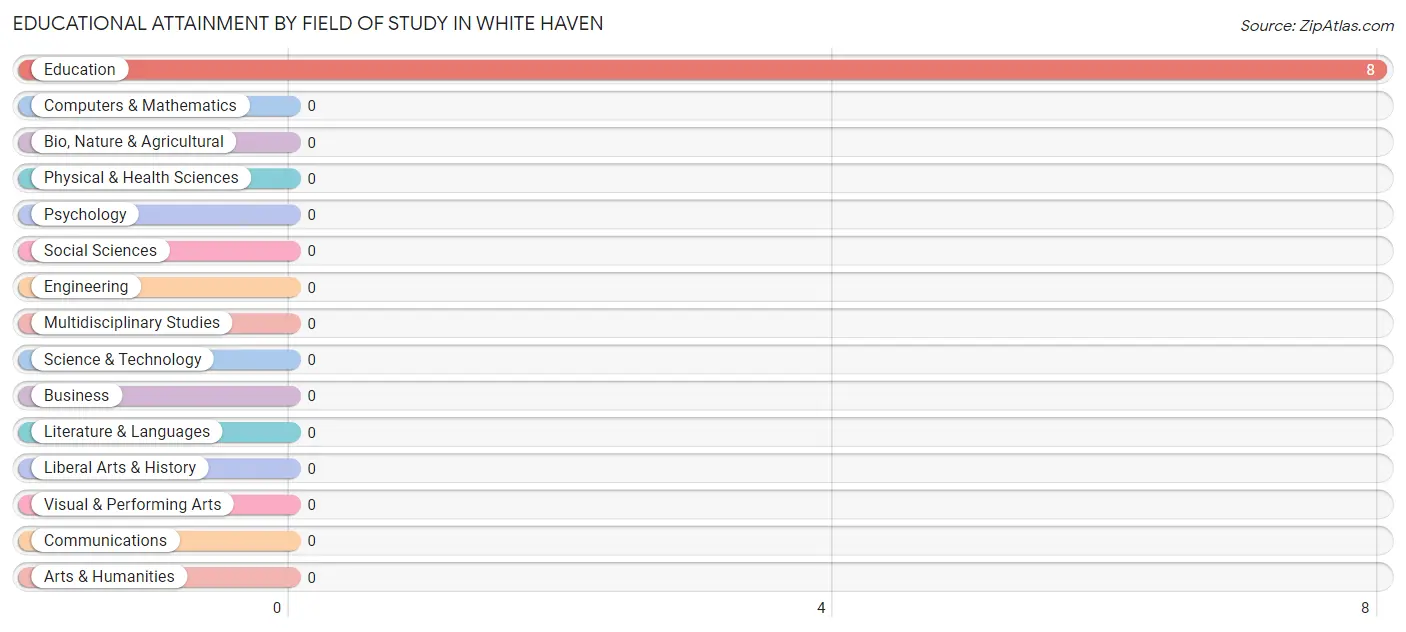
| Field of Study | # Graduates | % Graduates |
| Computers & Mathematics | 0 | 0.0% |
| Bio, Nature & Agricultural | 0 | 0.0% |
| Physical & Health Sciences | 0 | 0.0% |
| Psychology | 0 | 0.0% |
| Social Sciences | 0 | 0.0% |
| Engineering | 0 | 0.0% |
| Multidisciplinary Studies | 0 | 0.0% |
| Science & Technology | 0 | 0.0% |
| Business | 0 | 0.0% |
| Education | 8 | 100.0% |
| Literature & Languages | 0 | 0.0% |
| Liberal Arts & History | 0 | 0.0% |
| Visual & Performing Arts | 0 | 0.0% |
| Communications | 0 | 0.0% |
| Arts & Humanities | 0 | 0.0% |
| Total | 8 | 100.0% |
Transportation & Commute in White Haven
Vehicle Availability by Sex in White Haven
The most prevalent vehicle ownership categories in White Haven are males with 3 vehicles (134, accounting for 55.8%) and females with 3 vehicles (0, making up 268.0%).
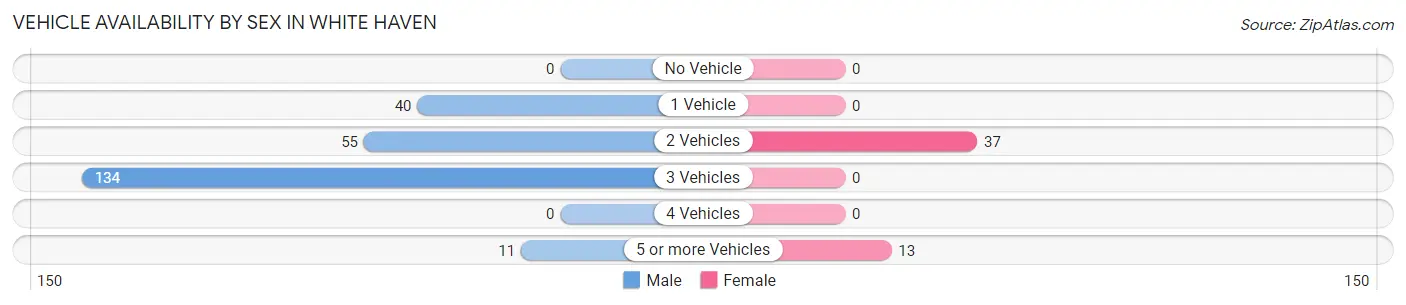
| Vehicles Available | Male | Female |
| No Vehicle | 0 (0.0%) | 0 (0.0%) |
| 1 Vehicle | 40 (16.7%) | 0 (0.0%) |
| 2 Vehicles | 55 (22.9%) | 37 (74.0%) |
| 3 Vehicles | 134 (55.8%) | 0 (0.0%) |
| 4 Vehicles | 0 (0.0%) | 0 (0.0%) |
| 5 or more Vehicles | 11 (4.6%) | 13 (26.0%) |
| Total | 240 (100.0%) | 50 (100.0%) |
Commute Time in White Haven
The most frequently occuring commute durations in White Haven are 5 to 9 minutes (141 commuters, 48.6%), 10 to 14 minutes (85 commuters, 29.3%), and 15 to 19 minutes (39 commuters, 13.5%).
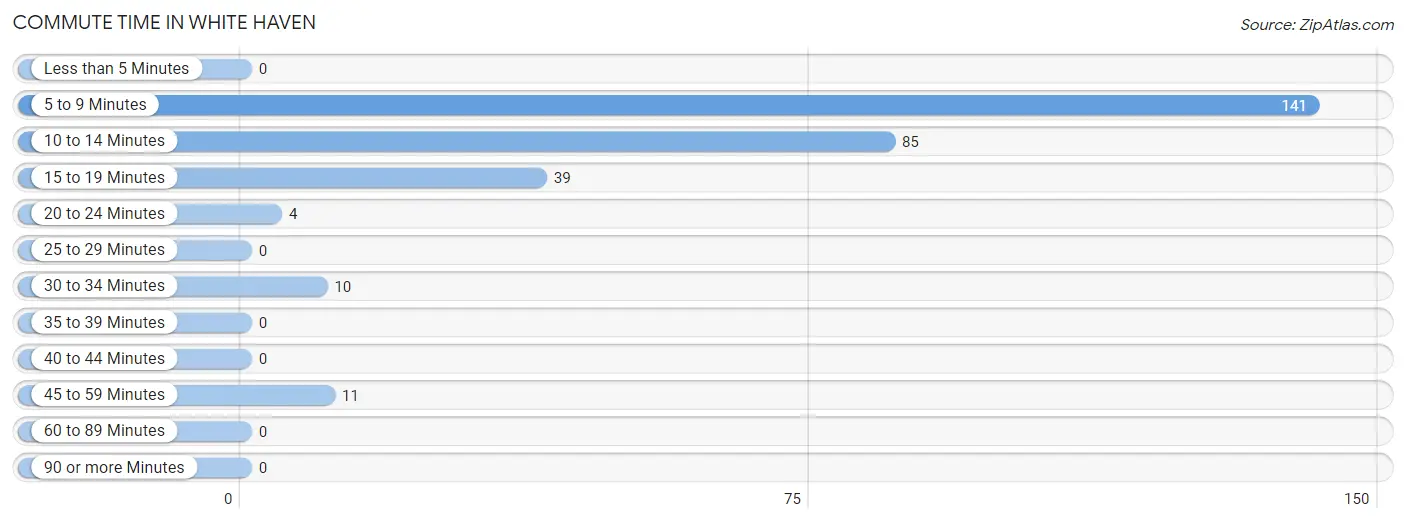
| Commute Time | # Commuters | % Commuters |
| Less than 5 Minutes | 0 | 0.0% |
| 5 to 9 Minutes | 141 | 48.6% |
| 10 to 14 Minutes | 85 | 29.3% |
| 15 to 19 Minutes | 39 | 13.5% |
| 20 to 24 Minutes | 4 | 1.4% |
| 25 to 29 Minutes | 0 | 0.0% |
| 30 to 34 Minutes | 10 | 3.5% |
| 35 to 39 Minutes | 0 | 0.0% |
| 40 to 44 Minutes | 0 | 0.0% |
| 45 to 59 Minutes | 11 | 3.8% |
| 60 to 89 Minutes | 0 | 0.0% |
| 90 or more Minutes | 0 | 0.0% |
Commute Time by Sex in White Haven
The most common commute times in White Haven are 5 to 9 minutes (141 commuters, 58.8%) for males and 10 to 14 minutes (34 commuters, 68.0%) for females.
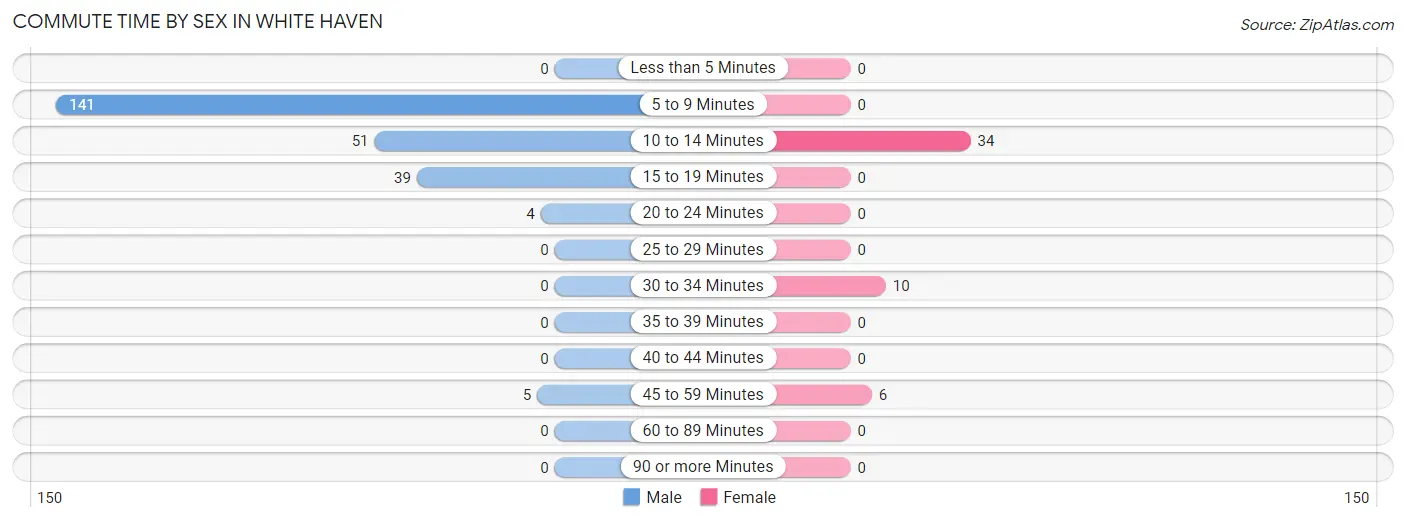
| Commute Time | Male | Female |
| Less than 5 Minutes | 0 (0.0%) | 0 (0.0%) |
| 5 to 9 Minutes | 141 (58.8%) | 0 (0.0%) |
| 10 to 14 Minutes | 51 (21.2%) | 34 (68.0%) |
| 15 to 19 Minutes | 39 (16.3%) | 0 (0.0%) |
| 20 to 24 Minutes | 4 (1.7%) | 0 (0.0%) |
| 25 to 29 Minutes | 0 (0.0%) | 0 (0.0%) |
| 30 to 34 Minutes | 0 (0.0%) | 10 (20.0%) |
| 35 to 39 Minutes | 0 (0.0%) | 0 (0.0%) |
| 40 to 44 Minutes | 0 (0.0%) | 0 (0.0%) |
| 45 to 59 Minutes | 5 (2.1%) | 6 (12.0%) |
| 60 to 89 Minutes | 0 (0.0%) | 0 (0.0%) |
| 90 or more Minutes | 0 (0.0%) | 0 (0.0%) |
Time of Departure to Work by Sex in White Haven
The most frequent times of departure to work in White Haven are 8:00 AM to 8:29 AM (73, 30.4%) for males and 6:00 AM to 6:29 AM (14, 28.0%) for females.
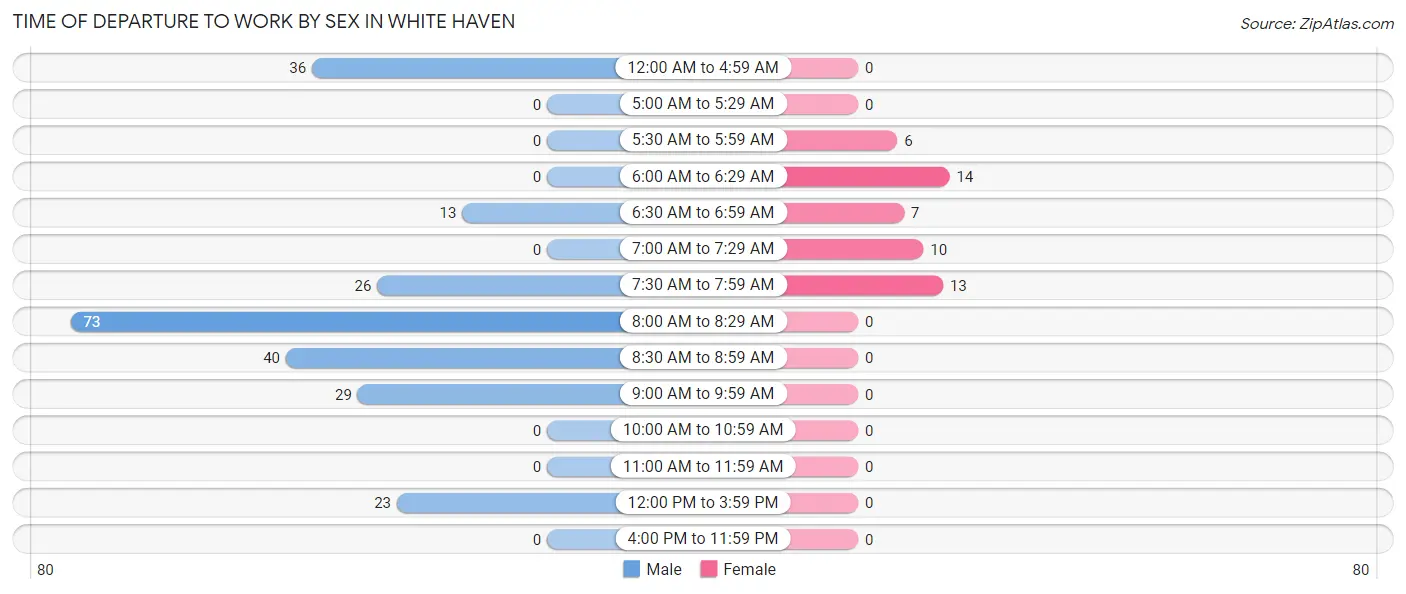
| Time of Departure | Male | Female |
| 12:00 AM to 4:59 AM | 36 (15.0%) | 0 (0.0%) |
| 5:00 AM to 5:29 AM | 0 (0.0%) | 0 (0.0%) |
| 5:30 AM to 5:59 AM | 0 (0.0%) | 6 (12.0%) |
| 6:00 AM to 6:29 AM | 0 (0.0%) | 14 (28.0%) |
| 6:30 AM to 6:59 AM | 13 (5.4%) | 7 (14.0%) |
| 7:00 AM to 7:29 AM | 0 (0.0%) | 10 (20.0%) |
| 7:30 AM to 7:59 AM | 26 (10.8%) | 13 (26.0%) |
| 8:00 AM to 8:29 AM | 73 (30.4%) | 0 (0.0%) |
| 8:30 AM to 8:59 AM | 40 (16.7%) | 0 (0.0%) |
| 9:00 AM to 9:59 AM | 29 (12.1%) | 0 (0.0%) |
| 10:00 AM to 10:59 AM | 0 (0.0%) | 0 (0.0%) |
| 11:00 AM to 11:59 AM | 0 (0.0%) | 0 (0.0%) |
| 12:00 PM to 3:59 PM | 23 (9.6%) | 0 (0.0%) |
| 4:00 PM to 11:59 PM | 0 (0.0%) | 0 (0.0%) |
| Total | 240 (100.0%) | 50 (100.0%) |
Housing Occupancy in White Haven
Occupancy by Ownership in White Haven
Of the total 273 dwellings in White Haven, owner-occupied units account for 220 (80.6%), while renter-occupied units make up 53 (19.4%).
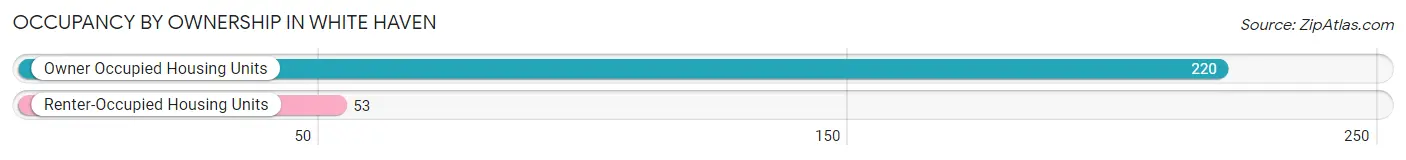
| Occupancy | # Housing Units | % Housing Units |
| Owner Occupied Housing Units | 220 | 80.6% |
| Renter-Occupied Housing Units | 53 | 19.4% |
| Total Occupied Housing Units | 273 | 100.0% |
Occupancy by Household Size in White Haven
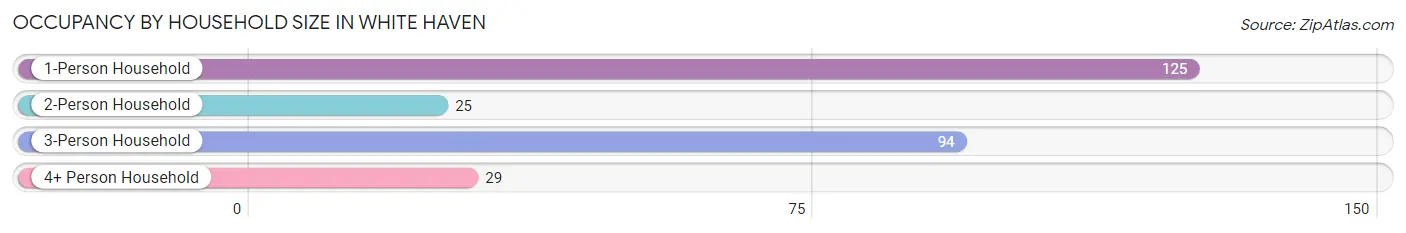
| Household Size | # Housing Units | % Housing Units |
| 1-Person Household | 125 | 45.8% |
| 2-Person Household | 25 | 9.2% |
| 3-Person Household | 94 | 34.4% |
| 4+ Person Household | 29 | 10.6% |
| Total Housing Units | 273 | 100.0% |
Occupancy by Ownership by Household Size in White Haven
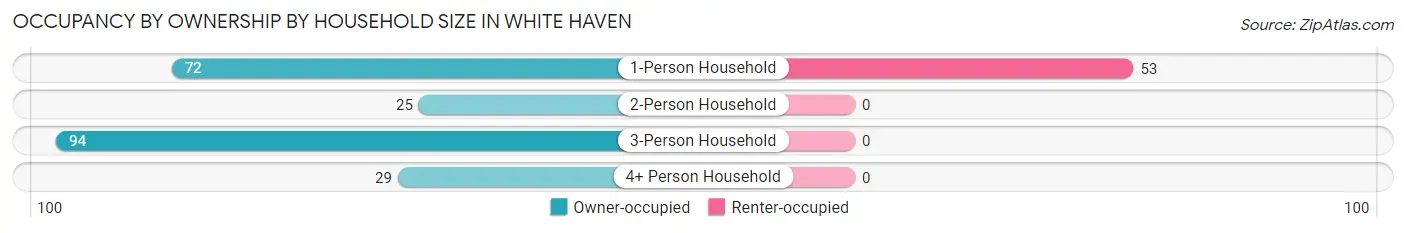
| Household Size | Owner-occupied | Renter-occupied |
| 1-Person Household | 72 (57.6%) | 53 (42.4%) |
| 2-Person Household | 25 (100.0%) | 0 (0.0%) |
| 3-Person Household | 94 (100.0%) | 0 (0.0%) |
| 4+ Person Household | 29 (100.0%) | 0 (0.0%) |
| Total Housing Units | 220 (80.6%) | 53 (19.4%) |
Occupancy by Educational Attainment in White Haven
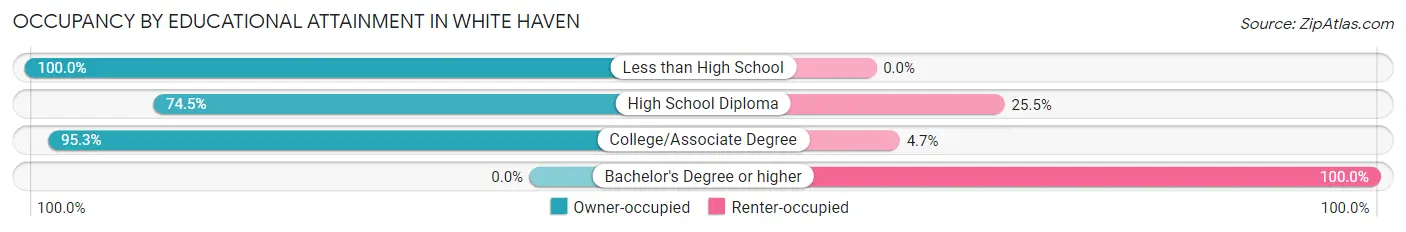
| Household Size | Owner-occupied | Renter-occupied |
| Less than High School | 1 (100.0%) | 0 (0.0%) |
| High School Diploma | 117 (74.5%) | 40 (25.5%) |
| College/Associate Degree | 102 (95.3%) | 5 (4.7%) |
| Bachelor's Degree or higher | 0 (0.0%) | 8 (100.0%) |
Occupancy by Age of Householder in White Haven
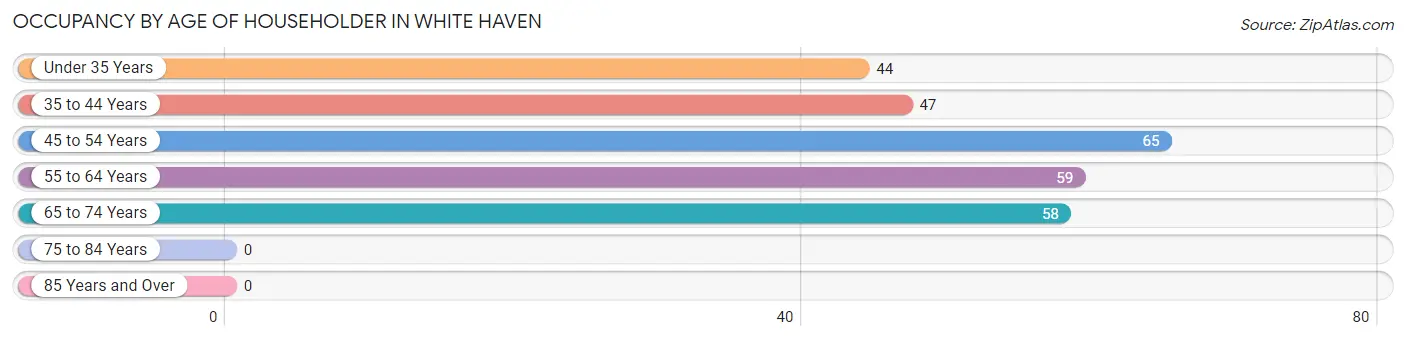
| Age Bracket | # Households | % Households |
| Under 35 Years | 44 | 16.1% |
| 35 to 44 Years | 47 | 17.2% |
| 45 to 54 Years | 65 | 23.8% |
| 55 to 64 Years | 59 | 21.6% |
| 65 to 74 Years | 58 | 21.2% |
| 75 to 84 Years | 0 | 0.0% |
| 85 Years and Over | 0 | 0.0% |
| Total | 273 | 100.0% |
Housing Finances in White Haven
Median Income by Occupancy in White Haven
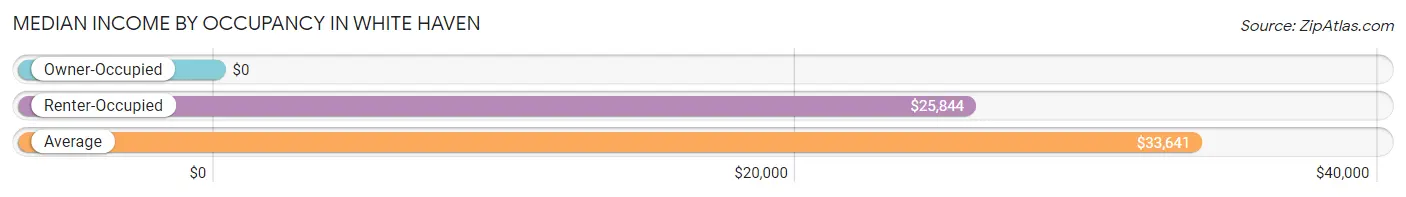
| Occupancy Type | # Households | Median Income |
| Owner-Occupied | 220 (80.6%) | $0 |
| Renter-Occupied | 53 (19.4%) | $25,844 |
| Average | 273 (100.0%) | $33,641 |
Occupancy by Householder Income Bracket in White Haven
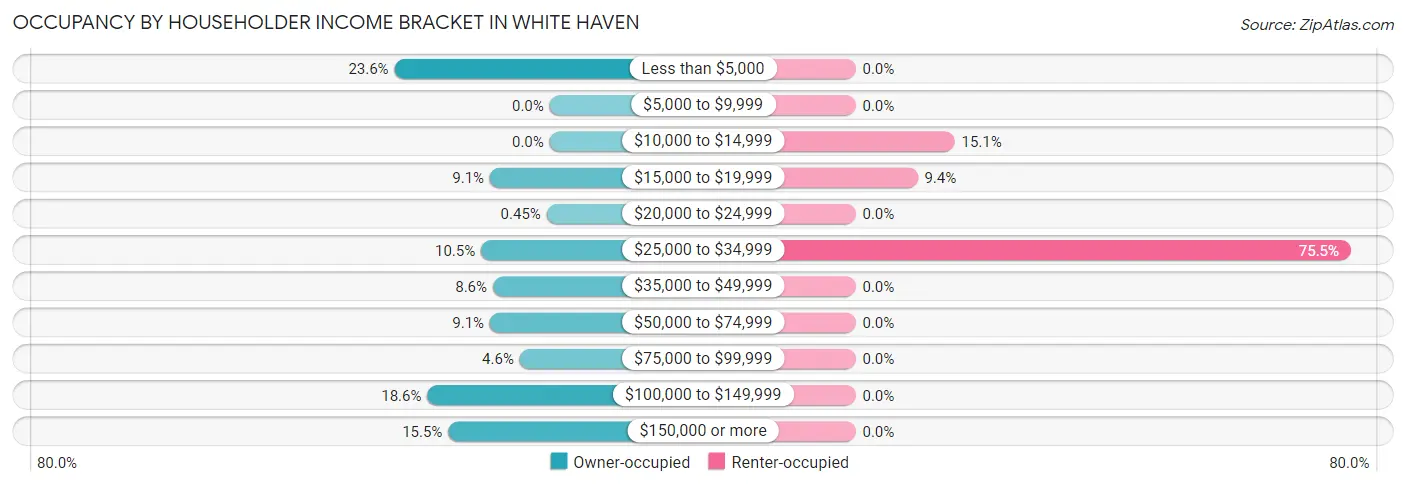
| Income Bracket | Owner-occupied | Renter-occupied |
| Less than $5,000 | 52 (23.6%) | 0 (0.0%) |
| $5,000 to $9,999 | 0 (0.0%) | 0 (0.0%) |
| $10,000 to $14,999 | 0 (0.0%) | 8 (15.1%) |
| $15,000 to $19,999 | 20 (9.1%) | 5 (9.4%) |
| $20,000 to $24,999 | 1 (0.4%) | 0 (0.0%) |
| $25,000 to $34,999 | 23 (10.4%) | 40 (75.5%) |
| $35,000 to $49,999 | 19 (8.6%) | 0 (0.0%) |
| $50,000 to $74,999 | 20 (9.1%) | 0 (0.0%) |
| $75,000 to $99,999 | 10 (4.5%) | 0 (0.0%) |
| $100,000 to $149,999 | 41 (18.6%) | 0 (0.0%) |
| $150,000 or more | 34 (15.4%) | 0 (0.0%) |
| Total | 220 (100.0%) | 53 (100.0%) |
Monthly Housing Cost Tiers in White Haven
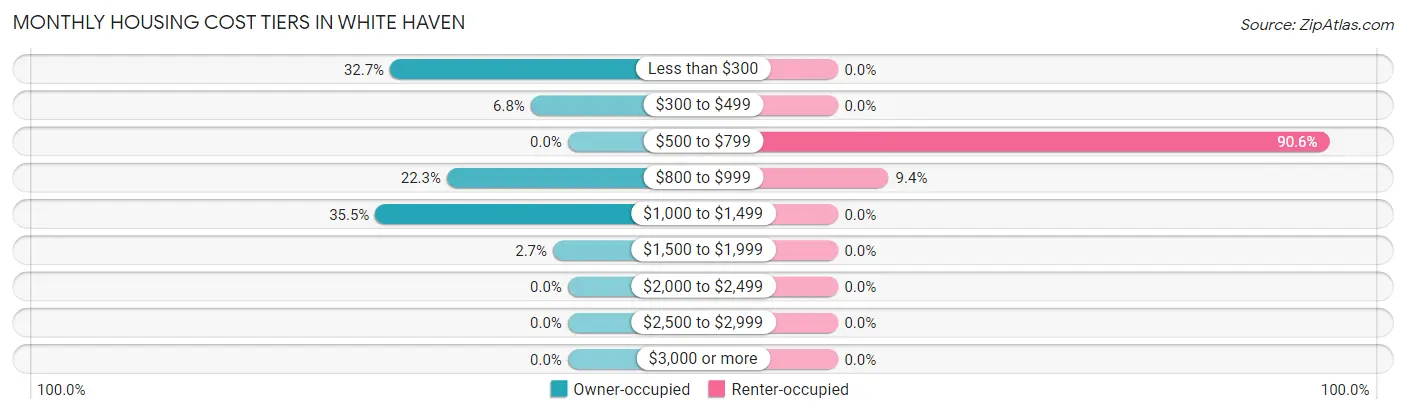
| Monthly Cost | Owner-occupied | Renter-occupied |
| Less than $300 | 72 (32.7%) | 0 (0.0%) |
| $300 to $499 | 15 (6.8%) | 0 (0.0%) |
| $500 to $799 | 0 (0.0%) | 48 (90.6%) |
| $800 to $999 | 49 (22.3%) | 5 (9.4%) |
| $1,000 to $1,499 | 78 (35.4%) | 0 (0.0%) |
| $1,500 to $1,999 | 6 (2.7%) | 0 (0.0%) |
| $2,000 to $2,499 | 0 (0.0%) | 0 (0.0%) |
| $2,500 to $2,999 | 0 (0.0%) | 0 (0.0%) |
| $3,000 or more | 0 (0.0%) | 0 (0.0%) |
| Total | 220 (100.0%) | 53 (100.0%) |
Physical Housing Characteristics in White Haven
Housing Structures in White Haven
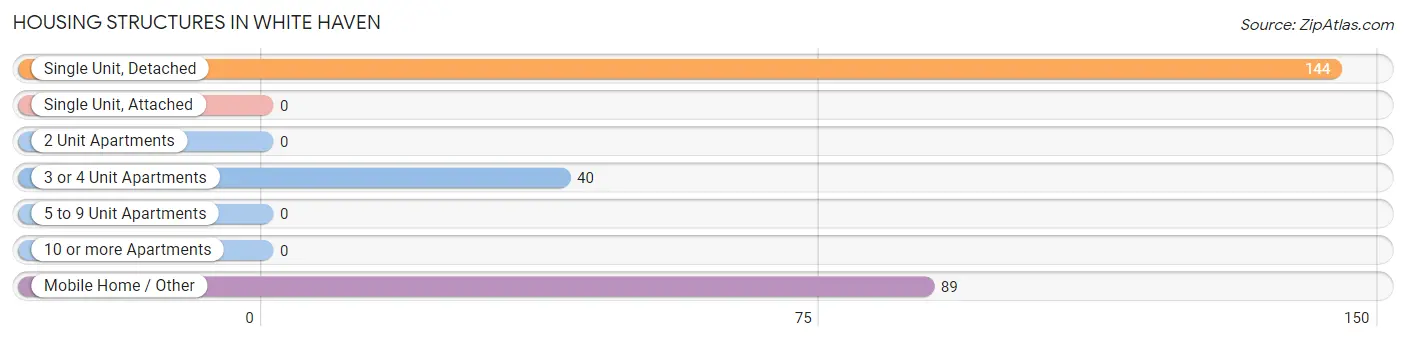
| Structure Type | # Housing Units | % Housing Units |
| Single Unit, Detached | 144 | 52.7% |
| Single Unit, Attached | 0 | 0.0% |
| 2 Unit Apartments | 0 | 0.0% |
| 3 or 4 Unit Apartments | 40 | 14.6% |
| 5 to 9 Unit Apartments | 0 | 0.0% |
| 10 or more Apartments | 0 | 0.0% |
| Mobile Home / Other | 89 | 32.6% |
| Total | 273 | 100.0% |
Housing Structures by Occupancy in White Haven
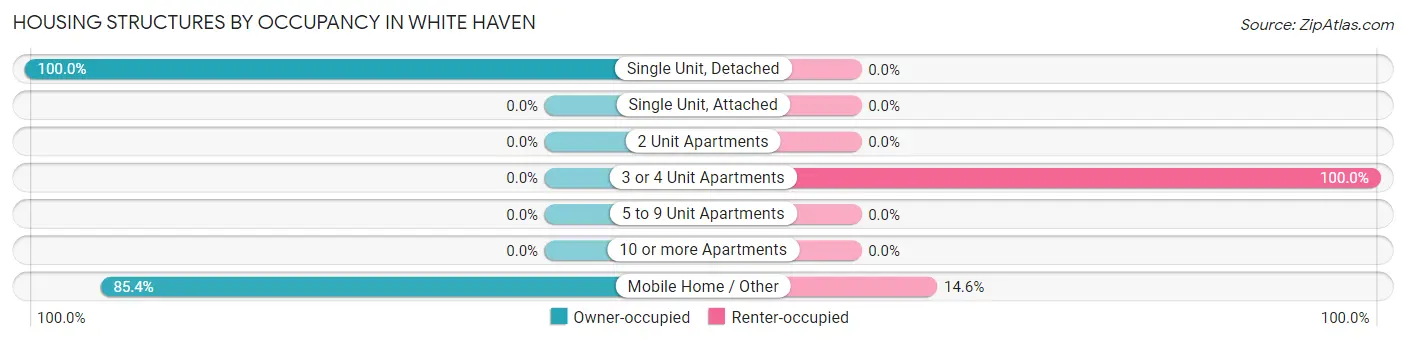
| Structure Type | Owner-occupied | Renter-occupied |
| Single Unit, Detached | 144 (100.0%) | 0 (0.0%) |
| Single Unit, Attached | 0 (0.0%) | 0 (0.0%) |
| 2 Unit Apartments | 0 (0.0%) | 0 (0.0%) |
| 3 or 4 Unit Apartments | 0 (0.0%) | 40 (100.0%) |
| 5 to 9 Unit Apartments | 0 (0.0%) | 0 (0.0%) |
| 10 or more Apartments | 0 (0.0%) | 0 (0.0%) |
| Mobile Home / Other | 76 (85.4%) | 13 (14.6%) |
| Total | 220 (80.6%) | 53 (19.4%) |
Housing Structures by Number of Rooms in White Haven
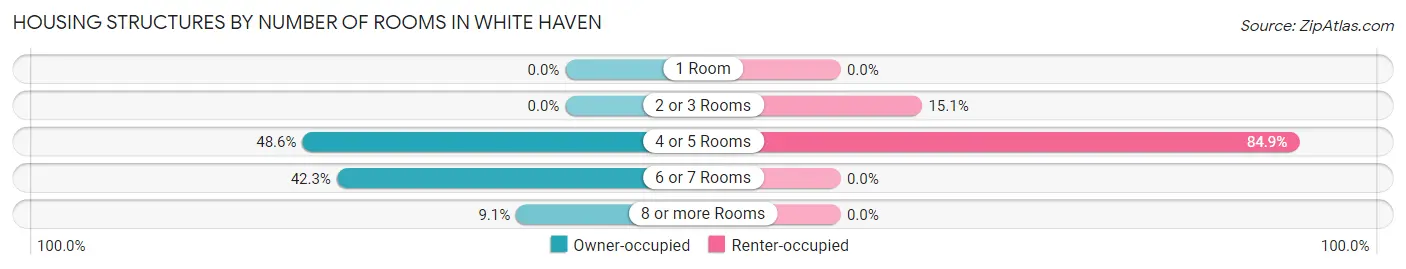
| Number of Rooms | Owner-occupied | Renter-occupied |
| 1 Room | 0 (0.0%) | 0 (0.0%) |
| 2 or 3 Rooms | 0 (0.0%) | 8 (15.1%) |
| 4 or 5 Rooms | 107 (48.6%) | 45 (84.9%) |
| 6 or 7 Rooms | 93 (42.3%) | 0 (0.0%) |
| 8 or more Rooms | 20 (9.1%) | 0 (0.0%) |
| Total | 220 (100.0%) | 53 (100.0%) |
Housing Structure by Heating Type in White Haven
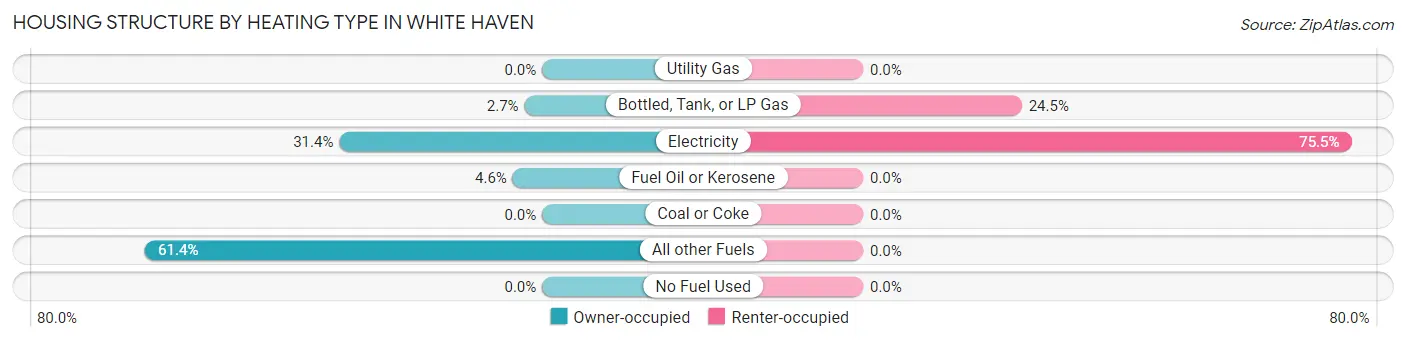
| Heating Type | Owner-occupied | Renter-occupied |
| Utility Gas | 0 (0.0%) | 0 (0.0%) |
| Bottled, Tank, or LP Gas | 6 (2.7%) | 13 (24.5%) |
| Electricity | 69 (31.4%) | 40 (75.5%) |
| Fuel Oil or Kerosene | 10 (4.5%) | 0 (0.0%) |
| Coal or Coke | 0 (0.0%) | 0 (0.0%) |
| All other Fuels | 135 (61.4%) | 0 (0.0%) |
| No Fuel Used | 0 (0.0%) | 0 (0.0%) |
| Total | 220 (100.0%) | 53 (100.0%) |
Household Vehicle Usage in White Haven
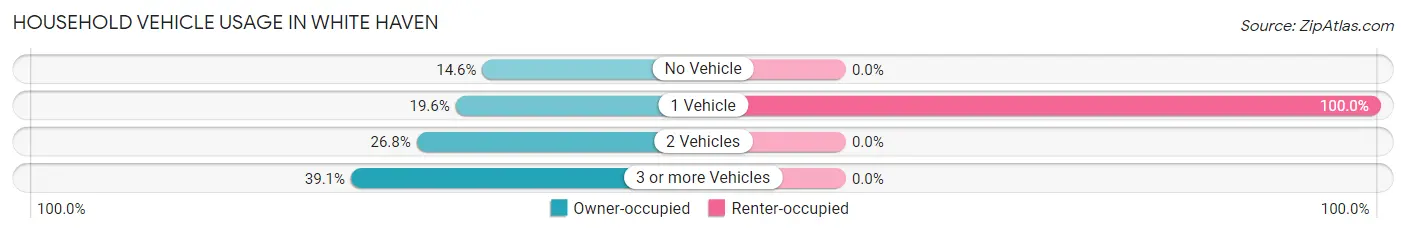
| Vehicles per Household | Owner-occupied | Renter-occupied |
| No Vehicle | 32 (14.5%) | 0 (0.0%) |
| 1 Vehicle | 43 (19.6%) | 53 (100.0%) |
| 2 Vehicles | 59 (26.8%) | 0 (0.0%) |
| 3 or more Vehicles | 86 (39.1%) | 0 (0.0%) |
| Total | 220 (100.0%) | 53 (100.0%) |
Real Estate & Mortgages in White Haven
Real Estate and Mortgage Overview in White Haven
| Characteristic | Without Mortgage | With Mortgage |
| Housing Units | 73 | 147 |
| Median Property Value | - | - |
| Median Household Income | $2,499 | $34 |
| Monthly Housing Costs | $123 | $0 |
| Real Estate Taxes | $236 | $0 |
Property Value by Mortgage Status in White Haven
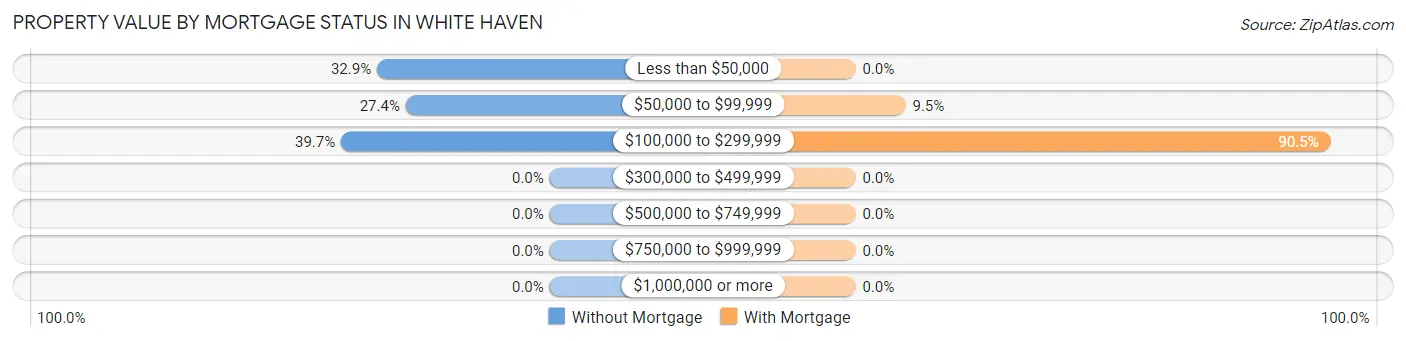
| Property Value | Without Mortgage | With Mortgage |
| Less than $50,000 | 24 (32.9%) | 0 (0.0%) |
| $50,000 to $99,999 | 20 (27.4%) | 14 (9.5%) |
| $100,000 to $299,999 | 29 (39.7%) | 133 (90.5%) |
| $300,000 to $499,999 | 0 (0.0%) | 0 (0.0%) |
| $500,000 to $749,999 | 0 (0.0%) | 0 (0.0%) |
| $750,000 to $999,999 | 0 (0.0%) | 0 (0.0%) |
| $1,000,000 or more | 0 (0.0%) | 0 (0.0%) |
| Total | 73 (100.0%) | 147 (100.0%) |
Household Income by Mortgage Status in White Haven
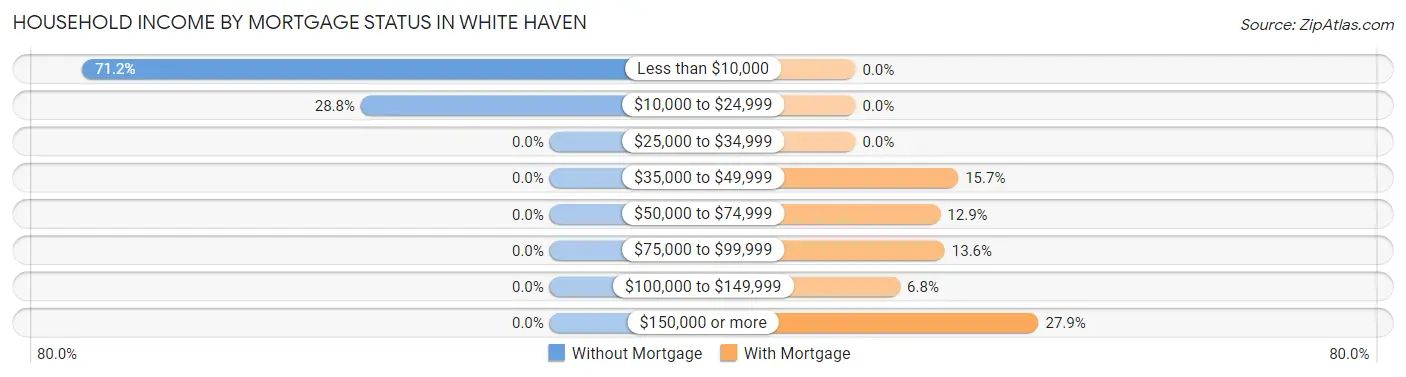
| Household Income | Without Mortgage | With Mortgage |
| Less than $10,000 | 52 (71.2%) | 0 (0.0%) |
| $10,000 to $24,999 | 21 (28.8%) | 0 (0.0%) |
| $25,000 to $34,999 | 0 (0.0%) | 0 (0.0%) |
| $35,000 to $49,999 | 0 (0.0%) | 23 (15.7%) |
| $50,000 to $74,999 | 0 (0.0%) | 19 (12.9%) |
| $75,000 to $99,999 | 0 (0.0%) | 20 (13.6%) |
| $100,000 to $149,999 | 0 (0.0%) | 10 (6.8%) |
| $150,000 or more | 0 (0.0%) | 41 (27.9%) |
| Total | 73 (100.0%) | 147 (100.0%) |
Property Value to Household Income Ratio in White Haven
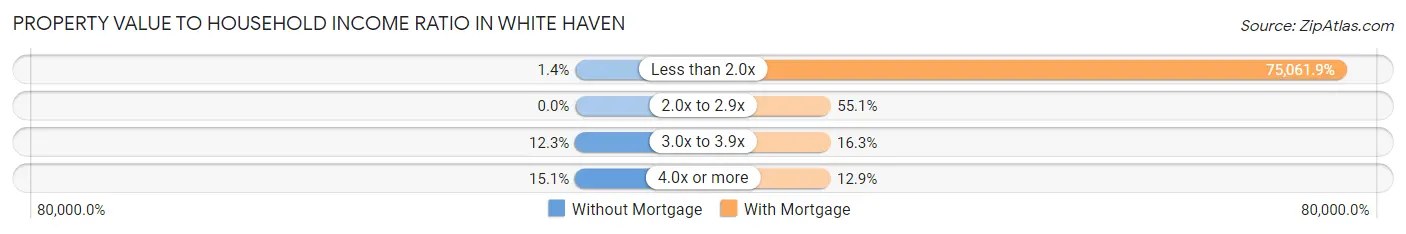
| Value-to-Income Ratio | Without Mortgage | With Mortgage |
| Less than 2.0x | 1 (1.4%) | 110,341 (75,061.9%) |
| 2.0x to 2.9x | 0 (0.0%) | 81 (55.1%) |
| 3.0x to 3.9x | 9 (12.3%) | 24 (16.3%) |
| 4.0x or more | 11 (15.1%) | 19 (12.9%) |
| Total | 73 (100.0%) | 147 (100.0%) |
Real Estate Taxes by Mortgage Status in White Haven
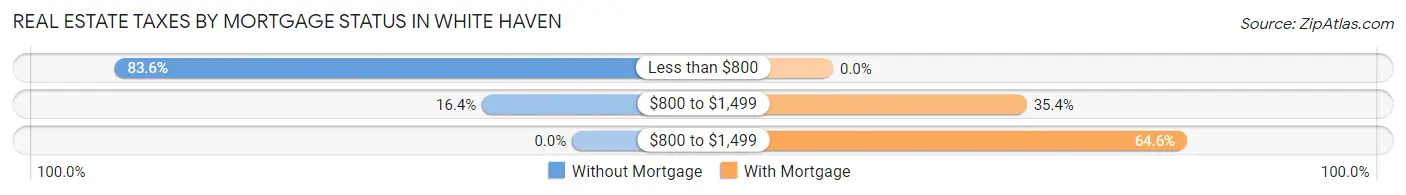
| Property Taxes | Without Mortgage | With Mortgage |
| Less than $800 | 61 (83.6%) | 0 (0.0%) |
| $800 to $1,499 | 12 (16.4%) | 52 (35.4%) |
| $800 to $1,499 | 0 (0.0%) | 95 (64.6%) |
| Total | 73 (100.0%) | 147 (100.0%) |
Health & Disability in White Haven
Health Insurance Coverage by Age in White Haven
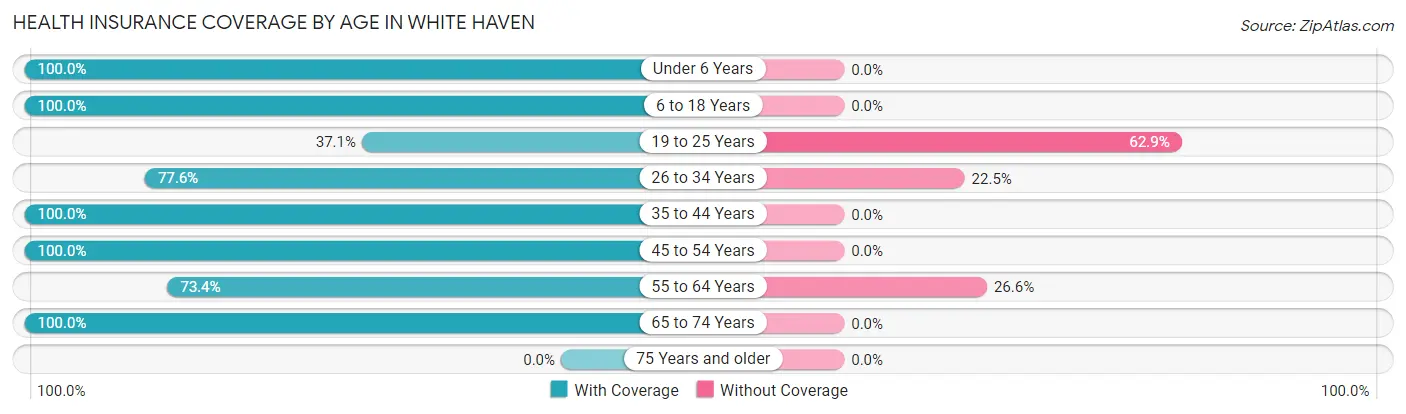
| Age Bracket | With Coverage | Without Coverage |
| Under 6 Years | 51 (100.0%) | 0 (0.0%) |
| 6 to 18 Years | 81 (100.0%) | 0 (0.0%) |
| 19 to 25 Years | 49 (37.1%) | 83 (62.9%) |
| 26 to 34 Years | 38 (77.5%) | 11 (22.5%) |
| 35 to 44 Years | 47 (100.0%) | 0 (0.0%) |
| 45 to 54 Years | 127 (100.0%) | 0 (0.0%) |
| 55 to 64 Years | 80 (73.4%) | 29 (26.6%) |
| 65 to 74 Years | 103 (100.0%) | 0 (0.0%) |
| 75 Years and older | 0 (0.0%) | 0 (0.0%) |
| Total | 576 (82.4%) | 123 (17.6%) |
Health Insurance Coverage by Citizenship Status in White Haven
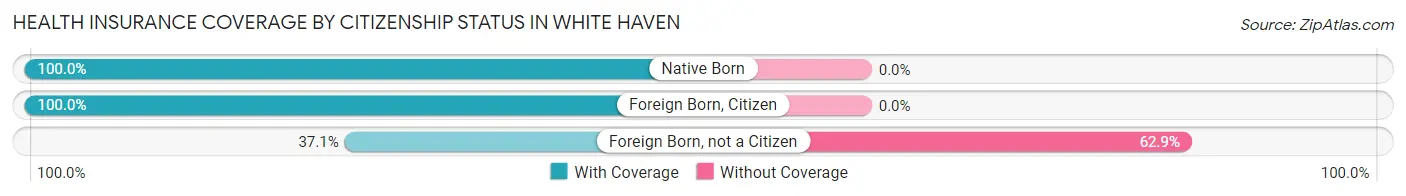
| Citizenship Status | With Coverage | Without Coverage |
| Native Born | 51 (100.0%) | 0 (0.0%) |
| Foreign Born, Citizen | 81 (100.0%) | 0 (0.0%) |
| Foreign Born, not a Citizen | 49 (37.1%) | 83 (62.9%) |
Health Insurance Coverage by Household Income in White Haven
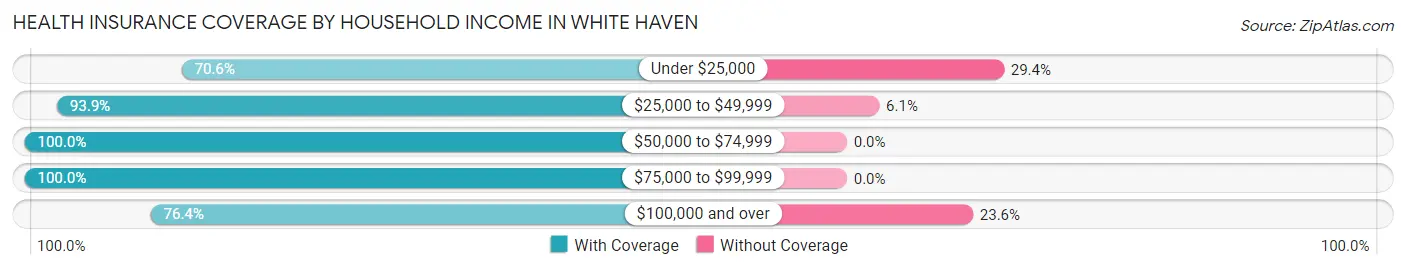
| Household Income | With Coverage | Without Coverage |
| Under $25,000 | 96 (70.6%) | 40 (29.4%) |
| $25,000 to $49,999 | 155 (93.9%) | 10 (6.1%) |
| $50,000 to $74,999 | 69 (100.0%) | 0 (0.0%) |
| $75,000 to $99,999 | 20 (100.0%) | 0 (0.0%) |
| $100,000 and over | 236 (76.4%) | 73 (23.6%) |
Public vs Private Health Insurance Coverage by Age in White Haven
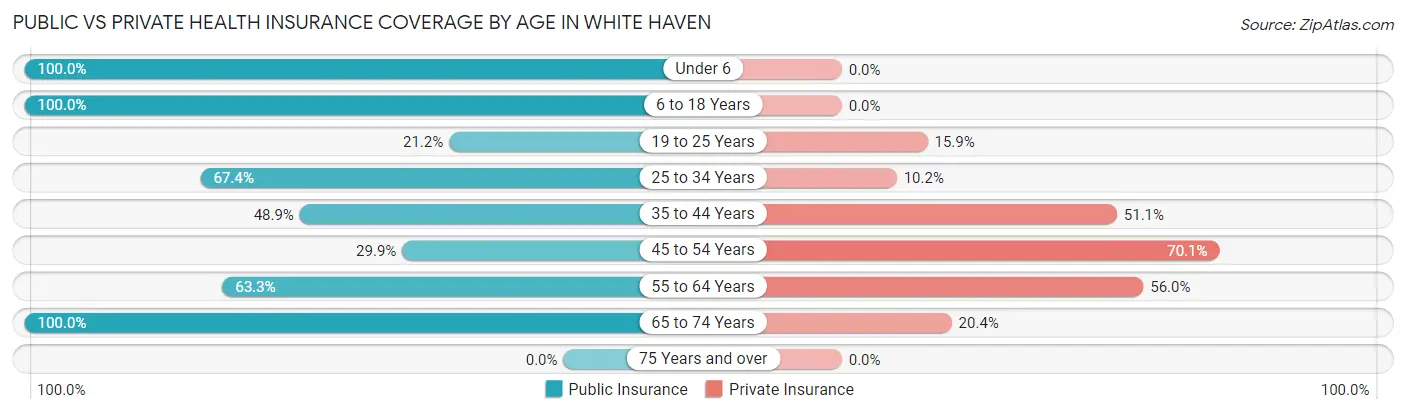
| Age Bracket | Public Insurance | Private Insurance |
| Under 6 | 51 (100.0%) | 0 (0.0%) |
| 6 to 18 Years | 81 (100.0%) | 0 (0.0%) |
| 19 to 25 Years | 28 (21.2%) | 21 (15.9%) |
| 25 to 34 Years | 33 (67.3%) | 5 (10.2%) |
| 35 to 44 Years | 23 (48.9%) | 24 (51.1%) |
| 45 to 54 Years | 38 (29.9%) | 89 (70.1%) |
| 55 to 64 Years | 69 (63.3%) | 61 (56.0%) |
| 65 to 74 Years | 103 (100.0%) | 21 (20.4%) |
| 75 Years and over | 0 (0.0%) | 0 (0.0%) |
| Total | 426 (60.9%) | 221 (31.6%) |
Disability Status by Sex by Age in White Haven
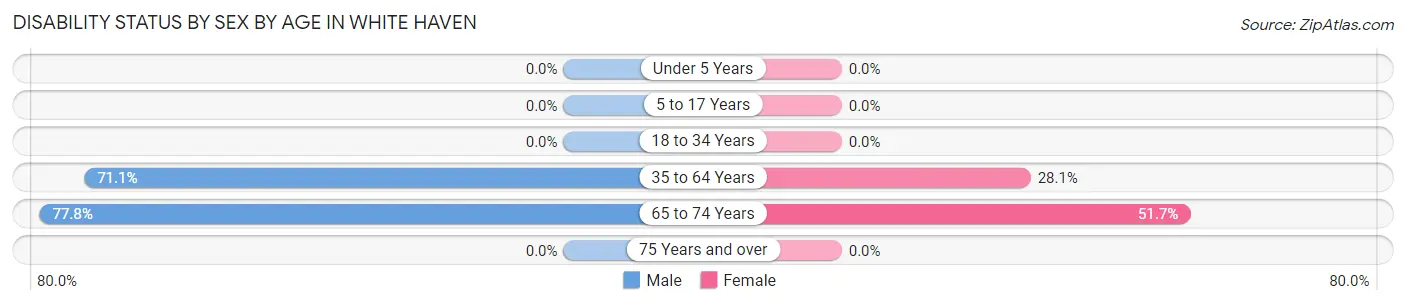
| Age Bracket | Male | Female |
| Under 5 Years | 0 (0.0%) | 0 (0.0%) |
| 5 to 17 Years | 0 (0.0%) | 0 (0.0%) |
| 18 to 34 Years | 0 (0.0%) | 0 (0.0%) |
| 35 to 64 Years | 143 (71.1%) | 23 (28.1%) |
| 65 to 74 Years | 35 (77.8%) | 30 (51.7%) |
| 75 Years and over | 0 (0.0%) | 0 (0.0%) |
Disability Class by Sex by Age in White Haven
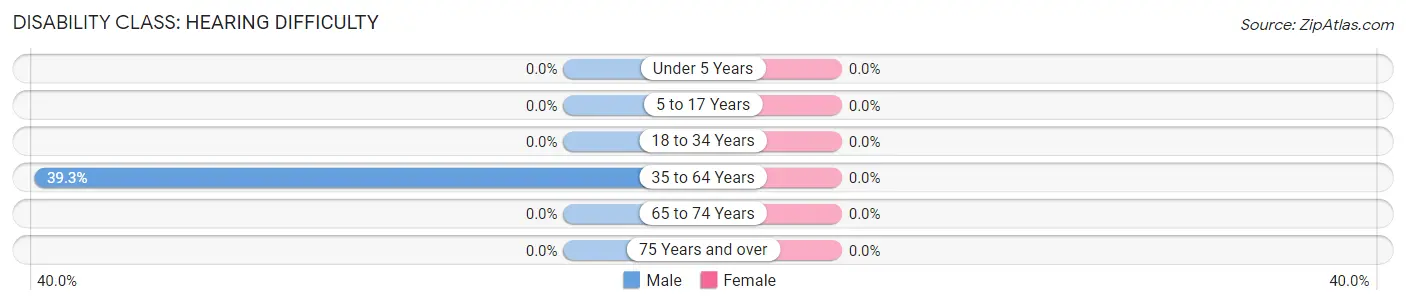
Disability Class: Hearing Difficulty
| Age Bracket | Male | Female |
| Under 5 Years | 0 (0.0%) | 0 (0.0%) |
| 5 to 17 Years | 0 (0.0%) | 0 (0.0%) |
| 18 to 34 Years | 0 (0.0%) | 0 (0.0%) |
| 35 to 64 Years | 79 (39.3%) | 0 (0.0%) |
| 65 to 74 Years | 0 (0.0%) | 0 (0.0%) |
| 75 Years and over | 0 (0.0%) | 0 (0.0%) |
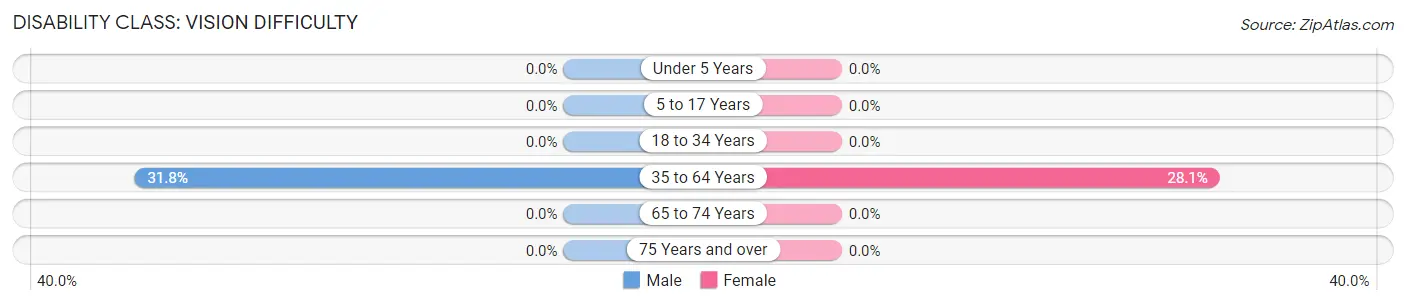
Disability Class: Vision Difficulty
| Age Bracket | Male | Female |
| Under 5 Years | 0 (0.0%) | 0 (0.0%) |
| 5 to 17 Years | 0 (0.0%) | 0 (0.0%) |
| 18 to 34 Years | 0 (0.0%) | 0 (0.0%) |
| 35 to 64 Years | 64 (31.8%) | 23 (28.1%) |
| 65 to 74 Years | 0 (0.0%) | 0 (0.0%) |
| 75 Years and over | 0 (0.0%) | 0 (0.0%) |
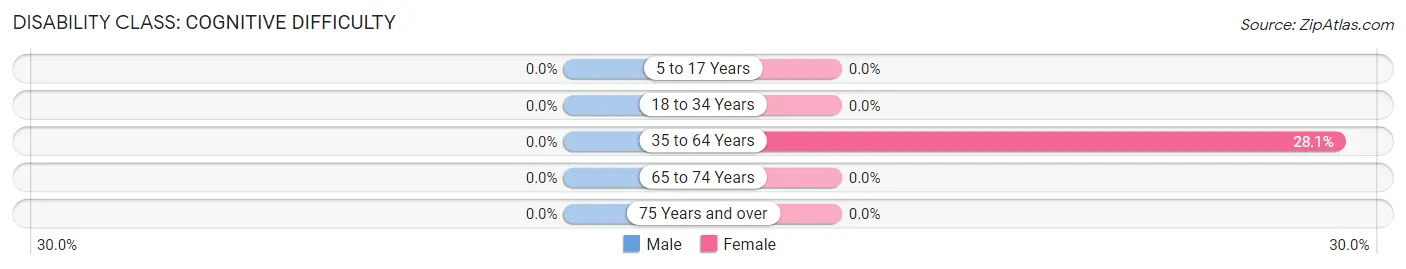
Disability Class: Cognitive Difficulty
| Age Bracket | Male | Female |
| 5 to 17 Years | 0 (0.0%) | 0 (0.0%) |
| 18 to 34 Years | 0 (0.0%) | 0 (0.0%) |
| 35 to 64 Years | 0 (0.0%) | 23 (28.1%) |
| 65 to 74 Years | 0 (0.0%) | 0 (0.0%) |
| 75 Years and over | 0 (0.0%) | 0 (0.0%) |
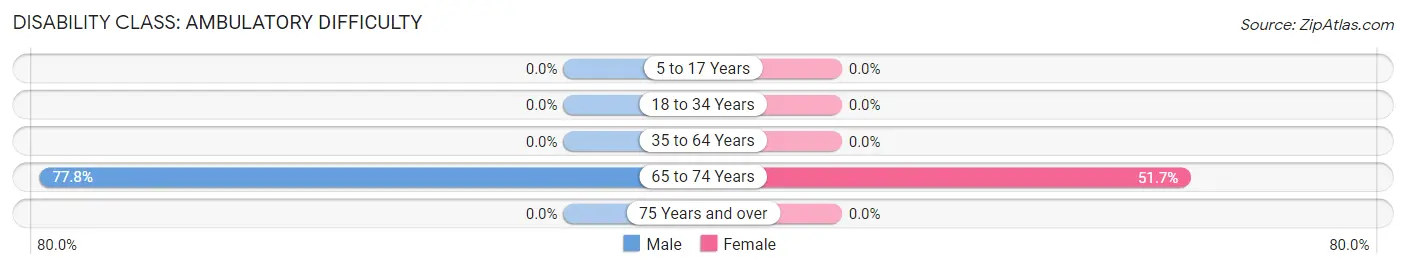
Disability Class: Ambulatory Difficulty
| Age Bracket | Male | Female |
| 5 to 17 Years | 0 (0.0%) | 0 (0.0%) |
| 18 to 34 Years | 0 (0.0%) | 0 (0.0%) |
| 35 to 64 Years | 0 (0.0%) | 0 (0.0%) |
| 65 to 74 Years | 35 (77.8%) | 30 (51.7%) |
| 75 Years and over | 0 (0.0%) | 0 (0.0%) |
Disability Class: Self-Care Difficulty
| Age Bracket | Male | Female |
| 5 to 17 Years | 0 (0.0%) | 0 (0.0%) |
| 18 to 34 Years | 0 (0.0%) | 0 (0.0%) |
| 35 to 64 Years | 0 (0.0%) | 0 (0.0%) |
| 65 to 74 Years | 0 (0.0%) | 0 (0.0%) |
| 75 Years and over | 0 (0.0%) | 0 (0.0%) |
Technology Access in White Haven
Computing Device Access in White Haven
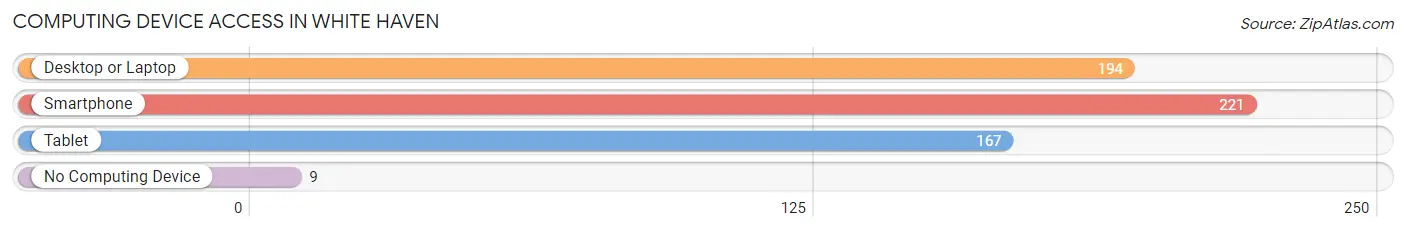
| Device Type | # Households | % Households |
| Desktop or Laptop | 194 | 71.1% |
| Smartphone | 221 | 80.9% |
| Tablet | 167 | 61.2% |
| No Computing Device | 9 | 3.3% |
| Total | 273 | 100.0% |
Internet Access in White Haven
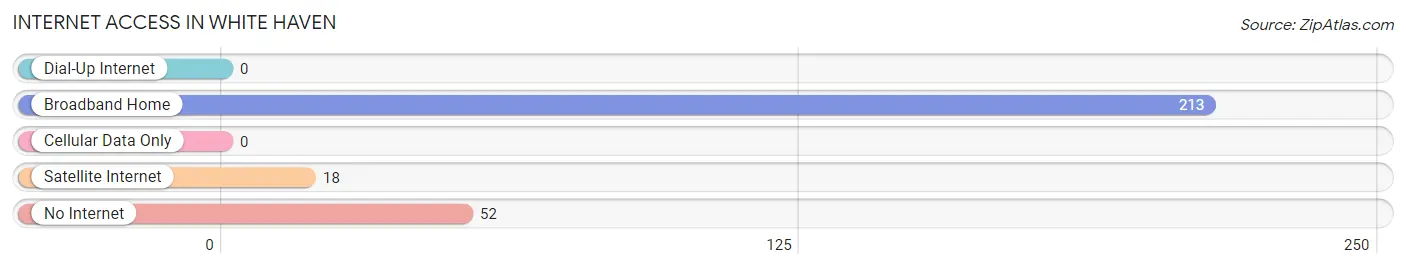
| Internet Type | # Households | % Households |
| Dial-Up Internet | 0 | 0.0% |
| Broadband Home | 213 | 78.0% |
| Cellular Data Only | 0 | 0.0% |
| Satellite Internet | 18 | 6.6% |
| No Internet | 52 | 19.1% |
| Total | 273 | 100.0% |
White Haven Summary
History
White Haven is a small unincorporated community located in the Flathead Valley of Montana. It is situated in the northwest corner of the state, just south of the Canadian border. The area was first settled in the late 1800s by homesteaders who were drawn to the area by its abundant natural resources. The town was officially established in 1910 and named after the white-tailed deer that were abundant in the area.
White Haven has a rich history of logging and mining. The area was home to several sawmills and mines, including the White Haven Mine, which operated from 1910 to the early 1940s. The mine produced copper, lead, zinc, and silver. The town also had a thriving lumber industry, with several sawmills operating in the area.
The town was also home to a number of small businesses, including a general store, a blacksmith shop, a hotel, and a saloon. The town was also home to a school, which operated until the 1950s.
Geography
White Haven is located in the Flathead Valley of Montana, in the northwest corner of the state. The town is situated at an elevation of 3,400 feet and is surrounded by the Flathead National Forest. The area is characterized by rolling hills, dense forests, and numerous lakes and streams.
The climate in White Haven is generally mild, with warm summers and cold winters. The average annual temperature is around 45 degrees Fahrenheit. The area receives an average of 20 inches of precipitation per year, with most of it falling in the form of snow.
Economy
White Haven’s economy is largely based on tourism and recreation. The area is home to several ski resorts, including Whitefish Mountain Resort and Big Mountain Ski Resort. The area is also popular for fishing, hunting, and camping.
The town is also home to several small businesses, including a general store, a gas station, and a restaurant. The town is also home to a post office and a library.
Demographics
As of the 2010 census, the population of White Haven was 545. The population is predominantly white (95.2%), with a small percentage of Native Americans (2.2%) and African Americans (1.6%). The median age of the population is 44.7 years, and the median household income is $41,250.
The town is served by the White Haven School District, which includes an elementary school, a middle school, and a high school. The town is also home to a branch of Flathead Valley Community College.
Common Questions
What is Per Capita Income in White Haven?
Per Capita income in White Haven is $31,440.
What is the Median Family Income in White Haven?
Median Family Income in White Haven is $110,341.
What is the Median Household income in White Haven?
Median Household Income in White Haven is $33,641.
What is Inequality or Gini Index in White Haven?
Inequality or Gini Index in White Haven is 0.55.
What is the Total Population of White Haven?
Total Population of White Haven is 699.
What is the Total Male Population of White Haven?
Total Male Population of White Haven is 485.
What is the Total Female Population of White Haven?
Total Female Population of White Haven is 214.
What is the Ratio of Males per 100 Females in White Haven?
There are 226.64 Males per 100 Females in White Haven.
What is the Ratio of Females per 100 Males in White Haven?
There are 44.12 Females per 100 Males in White Haven.
What is the Median Population Age in White Haven?
Median Population Age in White Haven is 44.6 Years.
What is the Average Family Size in White Haven
Average Family Size in White Haven is 3.3 People.
What is the Average Household Size in White Haven
Average Household Size in White Haven is 2.6 People.
How Large is the Labor Force in White Haven?
There are 334 People in the Labor Forcein in White Haven.
What is the Percentage of People in the Labor Force in White Haven?
54.0% of People are in the Labor Force in White Haven.
What is the Unemployment Rate in White Haven?
Unemployment Rate in White Haven is 13.2%.