Porter Heights, TX Map & Demographics
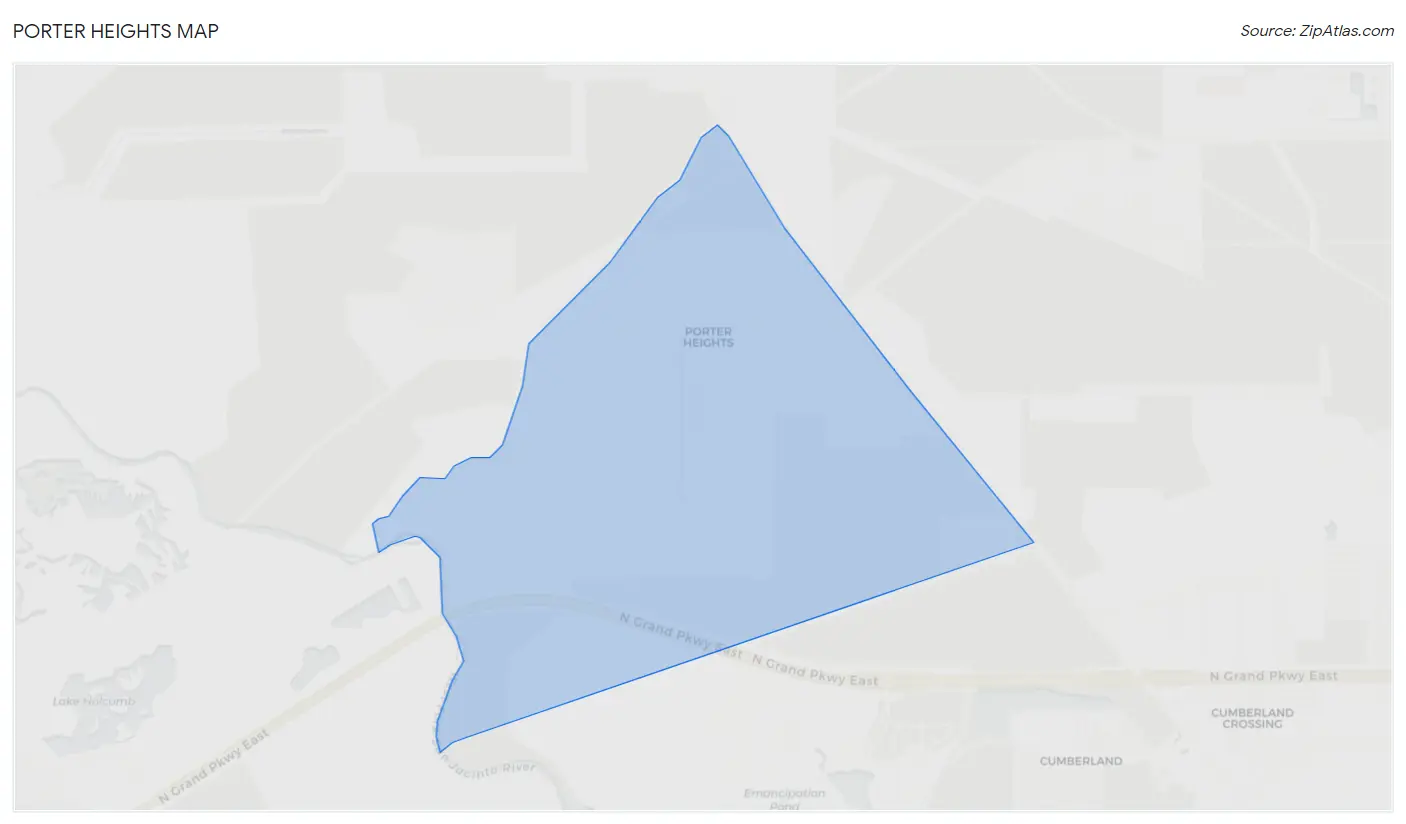
Porter Heights Map
Porter Heights Overview
$57,449
PER CAPITA INCOME
0.37
INEQUALITY / GINI INDEX
1,001
TOTAL POPULATION
515
MALE POPULATION
486
FEMALE POPULATION
105.97
MALES / 100 FEMALES
94.37
FEMALES / 100 MALES
55.4
MEDIAN AGE
2.8
AVG FAMILY SIZE
2.5
AVG HOUSEHOLD SIZE
629
LABOR FORCE [ PEOPLE ]
70.8%
PERCENT IN LABOR FORCE
Income in Porter Heights
Income Overview in Porter Heights
| Characteristic | Number | Measure |
| Per Capita Income | 1,001 | $57,449 |
| Median Family Income | 312 | $0 |
| Mean Family Income | 312 | $167,530 |
| Median Household Income | 400 | $0 |
| Mean Household Income | 400 | $143,017 |
| Income Deficit | 312 | $0 |
| Wage / Income Gap (%) | 1,001 | 0.00% |
| Wage / Income Gap ($) | 1,001 | 100.00¢ per $1 |
| Gini / Inequality Index | 1,001 | 0.37 |
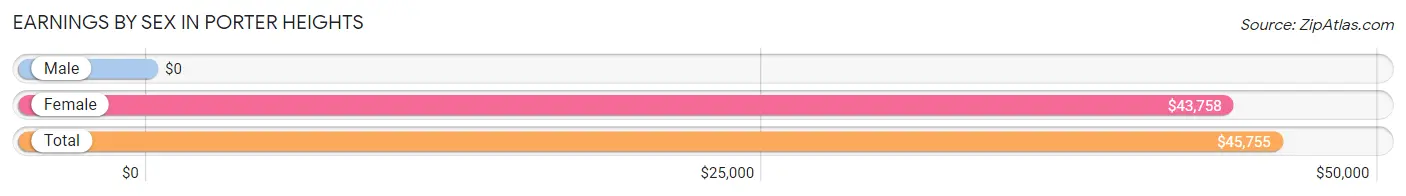
Earnings by Sex in Porter Heights
| Sex | Number | Average Earnings |
| Male | 423 (67.2%) | $0 |
| Female | 206 (32.8%) | $43,758 |
| Total | 629 (100.0%) | $45,755 |
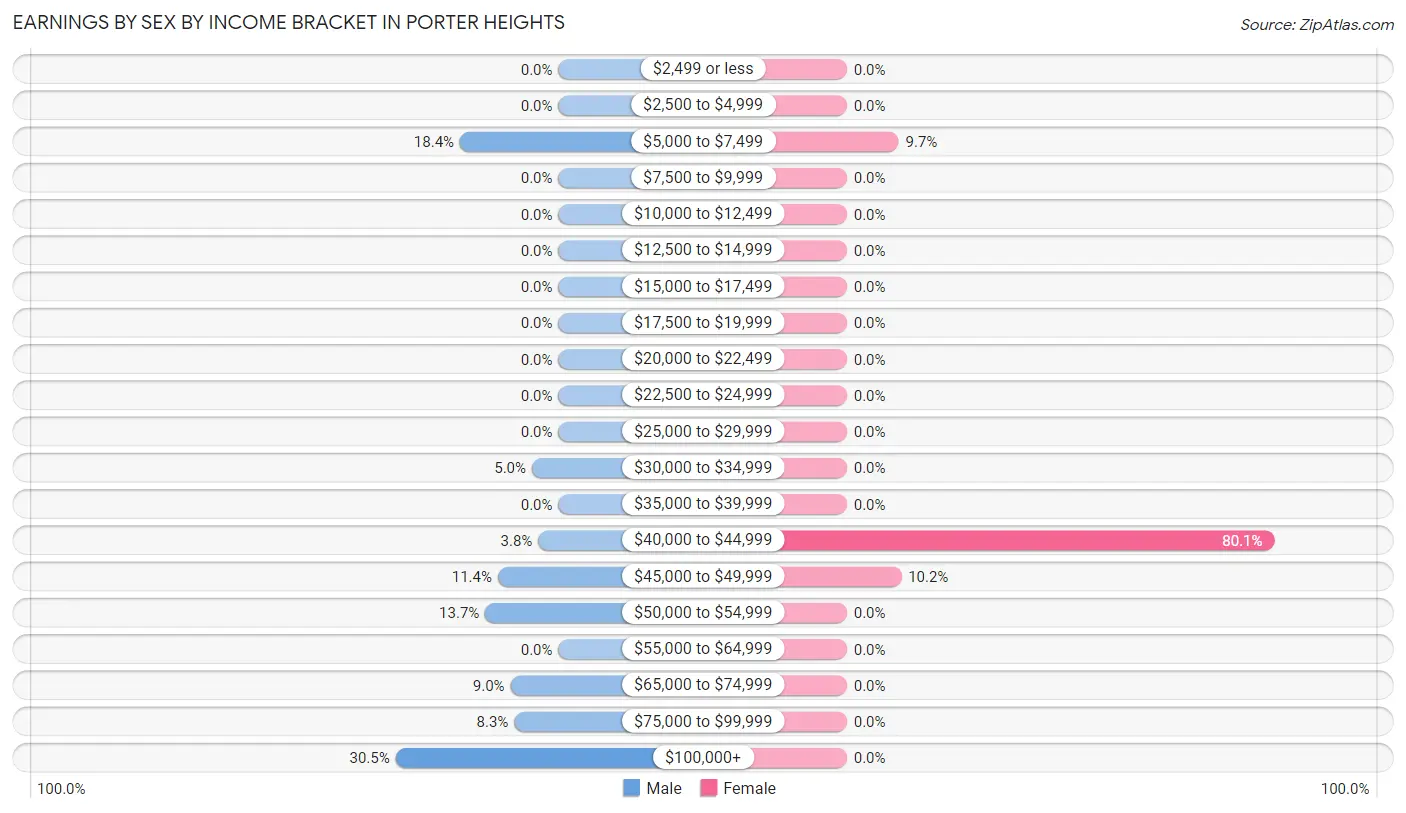
Earnings by Sex by Income Bracket in Porter Heights
The most common earnings brackets in Porter Heights are $100,000+ for men (129 | 30.5%) and $40,000 to $44,999 for women (165 | 80.1%).
| Income | Male | Female |
| $2,499 or less | 0 (0.0%) | 0 (0.0%) |
| $2,500 to $4,999 | 0 (0.0%) | 0 (0.0%) |
| $5,000 to $7,499 | 78 (18.4%) | 20 (9.7%) |
| $7,500 to $9,999 | 0 (0.0%) | 0 (0.0%) |
| $10,000 to $12,499 | 0 (0.0%) | 0 (0.0%) |
| $12,500 to $14,999 | 0 (0.0%) | 0 (0.0%) |
| $15,000 to $17,499 | 0 (0.0%) | 0 (0.0%) |
| $17,500 to $19,999 | 0 (0.0%) | 0 (0.0%) |
| $20,000 to $22,499 | 0 (0.0%) | 0 (0.0%) |
| $22,500 to $24,999 | 0 (0.0%) | 0 (0.0%) |
| $25,000 to $29,999 | 0 (0.0%) | 0 (0.0%) |
| $30,000 to $34,999 | 21 (5.0%) | 0 (0.0%) |
| $35,000 to $39,999 | 0 (0.0%) | 0 (0.0%) |
| $40,000 to $44,999 | 16 (3.8%) | 165 (80.1%) |
| $45,000 to $49,999 | 48 (11.4%) | 21 (10.2%) |
| $50,000 to $54,999 | 58 (13.7%) | 0 (0.0%) |
| $55,000 to $64,999 | 0 (0.0%) | 0 (0.0%) |
| $65,000 to $74,999 | 38 (9.0%) | 0 (0.0%) |
| $75,000 to $99,999 | 35 (8.3%) | 0 (0.0%) |
| $100,000+ | 129 (30.5%) | 0 (0.0%) |
| Total | 423 (100.0%) | 206 (100.0%) |
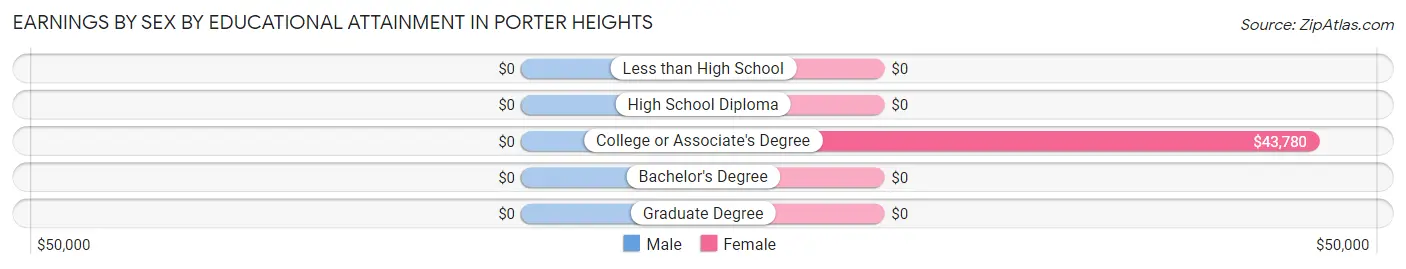
Earnings by Sex by Educational Attainment in Porter Heights
| Educational Attainment | Male Income | Female Income |
| Less than High School | - | - |
| High School Diploma | - | - |
| College or Associate's Degree | - | - |
| Bachelor's Degree | - | - |
| Graduate Degree | - | - |
| Total | - | - |
Family Income in Porter Heights
Family Income Brackets in Porter Heights
According to the Porter Heights family income data, there are 115 families falling into the $200,000+ income range, which is the most common income bracket and makes up 36.9% of all families.
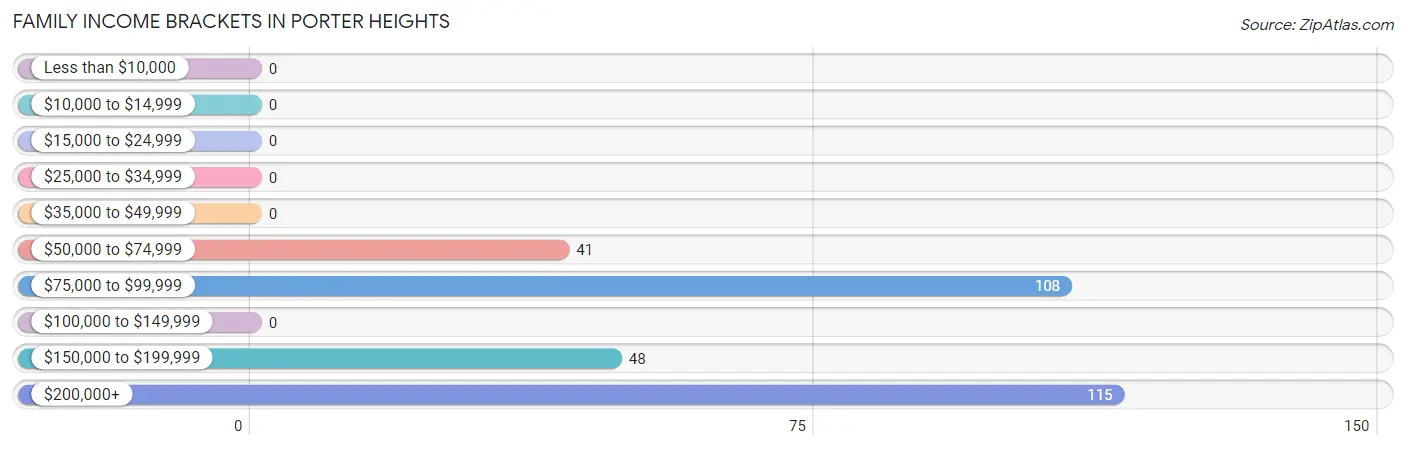
| Income Bracket | # Families | % Families |
| Less than $10,000 | 0 | 0.0% |
| $10,000 to $14,999 | 0 | 0.0% |
| $15,000 to $24,999 | 0 | 0.0% |
| $25,000 to $34,999 | 0 | 0.0% |
| $35,000 to $49,999 | 0 | 0.0% |
| $50,000 to $74,999 | 41 | 13.1% |
| $75,000 to $99,999 | 108 | 34.6% |
| $100,000 to $149,999 | 0 | 0.0% |
| $150,000 to $199,999 | 48 | 15.4% |
| $200,000+ | 115 | 36.9% |
Family Income by Famaliy Size in Porter Heights
2-person families (202 | 64.7%) account for the highest median family income in Porter Heights with $250,001 per family, while 2-person families (202 | 64.7%) have the highest median income of $125,000 per family member.
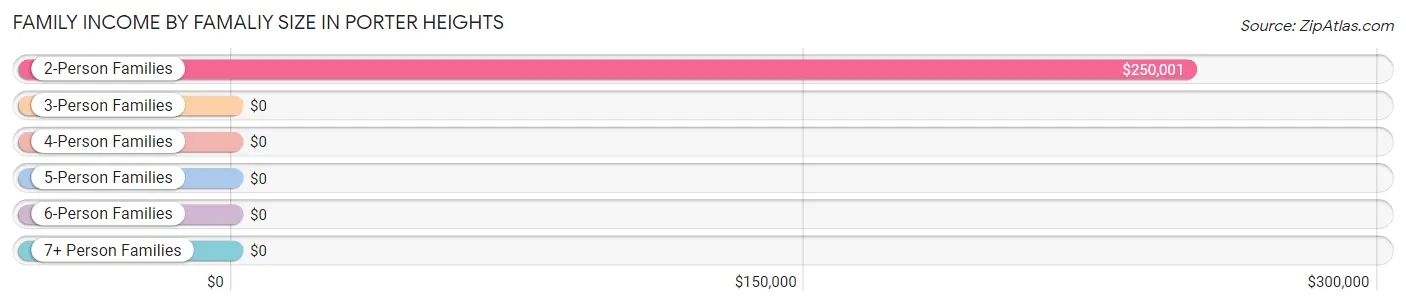
| Income Bracket | # Families | Median Income |
| 2-Person Families | 202 (64.7%) | $250,001 |
| 3-Person Families | 41 (13.1%) | $0 |
| 4-Person Families | 0 (0.0%) | $0 |
| 5-Person Families | 69 (22.1%) | $0 |
| 6-Person Families | 0 (0.0%) | $0 |
| 7+ Person Families | 0 (0.0%) | $0 |
| Total | 312 (100.0%) | $0 |
Family Income by Number of Earners in Porter Heights
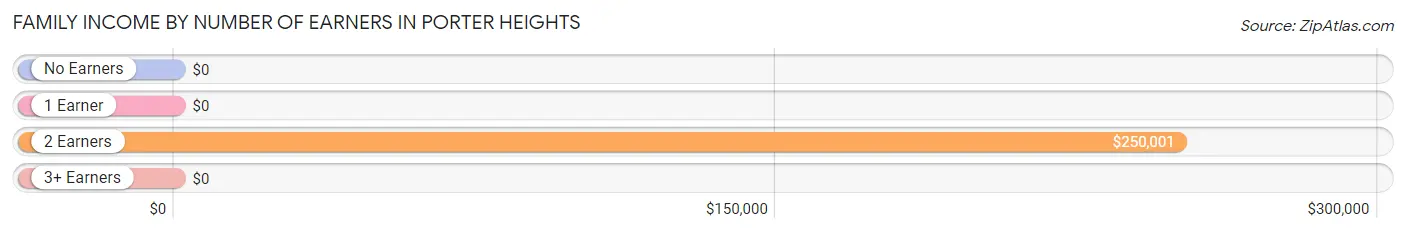
| Number of Earners | # Families | Median Income |
| No Earners | 0 (0.0%) | $0 |
| 1 Earner | 71 (22.8%) | $0 |
| 2 Earners | 200 (64.1%) | $250,001 |
| 3+ Earners | 41 (13.1%) | $0 |
| Total | 312 (100.0%) | $0 |
Household Income in Porter Heights
Household Income Brackets in Porter Heights
With 115 households falling in the category, the $200,000+ income range is the most frequent in Porter Heights, accounting for 28.7% of all households.
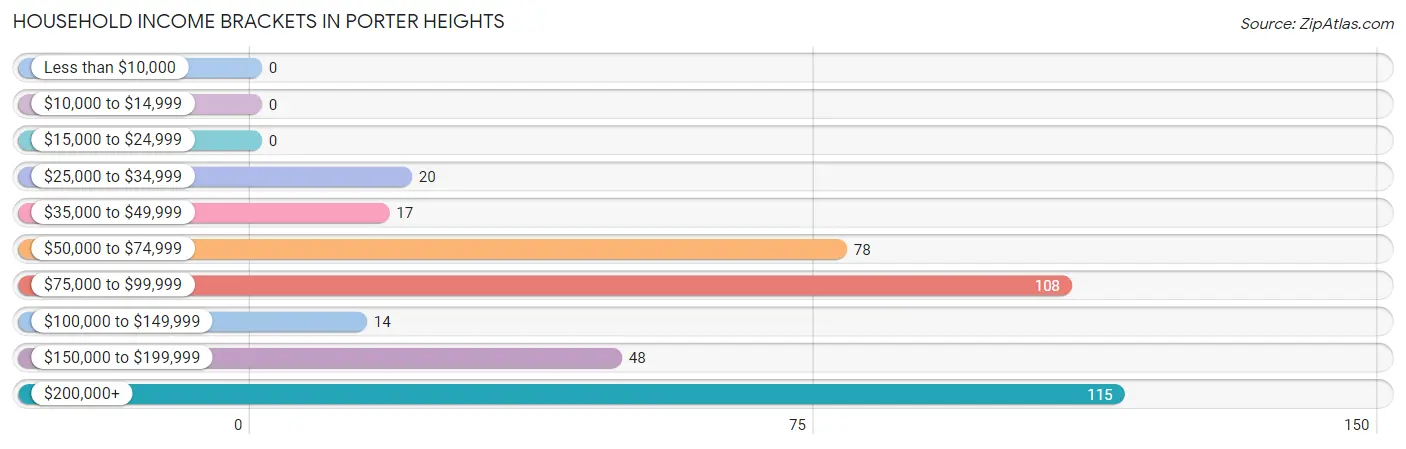
| Income Bracket | # Households | % Households |
| Less than $10,000 | 0 | 0.0% |
| $10,000 to $14,999 | 0 | 0.0% |
| $15,000 to $24,999 | 0 | 0.0% |
| $25,000 to $34,999 | 20 | 5.0% |
| $35,000 to $49,999 | 17 | 4.3% |
| $50,000 to $74,999 | 78 | 19.5% |
| $75,000 to $99,999 | 108 | 27.0% |
| $100,000 to $149,999 | 14 | 3.5% |
| $150,000 to $199,999 | 48 | 12.0% |
| $200,000+ | 115 | 28.8% |
Household Income by Householder Age in Porter Heights
The median household income in Porter Heights is $0, with the highest median household income of $250,001 found in the 45 to 64 years age bracket for the primary householder. A total of 208 households (52.0%) fall into this category.
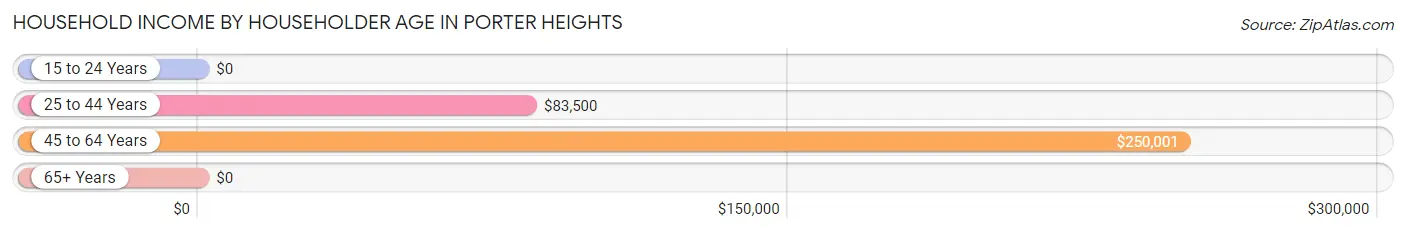
| Income Bracket | # Households | Median Income |
| 15 to 24 Years | 0 (0.0%) | $0 |
| 25 to 44 Years | 70 (17.5%) | $83,500 |
| 45 to 64 Years | 208 (52.0%) | $250,001 |
| 65+ Years | 122 (30.5%) | $0 |
| Total | 400 (100.0%) | $0 |
Poverty in Porter Heights
Income Below Poverty by Sex and Age in Porter Heights
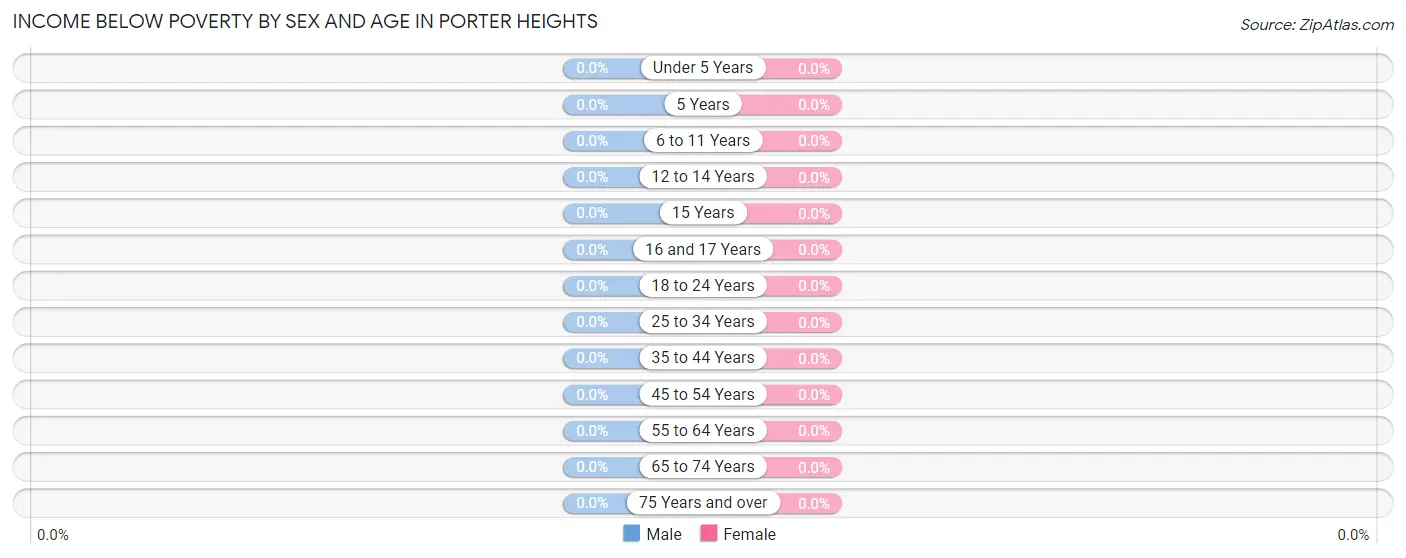
| Age Bracket | Male | Female |
| Under 5 Years | 0 (0.0%) | 0 (0.0%) |
| 5 Years | 0 (0.0%) | 0 (0.0%) |
| 6 to 11 Years | 0 (0.0%) | 0 (0.0%) |
| 12 to 14 Years | 0 (0.0%) | 0 (0.0%) |
| 15 Years | 0 (0.0%) | 0 (0.0%) |
| 16 and 17 Years | 0 (0.0%) | 0 (0.0%) |
| 18 to 24 Years | 0 (0.0%) | 0 (0.0%) |
| 25 to 34 Years | 0 (0.0%) | 0 (0.0%) |
| 35 to 44 Years | 0 (0.0%) | 0 (0.0%) |
| 45 to 54 Years | 0 (0.0%) | 0 (0.0%) |
| 55 to 64 Years | 0 (0.0%) | 0 (0.0%) |
| 65 to 74 Years | 0 (0.0%) | 0 (0.0%) |
| 75 Years and over | 0 (0.0%) | 0 (0.0%) |
| Total | 0 (0.0%) | 0 (0.0%) |
Income Above Poverty by Sex and Age in Porter Heights
According to the poverty statistics in Porter Heights, males aged 12 to 14 years and females aged 6 to 11 years are the age groups that are most secure financially, with 100.0% of males and 100.0% of females in these age groups living above the poverty line.
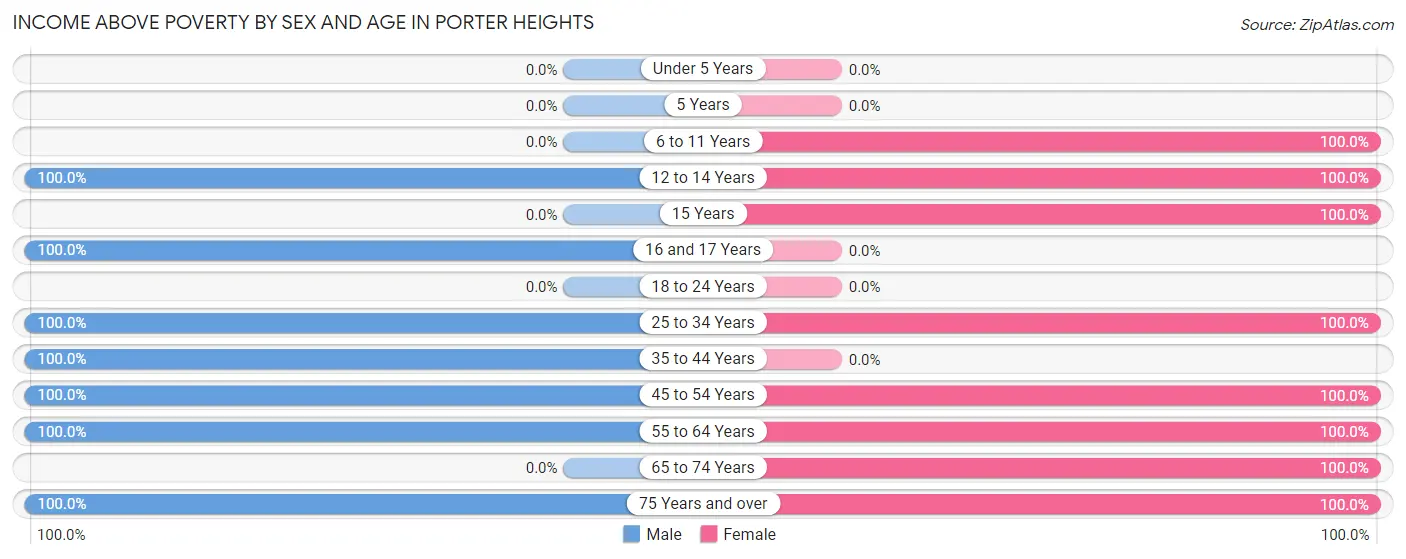
| Age Bracket | Male | Female |
| Under 5 Years | 0 (0.0%) | 0 (0.0%) |
| 5 Years | 0 (0.0%) | 0 (0.0%) |
| 6 to 11 Years | 0 (0.0%) | 22 (100.0%) |
| 12 to 14 Years | 21 (100.0%) | 22 (100.0%) |
| 15 Years | 0 (0.0%) | 48 (100.0%) |
| 16 and 17 Years | 113 (100.0%) | 0 (0.0%) |
| 18 to 24 Years | 0 (0.0%) | 0 (0.0%) |
| 25 to 34 Years | 35 (100.0%) | 21 (100.0%) |
| 35 to 44 Years | 35 (100.0%) | 0 (0.0%) |
| 45 to 54 Years | 58 (100.0%) | 55 (100.0%) |
| 55 to 64 Years | 169 (100.0%) | 196 (100.0%) |
| 65 to 74 Years | 0 (0.0%) | 64 (100.0%) |
| 75 Years and over | 84 (100.0%) | 58 (100.0%) |
| Total | 515 (100.0%) | 486 (100.0%) |
Income Below Poverty Among Married-Couple Families in Porter Heights
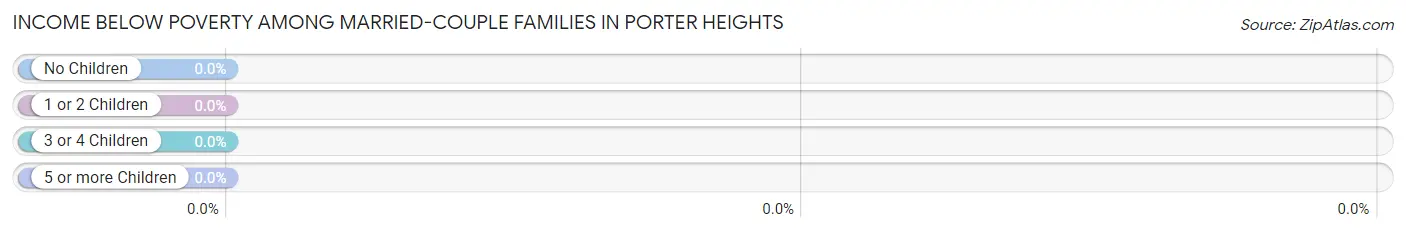
| Children | Above Poverty | Below Poverty |
| No Children | 167 (100.0%) | 0 (0.0%) |
| 1 or 2 Children | 48 (100.0%) | 0 (0.0%) |
| 3 or 4 Children | 21 (100.0%) | 0 (0.0%) |
| 5 or more Children | 0 (0.0%) | 0 (0.0%) |
| Total | 236 (100.0%) | 0 (0.0%) |
Income Below Poverty Among Single-Parent Households in Porter Heights
| Children | Single Father | Single Mother |
| No Children | 0 (0.0%) | 0 (0.0%) |
| 1 or 2 Children | 0 (0.0%) | 0 (0.0%) |
| 3 or 4 Children | 0 (0.0%) | 0 (0.0%) |
| 5 or more Children | 0 (0.0%) | 0 (0.0%) |
| Total | 0 (0.0%) | 0 (0.0%) |
Income Below Poverty Among Married-Couple vs Single-Parent Households in Porter Heights
| Children | Married-Couple Families | Single-Parent Households |
| No Children | 0 (0.0%) | 0 (0.0%) |
| 1 or 2 Children | 0 (0.0%) | 0 (0.0%) |
| 3 or 4 Children | 0 (0.0%) | 0 (0.0%) |
| 5 or more Children | 0 (0.0%) | 0 (0.0%) |
| Total | 0 (0.0%) | 0 (0.0%) |
Race in Porter Heights
The most populous races in Porter Heights are White / Caucasian (964 | 96.3%), Some other Race (37 | 3.7%), and Hispanic or Latino (30 | 3.0%).
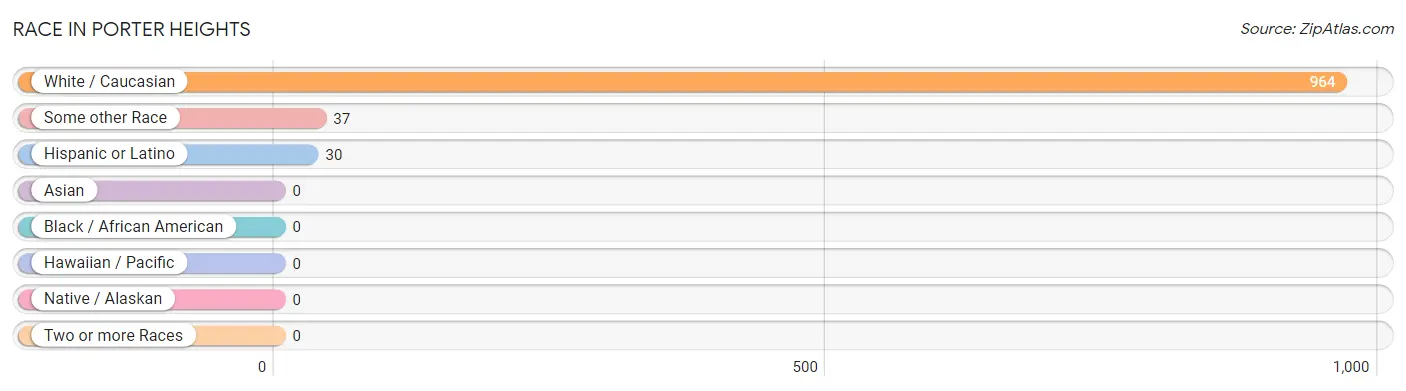
| Race | # Population | % Population |
| Asian | 0 | 0.0% |
| Black / African American | 0 | 0.0% |
| Hawaiian / Pacific | 0 | 0.0% |
| Hispanic or Latino | 30 | 3.0% |
| Native / Alaskan | 0 | 0.0% |
| White / Caucasian | 964 | 96.3% |
| Two or more Races | 0 | 0.0% |
| Some other Race | 37 | 3.7% |
| Total | 1,001 | 100.0% |
Ancestry in Porter Heights
The most populous ancestries reported in Porter Heights are English (522 | 52.1%), Irish (380 | 38.0%), German (188 | 18.8%), British (119 | 11.9%), and Scottish (37 | 3.7%), together accounting for 124.5% of all Porter Heights residents.
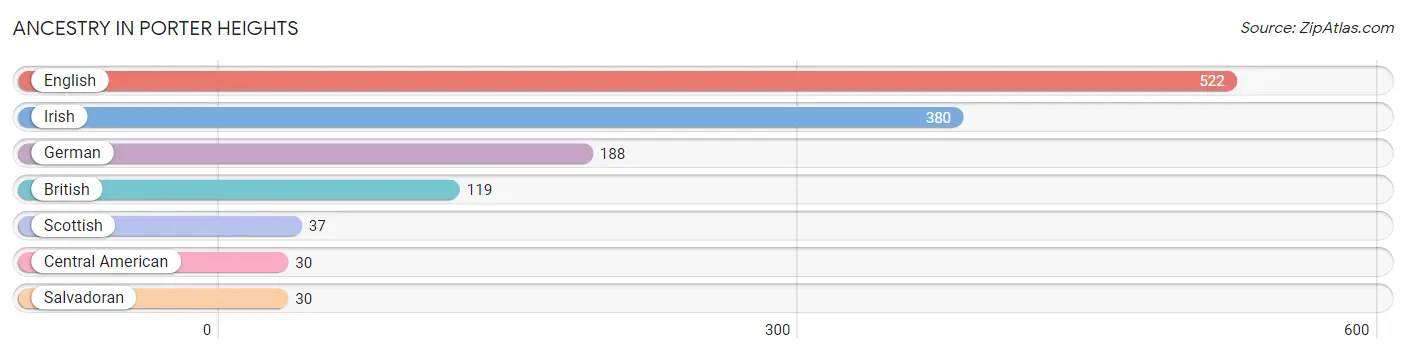
| Ancestry | # Population | % Population |
| British | 119 | 11.9% |
| Central American | 30 | 3.0% |
| English | 522 | 52.1% |
| German | 188 | 18.8% |
| Irish | 380 | 38.0% |
| Salvadoran | 30 | 3.0% |
| Scottish | 37 | 3.7% | View All 7 Rows |
Immigrants in Porter Heights
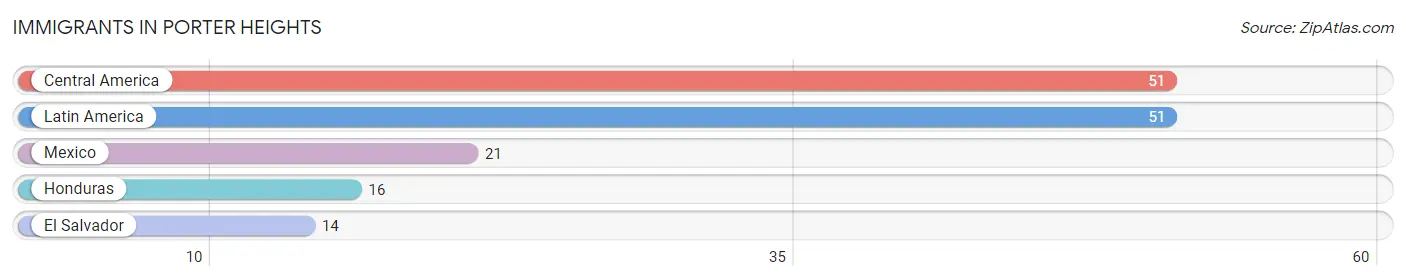
The most numerous immigrant groups reported in Porter Heights came from Central America (51 | 5.1%), Latin America (51 | 5.1%), Mexico (21 | 2.1%), Honduras (16 | 1.6%), and El Salvador (14 | 1.4%), together accounting for 15.3% of all Porter Heights residents.
| Immigration Origin | # Population | % Population |
| Central America | 51 | 5.1% |
| El Salvador | 14 | 1.4% |
| Honduras | 16 | 1.6% |
| Latin America | 51 | 5.1% |
| Mexico | 21 | 2.1% | View All 5 Rows |
Sex and Age in Porter Heights
Sex and Age in Porter Heights
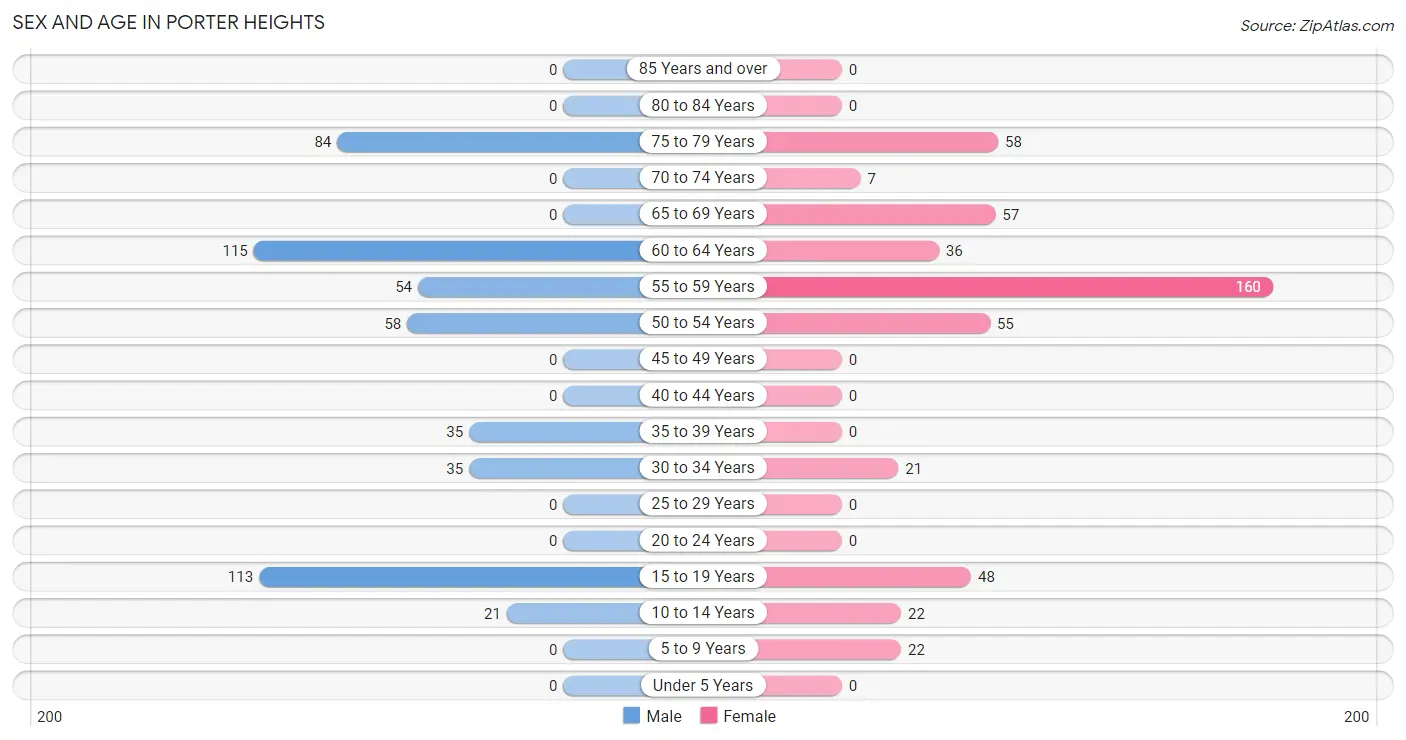
The most populous age groups in Porter Heights are 60 to 64 Years (115 | 22.3%) for men and 55 to 59 Years (160 | 32.9%) for women.
| Age Bracket | Male | Female |
| Under 5 Years | 0 (0.0%) | 0 (0.0%) |
| 5 to 9 Years | 0 (0.0%) | 22 (4.5%) |
| 10 to 14 Years | 21 (4.1%) | 22 (4.5%) |
| 15 to 19 Years | 113 (21.9%) | 48 (9.9%) |
| 20 to 24 Years | 0 (0.0%) | 0 (0.0%) |
| 25 to 29 Years | 0 (0.0%) | 0 (0.0%) |
| 30 to 34 Years | 35 (6.8%) | 21 (4.3%) |
| 35 to 39 Years | 35 (6.8%) | 0 (0.0%) |
| 40 to 44 Years | 0 (0.0%) | 0 (0.0%) |
| 45 to 49 Years | 0 (0.0%) | 0 (0.0%) |
| 50 to 54 Years | 58 (11.3%) | 55 (11.3%) |
| 55 to 59 Years | 54 (10.5%) | 160 (32.9%) |
| 60 to 64 Years | 115 (22.3%) | 36 (7.4%) |
| 65 to 69 Years | 0 (0.0%) | 57 (11.7%) |
| 70 to 74 Years | 0 (0.0%) | 7 (1.4%) |
| 75 to 79 Years | 84 (16.3%) | 58 (11.9%) |
| 80 to 84 Years | 0 (0.0%) | 0 (0.0%) |
| 85 Years and over | 0 (0.0%) | 0 (0.0%) |
| Total | 515 (100.0%) | 486 (100.0%) |
Families and Households in Porter Heights
Median Family Size in Porter Heights
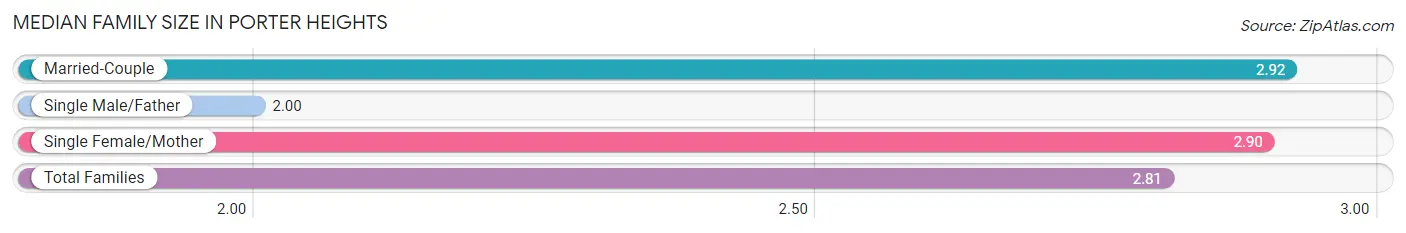
The median family size in Porter Heights is 2.81 persons per family, with married-couple families (236 | 75.6%) accounting for the largest median family size of 2.92 persons per family. On the other hand, single male/father families (35 | 11.2%) represent the smallest median family size with 2.00 persons per family.
| Family Type | # Families | Family Size |
| Married-Couple | 236 (75.6%) | 2.92 |
| Single Male/Father | 35 (11.2%) | 2.00 |
| Single Female/Mother | 41 (13.1%) | 2.90 |
| Total Families | 312 (100.0%) | 2.81 |
Median Household Size in Porter Heights
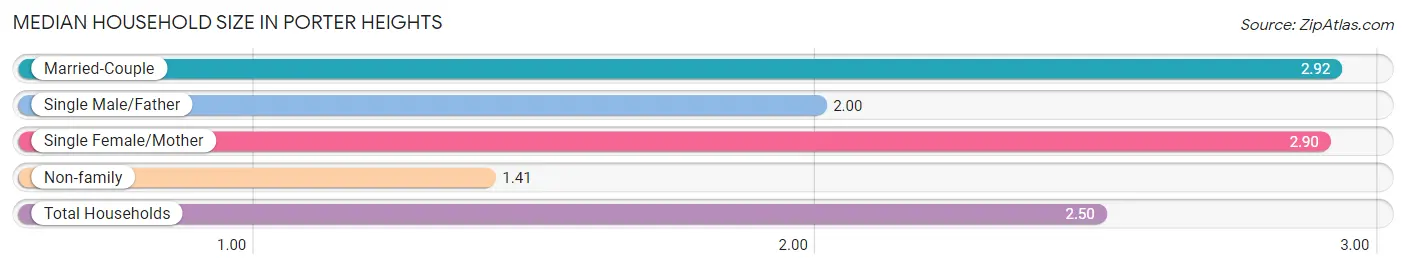
The median household size in Porter Heights is 2.50 persons per household, with married-couple households (236 | 59.0%) accounting for the largest median household size of 2.92 persons per household. non-family households (88 | 22.0%) represent the smallest median household size with 1.41 persons per household.
| Household Type | # Households | Household Size |
| Married-Couple | 236 (59.0%) | 2.92 |
| Single Male/Father | 35 (8.7%) | 2.00 |
| Single Female/Mother | 41 (10.2%) | 2.90 |
| Non-family | 88 (22.0%) | 1.41 |
| Total Households | 400 (100.0%) | 2.50 |
Household Size by Marriage Status in Porter Heights
Out of a total of 400 households in Porter Heights, 312 (78.0%) are family households, while 88 (22.0%) are nonfamily households. The most numerous type of family households are 2-person households, comprising 202, and the most common type of nonfamily households are 1-person households, comprising 51.
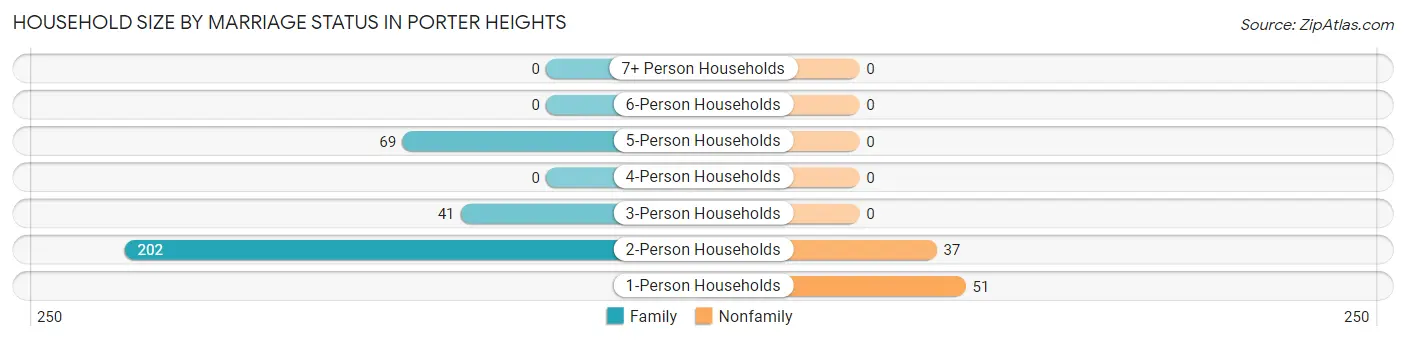
| Household Size | Family Households | Nonfamily Households |
| 1-Person Households | - | 51 (12.8%) |
| 2-Person Households | 202 (50.5%) | 37 (9.2%) |
| 3-Person Households | 41 (10.2%) | 0 (0.0%) |
| 4-Person Households | 0 (0.0%) | 0 (0.0%) |
| 5-Person Households | 69 (17.2%) | 0 (0.0%) |
| 6-Person Households | 0 (0.0%) | 0 (0.0%) |
| 7+ Person Households | 0 (0.0%) | 0 (0.0%) |
| Total | 312 (78.0%) | 88 (22.0%) |
Female Fertility in Porter Heights
Fertility by Age in Porter Heights
| Age Bracket | Women with Births | Births / 1,000 Women |
| 15 to 19 years | 0 (0.0%) | 0.0 |
| 20 to 34 years | 0 (0.0%) | 0.0 |
| 35 to 50 years | 0 (0.0%) | 0.0 |
| Total | 0 (0.0%) | 0.0 |
Fertility by Age by Marriage Status in Porter Heights
| Age Bracket | Married | Unmarried |
| 15 to 19 years | 0 (0.0%) | 0 (0.0%) |
| 20 to 34 years | 0 (0.0%) | 0 (0.0%) |
| 35 to 50 years | 0 (0.0%) | 0 (0.0%) |
| Total | 0 (0.0%) | 0 (0.0%) |
Fertility by Education in Porter Heights
| Educational Attainment | Women with Births | Births / 1,000 Women |
| Less than High School | 0 (0.0%) | 0.0 |
| High School Diploma | 0 (0.0%) | 0.0 |
| College or Associate's Degree | 0 (0.0%) | 0.0 |
| Bachelor's Degree | 0 (0.0%) | 0.0 |
| Graduate Degree | 0 (0.0%) | 0.0 |
| Total | 0 (0.0%) | 0.0 |
Fertility by Education by Marriage Status in Porter Heights
| Educational Attainment | Married | Unmarried |
| Less than High School | 0 (0.0%) | 0 (0.0%) |
| High School Diploma | 0 (0.0%) | 0 (0.0%) |
| College or Associate's Degree | 0 (0.0%) | 0 (0.0%) |
| Bachelor's Degree | 0 (0.0%) | 0 (0.0%) |
| Graduate Degree | 0 (0.0%) | 0 (0.0%) |
| Total | 0 (0.0%) | 0 (0.0%) |
Employment Characteristics in Porter Heights
Employment by Class of Employer in Porter Heights
Among the 629 employed individuals in Porter Heights, private company employees (588 | 93.5%), and local government employees (41 | 6.5%) make up the most common classes of employment.
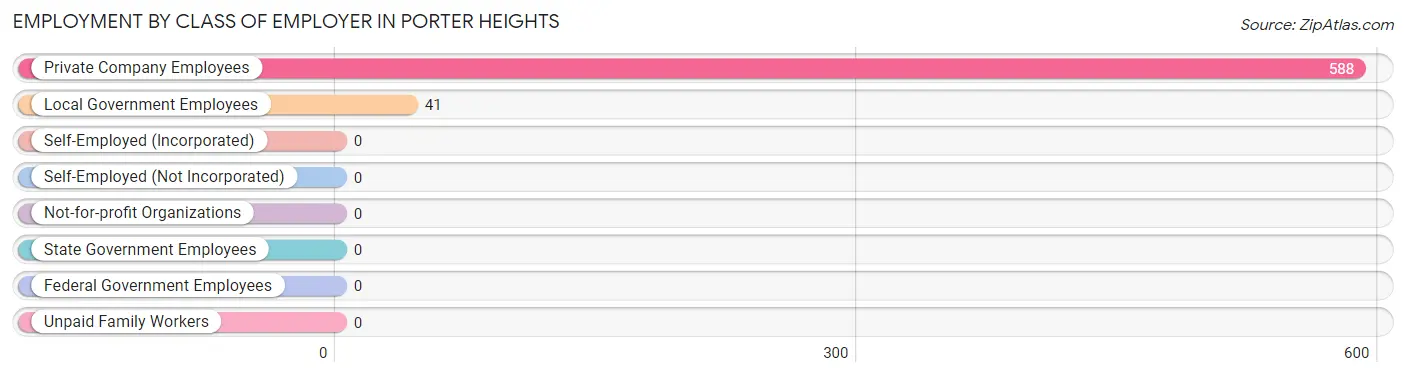
| Employer Class | # Employees | % Employees |
| Private Company Employees | 588 | 93.5% |
| Self-Employed (Incorporated) | 0 | 0.0% |
| Self-Employed (Not Incorporated) | 0 | 0.0% |
| Not-for-profit Organizations | 0 | 0.0% |
| Local Government Employees | 41 | 6.5% |
| State Government Employees | 0 | 0.0% |
| Federal Government Employees | 0 | 0.0% |
| Unpaid Family Workers | 0 | 0.0% |
| Total | 629 | 100.0% |
Employment Status by Age in Porter Heights
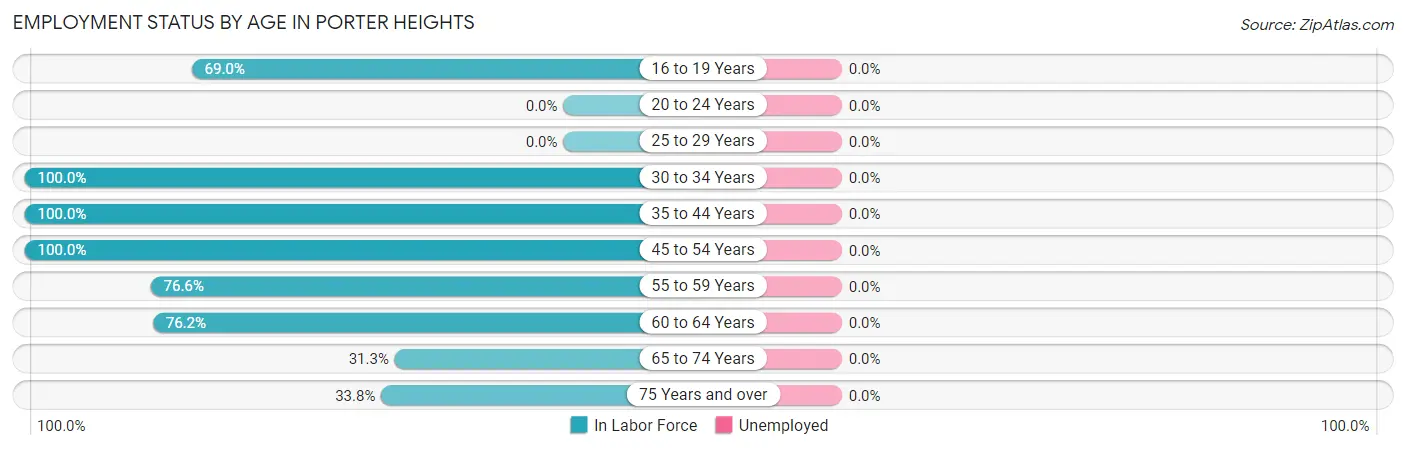
| Age Bracket | In Labor Force | Unemployed |
| 16 to 19 Years | 78 (69.0%) | 0 (0.0%) |
| 20 to 24 Years | 0 (0.0%) | 0 (0.0%) |
| 25 to 29 Years | 0 (0.0%) | 0 (0.0%) |
| 30 to 34 Years | 56 (100.0%) | 0 (0.0%) |
| 35 to 44 Years | 35 (100.0%) | 0 (0.0%) |
| 45 to 54 Years | 113 (100.0%) | 0 (0.0%) |
| 55 to 59 Years | 164 (76.6%) | 0 (0.0%) |
| 60 to 64 Years | 115 (76.2%) | 0 (0.0%) |
| 65 to 74 Years | 20 (31.3%) | 0 (0.0%) |
| 75 Years and over | 48 (33.8%) | 0 (0.0%) |
| Total | 629 (70.8%) | 0 (0.0%) |
Employment Status by Educational Attainment in Porter Heights
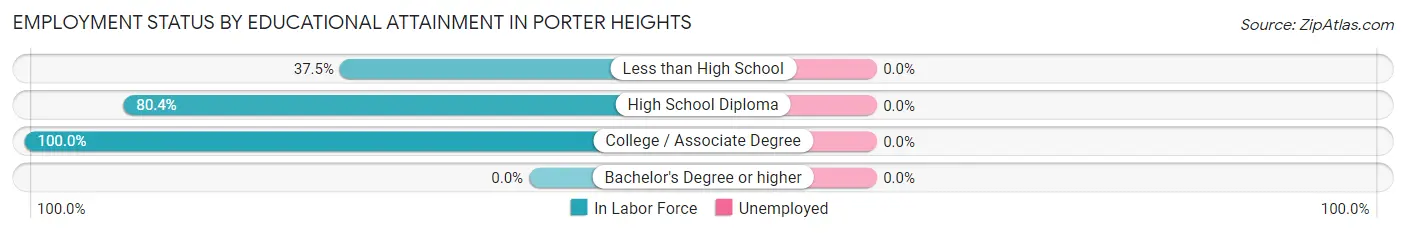
| Educational Attainment | In Labor Force | Unemployed |
| Less than High School | 30 (37.5%) | 0 (0.0%) |
| High School Diploma | 148 (80.4%) | 0 (0.0%) |
| College / Associate Degree | 305 (100.0%) | 0 (0.0%) |
| Bachelor's Degree or higher | 0 (0.0%) | 0 (0.0%) |
| Total | 483 (84.9%) | 0 (0.0%) |
Employment Occupations by Sex in Porter Heights
Management, Business, Science and Arts Occupations
The most common Management, Business, Science and Arts occupations in Porter Heights are , and Management (115 | 18.3%).
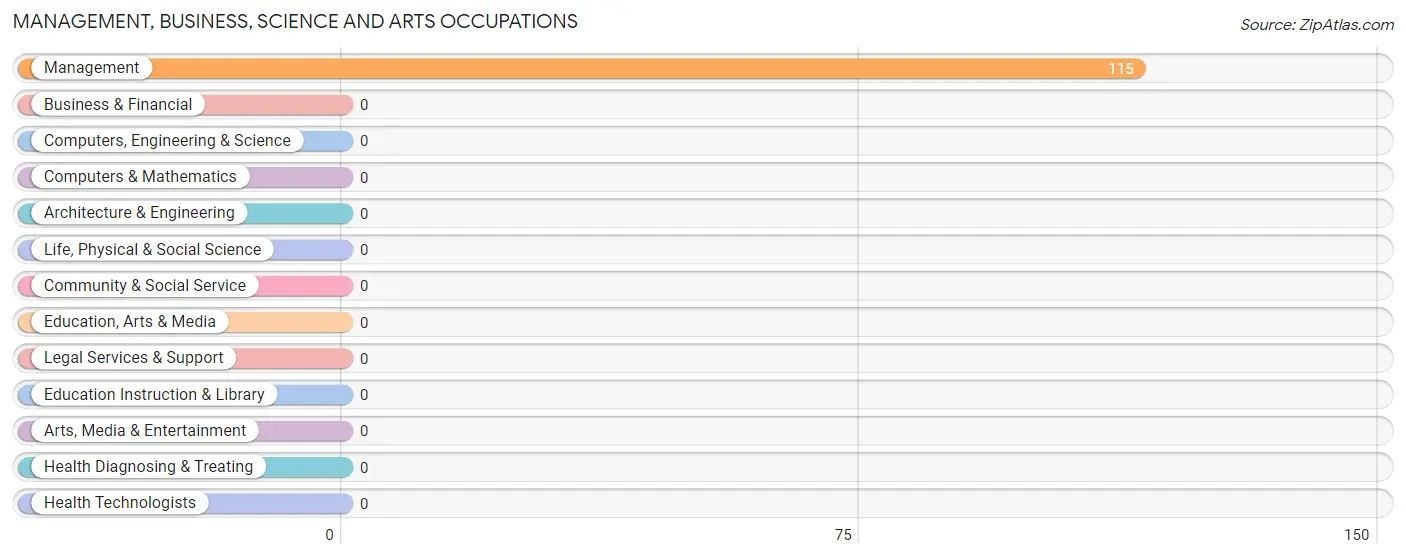
Management, Business, Science and Arts Occupations by Sex
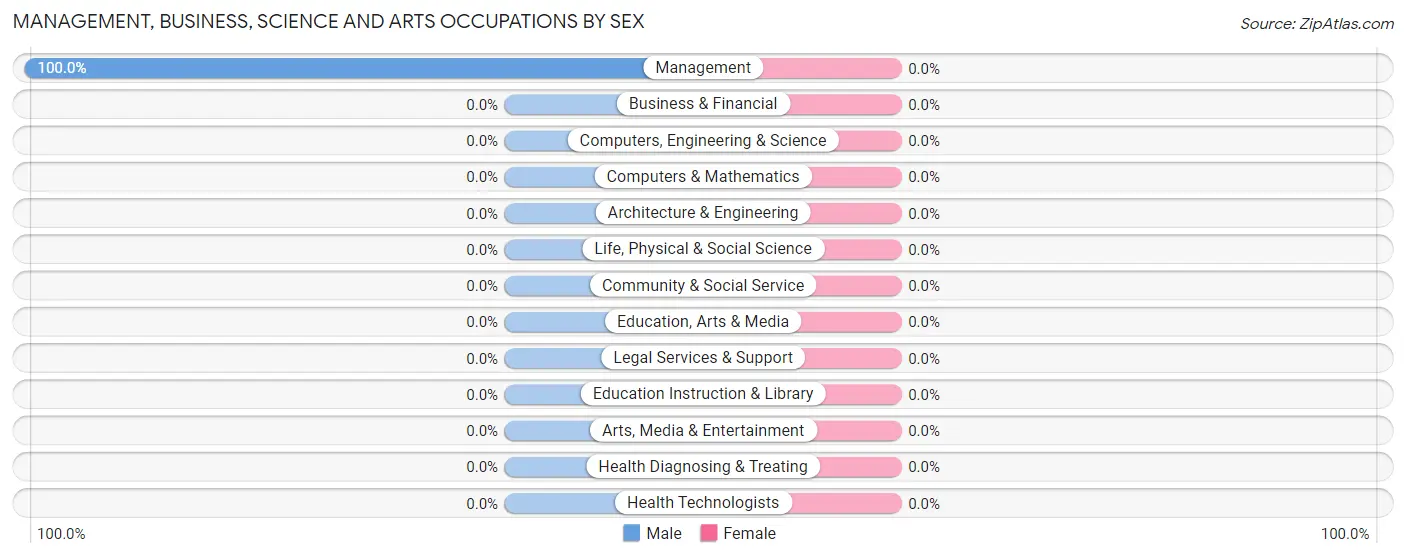
| Occupation | Male | Female |
| Management | 115 (100.0%) | 0 (0.0%) |
| Business & Financial | 0 (0.0%) | 0 (0.0%) |
| Computers, Engineering & Science | 0 (0.0%) | 0 (0.0%) |
| Computers & Mathematics | 0 (0.0%) | 0 (0.0%) |
| Architecture & Engineering | 0 (0.0%) | 0 (0.0%) |
| Life, Physical & Social Science | 0 (0.0%) | 0 (0.0%) |
| Community & Social Service | 0 (0.0%) | 0 (0.0%) |
| Education, Arts & Media | 0 (0.0%) | 0 (0.0%) |
| Legal Services & Support | 0 (0.0%) | 0 (0.0%) |
| Education Instruction & Library | 0 (0.0%) | 0 (0.0%) |
| Arts, Media & Entertainment | 0 (0.0%) | 0 (0.0%) |
| Health Diagnosing & Treating | 0 (0.0%) | 0 (0.0%) |
| Health Technologists | 0 (0.0%) | 0 (0.0%) |
| Total (Category) | 115 (100.0%) | 0 (0.0%) |
| Total (Overall) | 423 (67.2%) | 206 (32.8%) |
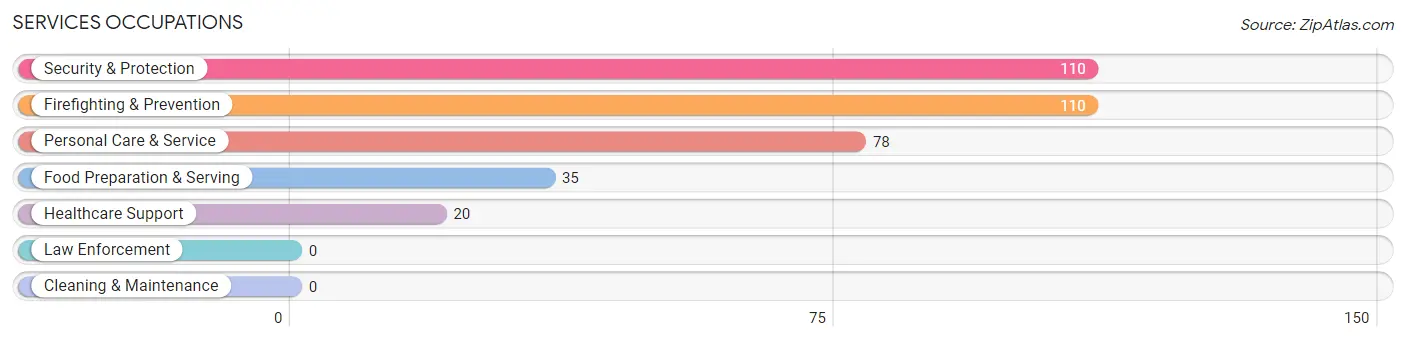
Services Occupations
The most common Services occupations in Porter Heights are Security & Protection (110 | 17.5%), Firefighting & Prevention (110 | 17.5%), Personal Care & Service (78 | 12.4%), Food Preparation & Serving (35 | 5.6%), and Healthcare Support (20 | 3.2%).
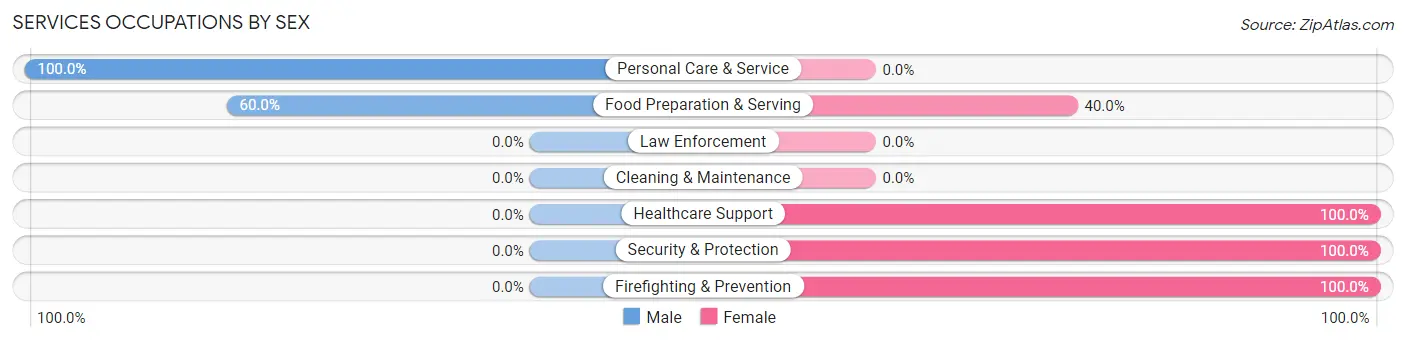
Services Occupations by Sex
Within the Services occupations in Porter Heights, the most male-oriented occupations are Personal Care & Service (100.0%), and Food Preparation & Serving (60.0%), while the most female-oriented occupations are Healthcare Support (100.0%), Security & Protection (100.0%), and Firefighting & Prevention (100.0%).
| Occupation | Male | Female |
| Healthcare Support | 0 (0.0%) | 20 (100.0%) |
| Security & Protection | 0 (0.0%) | 110 (100.0%) |
| Firefighting & Prevention | 0 (0.0%) | 110 (100.0%) |
| Law Enforcement | 0 (0.0%) | 0 (0.0%) |
| Food Preparation & Serving | 21 (60.0%) | 14 (40.0%) |
| Cleaning & Maintenance | 0 (0.0%) | 0 (0.0%) |
| Personal Care & Service | 78 (100.0%) | 0 (0.0%) |
| Total (Category) | 99 (40.7%) | 144 (59.3%) |
| Total (Overall) | 423 (67.2%) | 206 (32.8%) |
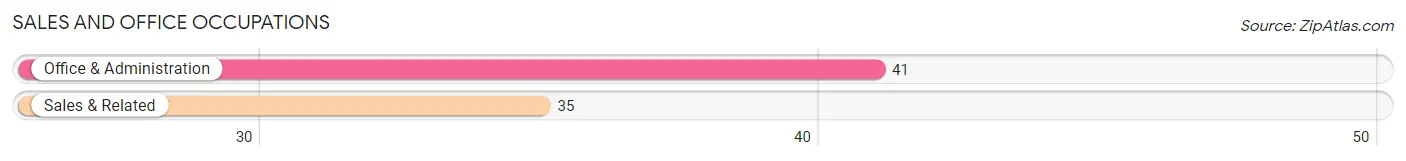
Sales and Office Occupations
The most common Sales and Office occupations in Porter Heights are Office & Administration (41 | 6.5%), and Sales & Related (35 | 5.6%).
Sales and Office Occupations by Sex

| Occupation | Male | Female |
| Sales & Related | 35 (100.0%) | 0 (0.0%) |
| Office & Administration | 0 (0.0%) | 41 (100.0%) |
| Total (Category) | 35 (46.1%) | 41 (53.9%) |
| Total (Overall) | 423 (67.2%) | 206 (32.8%) |
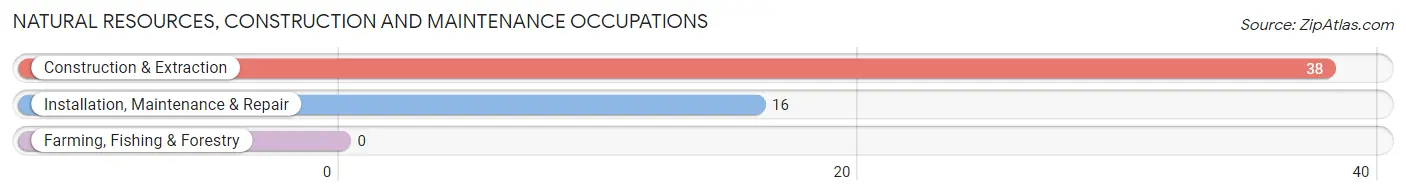
Natural Resources, Construction and Maintenance Occupations
The most common Natural Resources, Construction and Maintenance occupations in Porter Heights are Construction & Extraction (38 | 6.0%), and Installation, Maintenance & Repair (16 | 2.5%).
Natural Resources, Construction and Maintenance Occupations by Sex
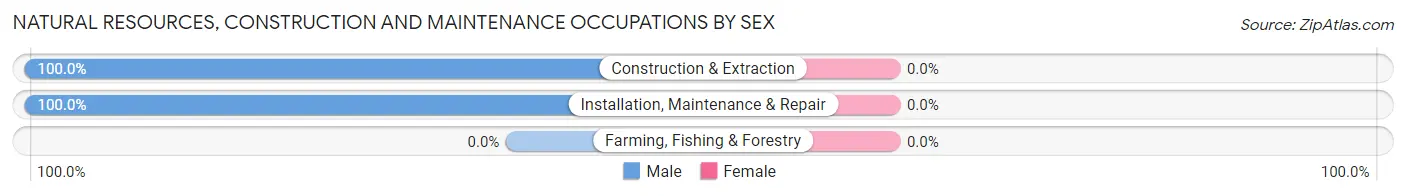
| Occupation | Male | Female |
| Farming, Fishing & Forestry | 0 (0.0%) | 0 (0.0%) |
| Construction & Extraction | 38 (100.0%) | 0 (0.0%) |
| Installation, Maintenance & Repair | 16 (100.0%) | 0 (0.0%) |
| Total (Category) | 54 (100.0%) | 0 (0.0%) |
| Total (Overall) | 423 (67.2%) | 206 (32.8%) |
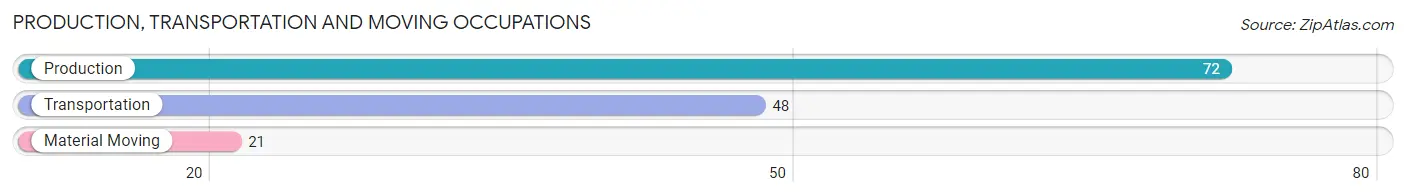
Production, Transportation and Moving Occupations
The most common Production, Transportation and Moving occupations in Porter Heights are Production (72 | 11.5%), Transportation (48 | 7.6%), and Material Moving (21 | 3.3%).
Production, Transportation and Moving Occupations by Sex
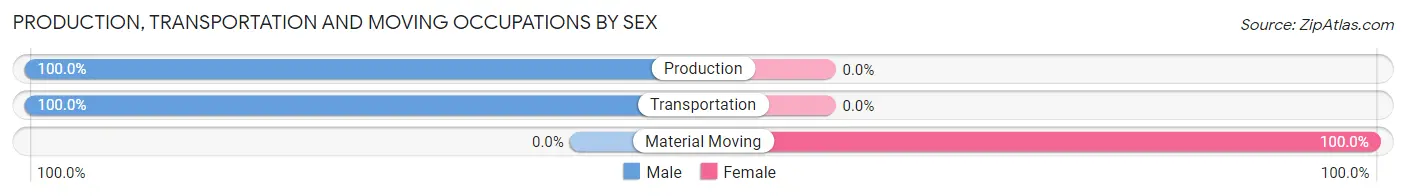
| Occupation | Male | Female |
| Production | 72 (100.0%) | 0 (0.0%) |
| Transportation | 48 (100.0%) | 0 (0.0%) |
| Material Moving | 0 (0.0%) | 21 (100.0%) |
| Total (Category) | 120 (85.1%) | 21 (14.9%) |
| Total (Overall) | 423 (67.2%) | 206 (32.8%) |
Employment Industries by Sex in Porter Heights
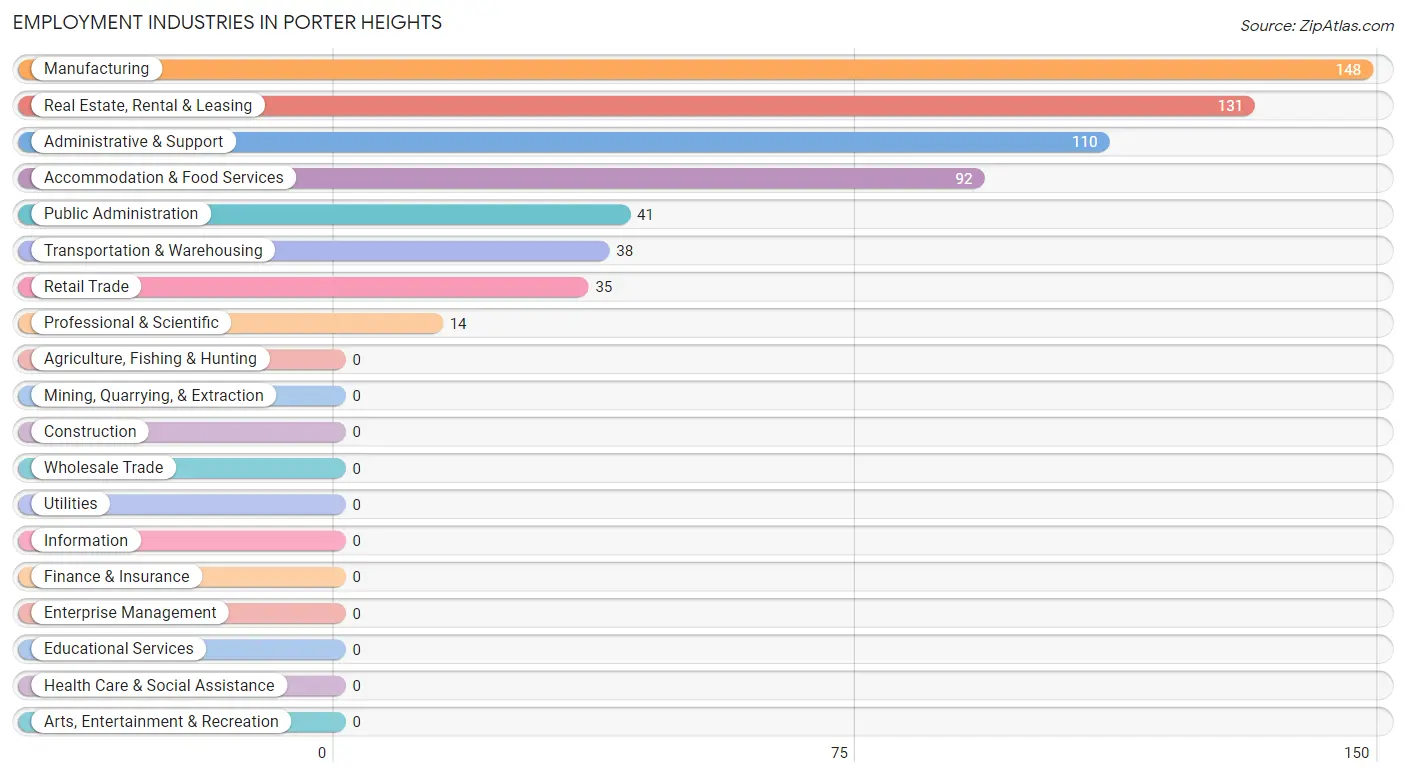
Employment Industries in Porter Heights
The major employment industries in Porter Heights include Manufacturing (148 | 23.5%), Real Estate, Rental & Leasing (131 | 20.8%), Administrative & Support (110 | 17.5%), Accommodation & Food Services (92 | 14.6%), and Public Administration (41 | 6.5%).
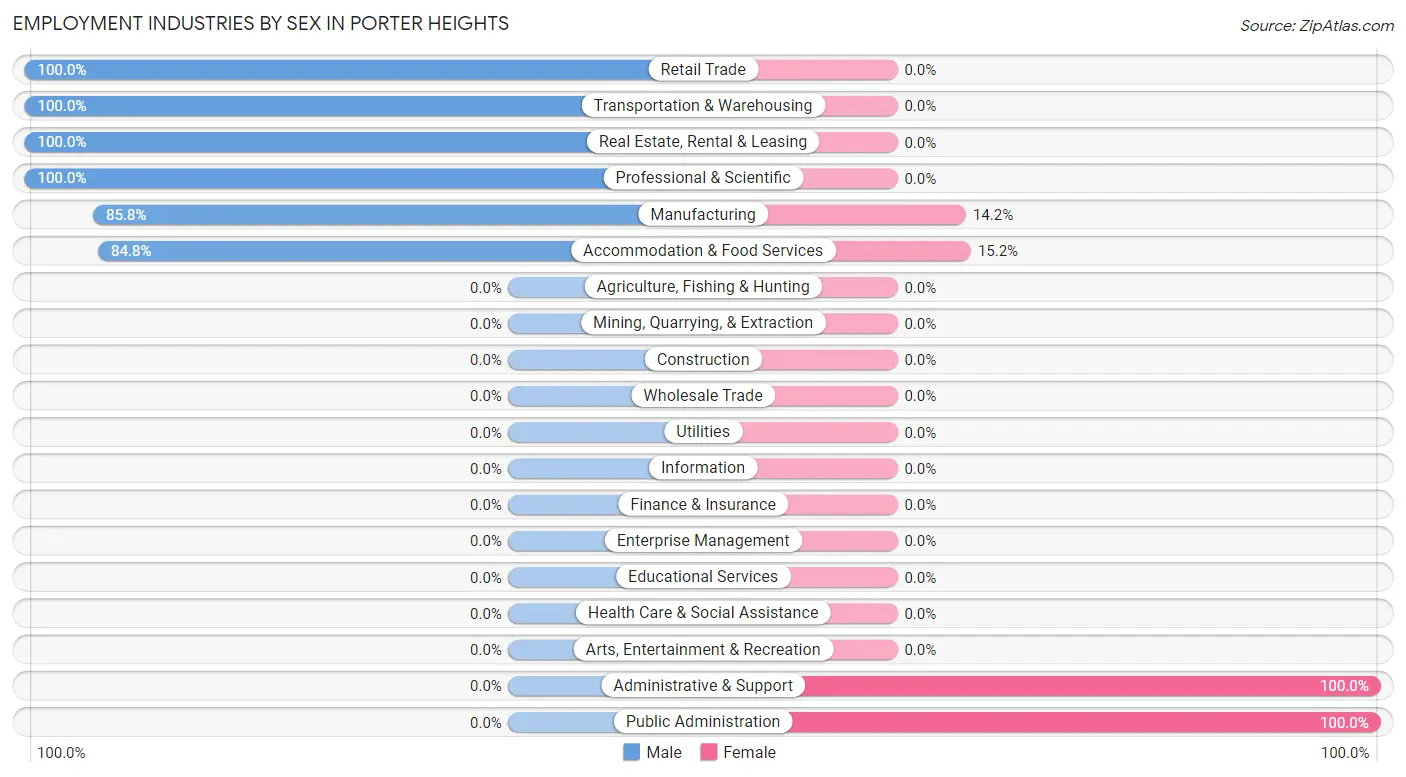
Employment Industries by Sex in Porter Heights
The Porter Heights industries that see more men than women are Retail Trade (100.0%), Transportation & Warehousing (100.0%), and Real Estate, Rental & Leasing (100.0%), whereas the industries that tend to have a higher number of women are Administrative & Support (100.0%), Public Administration (100.0%), and Accommodation & Food Services (15.2%).
| Industry | Male | Female |
| Agriculture, Fishing & Hunting | 0 (0.0%) | 0 (0.0%) |
| Mining, Quarrying, & Extraction | 0 (0.0%) | 0 (0.0%) |
| Construction | 0 (0.0%) | 0 (0.0%) |
| Manufacturing | 127 (85.8%) | 21 (14.2%) |
| Wholesale Trade | 0 (0.0%) | 0 (0.0%) |
| Retail Trade | 35 (100.0%) | 0 (0.0%) |
| Transportation & Warehousing | 38 (100.0%) | 0 (0.0%) |
| Utilities | 0 (0.0%) | 0 (0.0%) |
| Information | 0 (0.0%) | 0 (0.0%) |
| Finance & Insurance | 0 (0.0%) | 0 (0.0%) |
| Real Estate, Rental & Leasing | 131 (100.0%) | 0 (0.0%) |
| Professional & Scientific | 14 (100.0%) | 0 (0.0%) |
| Enterprise Management | 0 (0.0%) | 0 (0.0%) |
| Administrative & Support | 0 (0.0%) | 110 (100.0%) |
| Educational Services | 0 (0.0%) | 0 (0.0%) |
| Health Care & Social Assistance | 0 (0.0%) | 0 (0.0%) |
| Arts, Entertainment & Recreation | 0 (0.0%) | 0 (0.0%) |
| Accommodation & Food Services | 78 (84.8%) | 14 (15.2%) |
| Public Administration | 0 (0.0%) | 41 (100.0%) |
| Total | 423 (67.2%) | 206 (32.8%) |
Education in Porter Heights
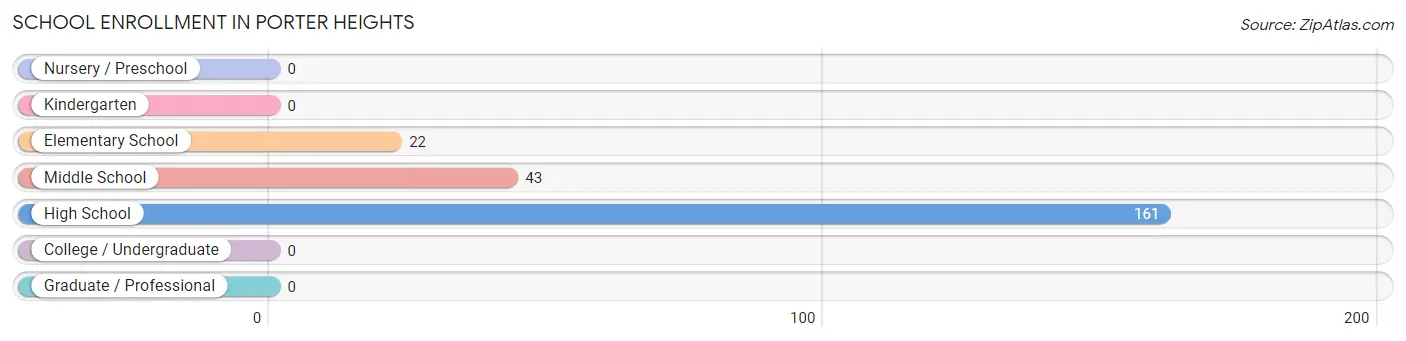
School Enrollment in Porter Heights
The most common levels of schooling among the 226 students in Porter Heights are high school (161 | 71.2%), middle school (43 | 19.0%), and elementary school (22 | 9.7%).
| School Level | # Students | % Students |
| Nursery / Preschool | 0 | 0.0% |
| Kindergarten | 0 | 0.0% |
| Elementary School | 22 | 9.7% |
| Middle School | 43 | 19.0% |
| High School | 161 | 71.2% |
| College / Undergraduate | 0 | 0.0% |
| Graduate / Professional | 0 | 0.0% |
| Total | 226 | 100.0% |
School Enrollment by Age by Funding Source in Porter Heights
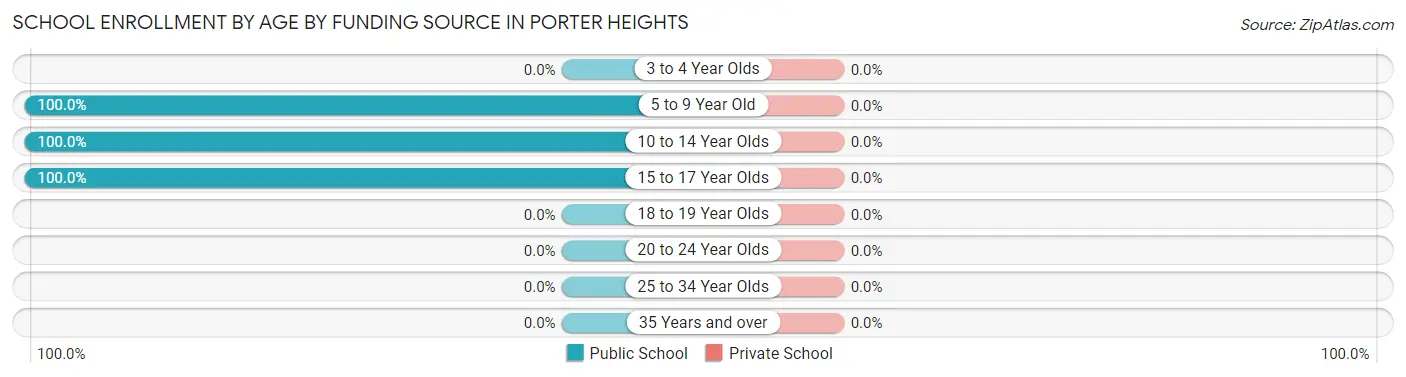
| Age Bracket | Public School | Private School |
| 3 to 4 Year Olds | 0 (0.0%) | 0 (0.0%) |
| 5 to 9 Year Old | 22 (100.0%) | 0 (0.0%) |
| 10 to 14 Year Olds | 43 (100.0%) | 0 (0.0%) |
| 15 to 17 Year Olds | 161 (100.0%) | 0 (0.0%) |
| 18 to 19 Year Olds | 0 (0.0%) | 0 (0.0%) |
| 20 to 24 Year Olds | 0 (0.0%) | 0 (0.0%) |
| 25 to 34 Year Olds | 0 (0.0%) | 0 (0.0%) |
| 35 Years and over | 0 (0.0%) | 0 (0.0%) |
| Total | 226 (100.0%) | 0 (0.0%) |
Educational Attainment by Field of Study in Porter Heights
, and education (36 | 100.0%) are the most common fields of study among 36 individuals in Porter Heights who have obtained a bachelor's degree or higher.
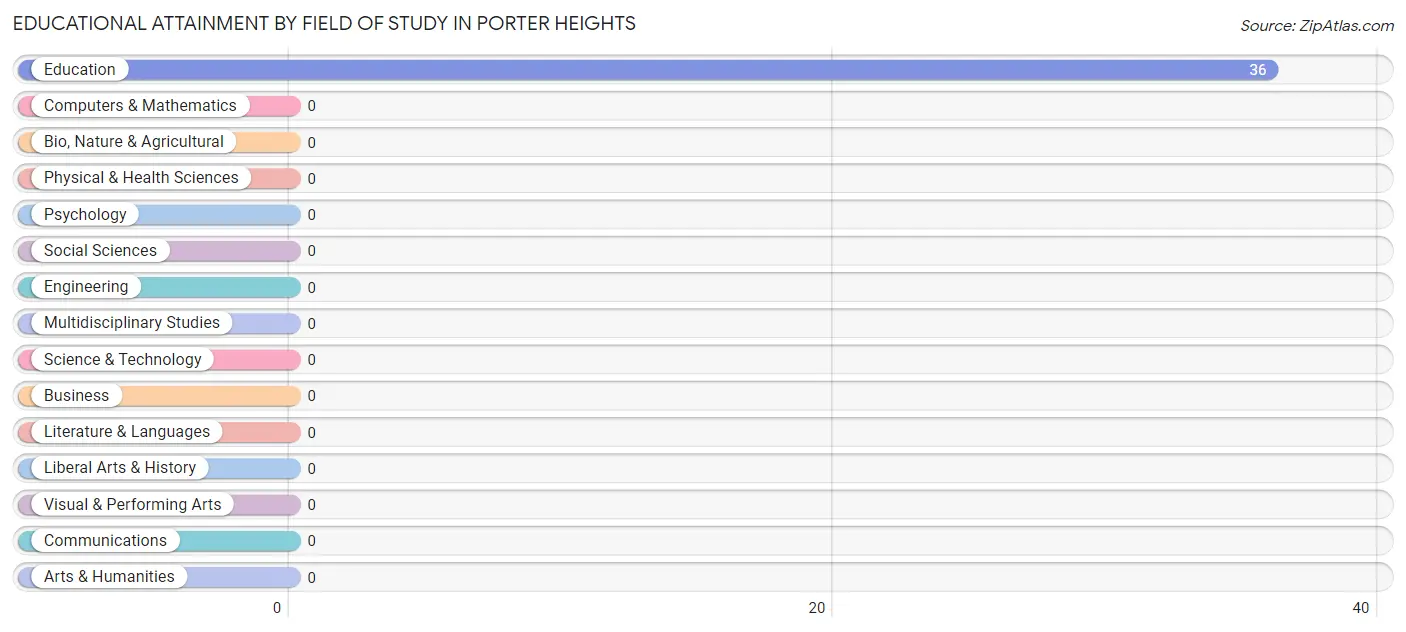
| Field of Study | # Graduates | % Graduates |
| Computers & Mathematics | 0 | 0.0% |
| Bio, Nature & Agricultural | 0 | 0.0% |
| Physical & Health Sciences | 0 | 0.0% |
| Psychology | 0 | 0.0% |
| Social Sciences | 0 | 0.0% |
| Engineering | 0 | 0.0% |
| Multidisciplinary Studies | 0 | 0.0% |
| Science & Technology | 0 | 0.0% |
| Business | 0 | 0.0% |
| Education | 36 | 100.0% |
| Literature & Languages | 0 | 0.0% |
| Liberal Arts & History | 0 | 0.0% |
| Visual & Performing Arts | 0 | 0.0% |
| Communications | 0 | 0.0% |
| Arts & Humanities | 0 | 0.0% |
| Total | 36 | 100.0% |
Transportation & Commute in Porter Heights
Vehicle Availability by Sex in Porter Heights
The most prevalent vehicle ownership categories in Porter Heights are males with 2 vehicles (204, accounting for 48.2%) and females with 2 vehicles (144, making up 99.0%).
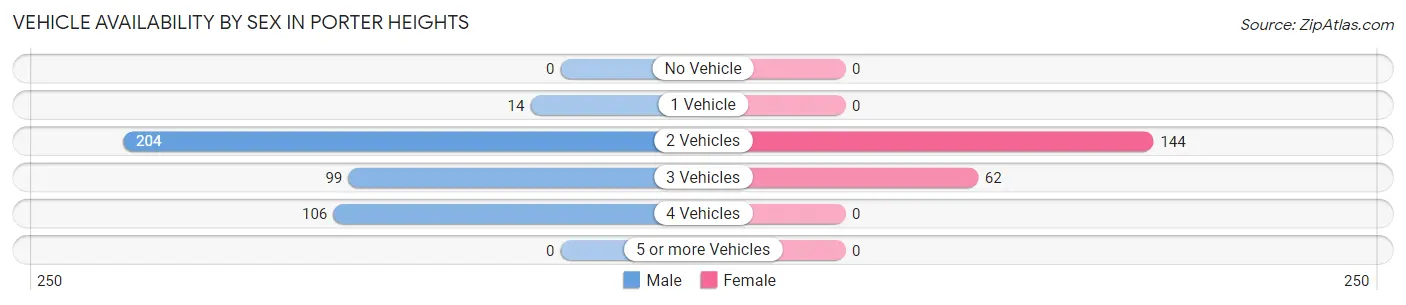
| Vehicles Available | Male | Female |
| No Vehicle | 0 (0.0%) | 0 (0.0%) |
| 1 Vehicle | 14 (3.3%) | 0 (0.0%) |
| 2 Vehicles | 204 (48.2%) | 144 (69.9%) |
| 3 Vehicles | 99 (23.4%) | 62 (30.1%) |
| 4 Vehicles | 106 (25.1%) | 0 (0.0%) |
| 5 or more Vehicles | 0 (0.0%) | 0 (0.0%) |
| Total | 423 (100.0%) | 206 (100.0%) |
Commute Time in Porter Heights
The most frequently occuring commute durations in Porter Heights are 30 to 34 minutes (248 commuters, 40.3%), 45 to 59 minutes (110 commuters, 17.9%), and 20 to 24 minutes (72 commuters, 11.7%).
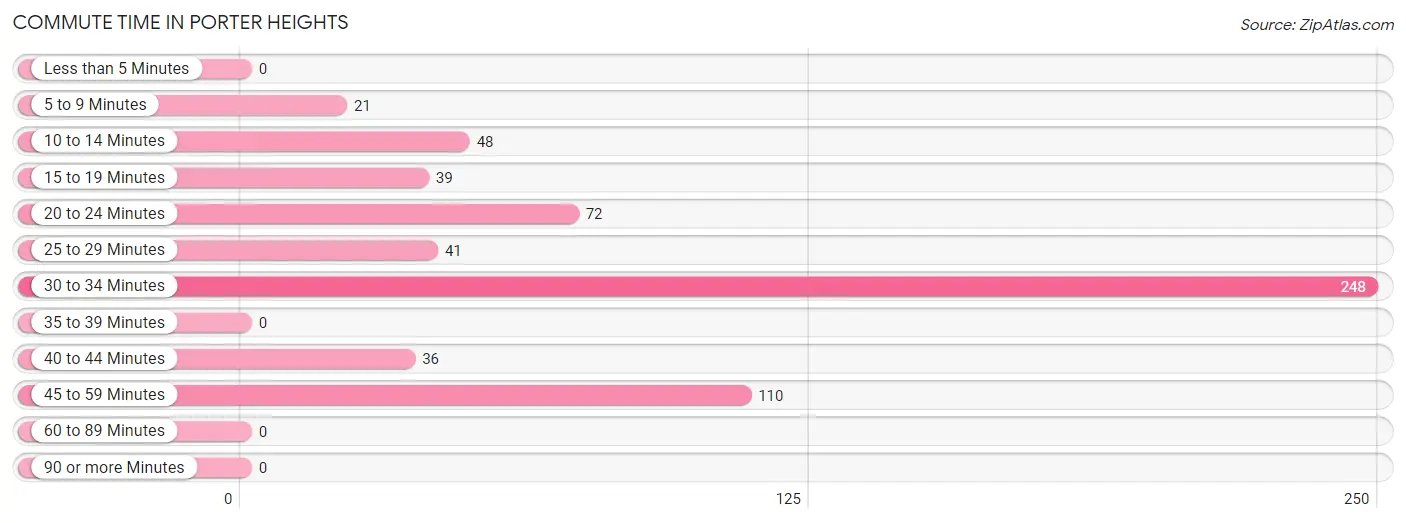
| Commute Time | # Commuters | % Commuters |
| Less than 5 Minutes | 0 | 0.0% |
| 5 to 9 Minutes | 21 | 3.4% |
| 10 to 14 Minutes | 48 | 7.8% |
| 15 to 19 Minutes | 39 | 6.3% |
| 20 to 24 Minutes | 72 | 11.7% |
| 25 to 29 Minutes | 41 | 6.7% |
| 30 to 34 Minutes | 248 | 40.3% |
| 35 to 39 Minutes | 0 | 0.0% |
| 40 to 44 Minutes | 36 | 5.9% |
| 45 to 59 Minutes | 110 | 17.9% |
| 60 to 89 Minutes | 0 | 0.0% |
| 90 or more Minutes | 0 | 0.0% |
Commute Time by Sex in Porter Heights
The most common commute times in Porter Heights are 30 to 34 minutes (248 commuters, 60.6%) for males and 45 to 59 minutes (110 commuters, 53.4%) for females.
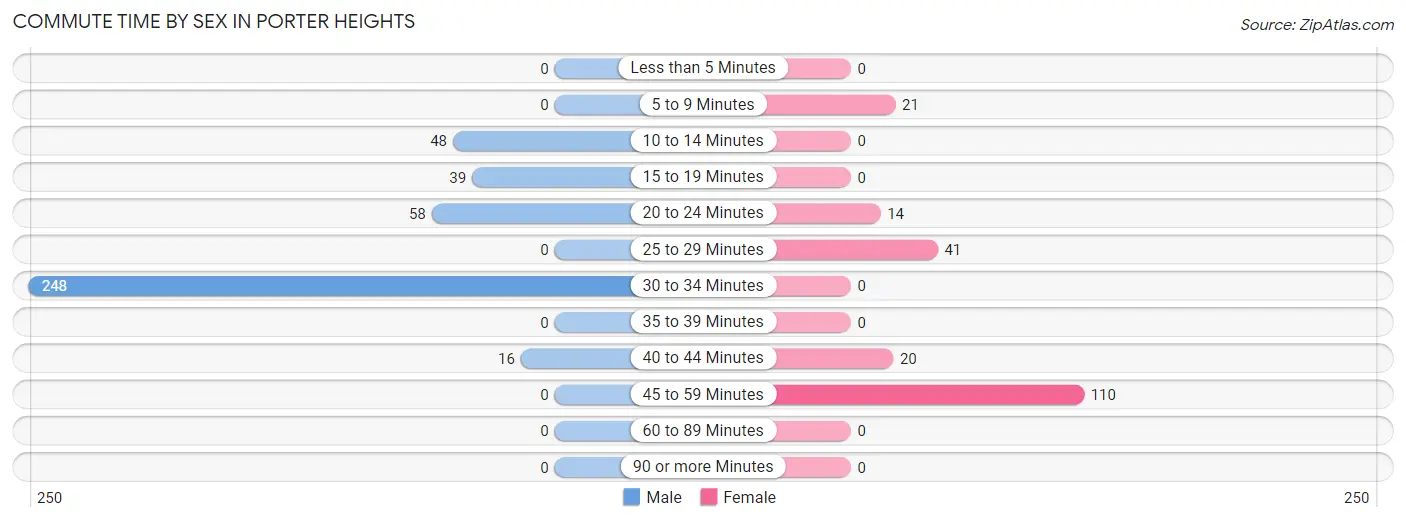
| Commute Time | Male | Female |
| Less than 5 Minutes | 0 (0.0%) | 0 (0.0%) |
| 5 to 9 Minutes | 0 (0.0%) | 21 (10.2%) |
| 10 to 14 Minutes | 48 (11.7%) | 0 (0.0%) |
| 15 to 19 Minutes | 39 (9.5%) | 0 (0.0%) |
| 20 to 24 Minutes | 58 (14.2%) | 14 (6.8%) |
| 25 to 29 Minutes | 0 (0.0%) | 41 (19.9%) |
| 30 to 34 Minutes | 248 (60.6%) | 0 (0.0%) |
| 35 to 39 Minutes | 0 (0.0%) | 0 (0.0%) |
| 40 to 44 Minutes | 16 (3.9%) | 20 (9.7%) |
| 45 to 59 Minutes | 0 (0.0%) | 110 (53.4%) |
| 60 to 89 Minutes | 0 (0.0%) | 0 (0.0%) |
| 90 or more Minutes | 0 (0.0%) | 0 (0.0%) |
Time of Departure to Work by Sex in Porter Heights
The most frequent times of departure to work in Porter Heights are 8:00 AM to 8:29 AM (222, 54.3%) for males and 12:00 AM to 4:59 AM (124, 60.2%) for females.
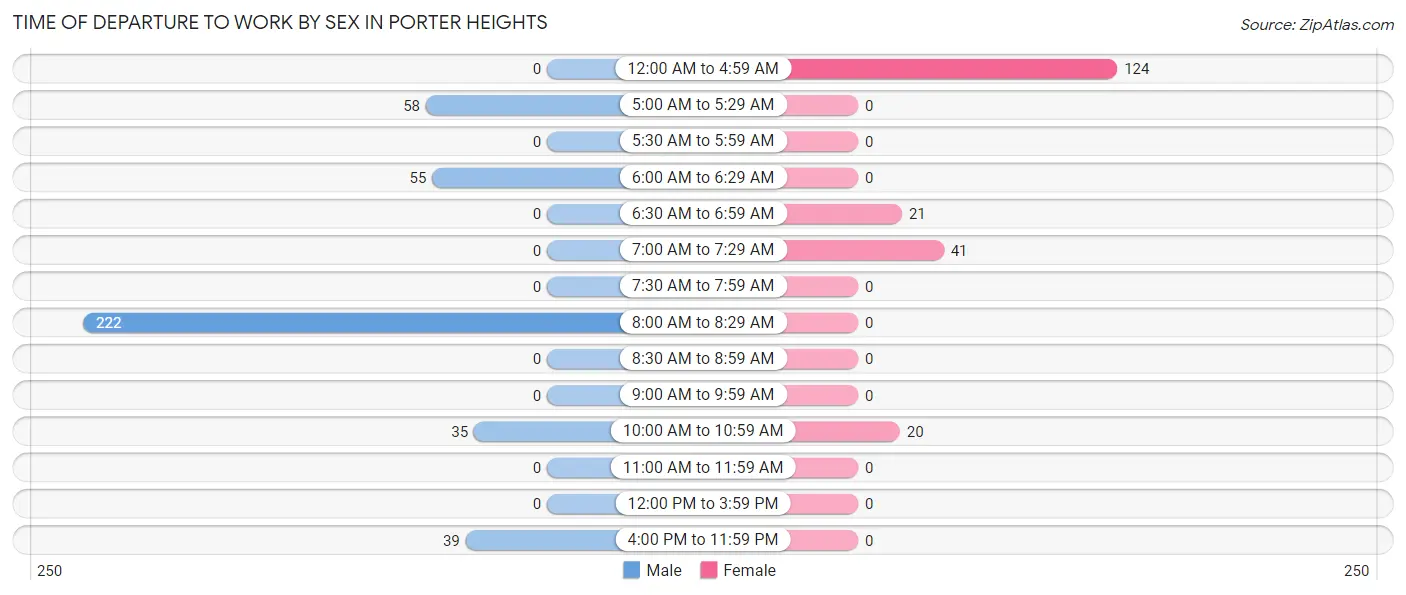
| Time of Departure | Male | Female |
| 12:00 AM to 4:59 AM | 0 (0.0%) | 124 (60.2%) |
| 5:00 AM to 5:29 AM | 58 (14.2%) | 0 (0.0%) |
| 5:30 AM to 5:59 AM | 0 (0.0%) | 0 (0.0%) |
| 6:00 AM to 6:29 AM | 55 (13.5%) | 0 (0.0%) |
| 6:30 AM to 6:59 AM | 0 (0.0%) | 21 (10.2%) |
| 7:00 AM to 7:29 AM | 0 (0.0%) | 41 (19.9%) |
| 7:30 AM to 7:59 AM | 0 (0.0%) | 0 (0.0%) |
| 8:00 AM to 8:29 AM | 222 (54.3%) | 0 (0.0%) |
| 8:30 AM to 8:59 AM | 0 (0.0%) | 0 (0.0%) |
| 9:00 AM to 9:59 AM | 0 (0.0%) | 0 (0.0%) |
| 10:00 AM to 10:59 AM | 35 (8.6%) | 20 (9.7%) |
| 11:00 AM to 11:59 AM | 0 (0.0%) | 0 (0.0%) |
| 12:00 PM to 3:59 PM | 0 (0.0%) | 0 (0.0%) |
| 4:00 PM to 11:59 PM | 39 (9.5%) | 0 (0.0%) |
| Total | 409 (100.0%) | 206 (100.0%) |
Housing Occupancy in Porter Heights
Occupancy by Ownership in Porter Heights
Of the total 400 dwellings in Porter Heights, owner-occupied units account for 379 (94.8%), while renter-occupied units make up 21 (5.2%).
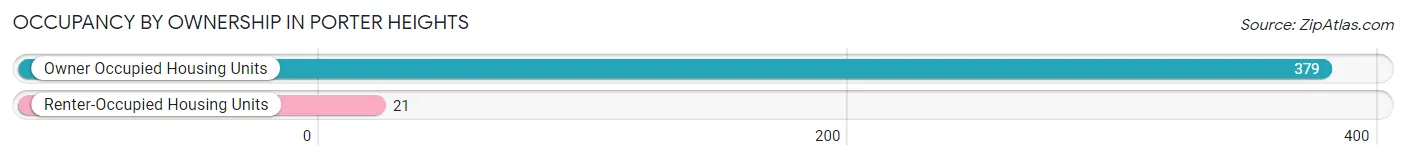
| Occupancy | # Housing Units | % Housing Units |
| Owner Occupied Housing Units | 379 | 94.8% |
| Renter-Occupied Housing Units | 21 | 5.2% |
| Total Occupied Housing Units | 400 | 100.0% |
Occupancy by Household Size in Porter Heights
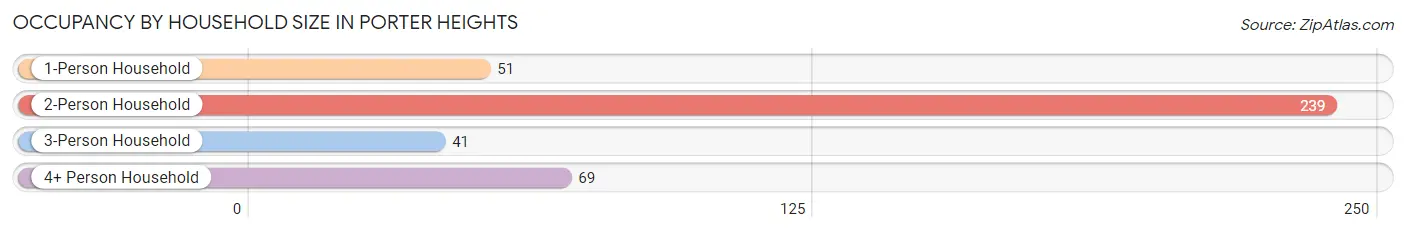
| Household Size | # Housing Units | % Housing Units |
| 1-Person Household | 51 | 12.8% |
| 2-Person Household | 239 | 59.8% |
| 3-Person Household | 41 | 10.2% |
| 4+ Person Household | 69 | 17.2% |
| Total Housing Units | 400 | 100.0% |
Occupancy by Ownership by Household Size in Porter Heights
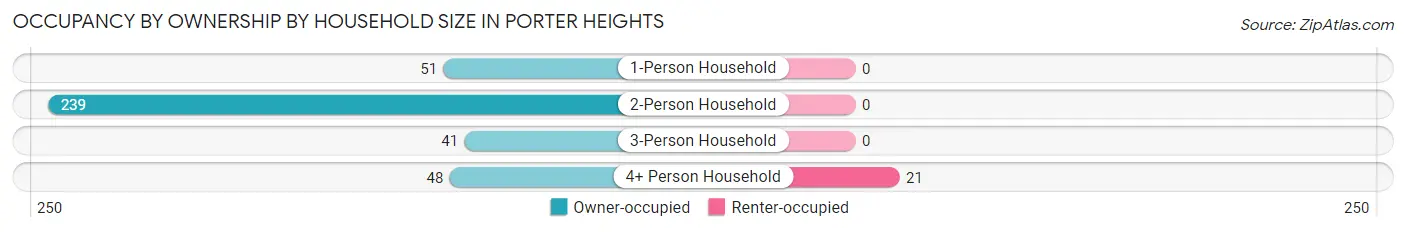
| Household Size | Owner-occupied | Renter-occupied |
| 1-Person Household | 51 (100.0%) | 0 (0.0%) |
| 2-Person Household | 239 (100.0%) | 0 (0.0%) |
| 3-Person Household | 41 (100.0%) | 0 (0.0%) |
| 4+ Person Household | 48 (69.6%) | 21 (30.4%) |
| Total Housing Units | 379 (94.8%) | 21 (5.2%) |
Occupancy by Educational Attainment in Porter Heights
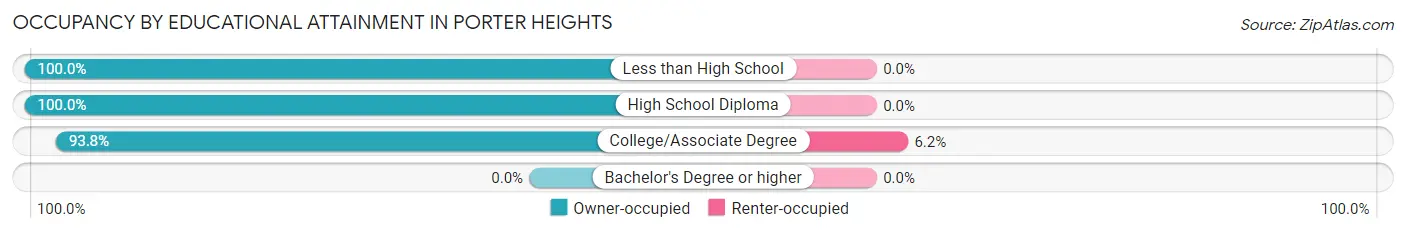
| Household Size | Owner-occupied | Renter-occupied |
| Less than High School | 16 (100.0%) | 0 (0.0%) |
| High School Diploma | 46 (100.0%) | 0 (0.0%) |
| College/Associate Degree | 317 (93.8%) | 21 (6.2%) |
| Bachelor's Degree or higher | 0 (0.0%) | 0 (0.0%) |
Occupancy by Age of Householder in Porter Heights
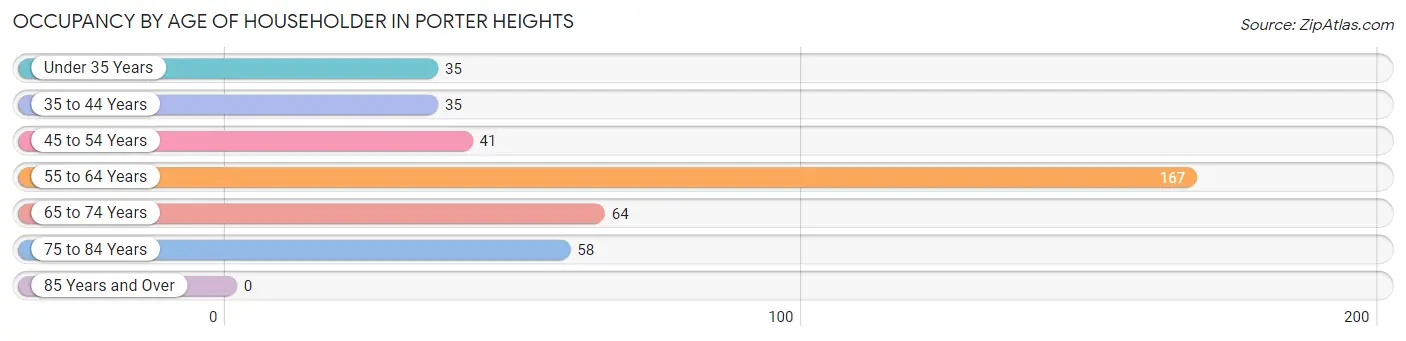
| Age Bracket | # Households | % Households |
| Under 35 Years | 35 | 8.7% |
| 35 to 44 Years | 35 | 8.7% |
| 45 to 54 Years | 41 | 10.2% |
| 55 to 64 Years | 167 | 41.7% |
| 65 to 74 Years | 64 | 16.0% |
| 75 to 84 Years | 58 | 14.5% |
| 85 Years and Over | 0 | 0.0% |
| Total | 400 | 100.0% |
Housing Finances in Porter Heights
Median Income by Occupancy in Porter Heights
| Occupancy Type | # Households | Median Income |
| Owner-Occupied | 379 (94.8%) | $0 |
| Renter-Occupied | 21 (5.2%) | $0 |
| Average | 400 (100.0%) | $0 |
Occupancy by Householder Income Bracket in Porter Heights
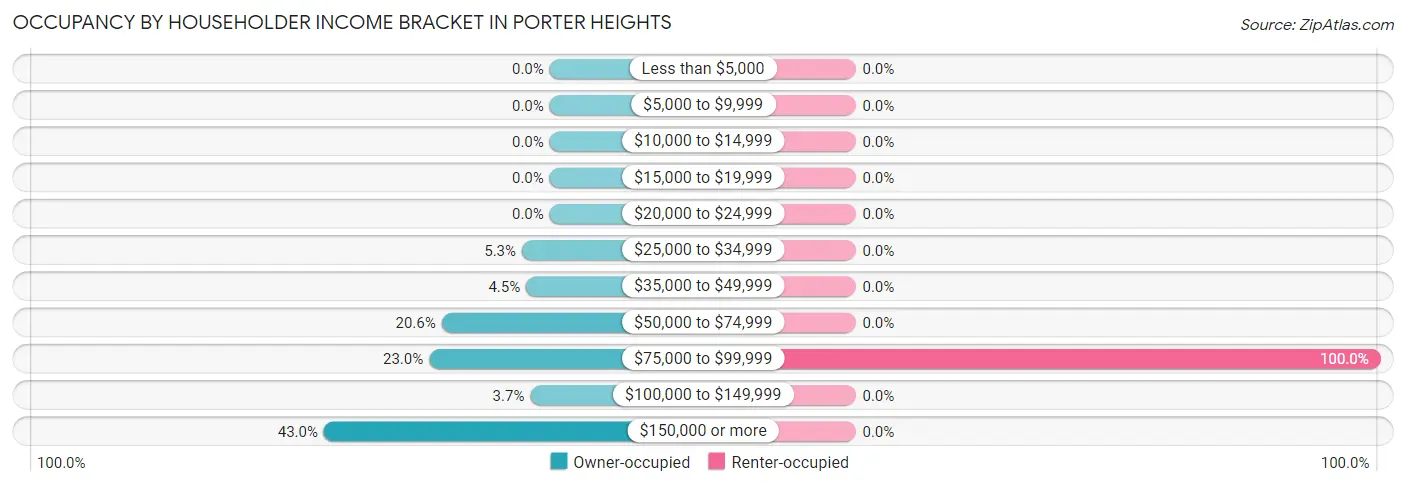
| Income Bracket | Owner-occupied | Renter-occupied |
| Less than $5,000 | 0 (0.0%) | 0 (0.0%) |
| $5,000 to $9,999 | 0 (0.0%) | 0 (0.0%) |
| $10,000 to $14,999 | 0 (0.0%) | 0 (0.0%) |
| $15,000 to $19,999 | 0 (0.0%) | 0 (0.0%) |
| $20,000 to $24,999 | 0 (0.0%) | 0 (0.0%) |
| $25,000 to $34,999 | 20 (5.3%) | 0 (0.0%) |
| $35,000 to $49,999 | 17 (4.5%) | 0 (0.0%) |
| $50,000 to $74,999 | 78 (20.6%) | 0 (0.0%) |
| $75,000 to $99,999 | 87 (23.0%) | 21 (100.0%) |
| $100,000 to $149,999 | 14 (3.7%) | 0 (0.0%) |
| $150,000 or more | 163 (43.0%) | 0 (0.0%) |
| Total | 379 (100.0%) | 21 (100.0%) |
Monthly Housing Cost Tiers in Porter Heights
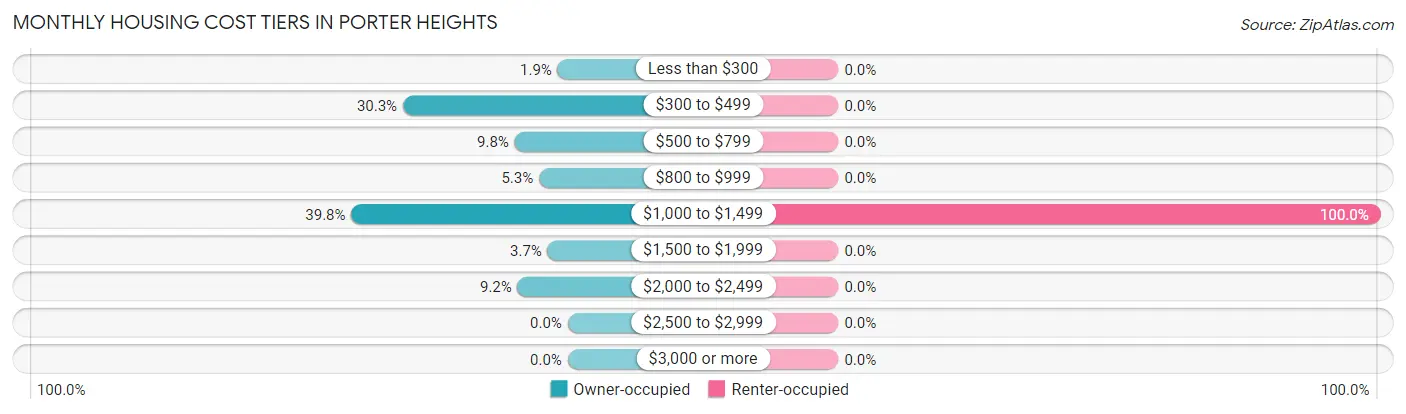
| Monthly Cost | Owner-occupied | Renter-occupied |
| Less than $300 | 7 (1.8%) | 0 (0.0%) |
| $300 to $499 | 115 (30.3%) | 0 (0.0%) |
| $500 to $799 | 37 (9.8%) | 0 (0.0%) |
| $800 to $999 | 20 (5.3%) | 0 (0.0%) |
| $1,000 to $1,499 | 151 (39.8%) | 21 (100.0%) |
| $1,500 to $1,999 | 14 (3.7%) | 0 (0.0%) |
| $2,000 to $2,499 | 35 (9.2%) | 0 (0.0%) |
| $2,500 to $2,999 | 0 (0.0%) | 0 (0.0%) |
| $3,000 or more | 0 (0.0%) | 0 (0.0%) |
| Total | 379 (100.0%) | 21 (100.0%) |
Physical Housing Characteristics in Porter Heights
Housing Structures in Porter Heights
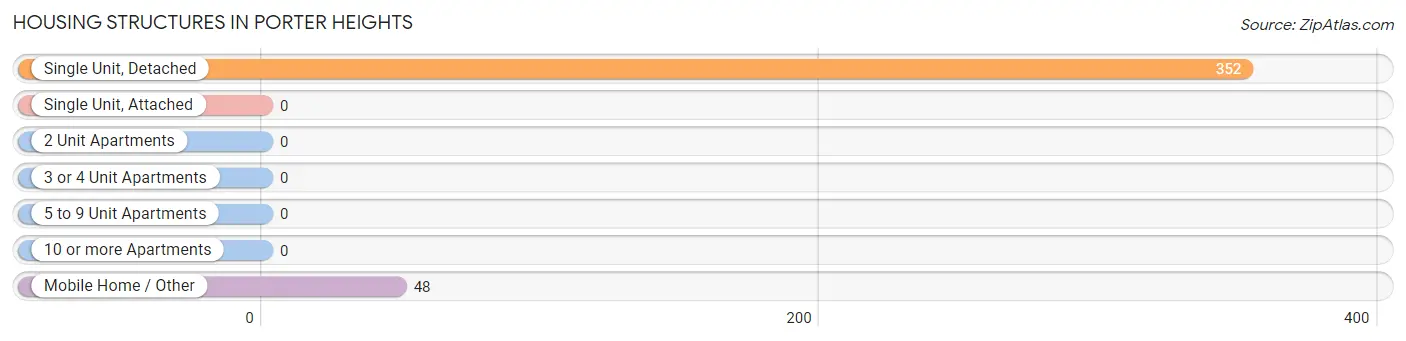
| Structure Type | # Housing Units | % Housing Units |
| Single Unit, Detached | 352 | 88.0% |
| Single Unit, Attached | 0 | 0.0% |
| 2 Unit Apartments | 0 | 0.0% |
| 3 or 4 Unit Apartments | 0 | 0.0% |
| 5 to 9 Unit Apartments | 0 | 0.0% |
| 10 or more Apartments | 0 | 0.0% |
| Mobile Home / Other | 48 | 12.0% |
| Total | 400 | 100.0% |
Housing Structures by Occupancy in Porter Heights
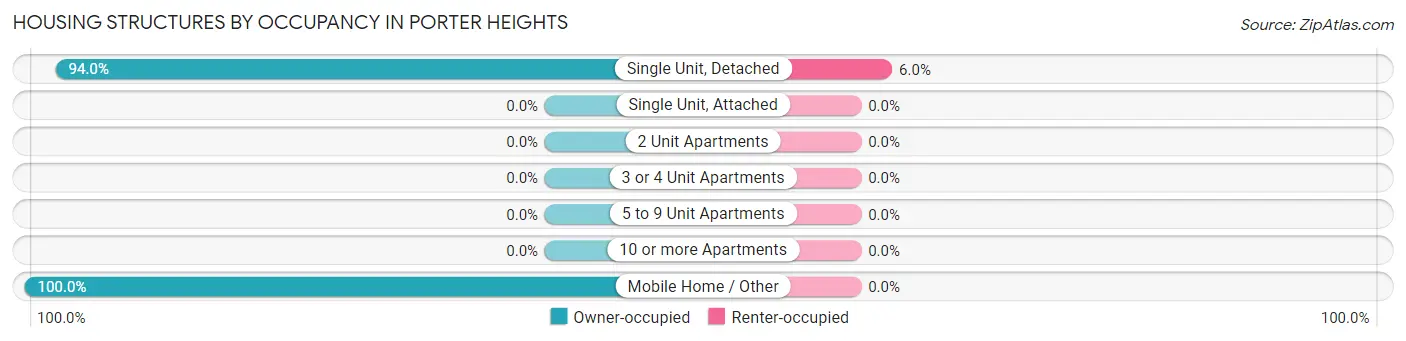
| Structure Type | Owner-occupied | Renter-occupied |
| Single Unit, Detached | 331 (94.0%) | 21 (6.0%) |
| Single Unit, Attached | 0 (0.0%) | 0 (0.0%) |
| 2 Unit Apartments | 0 (0.0%) | 0 (0.0%) |
| 3 or 4 Unit Apartments | 0 (0.0%) | 0 (0.0%) |
| 5 to 9 Unit Apartments | 0 (0.0%) | 0 (0.0%) |
| 10 or more Apartments | 0 (0.0%) | 0 (0.0%) |
| Mobile Home / Other | 48 (100.0%) | 0 (0.0%) |
| Total | 379 (94.8%) | 21 (5.2%) |
Housing Structures by Number of Rooms in Porter Heights
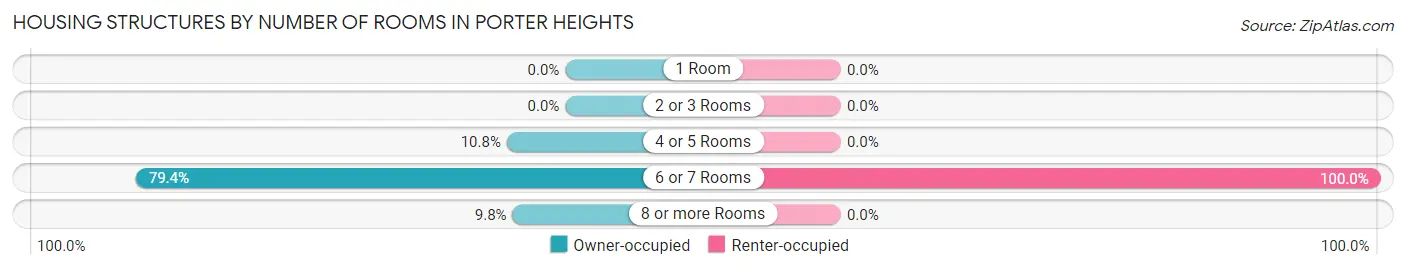
| Number of Rooms | Owner-occupied | Renter-occupied |
| 1 Room | 0 (0.0%) | 0 (0.0%) |
| 2 or 3 Rooms | 0 (0.0%) | 0 (0.0%) |
| 4 or 5 Rooms | 41 (10.8%) | 0 (0.0%) |
| 6 or 7 Rooms | 301 (79.4%) | 21 (100.0%) |
| 8 or more Rooms | 37 (9.8%) | 0 (0.0%) |
| Total | 379 (100.0%) | 21 (100.0%) |
Housing Structure by Heating Type in Porter Heights
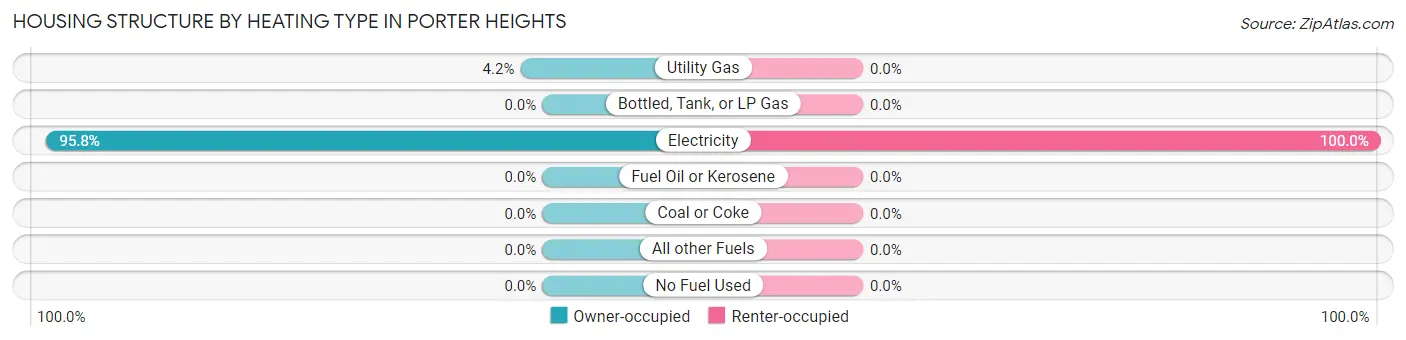
| Heating Type | Owner-occupied | Renter-occupied |
| Utility Gas | 16 (4.2%) | 0 (0.0%) |
| Bottled, Tank, or LP Gas | 0 (0.0%) | 0 (0.0%) |
| Electricity | 363 (95.8%) | 21 (100.0%) |
| Fuel Oil or Kerosene | 0 (0.0%) | 0 (0.0%) |
| Coal or Coke | 0 (0.0%) | 0 (0.0%) |
| All other Fuels | 0 (0.0%) | 0 (0.0%) |
| No Fuel Used | 0 (0.0%) | 0 (0.0%) |
| Total | 379 (100.0%) | 21 (100.0%) |
Household Vehicle Usage in Porter Heights
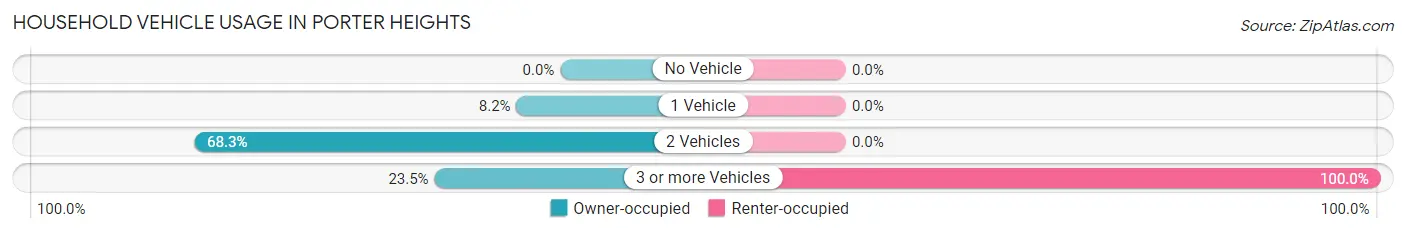
| Vehicles per Household | Owner-occupied | Renter-occupied |
| No Vehicle | 0 (0.0%) | 0 (0.0%) |
| 1 Vehicle | 31 (8.2%) | 0 (0.0%) |
| 2 Vehicles | 259 (68.3%) | 0 (0.0%) |
| 3 or more Vehicles | 89 (23.5%) | 21 (100.0%) |
| Total | 379 (100.0%) | 21 (100.0%) |
Real Estate & Mortgages in Porter Heights
Real Estate and Mortgage Overview in Porter Heights
| Characteristic | Without Mortgage | With Mortgage |
| Housing Units | 159 | 220 |
| Median Property Value | $190,800 | $209,200 |
| Median Household Income | $250,001 | $48 |
| Monthly Housing Costs | $463 | $0 |
| Real Estate Taxes | $2,309 | $0 |
Property Value by Mortgage Status in Porter Heights
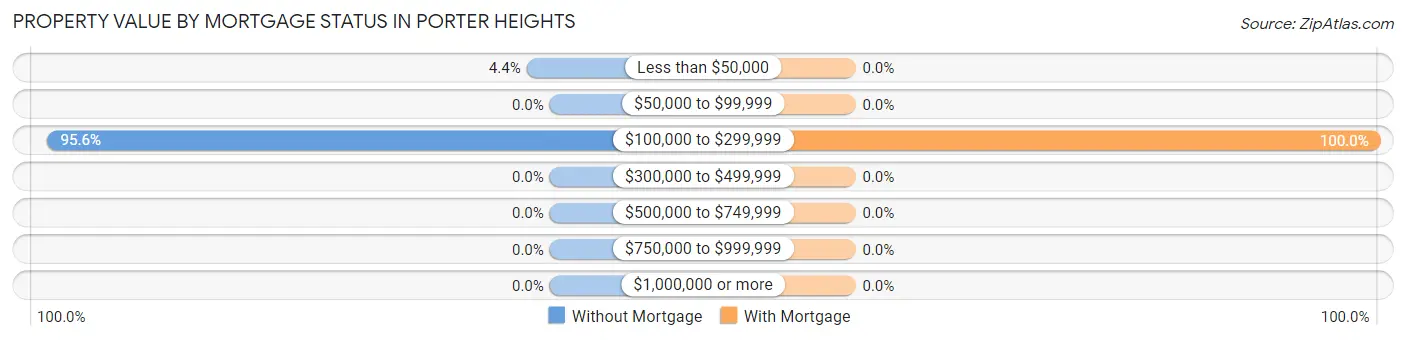
| Property Value | Without Mortgage | With Mortgage |
| Less than $50,000 | 7 (4.4%) | 0 (0.0%) |
| $50,000 to $99,999 | 0 (0.0%) | 0 (0.0%) |
| $100,000 to $299,999 | 152 (95.6%) | 220 (100.0%) |
| $300,000 to $499,999 | 0 (0.0%) | 0 (0.0%) |
| $500,000 to $749,999 | 0 (0.0%) | 0 (0.0%) |
| $750,000 to $999,999 | 0 (0.0%) | 0 (0.0%) |
| $1,000,000 or more | 0 (0.0%) | 0 (0.0%) |
| Total | 159 (100.0%) | 220 (100.0%) |
Household Income by Mortgage Status in Porter Heights
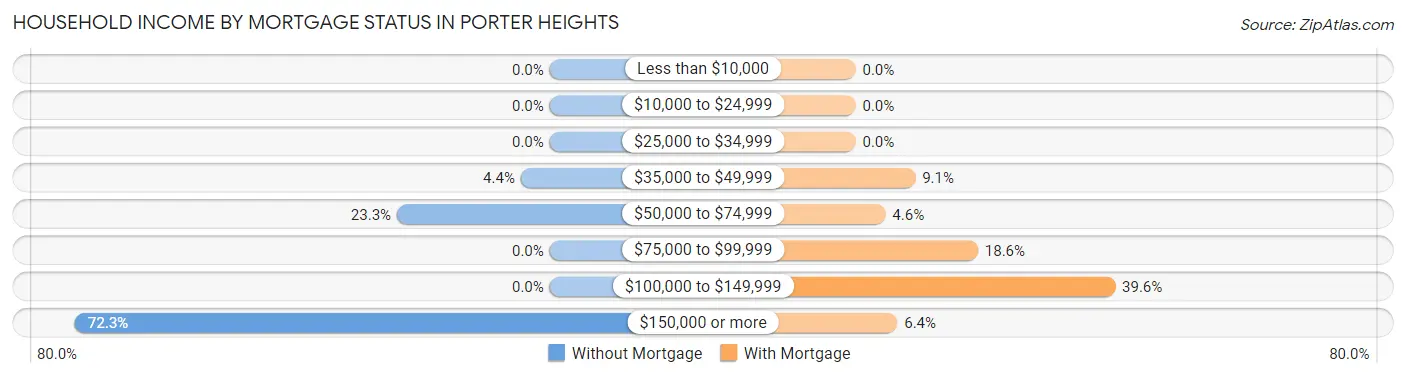
| Household Income | Without Mortgage | With Mortgage |
| Less than $10,000 | 0 (0.0%) | 0 (0.0%) |
| $10,000 to $24,999 | 0 (0.0%) | 0 (0.0%) |
| $25,000 to $34,999 | 0 (0.0%) | 0 (0.0%) |
| $35,000 to $49,999 | 7 (4.4%) | 20 (9.1%) |
| $50,000 to $74,999 | 37 (23.3%) | 10 (4.5%) |
| $75,000 to $99,999 | 0 (0.0%) | 41 (18.6%) |
| $100,000 to $149,999 | 0 (0.0%) | 87 (39.6%) |
| $150,000 or more | 115 (72.3%) | 14 (6.4%) |
| Total | 159 (100.0%) | 220 (100.0%) |
Property Value to Household Income Ratio in Porter Heights
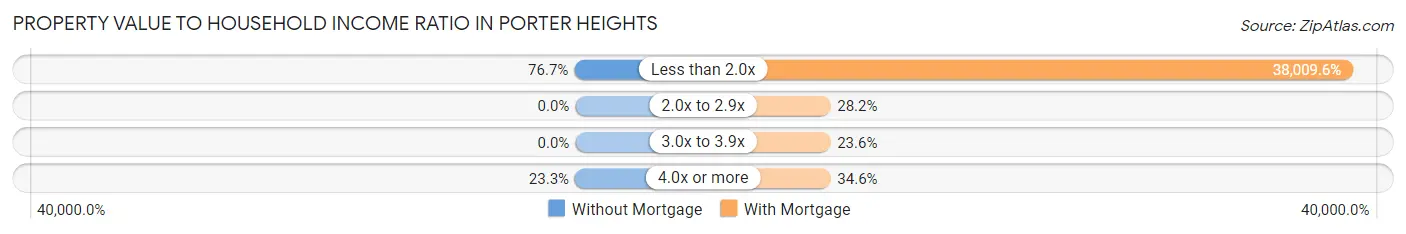
| Value-to-Income Ratio | Without Mortgage | With Mortgage |
| Less than 2.0x | 122 (76.7%) | 83,621 (38,009.6%) |
| 2.0x to 2.9x | 0 (0.0%) | 62 (28.2%) |
| 3.0x to 3.9x | 0 (0.0%) | 52 (23.6%) |
| 4.0x or more | 37 (23.3%) | 76 (34.5%) |
| Total | 159 (100.0%) | 220 (100.0%) |
Real Estate Taxes by Mortgage Status in Porter Heights
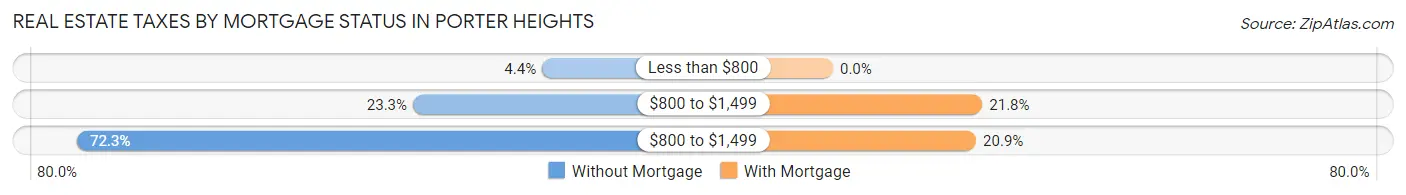
| Property Taxes | Without Mortgage | With Mortgage |
| Less than $800 | 7 (4.4%) | 0 (0.0%) |
| $800 to $1,499 | 37 (23.3%) | 48 (21.8%) |
| $800 to $1,499 | 115 (72.3%) | 46 (20.9%) |
| Total | 159 (100.0%) | 220 (100.0%) |
Health & Disability in Porter Heights
Health Insurance Coverage by Age in Porter Heights
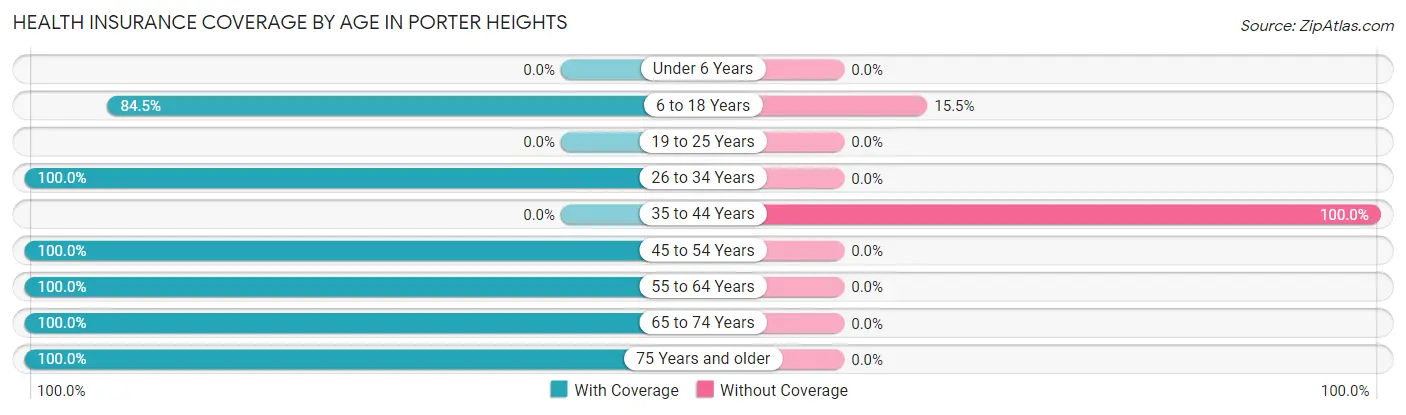
| Age Bracket | With Coverage | Without Coverage |
| Under 6 Years | 0 (0.0%) | 0 (0.0%) |
| 6 to 18 Years | 191 (84.5%) | 35 (15.5%) |
| 19 to 25 Years | 0 (0.0%) | 0 (0.0%) |
| 26 to 34 Years | 56 (100.0%) | 0 (0.0%) |
| 35 to 44 Years | 0 (0.0%) | 35 (100.0%) |
| 45 to 54 Years | 113 (100.0%) | 0 (0.0%) |
| 55 to 64 Years | 365 (100.0%) | 0 (0.0%) |
| 65 to 74 Years | 64 (100.0%) | 0 (0.0%) |
| 75 Years and older | 142 (100.0%) | 0 (0.0%) |
| Total | 931 (93.0%) | 70 (7.0%) |
Health Insurance Coverage by Citizenship Status in Porter Heights
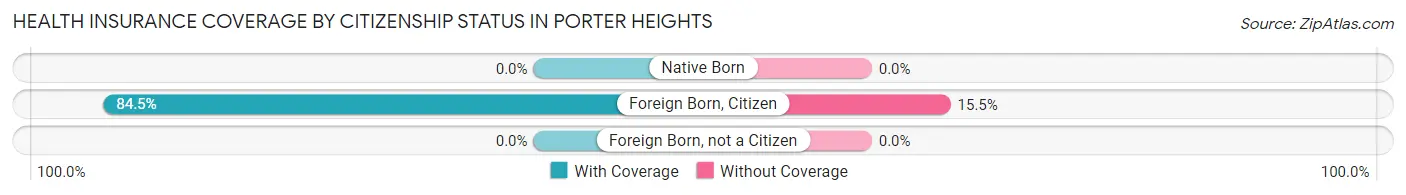
| Citizenship Status | With Coverage | Without Coverage |
| Native Born | 0 (0.0%) | 0 (0.0%) |
| Foreign Born, Citizen | 191 (84.5%) | 35 (15.5%) |
| Foreign Born, not a Citizen | 0 (0.0%) | 0 (0.0%) |
Health Insurance Coverage by Household Income in Porter Heights
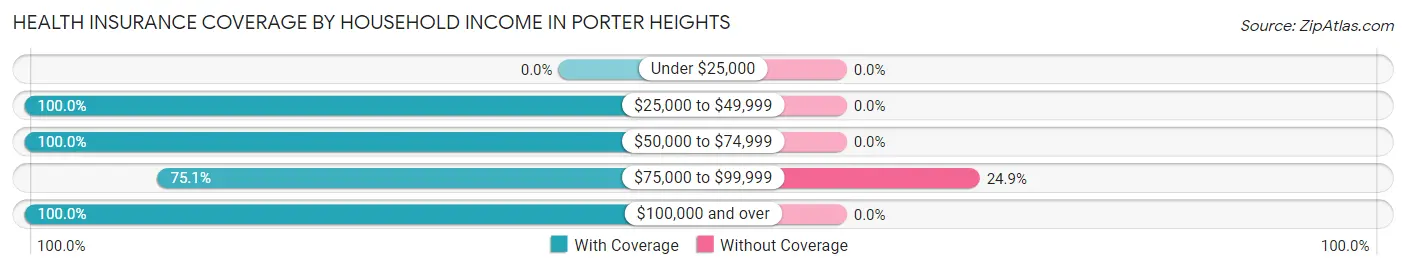
| Household Income | With Coverage | Without Coverage |
| Under $25,000 | 0 (0.0%) | 0 (0.0%) |
| $25,000 to $49,999 | 37 (100.0%) | 0 (0.0%) |
| $50,000 to $74,999 | 192 (100.0%) | 0 (0.0%) |
| $75,000 to $99,999 | 211 (75.1%) | 70 (24.9%) |
| $100,000 and over | 491 (100.0%) | 0 (0.0%) |
Public vs Private Health Insurance Coverage by Age in Porter Heights
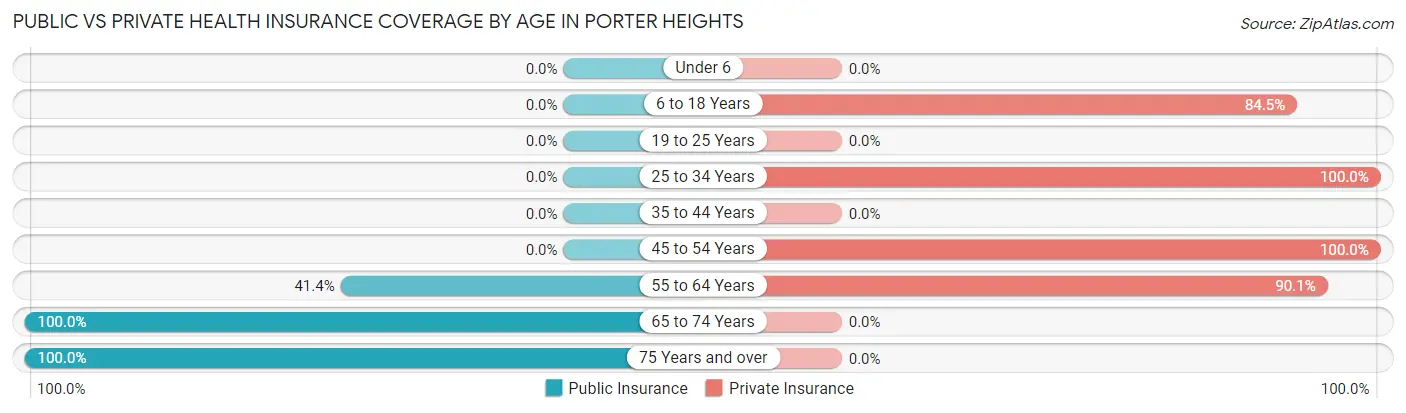
| Age Bracket | Public Insurance | Private Insurance |
| Under 6 | 0 (0.0%) | 0 (0.0%) |
| 6 to 18 Years | 0 (0.0%) | 191 (84.5%) |
| 19 to 25 Years | 0 (0.0%) | 0 (0.0%) |
| 25 to 34 Years | 0 (0.0%) | 56 (100.0%) |
| 35 to 44 Years | 0 (0.0%) | 0 (0.0%) |
| 45 to 54 Years | 0 (0.0%) | 113 (100.0%) |
| 55 to 64 Years | 151 (41.4%) | 329 (90.1%) |
| 65 to 74 Years | 64 (100.0%) | 0 (0.0%) |
| 75 Years and over | 142 (100.0%) | 0 (0.0%) |
| Total | 357 (35.7%) | 689 (68.8%) |
Disability Status by Sex by Age in Porter Heights
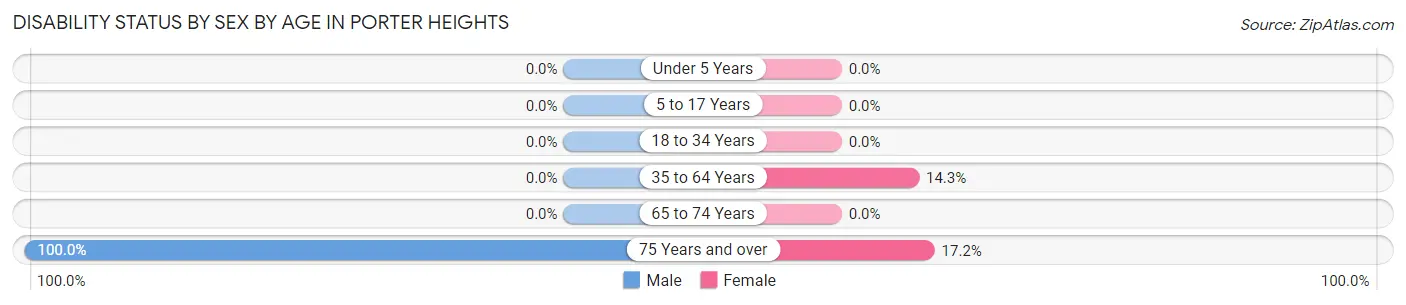
| Age Bracket | Male | Female |
| Under 5 Years | 0 (0.0%) | 0 (0.0%) |
| 5 to 17 Years | 0 (0.0%) | 0 (0.0%) |
| 18 to 34 Years | 0 (0.0%) | 0 (0.0%) |
| 35 to 64 Years | 0 (0.0%) | 36 (14.3%) |
| 65 to 74 Years | 0 (0.0%) | 0 (0.0%) |
| 75 Years and over | 84 (100.0%) | 10 (17.2%) |
Disability Class by Sex by Age in Porter Heights
Disability Class: Hearing Difficulty
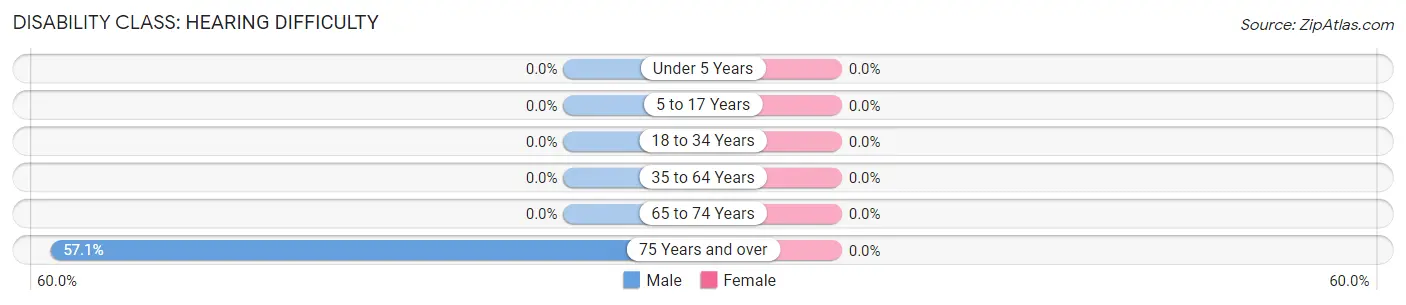
| Age Bracket | Male | Female |
| Under 5 Years | 0 (0.0%) | 0 (0.0%) |
| 5 to 17 Years | 0 (0.0%) | 0 (0.0%) |
| 18 to 34 Years | 0 (0.0%) | 0 (0.0%) |
| 35 to 64 Years | 0 (0.0%) | 0 (0.0%) |
| 65 to 74 Years | 0 (0.0%) | 0 (0.0%) |
| 75 Years and over | 48 (57.1%) | 0 (0.0%) |
Disability Class: Vision Difficulty
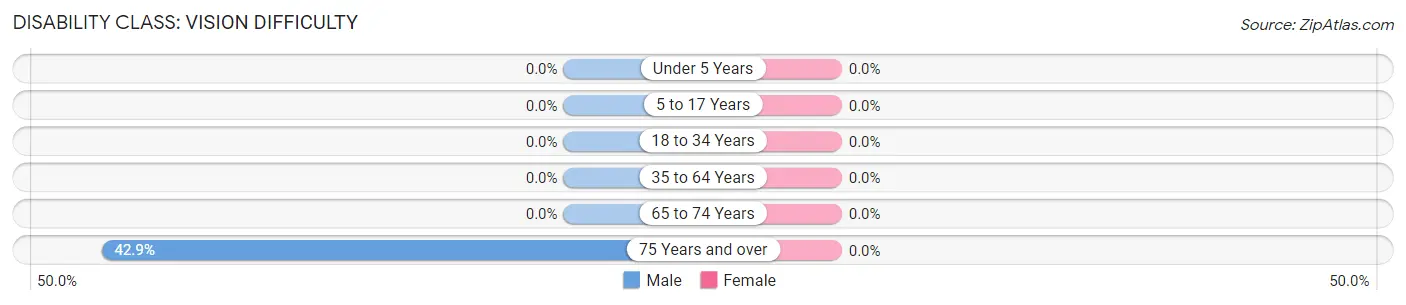
| Age Bracket | Male | Female |
| Under 5 Years | 0 (0.0%) | 0 (0.0%) |
| 5 to 17 Years | 0 (0.0%) | 0 (0.0%) |
| 18 to 34 Years | 0 (0.0%) | 0 (0.0%) |
| 35 to 64 Years | 0 (0.0%) | 0 (0.0%) |
| 65 to 74 Years | 0 (0.0%) | 0 (0.0%) |
| 75 Years and over | 36 (42.9%) | 0 (0.0%) |
Disability Class: Cognitive Difficulty
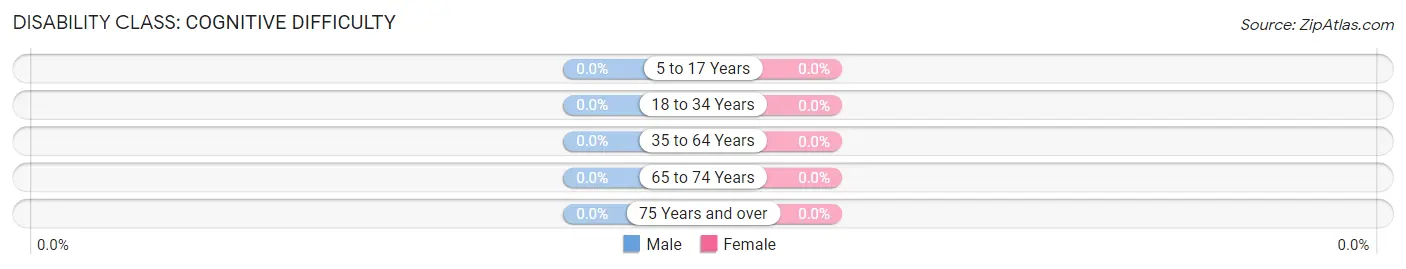
| Age Bracket | Male | Female |
| 5 to 17 Years | 0 (0.0%) | 0 (0.0%) |
| 18 to 34 Years | 0 (0.0%) | 0 (0.0%) |
| 35 to 64 Years | 0 (0.0%) | 0 (0.0%) |
| 65 to 74 Years | 0 (0.0%) | 0 (0.0%) |
| 75 Years and over | 0 (0.0%) | 0 (0.0%) |
Disability Class: Ambulatory Difficulty
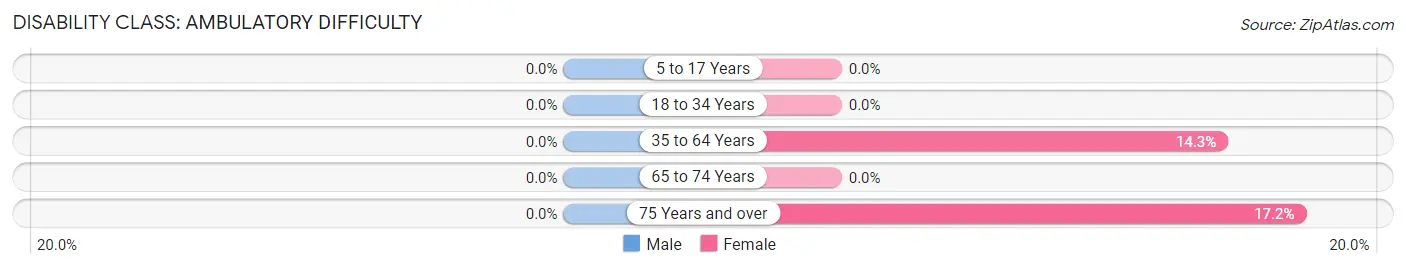
| Age Bracket | Male | Female |
| 5 to 17 Years | 0 (0.0%) | 0 (0.0%) |
| 18 to 34 Years | 0 (0.0%) | 0 (0.0%) |
| 35 to 64 Years | 0 (0.0%) | 36 (14.3%) |
| 65 to 74 Years | 0 (0.0%) | 0 (0.0%) |
| 75 Years and over | 0 (0.0%) | 10 (17.2%) |
Disability Class: Self-Care Difficulty
| Age Bracket | Male | Female |
| 5 to 17 Years | 0 (0.0%) | 0 (0.0%) |
| 18 to 34 Years | 0 (0.0%) | 0 (0.0%) |
| 35 to 64 Years | 0 (0.0%) | 0 (0.0%) |
| 65 to 74 Years | 0 (0.0%) | 0 (0.0%) |
| 75 Years and over | 0 (0.0%) | 0 (0.0%) |
Technology Access in Porter Heights
Computing Device Access in Porter Heights
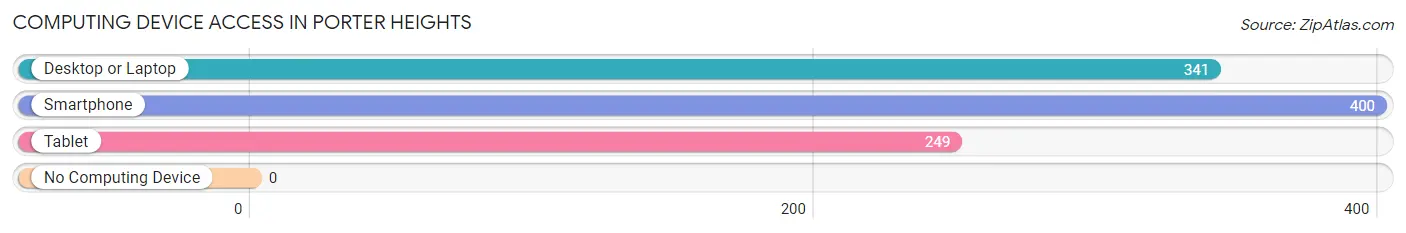
| Device Type | # Households | % Households |
| Desktop or Laptop | 341 | 85.3% |
| Smartphone | 400 | 100.0% |
| Tablet | 249 | 62.3% |
| No Computing Device | 0 | 0.0% |
| Total | 400 | 100.0% |
Internet Access in Porter Heights
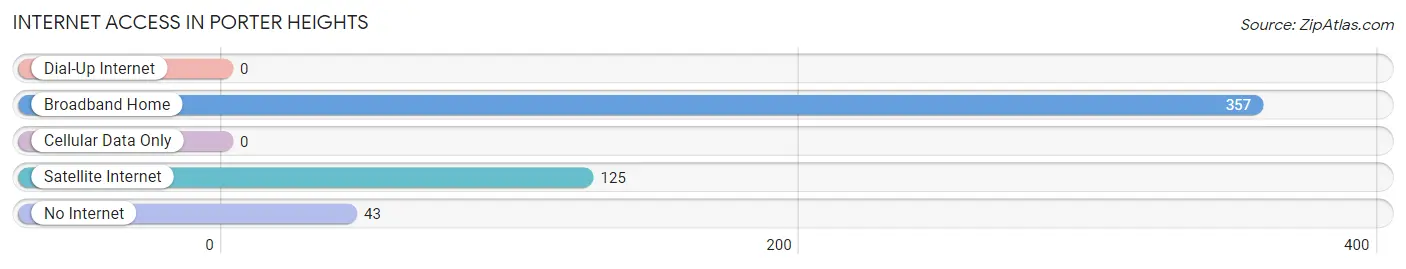
| Internet Type | # Households | % Households |
| Dial-Up Internet | 0 | 0.0% |
| Broadband Home | 357 | 89.2% |
| Cellular Data Only | 0 | 0.0% |
| Satellite Internet | 125 | 31.2% |
| No Internet | 43 | 10.7% |
| Total | 400 | 100.0% |
Porter Heights Summary
Porter Heights is a small unincorporated community located in Harris County, Texas, United States. It is situated approximately 25 miles northeast of downtown Houston and is part of the Houston–The Woodlands–Sugar Land metropolitan area. The community is located along the banks of the San Jacinto River and is bordered by the cities of Humble and Kingwood.
History
The area that is now Porter Heights was originally inhabited by the Atakapan Indians, who were later displaced by European settlers in the early 19th century. The first settlers in the area were the Porter family, who arrived in 1845 and established a homestead near the San Jacinto River. The area was known as Porter’s Landing, and the family built a ferry to transport goods and people across the river.
In 1891, the Houston, East and West Texas Railway was built through the area, connecting Houston to the east. The railway brought new settlers to the area, and the community of Porter Heights was established in 1895. The community was named after the Porter family, who were the first settlers in the area.
Geography
Porter Heights is located in Harris County, Texas, approximately 25 miles northeast of downtown Houston. It is situated along the banks of the San Jacinto River and is bordered by the cities of Humble and Kingwood. The community is located at an elevation of approximately 40 feet above sea level.
The climate in Porter Heights is classified as humid subtropical, with hot, humid summers and mild winters. The average annual temperature is 68°F, and the average annual precipitation is 48 inches.
Economy
The economy of Porter Heights is largely based on the oil and gas industry. The area is home to several oil and gas companies, including ExxonMobil, Chevron, and Shell. The community is also home to several small businesses, including restaurants, retail stores, and service providers.
Demographics
As of the 2010 census, the population of Porter Heights was 1,845. The racial makeup of the community was 79.3% White, 11.2% African American, 0.7% Native American, 0.7% Asian, and 6.9% from other races. The median household income was $50,945, and the median family income was $60,945.
Conclusion
Porter Heights is a small unincorporated community located in Harris County, Texas, approximately 25 miles northeast of downtown Houston. The area was originally inhabited by the Atakapan Indians, and was later settled by the Porter family in 1845. The economy of Porter Heights is largely based on the oil and gas industry, and the community is home to several small businesses. As of the 2010 census, the population of Porter Heights was 1,845, with a median household income of $50,945.
Common Questions
What is Per Capita Income in Porter Heights?
Per Capita income in Porter Heights is $57,449.
What is Inequality or Gini Index in Porter Heights?
Inequality or Gini Index in Porter Heights is 0.37.
What is the Total Population of Porter Heights?
Total Population of Porter Heights is 1,001.
What is the Total Male Population of Porter Heights?
Total Male Population of Porter Heights is 515.
What is the Total Female Population of Porter Heights?
Total Female Population of Porter Heights is 486.
What is the Ratio of Males per 100 Females in Porter Heights?
There are 105.97 Males per 100 Females in Porter Heights.
What is the Ratio of Females per 100 Males in Porter Heights?
There are 94.37 Females per 100 Males in Porter Heights.
What is the Median Population Age in Porter Heights?
Median Population Age in Porter Heights is 55.4 Years.
What is the Average Family Size in Porter Heights
Average Family Size in Porter Heights is 2.8 People.
What is the Average Household Size in Porter Heights
Average Household Size in Porter Heights is 2.5 People.
How Large is the Labor Force in Porter Heights?
There are 629 People in the Labor Forcein in Porter Heights.
What is the Percentage of People in the Labor Force in Porter Heights?
70.8% of People are in the Labor Force in Porter Heights.