Lemannville, LA Map & Demographics
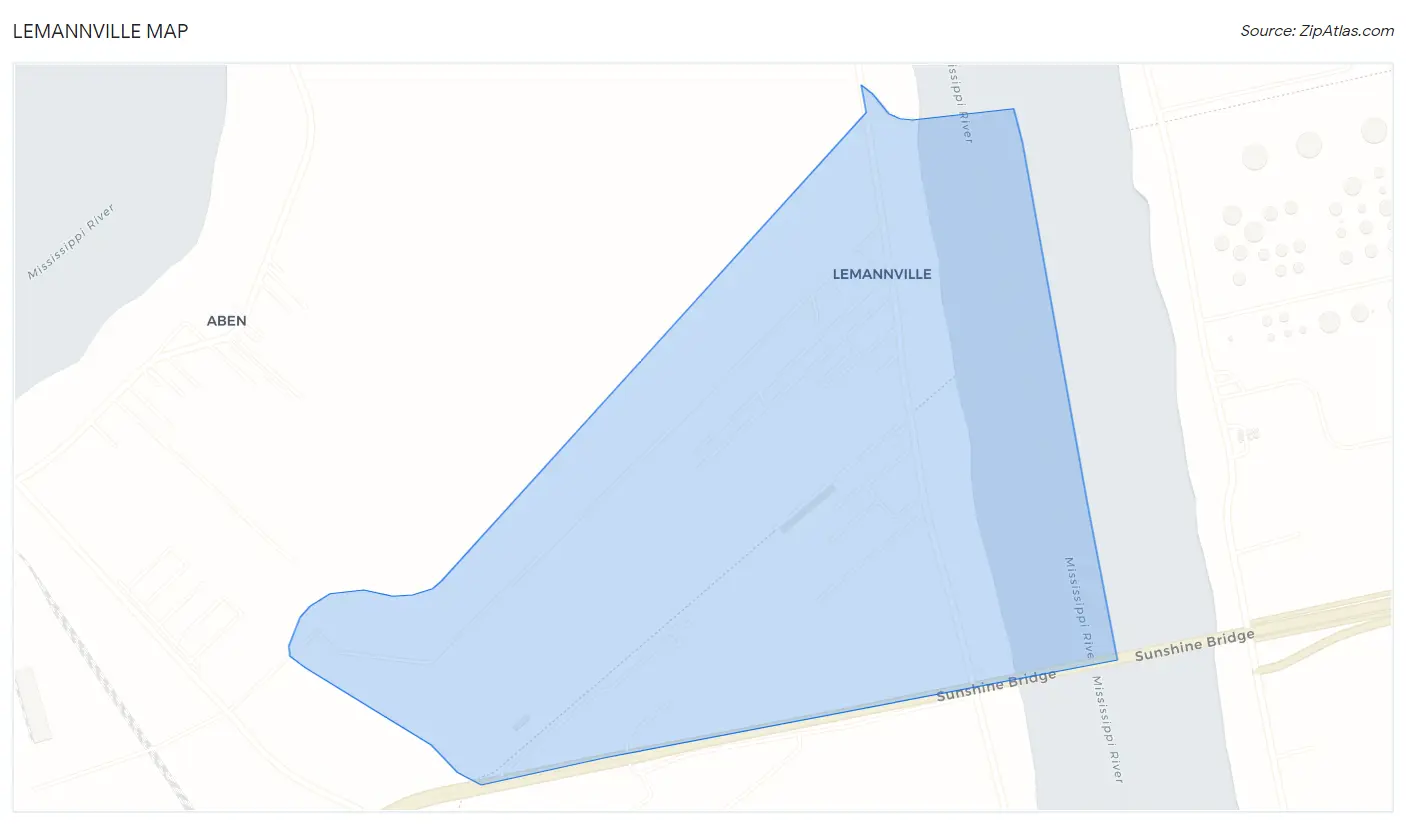
Lemannville Map
Lemannville Overview
$11,468
PER CAPITA INCOME
$11,964
AVG FAMILY INCOME
0.26
INEQUALITY / GINI INDEX
662
TOTAL POPULATION
545
MALE POPULATION
117
FEMALE POPULATION
465.81
MALES / 100 FEMALES
21.47
FEMALES / 100 MALES
34.5
MEDIAN AGE
3.9
AVG FAMILY SIZE
3.5
AVG HOUSEHOLD SIZE
42
LABOR FORCE [ PEOPLE ]
6.8%
PERCENT IN LABOR FORCE
Income in Lemannville
Income Overview in Lemannville
| Characteristic | Number | Measure |
| Per Capita Income | 662 | $11,468 |
| Median Family Income | 22 | $11,964 |
| Mean Family Income | 22 | $17,559 |
| Median Household Income | 37 | $0 |
| Mean Household Income | 37 | $25,754 |
| Income Deficit | 22 | $0 |
| Wage / Income Gap (%) | 662 | 0.00% |
| Wage / Income Gap ($) | 662 | 100.00¢ per $1 |
| Gini / Inequality Index | 662 | 0.26 |
Earnings by Sex in Lemannville
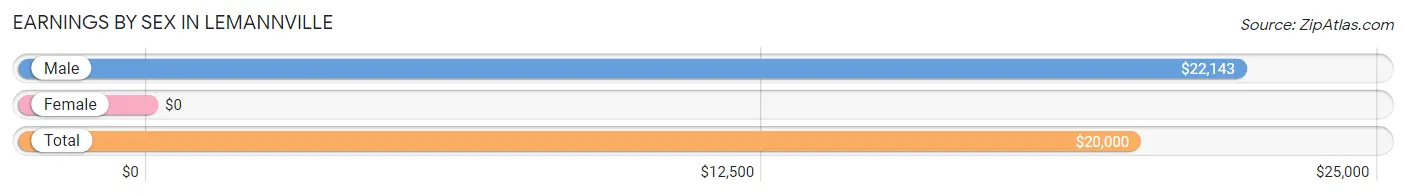
| Sex | Number | Average Earnings |
| Male | 208 (77.6%) | $22,143 |
| Female | 60 (22.4%) | $0 |
| Total | 268 (100.0%) | $20,000 |
Earnings by Sex by Income Bracket in Lemannville
The most common earnings brackets in Lemannville are $2,499 or less for men (26 | 12.5%) and $12,500 to $14,999 for women (27 | 45.0%).
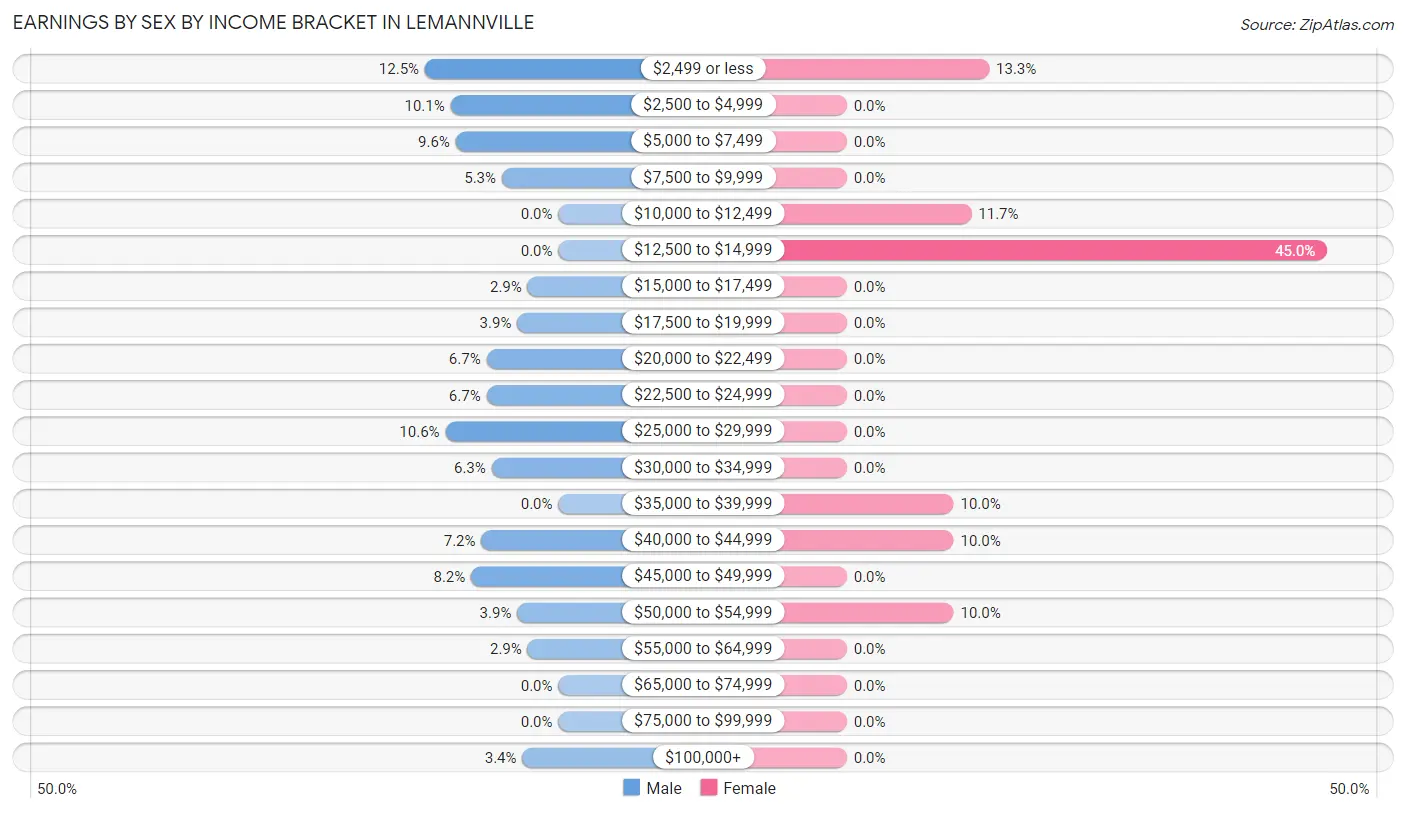
| Income | Male | Female |
| $2,499 or less | 26 (12.5%) | 8 (13.3%) |
| $2,500 to $4,999 | 21 (10.1%) | 0 (0.0%) |
| $5,000 to $7,499 | 20 (9.6%) | 0 (0.0%) |
| $7,500 to $9,999 | 11 (5.3%) | 0 (0.0%) |
| $10,000 to $12,499 | 0 (0.0%) | 7 (11.7%) |
| $12,500 to $14,999 | 0 (0.0%) | 27 (45.0%) |
| $15,000 to $17,499 | 6 (2.9%) | 0 (0.0%) |
| $17,500 to $19,999 | 8 (3.8%) | 0 (0.0%) |
| $20,000 to $22,499 | 14 (6.7%) | 0 (0.0%) |
| $22,500 to $24,999 | 14 (6.7%) | 0 (0.0%) |
| $25,000 to $29,999 | 22 (10.6%) | 0 (0.0%) |
| $30,000 to $34,999 | 13 (6.2%) | 0 (0.0%) |
| $35,000 to $39,999 | 0 (0.0%) | 6 (10.0%) |
| $40,000 to $44,999 | 15 (7.2%) | 6 (10.0%) |
| $45,000 to $49,999 | 17 (8.2%) | 0 (0.0%) |
| $50,000 to $54,999 | 8 (3.8%) | 6 (10.0%) |
| $55,000 to $64,999 | 6 (2.9%) | 0 (0.0%) |
| $65,000 to $74,999 | 0 (0.0%) | 0 (0.0%) |
| $75,000 to $99,999 | 0 (0.0%) | 0 (0.0%) |
| $100,000+ | 7 (3.4%) | 0 (0.0%) |
| Total | 208 (100.0%) | 60 (100.0%) |
Earnings by Sex by Educational Attainment in Lemannville
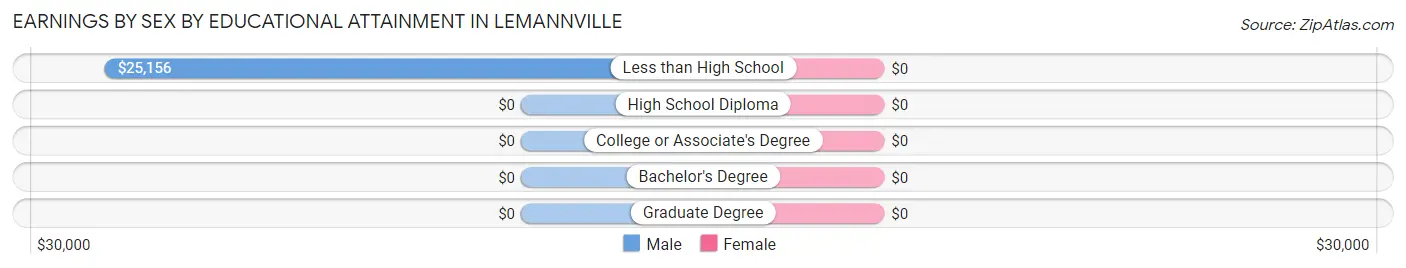
| Educational Attainment | Male Income | Female Income |
| Less than High School | $25,156 | $0 |
| High School Diploma | - | - |
| College or Associate's Degree | - | - |
| Bachelor's Degree | - | - |
| Graduate Degree | - | - |
| Total | $20,357 | $0 |
Family Income in Lemannville
Family Income Brackets in Lemannville
According to the Lemannville family income data, there are 14 families falling into the $10,000 to $14,999 income range, which is the most common income bracket and makes up 63.6% of all families.
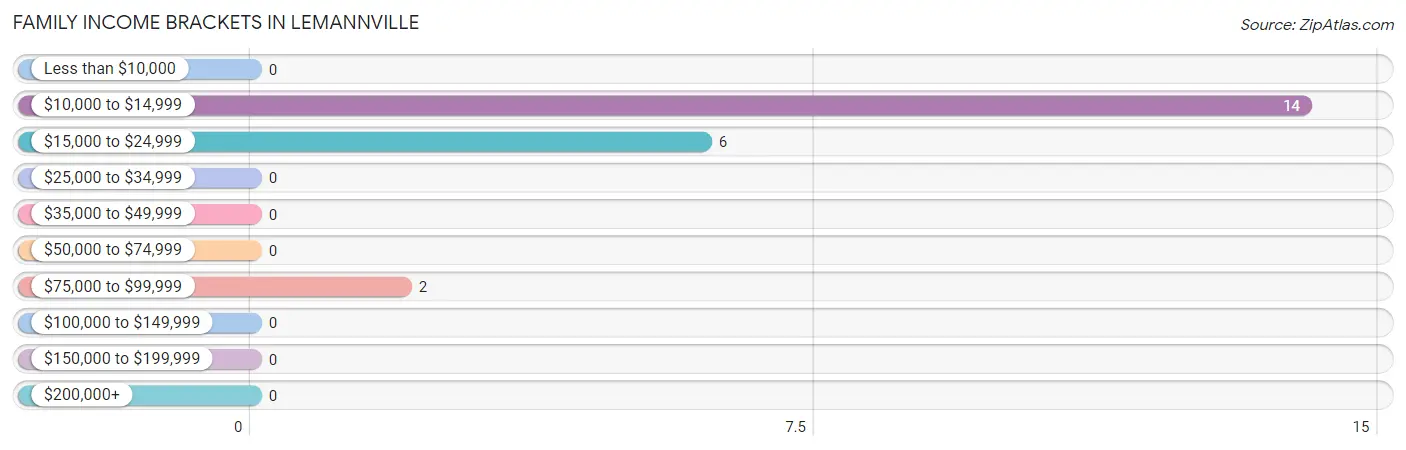
| Income Bracket | # Families | % Families |
| Less than $10,000 | 0 | 0.0% |
| $10,000 to $14,999 | 14 | 63.6% |
| $15,000 to $24,999 | 6 | 27.3% |
| $25,000 to $34,999 | 0 | 0.0% |
| $35,000 to $49,999 | 0 | 0.0% |
| $50,000 to $74,999 | 0 | 0.0% |
| $75,000 to $99,999 | 2 | 9.1% |
| $100,000 to $149,999 | 0 | 0.0% |
| $150,000 to $199,999 | 0 | 0.0% |
| $200,000+ | 0 | 0.0% |
Family Income by Famaliy Size in Lemannville
3-person families (22 | 100.0%) account for the highest median family income in Lemannville with $11,964 per family, while 3-person families (22 | 100.0%) have the highest median income of $3,988 per family member.
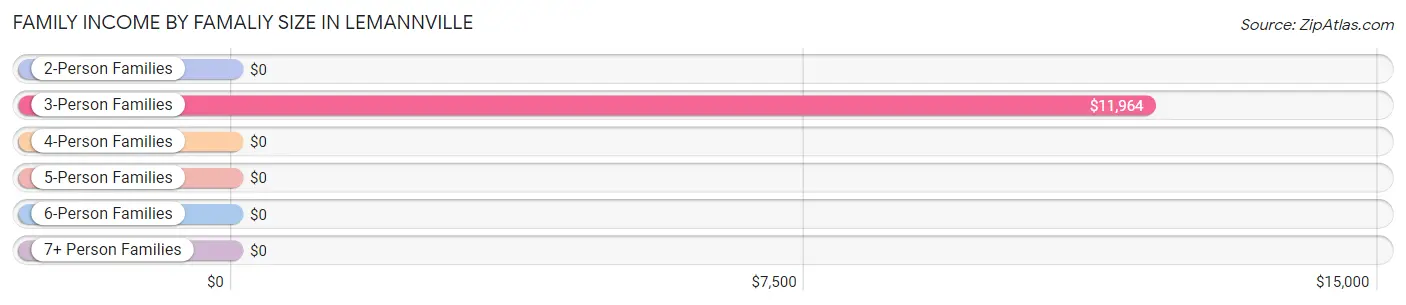
| Income Bracket | # Families | Median Income |
| 2-Person Families | 0 (0.0%) | $0 |
| 3-Person Families | 22 (100.0%) | $11,964 |
| 4-Person Families | 0 (0.0%) | $0 |
| 5-Person Families | 0 (0.0%) | $0 |
| 6-Person Families | 0 (0.0%) | $0 |
| 7+ Person Families | 0 (0.0%) | $0 |
| Total | 22 (100.0%) | $11,964 |
Family Income by Number of Earners in Lemannville
| Number of Earners | # Families | Median Income |
| No Earners | 20 (90.9%) | $0 |
| 1 Earner | 0 (0.0%) | $0 |
| 2 Earners | 2 (9.1%) | $0 |
| 3+ Earners | 0 (0.0%) | $0 |
| Total | 22 (100.0%) | $11,964 |
Household Income in Lemannville
Household Income Brackets in Lemannville
With 29 households falling in the category, the $15,000 to $24,999 income range is the most frequent in Lemannville, accounting for 78.4% of all households.
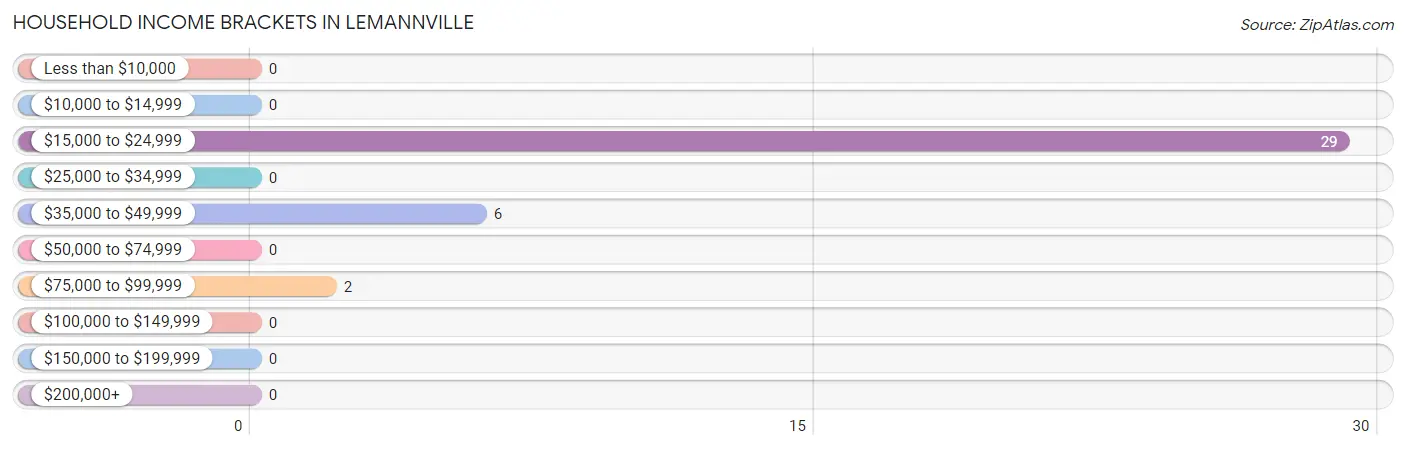
| Income Bracket | # Households | % Households |
| Less than $10,000 | 0 | 0.0% |
| $10,000 to $14,999 | 0 | 0.0% |
| $15,000 to $24,999 | 29 | 78.4% |
| $25,000 to $34,999 | 0 | 0.0% |
| $35,000 to $49,999 | 6 | 16.2% |
| $50,000 to $74,999 | 0 | 0.0% |
| $75,000 to $99,999 | 2 | 5.4% |
| $100,000 to $149,999 | 0 | 0.0% |
| $150,000 to $199,999 | 0 | 0.0% |
| $200,000+ | 0 | 0.0% |
Household Income by Householder Age in Lemannville
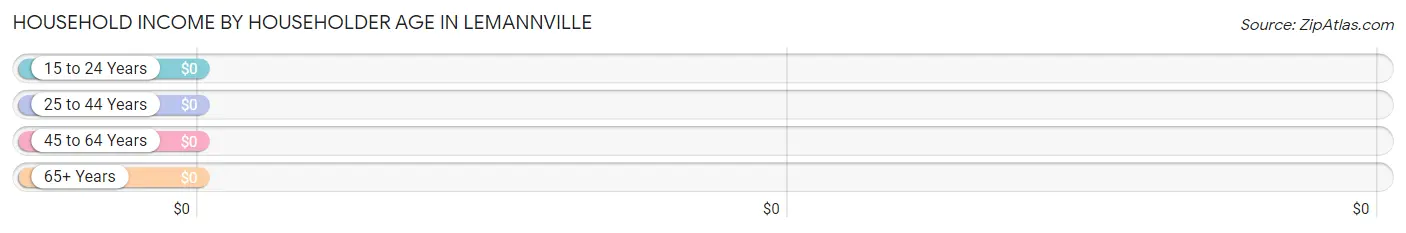
| Income Bracket | # Households | Median Income |
| 15 to 24 Years | 0 (0.0%) | $0 |
| 25 to 44 Years | 0 (0.0%) | $0 |
| 45 to 64 Years | 20 (54.0%) | $0 |
| 65+ Years | 17 (46.0%) | $0 |
| Total | 37 (100.0%) | $0 |
Poverty in Lemannville
Income Below Poverty by Sex and Age in Lemannville
With 93.3% poverty level for males and 72.3% for females among the residents of Lemannville, 6 to 11 year old males and under 5 year old females are the most vulnerable to poverty, with 20 males (100.0%) and 27 females (100.0%) in their respective age groups living below the poverty level.
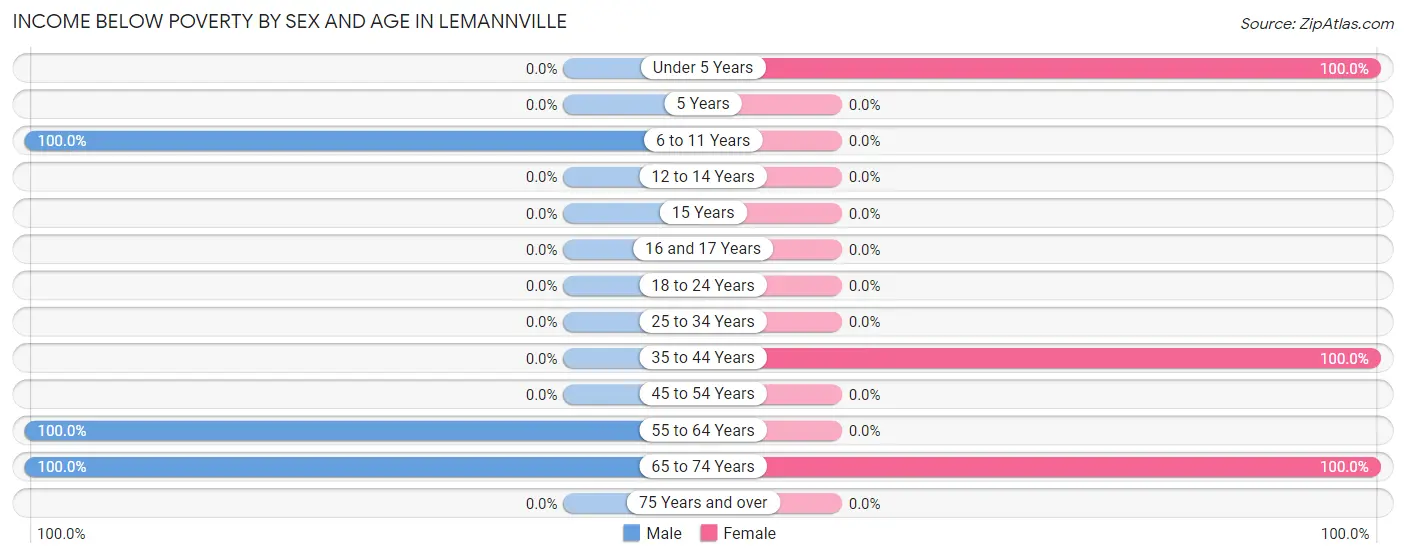
| Age Bracket | Male | Female |
| Under 5 Years | 0 (0.0%) | 27 (100.0%) |
| 5 Years | 0 (0.0%) | 0 (0.0%) |
| 6 to 11 Years | 20 (100.0%) | 0 (0.0%) |
| 12 to 14 Years | 0 (0.0%) | 0 (0.0%) |
| 15 Years | 0 (0.0%) | 0 (0.0%) |
| 16 and 17 Years | 0 (0.0%) | 0 (0.0%) |
| 18 to 24 Years | 0 (0.0%) | 0 (0.0%) |
| 25 to 34 Years | 0 (0.0%) | 0 (0.0%) |
| 35 to 44 Years | 0 (0.0%) | 27 (100.0%) |
| 45 to 54 Years | 0 (0.0%) | 0 (0.0%) |
| 55 to 64 Years | 14 (100.0%) | 0 (0.0%) |
| 65 to 74 Years | 8 (100.0%) | 6 (100.0%) |
| 75 Years and over | 0 (0.0%) | 0 (0.0%) |
| Total | 42 (93.3%) | 60 (72.3%) |
Income Above Poverty by Sex and Age in Lemannville
According to the poverty statistics in Lemannville, males aged 25 to 34 years and females aged 45 to 54 years are the age groups that are most secure financially, with 100.0% of males and 100.0% of females in these age groups living above the poverty line.
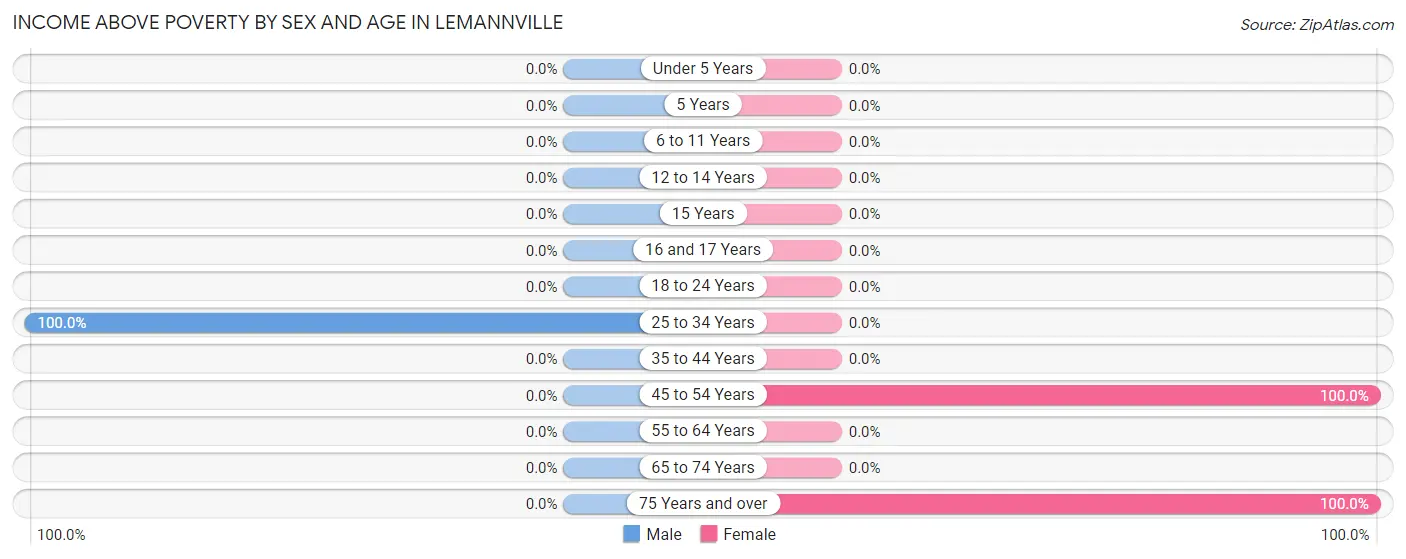
| Age Bracket | Male | Female |
| Under 5 Years | 0 (0.0%) | 0 (0.0%) |
| 5 Years | 0 (0.0%) | 0 (0.0%) |
| 6 to 11 Years | 0 (0.0%) | 0 (0.0%) |
| 12 to 14 Years | 0 (0.0%) | 0 (0.0%) |
| 15 Years | 0 (0.0%) | 0 (0.0%) |
| 16 and 17 Years | 0 (0.0%) | 0 (0.0%) |
| 18 to 24 Years | 0 (0.0%) | 0 (0.0%) |
| 25 to 34 Years | 3 (100.0%) | 0 (0.0%) |
| 35 to 44 Years | 0 (0.0%) | 0 (0.0%) |
| 45 to 54 Years | 0 (0.0%) | 12 (100.0%) |
| 55 to 64 Years | 0 (0.0%) | 0 (0.0%) |
| 65 to 74 Years | 0 (0.0%) | 0 (0.0%) |
| 75 Years and over | 0 (0.0%) | 11 (100.0%) |
| Total | 3 (6.7%) | 23 (27.7%) |
Income Below Poverty Among Married-Couple Families in Lemannville
The poverty statistics for married-couple families in Lemannville show that 100.0% or 6 of the total 6 families live below the poverty line. Families with 1 or 2 children have the highest poverty rate of 100.0%, comprising of 6 families. On the other hand, families with 1 or 2 children have the lowest poverty rate of 100.0%, which includes 6 families.
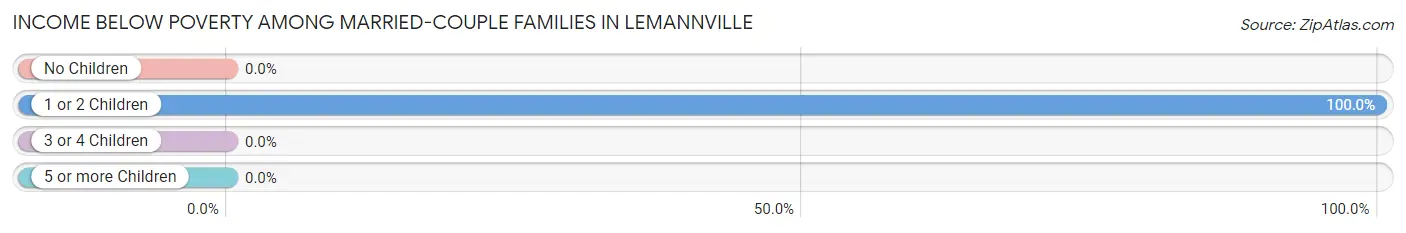
| Children | Above Poverty | Below Poverty |
| No Children | 0 (0.0%) | 0 (0.0%) |
| 1 or 2 Children | 0 (0.0%) | 6 (100.0%) |
| 3 or 4 Children | 0 (0.0%) | 0 (0.0%) |
| 5 or more Children | 0 (0.0%) | 0 (0.0%) |
| Total | 0 (0.0%) | 6 (100.0%) |
Income Below Poverty Among Single-Parent Households in Lemannville
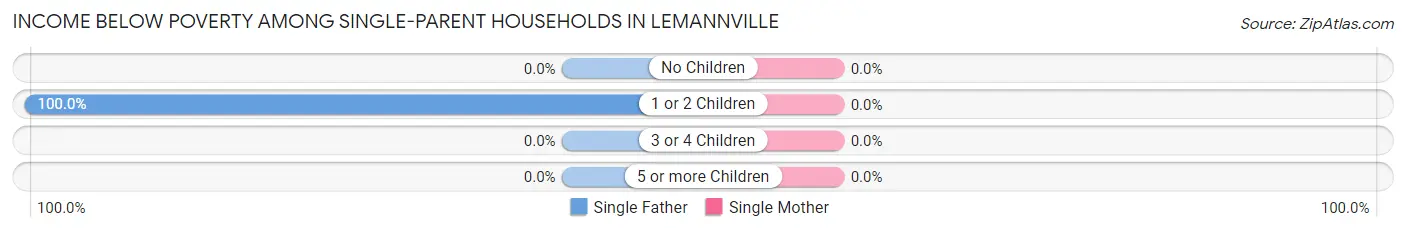
| Children | Single Father | Single Mother |
| No Children | 0 (0.0%) | 0 (0.0%) |
| 1 or 2 Children | 14 (100.0%) | 0 (0.0%) |
| 3 or 4 Children | 0 (0.0%) | 0 (0.0%) |
| 5 or more Children | 0 (0.0%) | 0 (0.0%) |
| Total | 14 (100.0%) | 0 (0.0%) |
Income Below Poverty Among Married-Couple vs Single-Parent Households in Lemannville
The poverty data for Lemannville shows that 6 of the married-couple family households (100.0%) and 14 of the single-parent households (87.5%) are living below the poverty level. Within the married-couple family households, those with 1 or 2 children have the highest poverty rate, with 6 households (100.0%) falling below the poverty line. Among the single-parent households, those with 1 or 2 children have the highest poverty rate, with 14 household (100.0%) living below poverty.
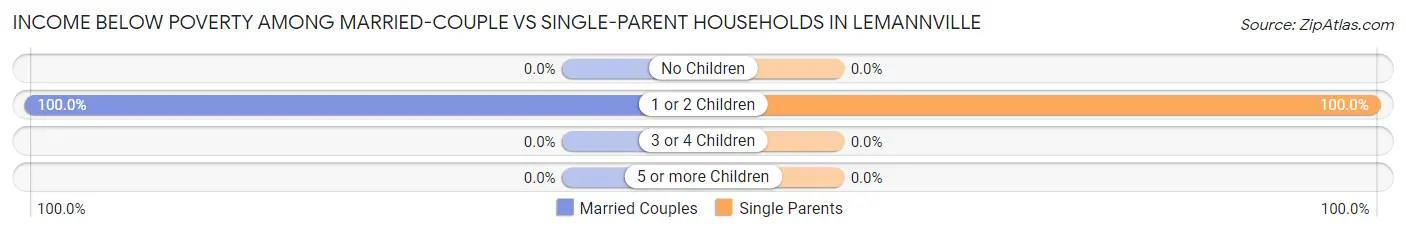
| Children | Married-Couple Families | Single-Parent Households |
| No Children | 0 (0.0%) | 0 (0.0%) |
| 1 or 2 Children | 6 (100.0%) | 14 (100.0%) |
| 3 or 4 Children | 0 (0.0%) | 0 (0.0%) |
| 5 or more Children | 0 (0.0%) | 0 (0.0%) |
| Total | 6 (100.0%) | 14 (87.5%) |
Race in Lemannville
The most populous races in Lemannville are Black / African American (358 | 54.1%), White / Caucasian (256 | 38.7%), and Two or more Races (34 | 5.1%).
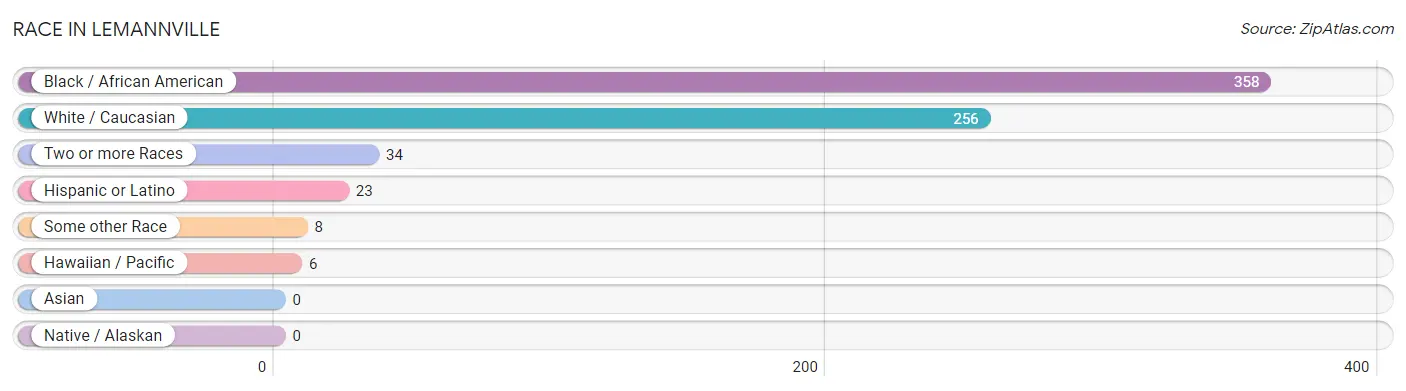
| Race | # Population | % Population |
| Asian | 0 | 0.0% |
| Black / African American | 358 | 54.1% |
| Hawaiian / Pacific | 6 | 0.9% |
| Hispanic or Latino | 23 | 3.5% |
| Native / Alaskan | 0 | 0.0% |
| White / Caucasian | 256 | 38.7% |
| Two or more Races | 34 | 5.1% |
| Some other Race | 8 | 1.2% |
| Total | 662 | 100.0% |
Ancestry in Lemannville
The most populous ancestries reported in Lemannville are American (121 | 18.3%), French (71 | 10.7%), Irish (52 | 7.9%), English (37 | 5.6%), and Italian (15 | 2.3%), together accounting for 44.7% of all Lemannville residents.
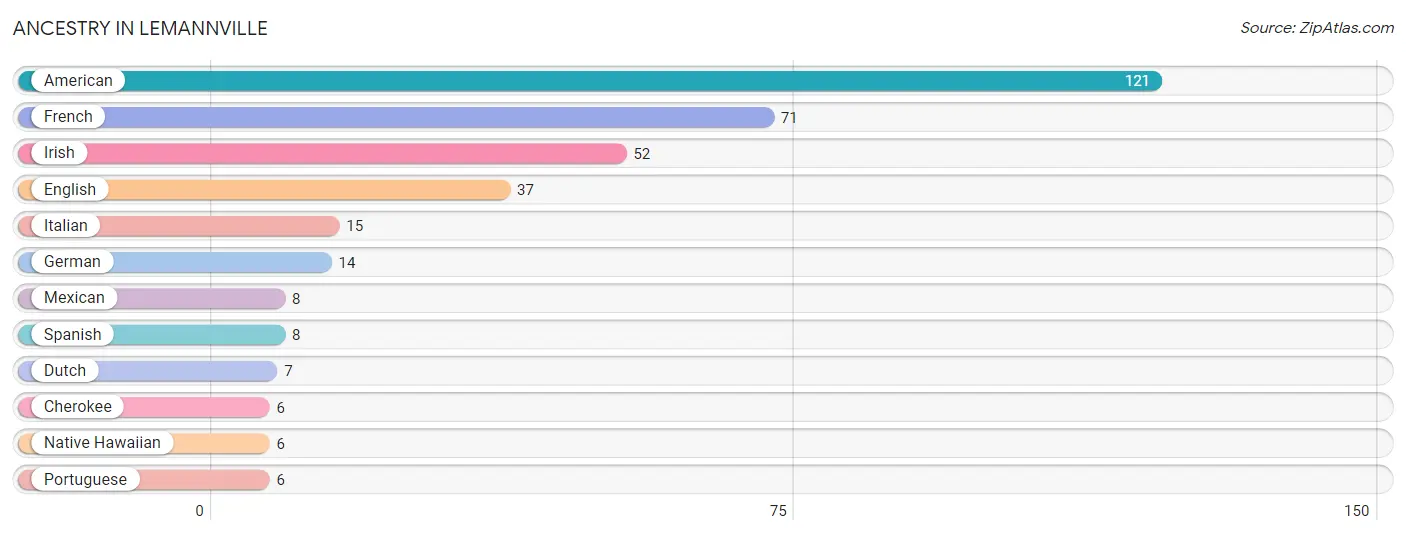
| Ancestry | # Population | % Population |
| American | 121 | 18.3% |
| Cherokee | 6 | 0.9% |
| Dutch | 7 | 1.1% |
| English | 37 | 5.6% |
| French | 71 | 10.7% |
| German | 14 | 2.1% |
| Irish | 52 | 7.9% |
| Italian | 15 | 2.3% |
| Mexican | 8 | 1.2% |
| Native Hawaiian | 6 | 0.9% |
| Portuguese | 6 | 0.9% |
| Spanish | 8 | 1.2% | View All 12 Rows |
Immigrants in Lemannville
The most numerous immigrant groups reported in Lemannville came from Central America (8 | 1.2%), Latin America (8 | 1.2%), and Mexico (8 | 1.2%), together accounting for 3.6% of all Lemannville residents.
| Immigration Origin | # Population | % Population |
| Central America | 8 | 1.2% |
| Latin America | 8 | 1.2% |
| Mexico | 8 | 1.2% | View All 3 Rows |
Sex and Age in Lemannville
Sex and Age in Lemannville
The most populous age groups in Lemannville are 25 to 29 Years (90 | 16.5%) for men and 35 to 39 Years (41 | 35.0%) for women.
| Age Bracket | Male | Female |
| Under 5 Years | 0 (0.0%) | 27 (23.1%) |
| 5 to 9 Years | 20 (3.7%) | 0 (0.0%) |
| 10 to 14 Years | 1 (0.2%) | 0 (0.0%) |
| 15 to 19 Years | 54 (9.9%) | 0 (0.0%) |
| 20 to 24 Years | 68 (12.5%) | 7 (6.0%) |
| 25 to 29 Years | 90 (16.5%) | 0 (0.0%) |
| 30 to 34 Years | 78 (14.3%) | 6 (5.1%) |
| 35 to 39 Years | 65 (11.9%) | 41 (35.0%) |
| 40 to 44 Years | 79 (14.5%) | 0 (0.0%) |
| 45 to 49 Years | 21 (3.8%) | 0 (0.0%) |
| 50 to 54 Years | 6 (1.1%) | 12 (10.3%) |
| 55 to 59 Years | 36 (6.6%) | 7 (6.0%) |
| 60 to 64 Years | 12 (2.2%) | 0 (0.0%) |
| 65 to 69 Years | 0 (0.0%) | 0 (0.0%) |
| 70 to 74 Years | 15 (2.8%) | 6 (5.1%) |
| 75 to 79 Years | 0 (0.0%) | 2 (1.7%) |
| 80 to 84 Years | 0 (0.0%) | 0 (0.0%) |
| 85 Years and over | 0 (0.0%) | 9 (7.7%) |
| Total | 545 (100.0%) | 117 (100.0%) |
Families and Households in Lemannville
Median Family Size in Lemannville
The median family size in Lemannville is 3.91 persons per family, with single female/mother families (2 | 9.1%) accounting for the largest median family size of 5.5 persons per family. On the other hand, married-couple families (6 | 27.3%) represent the smallest median family size with 3.67 persons per family.
| Family Type | # Families | Family Size |
| Married-Couple | 6 (27.3%) | 3.67 |
| Single Male/Father | 14 (63.6%) | 3.79 |
| Single Female/Mother | 2 (9.1%) | 5.50 |
| Total Families | 22 (100.0%) | 3.91 |
Median Household Size in Lemannville
The median household size in Lemannville is 3.46 persons per household, with single male/father households (14 | 37.8%) accounting for the largest median household size of 5.71 persons per household. non-family households (15 | 40.5%) represent the smallest median household size with 1.00 persons per household.
| Household Type | # Households | Household Size |
| Married-Couple | 6 (16.2%) | 3.67 |
| Single Male/Father | 14 (37.8%) | 5.71 |
| Single Female/Mother | 2 (5.4%) | 5.50 |
| Non-family | 15 (40.5%) | 1.00 |
| Total Households | 37 (100.0%) | 3.46 |
Household Size by Marriage Status in Lemannville
Out of a total of 37 households in Lemannville, 22 (59.5%) are family households, while 15 (40.5%) are nonfamily households. The most numerous type of family households are 4-person households, comprising 14, and the most common type of nonfamily households are 1-person households, comprising 15.
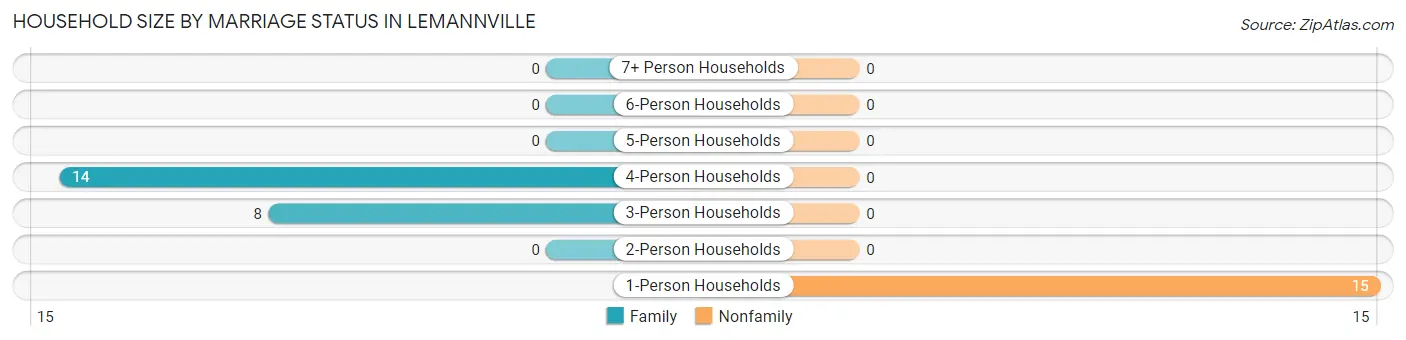
| Household Size | Family Households | Nonfamily Households |
| 1-Person Households | - | 15 (40.5%) |
| 2-Person Households | 0 (0.0%) | 0 (0.0%) |
| 3-Person Households | 8 (21.6%) | 0 (0.0%) |
| 4-Person Households | 14 (37.8%) | 0 (0.0%) |
| 5-Person Households | 0 (0.0%) | 0 (0.0%) |
| 6-Person Households | 0 (0.0%) | 0 (0.0%) |
| 7+ Person Households | 0 (0.0%) | 0 (0.0%) |
| Total | 22 (59.5%) | 15 (40.5%) |
Female Fertility in Lemannville
Fertility by Age in Lemannville
| Age Bracket | Women with Births | Births / 1,000 Women |
| 15 to 19 years | 0 (0.0%) | 0.0 |
| 20 to 34 years | 0 (0.0%) | 0.0 |
| 35 to 50 years | 0 (0.0%) | 0.0 |
| Total | 0 (0.0%) | 0.0 |
Fertility by Age by Marriage Status in Lemannville
| Age Bracket | Married | Unmarried |
| 15 to 19 years | 0 (0.0%) | 0 (0.0%) |
| 20 to 34 years | 0 (0.0%) | 0 (0.0%) |
| 35 to 50 years | 0 (0.0%) | 0 (0.0%) |
| Total | 0 (0.0%) | 0 (0.0%) |
Fertility by Education in Lemannville
| Educational Attainment | Women with Births | Births / 1,000 Women |
| Less than High School | 0 (0.0%) | 0.0 |
| High School Diploma | 0 (0.0%) | 0.0 |
| College or Associate's Degree | 0 (0.0%) | 0.0 |
| Bachelor's Degree | 0 (0.0%) | 0.0 |
| Graduate Degree | 0 (0.0%) | 0.0 |
| Total | 0 (0.0%) | 0.0 |
Fertility by Education by Marriage Status in Lemannville
| Educational Attainment | Married | Unmarried |
| Less than High School | 0 (0.0%) | 0 (0.0%) |
| High School Diploma | 0 (0.0%) | 0 (0.0%) |
| College or Associate's Degree | 0 (0.0%) | 0 (0.0%) |
| Bachelor's Degree | 0 (0.0%) | 0 (0.0%) |
| Graduate Degree | 0 (0.0%) | 0 (0.0%) |
| Total | 0 (0.0%) | 0 (0.0%) |
Employment Characteristics in Lemannville
Employment by Class of Employer in Lemannville
Among the 42 employed individuals in Lemannville, private company employees (30 | 71.4%), and local government employees (12 | 28.6%) make up the most common classes of employment.
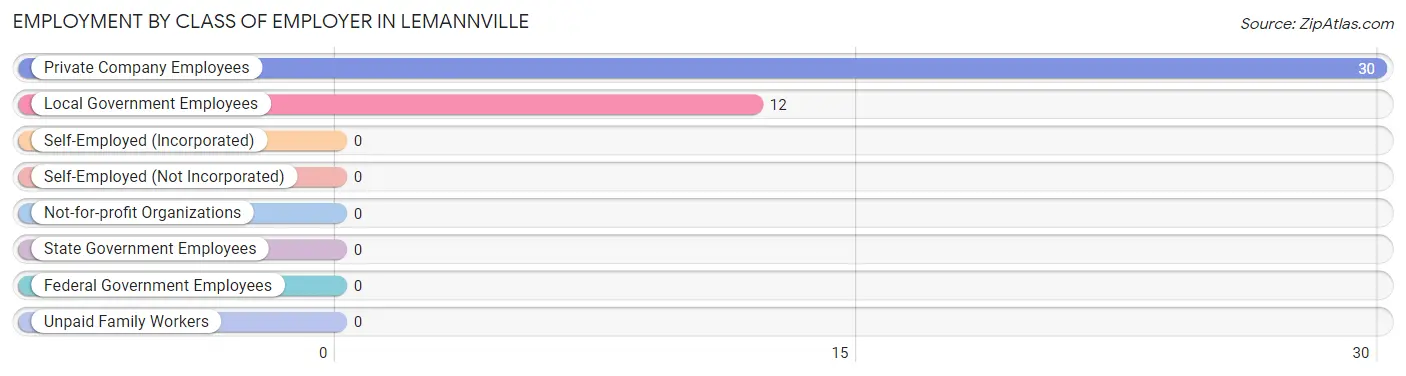
| Employer Class | # Employees | % Employees |
| Private Company Employees | 30 | 71.4% |
| Self-Employed (Incorporated) | 0 | 0.0% |
| Self-Employed (Not Incorporated) | 0 | 0.0% |
| Not-for-profit Organizations | 0 | 0.0% |
| Local Government Employees | 12 | 28.6% |
| State Government Employees | 0 | 0.0% |
| Federal Government Employees | 0 | 0.0% |
| Unpaid Family Workers | 0 | 0.0% |
| Total | 42 | 100.0% |
Employment Status by Age in Lemannville
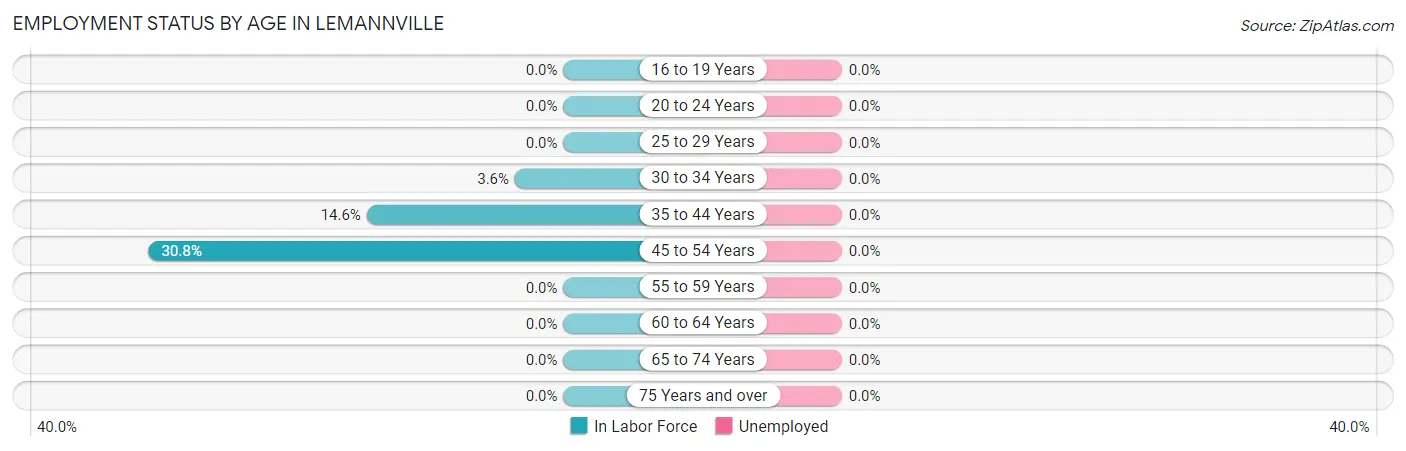
| Age Bracket | In Labor Force | Unemployed |
| 16 to 19 Years | 0 (0.0%) | 0 (0.0%) |
| 20 to 24 Years | 0 (0.0%) | 0 (0.0%) |
| 25 to 29 Years | 0 (0.0%) | 0 (0.0%) |
| 30 to 34 Years | 3 (3.6%) | 0 (0.0%) |
| 35 to 44 Years | 27 (14.6%) | 0 (0.0%) |
| 45 to 54 Years | 12 (30.8%) | 0 (0.0%) |
| 55 to 59 Years | 0 (0.0%) | 0 (0.0%) |
| 60 to 64 Years | 0 (0.0%) | 0 (0.0%) |
| 65 to 74 Years | 0 (0.0%) | 0 (0.0%) |
| 75 Years and over | 0 (0.0%) | 0 (0.0%) |
| Total | 42 (6.8%) | 0 (0.0%) |
Employment Status by Educational Attainment in Lemannville
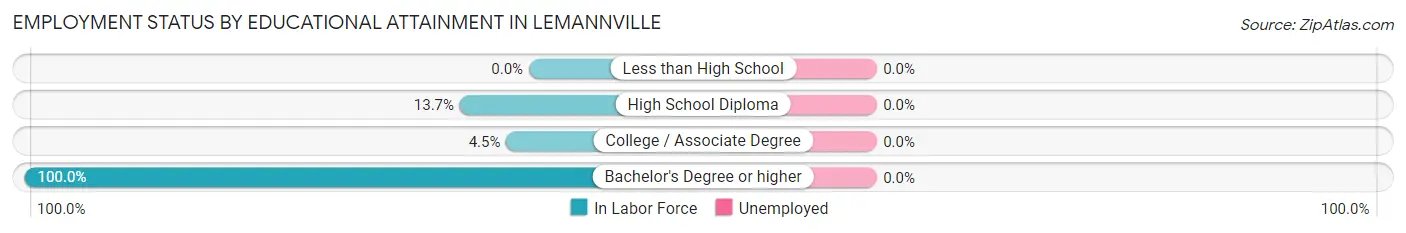
| Educational Attainment | In Labor Force | Unemployed |
| Less than High School | 0 (0.0%) | 0 (0.0%) |
| High School Diploma | 33 (13.7%) | 0 (0.0%) |
| College / Associate Degree | 3 (4.5%) | 0 (0.0%) |
| Bachelor's Degree or higher | 6 (100.0%) | 0 (0.0%) |
| Total | 42 (9.3%) | 0 (0.0%) |
Employment Occupations by Sex in Lemannville
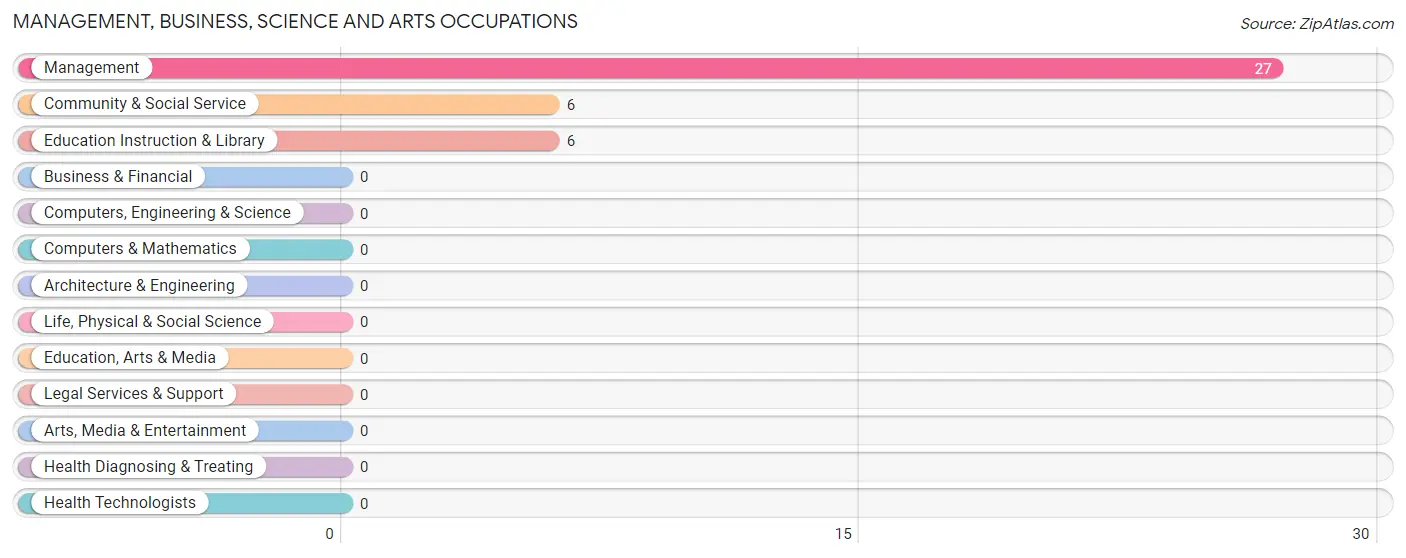
Management, Business, Science and Arts Occupations
The most common Management, Business, Science and Arts occupations in Lemannville are Management (27 | 64.3%), Community & Social Service (6 | 14.3%), and Education Instruction & Library (6 | 14.3%).
Management, Business, Science and Arts Occupations by Sex
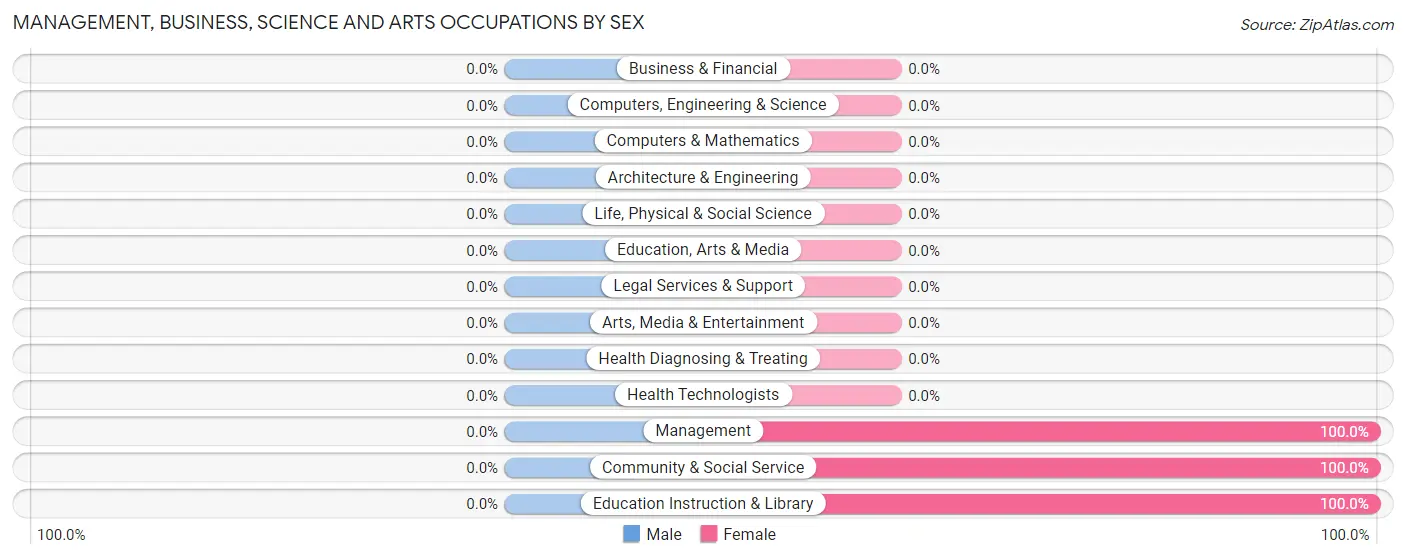
| Occupation | Male | Female |
| Management | 0 (0.0%) | 27 (100.0%) |
| Business & Financial | 0 (0.0%) | 0 (0.0%) |
| Computers, Engineering & Science | 0 (0.0%) | 0 (0.0%) |
| Computers & Mathematics | 0 (0.0%) | 0 (0.0%) |
| Architecture & Engineering | 0 (0.0%) | 0 (0.0%) |
| Life, Physical & Social Science | 0 (0.0%) | 0 (0.0%) |
| Community & Social Service | 0 (0.0%) | 6 (100.0%) |
| Education, Arts & Media | 0 (0.0%) | 0 (0.0%) |
| Legal Services & Support | 0 (0.0%) | 0 (0.0%) |
| Education Instruction & Library | 0 (0.0%) | 6 (100.0%) |
| Arts, Media & Entertainment | 0 (0.0%) | 0 (0.0%) |
| Health Diagnosing & Treating | 0 (0.0%) | 0 (0.0%) |
| Health Technologists | 0 (0.0%) | 0 (0.0%) |
| Total (Category) | 0 (0.0%) | 33 (100.0%) |
| Total (Overall) | 3 (7.1%) | 39 (92.9%) |
Services Occupations
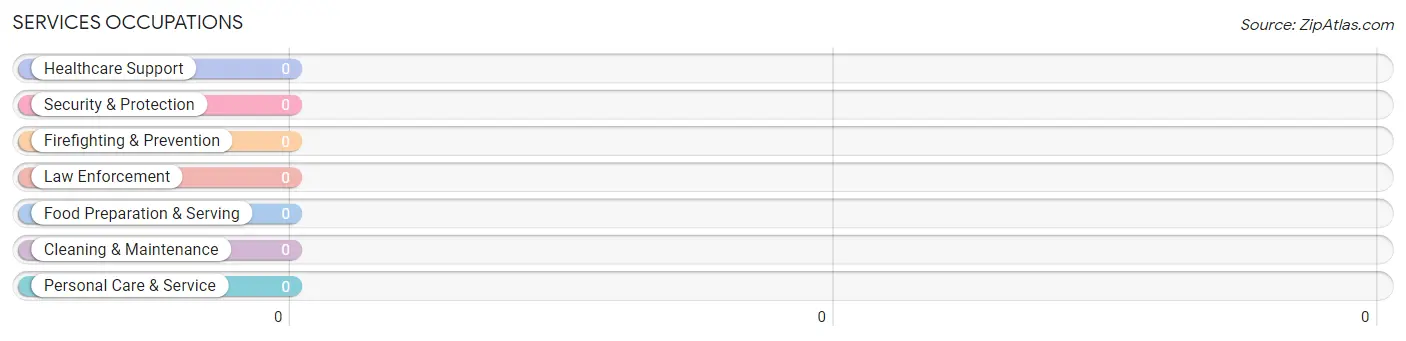
Services Occupations by Sex
| Occupation | Male | Female |
| Healthcare Support | 0 (0.0%) | 0 (0.0%) |
| Security & Protection | 0 (0.0%) | 0 (0.0%) |
| Firefighting & Prevention | 0 (0.0%) | 0 (0.0%) |
| Law Enforcement | 0 (0.0%) | 0 (0.0%) |
| Food Preparation & Serving | 0 (0.0%) | 0 (0.0%) |
| Cleaning & Maintenance | 0 (0.0%) | 0 (0.0%) |
| Personal Care & Service | 0 (0.0%) | 0 (0.0%) |
| Total (Category) | 0 (0.0%) | 0 (0.0%) |
| Total (Overall) | 3 (7.1%) | 39 (92.9%) |
Sales and Office Occupations

Sales and Office Occupations by Sex
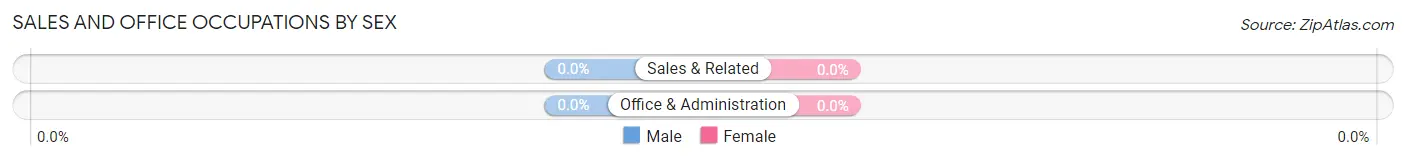
| Occupation | Male | Female |
| Sales & Related | 0 (0.0%) | 0 (0.0%) |
| Office & Administration | 0 (0.0%) | 0 (0.0%) |
| Total (Category) | 0 (0.0%) | 0 (0.0%) |
| Total (Overall) | 3 (7.1%) | 39 (92.9%) |
Natural Resources, Construction and Maintenance Occupations
Natural Resources, Construction and Maintenance Occupations by Sex
| Occupation | Male | Female |
| Farming, Fishing & Forestry | 0 (0.0%) | 0 (0.0%) |
| Construction & Extraction | 0 (0.0%) | 0 (0.0%) |
| Installation, Maintenance & Repair | 0 (0.0%) | 0 (0.0%) |
| Total (Category) | 0 (0.0%) | 0 (0.0%) |
| Total (Overall) | 3 (7.1%) | 39 (92.9%) |
Production, Transportation and Moving Occupations
The most common Production, Transportation and Moving occupations in Lemannville are Material Moving (6 | 14.3%), and Transportation (3 | 7.1%).
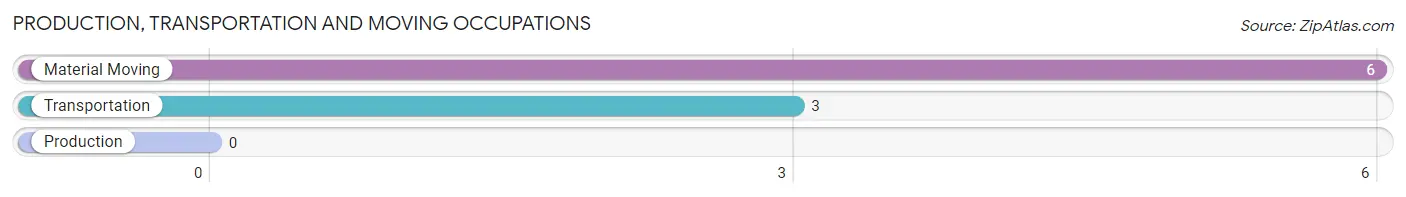
Production, Transportation and Moving Occupations by Sex
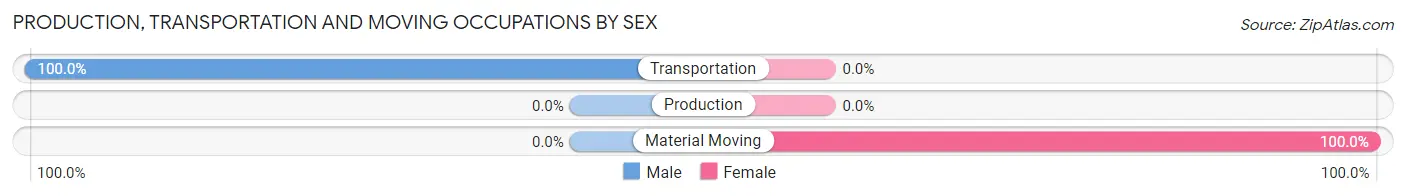
| Occupation | Male | Female |
| Production | 0 (0.0%) | 0 (0.0%) |
| Transportation | 3 (100.0%) | 0 (0.0%) |
| Material Moving | 0 (0.0%) | 6 (100.0%) |
| Total (Category) | 3 (33.3%) | 6 (66.7%) |
| Total (Overall) | 3 (7.1%) | 39 (92.9%) |
Employment Industries by Sex in Lemannville
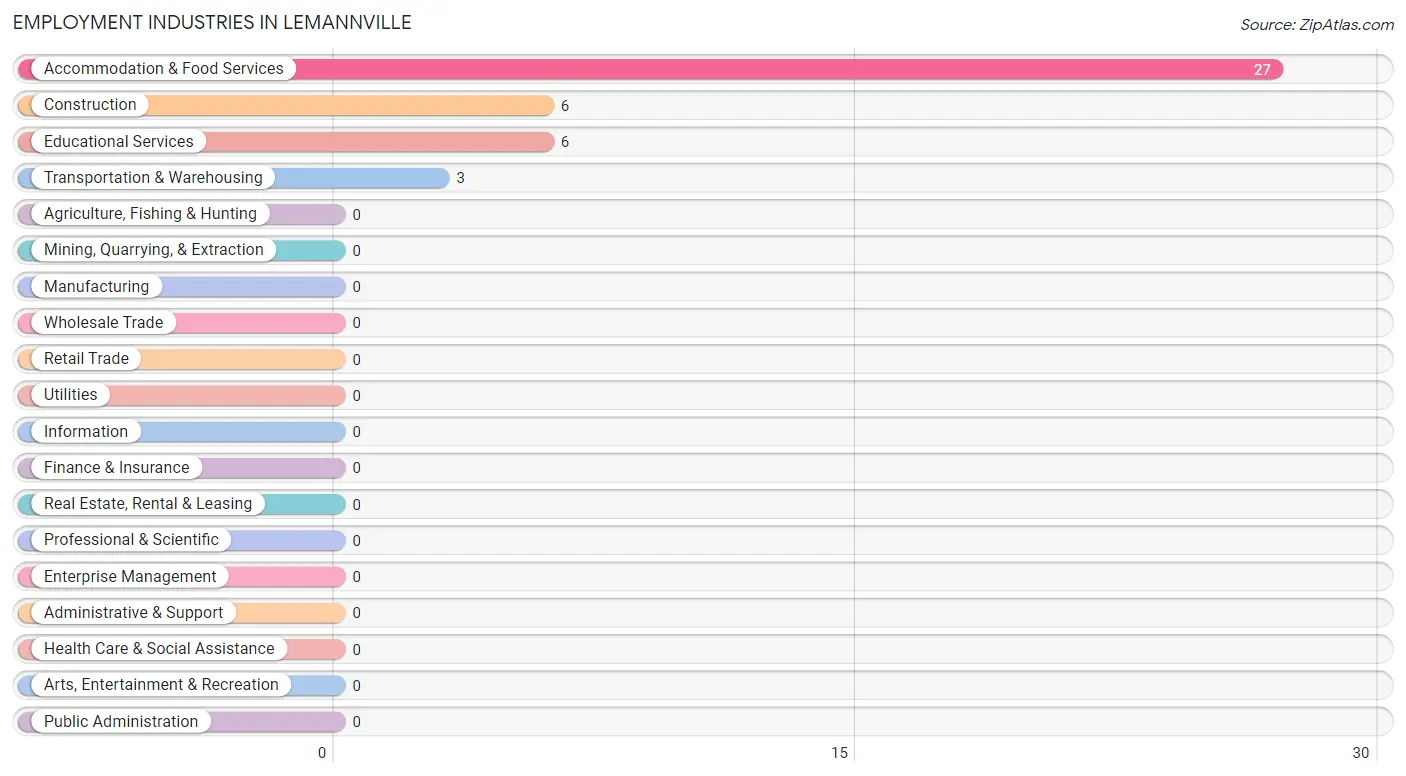
Employment Industries in Lemannville
The major employment industries in Lemannville include Accommodation & Food Services (27 | 64.3%), Construction (6 | 14.3%), Educational Services (6 | 14.3%), and Transportation & Warehousing (3 | 7.1%).
Employment Industries by Sex in Lemannville
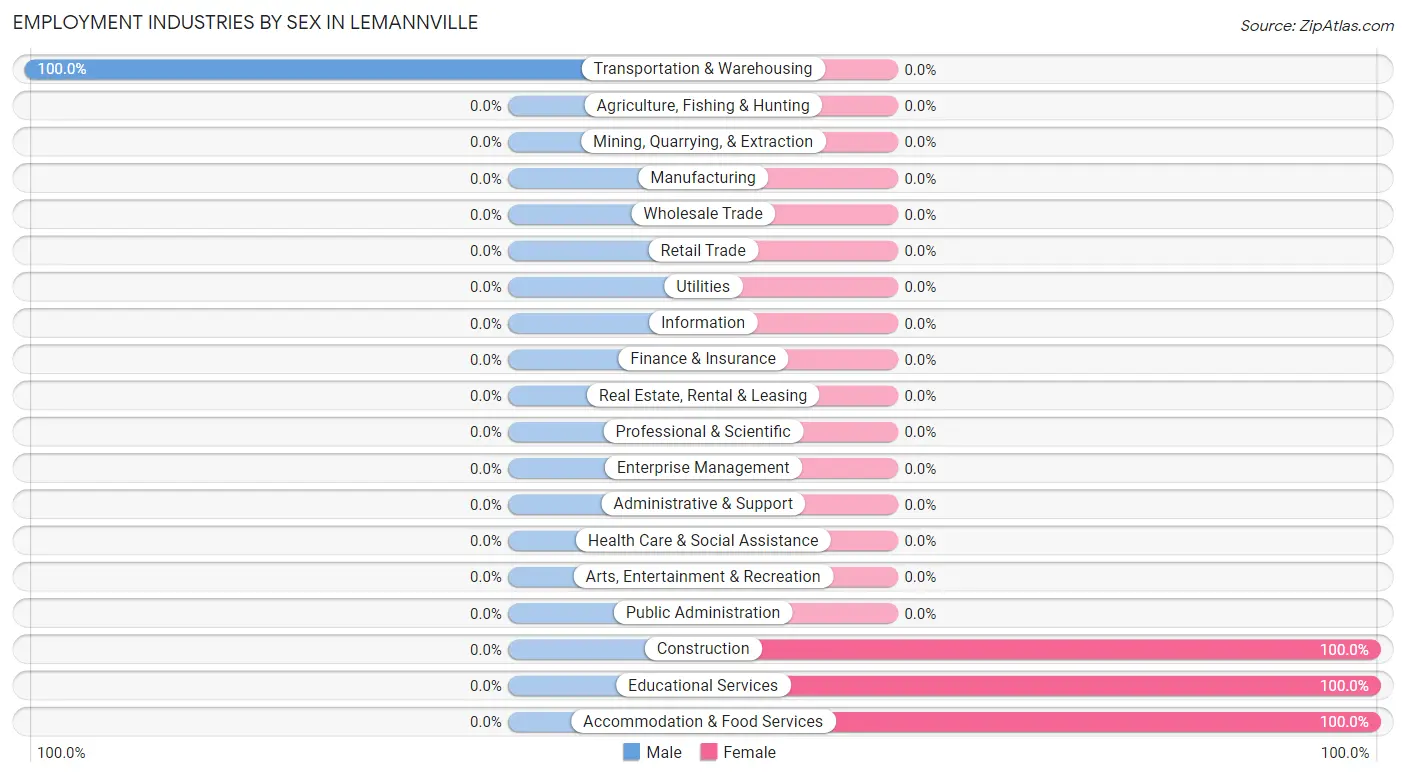
| Industry | Male | Female |
| Agriculture, Fishing & Hunting | 0 (0.0%) | 0 (0.0%) |
| Mining, Quarrying, & Extraction | 0 (0.0%) | 0 (0.0%) |
| Construction | 0 (0.0%) | 6 (100.0%) |
| Manufacturing | 0 (0.0%) | 0 (0.0%) |
| Wholesale Trade | 0 (0.0%) | 0 (0.0%) |
| Retail Trade | 0 (0.0%) | 0 (0.0%) |
| Transportation & Warehousing | 3 (100.0%) | 0 (0.0%) |
| Utilities | 0 (0.0%) | 0 (0.0%) |
| Information | 0 (0.0%) | 0 (0.0%) |
| Finance & Insurance | 0 (0.0%) | 0 (0.0%) |
| Real Estate, Rental & Leasing | 0 (0.0%) | 0 (0.0%) |
| Professional & Scientific | 0 (0.0%) | 0 (0.0%) |
| Enterprise Management | 0 (0.0%) | 0 (0.0%) |
| Administrative & Support | 0 (0.0%) | 0 (0.0%) |
| Educational Services | 0 (0.0%) | 6 (100.0%) |
| Health Care & Social Assistance | 0 (0.0%) | 0 (0.0%) |
| Arts, Entertainment & Recreation | 0 (0.0%) | 0 (0.0%) |
| Accommodation & Food Services | 0 (0.0%) | 27 (100.0%) |
| Public Administration | 0 (0.0%) | 0 (0.0%) |
| Total | 3 (7.1%) | 39 (92.9%) |
Education in Lemannville
School Enrollment in Lemannville
The most common levels of schooling among the 97 students in Lemannville are high school (37 | 38.1%), nursery / preschool (27 | 27.8%), and elementary school (20 | 20.6%).
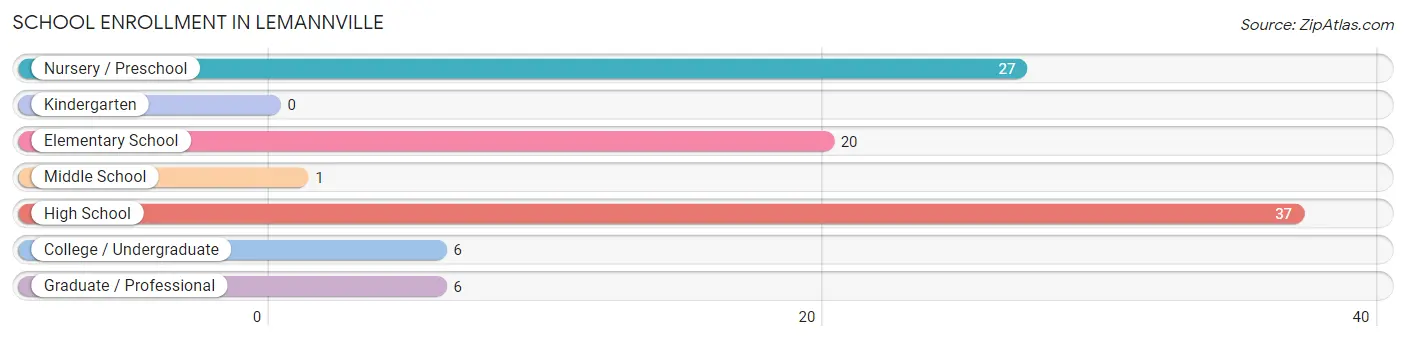
| School Level | # Students | % Students |
| Nursery / Preschool | 27 | 27.8% |
| Kindergarten | 0 | 0.0% |
| Elementary School | 20 | 20.6% |
| Middle School | 1 | 1.0% |
| High School | 37 | 38.1% |
| College / Undergraduate | 6 | 6.2% |
| Graduate / Professional | 6 | 6.2% |
| Total | 97 | 100.0% |
School Enrollment by Age by Funding Source in Lemannville
Out of a total of 97 students who are enrolled in schools in Lemannville, 13 (13.4%) attend a private institution, while the remaining 84 (86.6%) are enrolled in public schools. The age group of 35 years and over has the highest likelihood of being enrolled in private schools, with 6 (50.0% in the age bracket) enrolled. Conversely, the age group of 3 to 4 year olds has the lowest likelihood of being enrolled in a private school, with 27 (100.0% in the age bracket) attending a public institution.
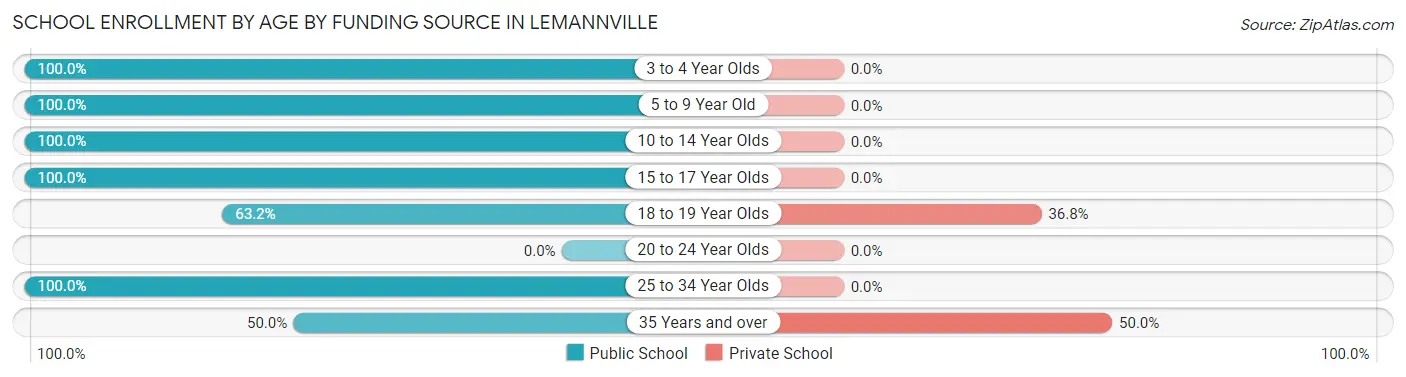
| Age Bracket | Public School | Private School |
| 3 to 4 Year Olds | 27 (100.0%) | 0 (0.0%) |
| 5 to 9 Year Old | 20 (100.0%) | 0 (0.0%) |
| 10 to 14 Year Olds | 1 (100.0%) | 0 (0.0%) |
| 15 to 17 Year Olds | 10 (100.0%) | 0 (0.0%) |
| 18 to 19 Year Olds | 12 (63.2%) | 7 (36.8%) |
| 20 to 24 Year Olds | 0 (0.0%) | 0 (0.0%) |
| 25 to 34 Year Olds | 8 (100.0%) | 0 (0.0%) |
| 35 Years and over | 6 (50.0%) | 6 (50.0%) |
| Total | 84 (86.6%) | 13 (13.4%) |
Educational Attainment by Field of Study in Lemannville
, and education (6 | 100.0%) are the most common fields of study among 6 individuals in Lemannville who have obtained a bachelor's degree or higher.

| Field of Study | # Graduates | % Graduates |
| Computers & Mathematics | 0 | 0.0% |
| Bio, Nature & Agricultural | 0 | 0.0% |
| Physical & Health Sciences | 0 | 0.0% |
| Psychology | 0 | 0.0% |
| Social Sciences | 0 | 0.0% |
| Engineering | 0 | 0.0% |
| Multidisciplinary Studies | 0 | 0.0% |
| Science & Technology | 0 | 0.0% |
| Business | 0 | 0.0% |
| Education | 6 | 100.0% |
| Literature & Languages | 0 | 0.0% |
| Liberal Arts & History | 0 | 0.0% |
| Visual & Performing Arts | 0 | 0.0% |
| Communications | 0 | 0.0% |
| Arts & Humanities | 0 | 0.0% |
| Total | 6 | 100.0% |
Transportation & Commute in Lemannville
Vehicle Availability by Sex in Lemannville
The most prevalent vehicle ownership categories in Lemannville are males with 4 vehicles (3, accounting for 100.0%) and females with 4 vehicles (6, making up 7.7%).
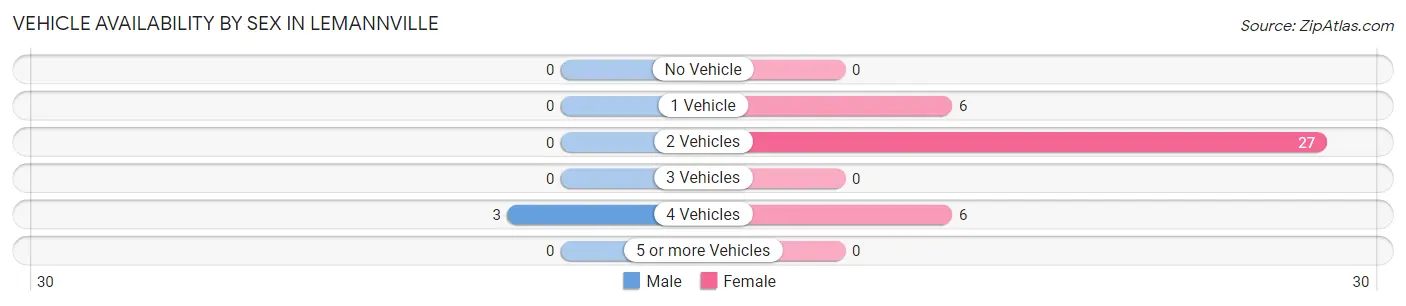
| Vehicles Available | Male | Female |
| No Vehicle | 0 (0.0%) | 0 (0.0%) |
| 1 Vehicle | 0 (0.0%) | 6 (15.4%) |
| 2 Vehicles | 0 (0.0%) | 27 (69.2%) |
| 3 Vehicles | 0 (0.0%) | 0 (0.0%) |
| 4 Vehicles | 3 (100.0%) | 6 (15.4%) |
| 5 or more Vehicles | 0 (0.0%) | 0 (0.0%) |
| Total | 3 (100.0%) | 39 (100.0%) |
Commute Time in Lemannville
The most frequently occuring commute durations in Lemannville are 45 to 59 minutes (33 commuters, 78.6%), 60 to 89 minutes (6 commuters, 14.3%), and 10 to 14 minutes (3 commuters, 7.1%).
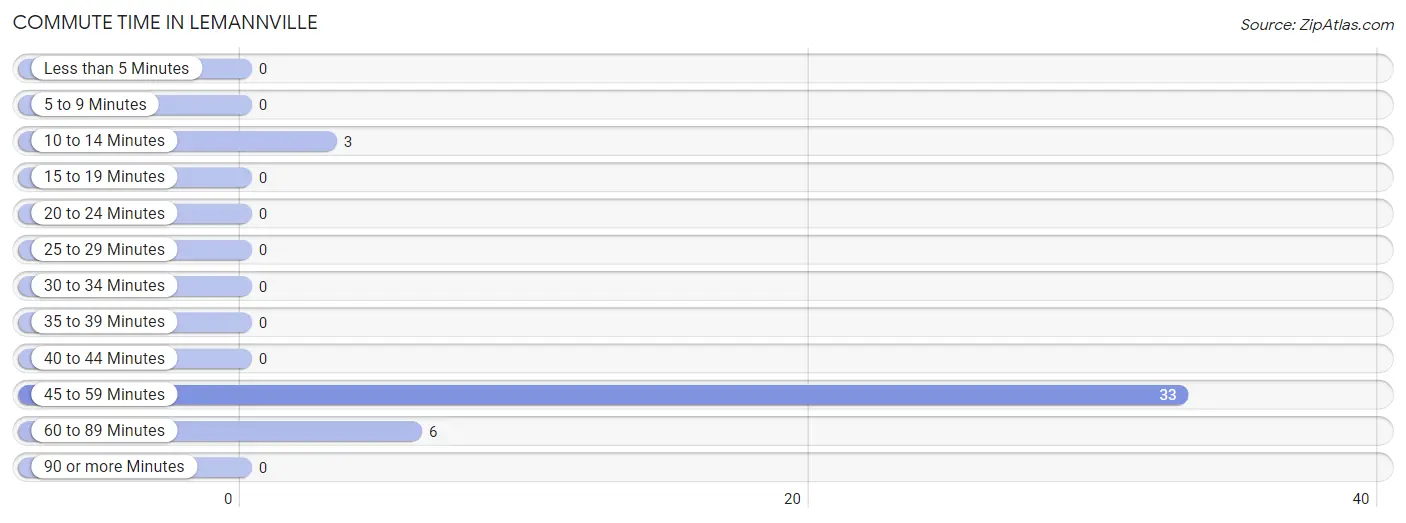
| Commute Time | # Commuters | % Commuters |
| Less than 5 Minutes | 0 | 0.0% |
| 5 to 9 Minutes | 0 | 0.0% |
| 10 to 14 Minutes | 3 | 7.1% |
| 15 to 19 Minutes | 0 | 0.0% |
| 20 to 24 Minutes | 0 | 0.0% |
| 25 to 29 Minutes | 0 | 0.0% |
| 30 to 34 Minutes | 0 | 0.0% |
| 35 to 39 Minutes | 0 | 0.0% |
| 40 to 44 Minutes | 0 | 0.0% |
| 45 to 59 Minutes | 33 | 78.6% |
| 60 to 89 Minutes | 6 | 14.3% |
| 90 or more Minutes | 0 | 0.0% |
Commute Time by Sex in Lemannville
The most common commute times in Lemannville are 10 to 14 minutes (3 commuters, 100.0%) for males and 45 to 59 minutes (33 commuters, 84.6%) for females.
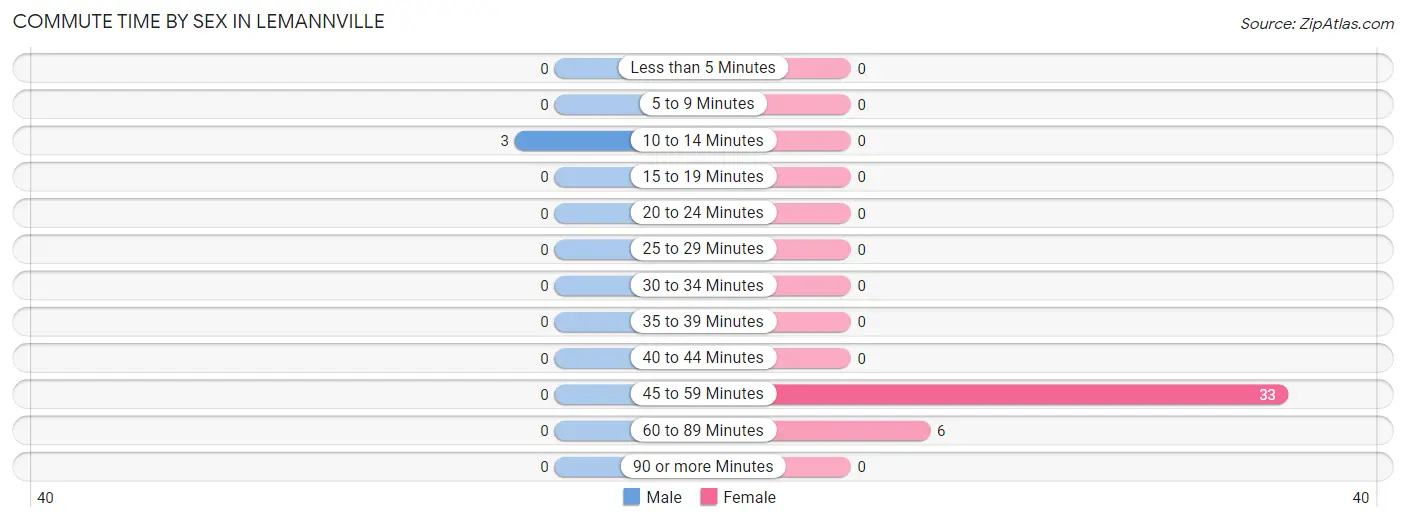
| Commute Time | Male | Female |
| Less than 5 Minutes | 0 (0.0%) | 0 (0.0%) |
| 5 to 9 Minutes | 0 (0.0%) | 0 (0.0%) |
| 10 to 14 Minutes | 3 (100.0%) | 0 (0.0%) |
| 15 to 19 Minutes | 0 (0.0%) | 0 (0.0%) |
| 20 to 24 Minutes | 0 (0.0%) | 0 (0.0%) |
| 25 to 29 Minutes | 0 (0.0%) | 0 (0.0%) |
| 30 to 34 Minutes | 0 (0.0%) | 0 (0.0%) |
| 35 to 39 Minutes | 0 (0.0%) | 0 (0.0%) |
| 40 to 44 Minutes | 0 (0.0%) | 0 (0.0%) |
| 45 to 59 Minutes | 0 (0.0%) | 33 (84.6%) |
| 60 to 89 Minutes | 0 (0.0%) | 6 (15.4%) |
| 90 or more Minutes | 0 (0.0%) | 0 (0.0%) |
Time of Departure to Work by Sex in Lemannville
The most frequent times of departure to work in Lemannville are 6:00 AM to 6:29 AM (3, 100.0%) for males and 4:00 PM to 11:59 PM (27, 69.2%) for females.
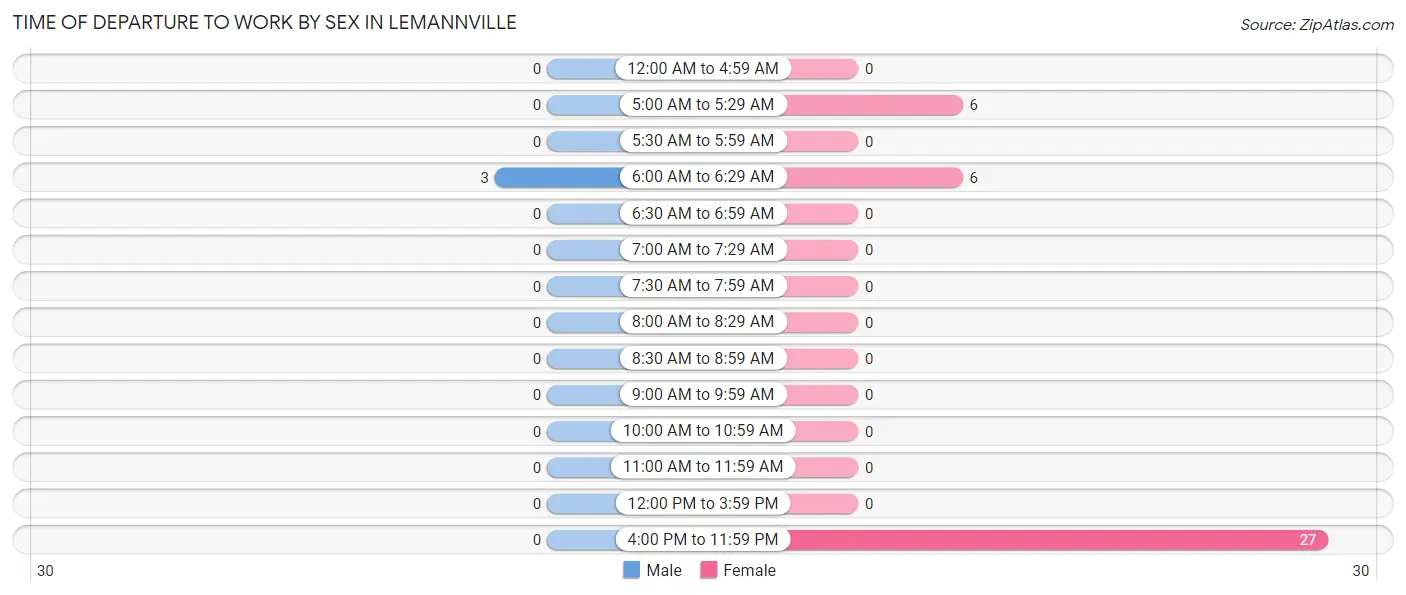
| Time of Departure | Male | Female |
| 12:00 AM to 4:59 AM | 0 (0.0%) | 0 (0.0%) |
| 5:00 AM to 5:29 AM | 0 (0.0%) | 6 (15.4%) |
| 5:30 AM to 5:59 AM | 0 (0.0%) | 0 (0.0%) |
| 6:00 AM to 6:29 AM | 3 (100.0%) | 6 (15.4%) |
| 6:30 AM to 6:59 AM | 0 (0.0%) | 0 (0.0%) |
| 7:00 AM to 7:29 AM | 0 (0.0%) | 0 (0.0%) |
| 7:30 AM to 7:59 AM | 0 (0.0%) | 0 (0.0%) |
| 8:00 AM to 8:29 AM | 0 (0.0%) | 0 (0.0%) |
| 8:30 AM to 8:59 AM | 0 (0.0%) | 0 (0.0%) |
| 9:00 AM to 9:59 AM | 0 (0.0%) | 0 (0.0%) |
| 10:00 AM to 10:59 AM | 0 (0.0%) | 0 (0.0%) |
| 11:00 AM to 11:59 AM | 0 (0.0%) | 0 (0.0%) |
| 12:00 PM to 3:59 PM | 0 (0.0%) | 0 (0.0%) |
| 4:00 PM to 11:59 PM | 0 (0.0%) | 27 (69.2%) |
| Total | 3 (100.0%) | 39 (100.0%) |
Housing Occupancy in Lemannville
Occupancy by Ownership in Lemannville
Of the total 37 dwellings in Lemannville, owner-occupied units account for 37 (100.0%), while renter-occupied units make up 0 (0.0%).
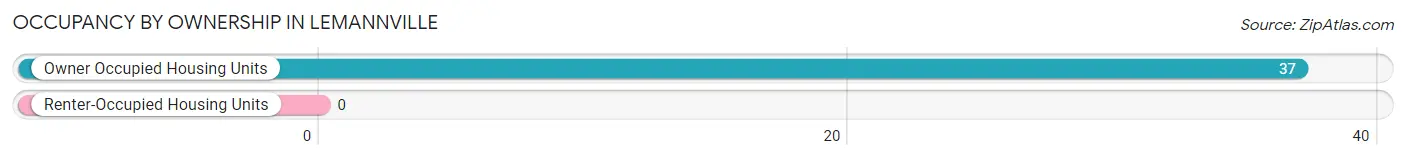
| Occupancy | # Housing Units | % Housing Units |
| Owner Occupied Housing Units | 37 | 100.0% |
| Renter-Occupied Housing Units | 0 | 0.0% |
| Total Occupied Housing Units | 37 | 100.0% |
Occupancy by Household Size in Lemannville
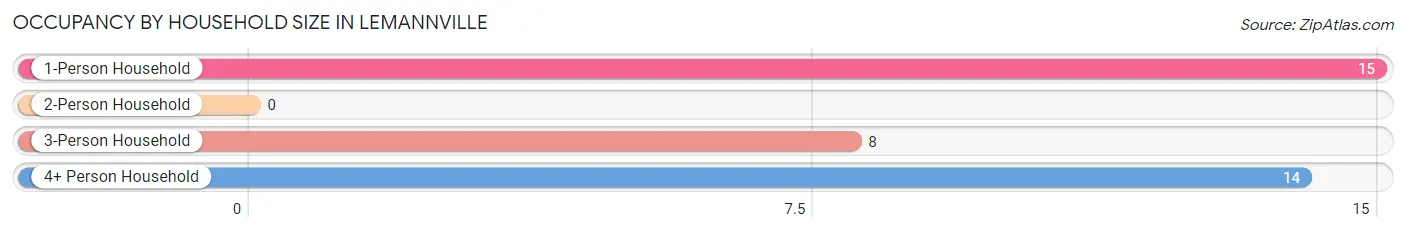
| Household Size | # Housing Units | % Housing Units |
| 1-Person Household | 15 | 40.5% |
| 2-Person Household | 0 | 0.0% |
| 3-Person Household | 8 | 21.6% |
| 4+ Person Household | 14 | 37.8% |
| Total Housing Units | 37 | 100.0% |
Occupancy by Ownership by Household Size in Lemannville
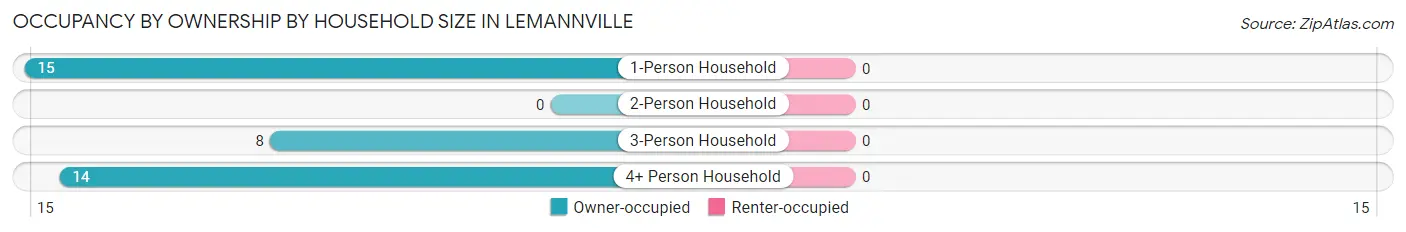
| Household Size | Owner-occupied | Renter-occupied |
| 1-Person Household | 15 (100.0%) | 0 (0.0%) |
| 2-Person Household | 0 (0.0%) | 0 (0.0%) |
| 3-Person Household | 8 (100.0%) | 0 (0.0%) |
| 4+ Person Household | 14 (100.0%) | 0 (0.0%) |
| Total Housing Units | 37 (100.0%) | 0 (0.0%) |
Occupancy by Educational Attainment in Lemannville
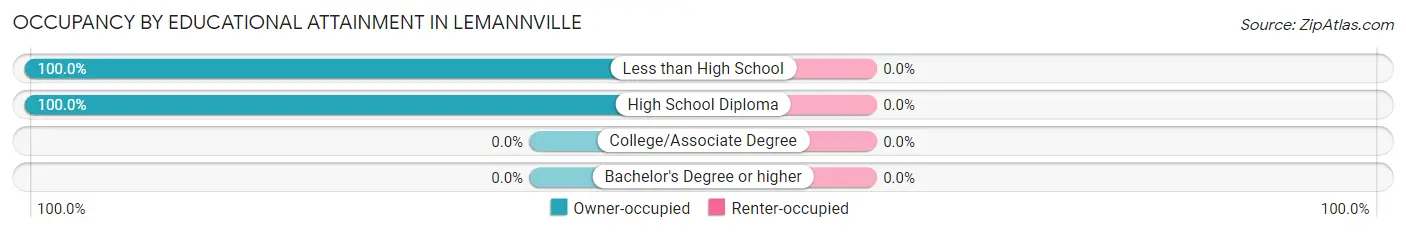
| Household Size | Owner-occupied | Renter-occupied |
| Less than High School | 6 (100.0%) | 0 (0.0%) |
| High School Diploma | 31 (100.0%) | 0 (0.0%) |
| College/Associate Degree | 0 (0.0%) | 0 (0.0%) |
| Bachelor's Degree or higher | 0 (0.0%) | 0 (0.0%) |
Occupancy by Age of Householder in Lemannville
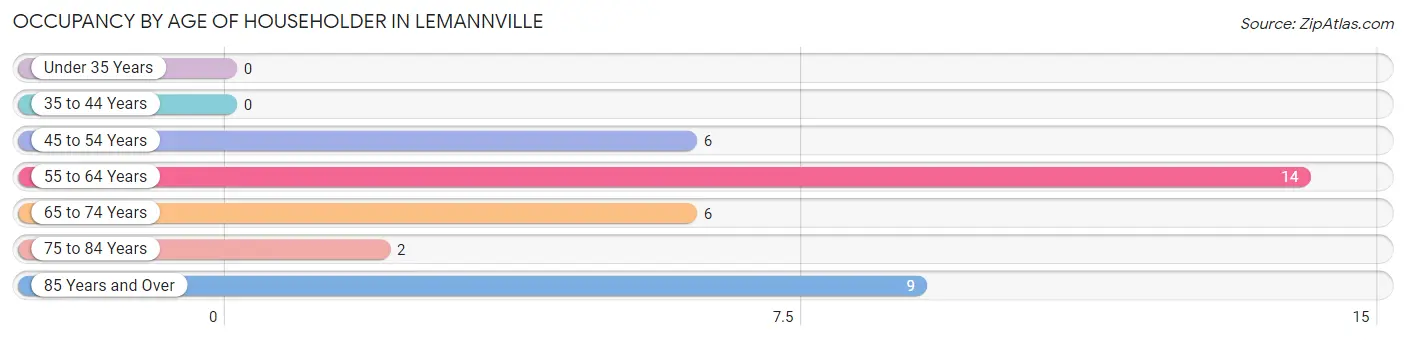
| Age Bracket | # Households | % Households |
| Under 35 Years | 0 | 0.0% |
| 35 to 44 Years | 0 | 0.0% |
| 45 to 54 Years | 6 | 16.2% |
| 55 to 64 Years | 14 | 37.8% |
| 65 to 74 Years | 6 | 16.2% |
| 75 to 84 Years | 2 | 5.4% |
| 85 Years and Over | 9 | 24.3% |
| Total | 37 | 100.0% |
Housing Finances in Lemannville
Median Income by Occupancy in Lemannville
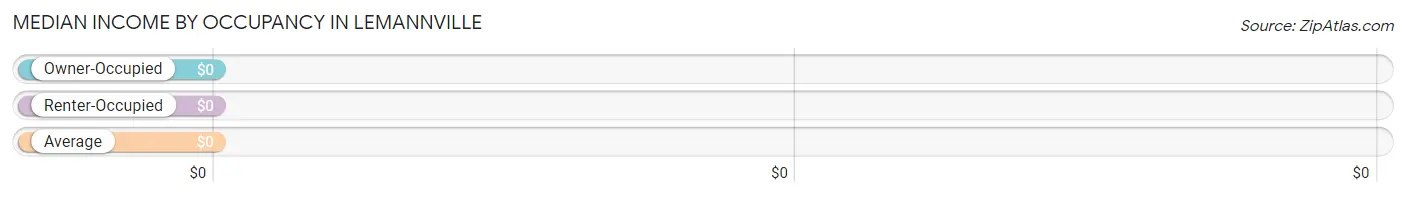
| Occupancy Type | # Households | Median Income |
| Owner-Occupied | 37 (100.0%) | $0 |
| Renter-Occupied | 0 (0.0%) | $0 |
| Average | 37 (100.0%) | $0 |
Occupancy by Householder Income Bracket in Lemannville
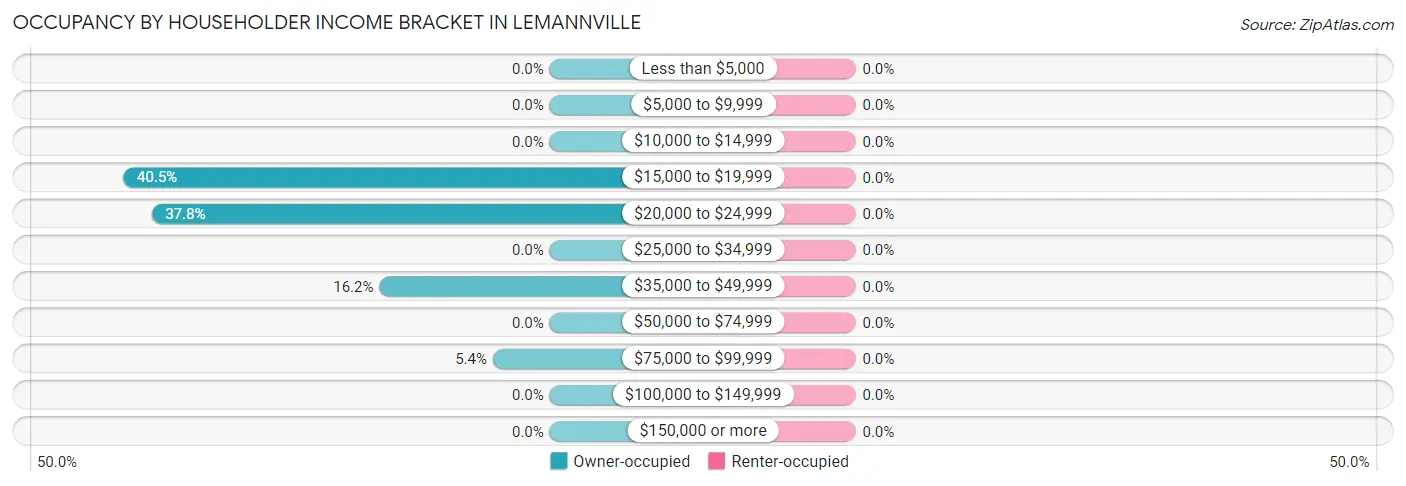
| Income Bracket | Owner-occupied | Renter-occupied |
| Less than $5,000 | 0 (0.0%) | 0 (0.0%) |
| $5,000 to $9,999 | 0 (0.0%) | 0 (0.0%) |
| $10,000 to $14,999 | 0 (0.0%) | 0 (0.0%) |
| $15,000 to $19,999 | 15 (40.5%) | 0 (0.0%) |
| $20,000 to $24,999 | 14 (37.8%) | 0 (0.0%) |
| $25,000 to $34,999 | 0 (0.0%) | 0 (0.0%) |
| $35,000 to $49,999 | 6 (16.2%) | 0 (0.0%) |
| $50,000 to $74,999 | 0 (0.0%) | 0 (0.0%) |
| $75,000 to $99,999 | 2 (5.4%) | 0 (0.0%) |
| $100,000 to $149,999 | 0 (0.0%) | 0 (0.0%) |
| $150,000 or more | 0 (0.0%) | 0 (0.0%) |
| Total | 37 (100.0%) | 0 (0.0%) |
Monthly Housing Cost Tiers in Lemannville
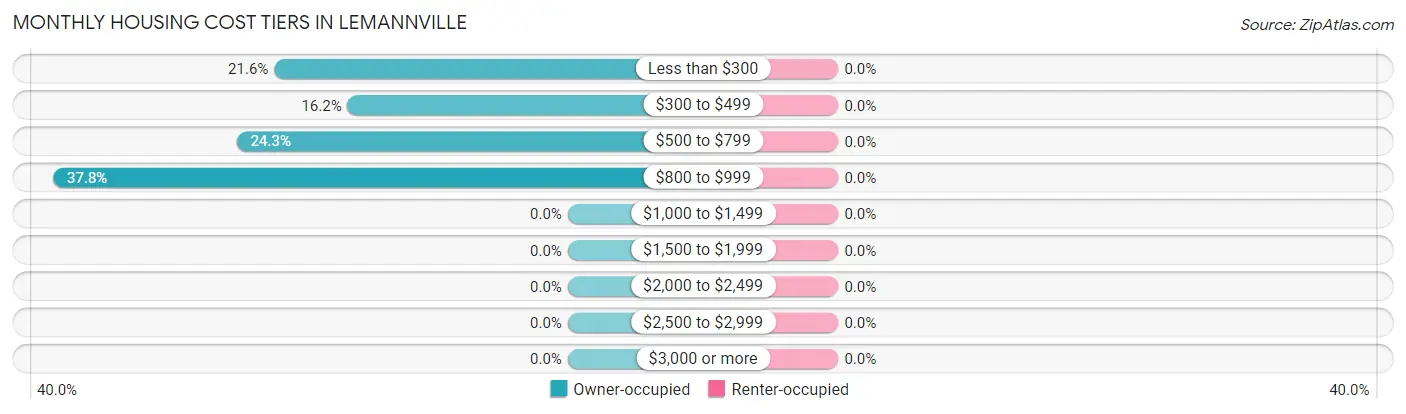
| Monthly Cost | Owner-occupied | Renter-occupied |
| Less than $300 | 8 (21.6%) | 0 (0.0%) |
| $300 to $499 | 6 (16.2%) | 0 (0.0%) |
| $500 to $799 | 9 (24.3%) | 0 (0.0%) |
| $800 to $999 | 14 (37.8%) | 0 (0.0%) |
| $1,000 to $1,499 | 0 (0.0%) | 0 (0.0%) |
| $1,500 to $1,999 | 0 (0.0%) | 0 (0.0%) |
| $2,000 to $2,499 | 0 (0.0%) | 0 (0.0%) |
| $2,500 to $2,999 | 0 (0.0%) | 0 (0.0%) |
| $3,000 or more | 0 (0.0%) | 0 (0.0%) |
| Total | 37 (100.0%) | 0 (0.0%) |
Physical Housing Characteristics in Lemannville
Housing Structures in Lemannville
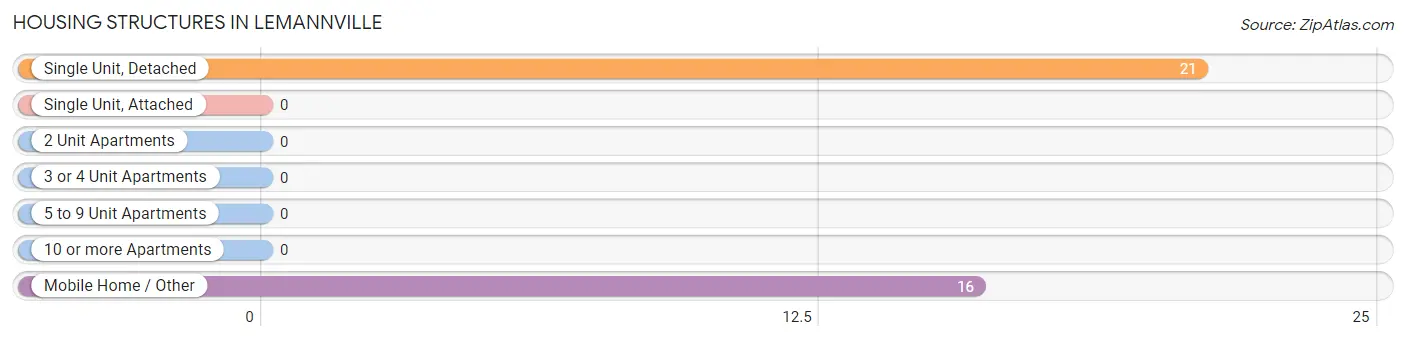
| Structure Type | # Housing Units | % Housing Units |
| Single Unit, Detached | 21 | 56.8% |
| Single Unit, Attached | 0 | 0.0% |
| 2 Unit Apartments | 0 | 0.0% |
| 3 or 4 Unit Apartments | 0 | 0.0% |
| 5 to 9 Unit Apartments | 0 | 0.0% |
| 10 or more Apartments | 0 | 0.0% |
| Mobile Home / Other | 16 | 43.2% |
| Total | 37 | 100.0% |
Housing Structures by Occupancy in Lemannville
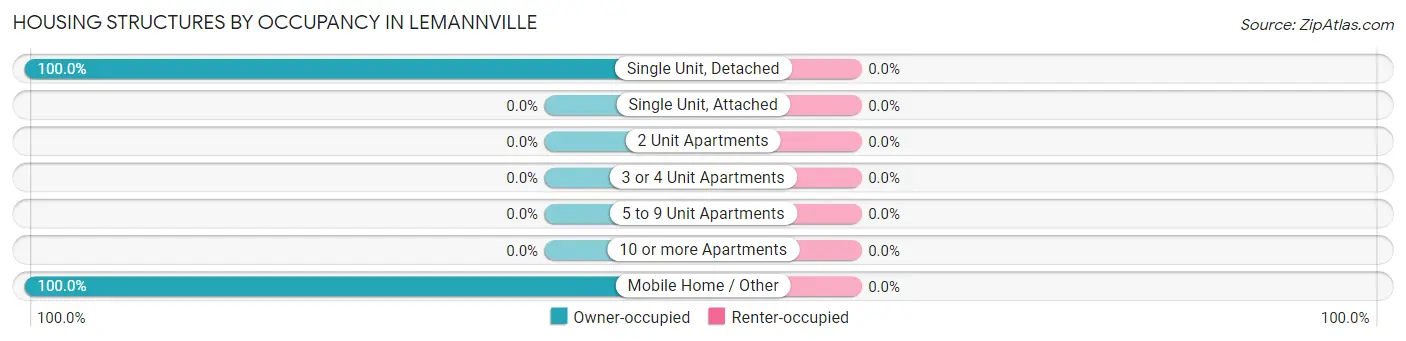
| Structure Type | Owner-occupied | Renter-occupied |
| Single Unit, Detached | 21 (100.0%) | 0 (0.0%) |
| Single Unit, Attached | 0 (0.0%) | 0 (0.0%) |
| 2 Unit Apartments | 0 (0.0%) | 0 (0.0%) |
| 3 or 4 Unit Apartments | 0 (0.0%) | 0 (0.0%) |
| 5 to 9 Unit Apartments | 0 (0.0%) | 0 (0.0%) |
| 10 or more Apartments | 0 (0.0%) | 0 (0.0%) |
| Mobile Home / Other | 16 (100.0%) | 0 (0.0%) |
| Total | 37 (100.0%) | 0 (0.0%) |
Housing Structures by Number of Rooms in Lemannville
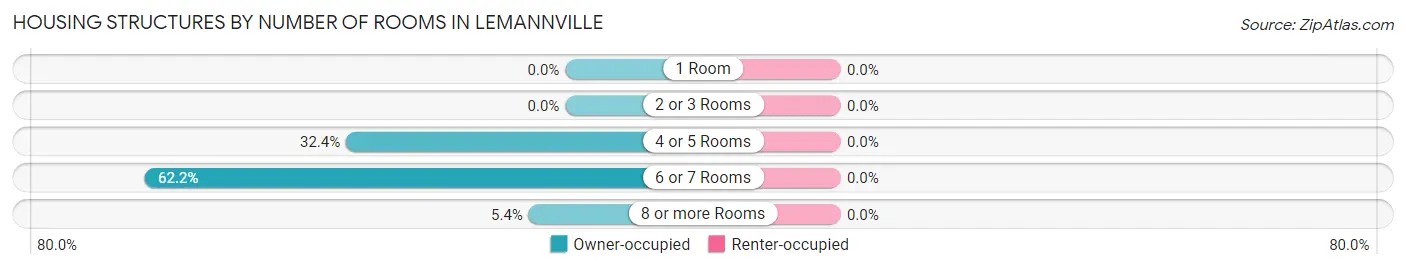
| Number of Rooms | Owner-occupied | Renter-occupied |
| 1 Room | 0 (0.0%) | 0 (0.0%) |
| 2 or 3 Rooms | 0 (0.0%) | 0 (0.0%) |
| 4 or 5 Rooms | 12 (32.4%) | 0 (0.0%) |
| 6 or 7 Rooms | 23 (62.2%) | 0 (0.0%) |
| 8 or more Rooms | 2 (5.4%) | 0 (0.0%) |
| Total | 37 (100.0%) | 0 (0.0%) |
Housing Structure by Heating Type in Lemannville
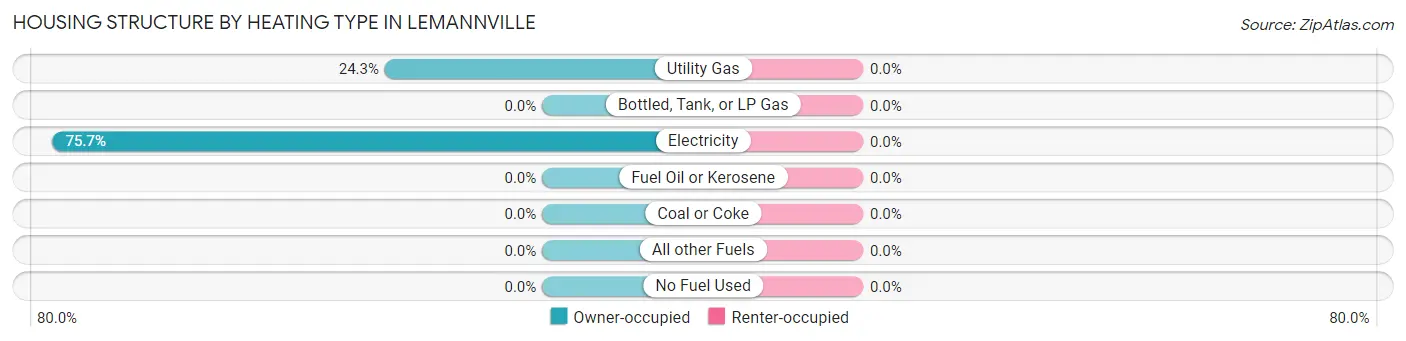
| Heating Type | Owner-occupied | Renter-occupied |
| Utility Gas | 9 (24.3%) | 0 (0.0%) |
| Bottled, Tank, or LP Gas | 0 (0.0%) | 0 (0.0%) |
| Electricity | 28 (75.7%) | 0 (0.0%) |
| Fuel Oil or Kerosene | 0 (0.0%) | 0 (0.0%) |
| Coal or Coke | 0 (0.0%) | 0 (0.0%) |
| All other Fuels | 0 (0.0%) | 0 (0.0%) |
| No Fuel Used | 0 (0.0%) | 0 (0.0%) |
| Total | 37 (100.0%) | 0 (0.0%) |
Household Vehicle Usage in Lemannville
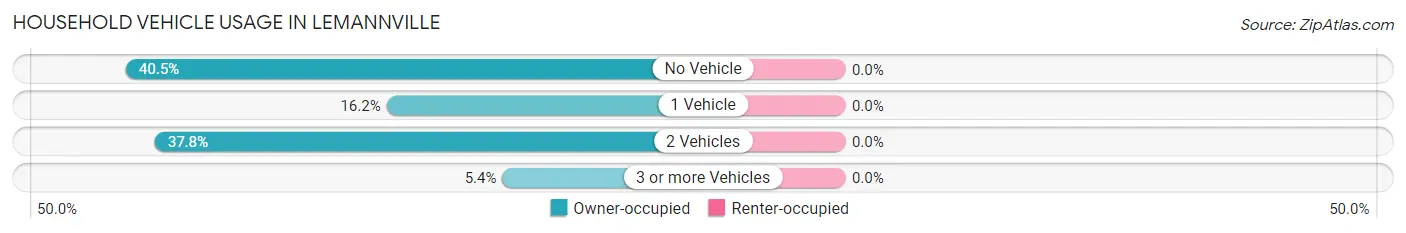
| Vehicles per Household | Owner-occupied | Renter-occupied |
| No Vehicle | 15 (40.5%) | 0 (0.0%) |
| 1 Vehicle | 6 (16.2%) | 0 (0.0%) |
| 2 Vehicles | 14 (37.8%) | 0 (0.0%) |
| 3 or more Vehicles | 2 (5.4%) | 0 (0.0%) |
| Total | 37 (100.0%) | 0 (0.0%) |
Real Estate & Mortgages in Lemannville
Real Estate and Mortgage Overview in Lemannville
| Characteristic | Without Mortgage | With Mortgage |
| Housing Units | 23 | 14 |
| Median Property Value | $109,700 | $0 |
| Median Household Income | - | - |
| Monthly Housing Costs | - | - |
| Real Estate Taxes | - | - |
Property Value by Mortgage Status in Lemannville
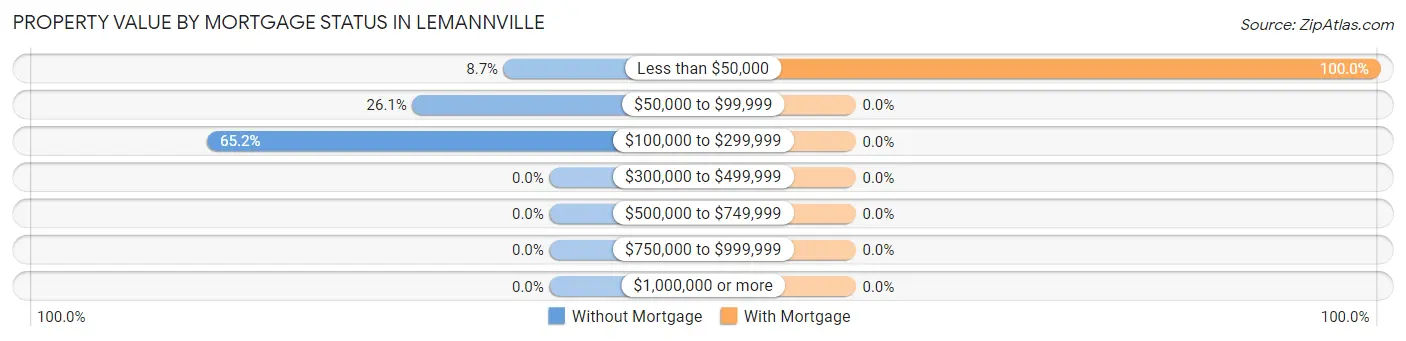
| Property Value | Without Mortgage | With Mortgage |
| Less than $50,000 | 2 (8.7%) | 14 (100.0%) |
| $50,000 to $99,999 | 6 (26.1%) | 0 (0.0%) |
| $100,000 to $299,999 | 15 (65.2%) | 0 (0.0%) |
| $300,000 to $499,999 | 0 (0.0%) | 0 (0.0%) |
| $500,000 to $749,999 | 0 (0.0%) | 0 (0.0%) |
| $750,000 to $999,999 | 0 (0.0%) | 0 (0.0%) |
| $1,000,000 or more | 0 (0.0%) | 0 (0.0%) |
| Total | 23 (100.0%) | 14 (100.0%) |
Household Income by Mortgage Status in Lemannville
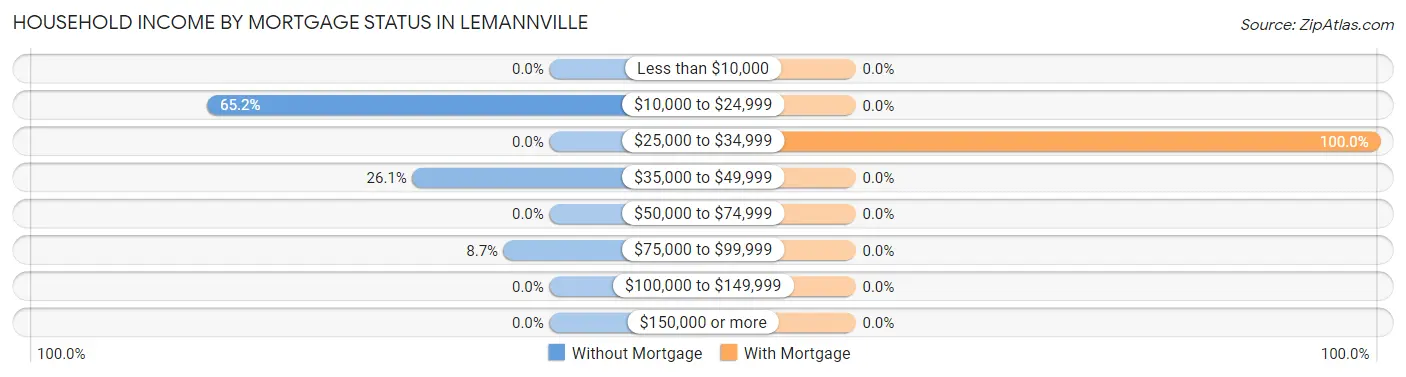
| Household Income | Without Mortgage | With Mortgage |
| Less than $10,000 | 0 (0.0%) | 0 (0.0%) |
| $10,000 to $24,999 | 15 (65.2%) | 0 (0.0%) |
| $25,000 to $34,999 | 0 (0.0%) | 14 (100.0%) |
| $35,000 to $49,999 | 6 (26.1%) | 0 (0.0%) |
| $50,000 to $74,999 | 0 (0.0%) | 0 (0.0%) |
| $75,000 to $99,999 | 2 (8.7%) | 0 (0.0%) |
| $100,000 to $149,999 | 0 (0.0%) | 0 (0.0%) |
| $150,000 or more | 0 (0.0%) | 0 (0.0%) |
| Total | 23 (100.0%) | 14 (100.0%) |
Property Value to Household Income Ratio in Lemannville
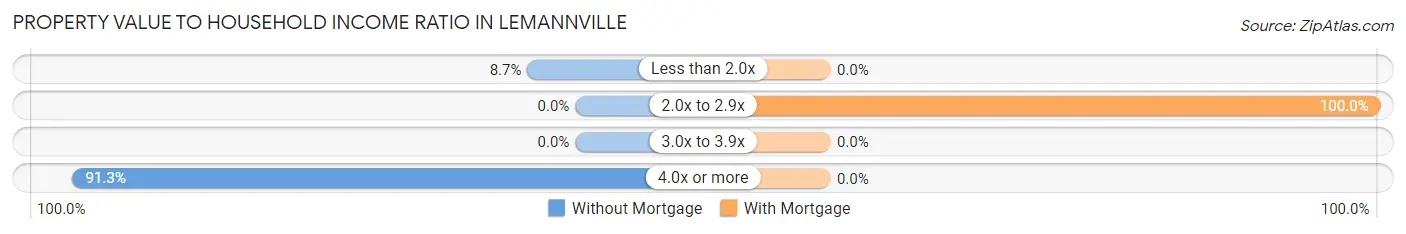
| Value-to-Income Ratio | Without Mortgage | With Mortgage |
| Less than 2.0x | 2 (8.7%) | 0 (0.0%) |
| 2.0x to 2.9x | 0 (0.0%) | 14 (100.0%) |
| 3.0x to 3.9x | 0 (0.0%) | 0 (0.0%) |
| 4.0x or more | 21 (91.3%) | 0 (0.0%) |
| Total | 23 (100.0%) | 14 (100.0%) |
Real Estate Taxes by Mortgage Status in Lemannville
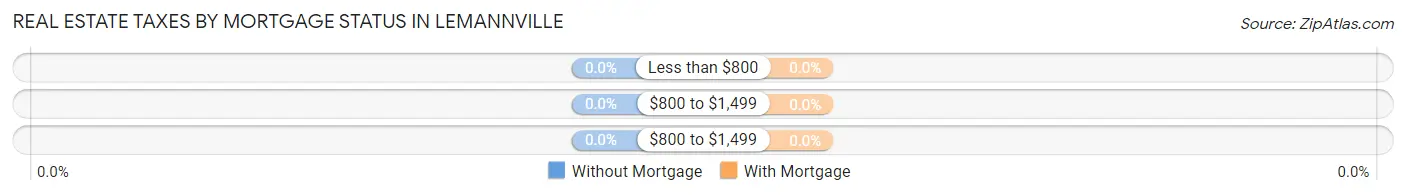
| Property Taxes | Without Mortgage | With Mortgage |
| Less than $800 | 0 (0.0%) | 0 (0.0%) |
| $800 to $1,499 | 0 (0.0%) | 0 (0.0%) |
| $800 to $1,499 | 0 (0.0%) | 0 (0.0%) |
| Total | 23 (100.0%) | 14 (100.0%) |
Health & Disability in Lemannville
Health Insurance Coverage by Age in Lemannville
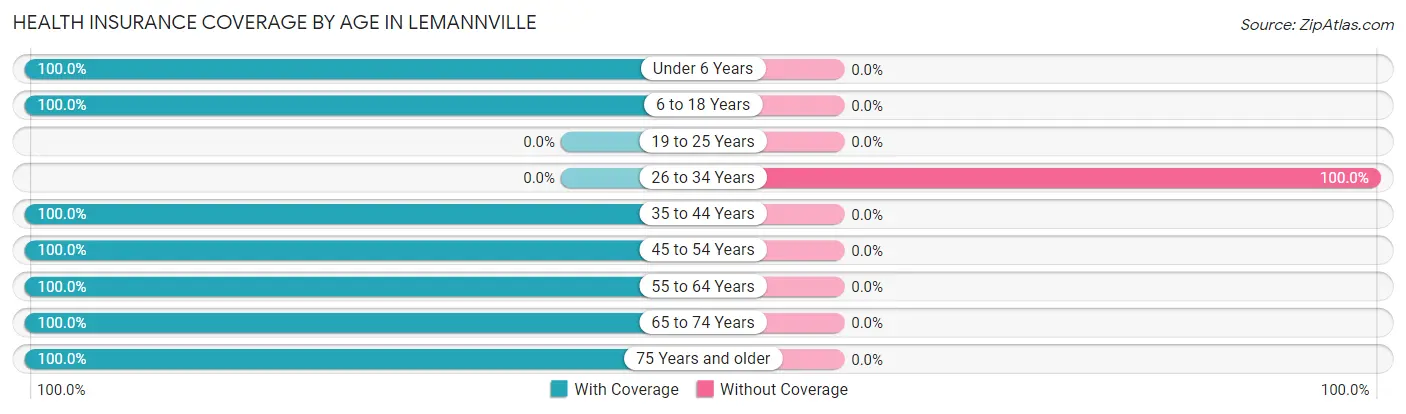
| Age Bracket | With Coverage | Without Coverage |
| Under 6 Years | 27 (100.0%) | 0 (0.0%) |
| 6 to 18 Years | 20 (100.0%) | 0 (0.0%) |
| 19 to 25 Years | 0 (0.0%) | 0 (0.0%) |
| 26 to 34 Years | 0 (0.0%) | 3 (100.0%) |
| 35 to 44 Years | 27 (100.0%) | 0 (0.0%) |
| 45 to 54 Years | 12 (100.0%) | 0 (0.0%) |
| 55 to 64 Years | 14 (100.0%) | 0 (0.0%) |
| 65 to 74 Years | 14 (100.0%) | 0 (0.0%) |
| 75 Years and older | 11 (100.0%) | 0 (0.0%) |
| Total | 125 (97.7%) | 3 (2.3%) |
Health Insurance Coverage by Citizenship Status in Lemannville
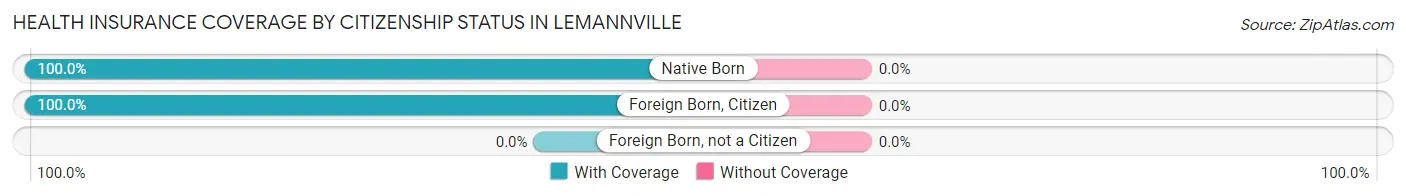
| Citizenship Status | With Coverage | Without Coverage |
| Native Born | 27 (100.0%) | 0 (0.0%) |
| Foreign Born, Citizen | 20 (100.0%) | 0 (0.0%) |
| Foreign Born, not a Citizen | 0 (0.0%) | 0 (0.0%) |
Health Insurance Coverage by Household Income in Lemannville
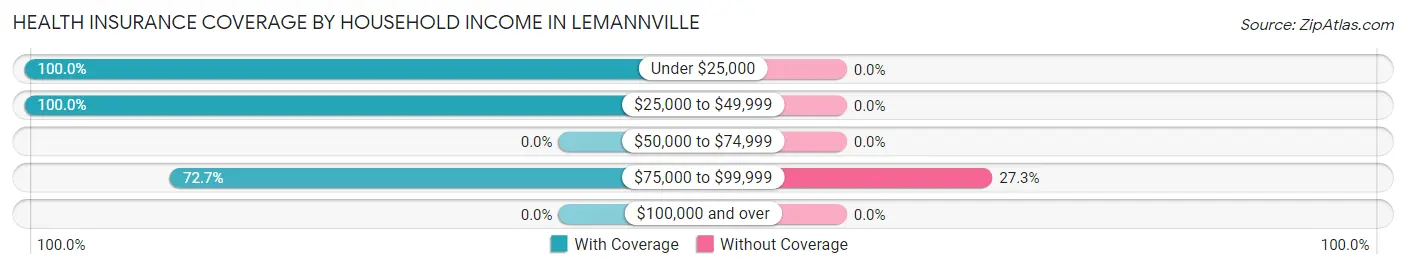
| Household Income | With Coverage | Without Coverage |
| Under $25,000 | 111 (100.0%) | 0 (0.0%) |
| $25,000 to $49,999 | 6 (100.0%) | 0 (0.0%) |
| $50,000 to $74,999 | 0 (0.0%) | 0 (0.0%) |
| $75,000 to $99,999 | 8 (72.7%) | 3 (27.3%) |
| $100,000 and over | 0 (0.0%) | 0 (0.0%) |
Public vs Private Health Insurance Coverage by Age in Lemannville
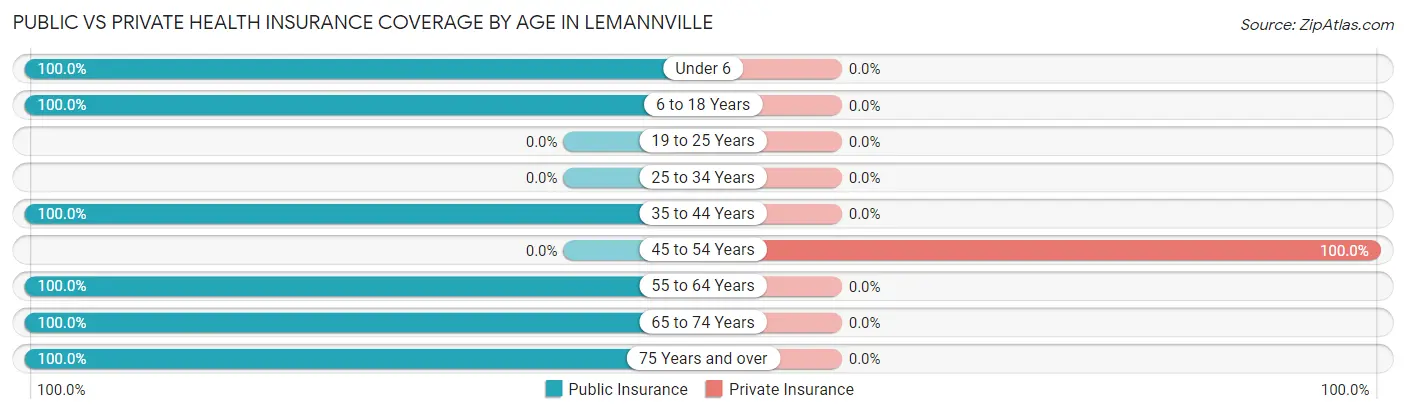
| Age Bracket | Public Insurance | Private Insurance |
| Under 6 | 27 (100.0%) | 0 (0.0%) |
| 6 to 18 Years | 20 (100.0%) | 0 (0.0%) |
| 19 to 25 Years | 0 (0.0%) | 0 (0.0%) |
| 25 to 34 Years | 0 (0.0%) | 0 (0.0%) |
| 35 to 44 Years | 27 (100.0%) | 0 (0.0%) |
| 45 to 54 Years | 0 (0.0%) | 12 (100.0%) |
| 55 to 64 Years | 14 (100.0%) | 0 (0.0%) |
| 65 to 74 Years | 14 (100.0%) | 0 (0.0%) |
| 75 Years and over | 11 (100.0%) | 0 (0.0%) |
| Total | 113 (88.3%) | 12 (9.4%) |
Disability Status by Sex by Age in Lemannville
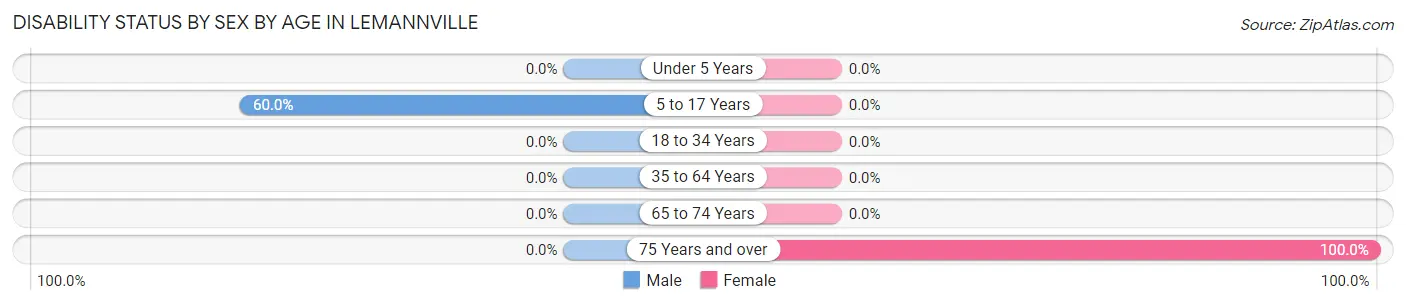
| Age Bracket | Male | Female |
| Under 5 Years | 0 (0.0%) | 0 (0.0%) |
| 5 to 17 Years | 12 (60.0%) | 0 (0.0%) |
| 18 to 34 Years | 0 (0.0%) | 0 (0.0%) |
| 35 to 64 Years | 0 (0.0%) | 0 (0.0%) |
| 65 to 74 Years | 0 (0.0%) | 0 (0.0%) |
| 75 Years and over | 0 (0.0%) | 11 (100.0%) |
Disability Class by Sex by Age in Lemannville
Disability Class: Hearing Difficulty
| Age Bracket | Male | Female |
| Under 5 Years | 0 (0.0%) | 0 (0.0%) |
| 5 to 17 Years | 0 (0.0%) | 0 (0.0%) |
| 18 to 34 Years | 0 (0.0%) | 0 (0.0%) |
| 35 to 64 Years | 0 (0.0%) | 0 (0.0%) |
| 65 to 74 Years | 0 (0.0%) | 0 (0.0%) |
| 75 Years and over | 0 (0.0%) | 0 (0.0%) |
Disability Class: Vision Difficulty
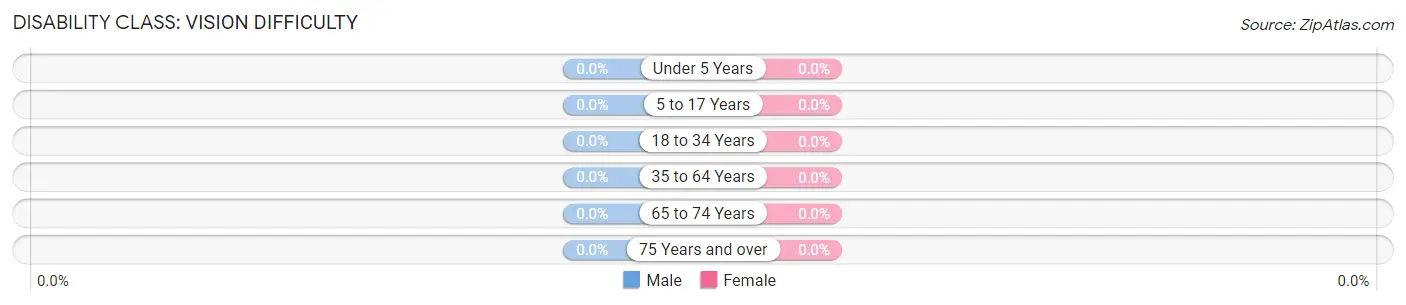
| Age Bracket | Male | Female |
| Under 5 Years | 0 (0.0%) | 0 (0.0%) |
| 5 to 17 Years | 0 (0.0%) | 0 (0.0%) |
| 18 to 34 Years | 0 (0.0%) | 0 (0.0%) |
| 35 to 64 Years | 0 (0.0%) | 0 (0.0%) |
| 65 to 74 Years | 0 (0.0%) | 0 (0.0%) |
| 75 Years and over | 0 (0.0%) | 0 (0.0%) |
Disability Class: Cognitive Difficulty
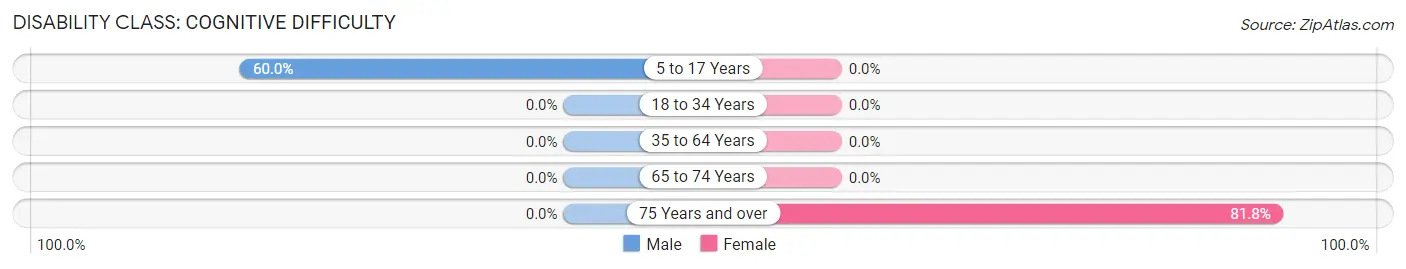
| Age Bracket | Male | Female |
| 5 to 17 Years | 12 (60.0%) | 0 (0.0%) |
| 18 to 34 Years | 0 (0.0%) | 0 (0.0%) |
| 35 to 64 Years | 0 (0.0%) | 0 (0.0%) |
| 65 to 74 Years | 0 (0.0%) | 0 (0.0%) |
| 75 Years and over | 0 (0.0%) | 9 (81.8%) |
Disability Class: Ambulatory Difficulty
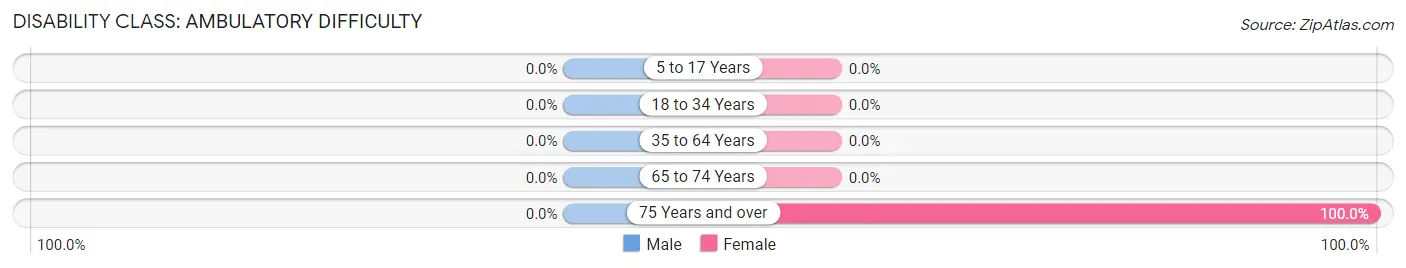
| Age Bracket | Male | Female |
| 5 to 17 Years | 0 (0.0%) | 0 (0.0%) |
| 18 to 34 Years | 0 (0.0%) | 0 (0.0%) |
| 35 to 64 Years | 0 (0.0%) | 0 (0.0%) |
| 65 to 74 Years | 0 (0.0%) | 0 (0.0%) |
| 75 Years and over | 0 (0.0%) | 11 (100.0%) |
Disability Class: Self-Care Difficulty
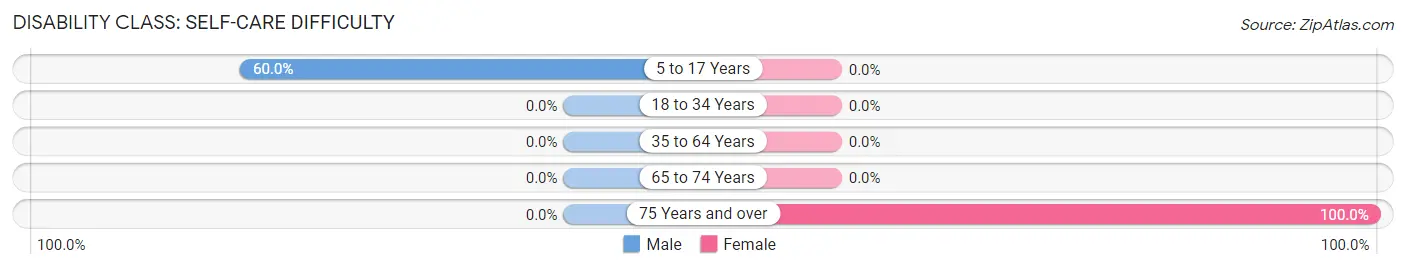
| Age Bracket | Male | Female |
| 5 to 17 Years | 12 (60.0%) | 0 (0.0%) |
| 18 to 34 Years | 0 (0.0%) | 0 (0.0%) |
| 35 to 64 Years | 0 (0.0%) | 0 (0.0%) |
| 65 to 74 Years | 0 (0.0%) | 0 (0.0%) |
| 75 Years and over | 0 (0.0%) | 11 (100.0%) |
Technology Access in Lemannville
Computing Device Access in Lemannville
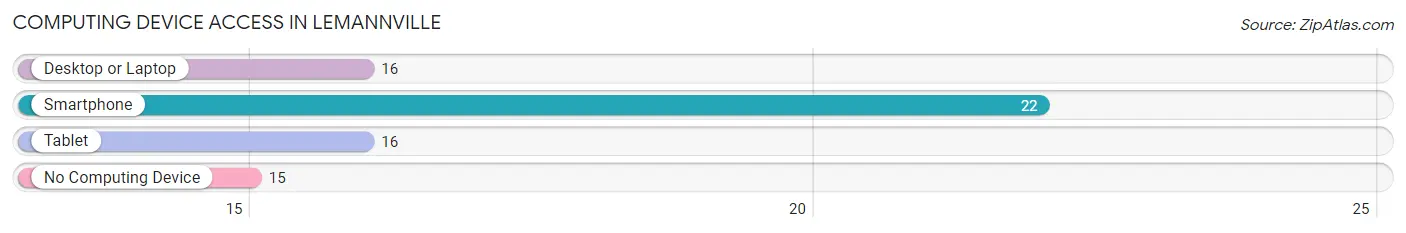
| Device Type | # Households | % Households |
| Desktop or Laptop | 16 | 43.2% |
| Smartphone | 22 | 59.5% |
| Tablet | 16 | 43.2% |
| No Computing Device | 15 | 40.5% |
| Total | 37 | 100.0% |
Internet Access in Lemannville
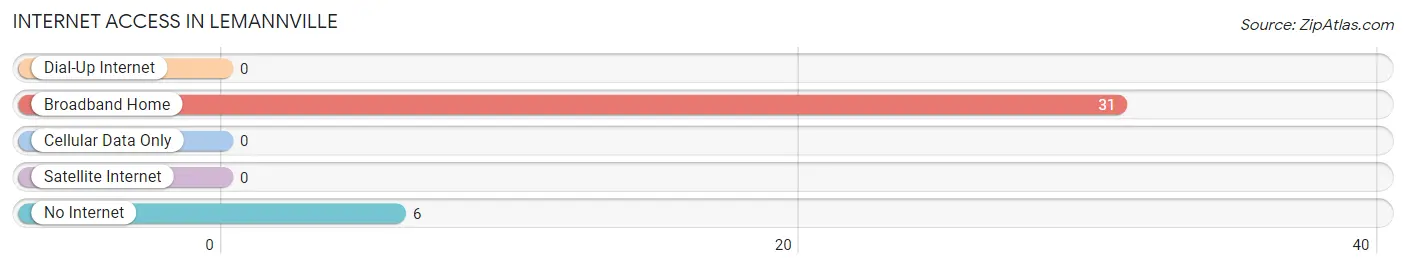
| Internet Type | # Households | % Households |
| Dial-Up Internet | 0 | 0.0% |
| Broadband Home | 31 | 83.8% |
| Cellular Data Only | 0 | 0.0% |
| Satellite Internet | 0 | 0.0% |
| No Internet | 6 | 16.2% |
| Total | 37 | 100.0% |
Lemannville Summary
Lemannville is a small town located in the state of Louisiana, United States. It is situated in the parish of St. Charles, and is part of the New Orleans-Metairie-Kenner Metropolitan Statistical Area. The town has a population of approximately 1,000 people, and is located on the banks of the Mississippi River.
History
Lemannville was founded in 1845 by German immigrant, John Lemann. He purchased the land from the local Native American tribes and established a small trading post. The town quickly grew and became a popular destination for travelers and traders. In 1852, the town was officially incorporated and named after its founder.
In the late 19th century, Lemannville became a popular destination for wealthy plantation owners. The town was home to several large plantations, and the economy was largely based on the production of cotton and sugar. The town also had a thriving riverboat industry, and was a popular stop for steamboats traveling up and down the Mississippi River.
In the early 20th century, the town experienced a period of decline. The Great Depression hit the town hard, and many of the plantations closed. The riverboat industry also declined, and the town’s population began to dwindle.
In the 1950s, the town experienced a resurgence. The economy began to diversify, and the town became a popular tourist destination. The town also began to attract new businesses, and the population began to grow again.
Geography
Lemannville is located in the southeastern part of the state of Louisiana. It is situated in the parish of St. Charles, and is part of the New Orleans-Metairie-Kenner Metropolitan Statistical Area. The town is located on the banks of the Mississippi River, and is surrounded by swampland and marshland.
The town has a humid subtropical climate, with hot and humid summers and mild winters. The average temperature in the summer is around 90°F, and the average temperature in the winter is around 50°F. The town receives an average of 60 inches of rain per year.
Economy
The economy of Lemannville is largely based on tourism and agriculture. The town is home to several large plantations, and the production of cotton and sugar is still a major part of the local economy. The town also has a thriving riverboat industry, and is a popular stop for steamboats traveling up and down the Mississippi River.
The town is also home to several small businesses, including restaurants, shops, and other services. The town is also home to a small airport, which serves as a hub for private and commercial flights.
Demographics
As of the 2010 census, the population of Lemannville was 1,000 people. The town is predominantly white, with a small African American population. The median household income is $45,000, and the median home value is $150,000. The town has a high rate of poverty, with approximately 25% of the population living below the poverty line.
Common Questions
What is Per Capita Income in Lemannville?
Per Capita income in Lemannville is $11,468.
What is the Median Family Income in Lemannville?
Median Family Income in Lemannville is $11,964.
What is Inequality or Gini Index in Lemannville?
Inequality or Gini Index in Lemannville is 0.26.
What is the Total Population of Lemannville?
Total Population of Lemannville is 662.
What is the Total Male Population of Lemannville?
Total Male Population of Lemannville is 545.
What is the Total Female Population of Lemannville?
Total Female Population of Lemannville is 117.
What is the Ratio of Males per 100 Females in Lemannville?
There are 465.81 Males per 100 Females in Lemannville.
What is the Ratio of Females per 100 Males in Lemannville?
There are 21.47 Females per 100 Males in Lemannville.
What is the Median Population Age in Lemannville?
Median Population Age in Lemannville is 34.5 Years.
What is the Average Family Size in Lemannville
Average Family Size in Lemannville is 3.9 People.
What is the Average Household Size in Lemannville
Average Household Size in Lemannville is 3.5 People.
How Large is the Labor Force in Lemannville?
There are 42 People in the Labor Forcein in Lemannville.
What is the Percentage of People in the Labor Force in Lemannville?
6.8% of People are in the Labor Force in Lemannville.