Del Muerto, AZ Map & Demographics
Del Muerto Map
Del Muerto Overview
$13,070
PER CAPITA INCOME
$26,974
AVG FAMILY INCOME
$26,974
AVG HOUSEHOLD INCOME
0.31
INEQUALITY / GINI INDEX
515
TOTAL POPULATION
194
MALE POPULATION
321
FEMALE POPULATION
60.44
MALES / 100 FEMALES
165.46
FEMALES / 100 MALES
46.2
MEDIAN AGE
3.2
AVG FAMILY SIZE
2.9
AVG HOUSEHOLD SIZE
119
LABOR FORCE [ PEOPLE ]
27.2%
PERCENT IN LABOR FORCE
Income in Del Muerto
Income Overview in Del Muerto
Per Capita Income in Del Muerto is $13,070, while median incomes of families and households are $26,974 and $26,974 respectively.
| Characteristic | Number | Measure |
| Per Capita Income | 515 | $13,070 |
| Median Family Income | 154 | $26,974 |
| Mean Family Income | 154 | $36,077 |
| Median Household Income | 180 | $26,974 |
| Mean Household Income | 180 | $33,616 |
| Income Deficit | 154 | $0 |
| Wage / Income Gap (%) | 515 | 0.00% |
| Wage / Income Gap ($) | 515 | 100.00¢ per $1 |
| Gini / Inequality Index | 515 | 0.31 |
Earnings by Sex in Del Muerto
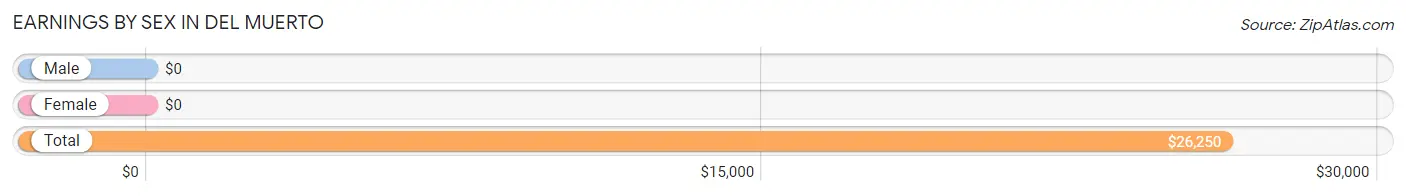
| Sex | Number | Average Earnings |
| Male | 27 (22.7%) | $0 |
| Female | 92 (77.3%) | $0 |
| Total | 119 (100.0%) | $26,250 |
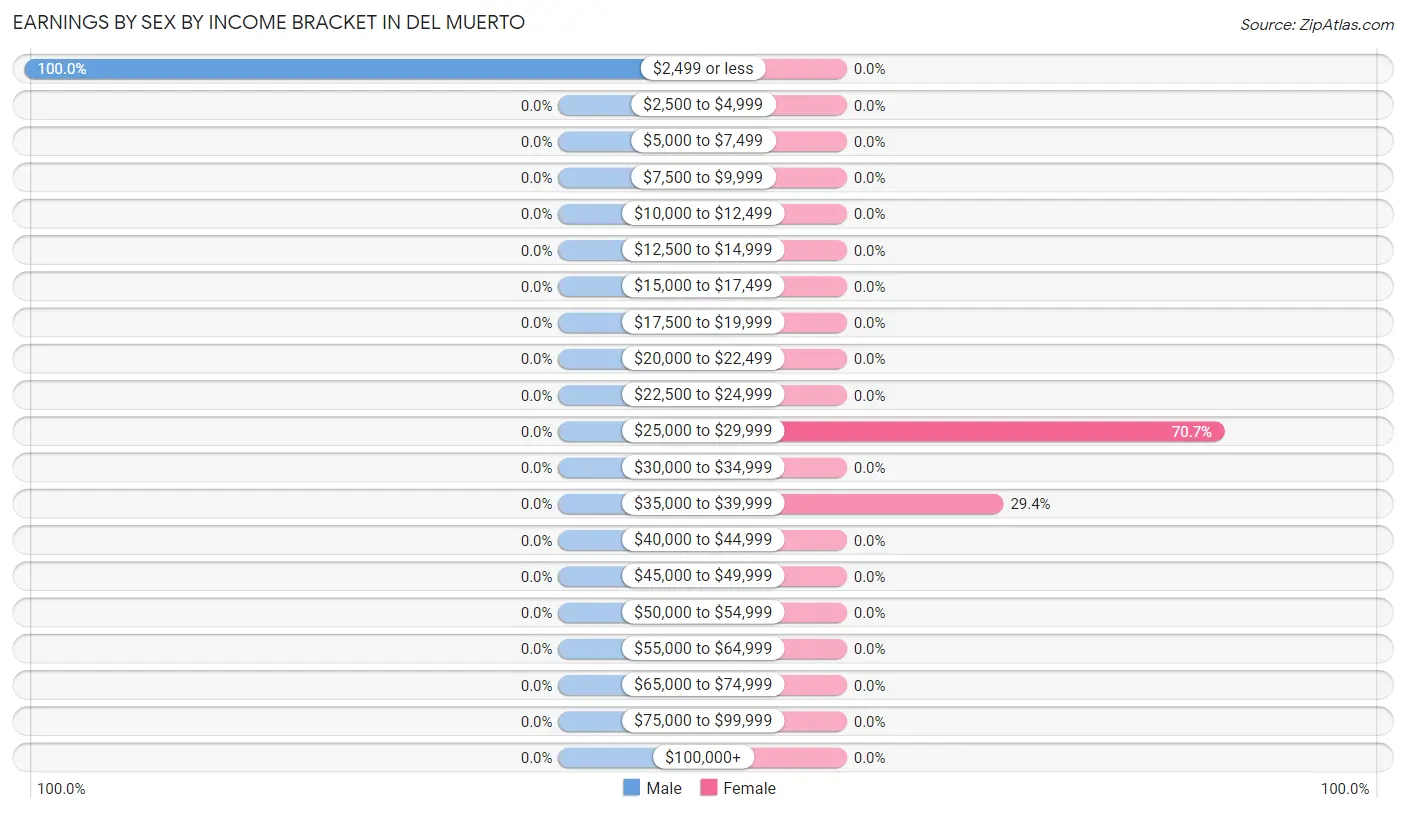
Earnings by Sex by Income Bracket in Del Muerto
The most common earnings brackets in Del Muerto are $2,499 or less for men (27 | 100.0%) and $25,000 to $29,999 for women (65 | 70.7%).
| Income | Male | Female |
| $2,499 or less | 27 (100.0%) | 0 (0.0%) |
| $2,500 to $4,999 | 0 (0.0%) | 0 (0.0%) |
| $5,000 to $7,499 | 0 (0.0%) | 0 (0.0%) |
| $7,500 to $9,999 | 0 (0.0%) | 0 (0.0%) |
| $10,000 to $12,499 | 0 (0.0%) | 0 (0.0%) |
| $12,500 to $14,999 | 0 (0.0%) | 0 (0.0%) |
| $15,000 to $17,499 | 0 (0.0%) | 0 (0.0%) |
| $17,500 to $19,999 | 0 (0.0%) | 0 (0.0%) |
| $20,000 to $22,499 | 0 (0.0%) | 0 (0.0%) |
| $22,500 to $24,999 | 0 (0.0%) | 0 (0.0%) |
| $25,000 to $29,999 | 0 (0.0%) | 65 (70.7%) |
| $30,000 to $34,999 | 0 (0.0%) | 0 (0.0%) |
| $35,000 to $39,999 | 0 (0.0%) | 27 (29.3%) |
| $40,000 to $44,999 | 0 (0.0%) | 0 (0.0%) |
| $45,000 to $49,999 | 0 (0.0%) | 0 (0.0%) |
| $50,000 to $54,999 | 0 (0.0%) | 0 (0.0%) |
| $55,000 to $64,999 | 0 (0.0%) | 0 (0.0%) |
| $65,000 to $74,999 | 0 (0.0%) | 0 (0.0%) |
| $75,000 to $99,999 | 0 (0.0%) | 0 (0.0%) |
| $100,000+ | 0 (0.0%) | 0 (0.0%) |
| Total | 27 (100.0%) | 92 (100.0%) |
Earnings by Sex by Educational Attainment in Del Muerto
| Educational Attainment | Male Income | Female Income |
| Less than High School | - | - |
| High School Diploma | - | - |
| College or Associate's Degree | - | - |
| Bachelor's Degree | - | - |
| Graduate Degree | - | - |
| Total | - | - |
Family Income in Del Muerto
Family Income Brackets in Del Muerto
According to the Del Muerto family income data, there are 88 families falling into the $25,000 to $34,999 income range, which is the most common income bracket and makes up 57.1% of all families.
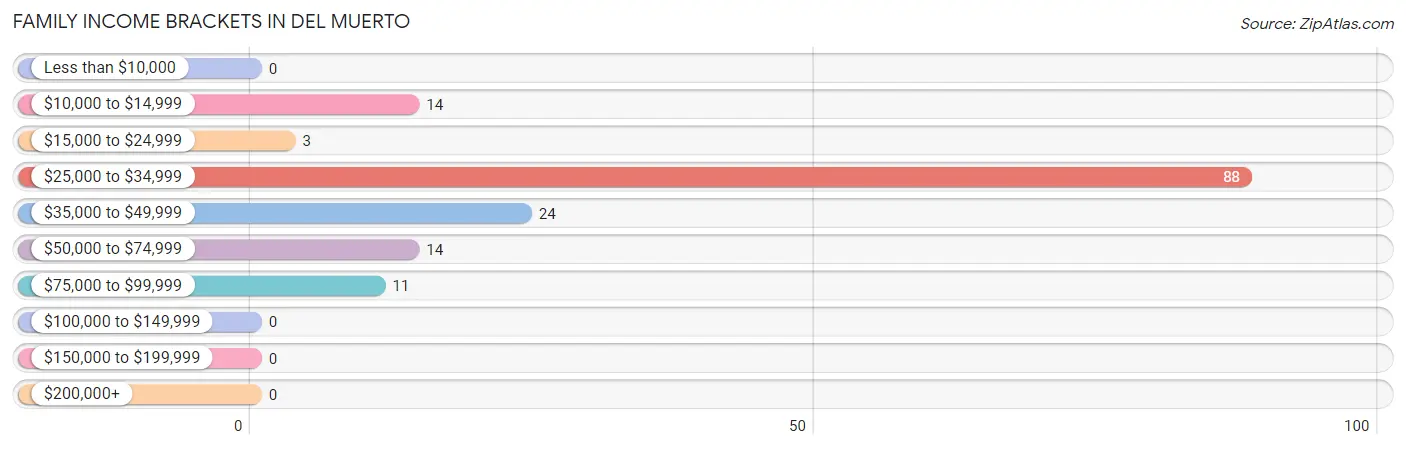
| Income Bracket | # Families | % Families |
| Less than $10,000 | 0 | 0.0% |
| $10,000 to $14,999 | 14 | 9.1% |
| $15,000 to $24,999 | 3 | 1.9% |
| $25,000 to $34,999 | 88 | 57.1% |
| $35,000 to $49,999 | 24 | 15.6% |
| $50,000 to $74,999 | 14 | 9.1% |
| $75,000 to $99,999 | 11 | 7.1% |
| $100,000 to $149,999 | 0 | 0.0% |
| $150,000 to $199,999 | 0 | 0.0% |
| $200,000+ | 0 | 0.0% |
Family Income by Famaliy Size in Del Muerto
2-person families (115 | 74.7%) account for the highest median family income in Del Muerto with $26,793 per family, while 2-person families (115 | 74.7%) have the highest median income of $13,396 per family member.
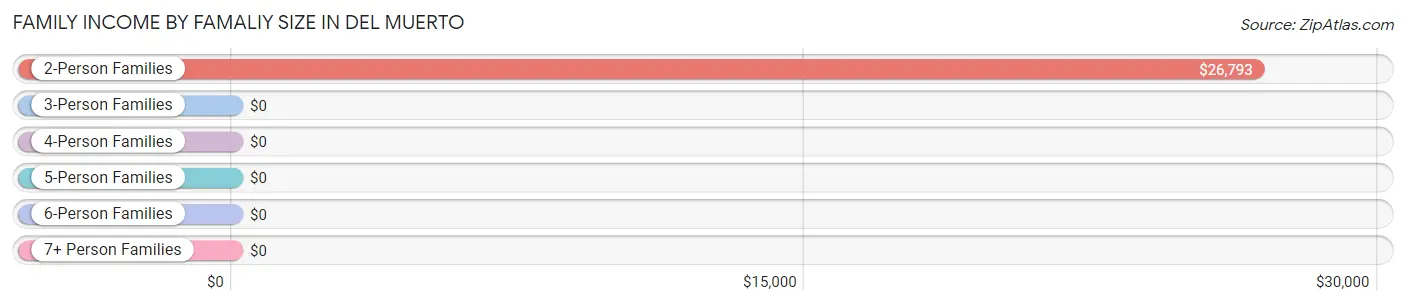
| Income Bracket | # Families | Median Income |
| 2-Person Families | 115 (74.7%) | $26,793 |
| 3-Person Families | 0 (0.0%) | $0 |
| 4-Person Families | 39 (25.3%) | $0 |
| 5-Person Families | 0 (0.0%) | $0 |
| 6-Person Families | 0 (0.0%) | $0 |
| 7+ Person Families | 0 (0.0%) | $0 |
| Total | 154 (100.0%) | $26,974 |
Family Income by Number of Earners in Del Muerto
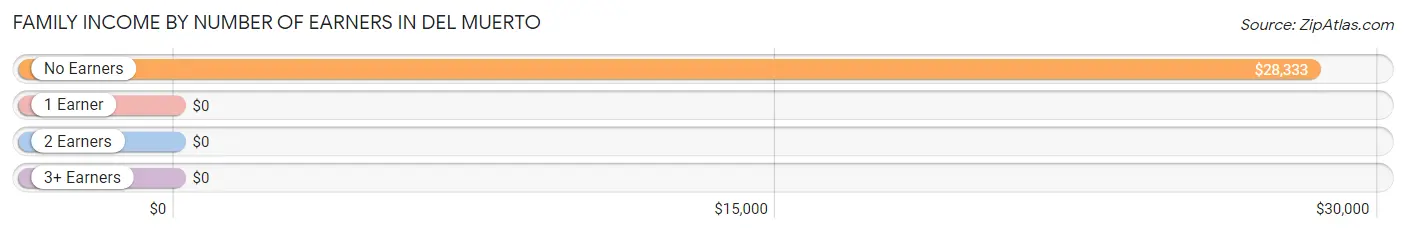
| Number of Earners | # Families | Median Income |
| No Earners | 64 (41.6%) | $28,333 |
| 1 Earner | 90 (58.4%) | $0 |
| 2 Earners | 0 (0.0%) | $0 |
| 3+ Earners | 0 (0.0%) | $0 |
| Total | 154 (100.0%) | $26,974 |
Household Income in Del Muerto
Household Income Brackets in Del Muerto
With 88 households falling in the category, the $25,000 to $34,999 income range is the most frequent in Del Muerto, accounting for 48.9% of all households.
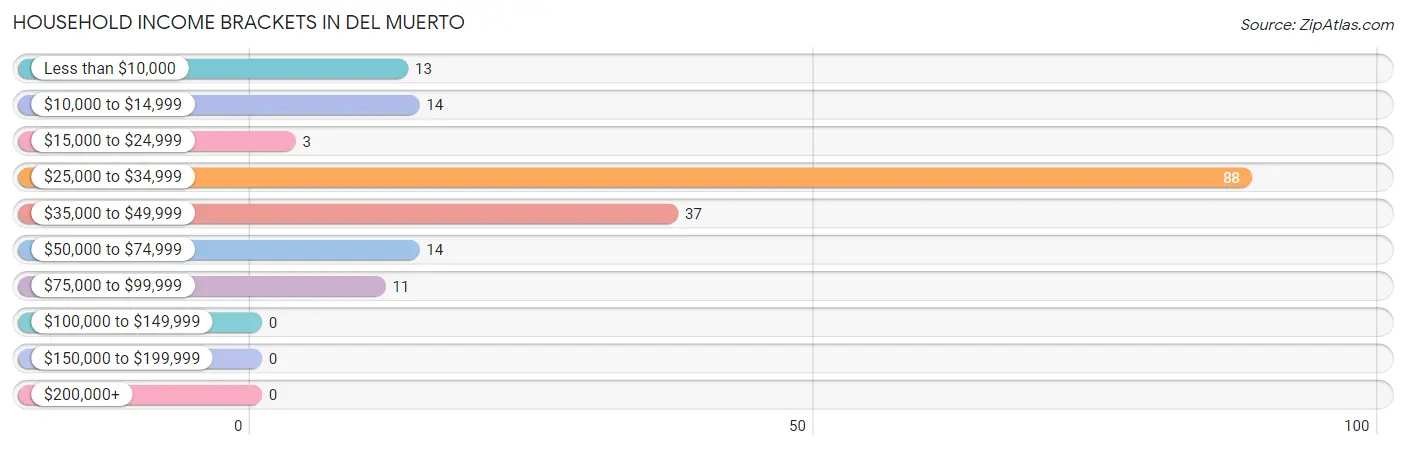
| Income Bracket | # Households | % Households |
| Less than $10,000 | 13 | 7.2% |
| $10,000 to $14,999 | 14 | 7.8% |
| $15,000 to $24,999 | 3 | 1.7% |
| $25,000 to $34,999 | 88 | 48.9% |
| $35,000 to $49,999 | 37 | 20.6% |
| $50,000 to $74,999 | 14 | 7.8% |
| $75,000 to $99,999 | 11 | 6.1% |
| $100,000 to $149,999 | 0 | 0.0% |
| $150,000 to $199,999 | 0 | 0.0% |
| $200,000+ | 0 | 0.0% |
Household Income by Householder Age in Del Muerto
The median household income in Del Muerto is $26,974, with the highest median household income of $39,615 found in the 65+ years age bracket for the primary householder. A total of 74 households (41.1%) fall into this category.
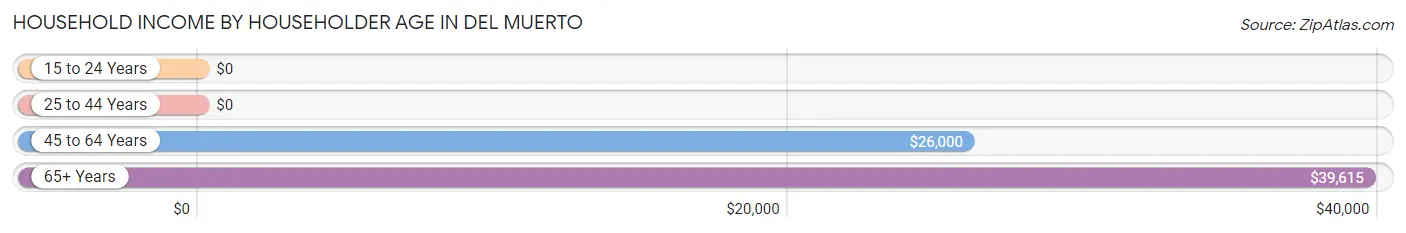
| Income Bracket | # Households | Median Income |
| 15 to 24 Years | 0 (0.0%) | $0 |
| 25 to 44 Years | 0 (0.0%) | $0 |
| 45 to 64 Years | 106 (58.9%) | $26,000 |
| 65+ Years | 74 (41.1%) | $39,615 |
| Total | 180 (100.0%) | $26,974 |
Poverty in Del Muerto
Income Below Poverty by Sex and Age in Del Muerto
With 24.2% poverty level for males and 13.4% for females among the residents of Del Muerto, 45 to 54 year old males and 18 to 24 year old females are the most vulnerable to poverty, with 26 males (100.0%) and 29 females (100.0%) in their respective age groups living below the poverty level.
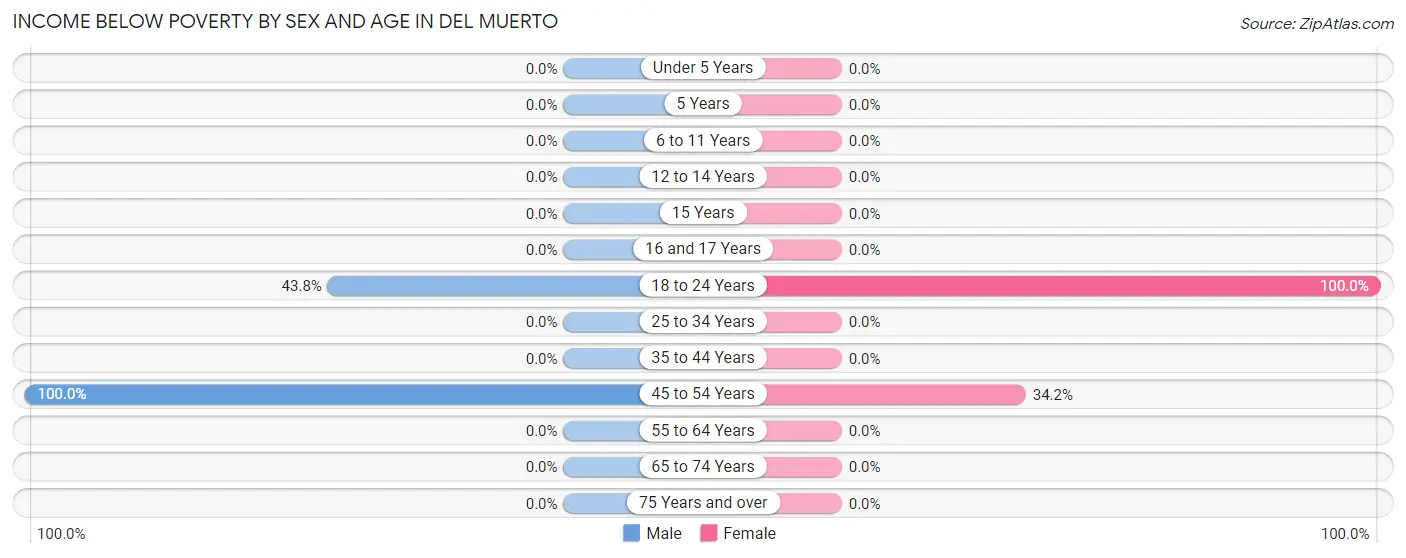
| Age Bracket | Male | Female |
| Under 5 Years | 0 (0.0%) | 0 (0.0%) |
| 5 Years | 0 (0.0%) | 0 (0.0%) |
| 6 to 11 Years | 0 (0.0%) | 0 (0.0%) |
| 12 to 14 Years | 0 (0.0%) | 0 (0.0%) |
| 15 Years | 0 (0.0%) | 0 (0.0%) |
| 16 and 17 Years | 0 (0.0%) | 0 (0.0%) |
| 18 to 24 Years | 21 (43.8%) | 29 (100.0%) |
| 25 to 34 Years | 0 (0.0%) | 0 (0.0%) |
| 35 to 44 Years | 0 (0.0%) | 0 (0.0%) |
| 45 to 54 Years | 26 (100.0%) | 14 (34.2%) |
| 55 to 64 Years | 0 (0.0%) | 0 (0.0%) |
| 65 to 74 Years | 0 (0.0%) | 0 (0.0%) |
| 75 Years and over | 0 (0.0%) | 0 (0.0%) |
| Total | 47 (24.2%) | 43 (13.4%) |
Income Above Poverty by Sex and Age in Del Muerto
According to the poverty statistics in Del Muerto, males aged 35 to 44 years and females aged 6 to 11 years are the age groups that are most secure financially, with 100.0% of males and 100.0% of females in these age groups living above the poverty line.
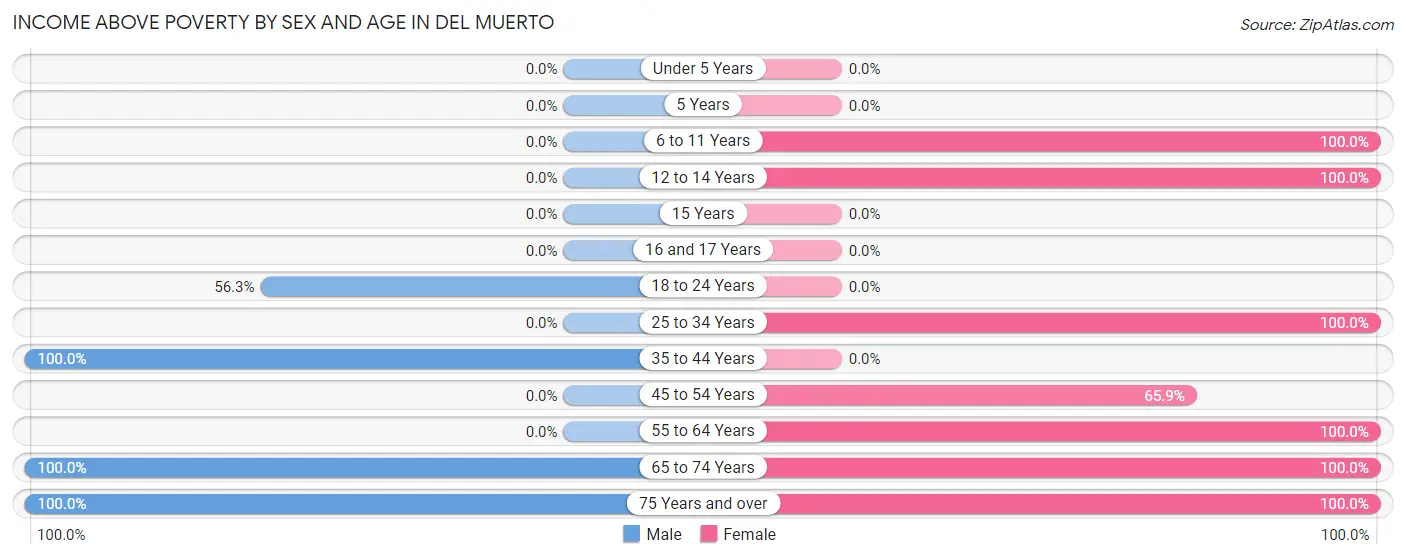
| Age Bracket | Male | Female |
| Under 5 Years | 0 (0.0%) | 0 (0.0%) |
| 5 Years | 0 (0.0%) | 0 (0.0%) |
| 6 to 11 Years | 0 (0.0%) | 16 (100.0%) |
| 12 to 14 Years | 0 (0.0%) | 61 (100.0%) |
| 15 Years | 0 (0.0%) | 0 (0.0%) |
| 16 and 17 Years | 0 (0.0%) | 0 (0.0%) |
| 18 to 24 Years | 27 (56.2%) | 0 (0.0%) |
| 25 to 34 Years | 0 (0.0%) | 32 (100.0%) |
| 35 to 44 Years | 60 (100.0%) | 0 (0.0%) |
| 45 to 54 Years | 0 (0.0%) | 27 (65.8%) |
| 55 to 64 Years | 0 (0.0%) | 79 (100.0%) |
| 65 to 74 Years | 46 (100.0%) | 27 (100.0%) |
| 75 Years and over | 14 (100.0%) | 36 (100.0%) |
| Total | 147 (75.8%) | 278 (86.6%) |
Income Below Poverty Among Married-Couple Families in Del Muerto
The poverty statistics for married-couple families in Del Muerto show that 21.2% or 14 of the total 66 families live below the poverty line. Families with no children have the highest poverty rate of 25.5%, comprising of 14 families. On the other hand, families with 1 or 2 children have the lowest poverty rate of 0.0%, which includes 0 families.
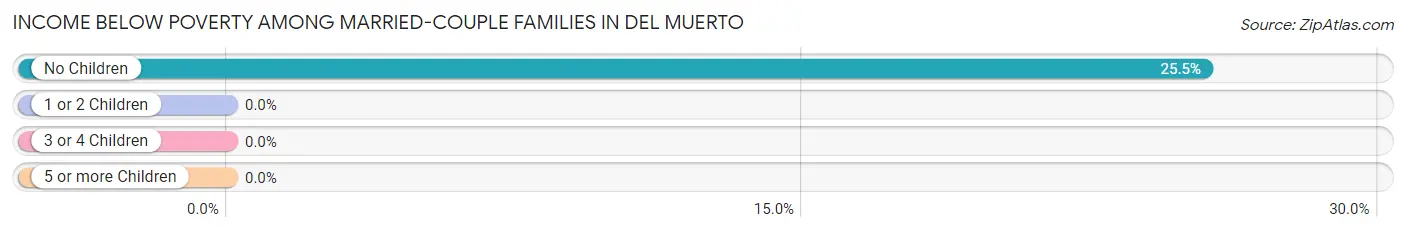
| Children | Above Poverty | Below Poverty |
| No Children | 41 (74.6%) | 14 (25.5%) |
| 1 or 2 Children | 11 (100.0%) | 0 (0.0%) |
| 3 or 4 Children | 0 (0.0%) | 0 (0.0%) |
| 5 or more Children | 0 (0.0%) | 0 (0.0%) |
| Total | 52 (78.8%) | 14 (21.2%) |
Income Below Poverty Among Single-Parent Households in Del Muerto
| Children | Single Father | Single Mother |
| No Children | 0 (0.0%) | 0 (0.0%) |
| 1 or 2 Children | 0 (0.0%) | 0 (0.0%) |
| 3 or 4 Children | 0 (0.0%) | 0 (0.0%) |
| 5 or more Children | 0 (0.0%) | 0 (0.0%) |
| Total | 0 (0.0%) | 0 (0.0%) |
Income Below Poverty Among Married-Couple vs Single-Parent Households in Del Muerto
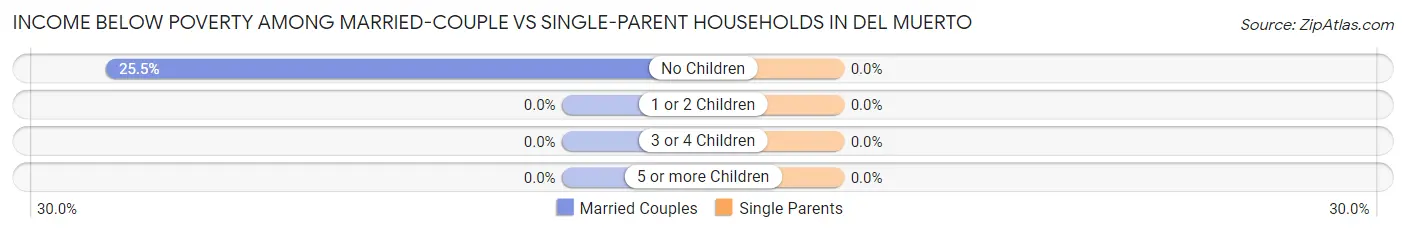
| Children | Married-Couple Families | Single-Parent Households |
| No Children | 14 (25.5%) | 0 (0.0%) |
| 1 or 2 Children | 0 (0.0%) | 0 (0.0%) |
| 3 or 4 Children | 0 (0.0%) | 0 (0.0%) |
| 5 or more Children | 0 (0.0%) | 0 (0.0%) |
| Total | 14 (21.2%) | 0 (0.0%) |
Race in Del Muerto
The most populous races in Del Muerto are Native / Alaskan (499 | 96.9%), Hispanic or Latino (43 | 8.4%), and Two or more Races (16 | 3.1%).
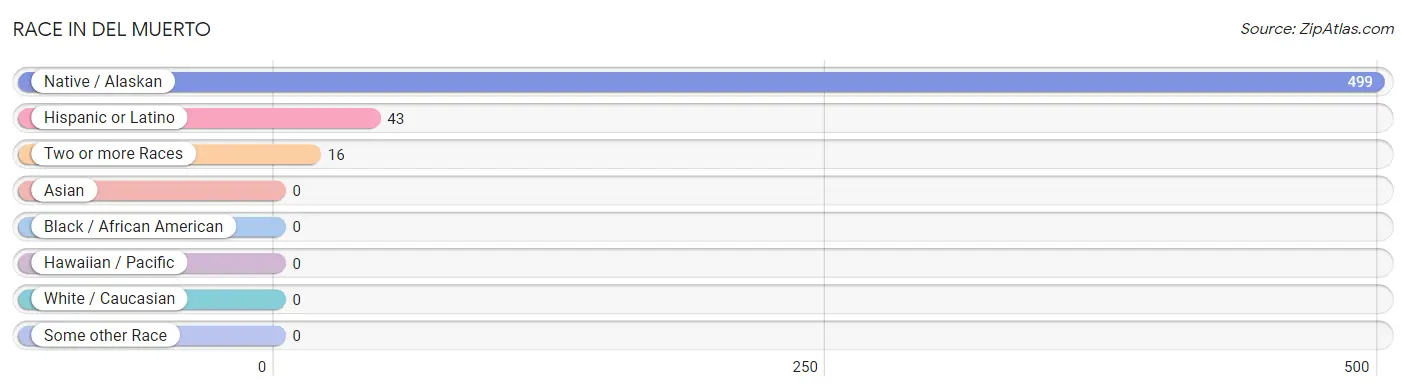
| Race | # Population | % Population |
| Asian | 0 | 0.0% |
| Black / African American | 0 | 0.0% |
| Hawaiian / Pacific | 0 | 0.0% |
| Hispanic or Latino | 43 | 8.4% |
| Native / Alaskan | 499 | 96.9% |
| White / Caucasian | 0 | 0.0% |
| Two or more Races | 16 | 3.1% |
| Some other Race | 0 | 0.0% |
| Total | 515 | 100.0% |
Ancestry in Del Muerto
The most populous ancestries reported in Del Muerto are Navajo (515 | 100.0%), and Mexican (43 | 8.4%), together accounting for 108.3% of all Del Muerto residents.
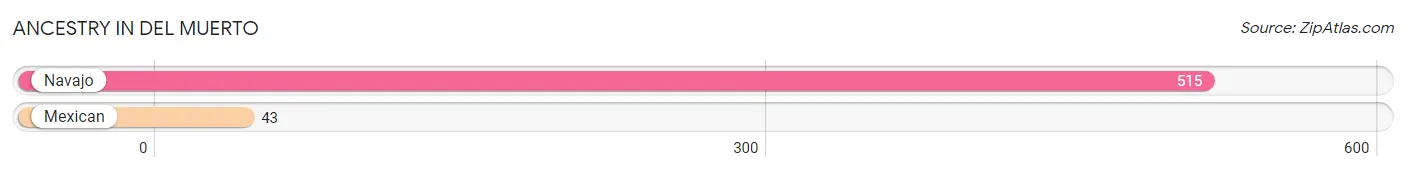
| Ancestry | # Population | % Population |
| Mexican | 43 | 8.4% |
| Navajo | 515 | 100.0% | View All 2 Rows |
Immigrants in Del Muerto

| Immigration Origin | # Population | % Population | View All 0 Rows |
Sex and Age in Del Muerto
Sex and Age in Del Muerto
The most populous age groups in Del Muerto are 35 to 39 Years (60 | 30.9%) for men and 60 to 64 Years (65 | 20.3%) for women.
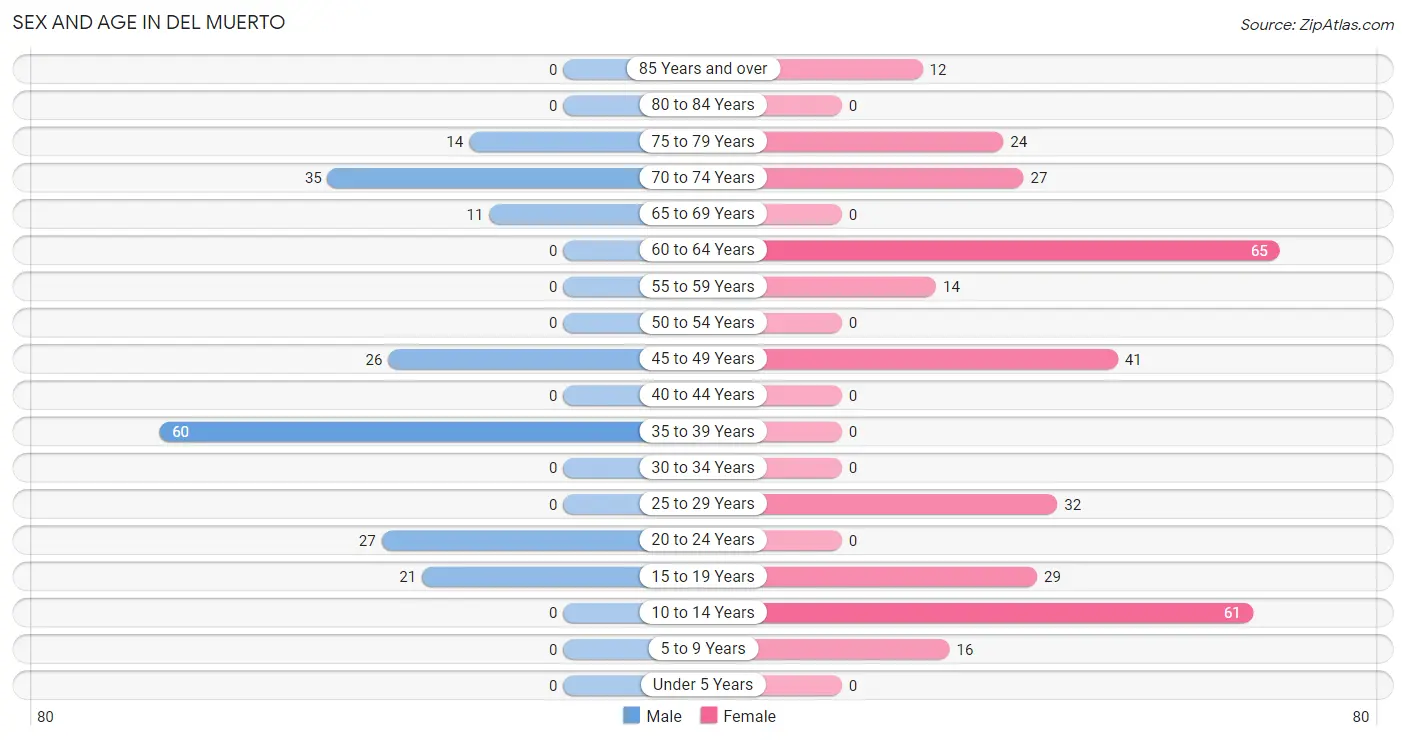
| Age Bracket | Male | Female |
| Under 5 Years | 0 (0.0%) | 0 (0.0%) |
| 5 to 9 Years | 0 (0.0%) | 16 (5.0%) |
| 10 to 14 Years | 0 (0.0%) | 61 (19.0%) |
| 15 to 19 Years | 21 (10.8%) | 29 (9.0%) |
| 20 to 24 Years | 27 (13.9%) | 0 (0.0%) |
| 25 to 29 Years | 0 (0.0%) | 32 (10.0%) |
| 30 to 34 Years | 0 (0.0%) | 0 (0.0%) |
| 35 to 39 Years | 60 (30.9%) | 0 (0.0%) |
| 40 to 44 Years | 0 (0.0%) | 0 (0.0%) |
| 45 to 49 Years | 26 (13.4%) | 41 (12.8%) |
| 50 to 54 Years | 0 (0.0%) | 0 (0.0%) |
| 55 to 59 Years | 0 (0.0%) | 14 (4.4%) |
| 60 to 64 Years | 0 (0.0%) | 65 (20.3%) |
| 65 to 69 Years | 11 (5.7%) | 0 (0.0%) |
| 70 to 74 Years | 35 (18.0%) | 27 (8.4%) |
| 75 to 79 Years | 14 (7.2%) | 24 (7.5%) |
| 80 to 84 Years | 0 (0.0%) | 0 (0.0%) |
| 85 Years and over | 0 (0.0%) | 12 (3.7%) |
| Total | 194 (100.0%) | 321 (100.0%) |
Families and Households in Del Muerto
Median Family Size in Del Muerto
The median family size in Del Muerto is 3.18 persons per family, with married-couple families (66 | 42.9%) accounting for the largest median family size of 4.24 persons per family. On the other hand, single female/mother families (77 | 50.0%) represent the smallest median family size with 2.19 persons per family.
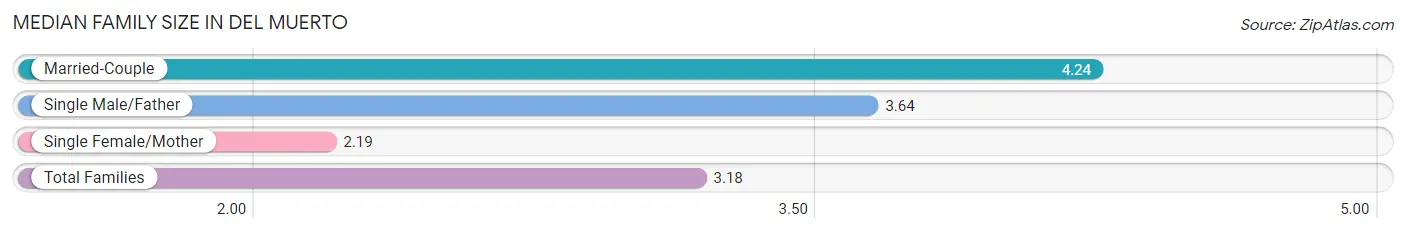
| Family Type | # Families | Family Size |
| Married-Couple | 66 (42.9%) | 4.24 |
| Single Male/Father | 11 (7.1%) | 3.64 |
| Single Female/Mother | 77 (50.0%) | 2.19 |
| Total Families | 154 (100.0%) | 3.18 |
Median Household Size in Del Muerto
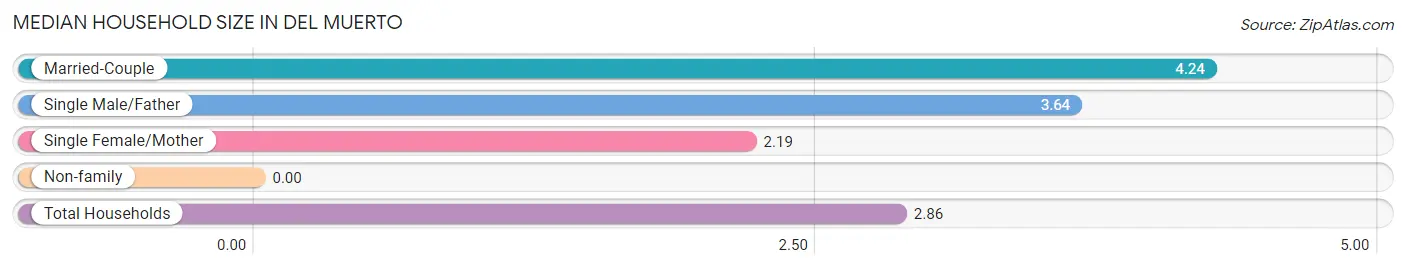
| Household Type | # Households | Household Size |
| Married-Couple | 66 (36.7%) | 4.24 |
| Single Male/Father | 11 (6.1%) | 3.64 |
| Single Female/Mother | 77 (42.8%) | 2.19 |
| Non-family | 26 (14.4%) | - |
| Total Households | 180 (100.0%) | 2.86 |
Household Size by Marriage Status in Del Muerto
Out of a total of 180 households in Del Muerto, 154 (85.6%) are family households, while 26 (14.4%) are nonfamily households. The most numerous type of family households are 2-person households, comprising 115, and the most common type of nonfamily households are 1-person households, comprising 26.
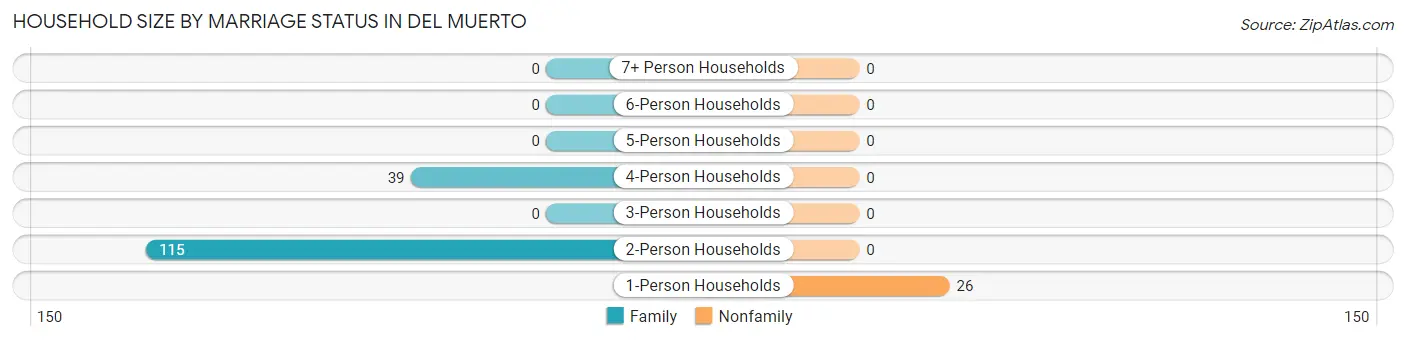
| Household Size | Family Households | Nonfamily Households |
| 1-Person Households | - | 26 (14.4%) |
| 2-Person Households | 115 (63.9%) | 0 (0.0%) |
| 3-Person Households | 0 (0.0%) | 0 (0.0%) |
| 4-Person Households | 39 (21.7%) | 0 (0.0%) |
| 5-Person Households | 0 (0.0%) | 0 (0.0%) |
| 6-Person Households | 0 (0.0%) | 0 (0.0%) |
| 7+ Person Households | 0 (0.0%) | 0 (0.0%) |
| Total | 154 (85.6%) | 26 (14.4%) |
Female Fertility in Del Muerto
Fertility by Age in Del Muerto
| Age Bracket | Women with Births | Births / 1,000 Women |
| 15 to 19 years | 0 (0.0%) | 0.0 |
| 20 to 34 years | 0 (0.0%) | 0.0 |
| 35 to 50 years | 0 (0.0%) | 0.0 |
| Total | 0 (0.0%) | 0.0 |
Fertility by Age by Marriage Status in Del Muerto
| Age Bracket | Married | Unmarried |
| 15 to 19 years | 0 (0.0%) | 0 (0.0%) |
| 20 to 34 years | 0 (0.0%) | 0 (0.0%) |
| 35 to 50 years | 0 (0.0%) | 0 (0.0%) |
| Total | 0 (0.0%) | 0 (0.0%) |
Fertility by Education in Del Muerto
| Educational Attainment | Women with Births | Births / 1,000 Women |
| Less than High School | 0 (0.0%) | 0.0 |
| High School Diploma | 0 (0.0%) | 0.0 |
| College or Associate's Degree | 0 (0.0%) | 0.0 |
| Bachelor's Degree | 0 (0.0%) | 0.0 |
| Graduate Degree | 0 (0.0%) | 0.0 |
| Total | 0 (0.0%) | 0.0 |
Fertility by Education by Marriage Status in Del Muerto
| Educational Attainment | Married | Unmarried |
| Less than High School | 0 (0.0%) | 0 (0.0%) |
| High School Diploma | 0 (0.0%) | 0 (0.0%) |
| College or Associate's Degree | 0 (0.0%) | 0 (0.0%) |
| Bachelor's Degree | 0 (0.0%) | 0 (0.0%) |
| Graduate Degree | 0 (0.0%) | 0 (0.0%) |
| Total | 0 (0.0%) | 0 (0.0%) |
Employment Characteristics in Del Muerto
Employment by Class of Employer in Del Muerto
Among the 119 employed individuals in Del Muerto, federal government employees (65 | 54.6%), private company employees (27 | 22.7%), and state government employees (27 | 22.7%) make up the most common classes of employment.
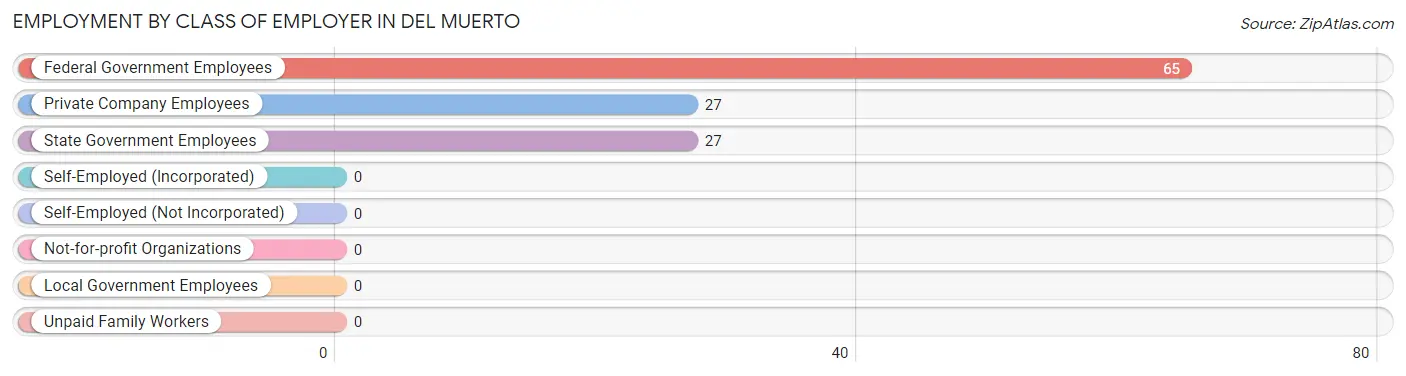
| Employer Class | # Employees | % Employees |
| Private Company Employees | 27 | 22.7% |
| Self-Employed (Incorporated) | 0 | 0.0% |
| Self-Employed (Not Incorporated) | 0 | 0.0% |
| Not-for-profit Organizations | 0 | 0.0% |
| Local Government Employees | 0 | 0.0% |
| State Government Employees | 27 | 22.7% |
| Federal Government Employees | 65 | 54.6% |
| Unpaid Family Workers | 0 | 0.0% |
| Total | 119 | 100.0% |
Employment Status by Age in Del Muerto
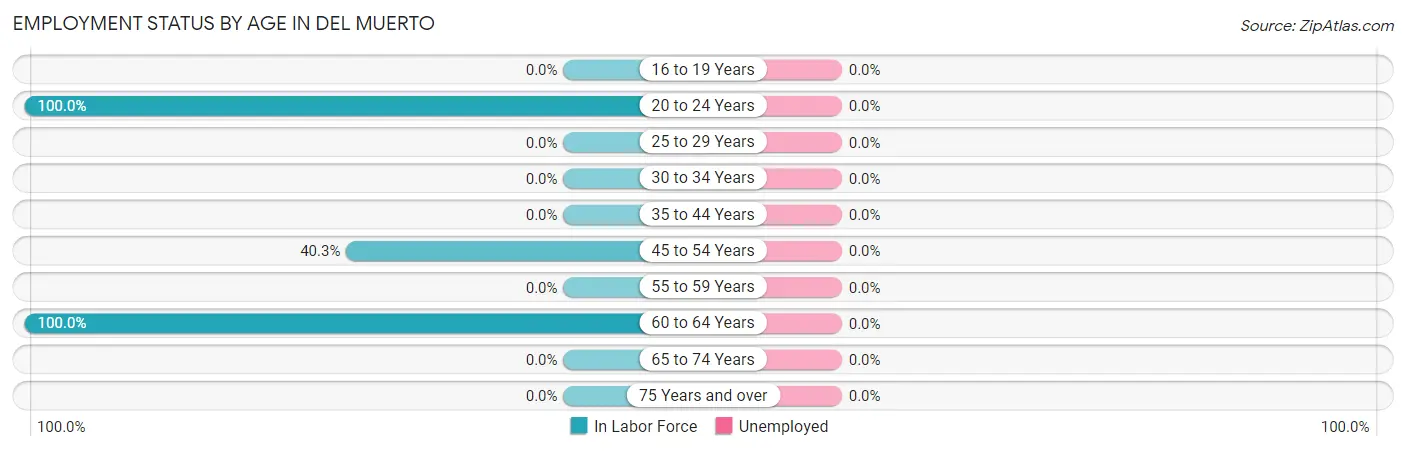
| Age Bracket | In Labor Force | Unemployed |
| 16 to 19 Years | 0 (0.0%) | 0 (0.0%) |
| 20 to 24 Years | 27 (100.0%) | 0 (0.0%) |
| 25 to 29 Years | 0 (0.0%) | 0 (0.0%) |
| 30 to 34 Years | 0 (0.0%) | 0 (0.0%) |
| 35 to 44 Years | 0 (0.0%) | 0 (0.0%) |
| 45 to 54 Years | 27 (40.3%) | 0 (0.0%) |
| 55 to 59 Years | 0 (0.0%) | 0 (0.0%) |
| 60 to 64 Years | 65 (100.0%) | 0 (0.0%) |
| 65 to 74 Years | 0 (0.0%) | 0 (0.0%) |
| 75 Years and over | 0 (0.0%) | 0 (0.0%) |
| Total | 119 (27.2%) | 0 (0.0%) |
Employment Status by Educational Attainment in Del Muerto

| Educational Attainment | In Labor Force | Unemployed |
| Less than High School | 0 (0.0%) | 0 (0.0%) |
| High School Diploma | 65 (42.8%) | 0 (0.0%) |
| College / Associate Degree | 27 (31.4%) | 0 (0.0%) |
| Bachelor's Degree or higher | 0 (0.0%) | 0 (0.0%) |
| Total | 92 (38.7%) | 0 (0.0%) |
Employment Occupations by Sex in Del Muerto
Management, Business, Science and Arts Occupations
The most common Management, Business, Science and Arts occupations in Del Muerto are , and Health Diagnosing & Treating (65 | 54.6%).
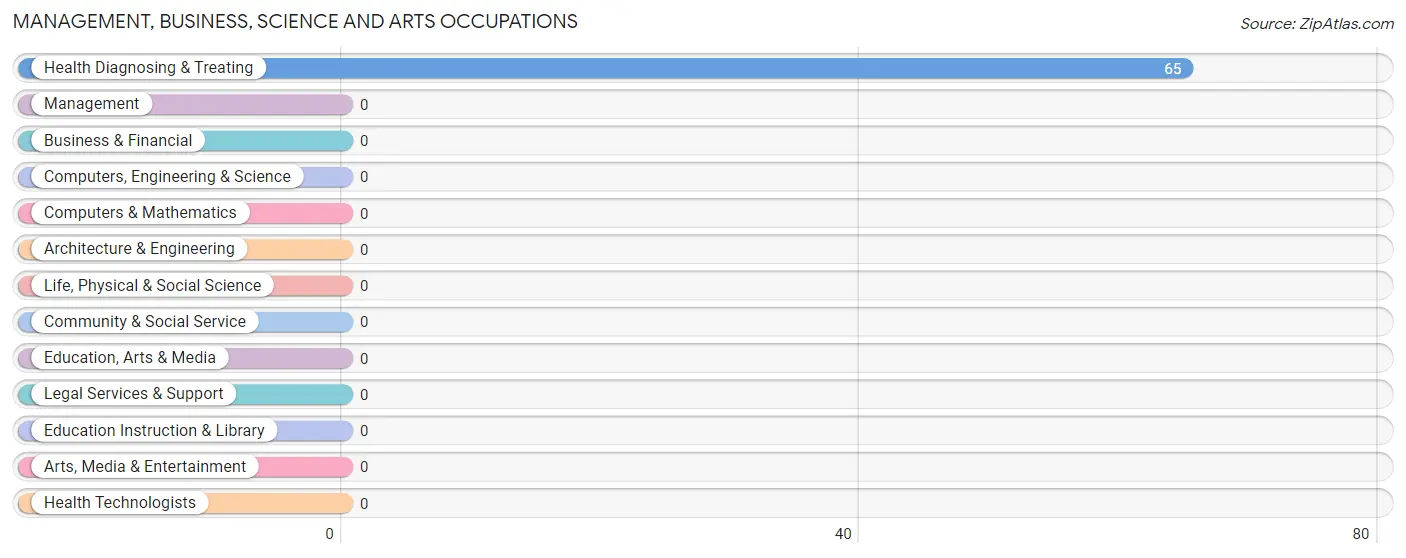
Management, Business, Science and Arts Occupations by Sex
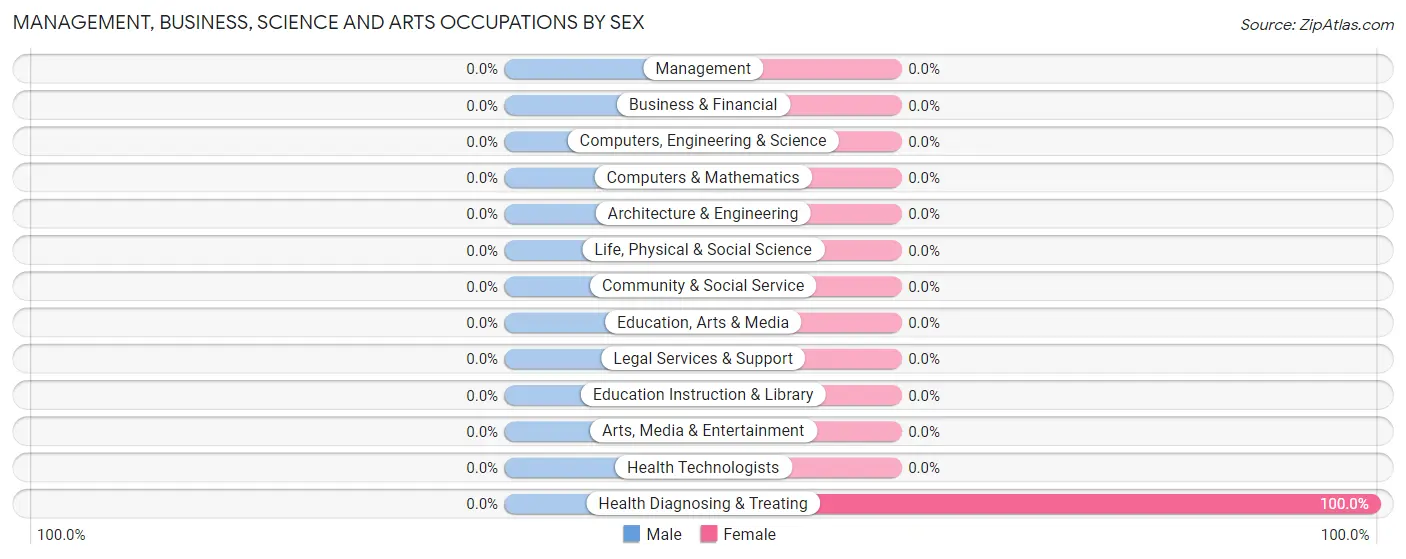
| Occupation | Male | Female |
| Management | 0 (0.0%) | 0 (0.0%) |
| Business & Financial | 0 (0.0%) | 0 (0.0%) |
| Computers, Engineering & Science | 0 (0.0%) | 0 (0.0%) |
| Computers & Mathematics | 0 (0.0%) | 0 (0.0%) |
| Architecture & Engineering | 0 (0.0%) | 0 (0.0%) |
| Life, Physical & Social Science | 0 (0.0%) | 0 (0.0%) |
| Community & Social Service | 0 (0.0%) | 0 (0.0%) |
| Education, Arts & Media | 0 (0.0%) | 0 (0.0%) |
| Legal Services & Support | 0 (0.0%) | 0 (0.0%) |
| Education Instruction & Library | 0 (0.0%) | 0 (0.0%) |
| Arts, Media & Entertainment | 0 (0.0%) | 0 (0.0%) |
| Health Diagnosing & Treating | 0 (0.0%) | 65 (100.0%) |
| Health Technologists | 0 (0.0%) | 0 (0.0%) |
| Total (Category) | 0 (0.0%) | 65 (100.0%) |
| Total (Overall) | 27 (22.7%) | 92 (77.3%) |
Services Occupations
Services Occupations by Sex
| Occupation | Male | Female |
| Healthcare Support | 0 (0.0%) | 0 (0.0%) |
| Security & Protection | 0 (0.0%) | 0 (0.0%) |
| Firefighting & Prevention | 0 (0.0%) | 0 (0.0%) |
| Law Enforcement | 0 (0.0%) | 0 (0.0%) |
| Food Preparation & Serving | 0 (0.0%) | 0 (0.0%) |
| Cleaning & Maintenance | 0 (0.0%) | 0 (0.0%) |
| Personal Care & Service | 0 (0.0%) | 0 (0.0%) |
| Total (Category) | 0 (0.0%) | 0 (0.0%) |
| Total (Overall) | 27 (22.7%) | 92 (77.3%) |
Sales and Office Occupations
The most common Sales and Office occupations in Del Muerto are , and Office & Administration (27 | 22.7%).

Sales and Office Occupations by Sex

| Occupation | Male | Female |
| Sales & Related | 0 (0.0%) | 0 (0.0%) |
| Office & Administration | 0 (0.0%) | 27 (100.0%) |
| Total (Category) | 0 (0.0%) | 27 (100.0%) |
| Total (Overall) | 27 (22.7%) | 92 (77.3%) |
Natural Resources, Construction and Maintenance Occupations

Natural Resources, Construction and Maintenance Occupations by Sex

| Occupation | Male | Female |
| Farming, Fishing & Forestry | 0 (0.0%) | 0 (0.0%) |
| Construction & Extraction | 0 (0.0%) | 0 (0.0%) |
| Installation, Maintenance & Repair | 0 (0.0%) | 0 (0.0%) |
| Total (Category) | 0 (0.0%) | 0 (0.0%) |
| Total (Overall) | 27 (22.7%) | 92 (77.3%) |
Production, Transportation and Moving Occupations
The most common Production, Transportation and Moving occupations in Del Muerto are , and Production (27 | 22.7%).
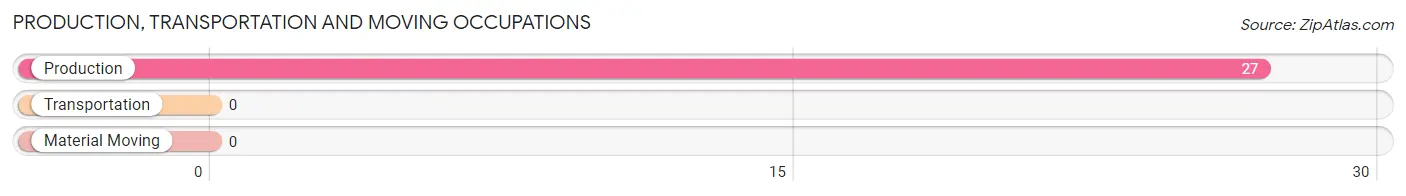
Production, Transportation and Moving Occupations by Sex

| Occupation | Male | Female |
| Production | 27 (100.0%) | 0 (0.0%) |
| Transportation | 0 (0.0%) | 0 (0.0%) |
| Material Moving | 0 (0.0%) | 0 (0.0%) |
| Total (Category) | 27 (100.0%) | 0 (0.0%) |
| Total (Overall) | 27 (22.7%) | 92 (77.3%) |
Employment Industries by Sex in Del Muerto
Employment Industries in Del Muerto
The major employment industries in Del Muerto include Health Care & Social Assistance (65 | 54.6%), Retail Trade (27 | 22.7%), and Public Administration (27 | 22.7%).
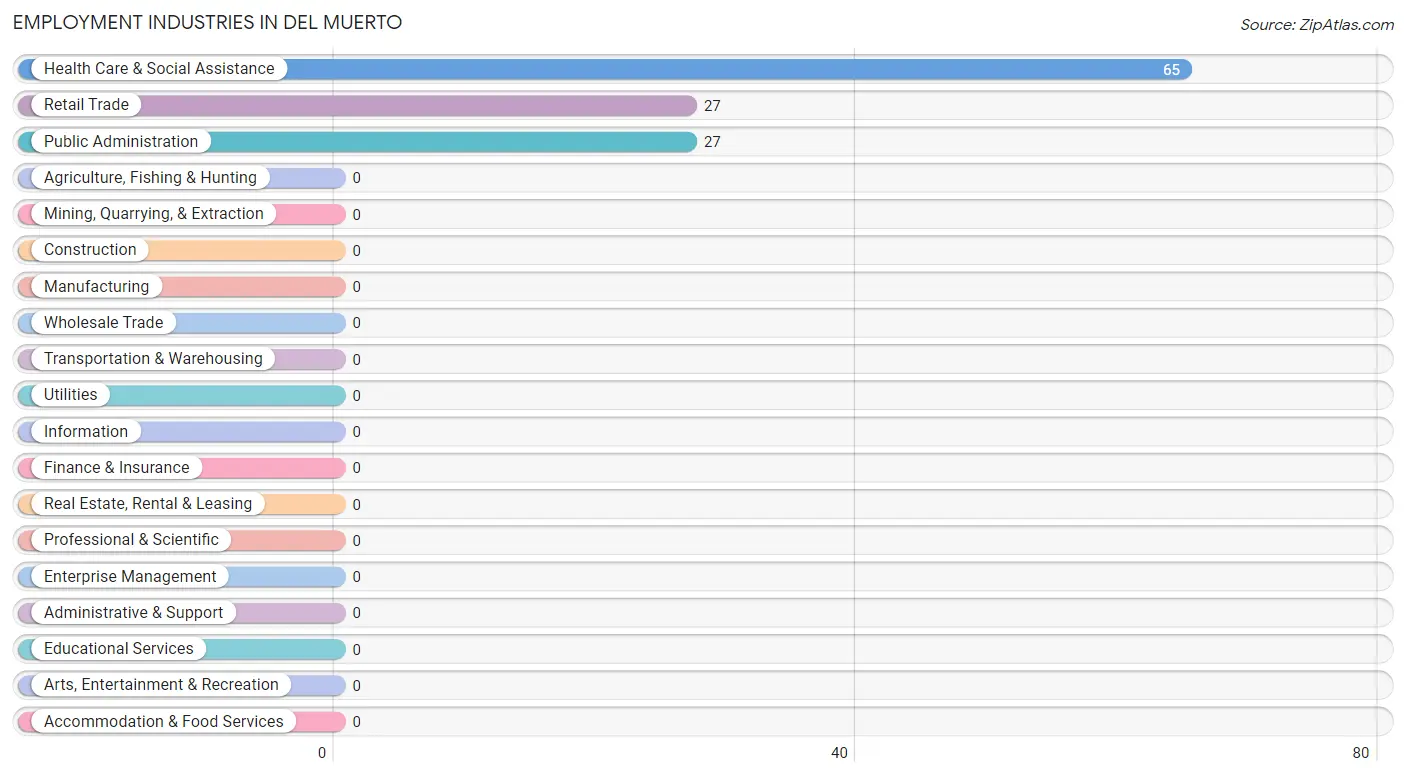
Employment Industries by Sex in Del Muerto
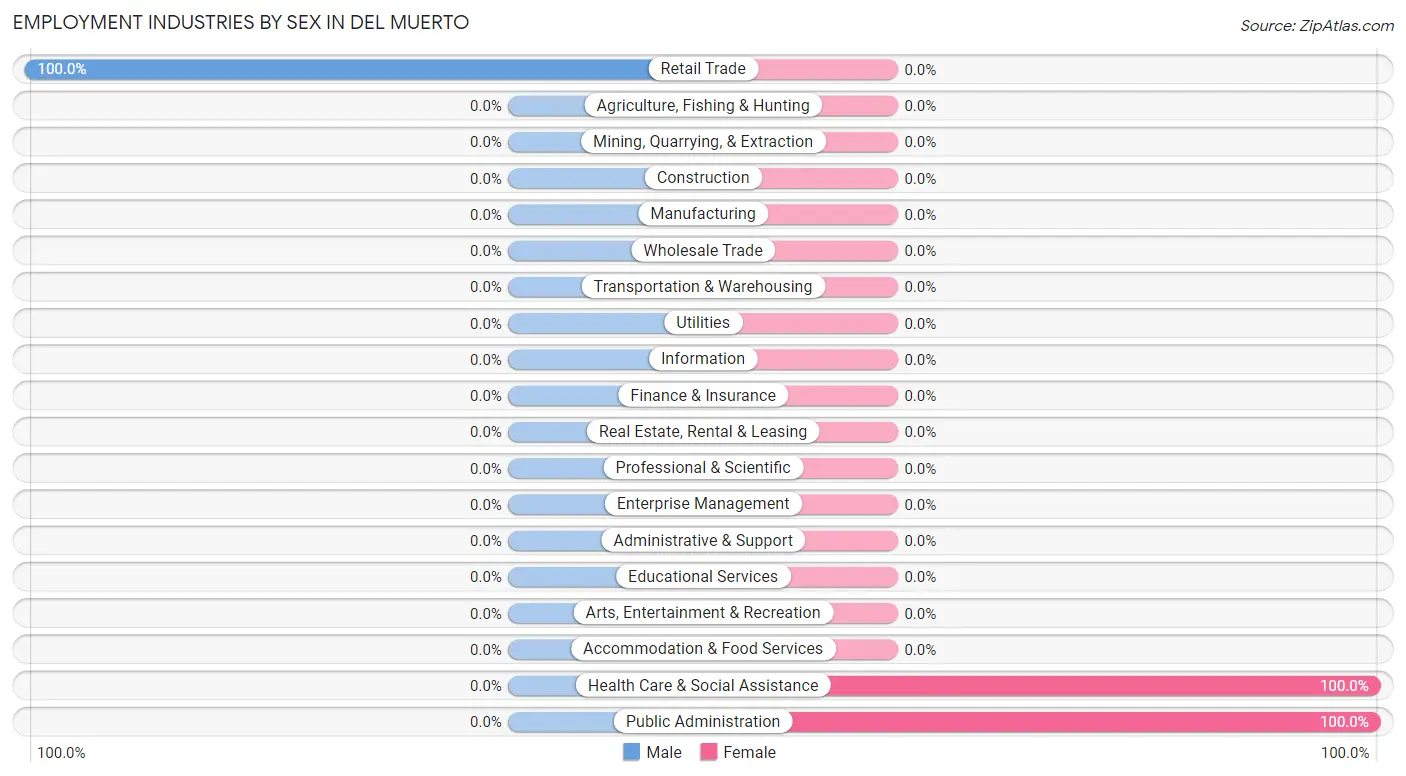
| Industry | Male | Female |
| Agriculture, Fishing & Hunting | 0 (0.0%) | 0 (0.0%) |
| Mining, Quarrying, & Extraction | 0 (0.0%) | 0 (0.0%) |
| Construction | 0 (0.0%) | 0 (0.0%) |
| Manufacturing | 0 (0.0%) | 0 (0.0%) |
| Wholesale Trade | 0 (0.0%) | 0 (0.0%) |
| Retail Trade | 27 (100.0%) | 0 (0.0%) |
| Transportation & Warehousing | 0 (0.0%) | 0 (0.0%) |
| Utilities | 0 (0.0%) | 0 (0.0%) |
| Information | 0 (0.0%) | 0 (0.0%) |
| Finance & Insurance | 0 (0.0%) | 0 (0.0%) |
| Real Estate, Rental & Leasing | 0 (0.0%) | 0 (0.0%) |
| Professional & Scientific | 0 (0.0%) | 0 (0.0%) |
| Enterprise Management | 0 (0.0%) | 0 (0.0%) |
| Administrative & Support | 0 (0.0%) | 0 (0.0%) |
| Educational Services | 0 (0.0%) | 0 (0.0%) |
| Health Care & Social Assistance | 0 (0.0%) | 65 (100.0%) |
| Arts, Entertainment & Recreation | 0 (0.0%) | 0 (0.0%) |
| Accommodation & Food Services | 0 (0.0%) | 0 (0.0%) |
| Public Administration | 0 (0.0%) | 27 (100.0%) |
| Total | 27 (22.7%) | 92 (77.3%) |
Education in Del Muerto
School Enrollment in Del Muerto
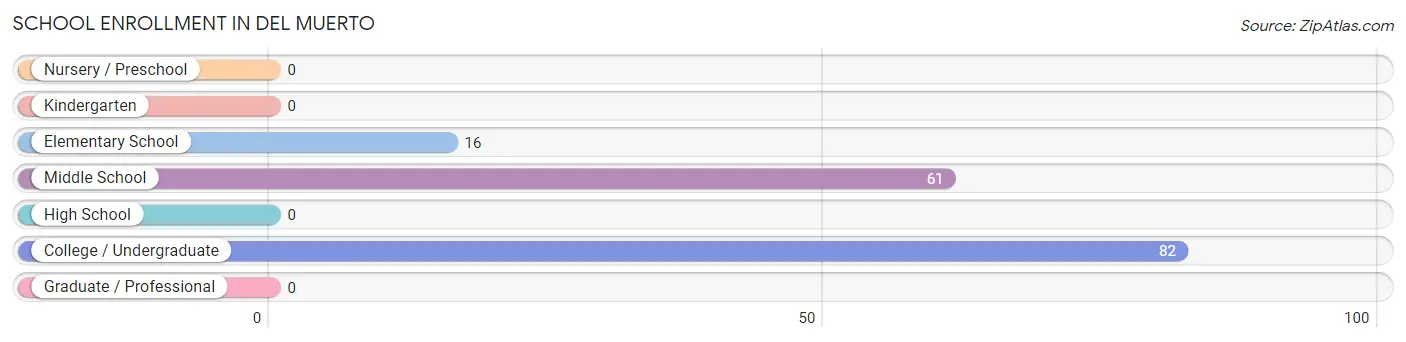
The most common levels of schooling among the 159 students in Del Muerto are college / undergraduate (82 | 51.6%), middle school (61 | 38.4%), and elementary school (16 | 10.1%).
| School Level | # Students | % Students |
| Nursery / Preschool | 0 | 0.0% |
| Kindergarten | 0 | 0.0% |
| Elementary School | 16 | 10.1% |
| Middle School | 61 | 38.4% |
| High School | 0 | 0.0% |
| College / Undergraduate | 82 | 51.6% |
| Graduate / Professional | 0 | 0.0% |
| Total | 159 | 100.0% |
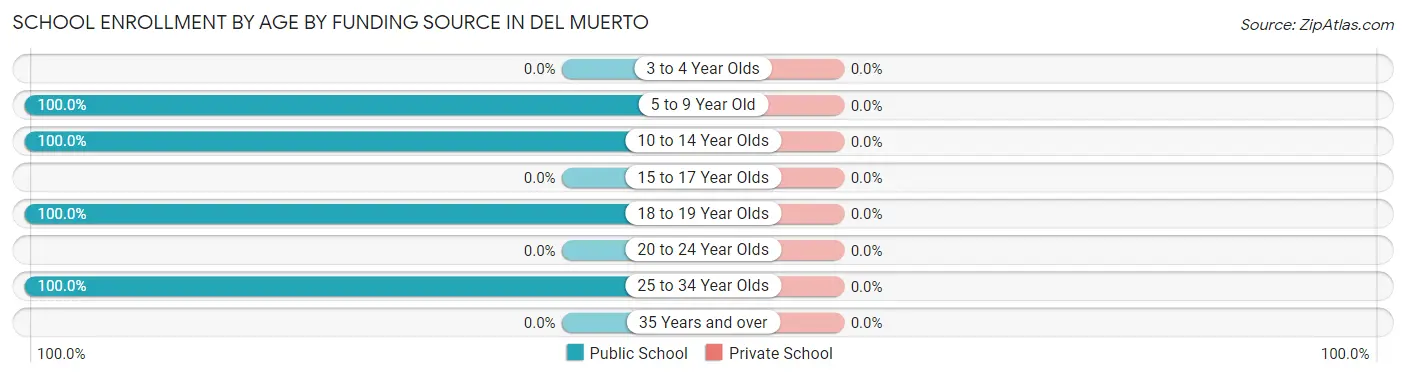
School Enrollment by Age by Funding Source in Del Muerto
| Age Bracket | Public School | Private School |
| 3 to 4 Year Olds | 0 (0.0%) | 0 (0.0%) |
| 5 to 9 Year Old | 16 (100.0%) | 0 (0.0%) |
| 10 to 14 Year Olds | 61 (100.0%) | 0 (0.0%) |
| 15 to 17 Year Olds | 0 (0.0%) | 0 (0.0%) |
| 18 to 19 Year Olds | 50 (100.0%) | 0 (0.0%) |
| 20 to 24 Year Olds | 0 (0.0%) | 0 (0.0%) |
| 25 to 34 Year Olds | 32 (100.0%) | 0 (0.0%) |
| 35 Years and over | 0 (0.0%) | 0 (0.0%) |
| Total | 159 (100.0%) | 0 (0.0%) |
Educational Attainment by Field of Study in Del Muerto
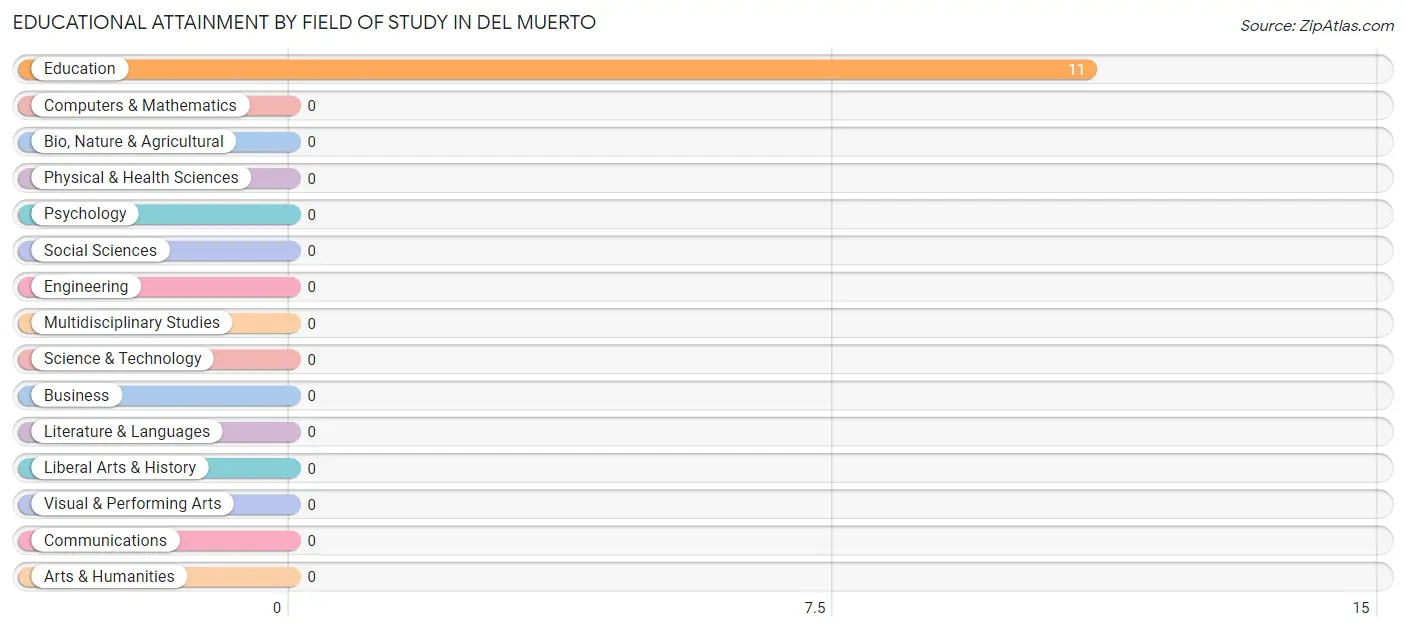
, and education (11 | 100.0%) are the most common fields of study among 11 individuals in Del Muerto who have obtained a bachelor's degree or higher.
| Field of Study | # Graduates | % Graduates |
| Computers & Mathematics | 0 | 0.0% |
| Bio, Nature & Agricultural | 0 | 0.0% |
| Physical & Health Sciences | 0 | 0.0% |
| Psychology | 0 | 0.0% |
| Social Sciences | 0 | 0.0% |
| Engineering | 0 | 0.0% |
| Multidisciplinary Studies | 0 | 0.0% |
| Science & Technology | 0 | 0.0% |
| Business | 0 | 0.0% |
| Education | 11 | 100.0% |
| Literature & Languages | 0 | 0.0% |
| Liberal Arts & History | 0 | 0.0% |
| Visual & Performing Arts | 0 | 0.0% |
| Communications | 0 | 0.0% |
| Arts & Humanities | 0 | 0.0% |
| Total | 11 | 100.0% |
Transportation & Commute in Del Muerto
Vehicle Availability by Sex in Del Muerto
The most prevalent vehicle ownership categories in Del Muerto are males with 2 vehicles (27, accounting for 100.0%) and females with 2 vehicles (27, making up 29.3%).
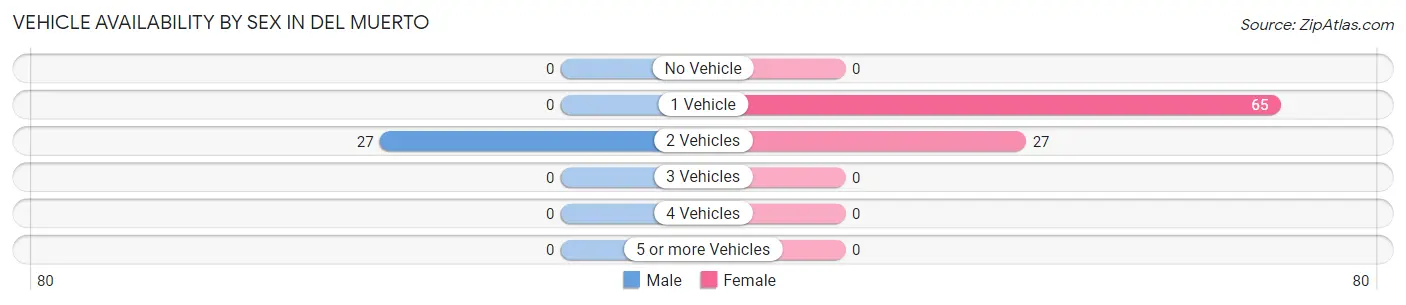
| Vehicles Available | Male | Female |
| No Vehicle | 0 (0.0%) | 0 (0.0%) |
| 1 Vehicle | 0 (0.0%) | 65 (70.7%) |
| 2 Vehicles | 27 (100.0%) | 27 (29.3%) |
| 3 Vehicles | 0 (0.0%) | 0 (0.0%) |
| 4 Vehicles | 0 (0.0%) | 0 (0.0%) |
| 5 or more Vehicles | 0 (0.0%) | 0 (0.0%) |
| Total | 27 (100.0%) | 92 (100.0%) |
Commute Time in Del Muerto
The most frequently occuring commute durations in Del Muerto are 20 to 24 minutes (65 commuters, 70.7%), 15 to 19 minutes (27 commuters, 29.3%), and less than 5 minutes (0 commuters, 0.0%).
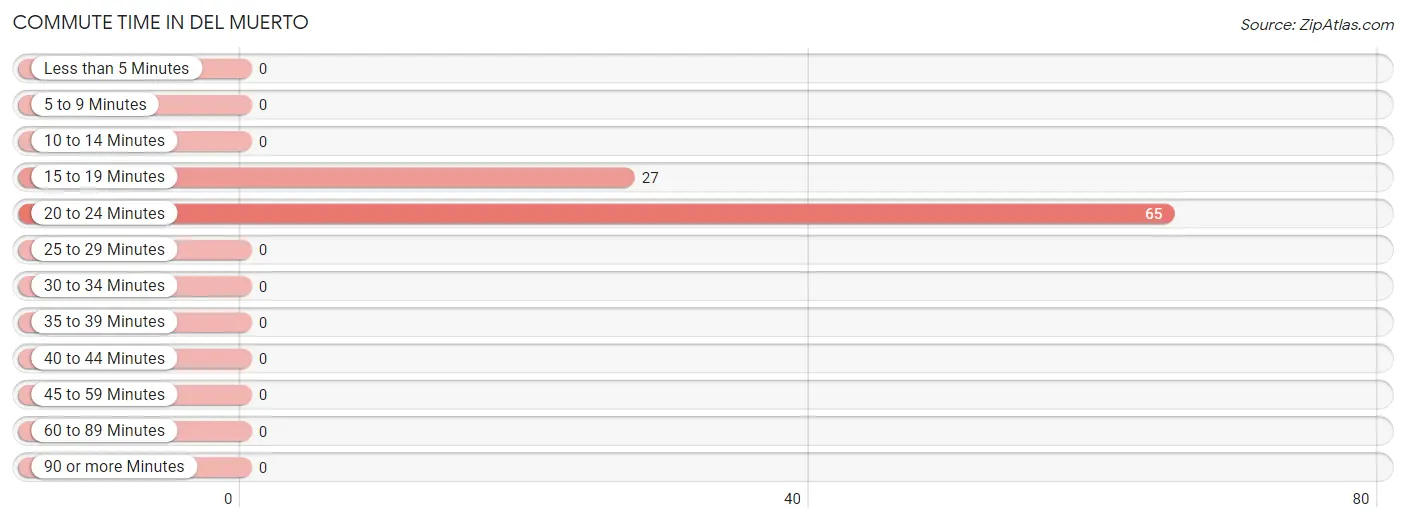
| Commute Time | # Commuters | % Commuters |
| Less than 5 Minutes | 0 | 0.0% |
| 5 to 9 Minutes | 0 | 0.0% |
| 10 to 14 Minutes | 0 | 0.0% |
| 15 to 19 Minutes | 27 | 29.3% |
| 20 to 24 Minutes | 65 | 70.7% |
| 25 to 29 Minutes | 0 | 0.0% |
| 30 to 34 Minutes | 0 | 0.0% |
| 35 to 39 Minutes | 0 | 0.0% |
| 40 to 44 Minutes | 0 | 0.0% |
| 45 to 59 Minutes | 0 | 0.0% |
| 60 to 89 Minutes | 0 | 0.0% |
| 90 or more Minutes | 0 | 0.0% |
Commute Time by Sex in Del Muerto
The most common commute times in Del Muerto are 15 to 19 minutes (27 commuters, 100.0%) for males and 20 to 24 minutes (65 commuters, 100.0%) for females.
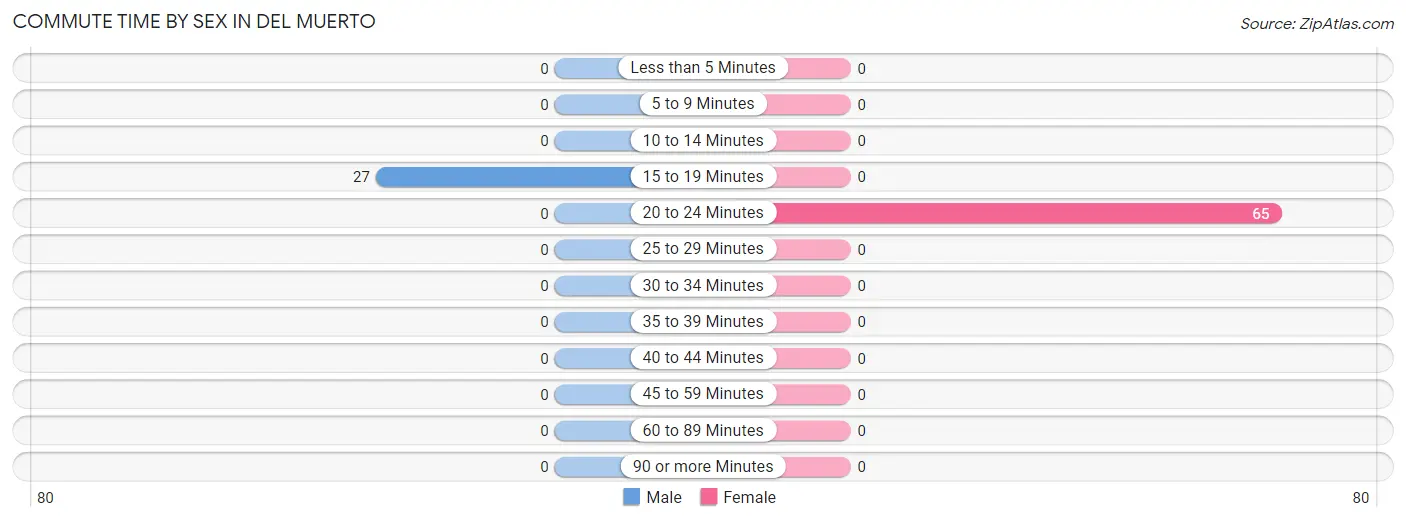
| Commute Time | Male | Female |
| Less than 5 Minutes | 0 (0.0%) | 0 (0.0%) |
| 5 to 9 Minutes | 0 (0.0%) | 0 (0.0%) |
| 10 to 14 Minutes | 0 (0.0%) | 0 (0.0%) |
| 15 to 19 Minutes | 27 (100.0%) | 0 (0.0%) |
| 20 to 24 Minutes | 0 (0.0%) | 65 (100.0%) |
| 25 to 29 Minutes | 0 (0.0%) | 0 (0.0%) |
| 30 to 34 Minutes | 0 (0.0%) | 0 (0.0%) |
| 35 to 39 Minutes | 0 (0.0%) | 0 (0.0%) |
| 40 to 44 Minutes | 0 (0.0%) | 0 (0.0%) |
| 45 to 59 Minutes | 0 (0.0%) | 0 (0.0%) |
| 60 to 89 Minutes | 0 (0.0%) | 0 (0.0%) |
| 90 or more Minutes | 0 (0.0%) | 0 (0.0%) |
Time of Departure to Work by Sex in Del Muerto
The most frequent times of departure to work in Del Muerto are 7:00 AM to 7:29 AM (27, 100.0%) for males and 7:30 AM to 7:59 AM (65, 100.0%) for females.
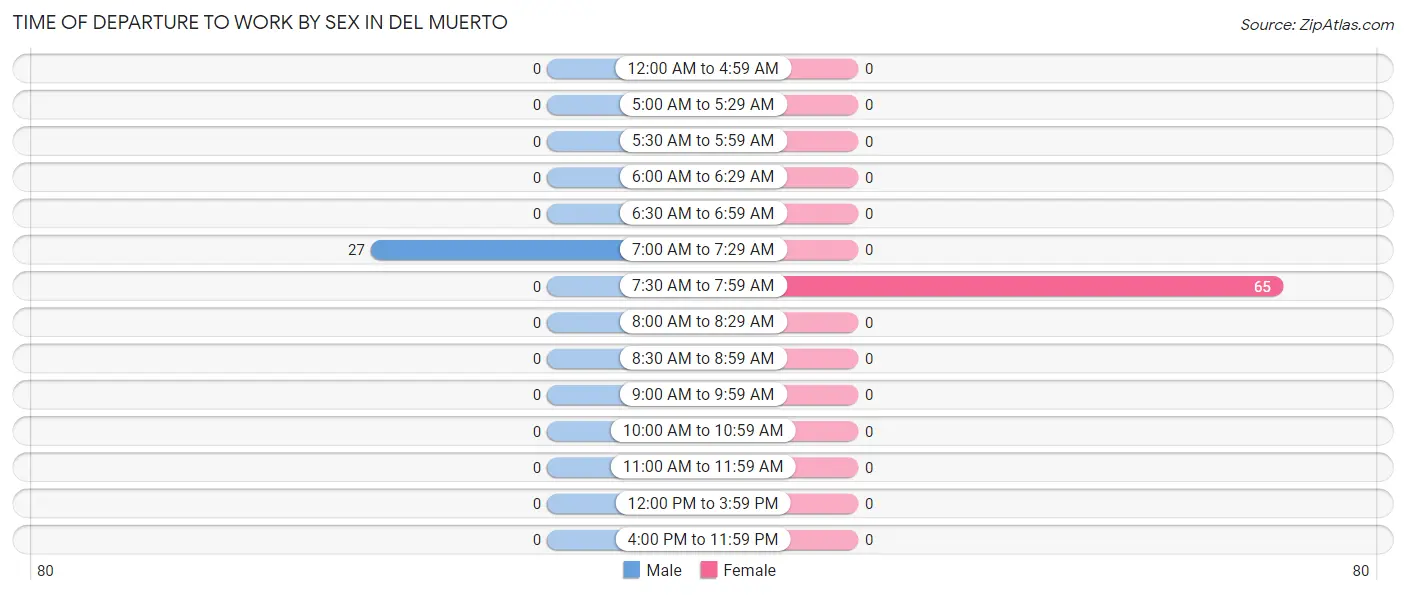
| Time of Departure | Male | Female |
| 12:00 AM to 4:59 AM | 0 (0.0%) | 0 (0.0%) |
| 5:00 AM to 5:29 AM | 0 (0.0%) | 0 (0.0%) |
| 5:30 AM to 5:59 AM | 0 (0.0%) | 0 (0.0%) |
| 6:00 AM to 6:29 AM | 0 (0.0%) | 0 (0.0%) |
| 6:30 AM to 6:59 AM | 0 (0.0%) | 0 (0.0%) |
| 7:00 AM to 7:29 AM | 27 (100.0%) | 0 (0.0%) |
| 7:30 AM to 7:59 AM | 0 (0.0%) | 65 (100.0%) |
| 8:00 AM to 8:29 AM | 0 (0.0%) | 0 (0.0%) |
| 8:30 AM to 8:59 AM | 0 (0.0%) | 0 (0.0%) |
| 9:00 AM to 9:59 AM | 0 (0.0%) | 0 (0.0%) |
| 10:00 AM to 10:59 AM | 0 (0.0%) | 0 (0.0%) |
| 11:00 AM to 11:59 AM | 0 (0.0%) | 0 (0.0%) |
| 12:00 PM to 3:59 PM | 0 (0.0%) | 0 (0.0%) |
| 4:00 PM to 11:59 PM | 0 (0.0%) | 0 (0.0%) |
| Total | 27 (100.0%) | 65 (100.0%) |
Housing Occupancy in Del Muerto
Occupancy by Ownership in Del Muerto
Of the total 180 dwellings in Del Muerto, owner-occupied units account for 180 (100.0%), while renter-occupied units make up 0 (0.0%).
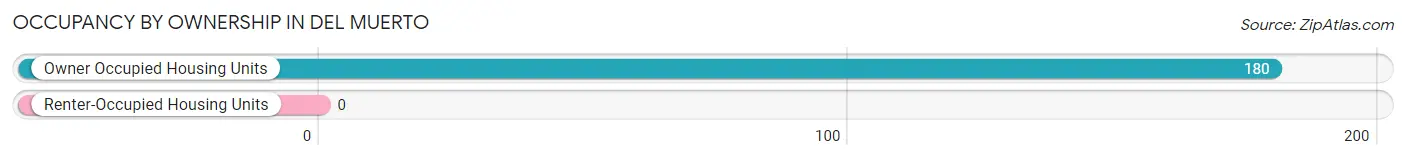
| Occupancy | # Housing Units | % Housing Units |
| Owner Occupied Housing Units | 180 | 100.0% |
| Renter-Occupied Housing Units | 0 | 0.0% |
| Total Occupied Housing Units | 180 | 100.0% |
Occupancy by Household Size in Del Muerto
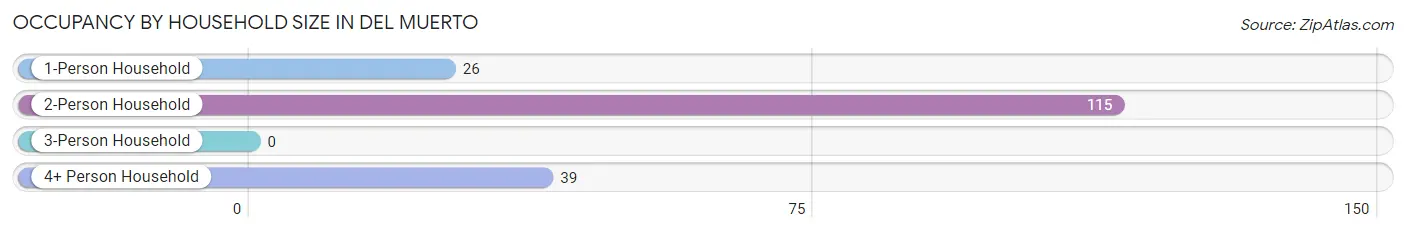
| Household Size | # Housing Units | % Housing Units |
| 1-Person Household | 26 | 14.4% |
| 2-Person Household | 115 | 63.9% |
| 3-Person Household | 0 | 0.0% |
| 4+ Person Household | 39 | 21.7% |
| Total Housing Units | 180 | 100.0% |
Occupancy by Ownership by Household Size in Del Muerto
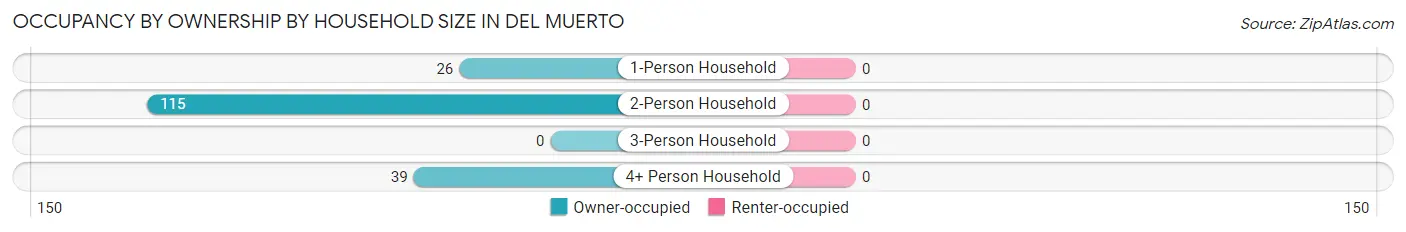
| Household Size | Owner-occupied | Renter-occupied |
| 1-Person Household | 26 (100.0%) | 0 (0.0%) |
| 2-Person Household | 115 (100.0%) | 0 (0.0%) |
| 3-Person Household | 0 (0.0%) | 0 (0.0%) |
| 4+ Person Household | 39 (100.0%) | 0 (0.0%) |
| Total Housing Units | 180 (100.0%) | 0 (0.0%) |
Occupancy by Educational Attainment in Del Muerto

| Household Size | Owner-occupied | Renter-occupied |
| Less than High School | 28 (100.0%) | 0 (0.0%) |
| High School Diploma | 116 (100.0%) | 0 (0.0%) |
| College/Associate Degree | 25 (100.0%) | 0 (0.0%) |
| Bachelor's Degree or higher | 11 (100.0%) | 0 (0.0%) |
Occupancy by Age of Householder in Del Muerto
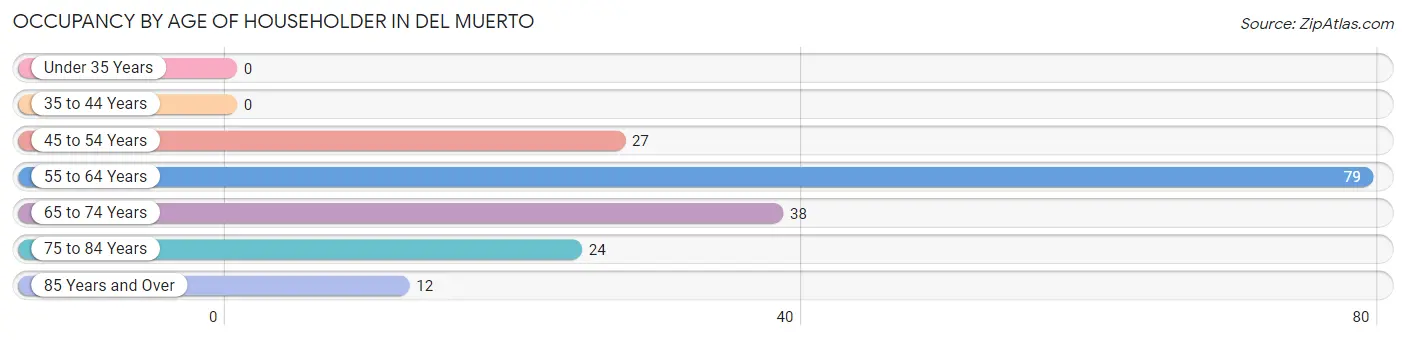
| Age Bracket | # Households | % Households |
| Under 35 Years | 0 | 0.0% |
| 35 to 44 Years | 0 | 0.0% |
| 45 to 54 Years | 27 | 15.0% |
| 55 to 64 Years | 79 | 43.9% |
| 65 to 74 Years | 38 | 21.1% |
| 75 to 84 Years | 24 | 13.3% |
| 85 Years and Over | 12 | 6.7% |
| Total | 180 | 100.0% |
Housing Finances in Del Muerto
Median Income by Occupancy in Del Muerto
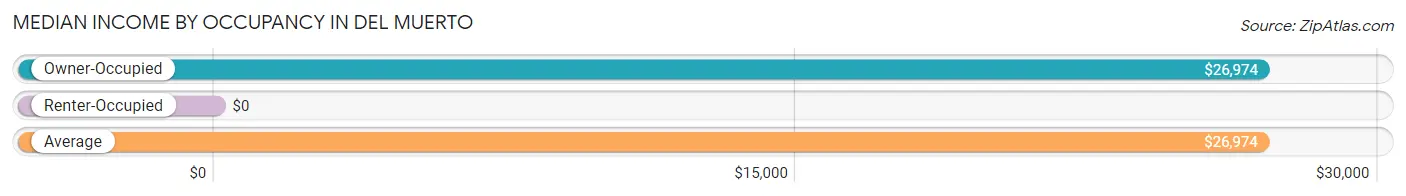
| Occupancy Type | # Households | Median Income |
| Owner-Occupied | 180 (100.0%) | $26,974 |
| Renter-Occupied | 0 (0.0%) | $0 |
| Average | 180 (100.0%) | $26,974 |
Occupancy by Householder Income Bracket in Del Muerto
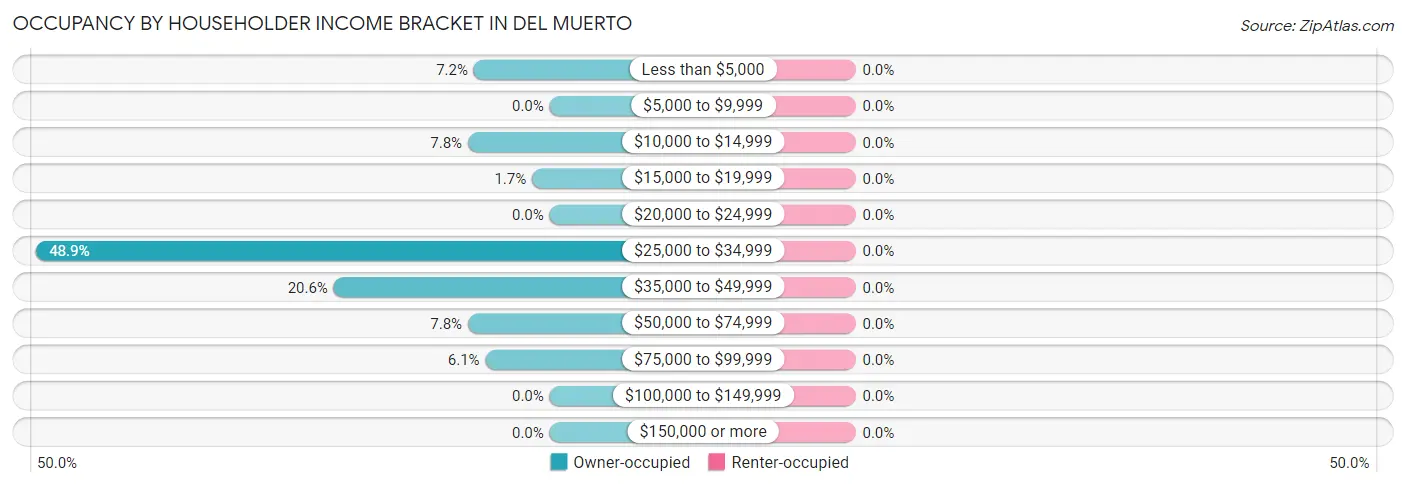
| Income Bracket | Owner-occupied | Renter-occupied |
| Less than $5,000 | 13 (7.2%) | 0 (0.0%) |
| $5,000 to $9,999 | 0 (0.0%) | 0 (0.0%) |
| $10,000 to $14,999 | 14 (7.8%) | 0 (0.0%) |
| $15,000 to $19,999 | 3 (1.7%) | 0 (0.0%) |
| $20,000 to $24,999 | 0 (0.0%) | 0 (0.0%) |
| $25,000 to $34,999 | 88 (48.9%) | 0 (0.0%) |
| $35,000 to $49,999 | 37 (20.6%) | 0 (0.0%) |
| $50,000 to $74,999 | 14 (7.8%) | 0 (0.0%) |
| $75,000 to $99,999 | 11 (6.1%) | 0 (0.0%) |
| $100,000 to $149,999 | 0 (0.0%) | 0 (0.0%) |
| $150,000 or more | 0 (0.0%) | 0 (0.0%) |
| Total | 180 (100.0%) | 0 (0.0%) |
Monthly Housing Cost Tiers in Del Muerto
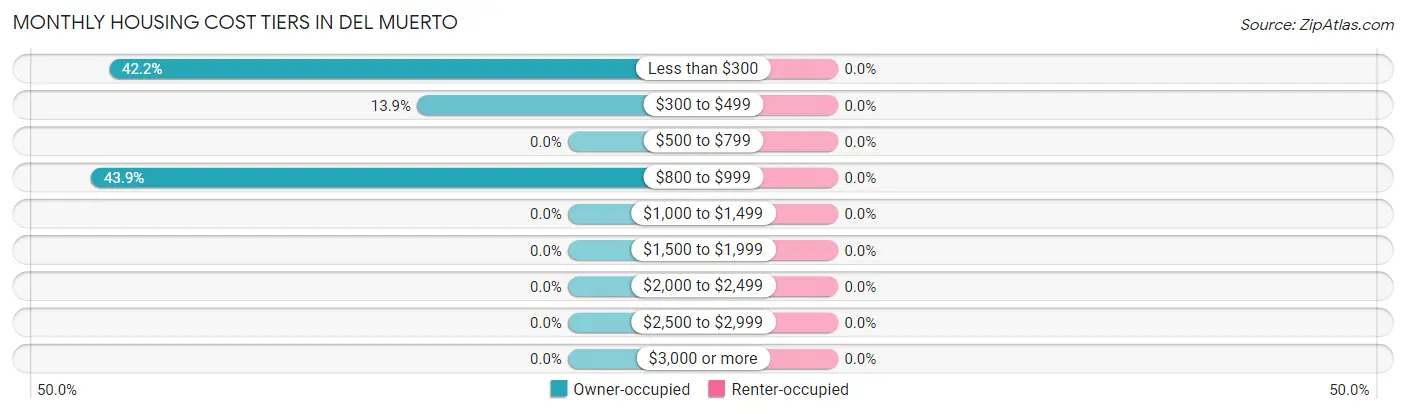
| Monthly Cost | Owner-occupied | Renter-occupied |
| Less than $300 | 76 (42.2%) | 0 (0.0%) |
| $300 to $499 | 25 (13.9%) | 0 (0.0%) |
| $500 to $799 | 0 (0.0%) | 0 (0.0%) |
| $800 to $999 | 79 (43.9%) | 0 (0.0%) |
| $1,000 to $1,499 | 0 (0.0%) | 0 (0.0%) |
| $1,500 to $1,999 | 0 (0.0%) | 0 (0.0%) |
| $2,000 to $2,499 | 0 (0.0%) | 0 (0.0%) |
| $2,500 to $2,999 | 0 (0.0%) | 0 (0.0%) |
| $3,000 or more | 0 (0.0%) | 0 (0.0%) |
| Total | 180 (100.0%) | 0 (0.0%) |
Physical Housing Characteristics in Del Muerto
Housing Structures in Del Muerto
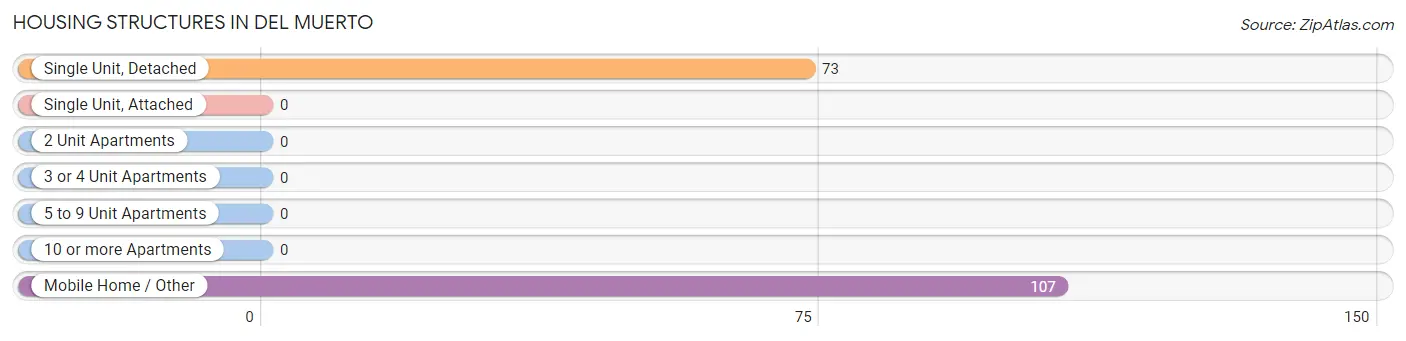
| Structure Type | # Housing Units | % Housing Units |
| Single Unit, Detached | 73 | 40.6% |
| Single Unit, Attached | 0 | 0.0% |
| 2 Unit Apartments | 0 | 0.0% |
| 3 or 4 Unit Apartments | 0 | 0.0% |
| 5 to 9 Unit Apartments | 0 | 0.0% |
| 10 or more Apartments | 0 | 0.0% |
| Mobile Home / Other | 107 | 59.4% |
| Total | 180 | 100.0% |
Housing Structures by Occupancy in Del Muerto
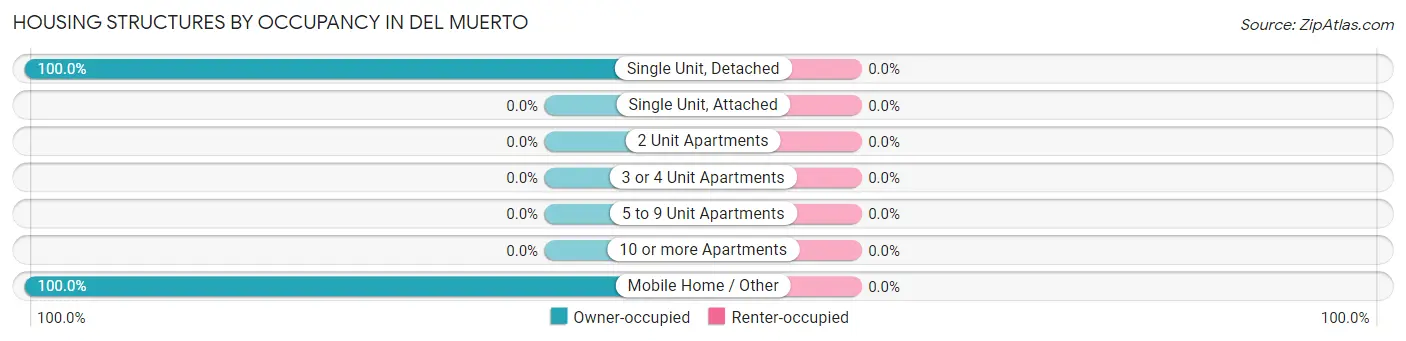
| Structure Type | Owner-occupied | Renter-occupied |
| Single Unit, Detached | 73 (100.0%) | 0 (0.0%) |
| Single Unit, Attached | 0 (0.0%) | 0 (0.0%) |
| 2 Unit Apartments | 0 (0.0%) | 0 (0.0%) |
| 3 or 4 Unit Apartments | 0 (0.0%) | 0 (0.0%) |
| 5 to 9 Unit Apartments | 0 (0.0%) | 0 (0.0%) |
| 10 or more Apartments | 0 (0.0%) | 0 (0.0%) |
| Mobile Home / Other | 107 (100.0%) | 0 (0.0%) |
| Total | 180 (100.0%) | 0 (0.0%) |
Housing Structures by Number of Rooms in Del Muerto
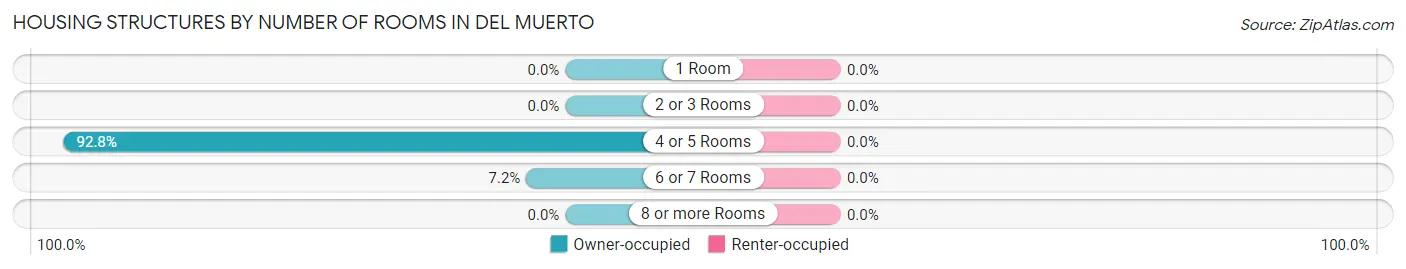
| Number of Rooms | Owner-occupied | Renter-occupied |
| 1 Room | 0 (0.0%) | 0 (0.0%) |
| 2 or 3 Rooms | 0 (0.0%) | 0 (0.0%) |
| 4 or 5 Rooms | 167 (92.8%) | 0 (0.0%) |
| 6 or 7 Rooms | 13 (7.2%) | 0 (0.0%) |
| 8 or more Rooms | 0 (0.0%) | 0 (0.0%) |
| Total | 180 (100.0%) | 0 (0.0%) |
Housing Structure by Heating Type in Del Muerto
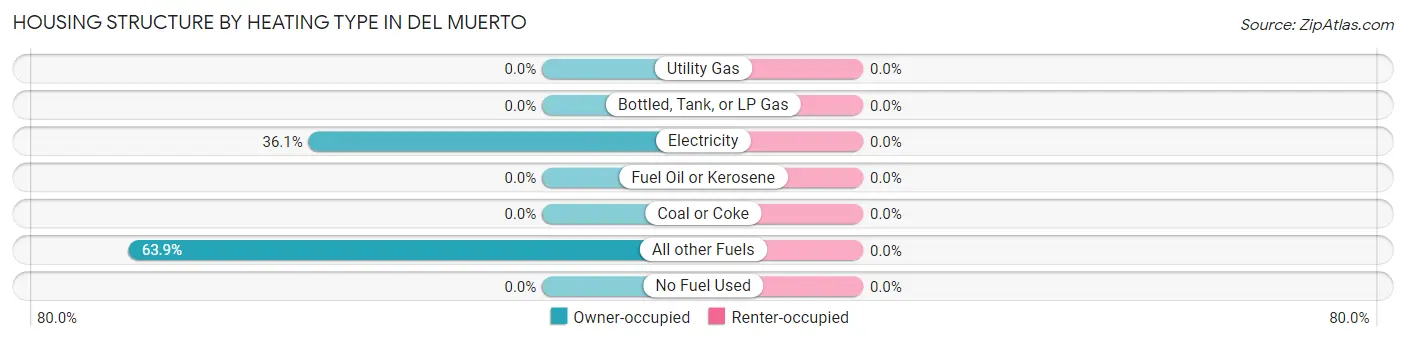
| Heating Type | Owner-occupied | Renter-occupied |
| Utility Gas | 0 (0.0%) | 0 (0.0%) |
| Bottled, Tank, or LP Gas | 0 (0.0%) | 0 (0.0%) |
| Electricity | 65 (36.1%) | 0 (0.0%) |
| Fuel Oil or Kerosene | 0 (0.0%) | 0 (0.0%) |
| Coal or Coke | 0 (0.0%) | 0 (0.0%) |
| All other Fuels | 115 (63.9%) | 0 (0.0%) |
| No Fuel Used | 0 (0.0%) | 0 (0.0%) |
| Total | 180 (100.0%) | 0 (0.0%) |
Household Vehicle Usage in Del Muerto
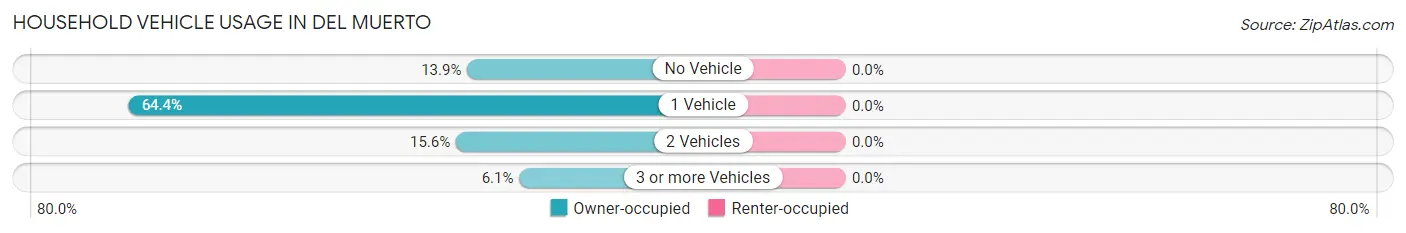
| Vehicles per Household | Owner-occupied | Renter-occupied |
| No Vehicle | 25 (13.9%) | 0 (0.0%) |
| 1 Vehicle | 116 (64.4%) | 0 (0.0%) |
| 2 Vehicles | 28 (15.6%) | 0 (0.0%) |
| 3 or more Vehicles | 11 (6.1%) | 0 (0.0%) |
| Total | 180 (100.0%) | 0 (0.0%) |
Real Estate & Mortgages in Del Muerto
Real Estate and Mortgage Overview in Del Muerto
| Characteristic | Without Mortgage | With Mortgage |
| Housing Units | 101 | 79 |
| Median Property Value | $22,600 | $0 |
| Median Household Income | $29,479 | $0 |
| Monthly Housing Costs | - | - |
| Real Estate Taxes | - | - |
Property Value by Mortgage Status in Del Muerto
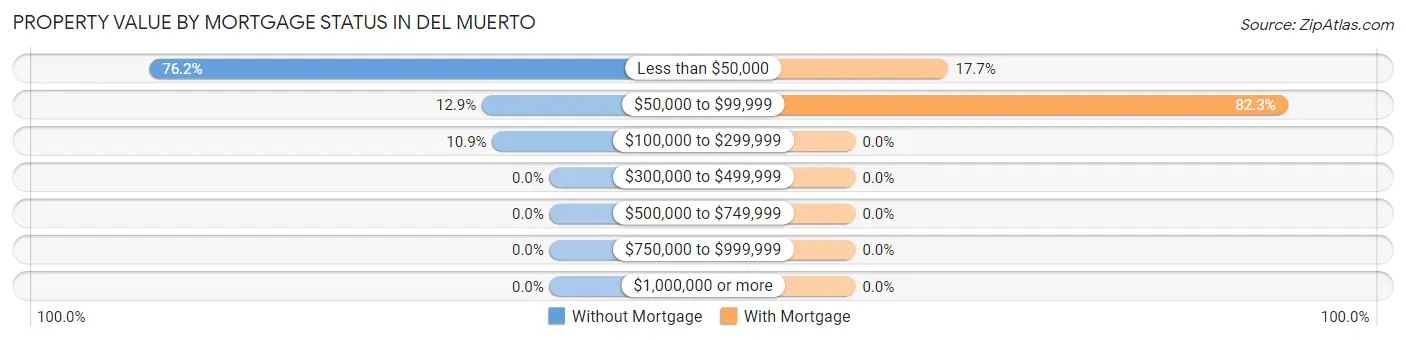
| Property Value | Without Mortgage | With Mortgage |
| Less than $50,000 | 77 (76.2%) | 14 (17.7%) |
| $50,000 to $99,999 | 13 (12.9%) | 65 (82.3%) |
| $100,000 to $299,999 | 11 (10.9%) | 0 (0.0%) |
| $300,000 to $499,999 | 0 (0.0%) | 0 (0.0%) |
| $500,000 to $749,999 | 0 (0.0%) | 0 (0.0%) |
| $750,000 to $999,999 | 0 (0.0%) | 0 (0.0%) |
| $1,000,000 or more | 0 (0.0%) | 0 (0.0%) |
| Total | 101 (100.0%) | 79 (100.0%) |
Household Income by Mortgage Status in Del Muerto
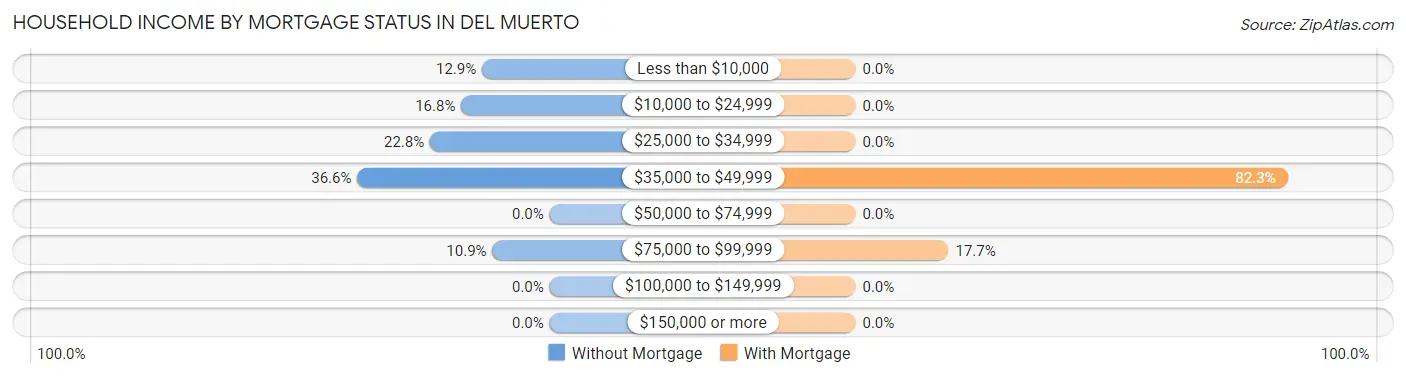
| Household Income | Without Mortgage | With Mortgage |
| Less than $10,000 | 13 (12.9%) | 0 (0.0%) |
| $10,000 to $24,999 | 17 (16.8%) | 0 (0.0%) |
| $25,000 to $34,999 | 23 (22.8%) | 0 (0.0%) |
| $35,000 to $49,999 | 37 (36.6%) | 65 (82.3%) |
| $50,000 to $74,999 | 0 (0.0%) | 0 (0.0%) |
| $75,000 to $99,999 | 11 (10.9%) | 14 (17.7%) |
| $100,000 to $149,999 | 0 (0.0%) | 0 (0.0%) |
| $150,000 or more | 0 (0.0%) | 0 (0.0%) |
| Total | 101 (100.0%) | 79 (100.0%) |
Property Value to Household Income Ratio in Del Muerto
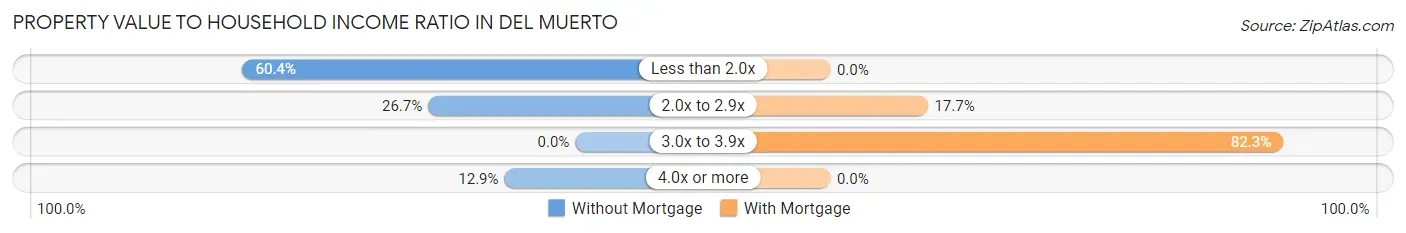
| Value-to-Income Ratio | Without Mortgage | With Mortgage |
| Less than 2.0x | 61 (60.4%) | 0 (0.0%) |
| 2.0x to 2.9x | 27 (26.7%) | 14 (17.7%) |
| 3.0x to 3.9x | 0 (0.0%) | 65 (82.3%) |
| 4.0x or more | 13 (12.9%) | 0 (0.0%) |
| Total | 101 (100.0%) | 79 (100.0%) |
Real Estate Taxes by Mortgage Status in Del Muerto

| Property Taxes | Without Mortgage | With Mortgage |
| Less than $800 | 0 (0.0%) | 0 (0.0%) |
| $800 to $1,499 | 0 (0.0%) | 0 (0.0%) |
| $800 to $1,499 | 0 (0.0%) | 0 (0.0%) |
| Total | 101 (100.0%) | 79 (100.0%) |
Health & Disability in Del Muerto
Health Insurance Coverage by Age in Del Muerto
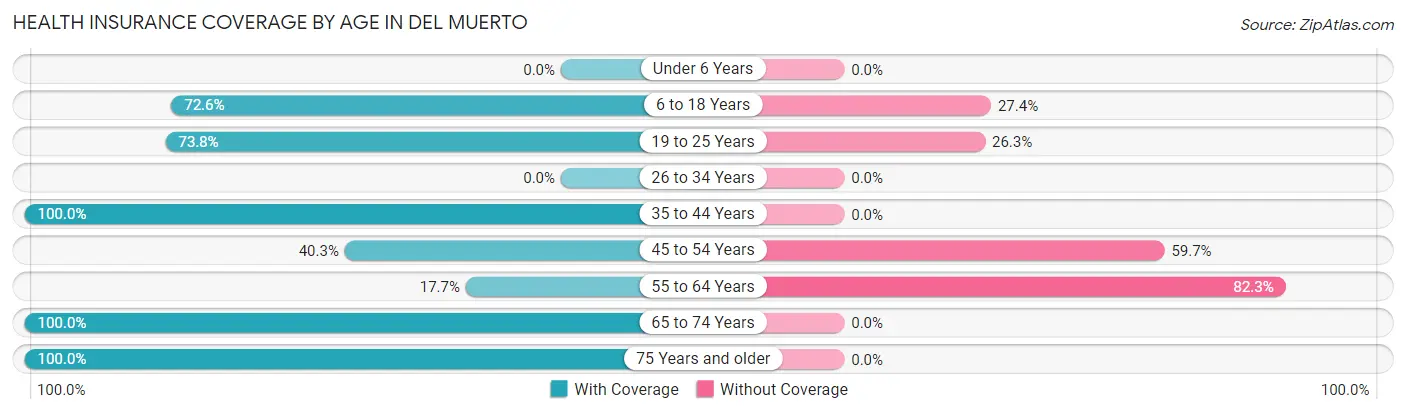
| Age Bracket | With Coverage | Without Coverage |
| Under 6 Years | 0 (0.0%) | 0 (0.0%) |
| 6 to 18 Years | 77 (72.6%) | 29 (27.4%) |
| 19 to 25 Years | 59 (73.8%) | 21 (26.3%) |
| 26 to 34 Years | 0 (0.0%) | 0 (0.0%) |
| 35 to 44 Years | 60 (100.0%) | 0 (0.0%) |
| 45 to 54 Years | 27 (40.3%) | 40 (59.7%) |
| 55 to 64 Years | 14 (17.7%) | 65 (82.3%) |
| 65 to 74 Years | 73 (100.0%) | 0 (0.0%) |
| 75 Years and older | 50 (100.0%) | 0 (0.0%) |
| Total | 360 (69.9%) | 155 (30.1%) |
Health Insurance Coverage by Citizenship Status in Del Muerto

| Citizenship Status | With Coverage | Without Coverage |
| Native Born | 0 (0.0%) | 0 (0.0%) |
| Foreign Born, Citizen | 77 (72.6%) | 29 (27.4%) |
| Foreign Born, not a Citizen | 59 (73.8%) | 21 (26.3%) |
Health Insurance Coverage by Household Income in Del Muerto

| Household Income | With Coverage | Without Coverage |
| Under $25,000 | 6 (6.2%) | 90 (93.8%) |
| $25,000 to $49,999 | 204 (75.8%) | 65 (24.2%) |
| $50,000 to $74,999 | 85 (100.0%) | 0 (0.0%) |
| $75,000 to $99,999 | 65 (100.0%) | 0 (0.0%) |
| $100,000 and over | 0 (0.0%) | 0 (0.0%) |
Public vs Private Health Insurance Coverage by Age in Del Muerto
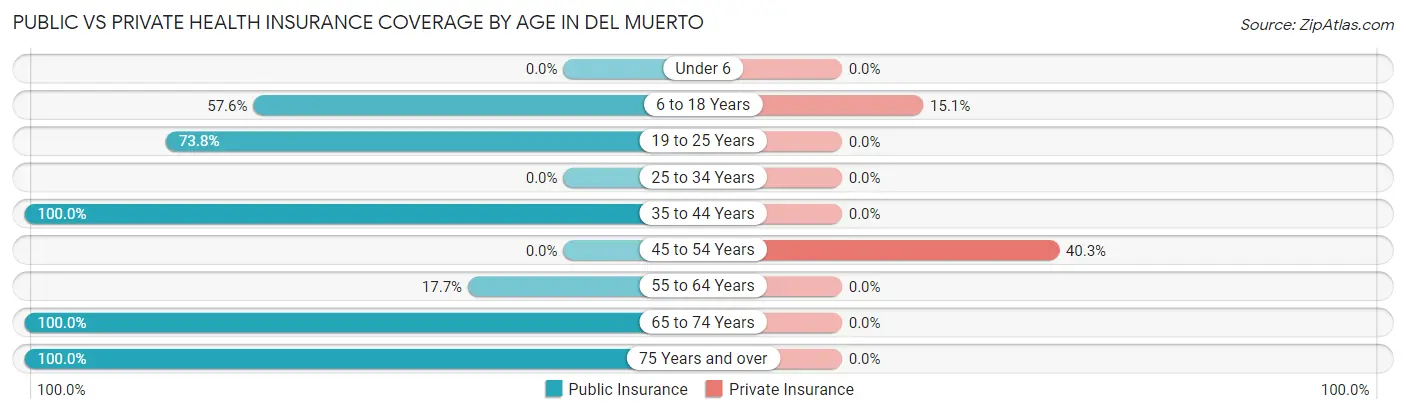
| Age Bracket | Public Insurance | Private Insurance |
| Under 6 | 0 (0.0%) | 0 (0.0%) |
| 6 to 18 Years | 61 (57.6%) | 16 (15.1%) |
| 19 to 25 Years | 59 (73.8%) | 0 (0.0%) |
| 25 to 34 Years | 0 (0.0%) | 0 (0.0%) |
| 35 to 44 Years | 60 (100.0%) | 0 (0.0%) |
| 45 to 54 Years | 0 (0.0%) | 27 (40.3%) |
| 55 to 64 Years | 14 (17.7%) | 0 (0.0%) |
| 65 to 74 Years | 73 (100.0%) | 0 (0.0%) |
| 75 Years and over | 50 (100.0%) | 0 (0.0%) |
| Total | 317 (61.6%) | 43 (8.4%) |
Disability Status by Sex by Age in Del Muerto
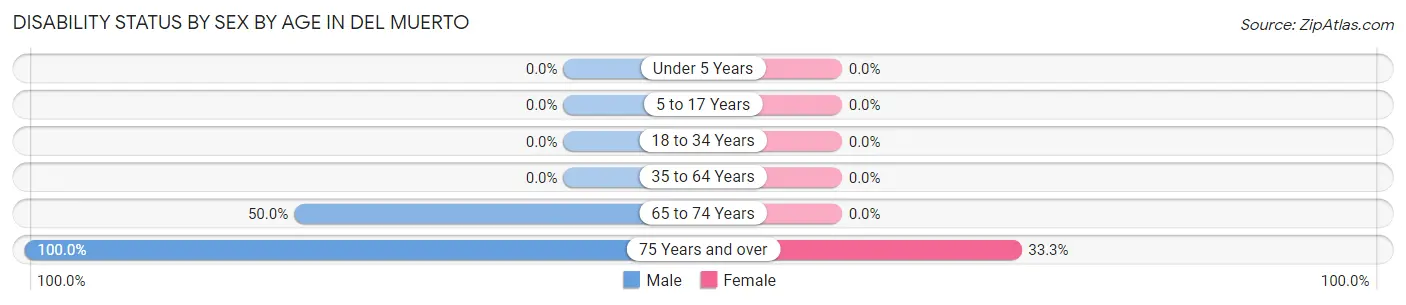
| Age Bracket | Male | Female |
| Under 5 Years | 0 (0.0%) | 0 (0.0%) |
| 5 to 17 Years | 0 (0.0%) | 0 (0.0%) |
| 18 to 34 Years | 0 (0.0%) | 0 (0.0%) |
| 35 to 64 Years | 0 (0.0%) | 0 (0.0%) |
| 65 to 74 Years | 23 (50.0%) | 0 (0.0%) |
| 75 Years and over | 14 (100.0%) | 12 (33.3%) |
Disability Class by Sex by Age in Del Muerto
Disability Class: Hearing Difficulty
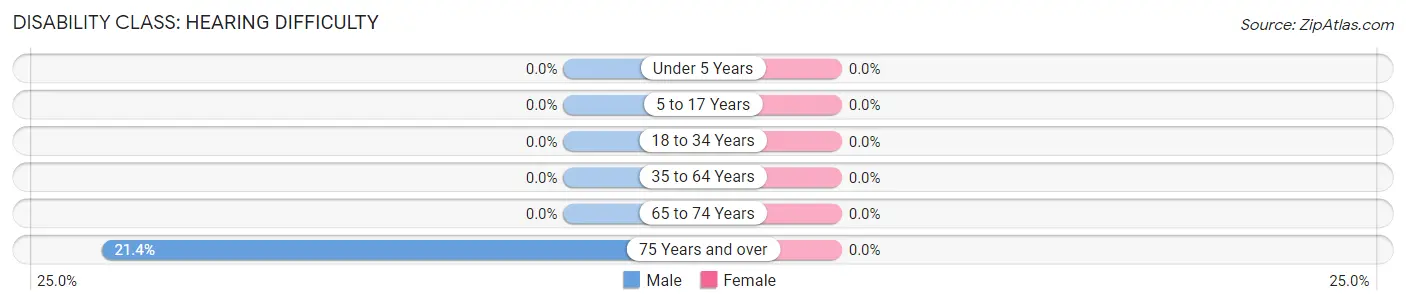
| Age Bracket | Male | Female |
| Under 5 Years | 0 (0.0%) | 0 (0.0%) |
| 5 to 17 Years | 0 (0.0%) | 0 (0.0%) |
| 18 to 34 Years | 0 (0.0%) | 0 (0.0%) |
| 35 to 64 Years | 0 (0.0%) | 0 (0.0%) |
| 65 to 74 Years | 0 (0.0%) | 0 (0.0%) |
| 75 Years and over | 3 (21.4%) | 0 (0.0%) |
Disability Class: Vision Difficulty
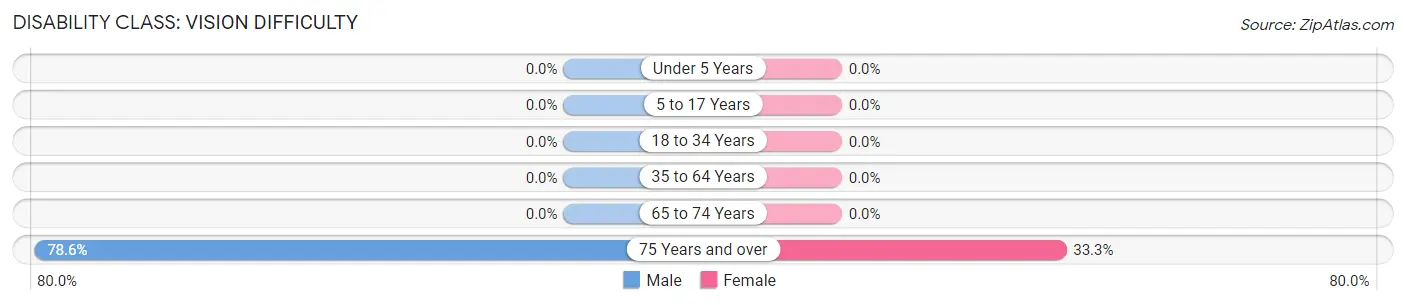
| Age Bracket | Male | Female |
| Under 5 Years | 0 (0.0%) | 0 (0.0%) |
| 5 to 17 Years | 0 (0.0%) | 0 (0.0%) |
| 18 to 34 Years | 0 (0.0%) | 0 (0.0%) |
| 35 to 64 Years | 0 (0.0%) | 0 (0.0%) |
| 65 to 74 Years | 0 (0.0%) | 0 (0.0%) |
| 75 Years and over | 11 (78.6%) | 12 (33.3%) |
Disability Class: Cognitive Difficulty
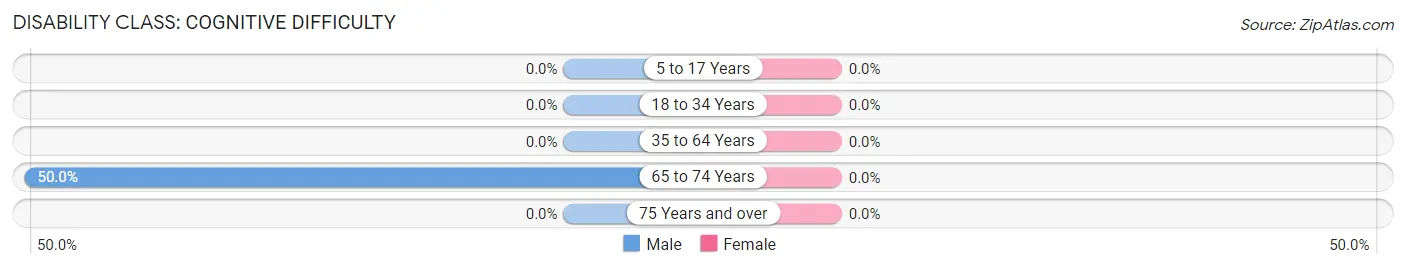
| Age Bracket | Male | Female |
| 5 to 17 Years | 0 (0.0%) | 0 (0.0%) |
| 18 to 34 Years | 0 (0.0%) | 0 (0.0%) |
| 35 to 64 Years | 0 (0.0%) | 0 (0.0%) |
| 65 to 74 Years | 23 (50.0%) | 0 (0.0%) |
| 75 Years and over | 0 (0.0%) | 0 (0.0%) |
Disability Class: Ambulatory Difficulty

| Age Bracket | Male | Female |
| 5 to 17 Years | 0 (0.0%) | 0 (0.0%) |
| 18 to 34 Years | 0 (0.0%) | 0 (0.0%) |
| 35 to 64 Years | 0 (0.0%) | 0 (0.0%) |
| 65 to 74 Years | 23 (50.0%) | 0 (0.0%) |
| 75 Years and over | 3 (21.4%) | 12 (33.3%) |
Disability Class: Self-Care Difficulty
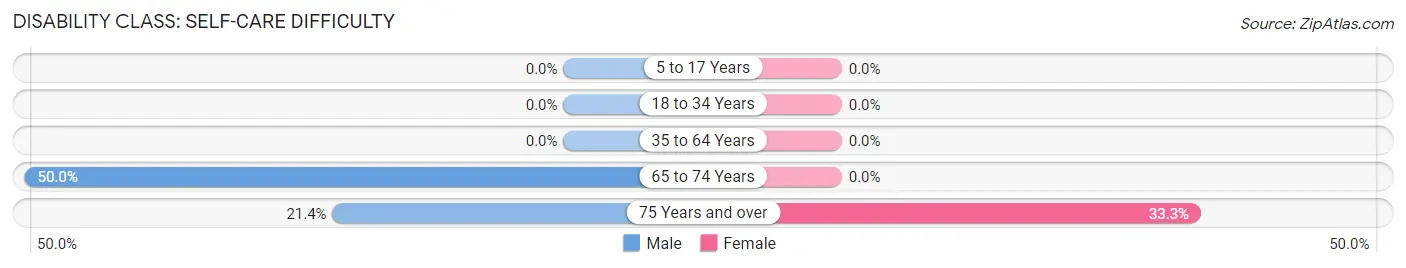
| Age Bracket | Male | Female |
| 5 to 17 Years | 0 (0.0%) | 0 (0.0%) |
| 18 to 34 Years | 0 (0.0%) | 0 (0.0%) |
| 35 to 64 Years | 0 (0.0%) | 0 (0.0%) |
| 65 to 74 Years | 23 (50.0%) | 0 (0.0%) |
| 75 Years and over | 3 (21.4%) | 12 (33.3%) |
Technology Access in Del Muerto
Computing Device Access in Del Muerto
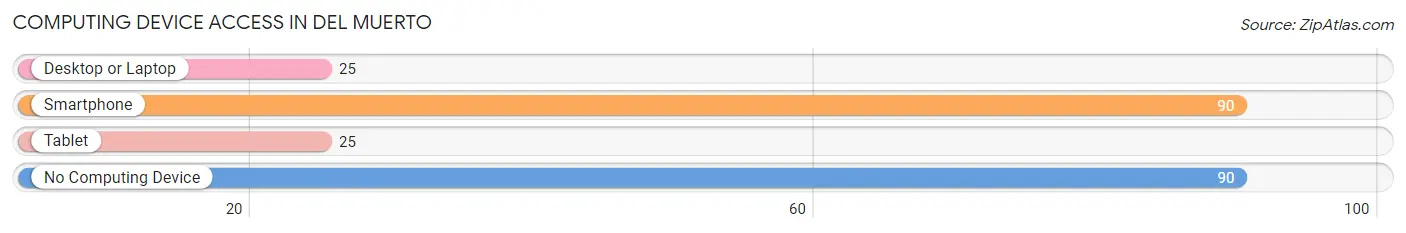
| Device Type | # Households | % Households |
| Desktop or Laptop | 25 | 13.9% |
| Smartphone | 90 | 50.0% |
| Tablet | 25 | 13.9% |
| No Computing Device | 90 | 50.0% |
| Total | 180 | 100.0% |
Internet Access in Del Muerto
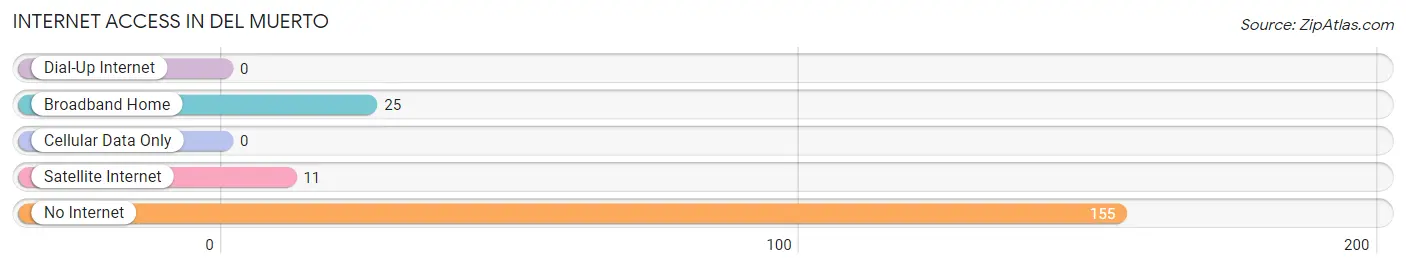
| Internet Type | # Households | % Households |
| Dial-Up Internet | 0 | 0.0% |
| Broadband Home | 25 | 13.9% |
| Cellular Data Only | 0 | 0.0% |
| Satellite Internet | 11 | 6.1% |
| No Internet | 155 | 86.1% |
| Total | 180 | 100.0% |
Del Muerto Summary
Muerto, Arizona is a small unincorporated community located in the northern part of the state, in Coconino County. It is situated in the Coconino National Forest, near the Arizona-Utah border. The town is located on the western edge of the Colorado Plateau, and is surrounded by the Kaibab National Forest to the east and the Coconino National Forest to the west. The town is home to a population of approximately 200 people, and is a popular destination for outdoor recreation.
History
The area around Muerto, Arizona has been inhabited for thousands of years by various Native American tribes, including the Hopi, Navajo, and Apache. The first European settlers arrived in the area in the late 1800s, and the town of Muerto was established in the early 1900s. The town was named after the nearby Muerto Mountains, which were named by Spanish explorers in the 1700s.
The town of Muerto was originally a mining town, and the area was home to several copper and silver mines. The town was also home to a number of small businesses, including a general store, a post office, and a hotel. The town was also home to a number of saloons and gambling halls, which were popular with the miners and other travelers.
In the early 1900s, the town of Muerto was a popular destination for tourists, and the area was home to a number of resorts and hotels. The town was also home to a number of ranches, and the area was known for its cattle and sheep ranching.
Geography
Muerto, Arizona is located in the northern part of the state, in Coconino County. The town is situated in the Coconino National Forest, near the Arizona-Utah border. The town is located on the western edge of the Colorado Plateau, and is surrounded by the Kaibab National Forest to the east and the Coconino National Forest to the west.
The town of Muerto is located at an elevation of 6,000 feet, and the area is known for its rugged terrain and spectacular views. The area is home to a number of mountain peaks, including the Muerto Mountains, which are located just to the east of the town. The area is also home to a number of canyons, including the Grand Canyon, which is located just to the north of the town.
Economy
The economy of Muerto, Arizona is largely based on tourism and outdoor recreation. The town is a popular destination for hikers, campers, and other outdoor enthusiasts, and the area is home to a number of trails and campgrounds. The town is also home to a number of resorts and hotels, which cater to tourists and other visitors.
The town is also home to a number of small businesses, including a general store, a post office, and a hotel. The town is also home to a number of ranches, and the area is known for its cattle and sheep ranching.
Demographics
As of the 2010 census, the population of Muerto, Arizona was approximately 200 people. The town is predominantly white, with a small Hispanic population. The median household income in the town is approximately $30,000, and the median age is approximately 40 years old. The town is home to a number of small businesses, and the area is known for its outdoor recreation and tourism.
Common Questions
What is Per Capita Income in Del Muerto?
Per Capita income in Del Muerto is $13,070.
What is the Median Family Income in Del Muerto?
Median Family Income in Del Muerto is $26,974.
What is the Median Household income in Del Muerto?
Median Household Income in Del Muerto is $26,974.
What is Inequality or Gini Index in Del Muerto?
Inequality or Gini Index in Del Muerto is 0.31.
What is the Total Population of Del Muerto?
Total Population of Del Muerto is 515.
What is the Total Male Population of Del Muerto?
Total Male Population of Del Muerto is 194.
What is the Total Female Population of Del Muerto?
Total Female Population of Del Muerto is 321.
What is the Ratio of Males per 100 Females in Del Muerto?
There are 60.44 Males per 100 Females in Del Muerto.
What is the Ratio of Females per 100 Males in Del Muerto?
There are 165.46 Females per 100 Males in Del Muerto.
What is the Median Population Age in Del Muerto?
Median Population Age in Del Muerto is 46.2 Years.
What is the Average Family Size in Del Muerto
Average Family Size in Del Muerto is 3.2 People.
What is the Average Household Size in Del Muerto
Average Household Size in Del Muerto is 2.9 People.
How Large is the Labor Force in Del Muerto?
There are 119 People in the Labor Forcein in Del Muerto.
What is the Percentage of People in the Labor Force in Del Muerto?
27.2% of People are in the Labor Force in Del Muerto.