Sorrel, LA Map & Demographics
Sorrel Map
Sorrel Overview
$31,002
PER CAPITA INCOME
$80,938
AVG FAMILY INCOME
$56,500
AVG HOUSEHOLD INCOME
0.45
INEQUALITY / GINI INDEX
537
TOTAL POPULATION
263
MALE POPULATION
274
FEMALE POPULATION
95.99
MALES / 100 FEMALES
104.18
FEMALES / 100 MALES
48.1
MEDIAN AGE
3.4
AVG FAMILY SIZE
2.5
AVG HOUSEHOLD SIZE
171
LABOR FORCE [ PEOPLE ]
34.4%
PERCENT IN LABOR FORCE
Income in Sorrel
Income Overview in Sorrel
Per Capita Income in Sorrel is $31,002, while median incomes of families and households are $80,938 and $56,500 respectively.
| Characteristic | Number | Measure |
| Per Capita Income | 537 | $31,002 |
| Median Family Income | 132 | $80,938 |
| Mean Family Income | 132 | $95,083 |
| Median Household Income | 214 | $56,500 |
| Mean Household Income | 214 | $71,971 |
| Income Deficit | 132 | $0 |
| Wage / Income Gap (%) | 537 | 0.00% |
| Wage / Income Gap ($) | 537 | 100.00¢ per $1 |
| Gini / Inequality Index | 537 | 0.45 |
Earnings by Sex in Sorrel
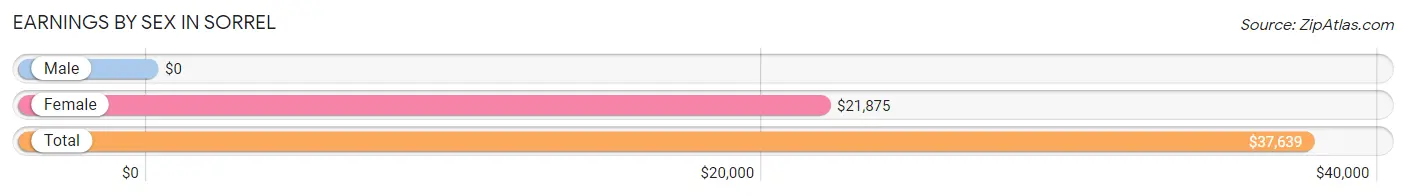
| Sex | Number | Average Earnings |
| Male | 126 (70.8%) | $0 |
| Female | 52 (29.2%) | $21,875 |
| Total | 178 (100.0%) | $37,639 |
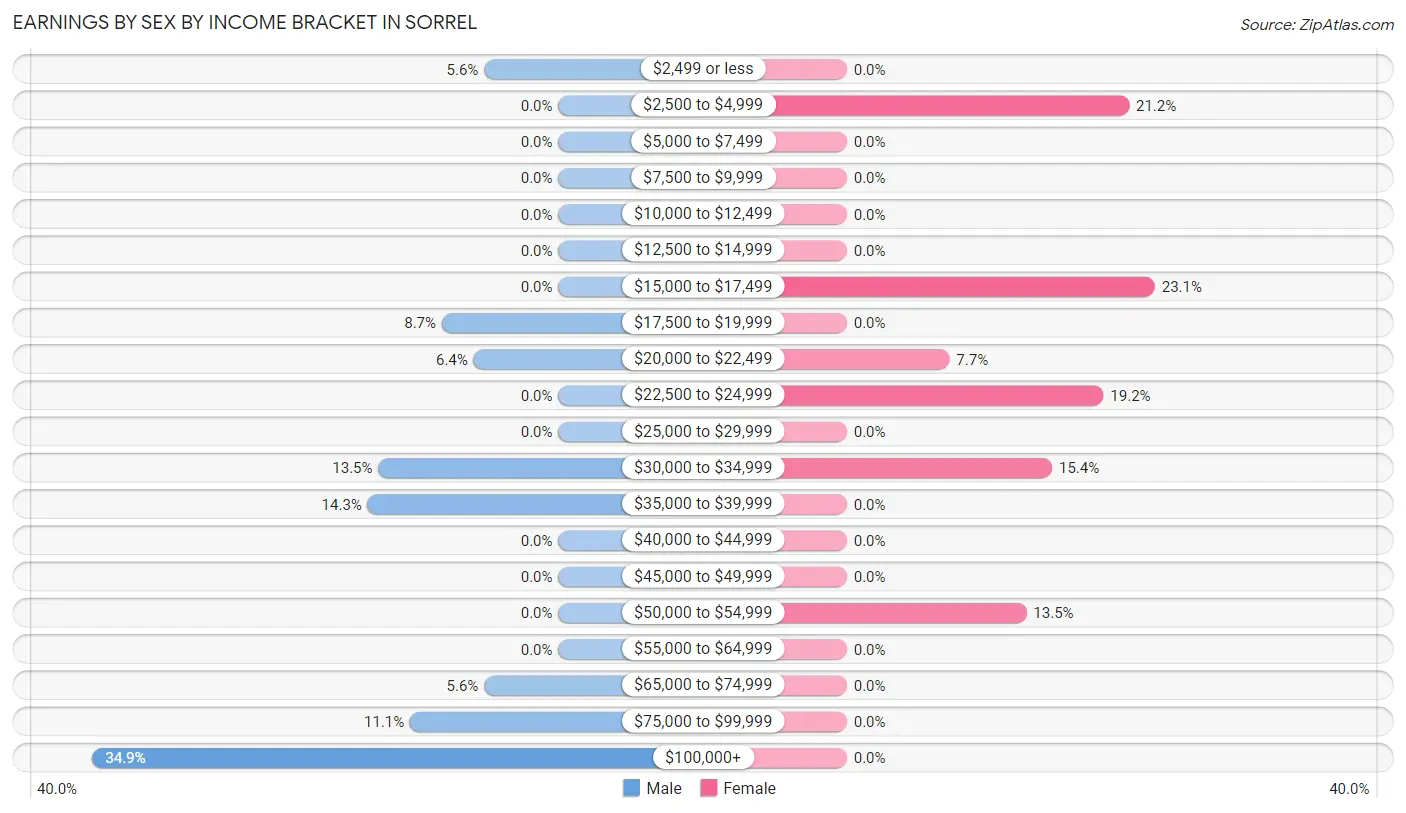
Earnings by Sex by Income Bracket in Sorrel
The most common earnings brackets in Sorrel are $100,000+ for men (44 | 34.9%) and $15,000 to $17,499 for women (12 | 23.1%).
| Income | Male | Female |
| $2,499 or less | 7 (5.6%) | 0 (0.0%) |
| $2,500 to $4,999 | 0 (0.0%) | 11 (21.1%) |
| $5,000 to $7,499 | 0 (0.0%) | 0 (0.0%) |
| $7,500 to $9,999 | 0 (0.0%) | 0 (0.0%) |
| $10,000 to $12,499 | 0 (0.0%) | 0 (0.0%) |
| $12,500 to $14,999 | 0 (0.0%) | 0 (0.0%) |
| $15,000 to $17,499 | 0 (0.0%) | 12 (23.1%) |
| $17,500 to $19,999 | 11 (8.7%) | 0 (0.0%) |
| $20,000 to $22,499 | 8 (6.4%) | 4 (7.7%) |
| $22,500 to $24,999 | 0 (0.0%) | 10 (19.2%) |
| $25,000 to $29,999 | 0 (0.0%) | 0 (0.0%) |
| $30,000 to $34,999 | 17 (13.5%) | 8 (15.4%) |
| $35,000 to $39,999 | 18 (14.3%) | 0 (0.0%) |
| $40,000 to $44,999 | 0 (0.0%) | 0 (0.0%) |
| $45,000 to $49,999 | 0 (0.0%) | 0 (0.0%) |
| $50,000 to $54,999 | 0 (0.0%) | 7 (13.5%) |
| $55,000 to $64,999 | 0 (0.0%) | 0 (0.0%) |
| $65,000 to $74,999 | 7 (5.6%) | 0 (0.0%) |
| $75,000 to $99,999 | 14 (11.1%) | 0 (0.0%) |
| $100,000+ | 44 (34.9%) | 0 (0.0%) |
| Total | 126 (100.0%) | 52 (100.0%) |
Earnings by Sex by Educational Attainment in Sorrel
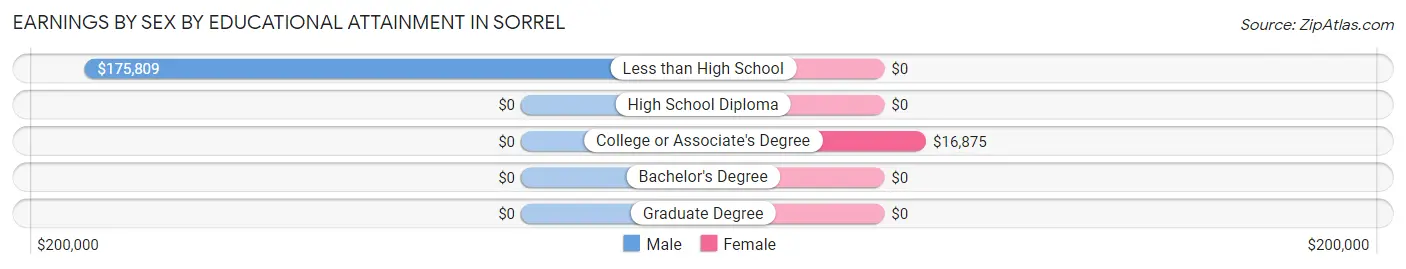
| Educational Attainment | Male Income | Female Income |
| Less than High School | $175,809 | $0 |
| High School Diploma | - | - |
| College or Associate's Degree | - | - |
| Bachelor's Degree | - | - |
| Graduate Degree | - | - |
| Total | - | - |
Family Income in Sorrel
Family Income Brackets in Sorrel
According to the Sorrel family income data, there are 38 families falling into the $150,000 to $199,999 income range, which is the most common income bracket and makes up 28.8% of all families.
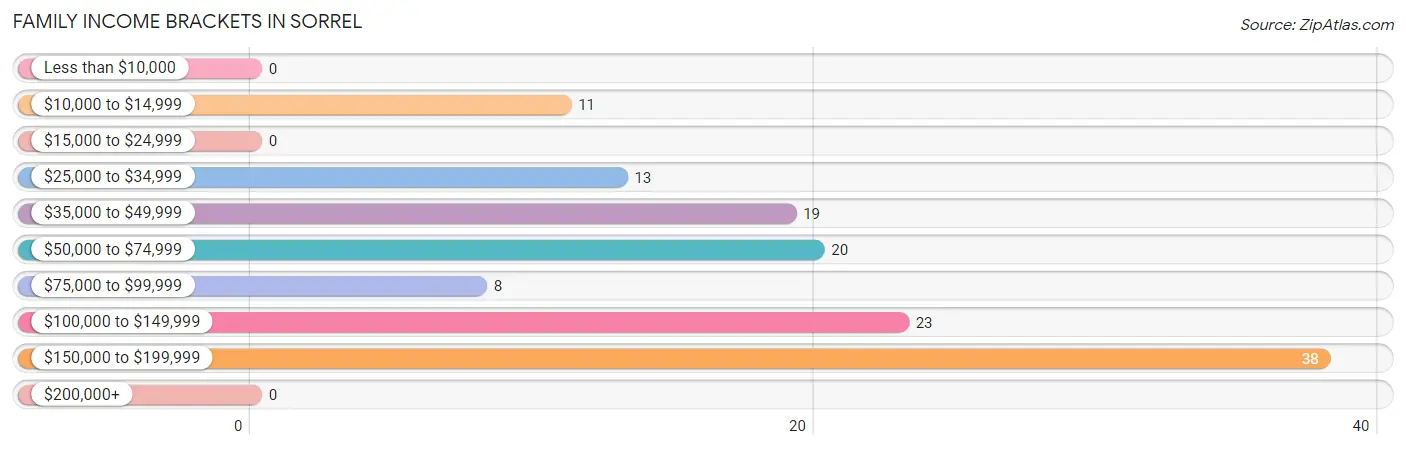
| Income Bracket | # Families | % Families |
| Less than $10,000 | 0 | 0.0% |
| $10,000 to $14,999 | 11 | 8.3% |
| $15,000 to $24,999 | 0 | 0.0% |
| $25,000 to $34,999 | 13 | 9.8% |
| $35,000 to $49,999 | 19 | 14.4% |
| $50,000 to $74,999 | 20 | 15.2% |
| $75,000 to $99,999 | 8 | 6.1% |
| $100,000 to $149,999 | 23 | 17.4% |
| $150,000 to $199,999 | 38 | 28.8% |
| $200,000+ | 0 | 0.0% |
Family Income by Famaliy Size in Sorrel
3-person families (61 | 46.2%) account for the highest median family income in Sorrel with $175,694 per family, while 3-person families (61 | 46.2%) have the highest median income of $58,565 per family member.
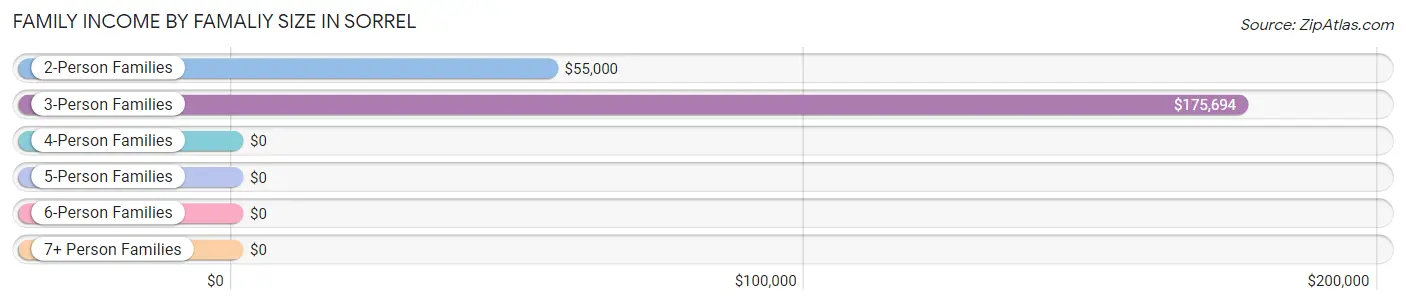
| Income Bracket | # Families | Median Income |
| 2-Person Families | 54 (40.9%) | $55,000 |
| 3-Person Families | 61 (46.2%) | $175,694 |
| 4-Person Families | 10 (7.6%) | $0 |
| 5-Person Families | 7 (5.3%) | $0 |
| 6-Person Families | 0 (0.0%) | $0 |
| 7+ Person Families | 0 (0.0%) | $0 |
| Total | 132 (100.0%) | $80,938 |
Family Income by Number of Earners in Sorrel
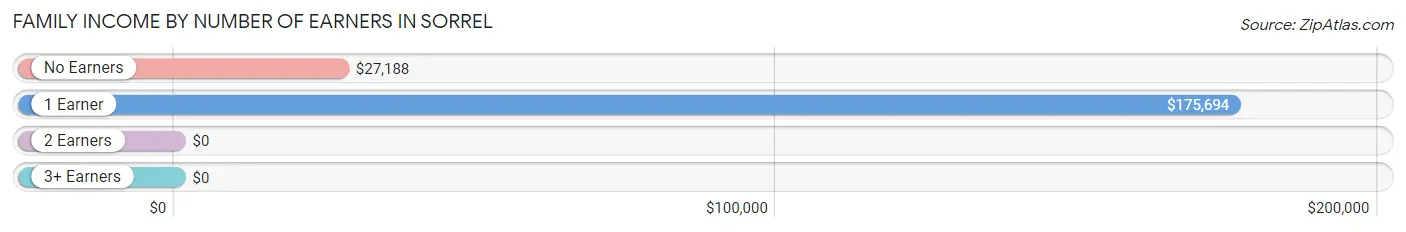
| Number of Earners | # Families | Median Income |
| No Earners | 36 (27.3%) | $27,188 |
| 1 Earner | 61 (46.2%) | $175,694 |
| 2 Earners | 31 (23.5%) | $0 |
| 3+ Earners | 4 (3.0%) | $0 |
| Total | 132 (100.0%) | $80,938 |
Household Income in Sorrel
Household Income Brackets in Sorrel
With 54 households falling in the category, the $10,000 to $14,999 income range is the most frequent in Sorrel, accounting for 25.2% of all households.
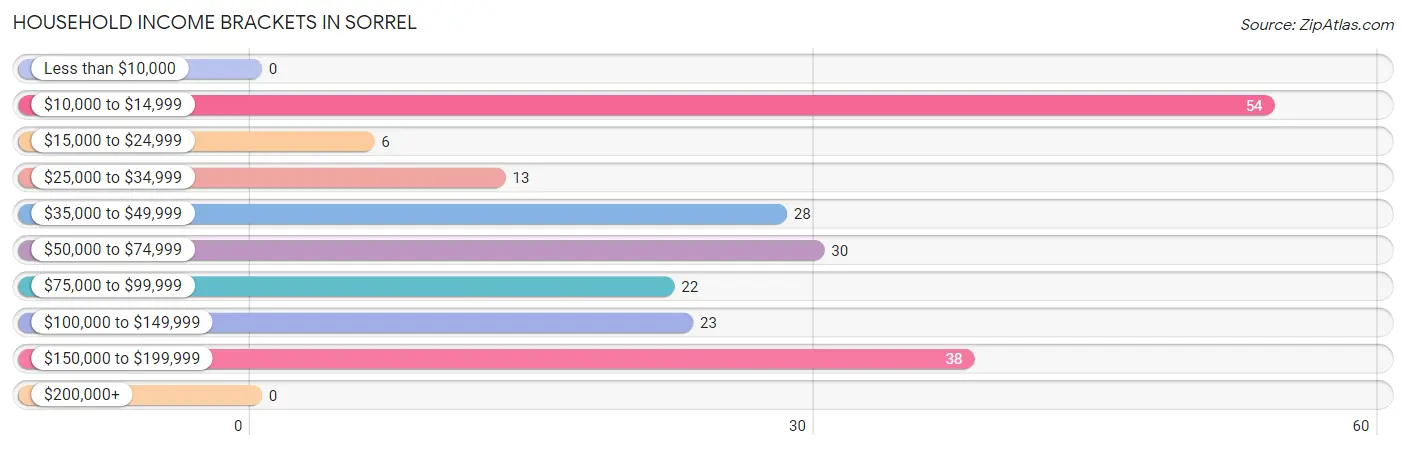
| Income Bracket | # Households | % Households |
| Less than $10,000 | 0 | 0.0% |
| $10,000 to $14,999 | 54 | 25.2% |
| $15,000 to $24,999 | 6 | 2.8% |
| $25,000 to $34,999 | 13 | 6.1% |
| $35,000 to $49,999 | 28 | 13.1% |
| $50,000 to $74,999 | 30 | 14.0% |
| $75,000 to $99,999 | 22 | 10.3% |
| $100,000 to $149,999 | 23 | 10.7% |
| $150,000 to $199,999 | 38 | 17.8% |
| $200,000+ | 0 | 0.0% |
Household Income by Householder Age in Sorrel
The median household income in Sorrel is $56,500, with the highest median household income of $107,917 found in the 45 to 64 years age bracket for the primary householder. A total of 98 households (45.8%) fall into this category.
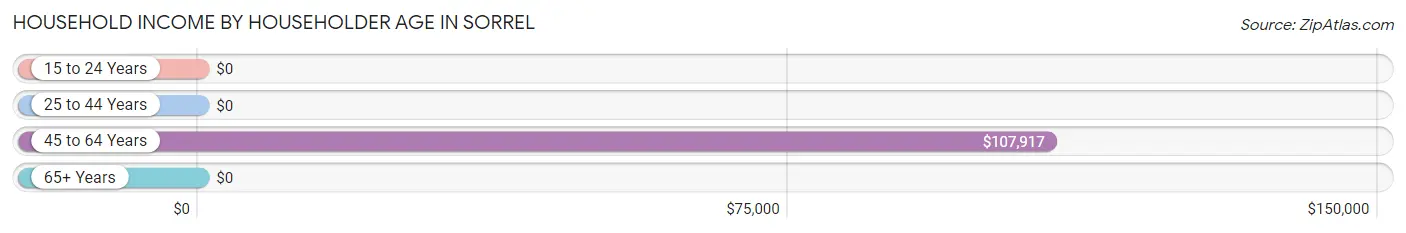
| Income Bracket | # Households | Median Income |
| 15 to 24 Years | 0 (0.0%) | $0 |
| 25 to 44 Years | 21 (9.8%) | $0 |
| 45 to 64 Years | 98 (45.8%) | $107,917 |
| 65+ Years | 95 (44.4%) | $0 |
| Total | 214 (100.0%) | $56,500 |
Poverty in Sorrel
Income Below Poverty by Sex and Age in Sorrel
With 16.4% poverty level for males and 22.3% for females among the residents of Sorrel, 65 to 74 year old males and 25 to 34 year old females are the most vulnerable to poverty, with 43 males (68.2%) and 35 females (61.4%) in their respective age groups living below the poverty level.
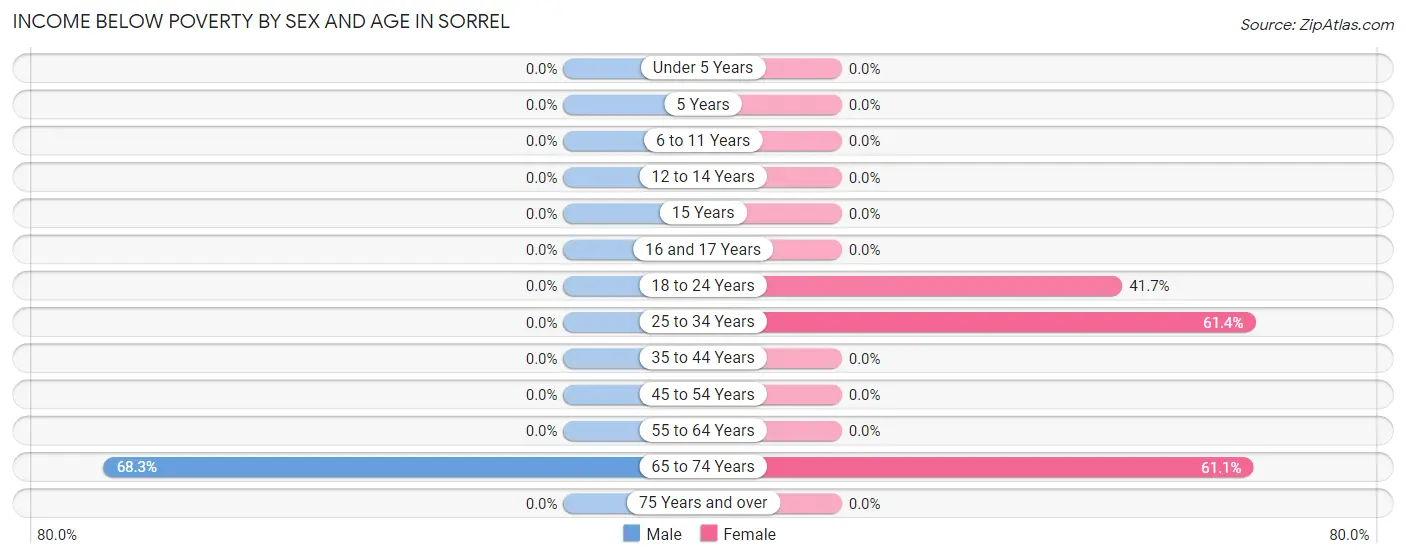
| Age Bracket | Male | Female |
| Under 5 Years | 0 (0.0%) | 0 (0.0%) |
| 5 Years | 0 (0.0%) | 0 (0.0%) |
| 6 to 11 Years | 0 (0.0%) | 0 (0.0%) |
| 12 to 14 Years | 0 (0.0%) | 0 (0.0%) |
| 15 Years | 0 (0.0%) | 0 (0.0%) |
| 16 and 17 Years | 0 (0.0%) | 0 (0.0%) |
| 18 to 24 Years | 0 (0.0%) | 15 (41.7%) |
| 25 to 34 Years | 0 (0.0%) | 35 (61.4%) |
| 35 to 44 Years | 0 (0.0%) | 0 (0.0%) |
| 45 to 54 Years | 0 (0.0%) | 0 (0.0%) |
| 55 to 64 Years | 0 (0.0%) | 0 (0.0%) |
| 65 to 74 Years | 43 (68.2%) | 11 (61.1%) |
| 75 Years and over | 0 (0.0%) | 0 (0.0%) |
| Total | 43 (16.4%) | 61 (22.3%) |
Income Above Poverty by Sex and Age in Sorrel
According to the poverty statistics in Sorrel, males aged 6 to 11 years and females aged 12 to 14 years are the age groups that are most secure financially, with 100.0% of males and 100.0% of females in these age groups living above the poverty line.
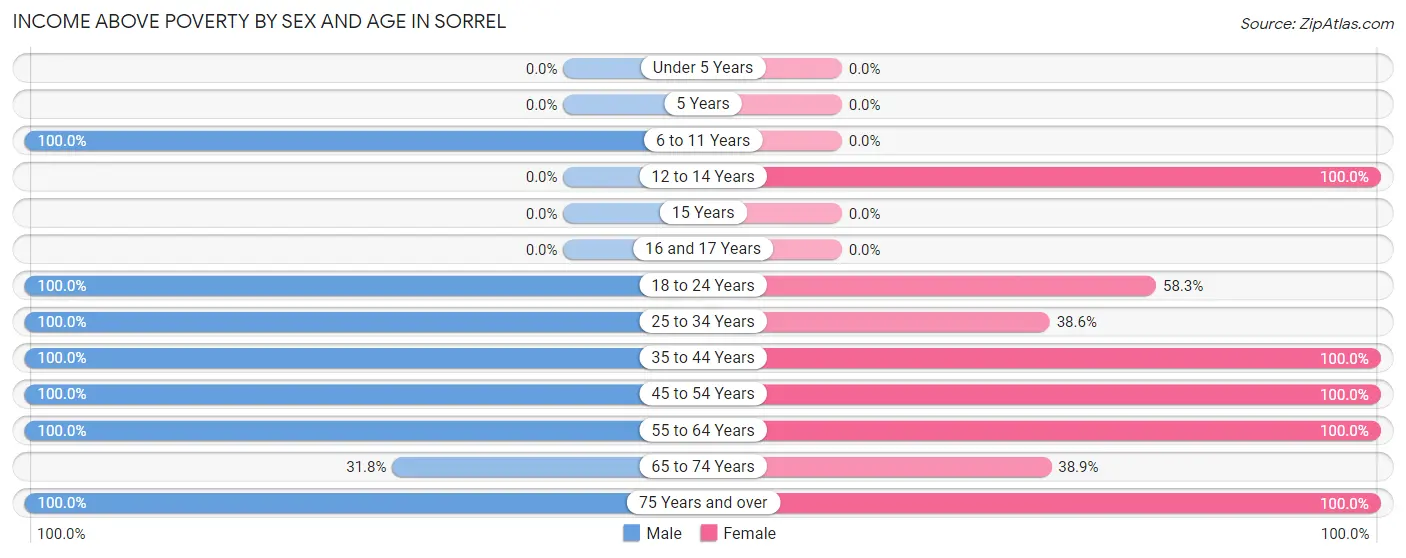
| Age Bracket | Male | Female |
| Under 5 Years | 0 (0.0%) | 0 (0.0%) |
| 5 Years | 0 (0.0%) | 0 (0.0%) |
| 6 to 11 Years | 24 (100.0%) | 0 (0.0%) |
| 12 to 14 Years | 0 (0.0%) | 16 (100.0%) |
| 15 Years | 0 (0.0%) | 0 (0.0%) |
| 16 and 17 Years | 0 (0.0%) | 0 (0.0%) |
| 18 to 24 Years | 26 (100.0%) | 21 (58.3%) |
| 25 to 34 Years | 17 (100.0%) | 22 (38.6%) |
| 35 to 44 Years | 17 (100.0%) | 33 (100.0%) |
| 45 to 54 Years | 64 (100.0%) | 42 (100.0%) |
| 55 to 64 Years | 37 (100.0%) | 49 (100.0%) |
| 65 to 74 Years | 20 (31.8%) | 7 (38.9%) |
| 75 Years and over | 15 (100.0%) | 23 (100.0%) |
| Total | 220 (83.7%) | 213 (77.7%) |
Income Below Poverty Among Married-Couple Families in Sorrel
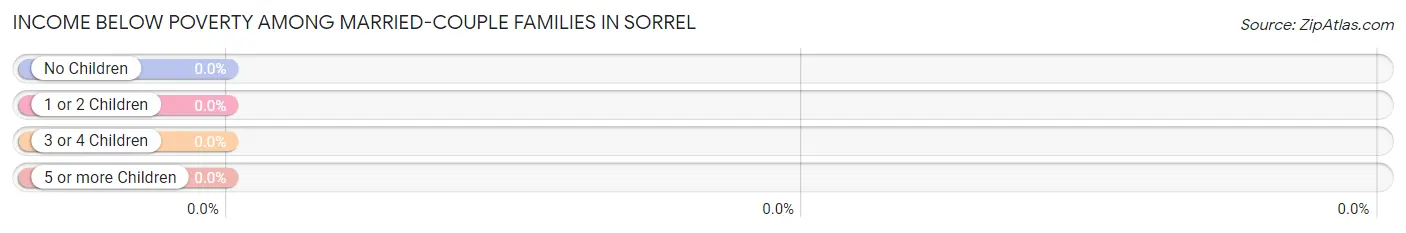
| Children | Above Poverty | Below Poverty |
| No Children | 87 (100.0%) | 0 (0.0%) |
| 1 or 2 Children | 27 (100.0%) | 0 (0.0%) |
| 3 or 4 Children | 0 (0.0%) | 0 (0.0%) |
| 5 or more Children | 0 (0.0%) | 0 (0.0%) |
| Total | 114 (100.0%) | 0 (0.0%) |
Income Below Poverty Among Single-Parent Households in Sorrel
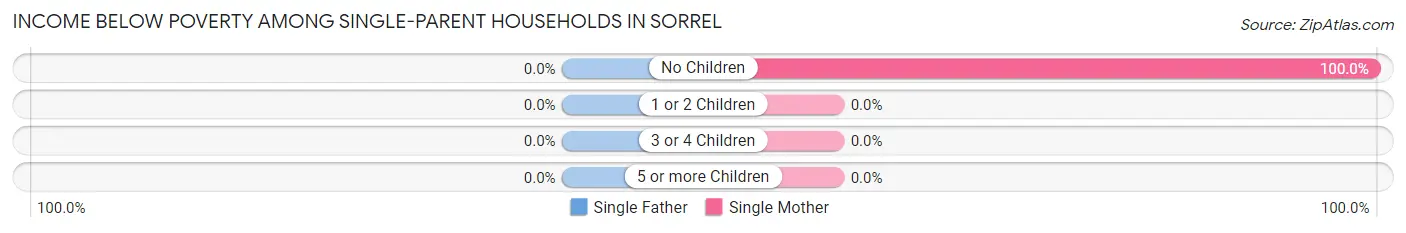
| Children | Single Father | Single Mother |
| No Children | 0 (0.0%) | 11 (100.0%) |
| 1 or 2 Children | 0 (0.0%) | 0 (0.0%) |
| 3 or 4 Children | 0 (0.0%) | 0 (0.0%) |
| 5 or more Children | 0 (0.0%) | 0 (0.0%) |
| Total | 0 (0.0%) | 11 (61.1%) |
Income Below Poverty Among Married-Couple vs Single-Parent Households in Sorrel
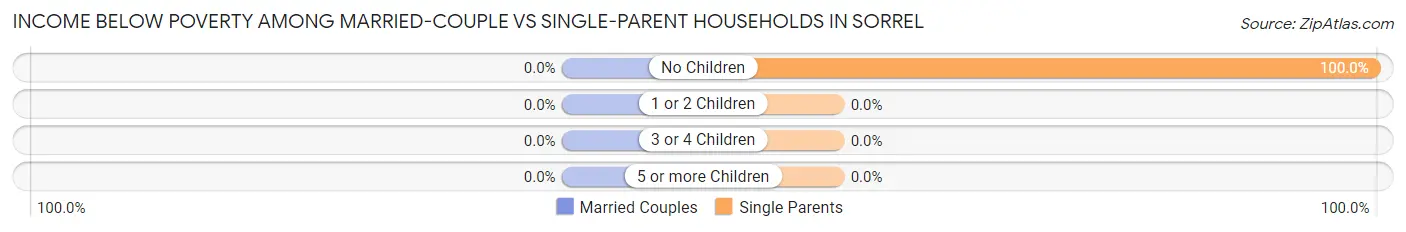
| Children | Married-Couple Families | Single-Parent Households |
| No Children | 0 (0.0%) | 11 (100.0%) |
| 1 or 2 Children | 0 (0.0%) | 0 (0.0%) |
| 3 or 4 Children | 0 (0.0%) | 0 (0.0%) |
| 5 or more Children | 0 (0.0%) | 0 (0.0%) |
| Total | 0 (0.0%) | 11 (61.1%) |
Race in Sorrel
The most populous races in Sorrel are Black / African American (267 | 49.7%), White / Caucasian (259 | 48.2%), and Hispanic or Latino (11 | 2.1%).
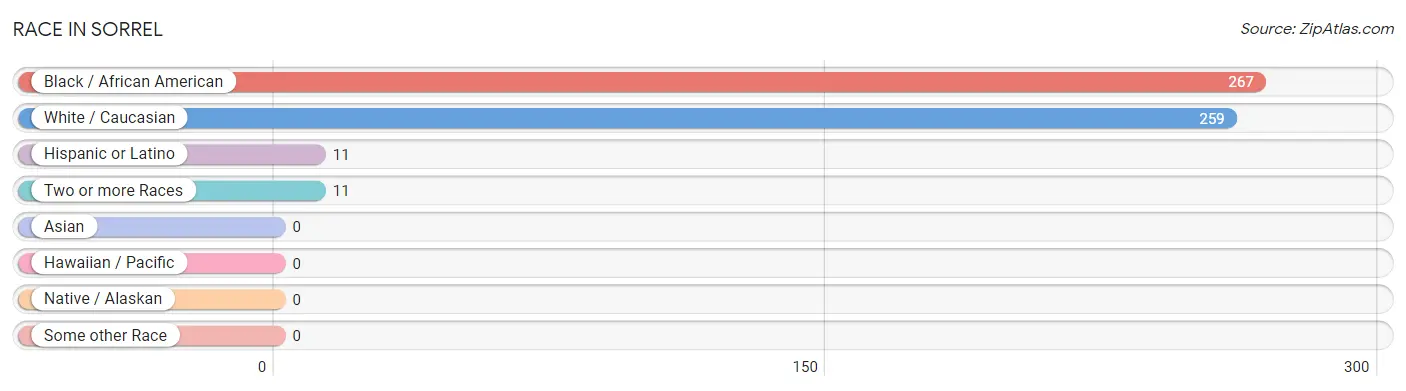
| Race | # Population | % Population |
| Asian | 0 | 0.0% |
| Black / African American | 267 | 49.7% |
| Hawaiian / Pacific | 0 | 0.0% |
| Hispanic or Latino | 11 | 2.1% |
| Native / Alaskan | 0 | 0.0% |
| White / Caucasian | 259 | 48.2% |
| Two or more Races | 11 | 2.1% |
| Some other Race | 0 | 0.0% |
| Total | 537 | 100.0% |
Ancestry in Sorrel
The most populous ancestries reported in Sorrel are French (65 | 12.1%), American (33 | 6.1%), English (19 | 3.5%), German (17 | 3.2%), and French Canadian (13 | 2.4%), together accounting for 27.4% of all Sorrel residents.
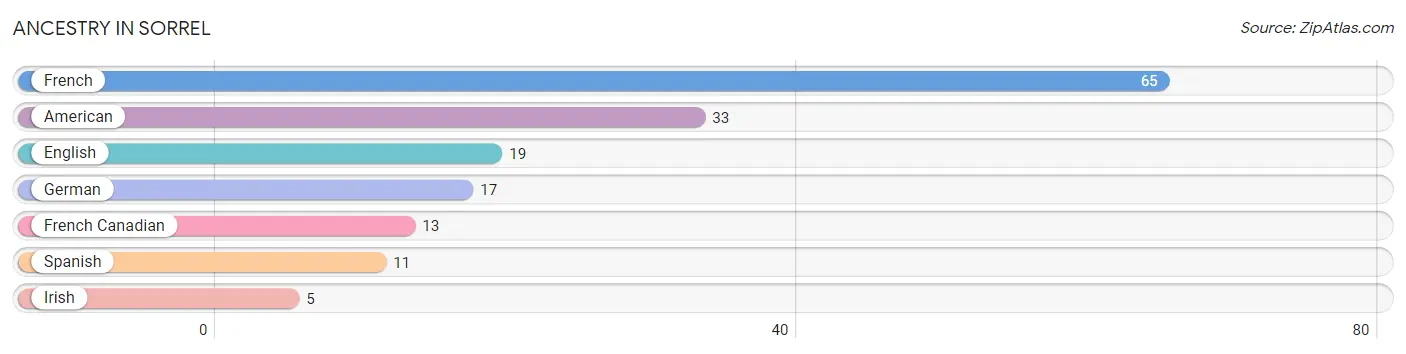
| Ancestry | # Population | % Population |
| American | 33 | 6.1% |
| English | 19 | 3.5% |
| French | 65 | 12.1% |
| French Canadian | 13 | 2.4% |
| German | 17 | 3.2% |
| Irish | 5 | 0.9% |
| Spanish | 11 | 2.1% | View All 7 Rows |
Immigrants in Sorrel

| Immigration Origin | # Population | % Population | View All 0 Rows |
Sex and Age in Sorrel
Sex and Age in Sorrel
The most populous age groups in Sorrel are 65 to 69 Years (63 | 23.9%) for men and 25 to 29 Years (57 | 20.8%) for women.
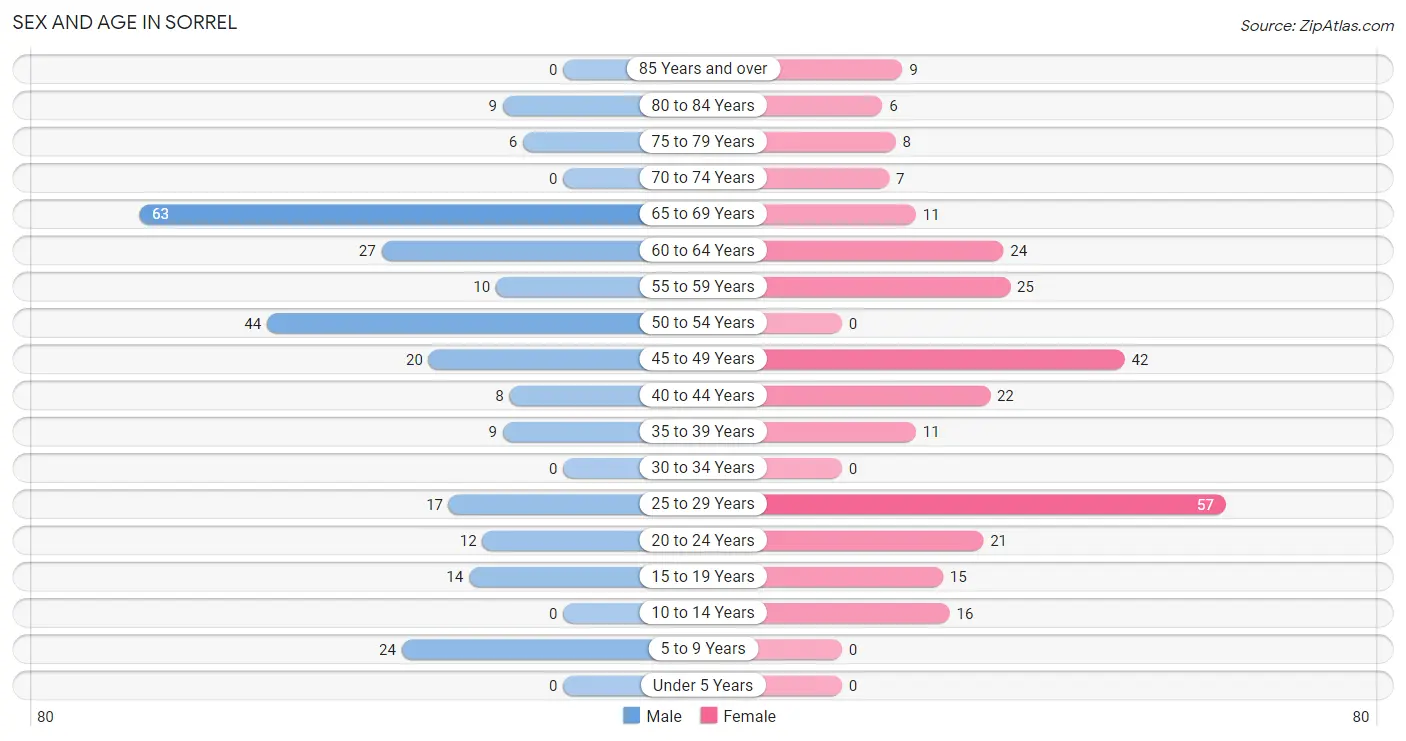
| Age Bracket | Male | Female |
| Under 5 Years | 0 (0.0%) | 0 (0.0%) |
| 5 to 9 Years | 24 (9.1%) | 0 (0.0%) |
| 10 to 14 Years | 0 (0.0%) | 16 (5.8%) |
| 15 to 19 Years | 14 (5.3%) | 15 (5.5%) |
| 20 to 24 Years | 12 (4.6%) | 21 (7.7%) |
| 25 to 29 Years | 17 (6.5%) | 57 (20.8%) |
| 30 to 34 Years | 0 (0.0%) | 0 (0.0%) |
| 35 to 39 Years | 9 (3.4%) | 11 (4.0%) |
| 40 to 44 Years | 8 (3.0%) | 22 (8.0%) |
| 45 to 49 Years | 20 (7.6%) | 42 (15.3%) |
| 50 to 54 Years | 44 (16.7%) | 0 (0.0%) |
| 55 to 59 Years | 10 (3.8%) | 25 (9.1%) |
| 60 to 64 Years | 27 (10.3%) | 24 (8.8%) |
| 65 to 69 Years | 63 (23.9%) | 11 (4.0%) |
| 70 to 74 Years | 0 (0.0%) | 7 (2.5%) |
| 75 to 79 Years | 6 (2.3%) | 8 (2.9%) |
| 80 to 84 Years | 9 (3.4%) | 6 (2.2%) |
| 85 Years and over | 0 (0.0%) | 9 (3.3%) |
| Total | 263 (100.0%) | 274 (100.0%) |
Families and Households in Sorrel
Median Family Size in Sorrel
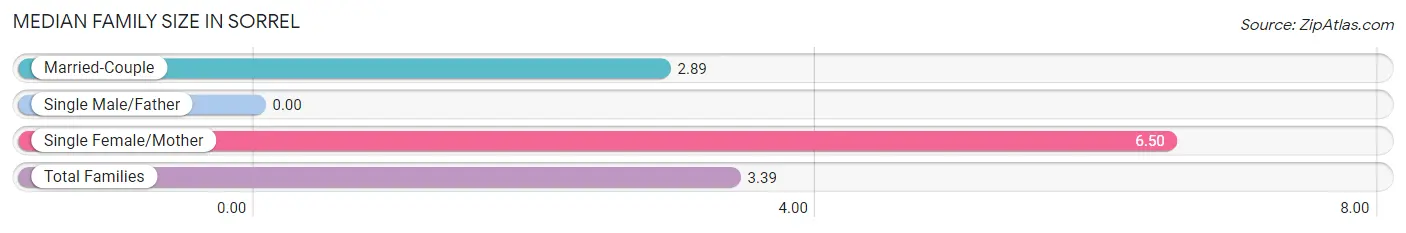
| Family Type | # Families | Family Size |
| Married-Couple | 114 (86.4%) | 2.89 |
| Single Male/Father | 0 (0.0%) | - |
| Single Female/Mother | 18 (13.6%) | 6.50 |
| Total Families | 132 (100.0%) | 3.39 |
Median Household Size in Sorrel
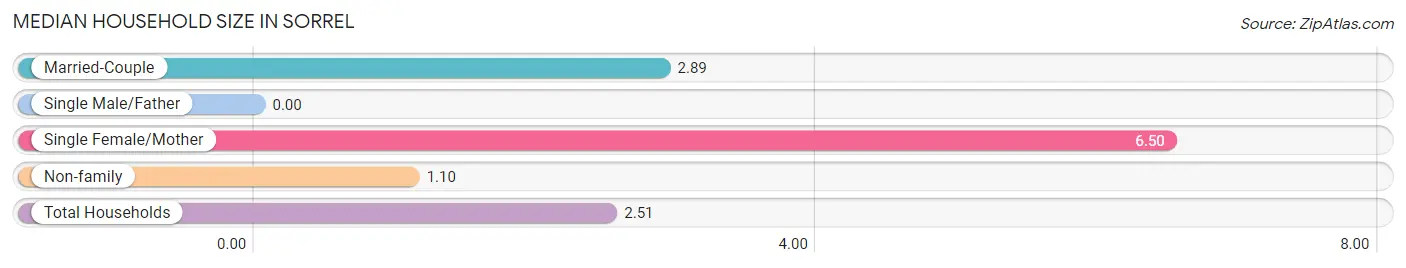
| Household Type | # Households | Household Size |
| Married-Couple | 114 (53.3%) | 2.89 |
| Single Male/Father | 0 (0.0%) | - |
| Single Female/Mother | 18 (8.4%) | 6.50 |
| Non-family | 82 (38.3%) | 1.10 |
| Total Households | 214 (100.0%) | 2.51 |
Household Size by Marriage Status in Sorrel
Out of a total of 214 households in Sorrel, 132 (61.7%) are family households, while 82 (38.3%) are nonfamily households. The most numerous type of family households are 3-person households, comprising 61, and the most common type of nonfamily households are 1-person households, comprising 72.
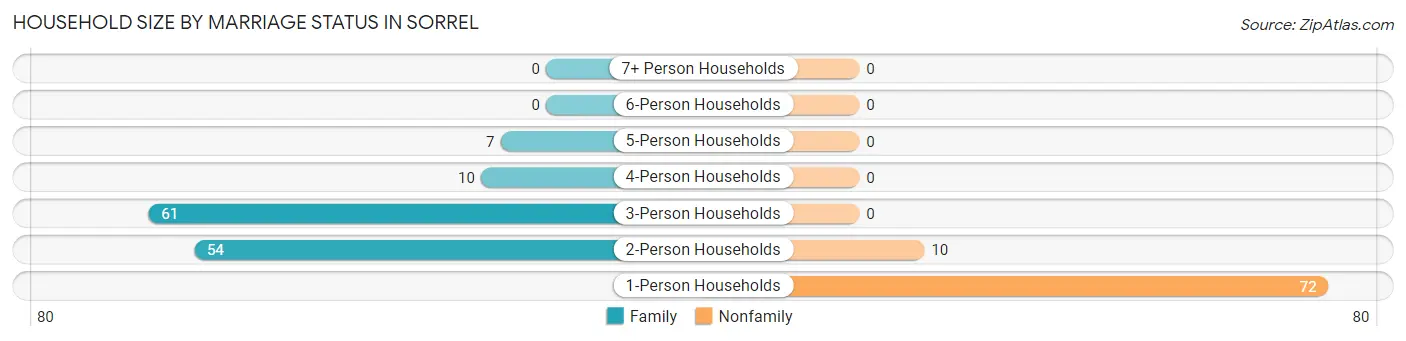
| Household Size | Family Households | Nonfamily Households |
| 1-Person Households | - | 72 (33.6%) |
| 2-Person Households | 54 (25.2%) | 10 (4.7%) |
| 3-Person Households | 61 (28.5%) | 0 (0.0%) |
| 4-Person Households | 10 (4.7%) | 0 (0.0%) |
| 5-Person Households | 7 (3.3%) | 0 (0.0%) |
| 6-Person Households | 0 (0.0%) | 0 (0.0%) |
| 7+ Person Households | 0 (0.0%) | 0 (0.0%) |
| Total | 132 (61.7%) | 82 (38.3%) |
Female Fertility in Sorrel
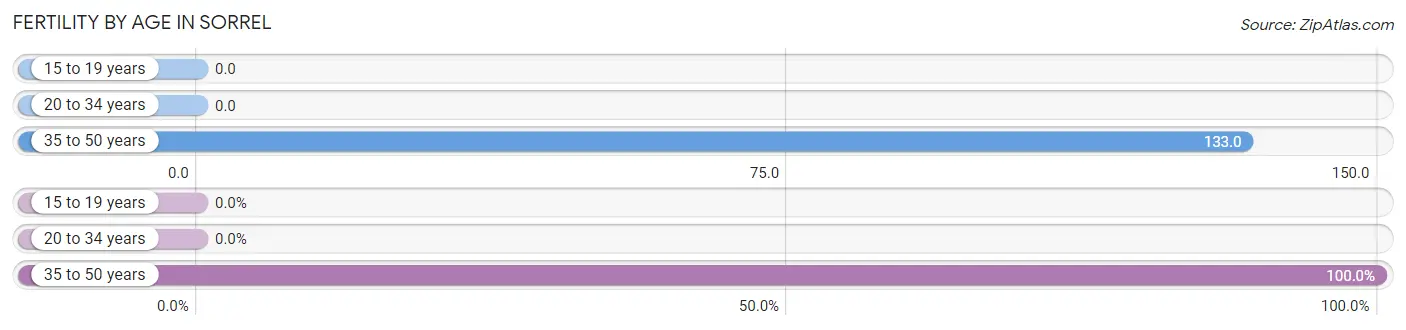
Fertility by Age in Sorrel
Average fertility rate in Sorrel is 60.0 births per 1,000 women. Women in the age bracket of 35 to 50 years have the highest fertility rate with 133.0 births per 1,000 women. Women in the age bracket of 35 to 50 years acount for 100.0% of all women with births.
| Age Bracket | Women with Births | Births / 1,000 Women |
| 15 to 19 years | 0 (0.0%) | 0.0 |
| 20 to 34 years | 0 (0.0%) | 0.0 |
| 35 to 50 years | 10 (100.0%) | 133.0 |
| Total | 10 (100.0%) | 60.0 |
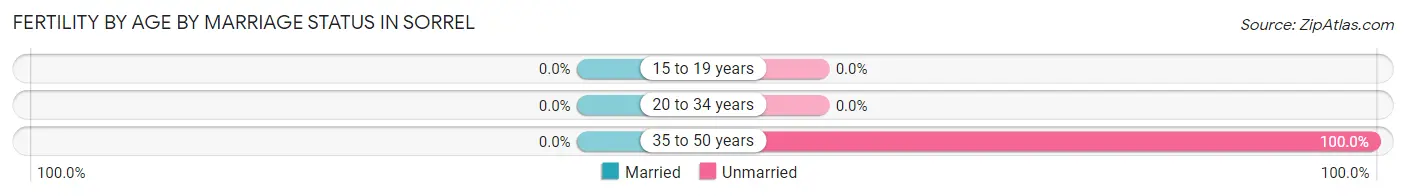
Fertility by Age by Marriage Status in Sorrel
| Age Bracket | Married | Unmarried |
| 15 to 19 years | 0 (0.0%) | 0 (0.0%) |
| 20 to 34 years | 0 (0.0%) | 0 (0.0%) |
| 35 to 50 years | 0 (0.0%) | 10 (100.0%) |
| Total | 0 (0.0%) | 10 (100.0%) |
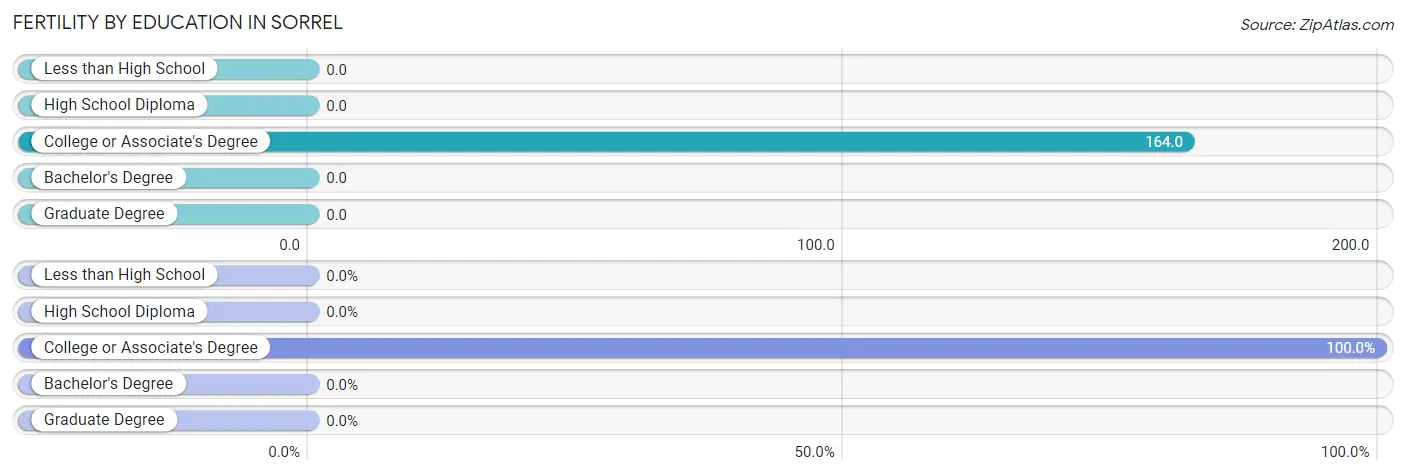
Fertility by Education in Sorrel
| Educational Attainment | Women with Births | Births / 1,000 Women |
| Less than High School | 0 (0.0%) | 0.0 |
| High School Diploma | 0 (0.0%) | 0.0 |
| College or Associate's Degree | 10 (100.0%) | 164.0 |
| Bachelor's Degree | 0 (0.0%) | 0.0 |
| Graduate Degree | 0 (0.0%) | 0.0 |
| Total | 10 (100.0%) | 60.0 |
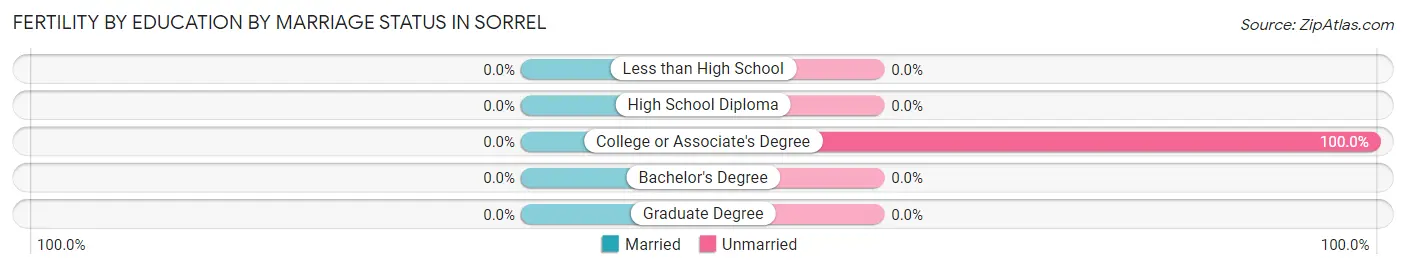
Fertility by Education by Marriage Status in Sorrel
| Educational Attainment | Married | Unmarried |
| Less than High School | 0 (0.0%) | 0 (0.0%) |
| High School Diploma | 0 (0.0%) | 0 (0.0%) |
| College or Associate's Degree | 0 (0.0%) | 10 (100.0%) |
| Bachelor's Degree | 0 (0.0%) | 0 (0.0%) |
| Graduate Degree | 0 (0.0%) | 0 (0.0%) |
| Total | 0 (0.0%) | 10 (100.0%) |
Employment Characteristics in Sorrel
Employment by Class of Employer in Sorrel
Among the 171 employed individuals in Sorrel, private company employees (124 | 72.5%), local government employees (27 | 15.8%), and state government employees (11 | 6.4%) make up the most common classes of employment.
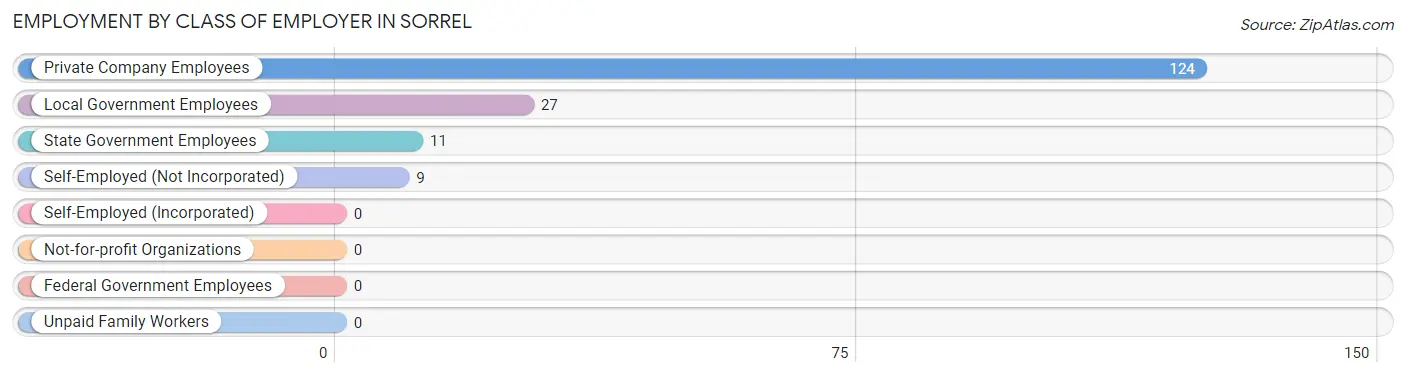
| Employer Class | # Employees | % Employees |
| Private Company Employees | 124 | 72.5% |
| Self-Employed (Incorporated) | 0 | 0.0% |
| Self-Employed (Not Incorporated) | 9 | 5.3% |
| Not-for-profit Organizations | 0 | 0.0% |
| Local Government Employees | 27 | 15.8% |
| State Government Employees | 11 | 6.4% |
| Federal Government Employees | 0 | 0.0% |
| Unpaid Family Workers | 0 | 0.0% |
| Total | 171 | 100.0% |
Employment Status by Age in Sorrel
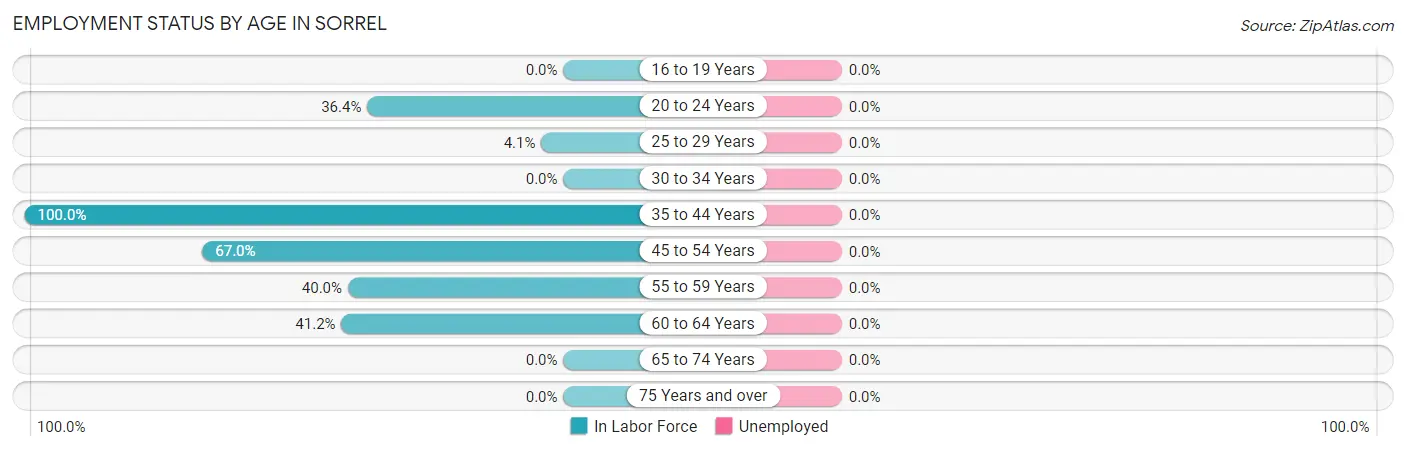
| Age Bracket | In Labor Force | Unemployed |
| 16 to 19 Years | 0 (0.0%) | 0 (0.0%) |
| 20 to 24 Years | 12 (36.4%) | 0 (0.0%) |
| 25 to 29 Years | 3 (4.1%) | 0 (0.0%) |
| 30 to 34 Years | 0 (0.0%) | 0 (0.0%) |
| 35 to 44 Years | 50 (100.0%) | 0 (0.0%) |
| 45 to 54 Years | 71 (67.0%) | 0 (0.0%) |
| 55 to 59 Years | 14 (40.0%) | 0 (0.0%) |
| 60 to 64 Years | 21 (41.2%) | 0 (0.0%) |
| 65 to 74 Years | 0 (0.0%) | 0 (0.0%) |
| 75 Years and over | 0 (0.0%) | 0 (0.0%) |
| Total | 171 (34.4%) | 0 (0.0%) |
Employment Status by Educational Attainment in Sorrel
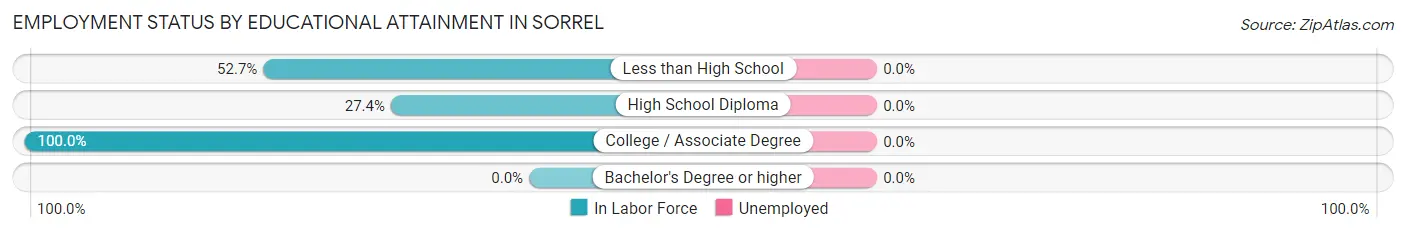
| Educational Attainment | In Labor Force | Unemployed |
| Less than High School | 39 (52.7%) | 0 (0.0%) |
| High School Diploma | 46 (27.4%) | 0 (0.0%) |
| College / Associate Degree | 74 (100.0%) | 0 (0.0%) |
| Bachelor's Degree or higher | 0 (0.0%) | 0 (0.0%) |
| Total | 159 (50.3%) | 0 (0.0%) |
Employment Occupations by Sex in Sorrel
Management, Business, Science and Arts Occupations
The most common Management, Business, Science and Arts occupations in Sorrel are Management (10 | 5.9%), and Health Diagnosing & Treating (4 | 2.3%).
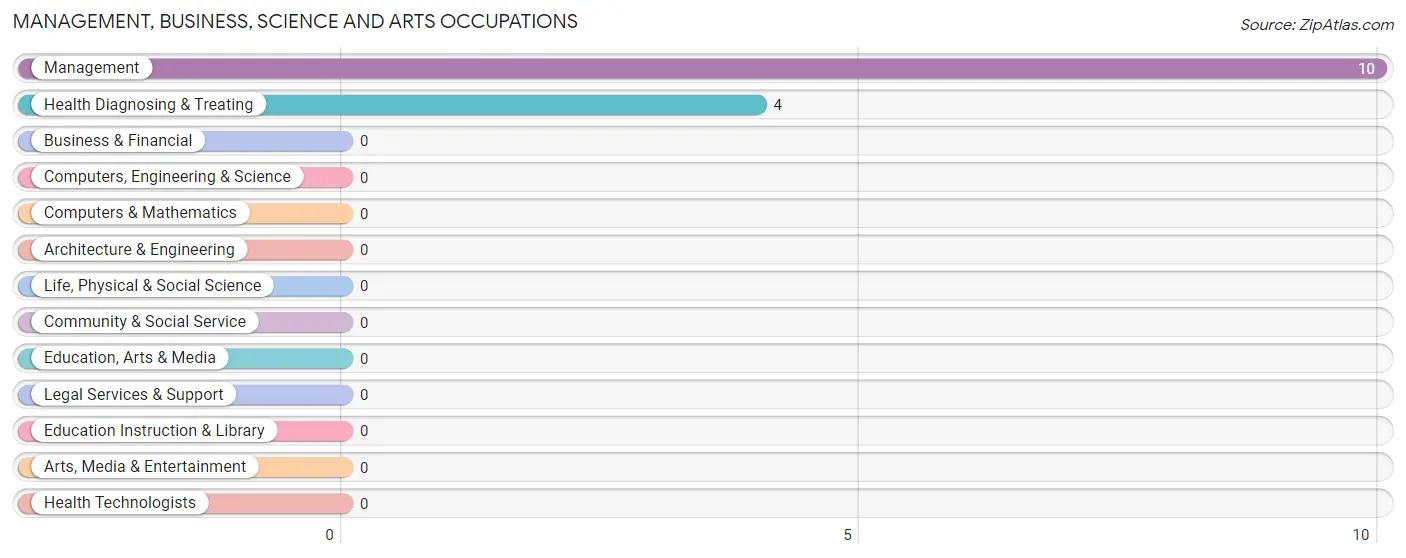
Management, Business, Science and Arts Occupations by Sex
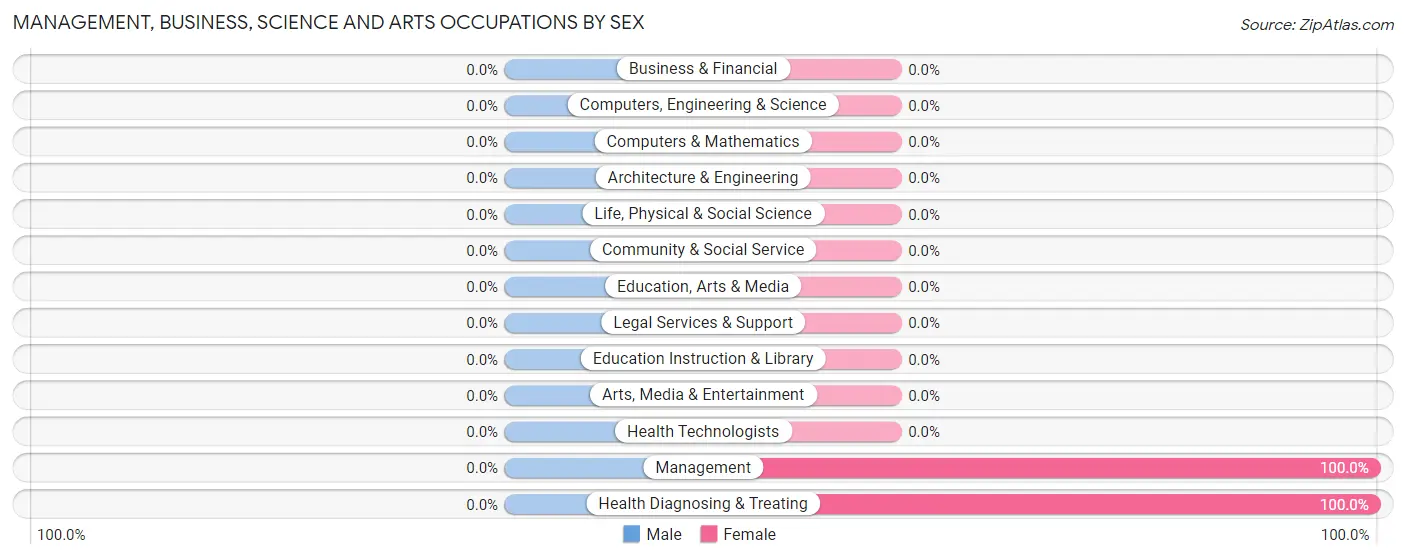
| Occupation | Male | Female |
| Management | 0 (0.0%) | 10 (100.0%) |
| Business & Financial | 0 (0.0%) | 0 (0.0%) |
| Computers, Engineering & Science | 0 (0.0%) | 0 (0.0%) |
| Computers & Mathematics | 0 (0.0%) | 0 (0.0%) |
| Architecture & Engineering | 0 (0.0%) | 0 (0.0%) |
| Life, Physical & Social Science | 0 (0.0%) | 0 (0.0%) |
| Community & Social Service | 0 (0.0%) | 0 (0.0%) |
| Education, Arts & Media | 0 (0.0%) | 0 (0.0%) |
| Legal Services & Support | 0 (0.0%) | 0 (0.0%) |
| Education Instruction & Library | 0 (0.0%) | 0 (0.0%) |
| Arts, Media & Entertainment | 0 (0.0%) | 0 (0.0%) |
| Health Diagnosing & Treating | 0 (0.0%) | 4 (100.0%) |
| Health Technologists | 0 (0.0%) | 0 (0.0%) |
| Total (Category) | 0 (0.0%) | 14 (100.0%) |
| Total (Overall) | 119 (69.6%) | 52 (30.4%) |
Services Occupations
The most common Services occupations in Sorrel are Healthcare Support (12 | 7.0%), and Food Preparation & Serving (5 | 2.9%).
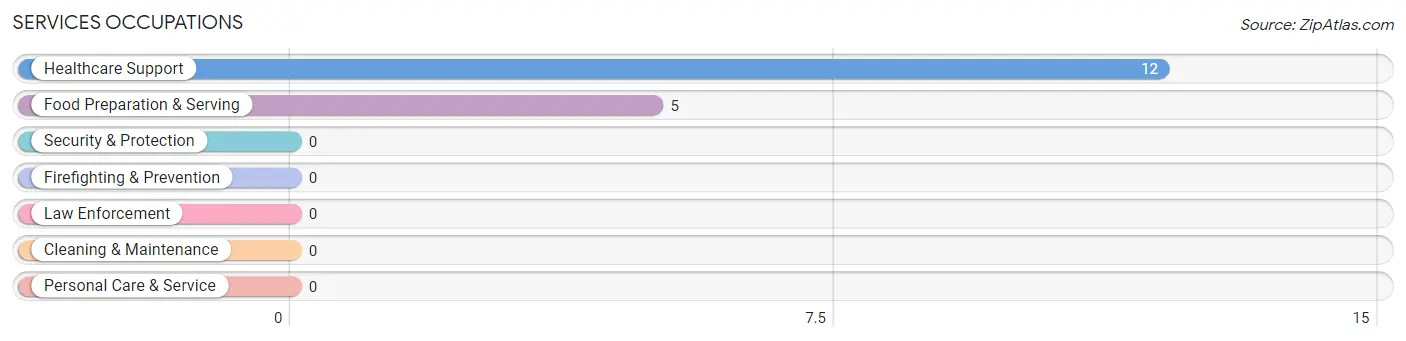
Services Occupations by Sex
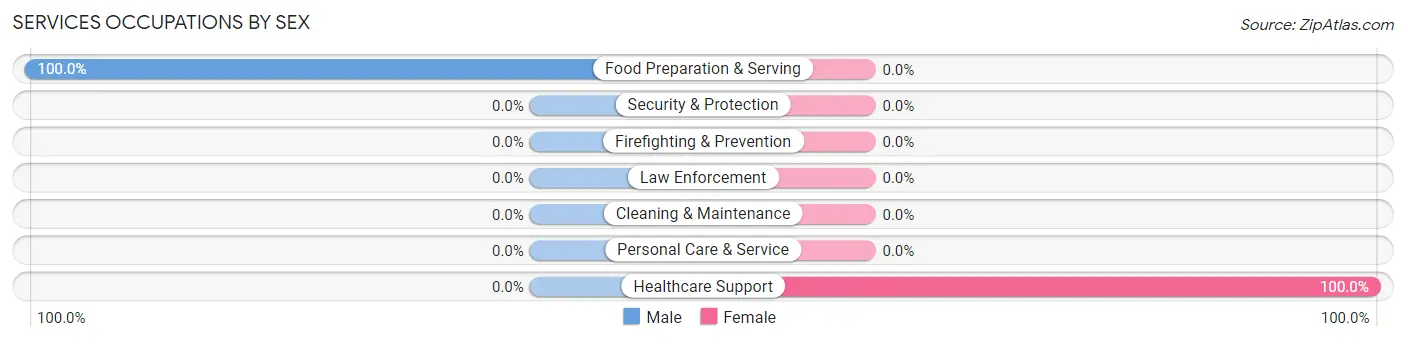
| Occupation | Male | Female |
| Healthcare Support | 0 (0.0%) | 12 (100.0%) |
| Security & Protection | 0 (0.0%) | 0 (0.0%) |
| Firefighting & Prevention | 0 (0.0%) | 0 (0.0%) |
| Law Enforcement | 0 (0.0%) | 0 (0.0%) |
| Food Preparation & Serving | 5 (100.0%) | 0 (0.0%) |
| Cleaning & Maintenance | 0 (0.0%) | 0 (0.0%) |
| Personal Care & Service | 0 (0.0%) | 0 (0.0%) |
| Total (Category) | 5 (29.4%) | 12 (70.6%) |
| Total (Overall) | 119 (69.6%) | 52 (30.4%) |
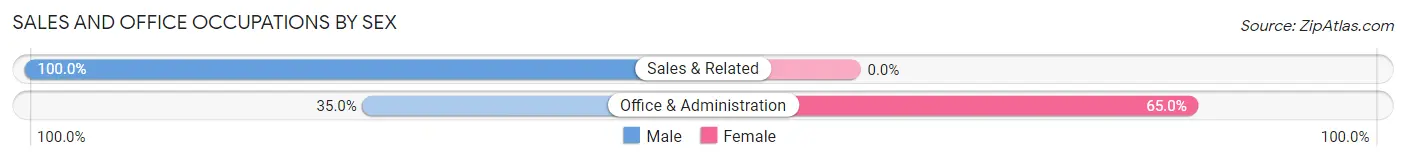
Sales and Office Occupations
The most common Sales and Office occupations in Sorrel are Office & Administration (40 | 23.4%), and Sales & Related (15 | 8.8%).
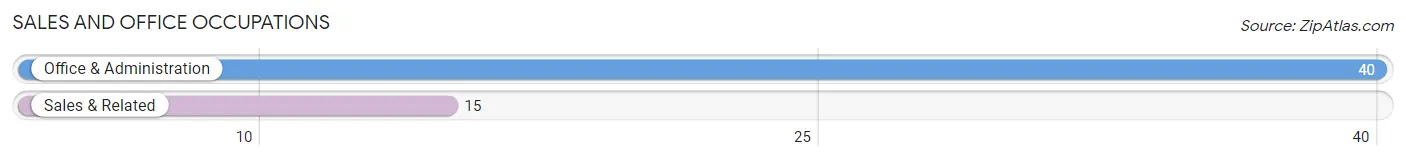
Sales and Office Occupations by Sex
| Occupation | Male | Female |
| Sales & Related | 15 (100.0%) | 0 (0.0%) |
| Office & Administration | 14 (35.0%) | 26 (65.0%) |
| Total (Category) | 29 (52.7%) | 26 (47.3%) |
| Total (Overall) | 119 (69.6%) | 52 (30.4%) |
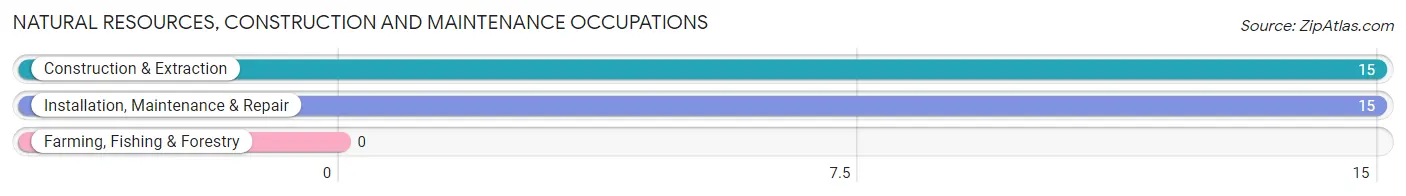
Natural Resources, Construction and Maintenance Occupations
The most common Natural Resources, Construction and Maintenance occupations in Sorrel are Construction & Extraction (15 | 8.8%), and Installation, Maintenance & Repair (15 | 8.8%).
Natural Resources, Construction and Maintenance Occupations by Sex
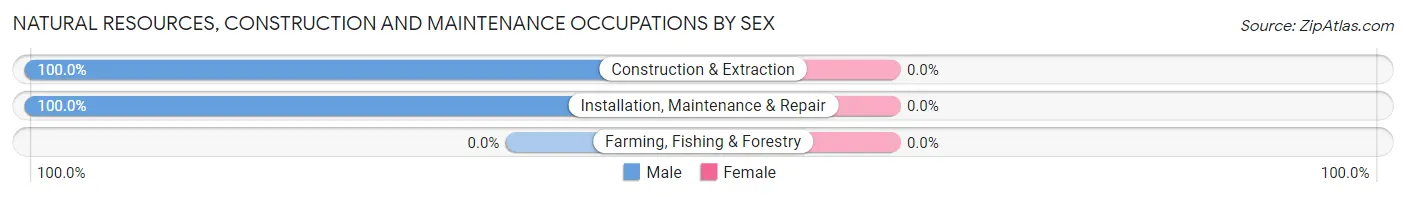
| Occupation | Male | Female |
| Farming, Fishing & Forestry | 0 (0.0%) | 0 (0.0%) |
| Construction & Extraction | 15 (100.0%) | 0 (0.0%) |
| Installation, Maintenance & Repair | 15 (100.0%) | 0 (0.0%) |
| Total (Category) | 30 (100.0%) | 0 (0.0%) |
| Total (Overall) | 119 (69.6%) | 52 (30.4%) |
Production, Transportation and Moving Occupations
The most common Production, Transportation and Moving occupations in Sorrel are Transportation (44 | 25.7%), Production (8 | 4.7%), and Material Moving (3 | 1.8%).
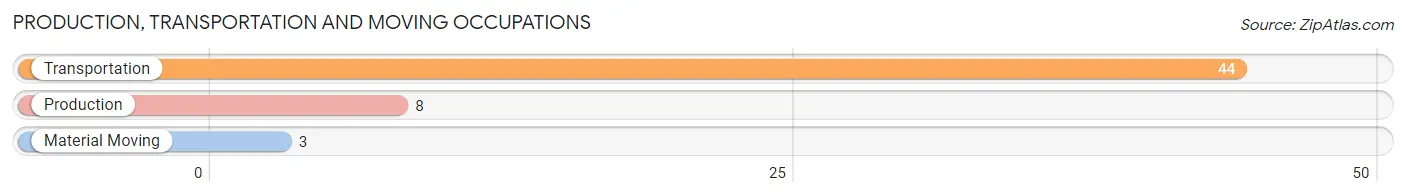
Production, Transportation and Moving Occupations by Sex
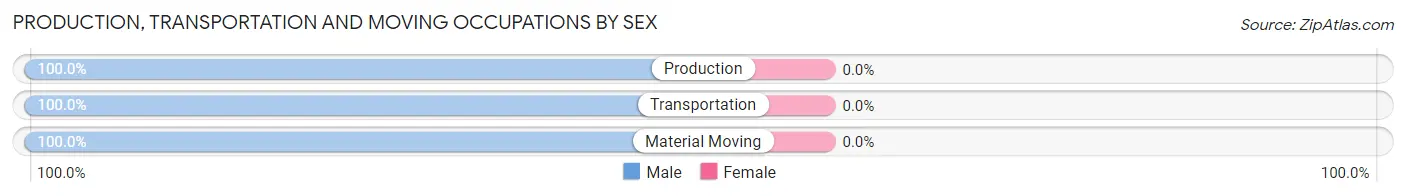
| Occupation | Male | Female |
| Production | 8 (100.0%) | 0 (0.0%) |
| Transportation | 44 (100.0%) | 0 (0.0%) |
| Material Moving | 3 (100.0%) | 0 (0.0%) |
| Total (Category) | 55 (100.0%) | 0 (0.0%) |
| Total (Overall) | 119 (69.6%) | 52 (30.4%) |
Employment Industries by Sex in Sorrel
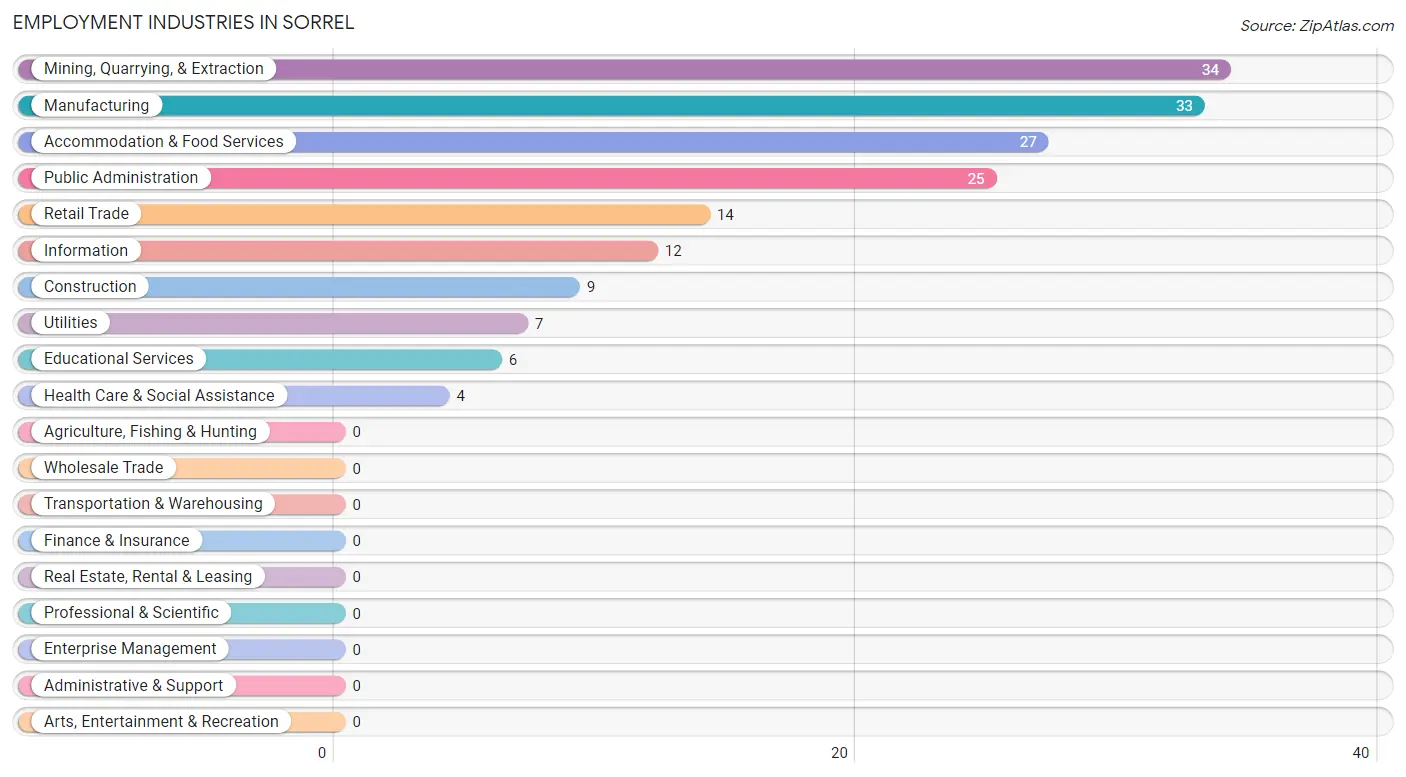
Employment Industries in Sorrel
The major employment industries in Sorrel include Mining, Quarrying, & Extraction (34 | 19.9%), Manufacturing (33 | 19.3%), Accommodation & Food Services (27 | 15.8%), Public Administration (25 | 14.6%), and Retail Trade (14 | 8.2%).
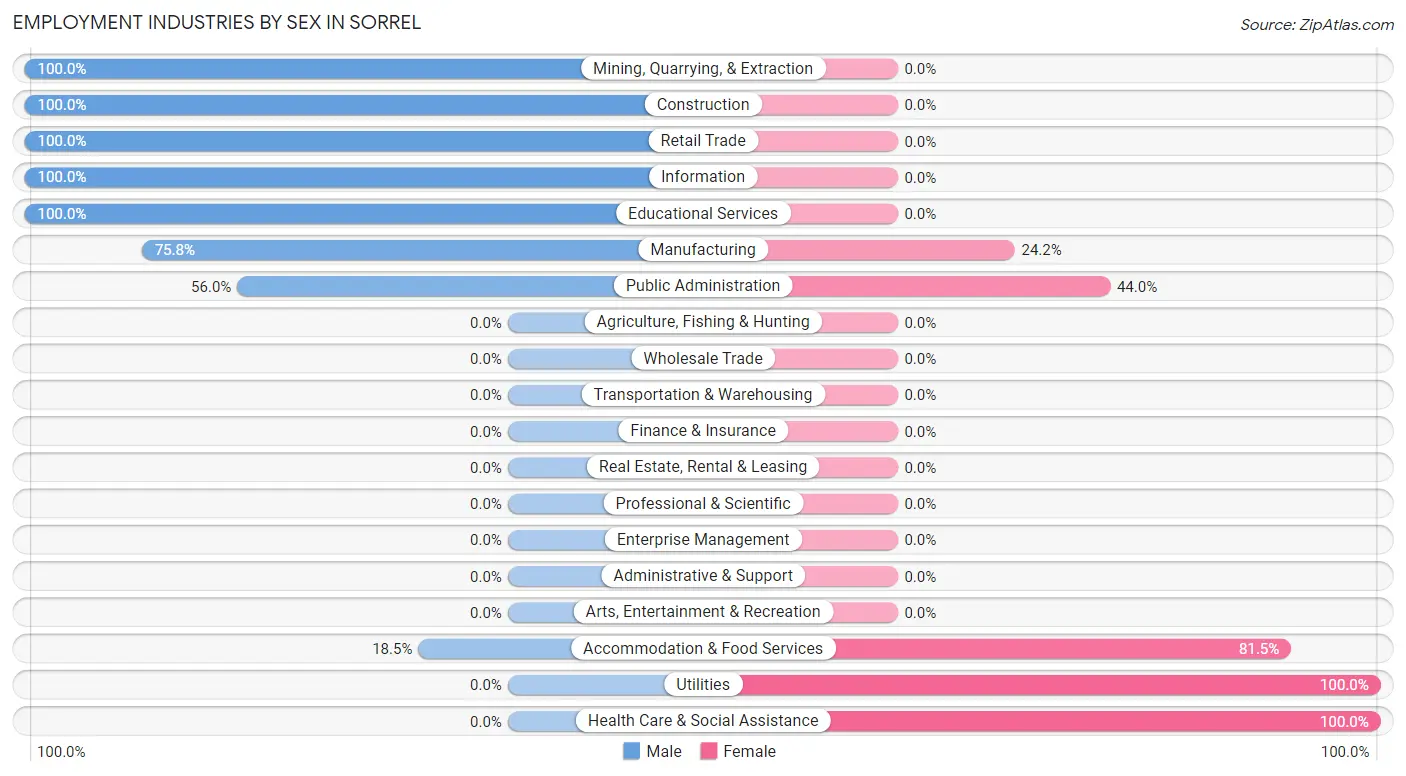
Employment Industries by Sex in Sorrel
The Sorrel industries that see more men than women are Mining, Quarrying, & Extraction (100.0%), Construction (100.0%), and Retail Trade (100.0%), whereas the industries that tend to have a higher number of women are Utilities (100.0%), Health Care & Social Assistance (100.0%), and Accommodation & Food Services (81.5%).
| Industry | Male | Female |
| Agriculture, Fishing & Hunting | 0 (0.0%) | 0 (0.0%) |
| Mining, Quarrying, & Extraction | 34 (100.0%) | 0 (0.0%) |
| Construction | 9 (100.0%) | 0 (0.0%) |
| Manufacturing | 25 (75.8%) | 8 (24.2%) |
| Wholesale Trade | 0 (0.0%) | 0 (0.0%) |
| Retail Trade | 14 (100.0%) | 0 (0.0%) |
| Transportation & Warehousing | 0 (0.0%) | 0 (0.0%) |
| Utilities | 0 (0.0%) | 7 (100.0%) |
| Information | 12 (100.0%) | 0 (0.0%) |
| Finance & Insurance | 0 (0.0%) | 0 (0.0%) |
| Real Estate, Rental & Leasing | 0 (0.0%) | 0 (0.0%) |
| Professional & Scientific | 0 (0.0%) | 0 (0.0%) |
| Enterprise Management | 0 (0.0%) | 0 (0.0%) |
| Administrative & Support | 0 (0.0%) | 0 (0.0%) |
| Educational Services | 6 (100.0%) | 0 (0.0%) |
| Health Care & Social Assistance | 0 (0.0%) | 4 (100.0%) |
| Arts, Entertainment & Recreation | 0 (0.0%) | 0 (0.0%) |
| Accommodation & Food Services | 5 (18.5%) | 22 (81.5%) |
| Public Administration | 14 (56.0%) | 11 (44.0%) |
| Total | 119 (69.6%) | 52 (30.4%) |
Education in Sorrel
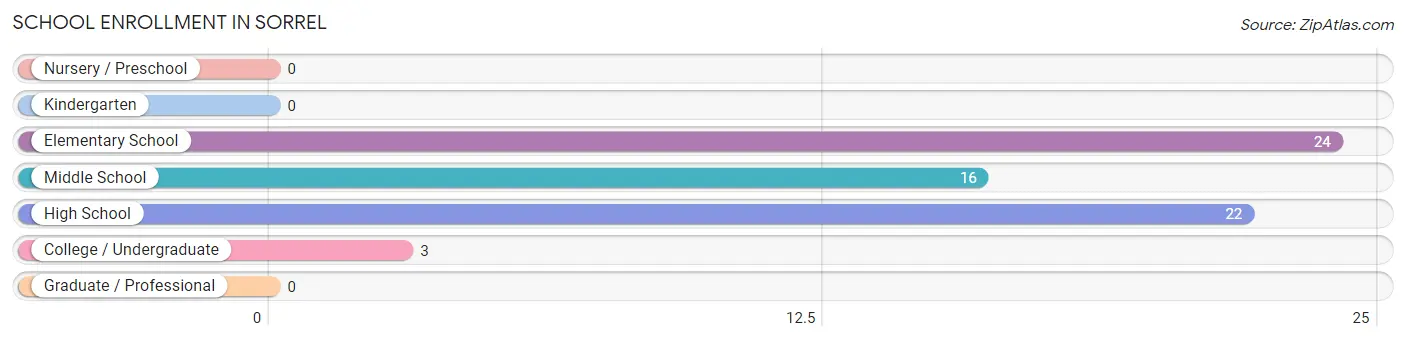
School Enrollment in Sorrel
The most common levels of schooling among the 65 students in Sorrel are elementary school (24 | 36.9%), high school (22 | 33.9%), and middle school (16 | 24.6%).
| School Level | # Students | % Students |
| Nursery / Preschool | 0 | 0.0% |
| Kindergarten | 0 | 0.0% |
| Elementary School | 24 | 36.9% |
| Middle School | 16 | 24.6% |
| High School | 22 | 33.9% |
| College / Undergraduate | 3 | 4.6% |
| Graduate / Professional | 0 | 0.0% |
| Total | 65 | 100.0% |
School Enrollment by Age by Funding Source in Sorrel
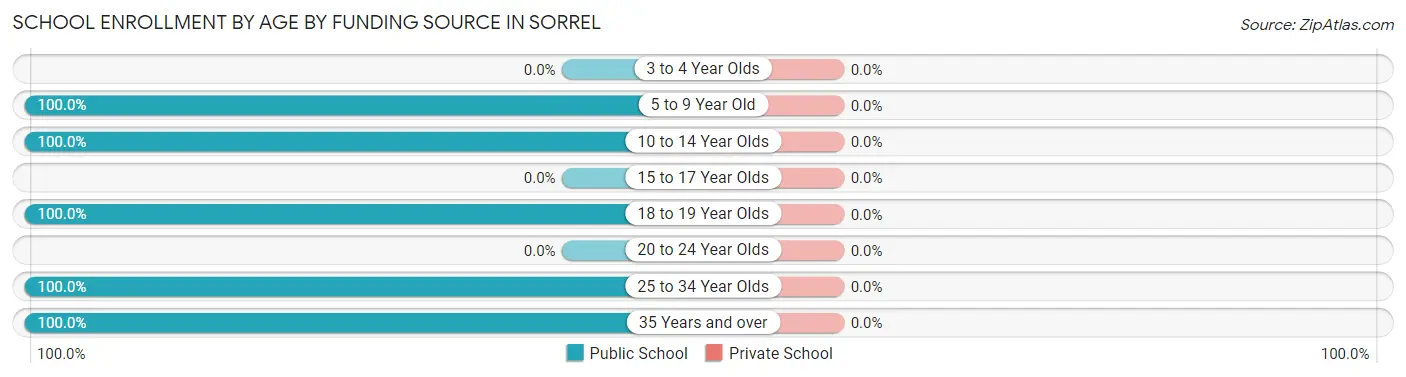
| Age Bracket | Public School | Private School |
| 3 to 4 Year Olds | 0 (0.0%) | 0 (0.0%) |
| 5 to 9 Year Old | 24 (100.0%) | 0 (0.0%) |
| 10 to 14 Year Olds | 16 (100.0%) | 0 (0.0%) |
| 15 to 17 Year Olds | 0 (0.0%) | 0 (0.0%) |
| 18 to 19 Year Olds | 15 (100.0%) | 0 (0.0%) |
| 20 to 24 Year Olds | 0 (0.0%) | 0 (0.0%) |
| 25 to 34 Year Olds | 7 (100.0%) | 0 (0.0%) |
| 35 Years and over | 3 (100.0%) | 0 (0.0%) |
| Total | 65 (100.0%) | 0 (0.0%) |
Educational Attainment by Field of Study in Sorrel
, and education (7 | 100.0%) are the most common fields of study among 7 individuals in Sorrel who have obtained a bachelor's degree or higher.
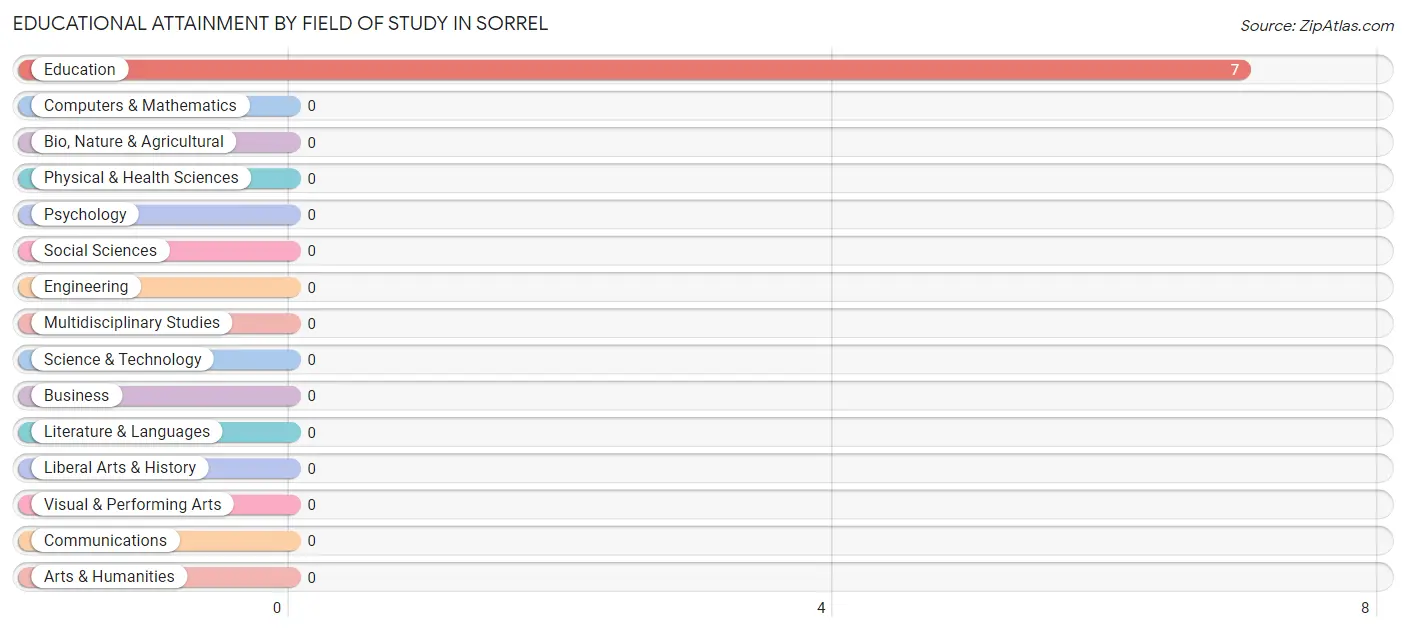
| Field of Study | # Graduates | % Graduates |
| Computers & Mathematics | 0 | 0.0% |
| Bio, Nature & Agricultural | 0 | 0.0% |
| Physical & Health Sciences | 0 | 0.0% |
| Psychology | 0 | 0.0% |
| Social Sciences | 0 | 0.0% |
| Engineering | 0 | 0.0% |
| Multidisciplinary Studies | 0 | 0.0% |
| Science & Technology | 0 | 0.0% |
| Business | 0 | 0.0% |
| Education | 7 | 100.0% |
| Literature & Languages | 0 | 0.0% |
| Liberal Arts & History | 0 | 0.0% |
| Visual & Performing Arts | 0 | 0.0% |
| Communications | 0 | 0.0% |
| Arts & Humanities | 0 | 0.0% |
| Total | 7 | 100.0% |
Transportation & Commute in Sorrel
Vehicle Availability by Sex in Sorrel
The most prevalent vehicle ownership categories in Sorrel are males with 3 vehicles (44, accounting for 37.0%) and females with 3 vehicles (8, making up 84.6%).
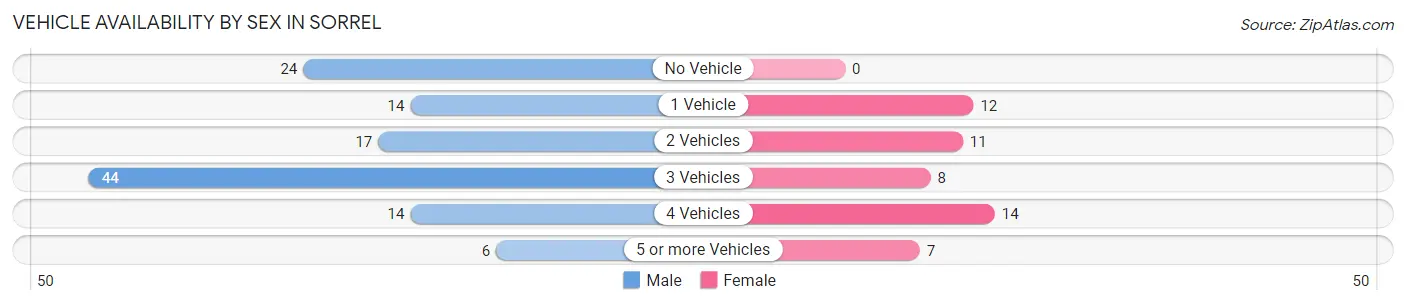
| Vehicles Available | Male | Female |
| No Vehicle | 24 (20.2%) | 0 (0.0%) |
| 1 Vehicle | 14 (11.8%) | 12 (23.1%) |
| 2 Vehicles | 17 (14.3%) | 11 (21.1%) |
| 3 Vehicles | 44 (37.0%) | 8 (15.4%) |
| 4 Vehicles | 14 (11.8%) | 14 (26.9%) |
| 5 or more Vehicles | 6 (5.0%) | 7 (13.5%) |
| Total | 119 (100.0%) | 52 (100.0%) |
Commute Time in Sorrel
The most frequently occuring commute durations in Sorrel are 30 to 34 minutes (47 commuters, 27.5%), 20 to 24 minutes (32 commuters, 18.7%), and 40 to 44 minutes (29 commuters, 17.0%).
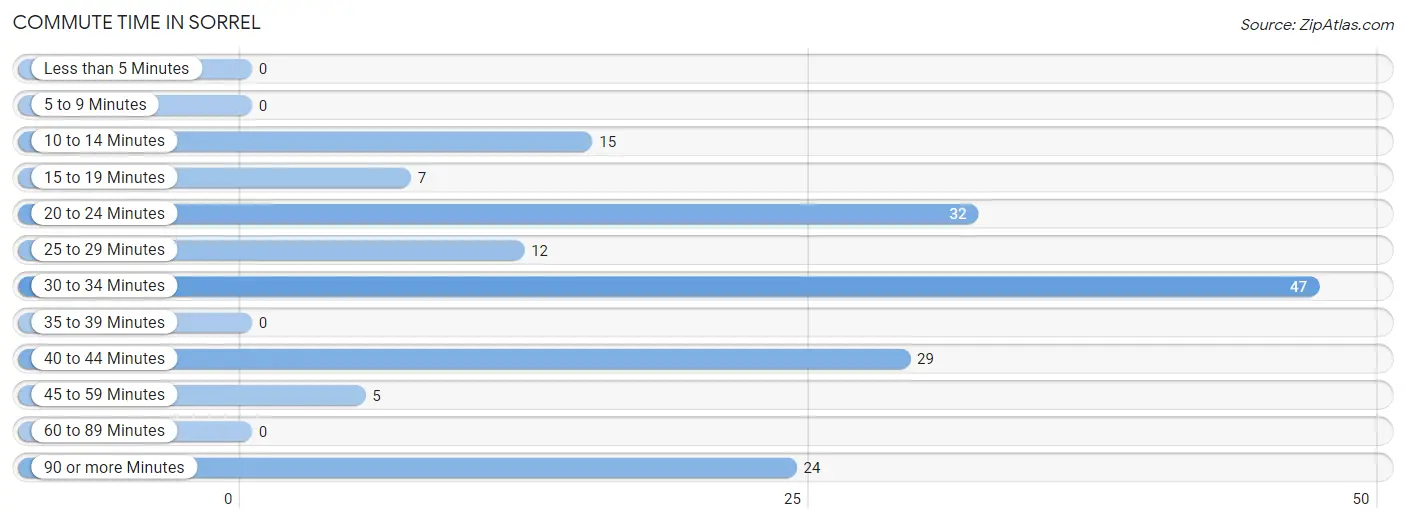
| Commute Time | # Commuters | % Commuters |
| Less than 5 Minutes | 0 | 0.0% |
| 5 to 9 Minutes | 0 | 0.0% |
| 10 to 14 Minutes | 15 | 8.8% |
| 15 to 19 Minutes | 7 | 4.1% |
| 20 to 24 Minutes | 32 | 18.7% |
| 25 to 29 Minutes | 12 | 7.0% |
| 30 to 34 Minutes | 47 | 27.5% |
| 35 to 39 Minutes | 0 | 0.0% |
| 40 to 44 Minutes | 29 | 17.0% |
| 45 to 59 Minutes | 5 | 2.9% |
| 60 to 89 Minutes | 0 | 0.0% |
| 90 or more Minutes | 24 | 14.0% |
Commute Time by Sex in Sorrel
The most common commute times in Sorrel are 30 to 34 minutes (43 commuters, 36.1%) for males and 40 to 44 minutes (20 commuters, 38.5%) for females.
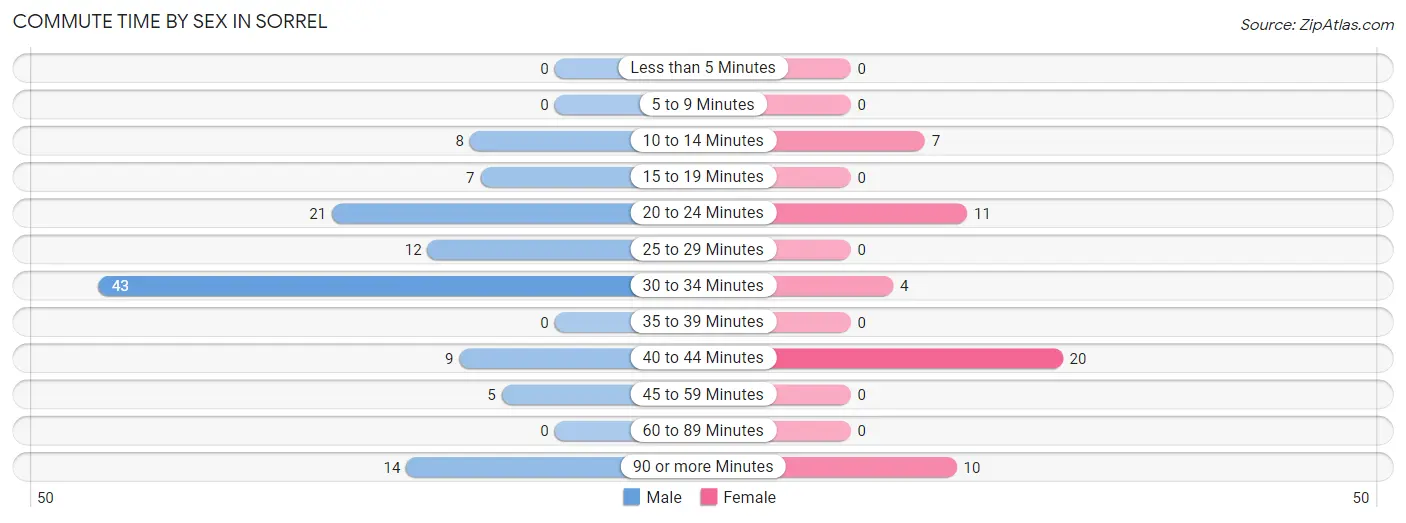
| Commute Time | Male | Female |
| Less than 5 Minutes | 0 (0.0%) | 0 (0.0%) |
| 5 to 9 Minutes | 0 (0.0%) | 0 (0.0%) |
| 10 to 14 Minutes | 8 (6.7%) | 7 (13.5%) |
| 15 to 19 Minutes | 7 (5.9%) | 0 (0.0%) |
| 20 to 24 Minutes | 21 (17.6%) | 11 (21.1%) |
| 25 to 29 Minutes | 12 (10.1%) | 0 (0.0%) |
| 30 to 34 Minutes | 43 (36.1%) | 4 (7.7%) |
| 35 to 39 Minutes | 0 (0.0%) | 0 (0.0%) |
| 40 to 44 Minutes | 9 (7.6%) | 20 (38.5%) |
| 45 to 59 Minutes | 5 (4.2%) | 0 (0.0%) |
| 60 to 89 Minutes | 0 (0.0%) | 0 (0.0%) |
| 90 or more Minutes | 14 (11.8%) | 10 (19.2%) |
Time of Departure to Work by Sex in Sorrel
The most frequent times of departure to work in Sorrel are 6:00 AM to 6:29 AM (40, 33.6%) for males and 5:00 AM to 5:29 AM (21, 40.4%) for females.
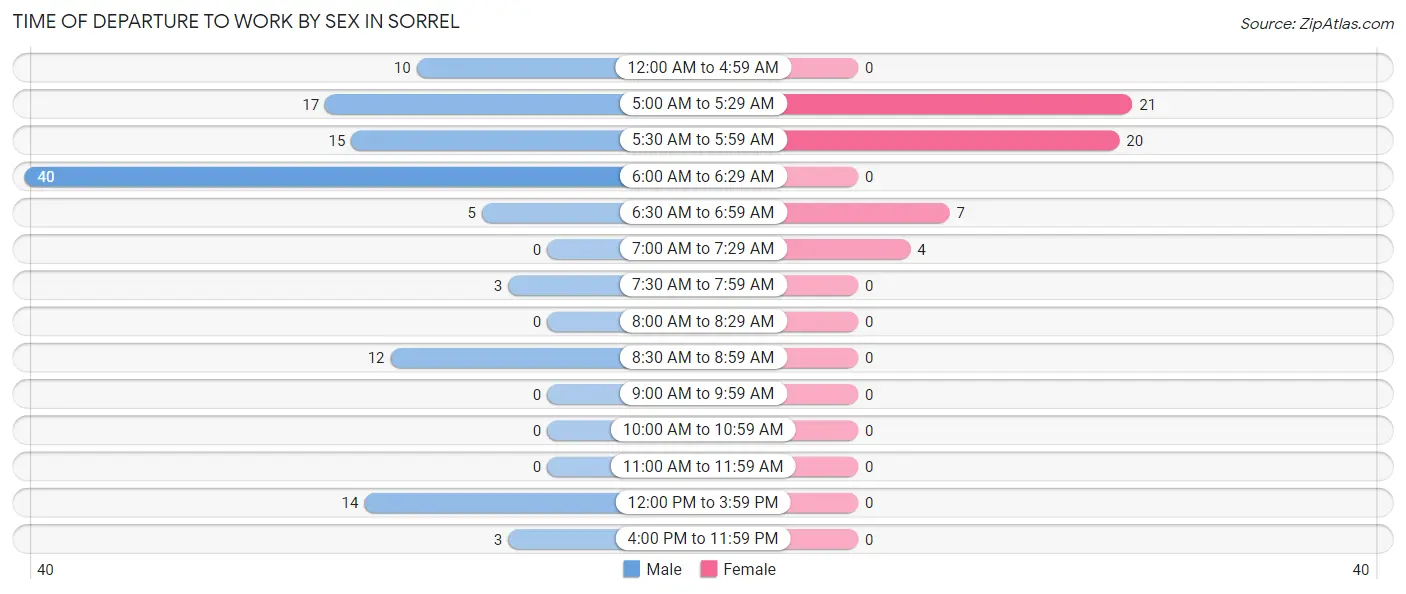
| Time of Departure | Male | Female |
| 12:00 AM to 4:59 AM | 10 (8.4%) | 0 (0.0%) |
| 5:00 AM to 5:29 AM | 17 (14.3%) | 21 (40.4%) |
| 5:30 AM to 5:59 AM | 15 (12.6%) | 20 (38.5%) |
| 6:00 AM to 6:29 AM | 40 (33.6%) | 0 (0.0%) |
| 6:30 AM to 6:59 AM | 5 (4.2%) | 7 (13.5%) |
| 7:00 AM to 7:29 AM | 0 (0.0%) | 4 (7.7%) |
| 7:30 AM to 7:59 AM | 3 (2.5%) | 0 (0.0%) |
| 8:00 AM to 8:29 AM | 0 (0.0%) | 0 (0.0%) |
| 8:30 AM to 8:59 AM | 12 (10.1%) | 0 (0.0%) |
| 9:00 AM to 9:59 AM | 0 (0.0%) | 0 (0.0%) |
| 10:00 AM to 10:59 AM | 0 (0.0%) | 0 (0.0%) |
| 11:00 AM to 11:59 AM | 0 (0.0%) | 0 (0.0%) |
| 12:00 PM to 3:59 PM | 14 (11.8%) | 0 (0.0%) |
| 4:00 PM to 11:59 PM | 3 (2.5%) | 0 (0.0%) |
| Total | 119 (100.0%) | 52 (100.0%) |
Housing Occupancy in Sorrel
Occupancy by Ownership in Sorrel
Of the total 214 dwellings in Sorrel, owner-occupied units account for 193 (90.2%), while renter-occupied units make up 21 (9.8%).
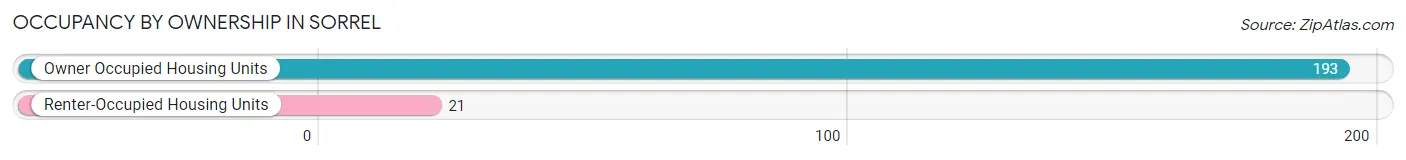
| Occupancy | # Housing Units | % Housing Units |
| Owner Occupied Housing Units | 193 | 90.2% |
| Renter-Occupied Housing Units | 21 | 9.8% |
| Total Occupied Housing Units | 214 | 100.0% |
Occupancy by Household Size in Sorrel
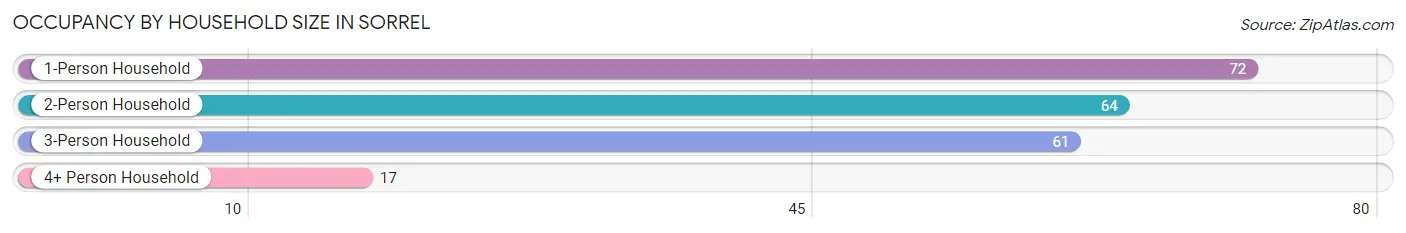
| Household Size | # Housing Units | % Housing Units |
| 1-Person Household | 72 | 33.6% |
| 2-Person Household | 64 | 29.9% |
| 3-Person Household | 61 | 28.5% |
| 4+ Person Household | 17 | 7.9% |
| Total Housing Units | 214 | 100.0% |
Occupancy by Ownership by Household Size in Sorrel
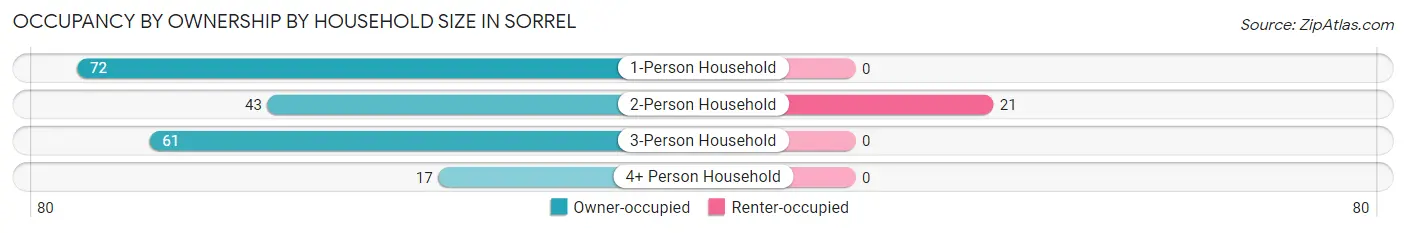
| Household Size | Owner-occupied | Renter-occupied |
| 1-Person Household | 72 (100.0%) | 0 (0.0%) |
| 2-Person Household | 43 (67.2%) | 21 (32.8%) |
| 3-Person Household | 61 (100.0%) | 0 (0.0%) |
| 4+ Person Household | 17 (100.0%) | 0 (0.0%) |
| Total Housing Units | 193 (90.2%) | 21 (9.8%) |
Occupancy by Educational Attainment in Sorrel
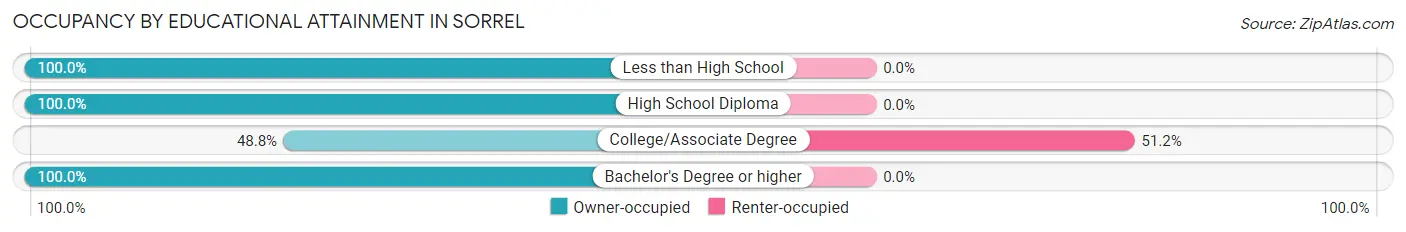
| Household Size | Owner-occupied | Renter-occupied |
| Less than High School | 38 (100.0%) | 0 (0.0%) |
| High School Diploma | 128 (100.0%) | 0 (0.0%) |
| College/Associate Degree | 20 (48.8%) | 21 (51.2%) |
| Bachelor's Degree or higher | 7 (100.0%) | 0 (0.0%) |
Occupancy by Age of Householder in Sorrel
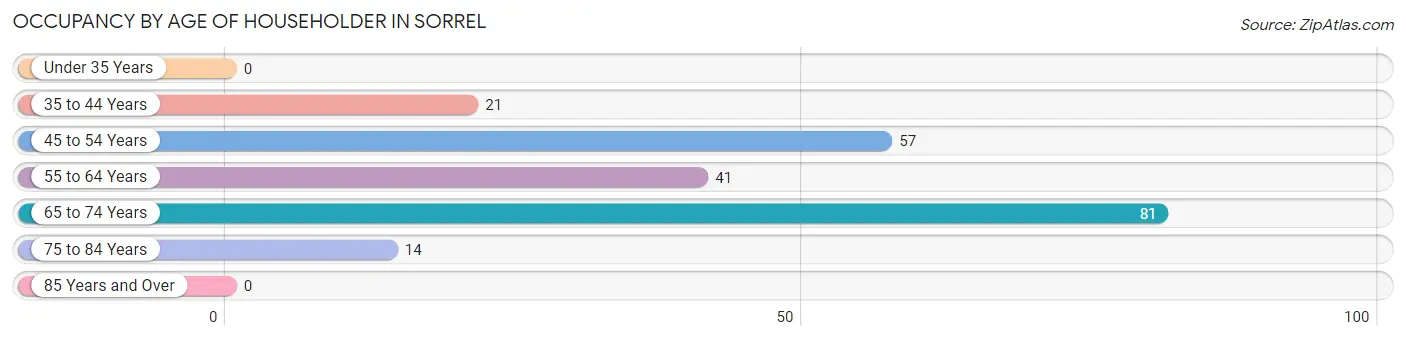
| Age Bracket | # Households | % Households |
| Under 35 Years | 0 | 0.0% |
| 35 to 44 Years | 21 | 9.8% |
| 45 to 54 Years | 57 | 26.6% |
| 55 to 64 Years | 41 | 19.2% |
| 65 to 74 Years | 81 | 37.9% |
| 75 to 84 Years | 14 | 6.5% |
| 85 Years and Over | 0 | 0.0% |
| Total | 214 | 100.0% |
Housing Finances in Sorrel
Median Income by Occupancy in Sorrel
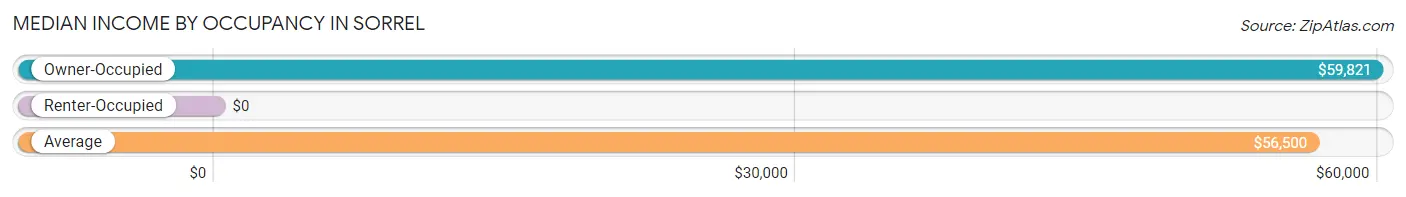
| Occupancy Type | # Households | Median Income |
| Owner-Occupied | 193 (90.2%) | $59,821 |
| Renter-Occupied | 21 (9.8%) | $0 |
| Average | 214 (100.0%) | $56,500 |
Occupancy by Householder Income Bracket in Sorrel
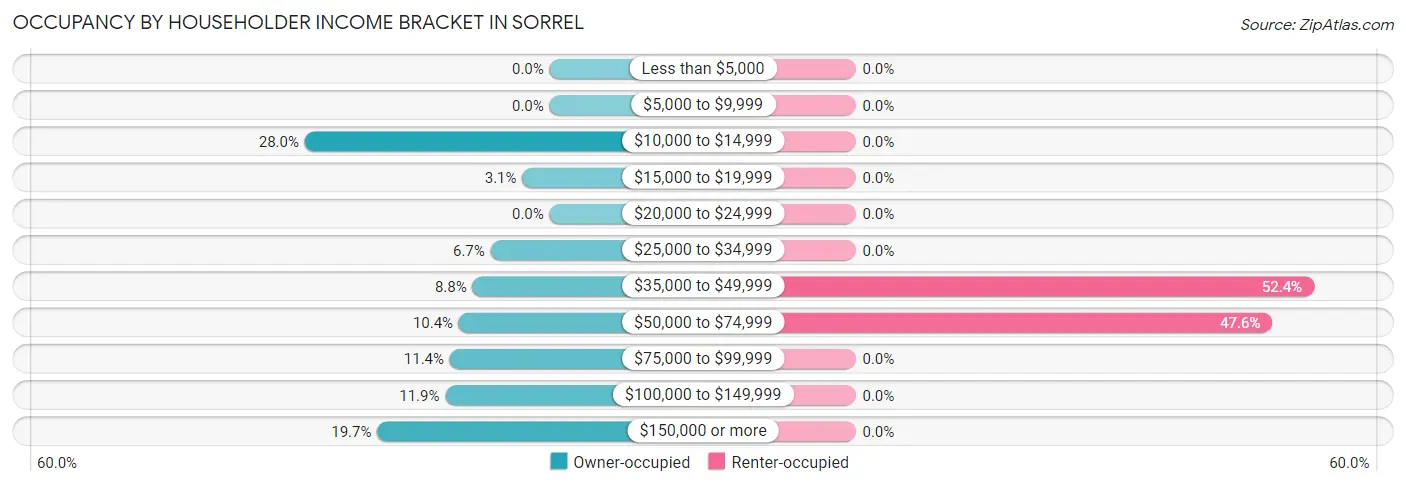
| Income Bracket | Owner-occupied | Renter-occupied |
| Less than $5,000 | 0 (0.0%) | 0 (0.0%) |
| $5,000 to $9,999 | 0 (0.0%) | 0 (0.0%) |
| $10,000 to $14,999 | 54 (28.0%) | 0 (0.0%) |
| $15,000 to $19,999 | 6 (3.1%) | 0 (0.0%) |
| $20,000 to $24,999 | 0 (0.0%) | 0 (0.0%) |
| $25,000 to $34,999 | 13 (6.7%) | 0 (0.0%) |
| $35,000 to $49,999 | 17 (8.8%) | 11 (52.4%) |
| $50,000 to $74,999 | 20 (10.4%) | 10 (47.6%) |
| $75,000 to $99,999 | 22 (11.4%) | 0 (0.0%) |
| $100,000 to $149,999 | 23 (11.9%) | 0 (0.0%) |
| $150,000 or more | 38 (19.7%) | 0 (0.0%) |
| Total | 193 (100.0%) | 21 (100.0%) |
Monthly Housing Cost Tiers in Sorrel
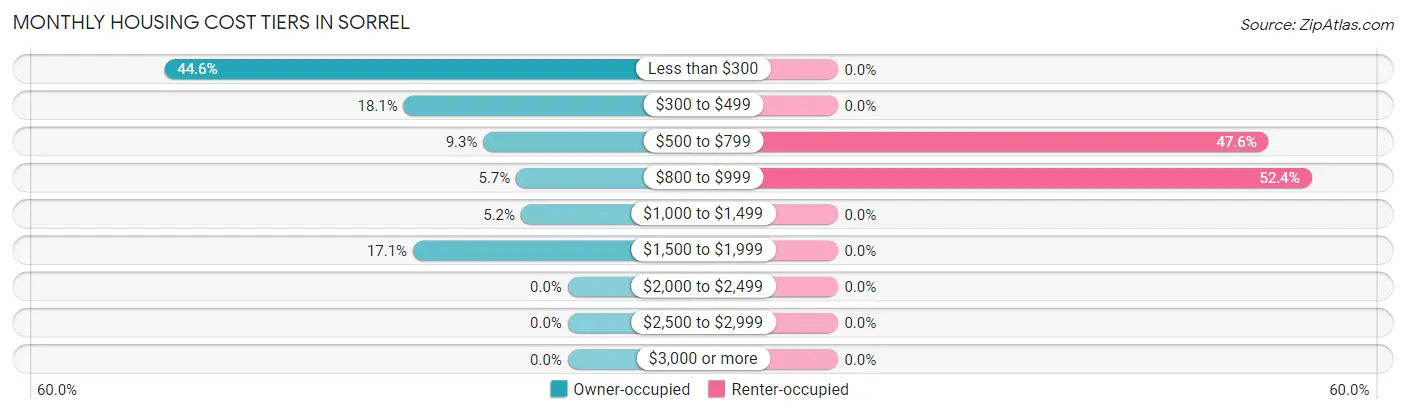
| Monthly Cost | Owner-occupied | Renter-occupied |
| Less than $300 | 86 (44.6%) | 0 (0.0%) |
| $300 to $499 | 35 (18.1%) | 0 (0.0%) |
| $500 to $799 | 18 (9.3%) | 10 (47.6%) |
| $800 to $999 | 11 (5.7%) | 11 (52.4%) |
| $1,000 to $1,499 | 10 (5.2%) | 0 (0.0%) |
| $1,500 to $1,999 | 33 (17.1%) | 0 (0.0%) |
| $2,000 to $2,499 | 0 (0.0%) | 0 (0.0%) |
| $2,500 to $2,999 | 0 (0.0%) | 0 (0.0%) |
| $3,000 or more | 0 (0.0%) | 0 (0.0%) |
| Total | 193 (100.0%) | 21 (100.0%) |
Physical Housing Characteristics in Sorrel
Housing Structures in Sorrel
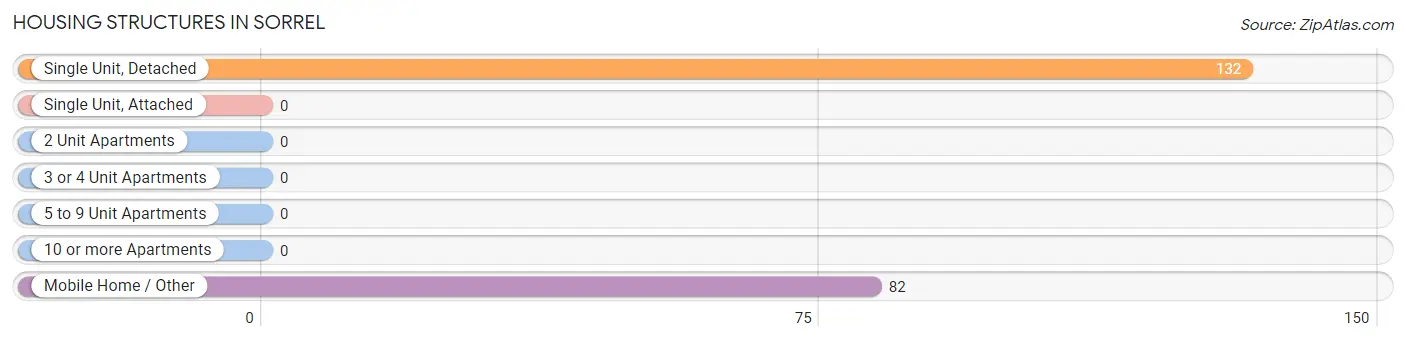
| Structure Type | # Housing Units | % Housing Units |
| Single Unit, Detached | 132 | 61.7% |
| Single Unit, Attached | 0 | 0.0% |
| 2 Unit Apartments | 0 | 0.0% |
| 3 or 4 Unit Apartments | 0 | 0.0% |
| 5 to 9 Unit Apartments | 0 | 0.0% |
| 10 or more Apartments | 0 | 0.0% |
| Mobile Home / Other | 82 | 38.3% |
| Total | 214 | 100.0% |
Housing Structures by Occupancy in Sorrel
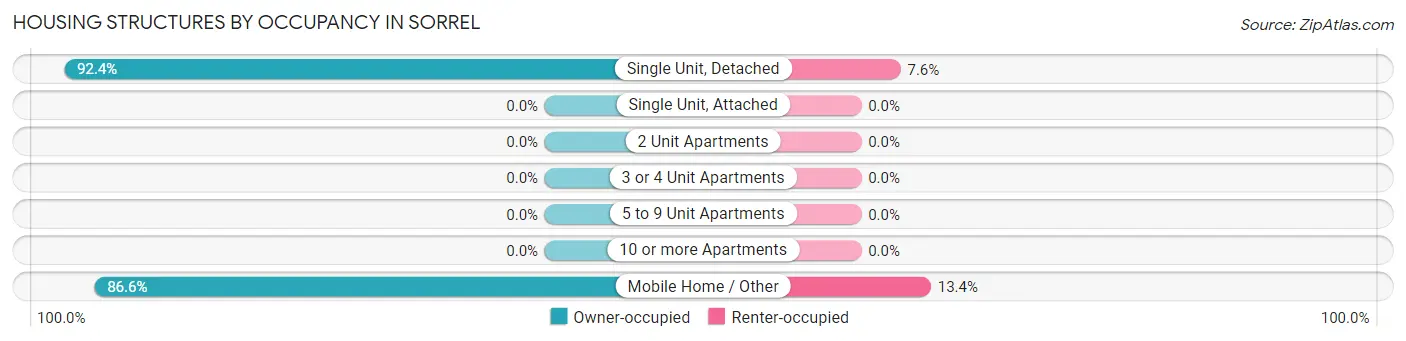
| Structure Type | Owner-occupied | Renter-occupied |
| Single Unit, Detached | 122 (92.4%) | 10 (7.6%) |
| Single Unit, Attached | 0 (0.0%) | 0 (0.0%) |
| 2 Unit Apartments | 0 (0.0%) | 0 (0.0%) |
| 3 or 4 Unit Apartments | 0 (0.0%) | 0 (0.0%) |
| 5 to 9 Unit Apartments | 0 (0.0%) | 0 (0.0%) |
| 10 or more Apartments | 0 (0.0%) | 0 (0.0%) |
| Mobile Home / Other | 71 (86.6%) | 11 (13.4%) |
| Total | 193 (90.2%) | 21 (9.8%) |
Housing Structures by Number of Rooms in Sorrel
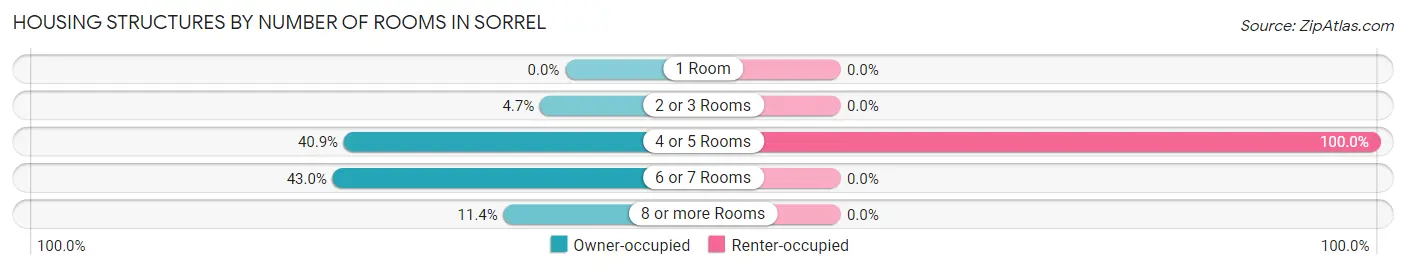
| Number of Rooms | Owner-occupied | Renter-occupied |
| 1 Room | 0 (0.0%) | 0 (0.0%) |
| 2 or 3 Rooms | 9 (4.7%) | 0 (0.0%) |
| 4 or 5 Rooms | 79 (40.9%) | 21 (100.0%) |
| 6 or 7 Rooms | 83 (43.0%) | 0 (0.0%) |
| 8 or more Rooms | 22 (11.4%) | 0 (0.0%) |
| Total | 193 (100.0%) | 21 (100.0%) |
Housing Structure by Heating Type in Sorrel
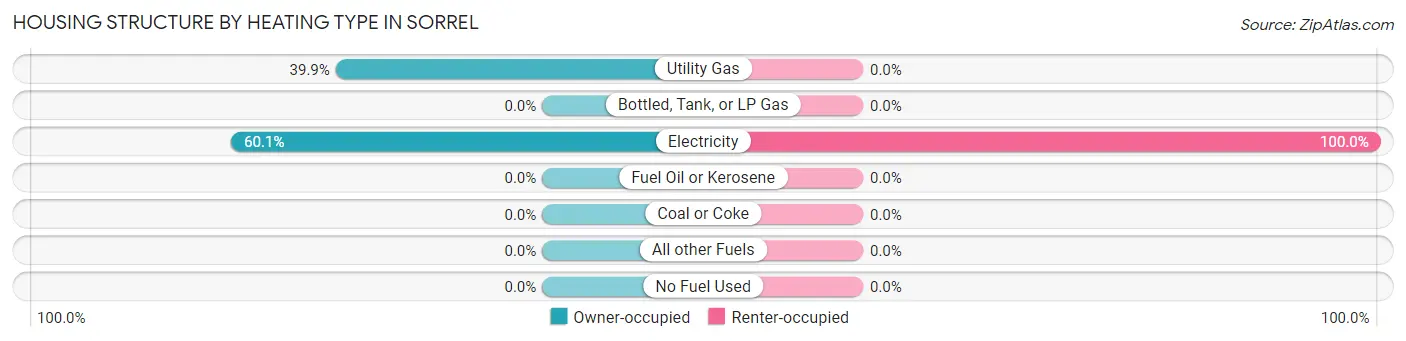
| Heating Type | Owner-occupied | Renter-occupied |
| Utility Gas | 77 (39.9%) | 0 (0.0%) |
| Bottled, Tank, or LP Gas | 0 (0.0%) | 0 (0.0%) |
| Electricity | 116 (60.1%) | 21 (100.0%) |
| Fuel Oil or Kerosene | 0 (0.0%) | 0 (0.0%) |
| Coal or Coke | 0 (0.0%) | 0 (0.0%) |
| All other Fuels | 0 (0.0%) | 0 (0.0%) |
| No Fuel Used | 0 (0.0%) | 0 (0.0%) |
| Total | 193 (100.0%) | 21 (100.0%) |
Household Vehicle Usage in Sorrel
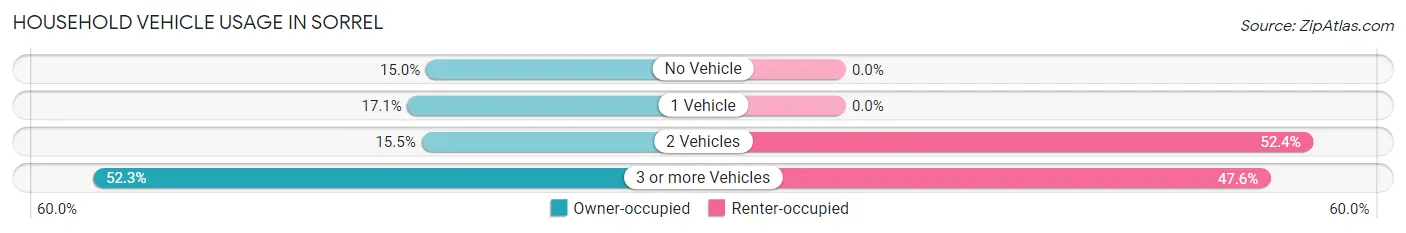
| Vehicles per Household | Owner-occupied | Renter-occupied |
| No Vehicle | 29 (15.0%) | 0 (0.0%) |
| 1 Vehicle | 33 (17.1%) | 0 (0.0%) |
| 2 Vehicles | 30 (15.5%) | 11 (52.4%) |
| 3 or more Vehicles | 101 (52.3%) | 10 (47.6%) |
| Total | 193 (100.0%) | 21 (100.0%) |
Real Estate & Mortgages in Sorrel
Real Estate and Mortgage Overview in Sorrel
| Characteristic | Without Mortgage | With Mortgage |
| Housing Units | 150 | 43 |
| Median Property Value | $56,400 | $217,400 |
| Median Household Income | - | - |
| Monthly Housing Costs | $268 | $0 |
| Real Estate Taxes | - | - |
Property Value by Mortgage Status in Sorrel
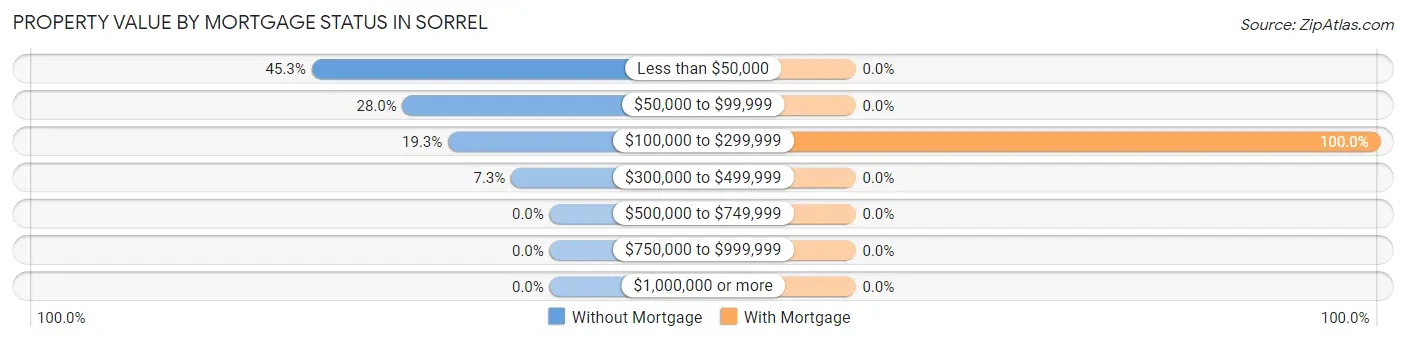
| Property Value | Without Mortgage | With Mortgage |
| Less than $50,000 | 68 (45.3%) | 0 (0.0%) |
| $50,000 to $99,999 | 42 (28.0%) | 0 (0.0%) |
| $100,000 to $299,999 | 29 (19.3%) | 43 (100.0%) |
| $300,000 to $499,999 | 11 (7.3%) | 0 (0.0%) |
| $500,000 to $749,999 | 0 (0.0%) | 0 (0.0%) |
| $750,000 to $999,999 | 0 (0.0%) | 0 (0.0%) |
| $1,000,000 or more | 0 (0.0%) | 0 (0.0%) |
| Total | 150 (100.0%) | 43 (100.0%) |
Household Income by Mortgage Status in Sorrel
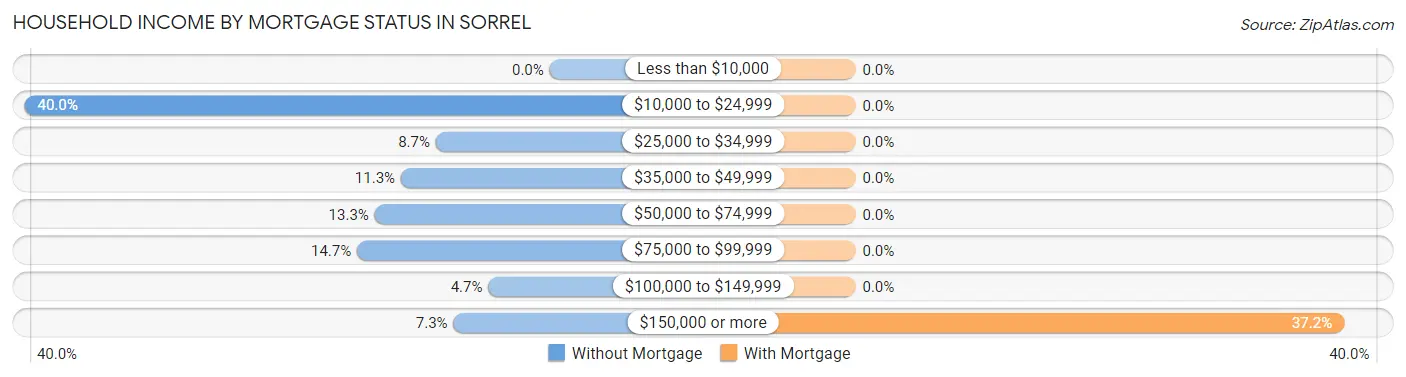
| Household Income | Without Mortgage | With Mortgage |
| Less than $10,000 | 0 (0.0%) | 0 (0.0%) |
| $10,000 to $24,999 | 60 (40.0%) | 0 (0.0%) |
| $25,000 to $34,999 | 13 (8.7%) | 0 (0.0%) |
| $35,000 to $49,999 | 17 (11.3%) | 0 (0.0%) |
| $50,000 to $74,999 | 20 (13.3%) | 0 (0.0%) |
| $75,000 to $99,999 | 22 (14.7%) | 0 (0.0%) |
| $100,000 to $149,999 | 7 (4.7%) | 0 (0.0%) |
| $150,000 or more | 11 (7.3%) | 16 (37.2%) |
| Total | 150 (100.0%) | 43 (100.0%) |
Property Value to Household Income Ratio in Sorrel
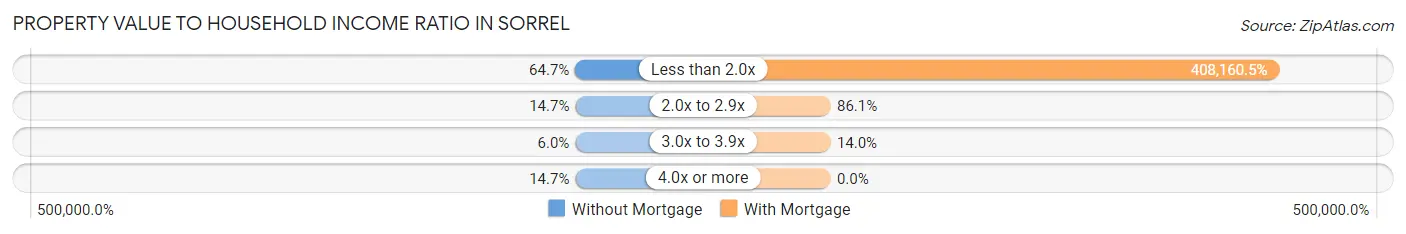
| Value-to-Income Ratio | Without Mortgage | With Mortgage |
| Less than 2.0x | 97 (64.7%) | 175,509 (408,160.5%) |
| 2.0x to 2.9x | 22 (14.7%) | 37 (86.1%) |
| 3.0x to 3.9x | 9 (6.0%) | 6 (14.0%) |
| 4.0x or more | 22 (14.7%) | 0 (0.0%) |
| Total | 150 (100.0%) | 43 (100.0%) |
Real Estate Taxes by Mortgage Status in Sorrel
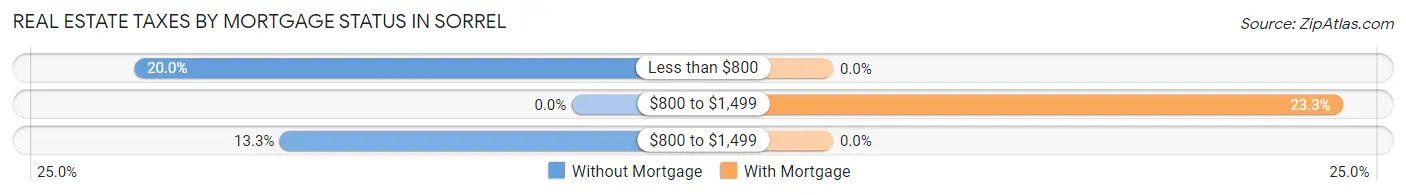
| Property Taxes | Without Mortgage | With Mortgage |
| Less than $800 | 30 (20.0%) | 0 (0.0%) |
| $800 to $1,499 | 0 (0.0%) | 10 (23.3%) |
| $800 to $1,499 | 20 (13.3%) | 0 (0.0%) |
| Total | 150 (100.0%) | 43 (100.0%) |
Health & Disability in Sorrel
Health Insurance Coverage by Age in Sorrel
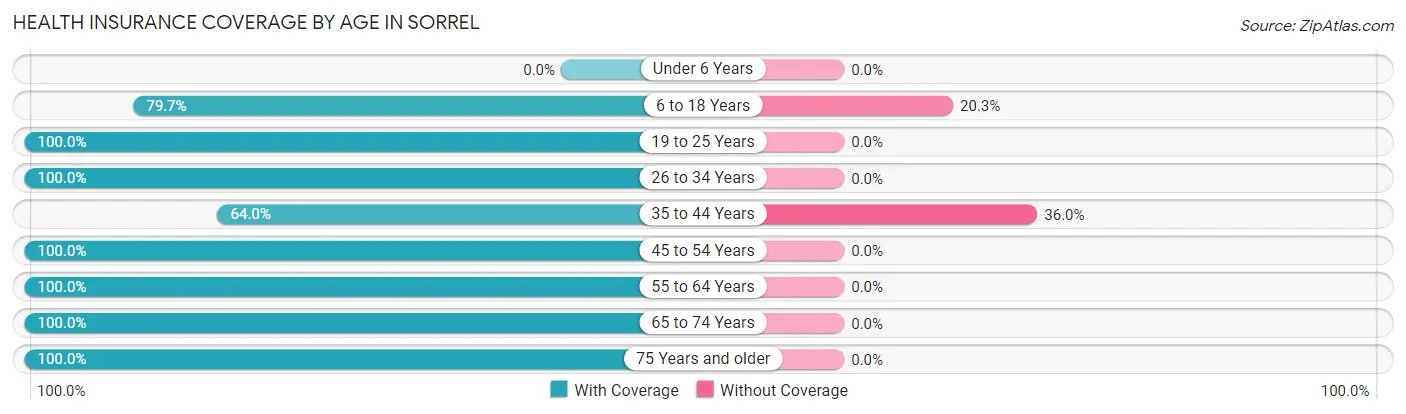
| Age Bracket | With Coverage | Without Coverage |
| Under 6 Years | 0 (0.0%) | 0 (0.0%) |
| 6 to 18 Years | 55 (79.7%) | 14 (20.3%) |
| 19 to 25 Years | 33 (100.0%) | 0 (0.0%) |
| 26 to 34 Years | 74 (100.0%) | 0 (0.0%) |
| 35 to 44 Years | 32 (64.0%) | 18 (36.0%) |
| 45 to 54 Years | 106 (100.0%) | 0 (0.0%) |
| 55 to 64 Years | 86 (100.0%) | 0 (0.0%) |
| 65 to 74 Years | 81 (100.0%) | 0 (0.0%) |
| 75 Years and older | 38 (100.0%) | 0 (0.0%) |
| Total | 505 (94.0%) | 32 (6.0%) |
Health Insurance Coverage by Citizenship Status in Sorrel
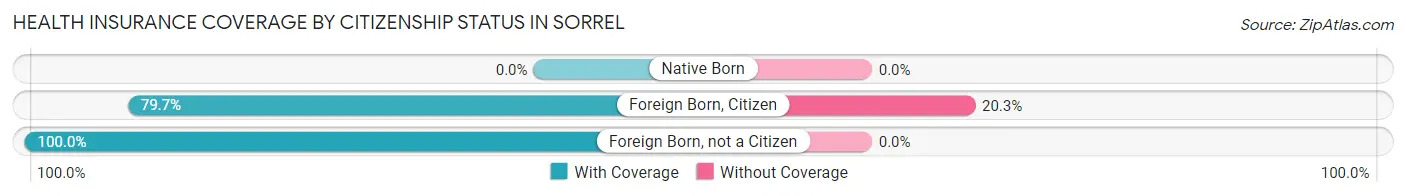
| Citizenship Status | With Coverage | Without Coverage |
| Native Born | 0 (0.0%) | 0 (0.0%) |
| Foreign Born, Citizen | 55 (79.7%) | 14 (20.3%) |
| Foreign Born, not a Citizen | 33 (100.0%) | 0 (0.0%) |
Health Insurance Coverage by Household Income in Sorrel
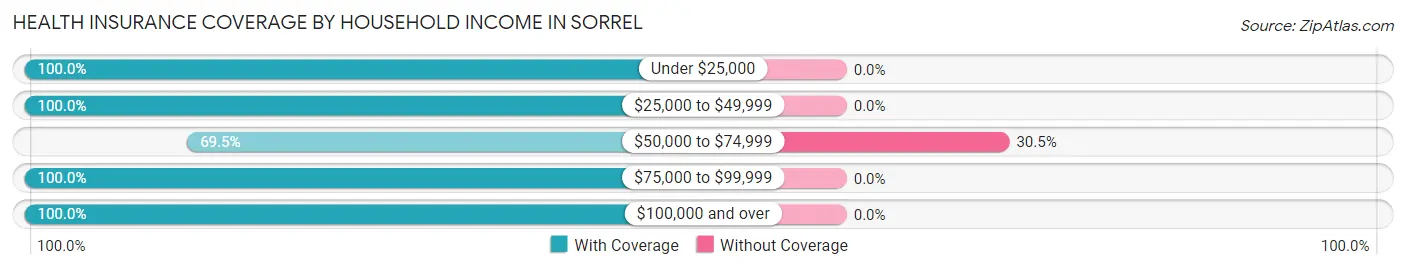
| Household Income | With Coverage | Without Coverage |
| Under $25,000 | 110 (100.0%) | 0 (0.0%) |
| $25,000 to $49,999 | 95 (100.0%) | 0 (0.0%) |
| $50,000 to $74,999 | 73 (69.5%) | 32 (30.5%) |
| $75,000 to $99,999 | 29 (100.0%) | 0 (0.0%) |
| $100,000 and over | 198 (100.0%) | 0 (0.0%) |
Public vs Private Health Insurance Coverage by Age in Sorrel
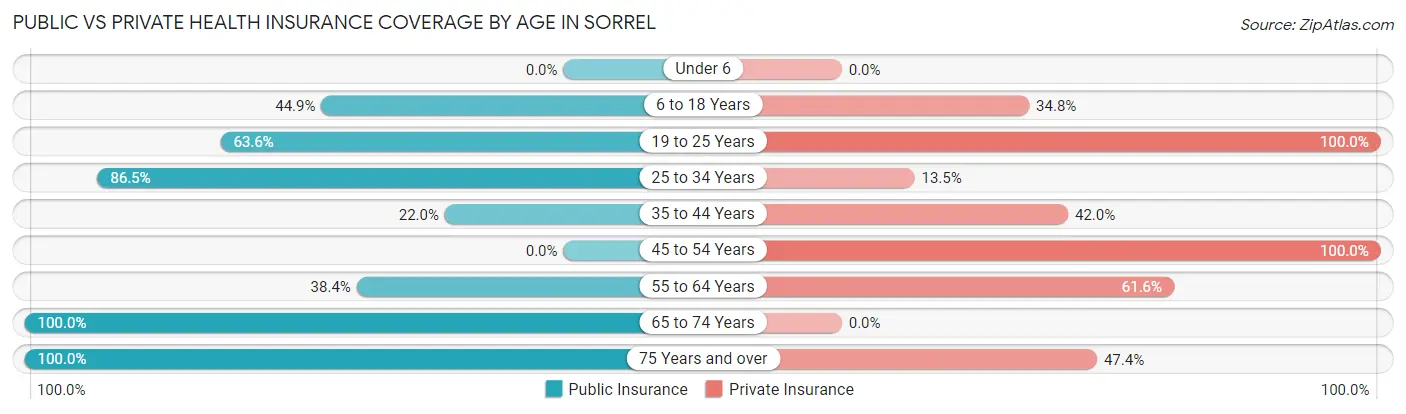
| Age Bracket | Public Insurance | Private Insurance |
| Under 6 | 0 (0.0%) | 0 (0.0%) |
| 6 to 18 Years | 31 (44.9%) | 24 (34.8%) |
| 19 to 25 Years | 21 (63.6%) | 33 (100.0%) |
| 25 to 34 Years | 64 (86.5%) | 10 (13.5%) |
| 35 to 44 Years | 11 (22.0%) | 21 (42.0%) |
| 45 to 54 Years | 0 (0.0%) | 106 (100.0%) |
| 55 to 64 Years | 33 (38.4%) | 53 (61.6%) |
| 65 to 74 Years | 81 (100.0%) | 0 (0.0%) |
| 75 Years and over | 38 (100.0%) | 18 (47.4%) |
| Total | 279 (52.0%) | 265 (49.3%) |
Disability Status by Sex by Age in Sorrel
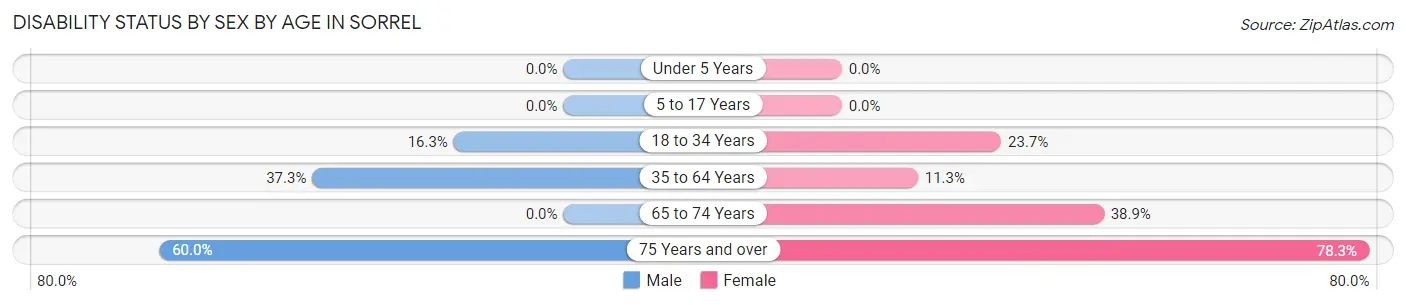
| Age Bracket | Male | Female |
| Under 5 Years | 0 (0.0%) | 0 (0.0%) |
| 5 to 17 Years | 0 (0.0%) | 0 (0.0%) |
| 18 to 34 Years | 7 (16.3%) | 22 (23.7%) |
| 35 to 64 Years | 44 (37.3%) | 14 (11.3%) |
| 65 to 74 Years | 0 (0.0%) | 7 (38.9%) |
| 75 Years and over | 9 (60.0%) | 18 (78.3%) |
Disability Class by Sex by Age in Sorrel
Disability Class: Hearing Difficulty
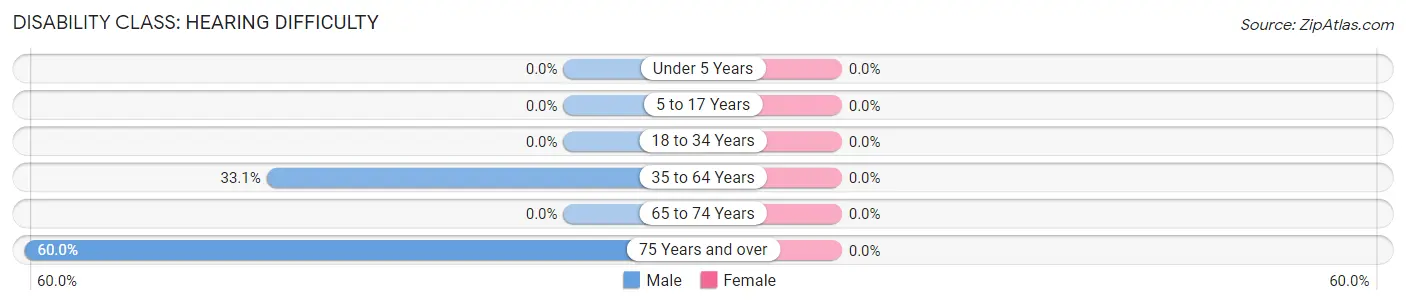
| Age Bracket | Male | Female |
| Under 5 Years | 0 (0.0%) | 0 (0.0%) |
| 5 to 17 Years | 0 (0.0%) | 0 (0.0%) |
| 18 to 34 Years | 0 (0.0%) | 0 (0.0%) |
| 35 to 64 Years | 39 (33.1%) | 0 (0.0%) |
| 65 to 74 Years | 0 (0.0%) | 0 (0.0%) |
| 75 Years and over | 9 (60.0%) | 0 (0.0%) |
Disability Class: Vision Difficulty
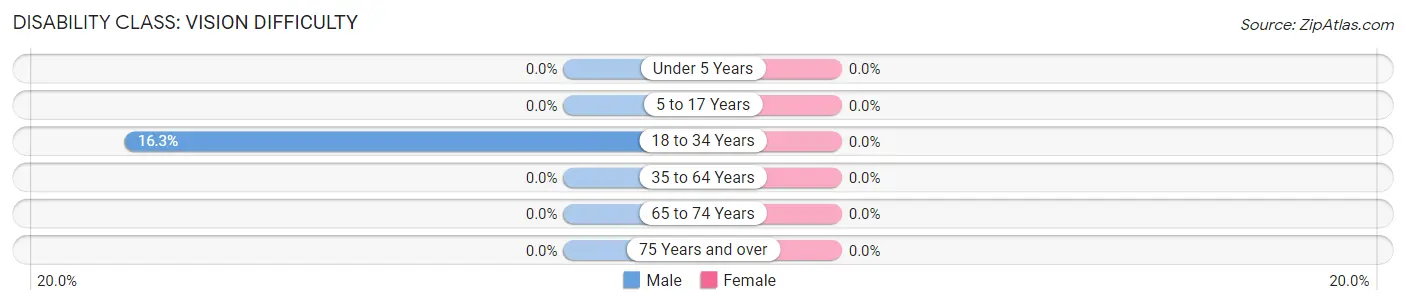
| Age Bracket | Male | Female |
| Under 5 Years | 0 (0.0%) | 0 (0.0%) |
| 5 to 17 Years | 0 (0.0%) | 0 (0.0%) |
| 18 to 34 Years | 7 (16.3%) | 0 (0.0%) |
| 35 to 64 Years | 0 (0.0%) | 0 (0.0%) |
| 65 to 74 Years | 0 (0.0%) | 0 (0.0%) |
| 75 Years and over | 0 (0.0%) | 0 (0.0%) |
Disability Class: Cognitive Difficulty
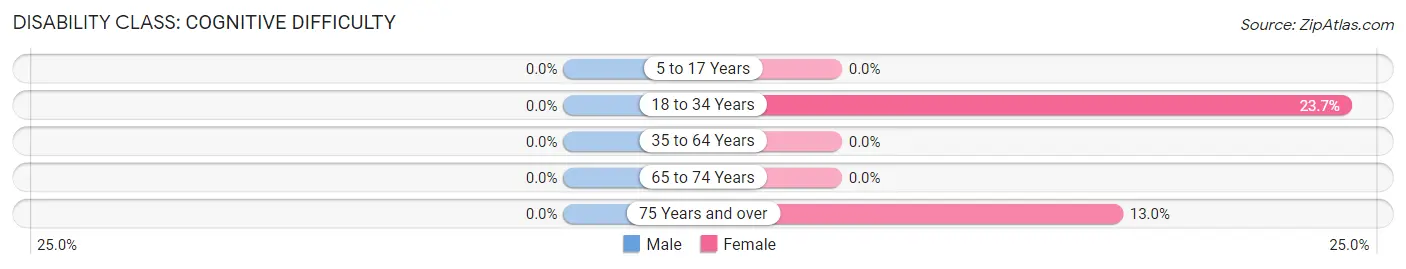
| Age Bracket | Male | Female |
| 5 to 17 Years | 0 (0.0%) | 0 (0.0%) |
| 18 to 34 Years | 0 (0.0%) | 22 (23.7%) |
| 35 to 64 Years | 0 (0.0%) | 0 (0.0%) |
| 65 to 74 Years | 0 (0.0%) | 0 (0.0%) |
| 75 Years and over | 0 (0.0%) | 3 (13.0%) |
Disability Class: Ambulatory Difficulty
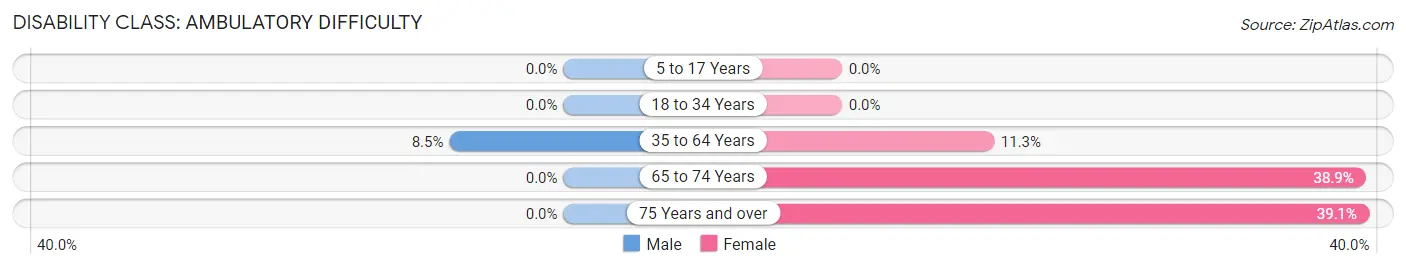
| Age Bracket | Male | Female |
| 5 to 17 Years | 0 (0.0%) | 0 (0.0%) |
| 18 to 34 Years | 0 (0.0%) | 0 (0.0%) |
| 35 to 64 Years | 10 (8.5%) | 14 (11.3%) |
| 65 to 74 Years | 0 (0.0%) | 7 (38.9%) |
| 75 Years and over | 0 (0.0%) | 9 (39.1%) |
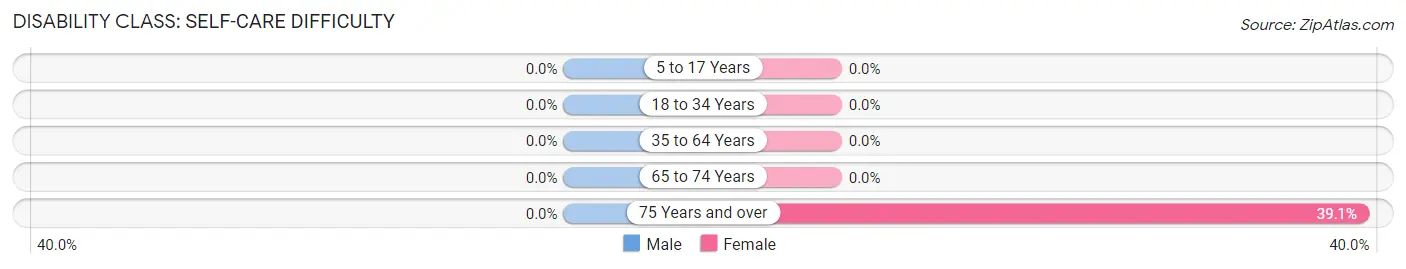
Disability Class: Self-Care Difficulty
| Age Bracket | Male | Female |
| 5 to 17 Years | 0 (0.0%) | 0 (0.0%) |
| 18 to 34 Years | 0 (0.0%) | 0 (0.0%) |
| 35 to 64 Years | 0 (0.0%) | 0 (0.0%) |
| 65 to 74 Years | 0 (0.0%) | 0 (0.0%) |
| 75 Years and over | 0 (0.0%) | 9 (39.1%) |
Technology Access in Sorrel
Computing Device Access in Sorrel
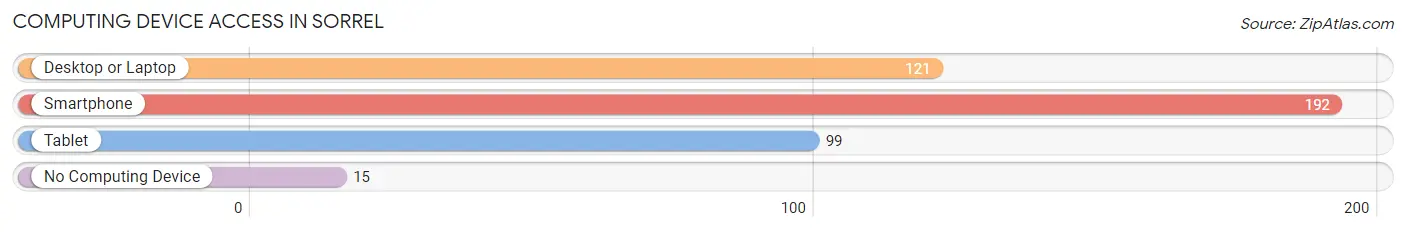
| Device Type | # Households | % Households |
| Desktop or Laptop | 121 | 56.5% |
| Smartphone | 192 | 89.7% |
| Tablet | 99 | 46.3% |
| No Computing Device | 15 | 7.0% |
| Total | 214 | 100.0% |
Internet Access in Sorrel
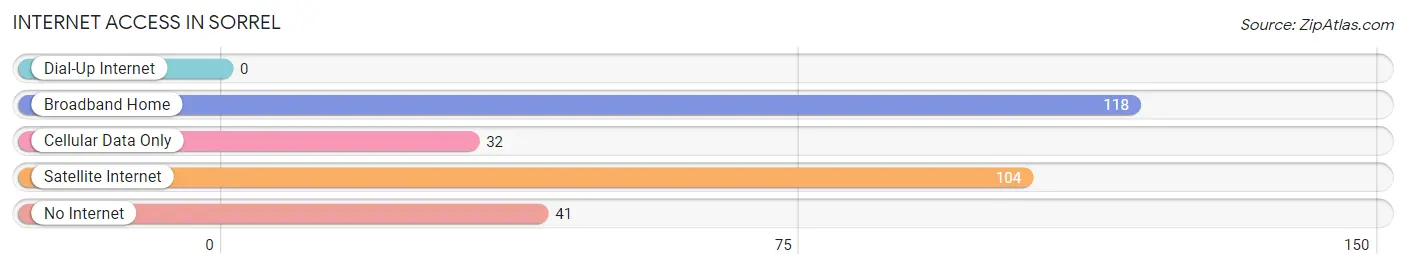
| Internet Type | # Households | % Households |
| Dial-Up Internet | 0 | 0.0% |
| Broadband Home | 118 | 55.1% |
| Cellular Data Only | 32 | 14.9% |
| Satellite Internet | 104 | 48.6% |
| No Internet | 41 | 19.2% |
| Total | 214 | 100.0% |
Sorrel Summary
Sorrel, Louisiana is a small town located in the southeastern part of the state, in Iberville Parish. It is situated on the banks of the Mississippi River, about 25 miles south of Baton Rouge. The town has a population of about 1,500 people, and is known for its rural charm and friendly atmosphere.
Geography
Sorrel is located in the southeastern part of Louisiana, in Iberville Parish. It is situated on the banks of the Mississippi River, about 25 miles south of Baton Rouge. The town is surrounded by a number of small towns and villages, including Plaquemine, White Castle, and Maringouin. The town is located in a rural area, and is known for its lush green landscape and rolling hills. The town is also home to a number of small lakes and ponds, which provide a great place for fishing and other outdoor activities.
Economy
Sorrel’s economy is largely based on agriculture and forestry. The town is home to a number of small farms, which produce a variety of crops, including corn, soybeans, and cotton. The town is also home to a number of timber companies, which harvest and process timber for use in construction and other industries. In addition, Sorrel is home to a number of small businesses, including restaurants, retail stores, and service providers.
Demographics
As of the 2010 census, Sorrel had a population of 1,500 people. The town is predominantly white, with about 75% of the population identifying as such. The remaining 25% of the population is made up of African Americans, Hispanics, and other ethnicities. The median household income in Sorrel is $37,000, and the median home value is $90,000.
Conclusion
Sorrel, Louisiana is a small town located in the southeastern part of the state, in Iberville Parish. It is situated on the banks of the Mississippi River, about 25 miles south of Baton Rouge. The town has a population of about 1,500 people, and is known for its rural charm and friendly atmosphere. The town’s economy is largely based on agriculture and forestry, and it is home to a number of small businesses. The town is predominantly white, with about 75% of the population identifying as such. The median household income in Sorrel is $37,000, and the median home value is $90,000.
Common Questions
What is Per Capita Income in Sorrel?
Per Capita income in Sorrel is $31,002.
What is the Median Family Income in Sorrel?
Median Family Income in Sorrel is $80,938.
What is the Median Household income in Sorrel?
Median Household Income in Sorrel is $56,500.
What is Inequality or Gini Index in Sorrel?
Inequality or Gini Index in Sorrel is 0.45.
What is the Total Population of Sorrel?
Total Population of Sorrel is 537.
What is the Total Male Population of Sorrel?
Total Male Population of Sorrel is 263.
What is the Total Female Population of Sorrel?
Total Female Population of Sorrel is 274.
What is the Ratio of Males per 100 Females in Sorrel?
There are 95.99 Males per 100 Females in Sorrel.
What is the Ratio of Females per 100 Males in Sorrel?
There are 104.18 Females per 100 Males in Sorrel.
What is the Median Population Age in Sorrel?
Median Population Age in Sorrel is 48.1 Years.
What is the Average Family Size in Sorrel
Average Family Size in Sorrel is 3.4 People.
What is the Average Household Size in Sorrel
Average Household Size in Sorrel is 2.5 People.
How Large is the Labor Force in Sorrel?
There are 171 People in the Labor Forcein in Sorrel.
What is the Percentage of People in the Labor Force in Sorrel?
34.4% of People are in the Labor Force in Sorrel.