Taft Southwest, TX Map & Demographics
Taft Southwest Map
Taft Southwest Overview
$15,561
PER CAPITA INCOME
$67,880
AVG FAMILY INCOME
$50,239
AVG HOUSEHOLD INCOME
46.0%
WAGE / INCOME GAP [ % ]
54.0¢/ $1
WAGE / INCOME GAP [ $ ]
0.37
INEQUALITY / GINI INDEX
1,468
TOTAL POPULATION
786
MALE POPULATION
682
FEMALE POPULATION
115.25
MALES / 100 FEMALES
86.77
FEMALES / 100 MALES
30.9
MEDIAN AGE
3.9
AVG FAMILY SIZE
3.1
AVG HOUSEHOLD SIZE
354
LABOR FORCE [ PEOPLE ]
34.9%
PERCENT IN LABOR FORCE
Income in Taft Southwest
Income Overview in Taft Southwest
Per Capita Income in Taft Southwest is $15,561, while median incomes of families and households are $67,880 and $50,239 respectively.
| Characteristic | Number | Measure |
| Per Capita Income | 1,468 | $15,561 |
| Median Family Income | 348 | $67,880 |
| Mean Family Income | 348 | $61,237 |
| Median Household Income | 477 | $50,239 |
| Mean Household Income | 477 | $48,654 |
| Income Deficit | 348 | $0 |
| Wage / Income Gap (%) | 1,468 | 46.02% |
| Wage / Income Gap ($) | 1,468 | 53.98¢ per $1 |
| Gini / Inequality Index | 1,468 | 0.37 |
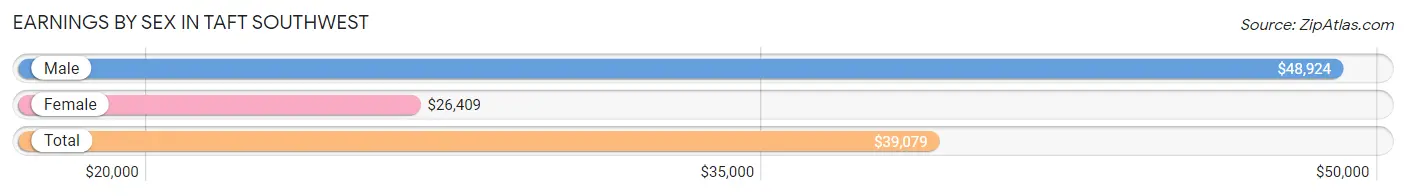
Earnings by Sex in Taft Southwest
Average Earnings in Taft Southwest are $39,079, $48,924 for men and $26,409 for women, a difference of 46.0%.
| Sex | Number | Average Earnings |
| Male | 255 (72.0%) | $48,924 |
| Female | 99 (28.0%) | $26,409 |
| Total | 354 (100.0%) | $39,079 |
Earnings by Sex by Income Bracket in Taft Southwest
The most common earnings brackets in Taft Southwest are $50,000 to $54,999 for men (75 | 29.4%) and $25,000 to $29,999 for women (63 | 63.6%).
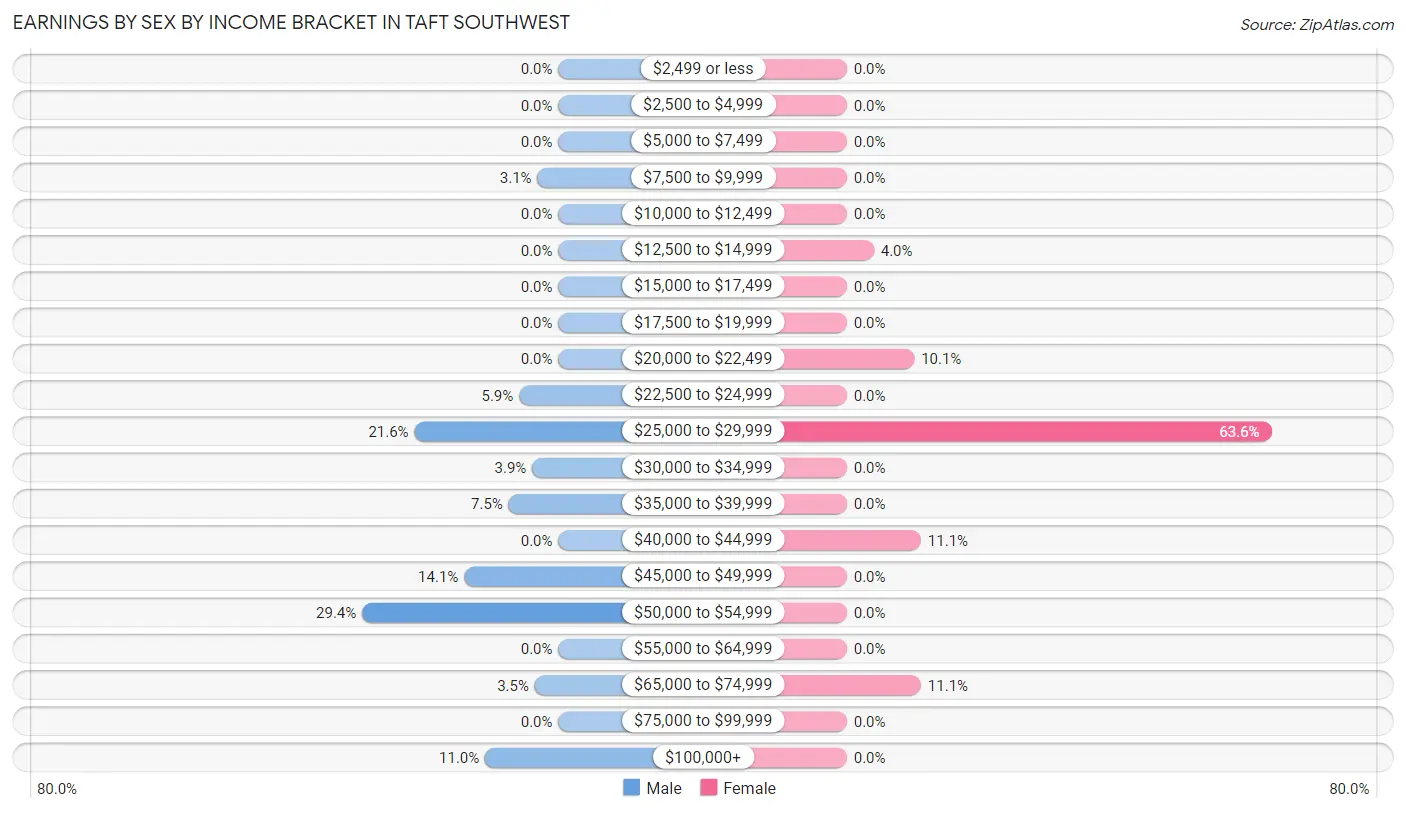
| Income | Male | Female |
| $2,499 or less | 0 (0.0%) | 0 (0.0%) |
| $2,500 to $4,999 | 0 (0.0%) | 0 (0.0%) |
| $5,000 to $7,499 | 0 (0.0%) | 0 (0.0%) |
| $7,500 to $9,999 | 8 (3.1%) | 0 (0.0%) |
| $10,000 to $12,499 | 0 (0.0%) | 0 (0.0%) |
| $12,500 to $14,999 | 0 (0.0%) | 4 (4.0%) |
| $15,000 to $17,499 | 0 (0.0%) | 0 (0.0%) |
| $17,500 to $19,999 | 0 (0.0%) | 0 (0.0%) |
| $20,000 to $22,499 | 0 (0.0%) | 10 (10.1%) |
| $22,500 to $24,999 | 15 (5.9%) | 0 (0.0%) |
| $25,000 to $29,999 | 55 (21.6%) | 63 (63.6%) |
| $30,000 to $34,999 | 10 (3.9%) | 0 (0.0%) |
| $35,000 to $39,999 | 19 (7.4%) | 0 (0.0%) |
| $40,000 to $44,999 | 0 (0.0%) | 11 (11.1%) |
| $45,000 to $49,999 | 36 (14.1%) | 0 (0.0%) |
| $50,000 to $54,999 | 75 (29.4%) | 0 (0.0%) |
| $55,000 to $64,999 | 0 (0.0%) | 0 (0.0%) |
| $65,000 to $74,999 | 9 (3.5%) | 11 (11.1%) |
| $75,000 to $99,999 | 0 (0.0%) | 0 (0.0%) |
| $100,000+ | 28 (11.0%) | 0 (0.0%) |
| Total | 255 (100.0%) | 99 (100.0%) |
Earnings by Sex by Educational Attainment in Taft Southwest
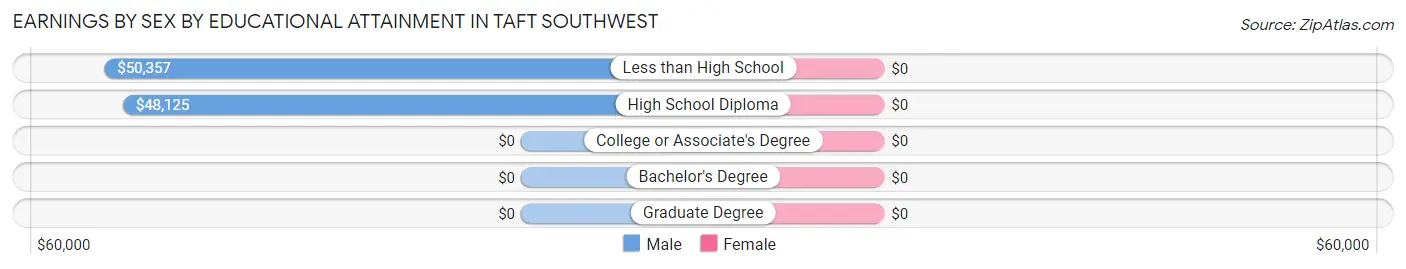
| Educational Attainment | Male Income | Female Income |
| Less than High School | $50,357 | $0 |
| High School Diploma | $48,125 | $0 |
| College or Associate's Degree | - | - |
| Bachelor's Degree | - | - |
| Graduate Degree | - | - |
| Total | $48,924 | $26,409 |
Family Income in Taft Southwest
Family Income Brackets in Taft Southwest
According to the Taft Southwest family income data, there are 131 families falling into the $50,000 to $74,999 income range, which is the most common income bracket and makes up 37.6% of all families.
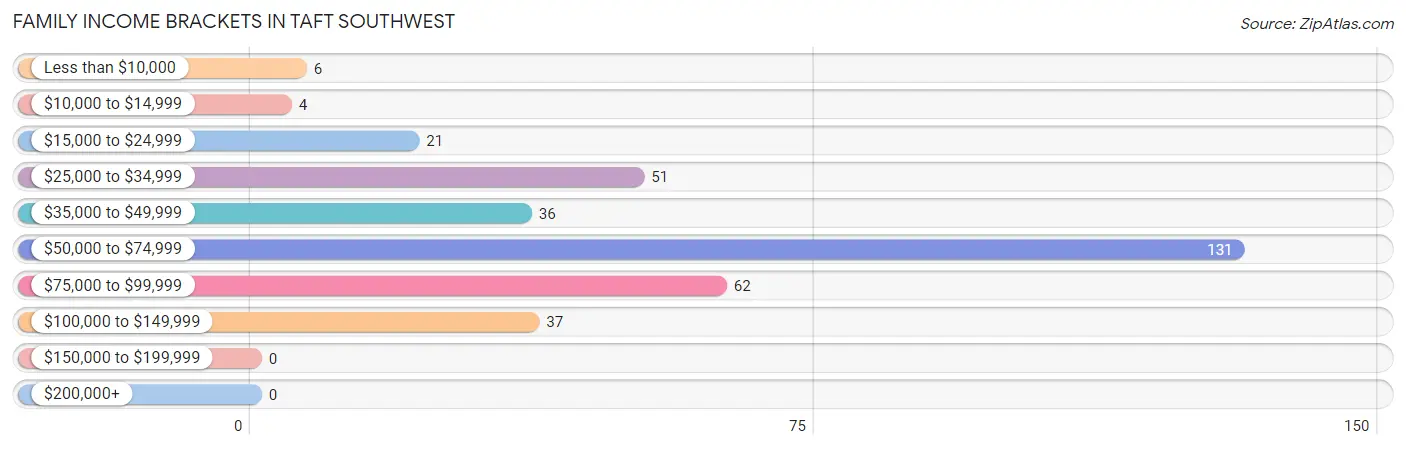
| Income Bracket | # Families | % Families |
| Less than $10,000 | 6 | 1.7% |
| $10,000 to $14,999 | 4 | 1.1% |
| $15,000 to $24,999 | 21 | 6.0% |
| $25,000 to $34,999 | 51 | 14.7% |
| $35,000 to $49,999 | 36 | 10.3% |
| $50,000 to $74,999 | 131 | 37.6% |
| $75,000 to $99,999 | 62 | 17.8% |
| $100,000 to $149,999 | 37 | 10.6% |
| $150,000 to $199,999 | 0 | 0.0% |
| $200,000+ | 0 | 0.0% |
Family Income by Famaliy Size in Taft Southwest
3-person families (91 | 26.2%) account for the highest median family income in Taft Southwest with $79,861 per family, while 3-person families (91 | 26.2%) have the highest median income of $26,620 per family member.
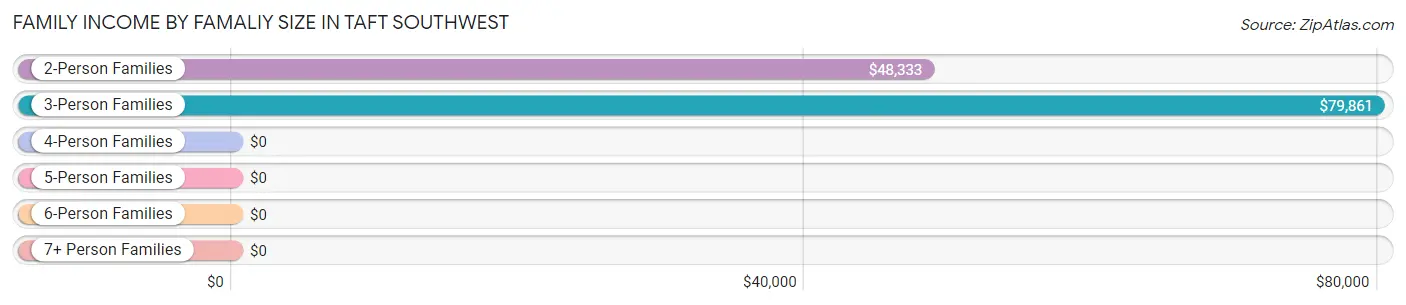
| Income Bracket | # Families | Median Income |
| 2-Person Families | 116 (33.3%) | $48,333 |
| 3-Person Families | 91 (26.2%) | $79,861 |
| 4-Person Families | 28 (8.1%) | $0 |
| 5-Person Families | 0 (0.0%) | $0 |
| 6-Person Families | 34 (9.8%) | $0 |
| 7+ Person Families | 79 (22.7%) | $0 |
| Total | 348 (100.0%) | $67,880 |
Family Income by Number of Earners in Taft Southwest
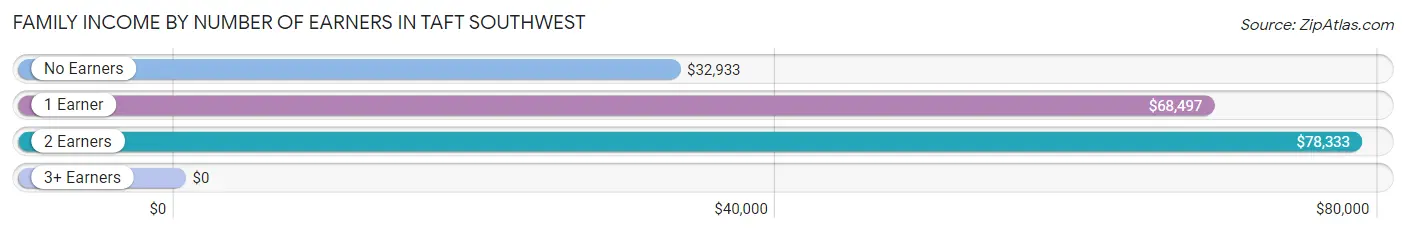
| Number of Earners | # Families | Median Income |
| No Earners | 73 (21.0%) | $32,933 |
| 1 Earner | 221 (63.5%) | $68,497 |
| 2 Earners | 54 (15.5%) | $78,333 |
| 3+ Earners | 0 (0.0%) | $0 |
| Total | 348 (100.0%) | $67,880 |
Household Income in Taft Southwest
Household Income Brackets in Taft Southwest
With 144 households falling in the category, the $50,000 to $74,999 income range is the most frequent in Taft Southwest, accounting for 30.2% of all households.
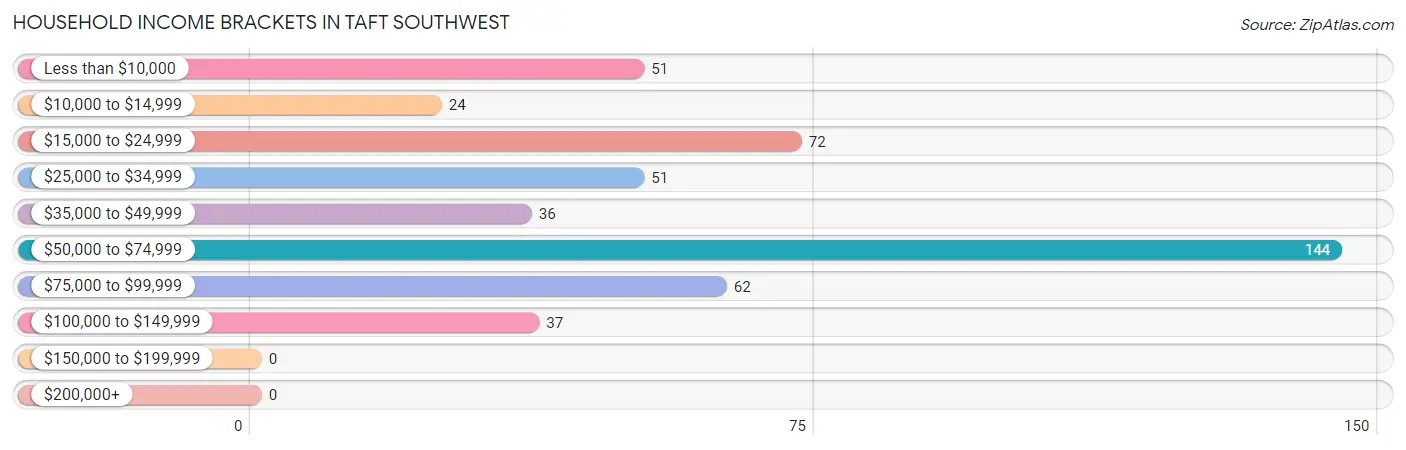
| Income Bracket | # Households | % Households |
| Less than $10,000 | 51 | 10.7% |
| $10,000 to $14,999 | 24 | 5.0% |
| $15,000 to $24,999 | 72 | 15.1% |
| $25,000 to $34,999 | 51 | 10.7% |
| $35,000 to $49,999 | 36 | 7.5% |
| $50,000 to $74,999 | 144 | 30.2% |
| $75,000 to $99,999 | 62 | 13.0% |
| $100,000 to $149,999 | 37 | 7.8% |
| $150,000 to $199,999 | 0 | 0.0% |
| $200,000+ | 0 | 0.0% |
Household Income by Householder Age in Taft Southwest
The median household income in Taft Southwest is $50,239, with the highest median household income of $68,481 found in the 25 to 44 years age bracket for the primary householder. A total of 152 households (31.9%) fall into this category.
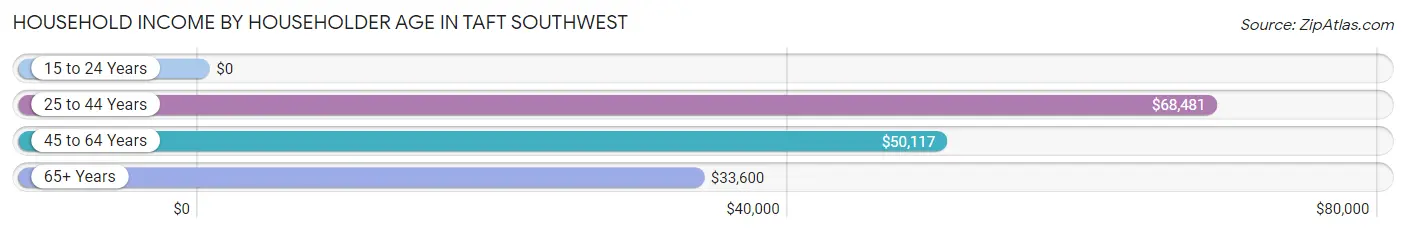
| Income Bracket | # Households | Median Income |
| 15 to 24 Years | 0 (0.0%) | $0 |
| 25 to 44 Years | 152 (31.9%) | $68,481 |
| 45 to 64 Years | 135 (28.3%) | $50,117 |
| 65+ Years | 190 (39.8%) | $33,600 |
| Total | 477 (100.0%) | $50,239 |
Poverty in Taft Southwest
Income Below Poverty by Sex and Age in Taft Southwest
With 12.9% poverty level for males and 9.1% for females among the residents of Taft Southwest, 65 to 74 year old males and 65 to 74 year old females are the most vulnerable to poverty, with 24 males (50.0%) and 27 females (36.0%) in their respective age groups living below the poverty level.
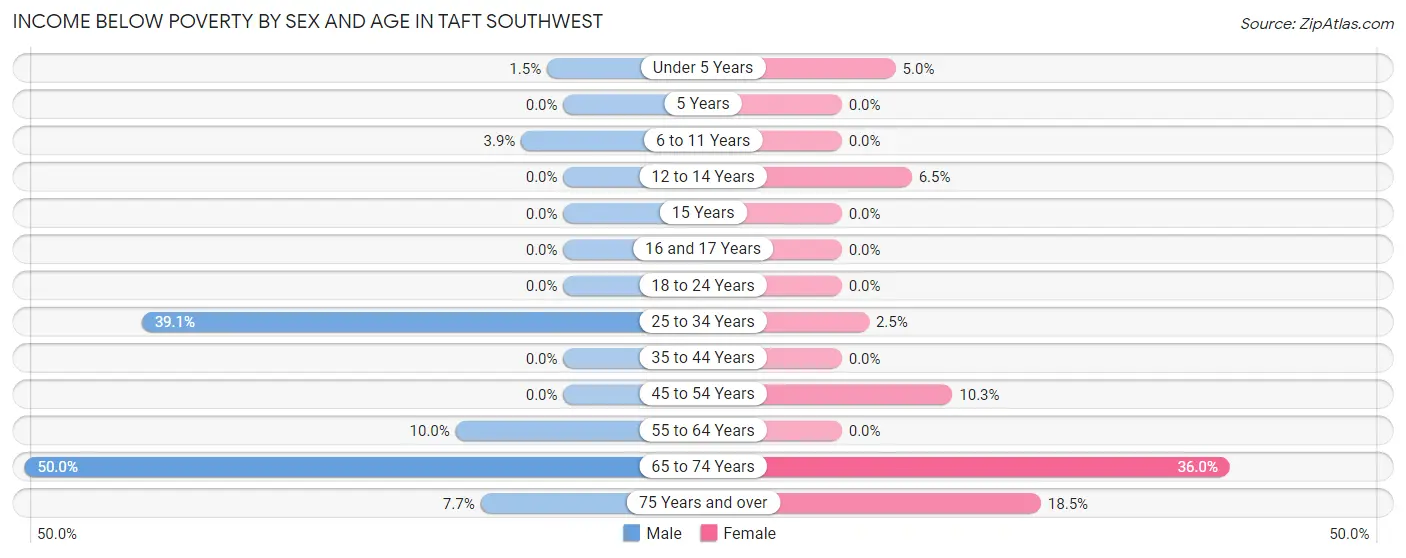
| Age Bracket | Male | Female |
| Under 5 Years | 2 (1.5%) | 1 (5.0%) |
| 5 Years | 0 (0.0%) | 0 (0.0%) |
| 6 to 11 Years | 5 (3.9%) | 0 (0.0%) |
| 12 to 14 Years | 0 (0.0%) | 5 (6.5%) |
| 15 Years | 0 (0.0%) | 0 (0.0%) |
| 16 and 17 Years | 0 (0.0%) | 0 (0.0%) |
| 18 to 24 Years | 0 (0.0%) | 0 (0.0%) |
| 25 to 34 Years | 45 (39.1%) | 4 (2.5%) |
| 35 to 44 Years | 0 (0.0%) | 0 (0.0%) |
| 45 to 54 Years | 0 (0.0%) | 8 (10.3%) |
| 55 to 64 Years | 15 (10.0%) | 0 (0.0%) |
| 65 to 74 Years | 24 (50.0%) | 27 (36.0%) |
| 75 Years and over | 10 (7.7%) | 17 (18.5%) |
| Total | 101 (12.9%) | 62 (9.1%) |
Income Above Poverty by Sex and Age in Taft Southwest
According to the poverty statistics in Taft Southwest, males aged 16 and 17 years and females aged 6 to 11 years are the age groups that are most secure financially, with 100.0% of males and 100.0% of females in these age groups living above the poverty line.
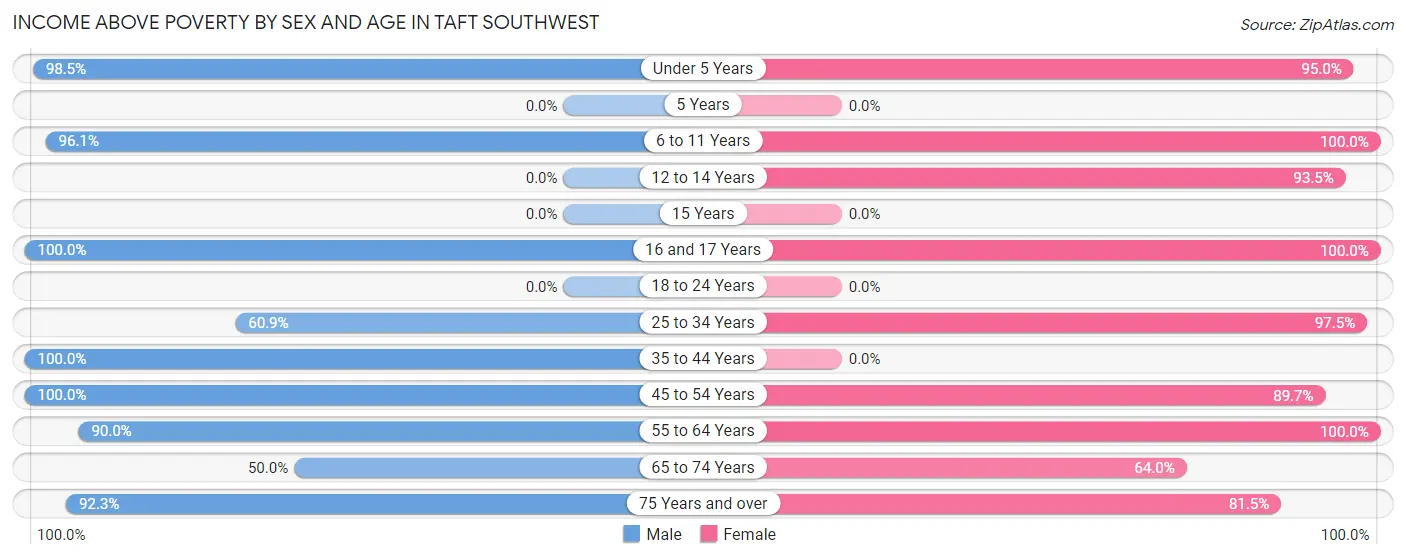
| Age Bracket | Male | Female |
| Under 5 Years | 130 (98.5%) | 19 (95.0%) |
| 5 Years | 0 (0.0%) | 0 (0.0%) |
| 6 to 11 Years | 123 (96.1%) | 98 (100.0%) |
| 12 to 14 Years | 0 (0.0%) | 72 (93.5%) |
| 15 Years | 0 (0.0%) | 0 (0.0%) |
| 16 and 17 Years | 15 (100.0%) | 13 (100.0%) |
| 18 to 24 Years | 0 (0.0%) | 0 (0.0%) |
| 25 to 34 Years | 70 (60.9%) | 155 (97.5%) |
| 35 to 44 Years | 28 (100.0%) | 0 (0.0%) |
| 45 to 54 Years | 40 (100.0%) | 70 (89.7%) |
| 55 to 64 Years | 135 (90.0%) | 70 (100.0%) |
| 65 to 74 Years | 24 (50.0%) | 48 (64.0%) |
| 75 Years and over | 120 (92.3%) | 75 (81.5%) |
| Total | 685 (87.2%) | 620 (90.9%) |
Income Below Poverty Among Married-Couple Families in Taft Southwest
The poverty statistics for married-couple families in Taft Southwest show that 19.0% or 30 of the total 158 families live below the poverty line. Families with 3 or 4 children have the highest poverty rate of 70.6%, comprising of 24 families. On the other hand, families with no children have the lowest poverty rate of 4.8%, which includes 6 families.
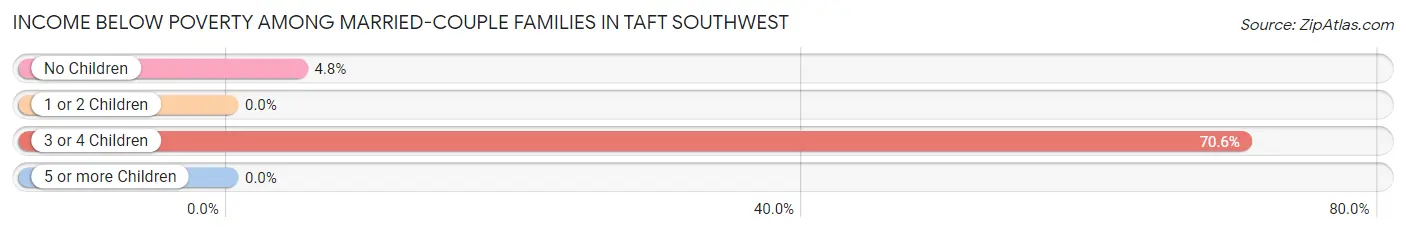
| Children | Above Poverty | Below Poverty |
| No Children | 118 (95.2%) | 6 (4.8%) |
| 1 or 2 Children | 0 (0.0%) | 0 (0.0%) |
| 3 or 4 Children | 10 (29.4%) | 24 (70.6%) |
| 5 or more Children | 0 (0.0%) | 0 (0.0%) |
| Total | 128 (81.0%) | 30 (19.0%) |
Income Below Poverty Among Single-Parent Households in Taft Southwest
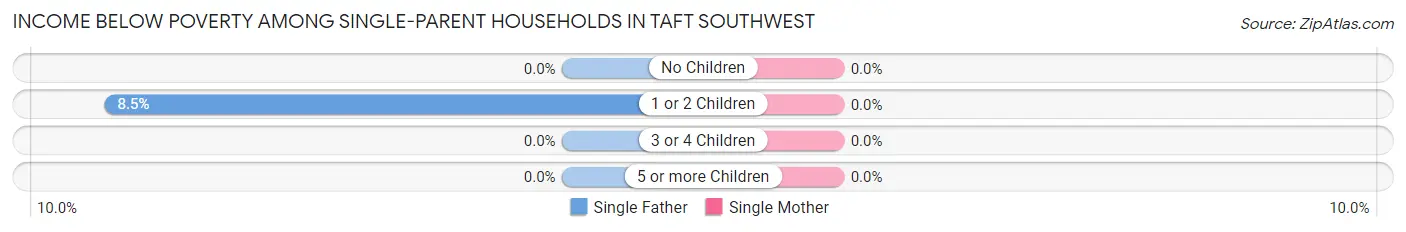
| Children | Single Father | Single Mother |
| No Children | 0 (0.0%) | 0 (0.0%) |
| 1 or 2 Children | 4 (8.5%) | 0 (0.0%) |
| 3 or 4 Children | 0 (0.0%) | 0 (0.0%) |
| 5 or more Children | 0 (0.0%) | 0 (0.0%) |
| Total | 4 (5.3%) | 0 (0.0%) |
Income Below Poverty Among Married-Couple vs Single-Parent Households in Taft Southwest
The poverty data for Taft Southwest shows that 30 of the married-couple family households (19.0%) and 4 of the single-parent households (2.1%) are living below the poverty level. Within the married-couple family households, those with 3 or 4 children have the highest poverty rate, with 24 households (70.6%) falling below the poverty line. Among the single-parent households, those with 1 or 2 children have the highest poverty rate, with 4 household (8.5%) living below poverty.
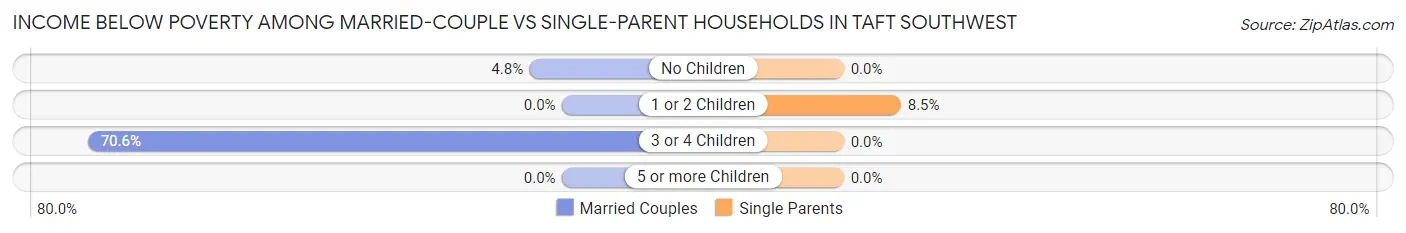
| Children | Married-Couple Families | Single-Parent Households |
| No Children | 6 (4.8%) | 0 (0.0%) |
| 1 or 2 Children | 0 (0.0%) | 4 (8.5%) |
| 3 or 4 Children | 24 (70.6%) | 0 (0.0%) |
| 5 or more Children | 0 (0.0%) | 0 (0.0%) |
| Total | 30 (19.0%) | 4 (2.1%) |
Race in Taft Southwest
The most populous races in Taft Southwest are Hispanic or Latino (1,430 | 97.4%), Two or more Races (975 | 66.4%), and White / Caucasian (410 | 27.9%).
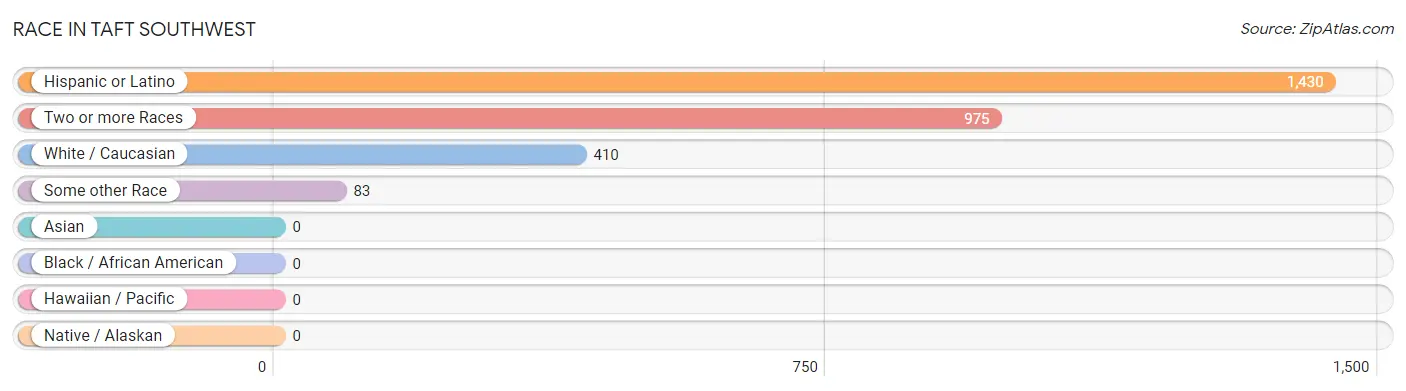
| Race | # Population | % Population |
| Asian | 0 | 0.0% |
| Black / African American | 0 | 0.0% |
| Hawaiian / Pacific | 0 | 0.0% |
| Hispanic or Latino | 1,430 | 97.4% |
| Native / Alaskan | 0 | 0.0% |
| White / Caucasian | 410 | 27.9% |
| Two or more Races | 975 | 66.4% |
| Some other Race | 83 | 5.7% |
| Total | 1,468 | 100.0% |
Ancestry in Taft Southwest
The most populous ancestries reported in Taft Southwest are Mexican (1,378 | 93.9%), and German (6 | 0.4%), together accounting for 94.3% of all Taft Southwest residents.
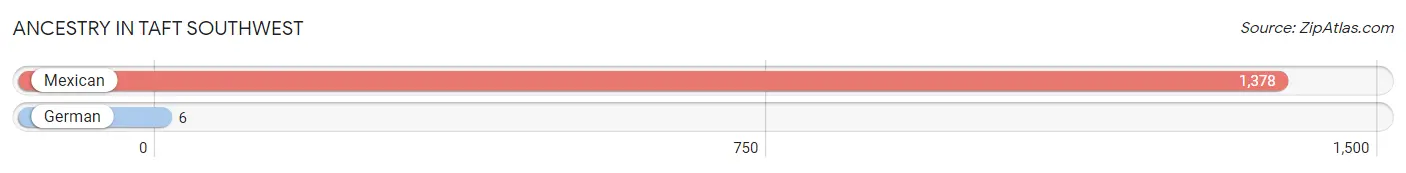
| Ancestry | # Population | % Population |
| German | 6 | 0.4% |
| Mexican | 1,378 | 93.9% | View All 2 Rows |
Immigrants in Taft Southwest

| Immigration Origin | # Population | % Population | View All 0 Rows |
Sex and Age in Taft Southwest
Sex and Age in Taft Southwest
The most populous age groups in Taft Southwest are Under 5 Years (132 | 16.8%) for men and 10 to 14 Years (135 | 19.8%) for women.
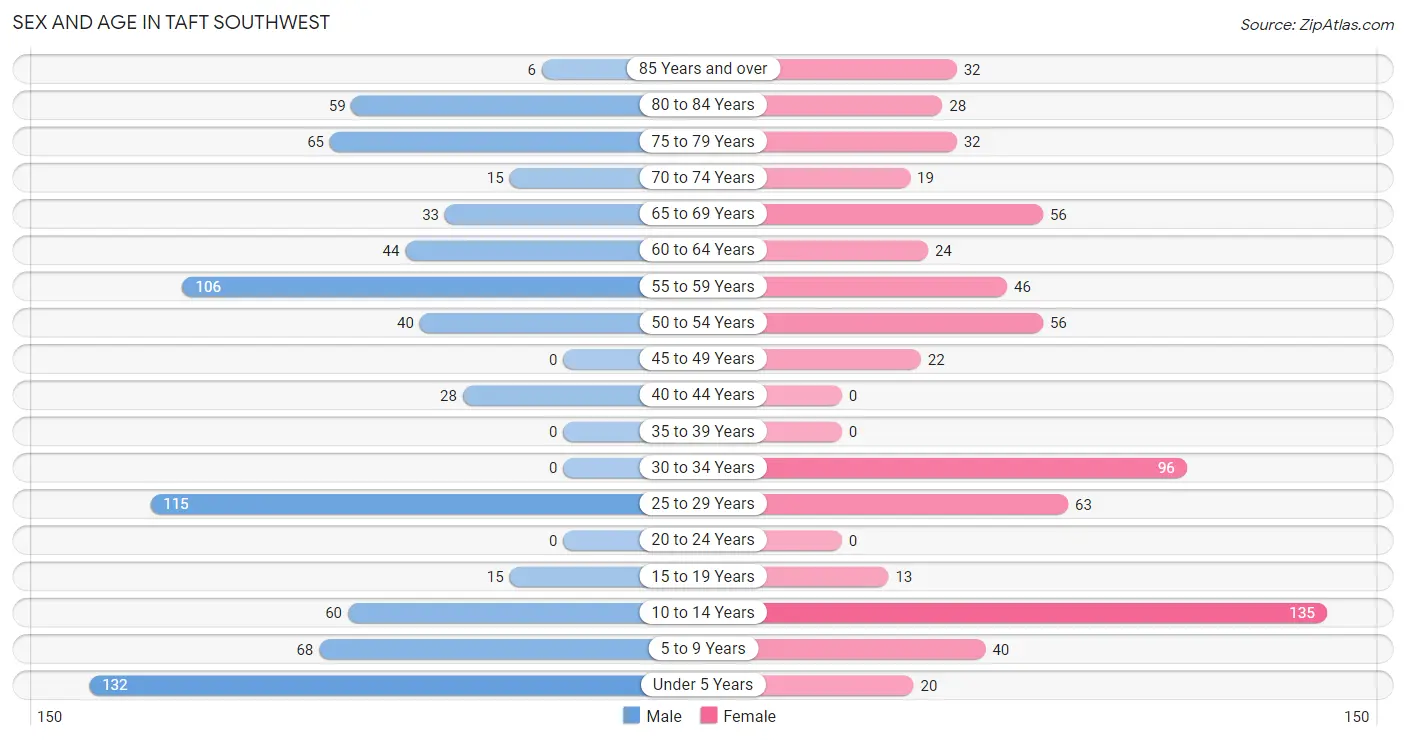
| Age Bracket | Male | Female |
| Under 5 Years | 132 (16.8%) | 20 (2.9%) |
| 5 to 9 Years | 68 (8.6%) | 40 (5.9%) |
| 10 to 14 Years | 60 (7.6%) | 135 (19.8%) |
| 15 to 19 Years | 15 (1.9%) | 13 (1.9%) |
| 20 to 24 Years | 0 (0.0%) | 0 (0.0%) |
| 25 to 29 Years | 115 (14.6%) | 63 (9.2%) |
| 30 to 34 Years | 0 (0.0%) | 96 (14.1%) |
| 35 to 39 Years | 0 (0.0%) | 0 (0.0%) |
| 40 to 44 Years | 28 (3.6%) | 0 (0.0%) |
| 45 to 49 Years | 0 (0.0%) | 22 (3.2%) |
| 50 to 54 Years | 40 (5.1%) | 56 (8.2%) |
| 55 to 59 Years | 106 (13.5%) | 46 (6.7%) |
| 60 to 64 Years | 44 (5.6%) | 24 (3.5%) |
| 65 to 69 Years | 33 (4.2%) | 56 (8.2%) |
| 70 to 74 Years | 15 (1.9%) | 19 (2.8%) |
| 75 to 79 Years | 65 (8.3%) | 32 (4.7%) |
| 80 to 84 Years | 59 (7.5%) | 28 (4.1%) |
| 85 Years and over | 6 (0.8%) | 32 (4.7%) |
| Total | 786 (100.0%) | 682 (100.0%) |
Families and Households in Taft Southwest
Median Family Size in Taft Southwest
The median family size in Taft Southwest is 3.85 persons per family, with single female/mother families (115 | 33.1%) accounting for the largest median family size of 5.2 persons per family. On the other hand, married-couple families (158 | 45.4%) represent the smallest median family size with 3.13 persons per family.
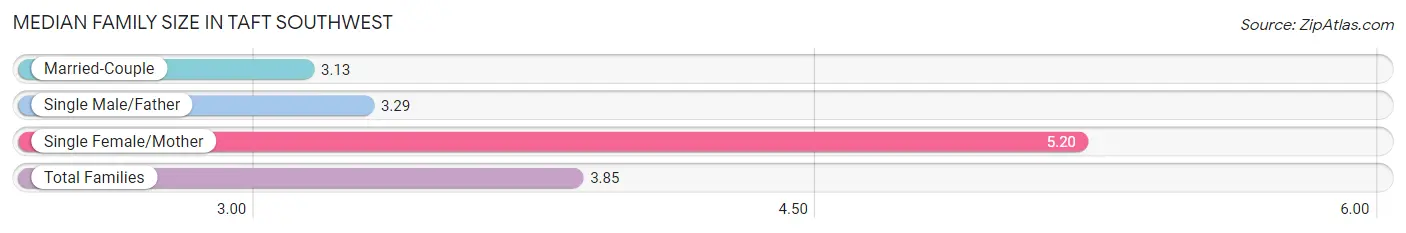
| Family Type | # Families | Family Size |
| Married-Couple | 158 (45.4%) | 3.13 |
| Single Male/Father | 75 (21.5%) | 3.29 |
| Single Female/Mother | 115 (33.1%) | 5.20 |
| Total Families | 348 (100.0%) | 3.85 |
Median Household Size in Taft Southwest
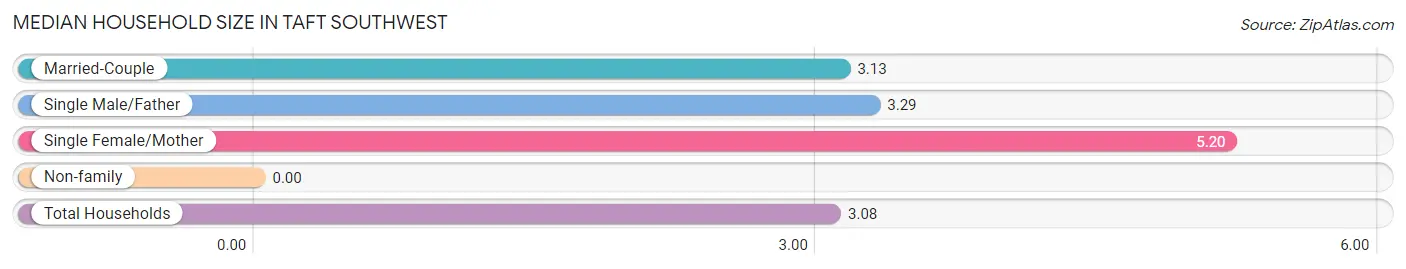
| Household Type | # Households | Household Size |
| Married-Couple | 158 (33.1%) | 3.13 |
| Single Male/Father | 75 (15.7%) | 3.29 |
| Single Female/Mother | 115 (24.1%) | 5.20 |
| Non-family | 129 (27.0%) | - |
| Total Households | 477 (100.0%) | 3.08 |
Household Size by Marriage Status in Taft Southwest
Out of a total of 477 households in Taft Southwest, 348 (73.0%) are family households, while 129 (27.0%) are nonfamily households. The most numerous type of family households are 2-person households, comprising 116, and the most common type of nonfamily households are 1-person households, comprising 129.
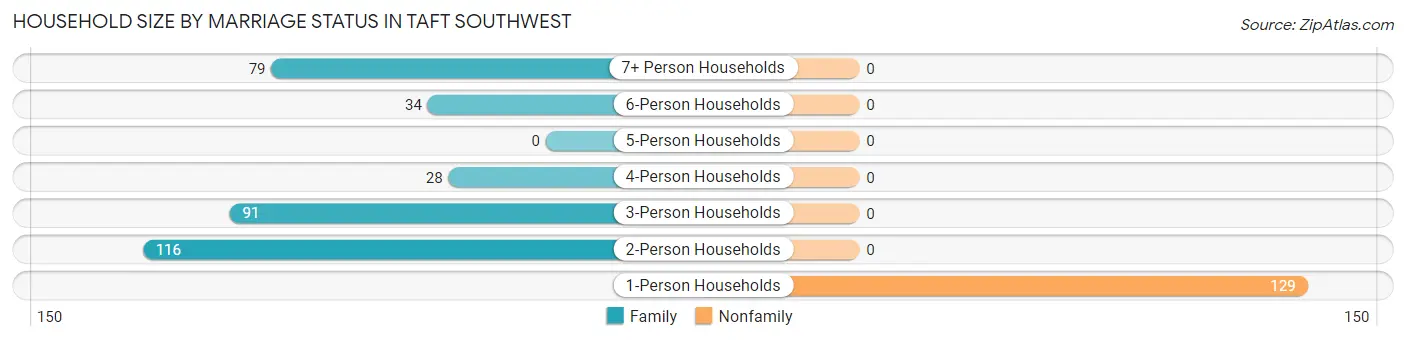
| Household Size | Family Households | Nonfamily Households |
| 1-Person Households | - | 129 (27.0%) |
| 2-Person Households | 116 (24.3%) | 0 (0.0%) |
| 3-Person Households | 91 (19.1%) | 0 (0.0%) |
| 4-Person Households | 28 (5.9%) | 0 (0.0%) |
| 5-Person Households | 0 (0.0%) | 0 (0.0%) |
| 6-Person Households | 34 (7.1%) | 0 (0.0%) |
| 7+ Person Households | 79 (16.6%) | 0 (0.0%) |
| Total | 348 (73.0%) | 129 (27.0%) |
Female Fertility in Taft Southwest
Fertility by Age in Taft Southwest
| Age Bracket | Women with Births | Births / 1,000 Women |
| 15 to 19 years | 0 (0.0%) | 0.0 |
| 20 to 34 years | 0 (0.0%) | 0.0 |
| 35 to 50 years | 0 (0.0%) | 0.0 |
| Total | 0 (0.0%) | 0.0 |
Fertility by Age by Marriage Status in Taft Southwest
| Age Bracket | Married | Unmarried |
| 15 to 19 years | 0 (0.0%) | 0 (0.0%) |
| 20 to 34 years | 0 (0.0%) | 0 (0.0%) |
| 35 to 50 years | 0 (0.0%) | 0 (0.0%) |
| Total | 0 (0.0%) | 0 (0.0%) |
Fertility by Education in Taft Southwest
| Educational Attainment | Women with Births | Births / 1,000 Women |
| Less than High School | 0 (0.0%) | 0.0 |
| High School Diploma | 0 (0.0%) | 0.0 |
| College or Associate's Degree | 0 (0.0%) | 0.0 |
| Bachelor's Degree | 0 (0.0%) | 0.0 |
| Graduate Degree | 0 (0.0%) | 0.0 |
| Total | 0 (0.0%) | 0.0 |
Fertility by Education by Marriage Status in Taft Southwest
| Educational Attainment | Married | Unmarried |
| Less than High School | 0 (0.0%) | 0 (0.0%) |
| High School Diploma | 0 (0.0%) | 0 (0.0%) |
| College or Associate's Degree | 0 (0.0%) | 0 (0.0%) |
| Bachelor's Degree | 0 (0.0%) | 0 (0.0%) |
| Graduate Degree | 0 (0.0%) | 0 (0.0%) |
| Total | 0 (0.0%) | 0 (0.0%) |
Employment Characteristics in Taft Southwest
Employment by Class of Employer in Taft Southwest
Among the 354 employed individuals in Taft Southwest, private company employees (197 | 55.6%), local government employees (86 | 24.3%), and self-employed (not incorporated) (43 | 12.1%) make up the most common classes of employment.
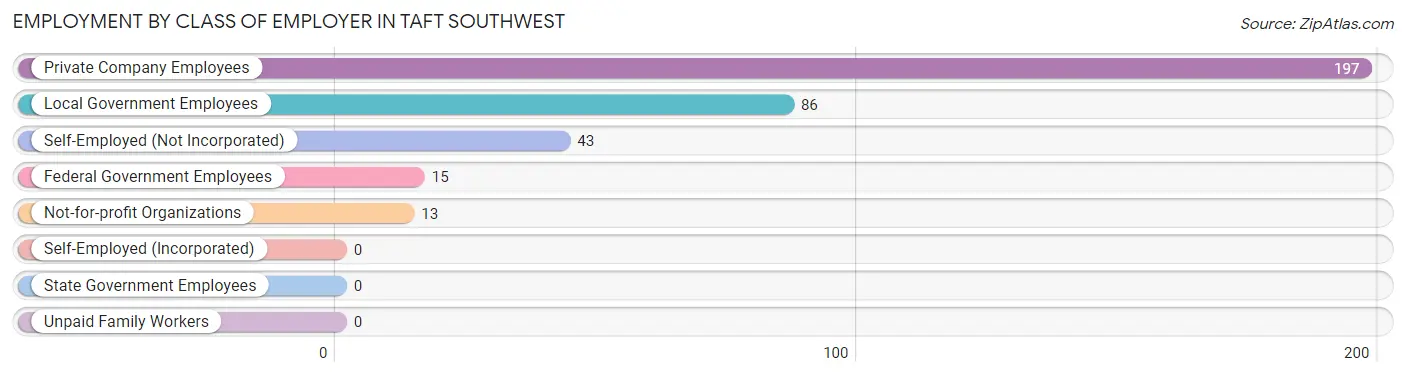
| Employer Class | # Employees | % Employees |
| Private Company Employees | 197 | 55.6% |
| Self-Employed (Incorporated) | 0 | 0.0% |
| Self-Employed (Not Incorporated) | 43 | 12.1% |
| Not-for-profit Organizations | 13 | 3.7% |
| Local Government Employees | 86 | 24.3% |
| State Government Employees | 0 | 0.0% |
| Federal Government Employees | 15 | 4.2% |
| Unpaid Family Workers | 0 | 0.0% |
| Total | 354 | 100.0% |
Employment Status by Age in Taft Southwest
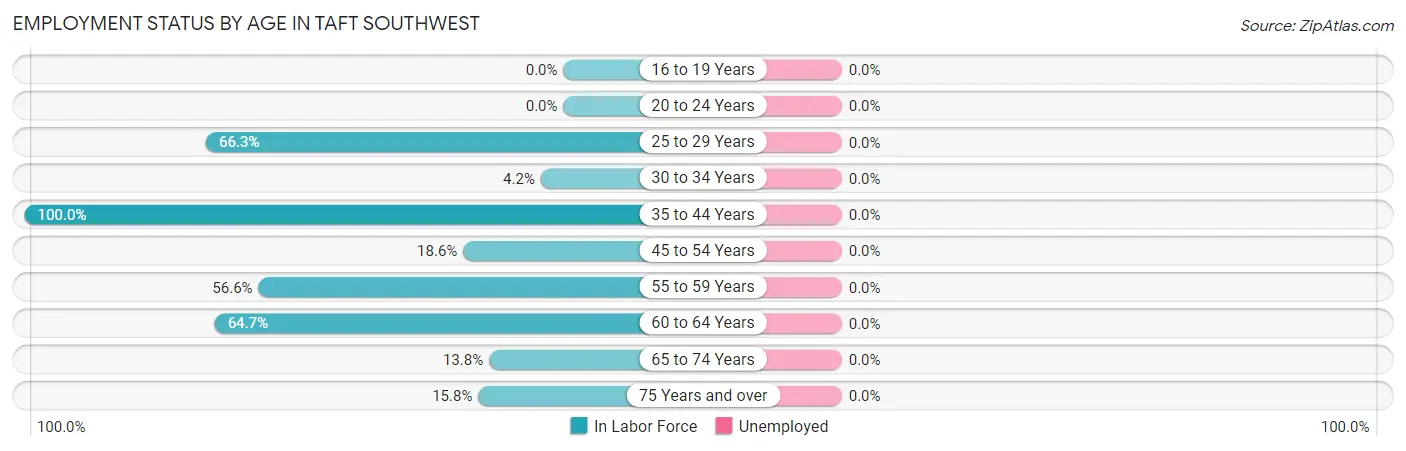
| Age Bracket | In Labor Force | Unemployed |
| 16 to 19 Years | 0 (0.0%) | 0 (0.0%) |
| 20 to 24 Years | 0 (0.0%) | 0 (0.0%) |
| 25 to 29 Years | 118 (66.3%) | 0 (0.0%) |
| 30 to 34 Years | 4 (4.2%) | 0 (0.0%) |
| 35 to 44 Years | 28 (100.0%) | 0 (0.0%) |
| 45 to 54 Years | 22 (18.6%) | 0 (0.0%) |
| 55 to 59 Years | 86 (56.6%) | 0 (0.0%) |
| 60 to 64 Years | 44 (64.7%) | 0 (0.0%) |
| 65 to 74 Years | 17 (13.8%) | 0 (0.0%) |
| 75 Years and over | 35 (15.8%) | 0 (0.0%) |
| Total | 354 (34.9%) | 0 (0.0%) |
Employment Status by Educational Attainment in Taft Southwest
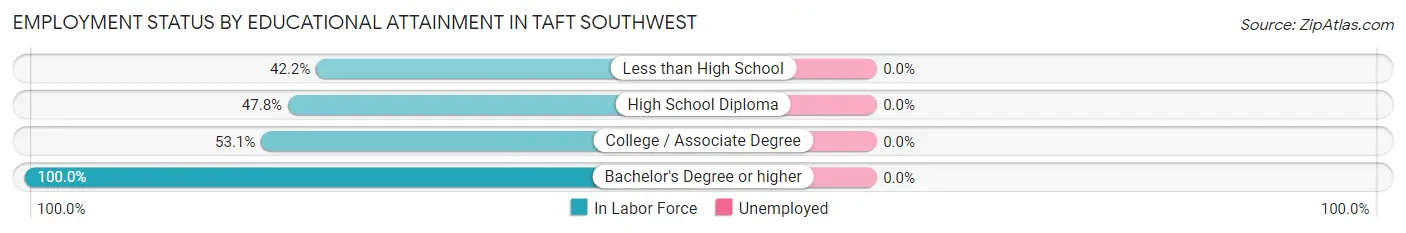
| Educational Attainment | In Labor Force | Unemployed |
| Less than High School | 97 (42.2%) | 0 (0.0%) |
| High School Diploma | 160 (47.8%) | 0 (0.0%) |
| College / Associate Degree | 34 (53.1%) | 0 (0.0%) |
| Bachelor's Degree or higher | 11 (100.0%) | 0 (0.0%) |
| Total | 302 (47.2%) | 0 (0.0%) |
Employment Occupations by Sex in Taft Southwest
Management, Business, Science and Arts Occupations
The most common Management, Business, Science and Arts occupations in Taft Southwest are Community & Social Service (21 | 5.9%), Education Instruction & Library (21 | 5.9%), Computers, Engineering & Science (8 | 2.3%), and Life, Physical & Social Science (8 | 2.3%).
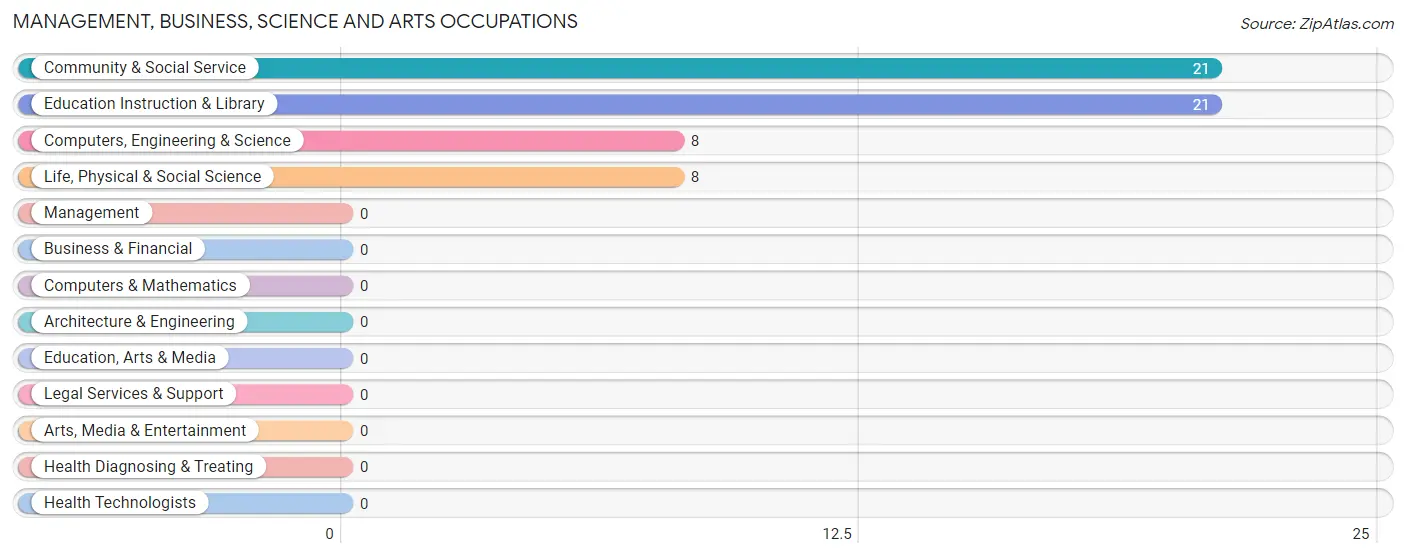
Management, Business, Science and Arts Occupations by Sex
Within the Management, Business, Science and Arts occupations in Taft Southwest, the most male-oriented occupations are Computers, Engineering & Science (100.0%), and Life, Physical & Social Science (100.0%), while the most female-oriented occupations are Community & Social Service (100.0%), and Education Instruction & Library (100.0%).
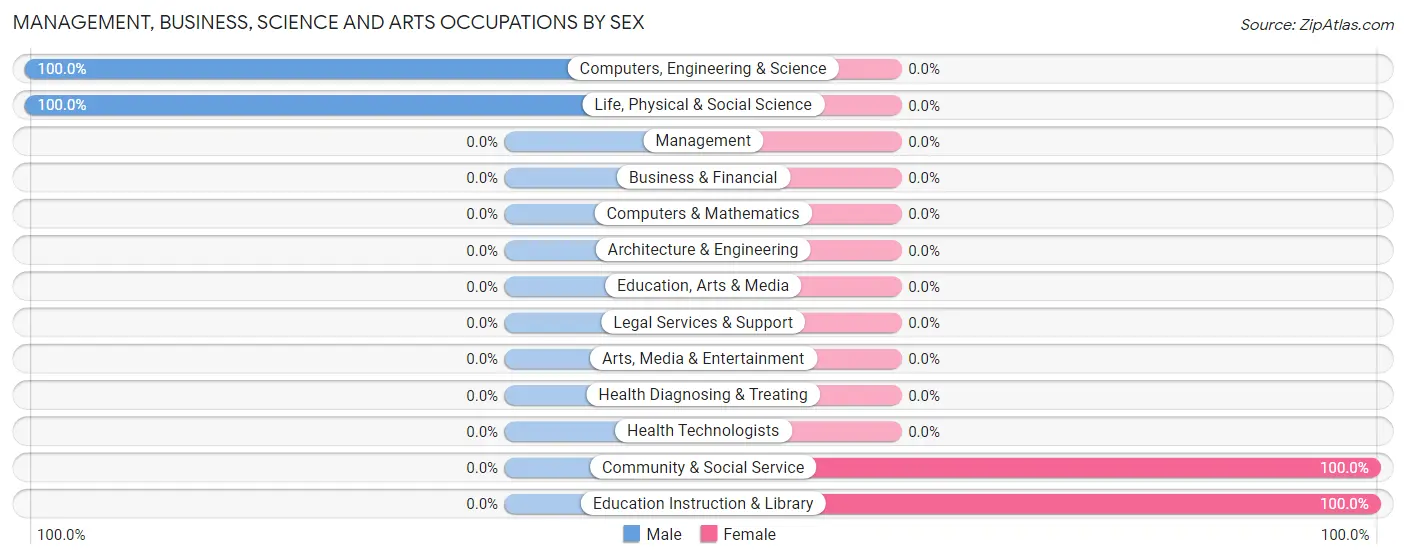
| Occupation | Male | Female |
| Management | 0 (0.0%) | 0 (0.0%) |
| Business & Financial | 0 (0.0%) | 0 (0.0%) |
| Computers, Engineering & Science | 8 (100.0%) | 0 (0.0%) |
| Computers & Mathematics | 0 (0.0%) | 0 (0.0%) |
| Architecture & Engineering | 0 (0.0%) | 0 (0.0%) |
| Life, Physical & Social Science | 8 (100.0%) | 0 (0.0%) |
| Community & Social Service | 0 (0.0%) | 21 (100.0%) |
| Education, Arts & Media | 0 (0.0%) | 0 (0.0%) |
| Legal Services & Support | 0 (0.0%) | 0 (0.0%) |
| Education Instruction & Library | 0 (0.0%) | 21 (100.0%) |
| Arts, Media & Entertainment | 0 (0.0%) | 0 (0.0%) |
| Health Diagnosing & Treating | 0 (0.0%) | 0 (0.0%) |
| Health Technologists | 0 (0.0%) | 0 (0.0%) |
| Total (Category) | 8 (27.6%) | 21 (72.4%) |
| Total (Overall) | 255 (72.0%) | 99 (28.0%) |
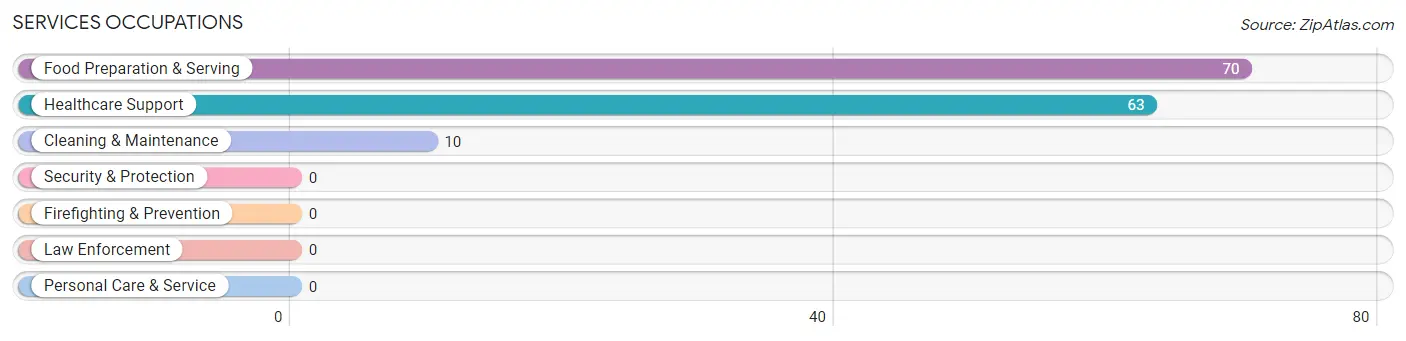
Services Occupations
The most common Services occupations in Taft Southwest are Food Preparation & Serving (70 | 19.8%), Healthcare Support (63 | 17.8%), and Cleaning & Maintenance (10 | 2.8%).
Services Occupations by Sex
Within the Services occupations in Taft Southwest, the most male-oriented occupations are Cleaning & Maintenance (100.0%), and Food Preparation & Serving (78.6%), while the most female-oriented occupations are Healthcare Support (100.0%), and Food Preparation & Serving (21.4%).
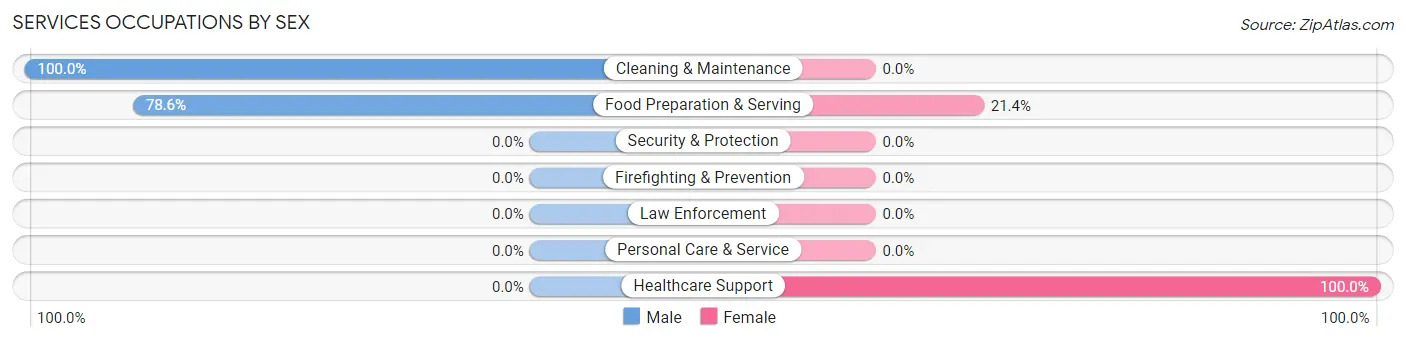
| Occupation | Male | Female |
| Healthcare Support | 0 (0.0%) | 63 (100.0%) |
| Security & Protection | 0 (0.0%) | 0 (0.0%) |
| Firefighting & Prevention | 0 (0.0%) | 0 (0.0%) |
| Law Enforcement | 0 (0.0%) | 0 (0.0%) |
| Food Preparation & Serving | 55 (78.6%) | 15 (21.4%) |
| Cleaning & Maintenance | 10 (100.0%) | 0 (0.0%) |
| Personal Care & Service | 0 (0.0%) | 0 (0.0%) |
| Total (Category) | 65 (45.5%) | 78 (54.5%) |
| Total (Overall) | 255 (72.0%) | 99 (28.0%) |
Sales and Office Occupations
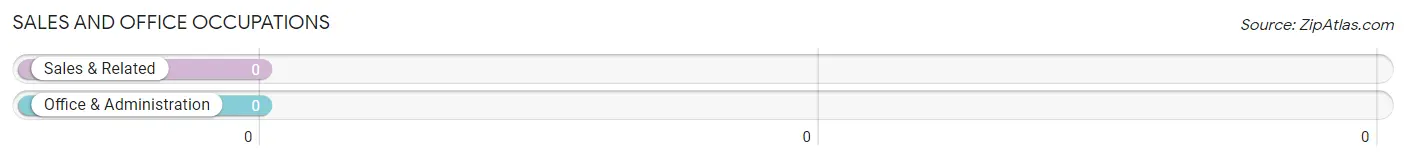
Sales and Office Occupations by Sex
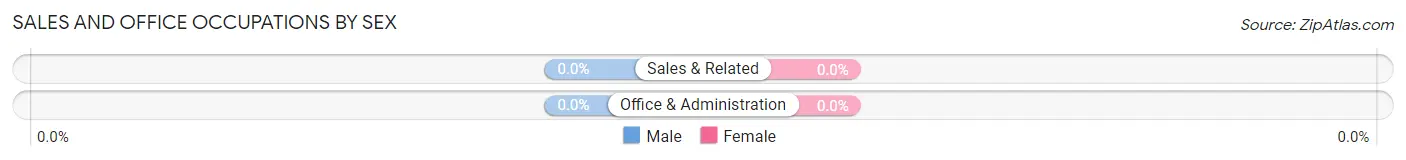
| Occupation | Male | Female |
| Sales & Related | 0 (0.0%) | 0 (0.0%) |
| Office & Administration | 0 (0.0%) | 0 (0.0%) |
| Total (Category) | 0 (0.0%) | 0 (0.0%) |
| Total (Overall) | 255 (72.0%) | 99 (28.0%) |
Natural Resources, Construction and Maintenance Occupations
The most common Natural Resources, Construction and Maintenance occupations in Taft Southwest are Construction & Extraction (59 | 16.7%), and Installation, Maintenance & Repair (41 | 11.6%).
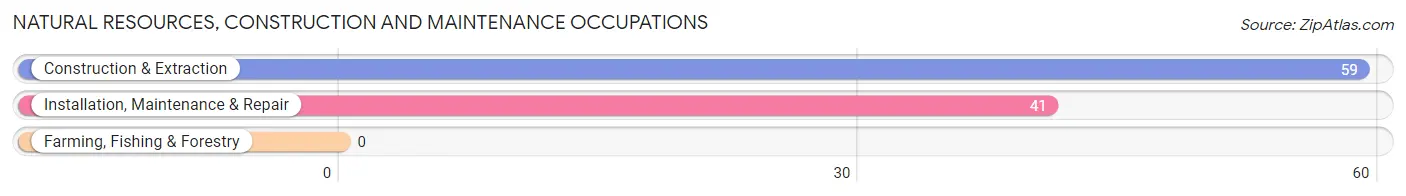
Natural Resources, Construction and Maintenance Occupations by Sex
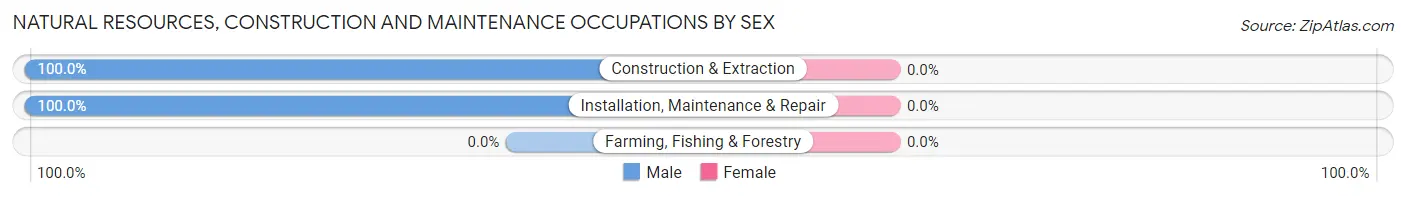
| Occupation | Male | Female |
| Farming, Fishing & Forestry | 0 (0.0%) | 0 (0.0%) |
| Construction & Extraction | 59 (100.0%) | 0 (0.0%) |
| Installation, Maintenance & Repair | 41 (100.0%) | 0 (0.0%) |
| Total (Category) | 100 (100.0%) | 0 (0.0%) |
| Total (Overall) | 255 (72.0%) | 99 (28.0%) |
Production, Transportation and Moving Occupations
The most common Production, Transportation and Moving occupations in Taft Southwest are Transportation (46 | 13.0%), and Production (36 | 10.2%).
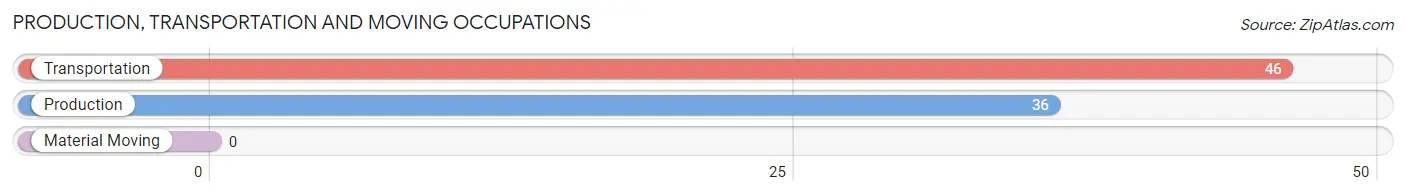
Production, Transportation and Moving Occupations by Sex
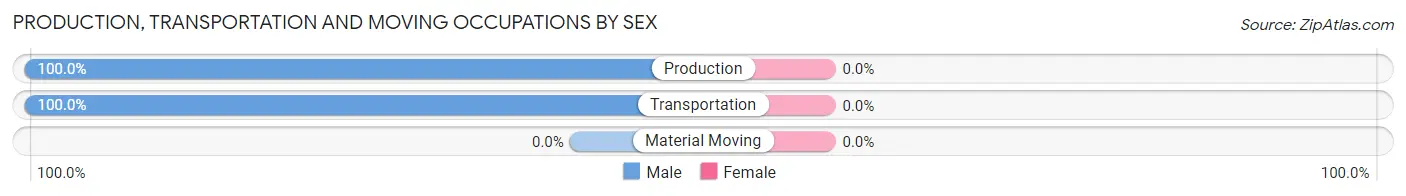
| Occupation | Male | Female |
| Production | 36 (100.0%) | 0 (0.0%) |
| Transportation | 46 (100.0%) | 0 (0.0%) |
| Material Moving | 0 (0.0%) | 0 (0.0%) |
| Total (Category) | 82 (100.0%) | 0 (0.0%) |
| Total (Overall) | 255 (72.0%) | 99 (28.0%) |
Employment Industries by Sex in Taft Southwest
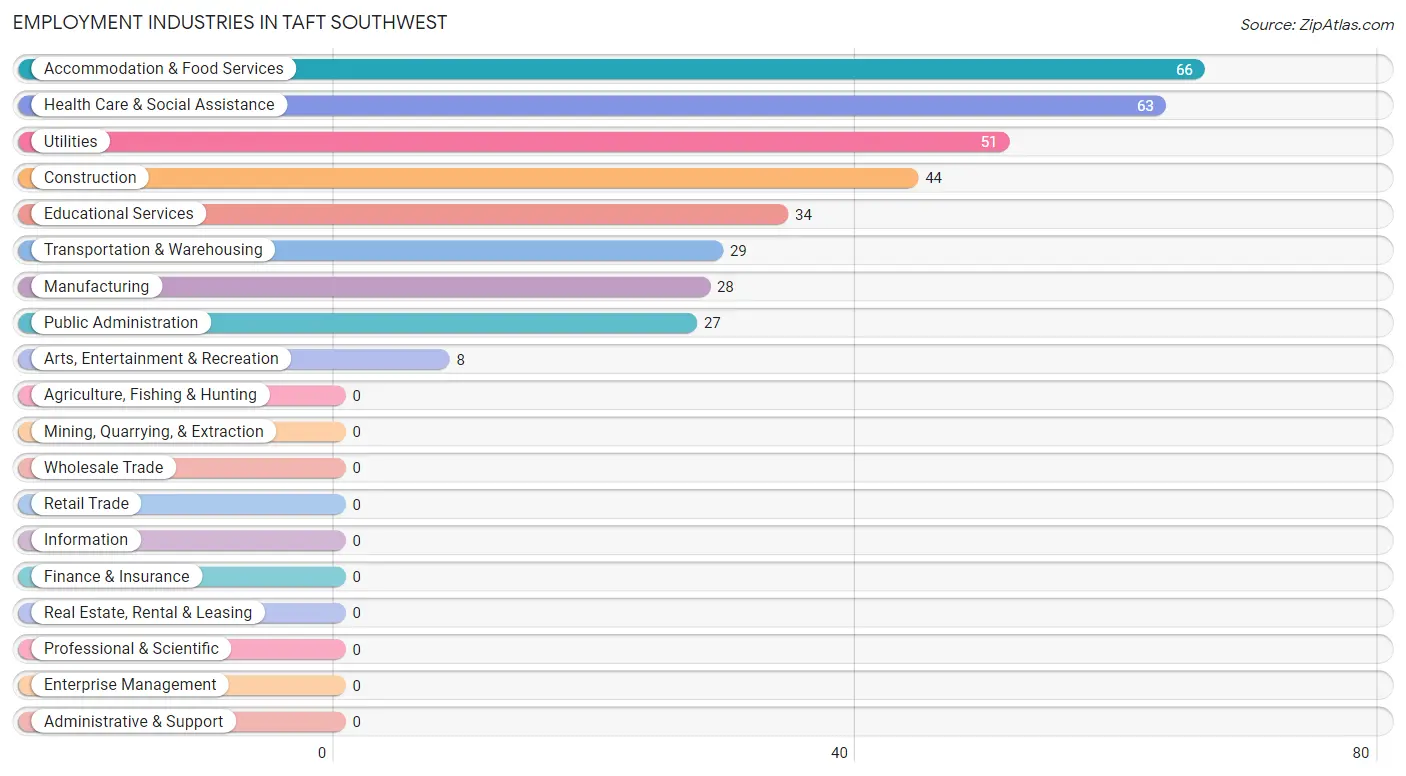
Employment Industries in Taft Southwest
The major employment industries in Taft Southwest include Accommodation & Food Services (66 | 18.6%), Health Care & Social Assistance (63 | 17.8%), Utilities (51 | 14.4%), Construction (44 | 12.4%), and Educational Services (34 | 9.6%).
Employment Industries by Sex in Taft Southwest
The Taft Southwest industries that see more men than women are Construction (100.0%), Manufacturing (100.0%), and Transportation & Warehousing (100.0%), whereas the industries that tend to have a higher number of women are Health Care & Social Assistance (100.0%), Educational Services (61.8%), and Accommodation & Food Services (16.7%).
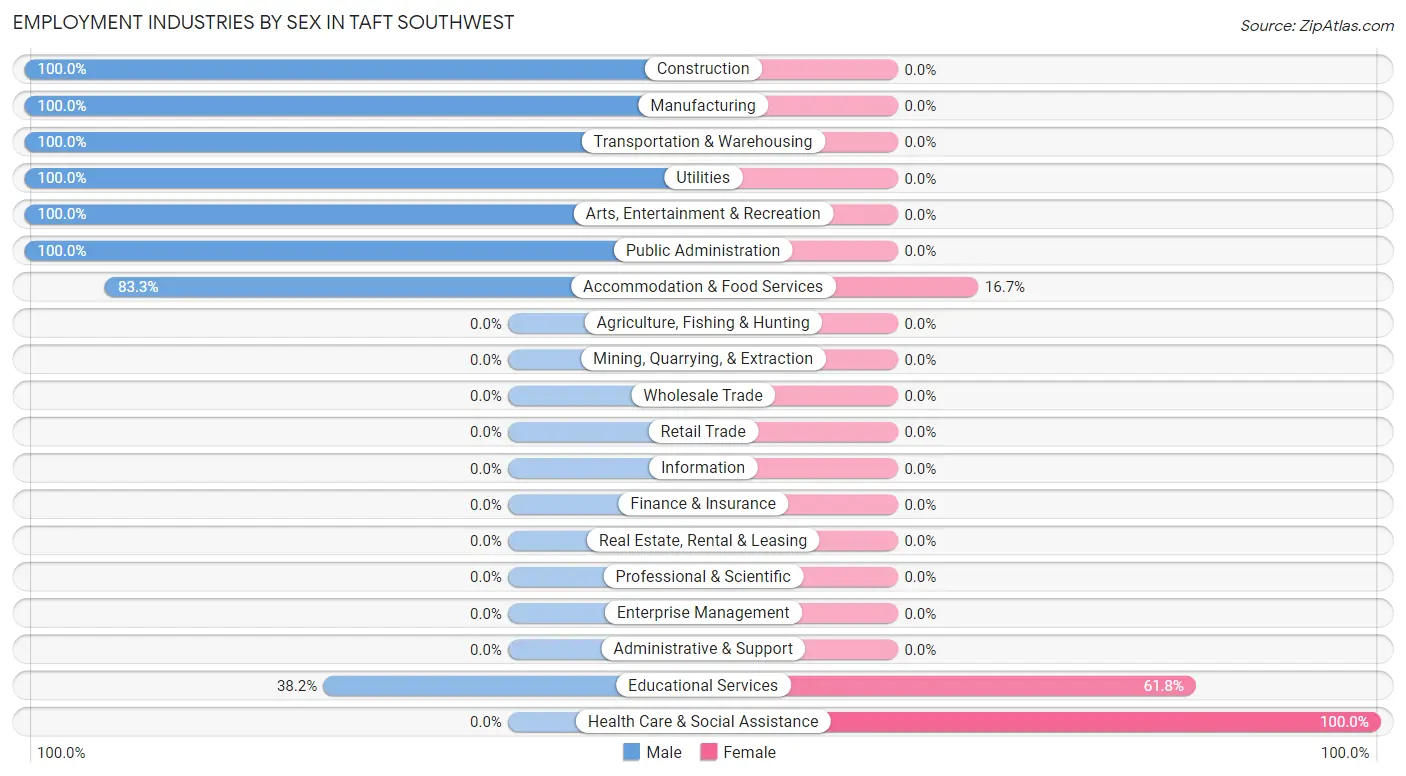
| Industry | Male | Female |
| Agriculture, Fishing & Hunting | 0 (0.0%) | 0 (0.0%) |
| Mining, Quarrying, & Extraction | 0 (0.0%) | 0 (0.0%) |
| Construction | 44 (100.0%) | 0 (0.0%) |
| Manufacturing | 28 (100.0%) | 0 (0.0%) |
| Wholesale Trade | 0 (0.0%) | 0 (0.0%) |
| Retail Trade | 0 (0.0%) | 0 (0.0%) |
| Transportation & Warehousing | 29 (100.0%) | 0 (0.0%) |
| Utilities | 51 (100.0%) | 0 (0.0%) |
| Information | 0 (0.0%) | 0 (0.0%) |
| Finance & Insurance | 0 (0.0%) | 0 (0.0%) |
| Real Estate, Rental & Leasing | 0 (0.0%) | 0 (0.0%) |
| Professional & Scientific | 0 (0.0%) | 0 (0.0%) |
| Enterprise Management | 0 (0.0%) | 0 (0.0%) |
| Administrative & Support | 0 (0.0%) | 0 (0.0%) |
| Educational Services | 13 (38.2%) | 21 (61.8%) |
| Health Care & Social Assistance | 0 (0.0%) | 63 (100.0%) |
| Arts, Entertainment & Recreation | 8 (100.0%) | 0 (0.0%) |
| Accommodation & Food Services | 55 (83.3%) | 11 (16.7%) |
| Public Administration | 27 (100.0%) | 0 (0.0%) |
| Total | 255 (72.0%) | 99 (28.0%) |
Education in Taft Southwest
School Enrollment in Taft Southwest
The most common levels of schooling among the 343 students in Taft Southwest are middle school (156 | 45.5%), elementary school (147 | 42.9%), and high school (28 | 8.2%).
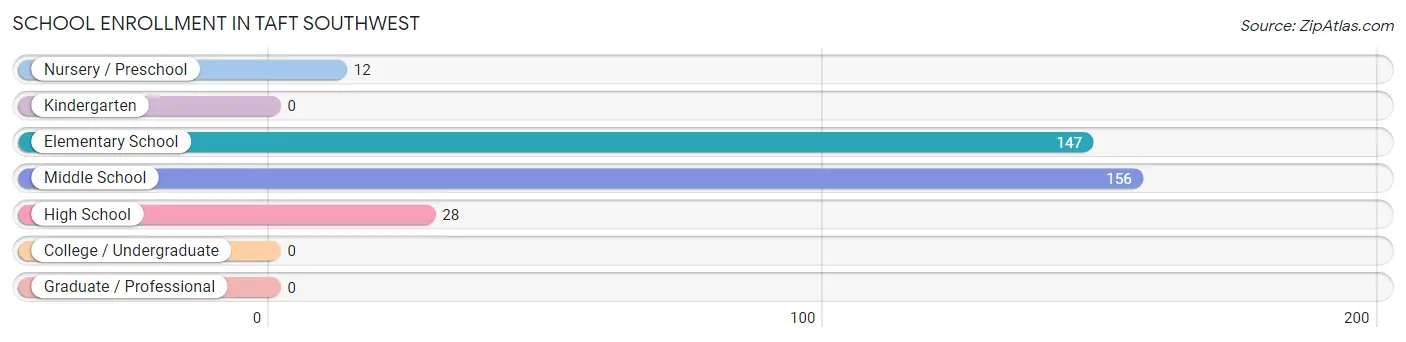
| School Level | # Students | % Students |
| Nursery / Preschool | 12 | 3.5% |
| Kindergarten | 0 | 0.0% |
| Elementary School | 147 | 42.9% |
| Middle School | 156 | 45.5% |
| High School | 28 | 8.2% |
| College / Undergraduate | 0 | 0.0% |
| Graduate / Professional | 0 | 0.0% |
| Total | 343 | 100.0% |
School Enrollment by Age by Funding Source in Taft Southwest
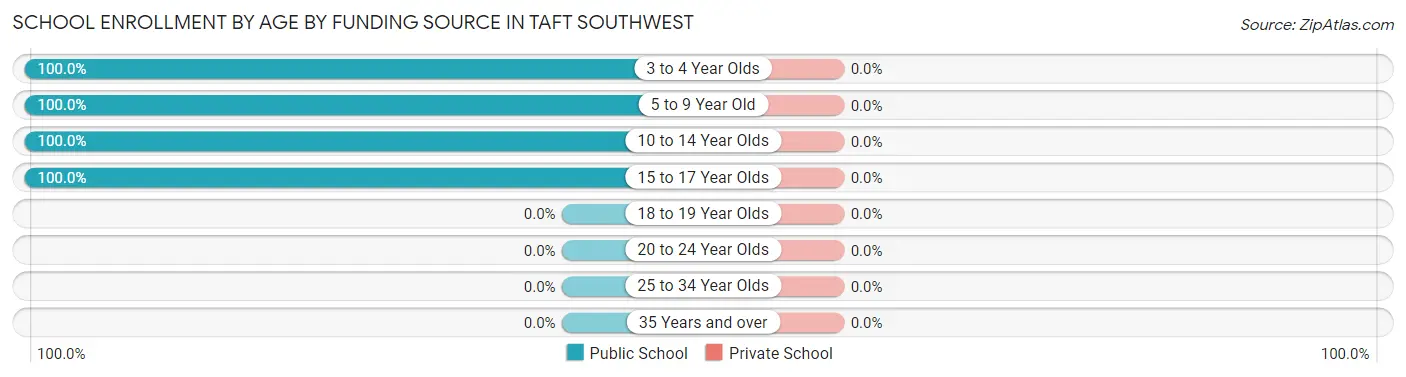
| Age Bracket | Public School | Private School |
| 3 to 4 Year Olds | 12 (100.0%) | 0 (0.0%) |
| 5 to 9 Year Old | 108 (100.0%) | 0 (0.0%) |
| 10 to 14 Year Olds | 195 (100.0%) | 0 (0.0%) |
| 15 to 17 Year Olds | 28 (100.0%) | 0 (0.0%) |
| 18 to 19 Year Olds | 0 (0.0%) | 0 (0.0%) |
| 20 to 24 Year Olds | 0 (0.0%) | 0 (0.0%) |
| 25 to 34 Year Olds | 0 (0.0%) | 0 (0.0%) |
| 35 Years and over | 0 (0.0%) | 0 (0.0%) |
| Total | 343 (100.0%) | 0 (0.0%) |
Educational Attainment by Field of Study in Taft Southwest
, and education (11 | 100.0%) are the most common fields of study among 11 individuals in Taft Southwest who have obtained a bachelor's degree or higher.
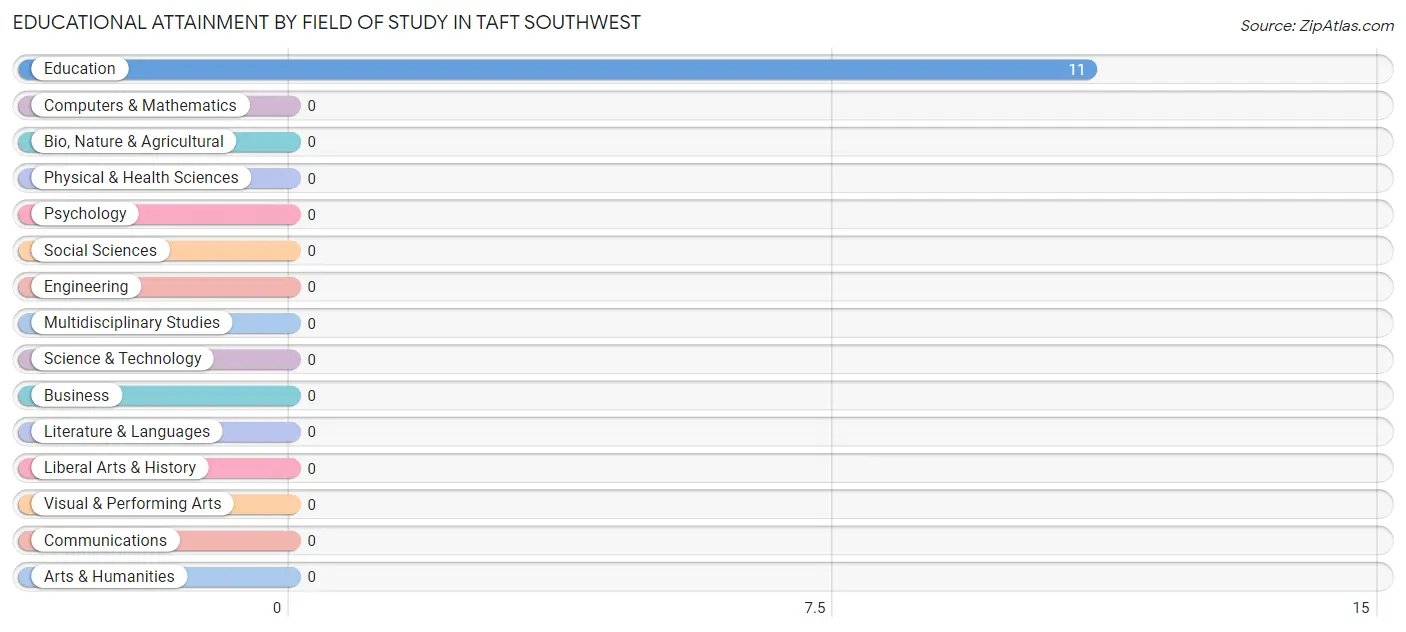
| Field of Study | # Graduates | % Graduates |
| Computers & Mathematics | 0 | 0.0% |
| Bio, Nature & Agricultural | 0 | 0.0% |
| Physical & Health Sciences | 0 | 0.0% |
| Psychology | 0 | 0.0% |
| Social Sciences | 0 | 0.0% |
| Engineering | 0 | 0.0% |
| Multidisciplinary Studies | 0 | 0.0% |
| Science & Technology | 0 | 0.0% |
| Business | 0 | 0.0% |
| Education | 11 | 100.0% |
| Literature & Languages | 0 | 0.0% |
| Liberal Arts & History | 0 | 0.0% |
| Visual & Performing Arts | 0 | 0.0% |
| Communications | 0 | 0.0% |
| Arts & Humanities | 0 | 0.0% |
| Total | 11 | 100.0% |
Transportation & Commute in Taft Southwest
Vehicle Availability by Sex in Taft Southwest
The most prevalent vehicle ownership categories in Taft Southwest are males with 2 vehicles (140, accounting for 54.9%) and females with 2 vehicles (85, making up 141.4%).
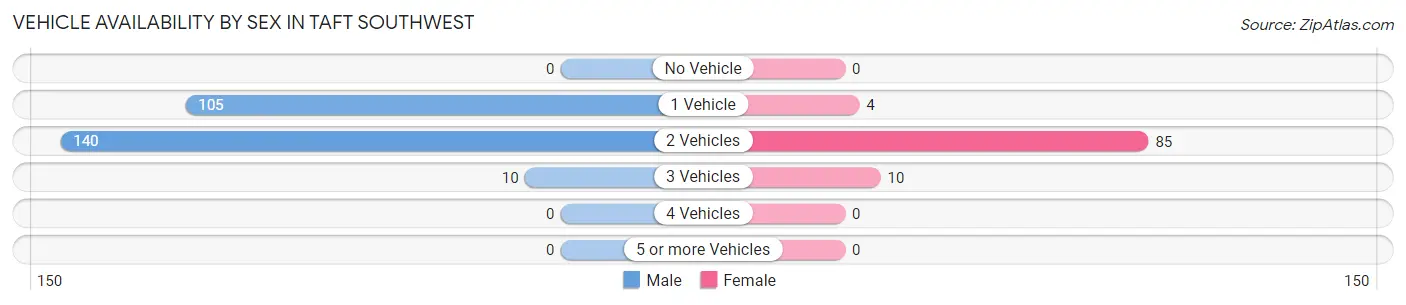
| Vehicles Available | Male | Female |
| No Vehicle | 0 (0.0%) | 0 (0.0%) |
| 1 Vehicle | 105 (41.2%) | 4 (4.0%) |
| 2 Vehicles | 140 (54.9%) | 85 (85.9%) |
| 3 Vehicles | 10 (3.9%) | 10 (10.1%) |
| 4 Vehicles | 0 (0.0%) | 0 (0.0%) |
| 5 or more Vehicles | 0 (0.0%) | 0 (0.0%) |
| Total | 255 (100.0%) | 99 (100.0%) |
Commute Time in Taft Southwest
The most frequently occuring commute durations in Taft Southwest are 30 to 34 minutes (100 commuters, 34.4%), 45 to 59 minutes (55 commuters, 18.9%), and 5 to 9 minutes (49 commuters, 16.8%).
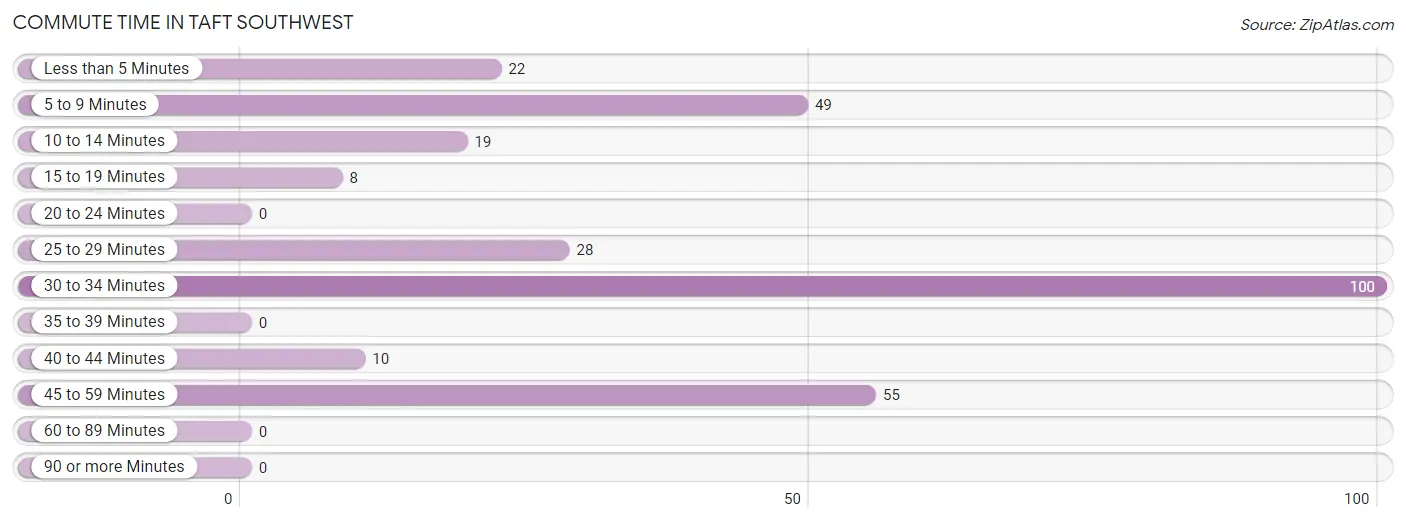
| Commute Time | # Commuters | % Commuters |
| Less than 5 Minutes | 22 | 7.6% |
| 5 to 9 Minutes | 49 | 16.8% |
| 10 to 14 Minutes | 19 | 6.5% |
| 15 to 19 Minutes | 8 | 2.8% |
| 20 to 24 Minutes | 0 | 0.0% |
| 25 to 29 Minutes | 28 | 9.6% |
| 30 to 34 Minutes | 100 | 34.4% |
| 35 to 39 Minutes | 0 | 0.0% |
| 40 to 44 Minutes | 10 | 3.4% |
| 45 to 59 Minutes | 55 | 18.9% |
| 60 to 89 Minutes | 0 | 0.0% |
| 90 or more Minutes | 0 | 0.0% |
Commute Time by Sex in Taft Southwest
The most common commute times in Taft Southwest are 30 to 34 minutes (100 commuters, 39.2%) for males and less than 5 minutes (22 commuters, 61.1%) for females.
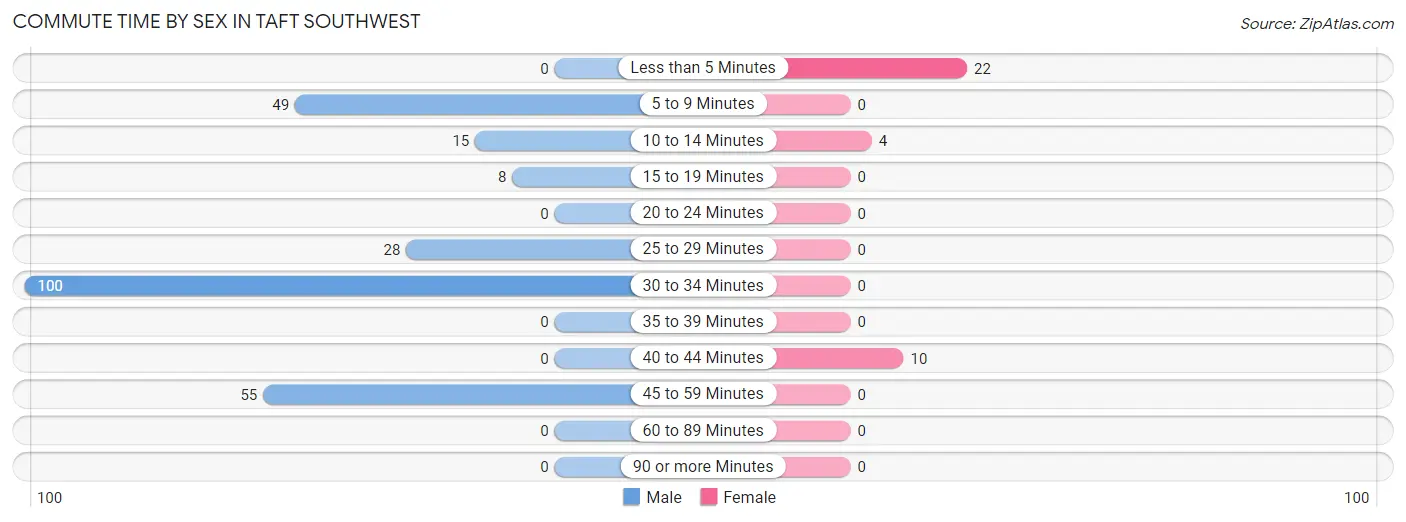
| Commute Time | Male | Female |
| Less than 5 Minutes | 0 (0.0%) | 22 (61.1%) |
| 5 to 9 Minutes | 49 (19.2%) | 0 (0.0%) |
| 10 to 14 Minutes | 15 (5.9%) | 4 (11.1%) |
| 15 to 19 Minutes | 8 (3.1%) | 0 (0.0%) |
| 20 to 24 Minutes | 0 (0.0%) | 0 (0.0%) |
| 25 to 29 Minutes | 28 (11.0%) | 0 (0.0%) |
| 30 to 34 Minutes | 100 (39.2%) | 0 (0.0%) |
| 35 to 39 Minutes | 0 (0.0%) | 0 (0.0%) |
| 40 to 44 Minutes | 0 (0.0%) | 10 (27.8%) |
| 45 to 59 Minutes | 55 (21.6%) | 0 (0.0%) |
| 60 to 89 Minutes | 0 (0.0%) | 0 (0.0%) |
| 90 or more Minutes | 0 (0.0%) | 0 (0.0%) |
Time of Departure to Work by Sex in Taft Southwest
The most frequent times of departure to work in Taft Southwest are 7:00 AM to 7:29 AM (98, 38.4%) for males and 7:00 AM to 7:29 AM (36, 100.0%) for females.
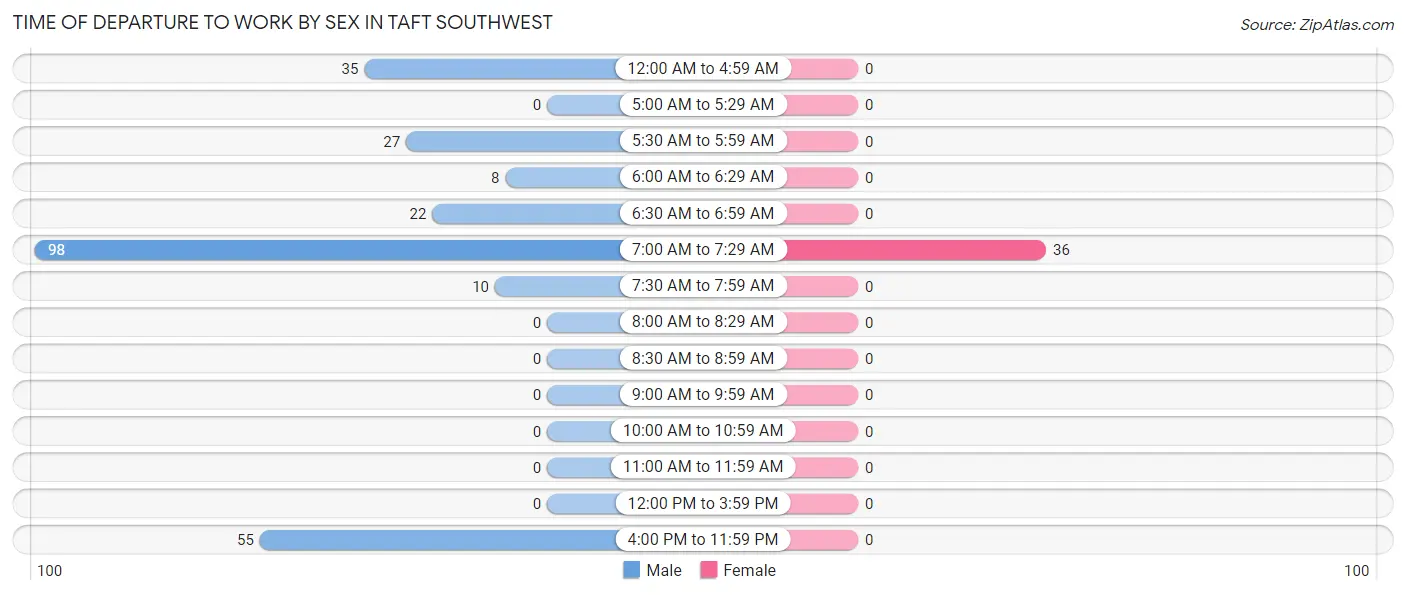
| Time of Departure | Male | Female |
| 12:00 AM to 4:59 AM | 35 (13.7%) | 0 (0.0%) |
| 5:00 AM to 5:29 AM | 0 (0.0%) | 0 (0.0%) |
| 5:30 AM to 5:59 AM | 27 (10.6%) | 0 (0.0%) |
| 6:00 AM to 6:29 AM | 8 (3.1%) | 0 (0.0%) |
| 6:30 AM to 6:59 AM | 22 (8.6%) | 0 (0.0%) |
| 7:00 AM to 7:29 AM | 98 (38.4%) | 36 (100.0%) |
| 7:30 AM to 7:59 AM | 10 (3.9%) | 0 (0.0%) |
| 8:00 AM to 8:29 AM | 0 (0.0%) | 0 (0.0%) |
| 8:30 AM to 8:59 AM | 0 (0.0%) | 0 (0.0%) |
| 9:00 AM to 9:59 AM | 0 (0.0%) | 0 (0.0%) |
| 10:00 AM to 10:59 AM | 0 (0.0%) | 0 (0.0%) |
| 11:00 AM to 11:59 AM | 0 (0.0%) | 0 (0.0%) |
| 12:00 PM to 3:59 PM | 0 (0.0%) | 0 (0.0%) |
| 4:00 PM to 11:59 PM | 55 (21.6%) | 0 (0.0%) |
| Total | 255 (100.0%) | 36 (100.0%) |
Housing Occupancy in Taft Southwest
Occupancy by Ownership in Taft Southwest
Of the total 477 dwellings in Taft Southwest, owner-occupied units account for 299 (62.7%), while renter-occupied units make up 178 (37.3%).
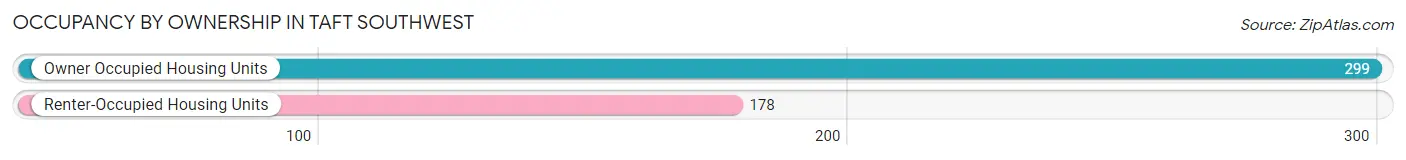
| Occupancy | # Housing Units | % Housing Units |
| Owner Occupied Housing Units | 299 | 62.7% |
| Renter-Occupied Housing Units | 178 | 37.3% |
| Total Occupied Housing Units | 477 | 100.0% |
Occupancy by Household Size in Taft Southwest
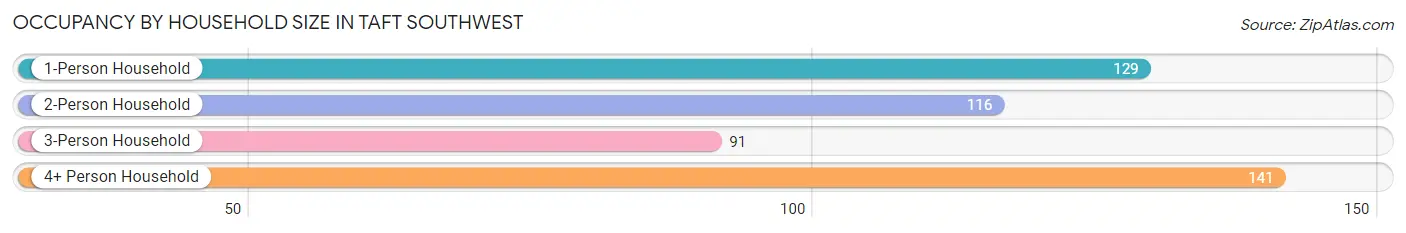
| Household Size | # Housing Units | % Housing Units |
| 1-Person Household | 129 | 27.0% |
| 2-Person Household | 116 | 24.3% |
| 3-Person Household | 91 | 19.1% |
| 4+ Person Household | 141 | 29.6% |
| Total Housing Units | 477 | 100.0% |
Occupancy by Ownership by Household Size in Taft Southwest
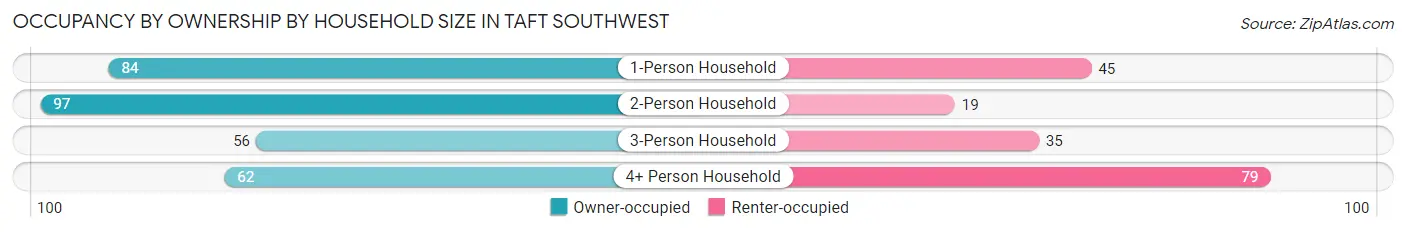
| Household Size | Owner-occupied | Renter-occupied |
| 1-Person Household | 84 (65.1%) | 45 (34.9%) |
| 2-Person Household | 97 (83.6%) | 19 (16.4%) |
| 3-Person Household | 56 (61.5%) | 35 (38.5%) |
| 4+ Person Household | 62 (44.0%) | 79 (56.0%) |
| Total Housing Units | 299 (62.7%) | 178 (37.3%) |
Occupancy by Educational Attainment in Taft Southwest
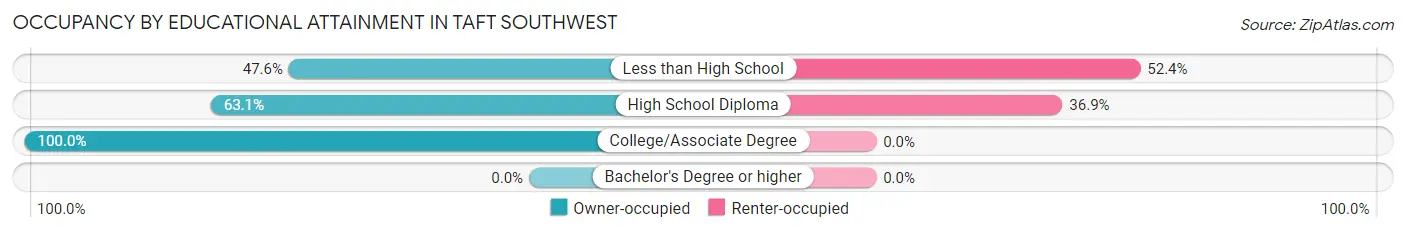
| Household Size | Owner-occupied | Renter-occupied |
| Less than High School | 90 (47.6%) | 99 (52.4%) |
| High School Diploma | 135 (63.1%) | 79 (36.9%) |
| College/Associate Degree | 74 (100.0%) | 0 (0.0%) |
| Bachelor's Degree or higher | 0 (0.0%) | 0 (0.0%) |
Occupancy by Age of Householder in Taft Southwest
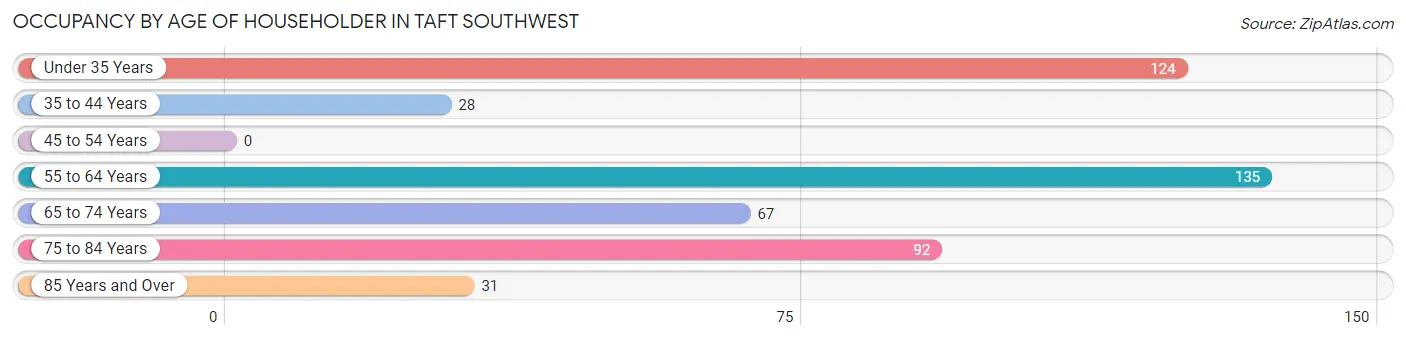
| Age Bracket | # Households | % Households |
| Under 35 Years | 124 | 26.0% |
| 35 to 44 Years | 28 | 5.9% |
| 45 to 54 Years | 0 | 0.0% |
| 55 to 64 Years | 135 | 28.3% |
| 65 to 74 Years | 67 | 14.1% |
| 75 to 84 Years | 92 | 19.3% |
| 85 Years and Over | 31 | 6.5% |
| Total | 477 | 100.0% |
Housing Finances in Taft Southwest
Median Income by Occupancy in Taft Southwest
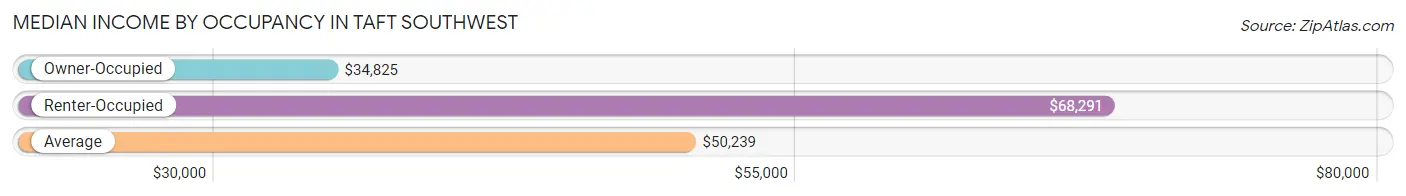
| Occupancy Type | # Households | Median Income |
| Owner-Occupied | 299 (62.7%) | $34,825 |
| Renter-Occupied | 178 (37.3%) | $68,291 |
| Average | 477 (100.0%) | $50,239 |
Occupancy by Householder Income Bracket in Taft Southwest
| Income Bracket | Owner-occupied | Renter-occupied |
| Less than $5,000 | 0 (0.0%) | 45 (25.3%) |
| $5,000 to $9,999 | 6 (2.0%) | 0 (0.0%) |
| $10,000 to $14,999 | 24 (8.0%) | 0 (0.0%) |
| $15,000 to $19,999 | 36 (12.0%) | 0 (0.0%) |
| $20,000 to $24,999 | 36 (12.0%) | 0 (0.0%) |
| $25,000 to $34,999 | 51 (17.1%) | 0 (0.0%) |
| $35,000 to $49,999 | 36 (12.0%) | 0 (0.0%) |
| $50,000 to $74,999 | 46 (15.4%) | 98 (55.1%) |
| $75,000 to $99,999 | 27 (9.0%) | 35 (19.7%) |
| $100,000 to $149,999 | 37 (12.4%) | 0 (0.0%) |
| $150,000 or more | 0 (0.0%) | 0 (0.0%) |
| Total | 299 (100.0%) | 178 (100.0%) |
Monthly Housing Cost Tiers in Taft Southwest
| Monthly Cost | Owner-occupied | Renter-occupied |
| Less than $300 | 66 (22.1%) | 0 (0.0%) |
| $300 to $499 | 86 (28.8%) | 0 (0.0%) |
| $500 to $799 | 56 (18.7%) | 0 (0.0%) |
| $800 to $999 | 36 (12.0%) | 54 (30.3%) |
| $1,000 to $1,499 | 28 (9.4%) | 79 (44.4%) |
| $1,500 to $1,999 | 0 (0.0%) | 0 (0.0%) |
| $2,000 to $2,499 | 0 (0.0%) | 0 (0.0%) |
| $2,500 to $2,999 | 0 (0.0%) | 0 (0.0%) |
| $3,000 or more | 27 (9.0%) | 0 (0.0%) |
| Total | 299 (100.0%) | 178 (100.0%) |
Physical Housing Characteristics in Taft Southwest
Housing Structures in Taft Southwest
| Structure Type | # Housing Units | % Housing Units |
| Single Unit, Detached | 379 | 79.4% |
| Single Unit, Attached | 0 | 0.0% |
| 2 Unit Apartments | 0 | 0.0% |
| 3 or 4 Unit Apartments | 0 | 0.0% |
| 5 to 9 Unit Apartments | 0 | 0.0% |
| 10 or more Apartments | 0 | 0.0% |
| Mobile Home / Other | 98 | 20.5% |
| Total | 477 | 100.0% |
Housing Structures by Occupancy in Taft Southwest
| Structure Type | Owner-occupied | Renter-occupied |
| Single Unit, Detached | 236 (62.3%) | 143 (37.7%) |
| Single Unit, Attached | 0 (0.0%) | 0 (0.0%) |
| 2 Unit Apartments | 0 (0.0%) | 0 (0.0%) |
| 3 or 4 Unit Apartments | 0 (0.0%) | 0 (0.0%) |
| 5 to 9 Unit Apartments | 0 (0.0%) | 0 (0.0%) |
| 10 or more Apartments | 0 (0.0%) | 0 (0.0%) |
| Mobile Home / Other | 63 (64.3%) | 35 (35.7%) |
| Total | 299 (62.7%) | 178 (37.3%) |
Housing Structures by Number of Rooms in Taft Southwest
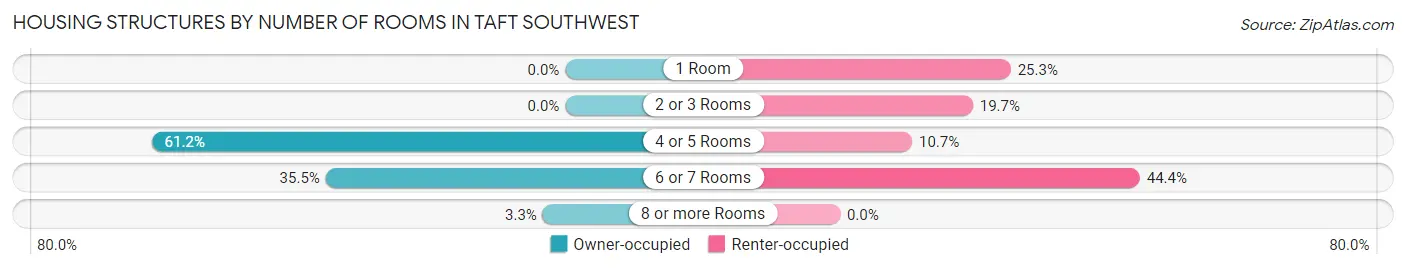
| Number of Rooms | Owner-occupied | Renter-occupied |
| 1 Room | 0 (0.0%) | 45 (25.3%) |
| 2 or 3 Rooms | 0 (0.0%) | 35 (19.7%) |
| 4 or 5 Rooms | 183 (61.2%) | 19 (10.7%) |
| 6 or 7 Rooms | 106 (35.4%) | 79 (44.4%) |
| 8 or more Rooms | 10 (3.3%) | 0 (0.0%) |
| Total | 299 (100.0%) | 178 (100.0%) |
Housing Structure by Heating Type in Taft Southwest
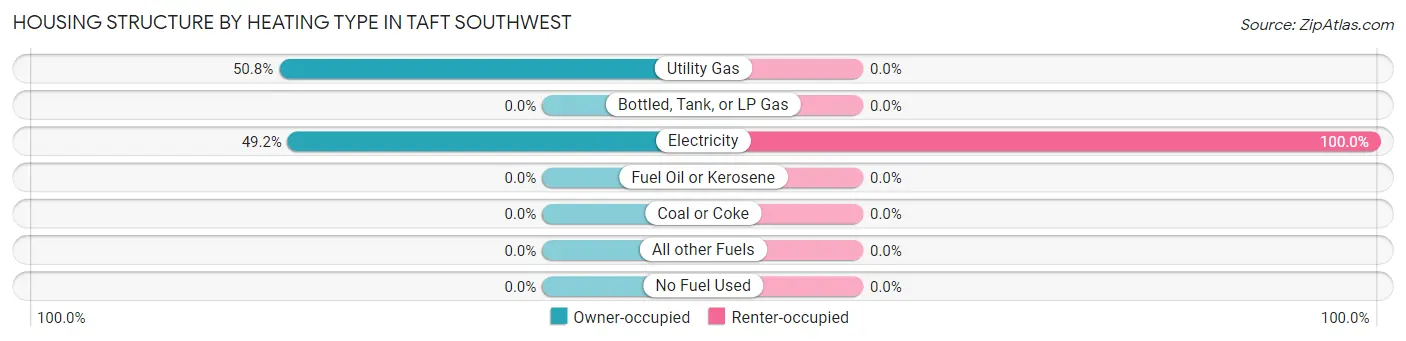
| Heating Type | Owner-occupied | Renter-occupied |
| Utility Gas | 152 (50.8%) | 0 (0.0%) |
| Bottled, Tank, or LP Gas | 0 (0.0%) | 0 (0.0%) |
| Electricity | 147 (49.2%) | 178 (100.0%) |
| Fuel Oil or Kerosene | 0 (0.0%) | 0 (0.0%) |
| Coal or Coke | 0 (0.0%) | 0 (0.0%) |
| All other Fuels | 0 (0.0%) | 0 (0.0%) |
| No Fuel Used | 0 (0.0%) | 0 (0.0%) |
| Total | 299 (100.0%) | 178 (100.0%) |
Household Vehicle Usage in Taft Southwest
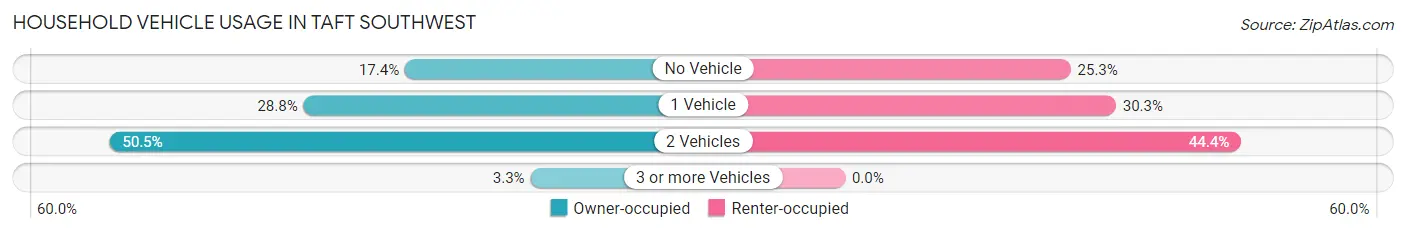
| Vehicles per Household | Owner-occupied | Renter-occupied |
| No Vehicle | 52 (17.4%) | 45 (25.3%) |
| 1 Vehicle | 86 (28.8%) | 54 (30.3%) |
| 2 Vehicles | 151 (50.5%) | 79 (44.4%) |
| 3 or more Vehicles | 10 (3.3%) | 0 (0.0%) |
| Total | 299 (100.0%) | 178 (100.0%) |
Real Estate & Mortgages in Taft Southwest
Real Estate and Mortgage Overview in Taft Southwest
| Characteristic | Without Mortgage | With Mortgage |
| Housing Units | 208 | 91 |
| Median Property Value | $48,900 | $0 |
| Median Household Income | $32,550 | $0 |
| Monthly Housing Costs | $335 | $27 |
| Real Estate Taxes | $359 | $0 |
Property Value by Mortgage Status in Taft Southwest
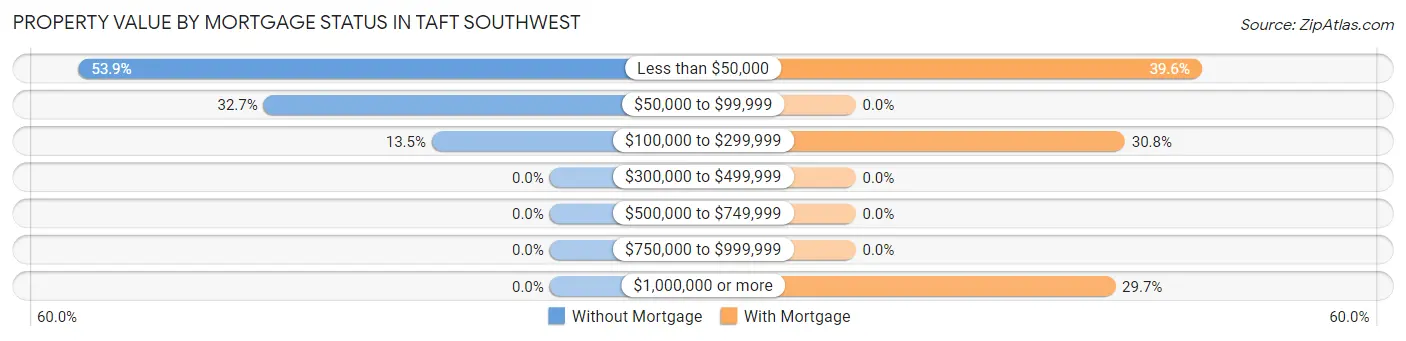
| Property Value | Without Mortgage | With Mortgage |
| Less than $50,000 | 112 (53.8%) | 36 (39.6%) |
| $50,000 to $99,999 | 68 (32.7%) | 0 (0.0%) |
| $100,000 to $299,999 | 28 (13.5%) | 28 (30.8%) |
| $300,000 to $499,999 | 0 (0.0%) | 0 (0.0%) |
| $500,000 to $749,999 | 0 (0.0%) | 0 (0.0%) |
| $750,000 to $999,999 | 0 (0.0%) | 0 (0.0%) |
| $1,000,000 or more | 0 (0.0%) | 27 (29.7%) |
| Total | 208 (100.0%) | 91 (100.0%) |
Household Income by Mortgage Status in Taft Southwest
| Household Income | Without Mortgage | With Mortgage |
| Less than $10,000 | 6 (2.9%) | 0 (0.0%) |
| $10,000 to $24,999 | 96 (46.2%) | 0 (0.0%) |
| $25,000 to $34,999 | 51 (24.5%) | 0 (0.0%) |
| $35,000 to $49,999 | 0 (0.0%) | 0 (0.0%) |
| $50,000 to $74,999 | 46 (22.1%) | 36 (39.6%) |
| $75,000 to $99,999 | 0 (0.0%) | 0 (0.0%) |
| $100,000 to $149,999 | 9 (4.3%) | 27 (29.7%) |
| $150,000 or more | 0 (0.0%) | 28 (30.8%) |
| Total | 208 (100.0%) | 91 (100.0%) |
Property Value to Household Income Ratio in Taft Southwest
| Value-to-Income Ratio | Without Mortgage | With Mortgage |
| Less than 2.0x | 134 (64.4%) | 78,380 (86,131.9%) |
| 2.0x to 2.9x | 11 (5.3%) | 64 (70.3%) |
| 3.0x to 3.9x | 0 (0.0%) | 0 (0.0%) |
| 4.0x or more | 63 (30.3%) | 0 (0.0%) |
| Total | 208 (100.0%) | 91 (100.0%) |
Real Estate Taxes by Mortgage Status in Taft Southwest
| Property Taxes | Without Mortgage | With Mortgage |
| Less than $800 | 151 (72.6%) | 0 (0.0%) |
| $800 to $1,499 | 15 (7.2%) | 0 (0.0%) |
| $800 to $1,499 | 14 (6.7%) | 64 (70.3%) |
| Total | 208 (100.0%) | 91 (100.0%) |
Health & Disability in Taft Southwest
Health Insurance Coverage by Age in Taft Southwest
| Age Bracket | With Coverage | Without Coverage |
| Under 6 Years | 139 (91.4%) | 13 (8.6%) |
| 6 to 18 Years | 331 (100.0%) | 0 (0.0%) |
| 19 to 25 Years | 0 (0.0%) | 45 (100.0%) |
| 26 to 34 Years | 79 (34.5%) | 150 (65.5%) |
| 35 to 44 Years | 28 (100.0%) | 0 (0.0%) |
| 45 to 54 Years | 62 (52.5%) | 56 (47.5%) |
| 55 to 64 Years | 220 (100.0%) | 0 (0.0%) |
| 65 to 74 Years | 123 (100.0%) | 0 (0.0%) |
| 75 Years and older | 222 (100.0%) | 0 (0.0%) |
| Total | 1,204 (82.0%) | 264 (18.0%) |
Health Insurance Coverage by Citizenship Status in Taft Southwest
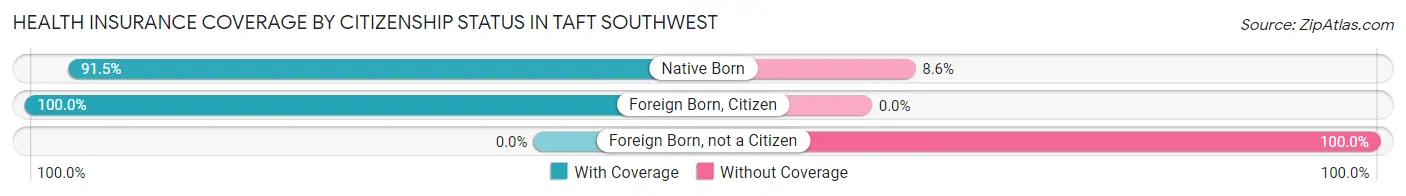
| Citizenship Status | With Coverage | Without Coverage |
| Native Born | 139 (91.4%) | 13 (8.6%) |
| Foreign Born, Citizen | 331 (100.0%) | 0 (0.0%) |
| Foreign Born, not a Citizen | 0 (0.0%) | 45 (100.0%) |
Health Insurance Coverage by Household Income in Taft Southwest
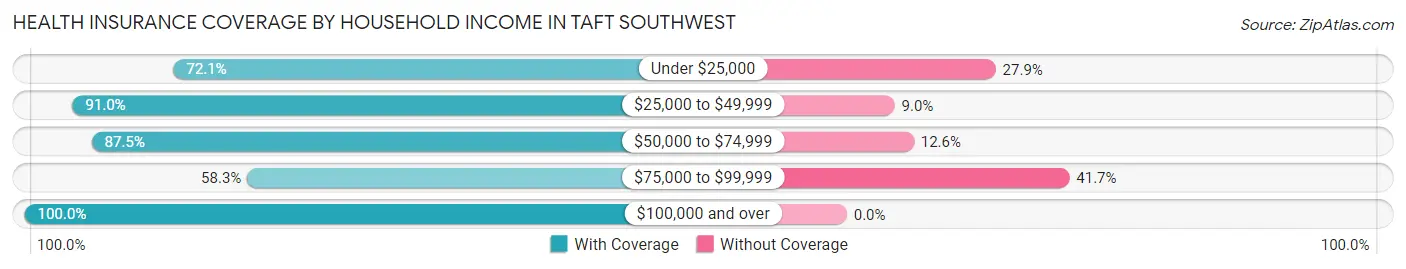
| Household Income | With Coverage | Without Coverage |
| Under $25,000 | 137 (72.1%) | 53 (27.9%) |
| $25,000 to $49,999 | 193 (91.0%) | 19 (9.0%) |
| $50,000 to $74,999 | 620 (87.5%) | 89 (12.6%) |
| $75,000 to $99,999 | 144 (58.3%) | 103 (41.7%) |
| $100,000 and over | 110 (100.0%) | 0 (0.0%) |
Public vs Private Health Insurance Coverage by Age in Taft Southwest
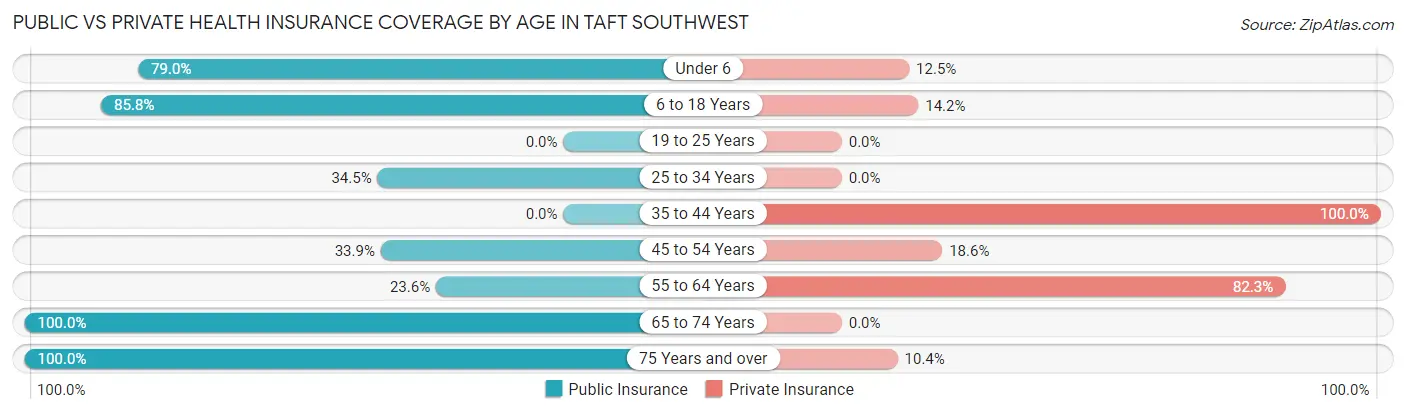
| Age Bracket | Public Insurance | Private Insurance |
| Under 6 | 120 (78.9%) | 19 (12.5%) |
| 6 to 18 Years | 284 (85.8%) | 47 (14.2%) |
| 19 to 25 Years | 0 (0.0%) | 0 (0.0%) |
| 25 to 34 Years | 79 (34.5%) | 0 (0.0%) |
| 35 to 44 Years | 0 (0.0%) | 28 (100.0%) |
| 45 to 54 Years | 40 (33.9%) | 22 (18.6%) |
| 55 to 64 Years | 52 (23.6%) | 181 (82.3%) |
| 65 to 74 Years | 123 (100.0%) | 0 (0.0%) |
| 75 Years and over | 222 (100.0%) | 23 (10.4%) |
| Total | 920 (62.7%) | 320 (21.8%) |
Disability Status by Sex by Age in Taft Southwest
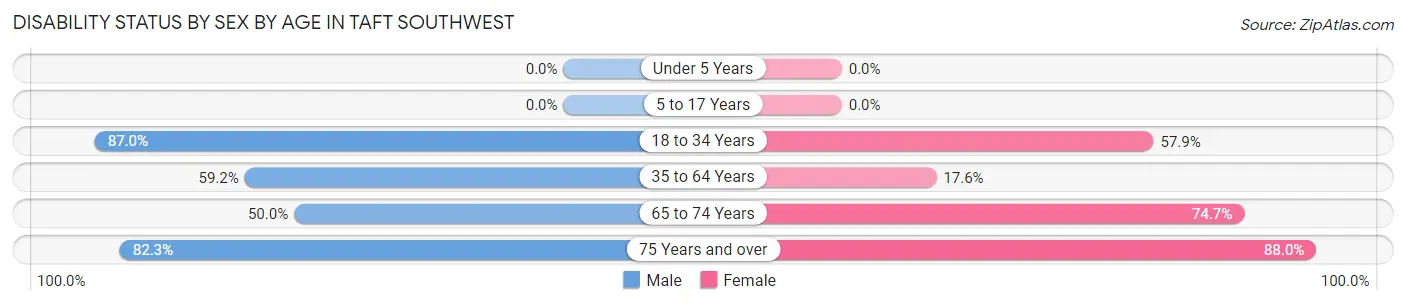
| Age Bracket | Male | Female |
| Under 5 Years | 0 (0.0%) | 0 (0.0%) |
| 5 to 17 Years | 0 (0.0%) | 0 (0.0%) |
| 18 to 34 Years | 100 (87.0%) | 92 (57.9%) |
| 35 to 64 Years | 129 (59.2%) | 26 (17.6%) |
| 65 to 74 Years | 24 (50.0%) | 56 (74.7%) |
| 75 Years and over | 107 (82.3%) | 81 (88.0%) |
Disability Class by Sex by Age in Taft Southwest
Disability Class: Hearing Difficulty
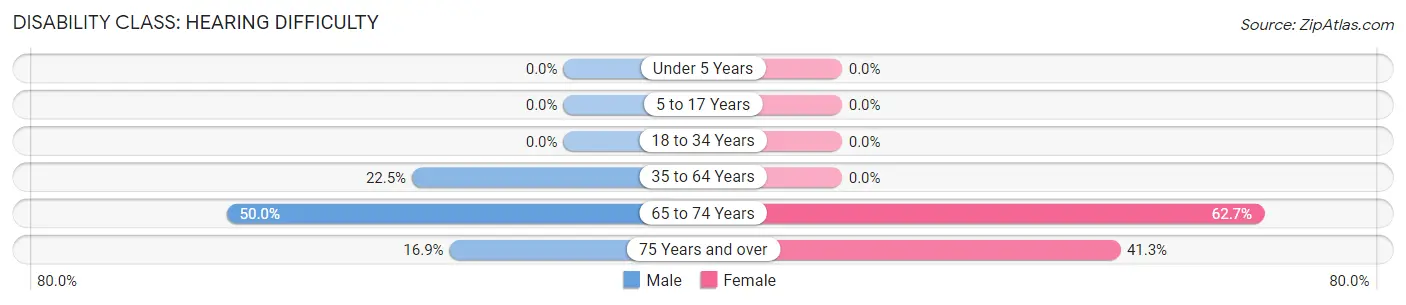
| Age Bracket | Male | Female |
| Under 5 Years | 0 (0.0%) | 0 (0.0%) |
| 5 to 17 Years | 0 (0.0%) | 0 (0.0%) |
| 18 to 34 Years | 0 (0.0%) | 0 (0.0%) |
| 35 to 64 Years | 49 (22.5%) | 0 (0.0%) |
| 65 to 74 Years | 24 (50.0%) | 47 (62.7%) |
| 75 Years and over | 22 (16.9%) | 38 (41.3%) |
Disability Class: Vision Difficulty
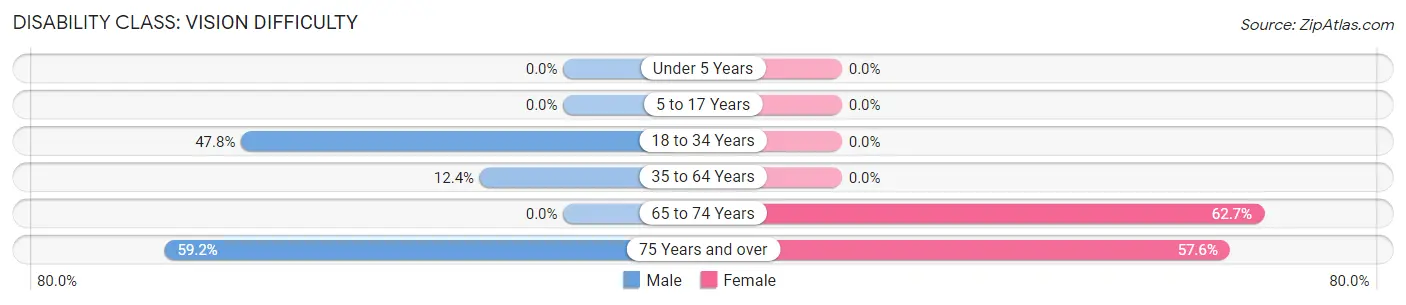
| Age Bracket | Male | Female |
| Under 5 Years | 0 (0.0%) | 0 (0.0%) |
| 5 to 17 Years | 0 (0.0%) | 0 (0.0%) |
| 18 to 34 Years | 55 (47.8%) | 0 (0.0%) |
| 35 to 64 Years | 27 (12.4%) | 0 (0.0%) |
| 65 to 74 Years | 0 (0.0%) | 47 (62.7%) |
| 75 Years and over | 77 (59.2%) | 53 (57.6%) |
Disability Class: Cognitive Difficulty
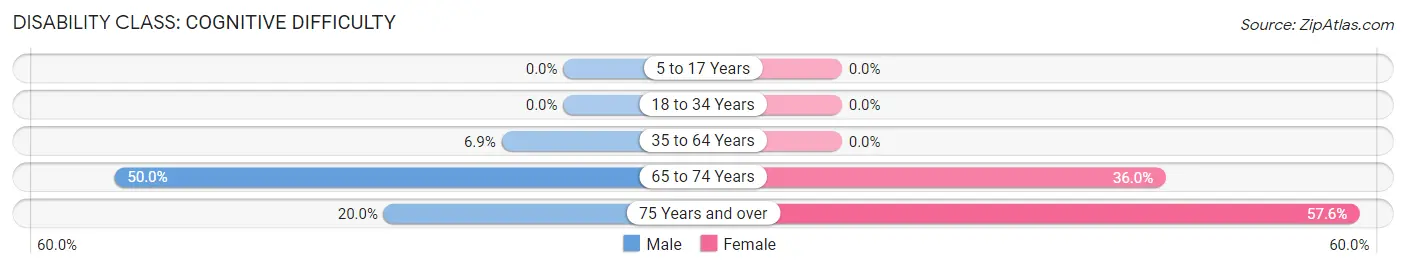
| Age Bracket | Male | Female |
| 5 to 17 Years | 0 (0.0%) | 0 (0.0%) |
| 18 to 34 Years | 0 (0.0%) | 0 (0.0%) |
| 35 to 64 Years | 15 (6.9%) | 0 (0.0%) |
| 65 to 74 Years | 24 (50.0%) | 27 (36.0%) |
| 75 Years and over | 26 (20.0%) | 53 (57.6%) |
Disability Class: Ambulatory Difficulty
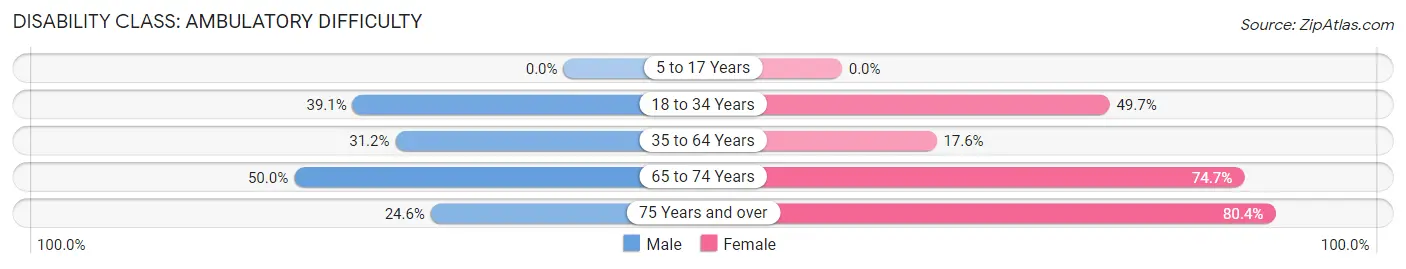
| Age Bracket | Male | Female |
| 5 to 17 Years | 0 (0.0%) | 0 (0.0%) |
| 18 to 34 Years | 45 (39.1%) | 79 (49.7%) |
| 35 to 64 Years | 68 (31.2%) | 26 (17.6%) |
| 65 to 74 Years | 24 (50.0%) | 56 (74.7%) |
| 75 Years and over | 32 (24.6%) | 74 (80.4%) |
Disability Class: Self-Care Difficulty
| Age Bracket | Male | Female |
| 5 to 17 Years | 0 (0.0%) | 0 (0.0%) |
| 18 to 34 Years | 45 (39.1%) | 0 (0.0%) |
| 35 to 64 Years | 40 (18.3%) | 18 (12.2%) |
| 65 to 74 Years | 0 (0.0%) | 0 (0.0%) |
| 75 Years and over | 28 (21.5%) | 17 (18.5%) |
Technology Access in Taft Southwest
Computing Device Access in Taft Southwest
| Device Type | # Households | % Households |
| Desktop or Laptop | 236 | 49.5% |
| Smartphone | 345 | 72.3% |
| Tablet | 164 | 34.4% |
| No Computing Device | 117 | 24.5% |
| Total | 477 | 100.0% |
Internet Access in Taft Southwest
| Internet Type | # Households | % Households |
| Dial-Up Internet | 0 | 0.0% |
| Broadband Home | 230 | 48.2% |
| Cellular Data Only | 61 | 12.8% |
| Satellite Internet | 23 | 4.8% |
| No Internet | 163 | 34.2% |
| Total | 477 | 100.0% |
Taft Southwest Summary
Taft Southwest is a city located in San Patricio County, Texas. It is part of the Corpus Christi Metropolitan Statistical Area. The population was 2,945 at the 2010 census.
History
Taft Southwest was founded in 1912 by the Taft family, who had moved to the area from Illinois. The town was named after the Taft family, who were prominent in the area. The town was originally a farming community, but it soon developed into a small industrial center. The Taft family owned a cotton gin, a lumber mill, and a brick factory.
In the early 1900s, the town was a major stop on the San Antonio and Aransas Pass Railway. The railway brought in new businesses and people to the area, and the town began to grow.
In the 1920s, the town was incorporated and the population grew to over 1,000. The town was home to several businesses, including a bank, a hotel, a movie theater, and a variety of stores.
In the 1950s, the town began to decline as the railroad stopped running and businesses began to close. The population dropped to just over 500 by the 1970s.
In the 1980s, the town began to experience a resurgence. New businesses opened, and the population began to grow again. The town was officially designated as a city in 1989.
Geography
Taft Southwest is located at 28°45'25" North, 97°25'45" West (28.756944, -97.429167). It is situated on the Gulf Coast of Texas, about 25 miles south of Corpus Christi.
The city has a total area of 2.2 square miles, all of which is land. The terrain is mostly flat, with some rolling hills.
Economy
The economy of Taft Southwest is largely based on agriculture and oil and gas production. The town is home to several oil and gas companies, as well as several agricultural businesses.
The town is also home to several small businesses, including restaurants, retail stores, and service providers.
Demographics
As of the 2010 census, the population of Taft Southwest was 2,945. The racial makeup of the town was 79.3% White, 0.7% African American, 0.3% Native American, 0.2% Asian, 0.1% Pacific Islander, 17.2% from other races, and 2.4% from two or more races. Hispanic or Latino of any race were 37.2% of the population.
The median household income in Taft Southwest was $31,250, and the median family income was $35,417. The per capita income was $14,945. About 22.2% of families and 25.2% of the population were below the poverty line, including 33.3% of those under age 18 and 16.2% of those age 65 or over.
Common Questions
What is Per Capita Income in Taft Southwest?
Per Capita income in Taft Southwest is $15,561.
What is the Median Family Income in Taft Southwest?
Median Family Income in Taft Southwest is $67,880.
What is the Median Household income in Taft Southwest?
Median Household Income in Taft Southwest is $50,239.
What is Income or Wage Gap in Taft Southwest?
Income or Wage Gap in Taft Southwest is 46.0%.
Women in Taft Southwest earn 54.0 cents for every dollar earned by a man.
What is Inequality or Gini Index in Taft Southwest?
Inequality or Gini Index in Taft Southwest is 0.37.
What is the Total Population of Taft Southwest?
Total Population of Taft Southwest is 1,468.
What is the Total Male Population of Taft Southwest?
Total Male Population of Taft Southwest is 786.
What is the Total Female Population of Taft Southwest?
Total Female Population of Taft Southwest is 682.
What is the Ratio of Males per 100 Females in Taft Southwest?
There are 115.25 Males per 100 Females in Taft Southwest.
What is the Ratio of Females per 100 Males in Taft Southwest?
There are 86.77 Females per 100 Males in Taft Southwest.
What is the Median Population Age in Taft Southwest?
Median Population Age in Taft Southwest is 30.9 Years.
What is the Average Family Size in Taft Southwest
Average Family Size in Taft Southwest is 3.9 People.
What is the Average Household Size in Taft Southwest
Average Household Size in Taft Southwest is 3.1 People.
How Large is the Labor Force in Taft Southwest?
There are 354 People in the Labor Forcein in Taft Southwest.
What is the Percentage of People in the Labor Force in Taft Southwest?
34.9% of People are in the Labor Force in Taft Southwest.