Doraville, GA Map & Demographics
Doraville Map
Doraville Overview
$26,517
PER CAPITA INCOME
$60,876
AVG FAMILY INCOME
$59,636
AVG HOUSEHOLD INCOME
2.8%
WAGE / INCOME GAP [ % ]
97.2¢/ $1
WAGE / INCOME GAP [ $ ]
0.39
INEQUALITY / GINI INDEX
10,691
TOTAL POPULATION
5,331
MALE POPULATION
5,360
FEMALE POPULATION
99.46
MALES / 100 FEMALES
100.54
FEMALES / 100 MALES
36.0
MEDIAN AGE
3.6
AVG FAMILY SIZE
2.8
AVG HOUSEHOLD SIZE
5,626
LABOR FORCE [ PEOPLE ]
69.6%
PERCENT IN LABOR FORCE
2.0%
UNEMPLOYMENT RATE
Income in Doraville
Income Overview in Doraville
Per Capita Income in Doraville is $26,517, while median incomes of families and households are $60,876 and $59,636 respectively.
| Characteristic | Number | Measure |
| Per Capita Income | 10,691 | $26,517 |
| Median Family Income | 2,313 | $60,876 |
| Mean Family Income | 2,313 | $74,080 |
| Median Household Income | 3,807 | $59,636 |
| Mean Household Income | 3,807 | $71,475 |
| Income Deficit | 2,313 | $0 |
| Wage / Income Gap (%) | 10,691 | 2.79% |
| Wage / Income Gap ($) | 10,691 | 97.21¢ per $1 |
| Gini / Inequality Index | 10,691 | 0.39 |
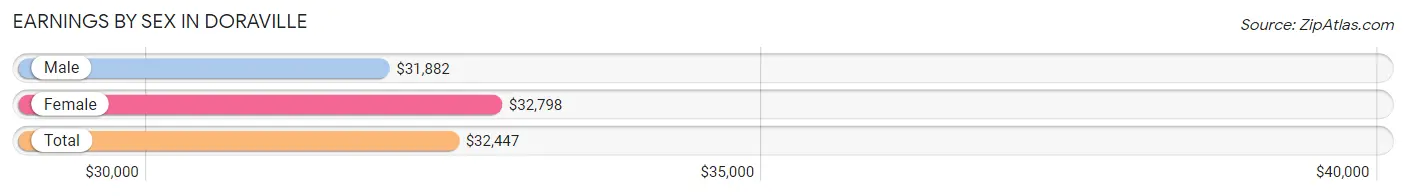
Earnings by Sex in Doraville
Average Earnings in Doraville are $32,447, $31,882 for men and $32,798 for women, a difference of 2.8%.
| Sex | Number | Average Earnings |
| Male | 2,892 (50.4%) | $31,882 |
| Female | 2,841 (49.6%) | $32,798 |
| Total | 5,733 (100.0%) | $32,447 |
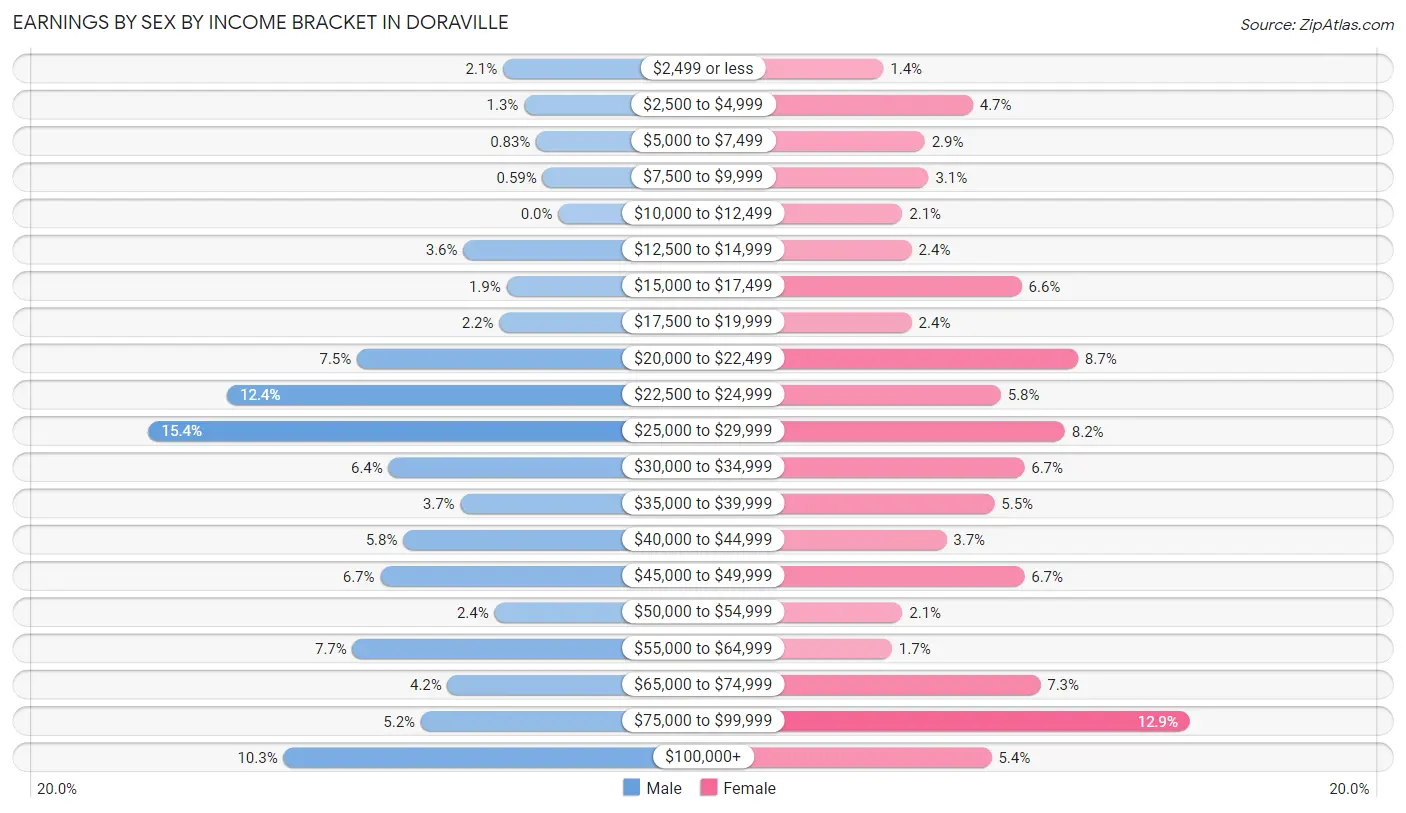
Earnings by Sex by Income Bracket in Doraville
The most common earnings brackets in Doraville are $25,000 to $29,999 for men (444 | 15.3%) and $75,000 to $99,999 for women (365 | 12.9%).
| Income | Male | Female |
| $2,499 or less | 60 (2.1%) | 39 (1.4%) |
| $2,500 to $4,999 | 37 (1.3%) | 134 (4.7%) |
| $5,000 to $7,499 | 24 (0.8%) | 83 (2.9%) |
| $7,500 to $9,999 | 17 (0.6%) | 87 (3.1%) |
| $10,000 to $12,499 | 0 (0.0%) | 59 (2.1%) |
| $12,500 to $14,999 | 103 (3.6%) | 69 (2.4%) |
| $15,000 to $17,499 | 56 (1.9%) | 186 (6.6%) |
| $17,500 to $19,999 | 64 (2.2%) | 69 (2.4%) |
| $20,000 to $22,499 | 218 (7.5%) | 246 (8.7%) |
| $22,500 to $24,999 | 359 (12.4%) | 164 (5.8%) |
| $25,000 to $29,999 | 444 (15.3%) | 232 (8.2%) |
| $30,000 to $34,999 | 184 (6.4%) | 189 (6.7%) |
| $35,000 to $39,999 | 106 (3.7%) | 157 (5.5%) |
| $40,000 to $44,999 | 168 (5.8%) | 106 (3.7%) |
| $45,000 to $49,999 | 193 (6.7%) | 189 (6.7%) |
| $50,000 to $54,999 | 69 (2.4%) | 59 (2.1%) |
| $55,000 to $64,999 | 223 (7.7%) | 48 (1.7%) |
| $65,000 to $74,999 | 120 (4.2%) | 206 (7.2%) |
| $75,000 to $99,999 | 149 (5.1%) | 365 (12.9%) |
| $100,000+ | 298 (10.3%) | 154 (5.4%) |
| Total | 2,892 (100.0%) | 2,841 (100.0%) |
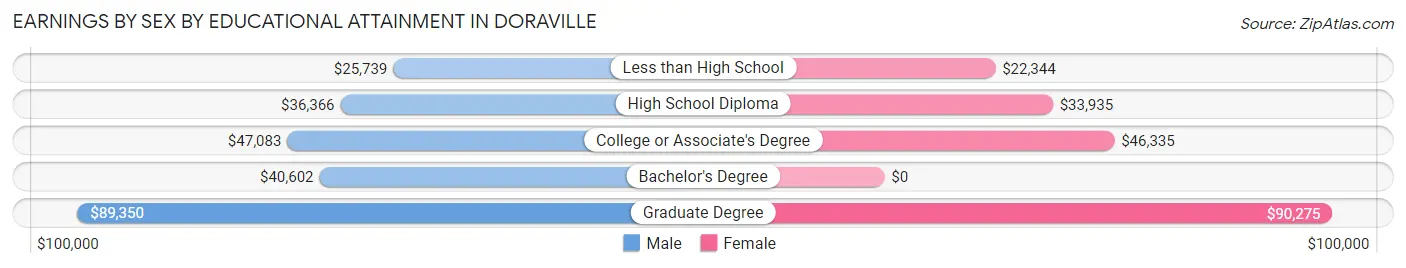
Earnings by Sex by Educational Attainment in Doraville
Average earnings in Doraville are $33,624 for men and $35,081 for women, a difference of 4.2%. Men with an educational attainment of graduate degree enjoy the highest average annual earnings of $89,350, while those with less than high school education earn the least with $25,739. Women with an educational attainment of graduate degree earn the most with the average annual earnings of $90,275, while those with less than high school education have the smallest earnings of $22,344.
| Educational Attainment | Male Income | Female Income |
| Less than High School | $25,739 | $22,344 |
| High School Diploma | $36,366 | $33,935 |
| College or Associate's Degree | $47,083 | $46,335 |
| Bachelor's Degree | $40,602 | $0 |
| Graduate Degree | $89,350 | $90,275 |
| Total | $33,624 | $35,081 |
Family Income in Doraville
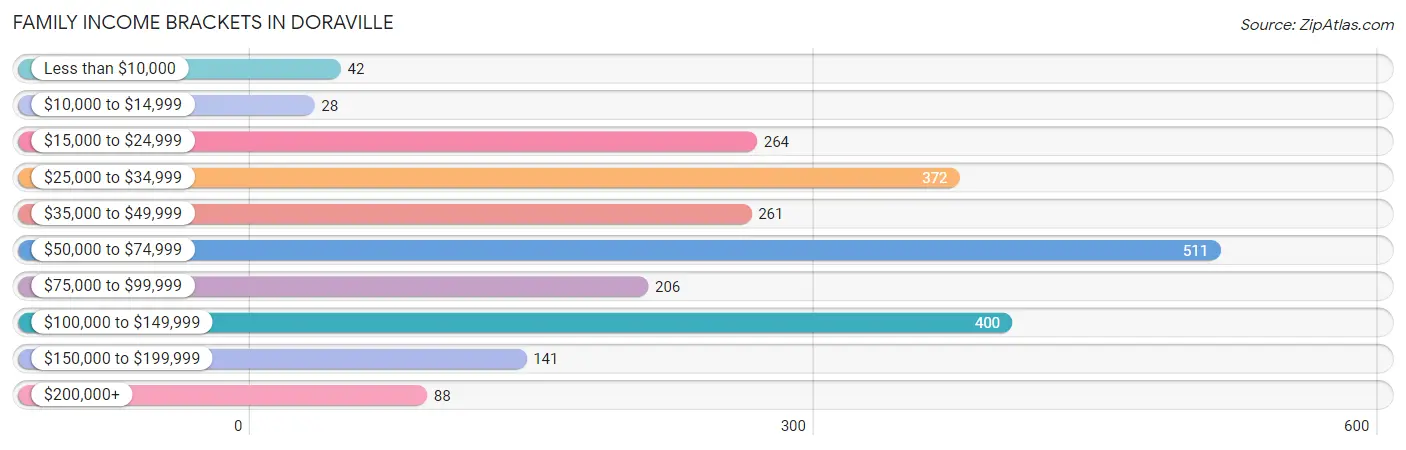
Family Income Brackets in Doraville
According to the Doraville family income data, there are 511 families falling into the $50,000 to $74,999 income range, which is the most common income bracket and makes up 22.1% of all families. Conversely, the $10,000 to $14,999 income bracket is the least frequent group with only 28 families (1.2%) belonging to this category.
| Income Bracket | # Families | % Families |
| Less than $10,000 | 42 | 1.8% |
| $10,000 to $14,999 | 28 | 1.2% |
| $15,000 to $24,999 | 264 | 11.4% |
| $25,000 to $34,999 | 372 | 16.1% |
| $35,000 to $49,999 | 261 | 11.3% |
| $50,000 to $74,999 | 511 | 22.1% |
| $75,000 to $99,999 | 206 | 8.9% |
| $100,000 to $149,999 | 400 | 17.3% |
| $150,000 to $199,999 | 141 | 6.1% |
| $200,000+ | 88 | 3.8% |
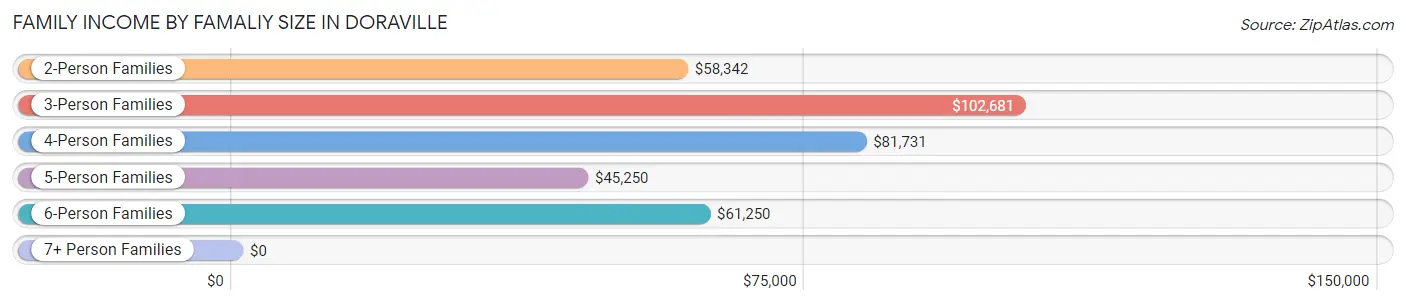
Family Income by Famaliy Size in Doraville
3-person families (392 | 17.0%) account for the highest median family income in Doraville with $102,681 per family, while 3-person families (392 | 17.0%) have the highest median income of $34,227 per family member.
| Income Bracket | # Families | Median Income |
| 2-Person Families | 1,073 (46.4%) | $58,342 |
| 3-Person Families | 392 (17.0%) | $102,681 |
| 4-Person Families | 384 (16.6%) | $81,731 |
| 5-Person Families | 361 (15.6%) | $45,250 |
| 6-Person Families | 71 (3.1%) | $61,250 |
| 7+ Person Families | 32 (1.4%) | $0 |
| Total | 2,313 (100.0%) | $60,876 |
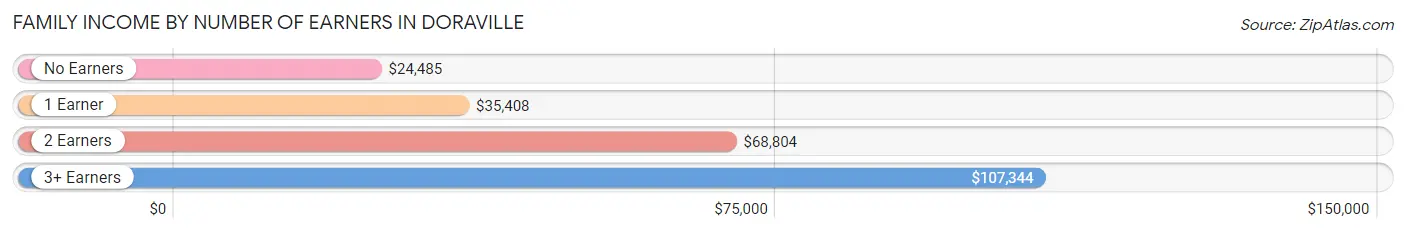
Family Income by Number of Earners in Doraville
The median family income in Doraville is $60,876, with families comprising 3+ earners (248) having the highest median family income of $107,344, while families with no earners (177) have the lowest median family income of $24,485, accounting for 10.7% and 7.6% of families, respectively.
| Number of Earners | # Families | Median Income |
| No Earners | 177 (7.6%) | $24,485 |
| 1 Earner | 920 (39.8%) | $35,408 |
| 2 Earners | 968 (41.8%) | $68,804 |
| 3+ Earners | 248 (10.7%) | $107,344 |
| Total | 2,313 (100.0%) | $60,876 |
Household Income in Doraville
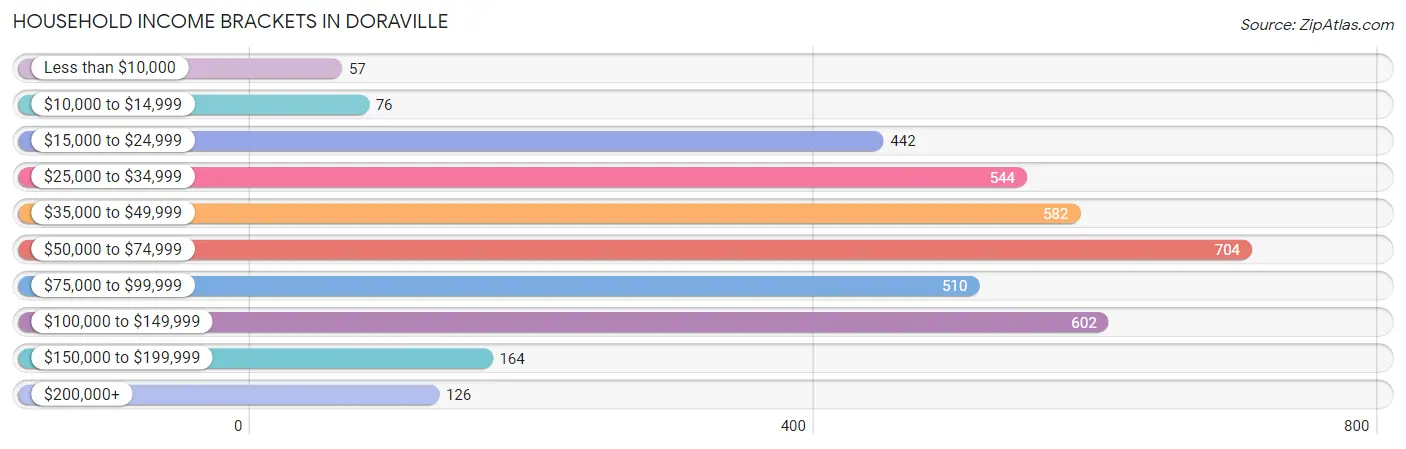
Household Income Brackets in Doraville
With 704 households falling in the category, the $50,000 to $74,999 income range is the most frequent in Doraville, accounting for 18.5% of all households. In contrast, only 57 households (1.5%) fall into the less than $10,000 income bracket, making it the least populous group.
| Income Bracket | # Households | % Households |
| Less than $10,000 | 57 | 1.5% |
| $10,000 to $14,999 | 76 | 2.0% |
| $15,000 to $24,999 | 442 | 11.6% |
| $25,000 to $34,999 | 544 | 14.3% |
| $35,000 to $49,999 | 582 | 15.3% |
| $50,000 to $74,999 | 704 | 18.5% |
| $75,000 to $99,999 | 510 | 13.4% |
| $100,000 to $149,999 | 602 | 15.8% |
| $150,000 to $199,999 | 164 | 4.3% |
| $200,000+ | 126 | 3.3% |
Household Income by Householder Age in Doraville
The median household income in Doraville is $59,636, with the highest median household income of $73,929 found in the 45 to 64 years age bracket for the primary householder. A total of 1,502 households (39.5%) fall into this category. Meanwhile, the 65+ years age bracket for the primary householder has the lowest median household income of $31,116, with 741 households (19.5%) in this group.
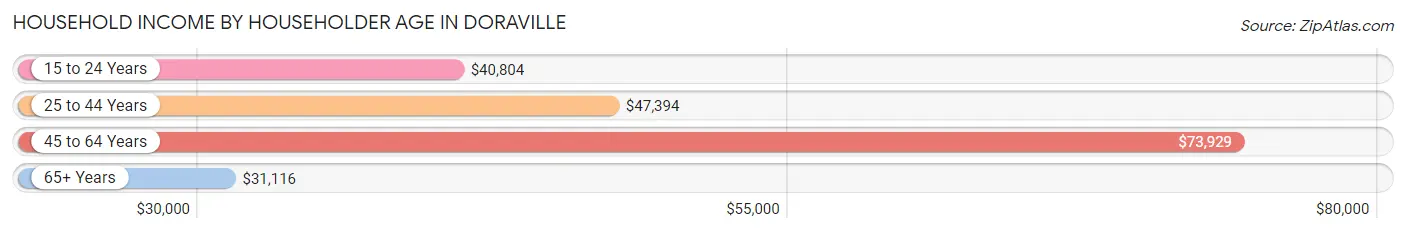
| Income Bracket | # Households | Median Income |
| 15 to 24 Years | 55 (1.4%) | $40,804 |
| 25 to 44 Years | 1,509 (39.6%) | $47,394 |
| 45 to 64 Years | 1,502 (39.5%) | $73,929 |
| 65+ Years | 741 (19.5%) | $31,116 |
| Total | 3,807 (100.0%) | $59,636 |
Poverty in Doraville
Income Below Poverty by Sex and Age in Doraville
With 22.5% poverty level for males and 21.2% for females among the residents of Doraville, 5 year old males and 6 to 11 year old females are the most vulnerable to poverty, with 63 males (81.8%) and 172 females (59.5%) in their respective age groups living below the poverty level.
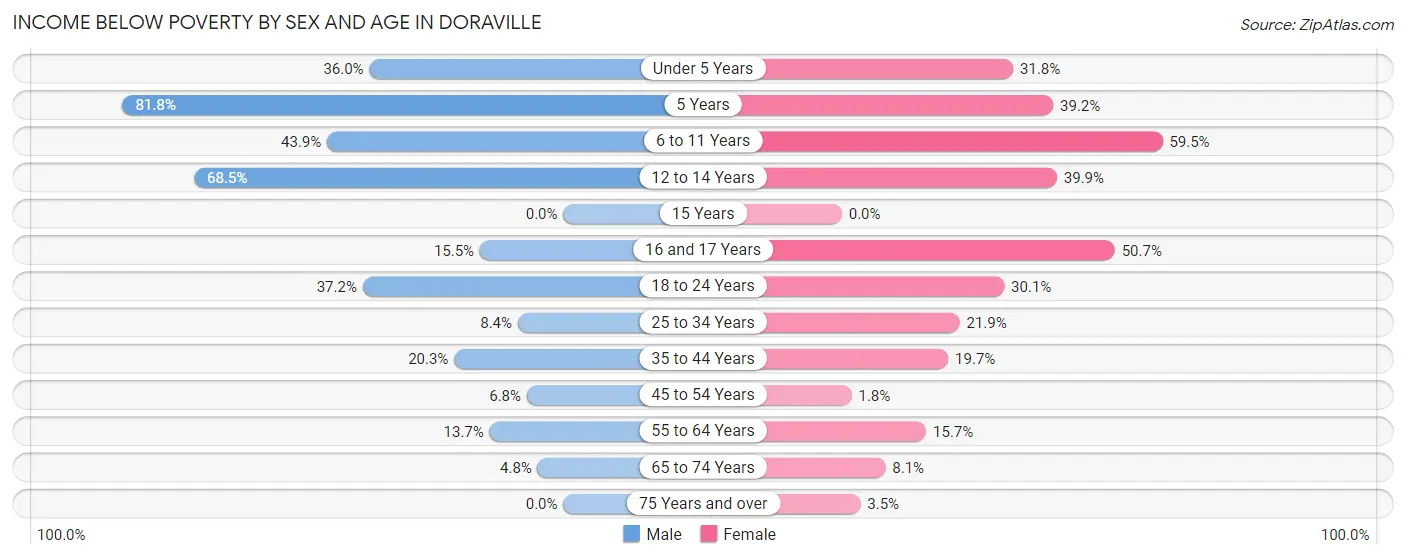
| Age Bracket | Male | Female |
| Under 5 Years | 131 (36.0%) | 97 (31.8%) |
| 5 Years | 63 (81.8%) | 40 (39.2%) |
| 6 to 11 Years | 317 (43.9%) | 172 (59.5%) |
| 12 to 14 Years | 172 (68.5%) | 99 (39.9%) |
| 15 Years | 0 (0.0%) | 0 (0.0%) |
| 16 and 17 Years | 13 (15.5%) | 77 (50.7%) |
| 18 to 24 Years | 146 (37.2%) | 126 (30.1%) |
| 25 to 34 Years | 61 (8.4%) | 163 (21.8%) |
| 35 to 44 Years | 153 (20.3%) | 195 (19.7%) |
| 45 to 54 Years | 44 (6.8%) | 14 (1.8%) |
| 55 to 64 Years | 59 (13.7%) | 108 (15.7%) |
| 65 to 74 Years | 31 (4.8%) | 28 (8.1%) |
| 75 Years and over | 0 (0.0%) | 7 (3.5%) |
| Total | 1,190 (22.5%) | 1,126 (21.2%) |
Income Above Poverty by Sex and Age in Doraville
According to the poverty statistics in Doraville, males aged 15 years and females aged 15 years are the age groups that are most secure financially, with 100.0% of males and 100.0% of females in these age groups living above the poverty line.
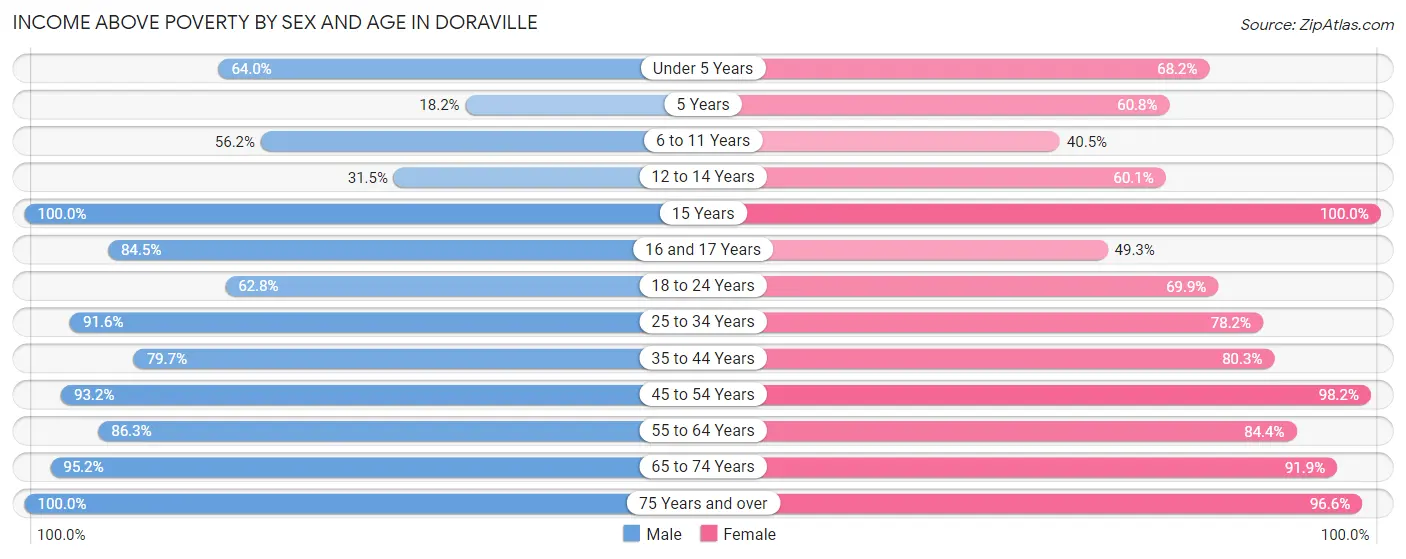
| Age Bracket | Male | Female |
| Under 5 Years | 233 (64.0%) | 208 (68.2%) |
| 5 Years | 14 (18.2%) | 62 (60.8%) |
| 6 to 11 Years | 406 (56.1%) | 117 (40.5%) |
| 12 to 14 Years | 79 (31.5%) | 149 (60.1%) |
| 15 Years | 112 (100.0%) | 51 (100.0%) |
| 16 and 17 Years | 71 (84.5%) | 75 (49.3%) |
| 18 to 24 Years | 246 (62.8%) | 292 (69.9%) |
| 25 to 34 Years | 662 (91.6%) | 583 (78.1%) |
| 35 to 44 Years | 602 (79.7%) | 793 (80.3%) |
| 45 to 54 Years | 606 (93.2%) | 760 (98.2%) |
| 55 to 64 Years | 372 (86.3%) | 582 (84.4%) |
| 65 to 74 Years | 619 (95.2%) | 318 (91.9%) |
| 75 Years and over | 82 (100.0%) | 196 (96.6%) |
| Total | 4,104 (77.5%) | 4,186 (78.8%) |
Income Below Poverty Among Married-Couple Families in Doraville
The poverty statistics for married-couple families in Doraville show that 11.0% or 190 of the total 1,734 families live below the poverty line. Families with 3 or 4 children have the highest poverty rate of 26.7%, comprising of 62 families. On the other hand, families with no children have the lowest poverty rate of 2.2%, which includes 22 families.
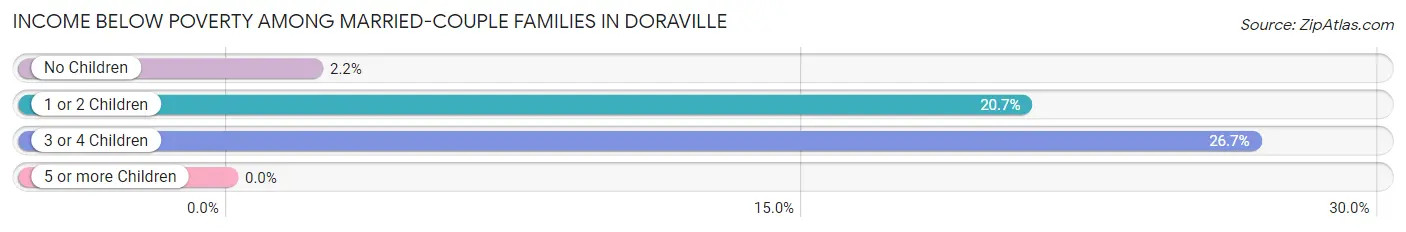
| Children | Above Poverty | Below Poverty |
| No Children | 969 (97.8%) | 22 (2.2%) |
| 1 or 2 Children | 405 (79.3%) | 106 (20.7%) |
| 3 or 4 Children | 170 (73.3%) | 62 (26.7%) |
| 5 or more Children | 0 (0.0%) | 0 (0.0%) |
| Total | 1,544 (89.0%) | 190 (11.0%) |
Income Below Poverty Among Single-Parent Households in Doraville
According to the poverty data in Doraville, 20.2% or 36 single-father households and 27.7% or 111 single-mother households are living below the poverty line. Among single-father households, those with 3 or 4 children have the highest poverty rate, with 17 households (54.8%) experiencing poverty. Likewise, among single-mother households, those with 3 or 4 children have the highest poverty rate, with 33 households (64.7%) falling below the poverty line.
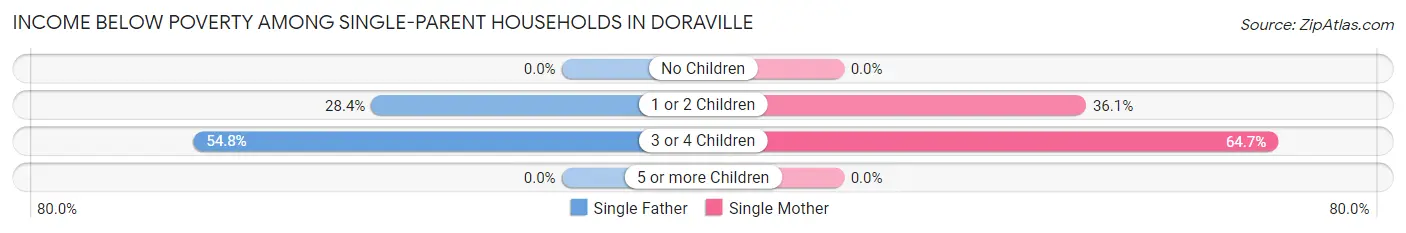
| Children | Single Father | Single Mother |
| No Children | 0 (0.0%) | 0 (0.0%) |
| 1 or 2 Children | 19 (28.4%) | 78 (36.1%) |
| 3 or 4 Children | 17 (54.8%) | 33 (64.7%) |
| 5 or more Children | 0 (0.0%) | 0 (0.0%) |
| Total | 36 (20.2%) | 111 (27.7%) |
Income Below Poverty Among Married-Couple vs Single-Parent Households in Doraville
The poverty data for Doraville shows that 190 of the married-couple family households (11.0%) and 147 of the single-parent households (25.4%) are living below the poverty level. Within the married-couple family households, those with 3 or 4 children have the highest poverty rate, with 62 households (26.7%) falling below the poverty line. Among the single-parent households, those with 3 or 4 children have the highest poverty rate, with 50 household (61.0%) living below poverty.
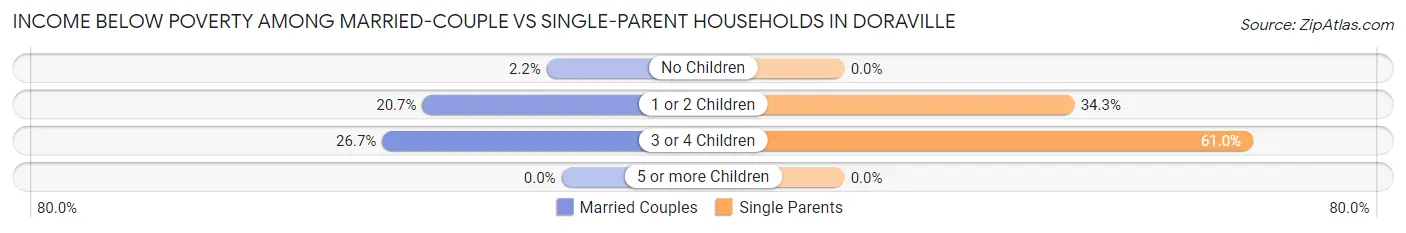
| Children | Married-Couple Families | Single-Parent Households |
| No Children | 22 (2.2%) | 0 (0.0%) |
| 1 or 2 Children | 106 (20.7%) | 97 (34.3%) |
| 3 or 4 Children | 62 (26.7%) | 50 (61.0%) |
| 5 or more Children | 0 (0.0%) | 0 (0.0%) |
| Total | 190 (11.0%) | 147 (25.4%) |
Race in Doraville
The most populous races in Doraville are Hispanic or Latino (4,824 | 45.1%), White / Caucasian (4,554 | 42.6%), and Asian (2,231 | 20.9%).
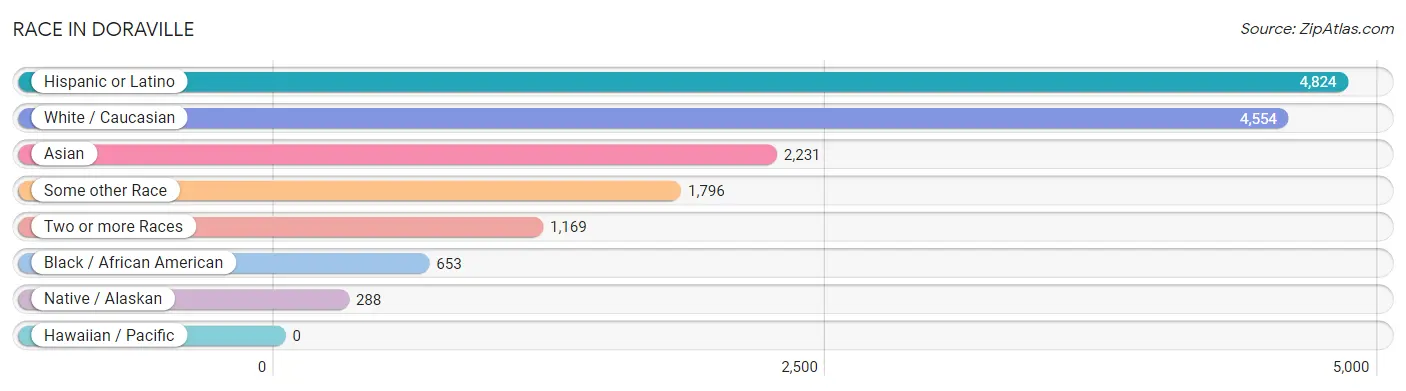
| Race | # Population | % Population |
| Asian | 2,231 | 20.9% |
| Black / African American | 653 | 6.1% |
| Hawaiian / Pacific | 0 | 0.0% |
| Hispanic or Latino | 4,824 | 45.1% |
| Native / Alaskan | 288 | 2.7% |
| White / Caucasian | 4,554 | 42.6% |
| Two or more Races | 1,169 | 10.9% |
| Some other Race | 1,796 | 16.8% |
| Total | 10,691 | 100.0% |
Ancestry in Doraville
The most populous ancestries reported in Doraville are Mexican (2,557 | 23.9%), Central American (1,811 | 16.9%), Guatemalan (1,206 | 11.3%), American (943 | 8.8%), and Vietnamese (683 | 6.4%), together accounting for 67.3% of all Doraville residents.
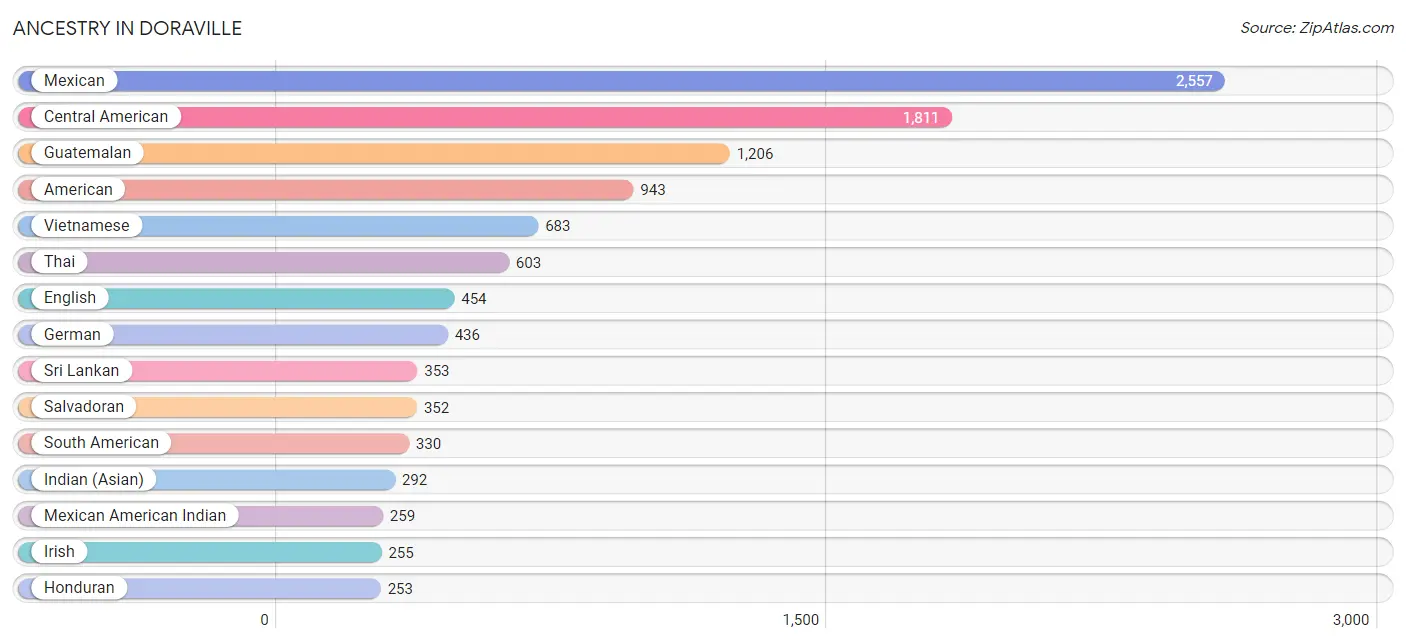
| Ancestry | # Population | % Population |
| African | 16 | 0.2% |
| American | 943 | 8.8% |
| Arab | 15 | 0.1% |
| Belgian | 11 | 0.1% |
| British | 36 | 0.3% |
| Burmese | 160 | 1.5% |
| Central American | 1,811 | 16.9% |
| Cherokee | 49 | 0.5% |
| Colombian | 150 | 1.4% |
| Czechoslovakian | 14 | 0.1% |
| Danish | 6 | 0.1% |
| Dutch | 62 | 0.6% |
| English | 454 | 4.3% |
| Ethiopian | 30 | 0.3% |
| European | 153 | 1.4% |
| Filipino | 44 | 0.4% |
| French | 103 | 1.0% |
| German | 436 | 4.1% |
| Guatemalan | 1,206 | 11.3% |
| Honduran | 253 | 2.4% |
| Indian (Asian) | 292 | 2.7% |
| Irish | 255 | 2.4% |
| Italian | 25 | 0.2% |
| Korean | 102 | 0.9% |
| Lebanese | 7 | 0.1% |
| Malaysian | 31 | 0.3% |
| Mexican | 2,557 | 23.9% |
| Mexican American Indian | 259 | 2.4% |
| Norwegian | 35 | 0.3% |
| Paraguayan | 67 | 0.6% |
| Peruvian | 11 | 0.1% |
| Polish | 69 | 0.6% |
| Puerto Rican | 51 | 0.5% |
| Russian | 32 | 0.3% |
| Salvadoran | 352 | 3.3% |
| Scotch-Irish | 55 | 0.5% |
| Scottish | 148 | 1.4% |
| South American | 330 | 3.1% |
| Spaniard | 20 | 0.2% |
| Sri Lankan | 353 | 3.3% |
| Subsaharan African | 145 | 1.4% |
| Swedish | 28 | 0.3% |
| Swiss | 21 | 0.2% |
| Thai | 603 | 5.6% |
| Venezuelan | 102 | 0.9% |
| Vietnamese | 683 | 6.4% | View All 46 Rows |
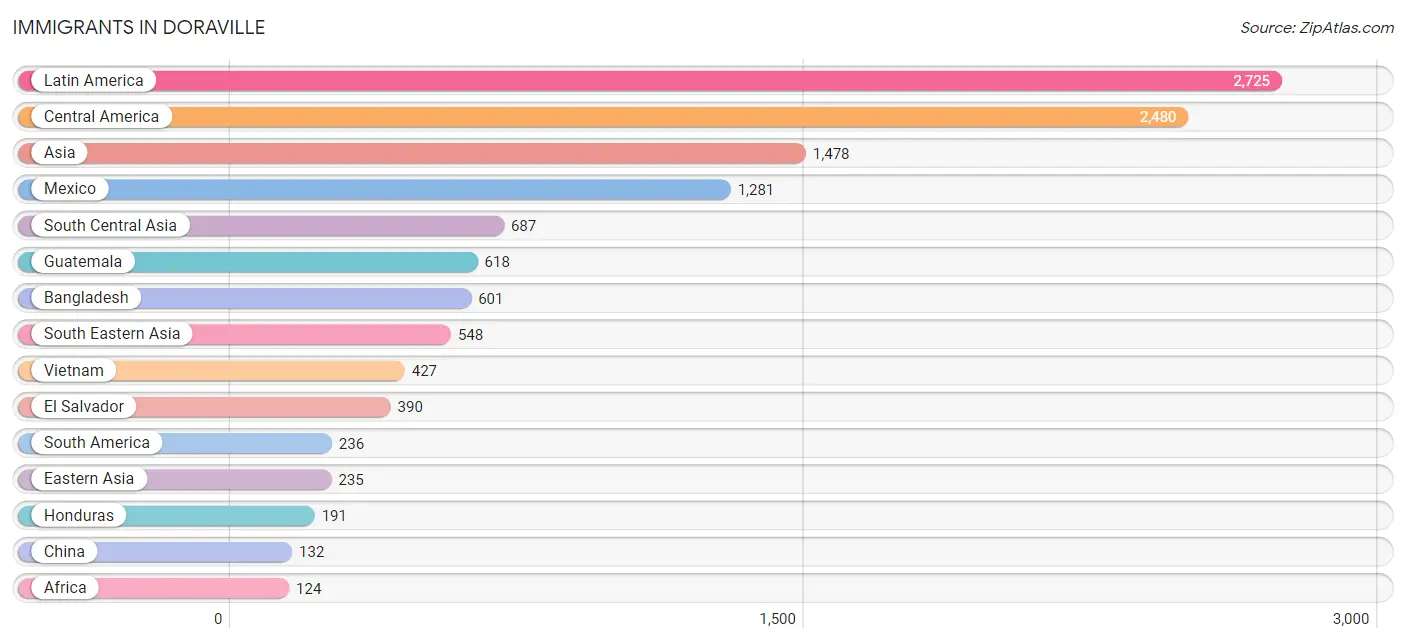
Immigrants in Doraville
The most numerous immigrant groups reported in Doraville came from Latin America (2,725 | 25.5%), Central America (2,480 | 23.2%), Asia (1,478 | 13.8%), Mexico (1,281 | 12.0%), and South Central Asia (687 | 6.4%), together accounting for 80.9% of all Doraville residents.
| Immigration Origin | # Population | % Population |
| Africa | 124 | 1.2% |
| Asia | 1,478 | 13.8% |
| Bangladesh | 601 | 5.6% |
| Canada | 22 | 0.2% |
| Caribbean | 9 | 0.1% |
| Central America | 2,480 | 23.2% |
| China | 132 | 1.2% |
| Colombia | 105 | 1.0% |
| Dominican Republic | 9 | 0.1% |
| Eastern Africa | 123 | 1.1% |
| Eastern Asia | 235 | 2.2% |
| Eastern Europe | 45 | 0.4% |
| El Salvador | 390 | 3.6% |
| Ethiopia | 84 | 0.8% |
| Europe | 71 | 0.7% |
| Guatemala | 618 | 5.8% |
| Honduras | 191 | 1.8% |
| India | 62 | 0.6% |
| Indonesia | 10 | 0.1% |
| Jordan | 8 | 0.1% |
| Korea | 103 | 1.0% |
| Latin America | 2,725 | 25.5% |
| Mexico | 1,281 | 12.0% |
| Moldova | 13 | 0.1% |
| Morocco | 1 | 0.0% |
| Nepal | 24 | 0.2% |
| Northern Africa | 1 | 0.0% |
| Peru | 11 | 0.1% |
| Philippines | 111 | 1.0% |
| Russia | 32 | 0.3% |
| South America | 236 | 2.2% |
| South Central Asia | 687 | 6.4% |
| South Eastern Asia | 548 | 5.1% |
| Southern Europe | 19 | 0.2% |
| Spain | 19 | 0.2% |
| Switzerland | 7 | 0.1% |
| Taiwan | 44 | 0.4% |
| Venezuela | 104 | 1.0% |
| Vietnam | 427 | 4.0% |
| Western Asia | 8 | 0.1% |
| Western Europe | 7 | 0.1% | View All 41 Rows |
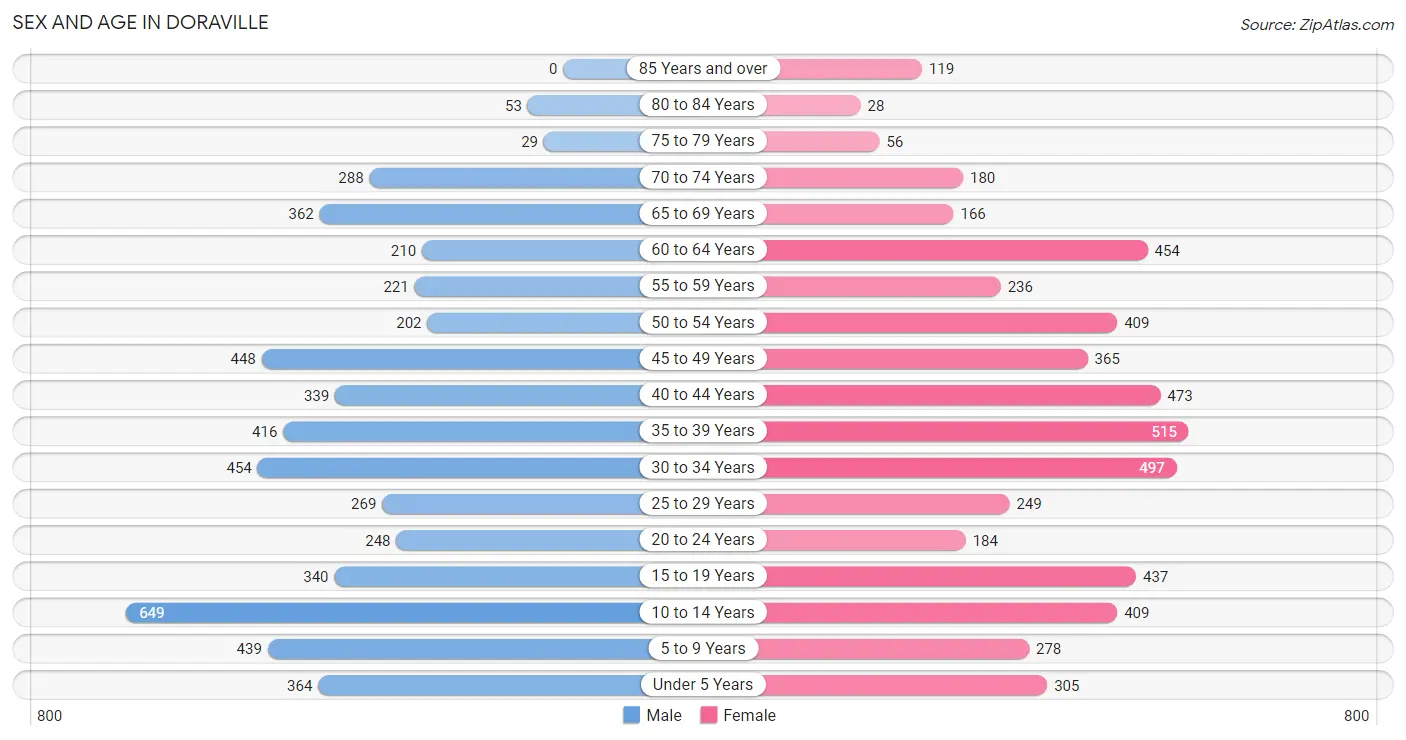
Sex and Age in Doraville
Sex and Age in Doraville
The most populous age groups in Doraville are 10 to 14 Years (649 | 12.2%) for men and 35 to 39 Years (515 | 9.6%) for women.
| Age Bracket | Male | Female |
| Under 5 Years | 364 (6.8%) | 305 (5.7%) |
| 5 to 9 Years | 439 (8.2%) | 278 (5.2%) |
| 10 to 14 Years | 649 (12.2%) | 409 (7.6%) |
| 15 to 19 Years | 340 (6.4%) | 437 (8.2%) |
| 20 to 24 Years | 248 (4.6%) | 184 (3.4%) |
| 25 to 29 Years | 269 (5.1%) | 249 (4.6%) |
| 30 to 34 Years | 454 (8.5%) | 497 (9.3%) |
| 35 to 39 Years | 416 (7.8%) | 515 (9.6%) |
| 40 to 44 Years | 339 (6.4%) | 473 (8.8%) |
| 45 to 49 Years | 448 (8.4%) | 365 (6.8%) |
| 50 to 54 Years | 202 (3.8%) | 409 (7.6%) |
| 55 to 59 Years | 221 (4.2%) | 236 (4.4%) |
| 60 to 64 Years | 210 (3.9%) | 454 (8.5%) |
| 65 to 69 Years | 362 (6.8%) | 166 (3.1%) |
| 70 to 74 Years | 288 (5.4%) | 180 (3.4%) |
| 75 to 79 Years | 29 (0.5%) | 56 (1.0%) |
| 80 to 84 Years | 53 (1.0%) | 28 (0.5%) |
| 85 Years and over | 0 (0.0%) | 119 (2.2%) |
| Total | 5,331 (100.0%) | 5,360 (100.0%) |
Families and Households in Doraville
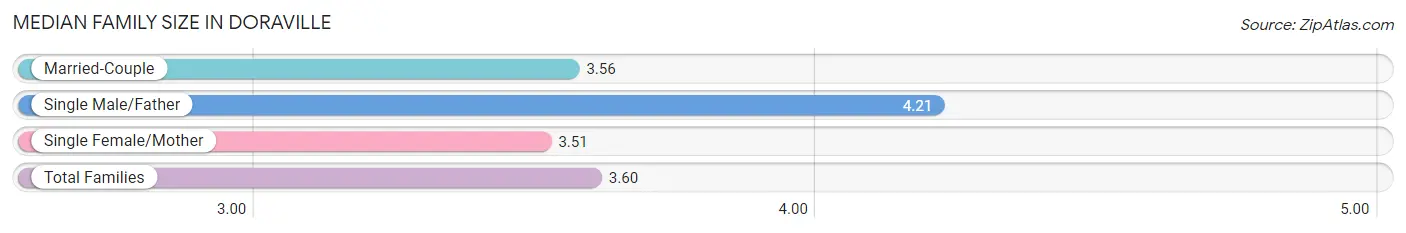
Median Family Size in Doraville
The median family size in Doraville is 3.60 persons per family, with single male/father families (178 | 7.7%) accounting for the largest median family size of 4.21 persons per family. On the other hand, single female/mother families (401 | 17.3%) represent the smallest median family size with 3.51 persons per family.
| Family Type | # Families | Family Size |
| Married-Couple | 1,734 (75.0%) | 3.56 |
| Single Male/Father | 178 (7.7%) | 4.21 |
| Single Female/Mother | 401 (17.3%) | 3.51 |
| Total Families | 2,313 (100.0%) | 3.60 |
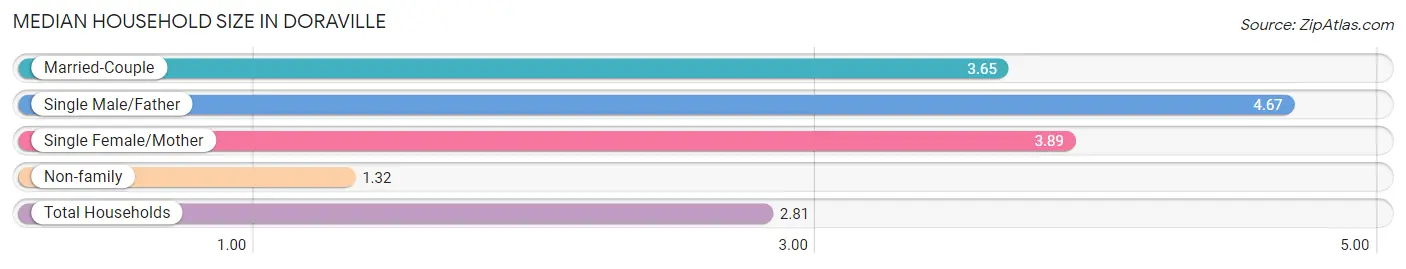
Median Household Size in Doraville
The median household size in Doraville is 2.81 persons per household, with single male/father households (178 | 4.7%) accounting for the largest median household size of 4.67 persons per household. non-family households (1,494 | 39.2%) represent the smallest median household size with 1.32 persons per household.
| Household Type | # Households | Household Size |
| Married-Couple | 1,734 (45.6%) | 3.65 |
| Single Male/Father | 178 (4.7%) | 4.67 |
| Single Female/Mother | 401 (10.5%) | 3.89 |
| Non-family | 1,494 (39.2%) | 1.32 |
| Total Households | 3,807 (100.0%) | 2.81 |
Household Size by Marriage Status in Doraville
Out of a total of 3,807 households in Doraville, 2,313 (60.8%) are family households, while 1,494 (39.2%) are nonfamily households. The most numerous type of family households are 2-person households, comprising 961, and the most common type of nonfamily households are 1-person households, comprising 1,253.
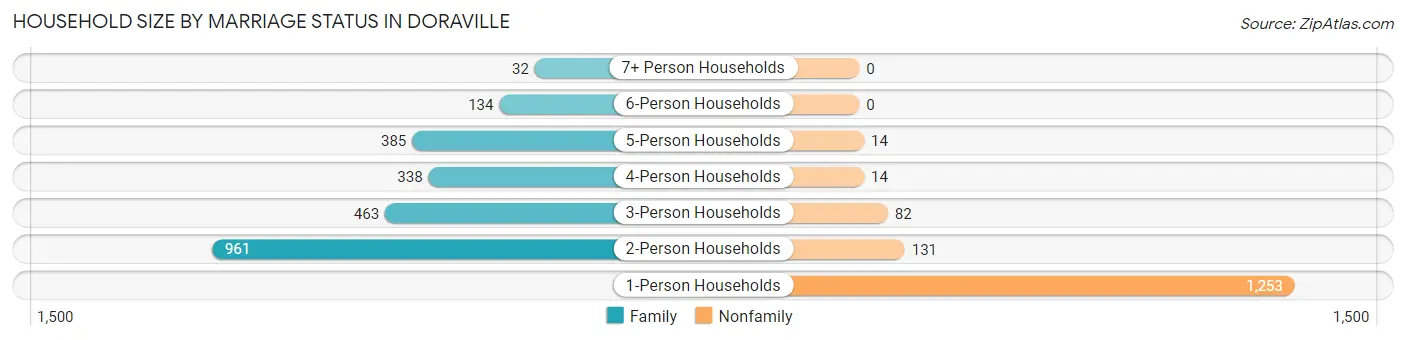
| Household Size | Family Households | Nonfamily Households |
| 1-Person Households | - | 1,253 (32.9%) |
| 2-Person Households | 961 (25.2%) | 131 (3.4%) |
| 3-Person Households | 463 (12.2%) | 82 (2.1%) |
| 4-Person Households | 338 (8.9%) | 14 (0.4%) |
| 5-Person Households | 385 (10.1%) | 14 (0.4%) |
| 6-Person Households | 134 (3.5%) | 0 (0.0%) |
| 7+ Person Households | 32 (0.8%) | 0 (0.0%) |
| Total | 2,313 (60.8%) | 1,494 (39.2%) |
Female Fertility in Doraville
Fertility by Age in Doraville
Average fertility rate in Doraville is 30.0 births per 1,000 women. Women in the age bracket of 20 to 34 years have the highest fertility rate with 91.0 births per 1,000 women. Women in the age bracket of 20 to 34 years acount for 100.0% of all women with births.
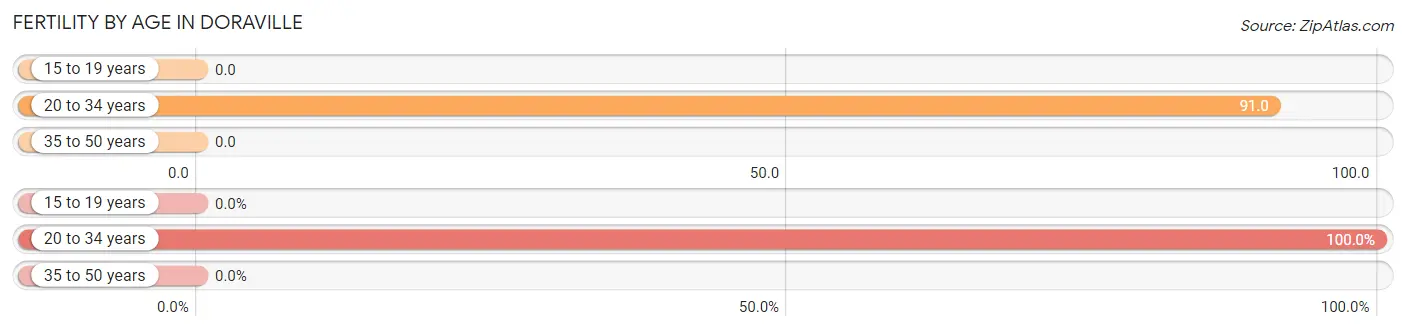
| Age Bracket | Women with Births | Births / 1,000 Women |
| 15 to 19 years | 0 (0.0%) | 0.0 |
| 20 to 34 years | 85 (100.0%) | 91.0 |
| 35 to 50 years | 0 (0.0%) | 0.0 |
| Total | 85 (100.0%) | 30.0 |
Fertility by Age by Marriage Status in Doraville
83.5% of women with births (85) in Doraville are married. The highest percentage of unmarried women with births falls into 20 to 34 years age bracket with 16.5% of them unmarried at the time of birth, while the lowest percentage of unmarried women with births belong to 20 to 34 years age bracket with 16.5% of them unmarried.
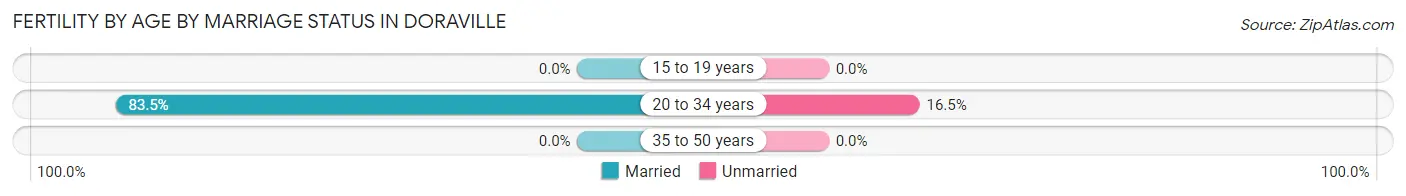
| Age Bracket | Married | Unmarried |
| 15 to 19 years | 0 (0.0%) | 0 (0.0%) |
| 20 to 34 years | 71 (83.5%) | 14 (16.5%) |
| 35 to 50 years | 0 (0.0%) | 0 (0.0%) |
| Total | 71 (83.5%) | 14 (16.5%) |
Fertility by Education in Doraville
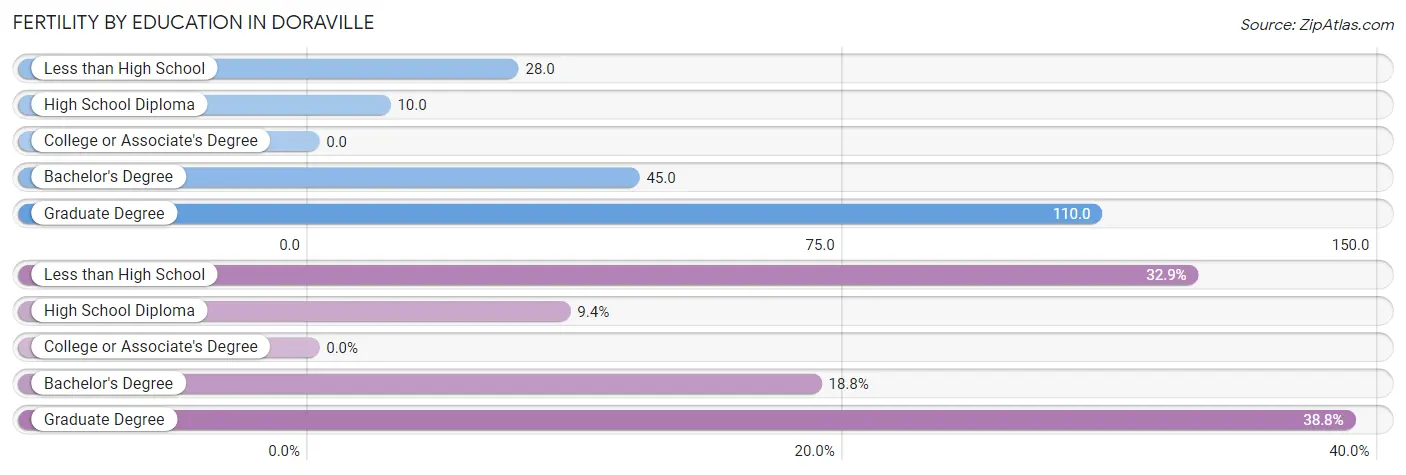
| Educational Attainment | Women with Births | Births / 1,000 Women |
| Less than High School | 28 (32.9%) | 28.0 |
| High School Diploma | 8 (9.4%) | 10.0 |
| College or Associate's Degree | 0 (0.0%) | 0.0 |
| Bachelor's Degree | 16 (18.8%) | 45.0 |
| Graduate Degree | 33 (38.8%) | 110.0 |
| Total | 85 (100.0%) | 30.0 |
Fertility by Education by Marriage Status in Doraville
16.5% of women with births in Doraville are unmarried. Women with the educational attainment of high school diploma are most likely to be married with 100.0% of them married at childbirth, while women with the educational attainment of less than high school are least likely to be married with 50.0% of them unmarried at childbirth.
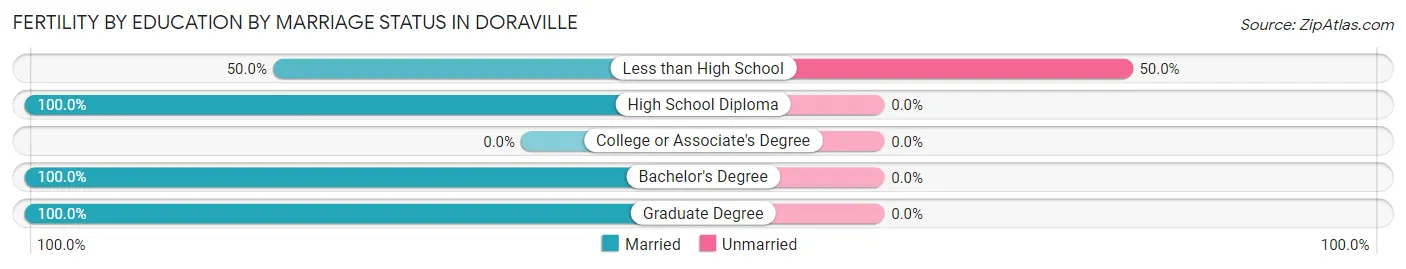
| Educational Attainment | Married | Unmarried |
| Less than High School | 14 (50.0%) | 14 (50.0%) |
| High School Diploma | 8 (100.0%) | 0 (0.0%) |
| College or Associate's Degree | 0 (0.0%) | 0 (0.0%) |
| Bachelor's Degree | 16 (100.0%) | 0 (0.0%) |
| Graduate Degree | 33 (100.0%) | 0 (0.0%) |
| Total | 71 (83.5%) | 14 (16.5%) |
Employment Characteristics in Doraville
Employment by Class of Employer in Doraville
Among the 5,157 employed individuals in Doraville, private company employees (3,907 | 75.8%), self-employed (not incorporated) (344 | 6.7%), and not-for-profit organizations (266 | 5.2%) make up the most common classes of employment.
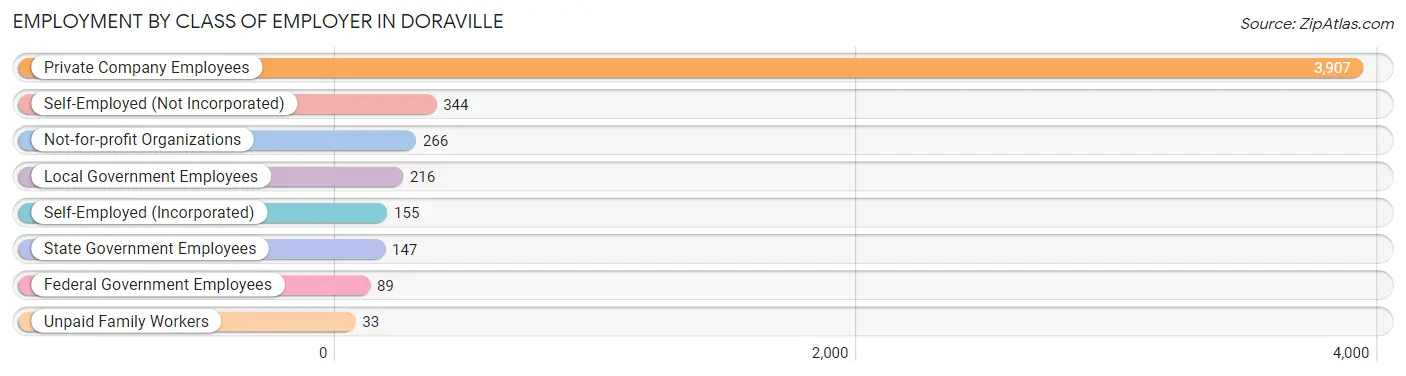
| Employer Class | # Employees | % Employees |
| Private Company Employees | 3,907 | 75.8% |
| Self-Employed (Incorporated) | 155 | 3.0% |
| Self-Employed (Not Incorporated) | 344 | 6.7% |
| Not-for-profit Organizations | 266 | 5.2% |
| Local Government Employees | 216 | 4.2% |
| State Government Employees | 147 | 2.9% |
| Federal Government Employees | 89 | 1.7% |
| Unpaid Family Workers | 33 | 0.6% |
| Total | 5,157 | 100.0% |
Employment Status by Age in Doraville
According to the labor force statistics for Doraville, out of the total population over 16 years of age (8,084), 69.6% or 5,626 individuals are in the labor force, with 2.0% or 113 of them unemployed. The age group with the highest labor force participation rate is 45 to 54 years, with 90.2% or 1,284 individuals in the labor force. Within the labor force, the 25 to 29 years age range has the highest percentage of unemployed individuals, with 9.5% or 38 of them being unemployed.
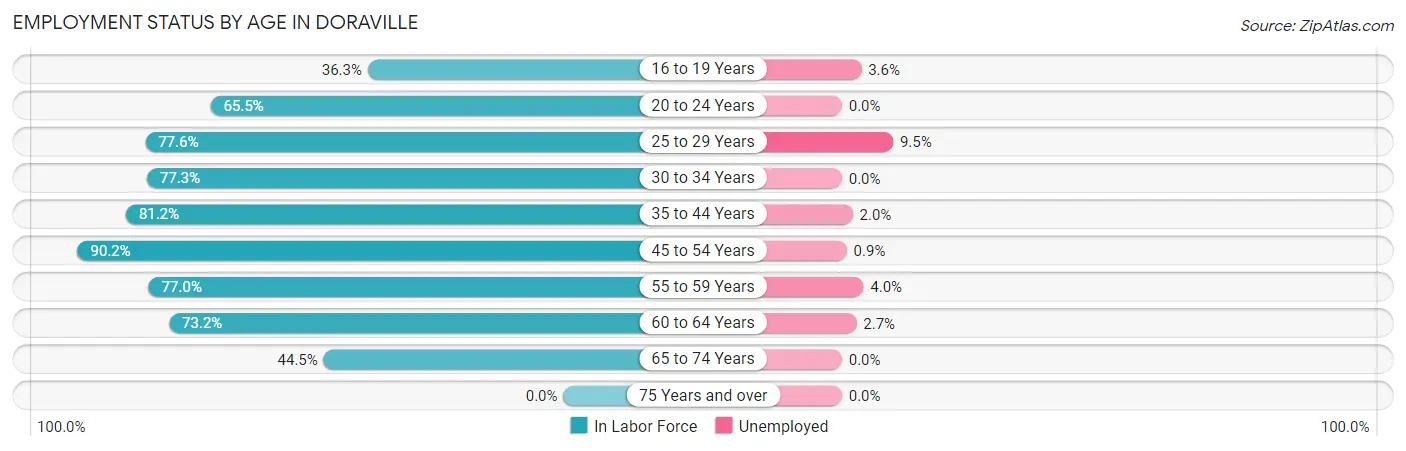
| Age Bracket | In Labor Force | Unemployed |
| 16 to 19 Years | 223 (36.3%) | 8 (3.6%) |
| 20 to 24 Years | 283 (65.5%) | 0 (0.0%) |
| 25 to 29 Years | 402 (77.6%) | 38 (9.5%) |
| 30 to 34 Years | 735 (77.3%) | 0 (0.0%) |
| 35 to 44 Years | 1,415 (81.2%) | 28 (2.0%) |
| 45 to 54 Years | 1,284 (90.2%) | 12 (0.9%) |
| 55 to 59 Years | 352 (77.0%) | 14 (4.0%) |
| 60 to 64 Years | 486 (73.2%) | 13 (2.7%) |
| 65 to 74 Years | 443 (44.5%) | 0 (0.0%) |
| 75 Years and over | 0 (0.0%) | 0 (0.0%) |
| Total | 5,626 (69.6%) | 113 (2.0%) |
Employment Status by Educational Attainment in Doraville
According to labor force statistics for Doraville, 81.2% of individuals (4,675) out of the total population between 25 and 64 years of age (5,757) are in the labor force, with 2.2% or 103 of them being unemployed. The group with the highest labor force participation rate are those with the educational attainment of bachelor's degree or higher, with 94.3% or 1,731 individuals in the labor force. Within the labor force, individuals with college / associate degree education have the highest percentage of unemployment, with 5.1% or 33 of them being unemployed.
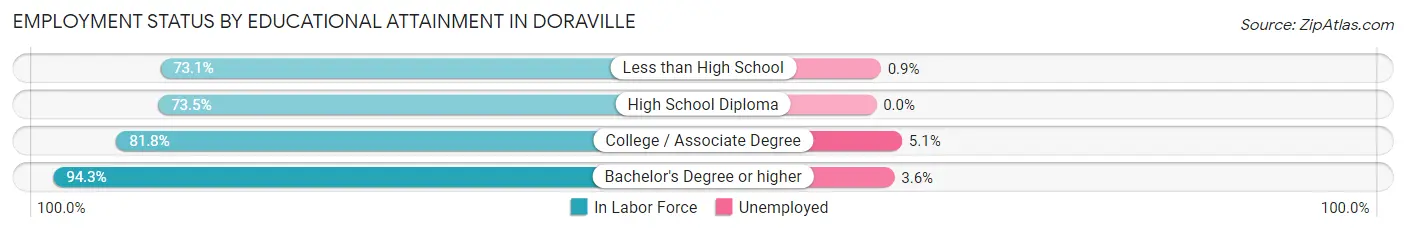
| Educational Attainment | In Labor Force | Unemployed |
| Less than High School | 1,017 (73.1%) | 13 (0.9%) |
| High School Diploma | 1,277 (73.5%) | 0 (0.0%) |
| College / Associate Degree | 649 (81.8%) | 40 (5.1%) |
| Bachelor's Degree or higher | 1,731 (94.3%) | 66 (3.6%) |
| Total | 4,675 (81.2%) | 127 (2.2%) |
Employment Occupations by Sex in Doraville
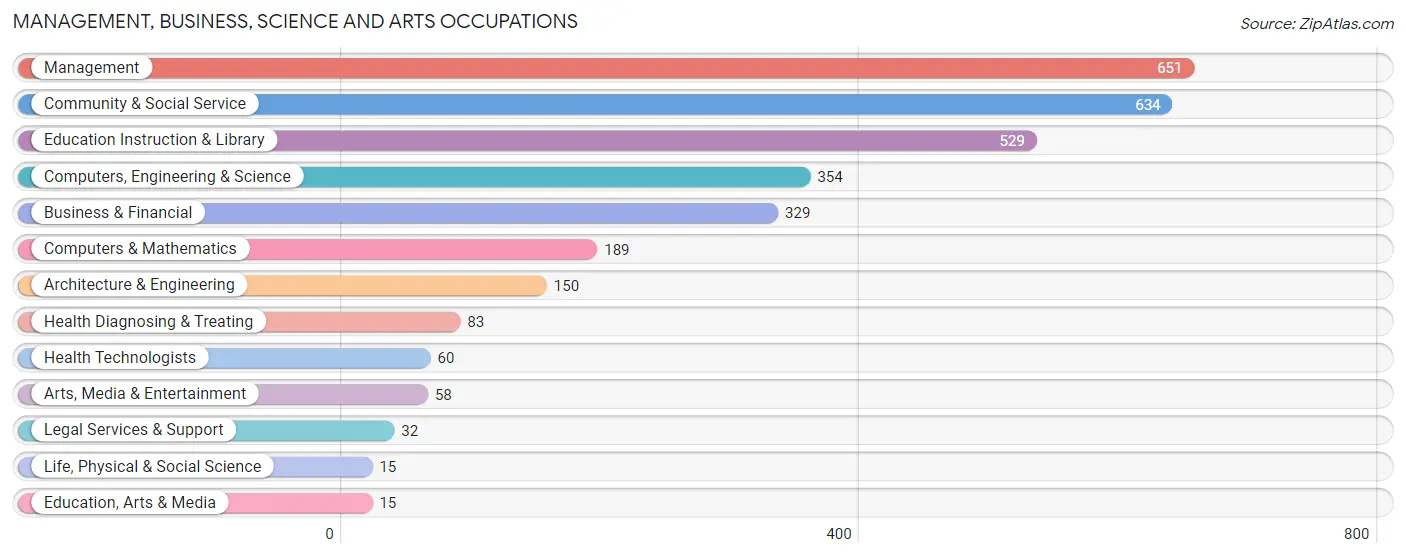
Management, Business, Science and Arts Occupations
The most common Management, Business, Science and Arts occupations in Doraville are Management (651 | 11.8%), Community & Social Service (634 | 11.5%), Education Instruction & Library (529 | 9.6%), Computers, Engineering & Science (354 | 6.4%), and Business & Financial (329 | 6.0%).
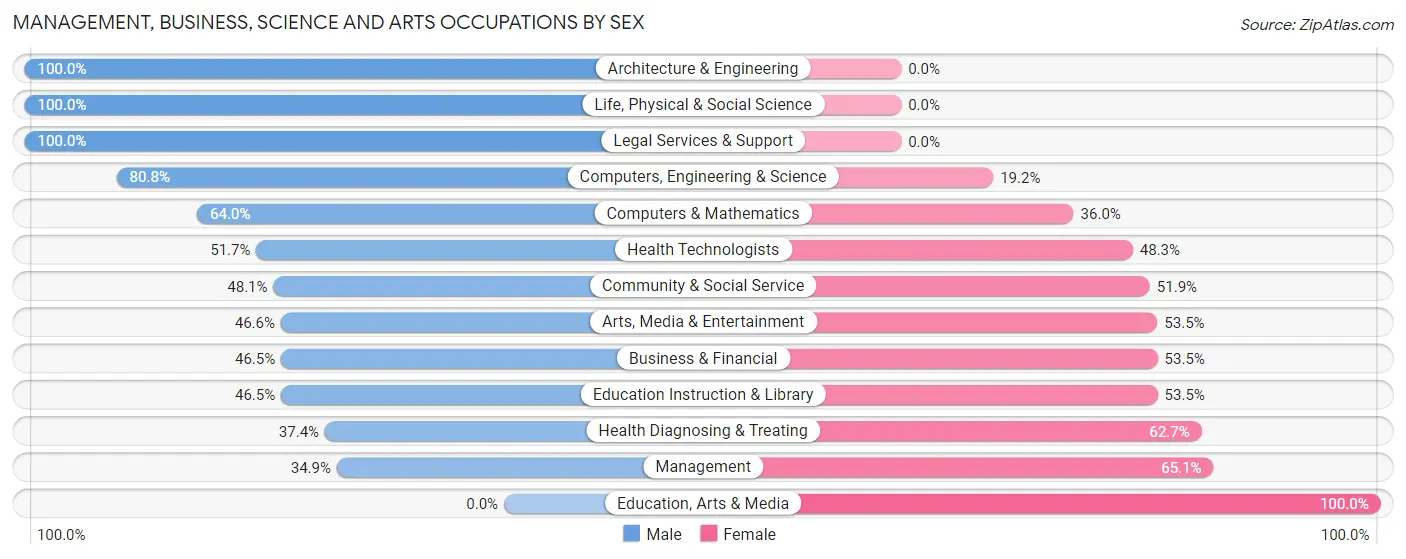
Management, Business, Science and Arts Occupations by Sex
Within the Management, Business, Science and Arts occupations in Doraville, the most male-oriented occupations are Architecture & Engineering (100.0%), Life, Physical & Social Science (100.0%), and Legal Services & Support (100.0%), while the most female-oriented occupations are Education, Arts & Media (100.0%), Management (65.1%), and Health Diagnosing & Treating (62.6%).
| Occupation | Male | Female |
| Management | 227 (34.9%) | 424 (65.1%) |
| Business & Financial | 153 (46.5%) | 176 (53.5%) |
| Computers, Engineering & Science | 286 (80.8%) | 68 (19.2%) |
| Computers & Mathematics | 121 (64.0%) | 68 (36.0%) |
| Architecture & Engineering | 150 (100.0%) | 0 (0.0%) |
| Life, Physical & Social Science | 15 (100.0%) | 0 (0.0%) |
| Community & Social Service | 305 (48.1%) | 329 (51.9%) |
| Education, Arts & Media | 0 (0.0%) | 15 (100.0%) |
| Legal Services & Support | 32 (100.0%) | 0 (0.0%) |
| Education Instruction & Library | 246 (46.5%) | 283 (53.5%) |
| Arts, Media & Entertainment | 27 (46.6%) | 31 (53.4%) |
| Health Diagnosing & Treating | 31 (37.3%) | 52 (62.6%) |
| Health Technologists | 31 (51.7%) | 29 (48.3%) |
| Total (Category) | 1,002 (48.8%) | 1,049 (51.1%) |
| Total (Overall) | 2,792 (50.7%) | 2,718 (49.3%) |
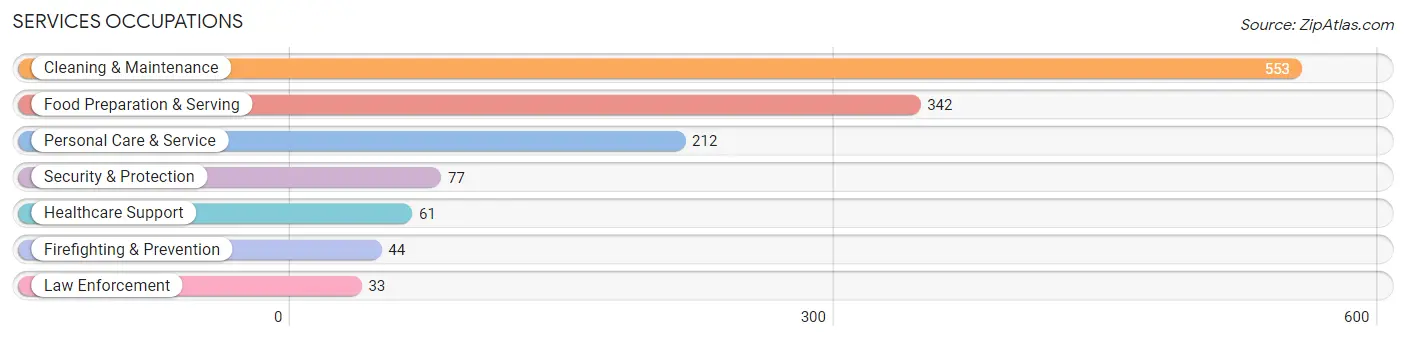
Services Occupations
The most common Services occupations in Doraville are Cleaning & Maintenance (553 | 10.0%), Food Preparation & Serving (342 | 6.2%), Personal Care & Service (212 | 3.8%), Security & Protection (77 | 1.4%), and Healthcare Support (61 | 1.1%).
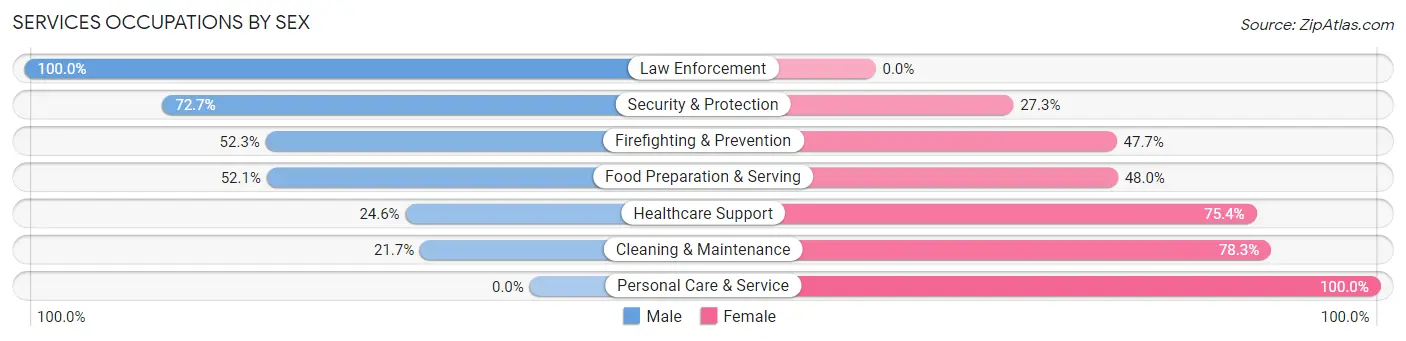
Services Occupations by Sex
Within the Services occupations in Doraville, the most male-oriented occupations are Law Enforcement (100.0%), Security & Protection (72.7%), and Firefighting & Prevention (52.3%), while the most female-oriented occupations are Personal Care & Service (100.0%), Cleaning & Maintenance (78.3%), and Healthcare Support (75.4%).
| Occupation | Male | Female |
| Healthcare Support | 15 (24.6%) | 46 (75.4%) |
| Security & Protection | 56 (72.7%) | 21 (27.3%) |
| Firefighting & Prevention | 23 (52.3%) | 21 (47.7%) |
| Law Enforcement | 33 (100.0%) | 0 (0.0%) |
| Food Preparation & Serving | 178 (52.0%) | 164 (47.9%) |
| Cleaning & Maintenance | 120 (21.7%) | 433 (78.3%) |
| Personal Care & Service | 0 (0.0%) | 212 (100.0%) |
| Total (Category) | 369 (29.6%) | 876 (70.4%) |
| Total (Overall) | 2,792 (50.7%) | 2,718 (49.3%) |
Sales and Office Occupations
The most common Sales and Office occupations in Doraville are Sales & Related (573 | 10.4%), and Office & Administration (304 | 5.5%).
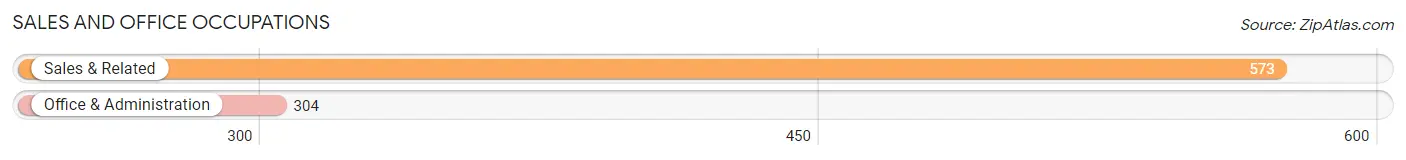
Sales and Office Occupations by Sex
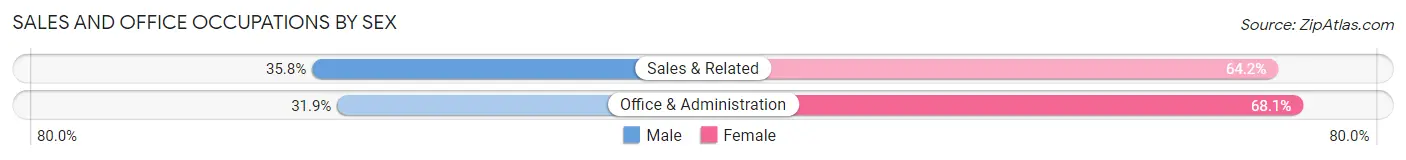
| Occupation | Male | Female |
| Sales & Related | 205 (35.8%) | 368 (64.2%) |
| Office & Administration | 97 (31.9%) | 207 (68.1%) |
| Total (Category) | 302 (34.4%) | 575 (65.6%) |
| Total (Overall) | 2,792 (50.7%) | 2,718 (49.3%) |
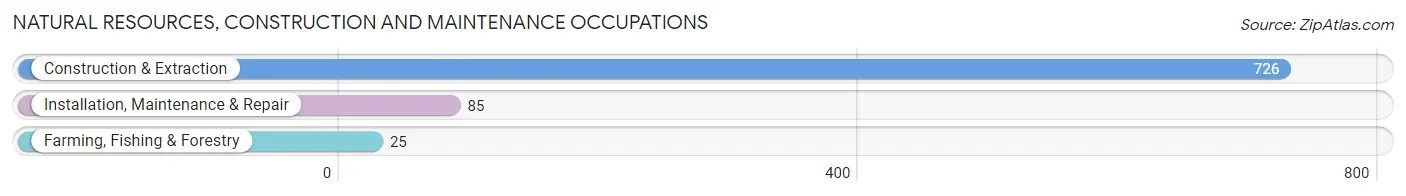
Natural Resources, Construction and Maintenance Occupations
The most common Natural Resources, Construction and Maintenance occupations in Doraville are Construction & Extraction (726 | 13.2%), Installation, Maintenance & Repair (85 | 1.5%), and Farming, Fishing & Forestry (25 | 0.4%).
Natural Resources, Construction and Maintenance Occupations by Sex
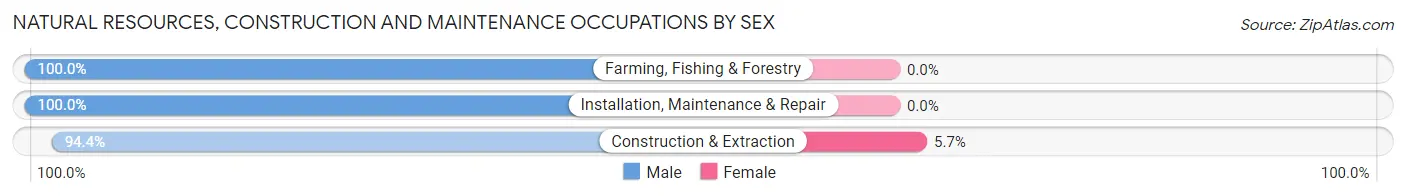
| Occupation | Male | Female |
| Farming, Fishing & Forestry | 25 (100.0%) | 0 (0.0%) |
| Construction & Extraction | 685 (94.4%) | 41 (5.7%) |
| Installation, Maintenance & Repair | 85 (100.0%) | 0 (0.0%) |
| Total (Category) | 795 (95.1%) | 41 (4.9%) |
| Total (Overall) | 2,792 (50.7%) | 2,718 (49.3%) |
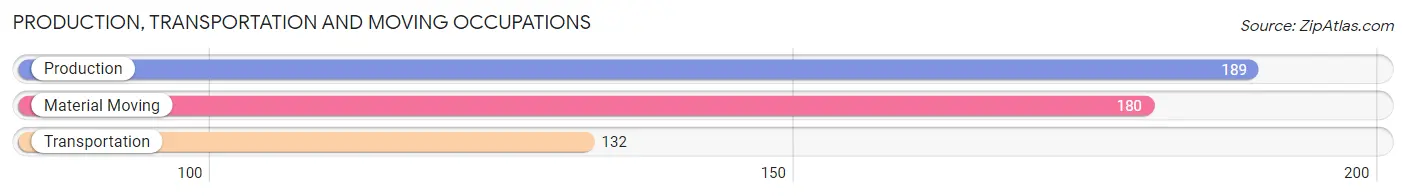
Production, Transportation and Moving Occupations
The most common Production, Transportation and Moving occupations in Doraville are Production (189 | 3.4%), Material Moving (180 | 3.3%), and Transportation (132 | 2.4%).
Production, Transportation and Moving Occupations by Sex
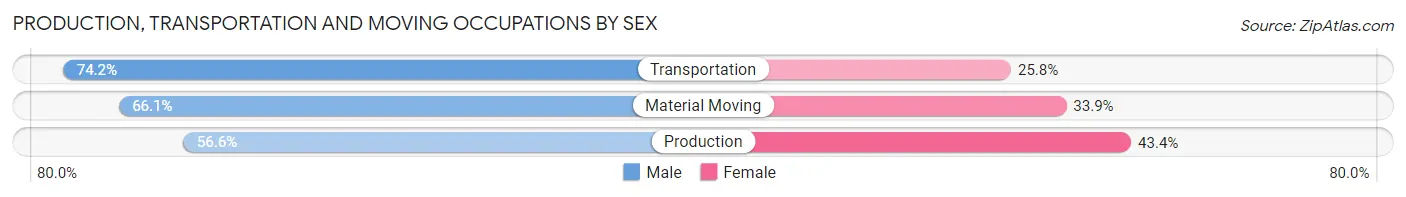
| Occupation | Male | Female |
| Production | 107 (56.6%) | 82 (43.4%) |
| Transportation | 98 (74.2%) | 34 (25.8%) |
| Material Moving | 119 (66.1%) | 61 (33.9%) |
| Total (Category) | 324 (64.7%) | 177 (35.3%) |
| Total (Overall) | 2,792 (50.7%) | 2,718 (49.3%) |
Employment Industries by Sex in Doraville
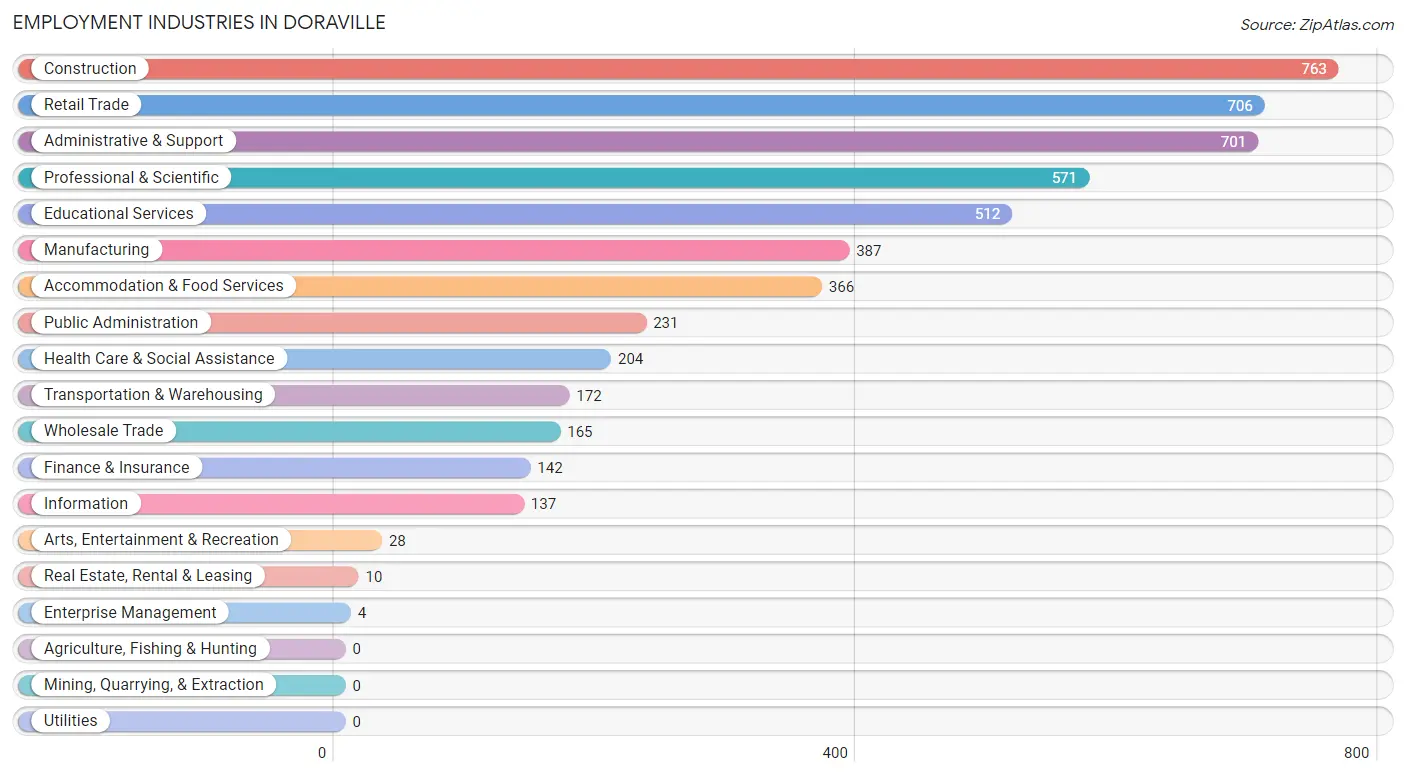
Employment Industries in Doraville
The major employment industries in Doraville include Construction (763 | 13.9%), Retail Trade (706 | 12.8%), Administrative & Support (701 | 12.7%), Professional & Scientific (571 | 10.4%), and Educational Services (512 | 9.3%).
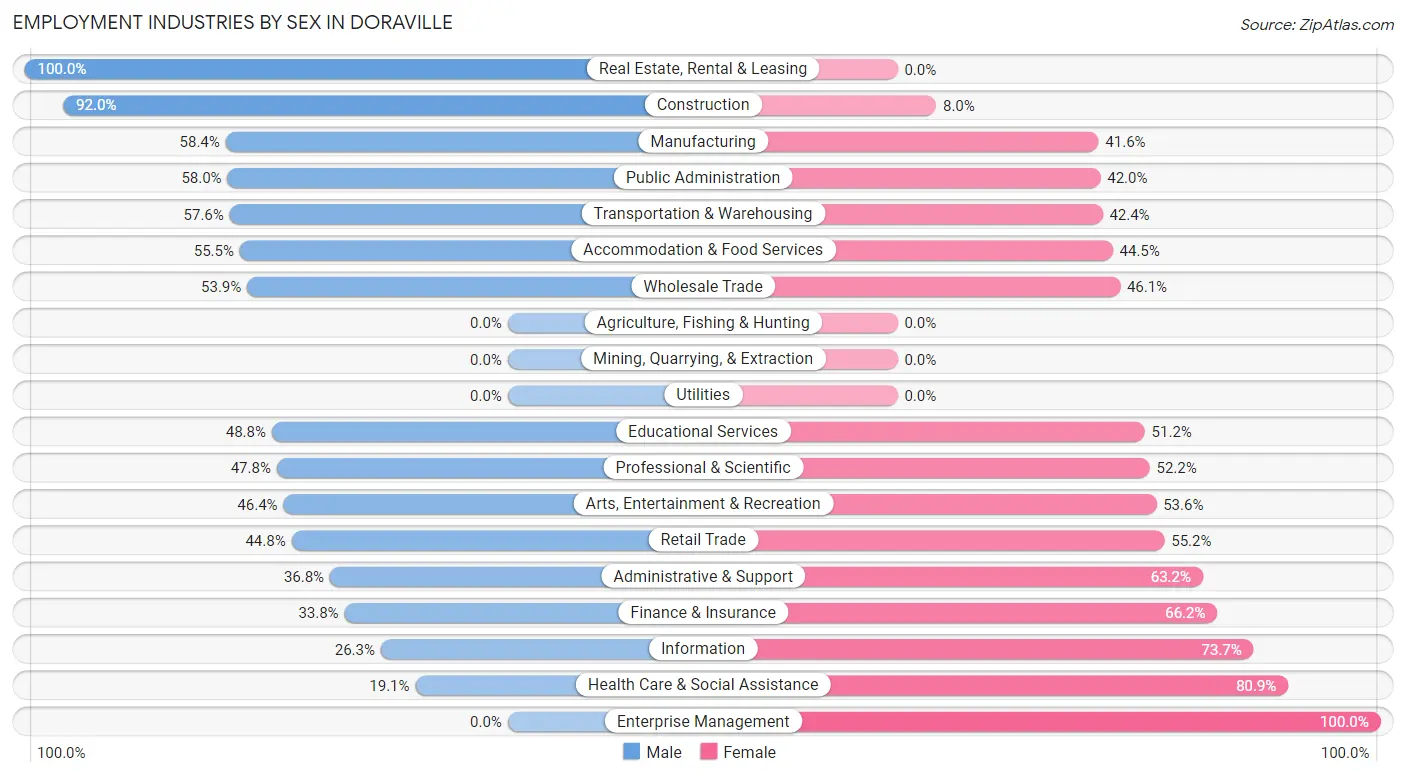
Employment Industries by Sex in Doraville
The Doraville industries that see more men than women are Real Estate, Rental & Leasing (100.0%), Construction (92.0%), and Manufacturing (58.4%), whereas the industries that tend to have a higher number of women are Enterprise Management (100.0%), Health Care & Social Assistance (80.9%), and Information (73.7%).
| Industry | Male | Female |
| Agriculture, Fishing & Hunting | 0 (0.0%) | 0 (0.0%) |
| Mining, Quarrying, & Extraction | 0 (0.0%) | 0 (0.0%) |
| Construction | 702 (92.0%) | 61 (8.0%) |
| Manufacturing | 226 (58.4%) | 161 (41.6%) |
| Wholesale Trade | 89 (53.9%) | 76 (46.1%) |
| Retail Trade | 316 (44.8%) | 390 (55.2%) |
| Transportation & Warehousing | 99 (57.6%) | 73 (42.4%) |
| Utilities | 0 (0.0%) | 0 (0.0%) |
| Information | 36 (26.3%) | 101 (73.7%) |
| Finance & Insurance | 48 (33.8%) | 94 (66.2%) |
| Real Estate, Rental & Leasing | 10 (100.0%) | 0 (0.0%) |
| Professional & Scientific | 273 (47.8%) | 298 (52.2%) |
| Enterprise Management | 0 (0.0%) | 4 (100.0%) |
| Administrative & Support | 258 (36.8%) | 443 (63.2%) |
| Educational Services | 250 (48.8%) | 262 (51.2%) |
| Health Care & Social Assistance | 39 (19.1%) | 165 (80.9%) |
| Arts, Entertainment & Recreation | 13 (46.4%) | 15 (53.6%) |
| Accommodation & Food Services | 203 (55.5%) | 163 (44.5%) |
| Public Administration | 134 (58.0%) | 97 (42.0%) |
| Total | 2,792 (50.7%) | 2,718 (49.3%) |
Education in Doraville
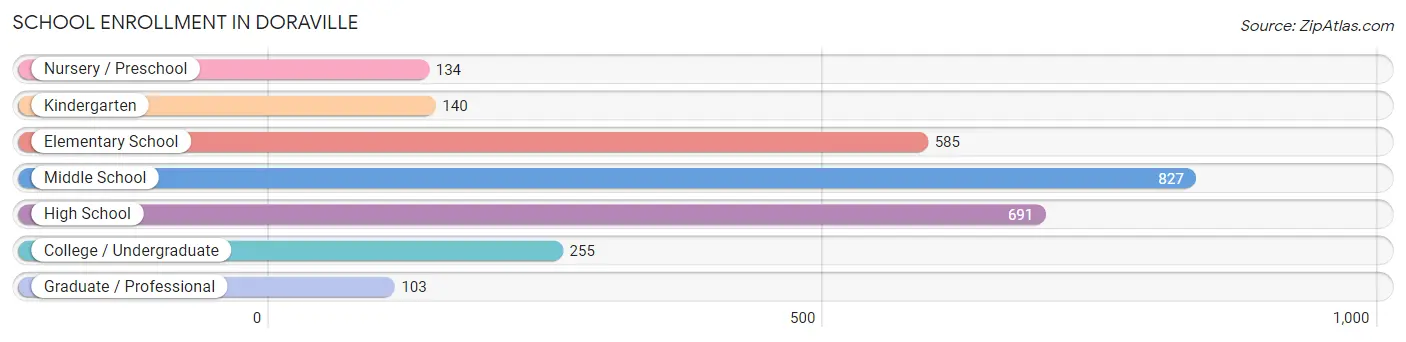
School Enrollment in Doraville
The most common levels of schooling among the 2,735 students in Doraville are middle school (827 | 30.2%), high school (691 | 25.3%), and elementary school (585 | 21.4%).
| School Level | # Students | % Students |
| Nursery / Preschool | 134 | 4.9% |
| Kindergarten | 140 | 5.1% |
| Elementary School | 585 | 21.4% |
| Middle School | 827 | 30.2% |
| High School | 691 | 25.3% |
| College / Undergraduate | 255 | 9.3% |
| Graduate / Professional | 103 | 3.8% |
| Total | 2,735 | 100.0% |
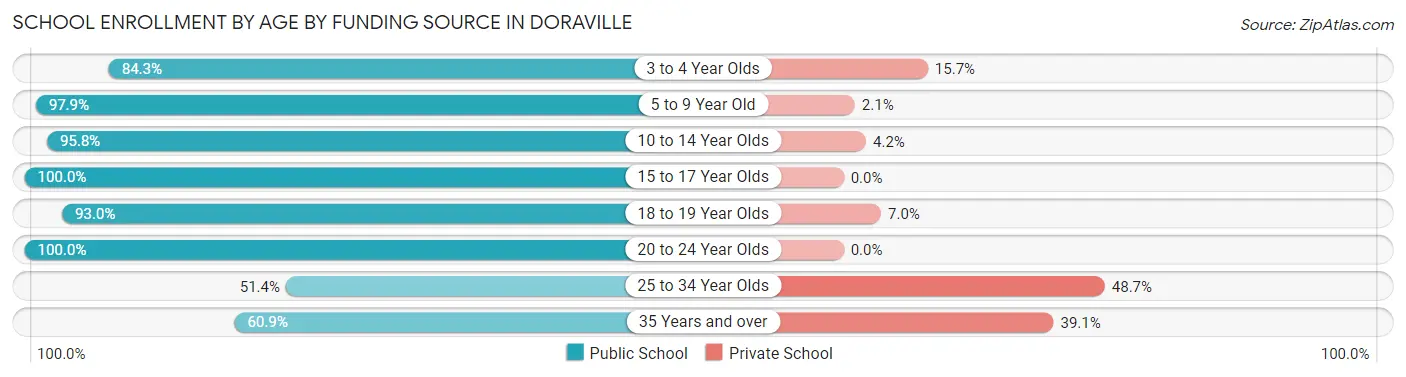
School Enrollment by Age by Funding Source in Doraville
Out of a total of 2,735 students who are enrolled in schools in Doraville, 172 (6.3%) attend a private institution, while the remaining 2,563 (93.7%) are enrolled in public schools. The age group of 25 to 34 year olds has the highest likelihood of being enrolled in private schools, with 18 (48.6% in the age bracket) enrolled. Conversely, the age group of 15 to 17 year olds has the lowest likelihood of being enrolled in a private school, with 350 (100.0% in the age bracket) attending a public institution.
| Age Bracket | Public School | Private School |
| 3 to 4 Year Olds | 86 (84.3%) | 16 (15.7%) |
| 5 to 9 Year Old | 655 (97.9%) | 14 (2.1%) |
| 10 to 14 Year Olds | 942 (95.8%) | 41 (4.2%) |
| 15 to 17 Year Olds | 350 (100.0%) | 0 (0.0%) |
| 18 to 19 Year Olds | 307 (93.0%) | 23 (7.0%) |
| 20 to 24 Year Olds | 108 (100.0%) | 0 (0.0%) |
| 25 to 34 Year Olds | 19 (51.3%) | 18 (48.6%) |
| 35 Years and over | 95 (60.9%) | 61 (39.1%) |
| Total | 2,563 (93.7%) | 172 (6.3%) |
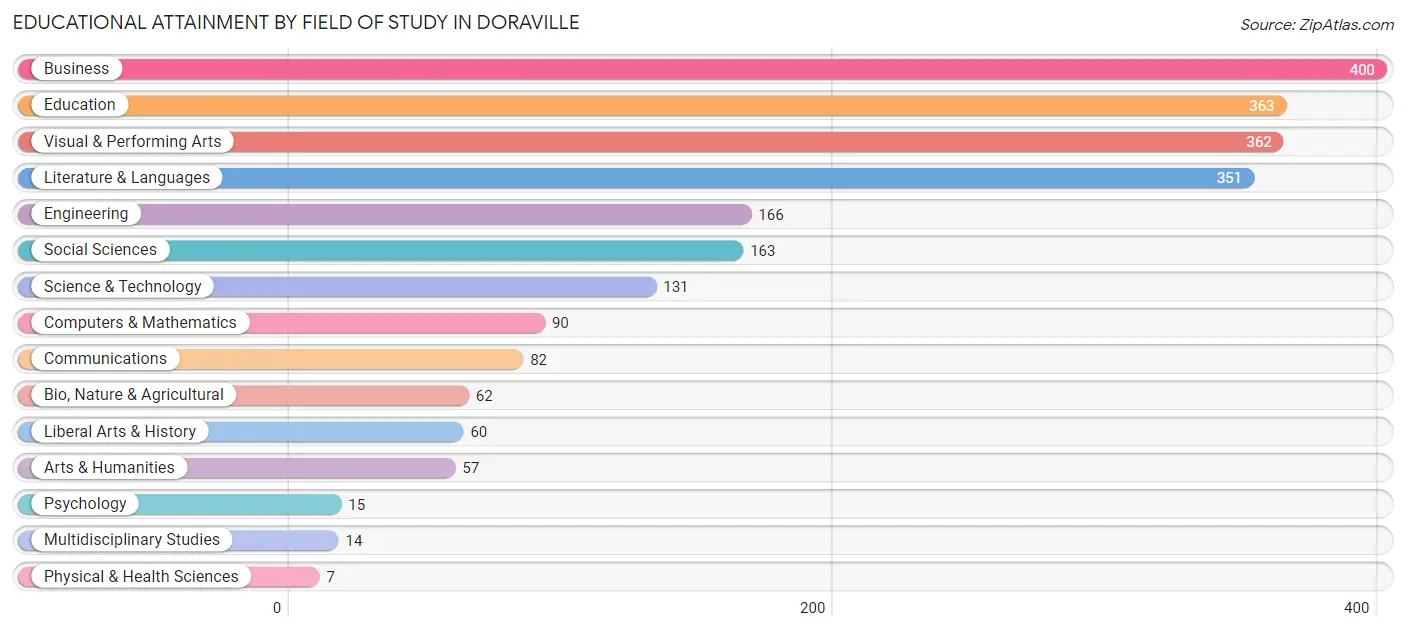
Educational Attainment by Field of Study in Doraville
Business (400 | 17.2%), education (363 | 15.6%), visual & performing arts (362 | 15.6%), literature & languages (351 | 15.1%), and engineering (166 | 7.1%) are the most common fields of study among 2,323 individuals in Doraville who have obtained a bachelor's degree or higher.
| Field of Study | # Graduates | % Graduates |
| Computers & Mathematics | 90 | 3.9% |
| Bio, Nature & Agricultural | 62 | 2.7% |
| Physical & Health Sciences | 7 | 0.3% |
| Psychology | 15 | 0.6% |
| Social Sciences | 163 | 7.0% |
| Engineering | 166 | 7.1% |
| Multidisciplinary Studies | 14 | 0.6% |
| Science & Technology | 131 | 5.6% |
| Business | 400 | 17.2% |
| Education | 363 | 15.6% |
| Literature & Languages | 351 | 15.1% |
| Liberal Arts & History | 60 | 2.6% |
| Visual & Performing Arts | 362 | 15.6% |
| Communications | 82 | 3.5% |
| Arts & Humanities | 57 | 2.5% |
| Total | 2,323 | 100.0% |
Transportation & Commute in Doraville
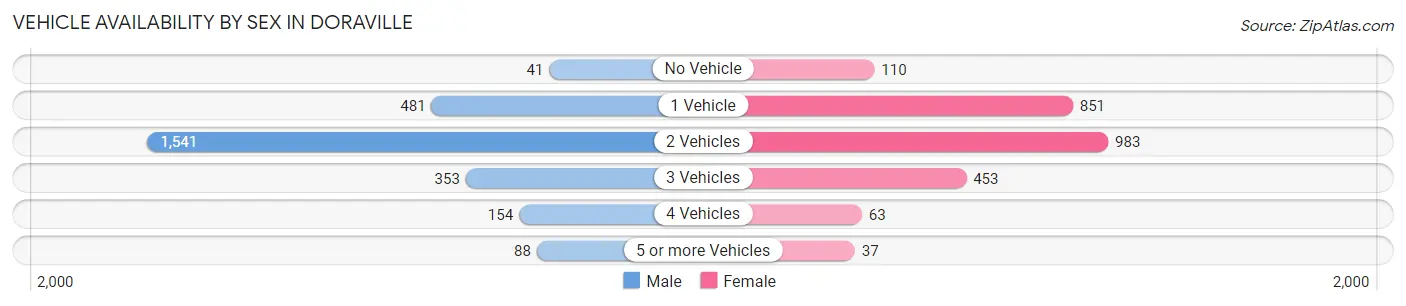
Vehicle Availability by Sex in Doraville
The most prevalent vehicle ownership categories in Doraville are males with 2 vehicles (1,541, accounting for 58.0%) and females with 2 vehicles (983, making up 61.7%).
| Vehicles Available | Male | Female |
| No Vehicle | 41 (1.5%) | 110 (4.4%) |
| 1 Vehicle | 481 (18.1%) | 851 (34.1%) |
| 2 Vehicles | 1,541 (58.0%) | 983 (39.4%) |
| 3 Vehicles | 353 (13.3%) | 453 (18.1%) |
| 4 Vehicles | 154 (5.8%) | 63 (2.5%) |
| 5 or more Vehicles | 88 (3.3%) | 37 (1.5%) |
| Total | 2,658 (100.0%) | 2,497 (100.0%) |
Commute Time in Doraville
The most frequently occuring commute durations in Doraville are 20 to 24 minutes (1,008 commuters, 22.8%), 10 to 14 minutes (699 commuters, 15.8%), and 15 to 19 minutes (598 commuters, 13.5%).
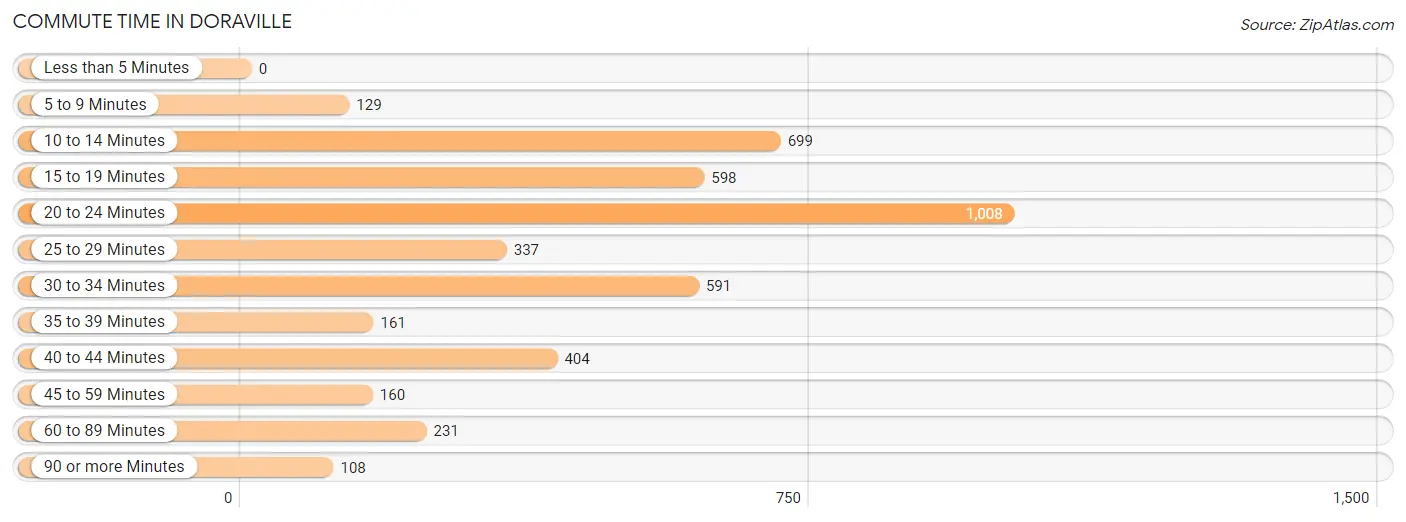
| Commute Time | # Commuters | % Commuters |
| Less than 5 Minutes | 0 | 0.0% |
| 5 to 9 Minutes | 129 | 2.9% |
| 10 to 14 Minutes | 699 | 15.8% |
| 15 to 19 Minutes | 598 | 13.5% |
| 20 to 24 Minutes | 1,008 | 22.8% |
| 25 to 29 Minutes | 337 | 7.6% |
| 30 to 34 Minutes | 591 | 13.4% |
| 35 to 39 Minutes | 161 | 3.6% |
| 40 to 44 Minutes | 404 | 9.1% |
| 45 to 59 Minutes | 160 | 3.6% |
| 60 to 89 Minutes | 231 | 5.2% |
| 90 or more Minutes | 108 | 2.4% |
Commute Time by Sex in Doraville
The most common commute times in Doraville are 20 to 24 minutes (632 commuters, 27.9%) for males and 20 to 24 minutes (376 commuters, 17.4%) for females.
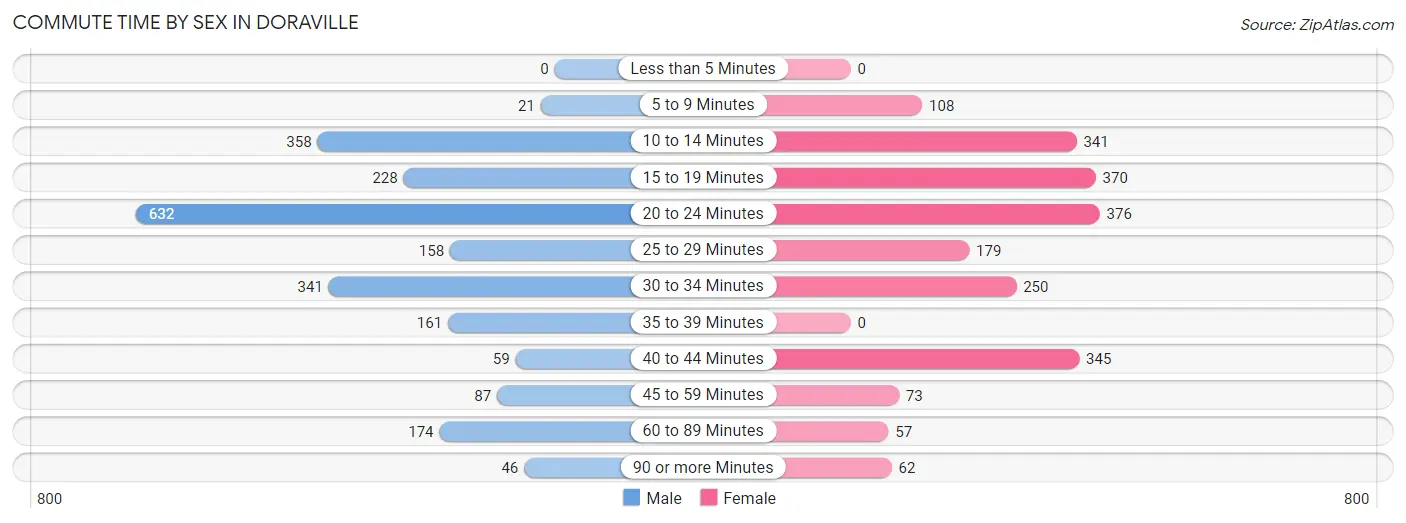
| Commute Time | Male | Female |
| Less than 5 Minutes | 0 (0.0%) | 0 (0.0%) |
| 5 to 9 Minutes | 21 (0.9%) | 108 (5.0%) |
| 10 to 14 Minutes | 358 (15.8%) | 341 (15.8%) |
| 15 to 19 Minutes | 228 (10.1%) | 370 (17.1%) |
| 20 to 24 Minutes | 632 (27.9%) | 376 (17.4%) |
| 25 to 29 Minutes | 158 (7.0%) | 179 (8.3%) |
| 30 to 34 Minutes | 341 (15.1%) | 250 (11.6%) |
| 35 to 39 Minutes | 161 (7.1%) | 0 (0.0%) |
| 40 to 44 Minutes | 59 (2.6%) | 345 (16.0%) |
| 45 to 59 Minutes | 87 (3.8%) | 73 (3.4%) |
| 60 to 89 Minutes | 174 (7.7%) | 57 (2.6%) |
| 90 or more Minutes | 46 (2.0%) | 62 (2.9%) |
Time of Departure to Work by Sex in Doraville
The most frequent times of departure to work in Doraville are 7:00 AM to 7:29 AM (525, 23.2%) for males and 8:00 AM to 8:29 AM (349, 16.2%) for females.
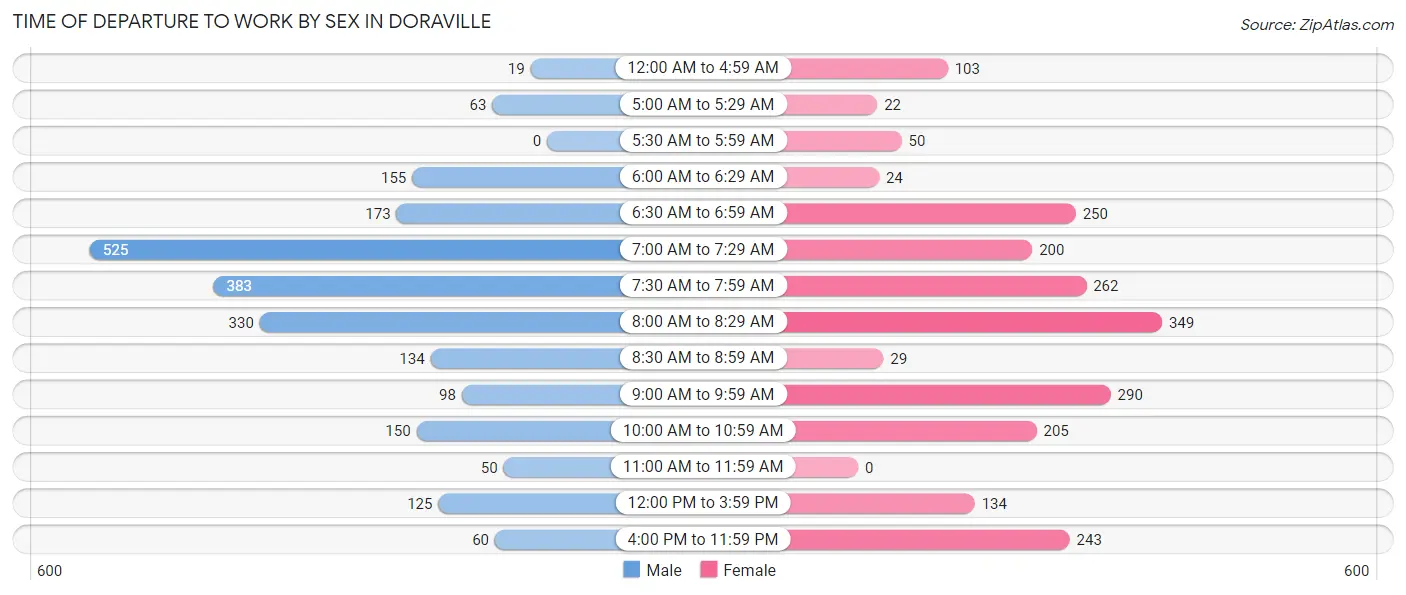
| Time of Departure | Male | Female |
| 12:00 AM to 4:59 AM | 19 (0.8%) | 103 (4.8%) |
| 5:00 AM to 5:29 AM | 63 (2.8%) | 22 (1.0%) |
| 5:30 AM to 5:59 AM | 0 (0.0%) | 50 (2.3%) |
| 6:00 AM to 6:29 AM | 155 (6.8%) | 24 (1.1%) |
| 6:30 AM to 6:59 AM | 173 (7.6%) | 250 (11.6%) |
| 7:00 AM to 7:29 AM | 525 (23.2%) | 200 (9.2%) |
| 7:30 AM to 7:59 AM | 383 (16.9%) | 262 (12.1%) |
| 8:00 AM to 8:29 AM | 330 (14.6%) | 349 (16.2%) |
| 8:30 AM to 8:59 AM | 134 (5.9%) | 29 (1.3%) |
| 9:00 AM to 9:59 AM | 98 (4.3%) | 290 (13.4%) |
| 10:00 AM to 10:59 AM | 150 (6.6%) | 205 (9.5%) |
| 11:00 AM to 11:59 AM | 50 (2.2%) | 0 (0.0%) |
| 12:00 PM to 3:59 PM | 125 (5.5%) | 134 (6.2%) |
| 4:00 PM to 11:59 PM | 60 (2.6%) | 243 (11.2%) |
| Total | 2,265 (100.0%) | 2,161 (100.0%) |
Housing Occupancy in Doraville
Occupancy by Ownership in Doraville
Of the total 3,807 dwellings in Doraville, owner-occupied units account for 2,247 (59.0%), while renter-occupied units make up 1,560 (41.0%).
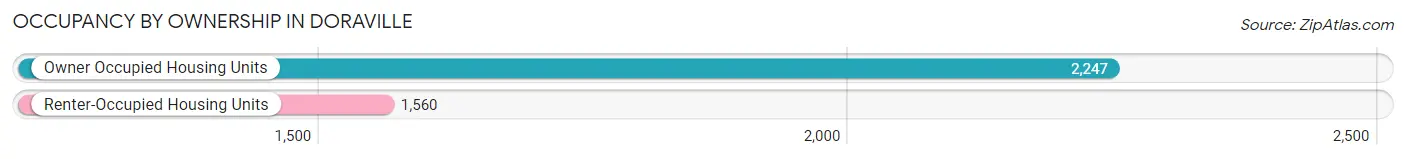
| Occupancy | # Housing Units | % Housing Units |
| Owner Occupied Housing Units | 2,247 | 59.0% |
| Renter-Occupied Housing Units | 1,560 | 41.0% |
| Total Occupied Housing Units | 3,807 | 100.0% |
Occupancy by Household Size in Doraville
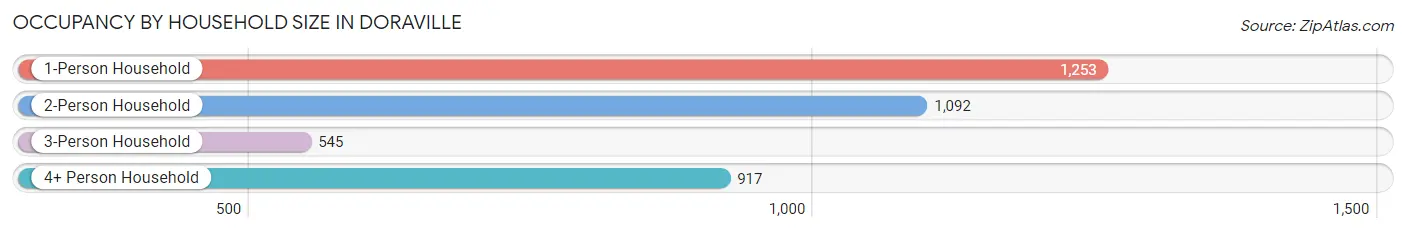
| Household Size | # Housing Units | % Housing Units |
| 1-Person Household | 1,253 | 32.9% |
| 2-Person Household | 1,092 | 28.7% |
| 3-Person Household | 545 | 14.3% |
| 4+ Person Household | 917 | 24.1% |
| Total Housing Units | 3,807 | 100.0% |
Occupancy by Ownership by Household Size in Doraville
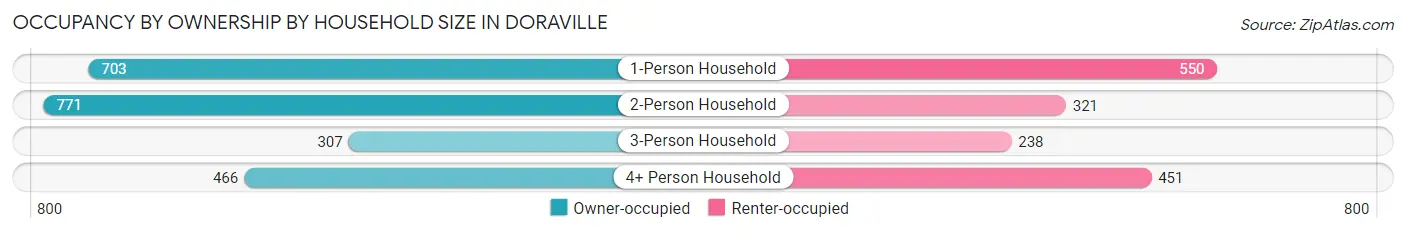
| Household Size | Owner-occupied | Renter-occupied |
| 1-Person Household | 703 (56.1%) | 550 (43.9%) |
| 2-Person Household | 771 (70.6%) | 321 (29.4%) |
| 3-Person Household | 307 (56.3%) | 238 (43.7%) |
| 4+ Person Household | 466 (50.8%) | 451 (49.2%) |
| Total Housing Units | 2,247 (59.0%) | 1,560 (41.0%) |
Occupancy by Educational Attainment in Doraville
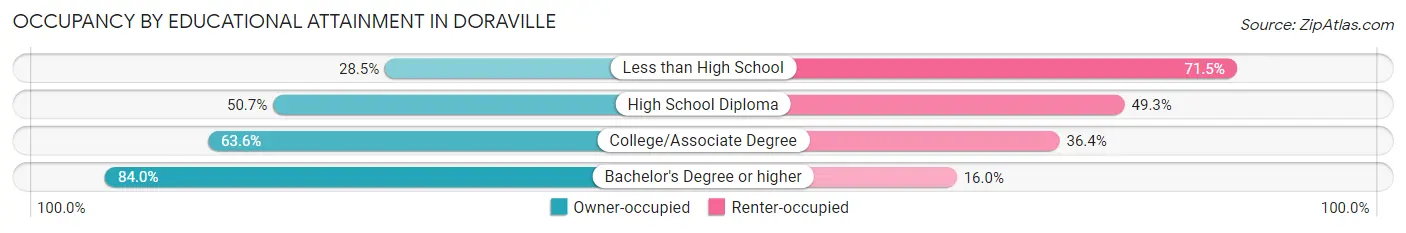
| Household Size | Owner-occupied | Renter-occupied |
| Less than High School | 250 (28.5%) | 626 (71.5%) |
| High School Diploma | 512 (50.7%) | 497 (49.3%) |
| College/Associate Degree | 406 (63.6%) | 232 (36.4%) |
| Bachelor's Degree or higher | 1,079 (84.0%) | 205 (16.0%) |
Occupancy by Age of Householder in Doraville
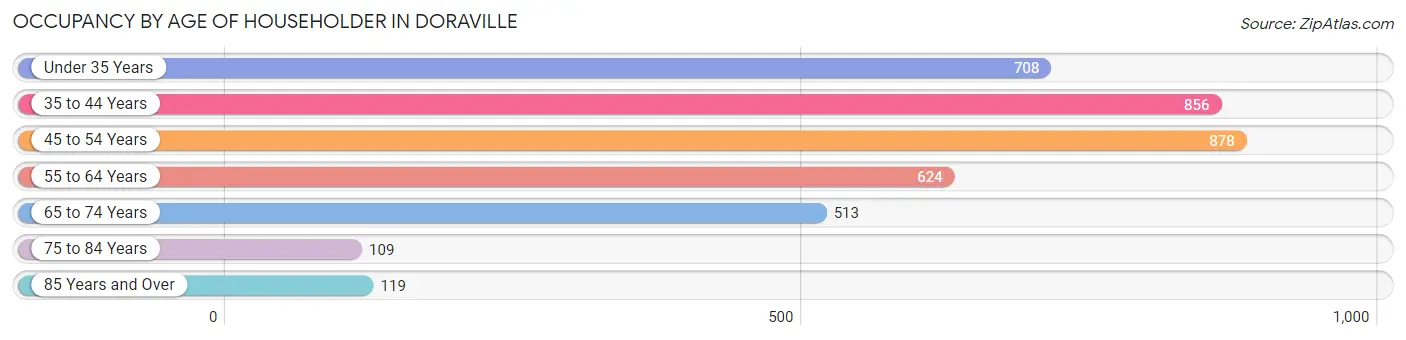
| Age Bracket | # Households | % Households |
| Under 35 Years | 708 | 18.6% |
| 35 to 44 Years | 856 | 22.5% |
| 45 to 54 Years | 878 | 23.1% |
| 55 to 64 Years | 624 | 16.4% |
| 65 to 74 Years | 513 | 13.5% |
| 75 to 84 Years | 109 | 2.9% |
| 85 Years and Over | 119 | 3.1% |
| Total | 3,807 | 100.0% |
Housing Finances in Doraville
Median Income by Occupancy in Doraville
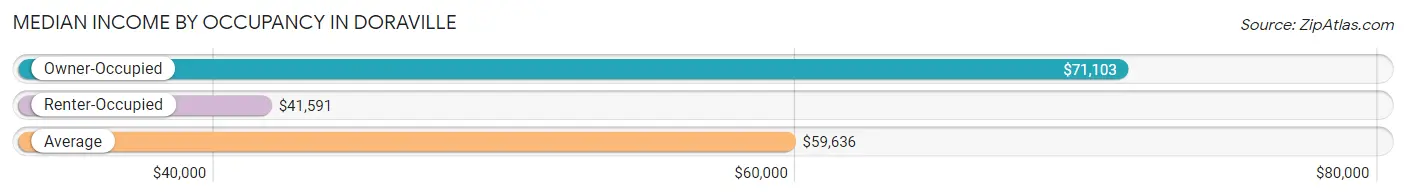
| Occupancy Type | # Households | Median Income |
| Owner-Occupied | 2,247 (59.0%) | $71,103 |
| Renter-Occupied | 1,560 (41.0%) | $41,591 |
| Average | 3,807 (100.0%) | $59,636 |
Occupancy by Householder Income Bracket in Doraville
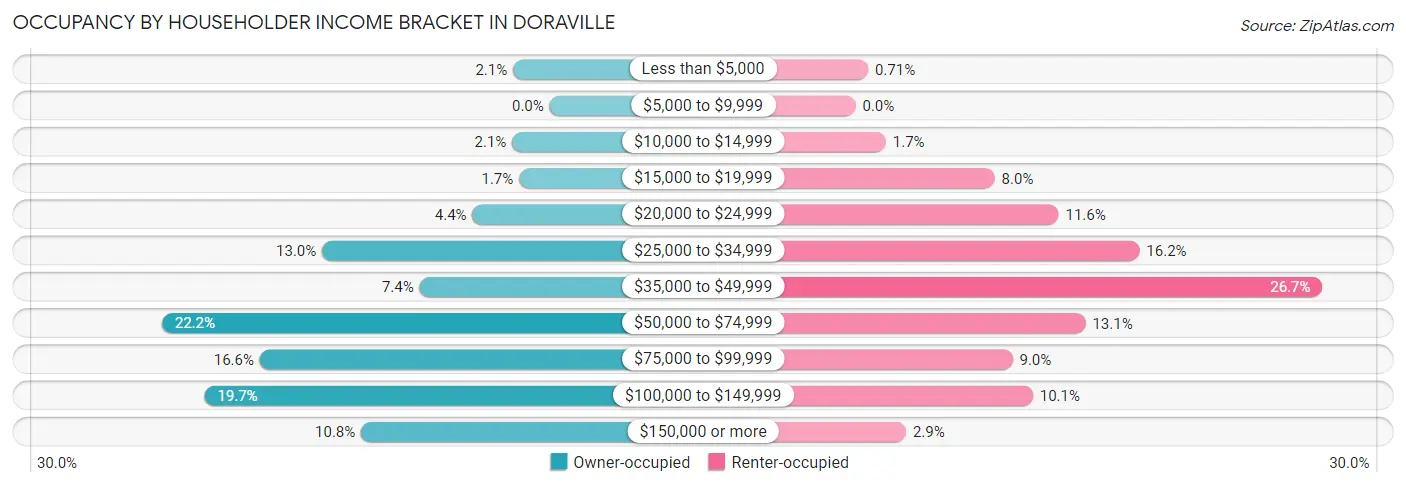
| Income Bracket | Owner-occupied | Renter-occupied |
| Less than $5,000 | 47 (2.1%) | 11 (0.7%) |
| $5,000 to $9,999 | 0 (0.0%) | 0 (0.0%) |
| $10,000 to $14,999 | 48 (2.1%) | 27 (1.7%) |
| $15,000 to $19,999 | 39 (1.7%) | 124 (8.0%) |
| $20,000 to $24,999 | 99 (4.4%) | 181 (11.6%) |
| $25,000 to $34,999 | 292 (13.0%) | 253 (16.2%) |
| $35,000 to $49,999 | 167 (7.4%) | 416 (26.7%) |
| $50,000 to $74,999 | 498 (22.2%) | 205 (13.1%) |
| $75,000 to $99,999 | 372 (16.6%) | 140 (9.0%) |
| $100,000 to $149,999 | 443 (19.7%) | 158 (10.1%) |
| $150,000 or more | 242 (10.8%) | 45 (2.9%) |
| Total | 2,247 (100.0%) | 1,560 (100.0%) |
Monthly Housing Cost Tiers in Doraville
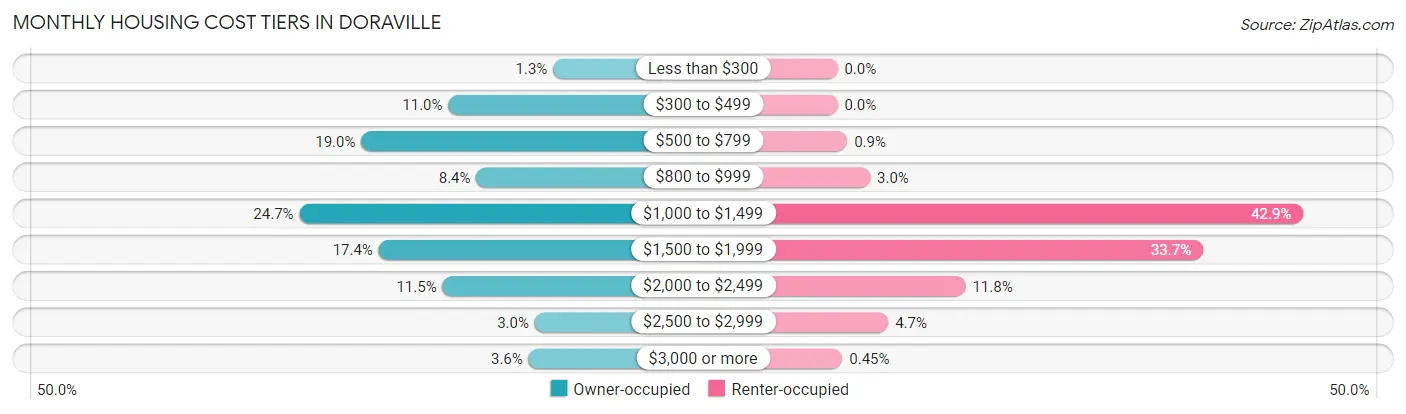
| Monthly Cost | Owner-occupied | Renter-occupied |
| Less than $300 | 30 (1.3%) | 0 (0.0%) |
| $300 to $499 | 247 (11.0%) | 0 (0.0%) |
| $500 to $799 | 427 (19.0%) | 14 (0.9%) |
| $800 to $999 | 189 (8.4%) | 47 (3.0%) |
| $1,000 to $1,499 | 555 (24.7%) | 669 (42.9%) |
| $1,500 to $1,999 | 391 (17.4%) | 525 (33.7%) |
| $2,000 to $2,499 | 259 (11.5%) | 184 (11.8%) |
| $2,500 to $2,999 | 68 (3.0%) | 73 (4.7%) |
| $3,000 or more | 81 (3.6%) | 7 (0.4%) |
| Total | 2,247 (100.0%) | 1,560 (100.0%) |
Physical Housing Characteristics in Doraville
Housing Structures in Doraville
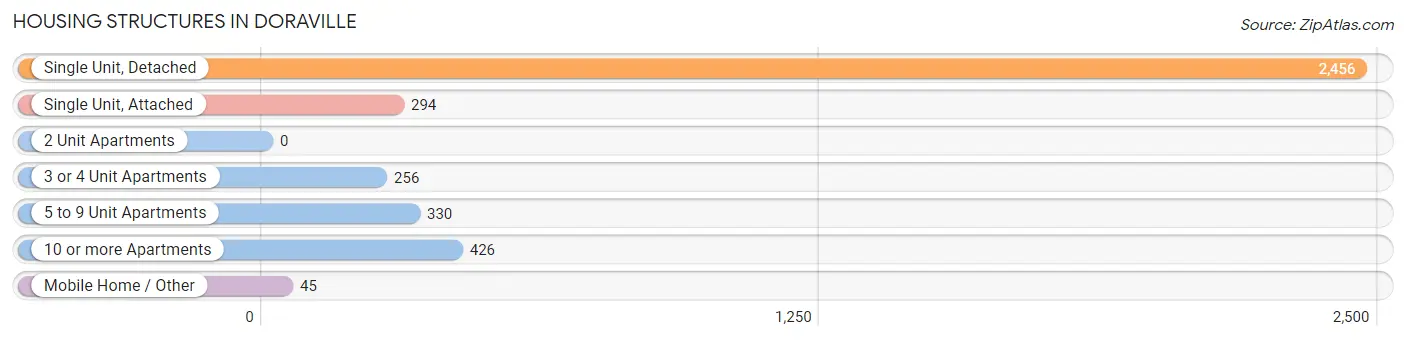
| Structure Type | # Housing Units | % Housing Units |
| Single Unit, Detached | 2,456 | 64.5% |
| Single Unit, Attached | 294 | 7.7% |
| 2 Unit Apartments | 0 | 0.0% |
| 3 or 4 Unit Apartments | 256 | 6.7% |
| 5 to 9 Unit Apartments | 330 | 8.7% |
| 10 or more Apartments | 426 | 11.2% |
| Mobile Home / Other | 45 | 1.2% |
| Total | 3,807 | 100.0% |
Housing Structures by Occupancy in Doraville
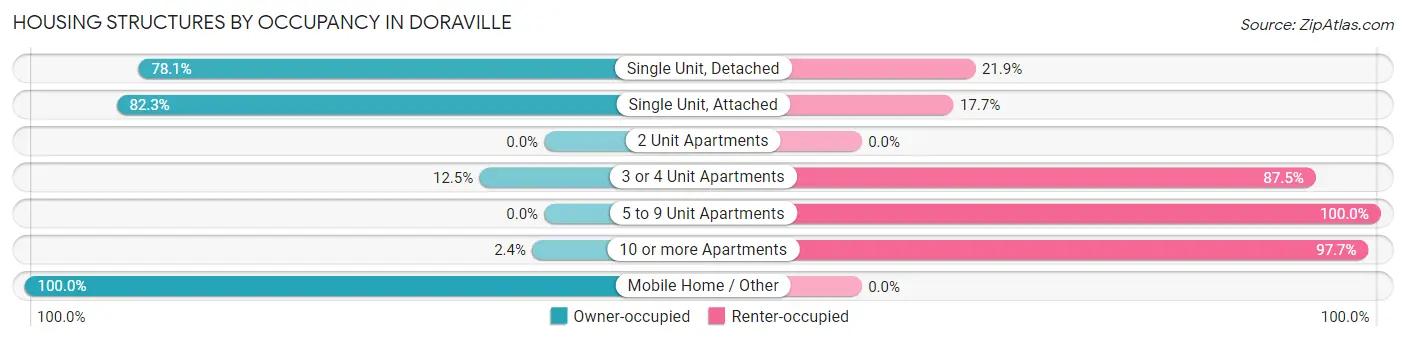
| Structure Type | Owner-occupied | Renter-occupied |
| Single Unit, Detached | 1,918 (78.1%) | 538 (21.9%) |
| Single Unit, Attached | 242 (82.3%) | 52 (17.7%) |
| 2 Unit Apartments | 0 (0.0%) | 0 (0.0%) |
| 3 or 4 Unit Apartments | 32 (12.5%) | 224 (87.5%) |
| 5 to 9 Unit Apartments | 0 (0.0%) | 330 (100.0%) |
| 10 or more Apartments | 10 (2.4%) | 416 (97.7%) |
| Mobile Home / Other | 45 (100.0%) | 0 (0.0%) |
| Total | 2,247 (59.0%) | 1,560 (41.0%) |
Housing Structures by Number of Rooms in Doraville
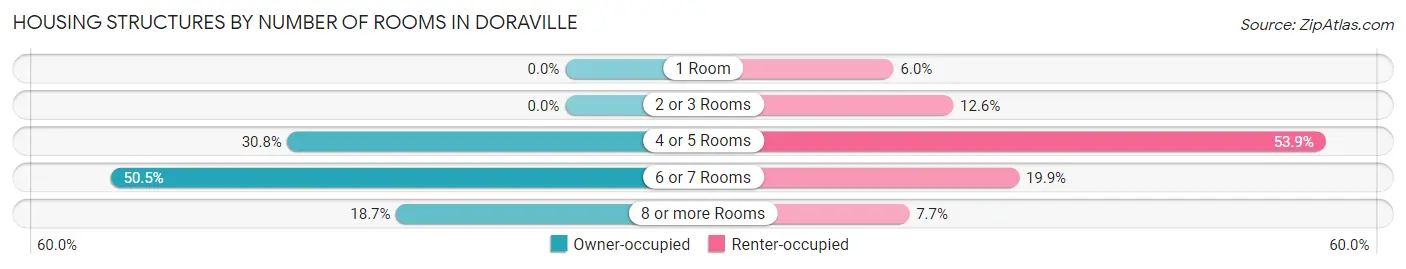
| Number of Rooms | Owner-occupied | Renter-occupied |
| 1 Room | 0 (0.0%) | 93 (6.0%) |
| 2 or 3 Rooms | 0 (0.0%) | 196 (12.6%) |
| 4 or 5 Rooms | 692 (30.8%) | 841 (53.9%) |
| 6 or 7 Rooms | 1,134 (50.5%) | 310 (19.9%) |
| 8 or more Rooms | 421 (18.7%) | 120 (7.7%) |
| Total | 2,247 (100.0%) | 1,560 (100.0%) |
Housing Structure by Heating Type in Doraville
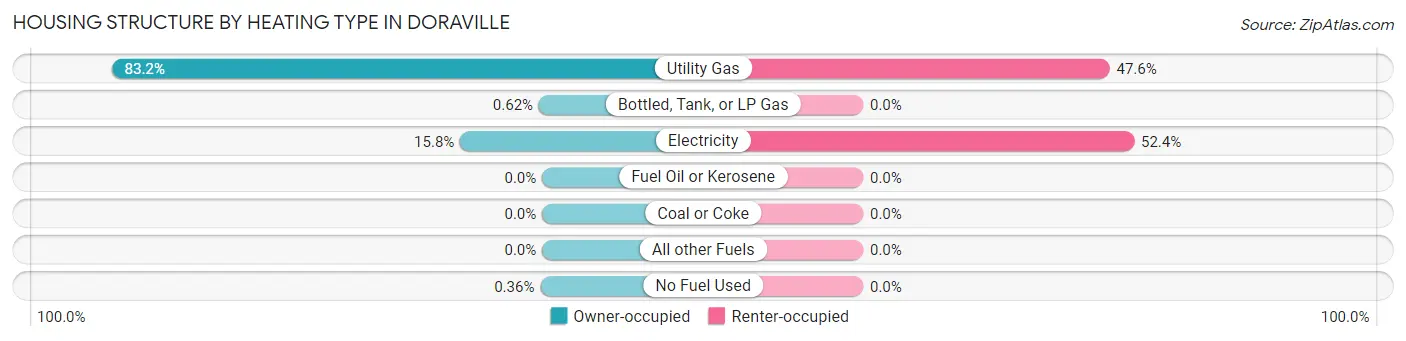
| Heating Type | Owner-occupied | Renter-occupied |
| Utility Gas | 1,869 (83.2%) | 743 (47.6%) |
| Bottled, Tank, or LP Gas | 14 (0.6%) | 0 (0.0%) |
| Electricity | 356 (15.8%) | 817 (52.4%) |
| Fuel Oil or Kerosene | 0 (0.0%) | 0 (0.0%) |
| Coal or Coke | 0 (0.0%) | 0 (0.0%) |
| All other Fuels | 0 (0.0%) | 0 (0.0%) |
| No Fuel Used | 8 (0.4%) | 0 (0.0%) |
| Total | 2,247 (100.0%) | 1,560 (100.0%) |
Household Vehicle Usage in Doraville
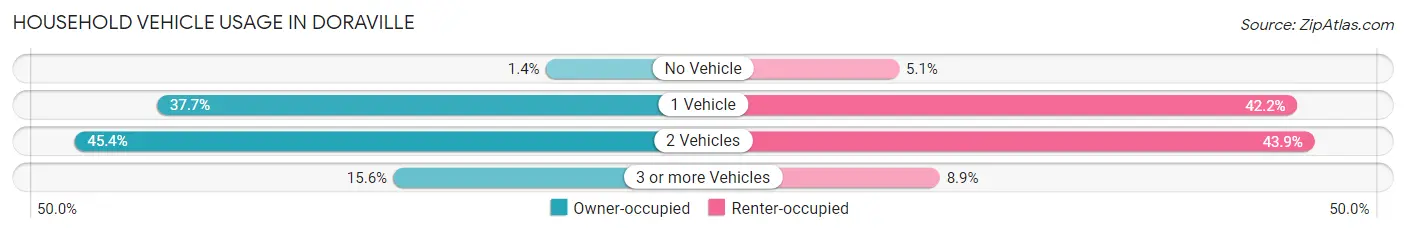
| Vehicles per Household | Owner-occupied | Renter-occupied |
| No Vehicle | 31 (1.4%) | 79 (5.1%) |
| 1 Vehicle | 846 (37.7%) | 659 (42.2%) |
| 2 Vehicles | 1,019 (45.4%) | 684 (43.9%) |
| 3 or more Vehicles | 351 (15.6%) | 138 (8.8%) |
| Total | 2,247 (100.0%) | 1,560 (100.0%) |
Real Estate & Mortgages in Doraville
Real Estate and Mortgage Overview in Doraville
| Characteristic | Without Mortgage | With Mortgage |
| Housing Units | 793 | 1,454 |
| Median Property Value | $255,700 | $295,700 |
| Median Household Income | $61,265 | $218 |
| Monthly Housing Costs | $543 | $81 |
| Real Estate Taxes | $1,825 | $26 |
Property Value by Mortgage Status in Doraville
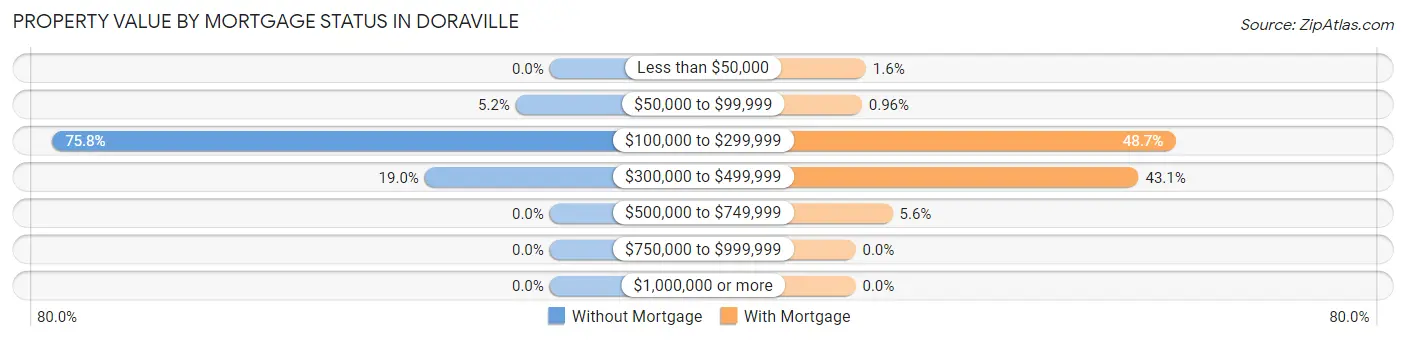
| Property Value | Without Mortgage | With Mortgage |
| Less than $50,000 | 0 (0.0%) | 23 (1.6%) |
| $50,000 to $99,999 | 41 (5.2%) | 14 (1.0%) |
| $100,000 to $299,999 | 601 (75.8%) | 708 (48.7%) |
| $300,000 to $499,999 | 151 (19.0%) | 627 (43.1%) |
| $500,000 to $749,999 | 0 (0.0%) | 82 (5.6%) |
| $750,000 to $999,999 | 0 (0.0%) | 0 (0.0%) |
| $1,000,000 or more | 0 (0.0%) | 0 (0.0%) |
| Total | 793 (100.0%) | 1,454 (100.0%) |
Household Income by Mortgage Status in Doraville
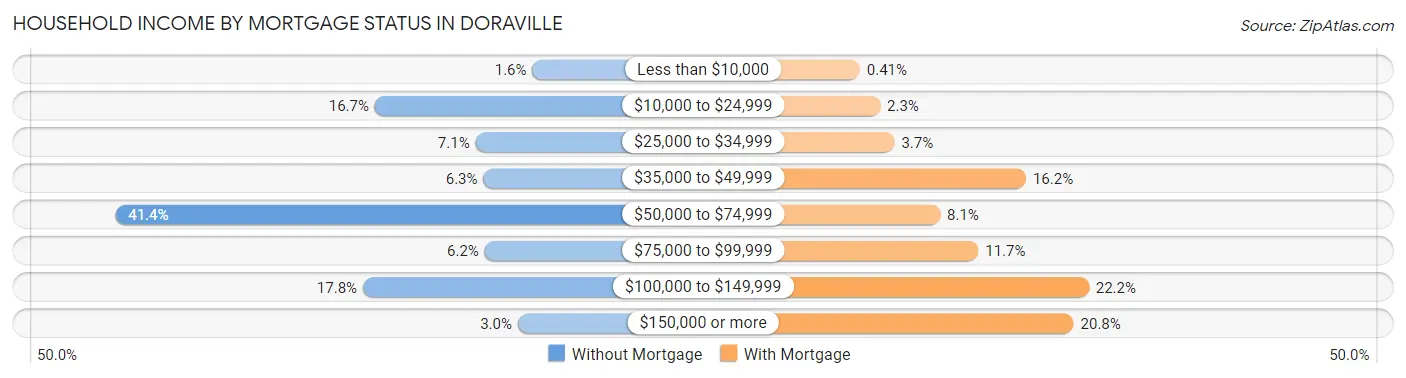
| Household Income | Without Mortgage | With Mortgage |
| Less than $10,000 | 13 (1.6%) | 6 (0.4%) |
| $10,000 to $24,999 | 132 (16.7%) | 34 (2.3%) |
| $25,000 to $34,999 | 56 (7.1%) | 54 (3.7%) |
| $35,000 to $49,999 | 50 (6.3%) | 236 (16.2%) |
| $50,000 to $74,999 | 328 (41.4%) | 117 (8.1%) |
| $75,000 to $99,999 | 49 (6.2%) | 170 (11.7%) |
| $100,000 to $149,999 | 141 (17.8%) | 323 (22.2%) |
| $150,000 or more | 24 (3.0%) | 302 (20.8%) |
| Total | 793 (100.0%) | 1,454 (100.0%) |
Property Value to Household Income Ratio in Doraville
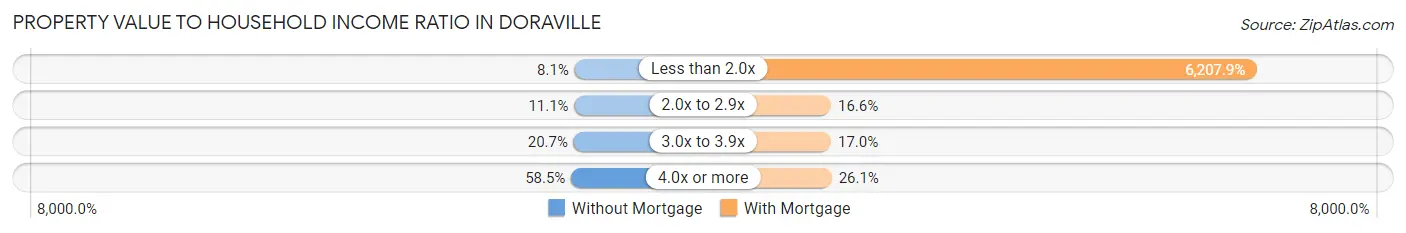
| Value-to-Income Ratio | Without Mortgage | With Mortgage |
| Less than 2.0x | 64 (8.1%) | 90,263 (6,207.9%) |
| 2.0x to 2.9x | 88 (11.1%) | 241 (16.6%) |
| 3.0x to 3.9x | 164 (20.7%) | 247 (17.0%) |
| 4.0x or more | 464 (58.5%) | 379 (26.1%) |
| Total | 793 (100.0%) | 1,454 (100.0%) |
Real Estate Taxes by Mortgage Status in Doraville
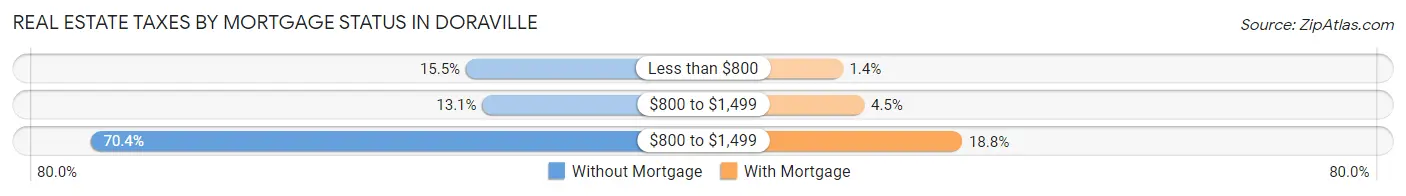
| Property Taxes | Without Mortgage | With Mortgage |
| Less than $800 | 123 (15.5%) | 20 (1.4%) |
| $800 to $1,499 | 104 (13.1%) | 66 (4.5%) |
| $800 to $1,499 | 558 (70.4%) | 274 (18.8%) |
| Total | 793 (100.0%) | 1,454 (100.0%) |
Health & Disability in Doraville
Health Insurance Coverage by Age in Doraville
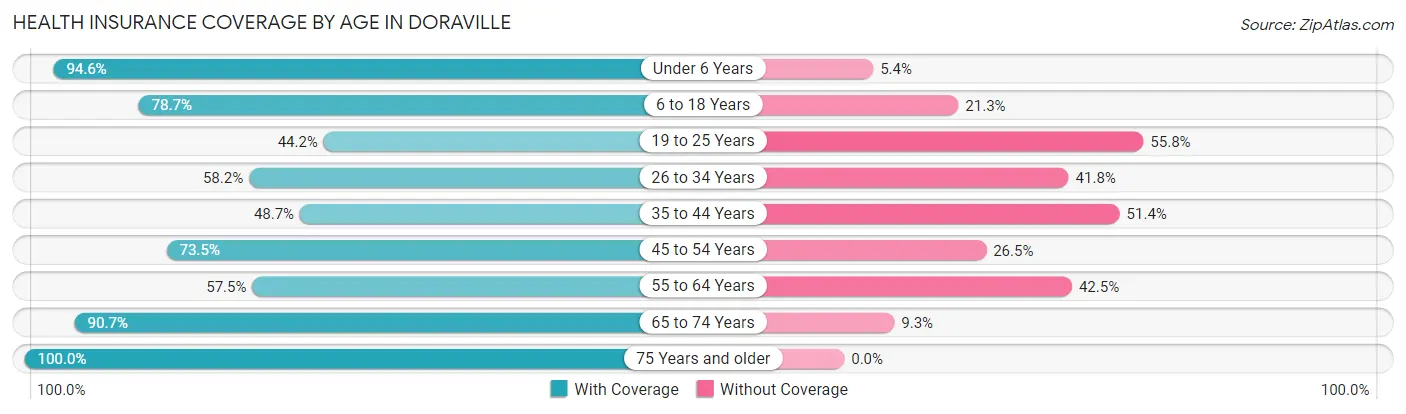
| Age Bracket | With Coverage | Without Coverage |
| Under 6 Years | 825 (94.6%) | 47 (5.4%) |
| 6 to 18 Years | 1,742 (78.7%) | 471 (21.3%) |
| 19 to 25 Years | 291 (44.2%) | 367 (55.8%) |
| 26 to 34 Years | 802 (58.2%) | 577 (41.8%) |
| 35 to 44 Years | 848 (48.6%) | 895 (51.3%) |
| 45 to 54 Years | 1,047 (73.5%) | 377 (26.5%) |
| 55 to 64 Years | 645 (57.5%) | 476 (42.5%) |
| 65 to 74 Years | 903 (90.7%) | 93 (9.3%) |
| 75 Years and older | 285 (100.0%) | 0 (0.0%) |
| Total | 7,388 (69.1%) | 3,303 (30.9%) |
Health Insurance Coverage by Citizenship Status in Doraville
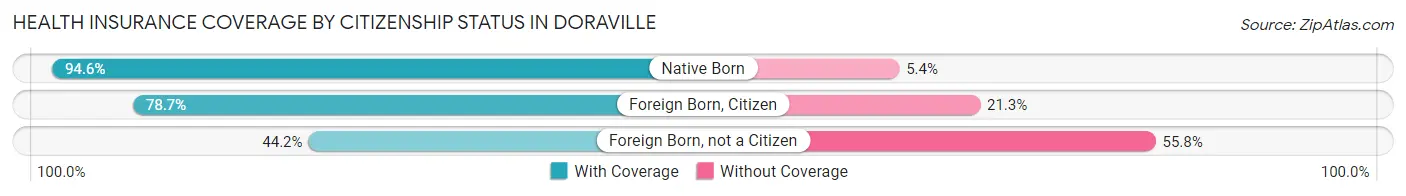
| Citizenship Status | With Coverage | Without Coverage |
| Native Born | 825 (94.6%) | 47 (5.4%) |
| Foreign Born, Citizen | 1,742 (78.7%) | 471 (21.3%) |
| Foreign Born, not a Citizen | 291 (44.2%) | 367 (55.8%) |
Health Insurance Coverage by Household Income in Doraville
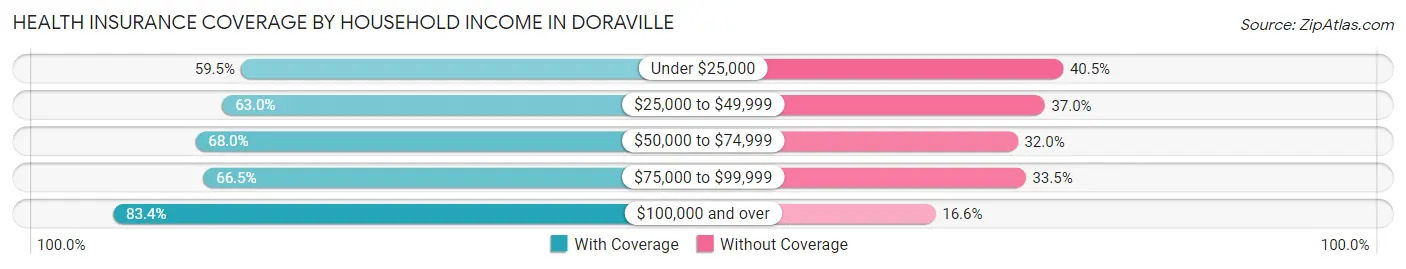
| Household Income | With Coverage | Without Coverage |
| Under $25,000 | 814 (59.5%) | 554 (40.5%) |
| $25,000 to $49,999 | 2,109 (63.0%) | 1,240 (37.0%) |
| $50,000 to $74,999 | 1,255 (68.0%) | 590 (32.0%) |
| $75,000 to $99,999 | 918 (66.5%) | 462 (33.5%) |
| $100,000 and over | 2,290 (83.4%) | 455 (16.6%) |
Public vs Private Health Insurance Coverage by Age in Doraville
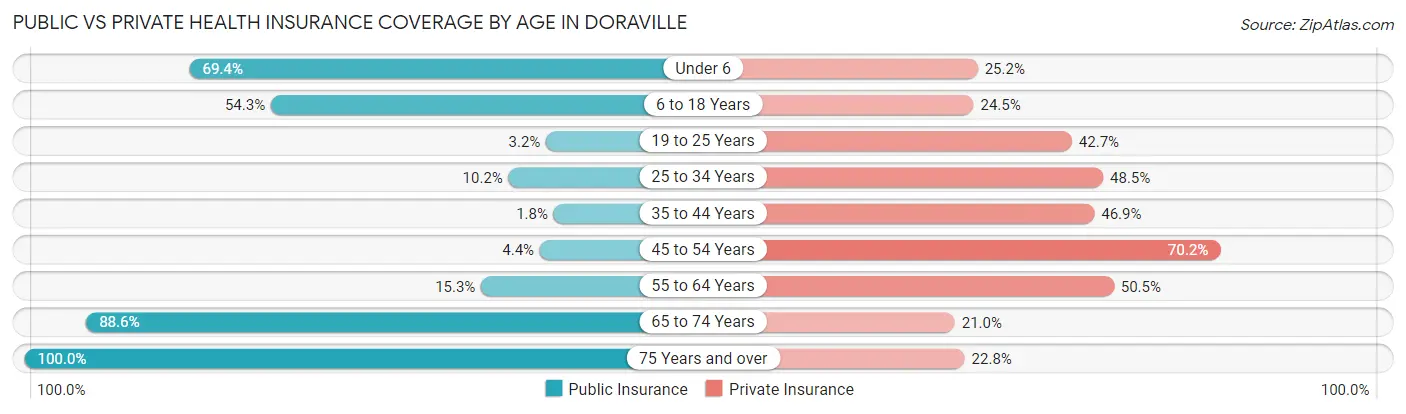
| Age Bracket | Public Insurance | Private Insurance |
| Under 6 | 605 (69.4%) | 220 (25.2%) |
| 6 to 18 Years | 1,201 (54.3%) | 541 (24.4%) |
| 19 to 25 Years | 21 (3.2%) | 281 (42.7%) |
| 25 to 34 Years | 140 (10.2%) | 669 (48.5%) |
| 35 to 44 Years | 31 (1.8%) | 817 (46.9%) |
| 45 to 54 Years | 62 (4.3%) | 1,000 (70.2%) |
| 55 to 64 Years | 171 (15.2%) | 566 (50.5%) |
| 65 to 74 Years | 882 (88.5%) | 209 (21.0%) |
| 75 Years and over | 285 (100.0%) | 65 (22.8%) |
| Total | 3,398 (31.8%) | 4,368 (40.9%) |
Disability Status by Sex by Age in Doraville
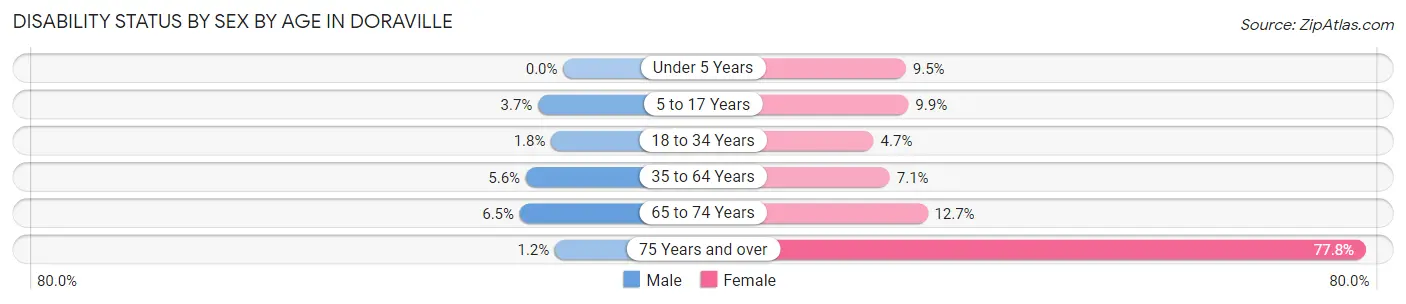
| Age Bracket | Male | Female |
| Under 5 Years | 0 (0.0%) | 29 (9.5%) |
| 5 to 17 Years | 48 (3.7%) | 88 (9.9%) |
| 18 to 34 Years | 20 (1.8%) | 55 (4.7%) |
| 35 to 64 Years | 102 (5.6%) | 175 (7.1%) |
| 65 to 74 Years | 42 (6.5%) | 44 (12.7%) |
| 75 Years and over | 1 (1.2%) | 158 (77.8%) |
Disability Class by Sex by Age in Doraville
Disability Class: Hearing Difficulty
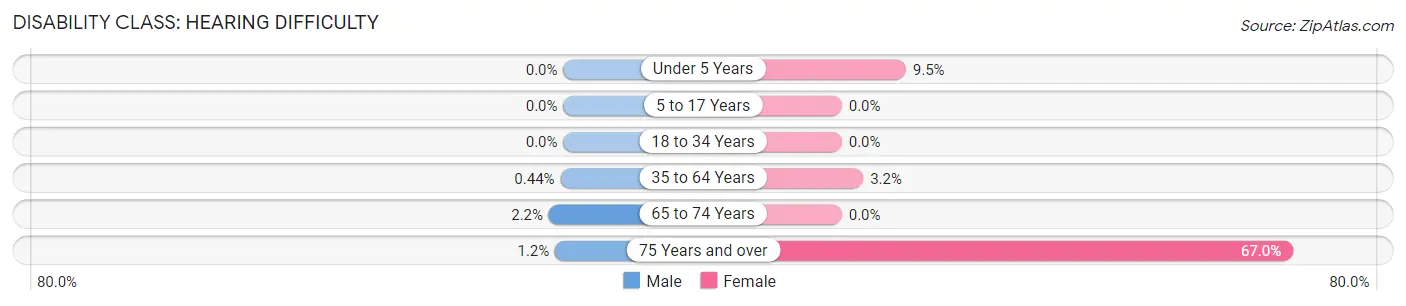
| Age Bracket | Male | Female |
| Under 5 Years | 0 (0.0%) | 29 (9.5%) |
| 5 to 17 Years | 0 (0.0%) | 0 (0.0%) |
| 18 to 34 Years | 0 (0.0%) | 0 (0.0%) |
| 35 to 64 Years | 8 (0.4%) | 78 (3.2%) |
| 65 to 74 Years | 14 (2.1%) | 0 (0.0%) |
| 75 Years and over | 1 (1.2%) | 136 (67.0%) |
Disability Class: Vision Difficulty
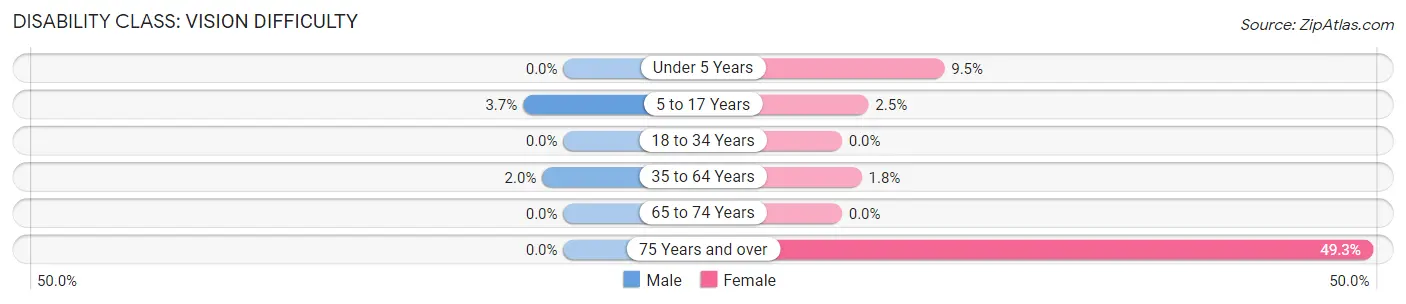
| Age Bracket | Male | Female |
| Under 5 Years | 0 (0.0%) | 29 (9.5%) |
| 5 to 17 Years | 48 (3.7%) | 22 (2.5%) |
| 18 to 34 Years | 0 (0.0%) | 0 (0.0%) |
| 35 to 64 Years | 36 (2.0%) | 45 (1.8%) |
| 65 to 74 Years | 0 (0.0%) | 0 (0.0%) |
| 75 Years and over | 0 (0.0%) | 100 (49.3%) |
Disability Class: Cognitive Difficulty
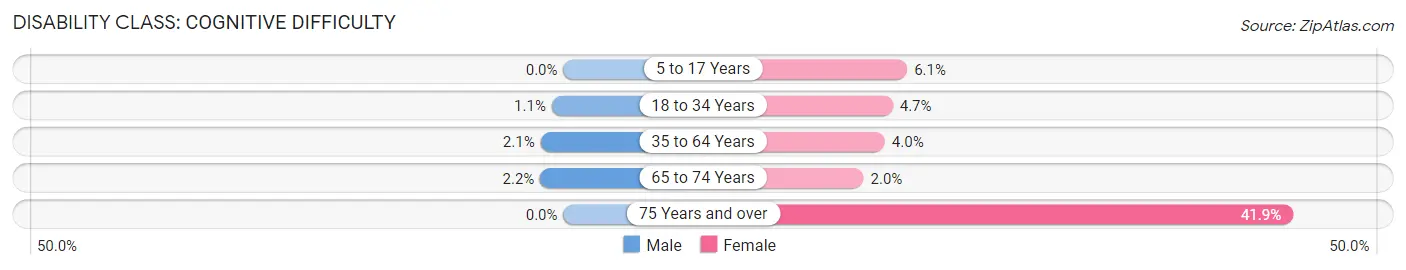
| Age Bracket | Male | Female |
| 5 to 17 Years | 0 (0.0%) | 54 (6.1%) |
| 18 to 34 Years | 12 (1.1%) | 55 (4.7%) |
| 35 to 64 Years | 39 (2.1%) | 98 (4.0%) |
| 65 to 74 Years | 14 (2.1%) | 7 (2.0%) |
| 75 Years and over | 0 (0.0%) | 85 (41.9%) |
Disability Class: Ambulatory Difficulty
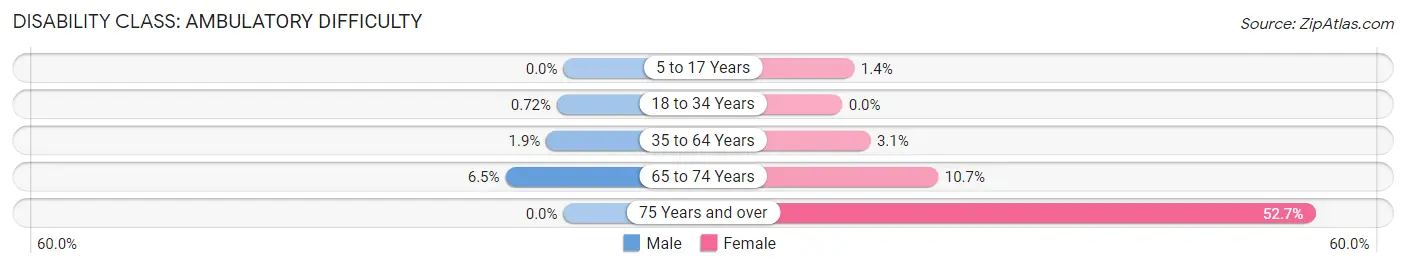
| Age Bracket | Male | Female |
| 5 to 17 Years | 0 (0.0%) | 12 (1.3%) |
| 18 to 34 Years | 8 (0.7%) | 0 (0.0%) |
| 35 to 64 Years | 35 (1.9%) | 77 (3.1%) |
| 65 to 74 Years | 42 (6.5%) | 37 (10.7%) |
| 75 Years and over | 0 (0.0%) | 107 (52.7%) |
Disability Class: Self-Care Difficulty
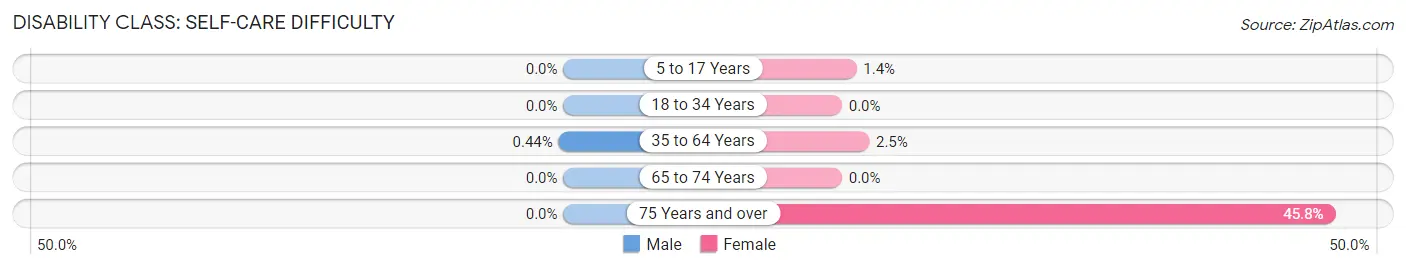
| Age Bracket | Male | Female |
| 5 to 17 Years | 0 (0.0%) | 12 (1.3%) |
| 18 to 34 Years | 0 (0.0%) | 0 (0.0%) |
| 35 to 64 Years | 8 (0.4%) | 62 (2.5%) |
| 65 to 74 Years | 0 (0.0%) | 0 (0.0%) |
| 75 Years and over | 0 (0.0%) | 93 (45.8%) |
Technology Access in Doraville
Computing Device Access in Doraville
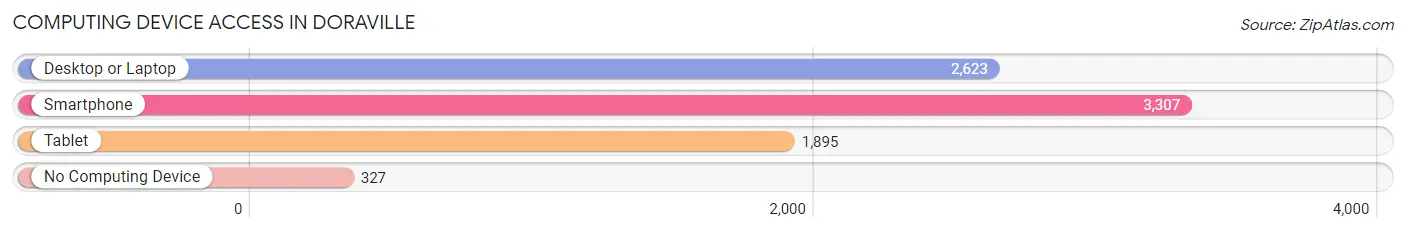
| Device Type | # Households | % Households |
| Desktop or Laptop | 2,623 | 68.9% |
| Smartphone | 3,307 | 86.9% |
| Tablet | 1,895 | 49.8% |
| No Computing Device | 327 | 8.6% |
| Total | 3,807 | 100.0% |
Internet Access in Doraville
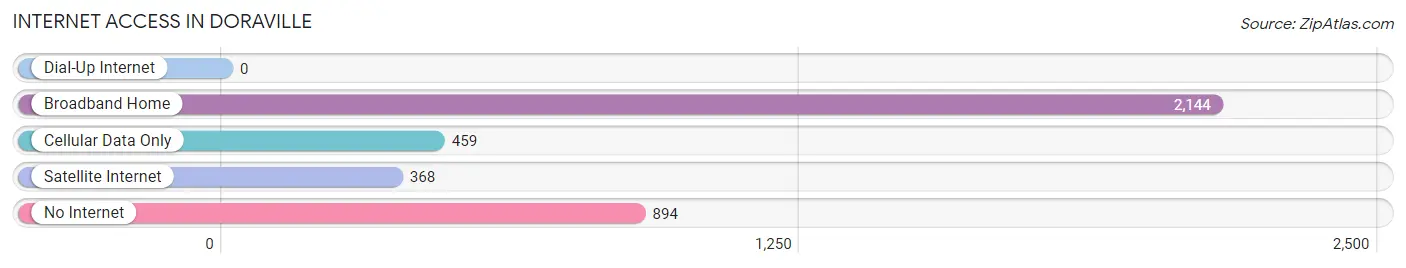
| Internet Type | # Households | % Households |
| Dial-Up Internet | 0 | 0.0% |
| Broadband Home | 2,144 | 56.3% |
| Cellular Data Only | 459 | 12.1% |
| Satellite Internet | 368 | 9.7% |
| No Internet | 894 | 23.5% |
| Total | 3,807 | 100.0% |
Doraville Summary
Doraville is a city located in DeKalb County, Georgia, United States. It is a suburb of Atlanta and is part of the Atlanta metropolitan area. The population was 8,330 at the 2010 census.
History
Doraville was founded in 1871 by two brothers, William and Thomas Dorsey. The brothers purchased land from the Creek Indians and built a small settlement. The town was originally called "Dorseyville" in honor of the brothers. In 1871, the town was incorporated as Doraville.
The town grew slowly until the 1940s, when it began to experience rapid growth due to the influx of new residents and businesses. The population increased from 1,000 in 1940 to over 8,000 in 2000.
Geography
Doraville is located in DeKalb County, Georgia, at 33°54'N 84°17'W (33.9000, -84.2833). It is situated in the northern part of the county, just south of the city of Atlanta.
The city has a total area of 4 2 square miles 10 8 km2 all of it land
Economy
Doraville is home to several large companies, including General Motors, Siemens, and NCR Corporation. The city also has a number of small businesses, including restaurants, retail stores, and professional services.
Demographics
As of the 2010 census, there were 8,330 people, 3,541 households, and 2,072 families residing in the city. The population density was 1,988.3 people per square mile (766.7/km2). There were 3,945 housing units at an average density of 945.2 per square mile (364.7/km2). The racial makeup of the city was 57.2% White, 28.2% African American, 0.3% Native American, 5.2% Asian, 0.1% Pacific Islander, 5.7% from other races, and 3.3% from two or more races. Hispanic or Latino of any race were 11.7% of the population.
There were 3,541 households, out of which 28.2% had children under the age of 18 living with them, 37.2% were married couples living together, 16.2% had a female householder with no husband present, and 40.7% were non-families. 32.2% of all households were made up of individuals, and 8.2% had someone living alone who was 65 years of age or older. The average household size was 2.35 and the average family size was 2.99.
In the city, the population was spread out, with 23.2% under the age of 18, 10.2% from 18 to 24, 33.2% from 25 to 44, 22.2% from 45 to 64, and 11.2% who were 65 years of age or older. The median age was 34 years. For every 100 females, there were 94.2 males. For every 100 females age 18 and over, there were 91.2 males.
The median income for a household in the city was $41,945, and the median income for a family was $50,945. Males had a median income of $35,945 versus $30,945 for females. The per capita income for the city was $22,945. About 8.2% of families and 11.2% of the population were below the poverty line, including 15.2% of those under age 18 and 8.2% of those age 65 or over.
Common Questions
What is Per Capita Income in Doraville?
Per Capita income in Doraville is $26,517.
What is the Median Family Income in Doraville?
Median Family Income in Doraville is $60,876.
What is the Median Household income in Doraville?
Median Household Income in Doraville is $59,636.
What is Income or Wage Gap in Doraville?
Income or Wage Gap in Doraville is 2.8%.
Women in Doraville earn 97.2 cents for every dollar earned by a man.
What is Inequality or Gini Index in Doraville?
Inequality or Gini Index in Doraville is 0.39.
What is the Total Population of Doraville?
Total Population of Doraville is 10,691.
What is the Total Male Population of Doraville?
Total Male Population of Doraville is 5,331.
What is the Total Female Population of Doraville?
Total Female Population of Doraville is 5,360.
What is the Ratio of Males per 100 Females in Doraville?
There are 99.46 Males per 100 Females in Doraville.
What is the Ratio of Females per 100 Males in Doraville?
There are 100.54 Females per 100 Males in Doraville.
What is the Median Population Age in Doraville?
Median Population Age in Doraville is 36.0 Years.
What is the Average Family Size in Doraville
Average Family Size in Doraville is 3.6 People.
What is the Average Household Size in Doraville
Average Household Size in Doraville is 2.8 People.
How Large is the Labor Force in Doraville?
There are 5,626 People in the Labor Forcein in Doraville.
What is the Percentage of People in the Labor Force in Doraville?
69.6% of People are in the Labor Force in Doraville.
What is the Unemployment Rate in Doraville?
Unemployment Rate in Doraville is 2.0%.