Glenview Manor, KY Map & Demographics
Glenview Manor Map
Glenview Manor Overview
$76,544
PER CAPITA INCOME
$219,821
AVG FAMILY INCOME
$163,125
AVG HOUSEHOLD INCOME
0.40
INEQUALITY / GINI INDEX
206
TOTAL POPULATION
110
MALE POPULATION
96
FEMALE POPULATION
114.58
MALES / 100 FEMALES
87.27
FEMALES / 100 MALES
45.4
MEDIAN AGE
2.9
AVG FAMILY SIZE
2.5
AVG HOUSEHOLD SIZE
104
LABOR FORCE [ PEOPLE ]
66.2%
PERCENT IN LABOR FORCE
2.9%
UNEMPLOYMENT RATE
Glenview Manor Area Codes
Income in Glenview Manor
Income Overview in Glenview Manor
Per Capita Income in Glenview Manor is $76,544, while median incomes of families and households are $219,821 and $163,125 respectively.
| Characteristic | Number | Measure |
| Per Capita Income | 206 | $76,544 |
| Median Family Income | 59 | $219,821 |
| Mean Family Income | 59 | $238,476 |
| Median Household Income | 81 | $163,125 |
| Mean Household Income | 81 | $208,011 |
| Income Deficit | 59 | $0 |
| Wage / Income Gap (%) | 206 | 0.00% |
| Wage / Income Gap ($) | 206 | 100.00¢ per $1 |
| Gini / Inequality Index | 206 | 0.40 |
Earnings by Sex in Glenview Manor
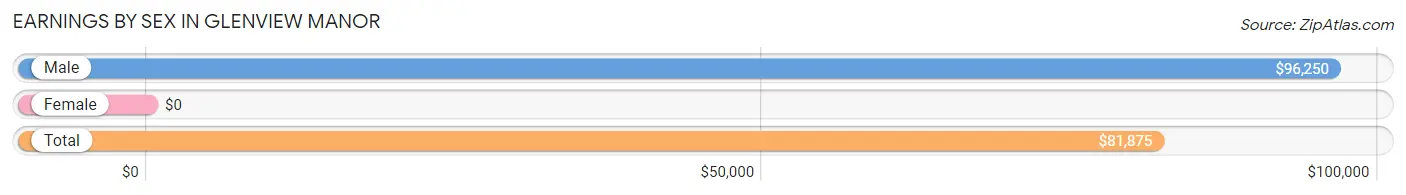
| Sex | Number | Average Earnings |
| Male | 71 (60.7%) | $96,250 |
| Female | 46 (39.3%) | $0 |
| Total | 117 (100.0%) | $81,875 |
Earnings by Sex by Income Bracket in Glenview Manor
The most common earnings brackets in Glenview Manor are $100,000+ for men (32 | 45.1%) and $100,000+ for women (19 | 41.3%).
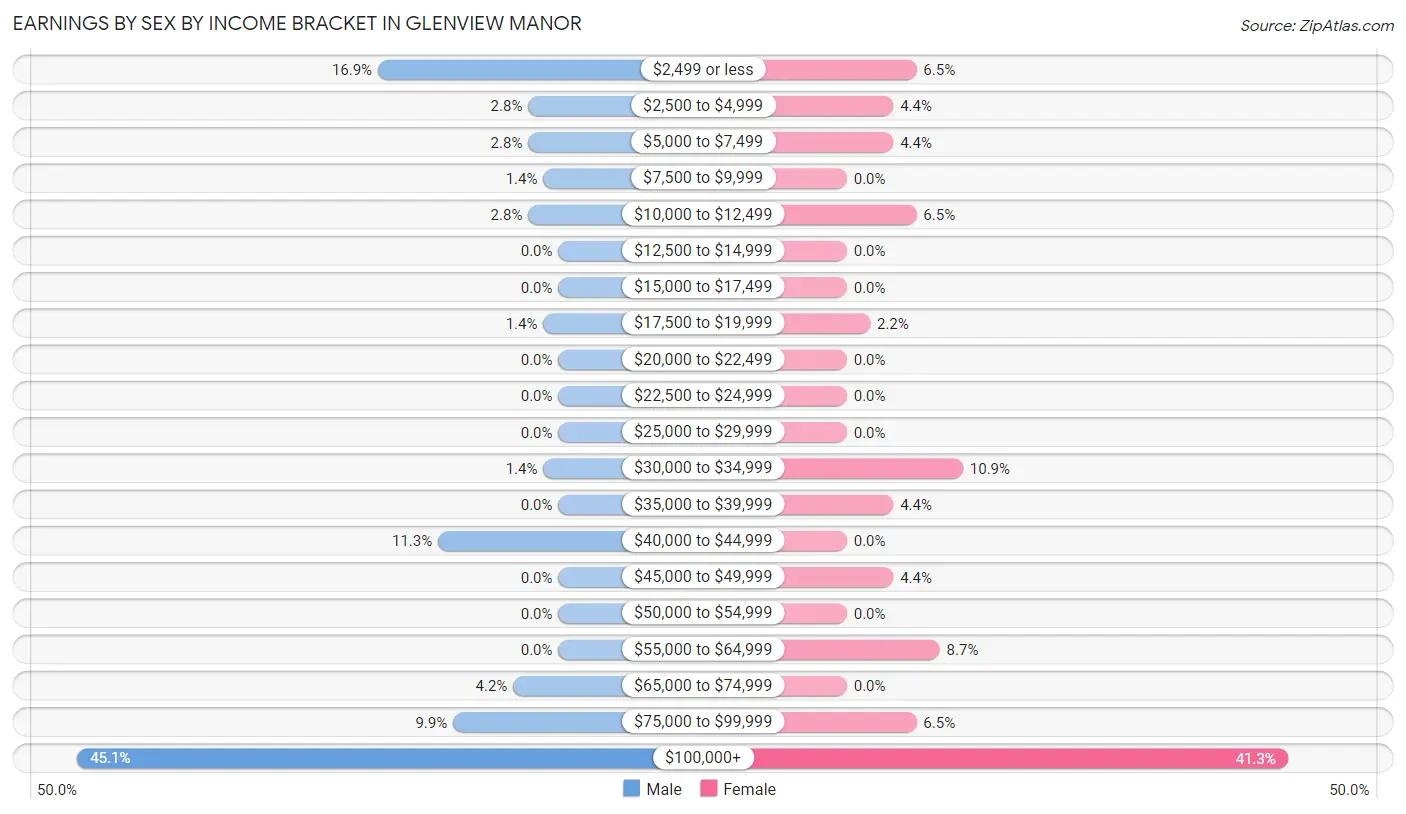
| Income | Male | Female |
| $2,499 or less | 12 (16.9%) | 3 (6.5%) |
| $2,500 to $4,999 | 2 (2.8%) | 2 (4.3%) |
| $5,000 to $7,499 | 2 (2.8%) | 2 (4.3%) |
| $7,500 to $9,999 | 1 (1.4%) | 0 (0.0%) |
| $10,000 to $12,499 | 2 (2.8%) | 3 (6.5%) |
| $12,500 to $14,999 | 0 (0.0%) | 0 (0.0%) |
| $15,000 to $17,499 | 0 (0.0%) | 0 (0.0%) |
| $17,500 to $19,999 | 1 (1.4%) | 1 (2.2%) |
| $20,000 to $22,499 | 0 (0.0%) | 0 (0.0%) |
| $22,500 to $24,999 | 0 (0.0%) | 0 (0.0%) |
| $25,000 to $29,999 | 0 (0.0%) | 0 (0.0%) |
| $30,000 to $34,999 | 1 (1.4%) | 5 (10.9%) |
| $35,000 to $39,999 | 0 (0.0%) | 2 (4.3%) |
| $40,000 to $44,999 | 8 (11.3%) | 0 (0.0%) |
| $45,000 to $49,999 | 0 (0.0%) | 2 (4.3%) |
| $50,000 to $54,999 | 0 (0.0%) | 0 (0.0%) |
| $55,000 to $64,999 | 0 (0.0%) | 4 (8.7%) |
| $65,000 to $74,999 | 3 (4.2%) | 0 (0.0%) |
| $75,000 to $99,999 | 7 (9.9%) | 3 (6.5%) |
| $100,000+ | 32 (45.1%) | 19 (41.3%) |
| Total | 71 (100.0%) | 46 (100.0%) |
Earnings by Sex by Educational Attainment in Glenview Manor
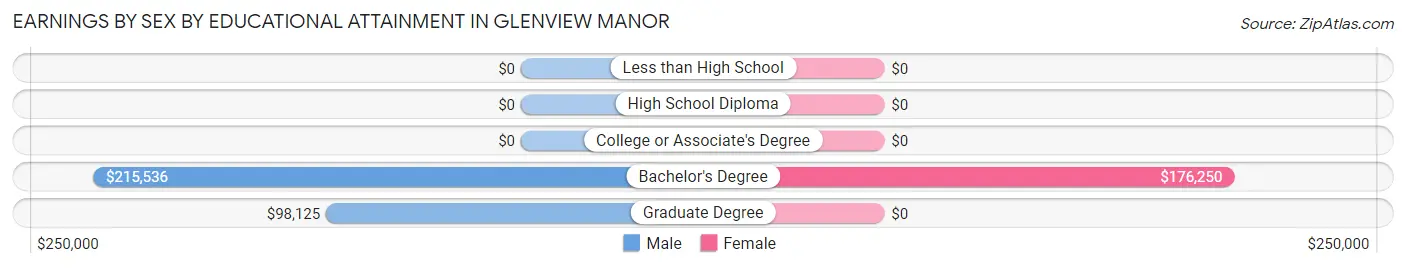
| Educational Attainment | Male Income | Female Income |
| Less than High School | - | - |
| High School Diploma | - | - |
| College or Associate's Degree | - | - |
| Bachelor's Degree | $215,536 | $176,250 |
| Graduate Degree | $98,125 | $0 |
| Total | $109,167 | $0 |
Family Income in Glenview Manor
Family Income Brackets in Glenview Manor
According to the Glenview Manor family income data, there are 38 families falling into the $200,000+ income range, which is the most common income bracket and makes up 64.4% of all families.
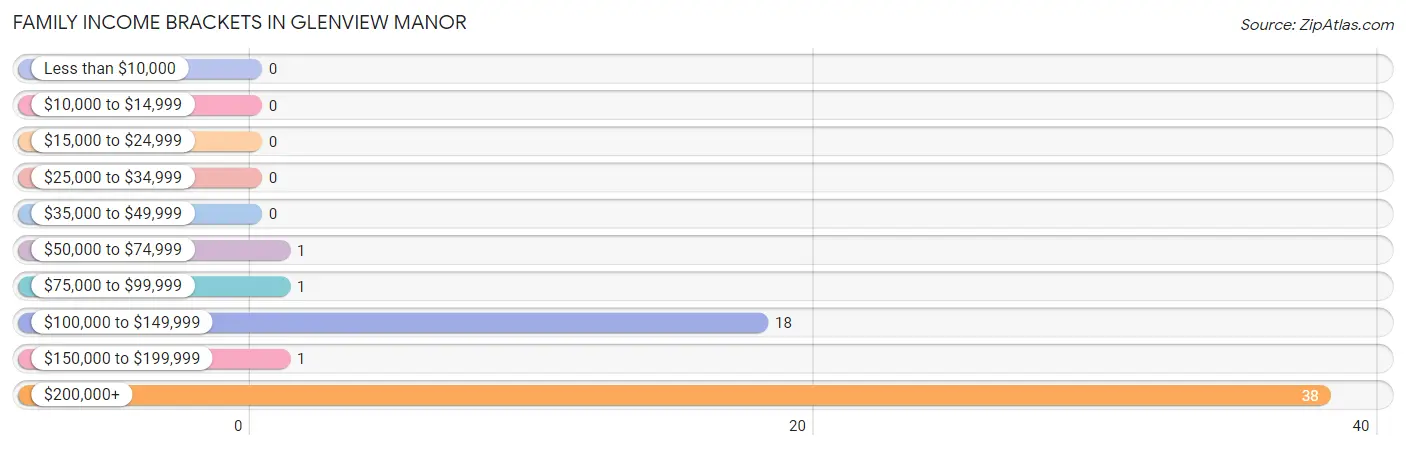
| Income Bracket | # Families | % Families |
| Less than $10,000 | 0 | 0.0% |
| $10,000 to $14,999 | 0 | 0.0% |
| $15,000 to $24,999 | 0 | 0.0% |
| $25,000 to $34,999 | 0 | 0.0% |
| $35,000 to $49,999 | 0 | 0.0% |
| $50,000 to $74,999 | 1 | 1.7% |
| $75,000 to $99,999 | 1 | 1.7% |
| $100,000 to $149,999 | 18 | 30.5% |
| $150,000 to $199,999 | 1 | 1.7% |
| $200,000+ | 38 | 64.4% |
Family Income by Famaliy Size in Glenview Manor
4-person families (10 | 17.0%) account for the highest median family income in Glenview Manor with $250,001 per family, while 2-person families (24 | 40.7%) have the highest median income of $103,750 per family member.
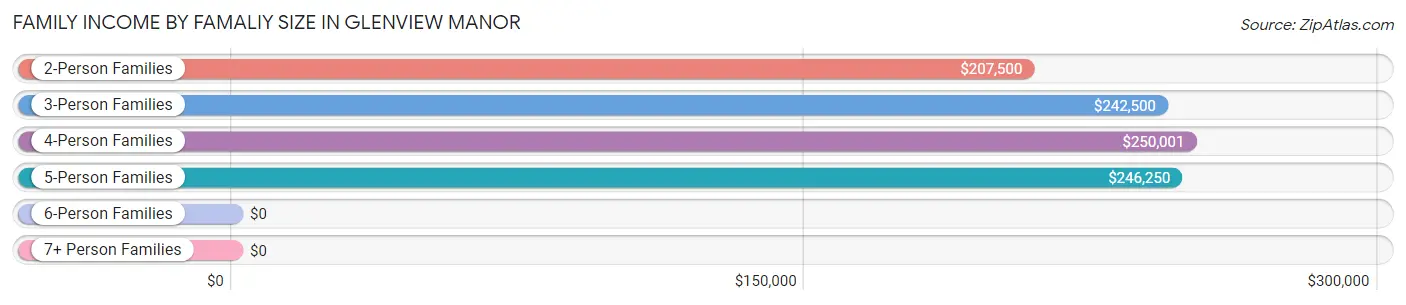
| Income Bracket | # Families | Median Income |
| 2-Person Families | 24 (40.7%) | $207,500 |
| 3-Person Families | 10 (17.0%) | $242,500 |
| 4-Person Families | 10 (17.0%) | $250,001 |
| 5-Person Families | 15 (25.4%) | $246,250 |
| 6-Person Families | 0 (0.0%) | $0 |
| 7+ Person Families | 0 (0.0%) | $0 |
| Total | 59 (100.0%) | $219,821 |
Family Income by Number of Earners in Glenview Manor
The median family income in Glenview Manor is $219,821, with families comprising 2 earners (20) having the highest median family income of $246,500, while families with no earners (7) have the lowest median family income of $131,875, accounting for 33.9% and 11.9% of families, respectively.
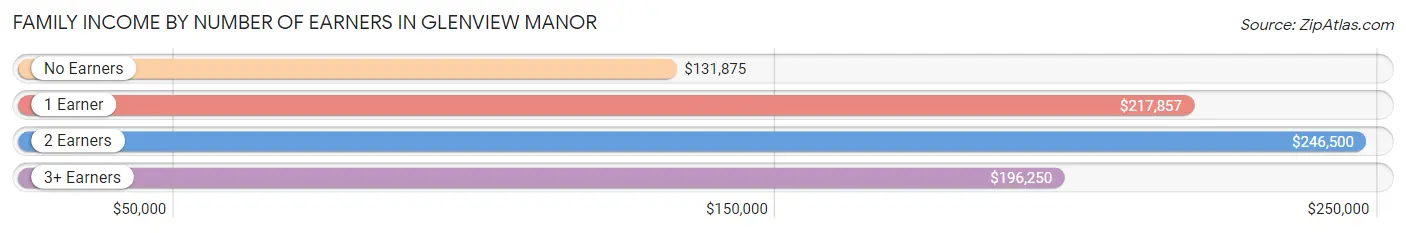
| Number of Earners | # Families | Median Income |
| No Earners | 7 (11.9%) | $131,875 |
| 1 Earner | 20 (33.9%) | $217,857 |
| 2 Earners | 20 (33.9%) | $246,500 |
| 3+ Earners | 12 (20.3%) | $196,250 |
| Total | 59 (100.0%) | $219,821 |
Household Income in Glenview Manor
Household Income Brackets in Glenview Manor
With 38 households falling in the category, the $200,000+ income range is the most frequent in Glenview Manor, accounting for 46.9% of all households.
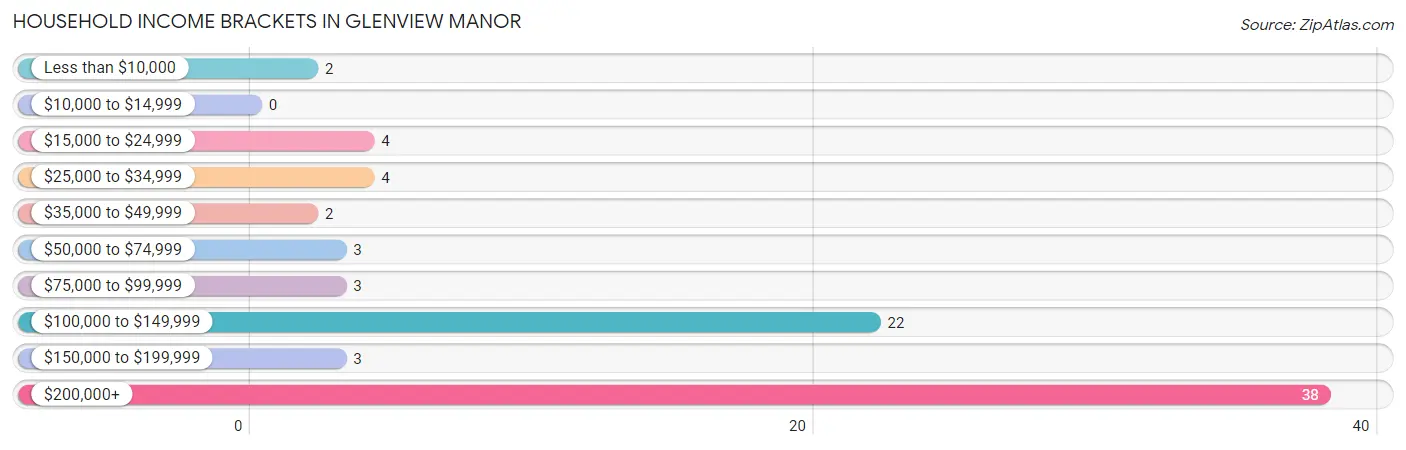
| Income Bracket | # Households | % Households |
| Less than $10,000 | 2 | 2.5% |
| $10,000 to $14,999 | 0 | 0.0% |
| $15,000 to $24,999 | 4 | 4.9% |
| $25,000 to $34,999 | 4 | 4.9% |
| $35,000 to $49,999 | 2 | 2.5% |
| $50,000 to $74,999 | 3 | 3.7% |
| $75,000 to $99,999 | 3 | 3.7% |
| $100,000 to $149,999 | 22 | 27.2% |
| $150,000 to $199,999 | 3 | 3.7% |
| $200,000+ | 38 | 46.9% |
Household Income by Householder Age in Glenview Manor
The median household income in Glenview Manor is $163,125, with the highest median household income of $250,001 found in the 25 to 44 years age bracket for the primary householder. A total of 16 households (19.8%) fall into this category.
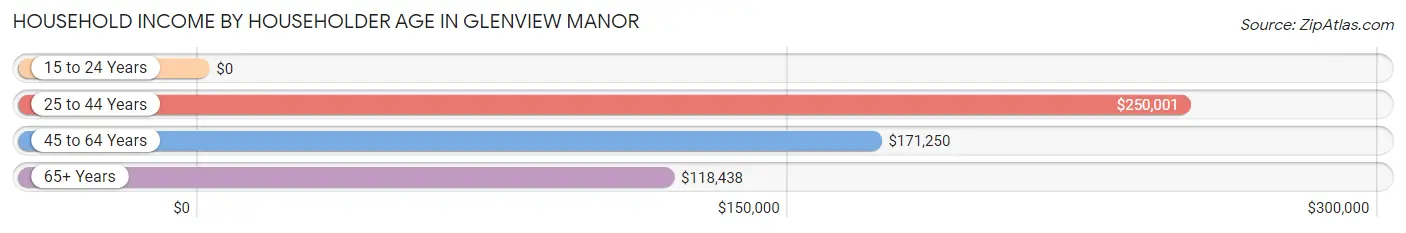
| Income Bracket | # Households | Median Income |
| 15 to 24 Years | 0 (0.0%) | $0 |
| 25 to 44 Years | 16 (19.8%) | $250,001 |
| 45 to 64 Years | 42 (51.8%) | $171,250 |
| 65+ Years | 23 (28.4%) | $118,438 |
| Total | 81 (100.0%) | $163,125 |
Poverty in Glenview Manor
Income Below Poverty by Sex and Age in Glenview Manor
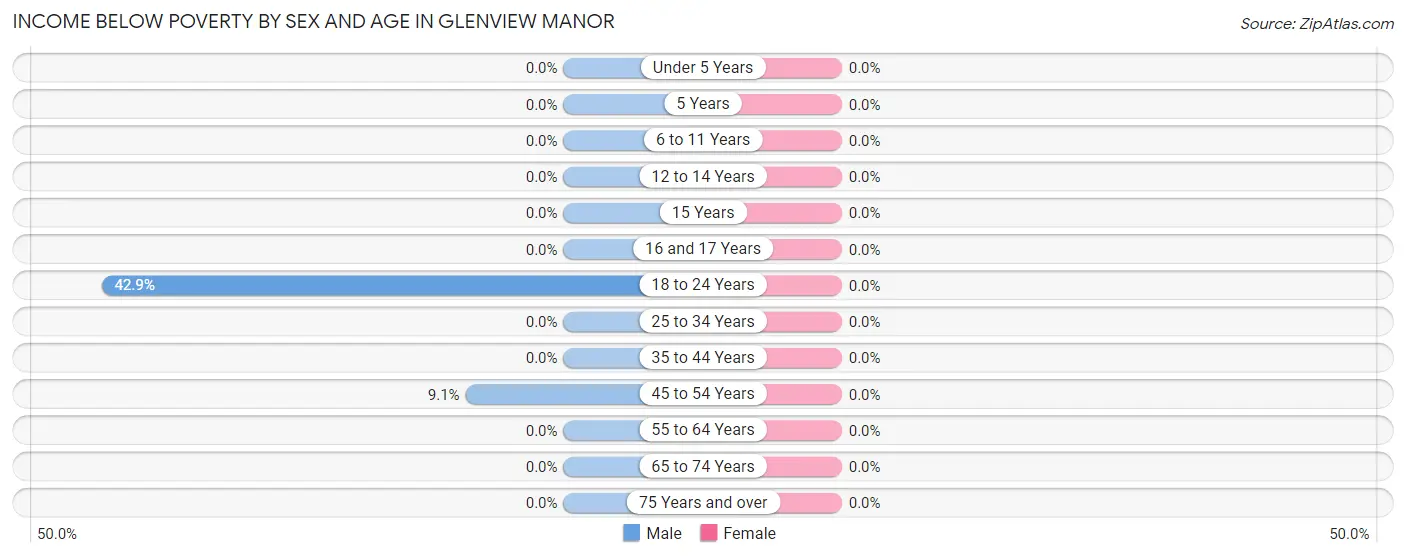
| Age Bracket | Male | Female |
| Under 5 Years | 0 (0.0%) | 0 (0.0%) |
| 5 Years | 0 (0.0%) | 0 (0.0%) |
| 6 to 11 Years | 0 (0.0%) | 0 (0.0%) |
| 12 to 14 Years | 0 (0.0%) | 0 (0.0%) |
| 15 Years | 0 (0.0%) | 0 (0.0%) |
| 16 and 17 Years | 0 (0.0%) | 0 (0.0%) |
| 18 to 24 Years | 6 (42.9%) | 0 (0.0%) |
| 25 to 34 Years | 0 (0.0%) | 0 (0.0%) |
| 35 to 44 Years | 0 (0.0%) | 0 (0.0%) |
| 45 to 54 Years | 2 (9.1%) | 0 (0.0%) |
| 55 to 64 Years | 0 (0.0%) | 0 (0.0%) |
| 65 to 74 Years | 0 (0.0%) | 0 (0.0%) |
| 75 Years and over | 0 (0.0%) | 0 (0.0%) |
| Total | 8 (7.3%) | 0 (0.0%) |
Income Above Poverty by Sex and Age in Glenview Manor
According to the poverty statistics in Glenview Manor, males aged under 5 years and females aged under 5 years are the age groups that are most secure financially, with 100.0% of males and 100.0% of females in these age groups living above the poverty line.
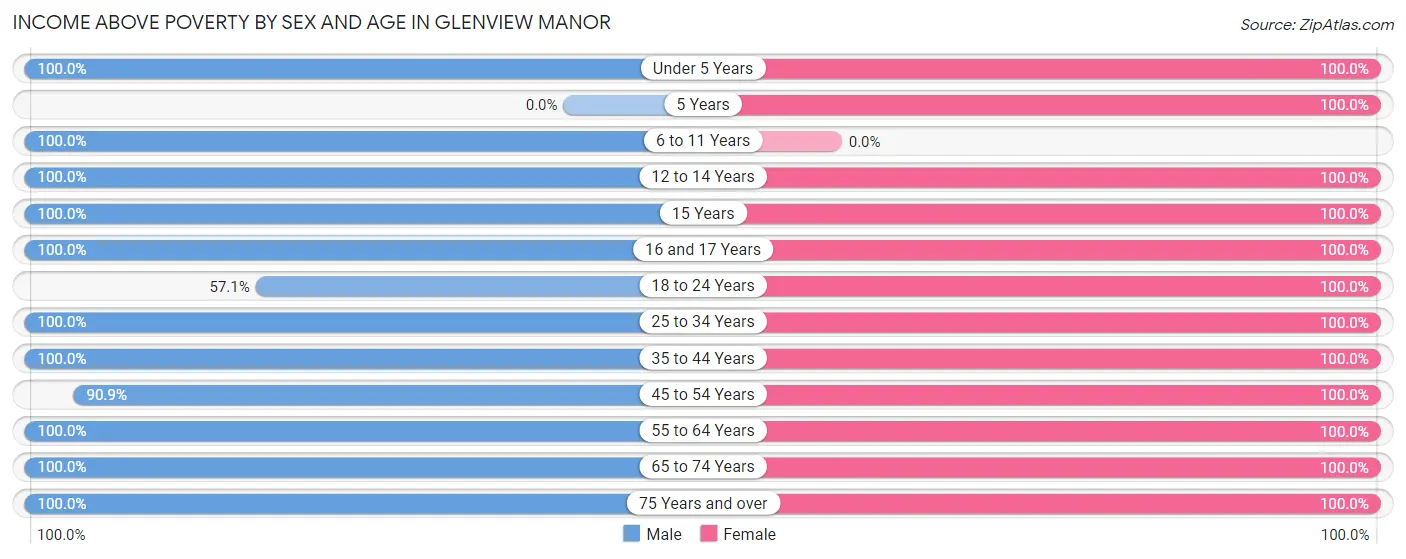
| Age Bracket | Male | Female |
| Under 5 Years | 9 (100.0%) | 3 (100.0%) |
| 5 Years | 0 (0.0%) | 1 (100.0%) |
| 6 to 11 Years | 6 (100.0%) | 0 (0.0%) |
| 12 to 14 Years | 10 (100.0%) | 14 (100.0%) |
| 15 Years | 2 (100.0%) | 4 (100.0%) |
| 16 and 17 Years | 3 (100.0%) | 7 (100.0%) |
| 18 to 24 Years | 8 (57.1%) | 2 (100.0%) |
| 25 to 34 Years | 7 (100.0%) | 5 (100.0%) |
| 35 to 44 Years | 9 (100.0%) | 5 (100.0%) |
| 45 to 54 Years | 20 (90.9%) | 37 (100.0%) |
| 55 to 64 Years | 10 (100.0%) | 2 (100.0%) |
| 65 to 74 Years | 13 (100.0%) | 7 (100.0%) |
| 75 Years and over | 5 (100.0%) | 9 (100.0%) |
| Total | 102 (92.7%) | 96 (100.0%) |
Income Below Poverty Among Married-Couple Families in Glenview Manor
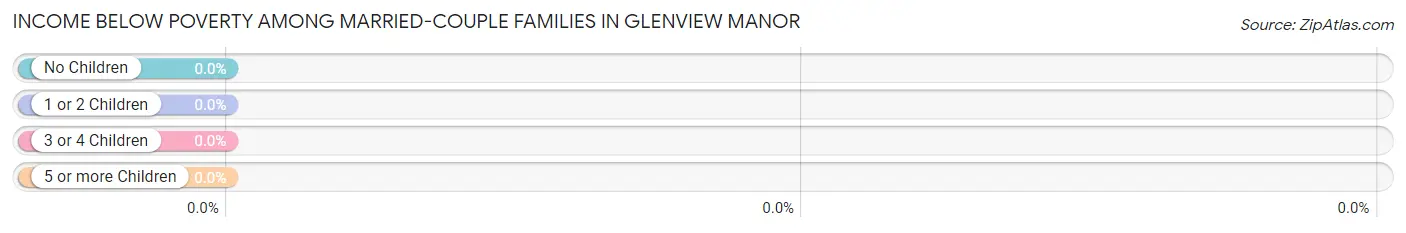
| Children | Above Poverty | Below Poverty |
| No Children | 20 (100.0%) | 0 (0.0%) |
| 1 or 2 Children | 20 (100.0%) | 0 (0.0%) |
| 3 or 4 Children | 11 (100.0%) | 0 (0.0%) |
| 5 or more Children | 0 (0.0%) | 0 (0.0%) |
| Total | 51 (100.0%) | 0 (0.0%) |
Income Below Poverty Among Single-Parent Households in Glenview Manor
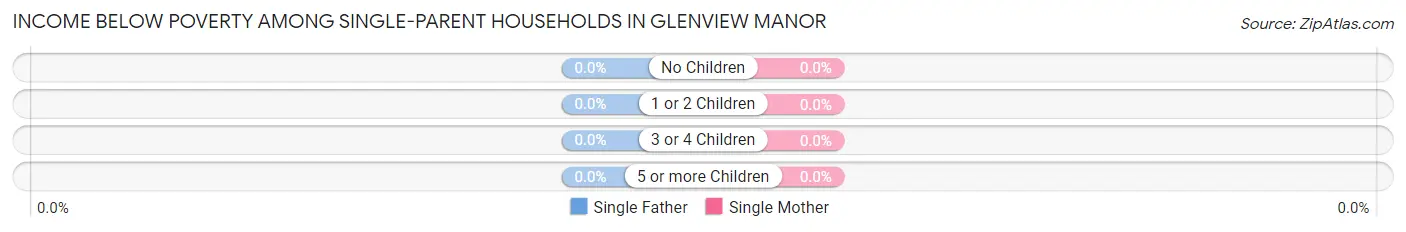
| Children | Single Father | Single Mother |
| No Children | 0 (0.0%) | 0 (0.0%) |
| 1 or 2 Children | 0 (0.0%) | 0 (0.0%) |
| 3 or 4 Children | 0 (0.0%) | 0 (0.0%) |
| 5 or more Children | 0 (0.0%) | 0 (0.0%) |
| Total | 0 (0.0%) | 0 (0.0%) |
Income Below Poverty Among Married-Couple vs Single-Parent Households in Glenview Manor
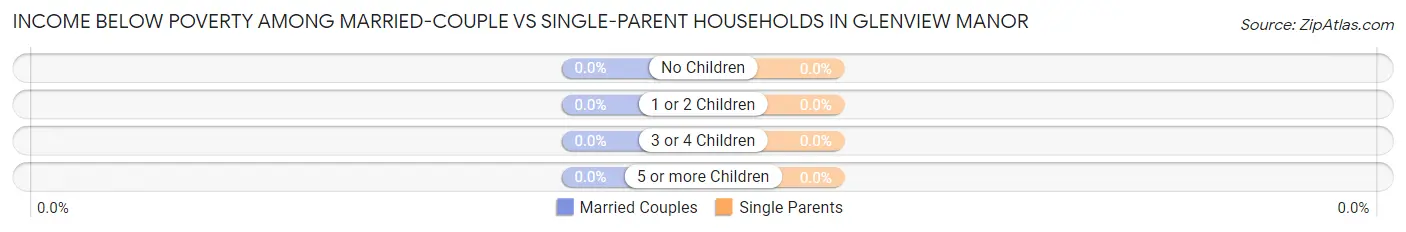
| Children | Married-Couple Families | Single-Parent Households |
| No Children | 0 (0.0%) | 0 (0.0%) |
| 1 or 2 Children | 0 (0.0%) | 0 (0.0%) |
| 3 or 4 Children | 0 (0.0%) | 0 (0.0%) |
| 5 or more Children | 0 (0.0%) | 0 (0.0%) |
| Total | 0 (0.0%) | 0 (0.0%) |
Race in Glenview Manor
The most populous races in Glenview Manor are White / Caucasian (202 | 98.1%), Two or more Races (3 | 1.5%), and Asian (1 | 0.5%).
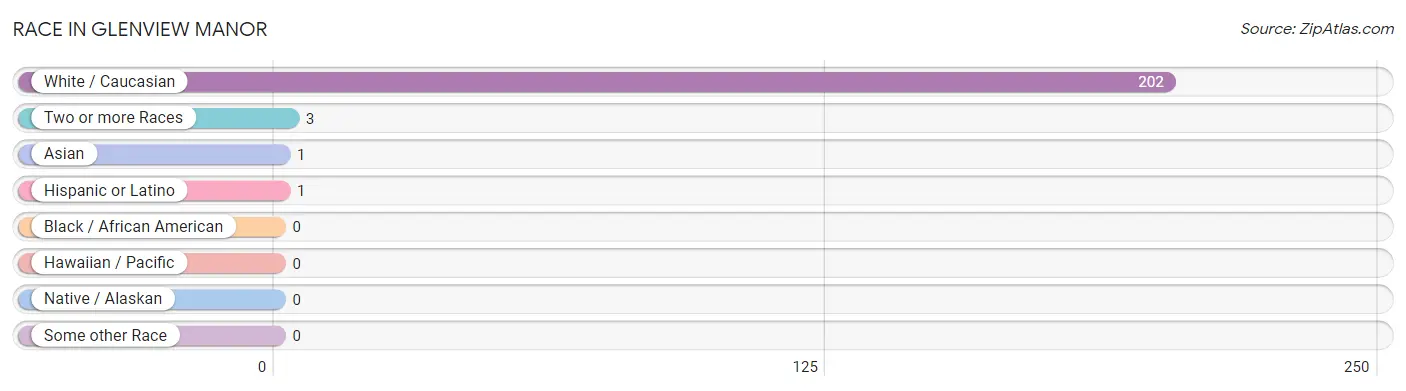
| Race | # Population | % Population |
| Asian | 1 | 0.5% |
| Black / African American | 0 | 0.0% |
| Hawaiian / Pacific | 0 | 0.0% |
| Hispanic or Latino | 1 | 0.5% |
| Native / Alaskan | 0 | 0.0% |
| White / Caucasian | 202 | 98.1% |
| Two or more Races | 3 | 1.5% |
| Some other Race | 0 | 0.0% |
| Total | 206 | 100.0% |
Ancestry in Glenview Manor
The most populous ancestries reported in Glenview Manor are German (67 | 32.5%), English (56 | 27.2%), Irish (40 | 19.4%), Polish (17 | 8.3%), and American (14 | 6.8%), together accounting for 94.2% of all Glenview Manor residents.
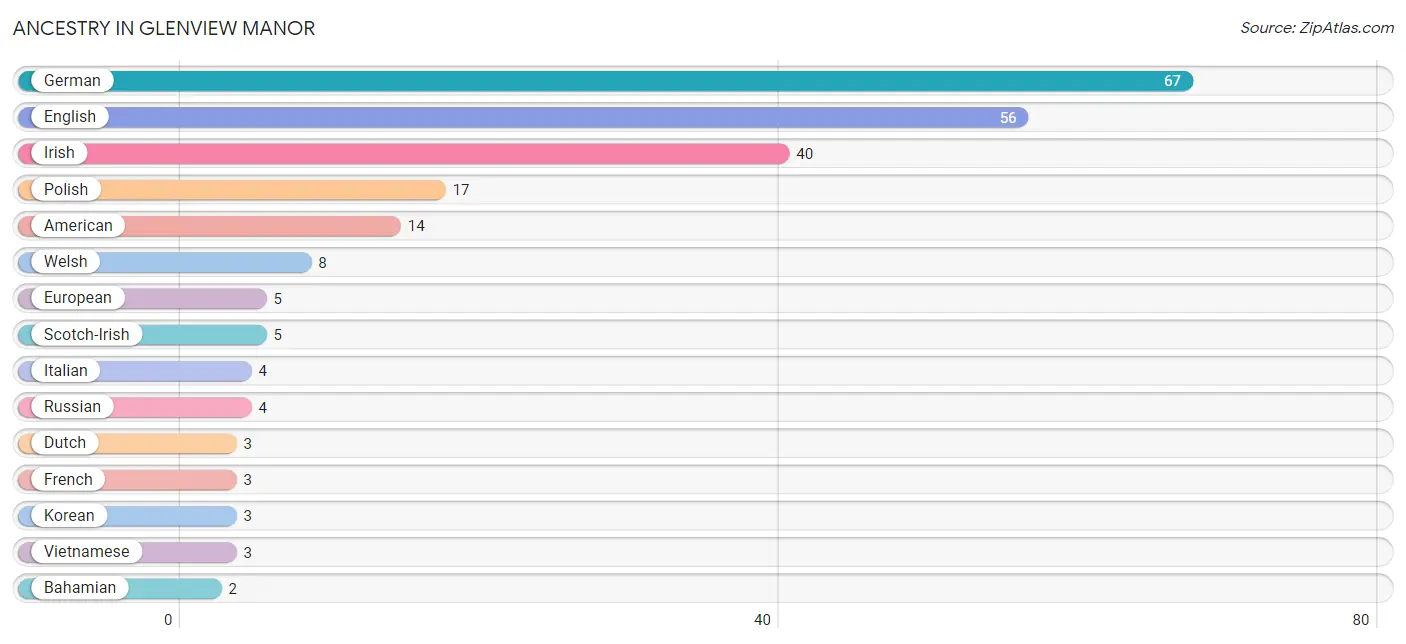
| Ancestry | # Population | % Population |
| American | 14 | 6.8% |
| Bahamian | 2 | 1.0% |
| Dutch | 3 | 1.5% |
| English | 56 | 27.2% |
| European | 5 | 2.4% |
| French | 3 | 1.5% |
| German | 67 | 32.5% |
| Hungarian | 2 | 1.0% |
| Irish | 40 | 19.4% |
| Italian | 4 | 1.9% |
| Korean | 3 | 1.5% |
| Norwegian | 1 | 0.5% |
| Polish | 17 | 8.3% |
| Russian | 4 | 1.9% |
| Scotch-Irish | 5 | 2.4% |
| Scottish | 2 | 1.0% |
| Spanish | 1 | 0.5% |
| Vietnamese | 3 | 1.5% |
| Welsh | 8 | 3.9% | View All 19 Rows |
Immigrants in Glenview Manor
The most numerous immigrant groups reported in Glenview Manor came from Europe (1 | 0.5%), France (1 | 0.5%), and Western Europe (1 | 0.5%), together accounting for 1.5% of all Glenview Manor residents.
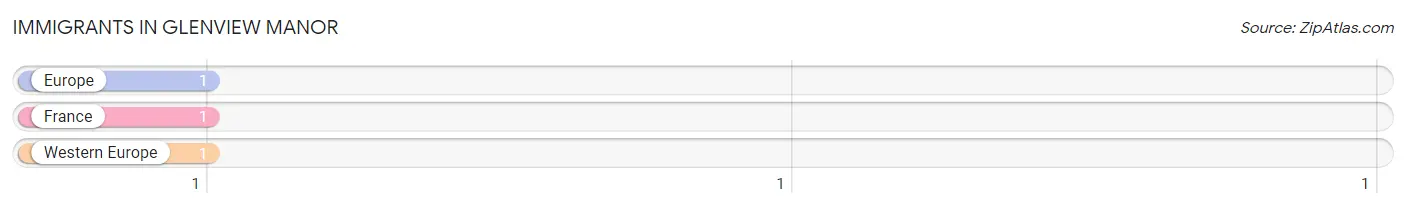
| Immigration Origin | # Population | % Population |
| Europe | 1 | 0.5% |
| France | 1 | 0.5% |
| Western Europe | 1 | 0.5% | View All 3 Rows |
Sex and Age in Glenview Manor
Sex and Age in Glenview Manor
The most populous age groups in Glenview Manor are 15 to 19 Years (18 | 16.4%) for men and 45 to 49 Years (23 | 24.0%) for women.
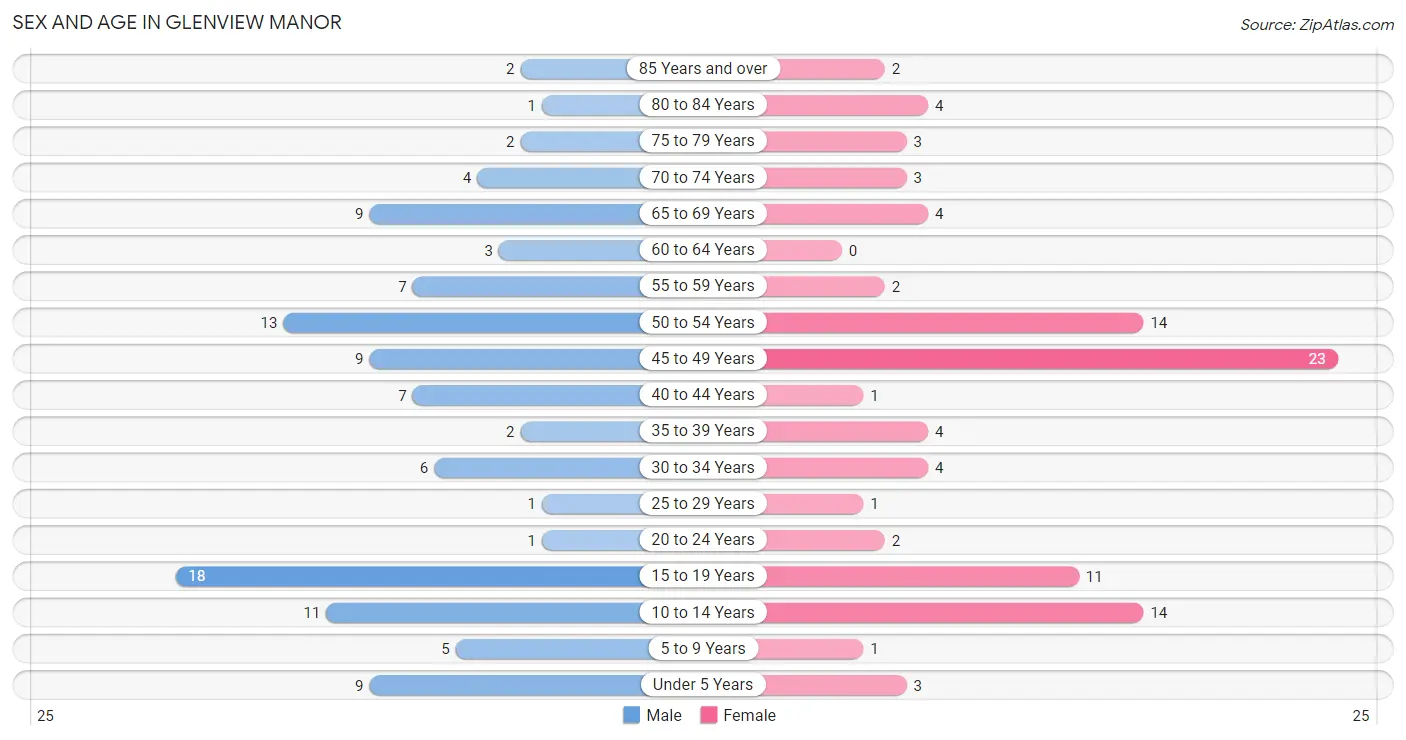
| Age Bracket | Male | Female |
| Under 5 Years | 9 (8.2%) | 3 (3.1%) |
| 5 to 9 Years | 5 (4.5%) | 1 (1.0%) |
| 10 to 14 Years | 11 (10.0%) | 14 (14.6%) |
| 15 to 19 Years | 18 (16.4%) | 11 (11.5%) |
| 20 to 24 Years | 1 (0.9%) | 2 (2.1%) |
| 25 to 29 Years | 1 (0.9%) | 1 (1.0%) |
| 30 to 34 Years | 6 (5.4%) | 4 (4.2%) |
| 35 to 39 Years | 2 (1.8%) | 4 (4.2%) |
| 40 to 44 Years | 7 (6.4%) | 1 (1.0%) |
| 45 to 49 Years | 9 (8.2%) | 23 (24.0%) |
| 50 to 54 Years | 13 (11.8%) | 14 (14.6%) |
| 55 to 59 Years | 7 (6.4%) | 2 (2.1%) |
| 60 to 64 Years | 3 (2.7%) | 0 (0.0%) |
| 65 to 69 Years | 9 (8.2%) | 4 (4.2%) |
| 70 to 74 Years | 4 (3.6%) | 3 (3.1%) |
| 75 to 79 Years | 2 (1.8%) | 3 (3.1%) |
| 80 to 84 Years | 1 (0.9%) | 4 (4.2%) |
| 85 Years and over | 2 (1.8%) | 2 (2.1%) |
| Total | 110 (100.0%) | 96 (100.0%) |
Families and Households in Glenview Manor
Median Family Size in Glenview Manor
The median family size in Glenview Manor is 2.93 persons per family, with single female/mother families (1 | 1.7%) accounting for the largest median family size of 4 persons per family. On the other hand, single male/father families (7 | 11.9%) represent the smallest median family size with 1.86 persons per family.
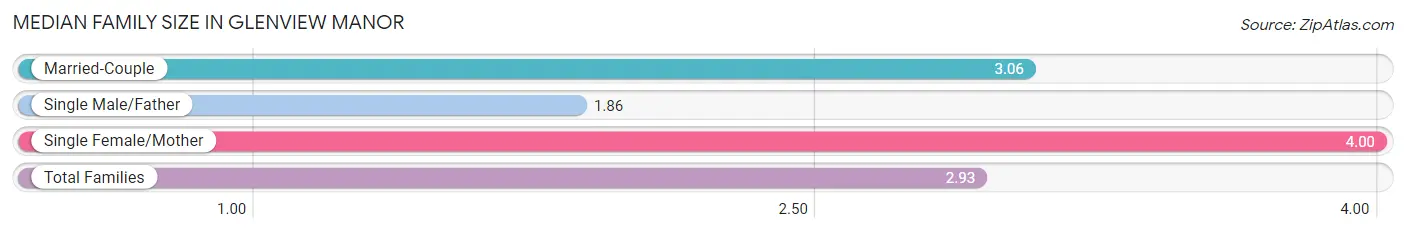
| Family Type | # Families | Family Size |
| Married-Couple | 51 (86.4%) | 3.06 |
| Single Male/Father | 7 (11.9%) | 1.86 |
| Single Female/Mother | 1 (1.7%) | 4.00 |
| Total Families | 59 (100.0%) | 2.93 |
Median Household Size in Glenview Manor
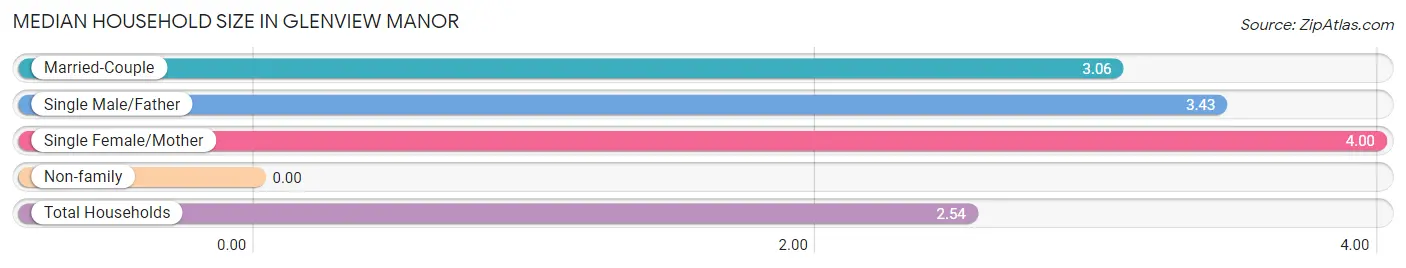
| Household Type | # Households | Household Size |
| Married-Couple | 51 (63.0%) | 3.06 |
| Single Male/Father | 7 (8.6%) | 3.43 |
| Single Female/Mother | 1 (1.2%) | 4.00 |
| Non-family | 22 (27.2%) | - |
| Total Households | 81 (100.0%) | 2.54 |
Household Size by Marriage Status in Glenview Manor
Out of a total of 81 households in Glenview Manor, 59 (72.8%) are family households, while 22 (27.2%) are nonfamily households. The most numerous type of family households are 2-person households, comprising 17, and the most common type of nonfamily households are 1-person households, comprising 22.
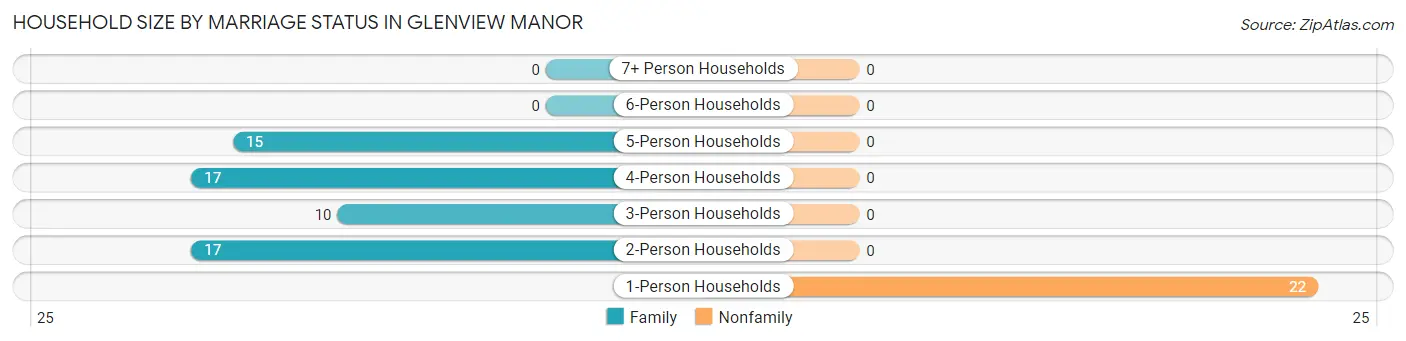
| Household Size | Family Households | Nonfamily Households |
| 1-Person Households | - | 22 (27.2%) |
| 2-Person Households | 17 (21.0%) | 0 (0.0%) |
| 3-Person Households | 10 (12.3%) | 0 (0.0%) |
| 4-Person Households | 17 (21.0%) | 0 (0.0%) |
| 5-Person Households | 15 (18.5%) | 0 (0.0%) |
| 6-Person Households | 0 (0.0%) | 0 (0.0%) |
| 7+ Person Households | 0 (0.0%) | 0 (0.0%) |
| Total | 59 (72.8%) | 22 (27.2%) |
Female Fertility in Glenview Manor
Fertility by Age in Glenview Manor
Average fertility rate in Glenview Manor is 85.0 births per 1,000 women. Women in the age bracket of 20 to 34 years have the highest fertility rate with 286.0 births per 1,000 women. Women in the age bracket of 20 to 34 years acount for 50.0% of all women with births.
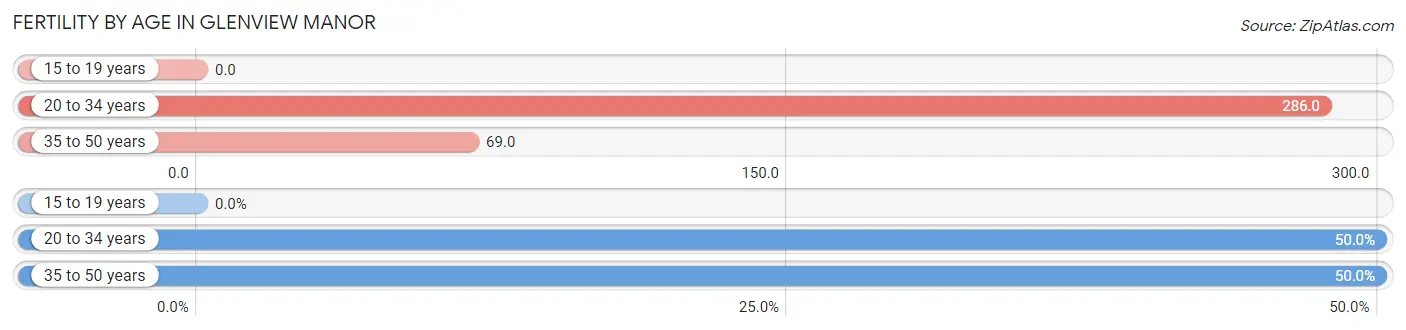
| Age Bracket | Women with Births | Births / 1,000 Women |
| 15 to 19 years | 0 (0.0%) | 0.0 |
| 20 to 34 years | 2 (50.0%) | 286.0 |
| 35 to 50 years | 2 (50.0%) | 69.0 |
| Total | 4 (100.0%) | 85.0 |
Fertility by Age by Marriage Status in Glenview Manor
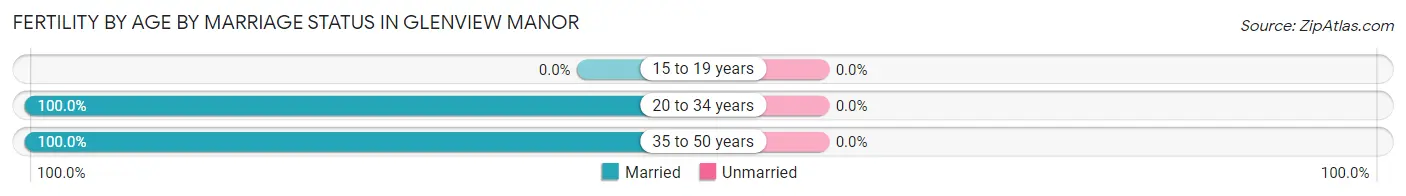
| Age Bracket | Married | Unmarried |
| 15 to 19 years | 0 (0.0%) | 0 (0.0%) |
| 20 to 34 years | 2 (100.0%) | 0 (0.0%) |
| 35 to 50 years | 2 (100.0%) | 0 (0.0%) |
| Total | 4 (100.0%) | 0 (0.0%) |
Fertility by Education in Glenview Manor
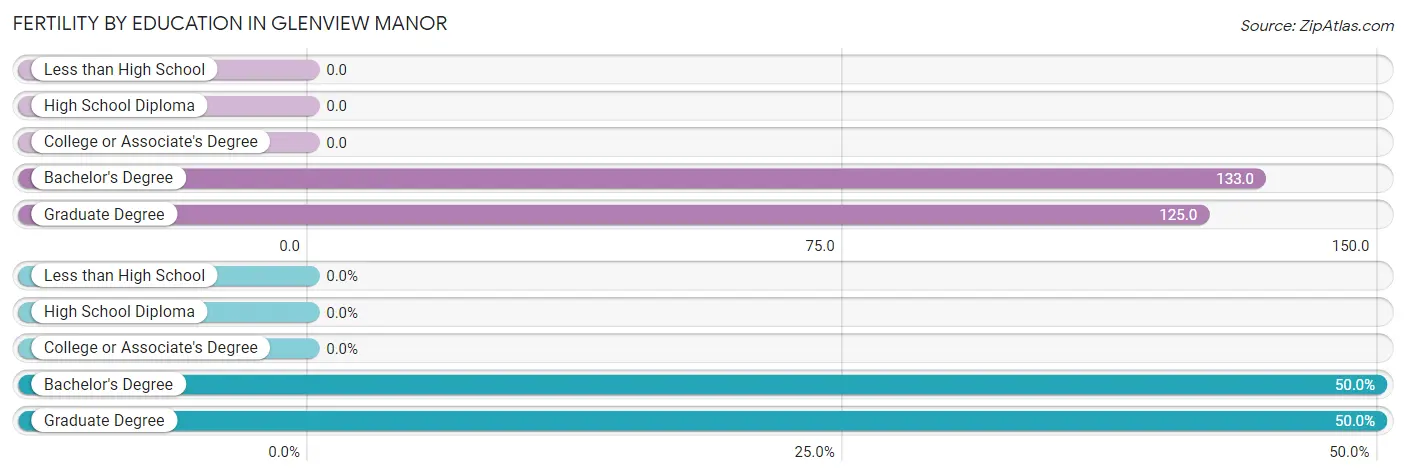
| Educational Attainment | Women with Births | Births / 1,000 Women |
| Less than High School | 0 (0.0%) | 0.0 |
| High School Diploma | 0 (0.0%) | 0.0 |
| College or Associate's Degree | 0 (0.0%) | 0.0 |
| Bachelor's Degree | 2 (50.0%) | 133.0 |
| Graduate Degree | 2 (50.0%) | 125.0 |
| Total | 4 (100.0%) | 85.0 |
Fertility by Education by Marriage Status in Glenview Manor
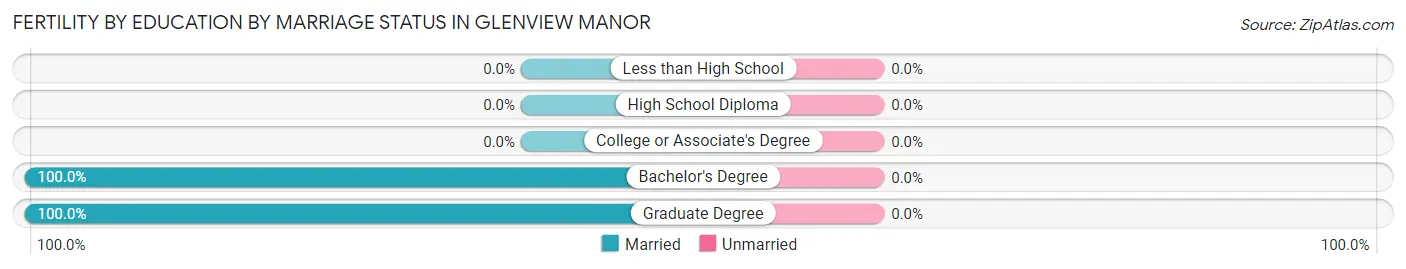
| Educational Attainment | Married | Unmarried |
| Less than High School | 0 (0.0%) | 0 (0.0%) |
| High School Diploma | 0 (0.0%) | 0 (0.0%) |
| College or Associate's Degree | 0 (0.0%) | 0 (0.0%) |
| Bachelor's Degree | 2 (100.0%) | 0 (0.0%) |
| Graduate Degree | 2 (100.0%) | 0 (0.0%) |
| Total | 4 (100.0%) | 0 (0.0%) |
Employment Characteristics in Glenview Manor
Employment by Class of Employer in Glenview Manor
Among the 99 employed individuals in Glenview Manor, private company employees (69 | 69.7%), self-employed (not incorporated) (14 | 14.1%), and not-for-profit organizations (10 | 10.1%) make up the most common classes of employment.
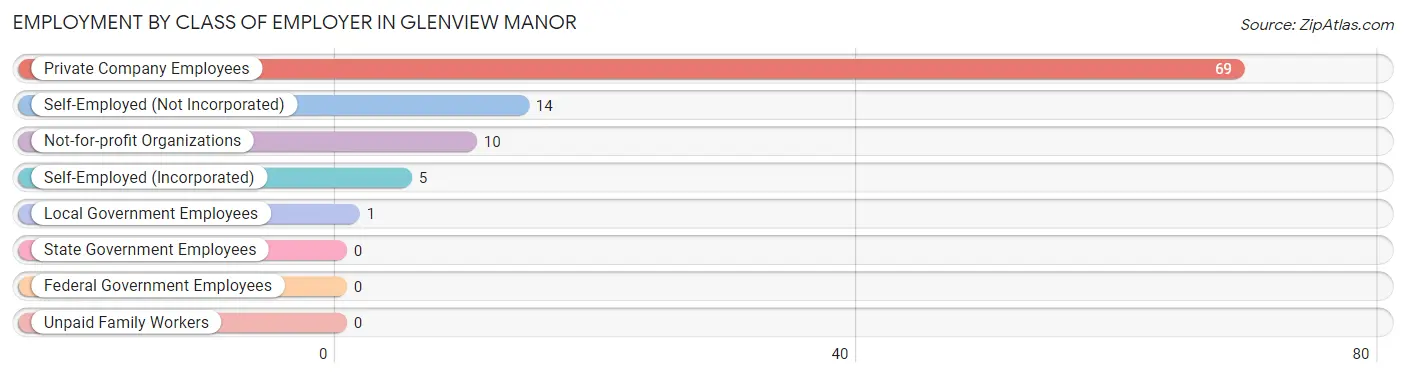
| Employer Class | # Employees | % Employees |
| Private Company Employees | 69 | 69.7% |
| Self-Employed (Incorporated) | 5 | 5.1% |
| Self-Employed (Not Incorporated) | 14 | 14.1% |
| Not-for-profit Organizations | 10 | 10.1% |
| Local Government Employees | 1 | 1.0% |
| State Government Employees | 0 | 0.0% |
| Federal Government Employees | 0 | 0.0% |
| Unpaid Family Workers | 0 | 0.0% |
| Total | 99 | 100.0% |
Employment Status by Age in Glenview Manor
According to the labor force statistics for Glenview Manor, out of the total population over 16 years of age (157), 66.2% or 104 individuals are in the labor force, with 2.9% or 3 of them unemployed. The age group with the highest labor force participation rate is 20 to 24 years, with 100.0% or 3 individuals in the labor force. Within the labor force, the 20 to 24 years age range has the highest percentage of unemployed individuals, with 66.7% or 2 of them being unemployed.
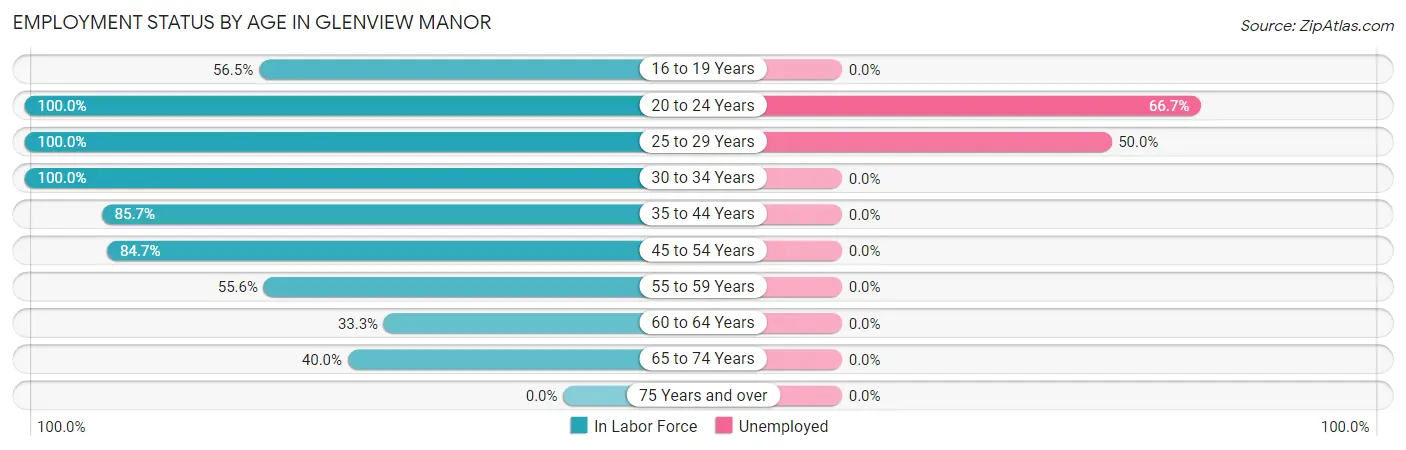
| Age Bracket | In Labor Force | Unemployed |
| 16 to 19 Years | 13 (56.5%) | 0 (0.0%) |
| 20 to 24 Years | 3 (100.0%) | 2 (66.7%) |
| 25 to 29 Years | 2 (100.0%) | 1 (50.0%) |
| 30 to 34 Years | 10 (100.0%) | 0 (0.0%) |
| 35 to 44 Years | 12 (85.7%) | 0 (0.0%) |
| 45 to 54 Years | 50 (84.7%) | 0 (0.0%) |
| 55 to 59 Years | 5 (55.6%) | 0 (0.0%) |
| 60 to 64 Years | 1 (33.3%) | 0 (0.0%) |
| 65 to 74 Years | 8 (40.0%) | 0 (0.0%) |
| 75 Years and over | 0 (0.0%) | 0 (0.0%) |
| Total | 104 (66.2%) | 3 (2.9%) |
Employment Status by Educational Attainment in Glenview Manor
According to labor force statistics for Glenview Manor, 82.5% of individuals (80) out of the total population between 25 and 64 years of age (97) are in the labor force, with 1.3% or 1 of them being unemployed. The group with the highest labor force participation rate are those with the educational attainment of bachelor's degree or higher, with 88.4% or 76 individuals in the labor force. Within the labor force, individuals with high school diploma education have the highest percentage of unemployment, with 33.3% or 1 of them being unemployed.
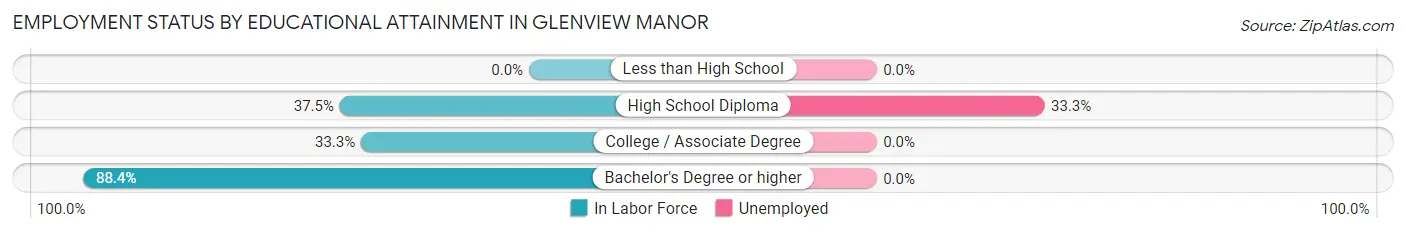
| Educational Attainment | In Labor Force | Unemployed |
| Less than High School | 0 (0.0%) | 0 (0.0%) |
| High School Diploma | 3 (37.5%) | 3 (33.3%) |
| College / Associate Degree | 1 (33.3%) | 0 (0.0%) |
| Bachelor's Degree or higher | 76 (88.4%) | 0 (0.0%) |
| Total | 80 (82.5%) | 1 (1.3%) |
Employment Occupations by Sex in Glenview Manor
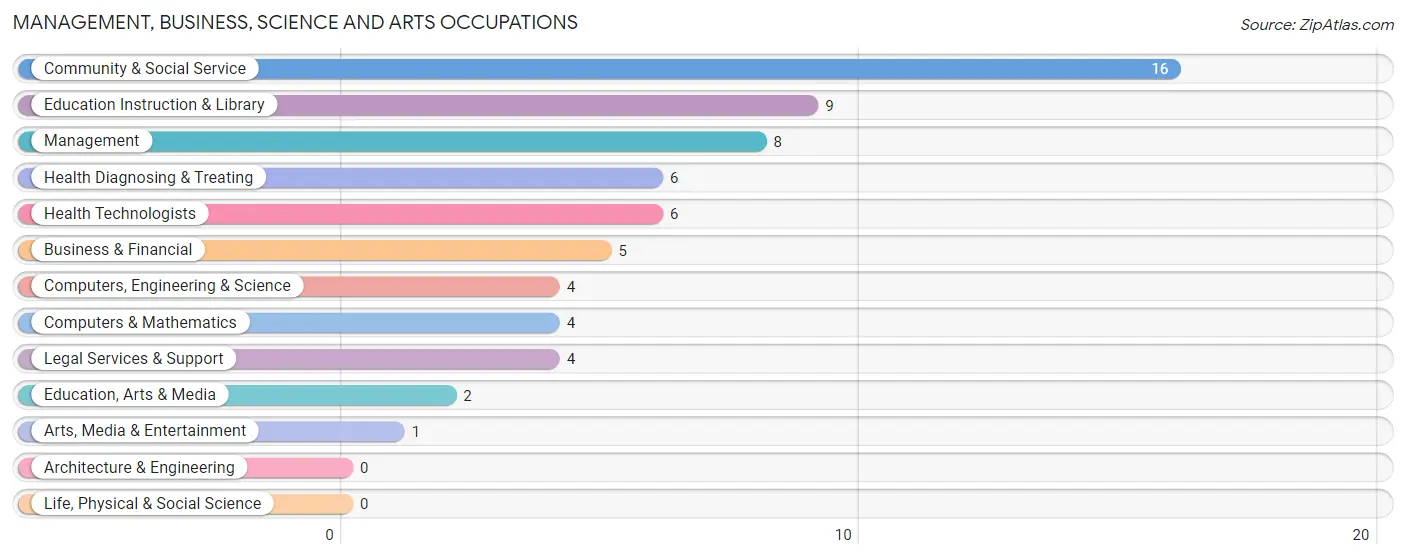
Management, Business, Science and Arts Occupations
The most common Management, Business, Science and Arts occupations in Glenview Manor are Community & Social Service (16 | 15.8%), Education Instruction & Library (9 | 8.9%), Management (8 | 7.9%), Health Diagnosing & Treating (6 | 5.9%), and Health Technologists (6 | 5.9%).
Management, Business, Science and Arts Occupations by Sex
Within the Management, Business, Science and Arts occupations in Glenview Manor, the most male-oriented occupations are Computers, Engineering & Science (100.0%), Computers & Mathematics (100.0%), and Education, Arts & Media (100.0%), while the most female-oriented occupations are Health Diagnosing & Treating (100.0%), Health Technologists (100.0%), and Education Instruction & Library (77.8%).
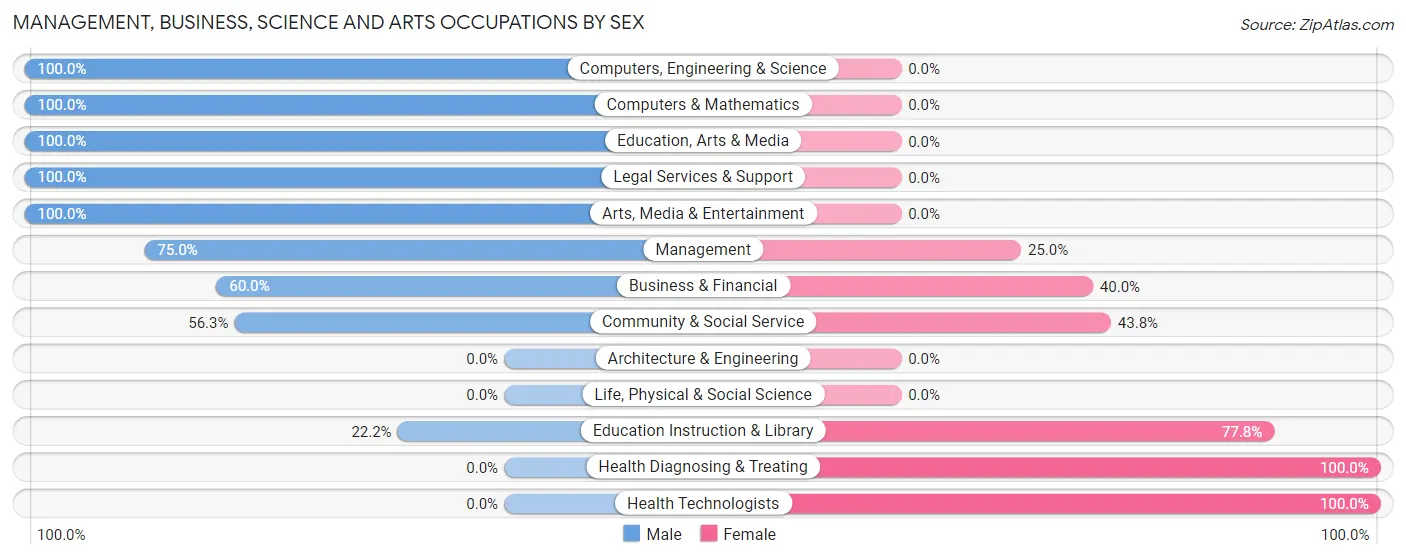
| Occupation | Male | Female |
| Management | 6 (75.0%) | 2 (25.0%) |
| Business & Financial | 3 (60.0%) | 2 (40.0%) |
| Computers, Engineering & Science | 4 (100.0%) | 0 (0.0%) |
| Computers & Mathematics | 4 (100.0%) | 0 (0.0%) |
| Architecture & Engineering | 0 (0.0%) | 0 (0.0%) |
| Life, Physical & Social Science | 0 (0.0%) | 0 (0.0%) |
| Community & Social Service | 9 (56.2%) | 7 (43.8%) |
| Education, Arts & Media | 2 (100.0%) | 0 (0.0%) |
| Legal Services & Support | 4 (100.0%) | 0 (0.0%) |
| Education Instruction & Library | 2 (22.2%) | 7 (77.8%) |
| Arts, Media & Entertainment | 1 (100.0%) | 0 (0.0%) |
| Health Diagnosing & Treating | 0 (0.0%) | 6 (100.0%) |
| Health Technologists | 0 (0.0%) | 6 (100.0%) |
| Total (Category) | 22 (56.4%) | 17 (43.6%) |
| Total (Overall) | 63 (62.4%) | 38 (37.6%) |
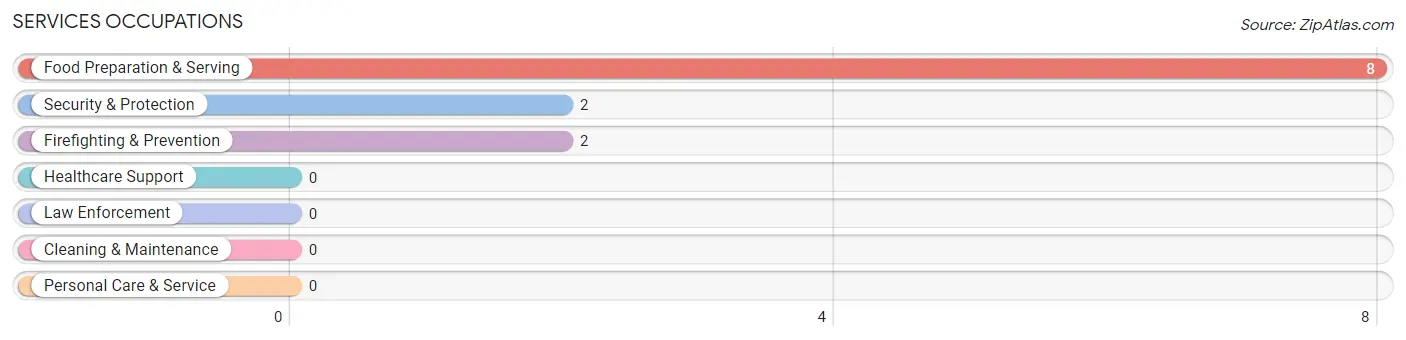
Services Occupations
The most common Services occupations in Glenview Manor are Food Preparation & Serving (8 | 7.9%), Security & Protection (2 | 2.0%), and Firefighting & Prevention (2 | 2.0%).
Services Occupations by Sex
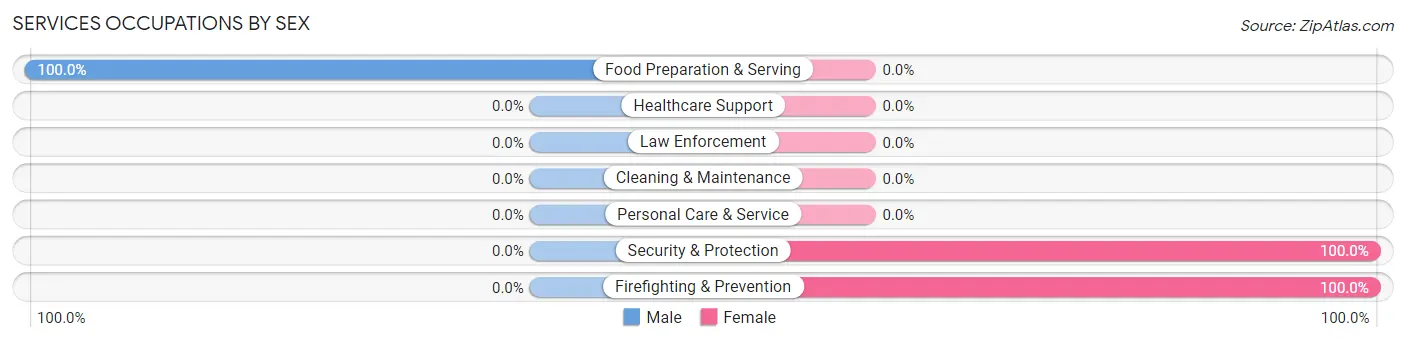
| Occupation | Male | Female |
| Healthcare Support | 0 (0.0%) | 0 (0.0%) |
| Security & Protection | 0 (0.0%) | 2 (100.0%) |
| Firefighting & Prevention | 0 (0.0%) | 2 (100.0%) |
| Law Enforcement | 0 (0.0%) | 0 (0.0%) |
| Food Preparation & Serving | 8 (100.0%) | 0 (0.0%) |
| Cleaning & Maintenance | 0 (0.0%) | 0 (0.0%) |
| Personal Care & Service | 0 (0.0%) | 0 (0.0%) |
| Total (Category) | 8 (80.0%) | 2 (20.0%) |
| Total (Overall) | 63 (62.4%) | 38 (37.6%) |
Sales and Office Occupations
The most common Sales and Office occupations in Glenview Manor are Sales & Related (44 | 43.6%), and Office & Administration (2 | 2.0%).

Sales and Office Occupations by Sex
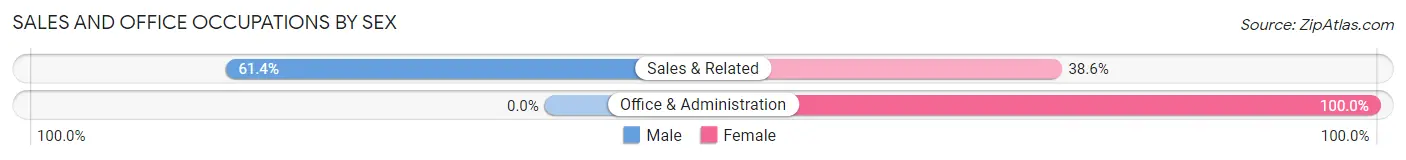
| Occupation | Male | Female |
| Sales & Related | 27 (61.4%) | 17 (38.6%) |
| Office & Administration | 0 (0.0%) | 2 (100.0%) |
| Total (Category) | 27 (58.7%) | 19 (41.3%) |
| Total (Overall) | 63 (62.4%) | 38 (37.6%) |
Natural Resources, Construction and Maintenance Occupations

Natural Resources, Construction and Maintenance Occupations by Sex
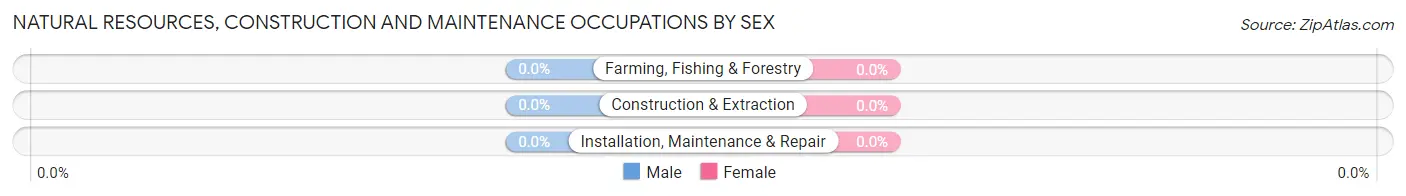
| Occupation | Male | Female |
| Farming, Fishing & Forestry | 0 (0.0%) | 0 (0.0%) |
| Construction & Extraction | 0 (0.0%) | 0 (0.0%) |
| Installation, Maintenance & Repair | 0 (0.0%) | 0 (0.0%) |
| Total (Category) | 0 (0.0%) | 0 (0.0%) |
| Total (Overall) | 63 (62.4%) | 38 (37.6%) |
Production, Transportation and Moving Occupations
The most common Production, Transportation and Moving occupations in Glenview Manor are Production (3 | 3.0%), Transportation (2 | 2.0%), and Material Moving (1 | 1.0%).
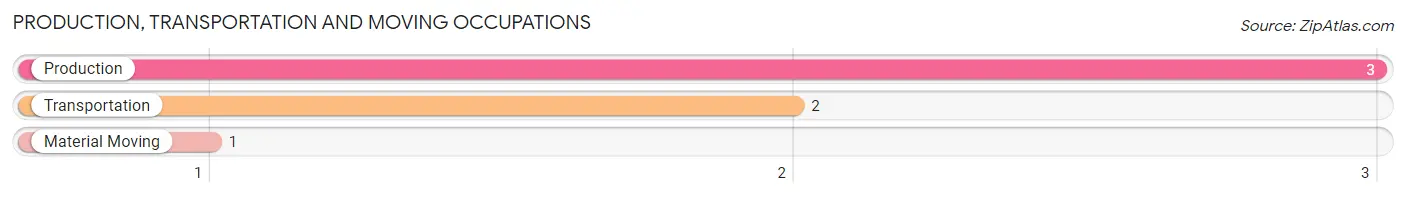
Production, Transportation and Moving Occupations by Sex
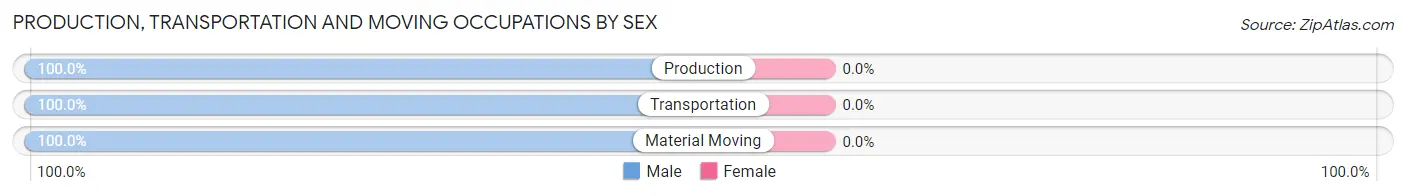
| Occupation | Male | Female |
| Production | 3 (100.0%) | 0 (0.0%) |
| Transportation | 2 (100.0%) | 0 (0.0%) |
| Material Moving | 1 (100.0%) | 0 (0.0%) |
| Total (Category) | 6 (100.0%) | 0 (0.0%) |
| Total (Overall) | 63 (62.4%) | 38 (37.6%) |
Employment Industries by Sex in Glenview Manor
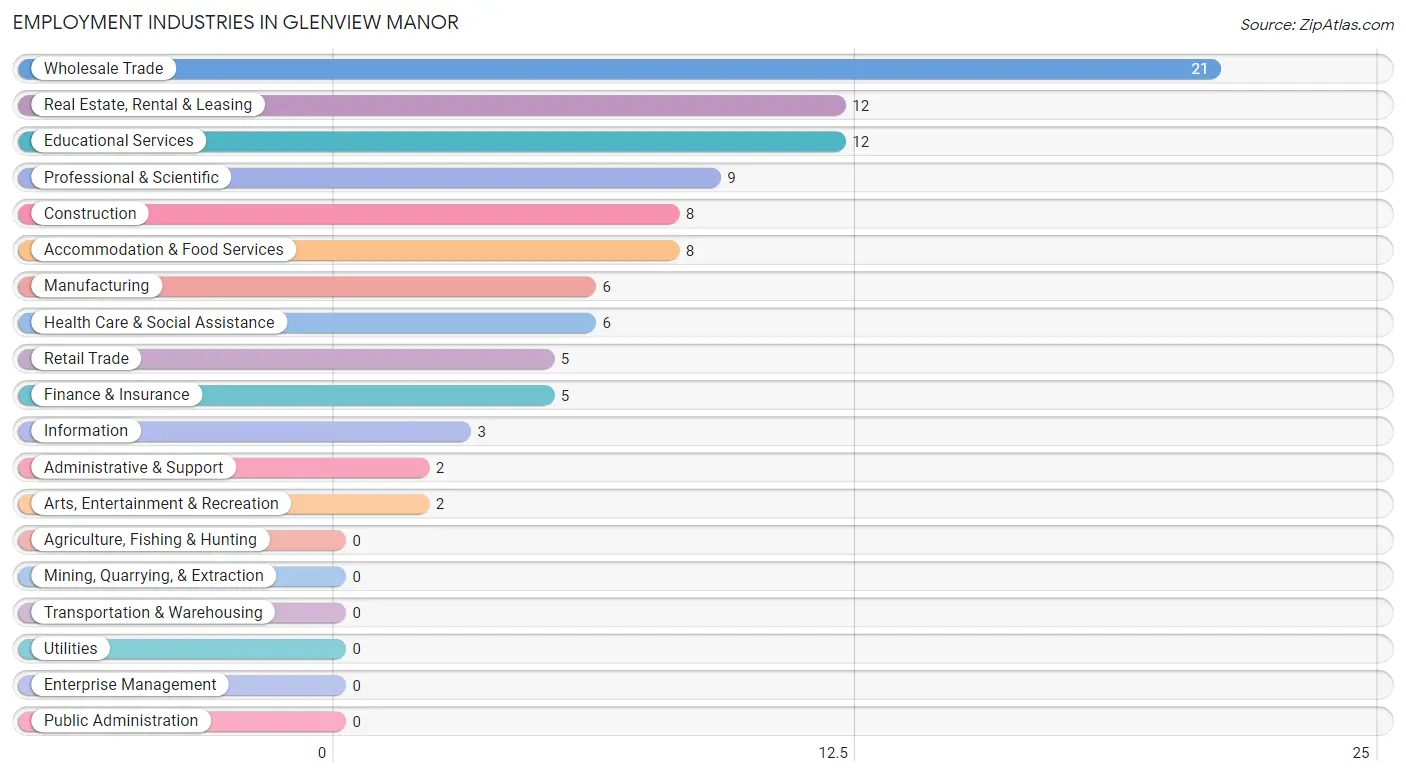
Employment Industries in Glenview Manor
The major employment industries in Glenview Manor include Wholesale Trade (21 | 20.8%), Real Estate, Rental & Leasing (12 | 11.9%), Educational Services (12 | 11.9%), Professional & Scientific (9 | 8.9%), and Construction (8 | 7.9%).
Employment Industries by Sex in Glenview Manor
The Glenview Manor industries that see more men than women are Construction (100.0%), Retail Trade (100.0%), and Information (100.0%), whereas the industries that tend to have a higher number of women are Health Care & Social Assistance (100.0%), Arts, Entertainment & Recreation (100.0%), and Finance & Insurance (80.0%).
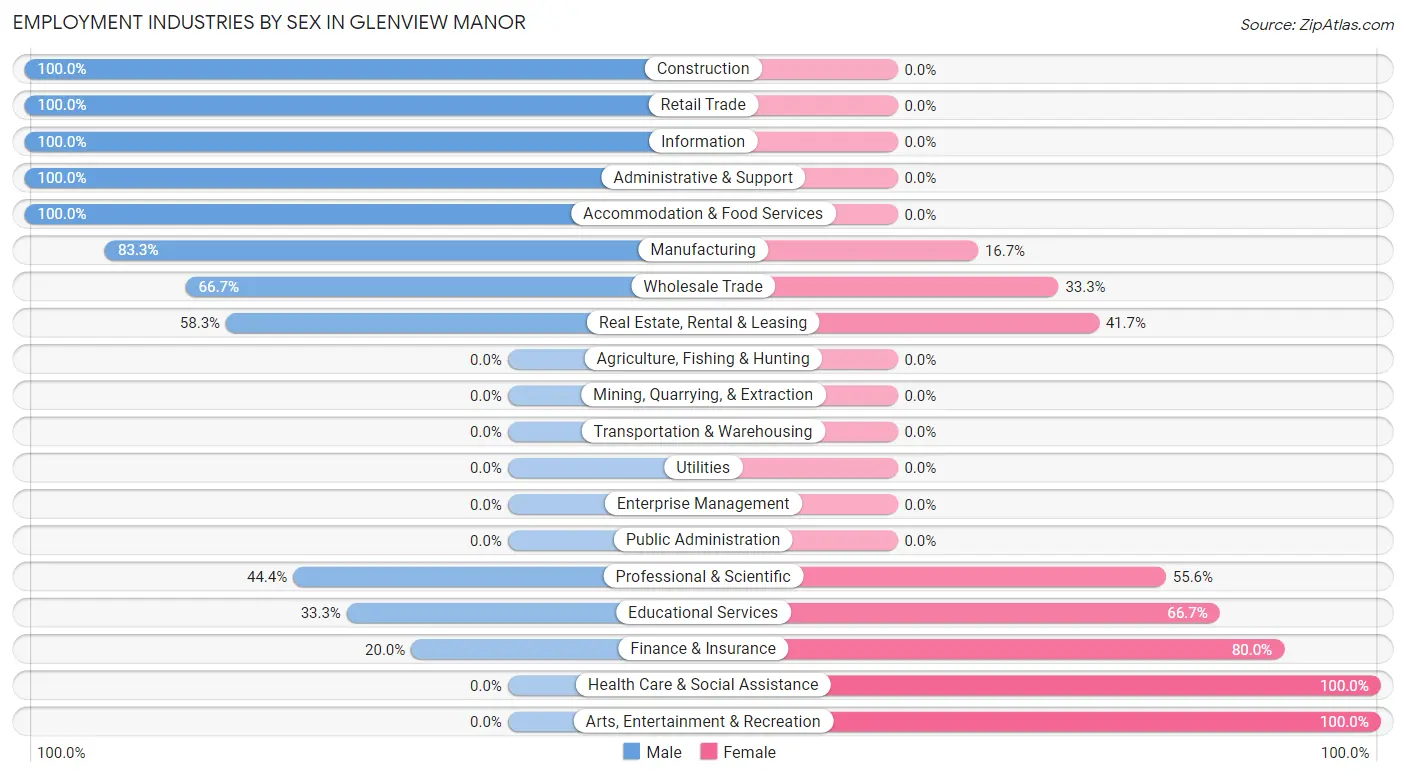
| Industry | Male | Female |
| Agriculture, Fishing & Hunting | 0 (0.0%) | 0 (0.0%) |
| Mining, Quarrying, & Extraction | 0 (0.0%) | 0 (0.0%) |
| Construction | 8 (100.0%) | 0 (0.0%) |
| Manufacturing | 5 (83.3%) | 1 (16.7%) |
| Wholesale Trade | 14 (66.7%) | 7 (33.3%) |
| Retail Trade | 5 (100.0%) | 0 (0.0%) |
| Transportation & Warehousing | 0 (0.0%) | 0 (0.0%) |
| Utilities | 0 (0.0%) | 0 (0.0%) |
| Information | 3 (100.0%) | 0 (0.0%) |
| Finance & Insurance | 1 (20.0%) | 4 (80.0%) |
| Real Estate, Rental & Leasing | 7 (58.3%) | 5 (41.7%) |
| Professional & Scientific | 4 (44.4%) | 5 (55.6%) |
| Enterprise Management | 0 (0.0%) | 0 (0.0%) |
| Administrative & Support | 2 (100.0%) | 0 (0.0%) |
| Educational Services | 4 (33.3%) | 8 (66.7%) |
| Health Care & Social Assistance | 0 (0.0%) | 6 (100.0%) |
| Arts, Entertainment & Recreation | 0 (0.0%) | 2 (100.0%) |
| Accommodation & Food Services | 8 (100.0%) | 0 (0.0%) |
| Public Administration | 0 (0.0%) | 0 (0.0%) |
| Total | 63 (62.4%) | 38 (37.6%) |
Education in Glenview Manor
School Enrollment in Glenview Manor
The most common levels of schooling among the 63 students in Glenview Manor are high school (27 | 42.9%), middle school (25 | 39.7%), and elementary school (5 | 7.9%).
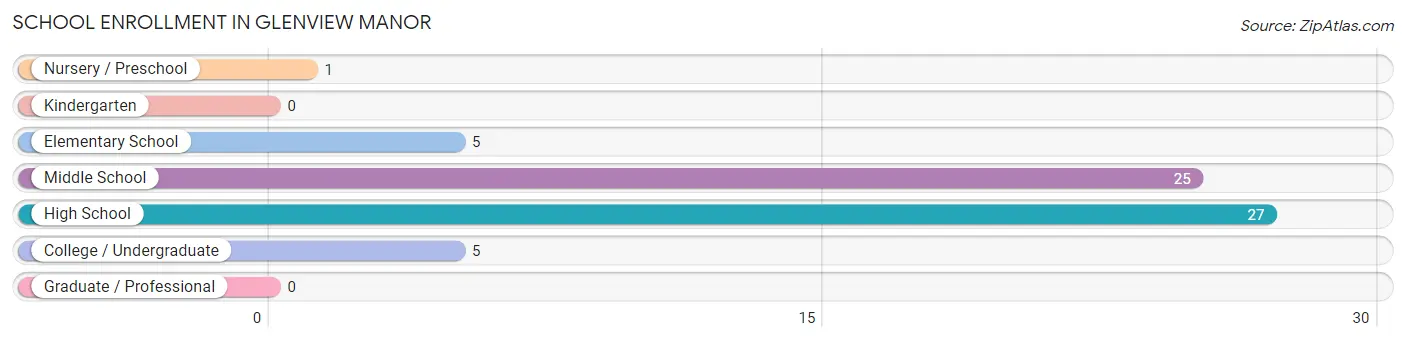
| School Level | # Students | % Students |
| Nursery / Preschool | 1 | 1.6% |
| Kindergarten | 0 | 0.0% |
| Elementary School | 5 | 7.9% |
| Middle School | 25 | 39.7% |
| High School | 27 | 42.9% |
| College / Undergraduate | 5 | 7.9% |
| Graduate / Professional | 0 | 0.0% |
| Total | 63 | 100.0% |
School Enrollment by Age by Funding Source in Glenview Manor
Out of a total of 63 students who are enrolled in schools in Glenview Manor, 49 (77.8%) attend a private institution, while the remaining 14 (22.2%) are enrolled in public schools. The age group of 3 to 4 year olds has the highest likelihood of being enrolled in private schools, with 1 (100.0% in the age bracket) enrolled. Conversely, the age group of 20 to 24 year olds has the lowest likelihood of being enrolled in a private school, with 2 (100.0% in the age bracket) attending a public institution.
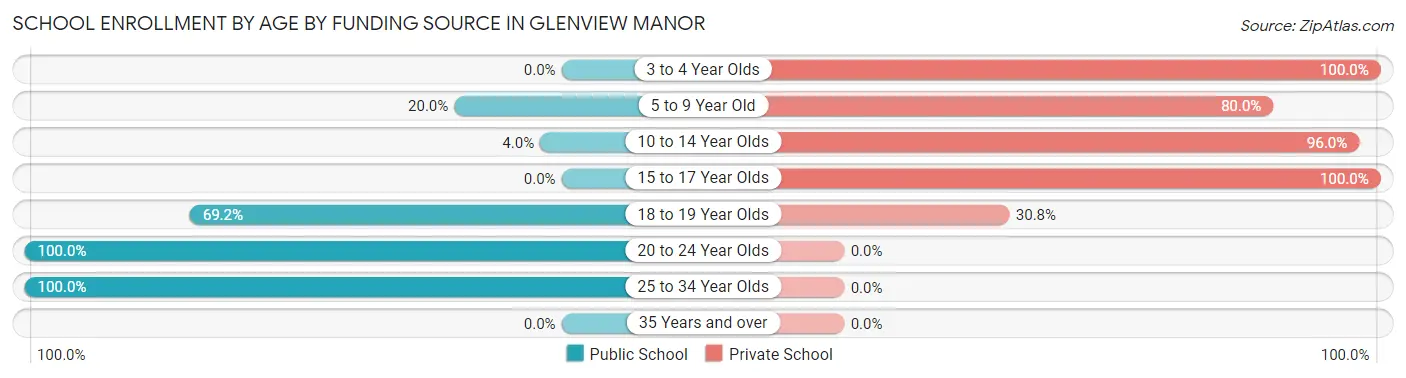
| Age Bracket | Public School | Private School |
| 3 to 4 Year Olds | 0 (0.0%) | 1 (100.0%) |
| 5 to 9 Year Old | 1 (20.0%) | 4 (80.0%) |
| 10 to 14 Year Olds | 1 (4.0%) | 24 (96.0%) |
| 15 to 17 Year Olds | 0 (0.0%) | 16 (100.0%) |
| 18 to 19 Year Olds | 9 (69.2%) | 4 (30.8%) |
| 20 to 24 Year Olds | 2 (100.0%) | 0 (0.0%) |
| 25 to 34 Year Olds | 1 (100.0%) | 0 (0.0%) |
| 35 Years and over | 0 (0.0%) | 0 (0.0%) |
| Total | 14 (22.2%) | 49 (77.8%) |
Educational Attainment by Field of Study in Glenview Manor
Business (32 | 28.3%), communications (13 | 11.5%), visual & performing arts (11 | 9.7%), psychology (7 | 6.2%), and social sciences (7 | 6.2%) are the most common fields of study among 113 individuals in Glenview Manor who have obtained a bachelor's degree or higher.
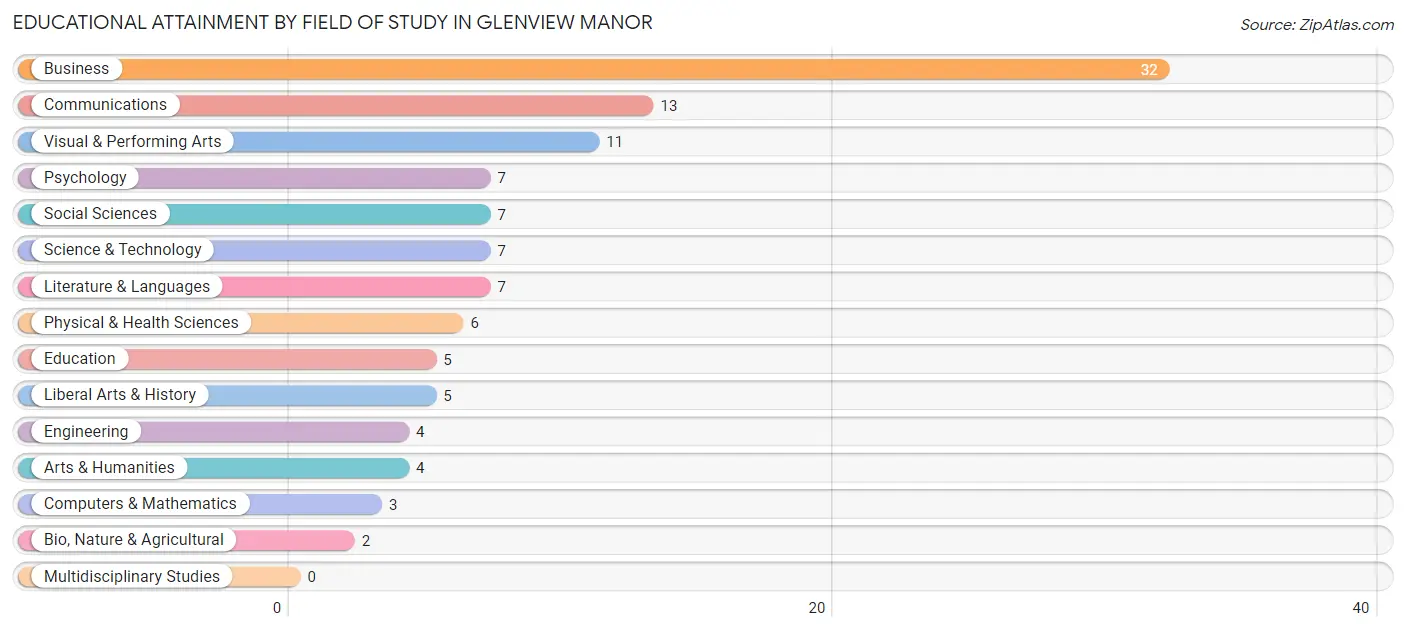
| Field of Study | # Graduates | % Graduates |
| Computers & Mathematics | 3 | 2.6% |
| Bio, Nature & Agricultural | 2 | 1.8% |
| Physical & Health Sciences | 6 | 5.3% |
| Psychology | 7 | 6.2% |
| Social Sciences | 7 | 6.2% |
| Engineering | 4 | 3.5% |
| Multidisciplinary Studies | 0 | 0.0% |
| Science & Technology | 7 | 6.2% |
| Business | 32 | 28.3% |
| Education | 5 | 4.4% |
| Literature & Languages | 7 | 6.2% |
| Liberal Arts & History | 5 | 4.4% |
| Visual & Performing Arts | 11 | 9.7% |
| Communications | 13 | 11.5% |
| Arts & Humanities | 4 | 3.5% |
| Total | 113 | 100.0% |
Transportation & Commute in Glenview Manor
Vehicle Availability by Sex in Glenview Manor
The most prevalent vehicle ownership categories in Glenview Manor are males with 3 vehicles (23, accounting for 37.7%) and females with 3 vehicles (11, making up 60.5%).
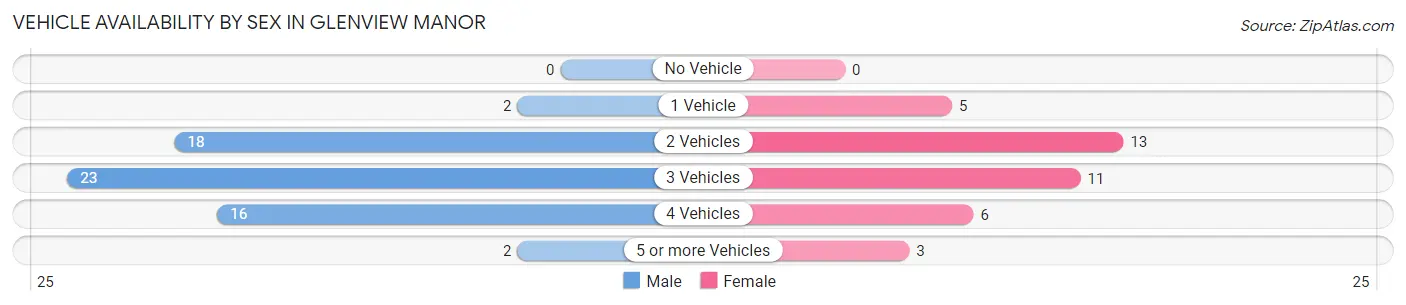
| Vehicles Available | Male | Female |
| No Vehicle | 0 (0.0%) | 0 (0.0%) |
| 1 Vehicle | 2 (3.3%) | 5 (13.2%) |
| 2 Vehicles | 18 (29.5%) | 13 (34.2%) |
| 3 Vehicles | 23 (37.7%) | 11 (28.9%) |
| 4 Vehicles | 16 (26.2%) | 6 (15.8%) |
| 5 or more Vehicles | 2 (3.3%) | 3 (7.9%) |
| Total | 61 (100.0%) | 38 (100.0%) |
Commute Time in Glenview Manor
The most frequently occuring commute durations in Glenview Manor are 15 to 19 minutes (26 commuters, 35.6%), 5 to 9 minutes (15 commuters, 20.5%), and 10 to 14 minutes (9 commuters, 12.3%).
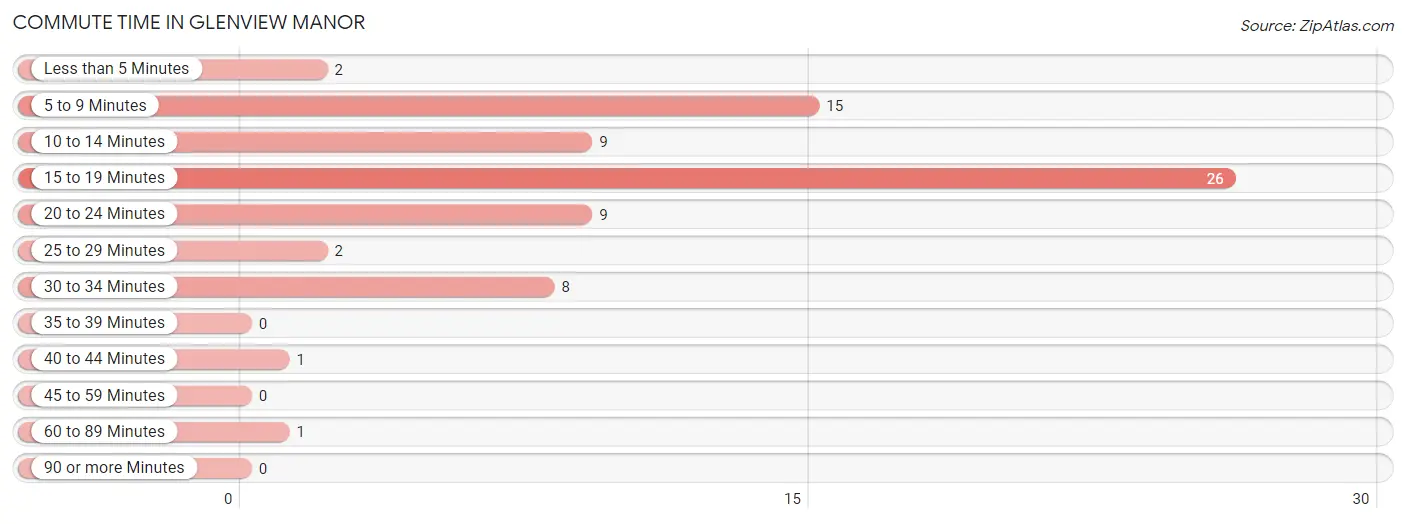
| Commute Time | # Commuters | % Commuters |
| Less than 5 Minutes | 2 | 2.7% |
| 5 to 9 Minutes | 15 | 20.5% |
| 10 to 14 Minutes | 9 | 12.3% |
| 15 to 19 Minutes | 26 | 35.6% |
| 20 to 24 Minutes | 9 | 12.3% |
| 25 to 29 Minutes | 2 | 2.7% |
| 30 to 34 Minutes | 8 | 11.0% |
| 35 to 39 Minutes | 0 | 0.0% |
| 40 to 44 Minutes | 1 | 1.4% |
| 45 to 59 Minutes | 0 | 0.0% |
| 60 to 89 Minutes | 1 | 1.4% |
| 90 or more Minutes | 0 | 0.0% |
Commute Time by Sex in Glenview Manor
The most common commute times in Glenview Manor are 15 to 19 minutes (20 commuters, 39.2%) for males and 15 to 19 minutes (6 commuters, 27.3%) for females.
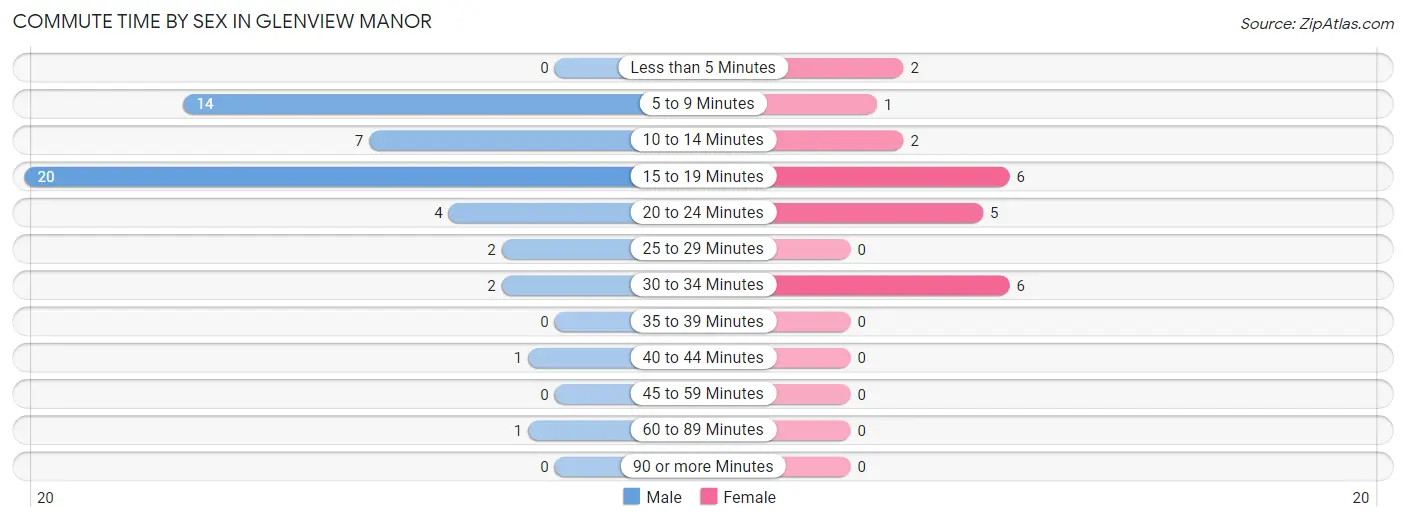
| Commute Time | Male | Female |
| Less than 5 Minutes | 0 (0.0%) | 2 (9.1%) |
| 5 to 9 Minutes | 14 (27.5%) | 1 (4.5%) |
| 10 to 14 Minutes | 7 (13.7%) | 2 (9.1%) |
| 15 to 19 Minutes | 20 (39.2%) | 6 (27.3%) |
| 20 to 24 Minutes | 4 (7.8%) | 5 (22.7%) |
| 25 to 29 Minutes | 2 (3.9%) | 0 (0.0%) |
| 30 to 34 Minutes | 2 (3.9%) | 6 (27.3%) |
| 35 to 39 Minutes | 0 (0.0%) | 0 (0.0%) |
| 40 to 44 Minutes | 1 (2.0%) | 0 (0.0%) |
| 45 to 59 Minutes | 0 (0.0%) | 0 (0.0%) |
| 60 to 89 Minutes | 1 (2.0%) | 0 (0.0%) |
| 90 or more Minutes | 0 (0.0%) | 0 (0.0%) |
Time of Departure to Work by Sex in Glenview Manor
The most frequent times of departure to work in Glenview Manor are 8:00 AM to 8:29 AM (21, 41.2%) for males and 7:30 AM to 7:59 AM (8, 36.4%) for females.
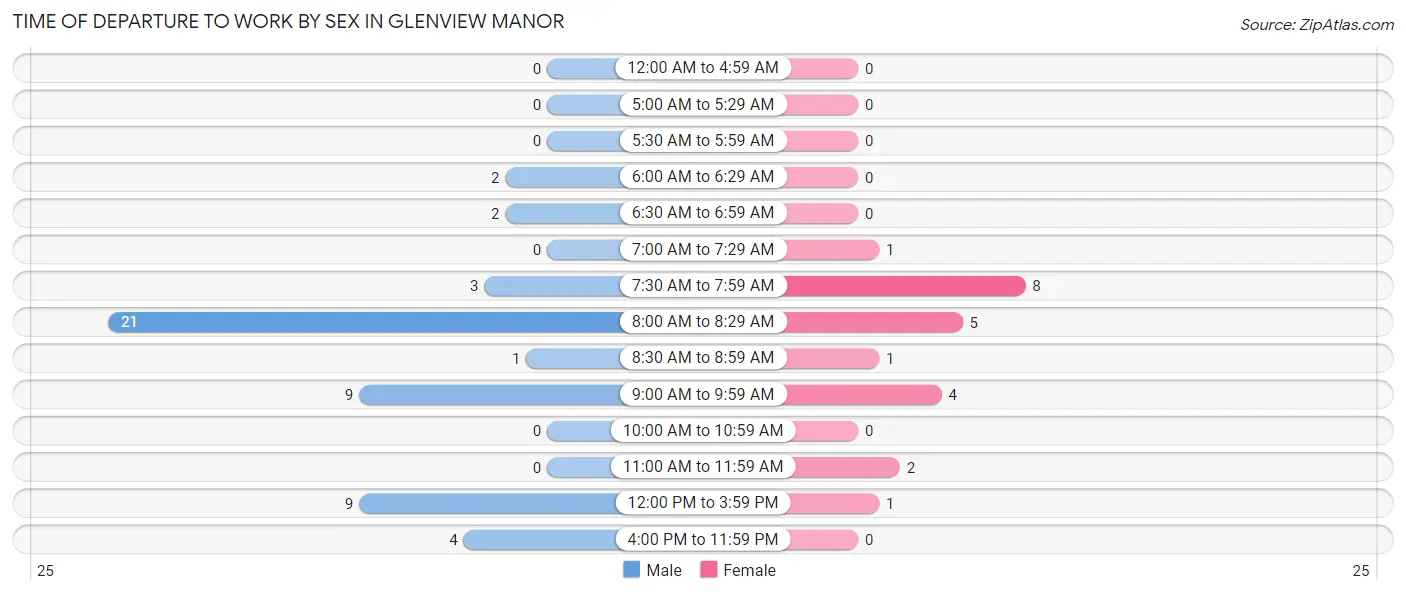
| Time of Departure | Male | Female |
| 12:00 AM to 4:59 AM | 0 (0.0%) | 0 (0.0%) |
| 5:00 AM to 5:29 AM | 0 (0.0%) | 0 (0.0%) |
| 5:30 AM to 5:59 AM | 0 (0.0%) | 0 (0.0%) |
| 6:00 AM to 6:29 AM | 2 (3.9%) | 0 (0.0%) |
| 6:30 AM to 6:59 AM | 2 (3.9%) | 0 (0.0%) |
| 7:00 AM to 7:29 AM | 0 (0.0%) | 1 (4.5%) |
| 7:30 AM to 7:59 AM | 3 (5.9%) | 8 (36.4%) |
| 8:00 AM to 8:29 AM | 21 (41.2%) | 5 (22.7%) |
| 8:30 AM to 8:59 AM | 1 (2.0%) | 1 (4.5%) |
| 9:00 AM to 9:59 AM | 9 (17.6%) | 4 (18.2%) |
| 10:00 AM to 10:59 AM | 0 (0.0%) | 0 (0.0%) |
| 11:00 AM to 11:59 AM | 0 (0.0%) | 2 (9.1%) |
| 12:00 PM to 3:59 PM | 9 (17.6%) | 1 (4.5%) |
| 4:00 PM to 11:59 PM | 4 (7.8%) | 0 (0.0%) |
| Total | 51 (100.0%) | 22 (100.0%) |
Housing Occupancy in Glenview Manor
Occupancy by Ownership in Glenview Manor
Of the total 81 dwellings in Glenview Manor, owner-occupied units account for 77 (95.1%), while renter-occupied units make up 4 (4.9%).
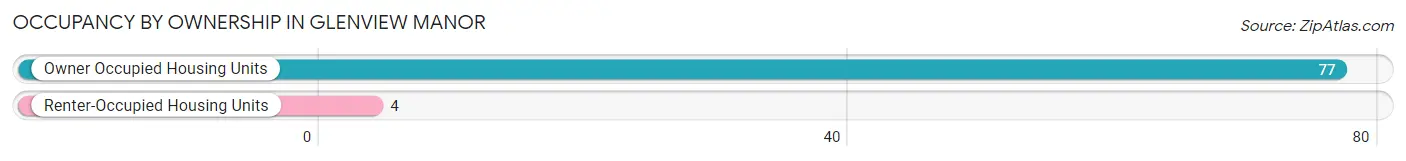
| Occupancy | # Housing Units | % Housing Units |
| Owner Occupied Housing Units | 77 | 95.1% |
| Renter-Occupied Housing Units | 4 | 4.9% |
| Total Occupied Housing Units | 81 | 100.0% |
Occupancy by Household Size in Glenview Manor
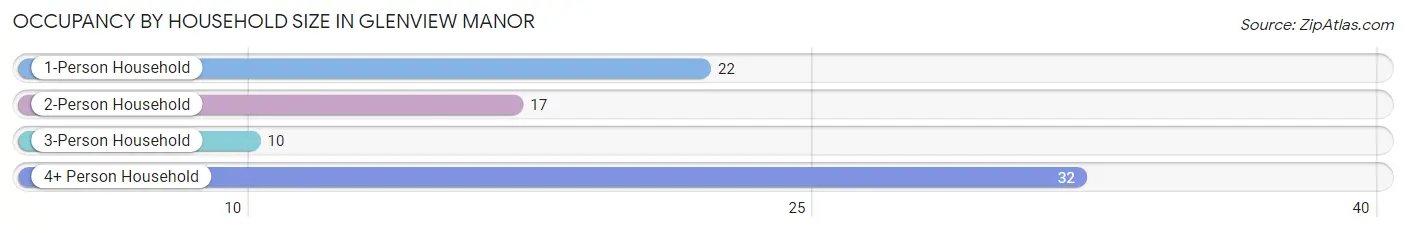
| Household Size | # Housing Units | % Housing Units |
| 1-Person Household | 22 | 27.2% |
| 2-Person Household | 17 | 21.0% |
| 3-Person Household | 10 | 12.3% |
| 4+ Person Household | 32 | 39.5% |
| Total Housing Units | 81 | 100.0% |
Occupancy by Ownership by Household Size in Glenview Manor
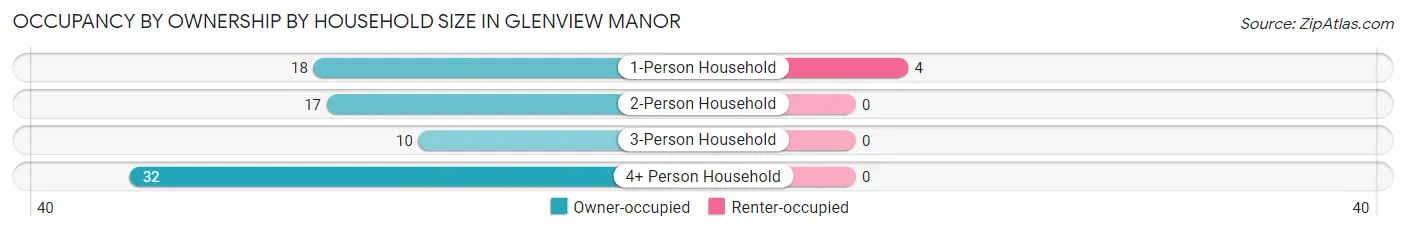
| Household Size | Owner-occupied | Renter-occupied |
| 1-Person Household | 18 (81.8%) | 4 (18.2%) |
| 2-Person Household | 17 (100.0%) | 0 (0.0%) |
| 3-Person Household | 10 (100.0%) | 0 (0.0%) |
| 4+ Person Household | 32 (100.0%) | 0 (0.0%) |
| Total Housing Units | 77 (95.1%) | 4 (4.9%) |
Occupancy by Educational Attainment in Glenview Manor
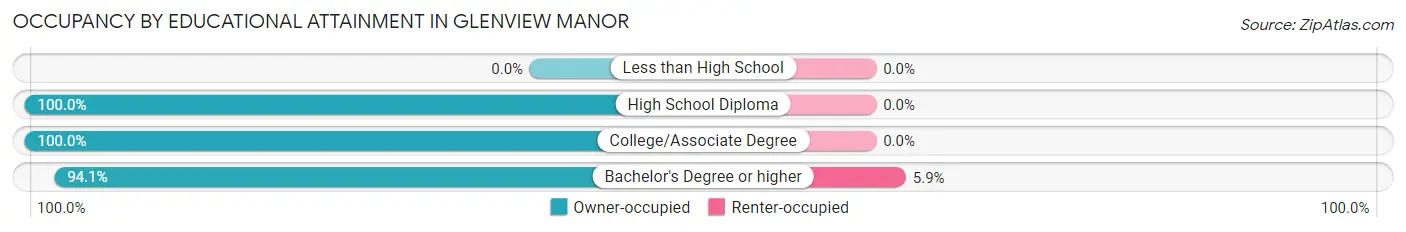
| Household Size | Owner-occupied | Renter-occupied |
| Less than High School | 0 (0.0%) | 0 (0.0%) |
| High School Diploma | 7 (100.0%) | 0 (0.0%) |
| College/Associate Degree | 6 (100.0%) | 0 (0.0%) |
| Bachelor's Degree or higher | 64 (94.1%) | 4 (5.9%) |
Occupancy by Age of Householder in Glenview Manor
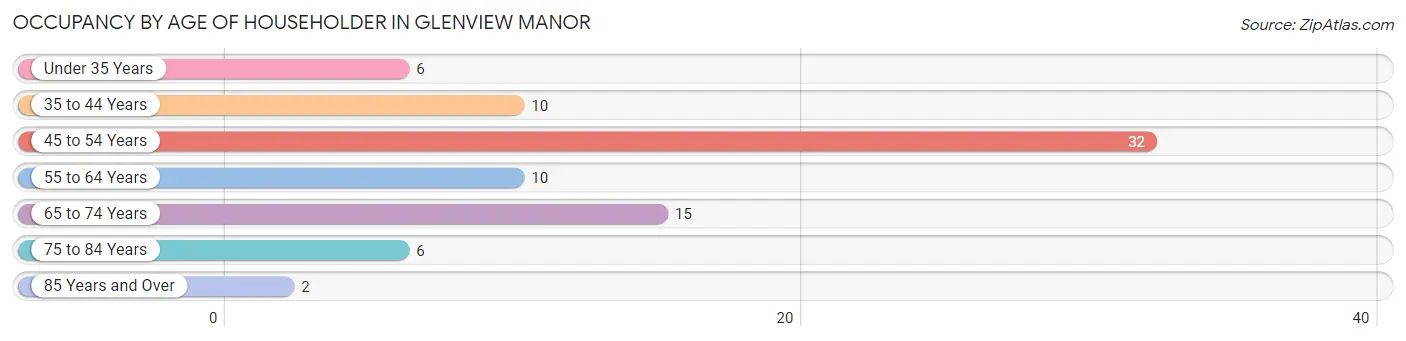
| Age Bracket | # Households | % Households |
| Under 35 Years | 6 | 7.4% |
| 35 to 44 Years | 10 | 12.3% |
| 45 to 54 Years | 32 | 39.5% |
| 55 to 64 Years | 10 | 12.3% |
| 65 to 74 Years | 15 | 18.5% |
| 75 to 84 Years | 6 | 7.4% |
| 85 Years and Over | 2 | 2.5% |
| Total | 81 | 100.0% |
Housing Finances in Glenview Manor
Median Income by Occupancy in Glenview Manor
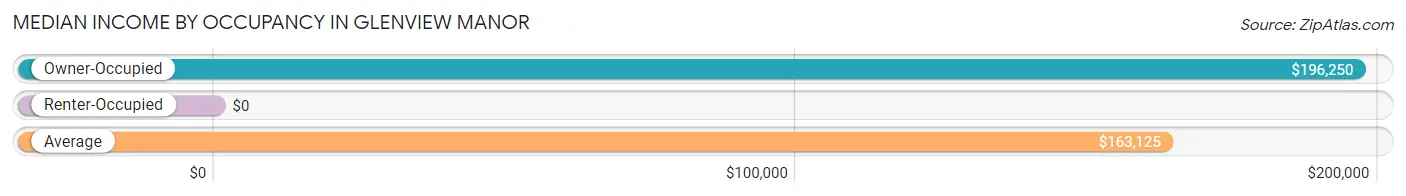
| Occupancy Type | # Households | Median Income |
| Owner-Occupied | 77 (95.1%) | $196,250 |
| Renter-Occupied | 4 (4.9%) | $0 |
| Average | 81 (100.0%) | $163,125 |
Occupancy by Householder Income Bracket in Glenview Manor
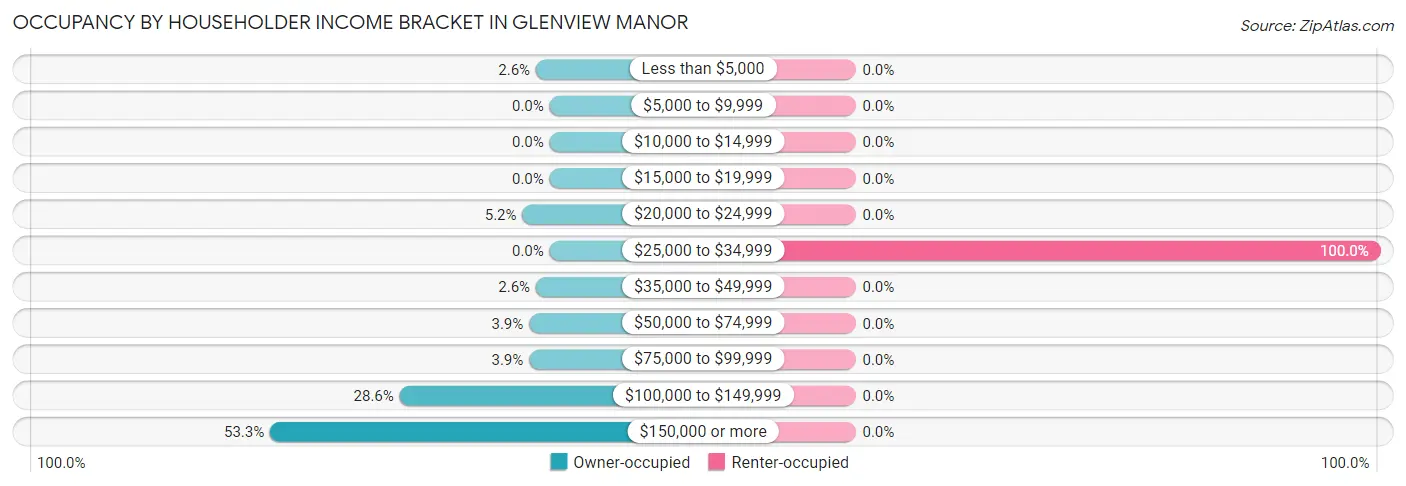
| Income Bracket | Owner-occupied | Renter-occupied |
| Less than $5,000 | 2 (2.6%) | 0 (0.0%) |
| $5,000 to $9,999 | 0 (0.0%) | 0 (0.0%) |
| $10,000 to $14,999 | 0 (0.0%) | 0 (0.0%) |
| $15,000 to $19,999 | 0 (0.0%) | 0 (0.0%) |
| $20,000 to $24,999 | 4 (5.2%) | 0 (0.0%) |
| $25,000 to $34,999 | 0 (0.0%) | 4 (100.0%) |
| $35,000 to $49,999 | 2 (2.6%) | 0 (0.0%) |
| $50,000 to $74,999 | 3 (3.9%) | 0 (0.0%) |
| $75,000 to $99,999 | 3 (3.9%) | 0 (0.0%) |
| $100,000 to $149,999 | 22 (28.6%) | 0 (0.0%) |
| $150,000 or more | 41 (53.2%) | 0 (0.0%) |
| Total | 77 (100.0%) | 4 (100.0%) |
Monthly Housing Cost Tiers in Glenview Manor
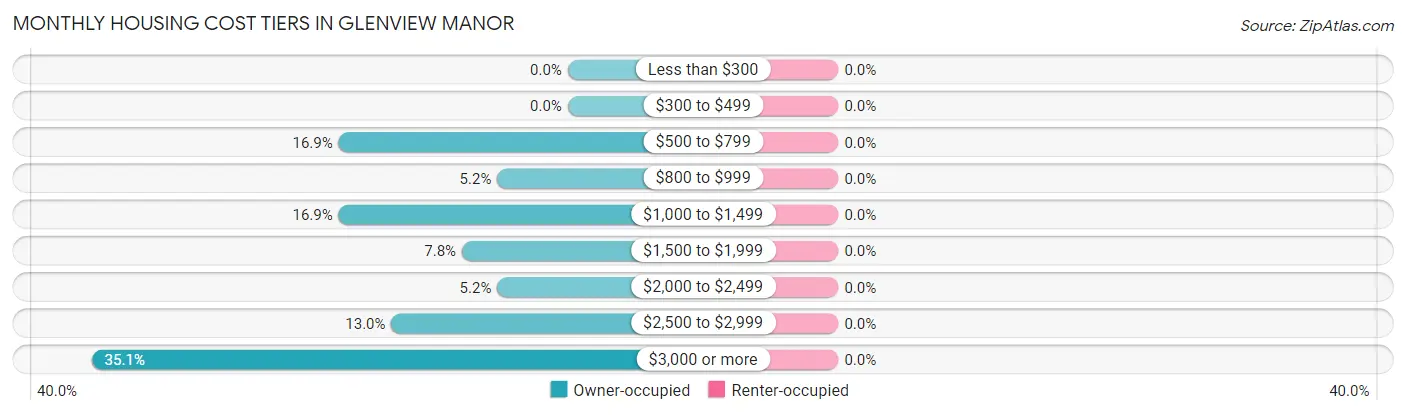
| Monthly Cost | Owner-occupied | Renter-occupied |
| Less than $300 | 0 (0.0%) | 0 (0.0%) |
| $300 to $499 | 0 (0.0%) | 0 (0.0%) |
| $500 to $799 | 13 (16.9%) | 0 (0.0%) |
| $800 to $999 | 4 (5.2%) | 0 (0.0%) |
| $1,000 to $1,499 | 13 (16.9%) | 0 (0.0%) |
| $1,500 to $1,999 | 6 (7.8%) | 0 (0.0%) |
| $2,000 to $2,499 | 4 (5.2%) | 0 (0.0%) |
| $2,500 to $2,999 | 10 (13.0%) | 0 (0.0%) |
| $3,000 or more | 27 (35.1%) | 0 (0.0%) |
| Total | 77 (100.0%) | 4 (100.0%) |
Physical Housing Characteristics in Glenview Manor
Housing Structures in Glenview Manor
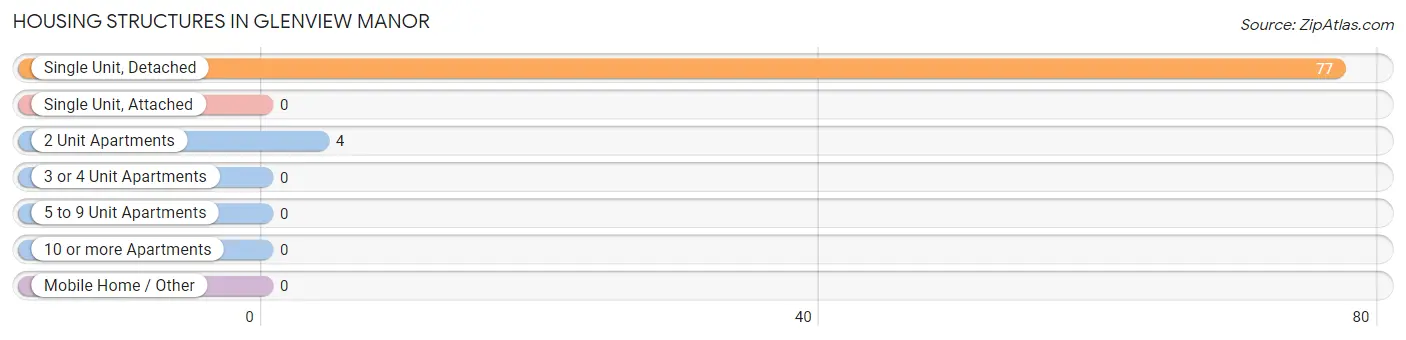
| Structure Type | # Housing Units | % Housing Units |
| Single Unit, Detached | 77 | 95.1% |
| Single Unit, Attached | 0 | 0.0% |
| 2 Unit Apartments | 4 | 4.9% |
| 3 or 4 Unit Apartments | 0 | 0.0% |
| 5 to 9 Unit Apartments | 0 | 0.0% |
| 10 or more Apartments | 0 | 0.0% |
| Mobile Home / Other | 0 | 0.0% |
| Total | 81 | 100.0% |
Housing Structures by Occupancy in Glenview Manor
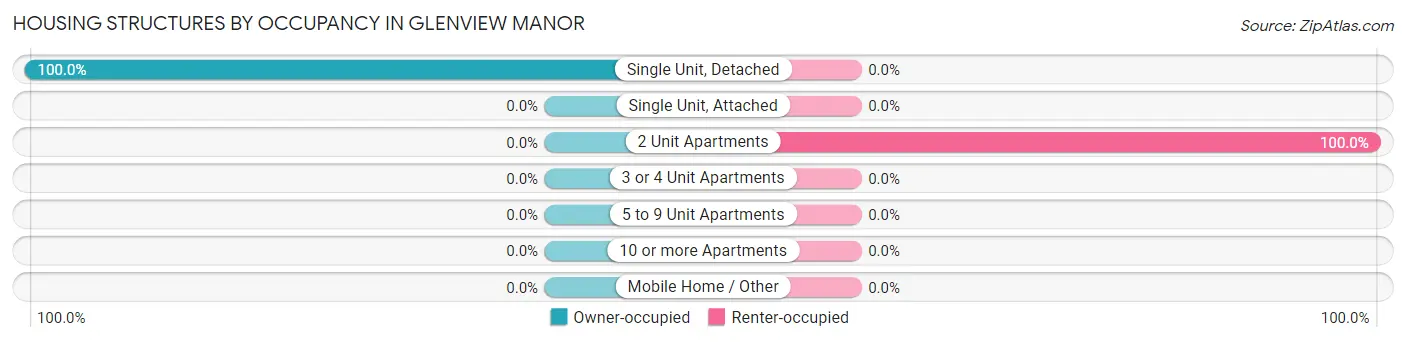
| Structure Type | Owner-occupied | Renter-occupied |
| Single Unit, Detached | 77 (100.0%) | 0 (0.0%) |
| Single Unit, Attached | 0 (0.0%) | 0 (0.0%) |
| 2 Unit Apartments | 0 (0.0%) | 4 (100.0%) |
| 3 or 4 Unit Apartments | 0 (0.0%) | 0 (0.0%) |
| 5 to 9 Unit Apartments | 0 (0.0%) | 0 (0.0%) |
| 10 or more Apartments | 0 (0.0%) | 0 (0.0%) |
| Mobile Home / Other | 0 (0.0%) | 0 (0.0%) |
| Total | 77 (95.1%) | 4 (4.9%) |
Housing Structures by Number of Rooms in Glenview Manor
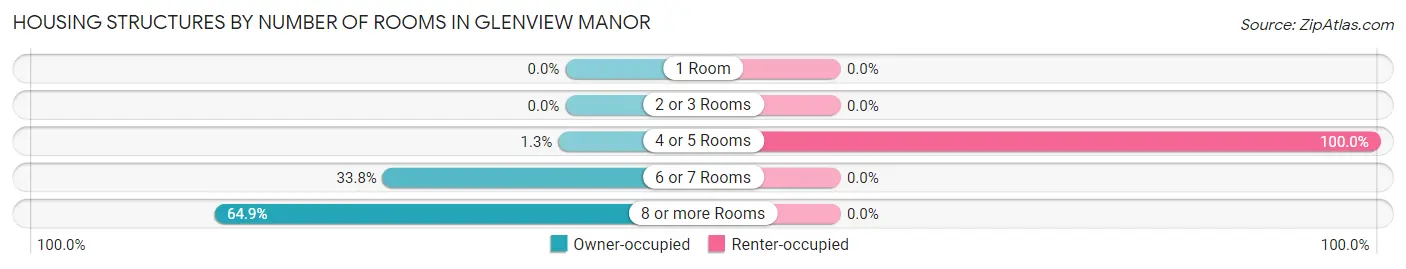
| Number of Rooms | Owner-occupied | Renter-occupied |
| 1 Room | 0 (0.0%) | 0 (0.0%) |
| 2 or 3 Rooms | 0 (0.0%) | 0 (0.0%) |
| 4 or 5 Rooms | 1 (1.3%) | 4 (100.0%) |
| 6 or 7 Rooms | 26 (33.8%) | 0 (0.0%) |
| 8 or more Rooms | 50 (64.9%) | 0 (0.0%) |
| Total | 77 (100.0%) | 4 (100.0%) |
Housing Structure by Heating Type in Glenview Manor
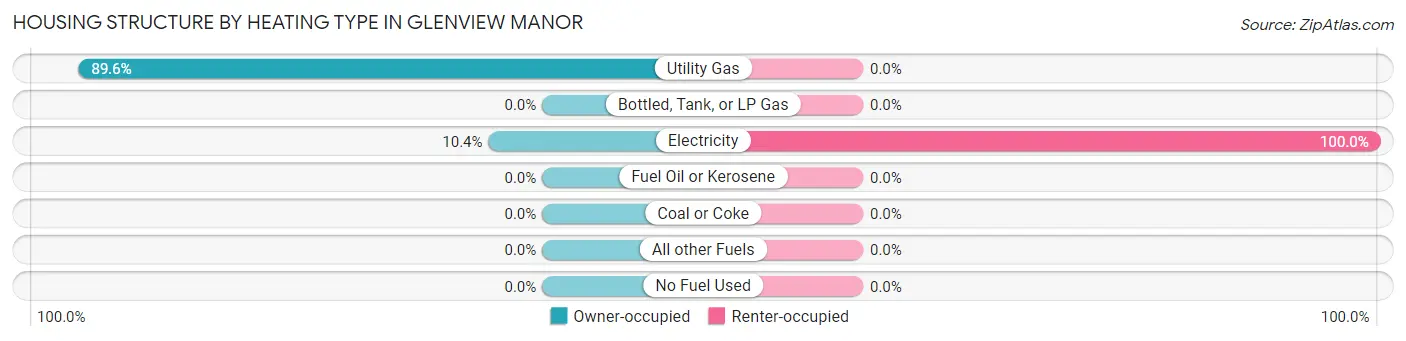
| Heating Type | Owner-occupied | Renter-occupied |
| Utility Gas | 69 (89.6%) | 0 (0.0%) |
| Bottled, Tank, or LP Gas | 0 (0.0%) | 0 (0.0%) |
| Electricity | 8 (10.4%) | 4 (100.0%) |
| Fuel Oil or Kerosene | 0 (0.0%) | 0 (0.0%) |
| Coal or Coke | 0 (0.0%) | 0 (0.0%) |
| All other Fuels | 0 (0.0%) | 0 (0.0%) |
| No Fuel Used | 0 (0.0%) | 0 (0.0%) |
| Total | 77 (100.0%) | 4 (100.0%) |
Household Vehicle Usage in Glenview Manor
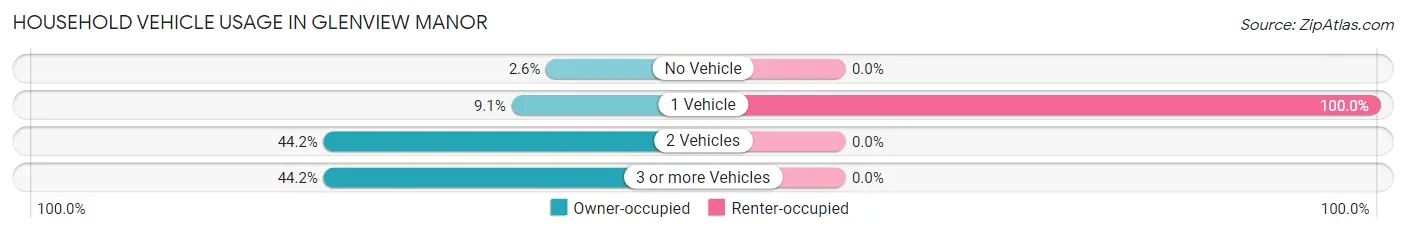
| Vehicles per Household | Owner-occupied | Renter-occupied |
| No Vehicle | 2 (2.6%) | 0 (0.0%) |
| 1 Vehicle | 7 (9.1%) | 4 (100.0%) |
| 2 Vehicles | 34 (44.2%) | 0 (0.0%) |
| 3 or more Vehicles | 34 (44.2%) | 0 (0.0%) |
| Total | 77 (100.0%) | 4 (100.0%) |
Real Estate & Mortgages in Glenview Manor
Real Estate and Mortgage Overview in Glenview Manor
| Characteristic | Without Mortgage | With Mortgage |
| Housing Units | 28 | 49 |
| Median Property Value | $454,500 | $587,500 |
| Median Household Income | $115,000 | $38 |
| Monthly Housing Costs | $825 | $27 |
| Real Estate Taxes | $3,857 | $0 |
Property Value by Mortgage Status in Glenview Manor
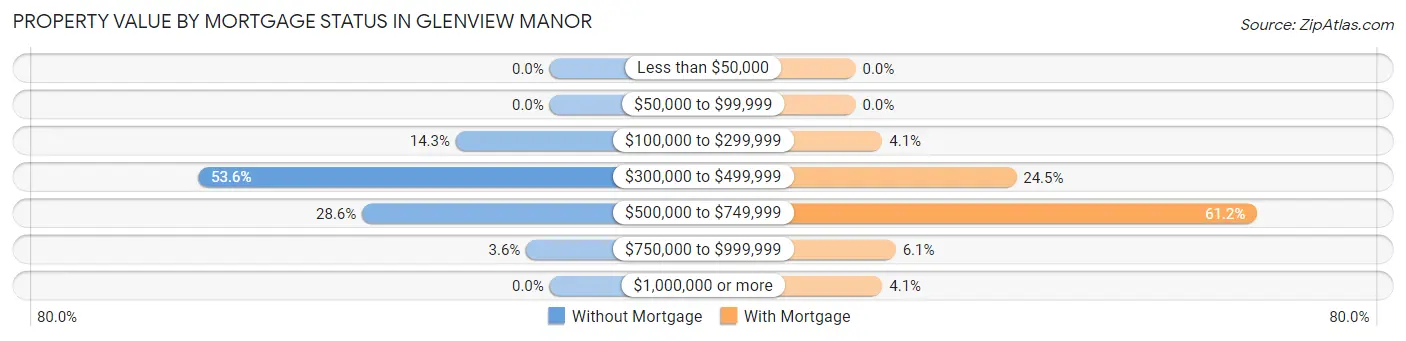
| Property Value | Without Mortgage | With Mortgage |
| Less than $50,000 | 0 (0.0%) | 0 (0.0%) |
| $50,000 to $99,999 | 0 (0.0%) | 0 (0.0%) |
| $100,000 to $299,999 | 4 (14.3%) | 2 (4.1%) |
| $300,000 to $499,999 | 15 (53.6%) | 12 (24.5%) |
| $500,000 to $749,999 | 8 (28.6%) | 30 (61.2%) |
| $750,000 to $999,999 | 1 (3.6%) | 3 (6.1%) |
| $1,000,000 or more | 0 (0.0%) | 2 (4.1%) |
| Total | 28 (100.0%) | 49 (100.0%) |
Household Income by Mortgage Status in Glenview Manor
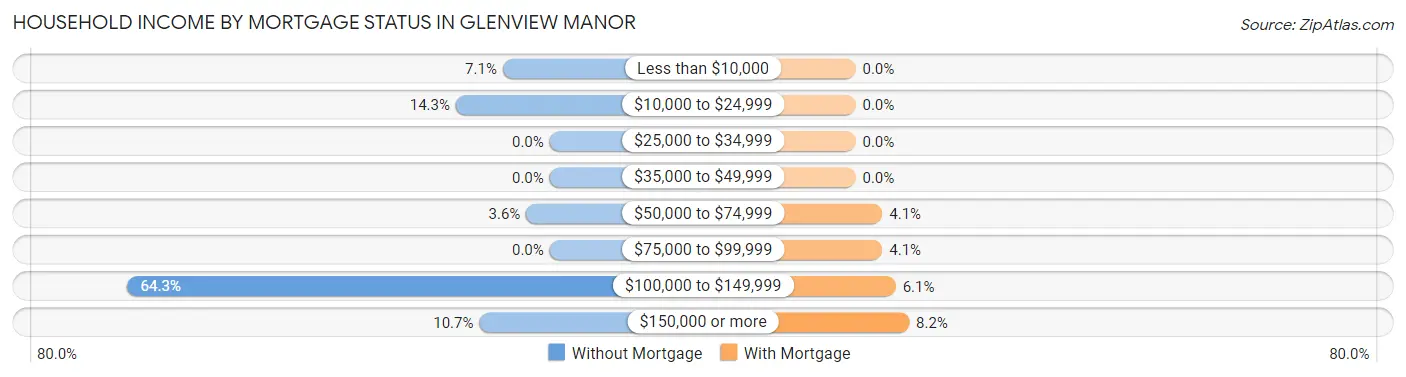
| Household Income | Without Mortgage | With Mortgage |
| Less than $10,000 | 2 (7.1%) | 0 (0.0%) |
| $10,000 to $24,999 | 4 (14.3%) | 0 (0.0%) |
| $25,000 to $34,999 | 0 (0.0%) | 0 (0.0%) |
| $35,000 to $49,999 | 0 (0.0%) | 0 (0.0%) |
| $50,000 to $74,999 | 1 (3.6%) | 2 (4.1%) |
| $75,000 to $99,999 | 0 (0.0%) | 2 (4.1%) |
| $100,000 to $149,999 | 18 (64.3%) | 3 (6.1%) |
| $150,000 or more | 3 (10.7%) | 4 (8.2%) |
| Total | 28 (100.0%) | 49 (100.0%) |
Property Value to Household Income Ratio in Glenview Manor
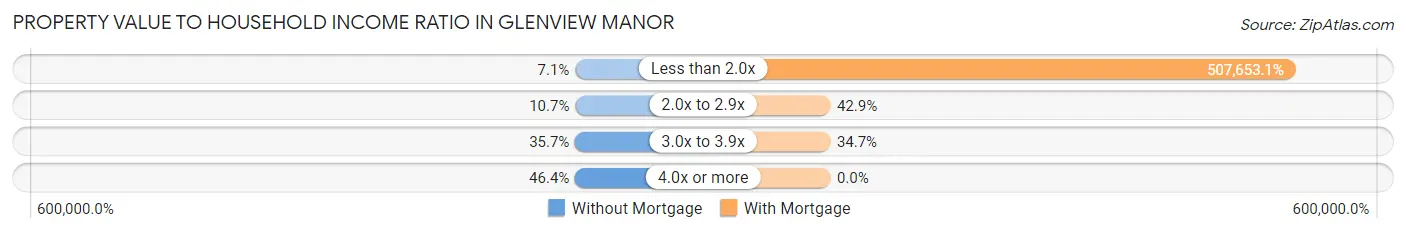
| Value-to-Income Ratio | Without Mortgage | With Mortgage |
| Less than 2.0x | 2 (7.1%) | 248,750 (507,653.1%) |
| 2.0x to 2.9x | 3 (10.7%) | 21 (42.9%) |
| 3.0x to 3.9x | 10 (35.7%) | 17 (34.7%) |
| 4.0x or more | 13 (46.4%) | 0 (0.0%) |
| Total | 28 (100.0%) | 49 (100.0%) |
Real Estate Taxes by Mortgage Status in Glenview Manor
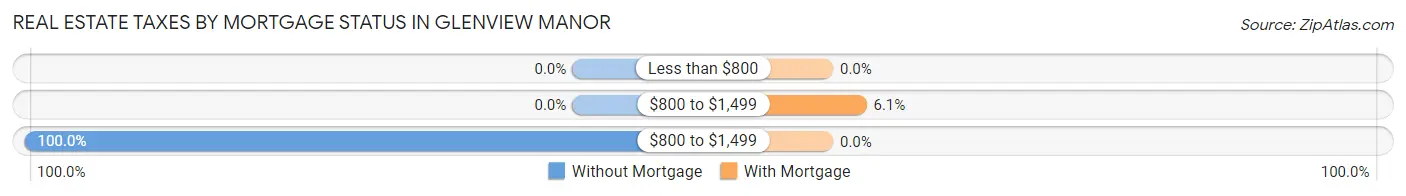
| Property Taxes | Without Mortgage | With Mortgage |
| Less than $800 | 0 (0.0%) | 0 (0.0%) |
| $800 to $1,499 | 0 (0.0%) | 3 (6.1%) |
| $800 to $1,499 | 28 (100.0%) | 0 (0.0%) |
| Total | 28 (100.0%) | 49 (100.0%) |
Health & Disability in Glenview Manor
Health Insurance Coverage by Age in Glenview Manor
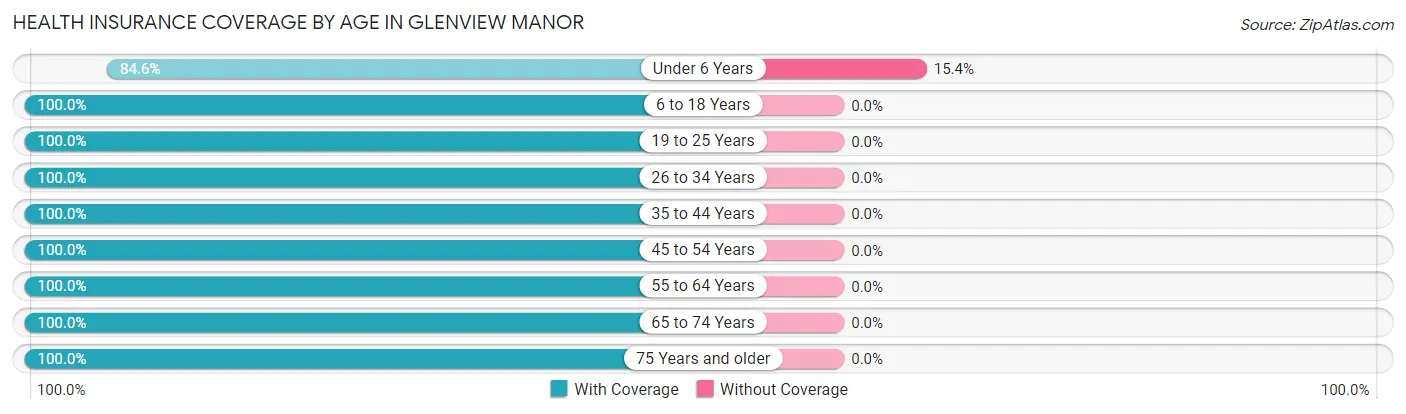
| Age Bracket | With Coverage | Without Coverage |
| Under 6 Years | 11 (84.6%) | 2 (15.4%) |
| 6 to 18 Years | 56 (100.0%) | 0 (0.0%) |
| 19 to 25 Years | 6 (100.0%) | 0 (0.0%) |
| 26 to 34 Years | 12 (100.0%) | 0 (0.0%) |
| 35 to 44 Years | 14 (100.0%) | 0 (0.0%) |
| 45 to 54 Years | 59 (100.0%) | 0 (0.0%) |
| 55 to 64 Years | 12 (100.0%) | 0 (0.0%) |
| 65 to 74 Years | 20 (100.0%) | 0 (0.0%) |
| 75 Years and older | 14 (100.0%) | 0 (0.0%) |
| Total | 204 (99.0%) | 2 (1.0%) |
Health Insurance Coverage by Citizenship Status in Glenview Manor
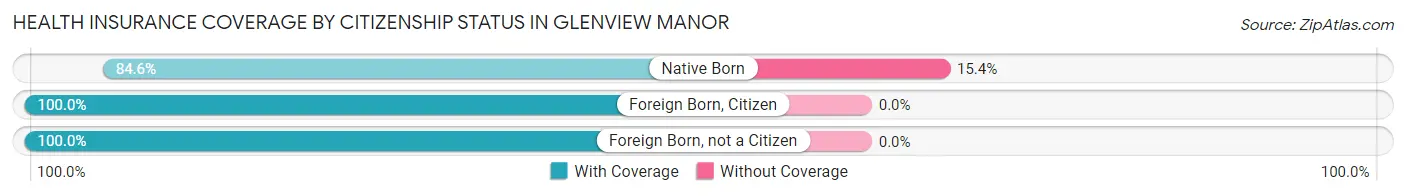
| Citizenship Status | With Coverage | Without Coverage |
| Native Born | 11 (84.6%) | 2 (15.4%) |
| Foreign Born, Citizen | 56 (100.0%) | 0 (0.0%) |
| Foreign Born, not a Citizen | 6 (100.0%) | 0 (0.0%) |
Health Insurance Coverage by Household Income in Glenview Manor
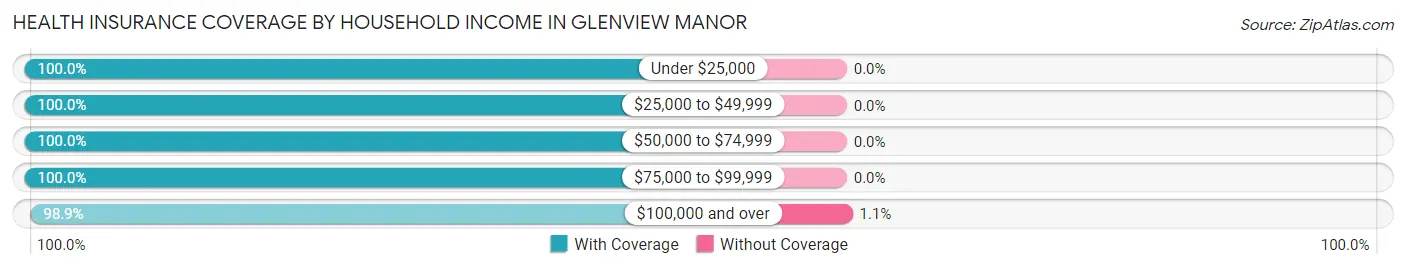
| Household Income | With Coverage | Without Coverage |
| Under $25,000 | 6 (100.0%) | 0 (0.0%) |
| $25,000 to $49,999 | 6 (100.0%) | 0 (0.0%) |
| $50,000 to $74,999 | 5 (100.0%) | 0 (0.0%) |
| $75,000 to $99,999 | 6 (100.0%) | 0 (0.0%) |
| $100,000 and over | 181 (98.9%) | 2 (1.1%) |
Public vs Private Health Insurance Coverage by Age in Glenview Manor

| Age Bracket | Public Insurance | Private Insurance |
| Under 6 | 0 (0.0%) | 11 (84.6%) |
| 6 to 18 Years | 0 (0.0%) | 56 (100.0%) |
| 19 to 25 Years | 0 (0.0%) | 6 (100.0%) |
| 25 to 34 Years | 1 (8.3%) | 11 (91.7%) |
| 35 to 44 Years | 0 (0.0%) | 14 (100.0%) |
| 45 to 54 Years | 2 (3.4%) | 57 (96.6%) |
| 55 to 64 Years | 0 (0.0%) | 12 (100.0%) |
| 65 to 74 Years | 20 (100.0%) | 16 (80.0%) |
| 75 Years and over | 14 (100.0%) | 13 (92.9%) |
| Total | 37 (18.0%) | 196 (95.2%) |
Disability Status by Sex by Age in Glenview Manor
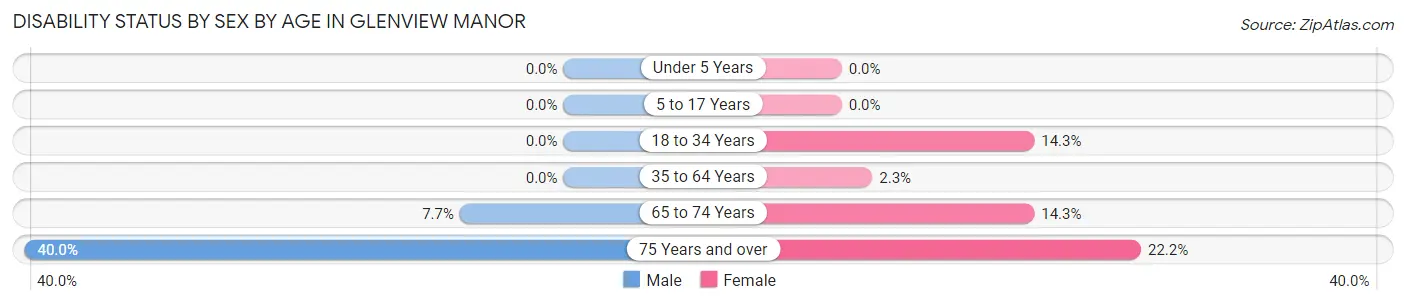
| Age Bracket | Male | Female |
| Under 5 Years | 0 (0.0%) | 0 (0.0%) |
| 5 to 17 Years | 0 (0.0%) | 0 (0.0%) |
| 18 to 34 Years | 0 (0.0%) | 1 (14.3%) |
| 35 to 64 Years | 0 (0.0%) | 1 (2.3%) |
| 65 to 74 Years | 1 (7.7%) | 1 (14.3%) |
| 75 Years and over | 2 (40.0%) | 2 (22.2%) |
Disability Class by Sex by Age in Glenview Manor
Disability Class: Hearing Difficulty
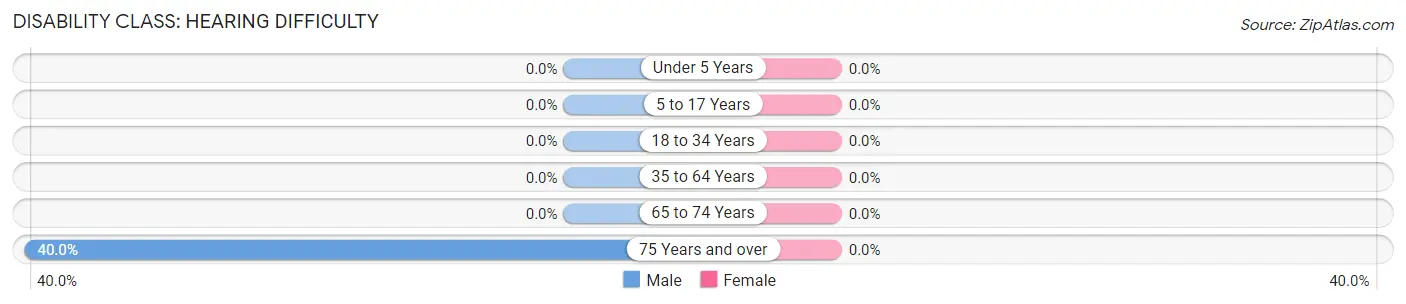
| Age Bracket | Male | Female |
| Under 5 Years | 0 (0.0%) | 0 (0.0%) |
| 5 to 17 Years | 0 (0.0%) | 0 (0.0%) |
| 18 to 34 Years | 0 (0.0%) | 0 (0.0%) |
| 35 to 64 Years | 0 (0.0%) | 0 (0.0%) |
| 65 to 74 Years | 0 (0.0%) | 0 (0.0%) |
| 75 Years and over | 2 (40.0%) | 0 (0.0%) |
Disability Class: Vision Difficulty
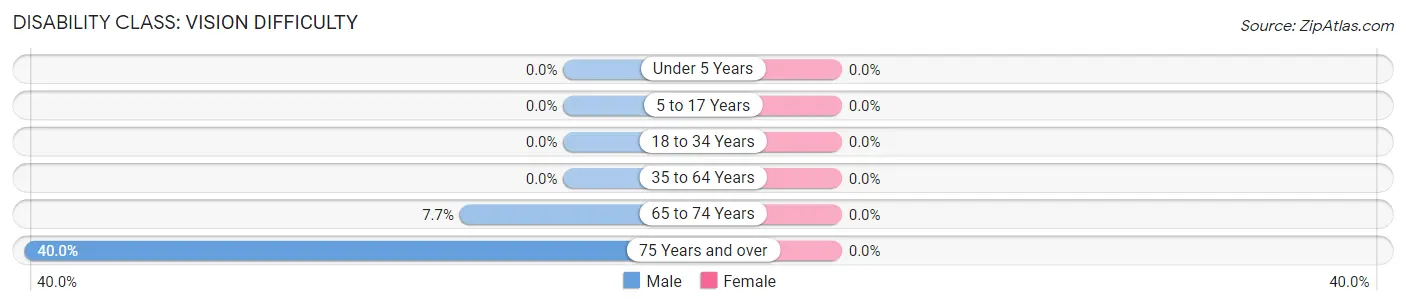
| Age Bracket | Male | Female |
| Under 5 Years | 0 (0.0%) | 0 (0.0%) |
| 5 to 17 Years | 0 (0.0%) | 0 (0.0%) |
| 18 to 34 Years | 0 (0.0%) | 0 (0.0%) |
| 35 to 64 Years | 0 (0.0%) | 0 (0.0%) |
| 65 to 74 Years | 1 (7.7%) | 0 (0.0%) |
| 75 Years and over | 2 (40.0%) | 0 (0.0%) |
Disability Class: Cognitive Difficulty
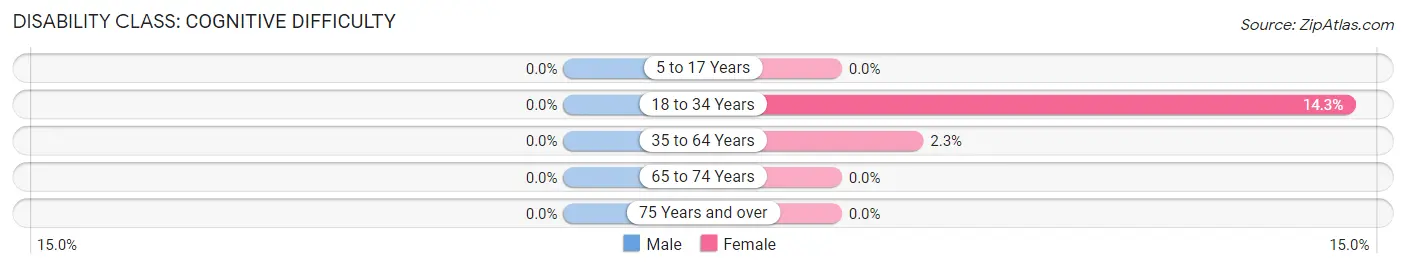
| Age Bracket | Male | Female |
| 5 to 17 Years | 0 (0.0%) | 0 (0.0%) |
| 18 to 34 Years | 0 (0.0%) | 1 (14.3%) |
| 35 to 64 Years | 0 (0.0%) | 1 (2.3%) |
| 65 to 74 Years | 0 (0.0%) | 0 (0.0%) |
| 75 Years and over | 0 (0.0%) | 0 (0.0%) |
Disability Class: Ambulatory Difficulty
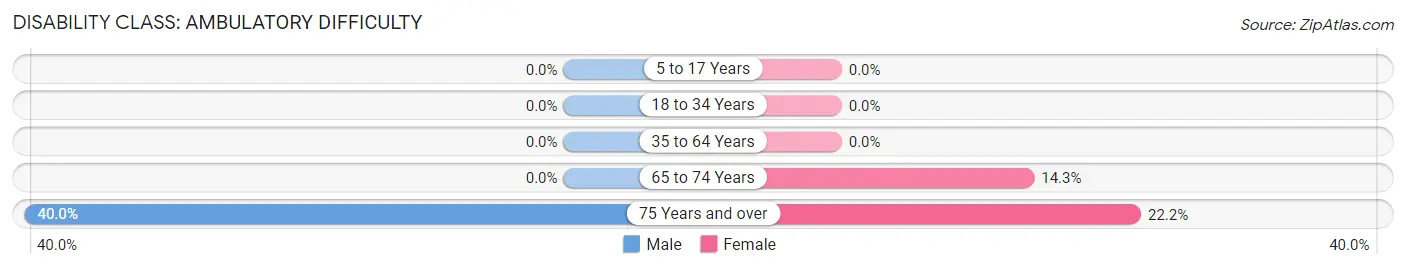
| Age Bracket | Male | Female |
| 5 to 17 Years | 0 (0.0%) | 0 (0.0%) |
| 18 to 34 Years | 0 (0.0%) | 0 (0.0%) |
| 35 to 64 Years | 0 (0.0%) | 0 (0.0%) |
| 65 to 74 Years | 0 (0.0%) | 1 (14.3%) |
| 75 Years and over | 2 (40.0%) | 2 (22.2%) |
Disability Class: Self-Care Difficulty
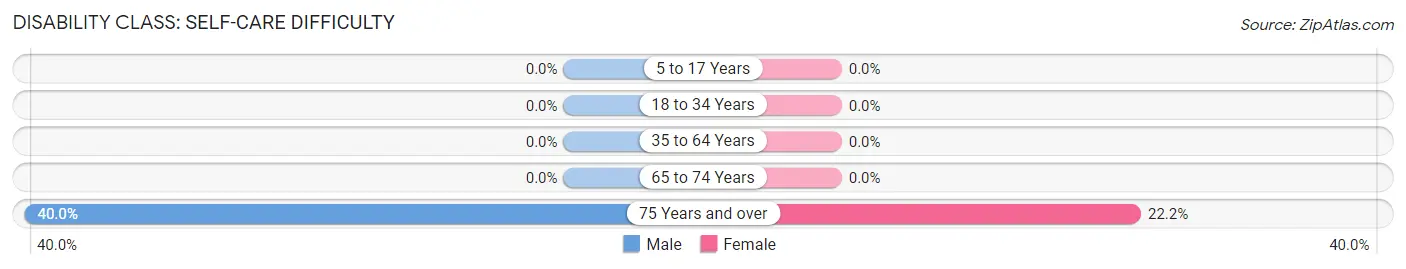
| Age Bracket | Male | Female |
| 5 to 17 Years | 0 (0.0%) | 0 (0.0%) |
| 18 to 34 Years | 0 (0.0%) | 0 (0.0%) |
| 35 to 64 Years | 0 (0.0%) | 0 (0.0%) |
| 65 to 74 Years | 0 (0.0%) | 0 (0.0%) |
| 75 Years and over | 2 (40.0%) | 2 (22.2%) |
Technology Access in Glenview Manor
Computing Device Access in Glenview Manor
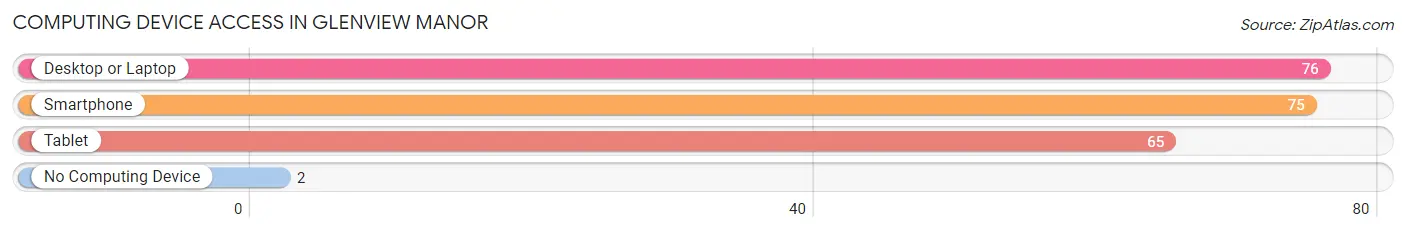
| Device Type | # Households | % Households |
| Desktop or Laptop | 76 | 93.8% |
| Smartphone | 75 | 92.6% |
| Tablet | 65 | 80.2% |
| No Computing Device | 2 | 2.5% |
| Total | 81 | 100.0% |
Internet Access in Glenview Manor
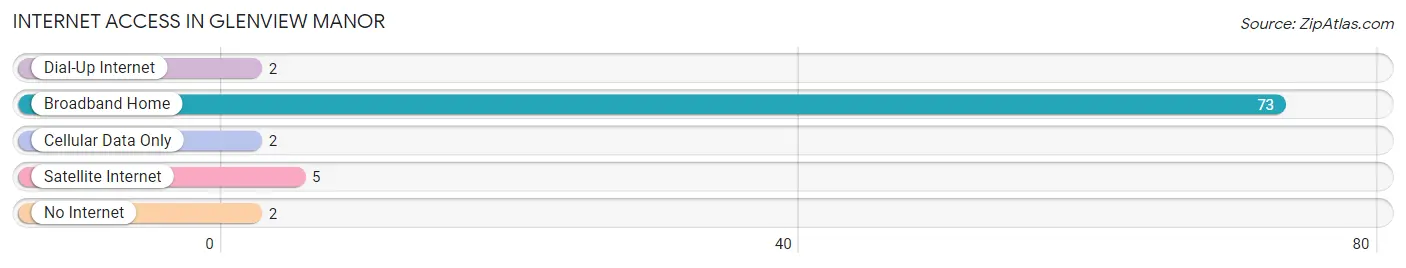
| Internet Type | # Households | % Households |
| Dial-Up Internet | 2 | 2.5% |
| Broadband Home | 73 | 90.1% |
| Cellular Data Only | 2 | 2.5% |
| Satellite Internet | 5 | 6.2% |
| No Internet | 2 | 2.5% |
| Total | 81 | 100.0% |
Glenview Manor Summary
Glenview Manor is a small unincorporated community located in Oldham County, Kentucky. It is situated in the northeastern corner of the county, just south of the Jefferson County line. The community is located along the Ohio River, and is bordered by the cities of Prospect and Crestwood. The population of Glenview Manor was estimated to be 1,845 in 2019.
History
Glenview Manor was founded in the early 1800s by a group of settlers from Pennsylvania. The community was originally known as “Glenview”, and was named after the nearby Glenview Creek. The creek was named after the glen, or valley, that it ran through. The community was later renamed “Glenview Manor” in the late 1800s, when a manor house was built in the area.
The manor house was built by a wealthy family from Louisville, and was used as a summer home. The manor house was eventually sold to a local family, who used it as a private residence until the early 1900s. The manor house was eventually demolished in the 1950s, and the land was sold to developers.
Geography
Glenview Manor is located in the northeastern corner of Oldham County, just south of the Jefferson County line. The community is situated along the Ohio River, and is bordered by the cities of Prospect and Crestwood. The terrain of the area is mostly flat, with some rolling hills. The climate of the area is humid subtropical, with hot summers and mild winters.
Economy
The economy of Glenview Manor is largely based on agriculture and manufacturing. The area is home to several farms, which produce a variety of crops, including corn, soybeans, and wheat. The area is also home to several manufacturing companies, which produce a variety of products, including furniture, automotive parts, and electronics.
Demographics
As of 2019, the population of Glenview Manor was estimated to be 1,845. The racial makeup of the community was 94.3% White, 2.2% African American, 0.7% Asian, 0.3% Native American, and 2.5% from other races. The median household income in the area was $63,945, and the median home value was $220,000. The median age of the population was 40.7 years.
Conclusion
Glenview Manor is a small unincorporated community located in Oldham County, Kentucky. It is situated in the northeastern corner of the county, just south of the Jefferson County line. The community is located along the Ohio River, and is bordered by the cities of Prospect and Crestwood. The population of Glenview Manor was estimated to be 1,845 in 2019. The economy of the area is largely based on agriculture and manufacturing, and the median household income was $63,945 in 2019. The racial makeup of the community was 94.3% White, 2.2% African American, 0.7% Asian, 0.3% Native American, and 2.5% from other races.
Common Questions
What is Per Capita Income in Glenview Manor?
Per Capita income in Glenview Manor is $76,544.
What is the Median Family Income in Glenview Manor?
Median Family Income in Glenview Manor is $219,821.
What is the Median Household income in Glenview Manor?
Median Household Income in Glenview Manor is $163,125.
What is Inequality or Gini Index in Glenview Manor?
Inequality or Gini Index in Glenview Manor is 0.40.
What is the Total Population of Glenview Manor?
Total Population of Glenview Manor is 206.
What is the Total Male Population of Glenview Manor?
Total Male Population of Glenview Manor is 110.
What is the Total Female Population of Glenview Manor?
Total Female Population of Glenview Manor is 96.
What is the Ratio of Males per 100 Females in Glenview Manor?
There are 114.58 Males per 100 Females in Glenview Manor.
What is the Ratio of Females per 100 Males in Glenview Manor?
There are 87.27 Females per 100 Males in Glenview Manor.
What is the Median Population Age in Glenview Manor?
Median Population Age in Glenview Manor is 45.4 Years.
What is the Average Family Size in Glenview Manor
Average Family Size in Glenview Manor is 2.9 People.
What is the Average Household Size in Glenview Manor
Average Household Size in Glenview Manor is 2.5 People.
How Large is the Labor Force in Glenview Manor?
There are 104 People in the Labor Forcein in Glenview Manor.
What is the Percentage of People in the Labor Force in Glenview Manor?
66.2% of People are in the Labor Force in Glenview Manor.
What is the Unemployment Rate in Glenview Manor?
Unemployment Rate in Glenview Manor is 2.9%.