Pecan Plantation, TX Map & Demographics
Pecan Plantation Map
Pecan Plantation Overview
$54,985
PER CAPITA INCOME
$114,567
AVG FAMILY INCOME
$97,100
AVG HOUSEHOLD INCOME
23.9%
WAGE / INCOME GAP [ % ]
76.1¢/ $1
WAGE / INCOME GAP [ $ ]
$14,751
FAMILY INCOME DEFICIT
0.37
INEQUALITY / GINI INDEX
6,664
TOTAL POPULATION
3,034
MALE POPULATION
3,630
FEMALE POPULATION
83.58
MALES / 100 FEMALES
119.64
FEMALES / 100 MALES
61.8
MEDIAN AGE
2.6
AVG FAMILY SIZE
2.4
AVG HOUSEHOLD SIZE
2,512
LABOR FORCE [ PEOPLE ]
42.3%
PERCENT IN LABOR FORCE
18.2%
UNEMPLOYMENT RATE
Income in Pecan Plantation
Income Overview in Pecan Plantation
Per Capita Income in Pecan Plantation is $54,985, while median incomes of families and households are $114,567 and $97,100 respectively.
| Characteristic | Number | Measure |
| Per Capita Income | 6,664 | $54,985 |
| Median Family Income | 2,235 | $114,567 |
| Mean Family Income | 2,235 | $137,997 |
| Median Household Income | 2,819 | $97,100 |
| Mean Household Income | 2,819 | $126,487 |
| Income Deficit | 2,235 | $14,751 |
| Wage / Income Gap (%) | 6,664 | 23.87% |
| Wage / Income Gap ($) | 6,664 | 76.13¢ per $1 |
| Gini / Inequality Index | 6,664 | 0.37 |
Earnings by Sex in Pecan Plantation
Average Earnings in Pecan Plantation are $50,568, $61,500 for men and $46,818 for women, a difference of 23.9%.
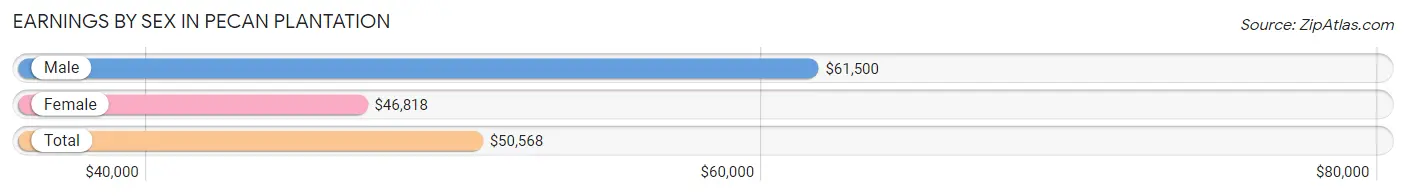
| Sex | Number | Average Earnings |
| Male | 1,558 (55.5%) | $61,500 |
| Female | 1,250 (44.5%) | $46,818 |
| Total | 2,808 (100.0%) | $50,568 |
Earnings by Sex by Income Bracket in Pecan Plantation
The most common earnings brackets in Pecan Plantation are $100,000+ for men (527 | 33.8%) and $45,000 to $49,999 for women (192 | 15.4%).
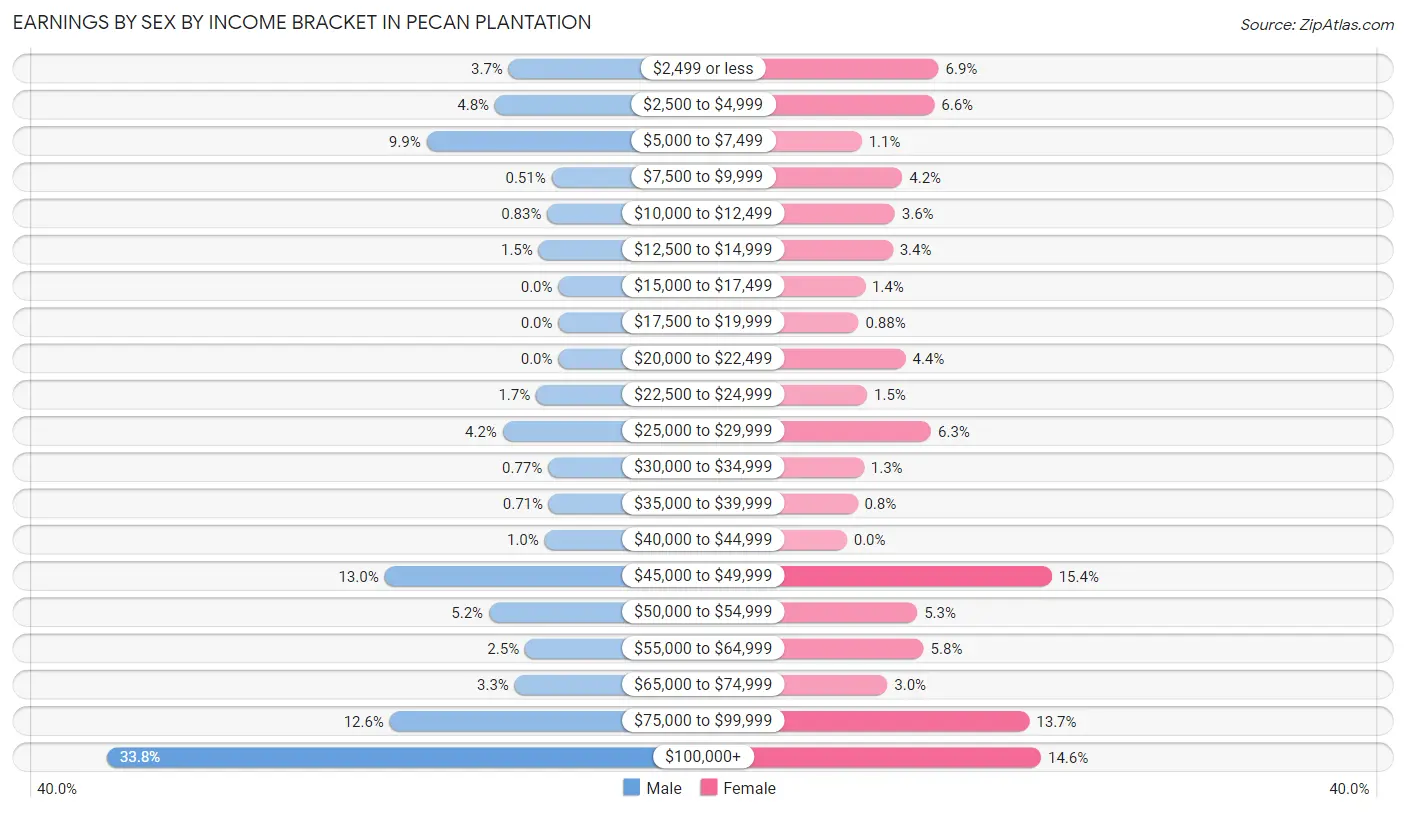
| Income | Male | Female |
| $2,499 or less | 58 (3.7%) | 86 (6.9%) |
| $2,500 to $4,999 | 74 (4.8%) | 82 (6.6%) |
| $5,000 to $7,499 | 154 (9.9%) | 14 (1.1%) |
| $7,500 to $9,999 | 8 (0.5%) | 52 (4.2%) |
| $10,000 to $12,499 | 13 (0.8%) | 45 (3.6%) |
| $12,500 to $14,999 | 23 (1.5%) | 43 (3.4%) |
| $15,000 to $17,499 | 0 (0.0%) | 17 (1.4%) |
| $17,500 to $19,999 | 0 (0.0%) | 11 (0.9%) |
| $20,000 to $22,499 | 0 (0.0%) | 55 (4.4%) |
| $22,500 to $24,999 | 26 (1.7%) | 19 (1.5%) |
| $25,000 to $29,999 | 65 (4.2%) | 79 (6.3%) |
| $30,000 to $34,999 | 12 (0.8%) | 16 (1.3%) |
| $35,000 to $39,999 | 11 (0.7%) | 10 (0.8%) |
| $40,000 to $44,999 | 16 (1.0%) | 0 (0.0%) |
| $45,000 to $49,999 | 203 (13.0%) | 192 (15.4%) |
| $50,000 to $54,999 | 81 (5.2%) | 66 (5.3%) |
| $55,000 to $64,999 | 39 (2.5%) | 72 (5.8%) |
| $65,000 to $74,999 | 51 (3.3%) | 38 (3.0%) |
| $75,000 to $99,999 | 197 (12.6%) | 171 (13.7%) |
| $100,000+ | 527 (33.8%) | 182 (14.6%) |
| Total | 1,558 (100.0%) | 1,250 (100.0%) |
Earnings by Sex by Educational Attainment in Pecan Plantation
Average earnings in Pecan Plantation are $67,344 for men and $47,528 for women, a difference of 29.4%. Men with an educational attainment of graduate degree enjoy the highest average annual earnings of $126,442, while those with college or associate's degree education earn the least with $73,287. Women with an educational attainment of graduate degree earn the most with the average annual earnings of $87,651, while those with high school diploma education have the smallest earnings of $26,875.
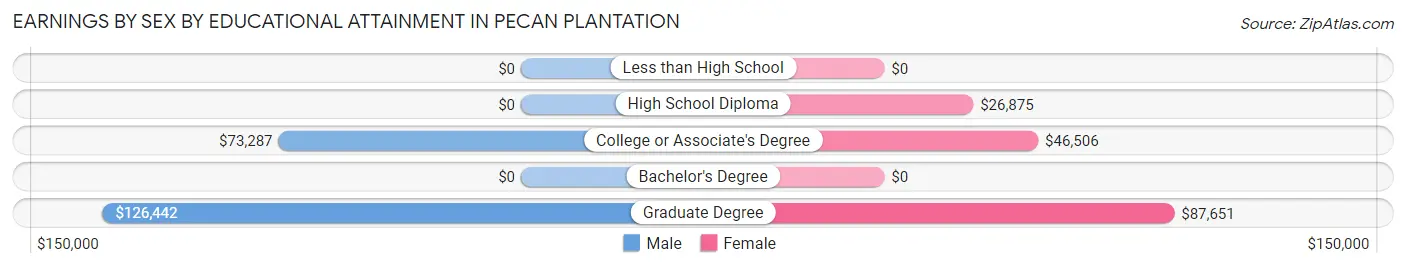
| Educational Attainment | Male Income | Female Income |
| Less than High School | - | - |
| High School Diploma | - | - |
| College or Associate's Degree | $73,287 | $46,506 |
| Bachelor's Degree | - | - |
| Graduate Degree | $126,442 | $87,651 |
| Total | $67,344 | $47,528 |
Family Income in Pecan Plantation
Family Income Brackets in Pecan Plantation
According to the Pecan Plantation family income data, there are 597 families falling into the $75,000 to $99,999 income range, which is the most common income bracket and makes up 26.7% of all families. Conversely, the $10,000 to $14,999 income bracket is the least frequent group with only 11 families (0.5%) belonging to this category.
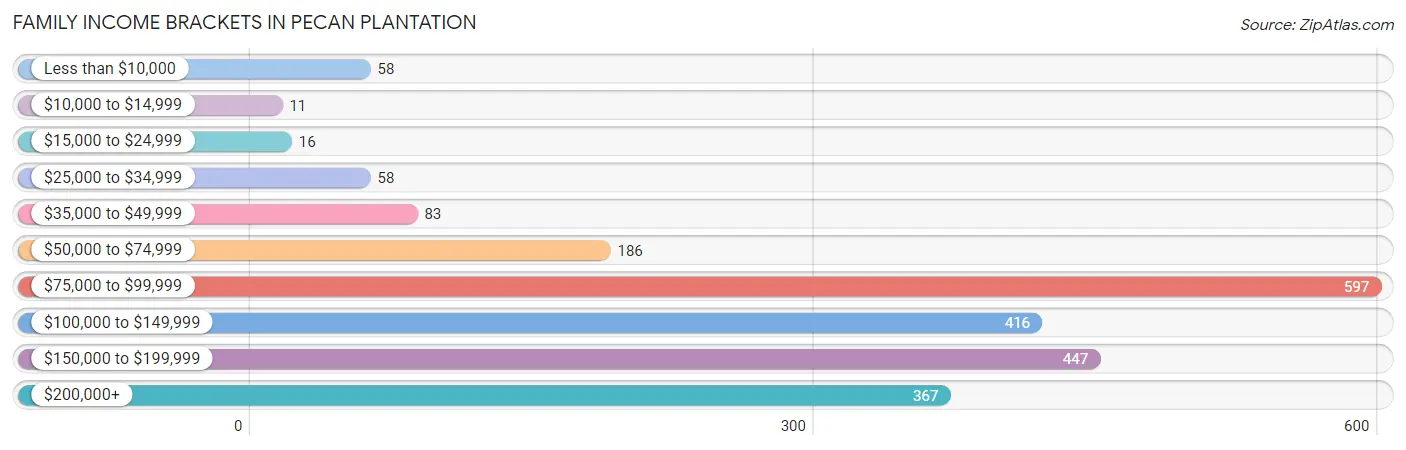
| Income Bracket | # Families | % Families |
| Less than $10,000 | 58 | 2.6% |
| $10,000 to $14,999 | 11 | 0.5% |
| $15,000 to $24,999 | 16 | 0.7% |
| $25,000 to $34,999 | 58 | 2.6% |
| $35,000 to $49,999 | 83 | 3.7% |
| $50,000 to $74,999 | 186 | 8.3% |
| $75,000 to $99,999 | 597 | 26.7% |
| $100,000 to $149,999 | 416 | 18.6% |
| $150,000 to $199,999 | 447 | 20.0% |
| $200,000+ | 367 | 16.4% |
Family Income by Famaliy Size in Pecan Plantation
5-person families (114 | 5.1%) account for the highest median family income in Pecan Plantation with $250,001 per family, while 5-person families (114 | 5.1%) have the highest median income of $50,000 per family member.
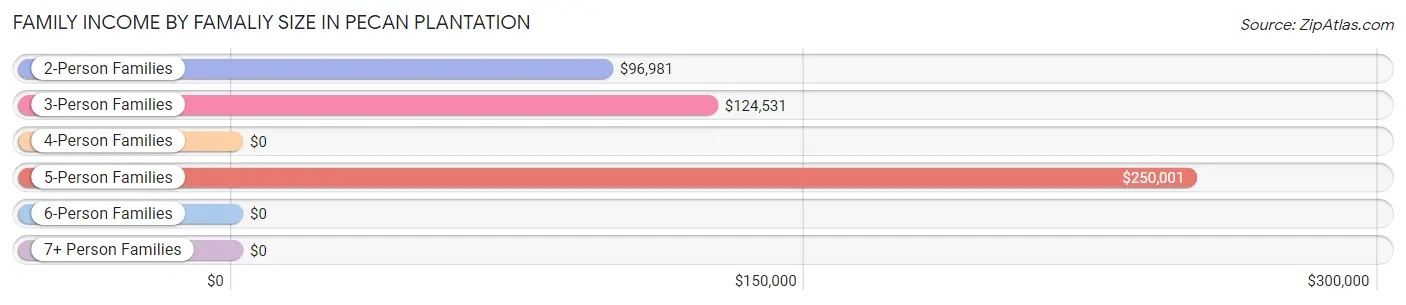
| Income Bracket | # Families | Median Income |
| 2-Person Families | 1,545 (69.1%) | $96,981 |
| 3-Person Families | 440 (19.7%) | $124,531 |
| 4-Person Families | 68 (3.0%) | $0 |
| 5-Person Families | 114 (5.1%) | $250,001 |
| 6-Person Families | 68 (3.0%) | $0 |
| 7+ Person Families | 0 (0.0%) | $0 |
| Total | 2,235 (100.0%) | $114,567 |
Family Income by Number of Earners in Pecan Plantation
The median family income in Pecan Plantation is $114,567, with families comprising 2 earners (361) having the highest median family income of $190,917, while families with no earners (873) have the lowest median family income of $95,104, accounting for 16.2% and 39.1% of families, respectively.
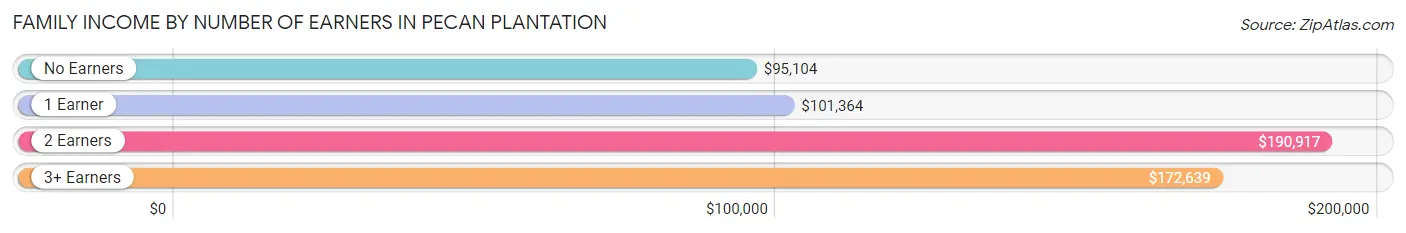
| Number of Earners | # Families | Median Income |
| No Earners | 873 (39.1%) | $95,104 |
| 1 Earner | 702 (31.4%) | $101,364 |
| 2 Earners | 361 (16.2%) | $190,917 |
| 3+ Earners | 299 (13.4%) | $172,639 |
| Total | 2,235 (100.0%) | $114,567 |
Household Income in Pecan Plantation
Household Income Brackets in Pecan Plantation
With 662 households falling in the category, the $75,000 to $99,999 income range is the most frequent in Pecan Plantation, accounting for 23.5% of all households. In contrast, only 14 households (0.5%) fall into the $15,000 to $24,999 income bracket, making it the least populous group.
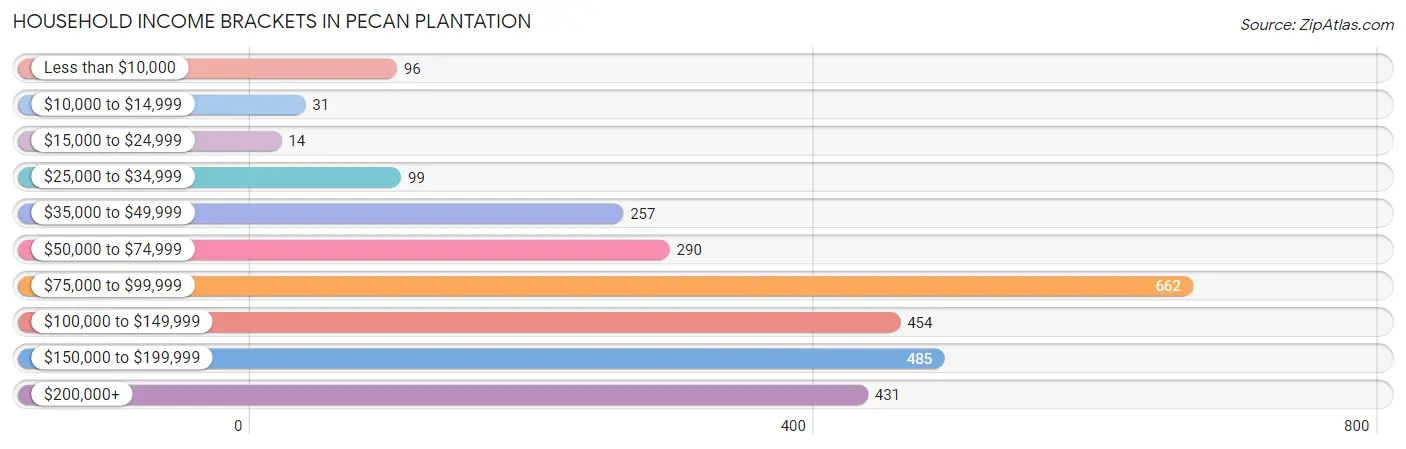
| Income Bracket | # Households | % Households |
| Less than $10,000 | 96 | 3.4% |
| $10,000 to $14,999 | 31 | 1.1% |
| $15,000 to $24,999 | 14 | 0.5% |
| $25,000 to $34,999 | 99 | 3.5% |
| $35,000 to $49,999 | 257 | 9.1% |
| $50,000 to $74,999 | 290 | 10.3% |
| $75,000 to $99,999 | 662 | 23.5% |
| $100,000 to $149,999 | 454 | 16.1% |
| $150,000 to $199,999 | 485 | 17.2% |
| $200,000+ | 431 | 15.3% |
Household Income by Householder Age in Pecan Plantation
The median household income in Pecan Plantation is $97,100, with the highest median household income of $161,016 found in the 25 to 44 years age bracket for the primary householder. A total of 250 households (8.9%) fall into this category.
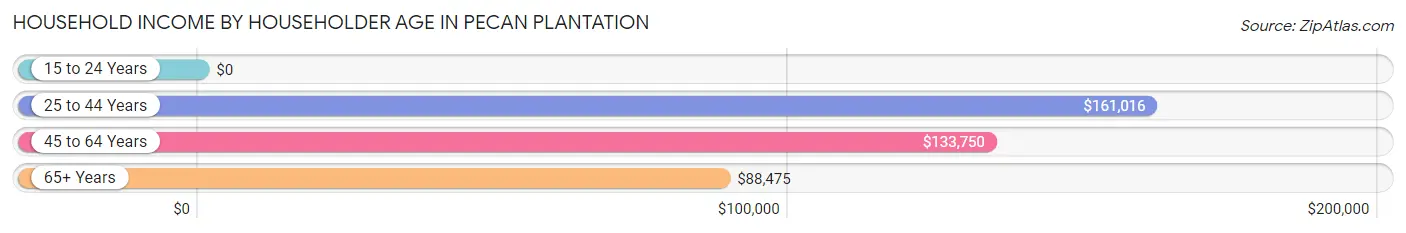
| Income Bracket | # Households | Median Income |
| 15 to 24 Years | 0 (0.0%) | $0 |
| 25 to 44 Years | 250 (8.9%) | $161,016 |
| 45 to 64 Years | 863 (30.6%) | $133,750 |
| 65+ Years | 1,706 (60.5%) | $88,475 |
| Total | 2,819 (100.0%) | $97,100 |
Poverty in Pecan Plantation
Income Below Poverty by Sex and Age in Pecan Plantation
With 3.3% poverty level for males and 2.9% for females among the residents of Pecan Plantation, 75 year old and over males and 45 to 54 year old females are the most vulnerable to poverty, with 57 males (8.0%) and 31 females (8.3%) in their respective age groups living below the poverty level.
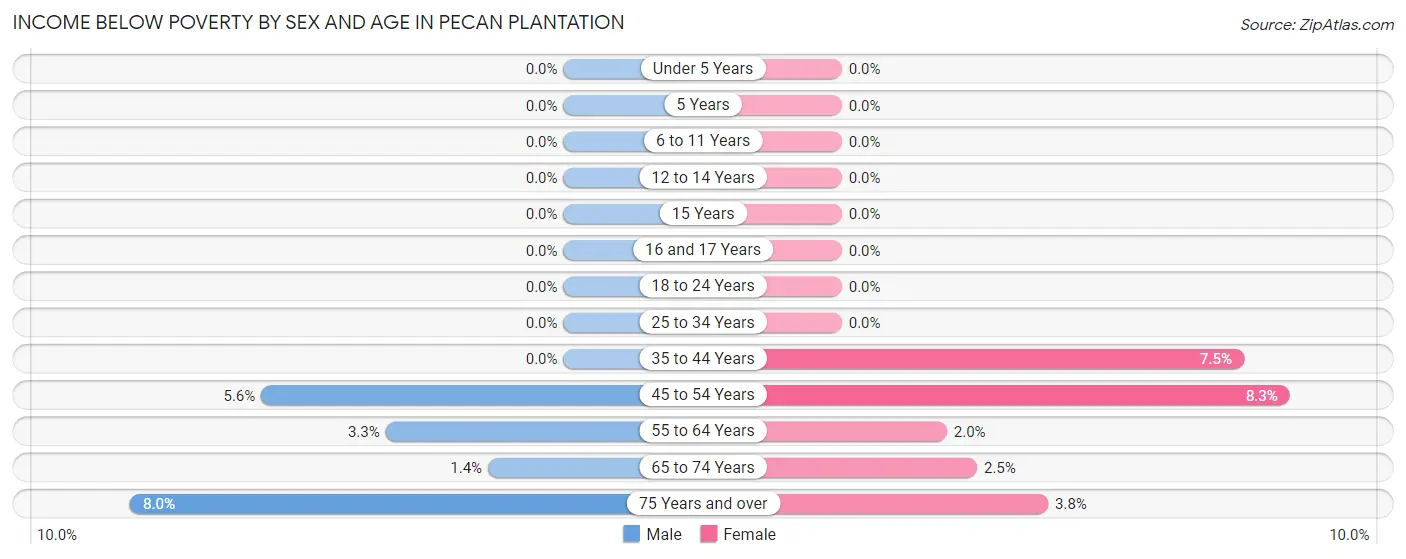
| Age Bracket | Male | Female |
| Under 5 Years | 0 (0.0%) | 0 (0.0%) |
| 5 Years | 0 (0.0%) | 0 (0.0%) |
| 6 to 11 Years | 0 (0.0%) | 0 (0.0%) |
| 12 to 14 Years | 0 (0.0%) | 0 (0.0%) |
| 15 Years | 0 (0.0%) | 0 (0.0%) |
| 16 and 17 Years | 0 (0.0%) | 0 (0.0%) |
| 18 to 24 Years | 0 (0.0%) | 0 (0.0%) |
| 25 to 34 Years | 0 (0.0%) | 0 (0.0%) |
| 35 to 44 Years | 0 (0.0%) | 15 (7.5%) |
| 45 to 54 Years | 11 (5.6%) | 31 (8.3%) |
| 55 to 64 Years | 22 (3.3%) | 13 (1.9%) |
| 65 to 74 Years | 11 (1.4%) | 21 (2.5%) |
| 75 Years and over | 57 (8.0%) | 24 (3.8%) |
| Total | 101 (3.3%) | 104 (2.9%) |
Income Above Poverty by Sex and Age in Pecan Plantation
According to the poverty statistics in Pecan Plantation, males aged under 5 years and females aged under 5 years are the age groups that are most secure financially, with 100.0% of males and 100.0% of females in these age groups living above the poverty line.
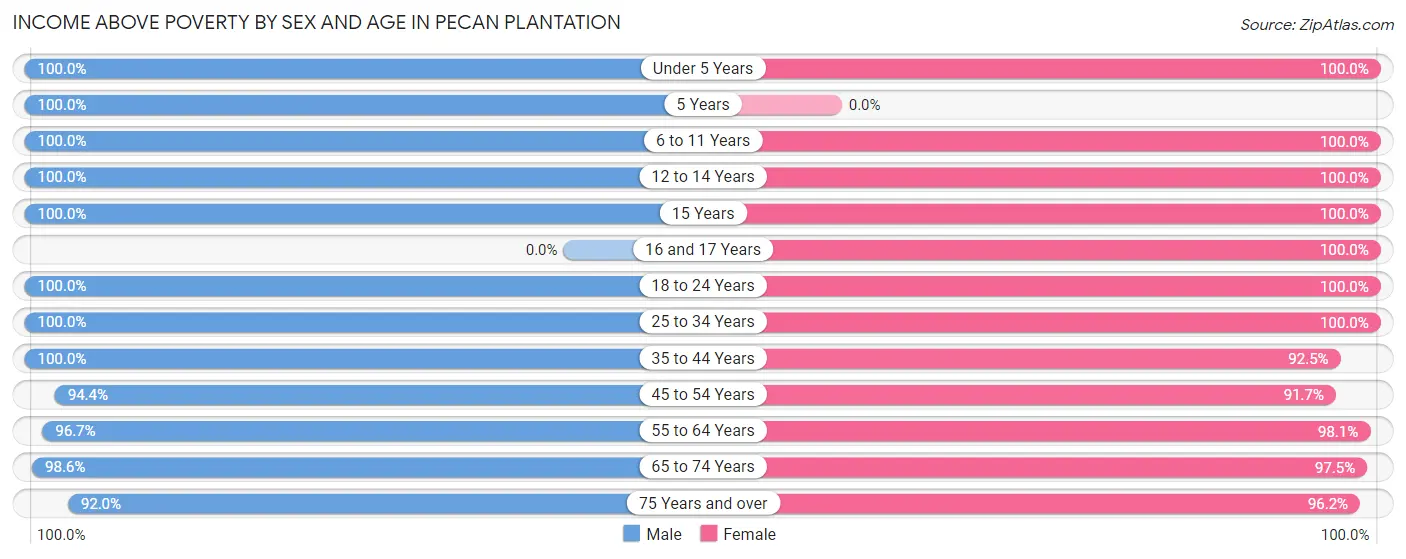
| Age Bracket | Male | Female |
| Under 5 Years | 48 (100.0%) | 275 (100.0%) |
| 5 Years | 25 (100.0%) | 0 (0.0%) |
| 6 to 11 Years | 60 (100.0%) | 146 (100.0%) |
| 12 to 14 Years | 8 (100.0%) | 103 (100.0%) |
| 15 Years | 30 (100.0%) | 31 (100.0%) |
| 16 and 17 Years | 0 (0.0%) | 35 (100.0%) |
| 18 to 24 Years | 62 (100.0%) | 126 (100.0%) |
| 25 to 34 Years | 120 (100.0%) | 211 (100.0%) |
| 35 to 44 Years | 324 (100.0%) | 186 (92.5%) |
| 45 to 54 Years | 185 (94.4%) | 342 (91.7%) |
| 55 to 64 Years | 645 (96.7%) | 653 (98.1%) |
| 65 to 74 Years | 774 (98.6%) | 815 (97.5%) |
| 75 Years and over | 652 (92.0%) | 603 (96.2%) |
| Total | 2,933 (96.7%) | 3,526 (97.1%) |
Income Below Poverty Among Married-Couple Families in Pecan Plantation
The poverty statistics for married-couple families in Pecan Plantation show that 3.3% or 70 of the total 2,134 families live below the poverty line. Families with no children have the highest poverty rate of 3.9%, comprising of 70 families. On the other hand, families with 1 or 2 children have the lowest poverty rate of 0.0%, which includes 0 families.
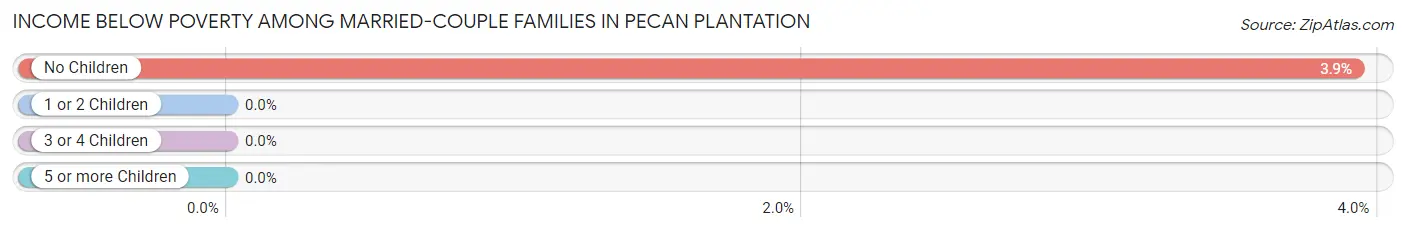
| Children | Above Poverty | Below Poverty |
| No Children | 1,714 (96.1%) | 70 (3.9%) |
| 1 or 2 Children | 298 (100.0%) | 0 (0.0%) |
| 3 or 4 Children | 52 (100.0%) | 0 (0.0%) |
| 5 or more Children | 0 (0.0%) | 0 (0.0%) |
| Total | 2,064 (96.7%) | 70 (3.3%) |
Income Below Poverty Among Single-Parent Households in Pecan Plantation
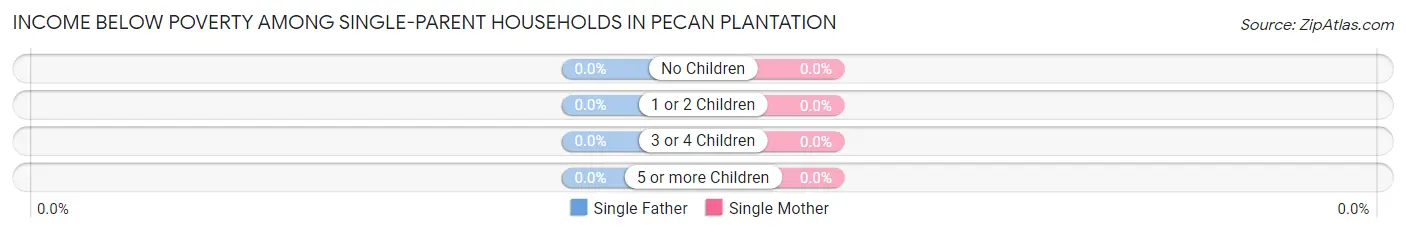
| Children | Single Father | Single Mother |
| No Children | 0 (0.0%) | 0 (0.0%) |
| 1 or 2 Children | 0 (0.0%) | 0 (0.0%) |
| 3 or 4 Children | 0 (0.0%) | 0 (0.0%) |
| 5 or more Children | 0 (0.0%) | 0 (0.0%) |
| Total | 0 (0.0%) | 0 (0.0%) |
Income Below Poverty Among Married-Couple vs Single-Parent Households in Pecan Plantation
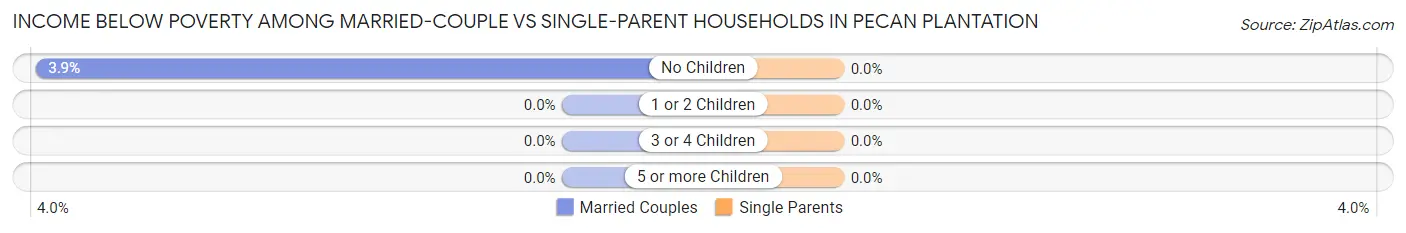
| Children | Married-Couple Families | Single-Parent Households |
| No Children | 70 (3.9%) | 0 (0.0%) |
| 1 or 2 Children | 0 (0.0%) | 0 (0.0%) |
| 3 or 4 Children | 0 (0.0%) | 0 (0.0%) |
| 5 or more Children | 0 (0.0%) | 0 (0.0%) |
| Total | 70 (3.3%) | 0 (0.0%) |
Race in Pecan Plantation
The most populous races in Pecan Plantation are White / Caucasian (6,215 | 93.3%), Two or more Races (307 | 4.6%), and Hispanic or Latino (208 | 3.1%).
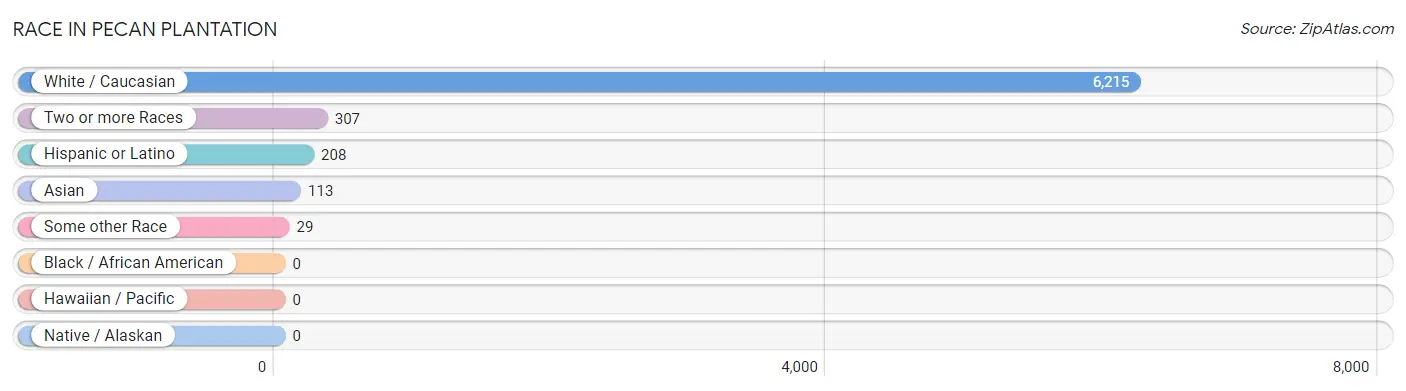
| Race | # Population | % Population |
| Asian | 113 | 1.7% |
| Black / African American | 0 | 0.0% |
| Hawaiian / Pacific | 0 | 0.0% |
| Hispanic or Latino | 208 | 3.1% |
| Native / Alaskan | 0 | 0.0% |
| White / Caucasian | 6,215 | 93.3% |
| Two or more Races | 307 | 4.6% |
| Some other Race | 29 | 0.4% |
| Total | 6,664 | 100.0% |
Ancestry in Pecan Plantation
The most populous ancestries reported in Pecan Plantation are English (1,434 | 21.5%), American (814 | 12.2%), German (800 | 12.0%), Irish (742 | 11.1%), and Dutch (303 | 4.5%), together accounting for 61.4% of all Pecan Plantation residents.
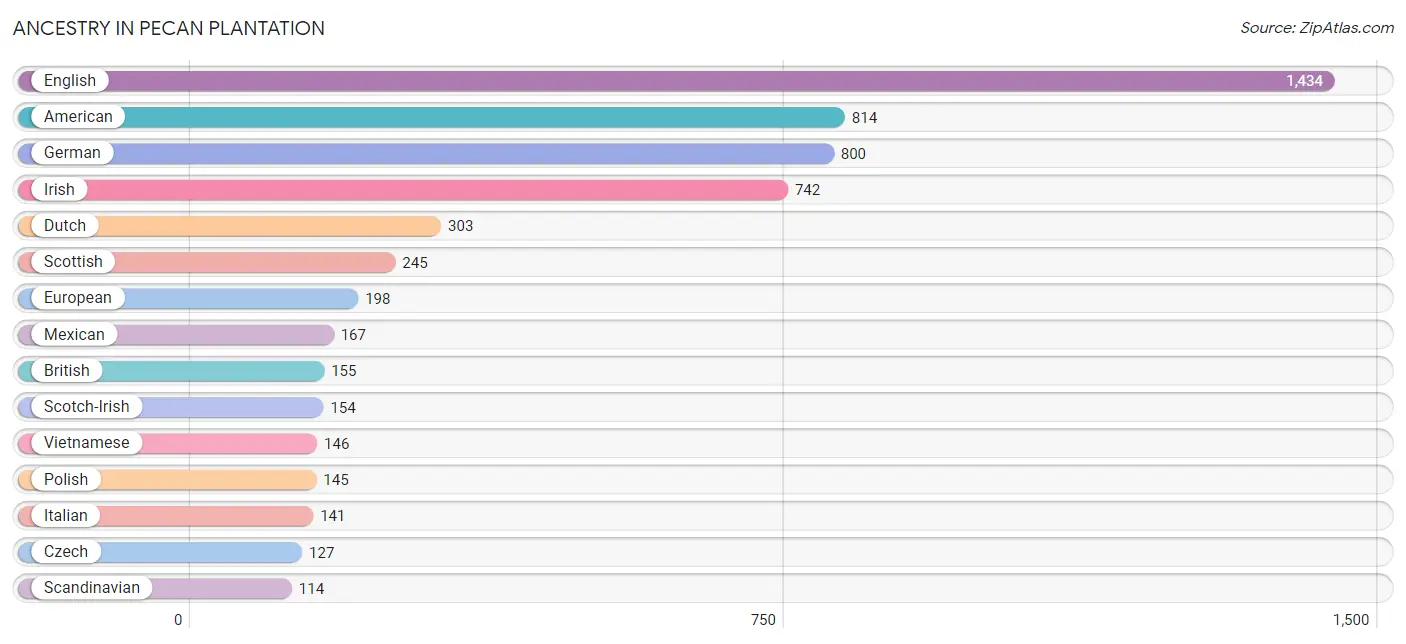
| Ancestry | # Population | % Population |
| American | 814 | 12.2% |
| Bhutanese | 38 | 0.6% |
| British | 155 | 2.3% |
| Canadian | 46 | 0.7% |
| Central American | 29 | 0.4% |
| Cherokee | 74 | 1.1% |
| Choctaw | 9 | 0.1% |
| Czech | 127 | 1.9% |
| Danish | 35 | 0.5% |
| Dutch | 303 | 4.5% |
| English | 1,434 | 21.5% |
| European | 198 | 3.0% |
| Filipino | 17 | 0.3% |
| French | 58 | 0.9% |
| French Canadian | 30 | 0.4% |
| German | 800 | 12.0% |
| Indian (Asian) | 6 | 0.1% |
| Irish | 742 | 11.1% |
| Italian | 141 | 2.1% |
| Korean | 17 | 0.3% |
| Mexican | 167 | 2.5% |
| Mexican American Indian | 12 | 0.2% |
| Northern European | 22 | 0.3% |
| Norwegian | 85 | 1.3% |
| Panamanian | 29 | 0.4% |
| Polish | 145 | 2.2% |
| Russian | 107 | 1.6% |
| Scandinavian | 114 | 1.7% |
| Scotch-Irish | 154 | 2.3% |
| Scottish | 245 | 3.7% |
| Thai | 58 | 0.9% |
| Vietnamese | 146 | 2.2% |
| Welsh | 37 | 0.6% | View All 33 Rows |
Immigrants in Pecan Plantation
The most numerous immigrant groups reported in Pecan Plantation came from Europe (142 | 2.1%), Asia (116 | 1.7%), Eastern Europe (83 | 1.3%), Russia (83 | 1.3%), and Bangladesh (62 | 0.9%), together accounting for 7.3% of all Pecan Plantation residents.
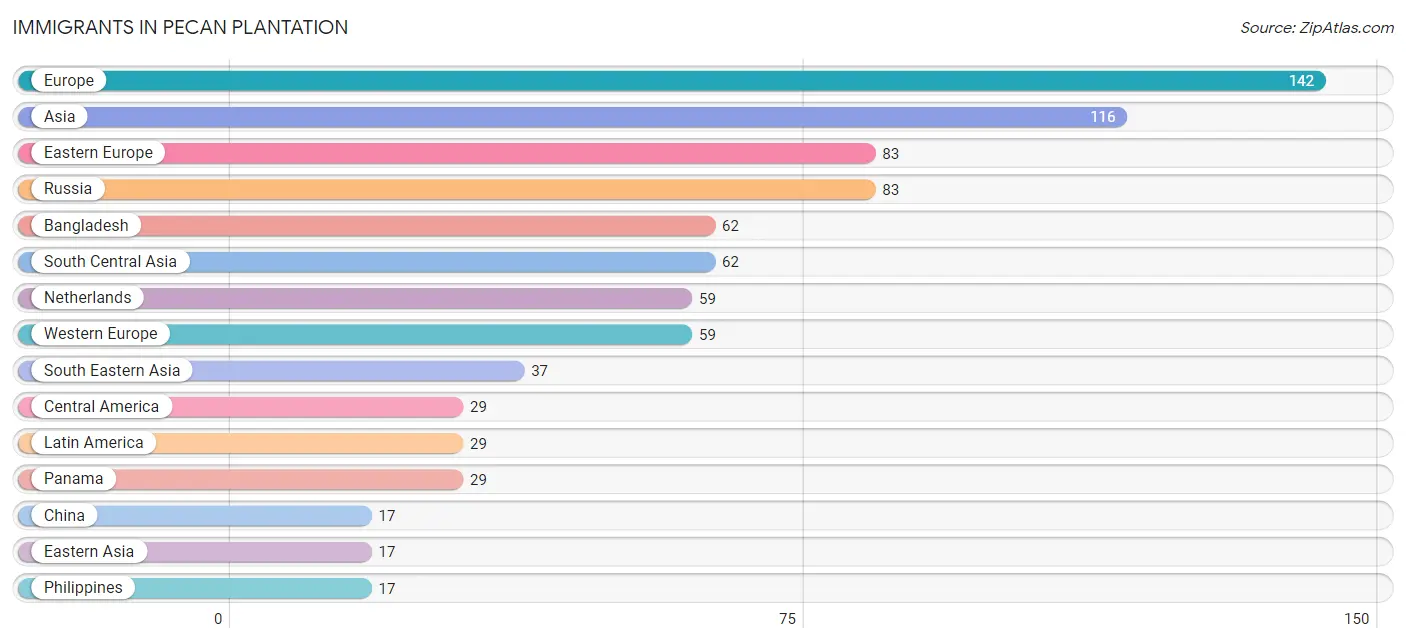
| Immigration Origin | # Population | % Population |
| Asia | 116 | 1.7% |
| Australia | 12 | 0.2% |
| Bangladesh | 62 | 0.9% |
| Central America | 29 | 0.4% |
| China | 17 | 0.3% |
| Eastern Asia | 17 | 0.3% |
| Eastern Europe | 83 | 1.3% |
| Europe | 142 | 2.1% |
| Latin America | 29 | 0.4% |
| Malaysia | 14 | 0.2% |
| Netherlands | 59 | 0.9% |
| Oceania | 12 | 0.2% |
| Panama | 29 | 0.4% |
| Philippines | 17 | 0.3% |
| Russia | 83 | 1.3% |
| Singapore | 6 | 0.1% |
| South Central Asia | 62 | 0.9% |
| South Eastern Asia | 37 | 0.6% |
| Taiwan | 17 | 0.3% |
| Western Europe | 59 | 0.9% | View All 20 Rows |
Sex and Age in Pecan Plantation
Sex and Age in Pecan Plantation
The most populous age groups in Pecan Plantation are 55 to 59 Years (443 | 14.6%) for men and 65 to 69 Years (433 | 11.9%) for women.
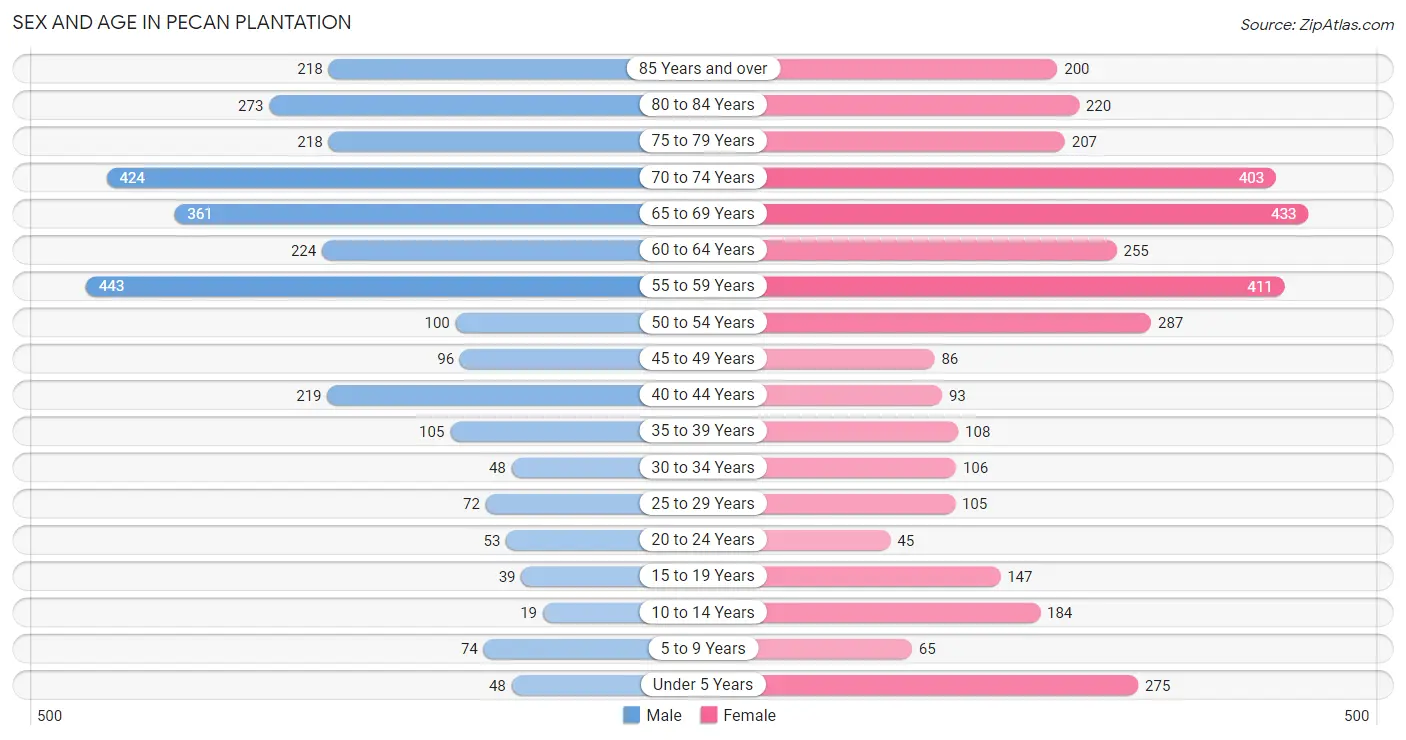
| Age Bracket | Male | Female |
| Under 5 Years | 48 (1.6%) | 275 (7.6%) |
| 5 to 9 Years | 74 (2.4%) | 65 (1.8%) |
| 10 to 14 Years | 19 (0.6%) | 184 (5.1%) |
| 15 to 19 Years | 39 (1.3%) | 147 (4.1%) |
| 20 to 24 Years | 53 (1.8%) | 45 (1.2%) |
| 25 to 29 Years | 72 (2.4%) | 105 (2.9%) |
| 30 to 34 Years | 48 (1.6%) | 106 (2.9%) |
| 35 to 39 Years | 105 (3.5%) | 108 (3.0%) |
| 40 to 44 Years | 219 (7.2%) | 93 (2.6%) |
| 45 to 49 Years | 96 (3.2%) | 86 (2.4%) |
| 50 to 54 Years | 100 (3.3%) | 287 (7.9%) |
| 55 to 59 Years | 443 (14.6%) | 411 (11.3%) |
| 60 to 64 Years | 224 (7.4%) | 255 (7.0%) |
| 65 to 69 Years | 361 (11.9%) | 433 (11.9%) |
| 70 to 74 Years | 424 (14.0%) | 403 (11.1%) |
| 75 to 79 Years | 218 (7.2%) | 207 (5.7%) |
| 80 to 84 Years | 273 (9.0%) | 220 (6.1%) |
| 85 Years and over | 218 (7.2%) | 200 (5.5%) |
| Total | 3,034 (100.0%) | 3,630 (100.0%) |
Families and Households in Pecan Plantation
Median Family Size in Pecan Plantation
The median family size in Pecan Plantation is 2.64 persons per family, with married-couple families (2,134 | 95.5%) accounting for the largest median family size of 2.65 persons per family. On the other hand, single male/father families (49 | 2.2%) represent the smallest median family size with 2.29 persons per family.
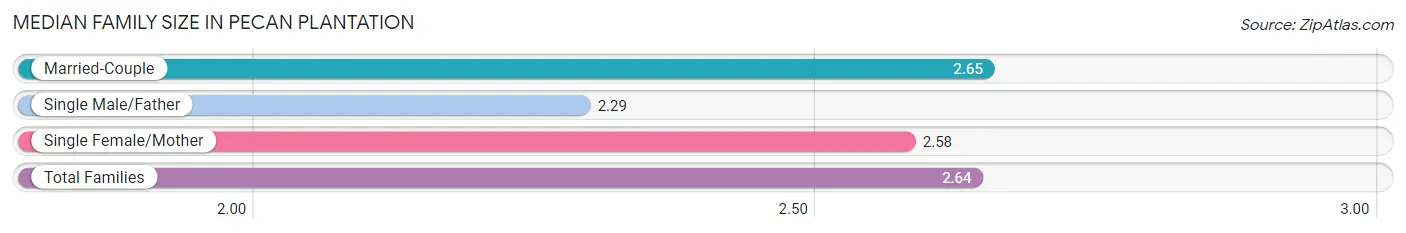
| Family Type | # Families | Family Size |
| Married-Couple | 2,134 (95.5%) | 2.65 |
| Single Male/Father | 49 (2.2%) | 2.29 |
| Single Female/Mother | 52 (2.3%) | 2.58 |
| Total Families | 2,235 (100.0%) | 2.64 |
Median Household Size in Pecan Plantation
The median household size in Pecan Plantation is 2.36 persons per household, with married-couple households (2,134 | 75.7%) accounting for the largest median household size of 2.66 persons per household. non-family households (584 | 20.7%) represent the smallest median household size with 1.28 persons per household.
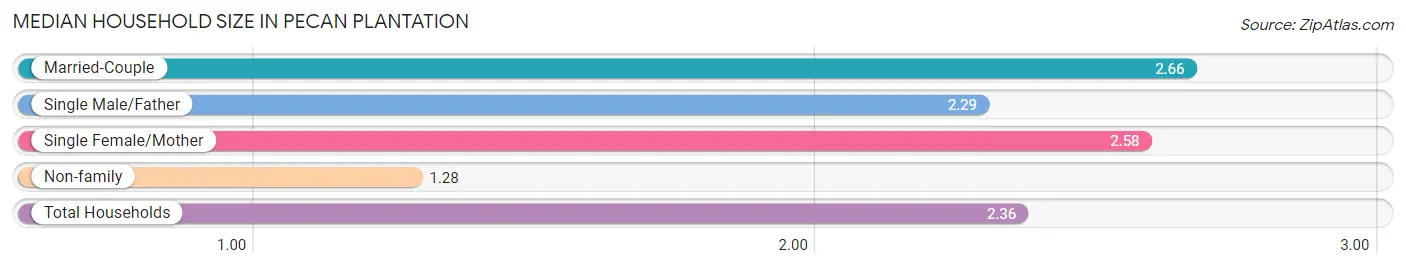
| Household Type | # Households | Household Size |
| Married-Couple | 2,134 (75.7%) | 2.66 |
| Single Male/Father | 49 (1.7%) | 2.29 |
| Single Female/Mother | 52 (1.8%) | 2.58 |
| Non-family | 584 (20.7%) | 1.28 |
| Total Households | 2,819 (100.0%) | 2.36 |
Household Size by Marriage Status in Pecan Plantation
Out of a total of 2,819 households in Pecan Plantation, 2,235 (79.3%) are family households, while 584 (20.7%) are nonfamily households. The most numerous type of family households are 2-person households, comprising 1,534, and the most common type of nonfamily households are 1-person households, comprising 427.
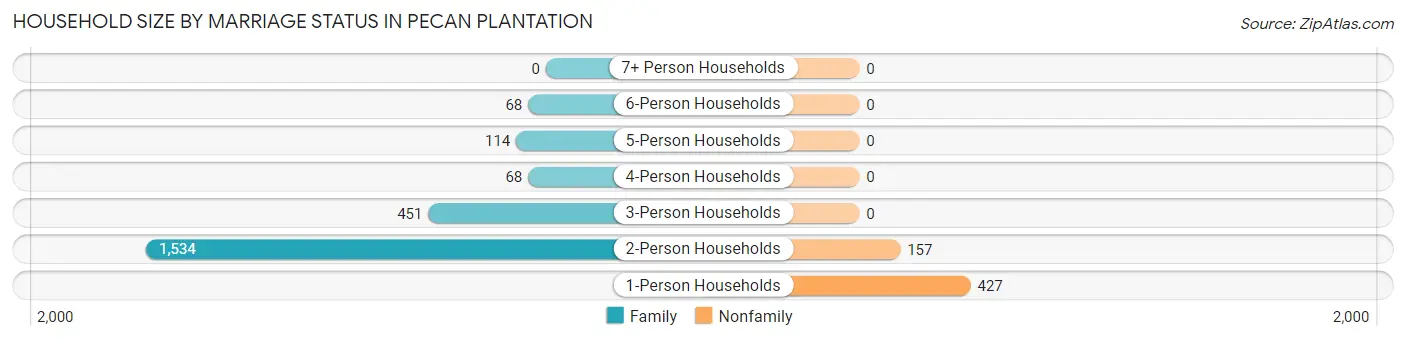
| Household Size | Family Households | Nonfamily Households |
| 1-Person Households | - | 427 (15.1%) |
| 2-Person Households | 1,534 (54.4%) | 157 (5.6%) |
| 3-Person Households | 451 (16.0%) | 0 (0.0%) |
| 4-Person Households | 68 (2.4%) | 0 (0.0%) |
| 5-Person Households | 114 (4.0%) | 0 (0.0%) |
| 6-Person Households | 68 (2.4%) | 0 (0.0%) |
| 7+ Person Households | 0 (0.0%) | 0 (0.0%) |
| Total | 2,235 (79.3%) | 584 (20.7%) |
Female Fertility in Pecan Plantation
Fertility by Age in Pecan Plantation
Average fertility rate in Pecan Plantation is 67.0 births per 1,000 women. Women in the age bracket of 35 to 50 years have the highest fertility rate with 108.0 births per 1,000 women. Women in the age bracket of 35 to 50 years acount for 71.4% of all women with births.
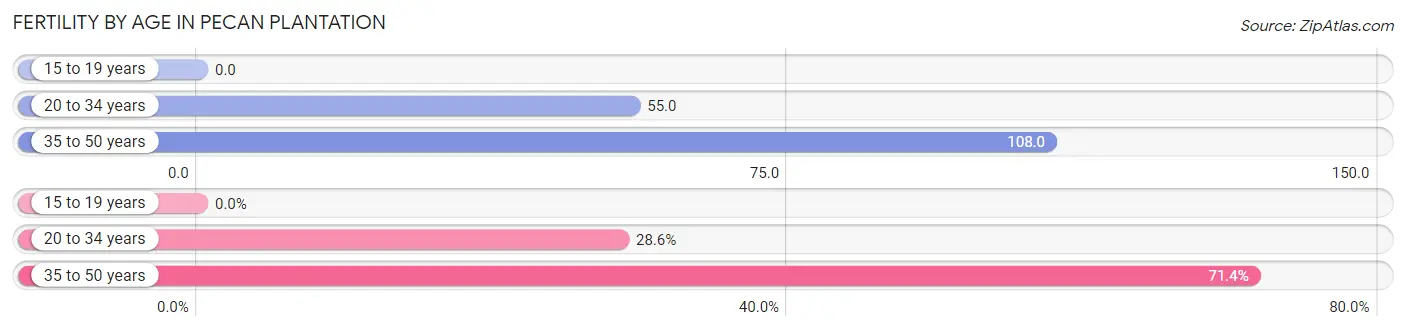
| Age Bracket | Women with Births | Births / 1,000 Women |
| 15 to 19 years | 0 (0.0%) | 0.0 |
| 20 to 34 years | 14 (28.6%) | 55.0 |
| 35 to 50 years | 35 (71.4%) | 108.0 |
| Total | 49 (100.0%) | 67.0 |
Fertility by Age by Marriage Status in Pecan Plantation
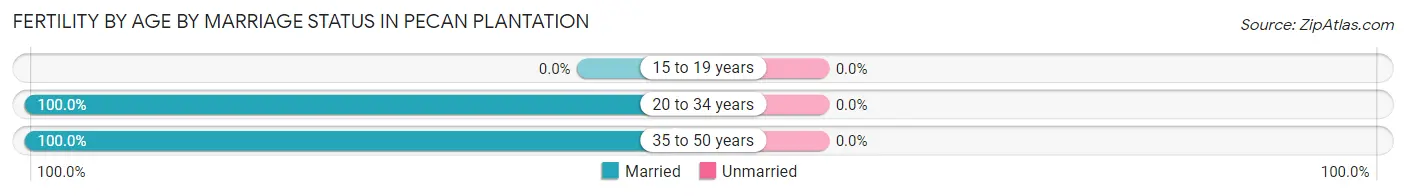
| Age Bracket | Married | Unmarried |
| 15 to 19 years | 0 (0.0%) | 0 (0.0%) |
| 20 to 34 years | 14 (100.0%) | 0 (0.0%) |
| 35 to 50 years | 35 (100.0%) | 0 (0.0%) |
| Total | 49 (100.0%) | 0 (0.0%) |
Fertility by Education in Pecan Plantation
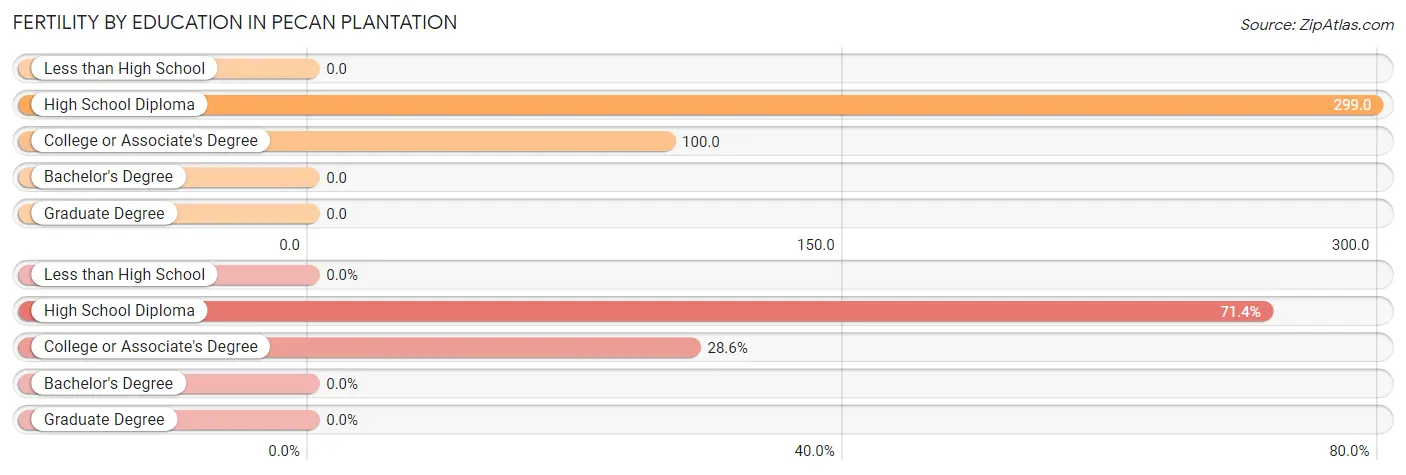
| Educational Attainment | Women with Births | Births / 1,000 Women |
| Less than High School | 0 (0.0%) | 0.0 |
| High School Diploma | 35 (71.4%) | 299.0 |
| College or Associate's Degree | 14 (28.6%) | 100.0 |
| Bachelor's Degree | 0 (0.0%) | 0.0 |
| Graduate Degree | 0 (0.0%) | 0.0 |
| Total | 49 (100.0%) | 67.0 |
Fertility by Education by Marriage Status in Pecan Plantation
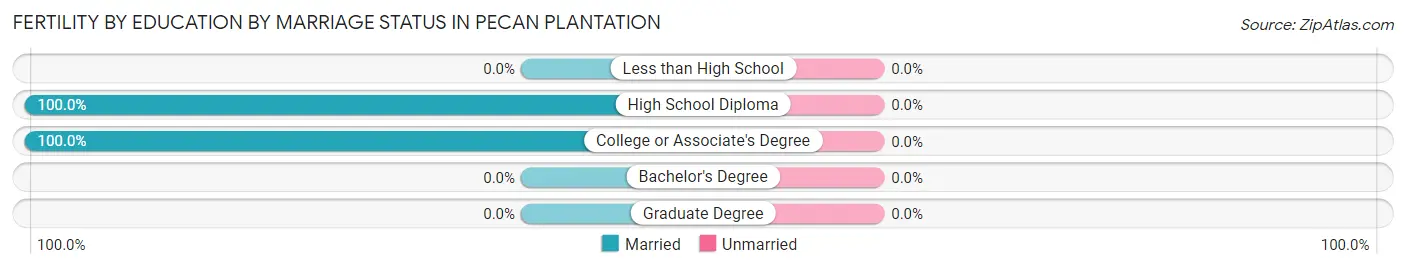
| Educational Attainment | Married | Unmarried |
| Less than High School | 0 (0.0%) | 0 (0.0%) |
| High School Diploma | 35 (100.0%) | 0 (0.0%) |
| College or Associate's Degree | 14 (100.0%) | 0 (0.0%) |
| Bachelor's Degree | 0 (0.0%) | 0 (0.0%) |
| Graduate Degree | 0 (0.0%) | 0 (0.0%) |
| Total | 49 (100.0%) | 0 (0.0%) |
Employment Characteristics in Pecan Plantation
Employment by Class of Employer in Pecan Plantation
Among the 2,055 employed individuals in Pecan Plantation, private company employees (1,156 | 56.2%), local government employees (277 | 13.5%), and not-for-profit organizations (193 | 9.4%) make up the most common classes of employment.
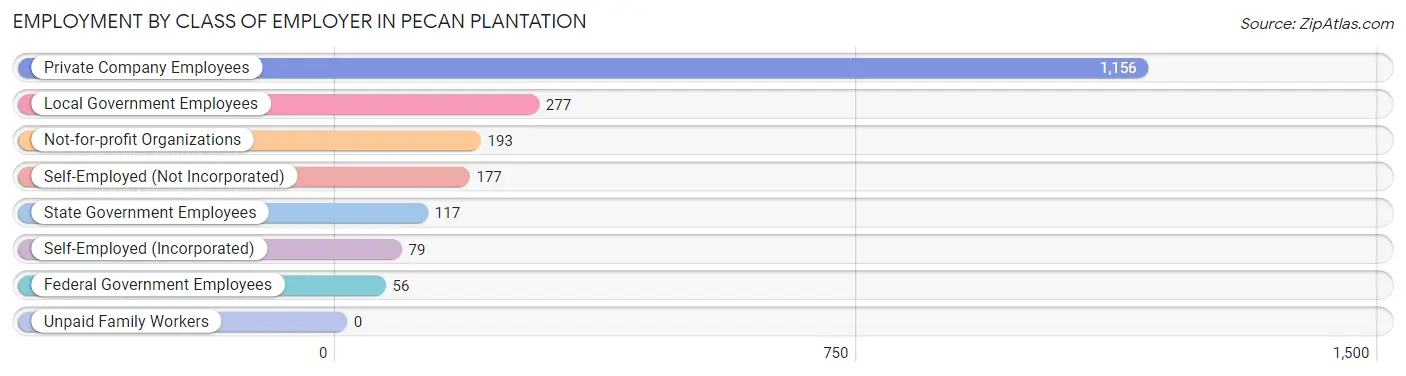
| Employer Class | # Employees | % Employees |
| Private Company Employees | 1,156 | 56.2% |
| Self-Employed (Incorporated) | 79 | 3.8% |
| Self-Employed (Not Incorporated) | 177 | 8.6% |
| Not-for-profit Organizations | 193 | 9.4% |
| Local Government Employees | 277 | 13.5% |
| State Government Employees | 117 | 5.7% |
| Federal Government Employees | 56 | 2.7% |
| Unpaid Family Workers | 0 | 0.0% |
| Total | 2,055 | 100.0% |
Employment Status by Age in Pecan Plantation
According to the labor force statistics for Pecan Plantation, out of the total population over 16 years of age (5,938), 42.3% or 2,512 individuals are in the labor force, with 18.2% or 457 of them unemployed. The age group with the highest labor force participation rate is 35 to 44 years, with 84.0% or 441 individuals in the labor force. Within the labor force, the 55 to 59 years age range has the highest percentage of unemployed individuals, with 47.1% or 286 of them being unemployed.
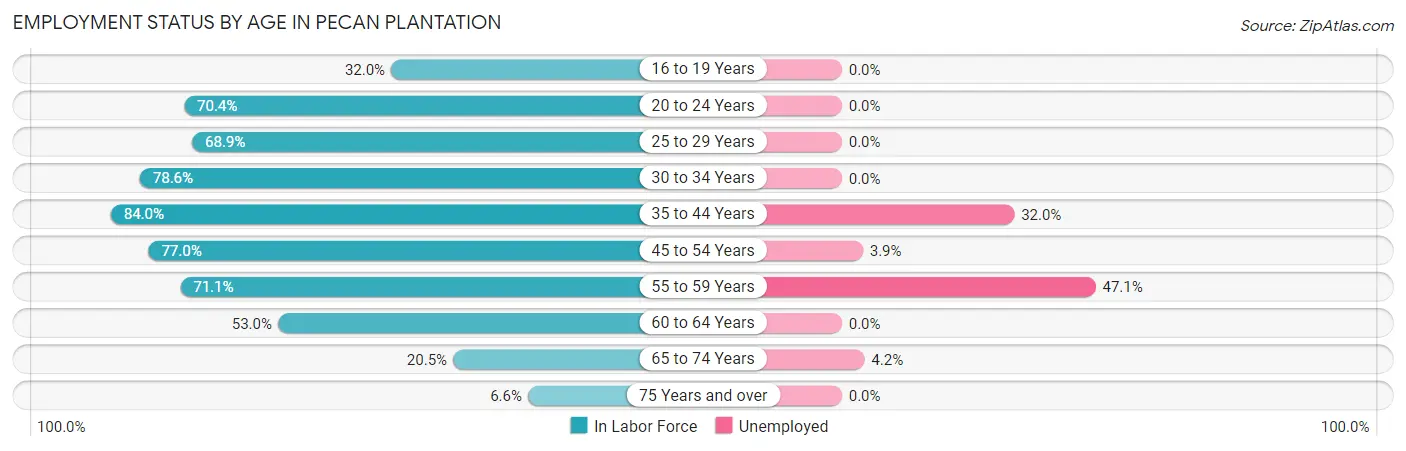
| Age Bracket | In Labor Force | Unemployed |
| 16 to 19 Years | 40 (32.0%) | 0 (0.0%) |
| 20 to 24 Years | 69 (70.4%) | 0 (0.0%) |
| 25 to 29 Years | 122 (68.9%) | 0 (0.0%) |
| 30 to 34 Years | 121 (78.6%) | 0 (0.0%) |
| 35 to 44 Years | 441 (84.0%) | 141 (32.0%) |
| 45 to 54 Years | 438 (77.0%) | 17 (3.9%) |
| 55 to 59 Years | 607 (71.1%) | 286 (47.1%) |
| 60 to 64 Years | 254 (53.0%) | 0 (0.0%) |
| 65 to 74 Years | 332 (20.5%) | 14 (4.2%) |
| 75 Years and over | 88 (6.6%) | 0 (0.0%) |
| Total | 2,512 (42.3%) | 457 (18.2%) |
Employment Status by Educational Attainment in Pecan Plantation
According to labor force statistics for Pecan Plantation, 71.9% of individuals (1,983) out of the total population between 25 and 64 years of age (2,758) are in the labor force, with 22.4% or 444 of them being unemployed. The group with the highest labor force participation rate are those with the educational attainment of less than high school, with 100.0% or 80 individuals in the labor force. Within the labor force, individuals with high school diploma education have the highest percentage of unemployment, with 39.9% or 158 of them being unemployed.
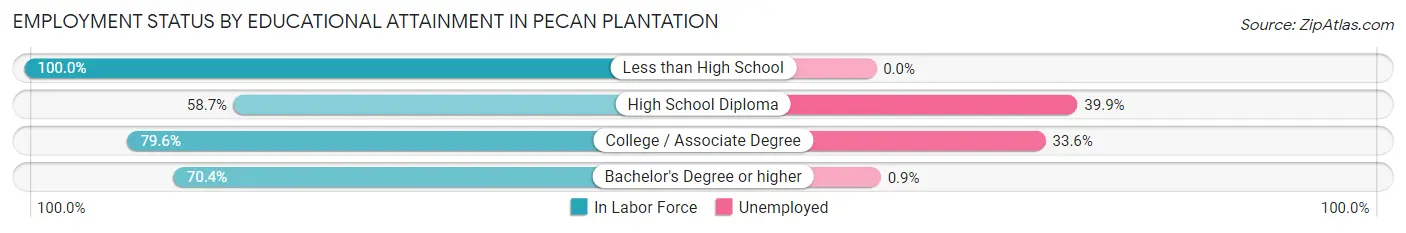
| Educational Attainment | In Labor Force | Unemployed |
| Less than High School | 80 (100.0%) | 0 (0.0%) |
| High School Diploma | 396 (58.7%) | 269 (39.9%) |
| College / Associate Degree | 833 (79.6%) | 351 (33.6%) |
| Bachelor's Degree or higher | 674 (70.4%) | 9 (0.9%) |
| Total | 1,983 (71.9%) | 618 (22.4%) |
Employment Occupations by Sex in Pecan Plantation
Management, Business, Science and Arts Occupations
The most common Management, Business, Science and Arts occupations in Pecan Plantation are Management (320 | 15.6%), Health Diagnosing & Treating (235 | 11.4%), Community & Social Service (220 | 10.7%), Health Technologists (169 | 8.2%), and Education Instruction & Library (168 | 8.2%).
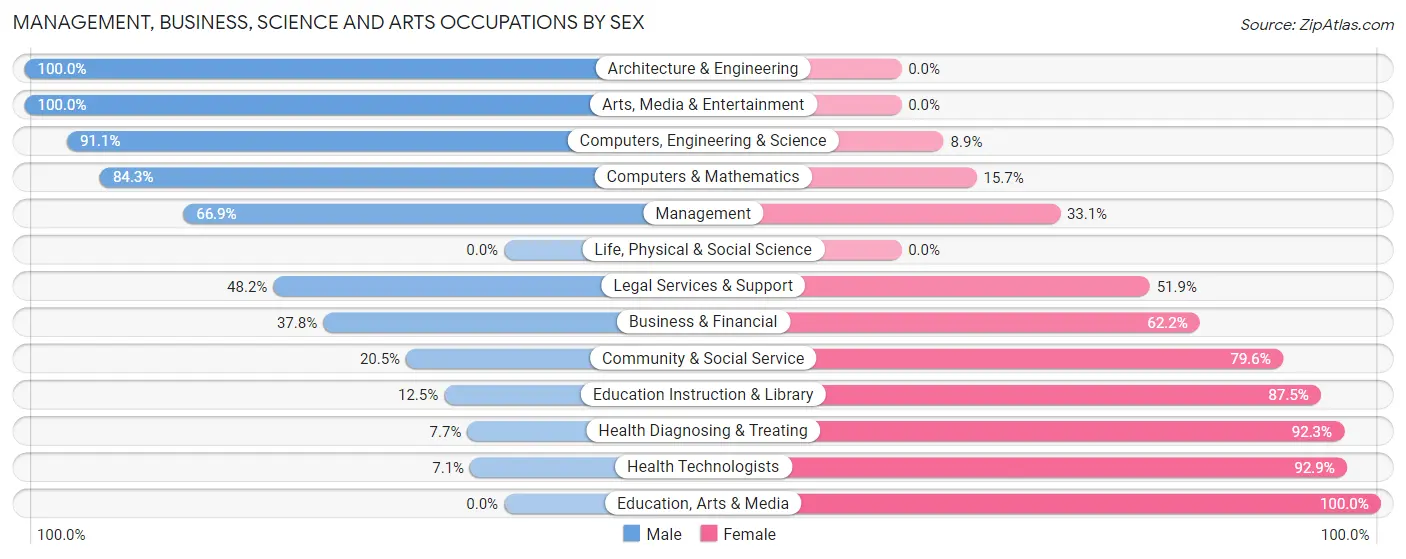
Management, Business, Science and Arts Occupations by Sex
Within the Management, Business, Science and Arts occupations in Pecan Plantation, the most male-oriented occupations are Architecture & Engineering (100.0%), Arts, Media & Entertainment (100.0%), and Computers, Engineering & Science (91.1%), while the most female-oriented occupations are Education, Arts & Media (100.0%), Health Technologists (92.9%), and Health Diagnosing & Treating (92.3%).
| Occupation | Male | Female |
| Management | 214 (66.9%) | 106 (33.1%) |
| Business & Financial | 37 (37.8%) | 61 (62.2%) |
| Computers, Engineering & Science | 144 (91.1%) | 14 (8.9%) |
| Computers & Mathematics | 75 (84.3%) | 14 (15.7%) |
| Architecture & Engineering | 69 (100.0%) | 0 (0.0%) |
| Life, Physical & Social Science | 0 (0.0%) | 0 (0.0%) |
| Community & Social Service | 45 (20.4%) | 175 (79.5%) |
| Education, Arts & Media | 0 (0.0%) | 14 (100.0%) |
| Legal Services & Support | 13 (48.1%) | 14 (51.8%) |
| Education Instruction & Library | 21 (12.5%) | 147 (87.5%) |
| Arts, Media & Entertainment | 11 (100.0%) | 0 (0.0%) |
| Health Diagnosing & Treating | 18 (7.7%) | 217 (92.3%) |
| Health Technologists | 12 (7.1%) | 157 (92.9%) |
| Total (Category) | 458 (44.4%) | 573 (55.6%) |
| Total (Overall) | 1,156 (56.2%) | 899 (43.8%) |
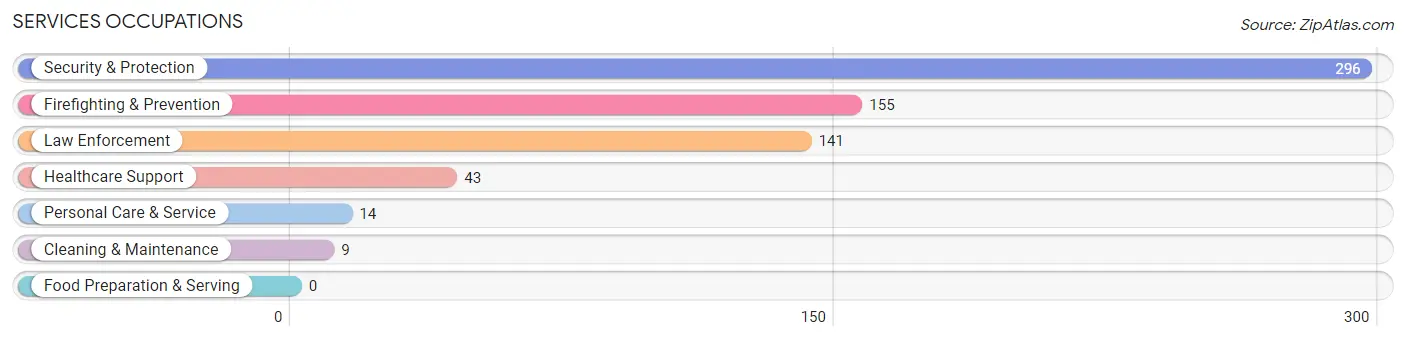
Services Occupations
The most common Services occupations in Pecan Plantation are Security & Protection (296 | 14.4%), Firefighting & Prevention (155 | 7.5%), Law Enforcement (141 | 6.9%), Healthcare Support (43 | 2.1%), and Personal Care & Service (14 | 0.7%).
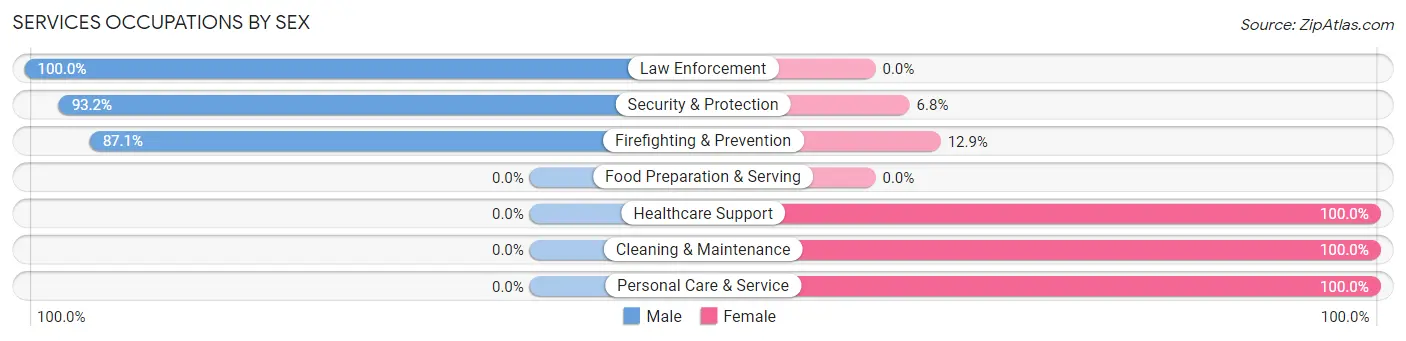
Services Occupations by Sex
Within the Services occupations in Pecan Plantation, the most male-oriented occupations are Law Enforcement (100.0%), Security & Protection (93.2%), and Firefighting & Prevention (87.1%), while the most female-oriented occupations are Healthcare Support (100.0%), Cleaning & Maintenance (100.0%), and Personal Care & Service (100.0%).
| Occupation | Male | Female |
| Healthcare Support | 0 (0.0%) | 43 (100.0%) |
| Security & Protection | 276 (93.2%) | 20 (6.8%) |
| Firefighting & Prevention | 135 (87.1%) | 20 (12.9%) |
| Law Enforcement | 141 (100.0%) | 0 (0.0%) |
| Food Preparation & Serving | 0 (0.0%) | 0 (0.0%) |
| Cleaning & Maintenance | 0 (0.0%) | 9 (100.0%) |
| Personal Care & Service | 0 (0.0%) | 14 (100.0%) |
| Total (Category) | 276 (76.2%) | 86 (23.8%) |
| Total (Overall) | 1,156 (56.2%) | 899 (43.8%) |
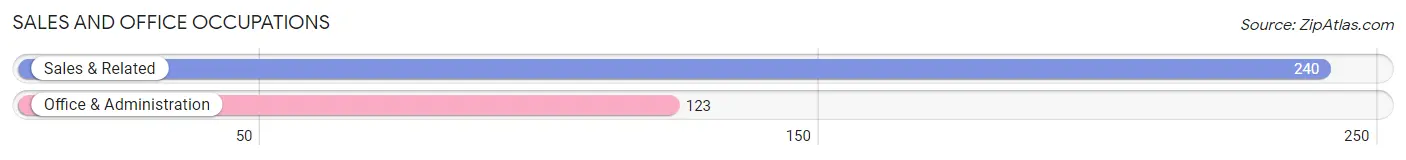
Sales and Office Occupations
The most common Sales and Office occupations in Pecan Plantation are Sales & Related (240 | 11.7%), and Office & Administration (123 | 6.0%).
Sales and Office Occupations by Sex
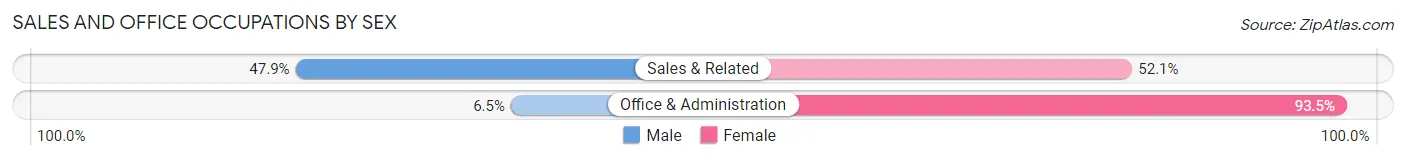
| Occupation | Male | Female |
| Sales & Related | 115 (47.9%) | 125 (52.1%) |
| Office & Administration | 8 (6.5%) | 115 (93.5%) |
| Total (Category) | 123 (33.9%) | 240 (66.1%) |
| Total (Overall) | 1,156 (56.2%) | 899 (43.8%) |
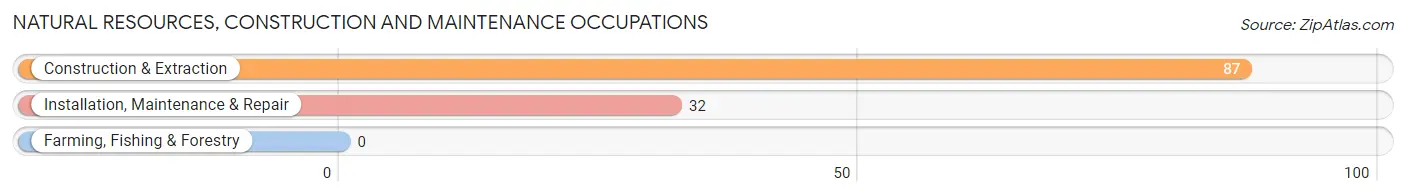
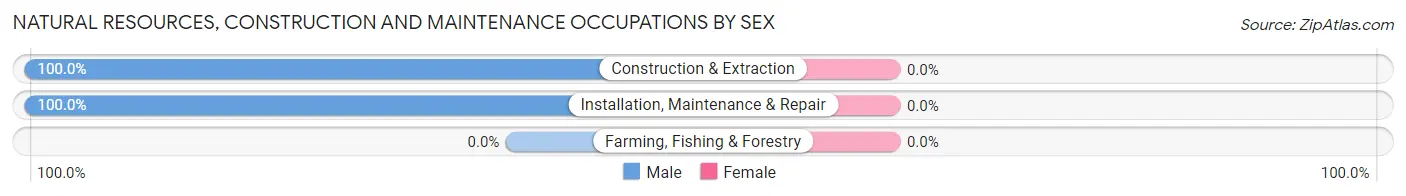
Natural Resources, Construction and Maintenance Occupations
The most common Natural Resources, Construction and Maintenance occupations in Pecan Plantation are Construction & Extraction (87 | 4.2%), and Installation, Maintenance & Repair (32 | 1.6%).
Natural Resources, Construction and Maintenance Occupations by Sex
| Occupation | Male | Female |
| Farming, Fishing & Forestry | 0 (0.0%) | 0 (0.0%) |
| Construction & Extraction | 87 (100.0%) | 0 (0.0%) |
| Installation, Maintenance & Repair | 32 (100.0%) | 0 (0.0%) |
| Total (Category) | 119 (100.0%) | 0 (0.0%) |
| Total (Overall) | 1,156 (56.2%) | 899 (43.8%) |
Production, Transportation and Moving Occupations
The most common Production, Transportation and Moving occupations in Pecan Plantation are Transportation (100 | 4.9%), Production (69 | 3.4%), and Material Moving (11 | 0.5%).
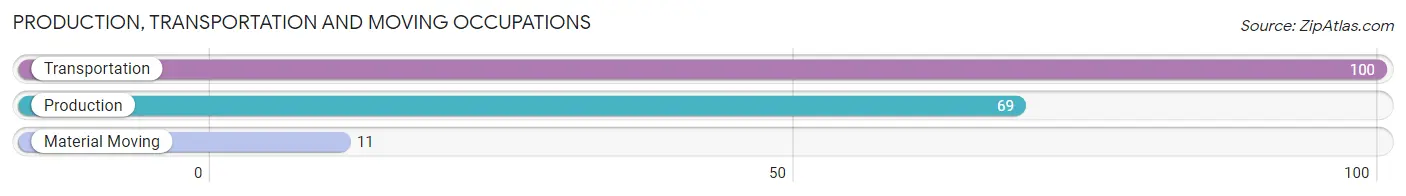
Production, Transportation and Moving Occupations by Sex
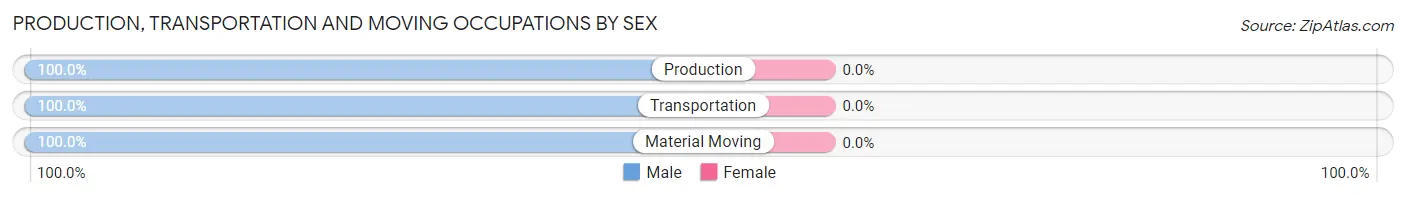
| Occupation | Male | Female |
| Production | 69 (100.0%) | 0 (0.0%) |
| Transportation | 100 (100.0%) | 0 (0.0%) |
| Material Moving | 11 (100.0%) | 0 (0.0%) |
| Total (Category) | 180 (100.0%) | 0 (0.0%) |
| Total (Overall) | 1,156 (56.2%) | 899 (43.8%) |
Employment Industries by Sex in Pecan Plantation
Employment Industries in Pecan Plantation
The major employment industries in Pecan Plantation include Health Care & Social Assistance (375 | 18.2%), Public Administration (319 | 15.5%), Educational Services (204 | 9.9%), Finance & Insurance (179 | 8.7%), and Mining, Quarrying, & Extraction (169 | 8.2%).
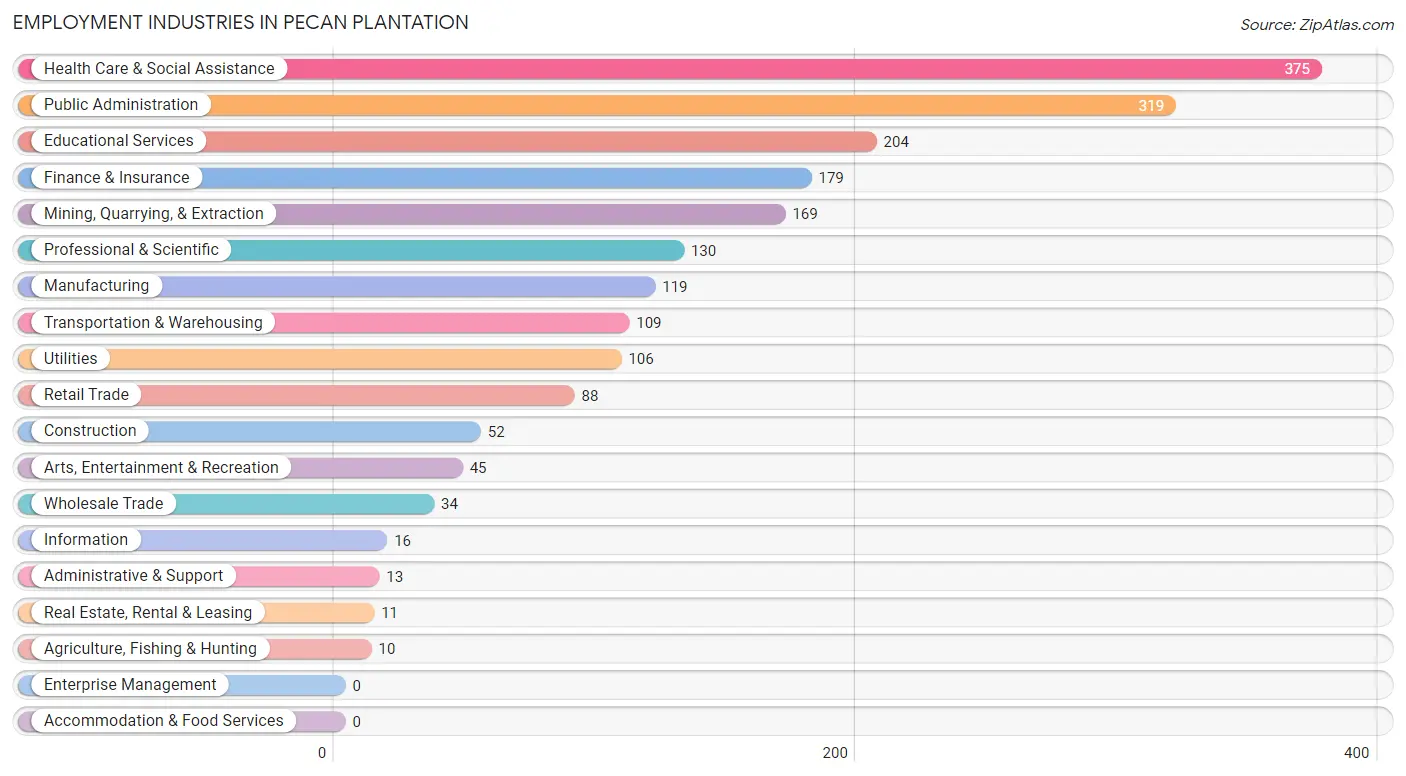
Employment Industries by Sex in Pecan Plantation
The Pecan Plantation industries that see more men than women are Agriculture, Fishing & Hunting (100.0%), Mining, Quarrying, & Extraction (100.0%), and Transportation & Warehousing (100.0%), whereas the industries that tend to have a higher number of women are Health Care & Social Assistance (87.5%), Educational Services (81.9%), and Arts, Entertainment & Recreation (75.6%).
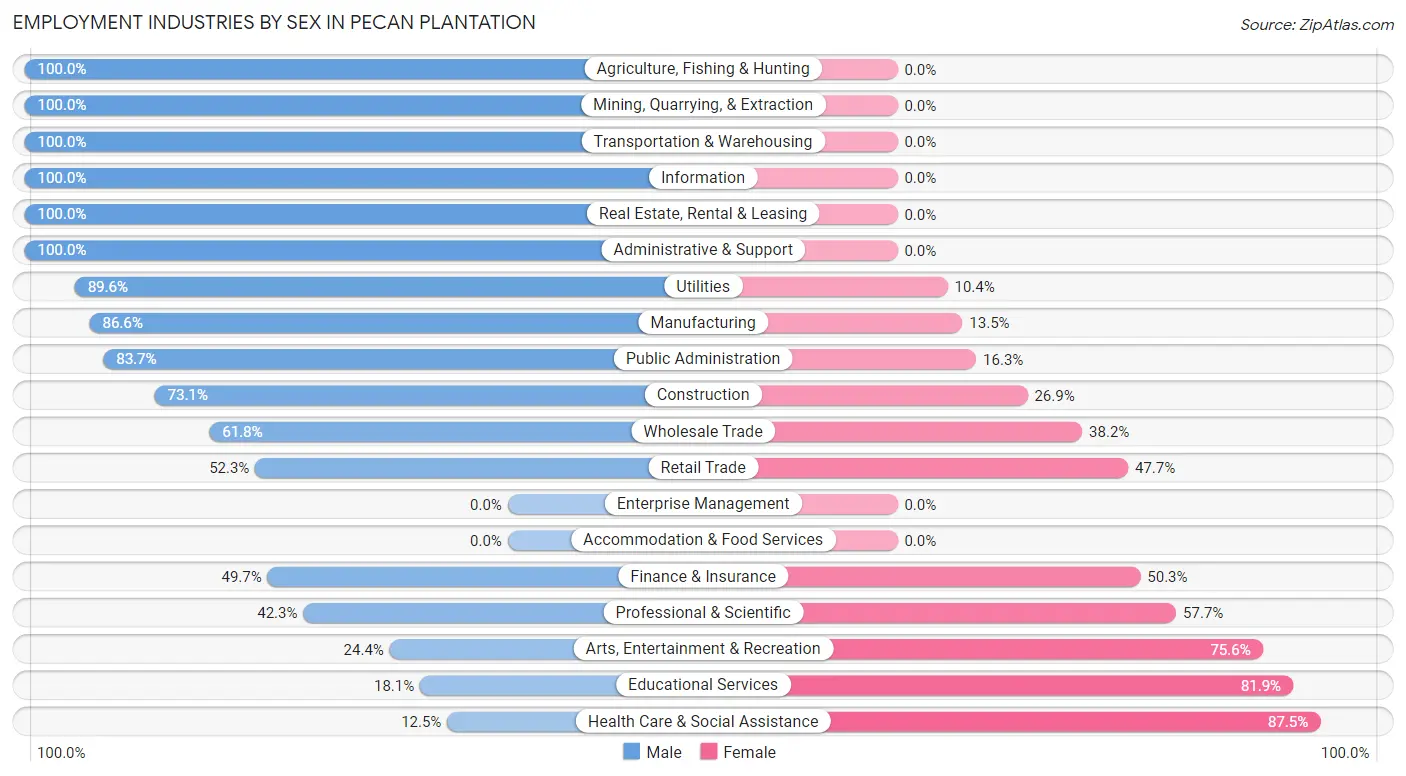
| Industry | Male | Female |
| Agriculture, Fishing & Hunting | 10 (100.0%) | 0 (0.0%) |
| Mining, Quarrying, & Extraction | 169 (100.0%) | 0 (0.0%) |
| Construction | 38 (73.1%) | 14 (26.9%) |
| Manufacturing | 103 (86.6%) | 16 (13.5%) |
| Wholesale Trade | 21 (61.8%) | 13 (38.2%) |
| Retail Trade | 46 (52.3%) | 42 (47.7%) |
| Transportation & Warehousing | 109 (100.0%) | 0 (0.0%) |
| Utilities | 95 (89.6%) | 11 (10.4%) |
| Information | 16 (100.0%) | 0 (0.0%) |
| Finance & Insurance | 89 (49.7%) | 90 (50.3%) |
| Real Estate, Rental & Leasing | 11 (100.0%) | 0 (0.0%) |
| Professional & Scientific | 55 (42.3%) | 75 (57.7%) |
| Enterprise Management | 0 (0.0%) | 0 (0.0%) |
| Administrative & Support | 13 (100.0%) | 0 (0.0%) |
| Educational Services | 37 (18.1%) | 167 (81.9%) |
| Health Care & Social Assistance | 47 (12.5%) | 328 (87.5%) |
| Arts, Entertainment & Recreation | 11 (24.4%) | 34 (75.6%) |
| Accommodation & Food Services | 0 (0.0%) | 0 (0.0%) |
| Public Administration | 267 (83.7%) | 52 (16.3%) |
| Total | 1,156 (56.2%) | 899 (43.8%) |
Education in Pecan Plantation
School Enrollment in Pecan Plantation
The most common levels of schooling among the 816 students in Pecan Plantation are college / undergraduate (207 | 25.4%), middle school (186 | 22.8%), and high school (174 | 21.3%).
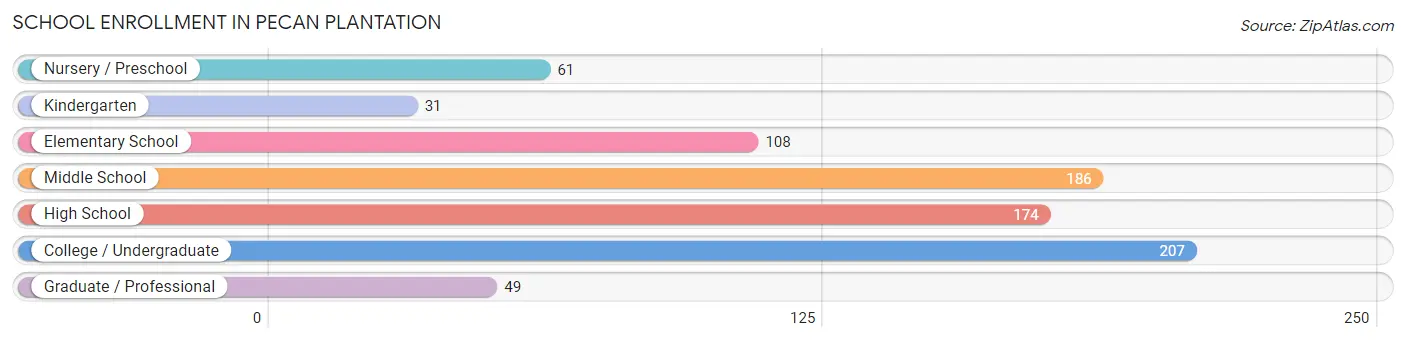
| School Level | # Students | % Students |
| Nursery / Preschool | 61 | 7.5% |
| Kindergarten | 31 | 3.8% |
| Elementary School | 108 | 13.2% |
| Middle School | 186 | 22.8% |
| High School | 174 | 21.3% |
| College / Undergraduate | 207 | 25.4% |
| Graduate / Professional | 49 | 6.0% |
| Total | 816 | 100.0% |
School Enrollment by Age by Funding Source in Pecan Plantation
Out of a total of 816 students who are enrolled in schools in Pecan Plantation, 164 (20.1%) attend a private institution, while the remaining 652 (79.9%) are enrolled in public schools. The age group of 3 to 4 year olds has the highest likelihood of being enrolled in private schools, with 61 (100.0% in the age bracket) enrolled. Conversely, the age group of 5 to 9 year old has the lowest likelihood of being enrolled in a private school, with 139 (100.0% in the age bracket) attending a public institution.
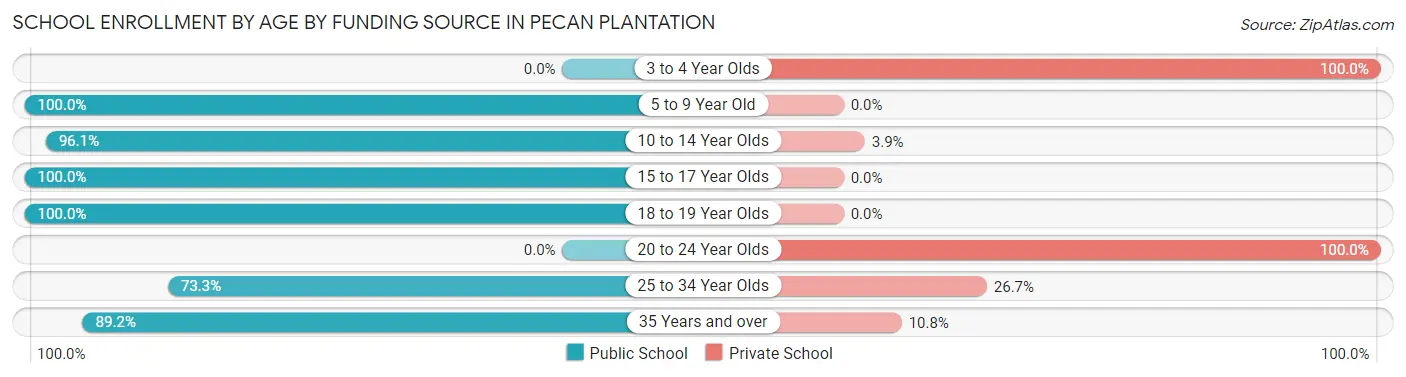
| Age Bracket | Public School | Private School |
| 3 to 4 Year Olds | 0 (0.0%) | 61 (100.0%) |
| 5 to 9 Year Old | 139 (100.0%) | 0 (0.0%) |
| 10 to 14 Year Olds | 195 (96.1%) | 8 (3.9%) |
| 15 to 17 Year Olds | 96 (100.0%) | 0 (0.0%) |
| 18 to 19 Year Olds | 90 (100.0%) | 0 (0.0%) |
| 20 to 24 Year Olds | 0 (0.0%) | 71 (100.0%) |
| 25 to 34 Year Olds | 33 (73.3%) | 12 (26.7%) |
| 35 Years and over | 99 (89.2%) | 12 (10.8%) |
| Total | 652 (79.9%) | 164 (20.1%) |
Educational Attainment by Field of Study in Pecan Plantation
Business (641 | 23.4%), education (479 | 17.5%), arts & humanities (251 | 9.2%), science & technology (238 | 8.7%), and liberal arts & history (189 | 6.9%) are the most common fields of study among 2,734 individuals in Pecan Plantation who have obtained a bachelor's degree or higher.
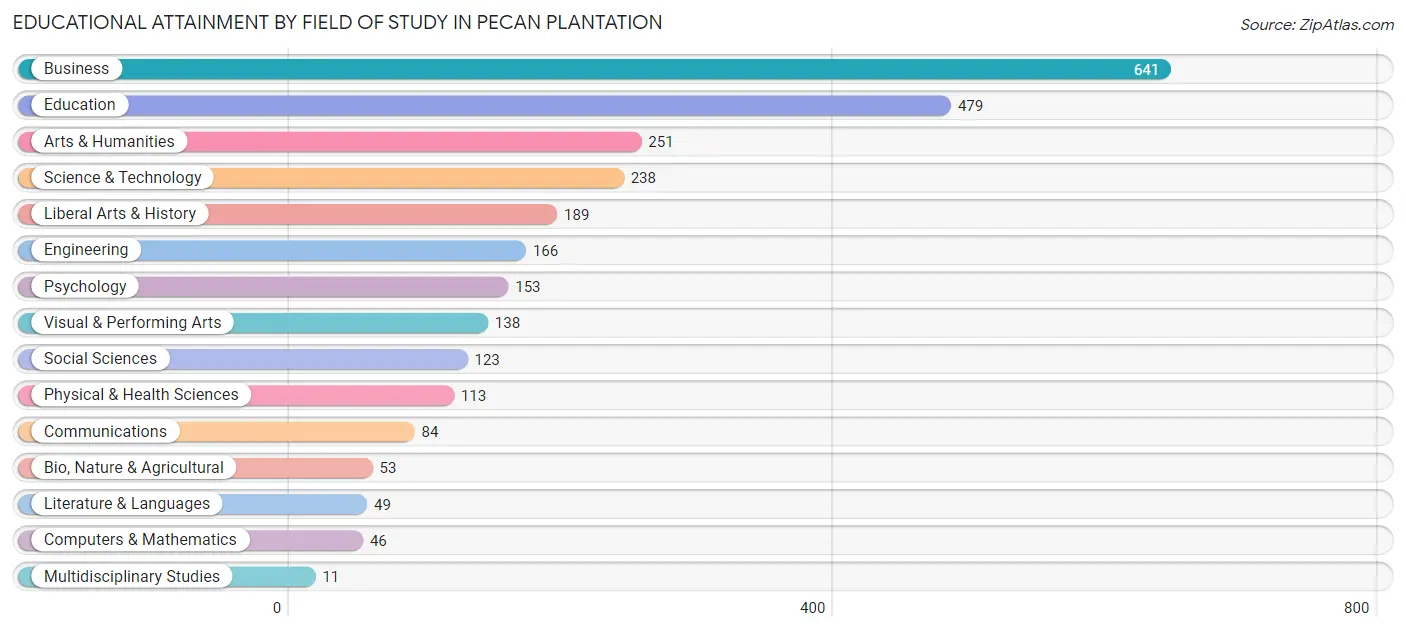
| Field of Study | # Graduates | % Graduates |
| Computers & Mathematics | 46 | 1.7% |
| Bio, Nature & Agricultural | 53 | 1.9% |
| Physical & Health Sciences | 113 | 4.1% |
| Psychology | 153 | 5.6% |
| Social Sciences | 123 | 4.5% |
| Engineering | 166 | 6.1% |
| Multidisciplinary Studies | 11 | 0.4% |
| Science & Technology | 238 | 8.7% |
| Business | 641 | 23.4% |
| Education | 479 | 17.5% |
| Literature & Languages | 49 | 1.8% |
| Liberal Arts & History | 189 | 6.9% |
| Visual & Performing Arts | 138 | 5.1% |
| Communications | 84 | 3.1% |
| Arts & Humanities | 251 | 9.2% |
| Total | 2,734 | 100.0% |
Transportation & Commute in Pecan Plantation
Vehicle Availability by Sex in Pecan Plantation
The most prevalent vehicle ownership categories in Pecan Plantation are males with 2 vehicles (472, accounting for 40.8%) and females with 2 vehicles (429, making up 52.5%).
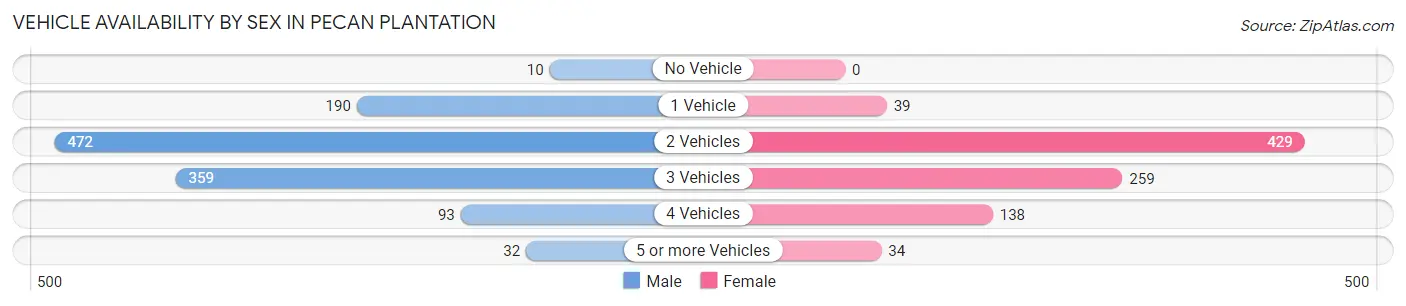
| Vehicles Available | Male | Female |
| No Vehicle | 10 (0.9%) | 0 (0.0%) |
| 1 Vehicle | 190 (16.4%) | 39 (4.3%) |
| 2 Vehicles | 472 (40.8%) | 429 (47.7%) |
| 3 Vehicles | 359 (31.1%) | 259 (28.8%) |
| 4 Vehicles | 93 (8.0%) | 138 (15.3%) |
| 5 or more Vehicles | 32 (2.8%) | 34 (3.8%) |
| Total | 1,156 (100.0%) | 899 (100.0%) |
Commute Time in Pecan Plantation
The most frequently occuring commute durations in Pecan Plantation are 60 to 89 minutes (551 commuters, 32.5%), 45 to 59 minutes (380 commuters, 22.4%), and 20 to 24 minutes (215 commuters, 12.7%).
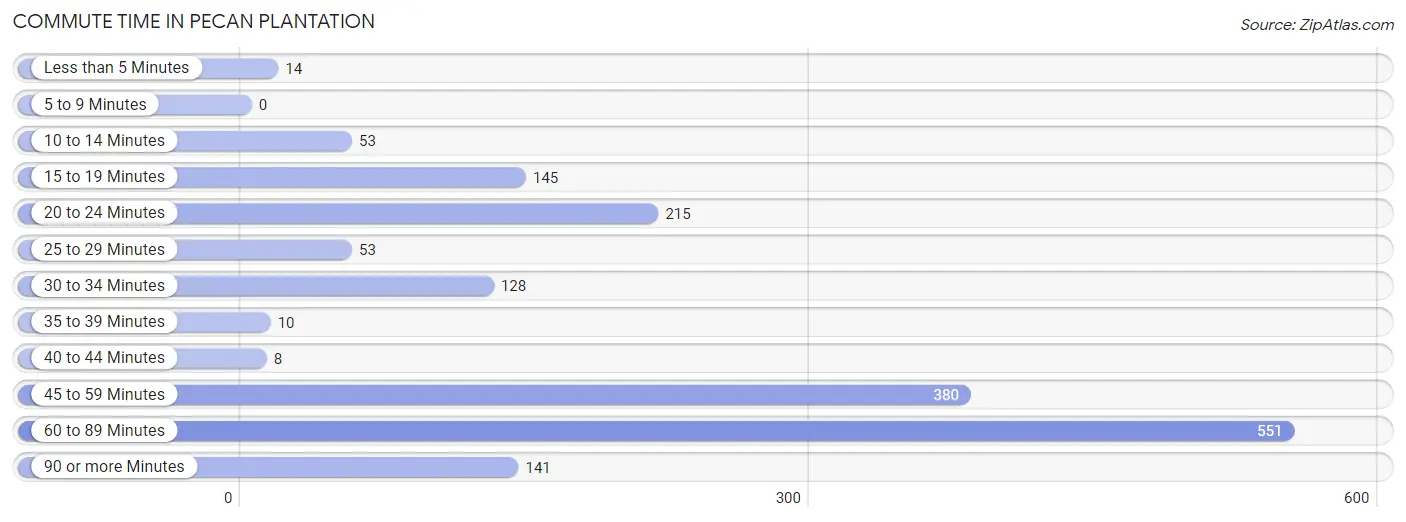
| Commute Time | # Commuters | % Commuters |
| Less than 5 Minutes | 14 | 0.8% |
| 5 to 9 Minutes | 0 | 0.0% |
| 10 to 14 Minutes | 53 | 3.1% |
| 15 to 19 Minutes | 145 | 8.5% |
| 20 to 24 Minutes | 215 | 12.7% |
| 25 to 29 Minutes | 53 | 3.1% |
| 30 to 34 Minutes | 128 | 7.5% |
| 35 to 39 Minutes | 10 | 0.6% |
| 40 to 44 Minutes | 8 | 0.5% |
| 45 to 59 Minutes | 380 | 22.4% |
| 60 to 89 Minutes | 551 | 32.5% |
| 90 or more Minutes | 141 | 8.3% |
Commute Time by Sex in Pecan Plantation
The most common commute times in Pecan Plantation are 60 to 89 minutes (366 commuters, 35.6%) for males and 60 to 89 minutes (185 commuters, 27.6%) for females.
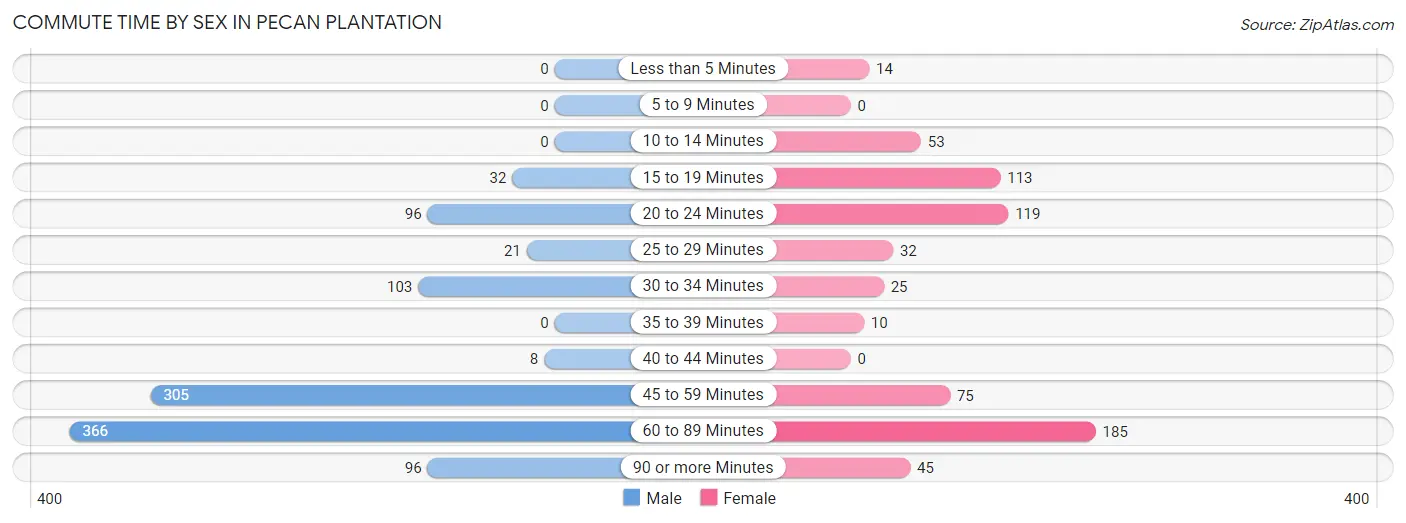
| Commute Time | Male | Female |
| Less than 5 Minutes | 0 (0.0%) | 14 (2.1%) |
| 5 to 9 Minutes | 0 (0.0%) | 0 (0.0%) |
| 10 to 14 Minutes | 0 (0.0%) | 53 (7.9%) |
| 15 to 19 Minutes | 32 (3.1%) | 113 (16.8%) |
| 20 to 24 Minutes | 96 (9.3%) | 119 (17.7%) |
| 25 to 29 Minutes | 21 (2.0%) | 32 (4.8%) |
| 30 to 34 Minutes | 103 (10.0%) | 25 (3.7%) |
| 35 to 39 Minutes | 0 (0.0%) | 10 (1.5%) |
| 40 to 44 Minutes | 8 (0.8%) | 0 (0.0%) |
| 45 to 59 Minutes | 305 (29.7%) | 75 (11.2%) |
| 60 to 89 Minutes | 366 (35.6%) | 185 (27.6%) |
| 90 or more Minutes | 96 (9.3%) | 45 (6.7%) |
Time of Departure to Work by Sex in Pecan Plantation
The most frequent times of departure to work in Pecan Plantation are 7:00 AM to 7:29 AM (227, 22.1%) for males and 7:00 AM to 7:29 AM (166, 24.7%) for females.
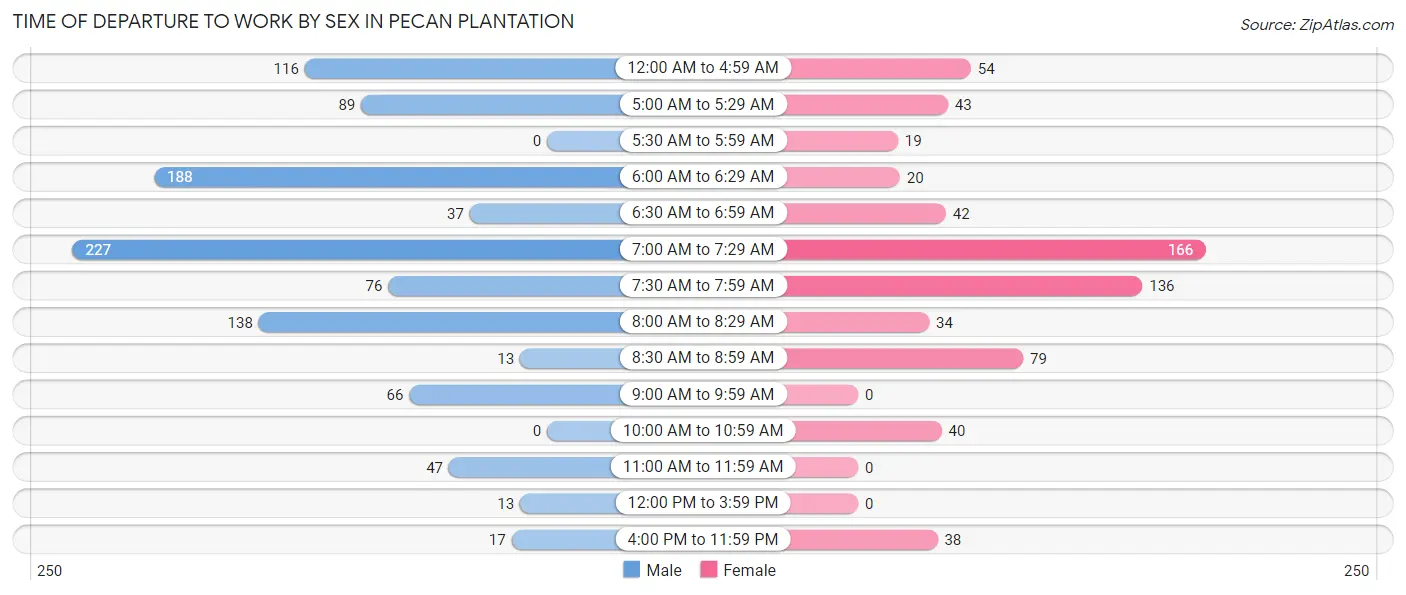
| Time of Departure | Male | Female |
| 12:00 AM to 4:59 AM | 116 (11.3%) | 54 (8.1%) |
| 5:00 AM to 5:29 AM | 89 (8.7%) | 43 (6.4%) |
| 5:30 AM to 5:59 AM | 0 (0.0%) | 19 (2.8%) |
| 6:00 AM to 6:29 AM | 188 (18.3%) | 20 (3.0%) |
| 6:30 AM to 6:59 AM | 37 (3.6%) | 42 (6.3%) |
| 7:00 AM to 7:29 AM | 227 (22.1%) | 166 (24.7%) |
| 7:30 AM to 7:59 AM | 76 (7.4%) | 136 (20.3%) |
| 8:00 AM to 8:29 AM | 138 (13.4%) | 34 (5.1%) |
| 8:30 AM to 8:59 AM | 13 (1.3%) | 79 (11.8%) |
| 9:00 AM to 9:59 AM | 66 (6.4%) | 0 (0.0%) |
| 10:00 AM to 10:59 AM | 0 (0.0%) | 40 (6.0%) |
| 11:00 AM to 11:59 AM | 47 (4.6%) | 0 (0.0%) |
| 12:00 PM to 3:59 PM | 13 (1.3%) | 0 (0.0%) |
| 4:00 PM to 11:59 PM | 17 (1.7%) | 38 (5.7%) |
| Total | 1,027 (100.0%) | 671 (100.0%) |
Housing Occupancy in Pecan Plantation
Occupancy by Ownership in Pecan Plantation
Of the total 2,819 dwellings in Pecan Plantation, owner-occupied units account for 2,720 (96.5%), while renter-occupied units make up 99 (3.5%).
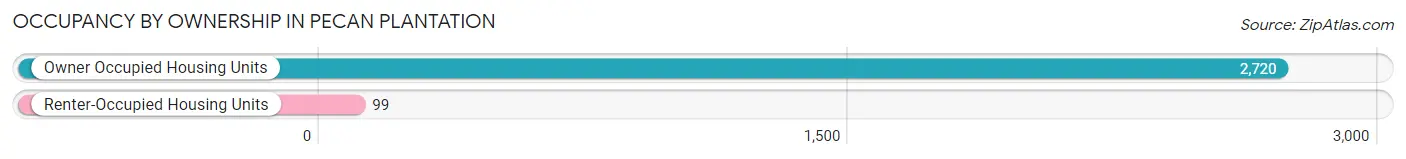
| Occupancy | # Housing Units | % Housing Units |
| Owner Occupied Housing Units | 2,720 | 96.5% |
| Renter-Occupied Housing Units | 99 | 3.5% |
| Total Occupied Housing Units | 2,819 | 100.0% |
Occupancy by Household Size in Pecan Plantation
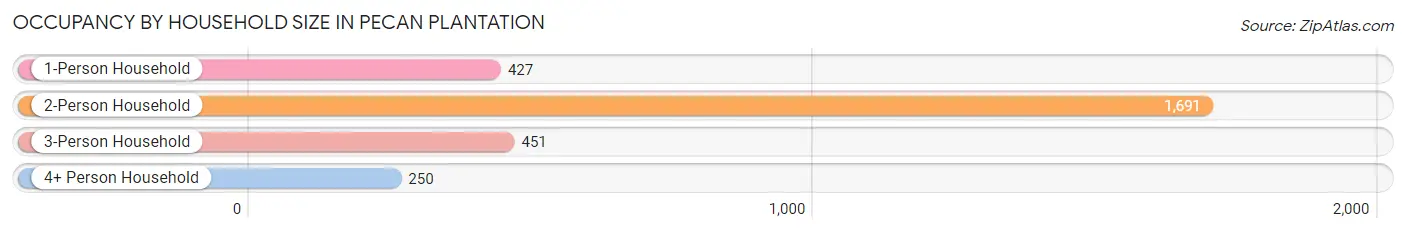
| Household Size | # Housing Units | % Housing Units |
| 1-Person Household | 427 | 15.1% |
| 2-Person Household | 1,691 | 60.0% |
| 3-Person Household | 451 | 16.0% |
| 4+ Person Household | 250 | 8.9% |
| Total Housing Units | 2,819 | 100.0% |
Occupancy by Ownership by Household Size in Pecan Plantation
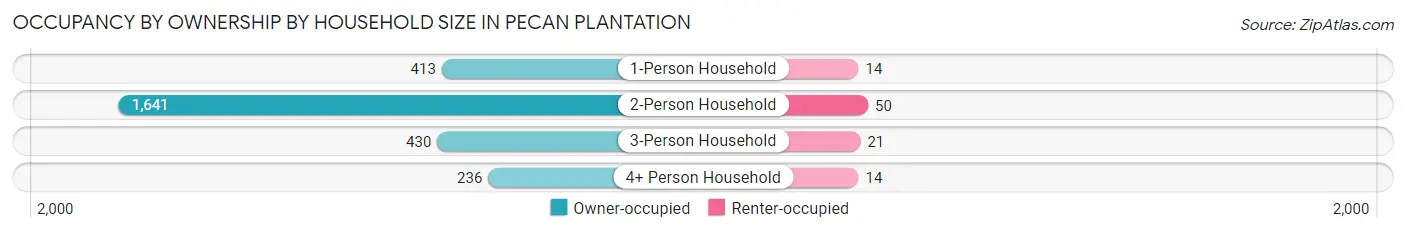
| Household Size | Owner-occupied | Renter-occupied |
| 1-Person Household | 413 (96.7%) | 14 (3.3%) |
| 2-Person Household | 1,641 (97.0%) | 50 (3.0%) |
| 3-Person Household | 430 (95.3%) | 21 (4.7%) |
| 4+ Person Household | 236 (94.4%) | 14 (5.6%) |
| Total Housing Units | 2,720 (96.5%) | 99 (3.5%) |
Occupancy by Educational Attainment in Pecan Plantation
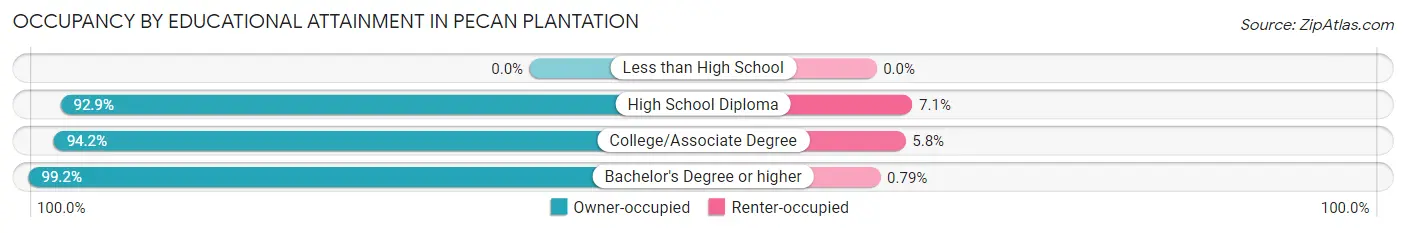
| Household Size | Owner-occupied | Renter-occupied |
| Less than High School | 0 (0.0%) | 0 (0.0%) |
| High School Diploma | 391 (92.9%) | 30 (7.1%) |
| College/Associate Degree | 946 (94.2%) | 58 (5.8%) |
| Bachelor's Degree or higher | 1,383 (99.2%) | 11 (0.8%) |
Occupancy by Age of Householder in Pecan Plantation
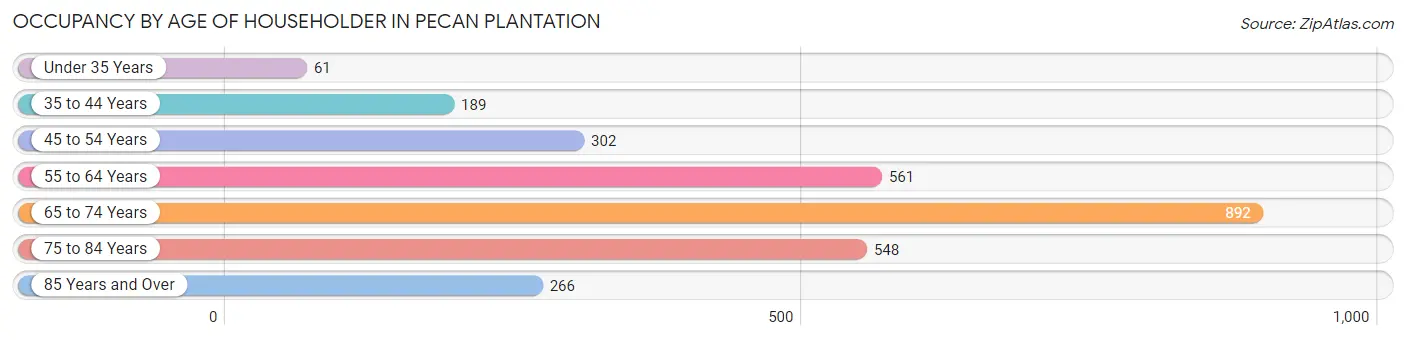
| Age Bracket | # Households | % Households |
| Under 35 Years | 61 | 2.2% |
| 35 to 44 Years | 189 | 6.7% |
| 45 to 54 Years | 302 | 10.7% |
| 55 to 64 Years | 561 | 19.9% |
| 65 to 74 Years | 892 | 31.6% |
| 75 to 84 Years | 548 | 19.4% |
| 85 Years and Over | 266 | 9.4% |
| Total | 2,819 | 100.0% |
Housing Finances in Pecan Plantation
Median Income by Occupancy in Pecan Plantation
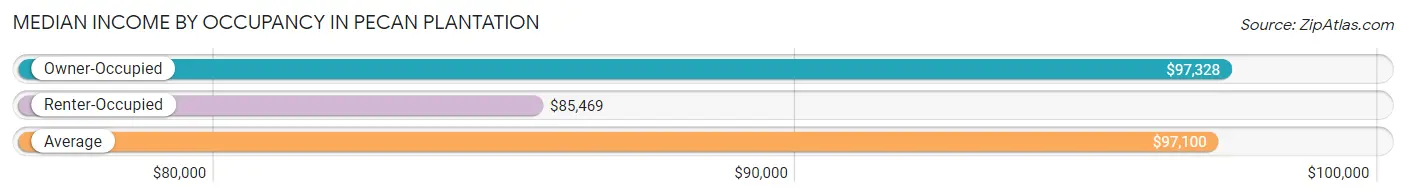
| Occupancy Type | # Households | Median Income |
| Owner-Occupied | 2,720 (96.5%) | $97,328 |
| Renter-Occupied | 99 (3.5%) | $85,469 |
| Average | 2,819 (100.0%) | $97,100 |
Occupancy by Householder Income Bracket in Pecan Plantation
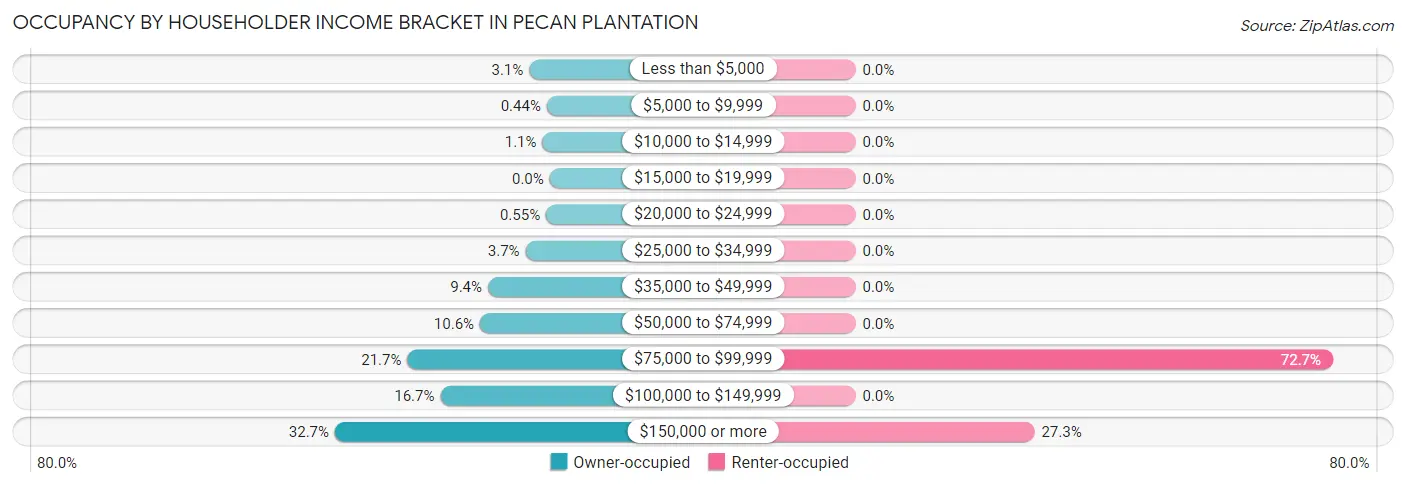
| Income Bracket | Owner-occupied | Renter-occupied |
| Less than $5,000 | 85 (3.1%) | 0 (0.0%) |
| $5,000 to $9,999 | 12 (0.4%) | 0 (0.0%) |
| $10,000 to $14,999 | 30 (1.1%) | 0 (0.0%) |
| $15,000 to $19,999 | 0 (0.0%) | 0 (0.0%) |
| $20,000 to $24,999 | 15 (0.5%) | 0 (0.0%) |
| $25,000 to $34,999 | 100 (3.7%) | 0 (0.0%) |
| $35,000 to $49,999 | 256 (9.4%) | 0 (0.0%) |
| $50,000 to $74,999 | 289 (10.6%) | 0 (0.0%) |
| $75,000 to $99,999 | 590 (21.7%) | 72 (72.7%) |
| $100,000 to $149,999 | 453 (16.7%) | 0 (0.0%) |
| $150,000 or more | 890 (32.7%) | 27 (27.3%) |
| Total | 2,720 (100.0%) | 99 (100.0%) |
Monthly Housing Cost Tiers in Pecan Plantation
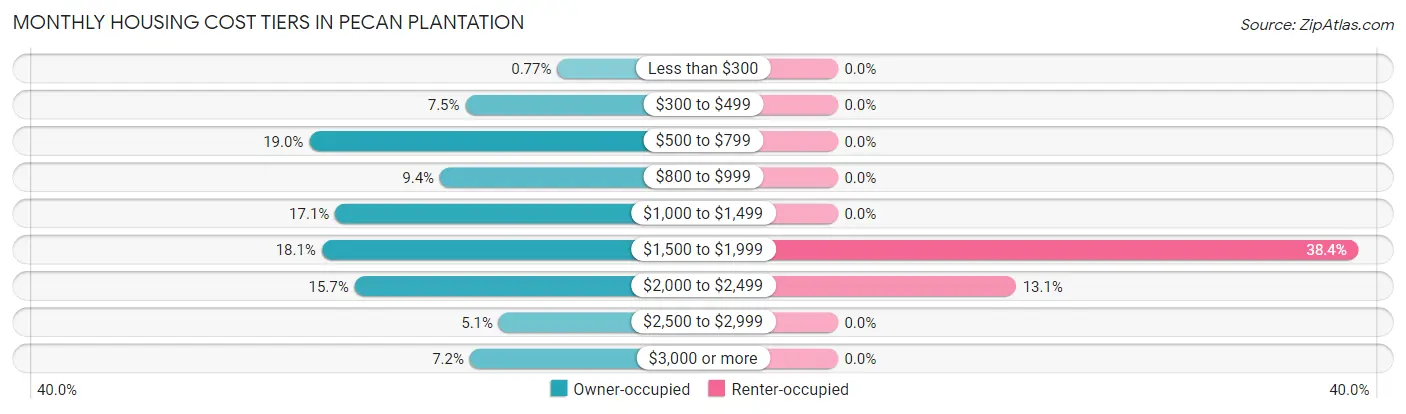
| Monthly Cost | Owner-occupied | Renter-occupied |
| Less than $300 | 21 (0.8%) | 0 (0.0%) |
| $300 to $499 | 205 (7.5%) | 0 (0.0%) |
| $500 to $799 | 518 (19.0%) | 0 (0.0%) |
| $800 to $999 | 256 (9.4%) | 0 (0.0%) |
| $1,000 to $1,499 | 466 (17.1%) | 0 (0.0%) |
| $1,500 to $1,999 | 493 (18.1%) | 38 (38.4%) |
| $2,000 to $2,499 | 427 (15.7%) | 13 (13.1%) |
| $2,500 to $2,999 | 138 (5.1%) | 0 (0.0%) |
| $3,000 or more | 196 (7.2%) | 0 (0.0%) |
| Total | 2,720 (100.0%) | 99 (100.0%) |
Physical Housing Characteristics in Pecan Plantation
Housing Structures in Pecan Plantation
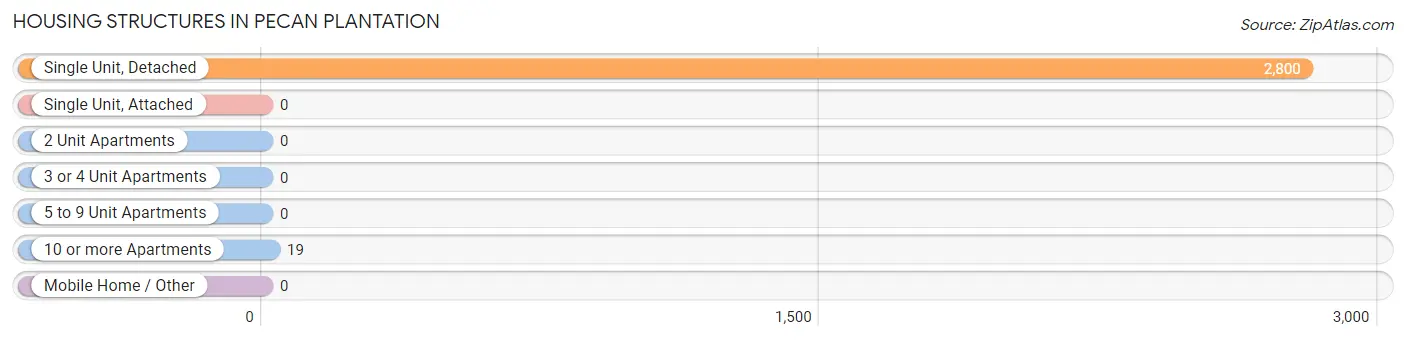
| Structure Type | # Housing Units | % Housing Units |
| Single Unit, Detached | 2,800 | 99.3% |
| Single Unit, Attached | 0 | 0.0% |
| 2 Unit Apartments | 0 | 0.0% |
| 3 or 4 Unit Apartments | 0 | 0.0% |
| 5 to 9 Unit Apartments | 0 | 0.0% |
| 10 or more Apartments | 19 | 0.7% |
| Mobile Home / Other | 0 | 0.0% |
| Total | 2,819 | 100.0% |
Housing Structures by Occupancy in Pecan Plantation
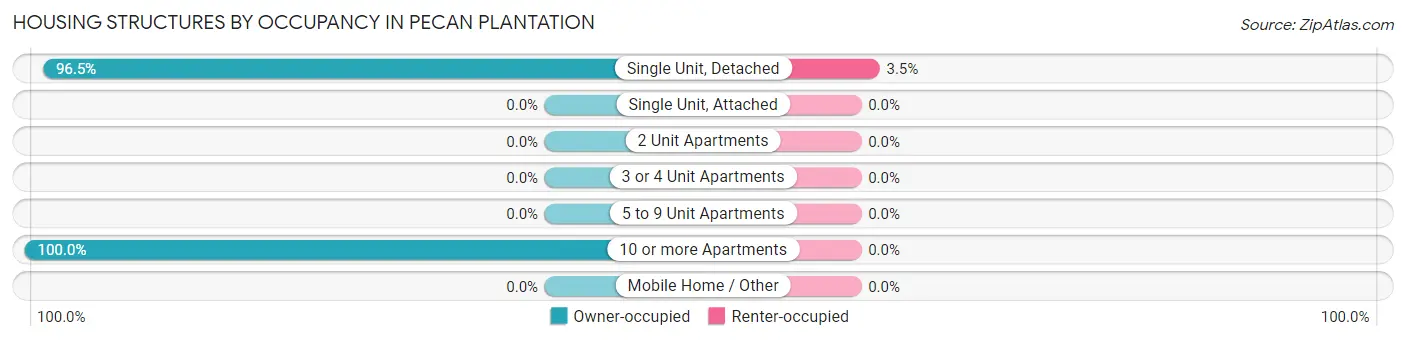
| Structure Type | Owner-occupied | Renter-occupied |
| Single Unit, Detached | 2,701 (96.5%) | 99 (3.5%) |
| Single Unit, Attached | 0 (0.0%) | 0 (0.0%) |
| 2 Unit Apartments | 0 (0.0%) | 0 (0.0%) |
| 3 or 4 Unit Apartments | 0 (0.0%) | 0 (0.0%) |
| 5 to 9 Unit Apartments | 0 (0.0%) | 0 (0.0%) |
| 10 or more Apartments | 19 (100.0%) | 0 (0.0%) |
| Mobile Home / Other | 0 (0.0%) | 0 (0.0%) |
| Total | 2,720 (96.5%) | 99 (3.5%) |
Housing Structures by Number of Rooms in Pecan Plantation
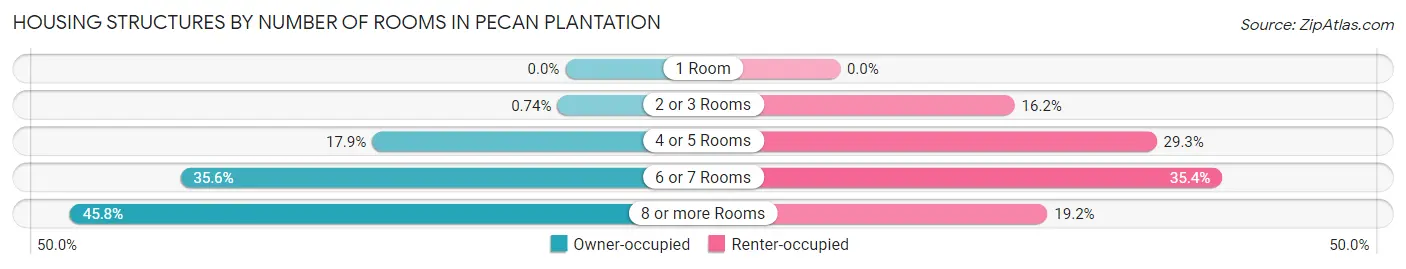
| Number of Rooms | Owner-occupied | Renter-occupied |
| 1 Room | 0 (0.0%) | 0 (0.0%) |
| 2 or 3 Rooms | 20 (0.7%) | 16 (16.2%) |
| 4 or 5 Rooms | 486 (17.9%) | 29 (29.3%) |
| 6 or 7 Rooms | 968 (35.6%) | 35 (35.3%) |
| 8 or more Rooms | 1,246 (45.8%) | 19 (19.2%) |
| Total | 2,720 (100.0%) | 99 (100.0%) |
Housing Structure by Heating Type in Pecan Plantation
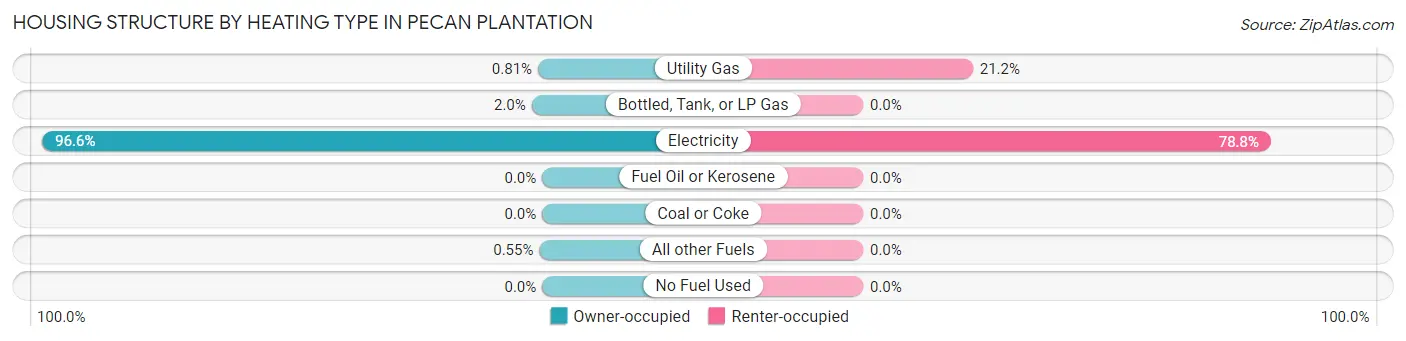
| Heating Type | Owner-occupied | Renter-occupied |
| Utility Gas | 22 (0.8%) | 21 (21.2%) |
| Bottled, Tank, or LP Gas | 55 (2.0%) | 0 (0.0%) |
| Electricity | 2,628 (96.6%) | 78 (78.8%) |
| Fuel Oil or Kerosene | 0 (0.0%) | 0 (0.0%) |
| Coal or Coke | 0 (0.0%) | 0 (0.0%) |
| All other Fuels | 15 (0.5%) | 0 (0.0%) |
| No Fuel Used | 0 (0.0%) | 0 (0.0%) |
| Total | 2,720 (100.0%) | 99 (100.0%) |
Household Vehicle Usage in Pecan Plantation
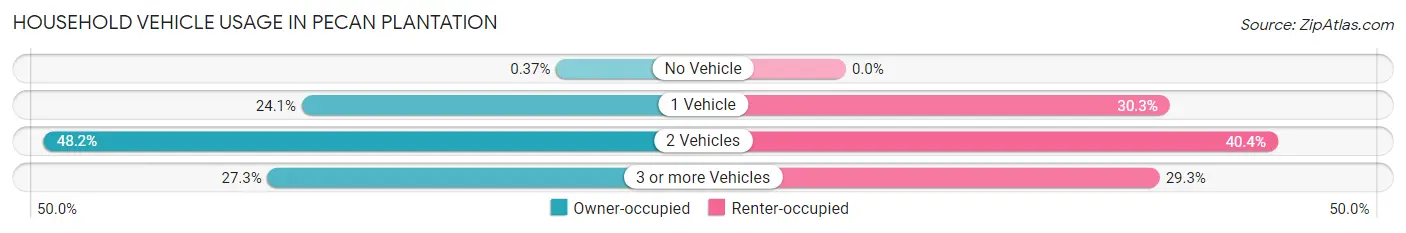
| Vehicles per Household | Owner-occupied | Renter-occupied |
| No Vehicle | 10 (0.4%) | 0 (0.0%) |
| 1 Vehicle | 656 (24.1%) | 30 (30.3%) |
| 2 Vehicles | 1,311 (48.2%) | 40 (40.4%) |
| 3 or more Vehicles | 743 (27.3%) | 29 (29.3%) |
| Total | 2,720 (100.0%) | 99 (100.0%) |
Real Estate & Mortgages in Pecan Plantation
Real Estate and Mortgage Overview in Pecan Plantation
| Characteristic | Without Mortgage | With Mortgage |
| Housing Units | 1,204 | 1,516 |
| Median Property Value | $363,300 | $330,600 |
| Median Household Income | $89,742 | $634 |
| Monthly Housing Costs | $733 | $196 |
| Real Estate Taxes | $3,052 | $20 |
Property Value by Mortgage Status in Pecan Plantation
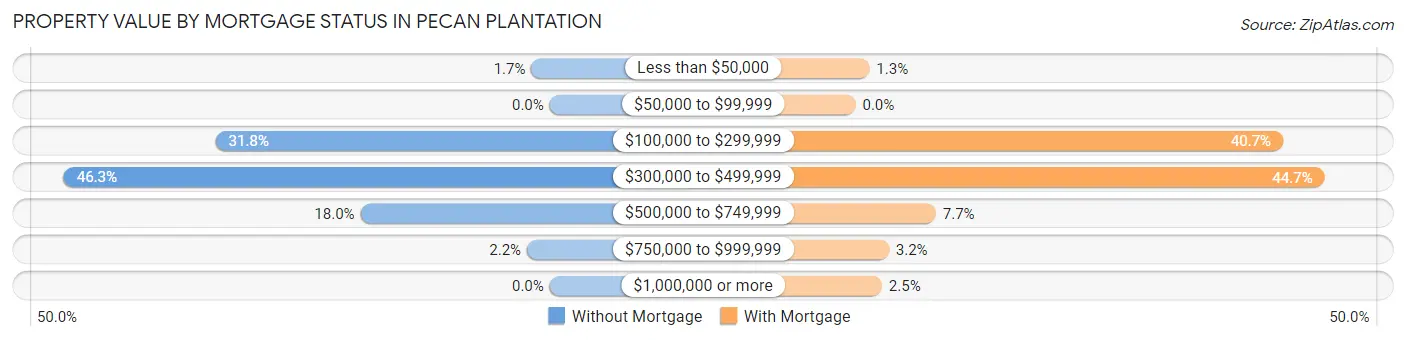
| Property Value | Without Mortgage | With Mortgage |
| Less than $50,000 | 21 (1.7%) | 20 (1.3%) |
| $50,000 to $99,999 | 0 (0.0%) | 0 (0.0%) |
| $100,000 to $299,999 | 383 (31.8%) | 617 (40.7%) |
| $300,000 to $499,999 | 557 (46.3%) | 677 (44.7%) |
| $500,000 to $749,999 | 217 (18.0%) | 116 (7.6%) |
| $750,000 to $999,999 | 26 (2.2%) | 48 (3.2%) |
| $1,000,000 or more | 0 (0.0%) | 38 (2.5%) |
| Total | 1,204 (100.0%) | 1,516 (100.0%) |
Household Income by Mortgage Status in Pecan Plantation
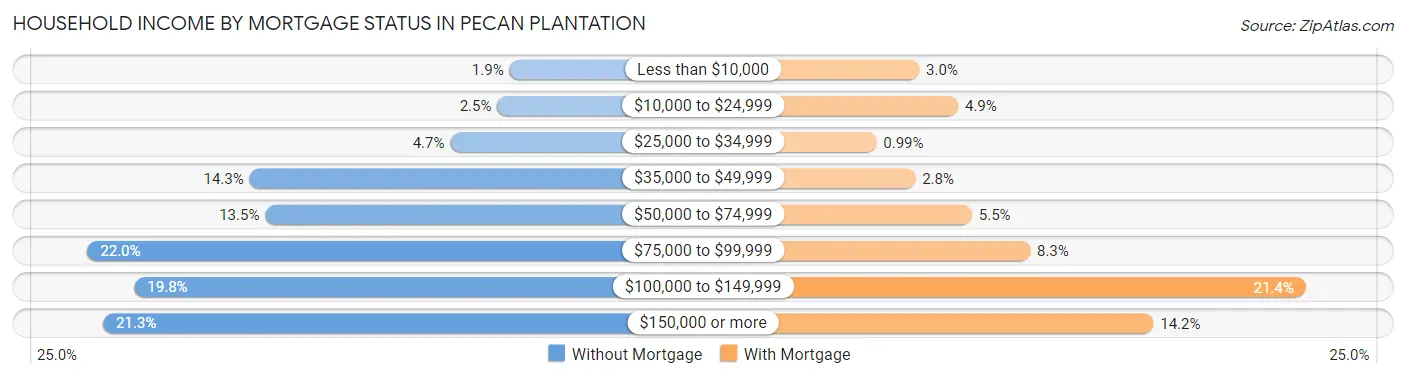
| Household Income | Without Mortgage | With Mortgage |
| Less than $10,000 | 23 (1.9%) | 46 (3.0%) |
| $10,000 to $24,999 | 30 (2.5%) | 74 (4.9%) |
| $25,000 to $34,999 | 57 (4.7%) | 15 (1.0%) |
| $35,000 to $49,999 | 172 (14.3%) | 43 (2.8%) |
| $50,000 to $74,999 | 163 (13.5%) | 84 (5.5%) |
| $75,000 to $99,999 | 265 (22.0%) | 126 (8.3%) |
| $100,000 to $149,999 | 238 (19.8%) | 325 (21.4%) |
| $150,000 or more | 256 (21.3%) | 215 (14.2%) |
| Total | 1,204 (100.0%) | 1,516 (100.0%) |
Property Value to Household Income Ratio in Pecan Plantation
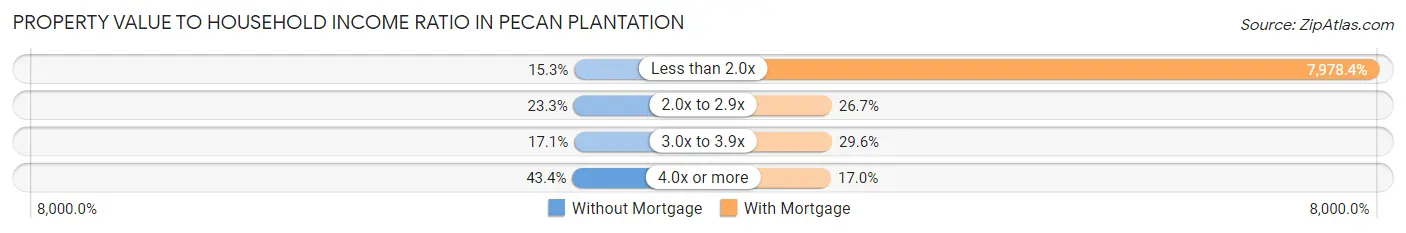
| Value-to-Income Ratio | Without Mortgage | With Mortgage |
| Less than 2.0x | 184 (15.3%) | 120,952 (7,978.4%) |
| 2.0x to 2.9x | 281 (23.3%) | 405 (26.7%) |
| 3.0x to 3.9x | 206 (17.1%) | 449 (29.6%) |
| 4.0x or more | 522 (43.4%) | 257 (17.0%) |
| Total | 1,204 (100.0%) | 1,516 (100.0%) |
Real Estate Taxes by Mortgage Status in Pecan Plantation
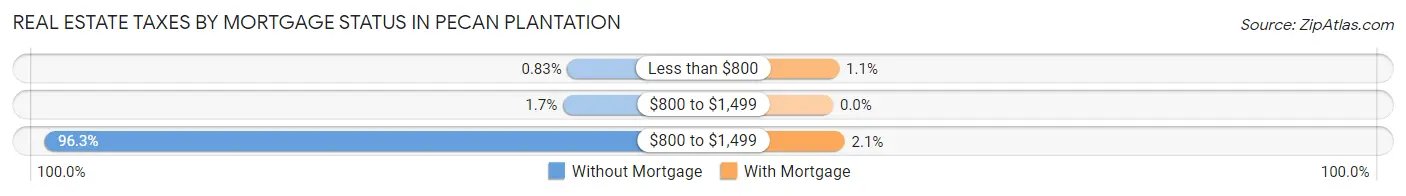
| Property Taxes | Without Mortgage | With Mortgage |
| Less than $800 | 10 (0.8%) | 17 (1.1%) |
| $800 to $1,499 | 20 (1.7%) | 0 (0.0%) |
| $800 to $1,499 | 1,159 (96.3%) | 32 (2.1%) |
| Total | 1,204 (100.0%) | 1,516 (100.0%) |
Health & Disability in Pecan Plantation
Health Insurance Coverage by Age in Pecan Plantation
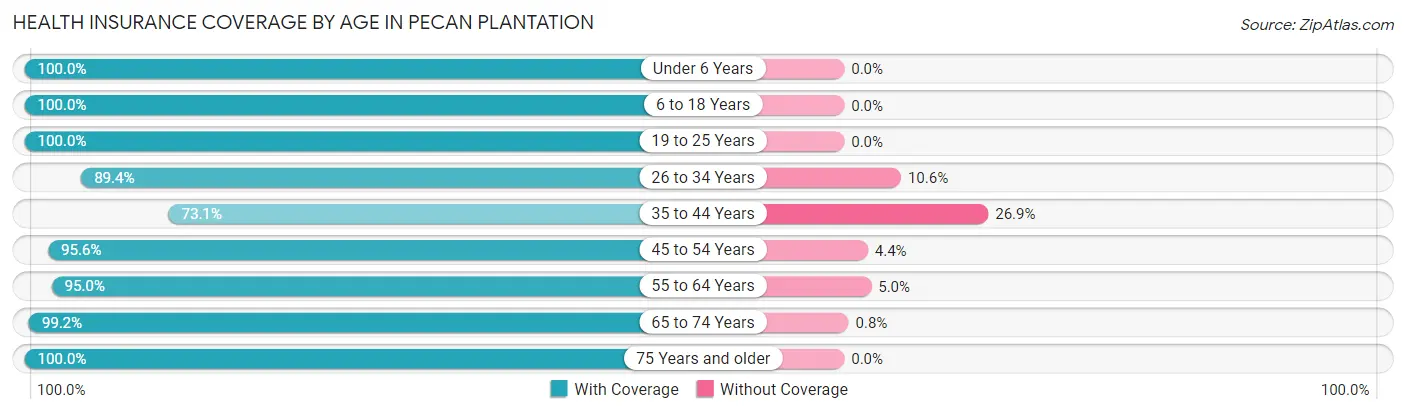
| Age Bracket | With Coverage | Without Coverage |
| Under 6 Years | 348 (100.0%) | 0 (0.0%) |
| 6 to 18 Years | 474 (100.0%) | 0 (0.0%) |
| 19 to 25 Years | 127 (100.0%) | 0 (0.0%) |
| 26 to 34 Years | 296 (89.4%) | 35 (10.6%) |
| 35 to 44 Years | 384 (73.1%) | 141 (26.9%) |
| 45 to 54 Years | 544 (95.6%) | 25 (4.4%) |
| 55 to 64 Years | 1,266 (95.0%) | 67 (5.0%) |
| 65 to 74 Years | 1,608 (99.2%) | 13 (0.8%) |
| 75 Years and older | 1,336 (100.0%) | 0 (0.0%) |
| Total | 6,383 (95.8%) | 281 (4.2%) |
Health Insurance Coverage by Citizenship Status in Pecan Plantation
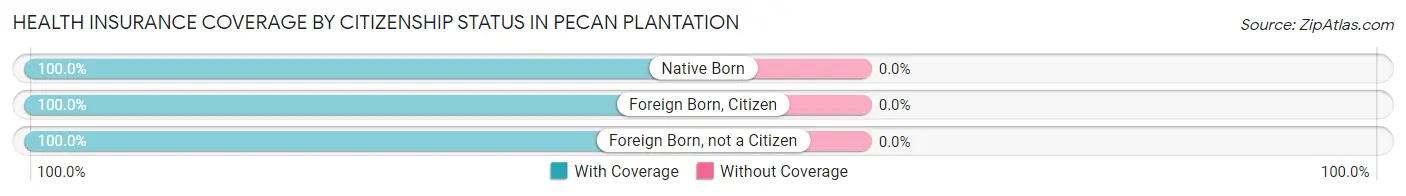
| Citizenship Status | With Coverage | Without Coverage |
| Native Born | 348 (100.0%) | 0 (0.0%) |
| Foreign Born, Citizen | 474 (100.0%) | 0 (0.0%) |
| Foreign Born, not a Citizen | 127 (100.0%) | 0 (0.0%) |
Health Insurance Coverage by Household Income in Pecan Plantation
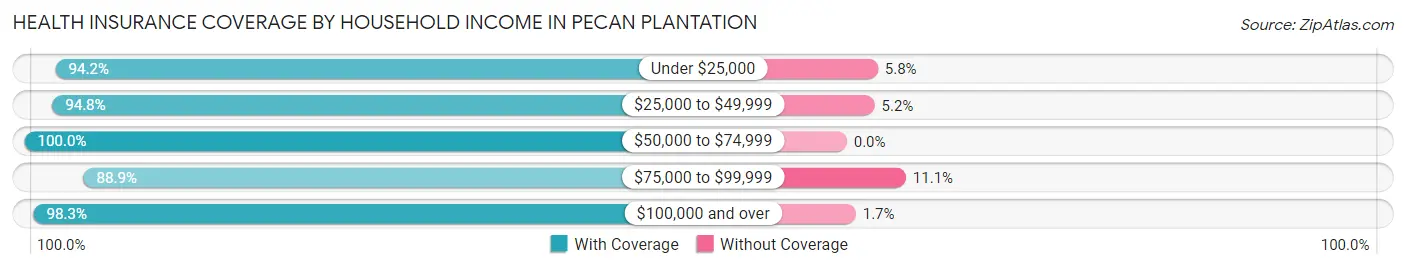
| Household Income | With Coverage | Without Coverage |
| Under $25,000 | 178 (94.2%) | 11 (5.8%) |
| $25,000 to $49,999 | 528 (94.8%) | 29 (5.2%) |
| $50,000 to $74,999 | 516 (100.0%) | 0 (0.0%) |
| $75,000 to $99,999 | 1,422 (88.9%) | 177 (11.1%) |
| $100,000 and over | 3,739 (98.3%) | 64 (1.7%) |
Public vs Private Health Insurance Coverage by Age in Pecan Plantation
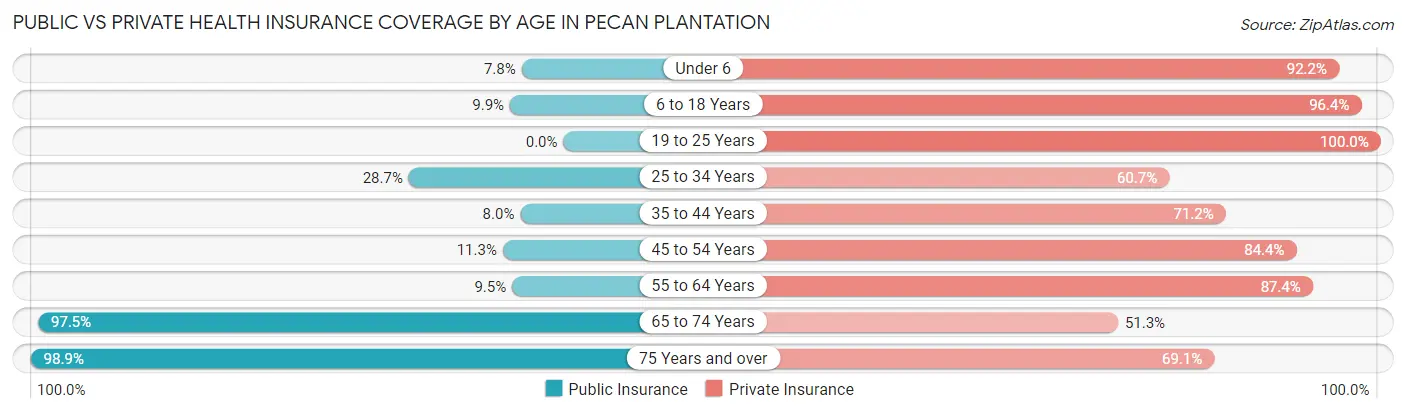
| Age Bracket | Public Insurance | Private Insurance |
| Under 6 | 27 (7.8%) | 321 (92.2%) |
| 6 to 18 Years | 47 (9.9%) | 457 (96.4%) |
| 19 to 25 Years | 0 (0.0%) | 127 (100.0%) |
| 25 to 34 Years | 95 (28.7%) | 201 (60.7%) |
| 35 to 44 Years | 42 (8.0%) | 374 (71.2%) |
| 45 to 54 Years | 64 (11.3%) | 480 (84.4%) |
| 55 to 64 Years | 127 (9.5%) | 1,165 (87.4%) |
| 65 to 74 Years | 1,581 (97.5%) | 831 (51.3%) |
| 75 Years and over | 1,321 (98.9%) | 923 (69.1%) |
| Total | 3,304 (49.6%) | 4,879 (73.2%) |
Disability Status by Sex by Age in Pecan Plantation
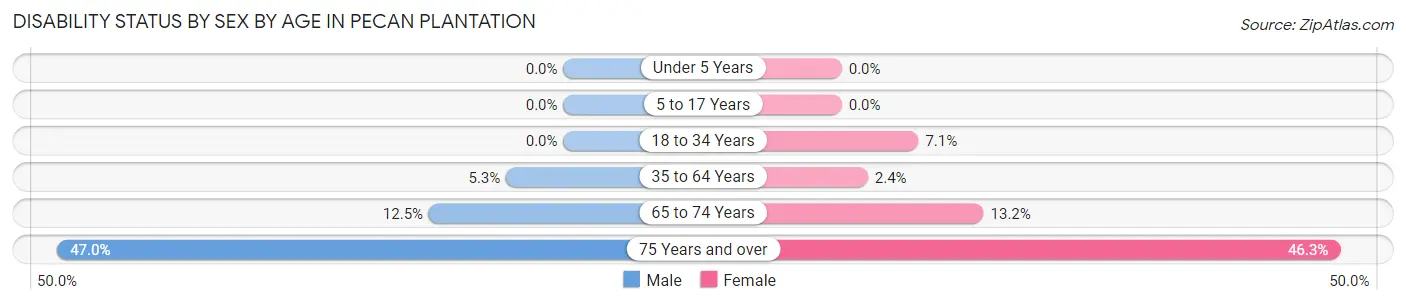
| Age Bracket | Male | Female |
| Under 5 Years | 0 (0.0%) | 0 (0.0%) |
| 5 to 17 Years | 0 (0.0%) | 0 (0.0%) |
| 18 to 34 Years | 0 (0.0%) | 24 (7.1%) |
| 35 to 64 Years | 63 (5.3%) | 30 (2.4%) |
| 65 to 74 Years | 98 (12.5%) | 110 (13.2%) |
| 75 Years and over | 333 (47.0%) | 290 (46.3%) |
Disability Class by Sex by Age in Pecan Plantation
Disability Class: Hearing Difficulty
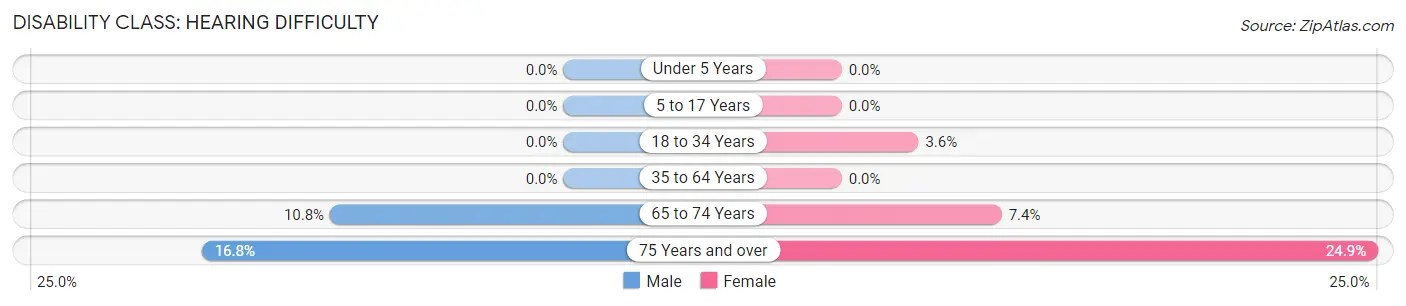
| Age Bracket | Male | Female |
| Under 5 Years | 0 (0.0%) | 0 (0.0%) |
| 5 to 17 Years | 0 (0.0%) | 0 (0.0%) |
| 18 to 34 Years | 0 (0.0%) | 12 (3.6%) |
| 35 to 64 Years | 0 (0.0%) | 0 (0.0%) |
| 65 to 74 Years | 85 (10.8%) | 62 (7.4%) |
| 75 Years and over | 119 (16.8%) | 156 (24.9%) |
Disability Class: Vision Difficulty
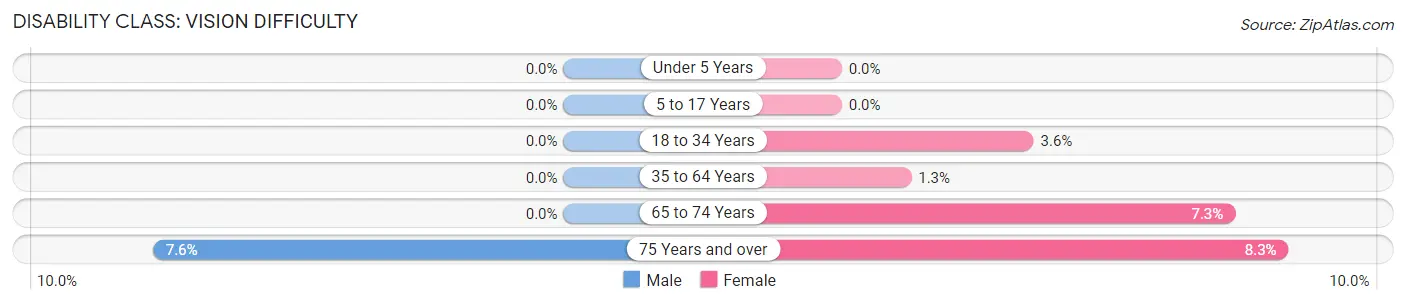
| Age Bracket | Male | Female |
| Under 5 Years | 0 (0.0%) | 0 (0.0%) |
| 5 to 17 Years | 0 (0.0%) | 0 (0.0%) |
| 18 to 34 Years | 0 (0.0%) | 12 (3.6%) |
| 35 to 64 Years | 0 (0.0%) | 16 (1.3%) |
| 65 to 74 Years | 0 (0.0%) | 61 (7.3%) |
| 75 Years and over | 54 (7.6%) | 52 (8.3%) |
Disability Class: Cognitive Difficulty
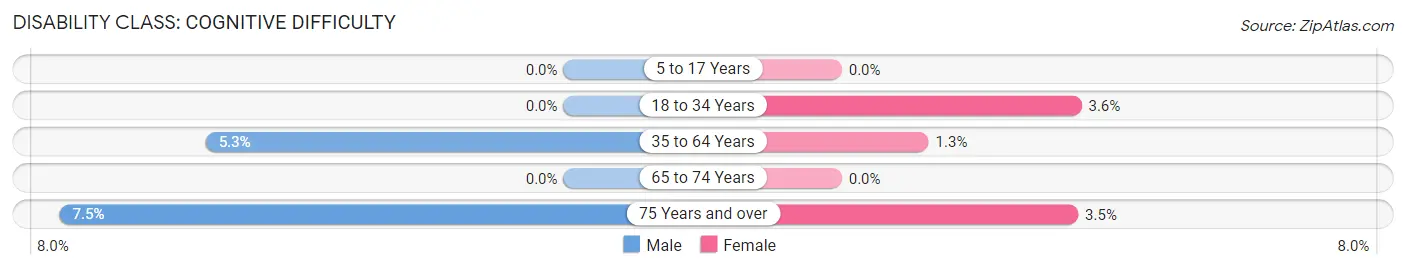
| Age Bracket | Male | Female |
| 5 to 17 Years | 0 (0.0%) | 0 (0.0%) |
| 18 to 34 Years | 0 (0.0%) | 12 (3.6%) |
| 35 to 64 Years | 63 (5.3%) | 16 (1.3%) |
| 65 to 74 Years | 0 (0.0%) | 0 (0.0%) |
| 75 Years and over | 53 (7.5%) | 22 (3.5%) |
Disability Class: Ambulatory Difficulty
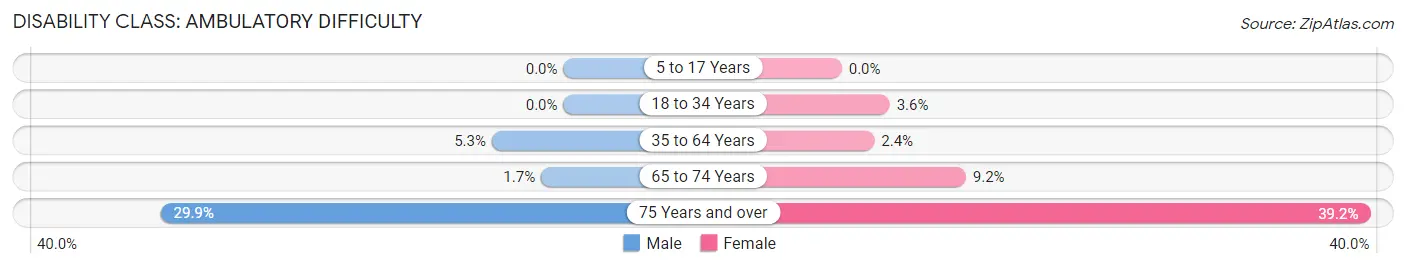
| Age Bracket | Male | Female |
| 5 to 17 Years | 0 (0.0%) | 0 (0.0%) |
| 18 to 34 Years | 0 (0.0%) | 12 (3.6%) |
| 35 to 64 Years | 63 (5.3%) | 30 (2.4%) |
| 65 to 74 Years | 13 (1.7%) | 77 (9.2%) |
| 75 Years and over | 212 (29.9%) | 246 (39.2%) |
Disability Class: Self-Care Difficulty
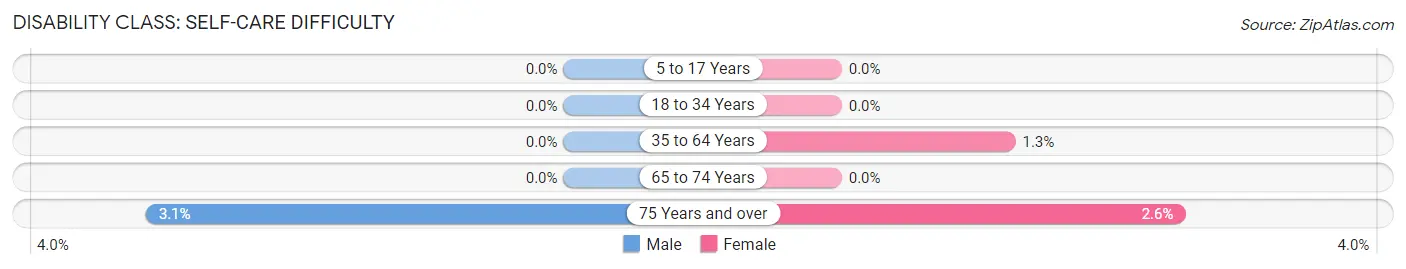
| Age Bracket | Male | Female |
| 5 to 17 Years | 0 (0.0%) | 0 (0.0%) |
| 18 to 34 Years | 0 (0.0%) | 0 (0.0%) |
| 35 to 64 Years | 0 (0.0%) | 16 (1.3%) |
| 65 to 74 Years | 0 (0.0%) | 0 (0.0%) |
| 75 Years and over | 22 (3.1%) | 16 (2.5%) |
Technology Access in Pecan Plantation
Computing Device Access in Pecan Plantation
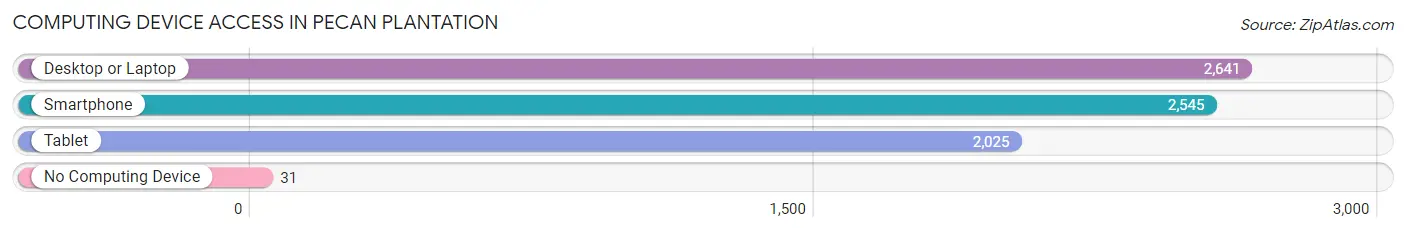
| Device Type | # Households | % Households |
| Desktop or Laptop | 2,641 | 93.7% |
| Smartphone | 2,545 | 90.3% |
| Tablet | 2,025 | 71.8% |
| No Computing Device | 31 | 1.1% |
| Total | 2,819 | 100.0% |
Internet Access in Pecan Plantation
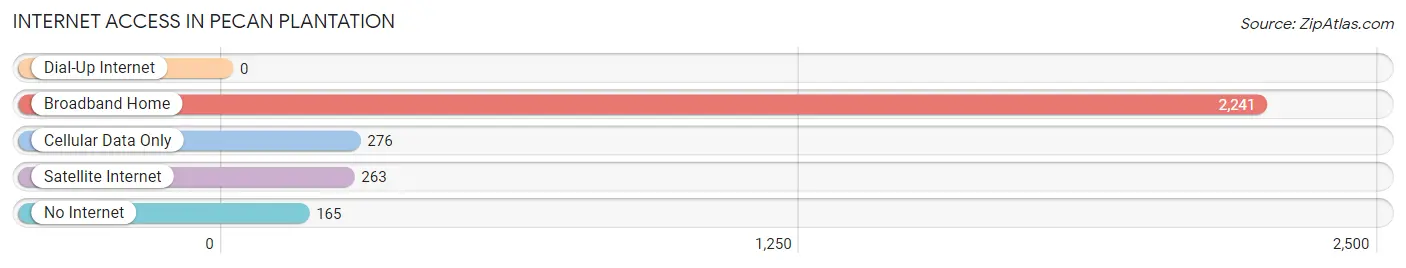
| Internet Type | # Households | % Households |
| Dial-Up Internet | 0 | 0.0% |
| Broadband Home | 2,241 | 79.5% |
| Cellular Data Only | 276 | 9.8% |
| Satellite Internet | 263 | 9.3% |
| No Internet | 165 | 5.9% |
| Total | 2,819 | 100.0% |
Pecan Plantation Summary
Pecan Plantation is a census-designated place (CDP) located in Hood County, Texas, United States. It is situated on the Brazos River, about 25 miles southwest of Fort Worth. The population was 2,945 at the 2010 census.
History
Pecan Plantation was founded in the late 1800s by a group of settlers from the nearby town of Granbury. The settlers were looking for a place to grow pecans, and the area around the Brazos River was ideal for the purpose. The settlers named the area Pecan Plantation, and the name has stuck ever since.
The first settlers in Pecan Plantation were mostly farmers, but the area soon became a popular destination for hunters and fishermen. The area was also known for its excellent pecan crop, and the town became known as the “Pecan Capital of Texas.”
In the early 1900s, the town began to grow and develop. The first school was built in 1910, and the first post office opened in 1911. The town was incorporated in 1912, and the first mayor was elected in 1913.
In the 1920s, the town began to attract more visitors, and the population began to grow. The town was home to several businesses, including a hotel, a bank, a movie theater, and a variety of stores.
In the 1950s, the town began to experience a decline in population. Many of the businesses closed, and the town began to lose its charm. However, in the late 1970s, the town began to experience a resurgence. The population began to grow again, and the town began to attract new businesses.
Geography
Pecan Plantation is located in Hood County, Texas, about 25 miles southwest of Fort Worth. The town is situated on the Brazos River, and is surrounded by rolling hills and wooded areas. The town is located in the Central Time Zone, and the elevation is 745 feet.
The climate in Pecan Plantation is mild and humid. The average temperature in the summer is around 90 degrees Fahrenheit, and the average temperature in the winter is around 50 degrees Fahrenheit. The average annual precipitation is around 40 inches.
Economy
The economy of Pecan Plantation is largely based on agriculture. The town is home to several farms, and the main crops grown in the area are pecans, cotton, corn, and hay. The town is also home to several businesses, including a hotel, a bank, a movie theater, and a variety of stores.
Demographics
As of the 2010 census, the population of Pecan Plantation was 2,945. The racial makeup of the town was 94.3% White, 0.7% African American, 0.2% Native American, 0.2% Asian, 0.1% Pacific Islander, 3.2% from other races, and 1.5% from two or more races. Hispanic or Latino of any race were 6.3% of the population.
The median income for a household in Pecan Plantation was $45,938, and the median income for a family was $50,938. The per capita income for the town was $20,938. About 8.3% of families and 10.2% of the population were below the poverty line, including 14.2% of those under age 18 and 8.3% of those age 65 or over.
Common Questions
What is Per Capita Income in Pecan Plantation?
Per Capita income in Pecan Plantation is $54,985.
What is the Median Family Income in Pecan Plantation?
Median Family Income in Pecan Plantation is $114,567.
What is the Median Household income in Pecan Plantation?
Median Household Income in Pecan Plantation is $97,100.
What is Income or Wage Gap in Pecan Plantation?
Income or Wage Gap in Pecan Plantation is 23.9%.
Women in Pecan Plantation earn 76.1 cents for every dollar earned by a man.
What is Family Income Deficit in Pecan Plantation?
Family Income Deficit in Pecan Plantation is $14,751.
Families that are below poverty line in Pecan Plantation earn $14,751 less on average than the poverty threshold level.
What is Inequality or Gini Index in Pecan Plantation?
Inequality or Gini Index in Pecan Plantation is 0.37.
What is the Total Population of Pecan Plantation?
Total Population of Pecan Plantation is 6,664.
What is the Total Male Population of Pecan Plantation?
Total Male Population of Pecan Plantation is 3,034.
What is the Total Female Population of Pecan Plantation?
Total Female Population of Pecan Plantation is 3,630.
What is the Ratio of Males per 100 Females in Pecan Plantation?
There are 83.58 Males per 100 Females in Pecan Plantation.
What is the Ratio of Females per 100 Males in Pecan Plantation?
There are 119.64 Females per 100 Males in Pecan Plantation.
What is the Median Population Age in Pecan Plantation?
Median Population Age in Pecan Plantation is 61.8 Years.
What is the Average Family Size in Pecan Plantation
Average Family Size in Pecan Plantation is 2.6 People.
What is the Average Household Size in Pecan Plantation
Average Household Size in Pecan Plantation is 2.4 People.
How Large is the Labor Force in Pecan Plantation?
There are 2,512 People in the Labor Forcein in Pecan Plantation.
What is the Percentage of People in the Labor Force in Pecan Plantation?
42.3% of People are in the Labor Force in Pecan Plantation.
What is the Unemployment Rate in Pecan Plantation?
Unemployment Rate in Pecan Plantation is 18.2%.