Highland Acres, DE Map & Demographics
Highland Acres Map
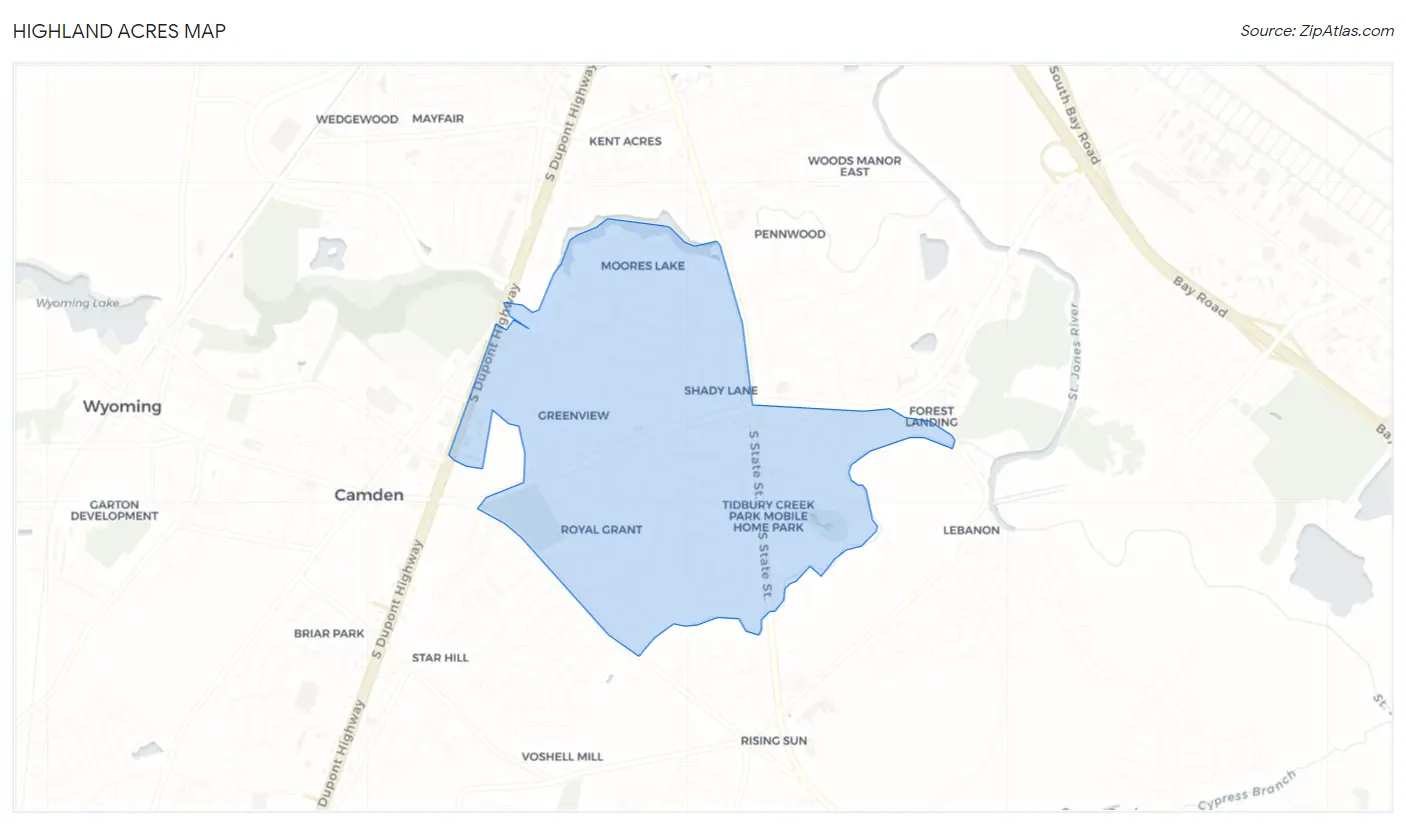
Highland Acres Overview
$44,615
PER CAPITA INCOME
$115,500
AVG FAMILY INCOME
$104,762
AVG HOUSEHOLD INCOME
9.1%
WAGE / INCOME GAP [ % ]
90.9¢/ $1
WAGE / INCOME GAP [ $ ]
0.36
INEQUALITY / GINI INDEX
3,892
TOTAL POPULATION
2,020
MALE POPULATION
1,872
FEMALE POPULATION
107.91
MALES / 100 FEMALES
92.67
FEMALES / 100 MALES
45.5
MEDIAN AGE
3.1
AVG FAMILY SIZE
2.9
AVG HOUSEHOLD SIZE
1,814
LABOR FORCE [ PEOPLE ]
53.8%
PERCENT IN LABOR FORCE
3.0%
UNEMPLOYMENT RATE
Income in Highland Acres
Income Overview in Highland Acres
Per Capita Income in Highland Acres is $44,615, while median incomes of families and households are $115,500 and $104,762 respectively.
| Characteristic | Number | Measure |
| Per Capita Income | 3,892 | $44,615 |
| Median Family Income | 1,106 | $115,500 |
| Mean Family Income | 1,106 | $123,701 |
| Median Household Income | 1,360 | $104,762 |
| Mean Household Income | 1,360 | $123,608 |
| Income Deficit | 1,106 | $0 |
| Wage / Income Gap (%) | 3,892 | 9.14% |
| Wage / Income Gap ($) | 3,892 | 90.86¢ per $1 |
| Gini / Inequality Index | 3,892 | 0.36 |
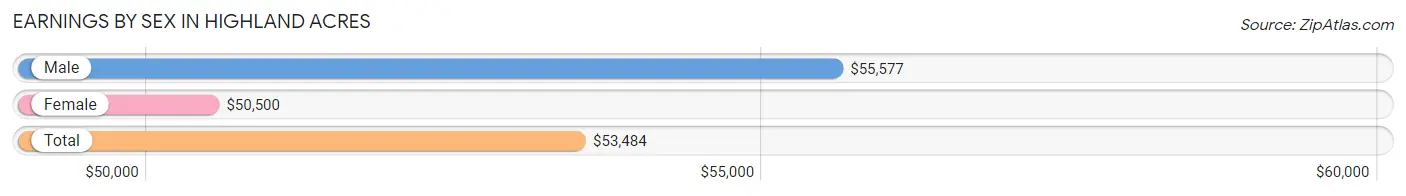
Earnings by Sex in Highland Acres
Average Earnings in Highland Acres are $53,484, $55,577 for men and $50,500 for women, a difference of 9.1%.
| Sex | Number | Average Earnings |
| Male | 1,034 (54.0%) | $55,577 |
| Female | 882 (46.0%) | $50,500 |
| Total | 1,916 (100.0%) | $53,484 |
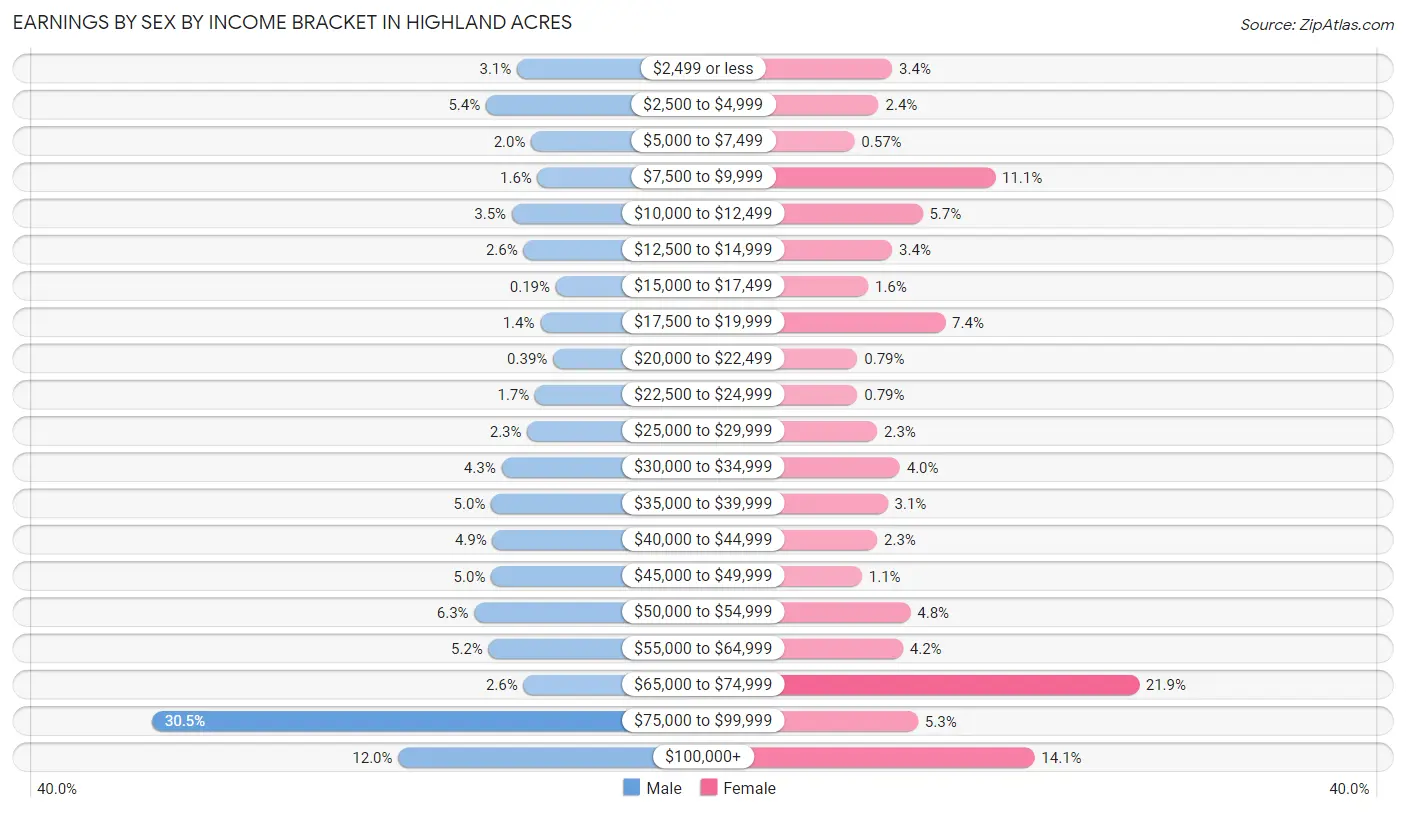
Earnings by Sex by Income Bracket in Highland Acres
The most common earnings brackets in Highland Acres are $75,000 to $99,999 for men (315 | 30.5%) and $65,000 to $74,999 for women (193 | 21.9%).
| Income | Male | Female |
| $2,499 or less | 32 (3.1%) | 30 (3.4%) |
| $2,500 to $4,999 | 56 (5.4%) | 21 (2.4%) |
| $5,000 to $7,499 | 21 (2.0%) | 5 (0.6%) |
| $7,500 to $9,999 | 16 (1.5%) | 98 (11.1%) |
| $10,000 to $12,499 | 36 (3.5%) | 50 (5.7%) |
| $12,500 to $14,999 | 27 (2.6%) | 30 (3.4%) |
| $15,000 to $17,499 | 2 (0.2%) | 14 (1.6%) |
| $17,500 to $19,999 | 14 (1.3%) | 65 (7.4%) |
| $20,000 to $22,499 | 4 (0.4%) | 7 (0.8%) |
| $22,500 to $24,999 | 18 (1.7%) | 7 (0.8%) |
| $25,000 to $29,999 | 24 (2.3%) | 20 (2.3%) |
| $30,000 to $34,999 | 44 (4.3%) | 35 (4.0%) |
| $35,000 to $39,999 | 52 (5.0%) | 27 (3.1%) |
| $40,000 to $44,999 | 51 (4.9%) | 20 (2.3%) |
| $45,000 to $49,999 | 52 (5.0%) | 10 (1.1%) |
| $50,000 to $54,999 | 65 (6.3%) | 42 (4.8%) |
| $55,000 to $64,999 | 54 (5.2%) | 37 (4.2%) |
| $65,000 to $74,999 | 27 (2.6%) | 193 (21.9%) |
| $75,000 to $99,999 | 315 (30.5%) | 47 (5.3%) |
| $100,000+ | 124 (12.0%) | 124 (14.1%) |
| Total | 1,034 (100.0%) | 882 (100.0%) |
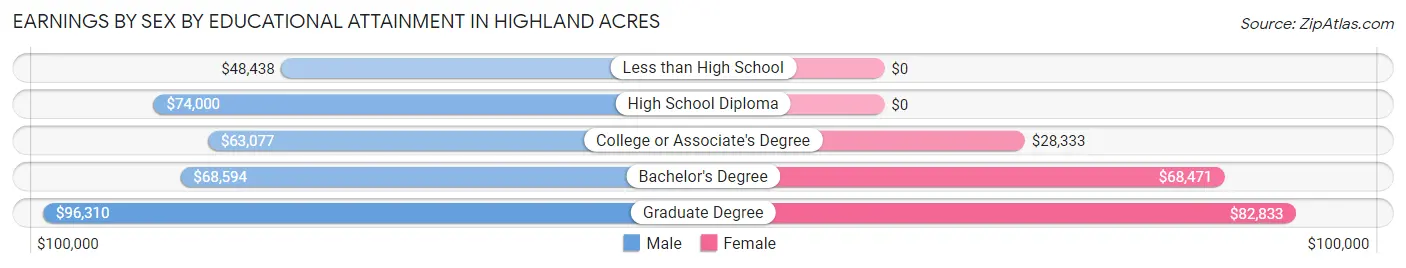
Earnings by Sex by Educational Attainment in Highland Acres
Average earnings in Highland Acres are $69,844 for men and $63,214 for women, a difference of 9.5%. Men with an educational attainment of graduate degree enjoy the highest average annual earnings of $96,310, while those with less than high school education earn the least with $48,438. Women with an educational attainment of graduate degree earn the most with the average annual earnings of $82,833, while those with college or associate's degree education have the smallest earnings of $28,333.
| Educational Attainment | Male Income | Female Income |
| Less than High School | $48,438 | $0 |
| High School Diploma | $74,000 | $0 |
| College or Associate's Degree | $63,077 | $28,333 |
| Bachelor's Degree | $68,594 | $68,471 |
| Graduate Degree | $96,310 | $82,833 |
| Total | $69,844 | $63,214 |
Family Income in Highland Acres
Family Income Brackets in Highland Acres
According to the Highland Acres family income data, there are 330 families falling into the $150,000 to $199,999 income range, which is the most common income bracket and makes up 29.8% of all families. Conversely, the $15,000 to $24,999 income bracket is the least frequent group with only 6 families (0.5%) belonging to this category.
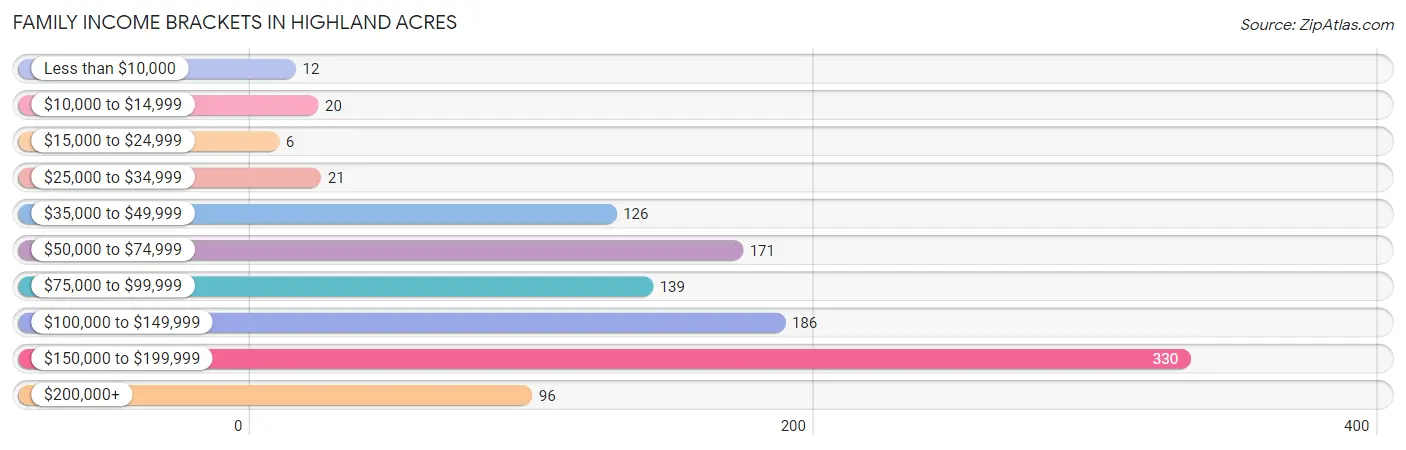
| Income Bracket | # Families | % Families |
| Less than $10,000 | 12 | 1.1% |
| $10,000 to $14,999 | 20 | 1.8% |
| $15,000 to $24,999 | 6 | 0.5% |
| $25,000 to $34,999 | 21 | 1.9% |
| $35,000 to $49,999 | 126 | 11.4% |
| $50,000 to $74,999 | 171 | 15.5% |
| $75,000 to $99,999 | 139 | 12.6% |
| $100,000 to $149,999 | 186 | 16.8% |
| $150,000 to $199,999 | 330 | 29.8% |
| $200,000+ | 96 | 8.7% |
Family Income by Famaliy Size in Highland Acres
4-person families (303 | 27.4%) account for the highest median family income in Highland Acres with $155,790 per family, while 2-person families (579 | 52.3%) have the highest median income of $51,193 per family member.
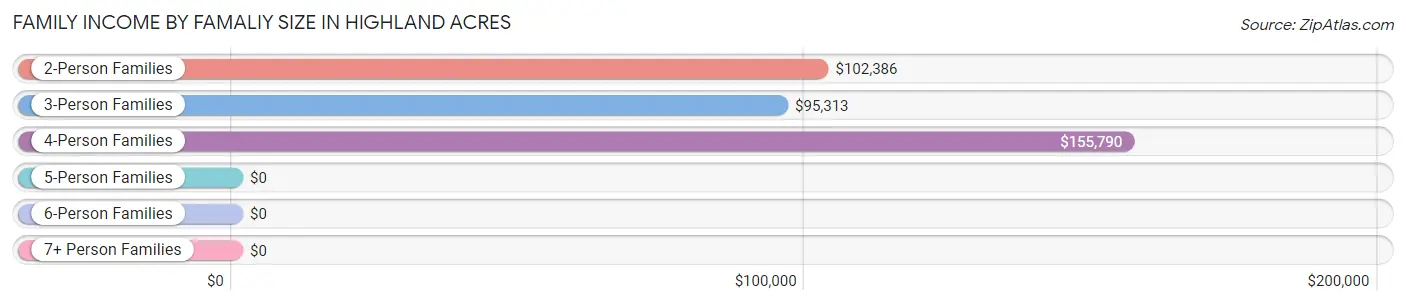
| Income Bracket | # Families | Median Income |
| 2-Person Families | 579 (52.3%) | $102,386 |
| 3-Person Families | 201 (18.2%) | $95,313 |
| 4-Person Families | 303 (27.4%) | $155,790 |
| 5-Person Families | 10 (0.9%) | $0 |
| 6-Person Families | 7 (0.6%) | $0 |
| 7+ Person Families | 6 (0.5%) | $0 |
| Total | 1,106 (100.0%) | $115,500 |
Family Income by Number of Earners in Highland Acres
The median family income in Highland Acres is $115,500, with families comprising 2 earners (386) having the highest median family income of $155,816, while families with 1 earner (256) have the lowest median family income of $70,278, accounting for 34.9% and 23.2% of families, respectively.
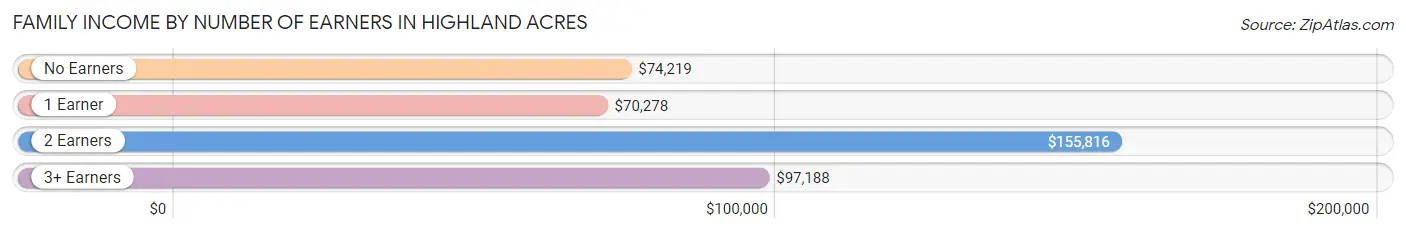
| Number of Earners | # Families | Median Income |
| No Earners | 319 (28.8%) | $74,219 |
| 1 Earner | 256 (23.2%) | $70,278 |
| 2 Earners | 386 (34.9%) | $155,816 |
| 3+ Earners | 145 (13.1%) | $97,188 |
| Total | 1,106 (100.0%) | $115,500 |
Household Income in Highland Acres
Household Income Brackets in Highland Acres
With 351 households falling in the category, the $150,000 to $199,999 income range is the most frequent in Highland Acres, accounting for 25.8% of all households. In contrast, only 14 households (1.0%) fall into the $15,000 to $24,999 income bracket, making it the least populous group.
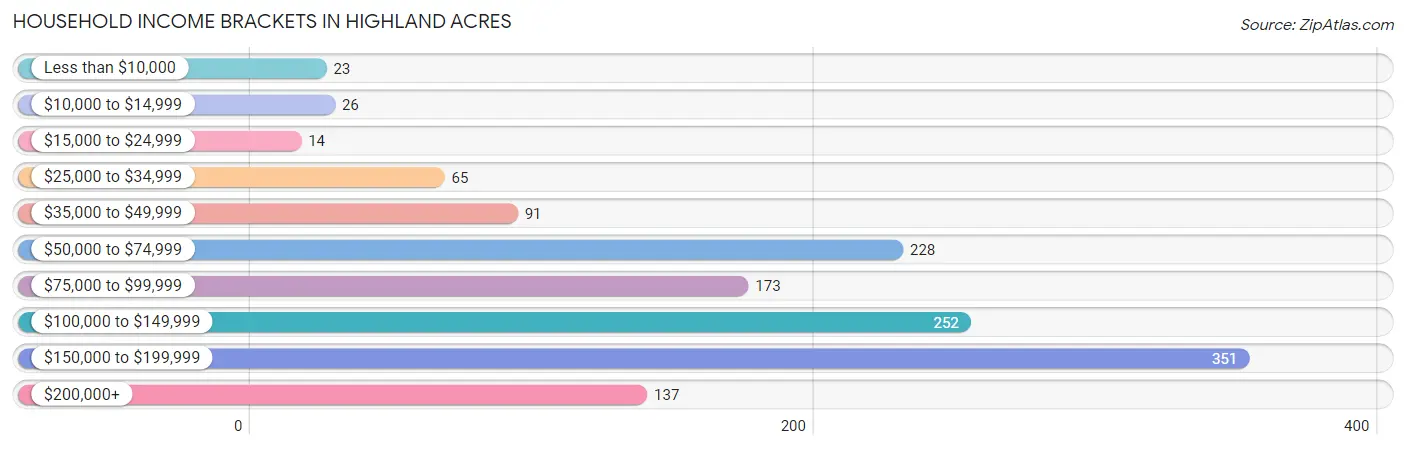
| Income Bracket | # Households | % Households |
| Less than $10,000 | 23 | 1.7% |
| $10,000 to $14,999 | 26 | 1.9% |
| $15,000 to $24,999 | 14 | 1.0% |
| $25,000 to $34,999 | 65 | 4.8% |
| $35,000 to $49,999 | 91 | 6.7% |
| $50,000 to $74,999 | 228 | 16.8% |
| $75,000 to $99,999 | 173 | 12.7% |
| $100,000 to $149,999 | 252 | 18.5% |
| $150,000 to $199,999 | 351 | 25.8% |
| $200,000+ | 137 | 10.1% |
Household Income by Householder Age in Highland Acres
The median household income in Highland Acres is $104,762, with the highest median household income of $155,660 found in the 25 to 44 years age bracket for the primary householder. A total of 328 households (24.1%) fall into this category. Meanwhile, the 15 to 24 years age bracket for the primary householder has the lowest median household income of $0, with 47 households (3.5%) in this group.
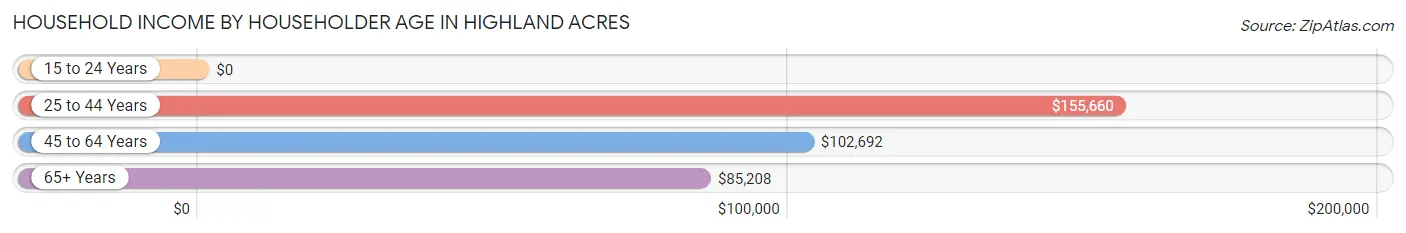
| Income Bracket | # Households | Median Income |
| 15 to 24 Years | 47 (3.5%) | $0 |
| 25 to 44 Years | 328 (24.1%) | $155,660 |
| 45 to 64 Years | 482 (35.4%) | $102,692 |
| 65+ Years | 503 (37.0%) | $85,208 |
| Total | 1,360 (100.0%) | $104,762 |
Poverty in Highland Acres
Income Below Poverty by Sex and Age in Highland Acres
With 2.5% poverty level for males and 8.9% for females among the residents of Highland Acres, 5 year old males and 25 to 34 year old females are the most vulnerable to poverty, with 17 males (65.4%) and 103 females (55.4%) in their respective age groups living below the poverty level.
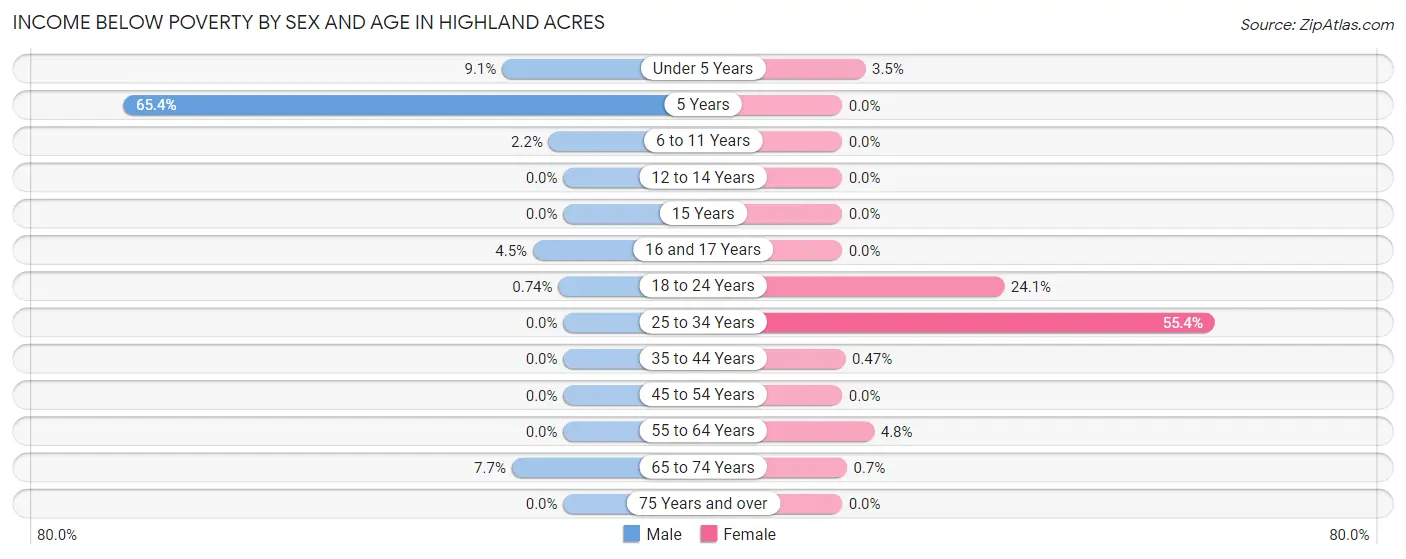
| Age Bracket | Male | Female |
| Under 5 Years | 3 (9.1%) | 1 (3.5%) |
| 5 Years | 17 (65.4%) | 0 (0.0%) |
| 6 to 11 Years | 6 (2.2%) | 0 (0.0%) |
| 12 to 14 Years | 0 (0.0%) | 0 (0.0%) |
| 15 Years | 0 (0.0%) | 0 (0.0%) |
| 16 and 17 Years | 7 (4.5%) | 0 (0.0%) |
| 18 to 24 Years | 1 (0.7%) | 39 (24.1%) |
| 25 to 34 Years | 0 (0.0%) | 103 (55.4%) |
| 35 to 44 Years | 0 (0.0%) | 1 (0.5%) |
| 45 to 54 Years | 0 (0.0%) | 0 (0.0%) |
| 55 to 64 Years | 0 (0.0%) | 20 (4.8%) |
| 65 to 74 Years | 16 (7.7%) | 2 (0.7%) |
| 75 Years and over | 0 (0.0%) | 0 (0.0%) |
| Total | 50 (2.5%) | 166 (8.9%) |
Income Above Poverty by Sex and Age in Highland Acres
According to the poverty statistics in Highland Acres, males aged 12 to 14 years and females aged 6 to 11 years are the age groups that are most secure financially, with 100.0% of males and 100.0% of females in these age groups living above the poverty line.
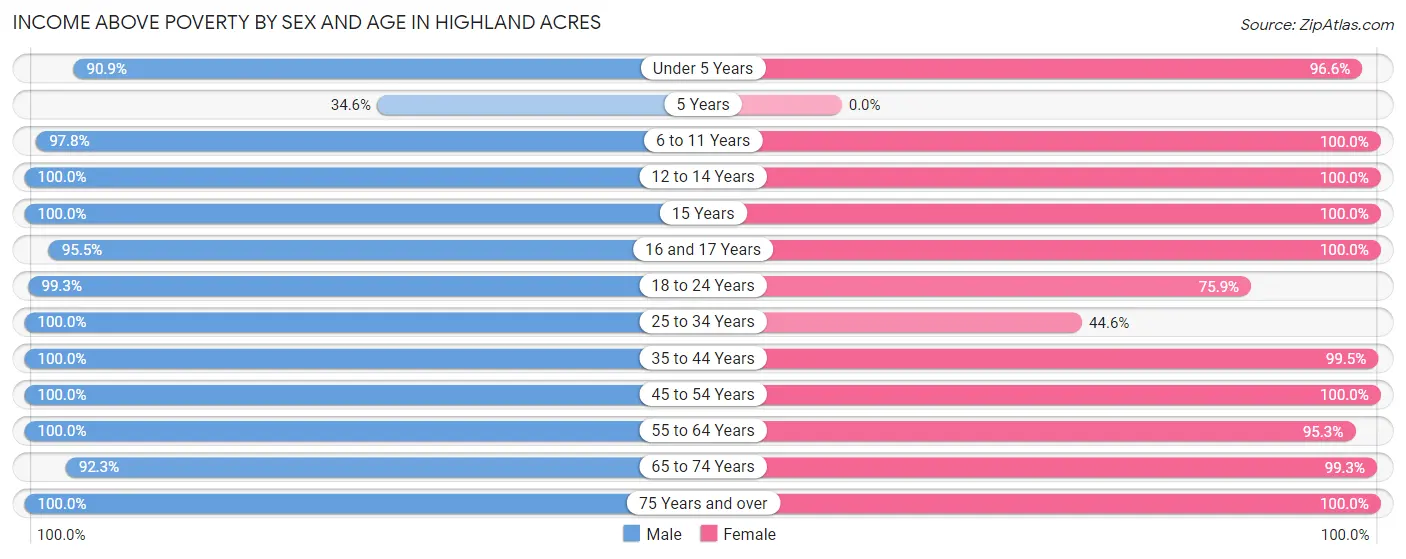
| Age Bracket | Male | Female |
| Under 5 Years | 30 (90.9%) | 28 (96.6%) |
| 5 Years | 9 (34.6%) | 0 (0.0%) |
| 6 to 11 Years | 271 (97.8%) | 103 (100.0%) |
| 12 to 14 Years | 25 (100.0%) | 14 (100.0%) |
| 15 Years | 6 (100.0%) | 8 (100.0%) |
| 16 and 17 Years | 148 (95.5%) | 202 (100.0%) |
| 18 to 24 Years | 134 (99.3%) | 123 (75.9%) |
| 25 to 34 Years | 245 (100.0%) | 83 (44.6%) |
| 35 to 44 Years | 111 (100.0%) | 210 (99.5%) |
| 45 to 54 Years | 275 (100.0%) | 99 (100.0%) |
| 55 to 64 Years | 382 (100.0%) | 401 (95.3%) |
| 65 to 74 Years | 193 (92.3%) | 284 (99.3%) |
| 75 Years and over | 141 (100.0%) | 151 (100.0%) |
| Total | 1,970 (97.5%) | 1,706 (91.1%) |
Income Below Poverty Among Married-Couple Families in Highland Acres
The poverty statistics for married-couple families in Highland Acres show that 0.6% or 5 of the total 880 families live below the poverty line. Families with 1 or 2 children have the highest poverty rate of 1.9%, comprising of 5 families. On the other hand, families with no children have the lowest poverty rate of 0.0%, which includes 0 families.
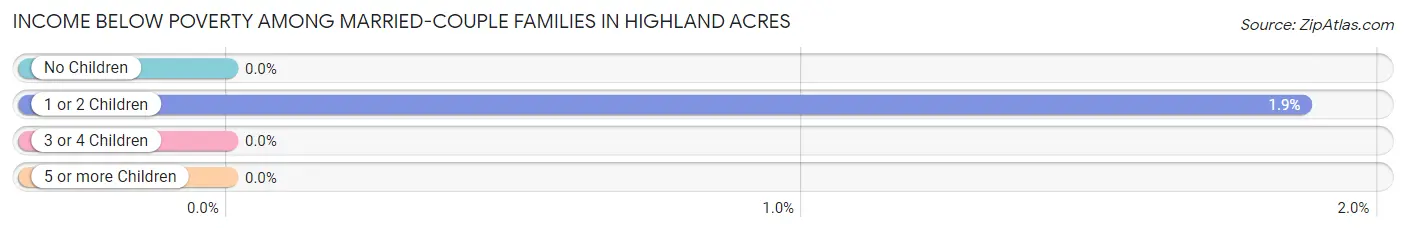
| Children | Above Poverty | Below Poverty |
| No Children | 589 (100.0%) | 0 (0.0%) |
| 1 or 2 Children | 263 (98.1%) | 5 (1.9%) |
| 3 or 4 Children | 17 (100.0%) | 0 (0.0%) |
| 5 or more Children | 6 (100.0%) | 0 (0.0%) |
| Total | 875 (99.4%) | 5 (0.6%) |
Income Below Poverty Among Single-Parent Households in Highland Acres
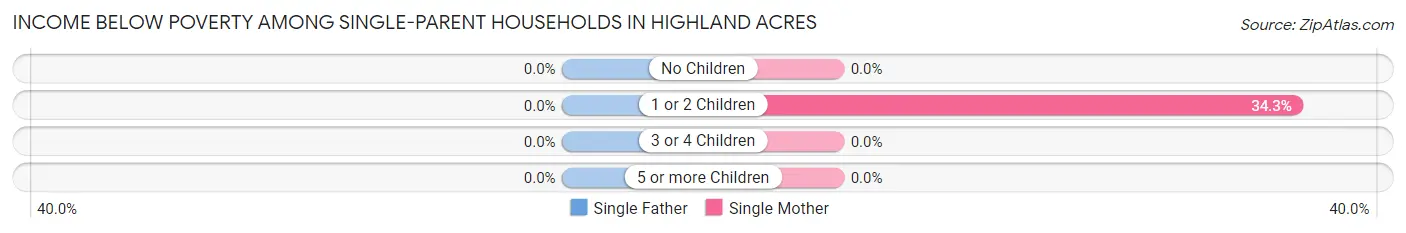
| Children | Single Father | Single Mother |
| No Children | 0 (0.0%) | 0 (0.0%) |
| 1 or 2 Children | 0 (0.0%) | 37 (34.3%) |
| 3 or 4 Children | 0 (0.0%) | 0 (0.0%) |
| 5 or more Children | 0 (0.0%) | 0 (0.0%) |
| Total | 0 (0.0%) | 37 (22.7%) |
Income Below Poverty Among Married-Couple vs Single-Parent Households in Highland Acres
The poverty data for Highland Acres shows that 5 of the married-couple family households (0.6%) and 37 of the single-parent households (16.4%) are living below the poverty level. Within the married-couple family households, those with 1 or 2 children have the highest poverty rate, with 5 households (1.9%) falling below the poverty line. Among the single-parent households, those with 1 or 2 children have the highest poverty rate, with 37 household (27.8%) living below poverty.
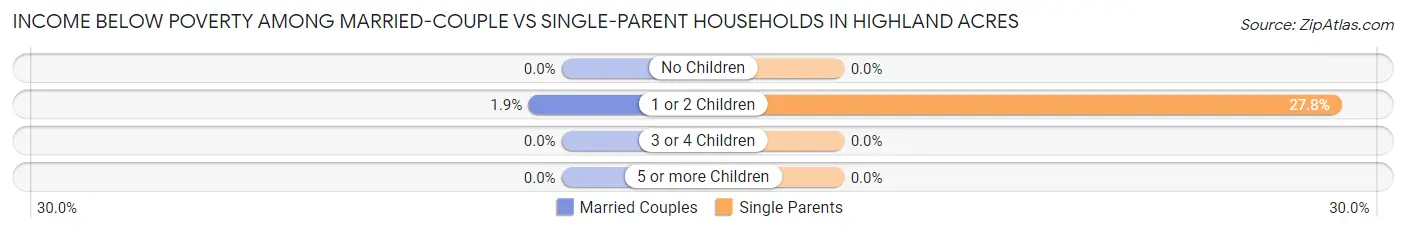
| Children | Married-Couple Families | Single-Parent Households |
| No Children | 0 (0.0%) | 0 (0.0%) |
| 1 or 2 Children | 5 (1.9%) | 37 (27.8%) |
| 3 or 4 Children | 0 (0.0%) | 0 (0.0%) |
| 5 or more Children | 0 (0.0%) | 0 (0.0%) |
| Total | 5 (0.6%) | 37 (16.4%) |
Race in Highland Acres
The most populous races in Highland Acres are White / Caucasian (3,191 | 82.0%), Black / African American (390 | 10.0%), and Asian (174 | 4.5%).
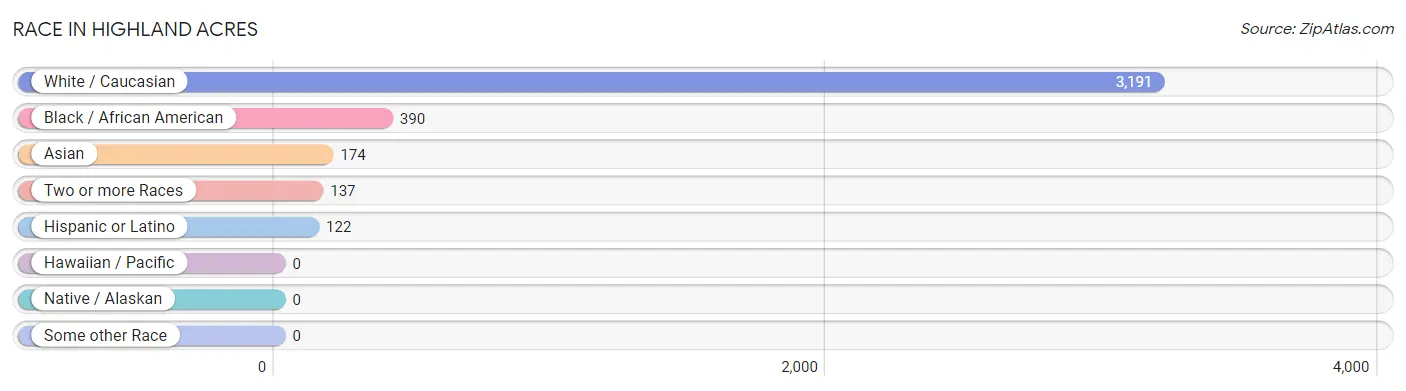
| Race | # Population | % Population |
| Asian | 174 | 4.5% |
| Black / African American | 390 | 10.0% |
| Hawaiian / Pacific | 0 | 0.0% |
| Hispanic or Latino | 122 | 3.1% |
| Native / Alaskan | 0 | 0.0% |
| White / Caucasian | 3,191 | 82.0% |
| Two or more Races | 137 | 3.5% |
| Some other Race | 0 | 0.0% |
| Total | 3,892 | 100.0% |
Ancestry in Highland Acres
The most populous ancestries reported in Highland Acres are English (1,132 | 29.1%), Irish (1,031 | 26.5%), German (644 | 16.6%), Italian (174 | 4.5%), and American (160 | 4.1%), together accounting for 80.7% of all Highland Acres residents.
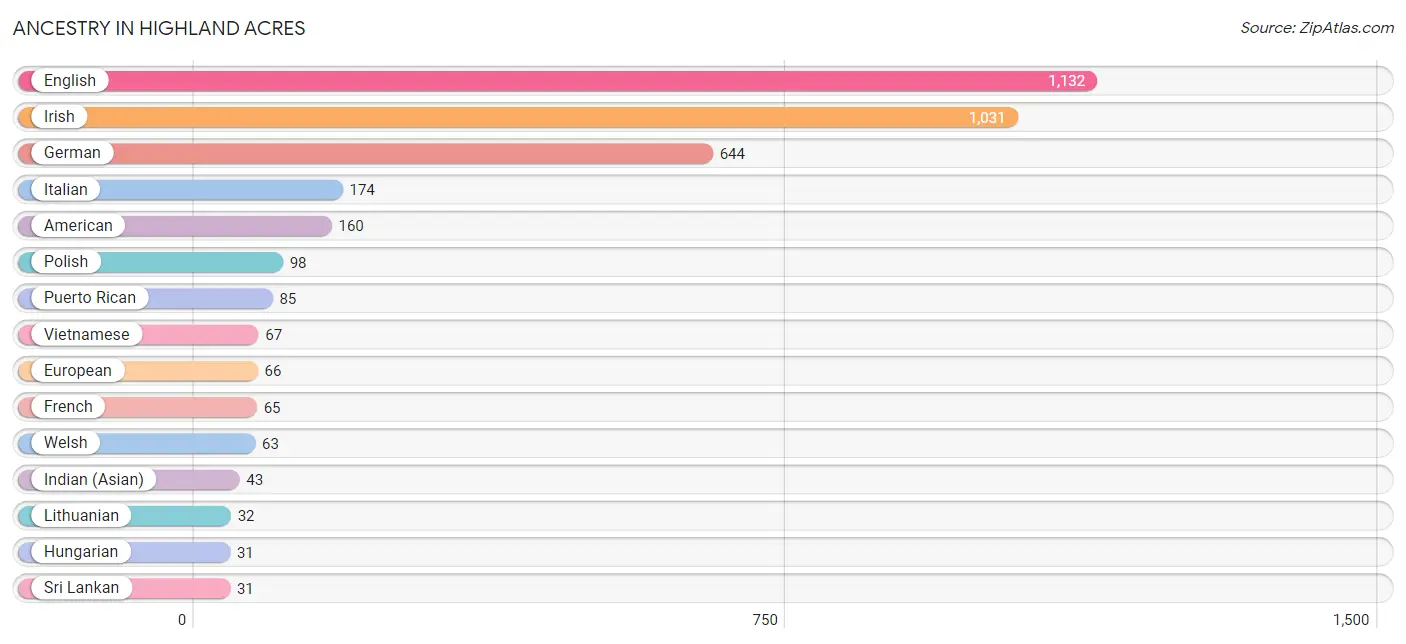
| Ancestry | # Population | % Population |
| American | 160 | 4.1% |
| Bhutanese | 22 | 0.6% |
| Blackfeet | 6 | 0.2% |
| Brazilian | 10 | 0.3% |
| British | 23 | 0.6% |
| Burmese | 6 | 0.2% |
| Cherokee | 8 | 0.2% |
| Cuban | 1 | 0.0% |
| Czech | 5 | 0.1% |
| Delaware | 6 | 0.2% |
| Dominican | 1 | 0.0% |
| Dutch | 5 | 0.1% |
| Eastern European | 6 | 0.2% |
| English | 1,132 | 29.1% |
| European | 66 | 1.7% |
| French | 65 | 1.7% |
| German | 644 | 16.6% |
| Greek | 23 | 0.6% |
| Hungarian | 31 | 0.8% |
| Indian (Asian) | 43 | 1.1% |
| Irish | 1,031 | 26.5% |
| Iroquois | 8 | 0.2% |
| Italian | 174 | 4.5% |
| Jamaican | 6 | 0.2% |
| Korean | 21 | 0.5% |
| Lithuanian | 32 | 0.8% |
| Mexican | 29 | 0.7% |
| Polish | 98 | 2.5% |
| Puerto Rican | 85 | 2.2% |
| Romanian | 9 | 0.2% |
| Scandinavian | 12 | 0.3% |
| Scotch-Irish | 11 | 0.3% |
| Scottish | 11 | 0.3% |
| Spanish | 6 | 0.2% |
| Sri Lankan | 31 | 0.8% |
| Swiss | 8 | 0.2% |
| Ukrainian | 9 | 0.2% |
| Vietnamese | 67 | 1.7% |
| Welsh | 63 | 1.6% |
| Yugoslavian | 8 | 0.2% | View All 40 Rows |
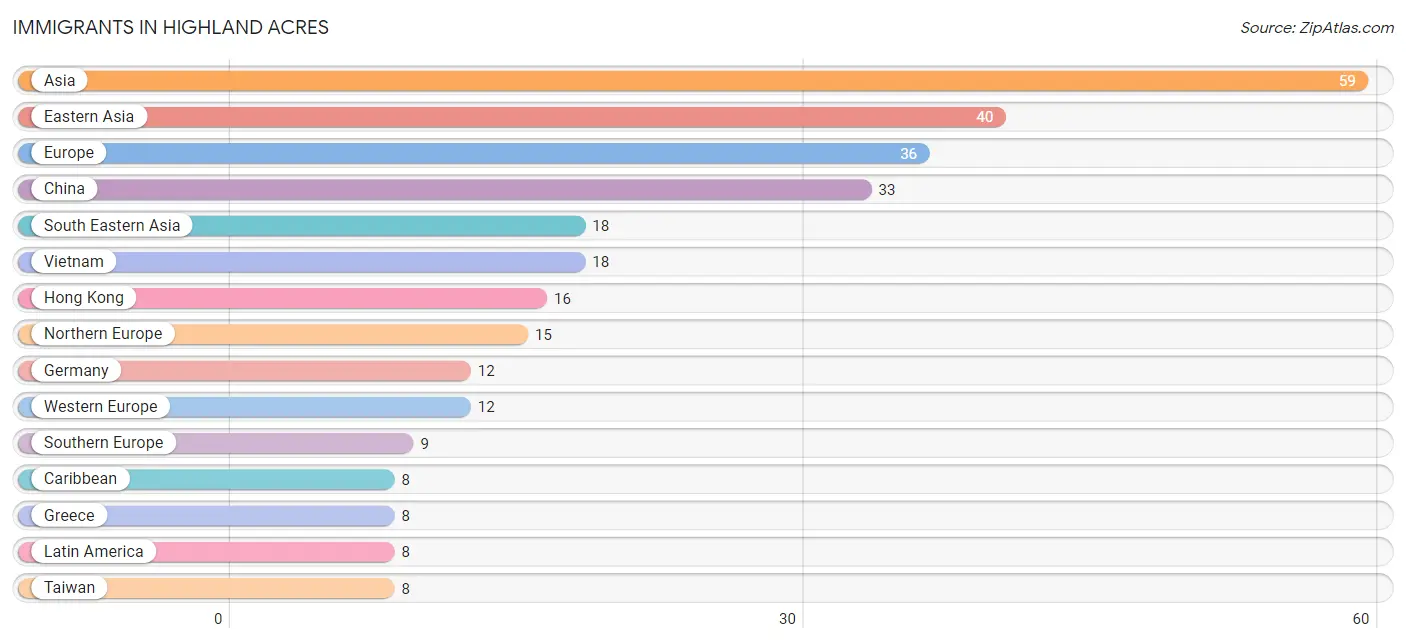
Immigrants in Highland Acres
The most numerous immigrant groups reported in Highland Acres came from Asia (59 | 1.5%), Eastern Asia (40 | 1.0%), Europe (36 | 0.9%), China (33 | 0.9%), and South Eastern Asia (18 | 0.5%), together accounting for 4.8% of all Highland Acres residents.
| Immigration Origin | # Population | % Population |
| Asia | 59 | 1.5% |
| Caribbean | 8 | 0.2% |
| China | 33 | 0.9% |
| Cuba | 1 | 0.0% |
| Dominican Republic | 1 | 0.0% |
| Eastern Asia | 40 | 1.0% |
| England | 7 | 0.2% |
| Europe | 36 | 0.9% |
| Germany | 12 | 0.3% |
| Greece | 8 | 0.2% |
| Hong Kong | 16 | 0.4% |
| Jamaica | 6 | 0.2% |
| Japan | 1 | 0.0% |
| Korea | 6 | 0.2% |
| Latin America | 8 | 0.2% |
| Northern Europe | 15 | 0.4% |
| Pakistan | 1 | 0.0% |
| South Central Asia | 1 | 0.0% |
| South Eastern Asia | 18 | 0.5% |
| Southern Europe | 9 | 0.2% |
| Spain | 1 | 0.0% |
| Taiwan | 8 | 0.2% |
| Vietnam | 18 | 0.5% |
| Western Europe | 12 | 0.3% | View All 24 Rows |
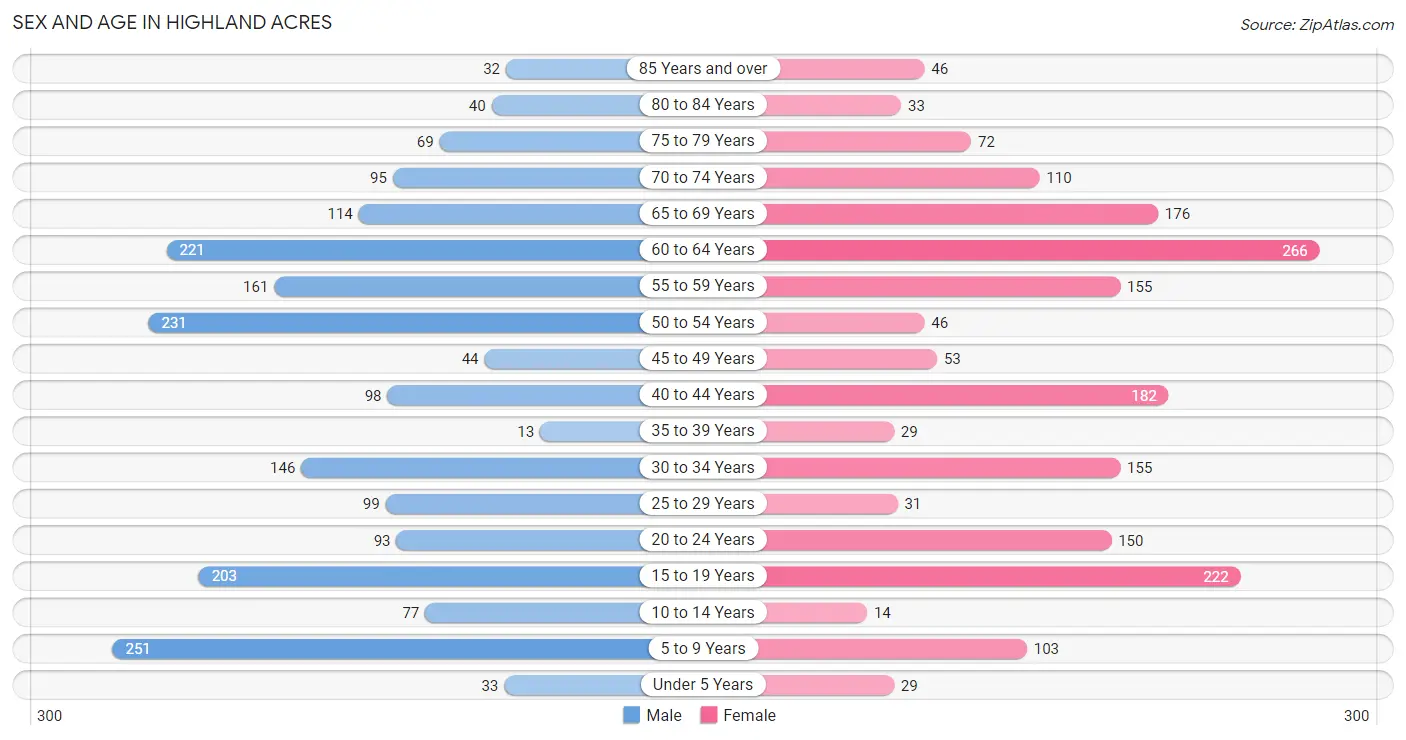
Sex and Age in Highland Acres
Sex and Age in Highland Acres
The most populous age groups in Highland Acres are 5 to 9 Years (251 | 12.4%) for men and 60 to 64 Years (266 | 14.2%) for women.
| Age Bracket | Male | Female |
| Under 5 Years | 33 (1.6%) | 29 (1.5%) |
| 5 to 9 Years | 251 (12.4%) | 103 (5.5%) |
| 10 to 14 Years | 77 (3.8%) | 14 (0.7%) |
| 15 to 19 Years | 203 (10.1%) | 222 (11.9%) |
| 20 to 24 Years | 93 (4.6%) | 150 (8.0%) |
| 25 to 29 Years | 99 (4.9%) | 31 (1.7%) |
| 30 to 34 Years | 146 (7.2%) | 155 (8.3%) |
| 35 to 39 Years | 13 (0.6%) | 29 (1.5%) |
| 40 to 44 Years | 98 (4.9%) | 182 (9.7%) |
| 45 to 49 Years | 44 (2.2%) | 53 (2.8%) |
| 50 to 54 Years | 231 (11.4%) | 46 (2.5%) |
| 55 to 59 Years | 161 (8.0%) | 155 (8.3%) |
| 60 to 64 Years | 221 (10.9%) | 266 (14.2%) |
| 65 to 69 Years | 114 (5.6%) | 176 (9.4%) |
| 70 to 74 Years | 95 (4.7%) | 110 (5.9%) |
| 75 to 79 Years | 69 (3.4%) | 72 (3.8%) |
| 80 to 84 Years | 40 (2.0%) | 33 (1.8%) |
| 85 Years and over | 32 (1.6%) | 46 (2.5%) |
| Total | 2,020 (100.0%) | 1,872 (100.0%) |
Families and Households in Highland Acres
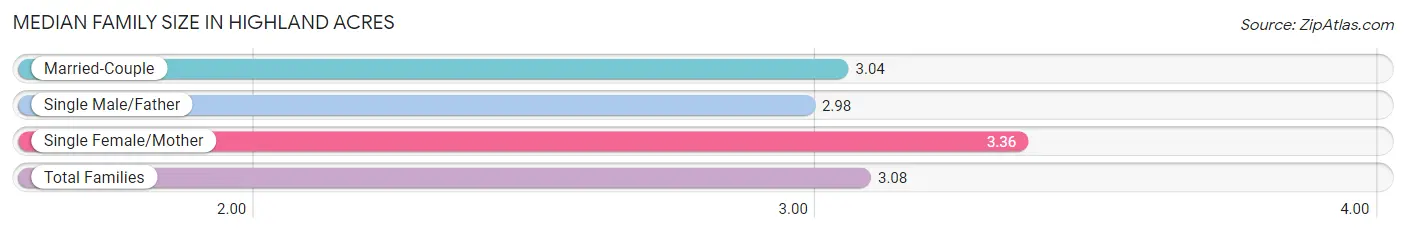
Median Family Size in Highland Acres
The median family size in Highland Acres is 3.08 persons per family, with single female/mother families (163 | 14.7%) accounting for the largest median family size of 3.36 persons per family. On the other hand, single male/father families (63 | 5.7%) represent the smallest median family size with 2.98 persons per family.
| Family Type | # Families | Family Size |
| Married-Couple | 880 (79.6%) | 3.04 |
| Single Male/Father | 63 (5.7%) | 2.98 |
| Single Female/Mother | 163 (14.7%) | 3.36 |
| Total Families | 1,106 (100.0%) | 3.08 |
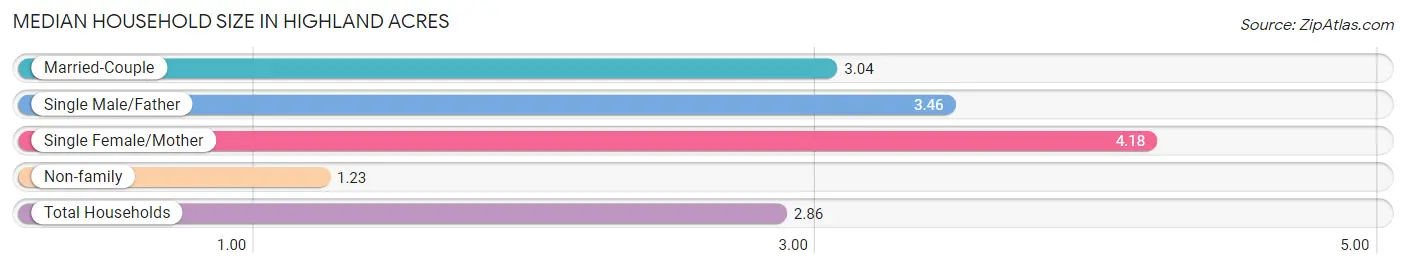
Median Household Size in Highland Acres
The median household size in Highland Acres is 2.86 persons per household, with single female/mother households (163 | 12.0%) accounting for the largest median household size of 4.18 persons per household. non-family households (254 | 18.7%) represent the smallest median household size with 1.23 persons per household.
| Household Type | # Households | Household Size |
| Married-Couple | 880 (64.7%) | 3.04 |
| Single Male/Father | 63 (4.6%) | 3.46 |
| Single Female/Mother | 163 (12.0%) | 4.18 |
| Non-family | 254 (18.7%) | 1.23 |
| Total Households | 1,360 (100.0%) | 2.86 |
Household Size by Marriage Status in Highland Acres
Out of a total of 1,360 households in Highland Acres, 1,106 (81.3%) are family households, while 254 (18.7%) are nonfamily households. The most numerous type of family households are 2-person households, comprising 493, and the most common type of nonfamily households are 1-person households, comprising 221.
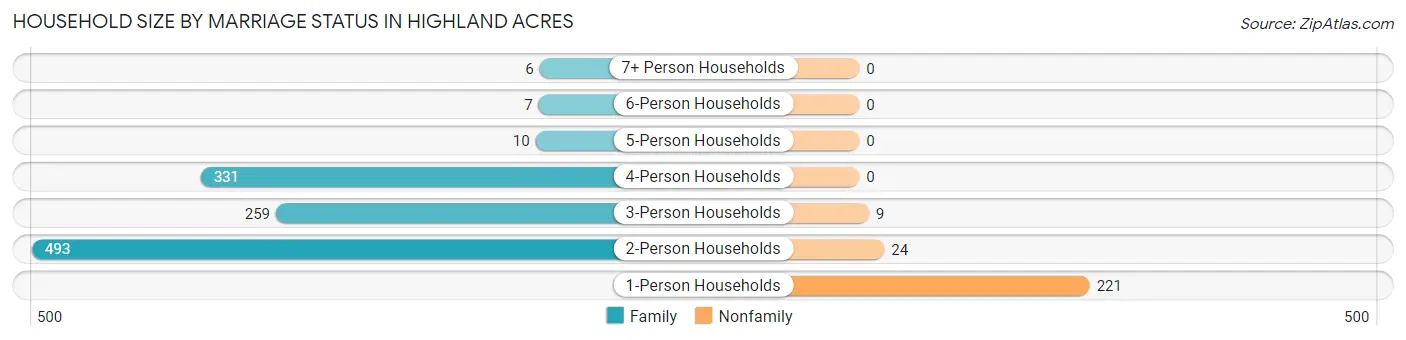
| Household Size | Family Households | Nonfamily Households |
| 1-Person Households | - | 221 (16.3%) |
| 2-Person Households | 493 (36.2%) | 24 (1.8%) |
| 3-Person Households | 259 (19.0%) | 9 (0.7%) |
| 4-Person Households | 331 (24.3%) | 0 (0.0%) |
| 5-Person Households | 10 (0.7%) | 0 (0.0%) |
| 6-Person Households | 7 (0.5%) | 0 (0.0%) |
| 7+ Person Households | 6 (0.4%) | 0 (0.0%) |
| Total | 1,106 (81.3%) | 254 (18.7%) |
Female Fertility in Highland Acres
Fertility by Age in Highland Acres
Average fertility rate in Highland Acres is 11.0 births per 1,000 women. Women in the age bracket of 20 to 34 years have the highest fertility rate with 27.0 births per 1,000 women. Women in the age bracket of 20 to 34 years acount for 100.0% of all women with births.
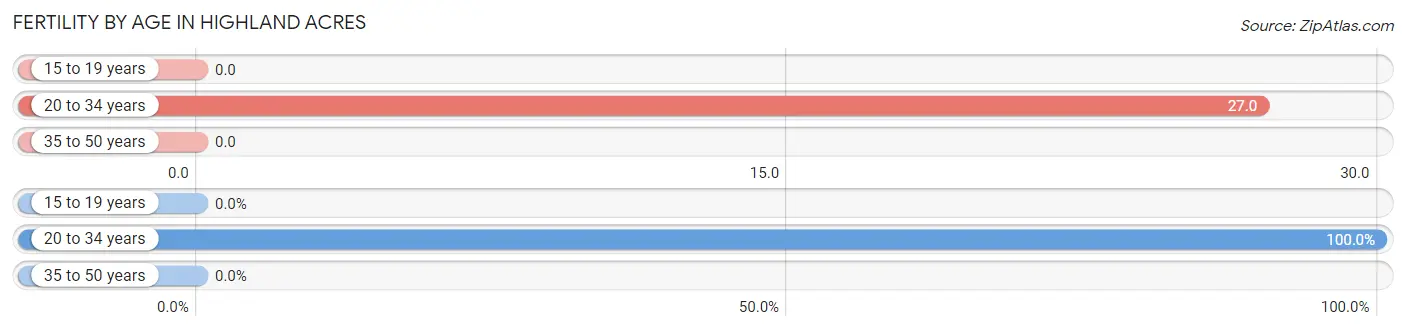
| Age Bracket | Women with Births | Births / 1,000 Women |
| 15 to 19 years | 0 (0.0%) | 0.0 |
| 20 to 34 years | 9 (100.0%) | 27.0 |
| 35 to 50 years | 0 (0.0%) | 0.0 |
| Total | 9 (100.0%) | 11.0 |
Fertility by Age by Marriage Status in Highland Acres
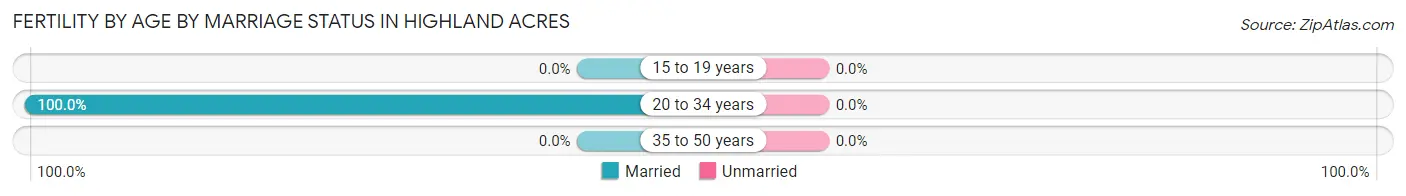
| Age Bracket | Married | Unmarried |
| 15 to 19 years | 0 (0.0%) | 0 (0.0%) |
| 20 to 34 years | 9 (100.0%) | 0 (0.0%) |
| 35 to 50 years | 0 (0.0%) | 0 (0.0%) |
| Total | 9 (100.0%) | 0 (0.0%) |
Fertility by Education in Highland Acres
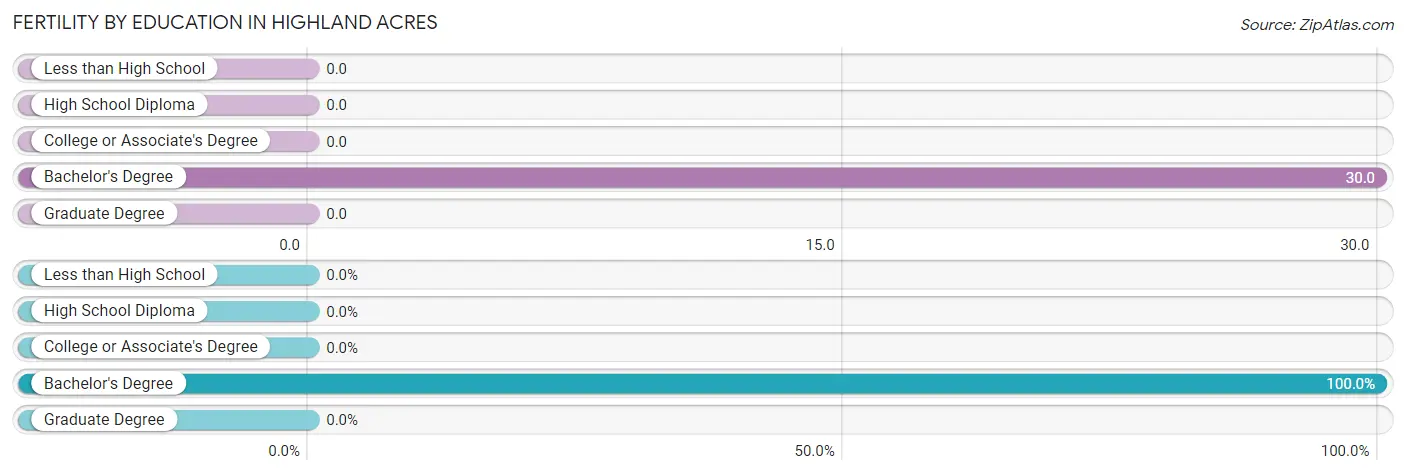
| Educational Attainment | Women with Births | Births / 1,000 Women |
| Less than High School | 0 (0.0%) | 0.0 |
| High School Diploma | 0 (0.0%) | 0.0 |
| College or Associate's Degree | 0 (0.0%) | 0.0 |
| Bachelor's Degree | 9 (100.0%) | 30.0 |
| Graduate Degree | 0 (0.0%) | 0.0 |
| Total | 9 (100.0%) | 11.0 |
Fertility by Education by Marriage Status in Highland Acres
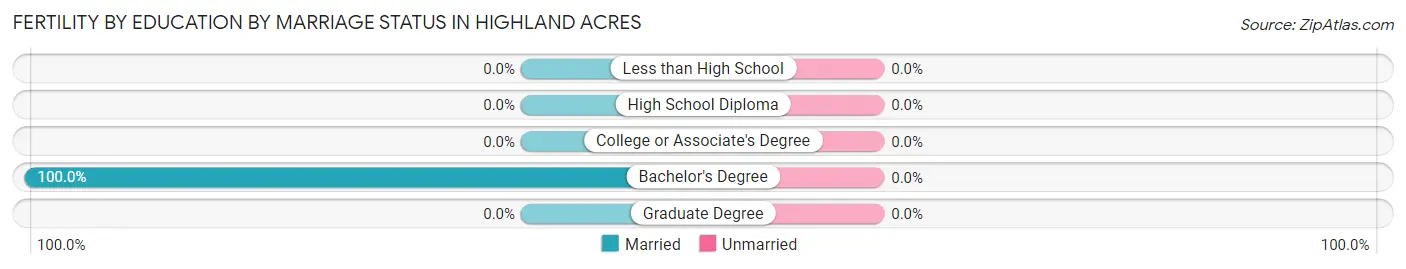
| Educational Attainment | Married | Unmarried |
| Less than High School | 0 (0.0%) | 0 (0.0%) |
| High School Diploma | 0 (0.0%) | 0 (0.0%) |
| College or Associate's Degree | 0 (0.0%) | 0 (0.0%) |
| Bachelor's Degree | 9 (100.0%) | 0 (0.0%) |
| Graduate Degree | 0 (0.0%) | 0 (0.0%) |
| Total | 9 (100.0%) | 0 (0.0%) |
Employment Characteristics in Highland Acres
Employment by Class of Employer in Highland Acres
Among the 1,741 employed individuals in Highland Acres, private company employees (1,088 | 62.5%), state government employees (224 | 12.9%), and federal government employees (130 | 7.5%) make up the most common classes of employment.
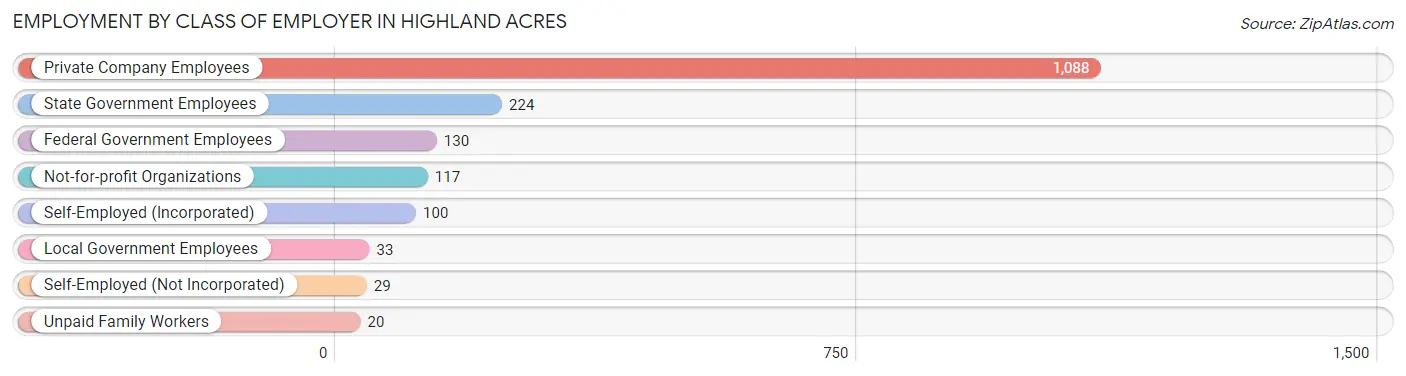
| Employer Class | # Employees | % Employees |
| Private Company Employees | 1,088 | 62.5% |
| Self-Employed (Incorporated) | 100 | 5.7% |
| Self-Employed (Not Incorporated) | 29 | 1.7% |
| Not-for-profit Organizations | 117 | 6.7% |
| Local Government Employees | 33 | 1.9% |
| State Government Employees | 224 | 12.9% |
| Federal Government Employees | 130 | 7.5% |
| Unpaid Family Workers | 20 | 1.1% |
| Total | 1,741 | 100.0% |
Employment Status by Age in Highland Acres
According to the labor force statistics for Highland Acres, out of the total population over 16 years of age (3,371), 53.8% or 1,814 individuals are in the labor force, with 3.0% or 54 of them unemployed. The age group with the highest labor force participation rate is 35 to 44 years, with 97.5% or 314 individuals in the labor force. Within the labor force, the 75 years and over age range has the highest percentage of unemployed individuals, with 55.0% or 11 of them being unemployed.
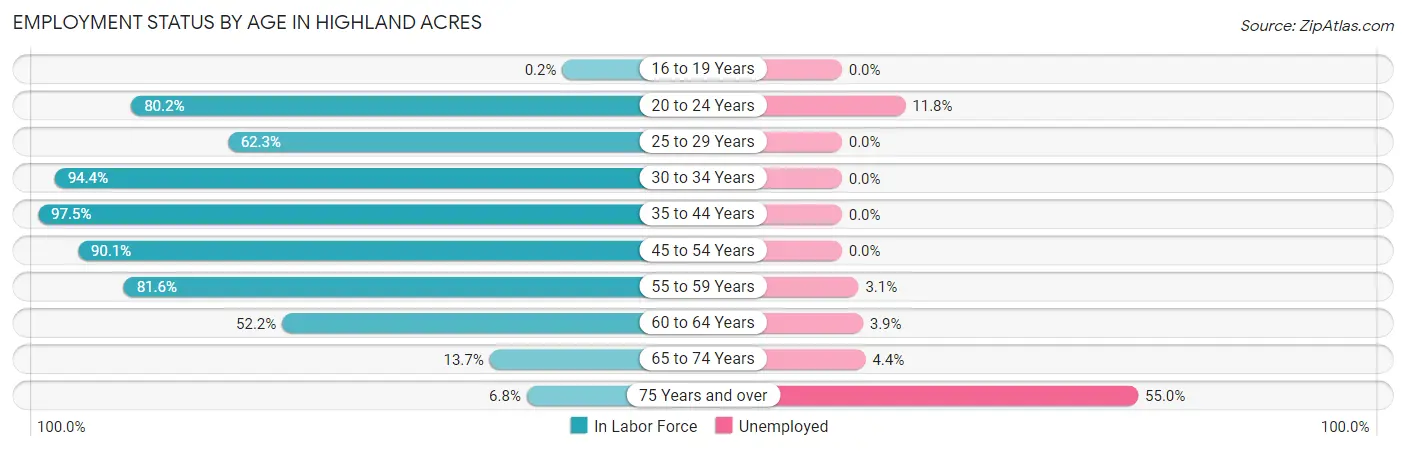
| Age Bracket | In Labor Force | Unemployed |
| 16 to 19 Years | 1 (0.2%) | 0 (0.0%) |
| 20 to 24 Years | 195 (80.2%) | 23 (11.8%) |
| 25 to 29 Years | 81 (62.3%) | 0 (0.0%) |
| 30 to 34 Years | 284 (94.4%) | 0 (0.0%) |
| 35 to 44 Years | 314 (97.5%) | 0 (0.0%) |
| 45 to 54 Years | 337 (90.1%) | 0 (0.0%) |
| 55 to 59 Years | 258 (81.6%) | 8 (3.1%) |
| 60 to 64 Years | 254 (52.2%) | 10 (3.9%) |
| 65 to 74 Years | 68 (13.7%) | 3 (4.4%) |
| 75 Years and over | 20 (6.8%) | 11 (55.0%) |
| Total | 1,814 (53.8%) | 54 (3.0%) |
Employment Status by Educational Attainment in Highland Acres
According to labor force statistics for Highland Acres, 79.2% of individuals (1,529) out of the total population between 25 and 64 years of age (1,930) are in the labor force, with 1.2% or 18 of them being unemployed. The group with the highest labor force participation rate are those with the educational attainment of bachelor's degree or higher, with 89.5% or 714 individuals in the labor force. Within the labor force, individuals with bachelor's degree or higher education have the highest percentage of unemployment, with 2.6% or 19 of them being unemployed.
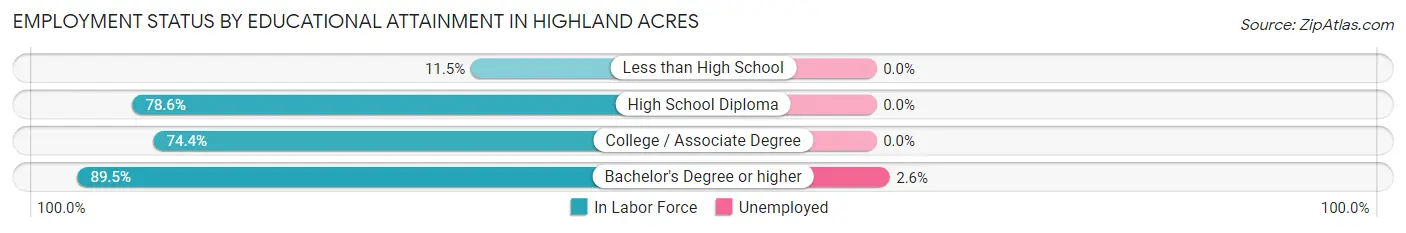
| Educational Attainment | In Labor Force | Unemployed |
| Less than High School | 10 (11.5%) | 0 (0.0%) |
| High School Diploma | 499 (78.6%) | 0 (0.0%) |
| College / Associate Degree | 305 (74.4%) | 0 (0.0%) |
| Bachelor's Degree or higher | 714 (89.5%) | 21 (2.6%) |
| Total | 1,529 (79.2%) | 23 (1.2%) |
Employment Occupations by Sex in Highland Acres
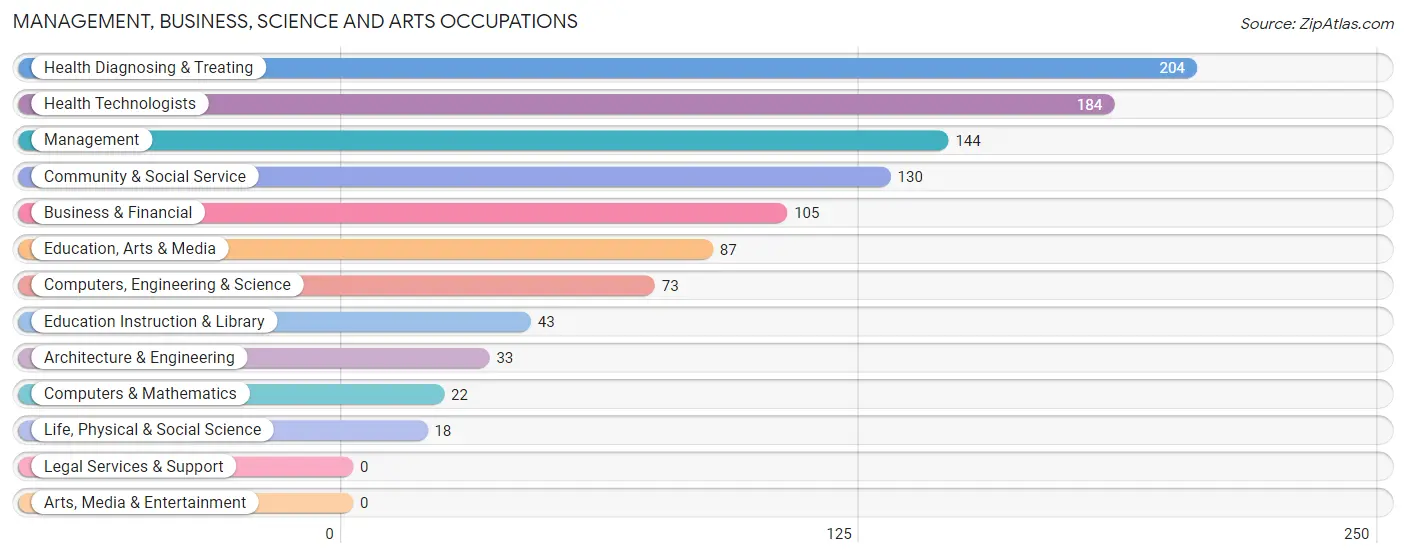
Management, Business, Science and Arts Occupations
The most common Management, Business, Science and Arts occupations in Highland Acres are Health Diagnosing & Treating (204 | 11.9%), Health Technologists (184 | 10.8%), Management (144 | 8.4%), Community & Social Service (130 | 7.6%), and Business & Financial (105 | 6.1%).
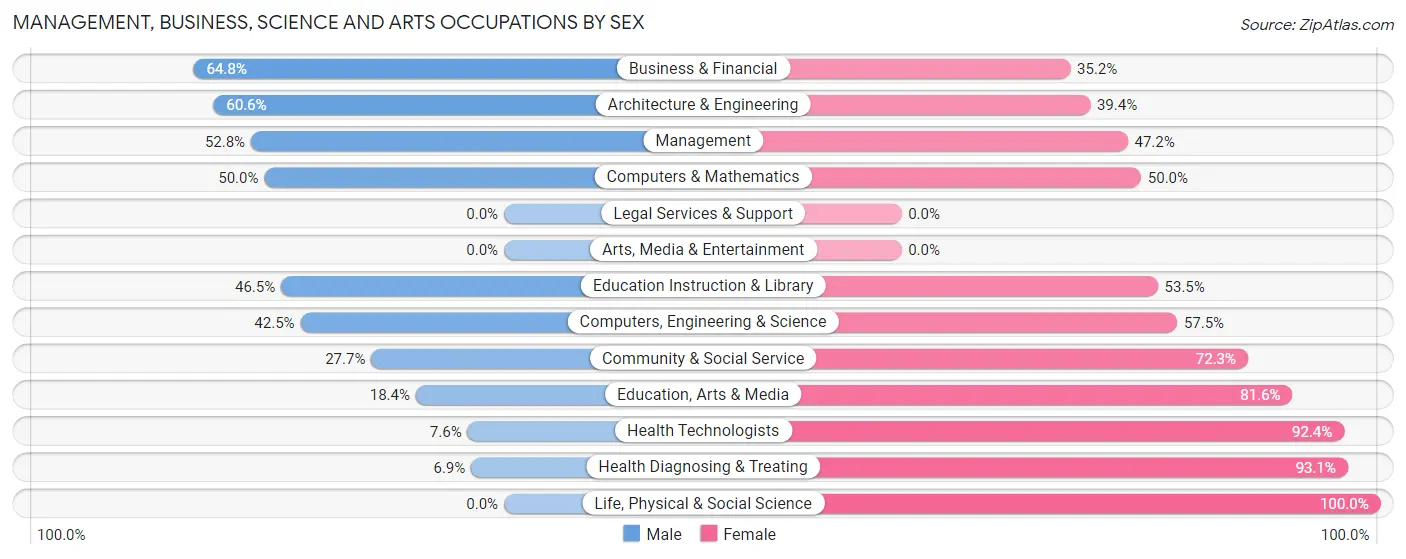
Management, Business, Science and Arts Occupations by Sex
Within the Management, Business, Science and Arts occupations in Highland Acres, the most male-oriented occupations are Business & Financial (64.8%), Architecture & Engineering (60.6%), and Management (52.8%), while the most female-oriented occupations are Life, Physical & Social Science (100.0%), Health Diagnosing & Treating (93.1%), and Health Technologists (92.4%).
| Occupation | Male | Female |
| Management | 76 (52.8%) | 68 (47.2%) |
| Business & Financial | 68 (64.8%) | 37 (35.2%) |
| Computers, Engineering & Science | 31 (42.5%) | 42 (57.5%) |
| Computers & Mathematics | 11 (50.0%) | 11 (50.0%) |
| Architecture & Engineering | 20 (60.6%) | 13 (39.4%) |
| Life, Physical & Social Science | 0 (0.0%) | 18 (100.0%) |
| Community & Social Service | 36 (27.7%) | 94 (72.3%) |
| Education, Arts & Media | 16 (18.4%) | 71 (81.6%) |
| Legal Services & Support | 0 (0.0%) | 0 (0.0%) |
| Education Instruction & Library | 20 (46.5%) | 23 (53.5%) |
| Arts, Media & Entertainment | 0 (0.0%) | 0 (0.0%) |
| Health Diagnosing & Treating | 14 (6.9%) | 190 (93.1%) |
| Health Technologists | 14 (7.6%) | 170 (92.4%) |
| Total (Category) | 225 (34.3%) | 431 (65.7%) |
| Total (Overall) | 885 (51.7%) | 825 (48.2%) |
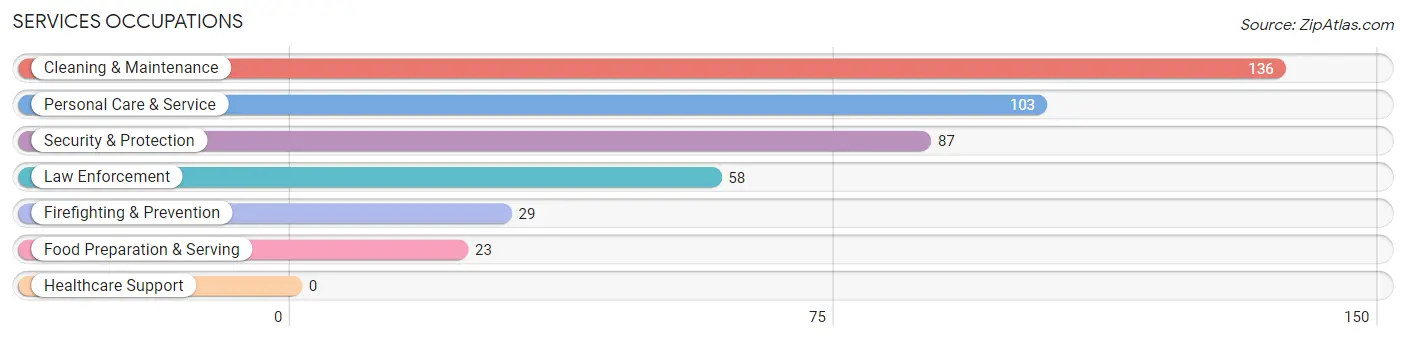
Services Occupations
The most common Services occupations in Highland Acres are Cleaning & Maintenance (136 | 8.0%), Personal Care & Service (103 | 6.0%), Security & Protection (87 | 5.1%), Law Enforcement (58 | 3.4%), and Firefighting & Prevention (29 | 1.7%).
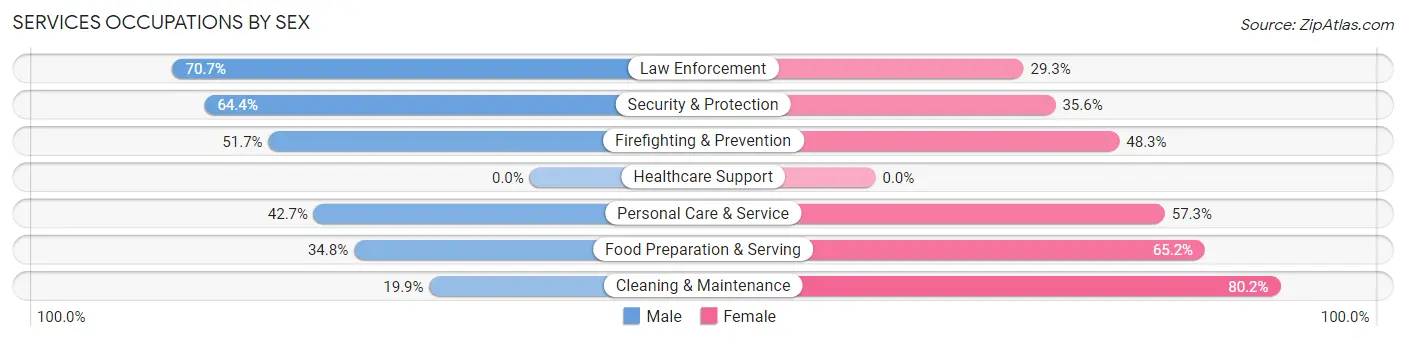
Services Occupations by Sex
Within the Services occupations in Highland Acres, the most male-oriented occupations are Law Enforcement (70.7%), Security & Protection (64.4%), and Firefighting & Prevention (51.7%), while the most female-oriented occupations are Cleaning & Maintenance (80.1%), Food Preparation & Serving (65.2%), and Personal Care & Service (57.3%).
| Occupation | Male | Female |
| Healthcare Support | 0 (0.0%) | 0 (0.0%) |
| Security & Protection | 56 (64.4%) | 31 (35.6%) |
| Firefighting & Prevention | 15 (51.7%) | 14 (48.3%) |
| Law Enforcement | 41 (70.7%) | 17 (29.3%) |
| Food Preparation & Serving | 8 (34.8%) | 15 (65.2%) |
| Cleaning & Maintenance | 27 (19.9%) | 109 (80.1%) |
| Personal Care & Service | 44 (42.7%) | 59 (57.3%) |
| Total (Category) | 135 (38.7%) | 214 (61.3%) |
| Total (Overall) | 885 (51.7%) | 825 (48.2%) |
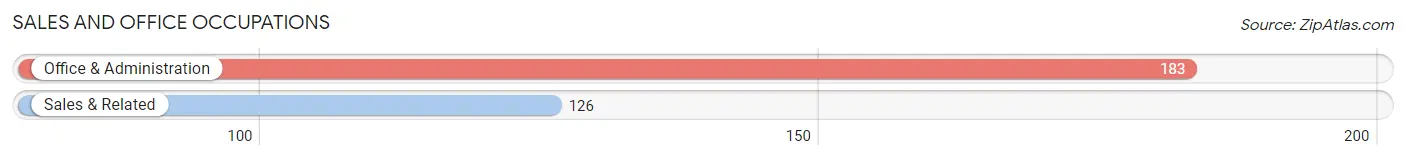
Sales and Office Occupations
The most common Sales and Office occupations in Highland Acres are Office & Administration (183 | 10.7%), and Sales & Related (126 | 7.4%).
Sales and Office Occupations by Sex
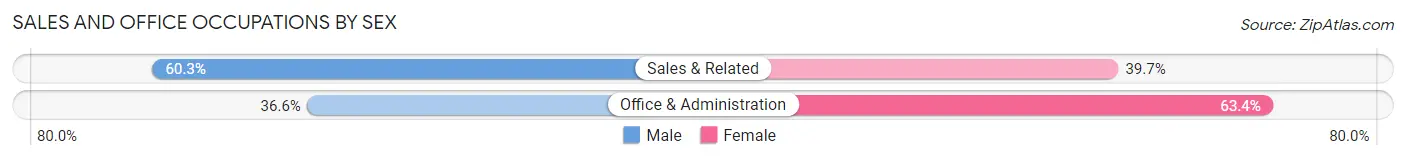
| Occupation | Male | Female |
| Sales & Related | 76 (60.3%) | 50 (39.7%) |
| Office & Administration | 67 (36.6%) | 116 (63.4%) |
| Total (Category) | 143 (46.3%) | 166 (53.7%) |
| Total (Overall) | 885 (51.7%) | 825 (48.2%) |
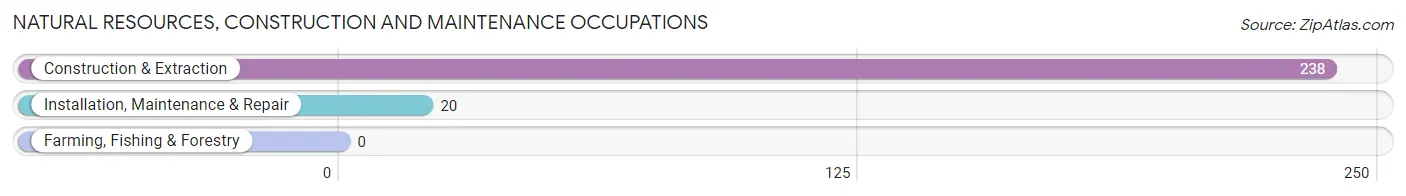
Natural Resources, Construction and Maintenance Occupations
The most common Natural Resources, Construction and Maintenance occupations in Highland Acres are Construction & Extraction (238 | 13.9%), and Installation, Maintenance & Repair (20 | 1.2%).
Natural Resources, Construction and Maintenance Occupations by Sex
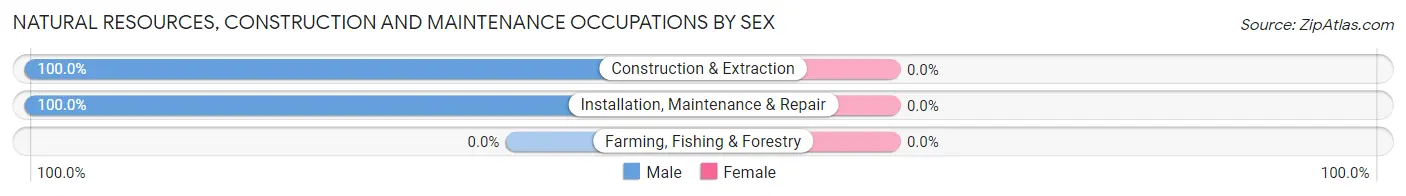
| Occupation | Male | Female |
| Farming, Fishing & Forestry | 0 (0.0%) | 0 (0.0%) |
| Construction & Extraction | 238 (100.0%) | 0 (0.0%) |
| Installation, Maintenance & Repair | 20 (100.0%) | 0 (0.0%) |
| Total (Category) | 258 (100.0%) | 0 (0.0%) |
| Total (Overall) | 885 (51.7%) | 825 (48.2%) |
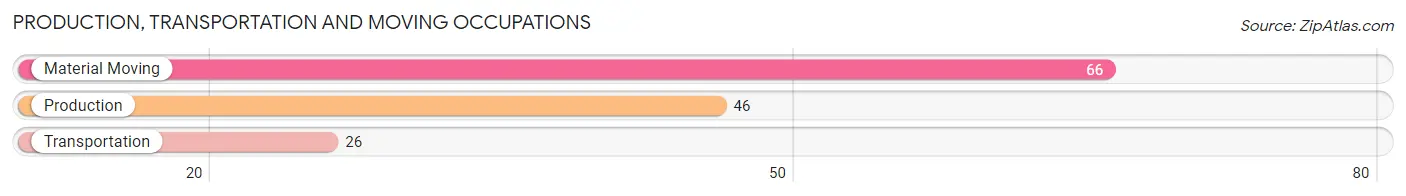
Production, Transportation and Moving Occupations
The most common Production, Transportation and Moving occupations in Highland Acres are Material Moving (66 | 3.9%), Production (46 | 2.7%), and Transportation (26 | 1.5%).
Production, Transportation and Moving Occupations by Sex
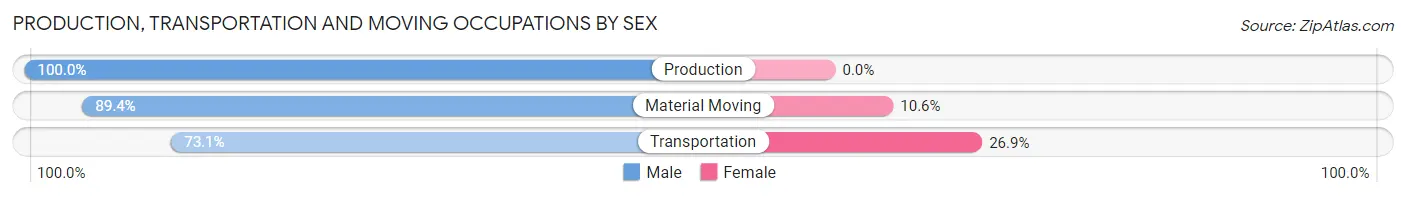
| Occupation | Male | Female |
| Production | 46 (100.0%) | 0 (0.0%) |
| Transportation | 19 (73.1%) | 7 (26.9%) |
| Material Moving | 59 (89.4%) | 7 (10.6%) |
| Total (Category) | 124 (89.9%) | 14 (10.1%) |
| Total (Overall) | 885 (51.7%) | 825 (48.2%) |
Employment Industries by Sex in Highland Acres
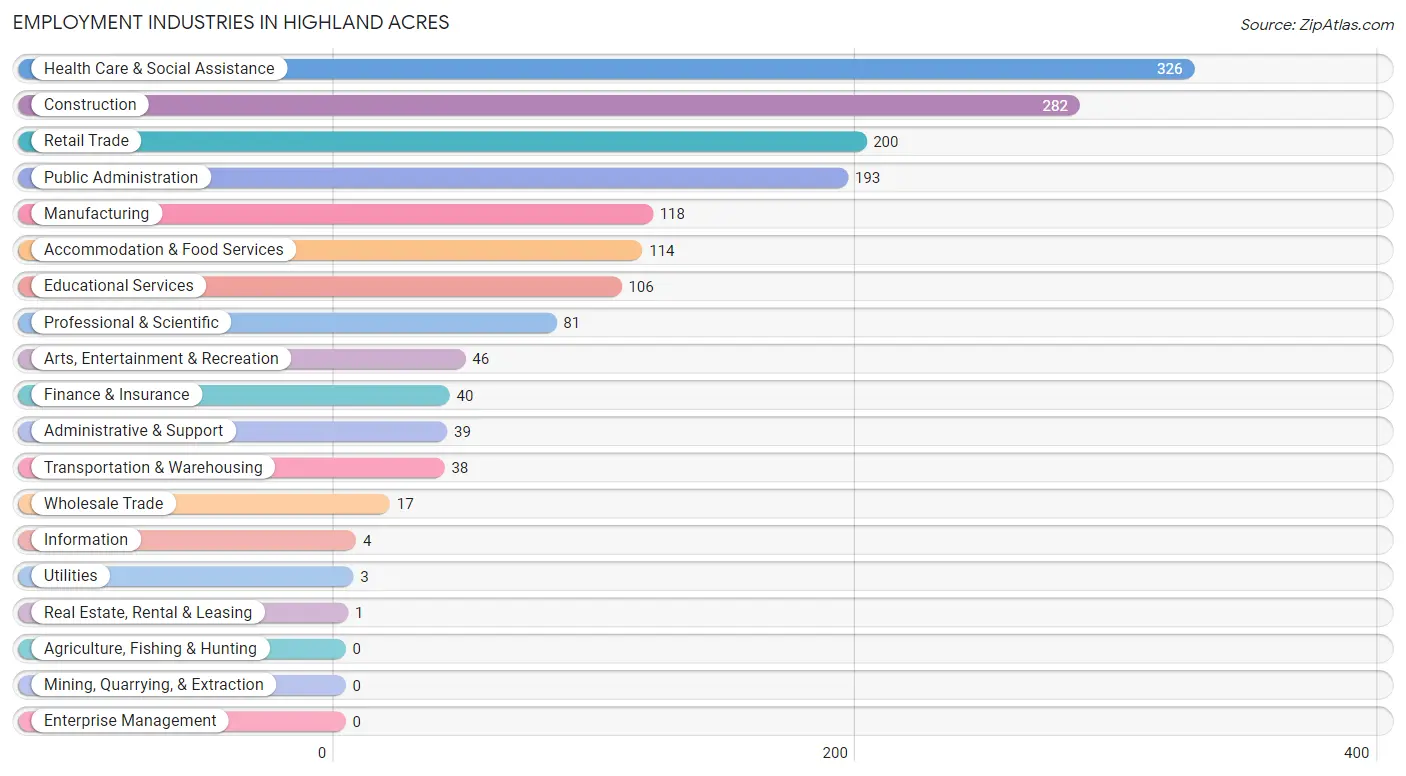
Employment Industries in Highland Acres
The major employment industries in Highland Acres include Health Care & Social Assistance (326 | 19.1%), Construction (282 | 16.5%), Retail Trade (200 | 11.7%), Public Administration (193 | 11.3%), and Manufacturing (118 | 6.9%).
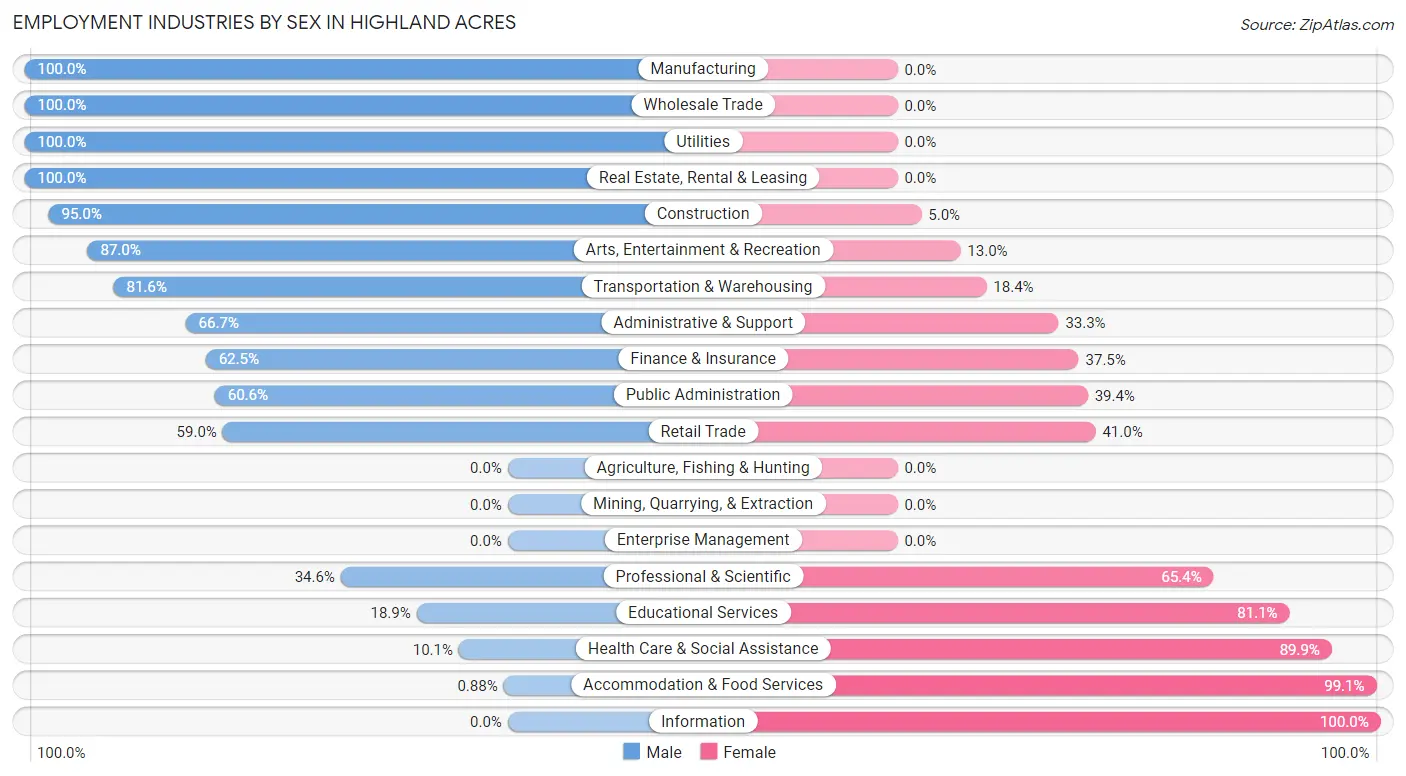
Employment Industries by Sex in Highland Acres
The Highland Acres industries that see more men than women are Manufacturing (100.0%), Wholesale Trade (100.0%), and Utilities (100.0%), whereas the industries that tend to have a higher number of women are Information (100.0%), Accommodation & Food Services (99.1%), and Health Care & Social Assistance (89.9%).
| Industry | Male | Female |
| Agriculture, Fishing & Hunting | 0 (0.0%) | 0 (0.0%) |
| Mining, Quarrying, & Extraction | 0 (0.0%) | 0 (0.0%) |
| Construction | 268 (95.0%) | 14 (5.0%) |
| Manufacturing | 118 (100.0%) | 0 (0.0%) |
| Wholesale Trade | 17 (100.0%) | 0 (0.0%) |
| Retail Trade | 118 (59.0%) | 82 (41.0%) |
| Transportation & Warehousing | 31 (81.6%) | 7 (18.4%) |
| Utilities | 3 (100.0%) | 0 (0.0%) |
| Information | 0 (0.0%) | 4 (100.0%) |
| Finance & Insurance | 25 (62.5%) | 15 (37.5%) |
| Real Estate, Rental & Leasing | 1 (100.0%) | 0 (0.0%) |
| Professional & Scientific | 28 (34.6%) | 53 (65.4%) |
| Enterprise Management | 0 (0.0%) | 0 (0.0%) |
| Administrative & Support | 26 (66.7%) | 13 (33.3%) |
| Educational Services | 20 (18.9%) | 86 (81.1%) |
| Health Care & Social Assistance | 33 (10.1%) | 293 (89.9%) |
| Arts, Entertainment & Recreation | 40 (87.0%) | 6 (13.0%) |
| Accommodation & Food Services | 1 (0.9%) | 113 (99.1%) |
| Public Administration | 117 (60.6%) | 76 (39.4%) |
| Total | 885 (51.7%) | 825 (48.2%) |
Education in Highland Acres
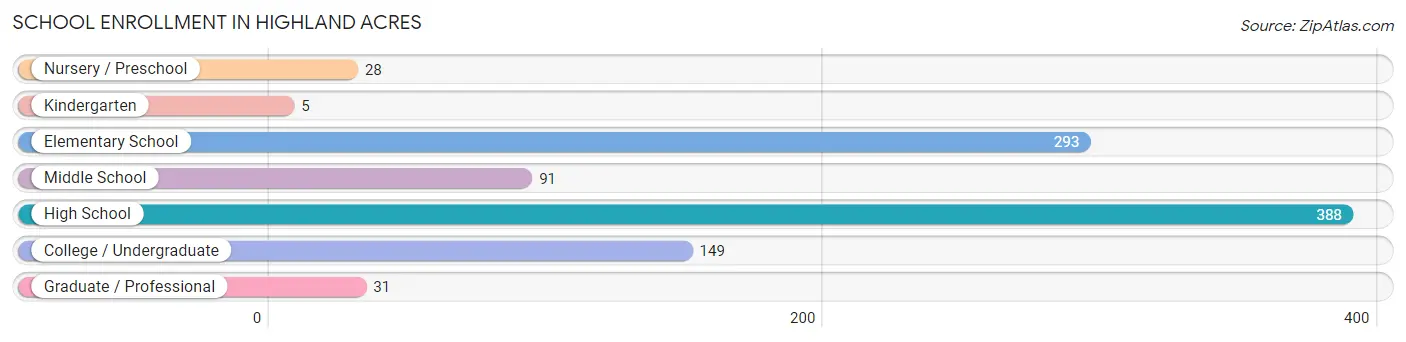
School Enrollment in Highland Acres
The most common levels of schooling among the 985 students in Highland Acres are high school (388 | 39.4%), elementary school (293 | 29.7%), and college / undergraduate (149 | 15.1%).
| School Level | # Students | % Students |
| Nursery / Preschool | 28 | 2.8% |
| Kindergarten | 5 | 0.5% |
| Elementary School | 293 | 29.7% |
| Middle School | 91 | 9.2% |
| High School | 388 | 39.4% |
| College / Undergraduate | 149 | 15.1% |
| Graduate / Professional | 31 | 3.2% |
| Total | 985 | 100.0% |
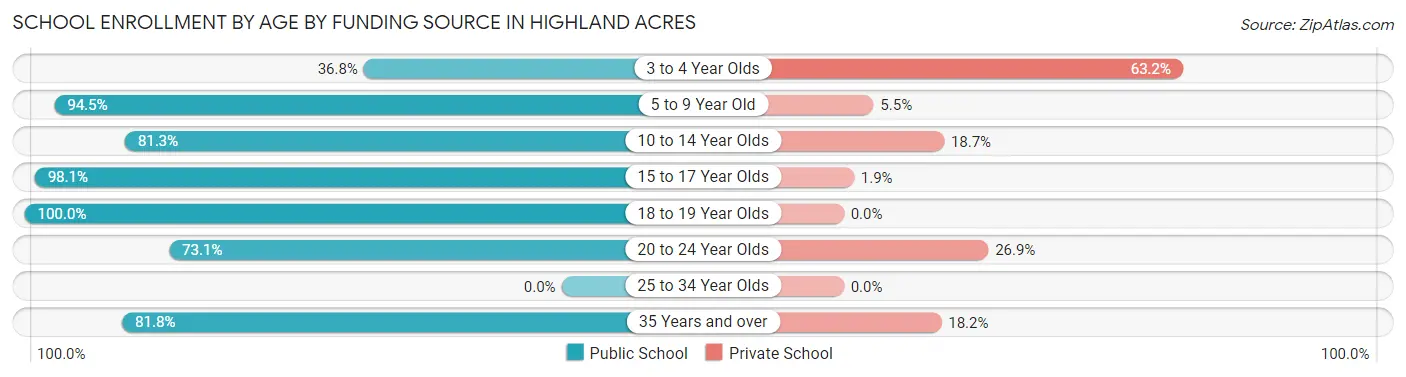
School Enrollment by Age by Funding Source in Highland Acres
Out of a total of 985 students who are enrolled in schools in Highland Acres, 86 (8.7%) attend a private institution, while the remaining 899 (91.3%) are enrolled in public schools. The age group of 3 to 4 year olds has the highest likelihood of being enrolled in private schools, with 12 (63.2% in the age bracket) enrolled. Conversely, the age group of 18 to 19 year olds has the lowest likelihood of being enrolled in a private school, with 53 (100.0% in the age bracket) attending a public institution.
| Age Bracket | Public School | Private School |
| 3 to 4 Year Olds | 7 (36.8%) | 12 (63.2%) |
| 5 to 9 Year Old | 290 (94.5%) | 17 (5.5%) |
| 10 to 14 Year Olds | 74 (81.3%) | 17 (18.7%) |
| 15 to 17 Year Olds | 364 (98.1%) | 7 (1.9%) |
| 18 to 19 Year Olds | 53 (100.0%) | 0 (0.0%) |
| 20 to 24 Year Olds | 57 (73.1%) | 21 (26.9%) |
| 25 to 34 Year Olds | 0 (0.0%) | 0 (0.0%) |
| 35 Years and over | 54 (81.8%) | 12 (18.2%) |
| Total | 899 (91.3%) | 86 (8.7%) |
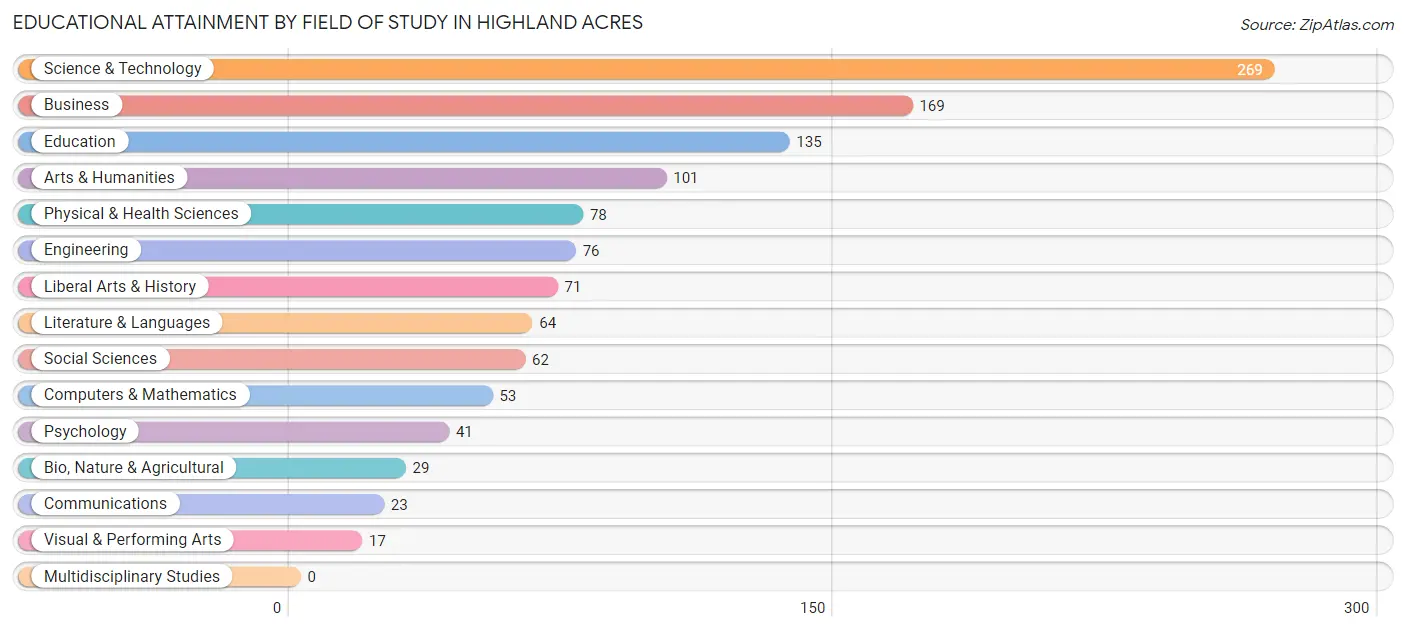
Educational Attainment by Field of Study in Highland Acres
Science & technology (269 | 22.6%), business (169 | 14.2%), education (135 | 11.4%), arts & humanities (101 | 8.5%), and physical & health sciences (78 | 6.6%) are the most common fields of study among 1,188 individuals in Highland Acres who have obtained a bachelor's degree or higher.
| Field of Study | # Graduates | % Graduates |
| Computers & Mathematics | 53 | 4.5% |
| Bio, Nature & Agricultural | 29 | 2.4% |
| Physical & Health Sciences | 78 | 6.6% |
| Psychology | 41 | 3.5% |
| Social Sciences | 62 | 5.2% |
| Engineering | 76 | 6.4% |
| Multidisciplinary Studies | 0 | 0.0% |
| Science & Technology | 269 | 22.6% |
| Business | 169 | 14.2% |
| Education | 135 | 11.4% |
| Literature & Languages | 64 | 5.4% |
| Liberal Arts & History | 71 | 6.0% |
| Visual & Performing Arts | 17 | 1.4% |
| Communications | 23 | 1.9% |
| Arts & Humanities | 101 | 8.5% |
| Total | 1,188 | 100.0% |
Transportation & Commute in Highland Acres
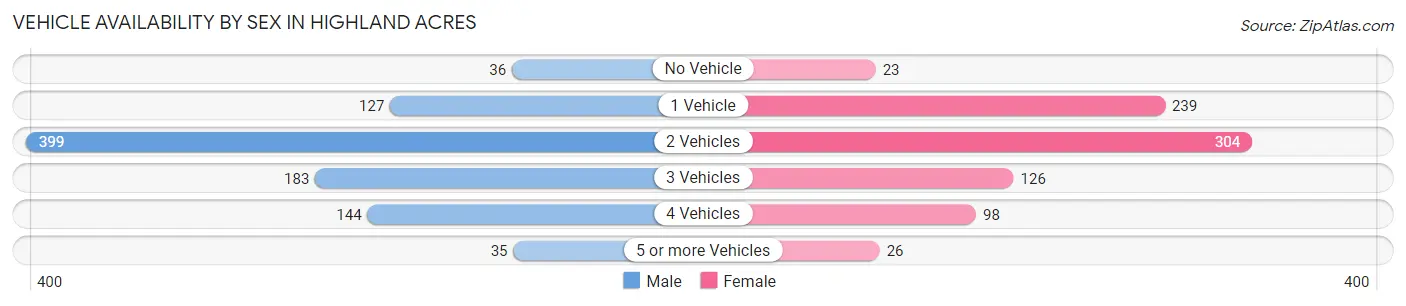
Vehicle Availability by Sex in Highland Acres
The most prevalent vehicle ownership categories in Highland Acres are males with 2 vehicles (399, accounting for 43.2%) and females with 2 vehicles (304, making up 48.9%).
| Vehicles Available | Male | Female |
| No Vehicle | 36 (3.9%) | 23 (2.8%) |
| 1 Vehicle | 127 (13.7%) | 239 (29.3%) |
| 2 Vehicles | 399 (43.2%) | 304 (37.2%) |
| 3 Vehicles | 183 (19.8%) | 126 (15.4%) |
| 4 Vehicles | 144 (15.6%) | 98 (12.0%) |
| 5 or more Vehicles | 35 (3.8%) | 26 (3.2%) |
| Total | 924 (100.0%) | 816 (100.0%) |
Commute Time in Highland Acres
The most frequently occuring commute durations in Highland Acres are 10 to 14 minutes (501 commuters, 30.1%), 15 to 19 minutes (244 commuters, 14.7%), and 5 to 9 minutes (169 commuters, 10.2%).
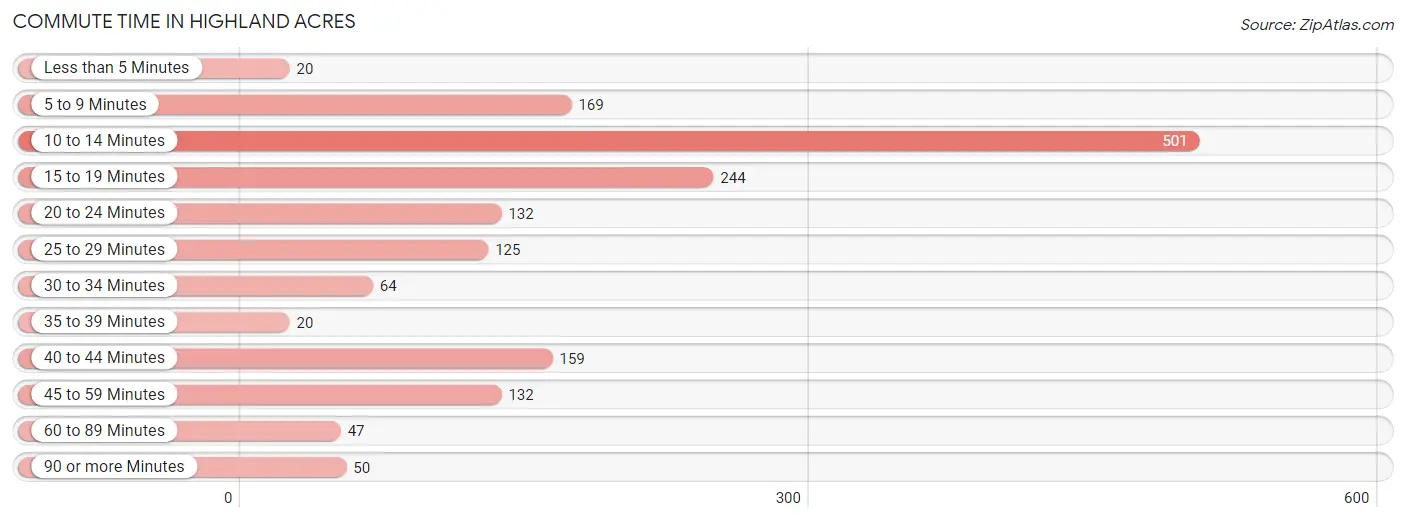
| Commute Time | # Commuters | % Commuters |
| Less than 5 Minutes | 20 | 1.2% |
| 5 to 9 Minutes | 169 | 10.2% |
| 10 to 14 Minutes | 501 | 30.1% |
| 15 to 19 Minutes | 244 | 14.7% |
| 20 to 24 Minutes | 132 | 7.9% |
| 25 to 29 Minutes | 125 | 7.5% |
| 30 to 34 Minutes | 64 | 3.8% |
| 35 to 39 Minutes | 20 | 1.2% |
| 40 to 44 Minutes | 159 | 9.6% |
| 45 to 59 Minutes | 132 | 7.9% |
| 60 to 89 Minutes | 47 | 2.8% |
| 90 or more Minutes | 50 | 3.0% |
Commute Time by Sex in Highland Acres
The most common commute times in Highland Acres are 10 to 14 minutes (298 commuters, 33.5%) for males and 10 to 14 minutes (203 commuters, 26.2%) for females.
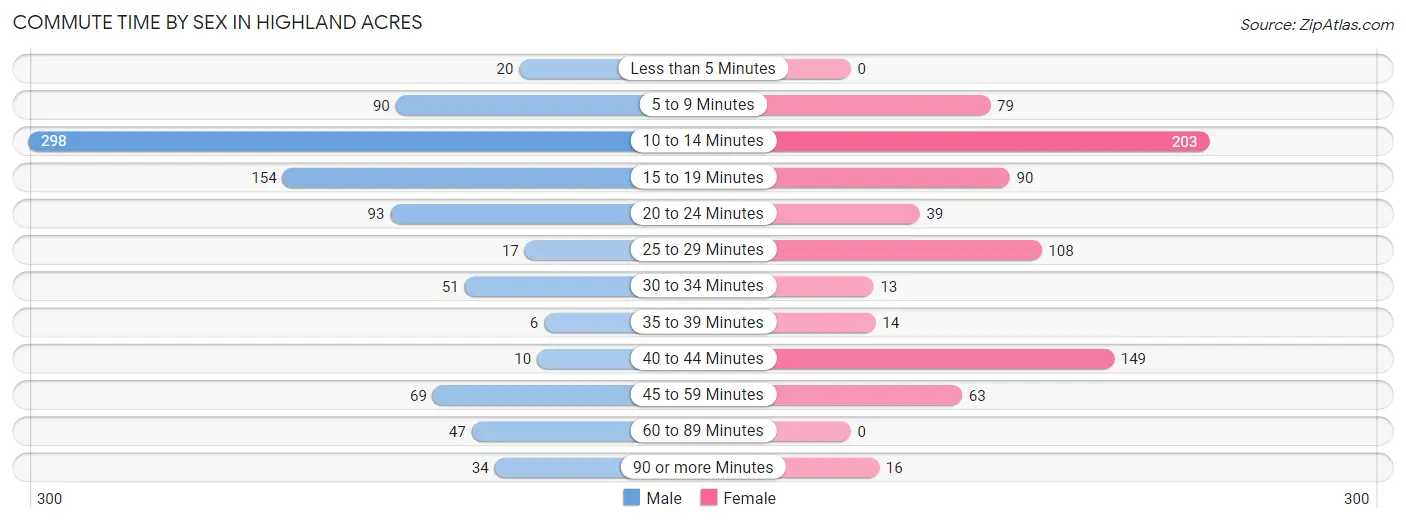
| Commute Time | Male | Female |
| Less than 5 Minutes | 20 (2.2%) | 0 (0.0%) |
| 5 to 9 Minutes | 90 (10.1%) | 79 (10.2%) |
| 10 to 14 Minutes | 298 (33.5%) | 203 (26.2%) |
| 15 to 19 Minutes | 154 (17.3%) | 90 (11.6%) |
| 20 to 24 Minutes | 93 (10.5%) | 39 (5.0%) |
| 25 to 29 Minutes | 17 (1.9%) | 108 (14.0%) |
| 30 to 34 Minutes | 51 (5.7%) | 13 (1.7%) |
| 35 to 39 Minutes | 6 (0.7%) | 14 (1.8%) |
| 40 to 44 Minutes | 10 (1.1%) | 149 (19.3%) |
| 45 to 59 Minutes | 69 (7.8%) | 63 (8.1%) |
| 60 to 89 Minutes | 47 (5.3%) | 0 (0.0%) |
| 90 or more Minutes | 34 (3.8%) | 16 (2.1%) |
Time of Departure to Work by Sex in Highland Acres
The most frequent times of departure to work in Highland Acres are 5:30 AM to 5:59 AM (200, 22.5%) for males and 7:00 AM to 7:29 AM (159, 20.5%) for females.
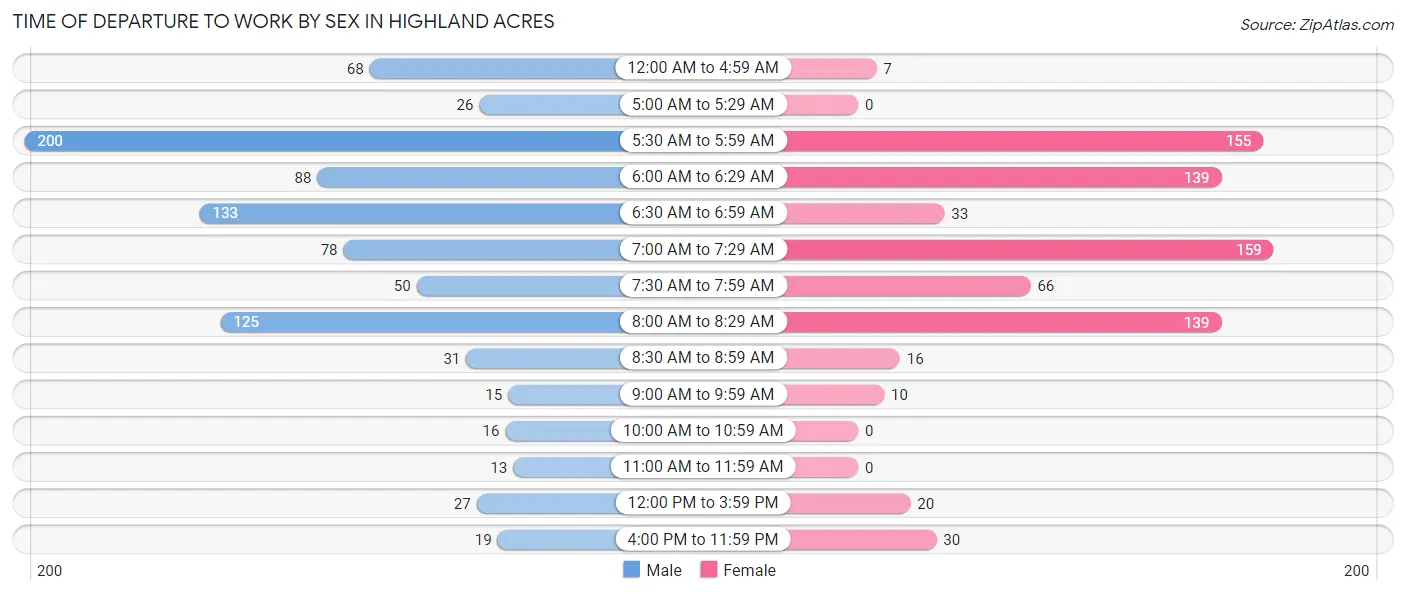
| Time of Departure | Male | Female |
| 12:00 AM to 4:59 AM | 68 (7.6%) | 7 (0.9%) |
| 5:00 AM to 5:29 AM | 26 (2.9%) | 0 (0.0%) |
| 5:30 AM to 5:59 AM | 200 (22.5%) | 155 (20.0%) |
| 6:00 AM to 6:29 AM | 88 (9.9%) | 139 (18.0%) |
| 6:30 AM to 6:59 AM | 133 (15.0%) | 33 (4.3%) |
| 7:00 AM to 7:29 AM | 78 (8.8%) | 159 (20.5%) |
| 7:30 AM to 7:59 AM | 50 (5.6%) | 66 (8.5%) |
| 8:00 AM to 8:29 AM | 125 (14.1%) | 139 (18.0%) |
| 8:30 AM to 8:59 AM | 31 (3.5%) | 16 (2.1%) |
| 9:00 AM to 9:59 AM | 15 (1.7%) | 10 (1.3%) |
| 10:00 AM to 10:59 AM | 16 (1.8%) | 0 (0.0%) |
| 11:00 AM to 11:59 AM | 13 (1.5%) | 0 (0.0%) |
| 12:00 PM to 3:59 PM | 27 (3.0%) | 20 (2.6%) |
| 4:00 PM to 11:59 PM | 19 (2.1%) | 30 (3.9%) |
| Total | 889 (100.0%) | 774 (100.0%) |
Housing Occupancy in Highland Acres
Occupancy by Ownership in Highland Acres
Of the total 1,360 dwellings in Highland Acres, owner-occupied units account for 1,213 (89.2%), while renter-occupied units make up 147 (10.8%).
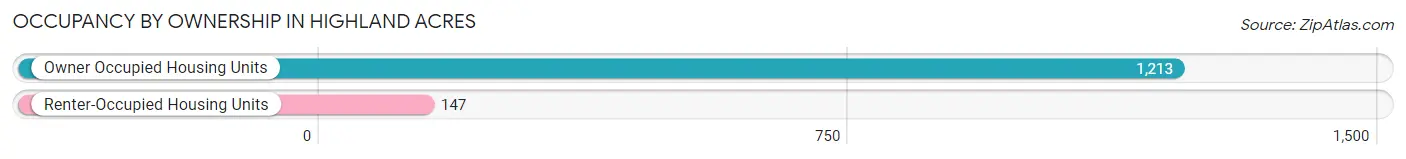
| Occupancy | # Housing Units | % Housing Units |
| Owner Occupied Housing Units | 1,213 | 89.2% |
| Renter-Occupied Housing Units | 147 | 10.8% |
| Total Occupied Housing Units | 1,360 | 100.0% |
Occupancy by Household Size in Highland Acres
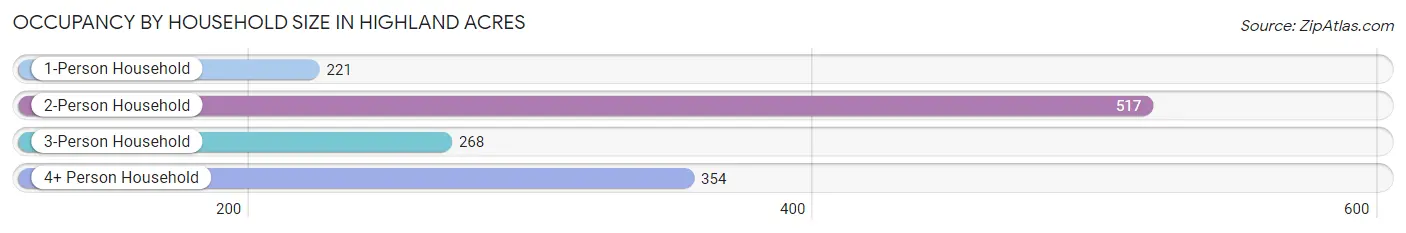
| Household Size | # Housing Units | % Housing Units |
| 1-Person Household | 221 | 16.3% |
| 2-Person Household | 517 | 38.0% |
| 3-Person Household | 268 | 19.7% |
| 4+ Person Household | 354 | 26.0% |
| Total Housing Units | 1,360 | 100.0% |
Occupancy by Ownership by Household Size in Highland Acres
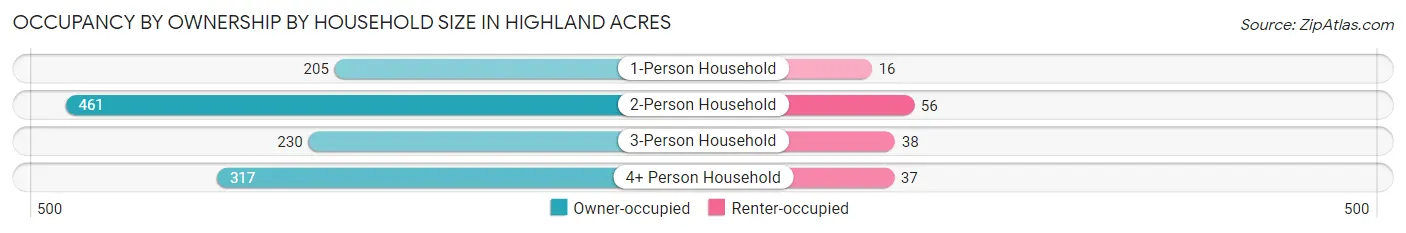
| Household Size | Owner-occupied | Renter-occupied |
| 1-Person Household | 205 (92.8%) | 16 (7.2%) |
| 2-Person Household | 461 (89.2%) | 56 (10.8%) |
| 3-Person Household | 230 (85.8%) | 38 (14.2%) |
| 4+ Person Household | 317 (89.5%) | 37 (10.4%) |
| Total Housing Units | 1,213 (89.2%) | 147 (10.8%) |
Occupancy by Educational Attainment in Highland Acres
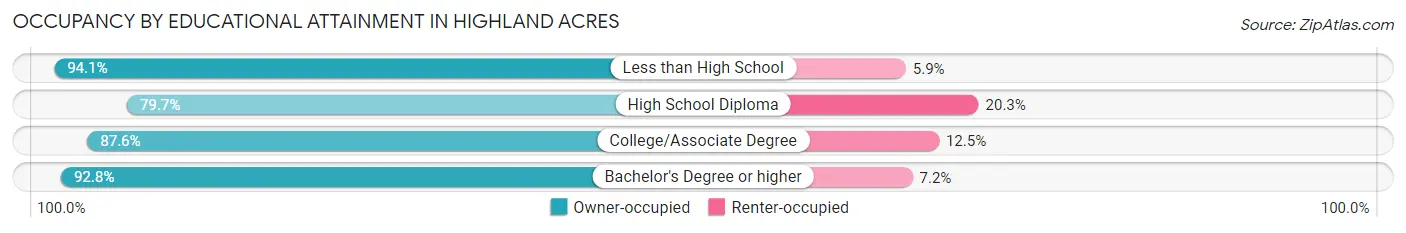
| Household Size | Owner-occupied | Renter-occupied |
| Less than High School | 16 (94.1%) | 1 (5.9%) |
| High School Diploma | 153 (79.7%) | 39 (20.3%) |
| College/Associate Degree | 401 (87.5%) | 57 (12.4%) |
| Bachelor's Degree or higher | 643 (92.8%) | 50 (7.2%) |
Occupancy by Age of Householder in Highland Acres
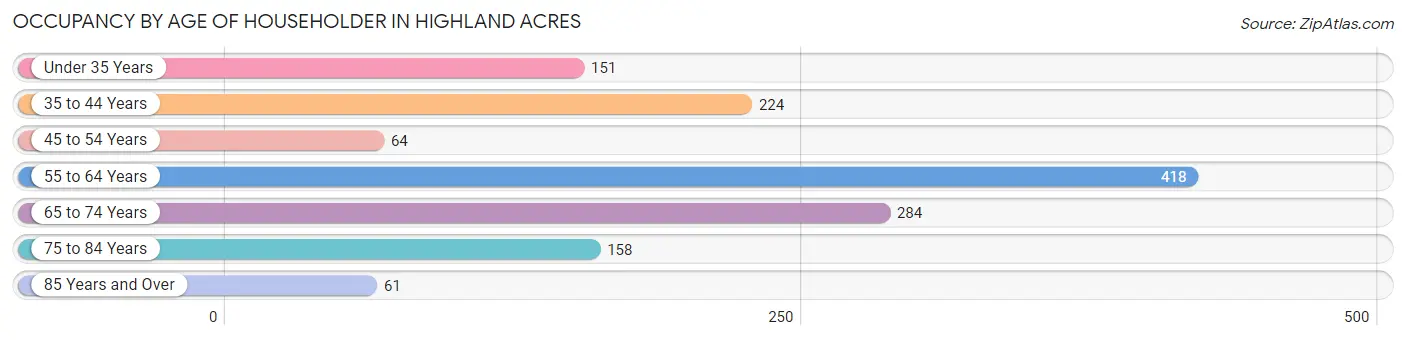
| Age Bracket | # Households | % Households |
| Under 35 Years | 151 | 11.1% |
| 35 to 44 Years | 224 | 16.5% |
| 45 to 54 Years | 64 | 4.7% |
| 55 to 64 Years | 418 | 30.7% |
| 65 to 74 Years | 284 | 20.9% |
| 75 to 84 Years | 158 | 11.6% |
| 85 Years and Over | 61 | 4.5% |
| Total | 1,360 | 100.0% |
Housing Finances in Highland Acres
Median Income by Occupancy in Highland Acres
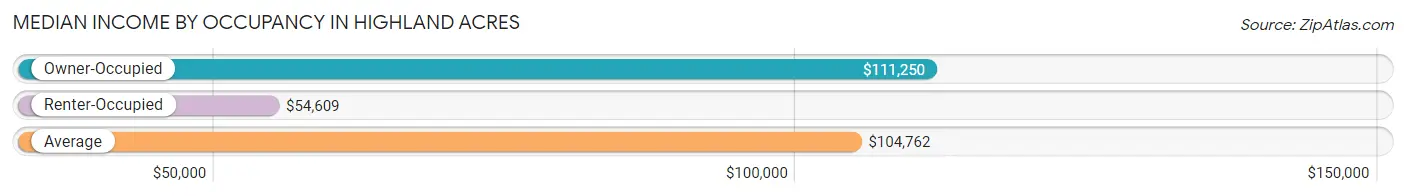
| Occupancy Type | # Households | Median Income |
| Owner-Occupied | 1,213 (89.2%) | $111,250 |
| Renter-Occupied | 147 (10.8%) | $54,609 |
| Average | 1,360 (100.0%) | $104,762 |
Occupancy by Householder Income Bracket in Highland Acres
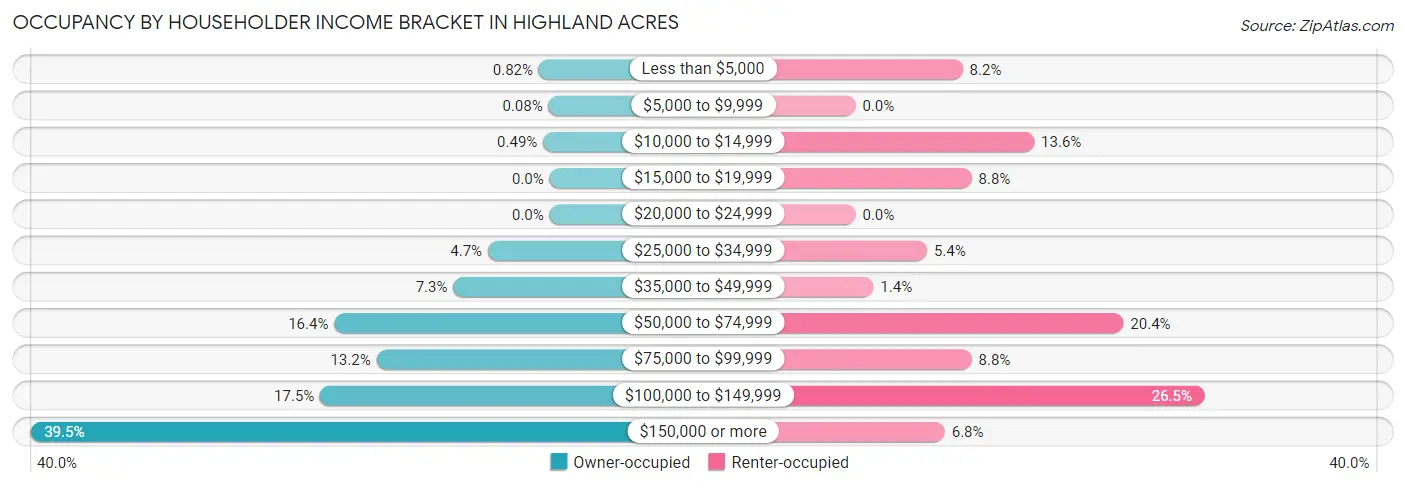
| Income Bracket | Owner-occupied | Renter-occupied |
| Less than $5,000 | 10 (0.8%) | 12 (8.2%) |
| $5,000 to $9,999 | 1 (0.1%) | 0 (0.0%) |
| $10,000 to $14,999 | 6 (0.5%) | 20 (13.6%) |
| $15,000 to $19,999 | 0 (0.0%) | 13 (8.8%) |
| $20,000 to $24,999 | 0 (0.0%) | 0 (0.0%) |
| $25,000 to $34,999 | 57 (4.7%) | 8 (5.4%) |
| $35,000 to $49,999 | 89 (7.3%) | 2 (1.4%) |
| $50,000 to $74,999 | 199 (16.4%) | 30 (20.4%) |
| $75,000 to $99,999 | 160 (13.2%) | 13 (8.8%) |
| $100,000 to $149,999 | 212 (17.5%) | 39 (26.5%) |
| $150,000 or more | 479 (39.5%) | 10 (6.8%) |
| Total | 1,213 (100.0%) | 147 (100.0%) |
Monthly Housing Cost Tiers in Highland Acres
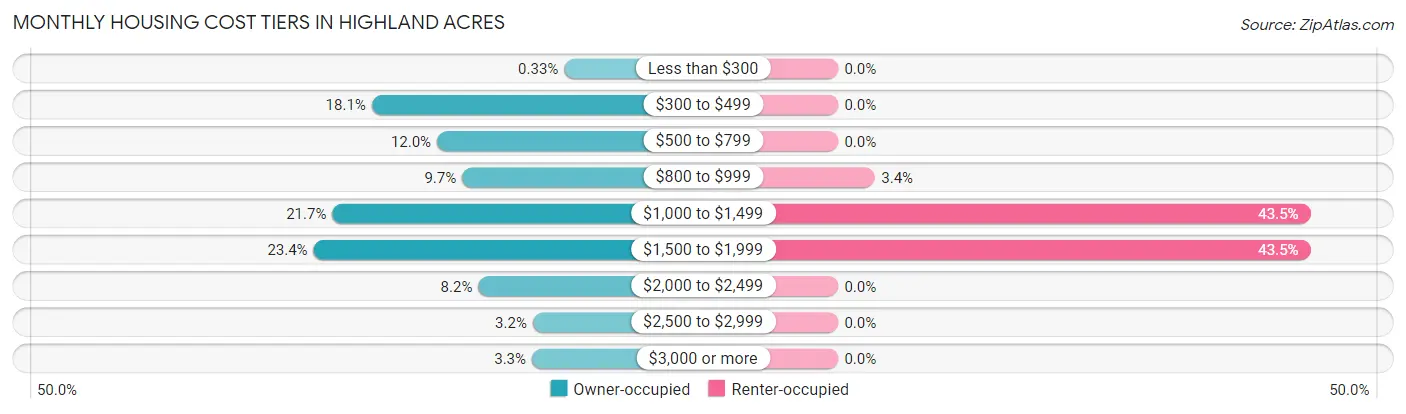
| Monthly Cost | Owner-occupied | Renter-occupied |
| Less than $300 | 4 (0.3%) | 0 (0.0%) |
| $300 to $499 | 219 (18.0%) | 0 (0.0%) |
| $500 to $799 | 146 (12.0%) | 0 (0.0%) |
| $800 to $999 | 118 (9.7%) | 5 (3.4%) |
| $1,000 to $1,499 | 263 (21.7%) | 64 (43.5%) |
| $1,500 to $1,999 | 284 (23.4%) | 64 (43.5%) |
| $2,000 to $2,499 | 100 (8.2%) | 0 (0.0%) |
| $2,500 to $2,999 | 39 (3.2%) | 0 (0.0%) |
| $3,000 or more | 40 (3.3%) | 0 (0.0%) |
| Total | 1,213 (100.0%) | 147 (100.0%) |
Physical Housing Characteristics in Highland Acres
Housing Structures in Highland Acres
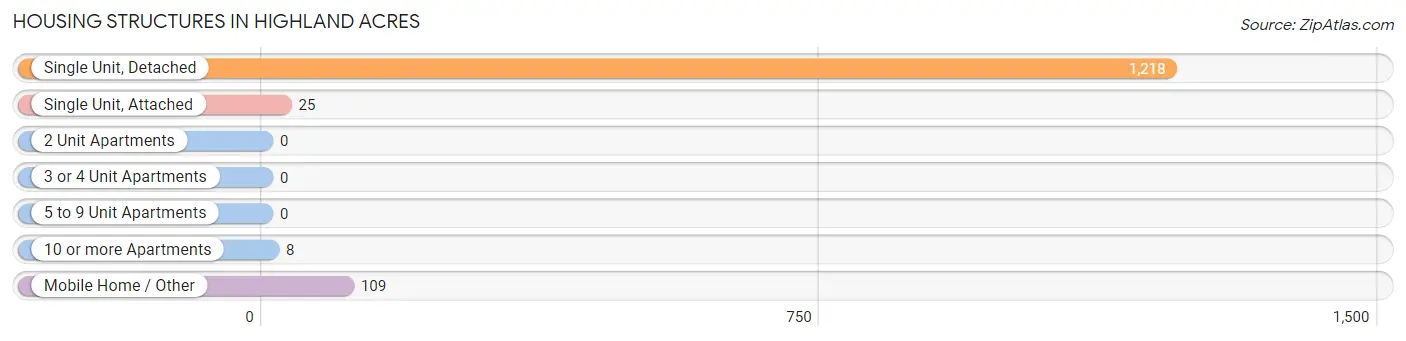
| Structure Type | # Housing Units | % Housing Units |
| Single Unit, Detached | 1,218 | 89.6% |
| Single Unit, Attached | 25 | 1.8% |
| 2 Unit Apartments | 0 | 0.0% |
| 3 or 4 Unit Apartments | 0 | 0.0% |
| 5 to 9 Unit Apartments | 0 | 0.0% |
| 10 or more Apartments | 8 | 0.6% |
| Mobile Home / Other | 109 | 8.0% |
| Total | 1,360 | 100.0% |
Housing Structures by Occupancy in Highland Acres
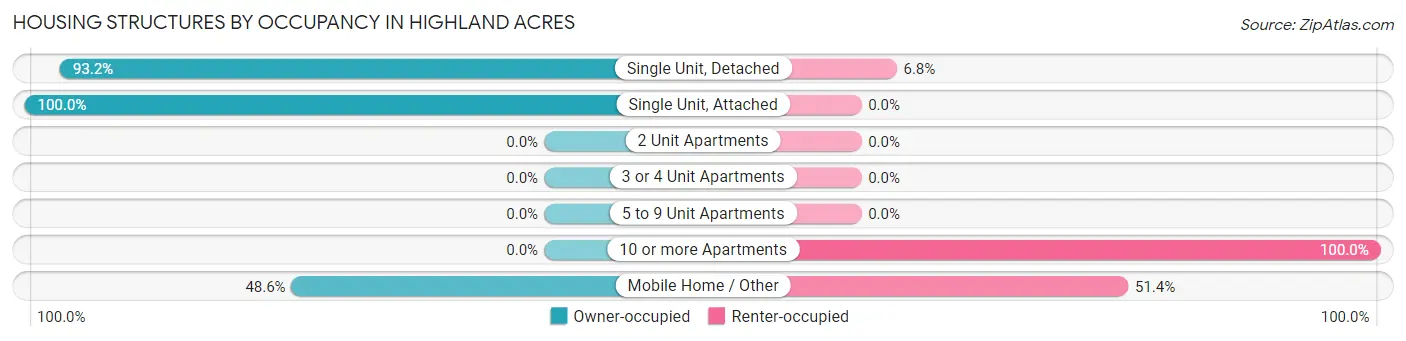
| Structure Type | Owner-occupied | Renter-occupied |
| Single Unit, Detached | 1,135 (93.2%) | 83 (6.8%) |
| Single Unit, Attached | 25 (100.0%) | 0 (0.0%) |
| 2 Unit Apartments | 0 (0.0%) | 0 (0.0%) |
| 3 or 4 Unit Apartments | 0 (0.0%) | 0 (0.0%) |
| 5 to 9 Unit Apartments | 0 (0.0%) | 0 (0.0%) |
| 10 or more Apartments | 0 (0.0%) | 8 (100.0%) |
| Mobile Home / Other | 53 (48.6%) | 56 (51.4%) |
| Total | 1,213 (89.2%) | 147 (10.8%) |
Housing Structures by Number of Rooms in Highland Acres
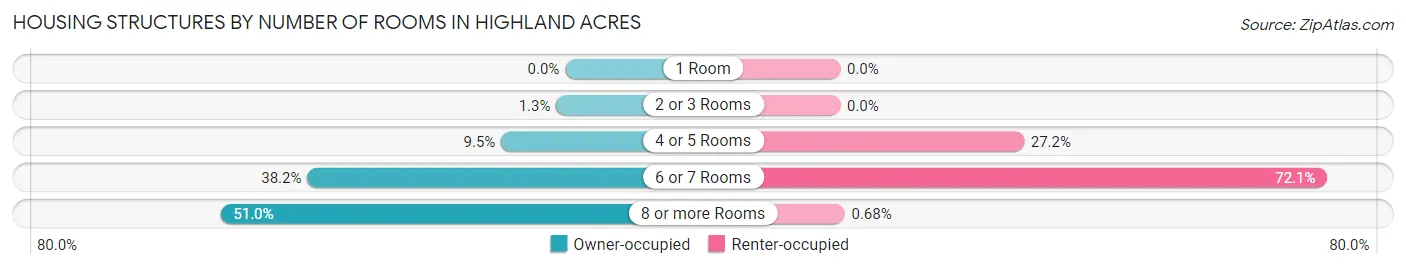
| Number of Rooms | Owner-occupied | Renter-occupied |
| 1 Room | 0 (0.0%) | 0 (0.0%) |
| 2 or 3 Rooms | 16 (1.3%) | 0 (0.0%) |
| 4 or 5 Rooms | 115 (9.5%) | 40 (27.2%) |
| 6 or 7 Rooms | 463 (38.2%) | 106 (72.1%) |
| 8 or more Rooms | 619 (51.0%) | 1 (0.7%) |
| Total | 1,213 (100.0%) | 147 (100.0%) |
Housing Structure by Heating Type in Highland Acres
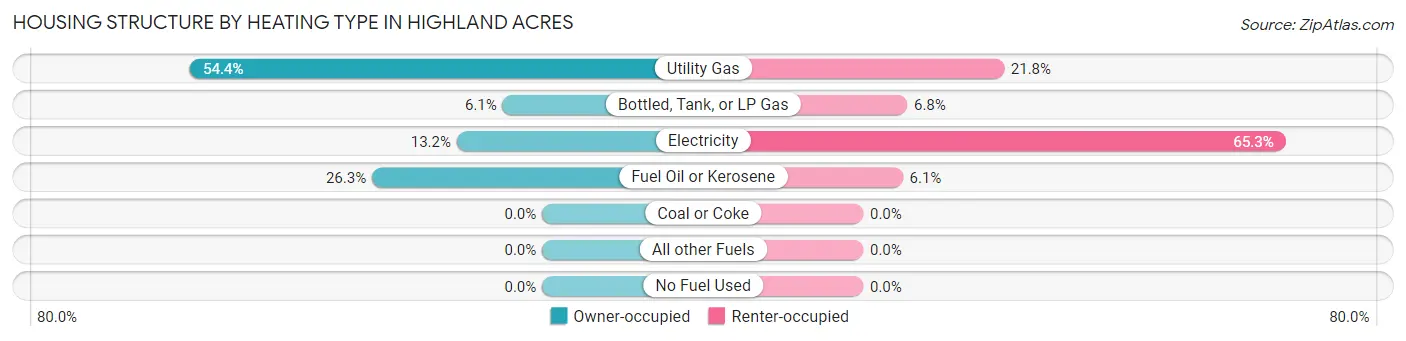
| Heating Type | Owner-occupied | Renter-occupied |
| Utility Gas | 660 (54.4%) | 32 (21.8%) |
| Bottled, Tank, or LP Gas | 74 (6.1%) | 10 (6.8%) |
| Electricity | 160 (13.2%) | 96 (65.3%) |
| Fuel Oil or Kerosene | 319 (26.3%) | 9 (6.1%) |
| Coal or Coke | 0 (0.0%) | 0 (0.0%) |
| All other Fuels | 0 (0.0%) | 0 (0.0%) |
| No Fuel Used | 0 (0.0%) | 0 (0.0%) |
| Total | 1,213 (100.0%) | 147 (100.0%) |
Household Vehicle Usage in Highland Acres
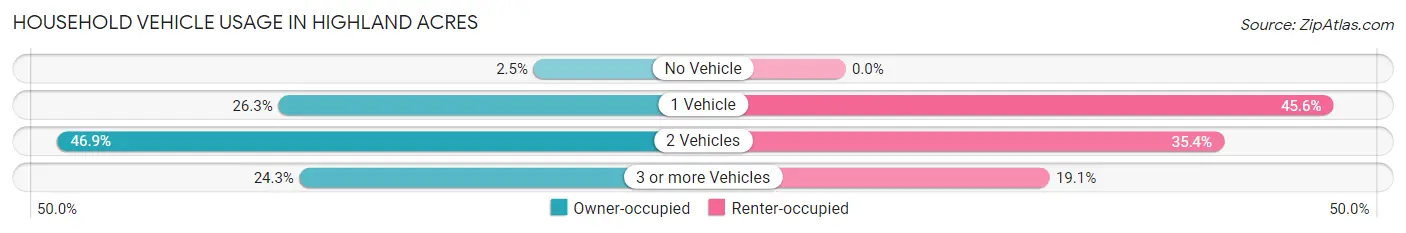
| Vehicles per Household | Owner-occupied | Renter-occupied |
| No Vehicle | 30 (2.5%) | 0 (0.0%) |
| 1 Vehicle | 319 (26.3%) | 67 (45.6%) |
| 2 Vehicles | 569 (46.9%) | 52 (35.4%) |
| 3 or more Vehicles | 295 (24.3%) | 28 (19.1%) |
| Total | 1,213 (100.0%) | 147 (100.0%) |
Real Estate & Mortgages in Highland Acres
Real Estate and Mortgage Overview in Highland Acres
| Characteristic | Without Mortgage | With Mortgage |
| Housing Units | 391 | 822 |
| Median Property Value | $278,400 | $283,300 |
| Median Household Income | $72,656 | $390 |
| Monthly Housing Costs | $481 | $40 |
| Real Estate Taxes | $1,548 | $43 |
Property Value by Mortgage Status in Highland Acres
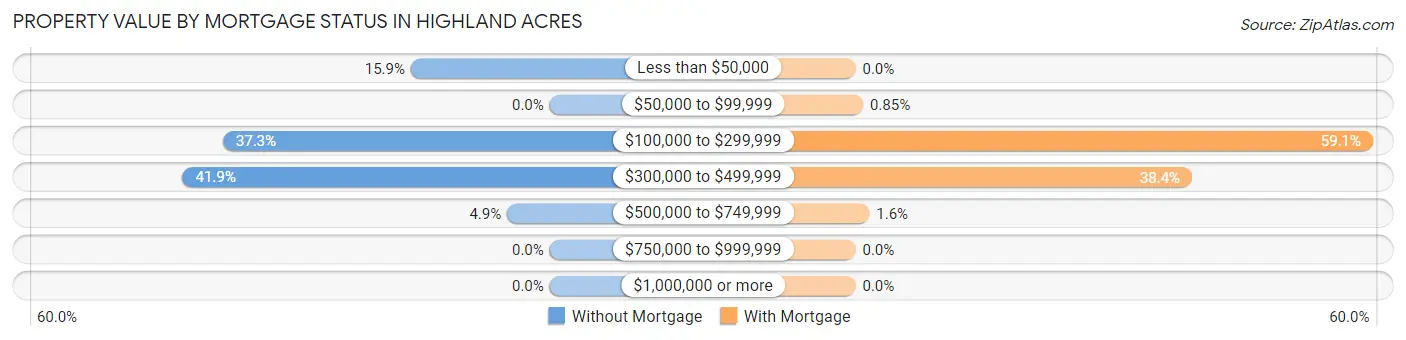
| Property Value | Without Mortgage | With Mortgage |
| Less than $50,000 | 62 (15.9%) | 0 (0.0%) |
| $50,000 to $99,999 | 0 (0.0%) | 7 (0.9%) |
| $100,000 to $299,999 | 146 (37.3%) | 486 (59.1%) |
| $300,000 to $499,999 | 164 (41.9%) | 316 (38.4%) |
| $500,000 to $749,999 | 19 (4.9%) | 13 (1.6%) |
| $750,000 to $999,999 | 0 (0.0%) | 0 (0.0%) |
| $1,000,000 or more | 0 (0.0%) | 0 (0.0%) |
| Total | 391 (100.0%) | 822 (100.0%) |
Household Income by Mortgage Status in Highland Acres
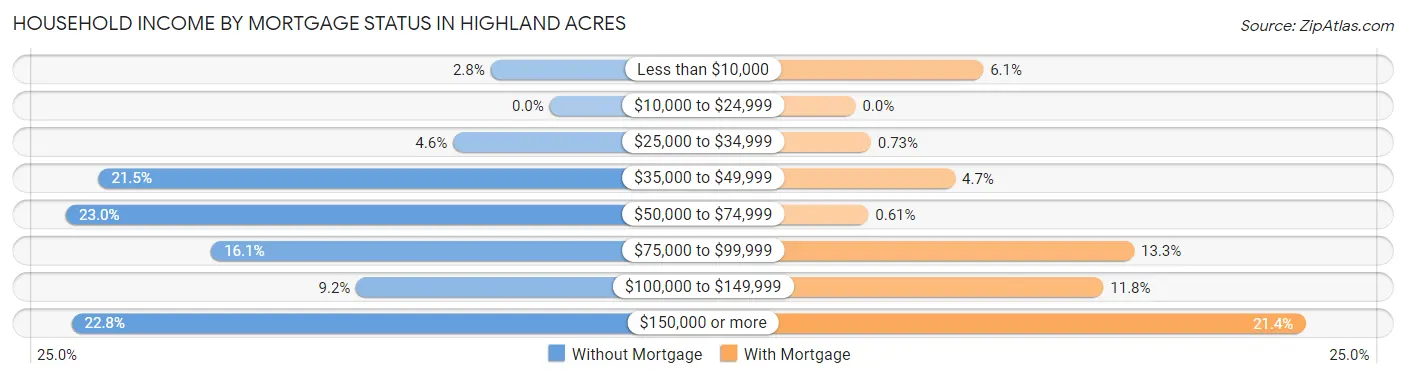
| Household Income | Without Mortgage | With Mortgage |
| Less than $10,000 | 11 (2.8%) | 50 (6.1%) |
| $10,000 to $24,999 | 0 (0.0%) | 0 (0.0%) |
| $25,000 to $34,999 | 18 (4.6%) | 6 (0.7%) |
| $35,000 to $49,999 | 84 (21.5%) | 39 (4.7%) |
| $50,000 to $74,999 | 90 (23.0%) | 5 (0.6%) |
| $75,000 to $99,999 | 63 (16.1%) | 109 (13.3%) |
| $100,000 to $149,999 | 36 (9.2%) | 97 (11.8%) |
| $150,000 or more | 89 (22.8%) | 176 (21.4%) |
| Total | 391 (100.0%) | 822 (100.0%) |
Property Value to Household Income Ratio in Highland Acres
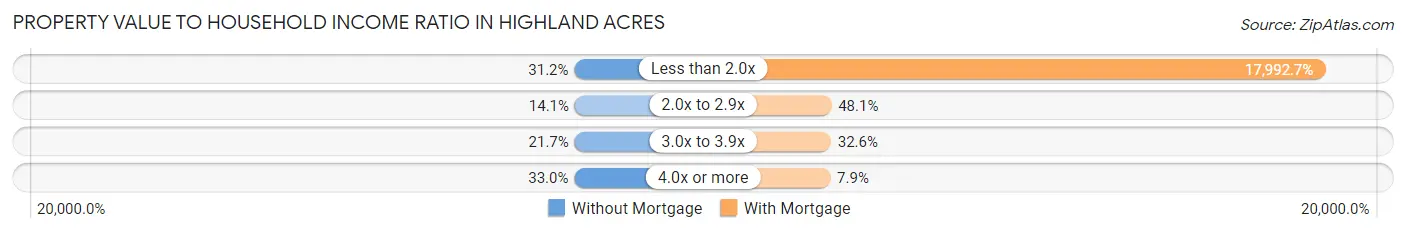
| Value-to-Income Ratio | Without Mortgage | With Mortgage |
| Less than 2.0x | 122 (31.2%) | 147,900 (17,992.7%) |
| 2.0x to 2.9x | 55 (14.1%) | 395 (48.0%) |
| 3.0x to 3.9x | 85 (21.7%) | 268 (32.6%) |
| 4.0x or more | 129 (33.0%) | 65 (7.9%) |
| Total | 391 (100.0%) | 822 (100.0%) |
Real Estate Taxes by Mortgage Status in Highland Acres
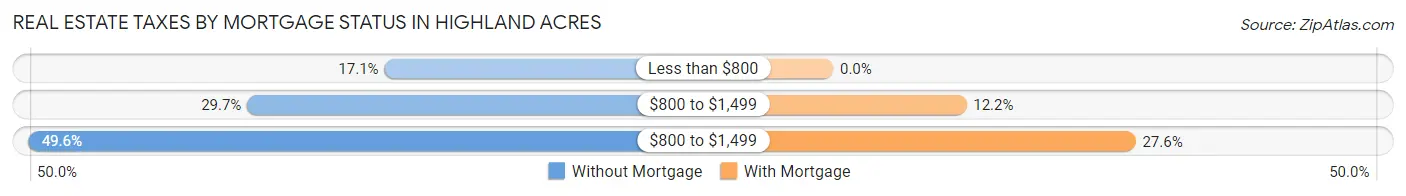
| Property Taxes | Without Mortgage | With Mortgage |
| Less than $800 | 67 (17.1%) | 0 (0.0%) |
| $800 to $1,499 | 116 (29.7%) | 100 (12.2%) |
| $800 to $1,499 | 194 (49.6%) | 227 (27.6%) |
| Total | 391 (100.0%) | 822 (100.0%) |
Health & Disability in Highland Acres
Health Insurance Coverage by Age in Highland Acres
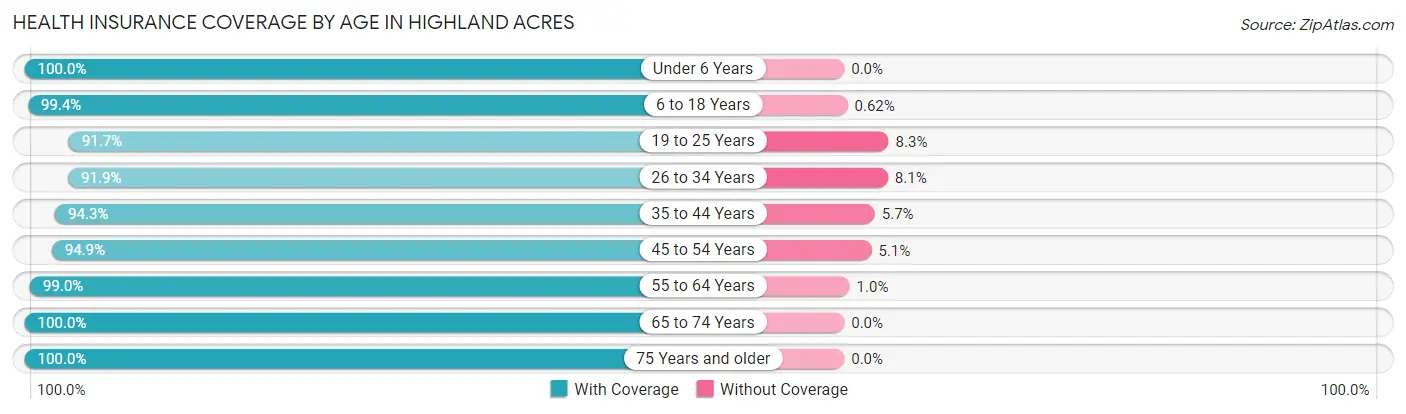
| Age Bracket | With Coverage | Without Coverage |
| Under 6 Years | 88 (100.0%) | 0 (0.0%) |
| 6 to 18 Years | 803 (99.4%) | 5 (0.6%) |
| 19 to 25 Years | 244 (91.7%) | 22 (8.3%) |
| 26 to 34 Years | 384 (91.9%) | 34 (8.1%) |
| 35 to 44 Years | 281 (94.3%) | 17 (5.7%) |
| 45 to 54 Years | 355 (94.9%) | 19 (5.1%) |
| 55 to 64 Years | 795 (99.0%) | 8 (1.0%) |
| 65 to 74 Years | 495 (100.0%) | 0 (0.0%) |
| 75 Years and older | 292 (100.0%) | 0 (0.0%) |
| Total | 3,737 (97.3%) | 105 (2.7%) |
Health Insurance Coverage by Citizenship Status in Highland Acres
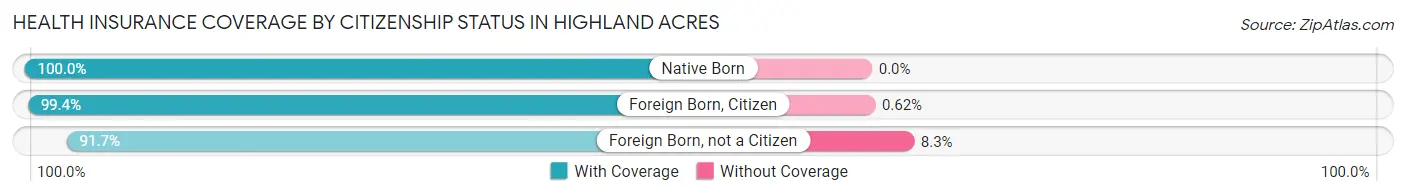
| Citizenship Status | With Coverage | Without Coverage |
| Native Born | 88 (100.0%) | 0 (0.0%) |
| Foreign Born, Citizen | 803 (99.4%) | 5 (0.6%) |
| Foreign Born, not a Citizen | 244 (91.7%) | 22 (8.3%) |
Health Insurance Coverage by Household Income in Highland Acres
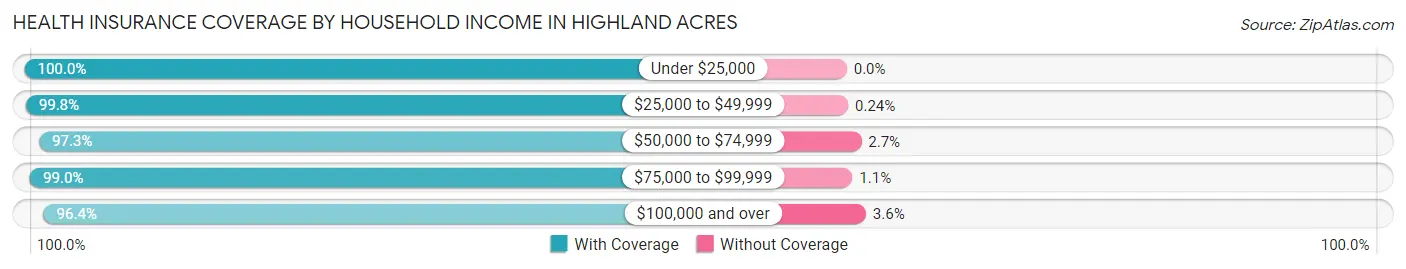
| Household Income | With Coverage | Without Coverage |
| Under $25,000 | 81 (100.0%) | 0 (0.0%) |
| $25,000 to $49,999 | 415 (99.8%) | 1 (0.2%) |
| $50,000 to $74,999 | 679 (97.3%) | 19 (2.7%) |
| $75,000 to $99,999 | 378 (99.0%) | 4 (1.1%) |
| $100,000 and over | 2,179 (96.4%) | 81 (3.6%) |
Public vs Private Health Insurance Coverage by Age in Highland Acres
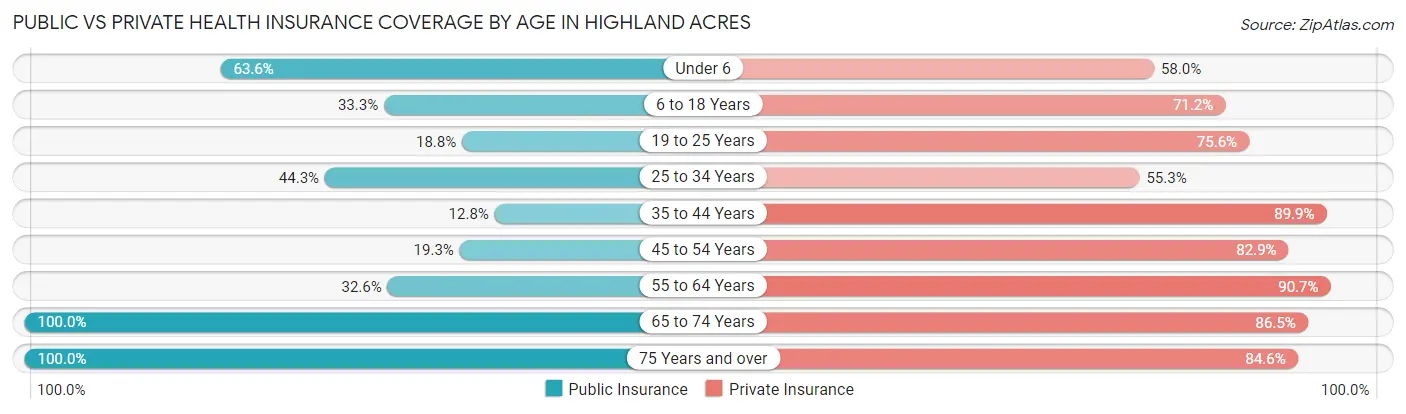
| Age Bracket | Public Insurance | Private Insurance |
| Under 6 | 56 (63.6%) | 51 (58.0%) |
| 6 to 18 Years | 269 (33.3%) | 575 (71.2%) |
| 19 to 25 Years | 50 (18.8%) | 201 (75.6%) |
| 25 to 34 Years | 185 (44.3%) | 231 (55.3%) |
| 35 to 44 Years | 38 (12.8%) | 268 (89.9%) |
| 45 to 54 Years | 72 (19.3%) | 310 (82.9%) |
| 55 to 64 Years | 262 (32.6%) | 728 (90.7%) |
| 65 to 74 Years | 495 (100.0%) | 428 (86.5%) |
| 75 Years and over | 292 (100.0%) | 247 (84.6%) |
| Total | 1,719 (44.7%) | 3,039 (79.1%) |
Disability Status by Sex by Age in Highland Acres
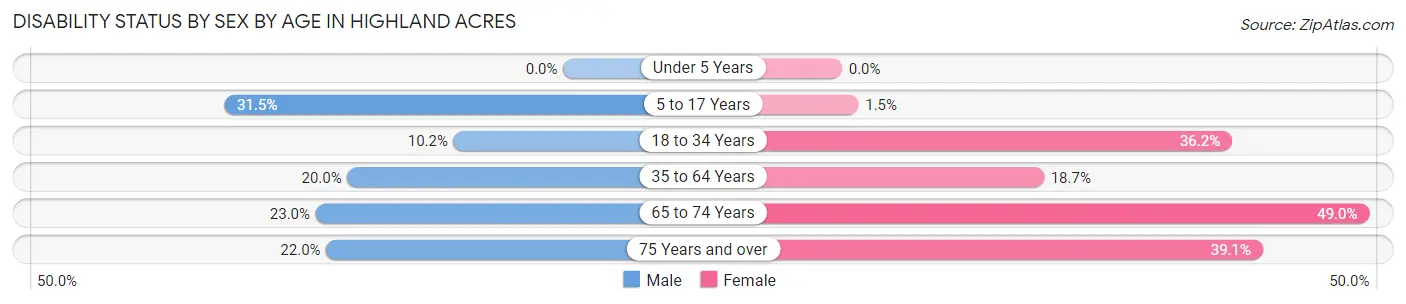
| Age Bracket | Male | Female |
| Under 5 Years | 0 (0.0%) | 0 (0.0%) |
| 5 to 17 Years | 154 (31.5%) | 5 (1.5%) |
| 18 to 34 Years | 36 (10.2%) | 126 (36.2%) |
| 35 to 64 Years | 149 (20.0%) | 137 (18.7%) |
| 65 to 74 Years | 48 (23.0%) | 140 (48.9%) |
| 75 Years and over | 31 (22.0%) | 59 (39.1%) |
Disability Class by Sex by Age in Highland Acres
Disability Class: Hearing Difficulty
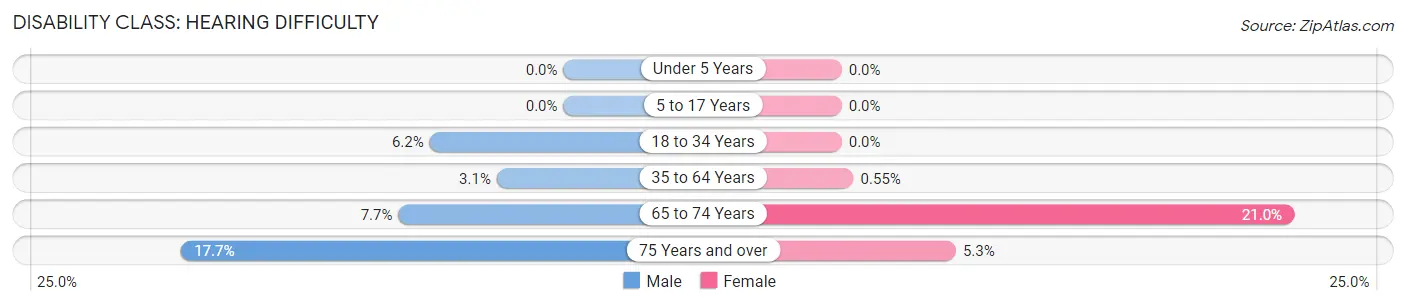
| Age Bracket | Male | Female |
| Under 5 Years | 0 (0.0%) | 0 (0.0%) |
| 5 to 17 Years | 0 (0.0%) | 0 (0.0%) |
| 18 to 34 Years | 22 (6.2%) | 0 (0.0%) |
| 35 to 64 Years | 23 (3.1%) | 4 (0.5%) |
| 65 to 74 Years | 16 (7.7%) | 60 (21.0%) |
| 75 Years and over | 25 (17.7%) | 8 (5.3%) |
Disability Class: Vision Difficulty
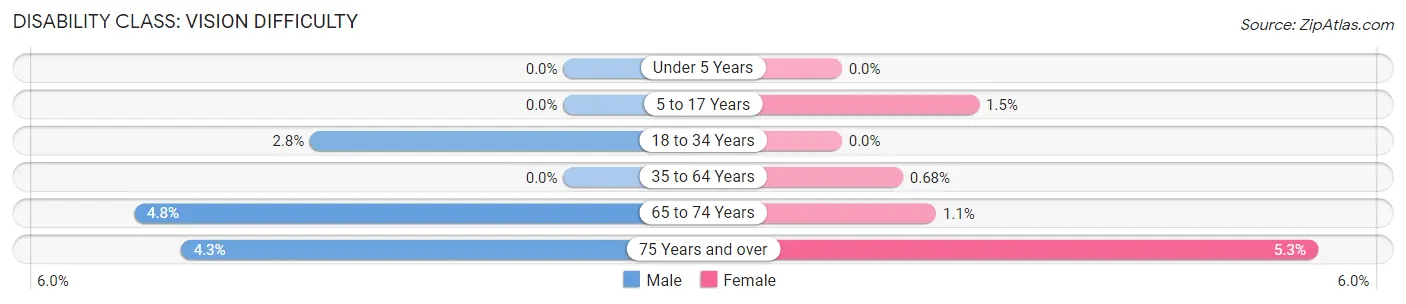
| Age Bracket | Male | Female |
| Under 5 Years | 0 (0.0%) | 0 (0.0%) |
| 5 to 17 Years | 0 (0.0%) | 5 (1.5%) |
| 18 to 34 Years | 10 (2.8%) | 0 (0.0%) |
| 35 to 64 Years | 0 (0.0%) | 5 (0.7%) |
| 65 to 74 Years | 10 (4.8%) | 3 (1.1%) |
| 75 Years and over | 6 (4.3%) | 8 (5.3%) |
Disability Class: Cognitive Difficulty
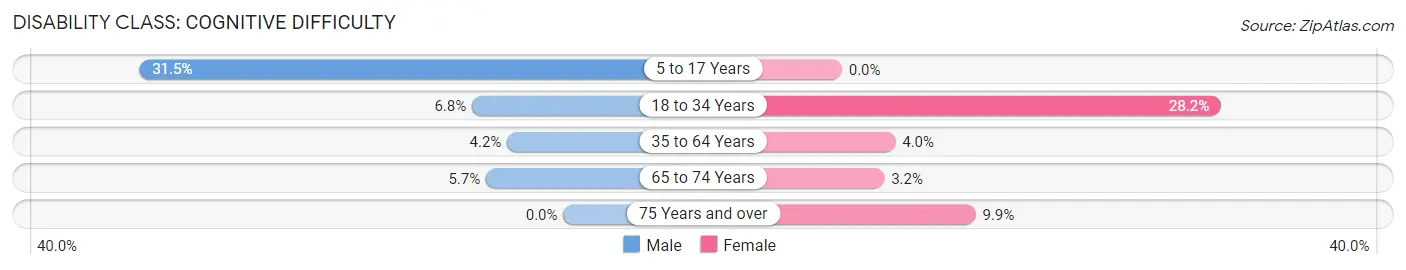
| Age Bracket | Male | Female |
| 5 to 17 Years | 154 (31.5%) | 0 (0.0%) |
| 18 to 34 Years | 24 (6.8%) | 98 (28.2%) |
| 35 to 64 Years | 31 (4.2%) | 29 (4.0%) |
| 65 to 74 Years | 12 (5.7%) | 9 (3.2%) |
| 75 Years and over | 0 (0.0%) | 15 (9.9%) |
Disability Class: Ambulatory Difficulty
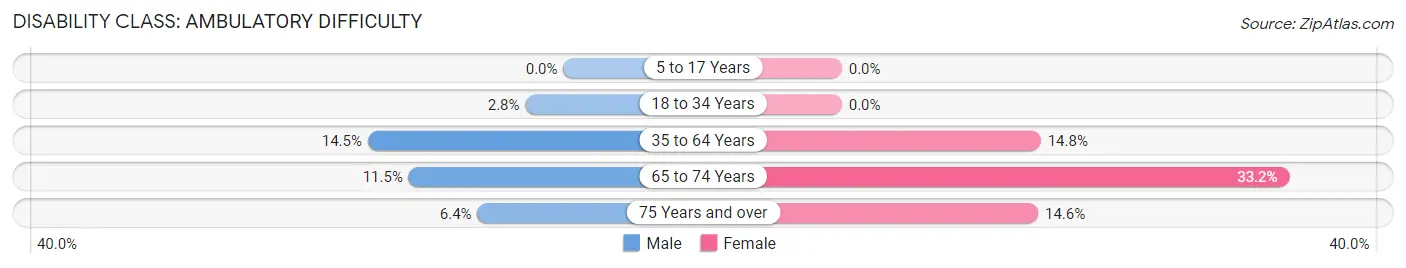
| Age Bracket | Male | Female |
| 5 to 17 Years | 0 (0.0%) | 0 (0.0%) |
| 18 to 34 Years | 10 (2.8%) | 0 (0.0%) |
| 35 to 64 Years | 108 (14.5%) | 108 (14.8%) |
| 65 to 74 Years | 24 (11.5%) | 95 (33.2%) |
| 75 Years and over | 9 (6.4%) | 22 (14.6%) |
Disability Class: Self-Care Difficulty
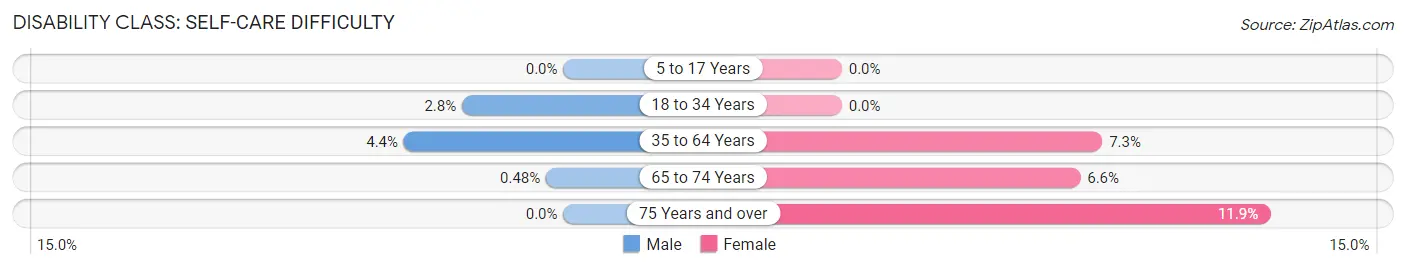
| Age Bracket | Male | Female |
| 5 to 17 Years | 0 (0.0%) | 0 (0.0%) |
| 18 to 34 Years | 10 (2.8%) | 0 (0.0%) |
| 35 to 64 Years | 33 (4.4%) | 53 (7.2%) |
| 65 to 74 Years | 1 (0.5%) | 19 (6.6%) |
| 75 Years and over | 0 (0.0%) | 18 (11.9%) |
Technology Access in Highland Acres
Computing Device Access in Highland Acres
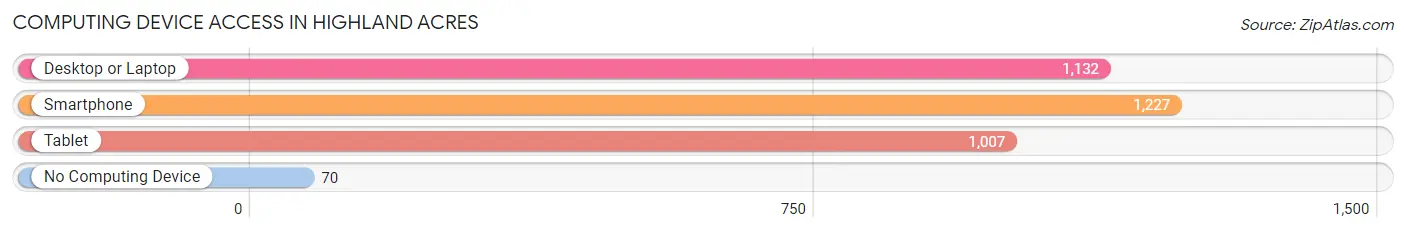
| Device Type | # Households | % Households |
| Desktop or Laptop | 1,132 | 83.2% |
| Smartphone | 1,227 | 90.2% |
| Tablet | 1,007 | 74.0% |
| No Computing Device | 70 | 5.1% |
| Total | 1,360 | 100.0% |
Internet Access in Highland Acres
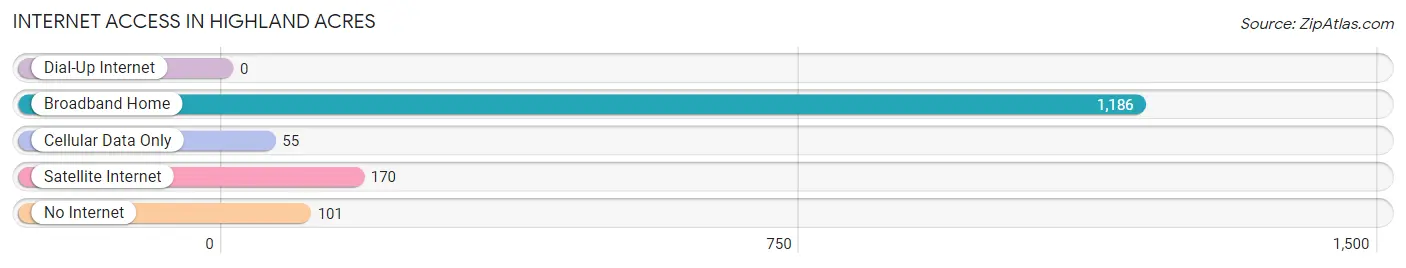
| Internet Type | # Households | % Households |
| Dial-Up Internet | 0 | 0.0% |
| Broadband Home | 1,186 | 87.2% |
| Cellular Data Only | 55 | 4.0% |
| Satellite Internet | 170 | 12.5% |
| No Internet | 101 | 7.4% |
| Total | 1,360 | 100.0% |
Highland Acres Summary
Highland Acres is a small unincorporated community located in Sussex County, Delaware. It is situated in the southern part of the state, approximately 10 miles south of the state capital, Dover. The community is bordered by the towns of Milford, Harrington, and Greenwood.
History
Highland Acres was founded in the late 1800s by a group of farmers who were looking for a place to settle and raise their families. The area was originally known as “Highland” and was part of a larger tract of land owned by the Milford and Harrington families. In the early 1900s, the area was divided into smaller parcels and sold to individual farmers. The area was renamed “Highland Acres” in the 1940s.
Geography
Highland Acres is located in the southern part of Sussex County, Delaware. It is situated in the Delmarva Peninsula, which is bordered by the Atlantic Ocean to the east and the Chesapeake Bay to the west. The community is located in a rural area and is surrounded by farmland and woodlands. The area is characterized by rolling hills and flat plains.
Economy
Highland Acres is a small, rural community with a limited economy. The primary industry in the area is agriculture, with many of the local farmers growing corn, soybeans, and other crops. There are also several small businesses in the area, including a few restaurants, convenience stores, and a gas station.
Demographics
As of the 2010 census, the population of Highland Acres was 1,845. The racial makeup of the community was 94.3% White, 2.2% African American, 0.3% Native American, 0.7% Asian, and 2.5% from other races. The median household income was $45,938, and the median age was 43.7 years.
Highland Acres is a small, rural community with a rich history and a diverse population. The area is known for its agricultural heritage and its close-knit community. Despite its small size, Highland Acres is a vibrant and welcoming place to live.
Common Questions
What is Per Capita Income in Highland Acres?
Per Capita income in Highland Acres is $44,615.
What is the Median Family Income in Highland Acres?
Median Family Income in Highland Acres is $115,500.
What is the Median Household income in Highland Acres?
Median Household Income in Highland Acres is $104,762.
What is Income or Wage Gap in Highland Acres?
Income or Wage Gap in Highland Acres is 9.1%.
Women in Highland Acres earn 90.9 cents for every dollar earned by a man.
What is Inequality or Gini Index in Highland Acres?
Inequality or Gini Index in Highland Acres is 0.36.
What is the Total Population of Highland Acres?
Total Population of Highland Acres is 3,892.
What is the Total Male Population of Highland Acres?
Total Male Population of Highland Acres is 2,020.
What is the Total Female Population of Highland Acres?
Total Female Population of Highland Acres is 1,872.
What is the Ratio of Males per 100 Females in Highland Acres?
There are 107.91 Males per 100 Females in Highland Acres.
What is the Ratio of Females per 100 Males in Highland Acres?
There are 92.67 Females per 100 Males in Highland Acres.
What is the Median Population Age in Highland Acres?
Median Population Age in Highland Acres is 45.5 Years.
What is the Average Family Size in Highland Acres
Average Family Size in Highland Acres is 3.1 People.
What is the Average Household Size in Highland Acres
Average Household Size in Highland Acres is 2.9 People.
How Large is the Labor Force in Highland Acres?
There are 1,814 People in the Labor Forcein in Highland Acres.
What is the Percentage of People in the Labor Force in Highland Acres?
53.8% of People are in the Labor Force in Highland Acres.
What is the Unemployment Rate in Highland Acres?
Unemployment Rate in Highland Acres is 3.0%.