Sheridan, CO Map & Demographics
Sheridan Map
Sheridan Overview
$29,789
PER CAPITA INCOME
$62,478
AVG FAMILY INCOME
$53,707
AVG HOUSEHOLD INCOME
7.9%
WAGE / INCOME GAP [ % ]
92.1¢/ $1
WAGE / INCOME GAP [ $ ]
$15,174
FAMILY INCOME DEFICIT
0.47
INEQUALITY / GINI INDEX
6,062
TOTAL POPULATION
2,921
MALE POPULATION
3,141
FEMALE POPULATION
93.00
MALES / 100 FEMALES
107.53
FEMALES / 100 MALES
35.6
MEDIAN AGE
3.5
AVG FAMILY SIZE
2.5
AVG HOUSEHOLD SIZE
3,035
LABOR FORCE [ PEOPLE ]
63.3%
PERCENT IN LABOR FORCE
10.1%
UNEMPLOYMENT RATE
Sheridan Area Codes
Income in Sheridan
Income Overview in Sheridan
Per Capita Income in Sheridan is $29,789, while median incomes of families and households are $62,478 and $53,707 respectively.
| Characteristic | Number | Measure |
| Per Capita Income | 6,062 | $29,789 |
| Median Family Income | 1,253 | $62,478 |
| Mean Family Income | 1,253 | $85,131 |
| Median Household Income | 2,442 | $53,707 |
| Mean Household Income | 2,442 | $71,448 |
| Income Deficit | 1,253 | $15,174 |
| Wage / Income Gap (%) | 6,062 | 7.90% |
| Wage / Income Gap ($) | 6,062 | 92.10¢ per $1 |
| Gini / Inequality Index | 6,062 | 0.47 |
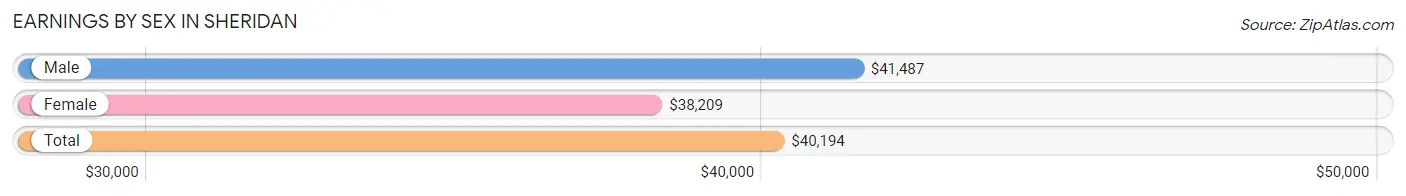
Earnings by Sex in Sheridan
Average Earnings in Sheridan are $40,194, $41,487 for men and $38,209 for women, a difference of 7.9%.
| Sex | Number | Average Earnings |
| Male | 1,735 (54.9%) | $41,487 |
| Female | 1,423 (45.1%) | $38,209 |
| Total | 3,158 (100.0%) | $40,194 |
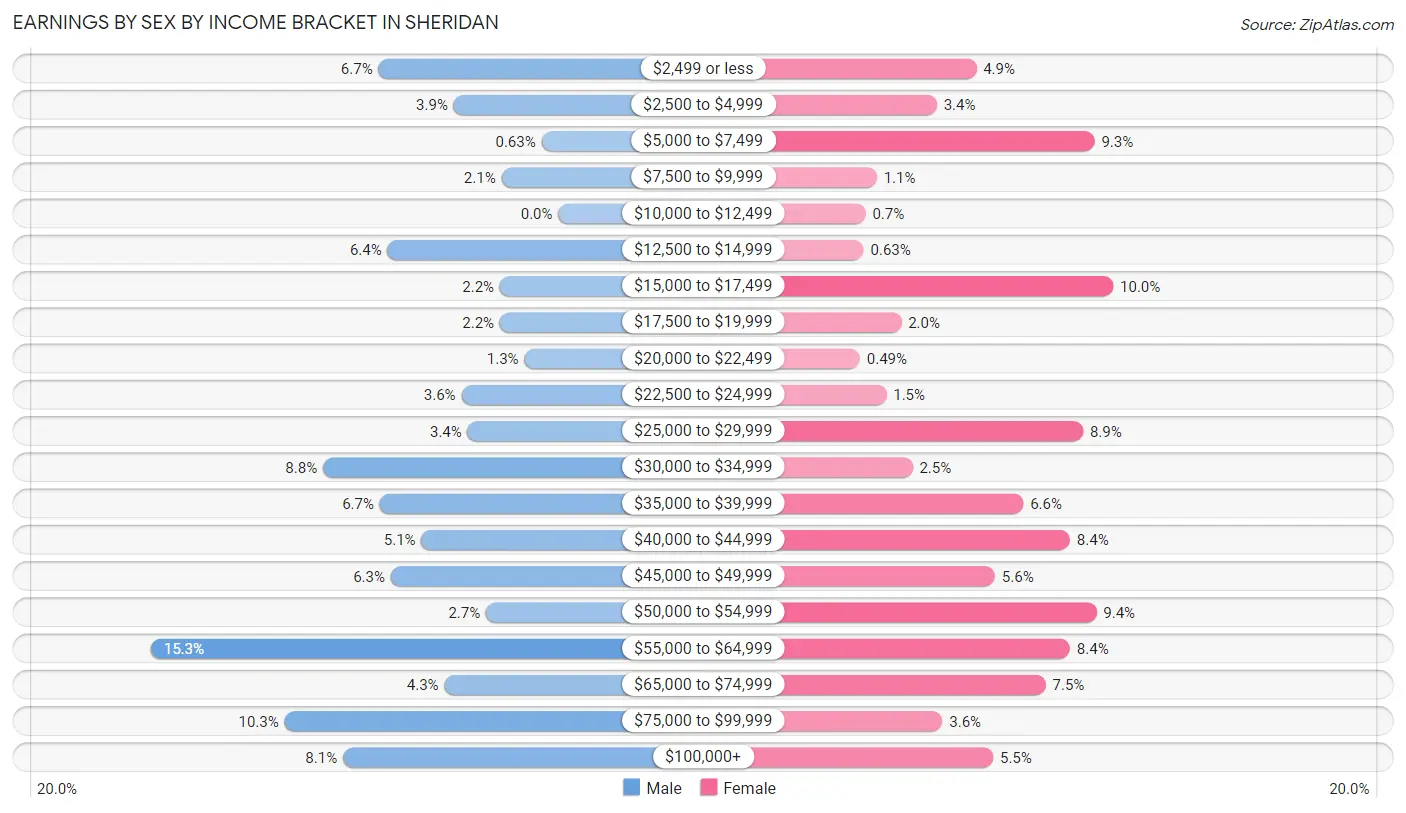
Earnings by Sex by Income Bracket in Sheridan
The most common earnings brackets in Sheridan are $55,000 to $64,999 for men (265 | 15.3%) and $15,000 to $17,499 for women (142 | 10.0%).
| Income | Male | Female |
| $2,499 or less | 117 (6.7%) | 69 (4.9%) |
| $2,500 to $4,999 | 68 (3.9%) | 48 (3.4%) |
| $5,000 to $7,499 | 11 (0.6%) | 132 (9.3%) |
| $7,500 to $9,999 | 37 (2.1%) | 16 (1.1%) |
| $10,000 to $12,499 | 0 (0.0%) | 10 (0.7%) |
| $12,500 to $14,999 | 111 (6.4%) | 9 (0.6%) |
| $15,000 to $17,499 | 38 (2.2%) | 142 (10.0%) |
| $17,500 to $19,999 | 38 (2.2%) | 29 (2.0%) |
| $20,000 to $22,499 | 22 (1.3%) | 7 (0.5%) |
| $22,500 to $24,999 | 63 (3.6%) | 21 (1.5%) |
| $25,000 to $29,999 | 59 (3.4%) | 126 (8.8%) |
| $30,000 to $34,999 | 153 (8.8%) | 35 (2.5%) |
| $35,000 to $39,999 | 116 (6.7%) | 94 (6.6%) |
| $40,000 to $44,999 | 89 (5.1%) | 119 (8.4%) |
| $45,000 to $49,999 | 109 (6.3%) | 79 (5.6%) |
| $50,000 to $54,999 | 47 (2.7%) | 133 (9.3%) |
| $55,000 to $64,999 | 265 (15.3%) | 119 (8.4%) |
| $65,000 to $74,999 | 74 (4.3%) | 106 (7.4%) |
| $75,000 to $99,999 | 178 (10.3%) | 51 (3.6%) |
| $100,000+ | 140 (8.1%) | 78 (5.5%) |
| Total | 1,735 (100.0%) | 1,423 (100.0%) |
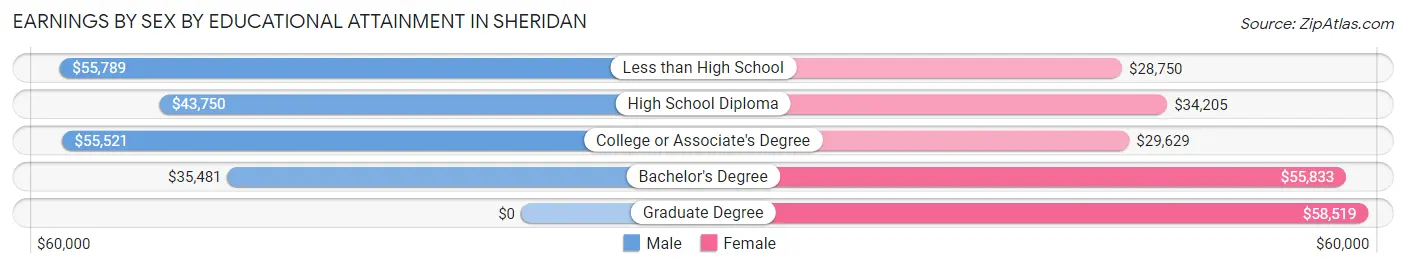
Earnings by Sex by Educational Attainment in Sheridan
Average earnings in Sheridan are $46,753 for men and $42,652 for women, a difference of 8.8%. Men with an educational attainment of less than high school enjoy the highest average annual earnings of $55,789, while those with bachelor's degree education earn the least with $35,481. Women with an educational attainment of graduate degree earn the most with the average annual earnings of $58,519, while those with less than high school education have the smallest earnings of $28,750.
| Educational Attainment | Male Income | Female Income |
| Less than High School | $55,789 | $28,750 |
| High School Diploma | $43,750 | $34,205 |
| College or Associate's Degree | $55,521 | $29,629 |
| Bachelor's Degree | $35,481 | $55,833 |
| Graduate Degree | - | - |
| Total | $46,753 | $42,652 |
Family Income in Sheridan
Family Income Brackets in Sheridan
According to the Sheridan family income data, there are 338 families falling into the $50,000 to $74,999 income range, which is the most common income bracket and makes up 27.0% of all families.
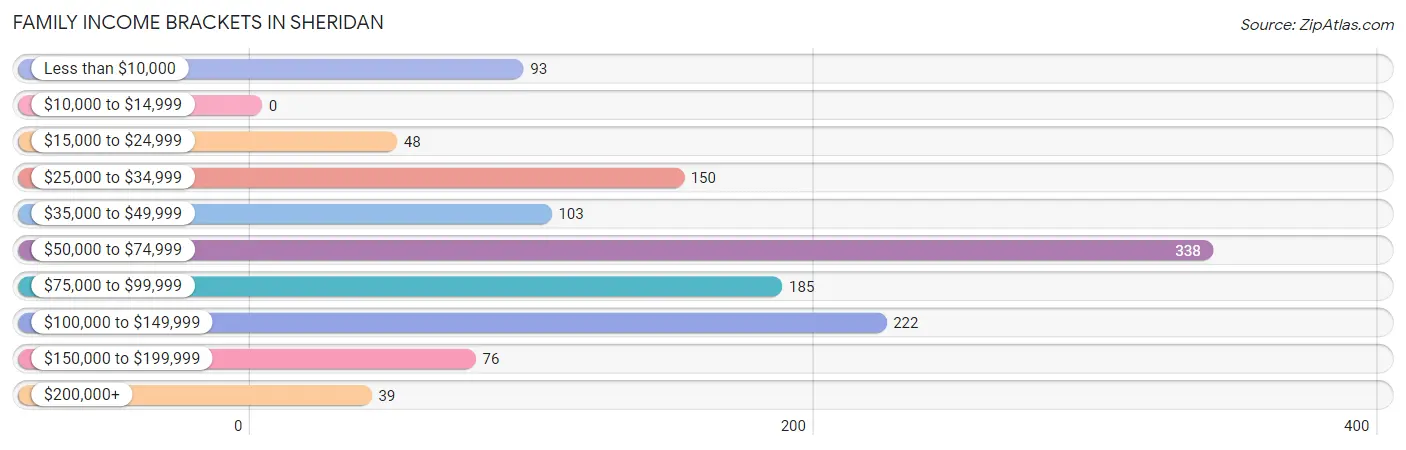
| Income Bracket | # Families | % Families |
| Less than $10,000 | 93 | 7.4% |
| $10,000 to $14,999 | 0 | 0.0% |
| $15,000 to $24,999 | 48 | 3.8% |
| $25,000 to $34,999 | 150 | 12.0% |
| $35,000 to $49,999 | 103 | 8.2% |
| $50,000 to $74,999 | 338 | 27.0% |
| $75,000 to $99,999 | 185 | 14.8% |
| $100,000 to $149,999 | 222 | 17.7% |
| $150,000 to $199,999 | 76 | 6.1% |
| $200,000+ | 39 | 3.1% |
Family Income by Famaliy Size in Sheridan
4-person families (220 | 17.6%) account for the highest median family income in Sheridan with $77,188 per family, while 2-person families (543 | 43.3%) have the highest median income of $30,910 per family member.
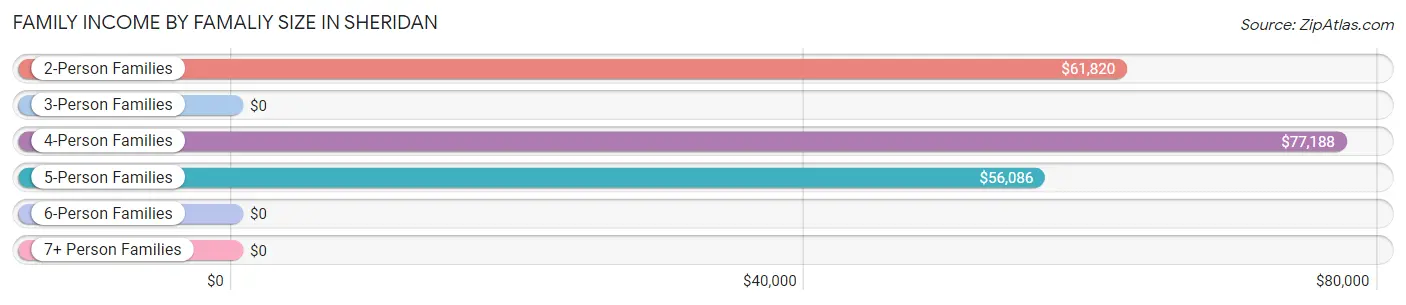
| Income Bracket | # Families | Median Income |
| 2-Person Families | 543 (43.3%) | $61,820 |
| 3-Person Families | 206 (16.4%) | $0 |
| 4-Person Families | 220 (17.6%) | $77,188 |
| 5-Person Families | 181 (14.4%) | $56,086 |
| 6-Person Families | 57 (4.5%) | $0 |
| 7+ Person Families | 46 (3.7%) | $0 |
| Total | 1,253 (100.0%) | $62,478 |
Family Income by Number of Earners in Sheridan
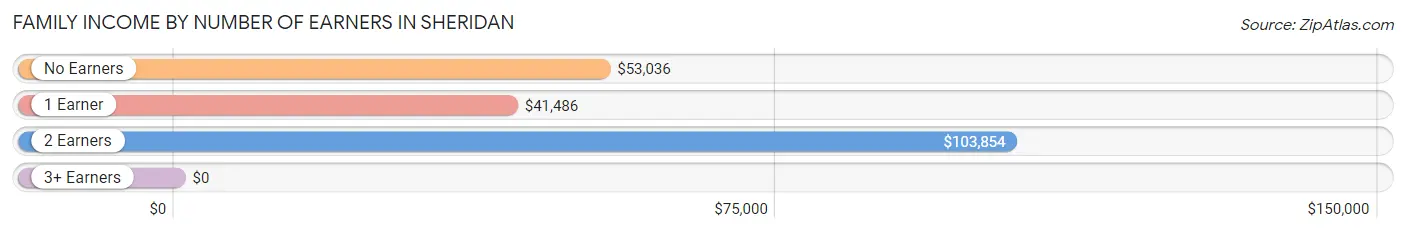
| Number of Earners | # Families | Median Income |
| No Earners | 139 (11.1%) | $53,036 |
| 1 Earner | 574 (45.8%) | $41,486 |
| 2 Earners | 365 (29.1%) | $103,854 |
| 3+ Earners | 175 (14.0%) | $0 |
| Total | 1,253 (100.0%) | $62,478 |
Household Income in Sheridan
Household Income Brackets in Sheridan
With 457 households falling in the category, the $50,000 to $74,999 income range is the most frequent in Sheridan, accounting for 18.7% of all households. In contrast, only 27 households (1.1%) fall into the $10,000 to $14,999 income bracket, making it the least populous group.
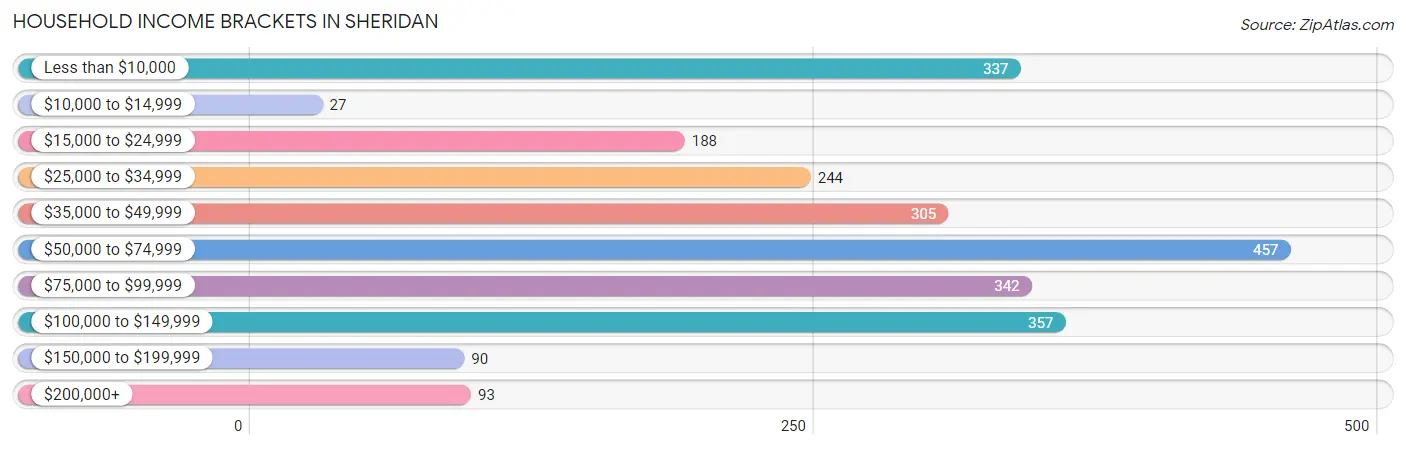
| Income Bracket | # Households | % Households |
| Less than $10,000 | 337 | 13.8% |
| $10,000 to $14,999 | 27 | 1.1% |
| $15,000 to $24,999 | 188 | 7.7% |
| $25,000 to $34,999 | 244 | 10.0% |
| $35,000 to $49,999 | 305 | 12.5% |
| $50,000 to $74,999 | 457 | 18.7% |
| $75,000 to $99,999 | 342 | 14.0% |
| $100,000 to $149,999 | 357 | 14.6% |
| $150,000 to $199,999 | 90 | 3.7% |
| $200,000+ | 93 | 3.8% |
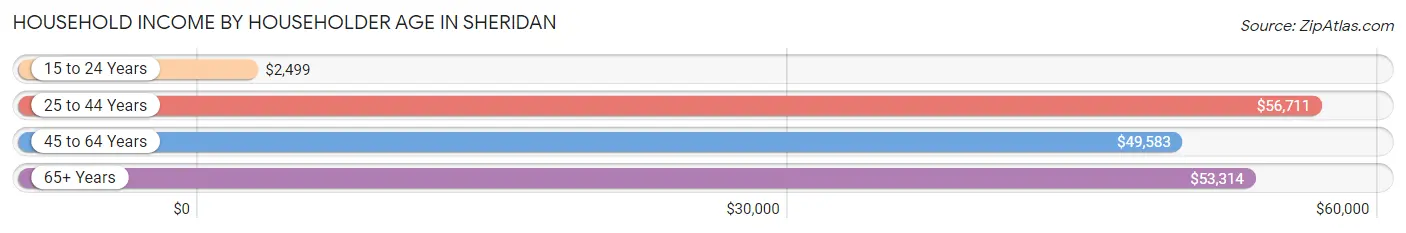
Household Income by Householder Age in Sheridan
The median household income in Sheridan is $53,707, with the highest median household income of $56,711 found in the 25 to 44 years age bracket for the primary householder. A total of 976 households (40.0%) fall into this category. Meanwhile, the 15 to 24 years age bracket for the primary householder has the lowest median household income of $2,499, with 87 households (3.6%) in this group.
| Income Bracket | # Households | Median Income |
| 15 to 24 Years | 87 (3.6%) | $2,499 |
| 25 to 44 Years | 976 (40.0%) | $56,711 |
| 45 to 64 Years | 782 (32.0%) | $49,583 |
| 65+ Years | 597 (24.4%) | $53,314 |
| Total | 2,442 (100.0%) | $53,707 |
Poverty in Sheridan
Income Below Poverty by Sex and Age in Sheridan
With 10.1% poverty level for males and 13.7% for females among the residents of Sheridan, 18 to 24 year old males and 45 to 54 year old females are the most vulnerable to poverty, with 112 males (31.7%) and 108 females (30.9%) in their respective age groups living below the poverty level.
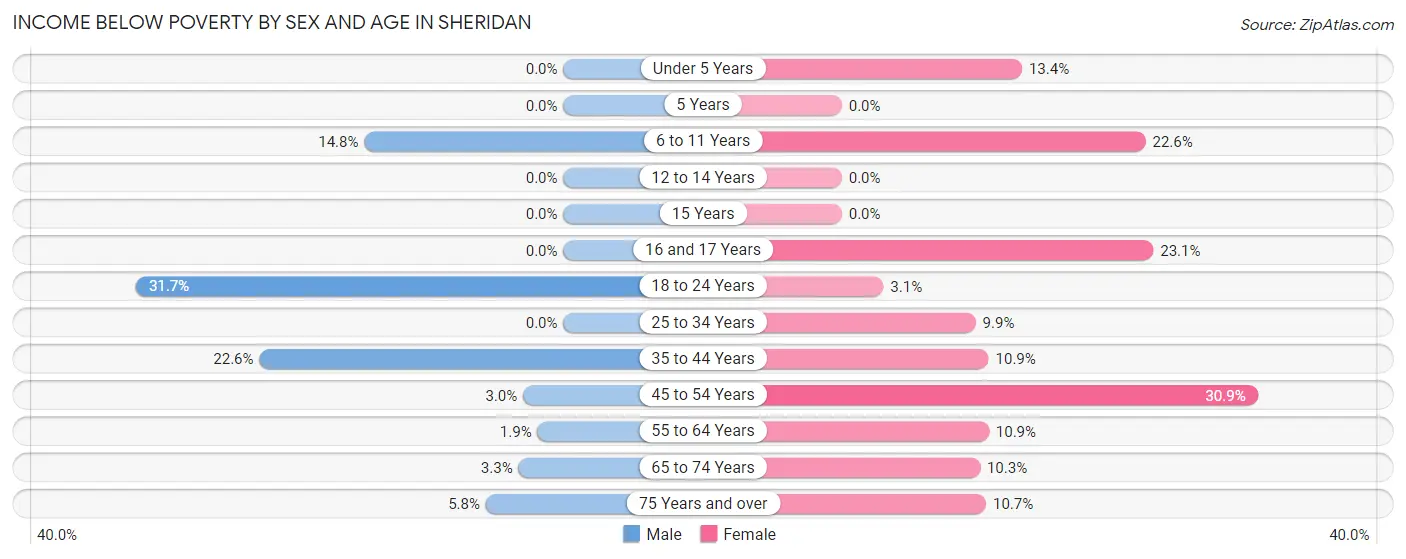
| Age Bracket | Male | Female |
| Under 5 Years | 0 (0.0%) | 21 (13.4%) |
| 5 Years | 0 (0.0%) | 0 (0.0%) |
| 6 to 11 Years | 30 (14.8%) | 85 (22.6%) |
| 12 to 14 Years | 0 (0.0%) | 0 (0.0%) |
| 15 Years | 0 (0.0%) | 0 (0.0%) |
| 16 and 17 Years | 0 (0.0%) | 31 (23.1%) |
| 18 to 24 Years | 112 (31.7%) | 8 (3.1%) |
| 25 to 34 Years | 0 (0.0%) | 33 (9.9%) |
| 35 to 44 Years | 121 (22.6%) | 62 (10.9%) |
| 45 to 54 Years | 7 (3.0%) | 108 (30.9%) |
| 55 to 64 Years | 7 (1.9%) | 26 (10.9%) |
| 65 to 74 Years | 9 (3.3%) | 35 (10.3%) |
| 75 Years and over | 8 (5.8%) | 15 (10.7%) |
| Total | 294 (10.1%) | 424 (13.7%) |
Income Above Poverty by Sex and Age in Sheridan
According to the poverty statistics in Sheridan, males aged under 5 years and females aged 5 years are the age groups that are most secure financially, with 100.0% of males and 100.0% of females in these age groups living above the poverty line.
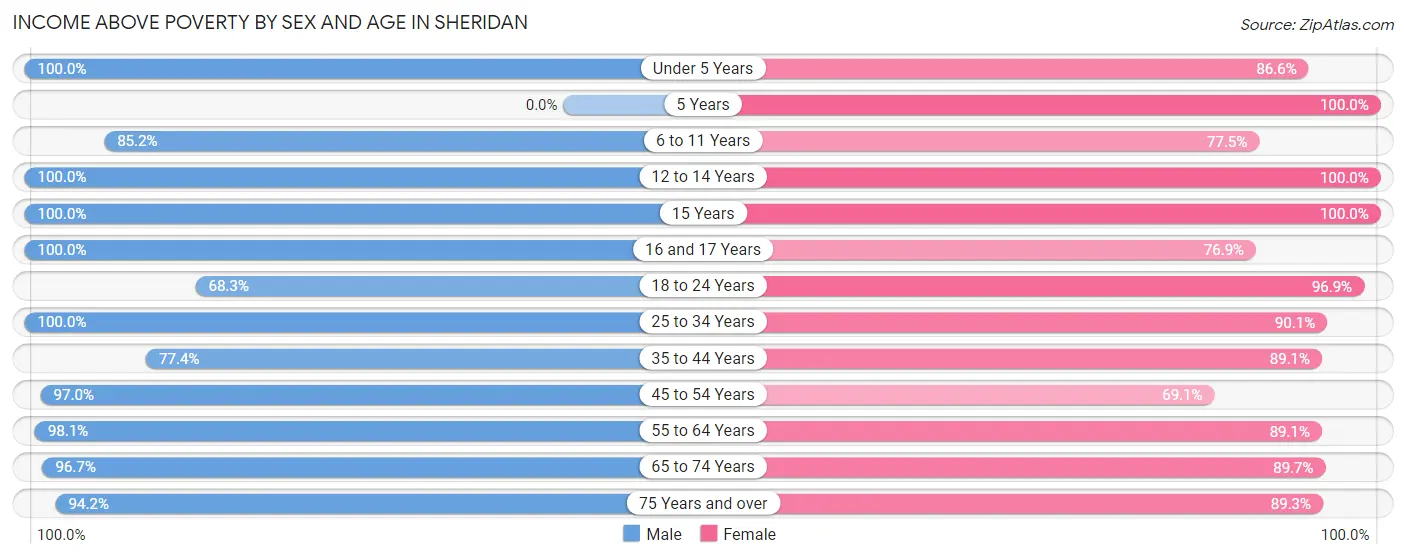
| Age Bracket | Male | Female |
| Under 5 Years | 27 (100.0%) | 136 (86.6%) |
| 5 Years | 0 (0.0%) | 21 (100.0%) |
| 6 to 11 Years | 173 (85.2%) | 292 (77.4%) |
| 12 to 14 Years | 219 (100.0%) | 151 (100.0%) |
| 15 Years | 41 (100.0%) | 22 (100.0%) |
| 16 and 17 Years | 31 (100.0%) | 103 (76.9%) |
| 18 to 24 Years | 241 (68.3%) | 251 (96.9%) |
| 25 to 34 Years | 503 (100.0%) | 299 (90.1%) |
| 35 to 44 Years | 415 (77.4%) | 507 (89.1%) |
| 45 to 54 Years | 227 (97.0%) | 242 (69.1%) |
| 55 to 64 Years | 358 (98.1%) | 212 (89.1%) |
| 65 to 74 Years | 261 (96.7%) | 306 (89.7%) |
| 75 Years and over | 131 (94.2%) | 125 (89.3%) |
| Total | 2,627 (89.9%) | 2,667 (86.3%) |
Income Below Poverty Among Married-Couple Families in Sheridan
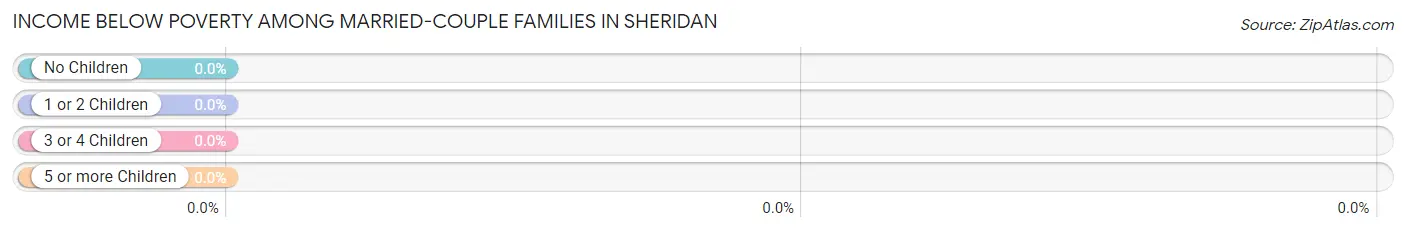
| Children | Above Poverty | Below Poverty |
| No Children | 481 (100.0%) | 0 (0.0%) |
| 1 or 2 Children | 248 (100.0%) | 0 (0.0%) |
| 3 or 4 Children | 92 (100.0%) | 0 (0.0%) |
| 5 or more Children | 0 (0.0%) | 0 (0.0%) |
| Total | 821 (100.0%) | 0 (0.0%) |
Income Below Poverty Among Single-Parent Households in Sheridan
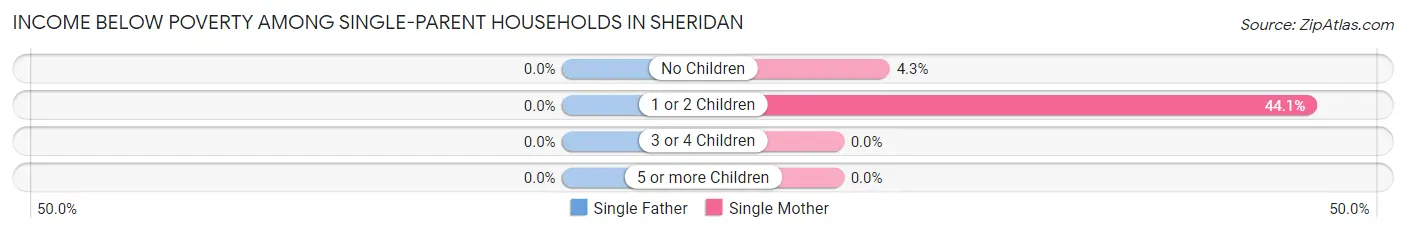
| Children | Single Father | Single Mother |
| No Children | 0 (0.0%) | 6 (4.3%) |
| 1 or 2 Children | 0 (0.0%) | 93 (44.1%) |
| 3 or 4 Children | 0 (0.0%) | 0 (0.0%) |
| 5 or more Children | 0 (0.0%) | 0 (0.0%) |
| Total | 0 (0.0%) | 99 (22.9%) |
Income Below Poverty Among Married-Couple vs Single-Parent Households in Sheridan
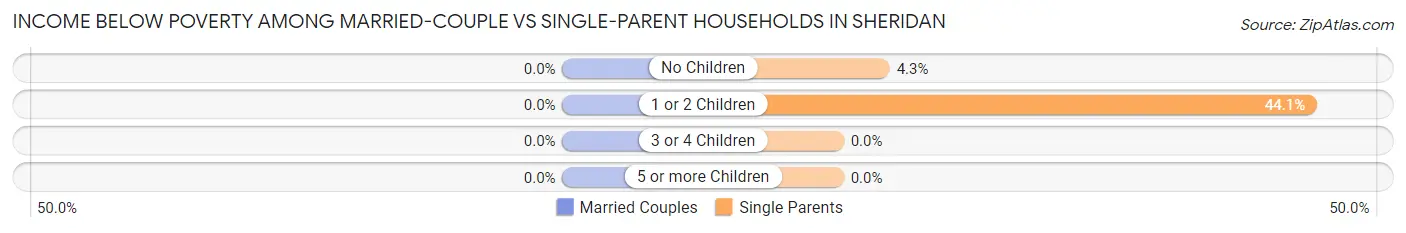
| Children | Married-Couple Families | Single-Parent Households |
| No Children | 0 (0.0%) | 6 (4.3%) |
| 1 or 2 Children | 0 (0.0%) | 93 (44.1%) |
| 3 or 4 Children | 0 (0.0%) | 0 (0.0%) |
| 5 or more Children | 0 (0.0%) | 0 (0.0%) |
| Total | 0 (0.0%) | 99 (22.9%) |
Race in Sheridan
The most populous races in Sheridan are White / Caucasian (3,412 | 56.3%), Hispanic or Latino (2,529 | 41.7%), and Some other Race (1,259 | 20.8%).
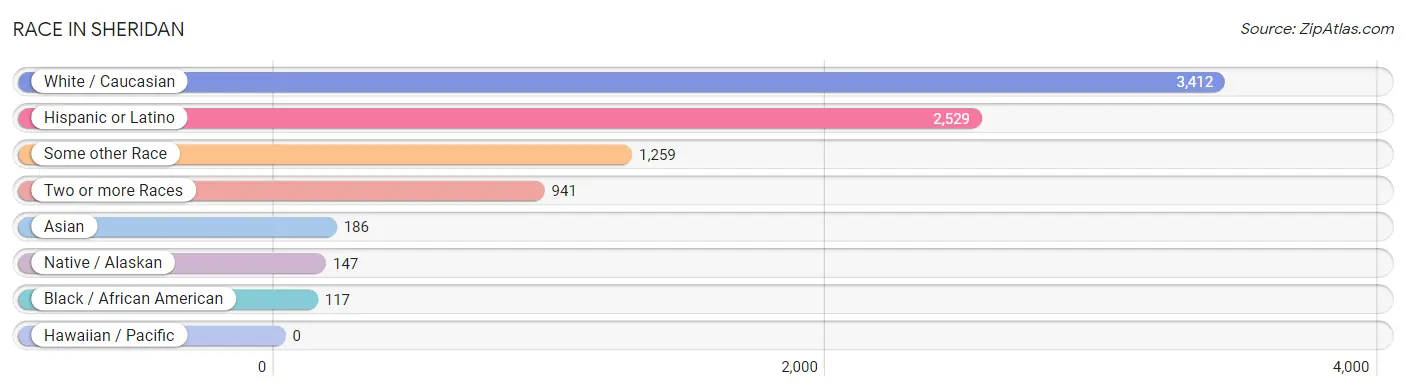
| Race | # Population | % Population |
| Asian | 186 | 3.1% |
| Black / African American | 117 | 1.9% |
| Hawaiian / Pacific | 0 | 0.0% |
| Hispanic or Latino | 2,529 | 41.7% |
| Native / Alaskan | 147 | 2.4% |
| White / Caucasian | 3,412 | 56.3% |
| Two or more Races | 941 | 15.5% |
| Some other Race | 1,259 | 20.8% |
| Total | 6,062 | 100.0% |
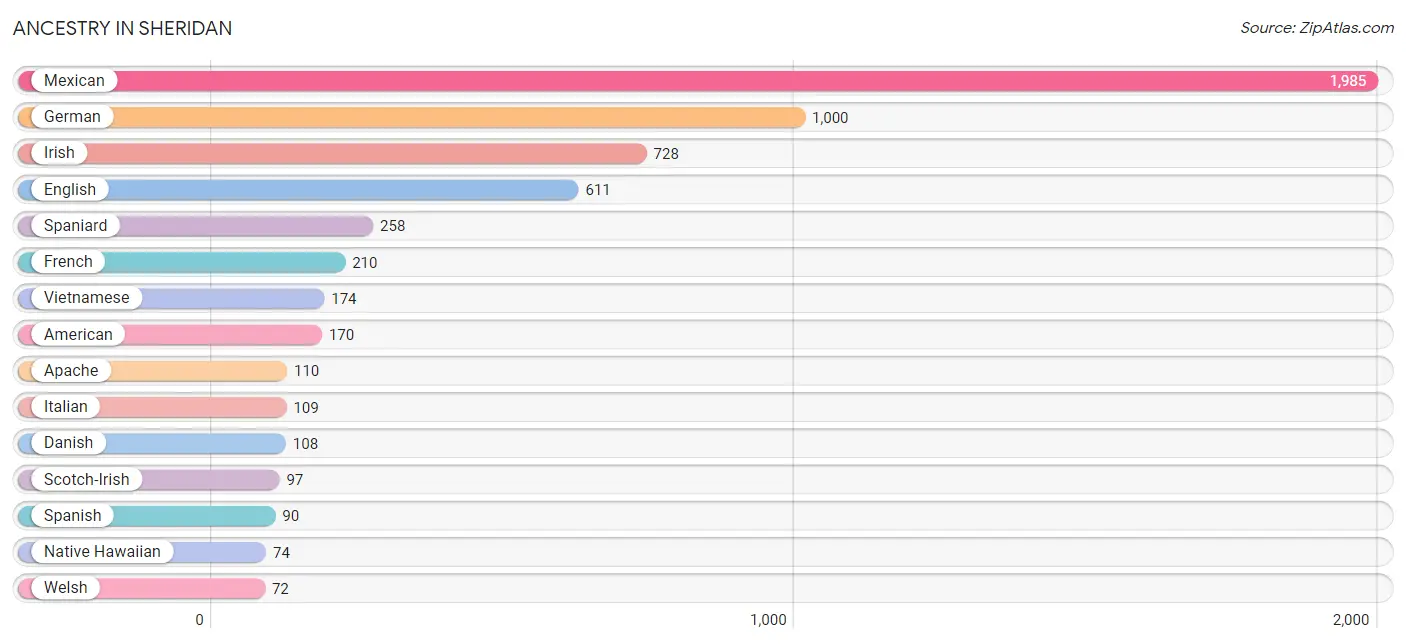
Ancestry in Sheridan
The most populous ancestries reported in Sheridan are Mexican (1,985 | 32.7%), German (1,000 | 16.5%), Irish (728 | 12.0%), English (611 | 10.1%), and Spaniard (258 | 4.3%), together accounting for 75.6% of all Sheridan residents.
| Ancestry | # Population | % Population |
| American | 170 | 2.8% |
| Apache | 110 | 1.8% |
| Arab | 21 | 0.4% |
| Austrian | 7 | 0.1% |
| British | 13 | 0.2% |
| Central American | 7 | 0.1% |
| Cherokee | 4 | 0.1% |
| Czech | 15 | 0.3% |
| Danish | 108 | 1.8% |
| Dutch | 13 | 0.2% |
| English | 611 | 10.1% |
| European | 16 | 0.3% |
| Filipino | 8 | 0.1% |
| Finnish | 22 | 0.4% |
| French | 210 | 3.5% |
| French Canadian | 20 | 0.3% |
| German | 1,000 | 16.5% |
| Iranian | 65 | 1.1% |
| Irish | 728 | 12.0% |
| Italian | 109 | 1.8% |
| Lebanese | 10 | 0.2% |
| Mexican | 1,985 | 32.7% |
| Native Hawaiian | 74 | 1.2% |
| Navajo | 71 | 1.2% |
| Norwegian | 61 | 1.0% |
| Polish | 42 | 0.7% |
| Puerto Rican | 40 | 0.7% |
| Romanian | 11 | 0.2% |
| Russian | 45 | 0.7% |
| Salvadoran | 7 | 0.1% |
| Scandinavian | 23 | 0.4% |
| Scotch-Irish | 97 | 1.6% |
| Scottish | 64 | 1.1% |
| Serbian | 12 | 0.2% |
| South American | 13 | 0.2% |
| Spaniard | 258 | 4.3% |
| Spanish | 90 | 1.5% |
| Spanish American | 16 | 0.3% |
| Sri Lankan | 12 | 0.2% |
| Swedish | 38 | 0.6% |
| Thai | 38 | 0.6% |
| Venezuelan | 13 | 0.2% |
| Vietnamese | 174 | 2.9% |
| Welsh | 72 | 1.2% |
| Yugoslavian | 14 | 0.2% | View All 45 Rows |
Immigrants in Sheridan
The most numerous immigrant groups reported in Sheridan came from Latin America (357 | 5.9%), Central America (327 | 5.4%), Mexico (320 | 5.3%), Asia (180 | 3.0%), and Bangladesh (169 | 2.8%), together accounting for 22.3% of all Sheridan residents.
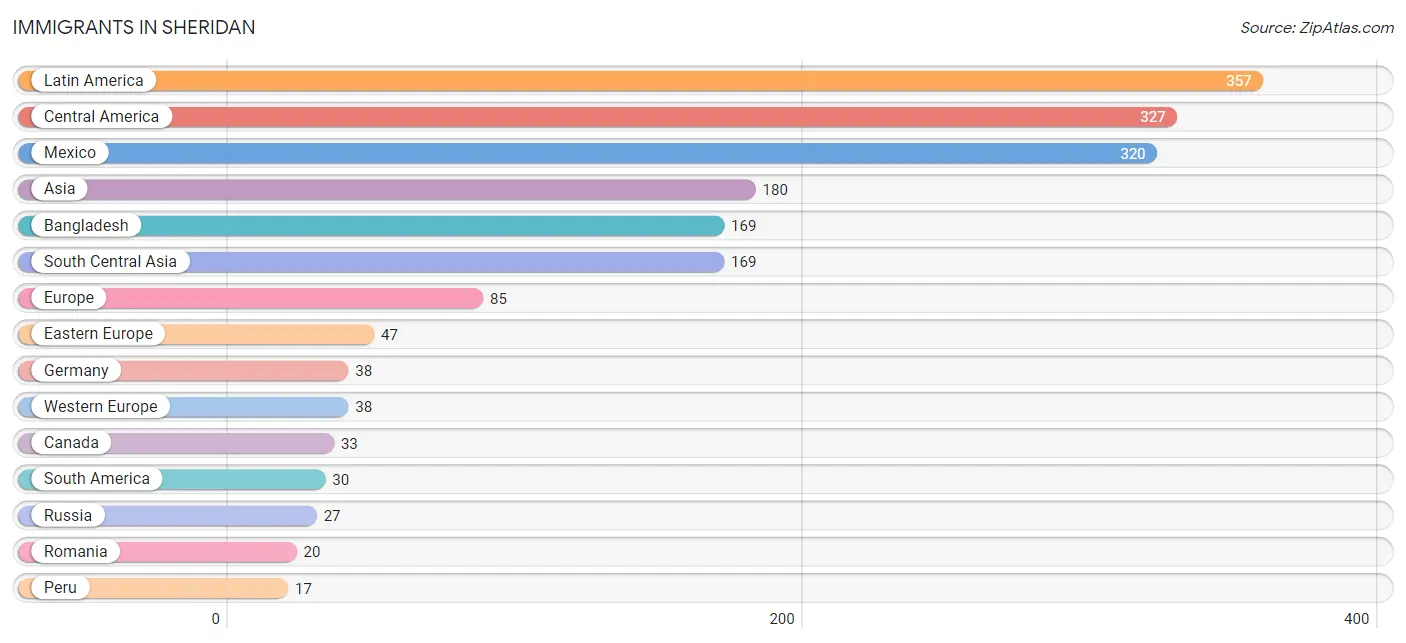
| Immigration Origin | # Population | % Population |
| Asia | 180 | 3.0% |
| Bangladesh | 169 | 2.8% |
| Canada | 33 | 0.5% |
| Central America | 327 | 5.4% |
| Eastern Europe | 47 | 0.8% |
| El Salvador | 7 | 0.1% |
| Europe | 85 | 1.4% |
| Germany | 38 | 0.6% |
| Israel | 11 | 0.2% |
| Latin America | 357 | 5.9% |
| Mexico | 320 | 5.3% |
| Peru | 17 | 0.3% |
| Romania | 20 | 0.3% |
| Russia | 27 | 0.4% |
| South America | 30 | 0.5% |
| South Central Asia | 169 | 2.8% |
| Venezuela | 13 | 0.2% |
| Western Asia | 11 | 0.2% |
| Western Europe | 38 | 0.6% | View All 19 Rows |
Sex and Age in Sheridan
Sex and Age in Sheridan
The most populous age groups in Sheridan are 35 to 39 Years (308 | 10.5%) for men and 5 to 9 Years (385 | 12.3%) for women.
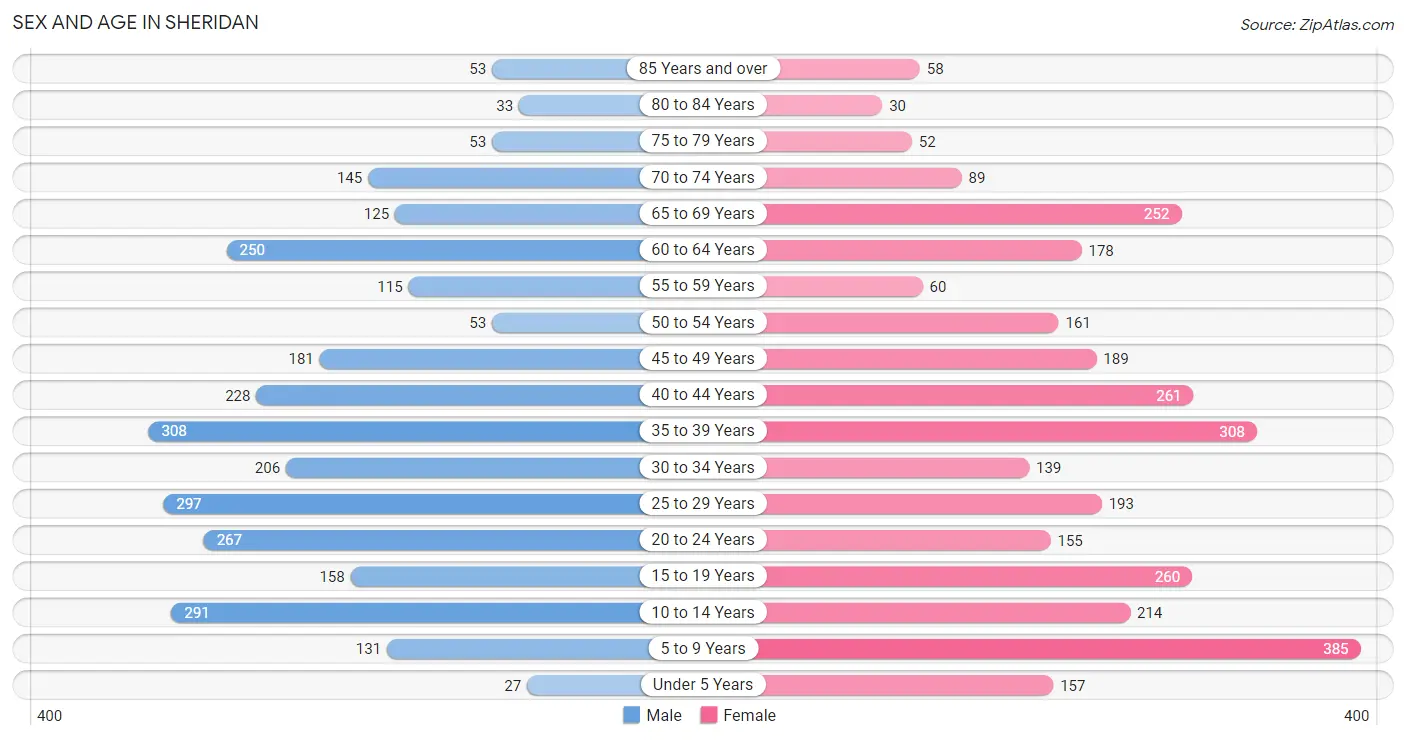
| Age Bracket | Male | Female |
| Under 5 Years | 27 (0.9%) | 157 (5.0%) |
| 5 to 9 Years | 131 (4.5%) | 385 (12.3%) |
| 10 to 14 Years | 291 (10.0%) | 214 (6.8%) |
| 15 to 19 Years | 158 (5.4%) | 260 (8.3%) |
| 20 to 24 Years | 267 (9.1%) | 155 (4.9%) |
| 25 to 29 Years | 297 (10.2%) | 193 (6.1%) |
| 30 to 34 Years | 206 (7.0%) | 139 (4.4%) |
| 35 to 39 Years | 308 (10.5%) | 308 (9.8%) |
| 40 to 44 Years | 228 (7.8%) | 261 (8.3%) |
| 45 to 49 Years | 181 (6.2%) | 189 (6.0%) |
| 50 to 54 Years | 53 (1.8%) | 161 (5.1%) |
| 55 to 59 Years | 115 (3.9%) | 60 (1.9%) |
| 60 to 64 Years | 250 (8.6%) | 178 (5.7%) |
| 65 to 69 Years | 125 (4.3%) | 252 (8.0%) |
| 70 to 74 Years | 145 (5.0%) | 89 (2.8%) |
| 75 to 79 Years | 53 (1.8%) | 52 (1.7%) |
| 80 to 84 Years | 33 (1.1%) | 30 (1.0%) |
| 85 Years and over | 53 (1.8%) | 58 (1.8%) |
| Total | 2,921 (100.0%) | 3,141 (100.0%) |
Families and Households in Sheridan
Median Family Size in Sheridan
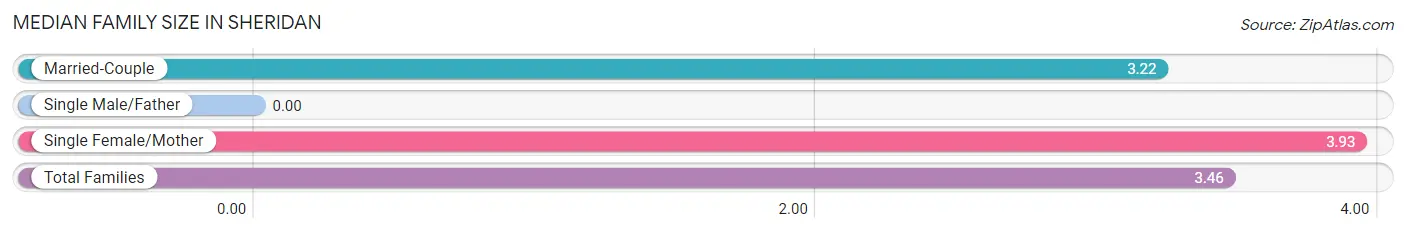
| Family Type | # Families | Family Size |
| Married-Couple | 821 (65.5%) | 3.22 |
| Single Male/Father | 0 (0.0%) | - |
| Single Female/Mother | 432 (34.5%) | 3.93 |
| Total Families | 1,253 (100.0%) | 3.46 |
Median Household Size in Sheridan
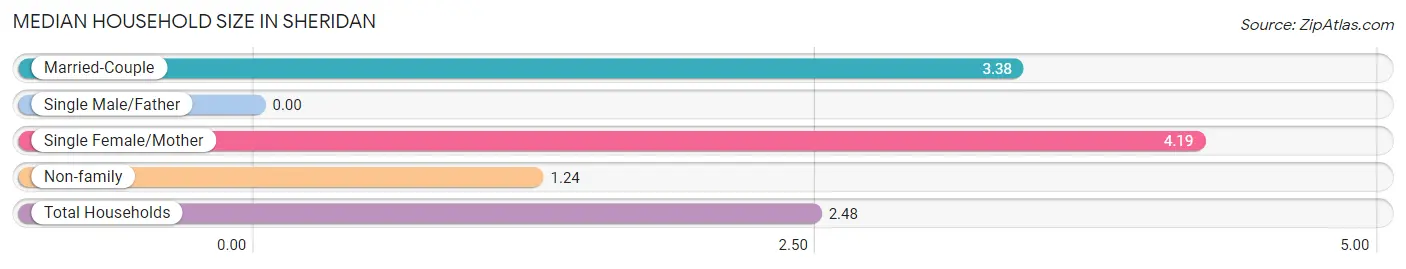
| Household Type | # Households | Household Size |
| Married-Couple | 821 (33.6%) | 3.38 |
| Single Male/Father | 0 (0.0%) | - |
| Single Female/Mother | 432 (17.7%) | 4.19 |
| Non-family | 1,189 (48.7%) | 1.24 |
| Total Households | 2,442 (100.0%) | 2.48 |
Household Size by Marriage Status in Sheridan
Out of a total of 2,442 households in Sheridan, 1,253 (51.3%) are family households, while 1,189 (48.7%) are nonfamily households. The most numerous type of family households are 2-person households, comprising 496, and the most common type of nonfamily households are 1-person households, comprising 946.
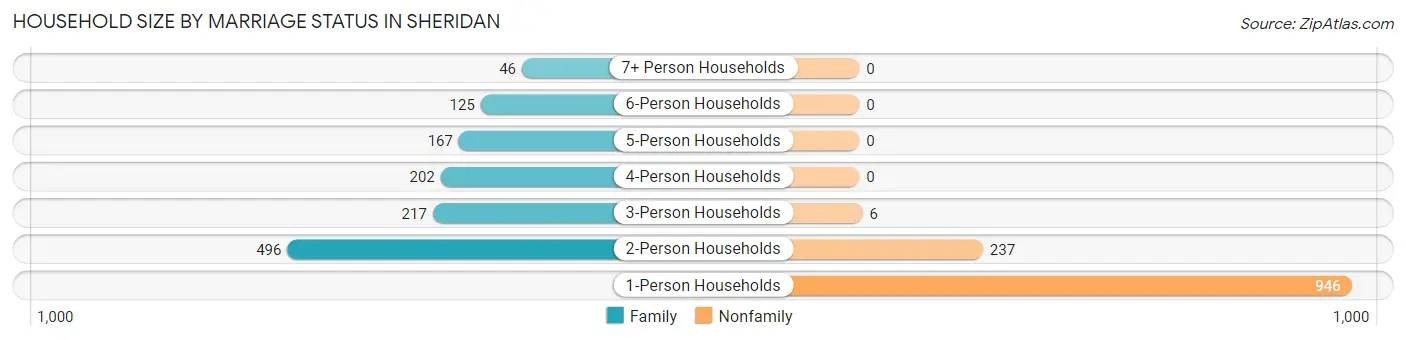
| Household Size | Family Households | Nonfamily Households |
| 1-Person Households | - | 946 (38.7%) |
| 2-Person Households | 496 (20.3%) | 237 (9.7%) |
| 3-Person Households | 217 (8.9%) | 6 (0.3%) |
| 4-Person Households | 202 (8.3%) | 0 (0.0%) |
| 5-Person Households | 167 (6.8%) | 0 (0.0%) |
| 6-Person Households | 125 (5.1%) | 0 (0.0%) |
| 7+ Person Households | 46 (1.9%) | 0 (0.0%) |
| Total | 1,253 (51.3%) | 1,189 (48.7%) |
Female Fertility in Sheridan
Fertility by Age in Sheridan
Average fertility rate in Sheridan is 90.0 births per 1,000 women. Women in the age bracket of 20 to 34 years have the highest fertility rate with 185.0 births per 1,000 women. Women in the age bracket of 20 to 34 years acount for 65.2% of all women with births.
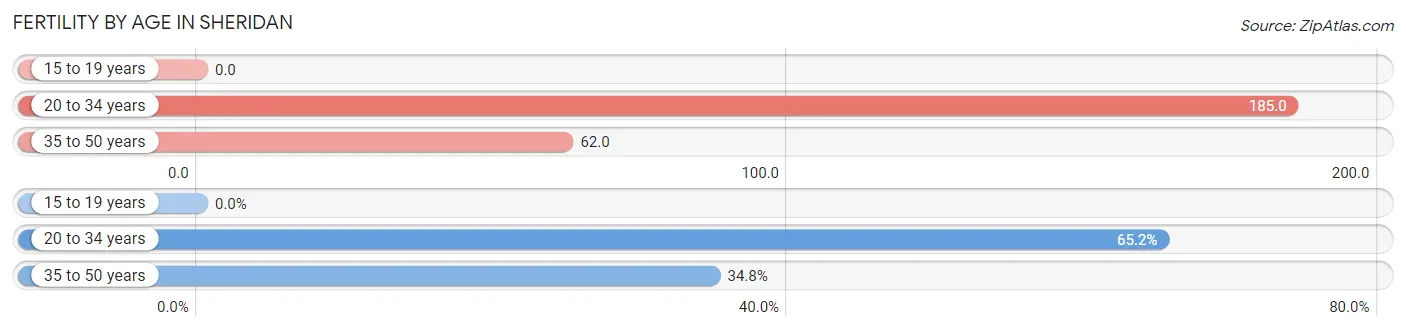
| Age Bracket | Women with Births | Births / 1,000 Women |
| 15 to 19 years | 0 (0.0%) | 0.0 |
| 20 to 34 years | 90 (65.2%) | 185.0 |
| 35 to 50 years | 48 (34.8%) | 62.0 |
| Total | 138 (100.0%) | 90.0 |
Fertility by Age by Marriage Status in Sheridan
52.9% of women with births (138) in Sheridan are married. The highest percentage of unmarried women with births falls into 20 to 34 years age bracket with 72.2% of them unmarried at the time of birth, while the lowest percentage of unmarried women with births belong to 35 to 50 years age bracket with 0.0% of them unmarried.
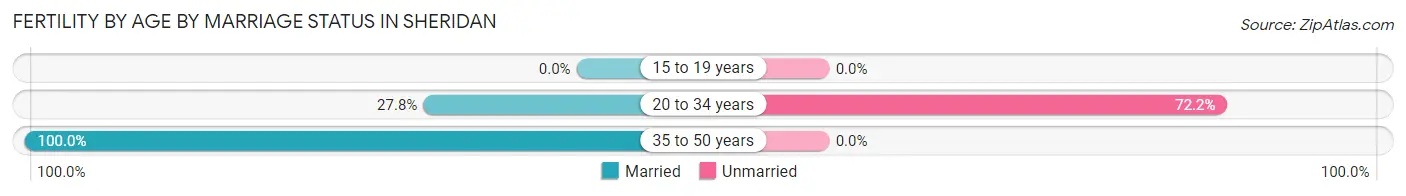
| Age Bracket | Married | Unmarried |
| 15 to 19 years | 0 (0.0%) | 0 (0.0%) |
| 20 to 34 years | 25 (27.8%) | 65 (72.2%) |
| 35 to 50 years | 48 (100.0%) | 0 (0.0%) |
| Total | 73 (52.9%) | 65 (47.1%) |
Fertility by Education in Sheridan
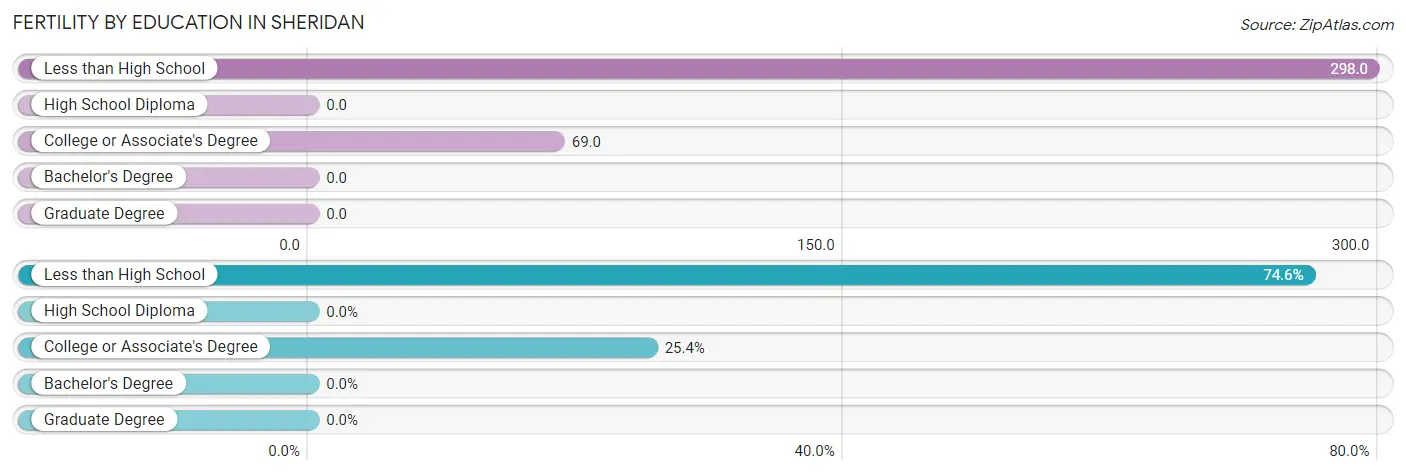
| Educational Attainment | Women with Births | Births / 1,000 Women |
| Less than High School | 103 (74.6%) | 298.0 |
| High School Diploma | 0 (0.0%) | 0.0 |
| College or Associate's Degree | 35 (25.4%) | 69.0 |
| Bachelor's Degree | 0 (0.0%) | 0.0 |
| Graduate Degree | 0 (0.0%) | 0.0 |
| Total | 138 (100.0%) | 90.0 |
Fertility by Education by Marriage Status in Sheridan
47.1% of women with births in Sheridan are unmarried. Women with the educational attainment of less than high school are most likely to be married with 70.9% of them married at childbirth, while women with the educational attainment of college or associate's degree are least likely to be married with 100.0% of them unmarried at childbirth.
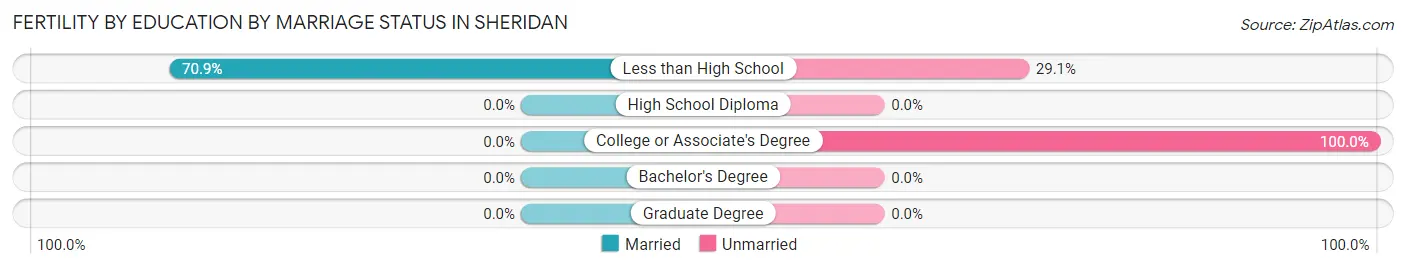
| Educational Attainment | Married | Unmarried |
| Less than High School | 73 (70.9%) | 30 (29.1%) |
| High School Diploma | 0 (0.0%) | 0 (0.0%) |
| College or Associate's Degree | 0 (0.0%) | 35 (100.0%) |
| Bachelor's Degree | 0 (0.0%) | 0 (0.0%) |
| Graduate Degree | 0 (0.0%) | 0 (0.0%) |
| Total | 73 (52.9%) | 65 (47.1%) |
Employment Characteristics in Sheridan
Employment by Class of Employer in Sheridan
Among the 2,598 employed individuals in Sheridan, private company employees (1,952 | 75.1%), not-for-profit organizations (190 | 7.3%), and local government employees (138 | 5.3%) make up the most common classes of employment.
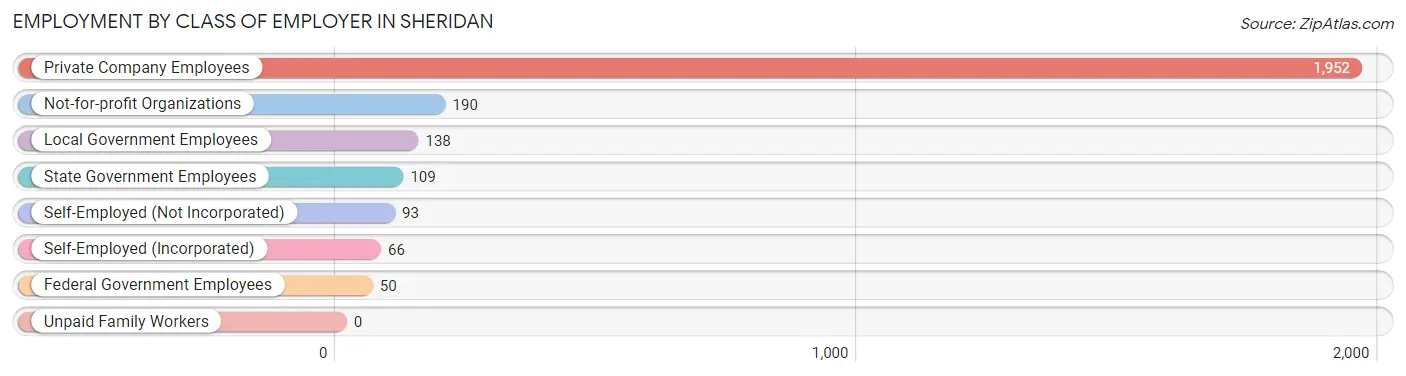
| Employer Class | # Employees | % Employees |
| Private Company Employees | 1,952 | 75.1% |
| Self-Employed (Incorporated) | 66 | 2.5% |
| Self-Employed (Not Incorporated) | 93 | 3.6% |
| Not-for-profit Organizations | 190 | 7.3% |
| Local Government Employees | 138 | 5.3% |
| State Government Employees | 109 | 4.2% |
| Federal Government Employees | 50 | 1.9% |
| Unpaid Family Workers | 0 | 0.0% |
| Total | 2,598 | 100.0% |
Employment Status by Age in Sheridan
According to the labor force statistics for Sheridan, out of the total population over 16 years of age (4,794), 63.3% or 3,035 individuals are in the labor force, with 10.1% or 307 of them unemployed. The age group with the highest labor force participation rate is 30 to 34 years, with 87.2% or 301 individuals in the labor force. Within the labor force, the 16 to 19 years age range has the highest percentage of unemployed individuals, with 44.6% or 41 of them being unemployed.
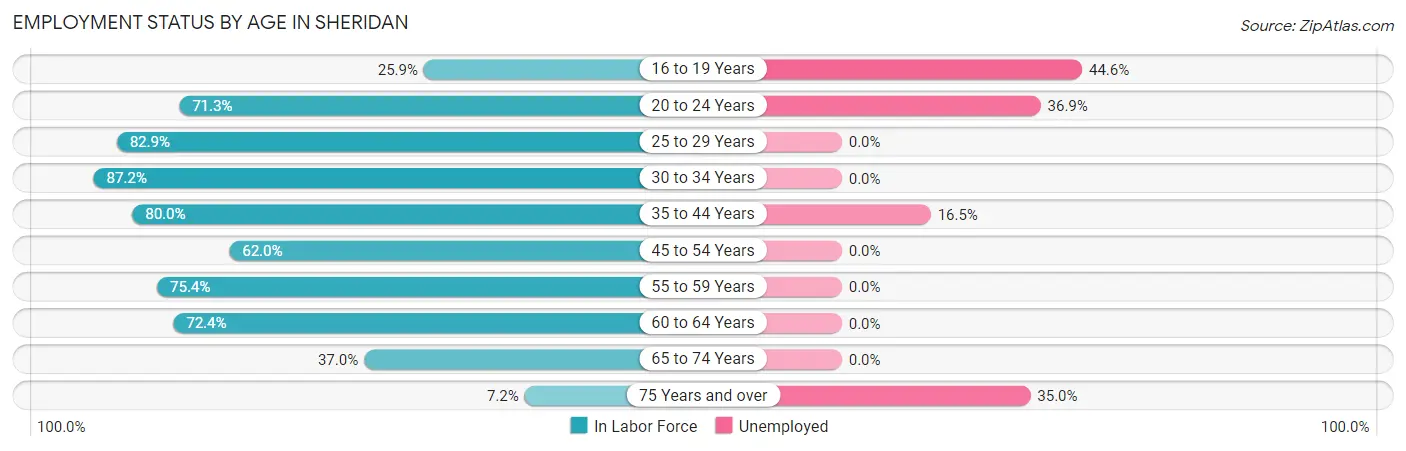
| Age Bracket | In Labor Force | Unemployed |
| 16 to 19 Years | 92 (25.9%) | 41 (44.6%) |
| 20 to 24 Years | 301 (71.3%) | 111 (36.9%) |
| 25 to 29 Years | 406 (82.9%) | 0 (0.0%) |
| 30 to 34 Years | 301 (87.2%) | 0 (0.0%) |
| 35 to 44 Years | 884 (80.0%) | 146 (16.5%) |
| 45 to 54 Years | 362 (62.0%) | 0 (0.0%) |
| 55 to 59 Years | 132 (75.4%) | 0 (0.0%) |
| 60 to 64 Years | 310 (72.4%) | 0 (0.0%) |
| 65 to 74 Years | 226 (37.0%) | 0 (0.0%) |
| 75 Years and over | 20 (7.2%) | 7 (35.0%) |
| Total | 3,035 (63.3%) | 307 (10.1%) |
Employment Status by Educational Attainment in Sheridan
According to labor force statistics for Sheridan, 76.6% of individuals (2,395) out of the total population between 25 and 64 years of age (3,127) are in the labor force, with 6.1% or 146 of them being unemployed. The group with the highest labor force participation rate are those with the educational attainment of bachelor's degree or higher, with 94.7% or 605 individuals in the labor force. Within the labor force, individuals with high school diploma education have the highest percentage of unemployment, with 19.6% or 146 of them being unemployed.
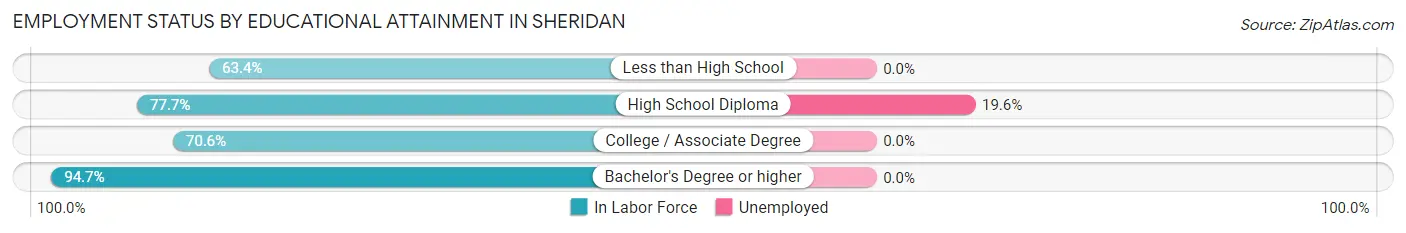
| Educational Attainment | In Labor Force | Unemployed |
| Less than High School | 308 (63.4%) | 0 (0.0%) |
| High School Diploma | 744 (77.7%) | 188 (19.6%) |
| College / Associate Degree | 738 (70.6%) | 0 (0.0%) |
| Bachelor's Degree or higher | 605 (94.7%) | 0 (0.0%) |
| Total | 2,395 (76.6%) | 191 (6.1%) |
Employment Occupations by Sex in Sheridan
Management, Business, Science and Arts Occupations
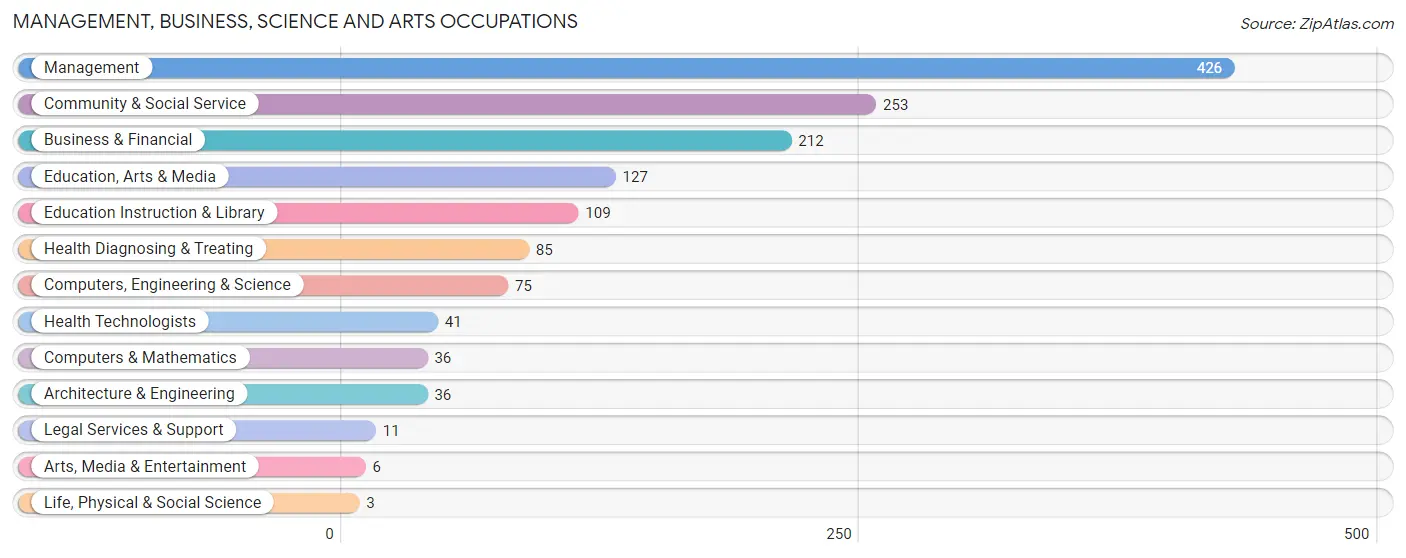
The most common Management, Business, Science and Arts occupations in Sheridan are Management (426 | 15.6%), Community & Social Service (253 | 9.3%), Business & Financial (212 | 7.8%), Education, Arts & Media (127 | 4.6%), and Education Instruction & Library (109 | 4.0%).
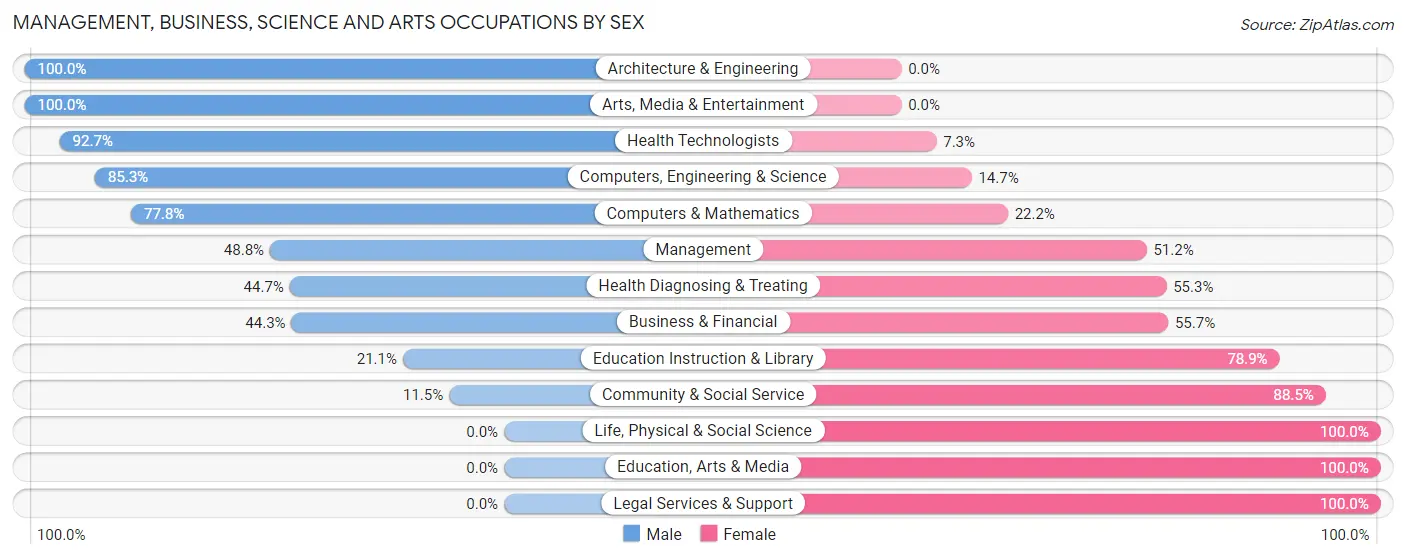
Management, Business, Science and Arts Occupations by Sex
Within the Management, Business, Science and Arts occupations in Sheridan, the most male-oriented occupations are Architecture & Engineering (100.0%), Arts, Media & Entertainment (100.0%), and Health Technologists (92.7%), while the most female-oriented occupations are Life, Physical & Social Science (100.0%), Education, Arts & Media (100.0%), and Legal Services & Support (100.0%).
| Occupation | Male | Female |
| Management | 208 (48.8%) | 218 (51.2%) |
| Business & Financial | 94 (44.3%) | 118 (55.7%) |
| Computers, Engineering & Science | 64 (85.3%) | 11 (14.7%) |
| Computers & Mathematics | 28 (77.8%) | 8 (22.2%) |
| Architecture & Engineering | 36 (100.0%) | 0 (0.0%) |
| Life, Physical & Social Science | 0 (0.0%) | 3 (100.0%) |
| Community & Social Service | 29 (11.5%) | 224 (88.5%) |
| Education, Arts & Media | 0 (0.0%) | 127 (100.0%) |
| Legal Services & Support | 0 (0.0%) | 11 (100.0%) |
| Education Instruction & Library | 23 (21.1%) | 86 (78.9%) |
| Arts, Media & Entertainment | 6 (100.0%) | 0 (0.0%) |
| Health Diagnosing & Treating | 38 (44.7%) | 47 (55.3%) |
| Health Technologists | 38 (92.7%) | 3 (7.3%) |
| Total (Category) | 433 (41.2%) | 618 (58.8%) |
| Total (Overall) | 1,460 (53.5%) | 1,269 (46.5%) |
Services Occupations
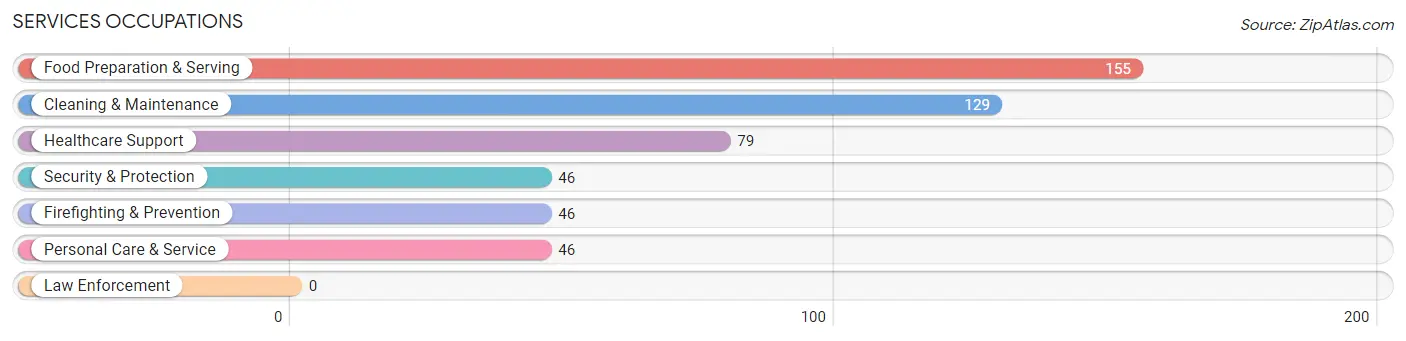
The most common Services occupations in Sheridan are Food Preparation & Serving (155 | 5.7%), Cleaning & Maintenance (129 | 4.7%), Healthcare Support (79 | 2.9%), Security & Protection (46 | 1.7%), and Firefighting & Prevention (46 | 1.7%).
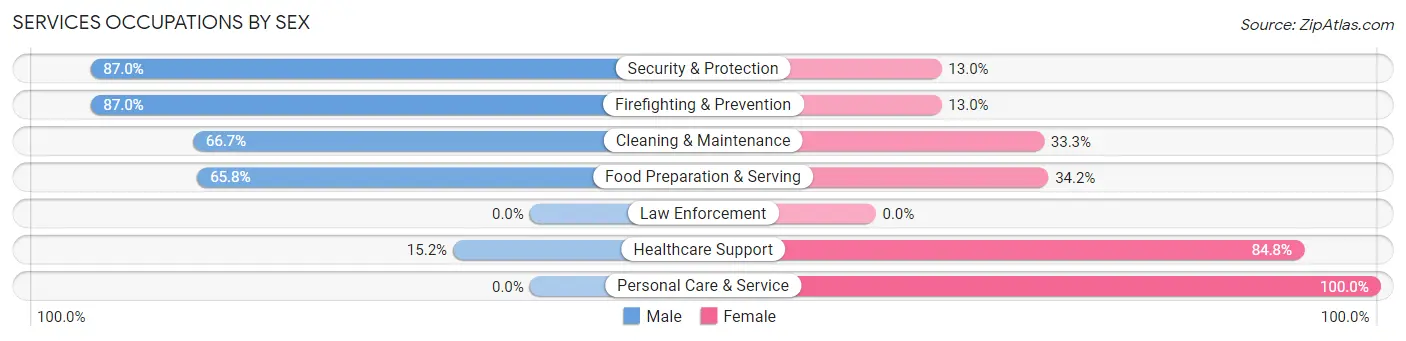
Services Occupations by Sex
Within the Services occupations in Sheridan, the most male-oriented occupations are Security & Protection (87.0%), Firefighting & Prevention (87.0%), and Cleaning & Maintenance (66.7%), while the most female-oriented occupations are Personal Care & Service (100.0%), Healthcare Support (84.8%), and Food Preparation & Serving (34.2%).
| Occupation | Male | Female |
| Healthcare Support | 12 (15.2%) | 67 (84.8%) |
| Security & Protection | 40 (87.0%) | 6 (13.0%) |
| Firefighting & Prevention | 40 (87.0%) | 6 (13.0%) |
| Law Enforcement | 0 (0.0%) | 0 (0.0%) |
| Food Preparation & Serving | 102 (65.8%) | 53 (34.2%) |
| Cleaning & Maintenance | 86 (66.7%) | 43 (33.3%) |
| Personal Care & Service | 0 (0.0%) | 46 (100.0%) |
| Total (Category) | 240 (52.7%) | 215 (47.2%) |
| Total (Overall) | 1,460 (53.5%) | 1,269 (46.5%) |
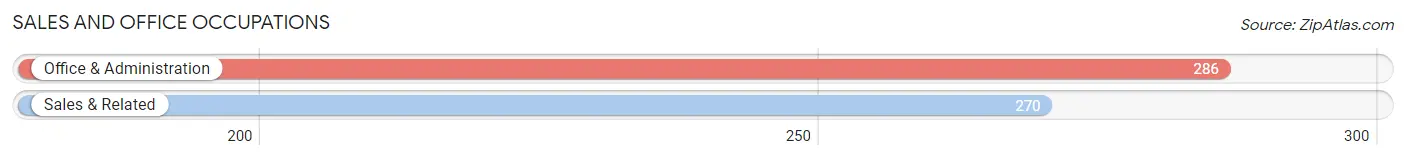
Sales and Office Occupations
The most common Sales and Office occupations in Sheridan are Office & Administration (286 | 10.5%), and Sales & Related (270 | 9.9%).
Sales and Office Occupations by Sex
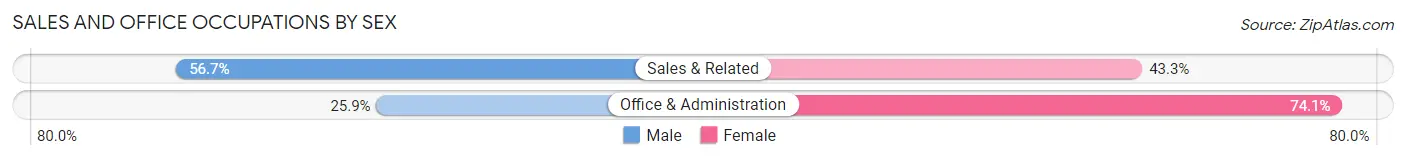
| Occupation | Male | Female |
| Sales & Related | 153 (56.7%) | 117 (43.3%) |
| Office & Administration | 74 (25.9%) | 212 (74.1%) |
| Total (Category) | 227 (40.8%) | 329 (59.2%) |
| Total (Overall) | 1,460 (53.5%) | 1,269 (46.5%) |
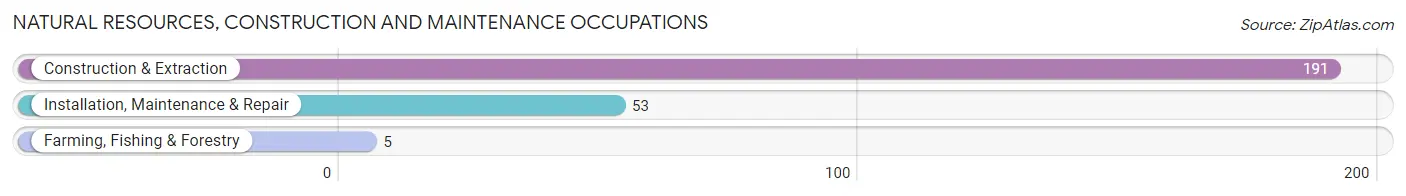
Natural Resources, Construction and Maintenance Occupations
The most common Natural Resources, Construction and Maintenance occupations in Sheridan are Construction & Extraction (191 | 7.0%), Installation, Maintenance & Repair (53 | 1.9%), and Farming, Fishing & Forestry (5 | 0.2%).
Natural Resources, Construction and Maintenance Occupations by Sex
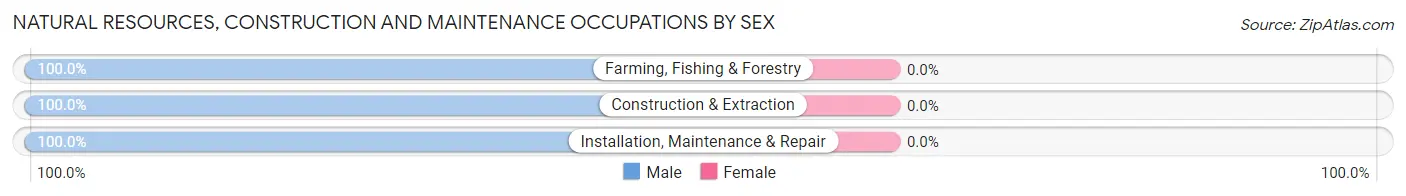
| Occupation | Male | Female |
| Farming, Fishing & Forestry | 5 (100.0%) | 0 (0.0%) |
| Construction & Extraction | 191 (100.0%) | 0 (0.0%) |
| Installation, Maintenance & Repair | 53 (100.0%) | 0 (0.0%) |
| Total (Category) | 249 (100.0%) | 0 (0.0%) |
| Total (Overall) | 1,460 (53.5%) | 1,269 (46.5%) |
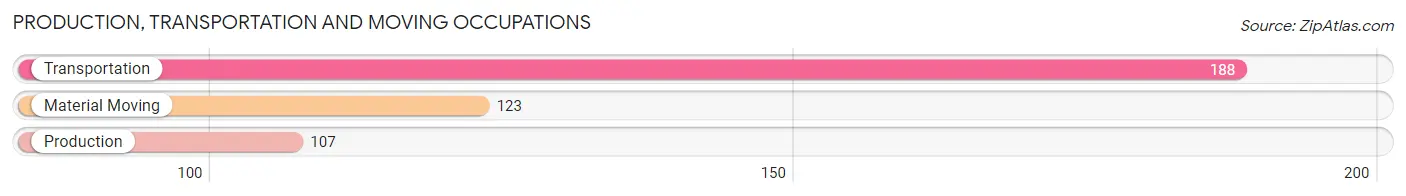
Production, Transportation and Moving Occupations
The most common Production, Transportation and Moving occupations in Sheridan are Transportation (188 | 6.9%), Material Moving (123 | 4.5%), and Production (107 | 3.9%).
Production, Transportation and Moving Occupations by Sex
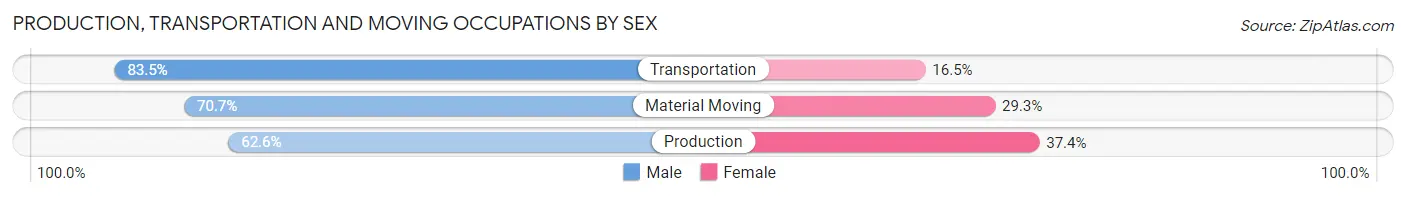
| Occupation | Male | Female |
| Production | 67 (62.6%) | 40 (37.4%) |
| Transportation | 157 (83.5%) | 31 (16.5%) |
| Material Moving | 87 (70.7%) | 36 (29.3%) |
| Total (Category) | 311 (74.4%) | 107 (25.6%) |
| Total (Overall) | 1,460 (53.5%) | 1,269 (46.5%) |
Employment Industries by Sex in Sheridan
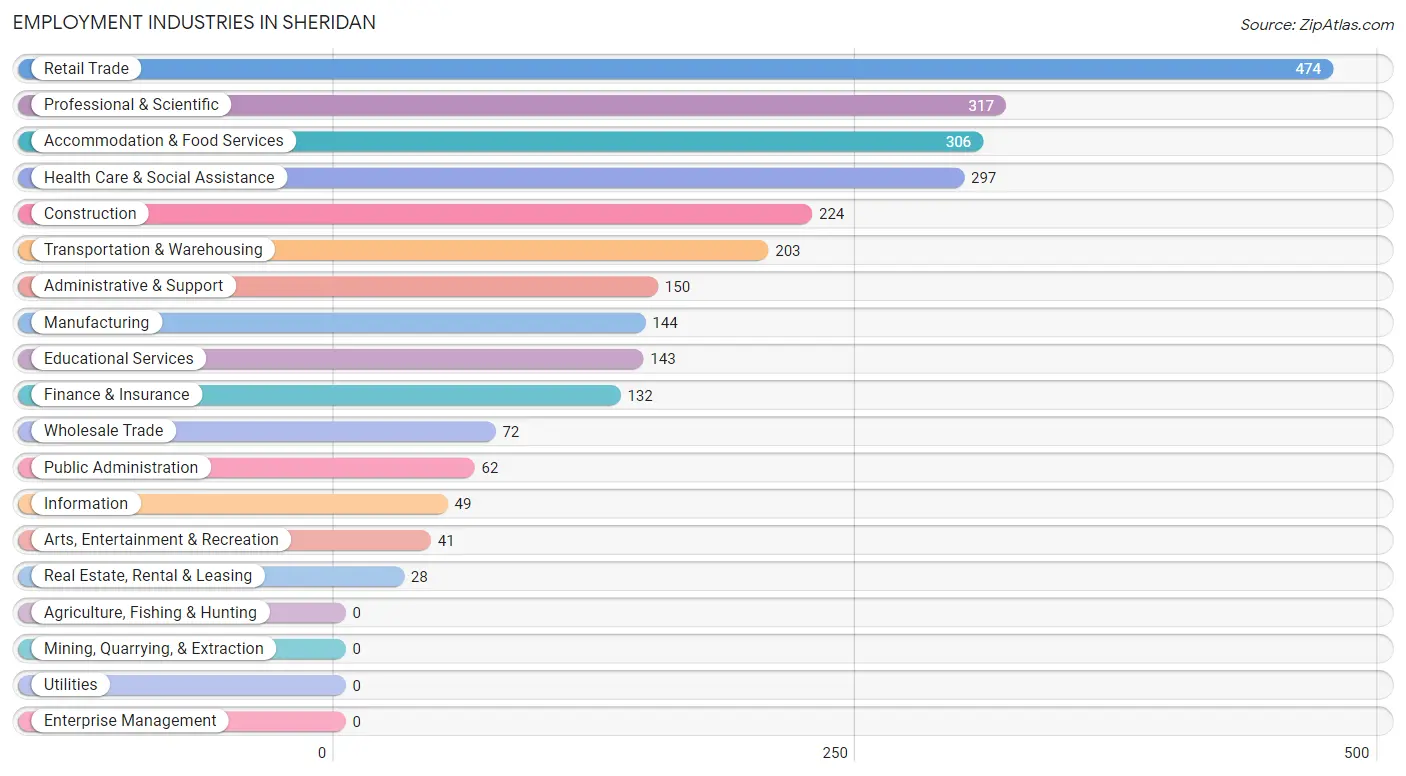
Employment Industries in Sheridan
The major employment industries in Sheridan include Retail Trade (474 | 17.4%), Professional & Scientific (317 | 11.6%), Accommodation & Food Services (306 | 11.2%), Health Care & Social Assistance (297 | 10.9%), and Construction (224 | 8.2%).
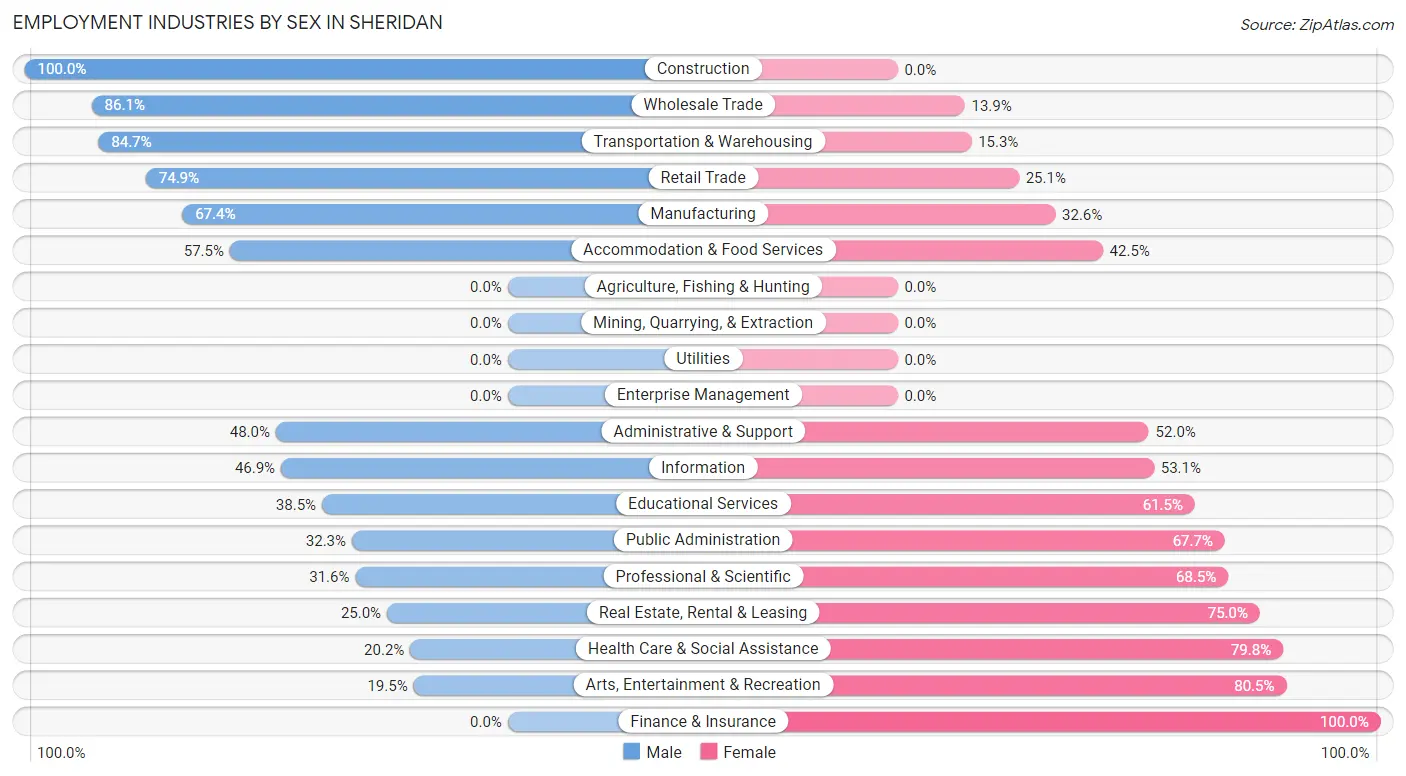
Employment Industries by Sex in Sheridan
The Sheridan industries that see more men than women are Construction (100.0%), Wholesale Trade (86.1%), and Transportation & Warehousing (84.7%), whereas the industries that tend to have a higher number of women are Finance & Insurance (100.0%), Arts, Entertainment & Recreation (80.5%), and Health Care & Social Assistance (79.8%).
| Industry | Male | Female |
| Agriculture, Fishing & Hunting | 0 (0.0%) | 0 (0.0%) |
| Mining, Quarrying, & Extraction | 0 (0.0%) | 0 (0.0%) |
| Construction | 224 (100.0%) | 0 (0.0%) |
| Manufacturing | 97 (67.4%) | 47 (32.6%) |
| Wholesale Trade | 62 (86.1%) | 10 (13.9%) |
| Retail Trade | 355 (74.9%) | 119 (25.1%) |
| Transportation & Warehousing | 172 (84.7%) | 31 (15.3%) |
| Utilities | 0 (0.0%) | 0 (0.0%) |
| Information | 23 (46.9%) | 26 (53.1%) |
| Finance & Insurance | 0 (0.0%) | 132 (100.0%) |
| Real Estate, Rental & Leasing | 7 (25.0%) | 21 (75.0%) |
| Professional & Scientific | 100 (31.6%) | 217 (68.4%) |
| Enterprise Management | 0 (0.0%) | 0 (0.0%) |
| Administrative & Support | 72 (48.0%) | 78 (52.0%) |
| Educational Services | 55 (38.5%) | 88 (61.5%) |
| Health Care & Social Assistance | 60 (20.2%) | 237 (79.8%) |
| Arts, Entertainment & Recreation | 8 (19.5%) | 33 (80.5%) |
| Accommodation & Food Services | 176 (57.5%) | 130 (42.5%) |
| Public Administration | 20 (32.3%) | 42 (67.7%) |
| Total | 1,460 (53.5%) | 1,269 (46.5%) |
Education in Sheridan
School Enrollment in Sheridan
The most common levels of schooling among the 1,593 students in Sheridan are elementary school (452 | 28.4%), middle school (396 | 24.9%), and high school (376 | 23.6%).
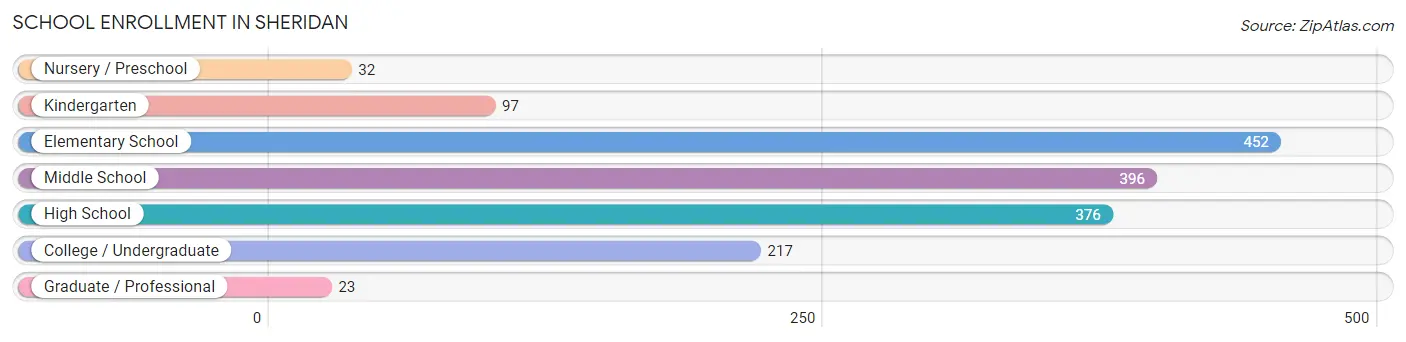
| School Level | # Students | % Students |
| Nursery / Preschool | 32 | 2.0% |
| Kindergarten | 97 | 6.1% |
| Elementary School | 452 | 28.4% |
| Middle School | 396 | 24.9% |
| High School | 376 | 23.6% |
| College / Undergraduate | 217 | 13.6% |
| Graduate / Professional | 23 | 1.4% |
| Total | 1,593 | 100.0% |
School Enrollment by Age by Funding Source in Sheridan
Out of a total of 1,593 students who are enrolled in schools in Sheridan, 56 (3.5%) attend a private institution, while the remaining 1,537 (96.5%) are enrolled in public schools. The age group of 3 to 4 year olds has the highest likelihood of being enrolled in private schools, with 11 (100.0% in the age bracket) enrolled. Conversely, the age group of 5 to 9 year old has the lowest likelihood of being enrolled in a private school, with 516 (100.0% in the age bracket) attending a public institution.
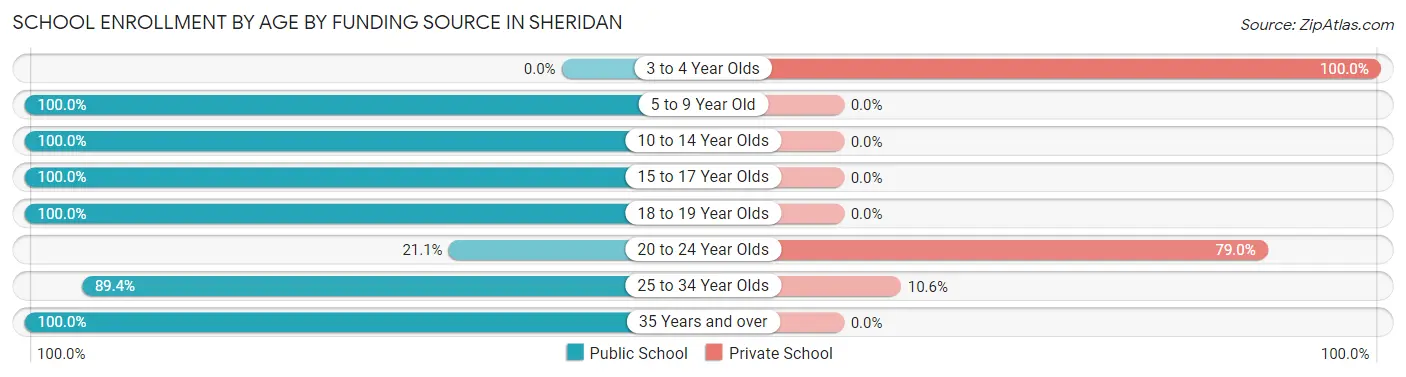
| Age Bracket | Public School | Private School |
| 3 to 4 Year Olds | 0 (0.0%) | 11 (100.0%) |
| 5 to 9 Year Old | 516 (100.0%) | 0 (0.0%) |
| 10 to 14 Year Olds | 505 (100.0%) | 0 (0.0%) |
| 15 to 17 Year Olds | 228 (100.0%) | 0 (0.0%) |
| 18 to 19 Year Olds | 63 (100.0%) | 0 (0.0%) |
| 20 to 24 Year Olds | 8 (21.0%) | 30 (78.9%) |
| 25 to 34 Year Olds | 126 (89.4%) | 15 (10.6%) |
| 35 Years and over | 91 (100.0%) | 0 (0.0%) |
| Total | 1,537 (96.5%) | 56 (3.5%) |
Educational Attainment by Field of Study in Sheridan
Arts & humanities (191 | 22.6%), literature & languages (106 | 12.5%), business (100 | 11.8%), education (78 | 9.2%), and computers & mathematics (74 | 8.7%) are the most common fields of study among 846 individuals in Sheridan who have obtained a bachelor's degree or higher.
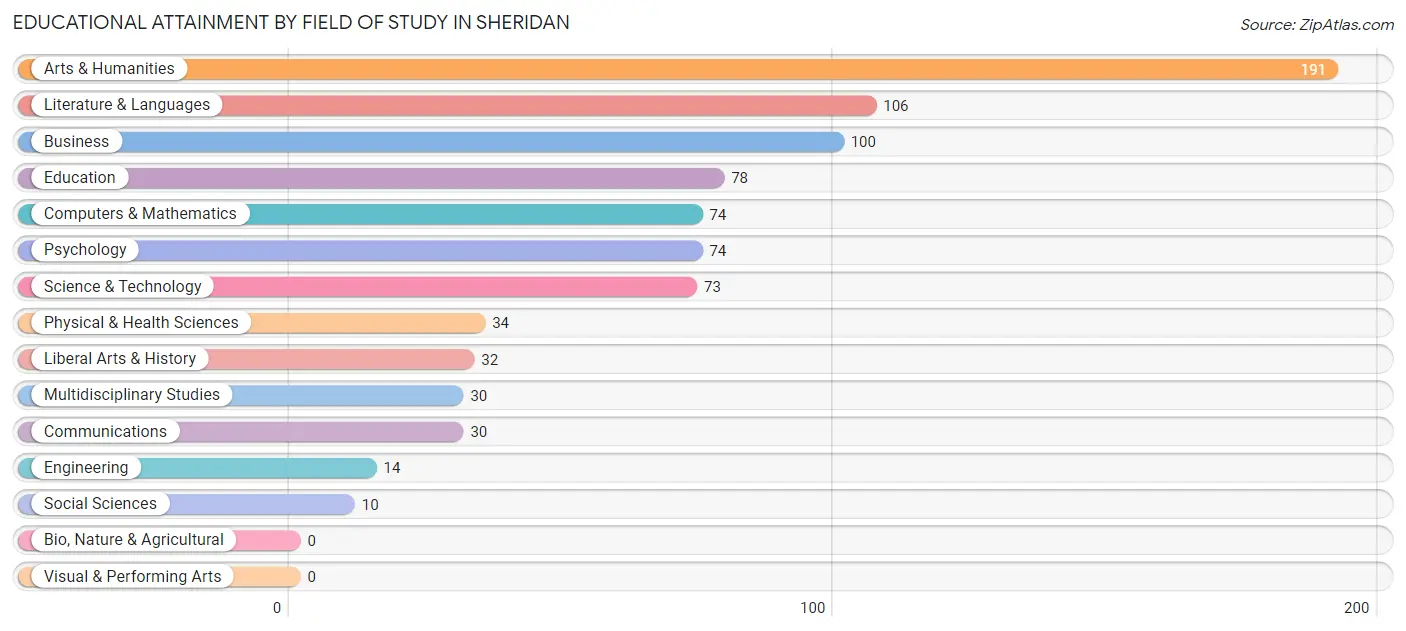
| Field of Study | # Graduates | % Graduates |
| Computers & Mathematics | 74 | 8.7% |
| Bio, Nature & Agricultural | 0 | 0.0% |
| Physical & Health Sciences | 34 | 4.0% |
| Psychology | 74 | 8.7% |
| Social Sciences | 10 | 1.2% |
| Engineering | 14 | 1.7% |
| Multidisciplinary Studies | 30 | 3.5% |
| Science & Technology | 73 | 8.6% |
| Business | 100 | 11.8% |
| Education | 78 | 9.2% |
| Literature & Languages | 106 | 12.5% |
| Liberal Arts & History | 32 | 3.8% |
| Visual & Performing Arts | 0 | 0.0% |
| Communications | 30 | 3.5% |
| Arts & Humanities | 191 | 22.6% |
| Total | 846 | 100.0% |
Transportation & Commute in Sheridan
Vehicle Availability by Sex in Sheridan
The most prevalent vehicle ownership categories in Sheridan are males with 2 vehicles (524, accounting for 36.2%) and females with 2 vehicles (569, making up 45.6%).
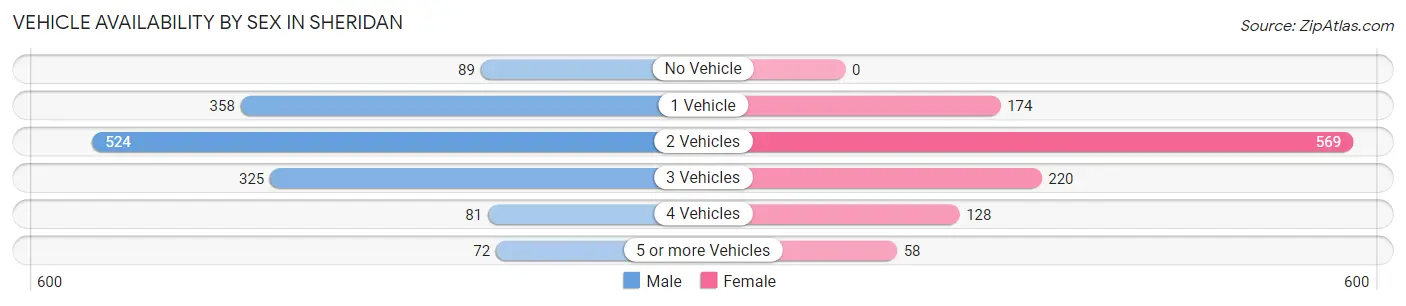
| Vehicles Available | Male | Female |
| No Vehicle | 89 (6.1%) | 0 (0.0%) |
| 1 Vehicle | 358 (24.7%) | 174 (15.1%) |
| 2 Vehicles | 524 (36.2%) | 569 (49.5%) |
| 3 Vehicles | 325 (22.4%) | 220 (19.2%) |
| 4 Vehicles | 81 (5.6%) | 128 (11.1%) |
| 5 or more Vehicles | 72 (5.0%) | 58 (5.1%) |
| Total | 1,449 (100.0%) | 1,149 (100.0%) |
Commute Time in Sheridan
The most frequently occuring commute durations in Sheridan are 10 to 14 minutes (386 commuters, 15.7%), 30 to 34 minutes (356 commuters, 14.5%), and 15 to 19 minutes (308 commuters, 12.5%).
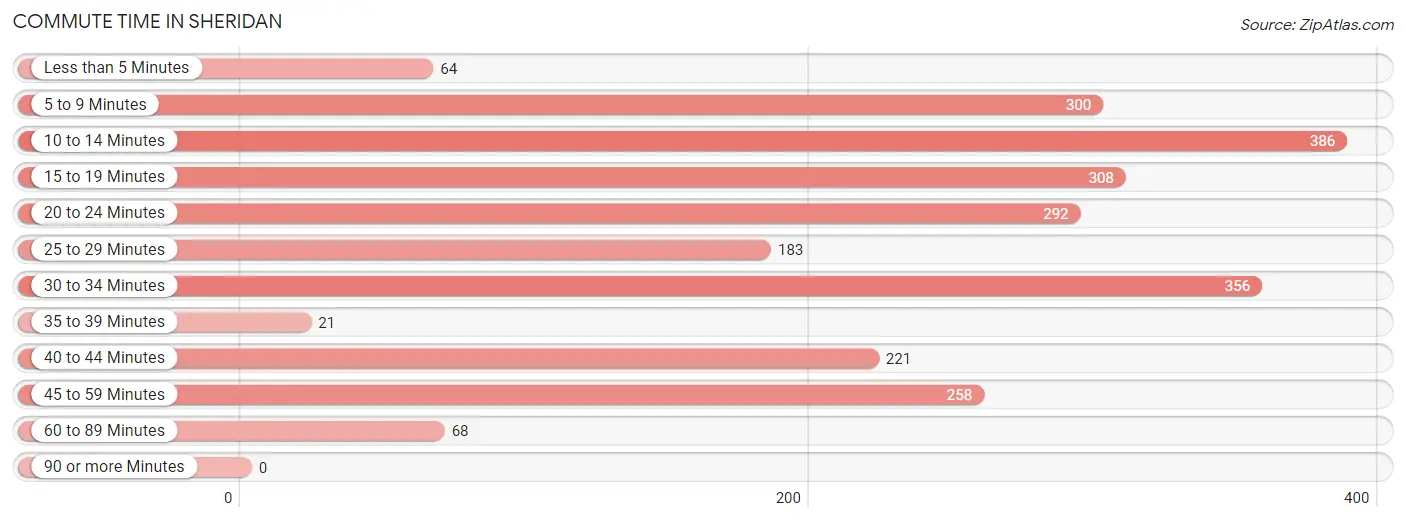
| Commute Time | # Commuters | % Commuters |
| Less than 5 Minutes | 64 | 2.6% |
| 5 to 9 Minutes | 300 | 12.2% |
| 10 to 14 Minutes | 386 | 15.7% |
| 15 to 19 Minutes | 308 | 12.5% |
| 20 to 24 Minutes | 292 | 11.9% |
| 25 to 29 Minutes | 183 | 7.4% |
| 30 to 34 Minutes | 356 | 14.5% |
| 35 to 39 Minutes | 21 | 0.9% |
| 40 to 44 Minutes | 221 | 9.0% |
| 45 to 59 Minutes | 258 | 10.5% |
| 60 to 89 Minutes | 68 | 2.8% |
| 90 or more Minutes | 0 | 0.0% |
Commute Time by Sex in Sheridan
The most common commute times in Sheridan are 30 to 34 minutes (233 commuters, 16.3%) for males and 10 to 14 minutes (228 commuters, 22.1%) for females.
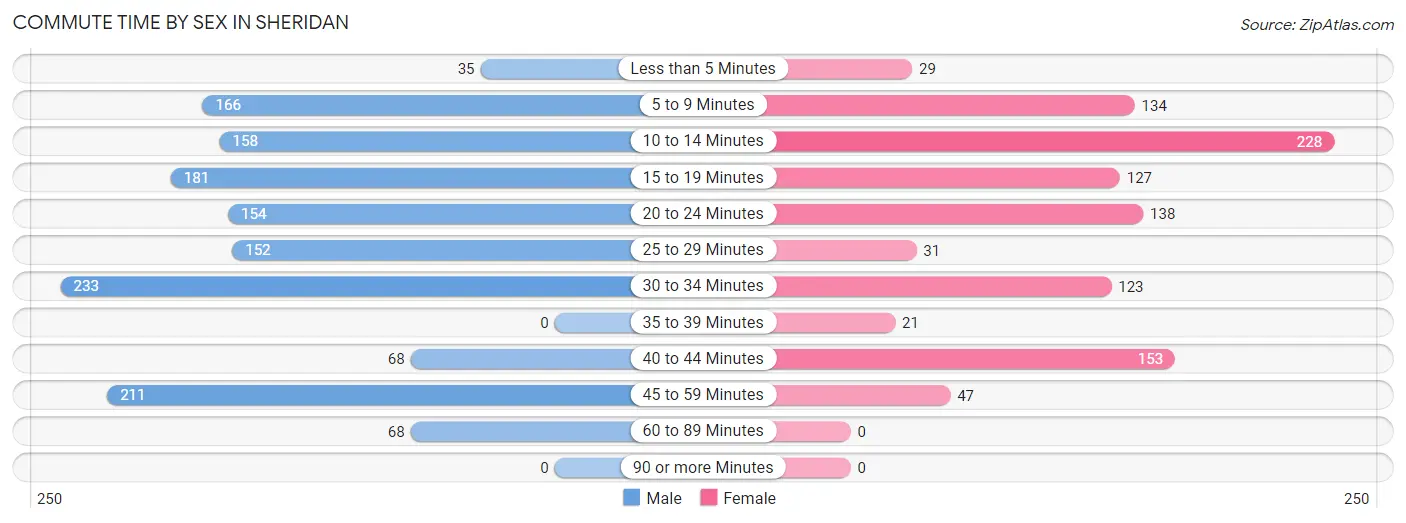
| Commute Time | Male | Female |
| Less than 5 Minutes | 35 (2.5%) | 29 (2.8%) |
| 5 to 9 Minutes | 166 (11.6%) | 134 (13.0%) |
| 10 to 14 Minutes | 158 (11.1%) | 228 (22.1%) |
| 15 to 19 Minutes | 181 (12.7%) | 127 (12.3%) |
| 20 to 24 Minutes | 154 (10.8%) | 138 (13.4%) |
| 25 to 29 Minutes | 152 (10.7%) | 31 (3.0%) |
| 30 to 34 Minutes | 233 (16.3%) | 123 (11.9%) |
| 35 to 39 Minutes | 0 (0.0%) | 21 (2.0%) |
| 40 to 44 Minutes | 68 (4.8%) | 153 (14.8%) |
| 45 to 59 Minutes | 211 (14.8%) | 47 (4.6%) |
| 60 to 89 Minutes | 68 (4.8%) | 0 (0.0%) |
| 90 or more Minutes | 0 (0.0%) | 0 (0.0%) |
Time of Departure to Work by Sex in Sheridan
The most frequent times of departure to work in Sheridan are 6:00 AM to 6:29 AM (324, 22.7%) for males and 7:00 AM to 7:29 AM (193, 18.7%) for females.
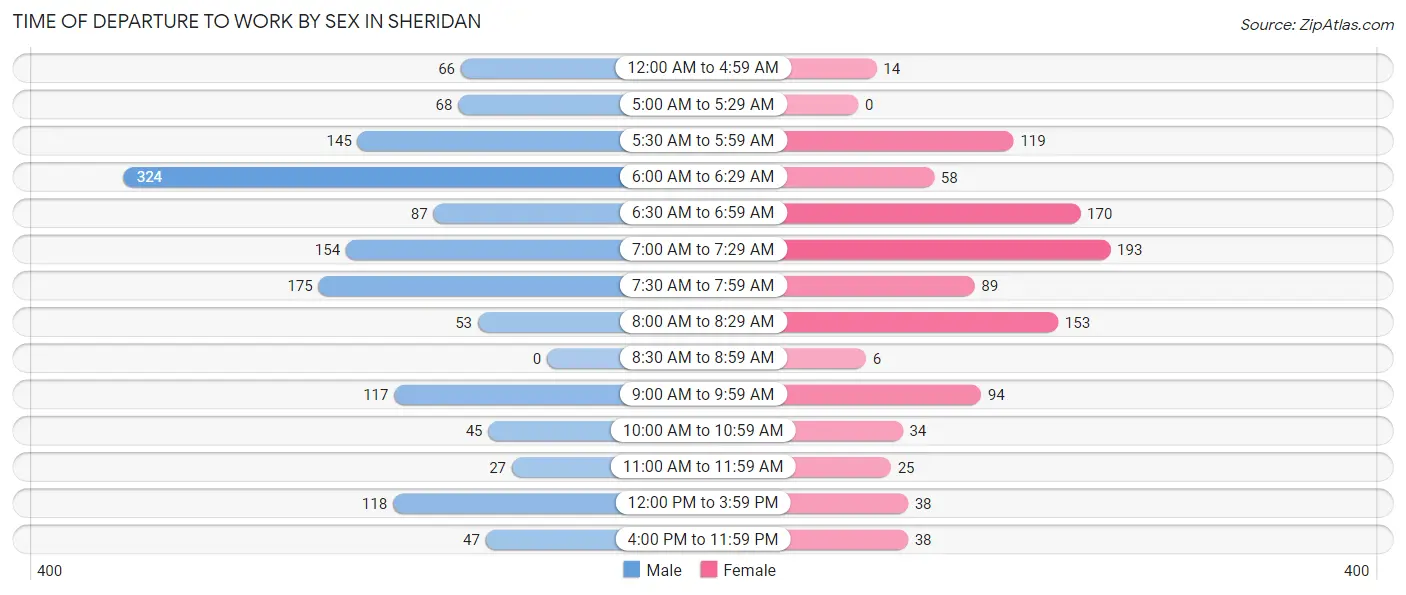
| Time of Departure | Male | Female |
| 12:00 AM to 4:59 AM | 66 (4.6%) | 14 (1.4%) |
| 5:00 AM to 5:29 AM | 68 (4.8%) | 0 (0.0%) |
| 5:30 AM to 5:59 AM | 145 (10.2%) | 119 (11.5%) |
| 6:00 AM to 6:29 AM | 324 (22.7%) | 58 (5.6%) |
| 6:30 AM to 6:59 AM | 87 (6.1%) | 170 (16.5%) |
| 7:00 AM to 7:29 AM | 154 (10.8%) | 193 (18.7%) |
| 7:30 AM to 7:59 AM | 175 (12.3%) | 89 (8.6%) |
| 8:00 AM to 8:29 AM | 53 (3.7%) | 153 (14.8%) |
| 8:30 AM to 8:59 AM | 0 (0.0%) | 6 (0.6%) |
| 9:00 AM to 9:59 AM | 117 (8.2%) | 94 (9.1%) |
| 10:00 AM to 10:59 AM | 45 (3.2%) | 34 (3.3%) |
| 11:00 AM to 11:59 AM | 27 (1.9%) | 25 (2.4%) |
| 12:00 PM to 3:59 PM | 118 (8.3%) | 38 (3.7%) |
| 4:00 PM to 11:59 PM | 47 (3.3%) | 38 (3.7%) |
| Total | 1,426 (100.0%) | 1,031 (100.0%) |
Housing Occupancy in Sheridan
Occupancy by Ownership in Sheridan
Of the total 2,442 dwellings in Sheridan, owner-occupied units account for 1,397 (57.2%), while renter-occupied units make up 1,045 (42.8%).
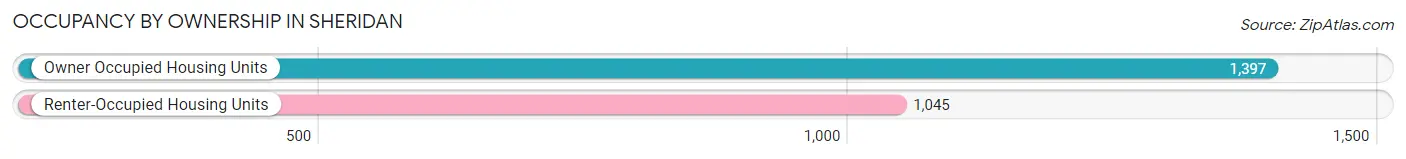
| Occupancy | # Housing Units | % Housing Units |
| Owner Occupied Housing Units | 1,397 | 57.2% |
| Renter-Occupied Housing Units | 1,045 | 42.8% |
| Total Occupied Housing Units | 2,442 | 100.0% |
Occupancy by Household Size in Sheridan
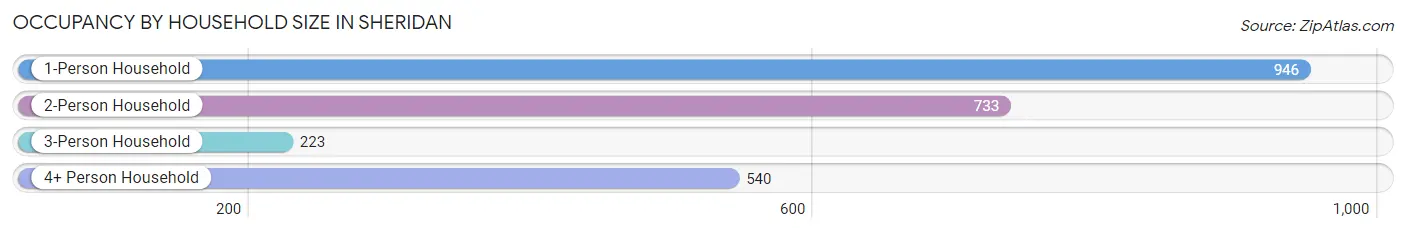
| Household Size | # Housing Units | % Housing Units |
| 1-Person Household | 946 | 38.7% |
| 2-Person Household | 733 | 30.0% |
| 3-Person Household | 223 | 9.1% |
| 4+ Person Household | 540 | 22.1% |
| Total Housing Units | 2,442 | 100.0% |
Occupancy by Ownership by Household Size in Sheridan
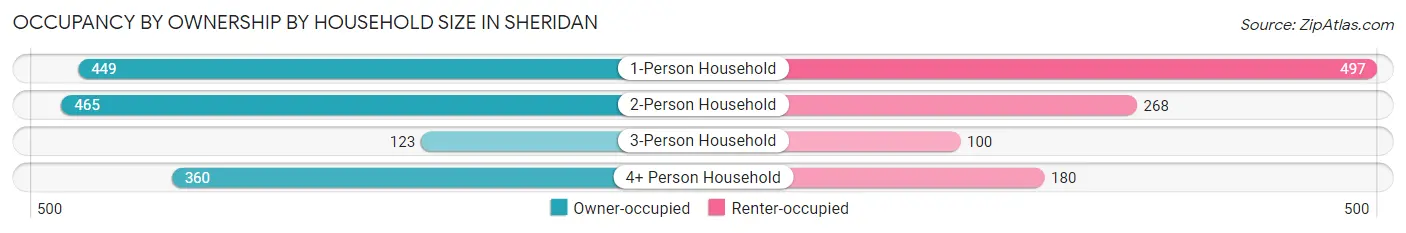
| Household Size | Owner-occupied | Renter-occupied |
| 1-Person Household | 449 (47.5%) | 497 (52.5%) |
| 2-Person Household | 465 (63.4%) | 268 (36.6%) |
| 3-Person Household | 123 (55.2%) | 100 (44.8%) |
| 4+ Person Household | 360 (66.7%) | 180 (33.3%) |
| Total Housing Units | 1,397 (57.2%) | 1,045 (42.8%) |
Occupancy by Educational Attainment in Sheridan
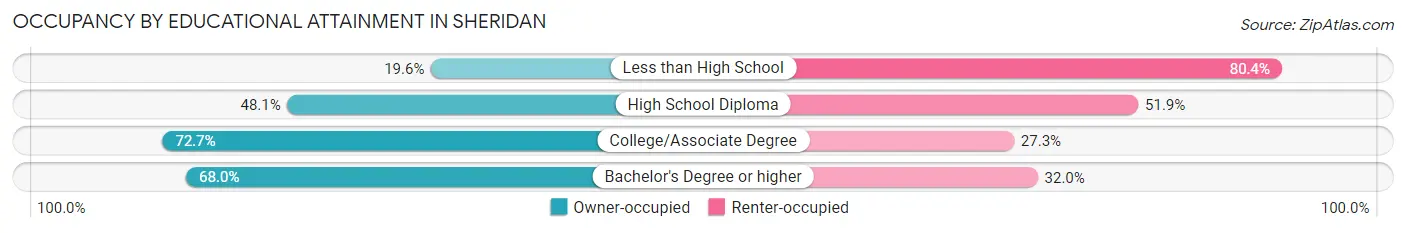
| Household Size | Owner-occupied | Renter-occupied |
| Less than High School | 47 (19.6%) | 193 (80.4%) |
| High School Diploma | 436 (48.1%) | 471 (51.9%) |
| College/Associate Degree | 519 (72.7%) | 195 (27.3%) |
| Bachelor's Degree or higher | 395 (68.0%) | 186 (32.0%) |
Occupancy by Age of Householder in Sheridan
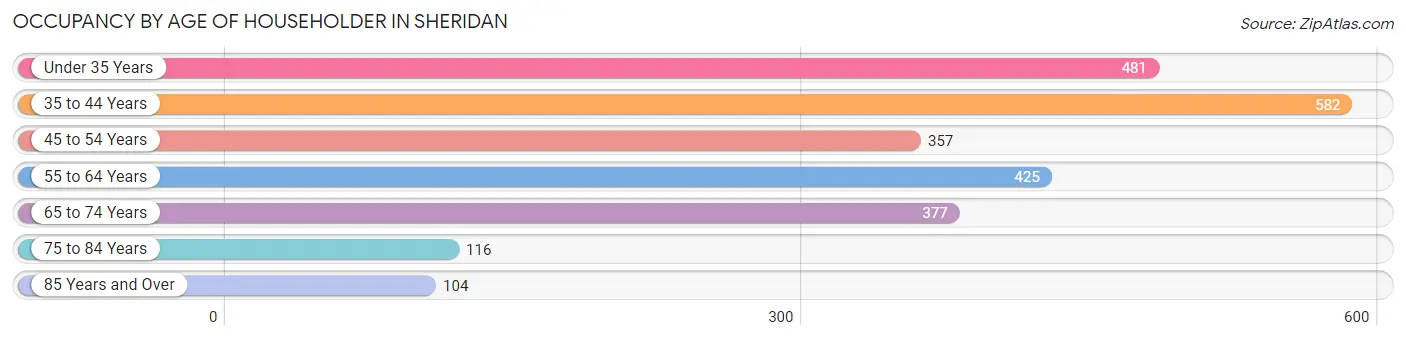
| Age Bracket | # Households | % Households |
| Under 35 Years | 481 | 19.7% |
| 35 to 44 Years | 582 | 23.8% |
| 45 to 54 Years | 357 | 14.6% |
| 55 to 64 Years | 425 | 17.4% |
| 65 to 74 Years | 377 | 15.4% |
| 75 to 84 Years | 116 | 4.8% |
| 85 Years and Over | 104 | 4.3% |
| Total | 2,442 | 100.0% |
Housing Finances in Sheridan
Median Income by Occupancy in Sheridan
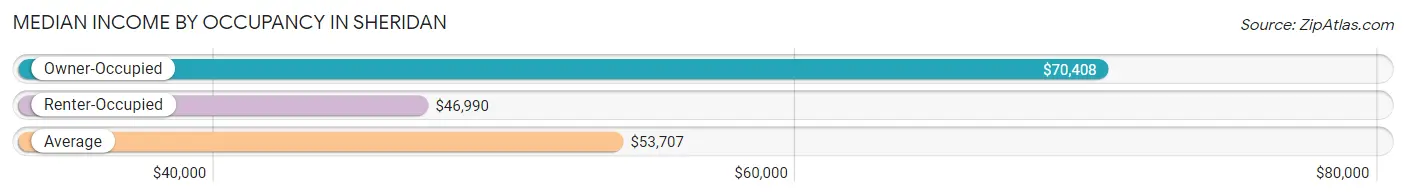
| Occupancy Type | # Households | Median Income |
| Owner-Occupied | 1,397 (57.2%) | $70,408 |
| Renter-Occupied | 1,045 (42.8%) | $46,990 |
| Average | 2,442 (100.0%) | $53,707 |
Occupancy by Householder Income Bracket in Sheridan
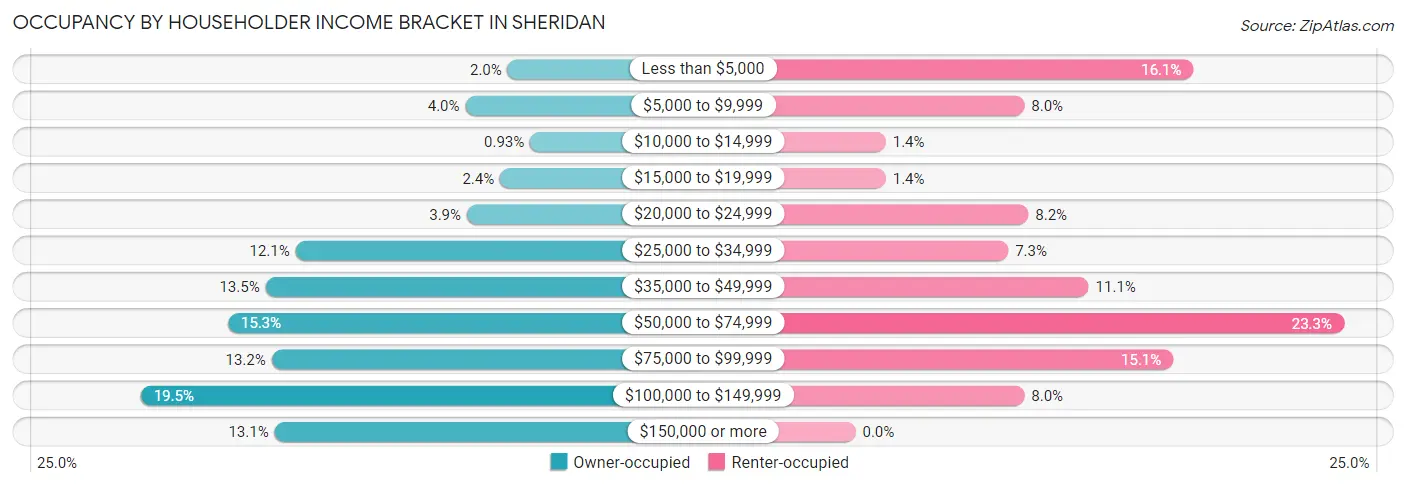
| Income Bracket | Owner-occupied | Renter-occupied |
| Less than $5,000 | 28 (2.0%) | 168 (16.1%) |
| $5,000 to $9,999 | 56 (4.0%) | 84 (8.0%) |
| $10,000 to $14,999 | 13 (0.9%) | 15 (1.4%) |
| $15,000 to $19,999 | 33 (2.4%) | 15 (1.4%) |
| $20,000 to $24,999 | 55 (3.9%) | 86 (8.2%) |
| $25,000 to $34,999 | 169 (12.1%) | 76 (7.3%) |
| $35,000 to $49,999 | 189 (13.5%) | 116 (11.1%) |
| $50,000 to $74,999 | 214 (15.3%) | 243 (23.3%) |
| $75,000 to $99,999 | 185 (13.2%) | 158 (15.1%) |
| $100,000 to $149,999 | 272 (19.5%) | 84 (8.0%) |
| $150,000 or more | 183 (13.1%) | 0 (0.0%) |
| Total | 1,397 (100.0%) | 1,045 (100.0%) |
Monthly Housing Cost Tiers in Sheridan
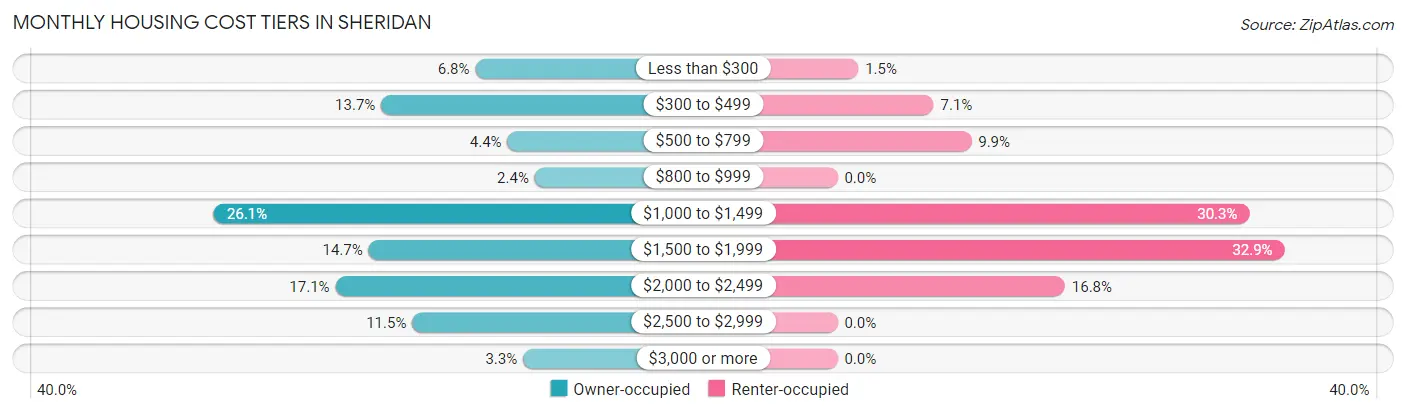
| Monthly Cost | Owner-occupied | Renter-occupied |
| Less than $300 | 95 (6.8%) | 16 (1.5%) |
| $300 to $499 | 192 (13.7%) | 74 (7.1%) |
| $500 to $799 | 62 (4.4%) | 103 (9.9%) |
| $800 to $999 | 34 (2.4%) | 0 (0.0%) |
| $1,000 to $1,499 | 364 (26.1%) | 317 (30.3%) |
| $1,500 to $1,999 | 205 (14.7%) | 344 (32.9%) |
| $2,000 to $2,499 | 239 (17.1%) | 175 (16.8%) |
| $2,500 to $2,999 | 160 (11.5%) | 0 (0.0%) |
| $3,000 or more | 46 (3.3%) | 0 (0.0%) |
| Total | 1,397 (100.0%) | 1,045 (100.0%) |
Physical Housing Characteristics in Sheridan
Housing Structures in Sheridan
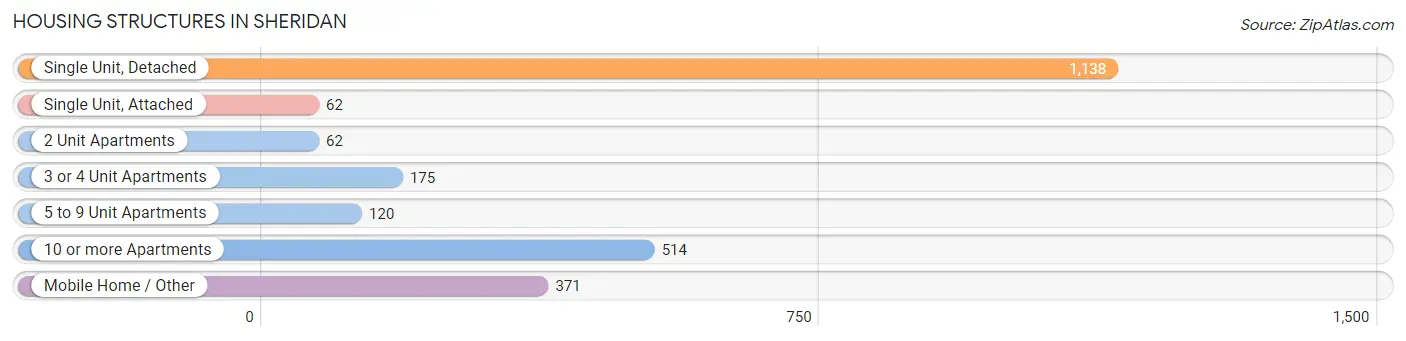
| Structure Type | # Housing Units | % Housing Units |
| Single Unit, Detached | 1,138 | 46.6% |
| Single Unit, Attached | 62 | 2.5% |
| 2 Unit Apartments | 62 | 2.5% |
| 3 or 4 Unit Apartments | 175 | 7.2% |
| 5 to 9 Unit Apartments | 120 | 4.9% |
| 10 or more Apartments | 514 | 21.0% |
| Mobile Home / Other | 371 | 15.2% |
| Total | 2,442 | 100.0% |
Housing Structures by Occupancy in Sheridan
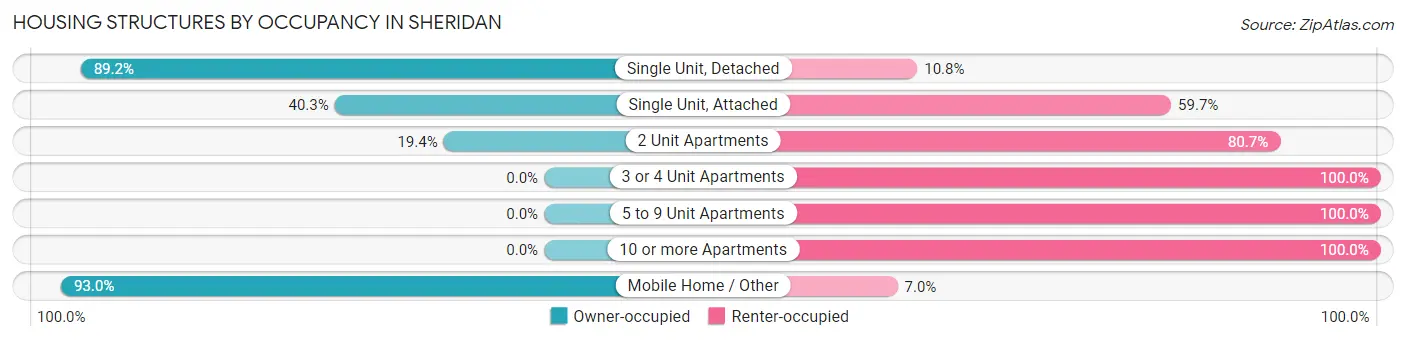
| Structure Type | Owner-occupied | Renter-occupied |
| Single Unit, Detached | 1,015 (89.2%) | 123 (10.8%) |
| Single Unit, Attached | 25 (40.3%) | 37 (59.7%) |
| 2 Unit Apartments | 12 (19.4%) | 50 (80.6%) |
| 3 or 4 Unit Apartments | 0 (0.0%) | 175 (100.0%) |
| 5 to 9 Unit Apartments | 0 (0.0%) | 120 (100.0%) |
| 10 or more Apartments | 0 (0.0%) | 514 (100.0%) |
| Mobile Home / Other | 345 (93.0%) | 26 (7.0%) |
| Total | 1,397 (57.2%) | 1,045 (42.8%) |
Housing Structures by Number of Rooms in Sheridan
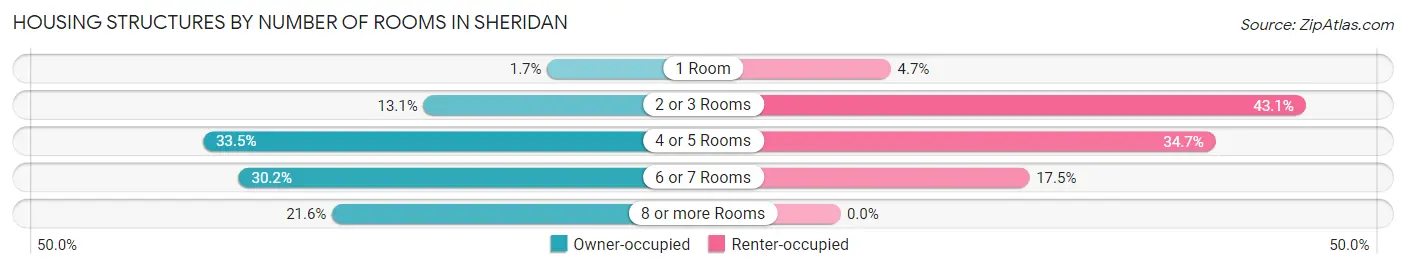
| Number of Rooms | Owner-occupied | Renter-occupied |
| 1 Room | 23 (1.7%) | 49 (4.7%) |
| 2 or 3 Rooms | 183 (13.1%) | 450 (43.1%) |
| 4 or 5 Rooms | 468 (33.5%) | 363 (34.7%) |
| 6 or 7 Rooms | 422 (30.2%) | 183 (17.5%) |
| 8 or more Rooms | 301 (21.5%) | 0 (0.0%) |
| Total | 1,397 (100.0%) | 1,045 (100.0%) |
Housing Structure by Heating Type in Sheridan
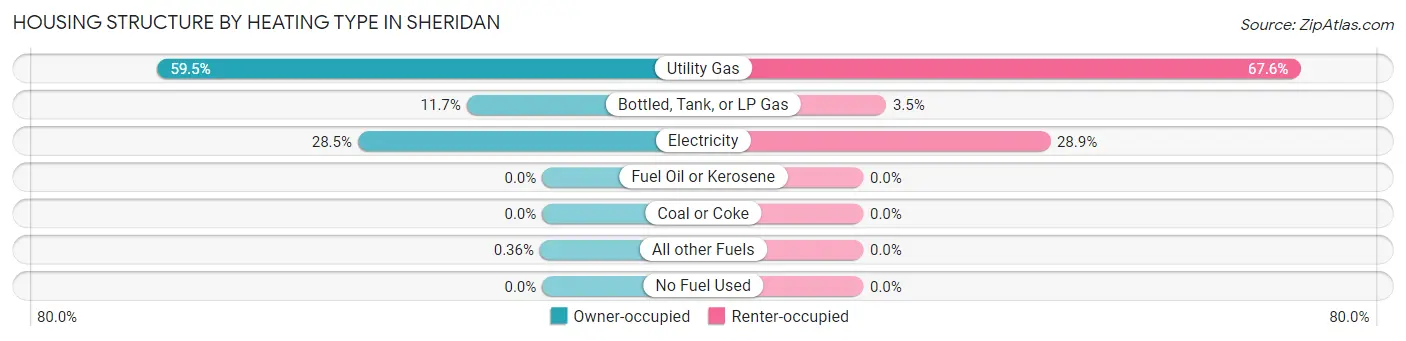
| Heating Type | Owner-occupied | Renter-occupied |
| Utility Gas | 831 (59.5%) | 706 (67.6%) |
| Bottled, Tank, or LP Gas | 163 (11.7%) | 37 (3.5%) |
| Electricity | 398 (28.5%) | 302 (28.9%) |
| Fuel Oil or Kerosene | 0 (0.0%) | 0 (0.0%) |
| Coal or Coke | 0 (0.0%) | 0 (0.0%) |
| All other Fuels | 5 (0.4%) | 0 (0.0%) |
| No Fuel Used | 0 (0.0%) | 0 (0.0%) |
| Total | 1,397 (100.0%) | 1,045 (100.0%) |
Household Vehicle Usage in Sheridan
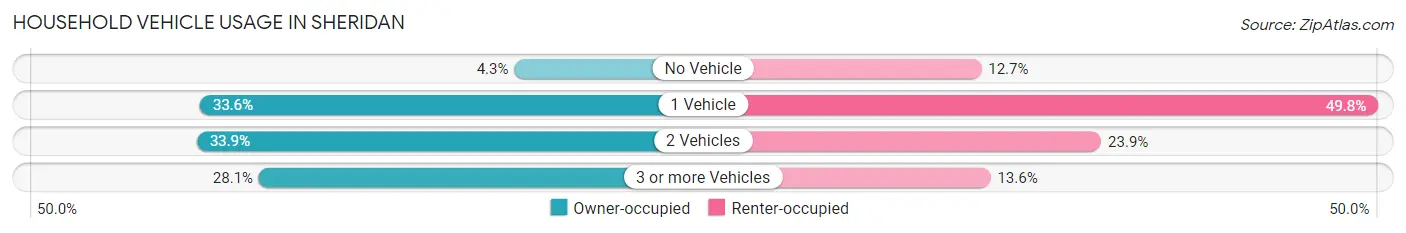
| Vehicles per Household | Owner-occupied | Renter-occupied |
| No Vehicle | 60 (4.3%) | 133 (12.7%) |
| 1 Vehicle | 470 (33.6%) | 520 (49.8%) |
| 2 Vehicles | 474 (33.9%) | 250 (23.9%) |
| 3 or more Vehicles | 393 (28.1%) | 142 (13.6%) |
| Total | 1,397 (100.0%) | 1,045 (100.0%) |
Real Estate & Mortgages in Sheridan
Real Estate and Mortgage Overview in Sheridan
| Characteristic | Without Mortgage | With Mortgage |
| Housing Units | 558 | 839 |
| Median Property Value | - | - |
| Median Household Income | $40,000 | $144 |
| Monthly Housing Costs | $492 | $33 |
| Real Estate Taxes | - | - |
Property Value by Mortgage Status in Sheridan
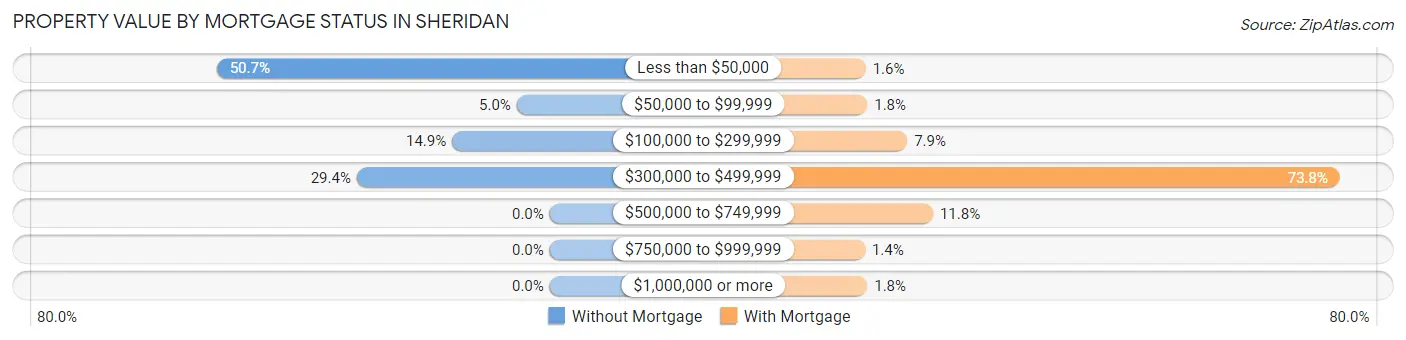
| Property Value | Without Mortgage | With Mortgage |
| Less than $50,000 | 283 (50.7%) | 13 (1.5%) |
| $50,000 to $99,999 | 28 (5.0%) | 15 (1.8%) |
| $100,000 to $299,999 | 83 (14.9%) | 66 (7.9%) |
| $300,000 to $499,999 | 164 (29.4%) | 619 (73.8%) |
| $500,000 to $749,999 | 0 (0.0%) | 99 (11.8%) |
| $750,000 to $999,999 | 0 (0.0%) | 12 (1.4%) |
| $1,000,000 or more | 0 (0.0%) | 15 (1.8%) |
| Total | 558 (100.0%) | 839 (100.0%) |
Household Income by Mortgage Status in Sheridan
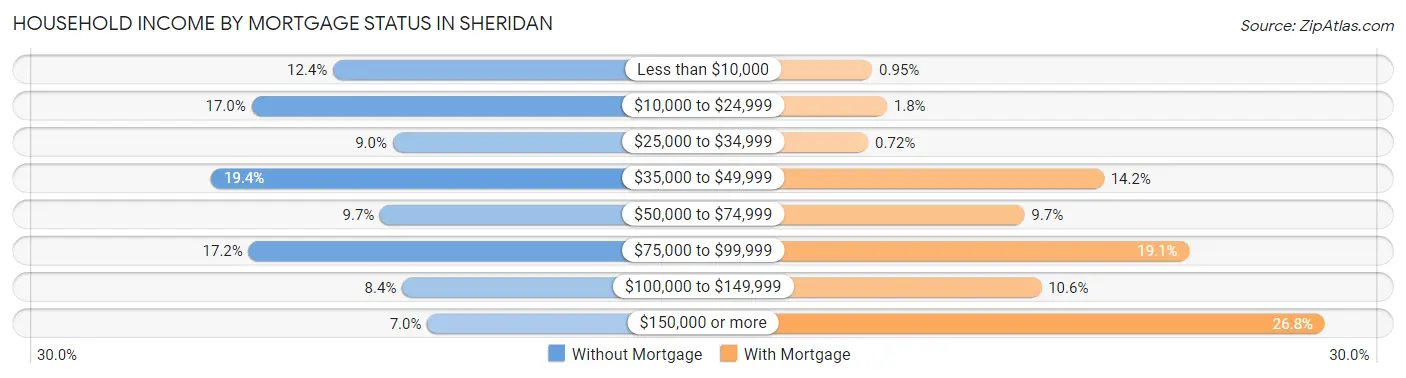
| Household Income | Without Mortgage | With Mortgage |
| Less than $10,000 | 69 (12.4%) | 8 (0.9%) |
| $10,000 to $24,999 | 95 (17.0%) | 15 (1.8%) |
| $25,000 to $34,999 | 50 (9.0%) | 6 (0.7%) |
| $35,000 to $49,999 | 108 (19.4%) | 119 (14.2%) |
| $50,000 to $74,999 | 54 (9.7%) | 81 (9.7%) |
| $75,000 to $99,999 | 96 (17.2%) | 160 (19.1%) |
| $100,000 to $149,999 | 47 (8.4%) | 89 (10.6%) |
| $150,000 or more | 39 (7.0%) | 225 (26.8%) |
| Total | 558 (100.0%) | 839 (100.0%) |
Property Value to Household Income Ratio in Sheridan
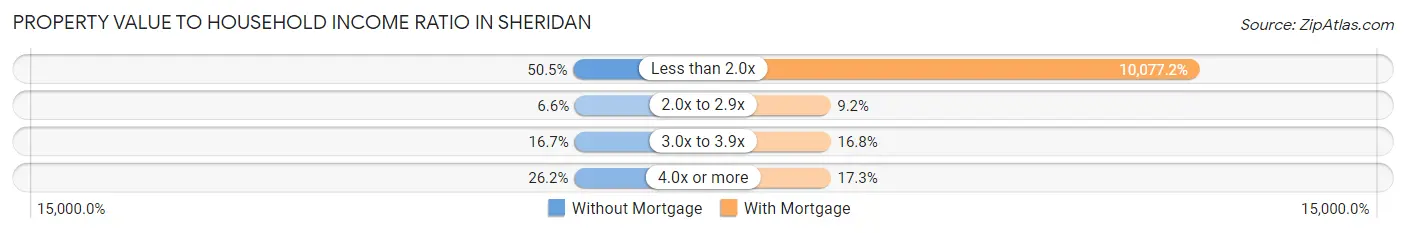
| Value-to-Income Ratio | Without Mortgage | With Mortgage |
| Less than 2.0x | 282 (50.5%) | 84,548 (10,077.2%) |
| 2.0x to 2.9x | 37 (6.6%) | 77 (9.2%) |
| 3.0x to 3.9x | 93 (16.7%) | 141 (16.8%) |
| 4.0x or more | 146 (26.2%) | 145 (17.3%) |
| Total | 558 (100.0%) | 839 (100.0%) |
Real Estate Taxes by Mortgage Status in Sheridan
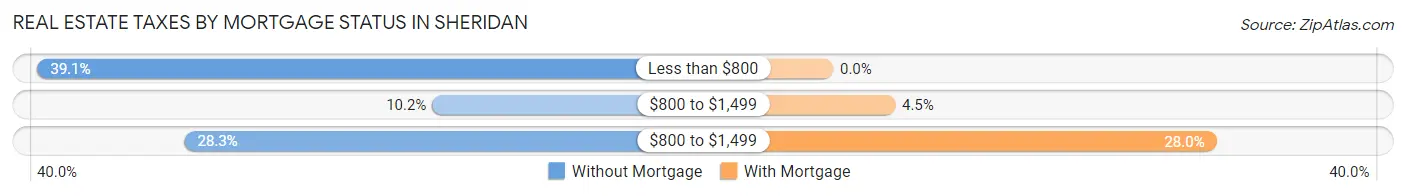
| Property Taxes | Without Mortgage | With Mortgage |
| Less than $800 | 218 (39.1%) | 0 (0.0%) |
| $800 to $1,499 | 57 (10.2%) | 38 (4.5%) |
| $800 to $1,499 | 158 (28.3%) | 235 (28.0%) |
| Total | 558 (100.0%) | 839 (100.0%) |
Health & Disability in Sheridan
Health Insurance Coverage by Age in Sheridan
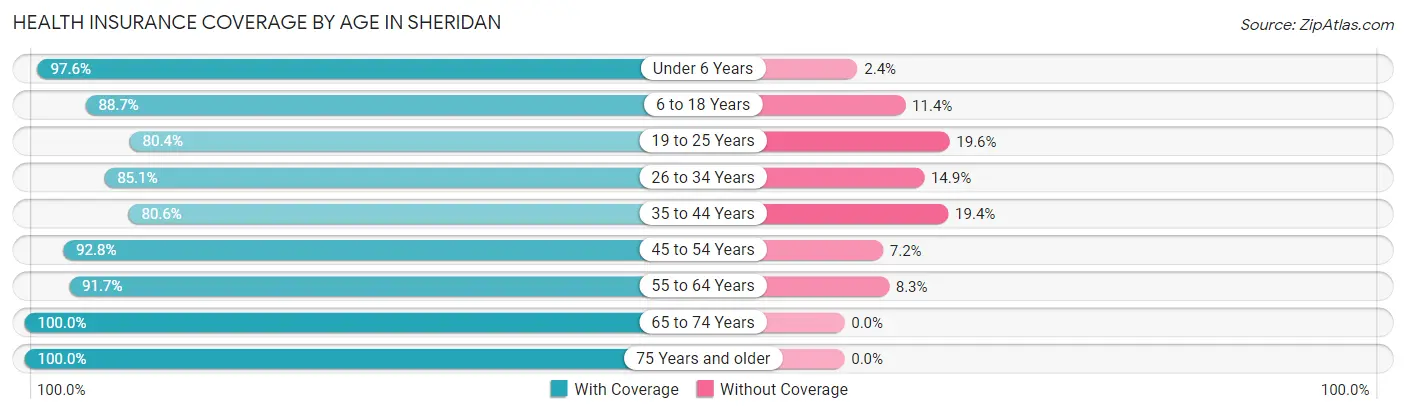
| Age Bracket | With Coverage | Without Coverage |
| Under 6 Years | 200 (97.6%) | 5 (2.4%) |
| 6 to 18 Years | 1,140 (88.6%) | 146 (11.4%) |
| 19 to 25 Years | 554 (80.4%) | 135 (19.6%) |
| 26 to 34 Years | 596 (85.1%) | 104 (14.9%) |
| 35 to 44 Years | 891 (80.6%) | 214 (19.4%) |
| 45 to 54 Years | 542 (92.8%) | 42 (7.2%) |
| 55 to 64 Years | 553 (91.7%) | 50 (8.3%) |
| 65 to 74 Years | 611 (100.0%) | 0 (0.0%) |
| 75 Years and older | 279 (100.0%) | 0 (0.0%) |
| Total | 5,366 (88.5%) | 696 (11.5%) |
Health Insurance Coverage by Citizenship Status in Sheridan
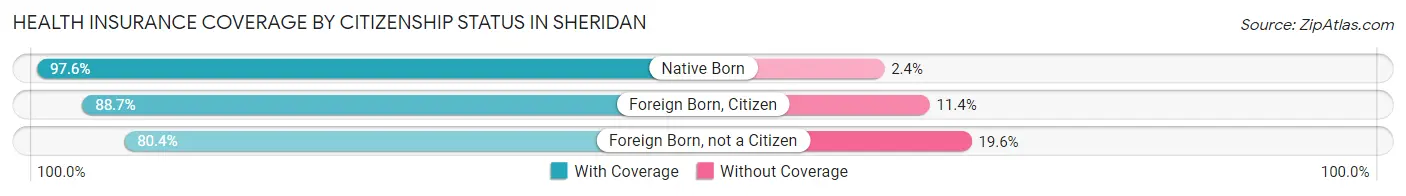
| Citizenship Status | With Coverage | Without Coverage |
| Native Born | 200 (97.6%) | 5 (2.4%) |
| Foreign Born, Citizen | 1,140 (88.6%) | 146 (11.4%) |
| Foreign Born, not a Citizen | 554 (80.4%) | 135 (19.6%) |
Health Insurance Coverage by Household Income in Sheridan
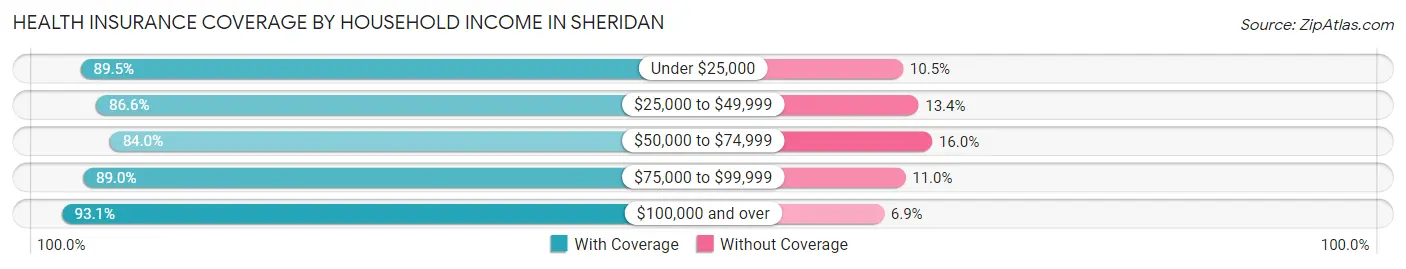
| Household Income | With Coverage | Without Coverage |
| Under $25,000 | 664 (89.5%) | 78 (10.5%) |
| $25,000 to $49,999 | 1,151 (86.6%) | 178 (13.4%) |
| $50,000 to $74,999 | 1,153 (84.0%) | 219 (16.0%) |
| $75,000 to $99,999 | 869 (89.0%) | 107 (11.0%) |
| $100,000 and over | 1,529 (93.1%) | 114 (6.9%) |
Public vs Private Health Insurance Coverage by Age in Sheridan
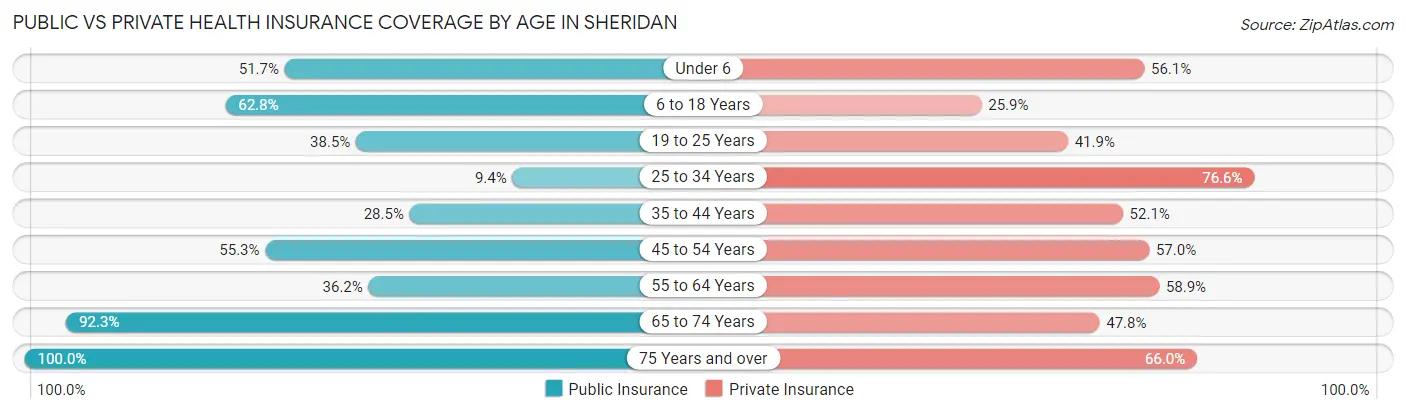
| Age Bracket | Public Insurance | Private Insurance |
| Under 6 | 106 (51.7%) | 115 (56.1%) |
| 6 to 18 Years | 807 (62.7%) | 333 (25.9%) |
| 19 to 25 Years | 265 (38.5%) | 289 (41.9%) |
| 25 to 34 Years | 66 (9.4%) | 536 (76.6%) |
| 35 to 44 Years | 315 (28.5%) | 576 (52.1%) |
| 45 to 54 Years | 323 (55.3%) | 333 (57.0%) |
| 55 to 64 Years | 218 (36.1%) | 355 (58.9%) |
| 65 to 74 Years | 564 (92.3%) | 292 (47.8%) |
| 75 Years and over | 279 (100.0%) | 184 (65.9%) |
| Total | 2,943 (48.5%) | 3,013 (49.7%) |
Disability Status by Sex by Age in Sheridan
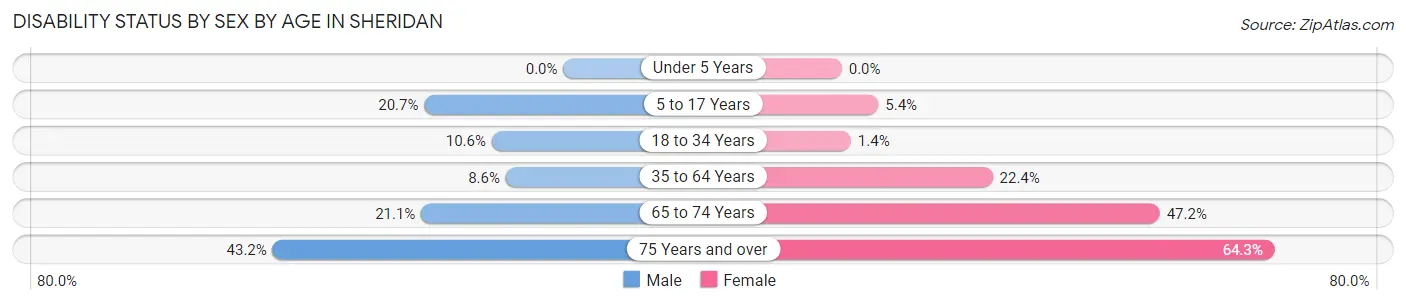
| Age Bracket | Male | Female |
| Under 5 Years | 0 (0.0%) | 0 (0.0%) |
| 5 to 17 Years | 102 (20.6%) | 41 (5.4%) |
| 18 to 34 Years | 91 (10.6%) | 8 (1.3%) |
| 35 to 64 Years | 97 (8.6%) | 259 (22.4%) |
| 65 to 74 Years | 57 (21.1%) | 161 (47.2%) |
| 75 Years and over | 60 (43.2%) | 90 (64.3%) |
Disability Class by Sex by Age in Sheridan
Disability Class: Hearing Difficulty
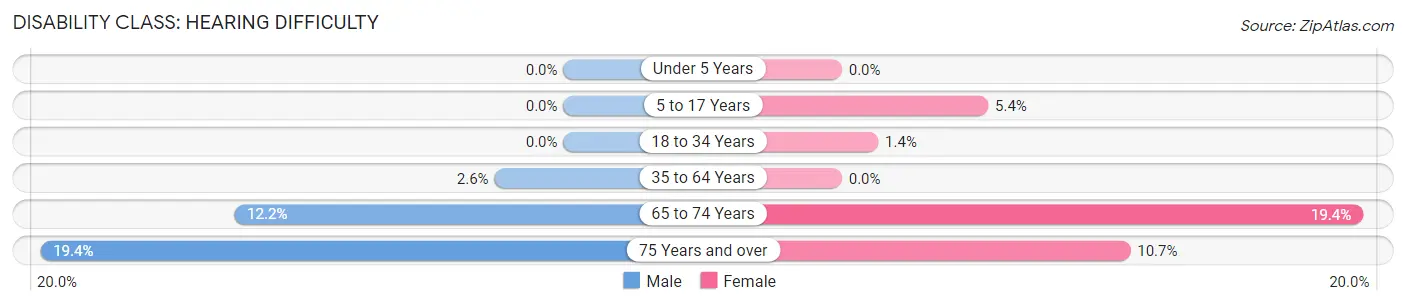
| Age Bracket | Male | Female |
| Under 5 Years | 0 (0.0%) | 0 (0.0%) |
| 5 to 17 Years | 0 (0.0%) | 41 (5.4%) |
| 18 to 34 Years | 0 (0.0%) | 8 (1.3%) |
| 35 to 64 Years | 29 (2.6%) | 0 (0.0%) |
| 65 to 74 Years | 33 (12.2%) | 66 (19.4%) |
| 75 Years and over | 27 (19.4%) | 15 (10.7%) |
Disability Class: Vision Difficulty
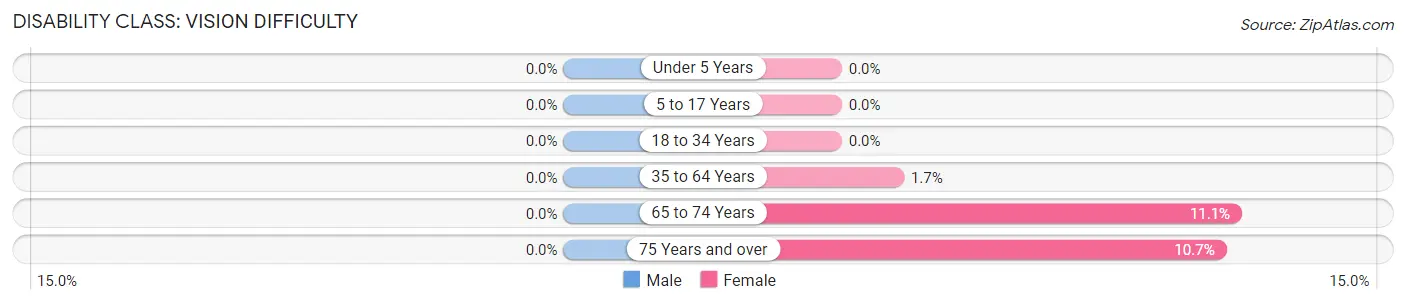
| Age Bracket | Male | Female |
| Under 5 Years | 0 (0.0%) | 0 (0.0%) |
| 5 to 17 Years | 0 (0.0%) | 0 (0.0%) |
| 18 to 34 Years | 0 (0.0%) | 0 (0.0%) |
| 35 to 64 Years | 0 (0.0%) | 20 (1.7%) |
| 65 to 74 Years | 0 (0.0%) | 38 (11.1%) |
| 75 Years and over | 0 (0.0%) | 15 (10.7%) |
Disability Class: Cognitive Difficulty
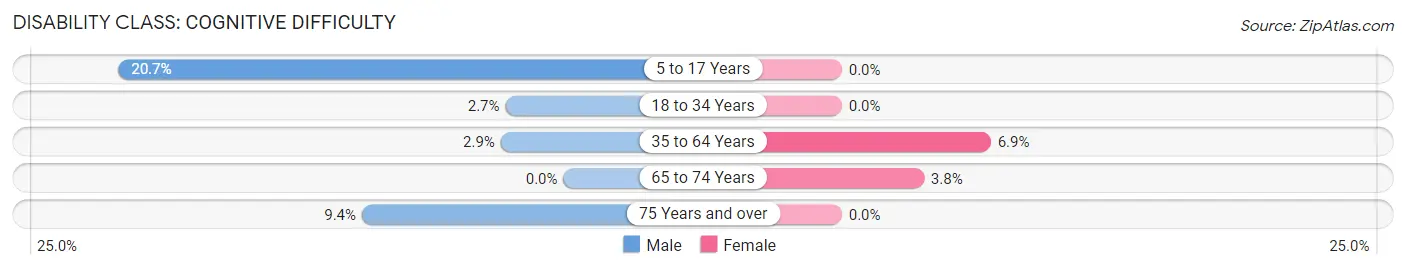
| Age Bracket | Male | Female |
| 5 to 17 Years | 102 (20.6%) | 0 (0.0%) |
| 18 to 34 Years | 23 (2.7%) | 0 (0.0%) |
| 35 to 64 Years | 33 (2.9%) | 80 (6.9%) |
| 65 to 74 Years | 0 (0.0%) | 13 (3.8%) |
| 75 Years and over | 13 (9.3%) | 0 (0.0%) |
Disability Class: Ambulatory Difficulty
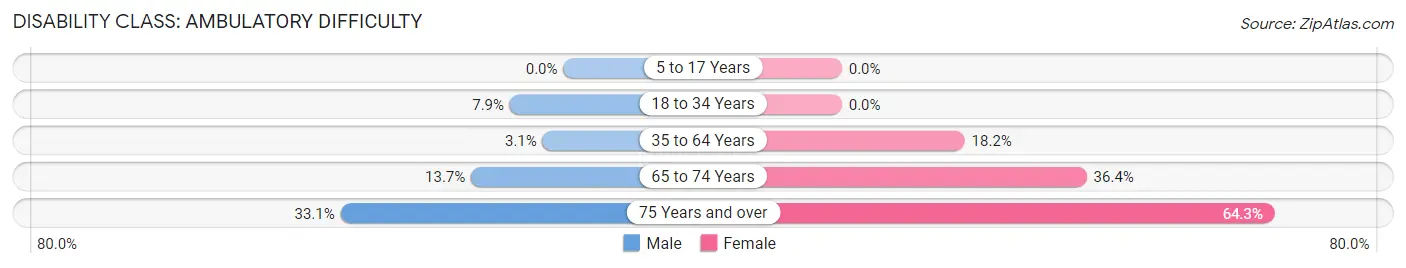
| Age Bracket | Male | Female |
| 5 to 17 Years | 0 (0.0%) | 0 (0.0%) |
| 18 to 34 Years | 68 (7.9%) | 0 (0.0%) |
| 35 to 64 Years | 35 (3.1%) | 211 (18.2%) |
| 65 to 74 Years | 37 (13.7%) | 124 (36.4%) |
| 75 Years and over | 46 (33.1%) | 90 (64.3%) |
Disability Class: Self-Care Difficulty
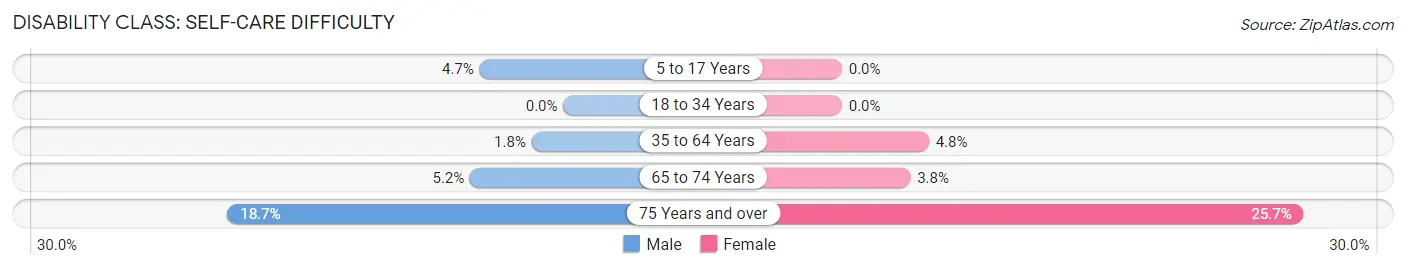
| Age Bracket | Male | Female |
| 5 to 17 Years | 23 (4.7%) | 0 (0.0%) |
| 18 to 34 Years | 0 (0.0%) | 0 (0.0%) |
| 35 to 64 Years | 20 (1.8%) | 56 (4.8%) |
| 65 to 74 Years | 14 (5.2%) | 13 (3.8%) |
| 75 Years and over | 26 (18.7%) | 36 (25.7%) |
Technology Access in Sheridan
Computing Device Access in Sheridan
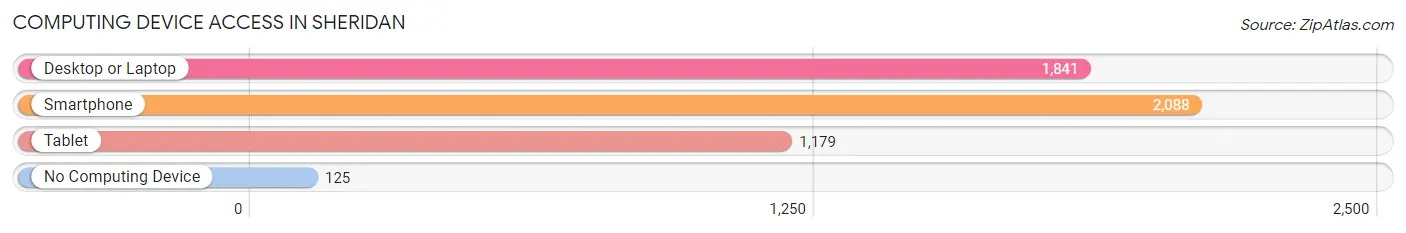
| Device Type | # Households | % Households |
| Desktop or Laptop | 1,841 | 75.4% |
| Smartphone | 2,088 | 85.5% |
| Tablet | 1,179 | 48.3% |
| No Computing Device | 125 | 5.1% |
| Total | 2,442 | 100.0% |
Internet Access in Sheridan
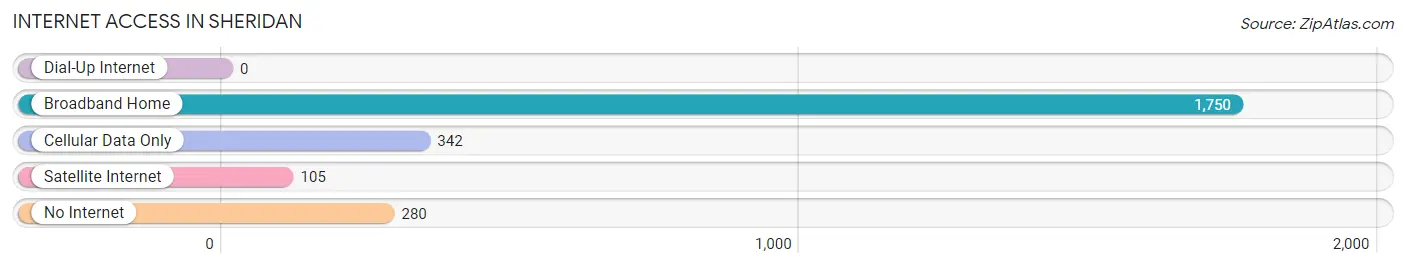
| Internet Type | # Households | % Households |
| Dial-Up Internet | 0 | 0.0% |
| Broadband Home | 1,750 | 71.7% |
| Cellular Data Only | 342 | 14.0% |
| Satellite Internet | 105 | 4.3% |
| No Internet | 280 | 11.5% |
| Total | 2,442 | 100.0% |
Sheridan Summary
Sheridan, Colorado is a small town located in the Denver metropolitan area. It is situated in Arapahoe County, and is part of the Denver-Aurora-Lakewood Metropolitan Statistical Area. The town has a population of approximately 6,000 people, and is located about 10 miles south of downtown Denver.
History
Sheridan was founded in 1891 by a group of settlers from the Midwest. The town was named after General Philip Sheridan, a Civil War hero. The town was originally a farming community, and the main crops grown were wheat, corn, and hay. In the early 1900s, the town began to grow and develop, and by the 1920s, it had become a popular destination for tourists.
In the 1950s, the town began to experience a population boom, and by the 1960s, it had become a bedroom community for Denver. The town has continued to grow and develop over the years, and today it is a vibrant and diverse community.
Geography
Sheridan is located in the Denver metropolitan area, and is situated in Arapahoe County. The town is located about 10 miles south of downtown Denver, and is bordered by the cities of Englewood, Littleton, and Aurora. The town is situated at an elevation of 5,400 feet, and is located in the foothills of the Rocky Mountains.
The town has a total area of 2.2 square miles, and is located in a semi-arid climate zone. The town experiences hot summers and cold winters, with temperatures ranging from the low 30s in the winter to the high 80s in the summer.
Economy
Sheridan’s economy is largely based on the service industry. The town is home to a variety of businesses, including restaurants, retail stores, and professional services. The town is also home to a number of manufacturing companies, including a plastics manufacturer and a metal fabrication company.
The town is also home to a number of educational institutions, including a community college and a technical school. The town is also home to a number of parks and recreational facilities, including a golf course and a public swimming pool.
Demographics
As of the 2010 census, the population of Sheridan was 6,000. The town has a median household income of $50,000, and the median age is 37. The town is predominantly white, with a small Hispanic population. The town is also home to a small African American population.
The town is home to a variety of religious denominations, including Catholic, Protestant, and Jewish. The town is also home to a variety of cultural and recreational activities, including festivals, concerts, and sporting events.
Conclusion
Sheridan, Colorado is a small town located in the Denver metropolitan area. It is situated in Arapahoe County, and is part of the Denver-Aurora-Lakewood Metropolitan Statistical Area. The town has a population of approximately 6,000 people, and is located about 10 miles south of downtown Denver. The town has a diverse economy, and is home to a variety of businesses, educational institutions, and recreational facilities. The town is predominantly white, with a small Hispanic population, and is home to a variety of religious denominations.
Common Questions
What is Per Capita Income in Sheridan?
Per Capita income in Sheridan is $29,789.
What is the Median Family Income in Sheridan?
Median Family Income in Sheridan is $62,478.
What is the Median Household income in Sheridan?
Median Household Income in Sheridan is $53,707.
What is Income or Wage Gap in Sheridan?
Income or Wage Gap in Sheridan is 7.9%.
Women in Sheridan earn 92.1 cents for every dollar earned by a man.
What is Family Income Deficit in Sheridan?
Family Income Deficit in Sheridan is $15,174.
Families that are below poverty line in Sheridan earn $15,174 less on average than the poverty threshold level.
What is Inequality or Gini Index in Sheridan?
Inequality or Gini Index in Sheridan is 0.47.
What is the Total Population of Sheridan?
Total Population of Sheridan is 6,062.
What is the Total Male Population of Sheridan?
Total Male Population of Sheridan is 2,921.
What is the Total Female Population of Sheridan?
Total Female Population of Sheridan is 3,141.
What is the Ratio of Males per 100 Females in Sheridan?
There are 93.00 Males per 100 Females in Sheridan.
What is the Ratio of Females per 100 Males in Sheridan?
There are 107.53 Females per 100 Males in Sheridan.
What is the Median Population Age in Sheridan?
Median Population Age in Sheridan is 35.6 Years.
What is the Average Family Size in Sheridan
Average Family Size in Sheridan is 3.5 People.
What is the Average Household Size in Sheridan
Average Household Size in Sheridan is 2.5 People.
How Large is the Labor Force in Sheridan?
There are 3,035 People in the Labor Forcein in Sheridan.
What is the Percentage of People in the Labor Force in Sheridan?
63.3% of People are in the Labor Force in Sheridan.
What is the Unemployment Rate in Sheridan?
Unemployment Rate in Sheridan is 10.1%.