Claymont, DE Map & Demographics
Claymont Map
Claymont Overview
$40,226
PER CAPITA INCOME
$99,440
AVG FAMILY INCOME
$72,840
AVG HOUSEHOLD INCOME
20.4%
WAGE / INCOME GAP [ % ]
79.6¢/ $1
WAGE / INCOME GAP [ $ ]
0.42
INEQUALITY / GINI INDEX
10,191
TOTAL POPULATION
5,205
MALE POPULATION
4,986
FEMALE POPULATION
104.39
MALES / 100 FEMALES
95.79
FEMALES / 100 MALES
37.2
MEDIAN AGE
3.2
AVG FAMILY SIZE
2.4
AVG HOUSEHOLD SIZE
5,885
LABOR FORCE [ PEOPLE ]
69.2%
PERCENT IN LABOR FORCE
3.9%
UNEMPLOYMENT RATE
Claymont Zip Codes
Claymont Area Codes
Income in Claymont
Income Overview in Claymont
Per Capita Income in Claymont is $40,226, while median incomes of families and households are $99,440 and $72,840 respectively.
| Characteristic | Number | Measure |
| Per Capita Income | 10,191 | $40,226 |
| Median Family Income | 2,373 | $99,440 |
| Mean Family Income | 2,373 | $115,252 |
| Median Household Income | 4,174 | $72,840 |
| Mean Household Income | 4,174 | $93,783 |
| Income Deficit | 2,373 | $0 |
| Wage / Income Gap (%) | 10,191 | 20.44% |
| Wage / Income Gap ($) | 10,191 | 79.56¢ per $1 |
| Gini / Inequality Index | 10,191 | 0.42 |
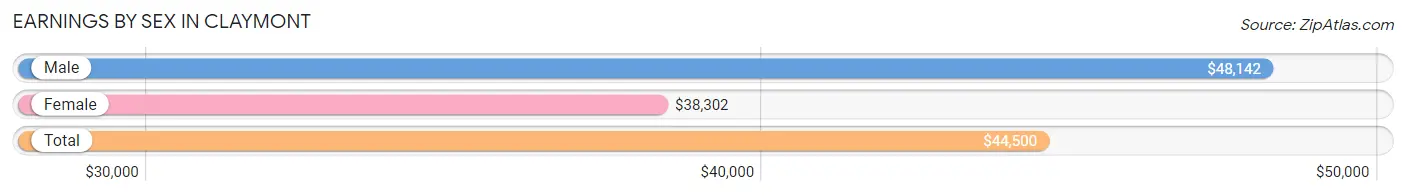
Earnings by Sex in Claymont
Average Earnings in Claymont are $44,500, $48,142 for men and $38,302 for women, a difference of 20.4%.
| Sex | Number | Average Earnings |
| Male | 3,249 (53.5%) | $48,142 |
| Female | 2,825 (46.5%) | $38,302 |
| Total | 6,074 (100.0%) | $44,500 |
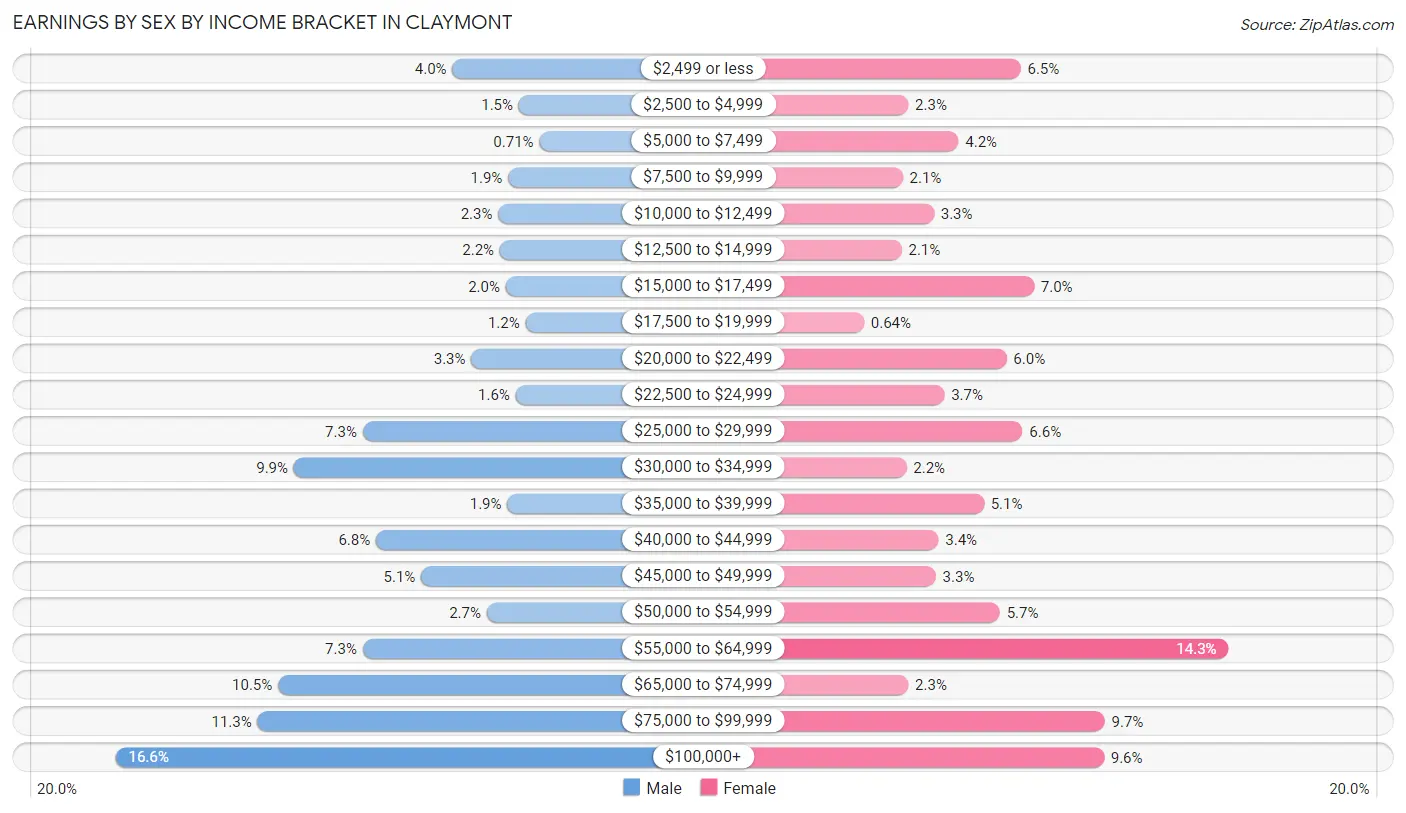
Earnings by Sex by Income Bracket in Claymont
The most common earnings brackets in Claymont are $100,000+ for men (539 | 16.6%) and $55,000 to $64,999 for women (404 | 14.3%).
| Income | Male | Female |
| $2,499 or less | 129 (4.0%) | 184 (6.5%) |
| $2,500 to $4,999 | 48 (1.5%) | 65 (2.3%) |
| $5,000 to $7,499 | 23 (0.7%) | 118 (4.2%) |
| $7,500 to $9,999 | 61 (1.9%) | 59 (2.1%) |
| $10,000 to $12,499 | 73 (2.2%) | 92 (3.3%) |
| $12,500 to $14,999 | 71 (2.2%) | 58 (2.1%) |
| $15,000 to $17,499 | 64 (2.0%) | 198 (7.0%) |
| $17,500 to $19,999 | 40 (1.2%) | 18 (0.6%) |
| $20,000 to $22,499 | 106 (3.3%) | 169 (6.0%) |
| $22,500 to $24,999 | 52 (1.6%) | 103 (3.6%) |
| $25,000 to $29,999 | 238 (7.3%) | 186 (6.6%) |
| $30,000 to $34,999 | 322 (9.9%) | 63 (2.2%) |
| $35,000 to $39,999 | 62 (1.9%) | 145 (5.1%) |
| $40,000 to $44,999 | 222 (6.8%) | 97 (3.4%) |
| $45,000 to $49,999 | 167 (5.1%) | 94 (3.3%) |
| $50,000 to $54,999 | 87 (2.7%) | 162 (5.7%) |
| $55,000 to $64,999 | 238 (7.3%) | 404 (14.3%) |
| $65,000 to $74,999 | 341 (10.5%) | 65 (2.3%) |
| $75,000 to $99,999 | 366 (11.3%) | 273 (9.7%) |
| $100,000+ | 539 (16.6%) | 272 (9.6%) |
| Total | 3,249 (100.0%) | 2,825 (100.0%) |
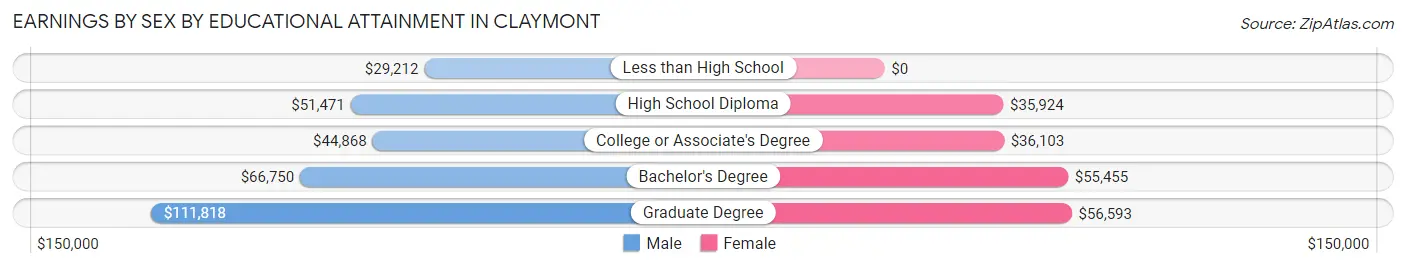
Earnings by Sex by Educational Attainment in Claymont
Average earnings in Claymont are $52,277 for men and $46,494 for women, a difference of 11.1%. Men with an educational attainment of graduate degree enjoy the highest average annual earnings of $111,818, while those with less than high school education earn the least with $29,212. Women with an educational attainment of graduate degree earn the most with the average annual earnings of $56,593, while those with high school diploma education have the smallest earnings of $35,924.
| Educational Attainment | Male Income | Female Income |
| Less than High School | $29,212 | $0 |
| High School Diploma | $51,471 | $35,924 |
| College or Associate's Degree | $44,868 | $36,103 |
| Bachelor's Degree | $66,750 | $55,455 |
| Graduate Degree | $111,818 | $56,593 |
| Total | $52,277 | $46,494 |
Family Income in Claymont
Family Income Brackets in Claymont
According to the Claymont family income data, there are 660 families falling into the $100,000 to $149,999 income range, which is the most common income bracket and makes up 27.8% of all families. Conversely, the less than $10,000 income bracket is the least frequent group with only 38 families (1.6%) belonging to this category.
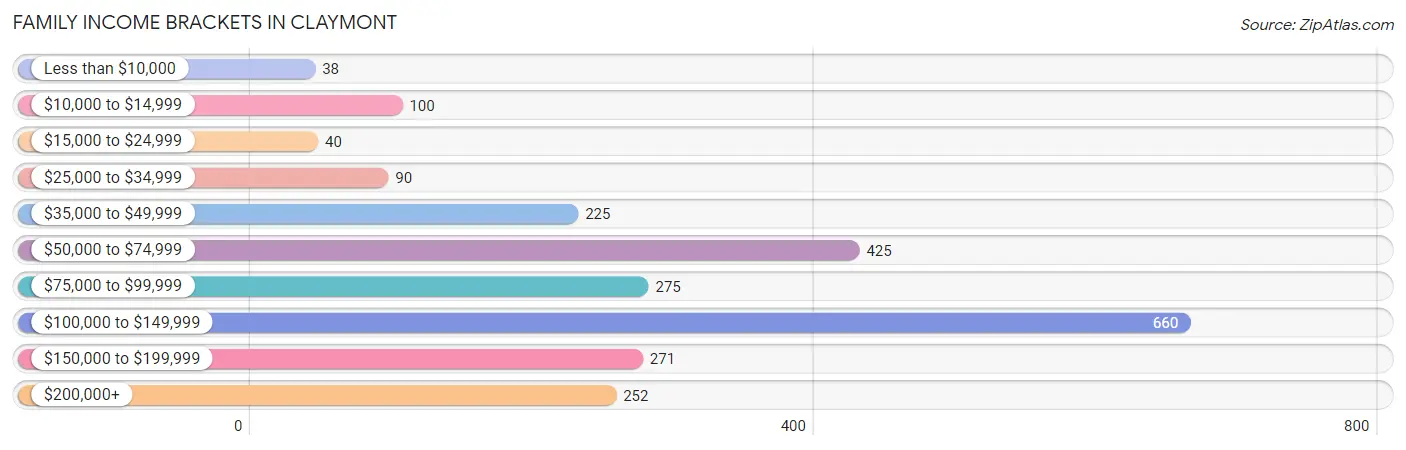
| Income Bracket | # Families | % Families |
| Less than $10,000 | 38 | 1.6% |
| $10,000 to $14,999 | 100 | 4.2% |
| $15,000 to $24,999 | 40 | 1.7% |
| $25,000 to $34,999 | 90 | 3.8% |
| $35,000 to $49,999 | 225 | 9.5% |
| $50,000 to $74,999 | 425 | 17.9% |
| $75,000 to $99,999 | 275 | 11.6% |
| $100,000 to $149,999 | 660 | 27.8% |
| $150,000 to $199,999 | 271 | 11.4% |
| $200,000+ | 252 | 10.6% |
Family Income by Famaliy Size in Claymont
5-person families (178 | 7.5%) account for the highest median family income in Claymont with $140,662 per family, while 2-person families (1,200 | 50.6%) have the highest median income of $45,950 per family member.
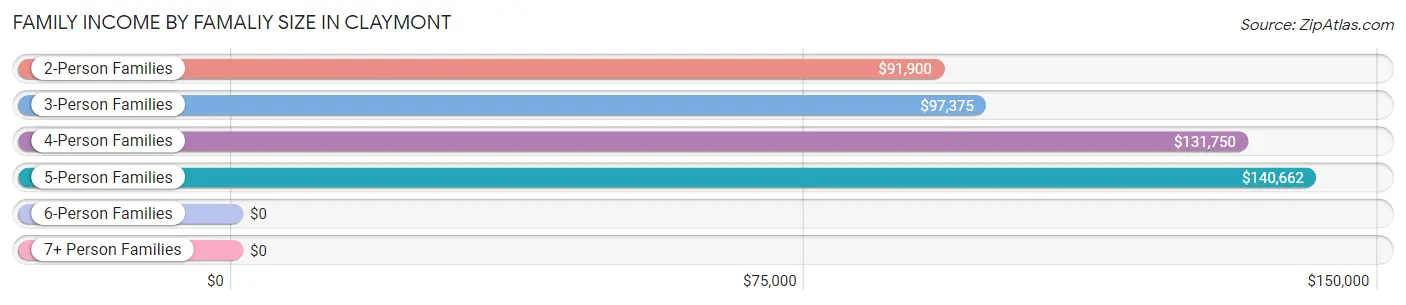
| Income Bracket | # Families | Median Income |
| 2-Person Families | 1,200 (50.6%) | $91,900 |
| 3-Person Families | 585 (24.6%) | $97,375 |
| 4-Person Families | 327 (13.8%) | $131,750 |
| 5-Person Families | 178 (7.5%) | $140,662 |
| 6-Person Families | 50 (2.1%) | $0 |
| 7+ Person Families | 33 (1.4%) | $0 |
| Total | 2,373 (100.0%) | $99,440 |
Family Income by Number of Earners in Claymont
The median family income in Claymont is $99,440, with families comprising 3+ earners (292) having the highest median family income of $128,333, while families with no earners (252) have the lowest median family income of $51,359, accounting for 12.3% and 10.6% of families, respectively.
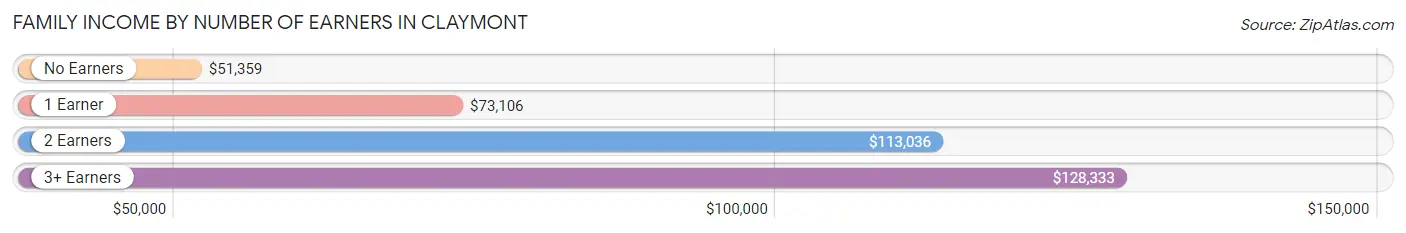
| Number of Earners | # Families | Median Income |
| No Earners | 252 (10.6%) | $51,359 |
| 1 Earner | 832 (35.1%) | $73,106 |
| 2 Earners | 997 (42.0%) | $113,036 |
| 3+ Earners | 292 (12.3%) | $128,333 |
| Total | 2,373 (100.0%) | $99,440 |
Household Income in Claymont
Household Income Brackets in Claymont
With 868 households falling in the category, the $50,000 to $74,999 income range is the most frequent in Claymont, accounting for 20.8% of all households. In contrast, only 100 households (2.4%) fall into the less than $10,000 income bracket, making it the least populous group.
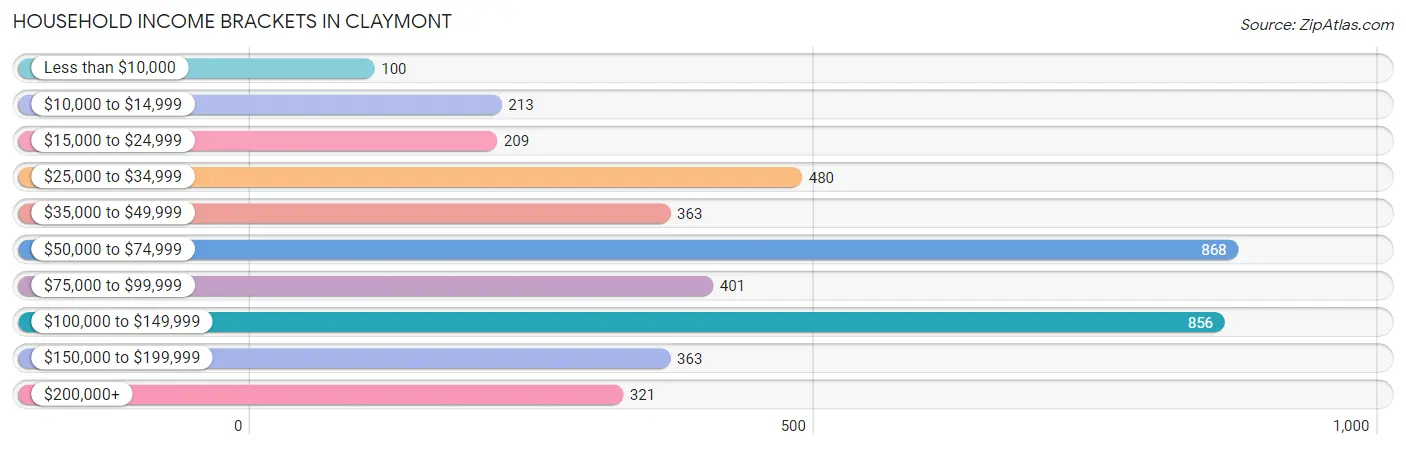
| Income Bracket | # Households | % Households |
| Less than $10,000 | 100 | 2.4% |
| $10,000 to $14,999 | 213 | 5.1% |
| $15,000 to $24,999 | 209 | 5.0% |
| $25,000 to $34,999 | 480 | 11.5% |
| $35,000 to $49,999 | 363 | 8.7% |
| $50,000 to $74,999 | 868 | 20.8% |
| $75,000 to $99,999 | 401 | 9.6% |
| $100,000 to $149,999 | 856 | 20.5% |
| $150,000 to $199,999 | 363 | 8.7% |
| $200,000+ | 321 | 7.7% |
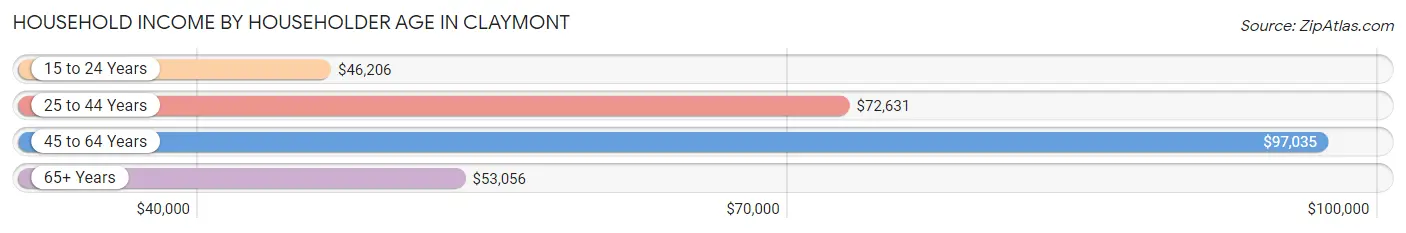
Household Income by Householder Age in Claymont
The median household income in Claymont is $72,840, with the highest median household income of $97,035 found in the 45 to 64 years age bracket for the primary householder. A total of 1,352 households (32.4%) fall into this category. Meanwhile, the 15 to 24 years age bracket for the primary householder has the lowest median household income of $46,206, with 125 households (3.0%) in this group.
| Income Bracket | # Households | Median Income |
| 15 to 24 Years | 125 (3.0%) | $46,206 |
| 25 to 44 Years | 1,645 (39.4%) | $72,631 |
| 45 to 64 Years | 1,352 (32.4%) | $97,035 |
| 65+ Years | 1,052 (25.2%) | $53,056 |
| Total | 4,174 (100.0%) | $72,840 |
Poverty in Claymont
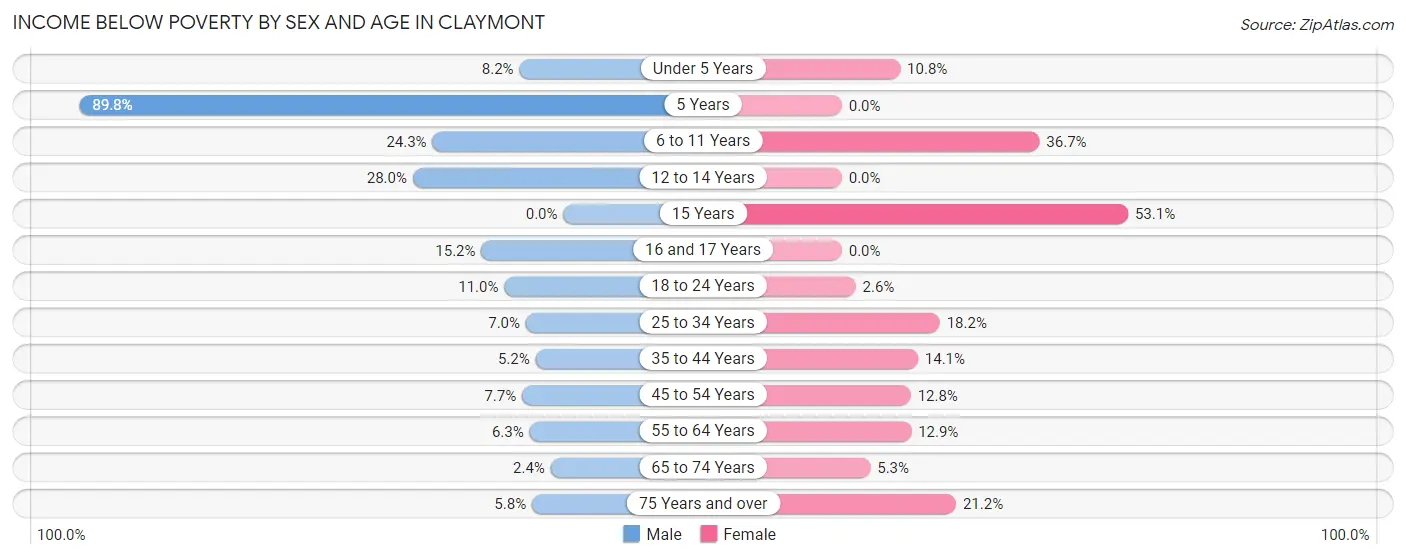
Income Below Poverty by Sex and Age in Claymont
With 10.6% poverty level for males and 13.1% for females among the residents of Claymont, 5 year old males and 15 year old females are the most vulnerable to poverty, with 106 males (89.8%) and 17 females (53.1%) in their respective age groups living below the poverty level.
| Age Bracket | Male | Female |
| Under 5 Years | 23 (8.2%) | 26 (10.8%) |
| 5 Years | 106 (89.8%) | 0 (0.0%) |
| 6 to 11 Years | 69 (24.3%) | 84 (36.7%) |
| 12 to 14 Years | 64 (28.0%) | 0 (0.0%) |
| 15 Years | 0 (0.0%) | 17 (53.1%) |
| 16 and 17 Years | 21 (15.2%) | 0 (0.0%) |
| 18 to 24 Years | 39 (11.0%) | 11 (2.6%) |
| 25 to 34 Years | 80 (7.0%) | 178 (18.2%) |
| 35 to 44 Years | 32 (5.2%) | 87 (14.1%) |
| 45 to 54 Years | 54 (7.7%) | 88 (12.8%) |
| 55 to 64 Years | 41 (6.3%) | 76 (12.9%) |
| 65 to 74 Years | 11 (2.4%) | 36 (5.3%) |
| 75 Years and over | 11 (5.8%) | 46 (21.2%) |
| Total | 551 (10.6%) | 649 (13.1%) |
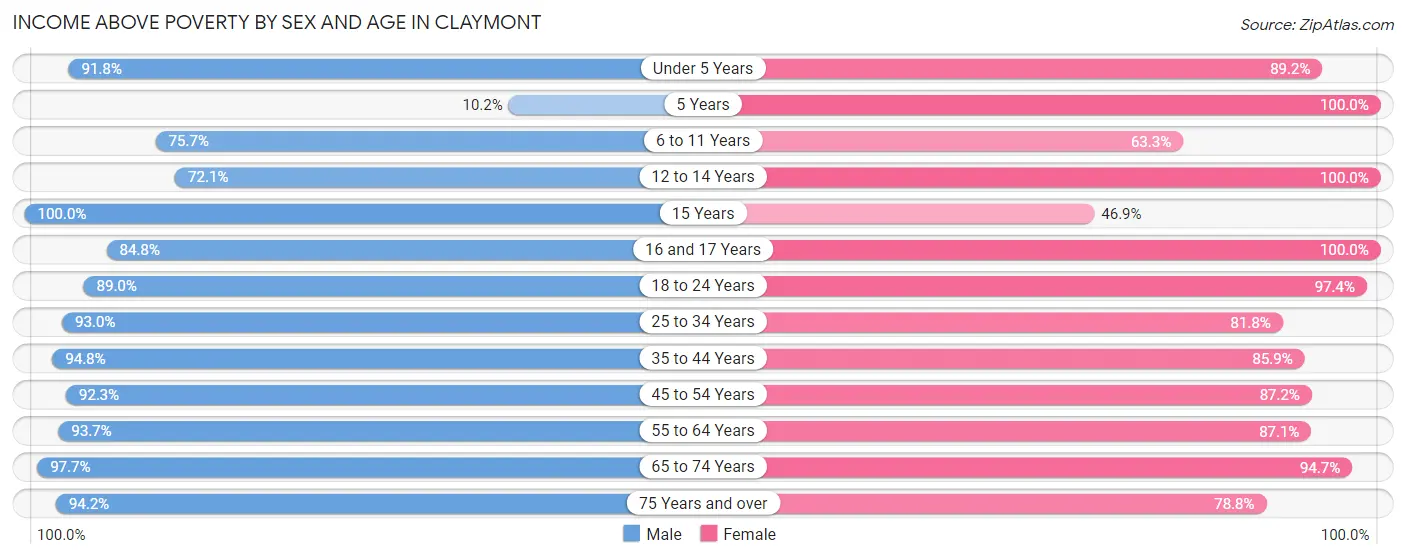
Income Above Poverty by Sex and Age in Claymont
According to the poverty statistics in Claymont, males aged 15 years and females aged 5 years are the age groups that are most secure financially, with 100.0% of males and 100.0% of females in these age groups living above the poverty line.
| Age Bracket | Male | Female |
| Under 5 Years | 259 (91.8%) | 214 (89.2%) |
| 5 Years | 12 (10.2%) | 91 (100.0%) |
| 6 to 11 Years | 215 (75.7%) | 145 (63.3%) |
| 12 to 14 Years | 165 (72.1%) | 153 (100.0%) |
| 15 Years | 10 (100.0%) | 15 (46.9%) |
| 16 and 17 Years | 117 (84.8%) | 22 (100.0%) |
| 18 to 24 Years | 317 (89.0%) | 419 (97.4%) |
| 25 to 34 Years | 1,070 (93.0%) | 801 (81.8%) |
| 35 to 44 Years | 588 (94.8%) | 529 (85.9%) |
| 45 to 54 Years | 650 (92.3%) | 600 (87.2%) |
| 55 to 64 Years | 613 (93.7%) | 514 (87.1%) |
| 65 to 74 Years | 458 (97.7%) | 645 (94.7%) |
| 75 Years and over | 178 (94.2%) | 171 (78.8%) |
| Total | 4,652 (89.4%) | 4,319 (86.9%) |
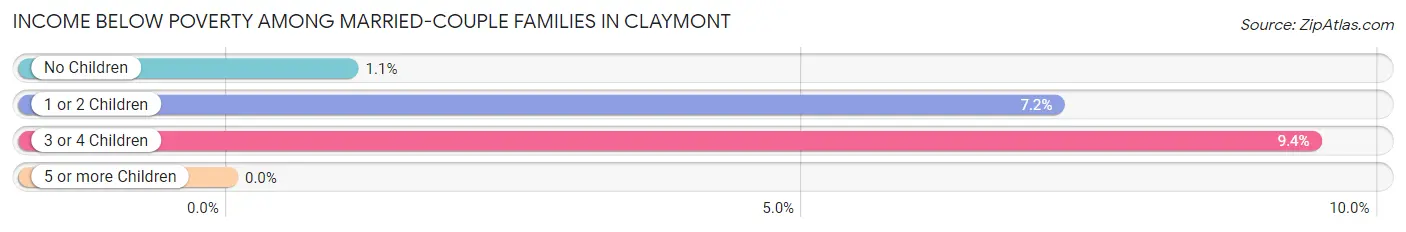
Income Below Poverty Among Married-Couple Families in Claymont
The poverty statistics for married-couple families in Claymont show that 3.4% or 57 of the total 1,656 families live below the poverty line. Families with 3 or 4 children have the highest poverty rate of 9.4%, comprising of 10 families. On the other hand, families with no children have the lowest poverty rate of 1.1%, which includes 11 families.
| Children | Above Poverty | Below Poverty |
| No Children | 1,038 (99.0%) | 11 (1.1%) |
| 1 or 2 Children | 465 (92.8%) | 36 (7.2%) |
| 3 or 4 Children | 96 (90.6%) | 10 (9.4%) |
| 5 or more Children | 0 (0.0%) | 0 (0.0%) |
| Total | 1,599 (96.6%) | 57 (3.4%) |
Income Below Poverty Among Single-Parent Households in Claymont
According to the poverty data in Claymont, 5.0% or 11 single-father households and 20.5% or 102 single-mother households are living below the poverty line. Among single-father households, those with 1 or 2 children have the highest poverty rate, with 11 households (14.5%) experiencing poverty. Likewise, among single-mother households, those with 3 or 4 children have the highest poverty rate, with 42 households (100.0%) falling below the poverty line.
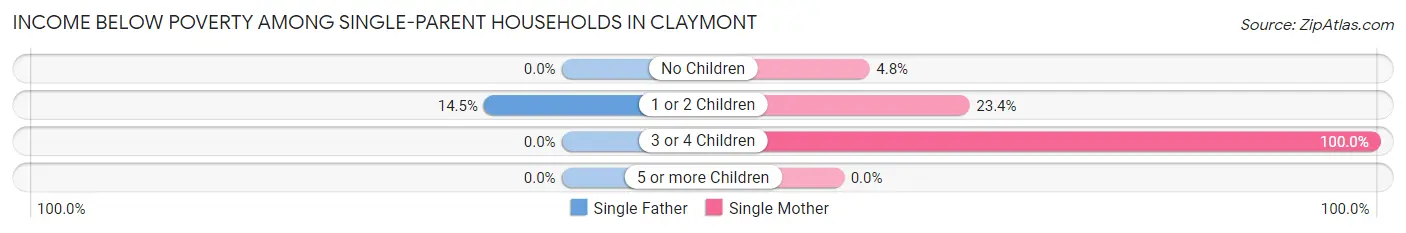
| Children | Single Father | Single Mother |
| No Children | 0 (0.0%) | 12 (4.8%) |
| 1 or 2 Children | 11 (14.5%) | 48 (23.4%) |
| 3 or 4 Children | 0 (0.0%) | 42 (100.0%) |
| 5 or more Children | 0 (0.0%) | 0 (0.0%) |
| Total | 11 (5.0%) | 102 (20.5%) |
Income Below Poverty Among Married-Couple vs Single-Parent Households in Claymont
The poverty data for Claymont shows that 57 of the married-couple family households (3.4%) and 113 of the single-parent households (15.8%) are living below the poverty level. Within the married-couple family households, those with 3 or 4 children have the highest poverty rate, with 10 households (9.4%) falling below the poverty line. Among the single-parent households, those with 3 or 4 children have the highest poverty rate, with 42 household (100.0%) living below poverty.
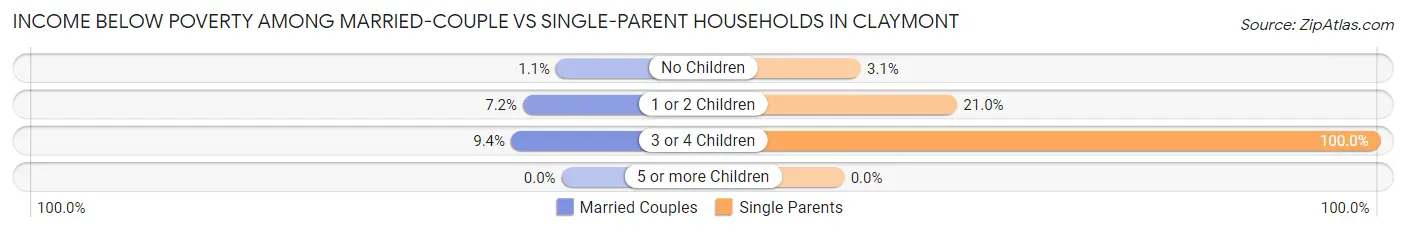
| Children | Married-Couple Families | Single-Parent Households |
| No Children | 11 (1.1%) | 12 (3.0%) |
| 1 or 2 Children | 36 (7.2%) | 59 (21.0%) |
| 3 or 4 Children | 10 (9.4%) | 42 (100.0%) |
| 5 or more Children | 0 (0.0%) | 0 (0.0%) |
| Total | 57 (3.4%) | 113 (15.8%) |
Race in Claymont
The most populous races in Claymont are White / Caucasian (5,525 | 54.2%), Black / African American (3,292 | 32.3%), and Hispanic or Latino (942 | 9.2%).
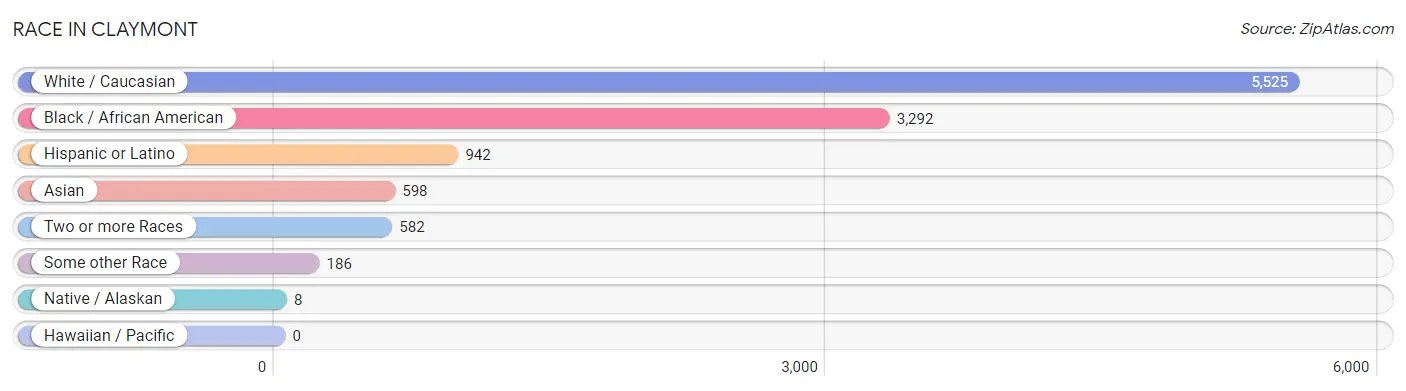
| Race | # Population | % Population |
| Asian | 598 | 5.9% |
| Black / African American | 3,292 | 32.3% |
| Hawaiian / Pacific | 0 | 0.0% |
| Hispanic or Latino | 942 | 9.2% |
| Native / Alaskan | 8 | 0.1% |
| White / Caucasian | 5,525 | 54.2% |
| Two or more Races | 582 | 5.7% |
| Some other Race | 186 | 1.8% |
| Total | 10,191 | 100.0% |
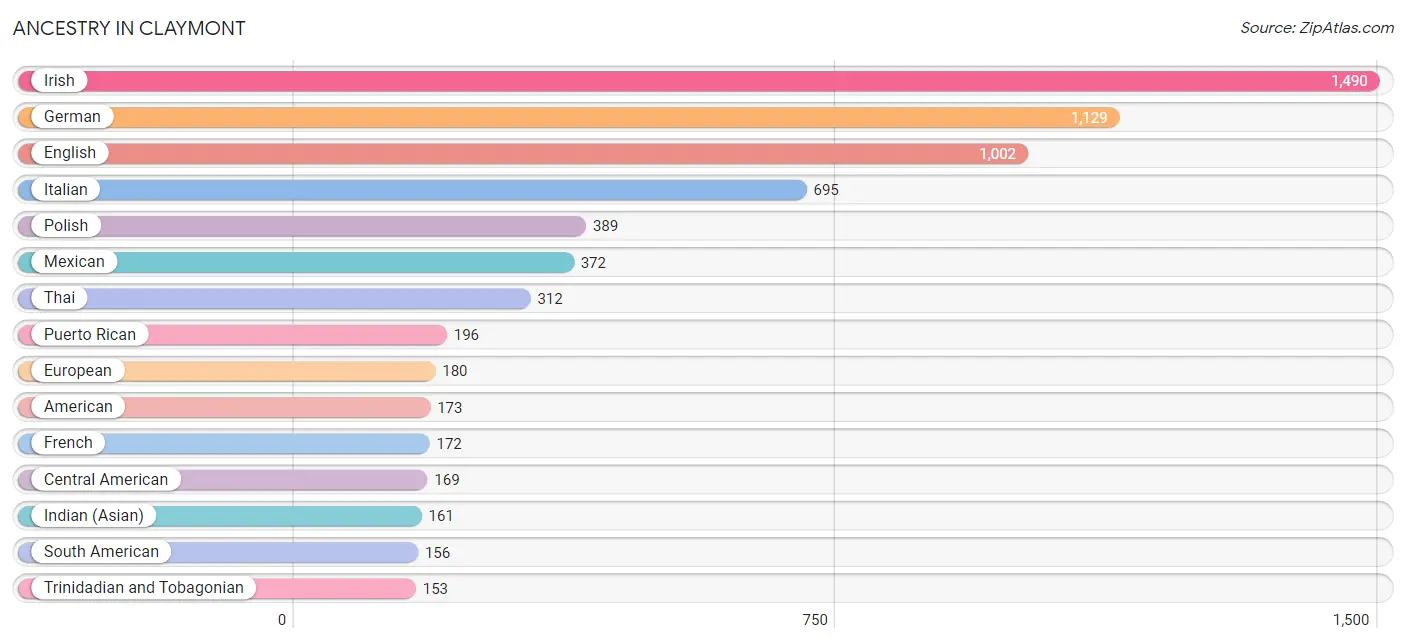
Ancestry in Claymont
The most populous ancestries reported in Claymont are Irish (1,490 | 14.6%), German (1,129 | 11.1%), English (1,002 | 9.8%), Italian (695 | 6.8%), and Polish (389 | 3.8%), together accounting for 46.2% of all Claymont residents.
| Ancestry | # Population | % Population |
| African | 59 | 0.6% |
| American | 173 | 1.7% |
| Arab | 87 | 0.9% |
| Belizean | 18 | 0.2% |
| Bhutanese | 1 | 0.0% |
| Blackfeet | 8 | 0.1% |
| Brazilian | 18 | 0.2% |
| British | 36 | 0.4% |
| Burmese | 14 | 0.1% |
| Central American | 169 | 1.7% |
| Central American Indian | 35 | 0.3% |
| Chilean | 8 | 0.1% |
| Czech | 10 | 0.1% |
| Czechoslovakian | 44 | 0.4% |
| Dominican | 12 | 0.1% |
| Dutch | 17 | 0.2% |
| Eastern European | 15 | 0.2% |
| English | 1,002 | 9.8% |
| European | 180 | 1.8% |
| French | 172 | 1.7% |
| French Canadian | 12 | 0.1% |
| German | 1,129 | 11.1% |
| Greek | 89 | 0.9% |
| Honduran | 113 | 1.1% |
| Hungarian | 16 | 0.2% |
| Indian (Asian) | 161 | 1.6% |
| Irish | 1,490 | 14.6% |
| Italian | 695 | 6.8% |
| Jamaican | 133 | 1.3% |
| Korean | 28 | 0.3% |
| Liberian | 12 | 0.1% |
| Lithuanian | 40 | 0.4% |
| Mexican | 372 | 3.6% |
| Moroccan | 87 | 0.9% |
| Norwegian | 10 | 0.1% |
| Panamanian | 56 | 0.5% |
| Pennsylvania German | 86 | 0.8% |
| Peruvian | 148 | 1.5% |
| Polish | 389 | 3.8% |
| Portuguese | 44 | 0.4% |
| Puerto Rican | 196 | 1.9% |
| Russian | 9 | 0.1% |
| Scandinavian | 64 | 0.6% |
| Scotch-Irish | 34 | 0.3% |
| Scottish | 102 | 1.0% |
| Sioux | 4 | 0.0% |
| Slavic | 15 | 0.2% |
| Slovak | 18 | 0.2% |
| South American | 156 | 1.5% |
| Sri Lankan | 150 | 1.5% |
| Subsaharan African | 71 | 0.7% |
| Swedish | 52 | 0.5% |
| Thai | 312 | 3.1% |
| Trinidadian and Tobagonian | 153 | 1.5% |
| Ukrainian | 84 | 0.8% |
| Vietnamese | 117 | 1.1% |
| Welsh | 27 | 0.3% |
| West Indian | 35 | 0.3% | View All 58 Rows |
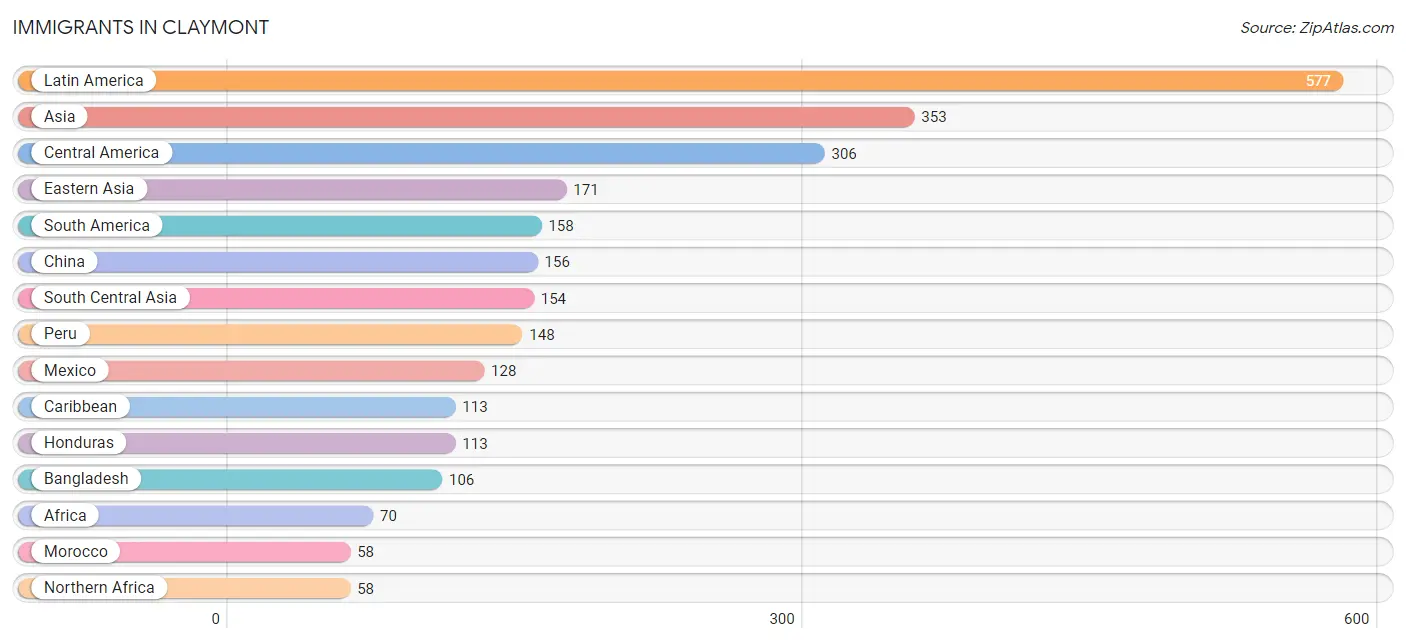
Immigrants in Claymont
The most numerous immigrant groups reported in Claymont came from Latin America (577 | 5.7%), Asia (353 | 3.5%), Central America (306 | 3.0%), Eastern Asia (171 | 1.7%), and South America (158 | 1.5%), together accounting for 15.4% of all Claymont residents.
| Immigration Origin | # Population | % Population |
| Africa | 70 | 0.7% |
| Asia | 353 | 3.5% |
| Bangladesh | 106 | 1.0% |
| Belize | 9 | 0.1% |
| Caribbean | 113 | 1.1% |
| Central America | 306 | 3.0% |
| China | 156 | 1.5% |
| Dominican Republic | 12 | 0.1% |
| Eastern Asia | 171 | 1.7% |
| Europe | 54 | 0.5% |
| Germany | 1 | 0.0% |
| Greece | 43 | 0.4% |
| Honduras | 113 | 1.1% |
| India | 48 | 0.5% |
| Jamaica | 29 | 0.3% |
| Japan | 1 | 0.0% |
| Korea | 14 | 0.1% |
| Latin America | 577 | 5.7% |
| Liberia | 12 | 0.1% |
| Mexico | 128 | 1.3% |
| Morocco | 58 | 0.6% |
| Northern Africa | 58 | 0.6% |
| Panama | 56 | 0.5% |
| Peru | 148 | 1.5% |
| Portugal | 10 | 0.1% |
| South America | 158 | 1.5% |
| South Central Asia | 154 | 1.5% |
| South Eastern Asia | 28 | 0.3% |
| Southern Europe | 53 | 0.5% |
| St. Vincent and the Grenadines | 34 | 0.3% |
| Trinidad and Tobago | 38 | 0.4% |
| Venezuela | 10 | 0.1% |
| Vietnam | 28 | 0.3% |
| Western Africa | 12 | 0.1% |
| Western Europe | 1 | 0.0% | View All 35 Rows |
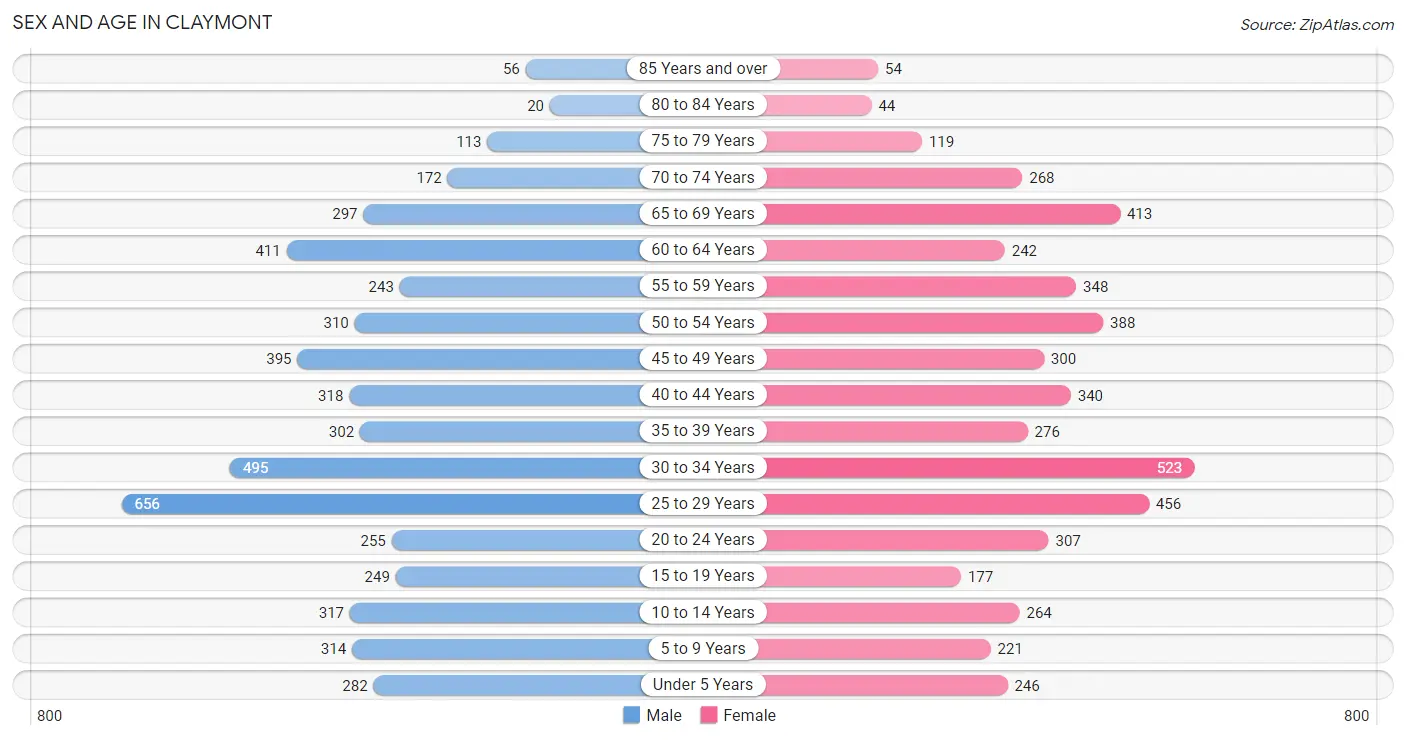
Sex and Age in Claymont
Sex and Age in Claymont
The most populous age groups in Claymont are 25 to 29 Years (656 | 12.6%) for men and 30 to 34 Years (523 | 10.5%) for women.
| Age Bracket | Male | Female |
| Under 5 Years | 282 (5.4%) | 246 (4.9%) |
| 5 to 9 Years | 314 (6.0%) | 221 (4.4%) |
| 10 to 14 Years | 317 (6.1%) | 264 (5.3%) |
| 15 to 19 Years | 249 (4.8%) | 177 (3.5%) |
| 20 to 24 Years | 255 (4.9%) | 307 (6.2%) |
| 25 to 29 Years | 656 (12.6%) | 456 (9.1%) |
| 30 to 34 Years | 495 (9.5%) | 523 (10.5%) |
| 35 to 39 Years | 302 (5.8%) | 276 (5.5%) |
| 40 to 44 Years | 318 (6.1%) | 340 (6.8%) |
| 45 to 49 Years | 395 (7.6%) | 300 (6.0%) |
| 50 to 54 Years | 310 (6.0%) | 388 (7.8%) |
| 55 to 59 Years | 243 (4.7%) | 348 (7.0%) |
| 60 to 64 Years | 411 (7.9%) | 242 (4.9%) |
| 65 to 69 Years | 297 (5.7%) | 413 (8.3%) |
| 70 to 74 Years | 172 (3.3%) | 268 (5.4%) |
| 75 to 79 Years | 113 (2.2%) | 119 (2.4%) |
| 80 to 84 Years | 20 (0.4%) | 44 (0.9%) |
| 85 Years and over | 56 (1.1%) | 54 (1.1%) |
| Total | 5,205 (100.0%) | 4,986 (100.0%) |
Families and Households in Claymont
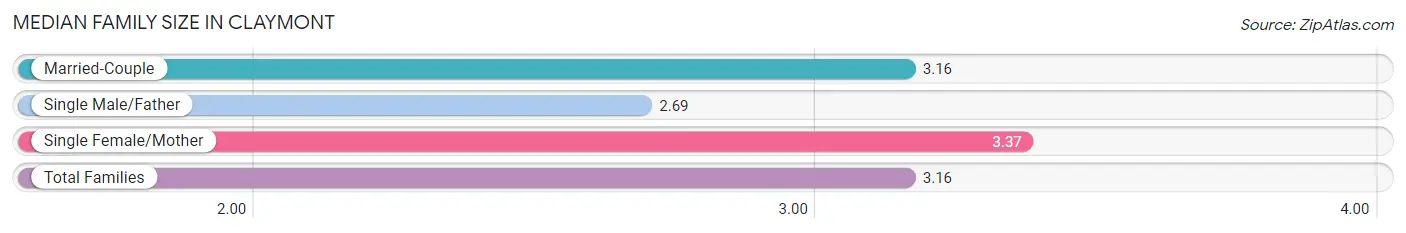
Median Family Size in Claymont
The median family size in Claymont is 3.16 persons per family, with single female/mother families (498 | 21.0%) accounting for the largest median family size of 3.37 persons per family. On the other hand, single male/father families (219 | 9.2%) represent the smallest median family size with 2.69 persons per family.
| Family Type | # Families | Family Size |
| Married-Couple | 1,656 (69.8%) | 3.16 |
| Single Male/Father | 219 (9.2%) | 2.69 |
| Single Female/Mother | 498 (21.0%) | 3.37 |
| Total Families | 2,373 (100.0%) | 3.16 |
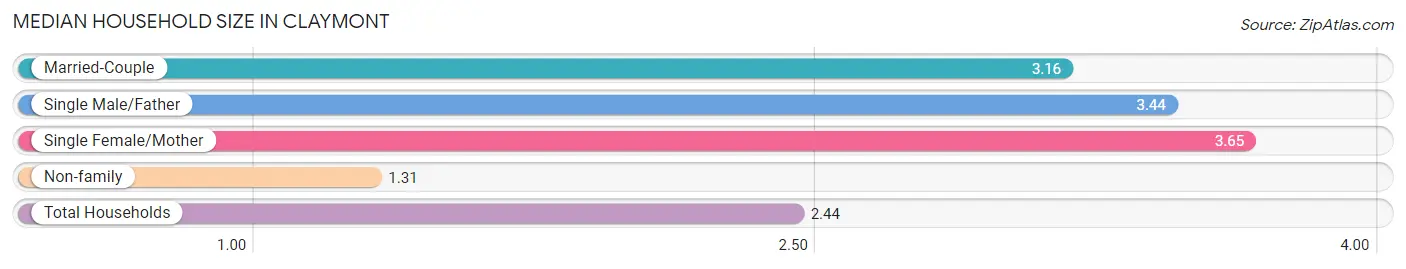
Median Household Size in Claymont
The median household size in Claymont is 2.44 persons per household, with single female/mother households (498 | 11.9%) accounting for the largest median household size of 3.65 persons per household. non-family households (1,801 | 43.1%) represent the smallest median household size with 1.31 persons per household.
| Household Type | # Households | Household Size |
| Married-Couple | 1,656 (39.7%) | 3.16 |
| Single Male/Father | 219 (5.2%) | 3.44 |
| Single Female/Mother | 498 (11.9%) | 3.65 |
| Non-family | 1,801 (43.1%) | 1.31 |
| Total Households | 4,174 (100.0%) | 2.44 |
Household Size by Marriage Status in Claymont
Out of a total of 4,174 households in Claymont, 2,373 (56.9%) are family households, while 1,801 (43.1%) are nonfamily households. The most numerous type of family households are 2-person households, comprising 1,097, and the most common type of nonfamily households are 1-person households, comprising 1,381.
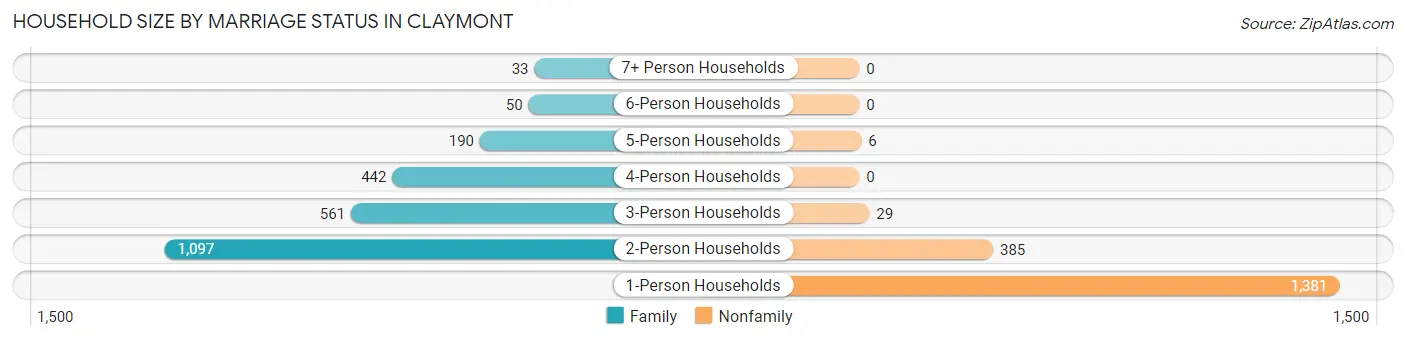
| Household Size | Family Households | Nonfamily Households |
| 1-Person Households | - | 1,381 (33.1%) |
| 2-Person Households | 1,097 (26.3%) | 385 (9.2%) |
| 3-Person Households | 561 (13.4%) | 29 (0.7%) |
| 4-Person Households | 442 (10.6%) | 0 (0.0%) |
| 5-Person Households | 190 (4.5%) | 6 (0.1%) |
| 6-Person Households | 50 (1.2%) | 0 (0.0%) |
| 7+ Person Households | 33 (0.8%) | 0 (0.0%) |
| Total | 2,373 (56.9%) | 1,801 (43.1%) |
Female Fertility in Claymont
Fertility by Age in Claymont
Average fertility rate in Claymont is 41.0 births per 1,000 women. Women in the age bracket of 20 to 34 years have the highest fertility rate with 68.0 births per 1,000 women. Women in the age bracket of 20 to 34 years acount for 88.9% of all women with births.
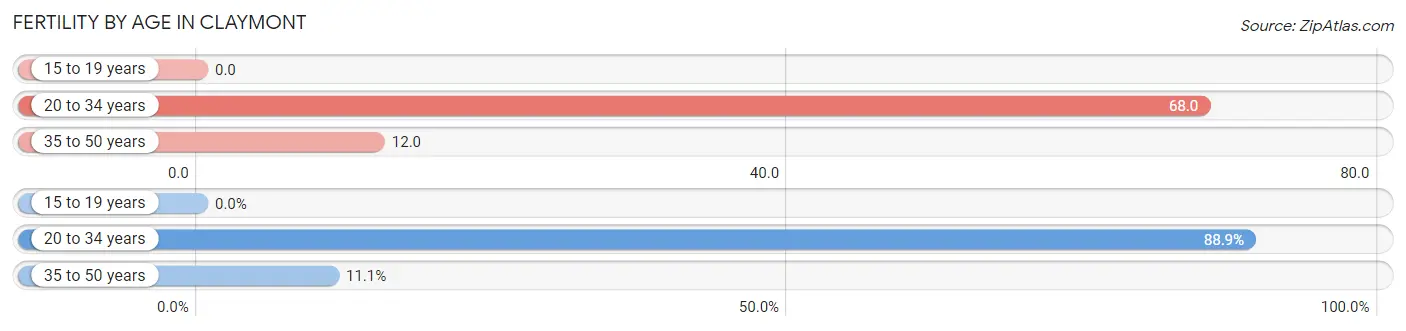
| Age Bracket | Women with Births | Births / 1,000 Women |
| 15 to 19 years | 0 (0.0%) | 0.0 |
| 20 to 34 years | 88 (88.9%) | 68.0 |
| 35 to 50 years | 11 (11.1%) | 12.0 |
| Total | 99 (100.0%) | 41.0 |
Fertility by Age by Marriage Status in Claymont
84.8% of women with births (99) in Claymont are married. The highest percentage of unmarried women with births falls into 20 to 34 years age bracket with 17.1% of them unmarried at the time of birth, while the lowest percentage of unmarried women with births belong to 35 to 50 years age bracket with 0.0% of them unmarried.
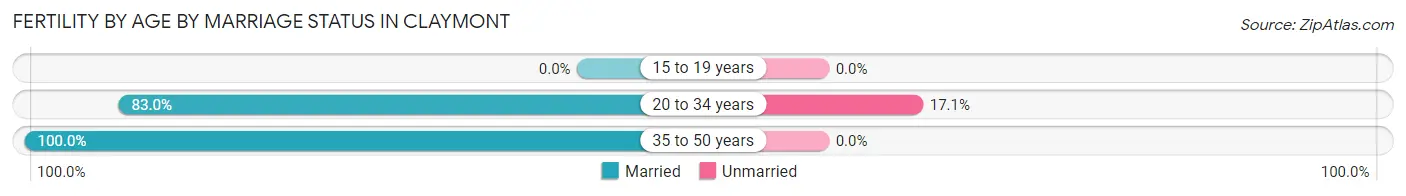
| Age Bracket | Married | Unmarried |
| 15 to 19 years | 0 (0.0%) | 0 (0.0%) |
| 20 to 34 years | 73 (83.0%) | 15 (17.1%) |
| 35 to 50 years | 11 (100.0%) | 0 (0.0%) |
| Total | 84 (84.9%) | 15 (15.1%) |
Fertility by Education in Claymont
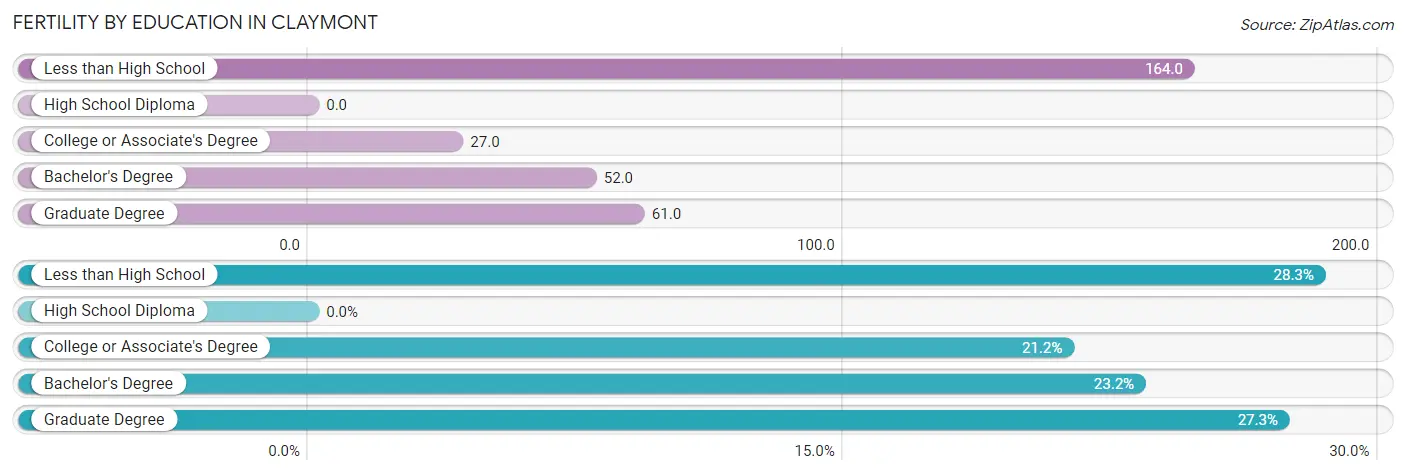
| Educational Attainment | Women with Births | Births / 1,000 Women |
| Less than High School | 28 (28.3%) | 164.0 |
| High School Diploma | 0 (0.0%) | 0.0 |
| College or Associate's Degree | 21 (21.2%) | 27.0 |
| Bachelor's Degree | 23 (23.2%) | 52.0 |
| Graduate Degree | 27 (27.3%) | 61.0 |
| Total | 99 (100.0%) | 41.0 |
Fertility by Education by Marriage Status in Claymont
15.1% of women with births in Claymont are unmarried. Women with the educational attainment of bachelor's degree are most likely to be married with 100.0% of them married at childbirth, while women with the educational attainment of college or associate's degree are least likely to be married with 66.7% of them unmarried at childbirth.
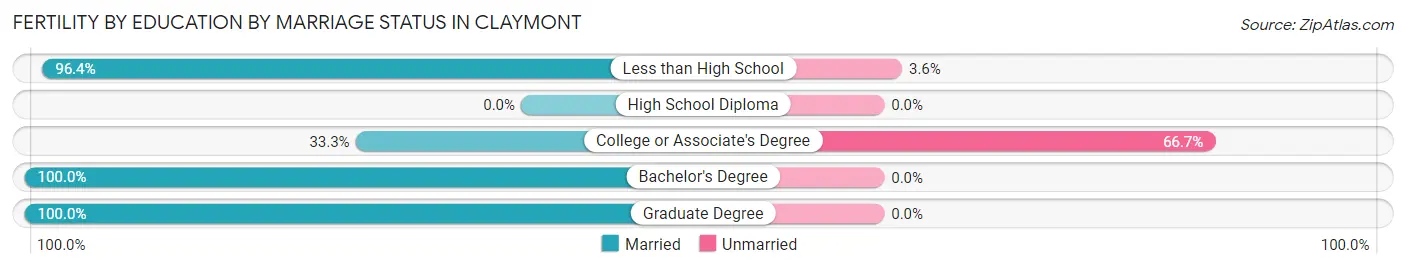
| Educational Attainment | Married | Unmarried |
| Less than High School | 27 (96.4%) | 1 (3.6%) |
| High School Diploma | 0 (0.0%) | 0 (0.0%) |
| College or Associate's Degree | 7 (33.3%) | 14 (66.7%) |
| Bachelor's Degree | 23 (100.0%) | 0 (0.0%) |
| Graduate Degree | 27 (100.0%) | 0 (0.0%) |
| Total | 84 (84.9%) | 15 (15.1%) |
Employment Characteristics in Claymont
Employment by Class of Employer in Claymont
Among the 5,517 employed individuals in Claymont, private company employees (4,099 | 74.3%), not-for-profit organizations (560 | 10.2%), and state government employees (244 | 4.4%) make up the most common classes of employment.
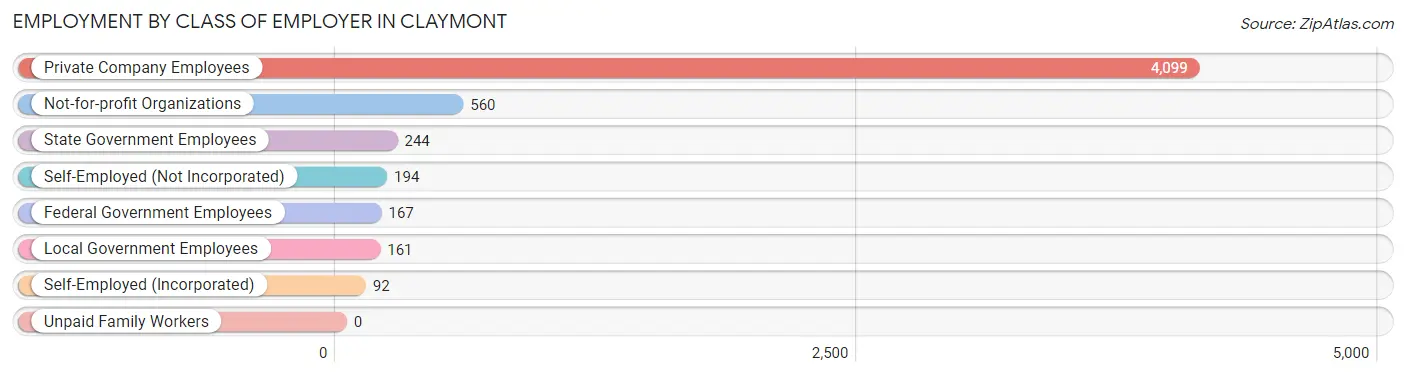
| Employer Class | # Employees | % Employees |
| Private Company Employees | 4,099 | 74.3% |
| Self-Employed (Incorporated) | 92 | 1.7% |
| Self-Employed (Not Incorporated) | 194 | 3.5% |
| Not-for-profit Organizations | 560 | 10.2% |
| Local Government Employees | 161 | 2.9% |
| State Government Employees | 244 | 4.4% |
| Federal Government Employees | 167 | 3.0% |
| Unpaid Family Workers | 0 | 0.0% |
| Total | 5,517 | 100.0% |
Employment Status by Age in Claymont
According to the labor force statistics for Claymont, out of the total population over 16 years of age (8,505), 69.2% or 5,885 individuals are in the labor force, with 3.9% or 230 of them unemployed. The age group with the highest labor force participation rate is 30 to 34 years, with 90.5% or 921 individuals in the labor force. Within the labor force, the 16 to 19 years age range has the highest percentage of unemployed individuals, with 18.1% or 34 of them being unemployed.
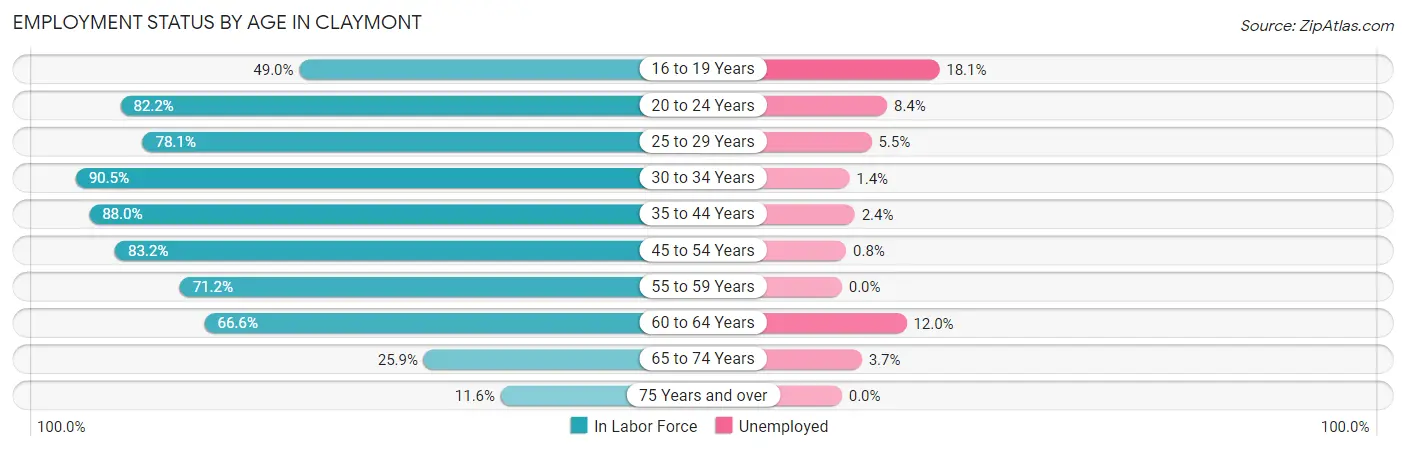
| Age Bracket | In Labor Force | Unemployed |
| 16 to 19 Years | 188 (49.0%) | 34 (18.1%) |
| 20 to 24 Years | 462 (82.2%) | 39 (8.4%) |
| 25 to 29 Years | 868 (78.1%) | 48 (5.5%) |
| 30 to 34 Years | 921 (90.5%) | 13 (1.4%) |
| 35 to 44 Years | 1,088 (88.0%) | 26 (2.4%) |
| 45 to 54 Years | 1,159 (83.2%) | 9 (0.8%) |
| 55 to 59 Years | 421 (71.2%) | 0 (0.0%) |
| 60 to 64 Years | 435 (66.6%) | 52 (12.0%) |
| 65 to 74 Years | 298 (25.9%) | 11 (3.7%) |
| 75 Years and over | 47 (11.6%) | 0 (0.0%) |
| Total | 5,885 (69.2%) | 230 (3.9%) |
Employment Status by Educational Attainment in Claymont
According to labor force statistics for Claymont, 81.5% of individuals (4,892) out of the total population between 25 and 64 years of age (6,003) are in the labor force, with 3.0% or 147 of them being unemployed. The group with the highest labor force participation rate are those with the educational attainment of bachelor's degree or higher, with 88.9% or 1,959 individuals in the labor force. Within the labor force, individuals with high school diploma education have the highest percentage of unemployment, with 7.9% or 101 of them being unemployed.
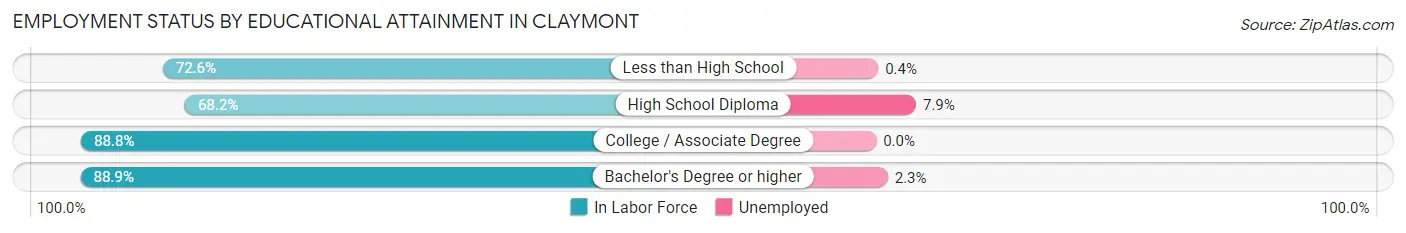
| Educational Attainment | In Labor Force | Unemployed |
| Less than High School | 249 (72.6%) | 1 (0.4%) |
| High School Diploma | 1,275 (68.2%) | 148 (7.9%) |
| College / Associate Degree | 1,408 (88.8%) | 0 (0.0%) |
| Bachelor's Degree or higher | 1,959 (88.9%) | 51 (2.3%) |
| Total | 4,892 (81.5%) | 180 (3.0%) |
Employment Occupations by Sex in Claymont
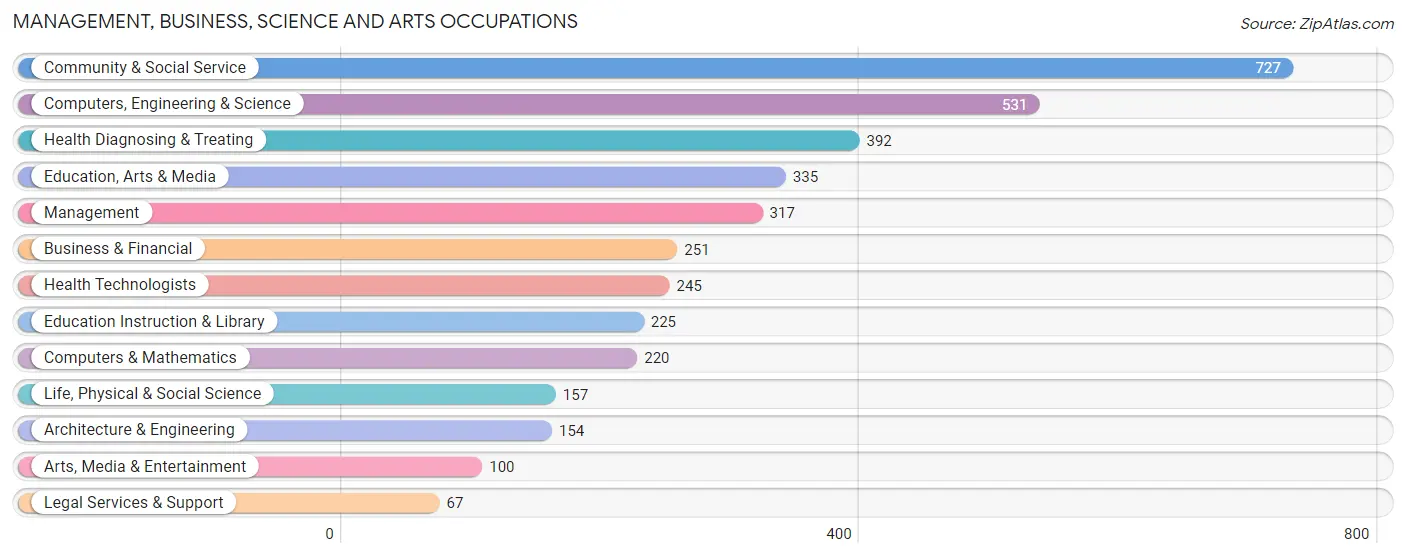
Management, Business, Science and Arts Occupations
The most common Management, Business, Science and Arts occupations in Claymont are Community & Social Service (727 | 12.9%), Computers, Engineering & Science (531 | 9.4%), Health Diagnosing & Treating (392 | 6.9%), Education, Arts & Media (335 | 5.9%), and Management (317 | 5.6%).
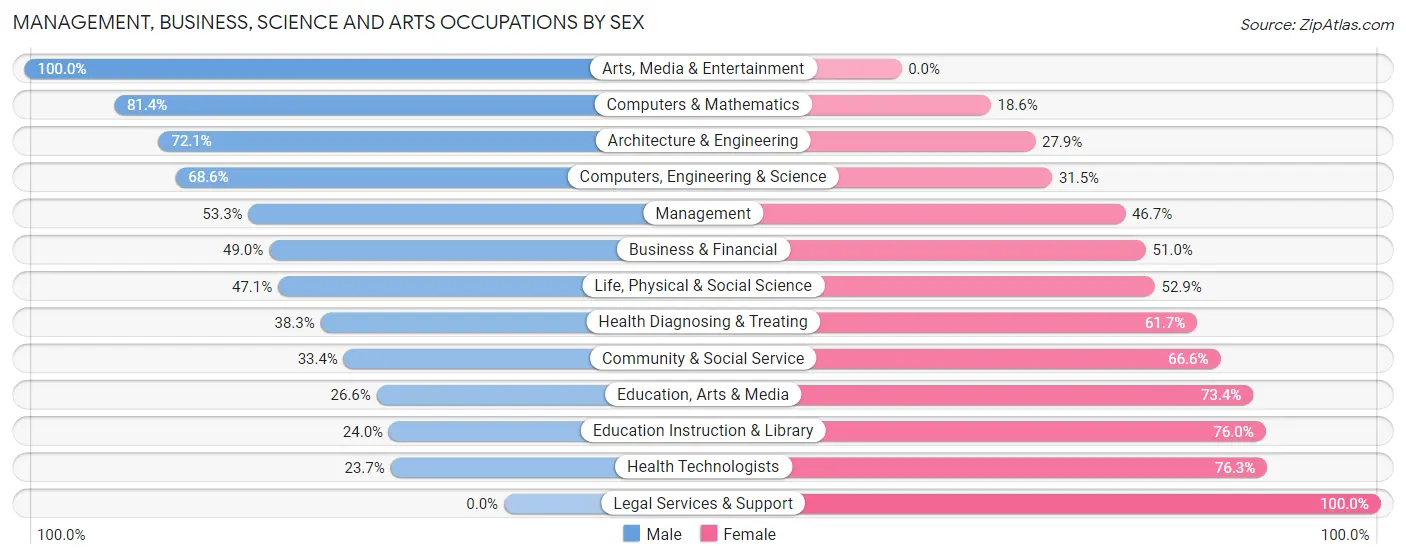
Management, Business, Science and Arts Occupations by Sex
Within the Management, Business, Science and Arts occupations in Claymont, the most male-oriented occupations are Arts, Media & Entertainment (100.0%), Computers & Mathematics (81.4%), and Architecture & Engineering (72.1%), while the most female-oriented occupations are Legal Services & Support (100.0%), Health Technologists (76.3%), and Education Instruction & Library (76.0%).
| Occupation | Male | Female |
| Management | 169 (53.3%) | 148 (46.7%) |
| Business & Financial | 123 (49.0%) | 128 (51.0%) |
| Computers, Engineering & Science | 364 (68.5%) | 167 (31.5%) |
| Computers & Mathematics | 179 (81.4%) | 41 (18.6%) |
| Architecture & Engineering | 111 (72.1%) | 43 (27.9%) |
| Life, Physical & Social Science | 74 (47.1%) | 83 (52.9%) |
| Community & Social Service | 243 (33.4%) | 484 (66.6%) |
| Education, Arts & Media | 89 (26.6%) | 246 (73.4%) |
| Legal Services & Support | 0 (0.0%) | 67 (100.0%) |
| Education Instruction & Library | 54 (24.0%) | 171 (76.0%) |
| Arts, Media & Entertainment | 100 (100.0%) | 0 (0.0%) |
| Health Diagnosing & Treating | 150 (38.3%) | 242 (61.7%) |
| Health Technologists | 58 (23.7%) | 187 (76.3%) |
| Total (Category) | 1,049 (47.3%) | 1,169 (52.7%) |
| Total (Overall) | 3,036 (53.7%) | 2,616 (46.3%) |
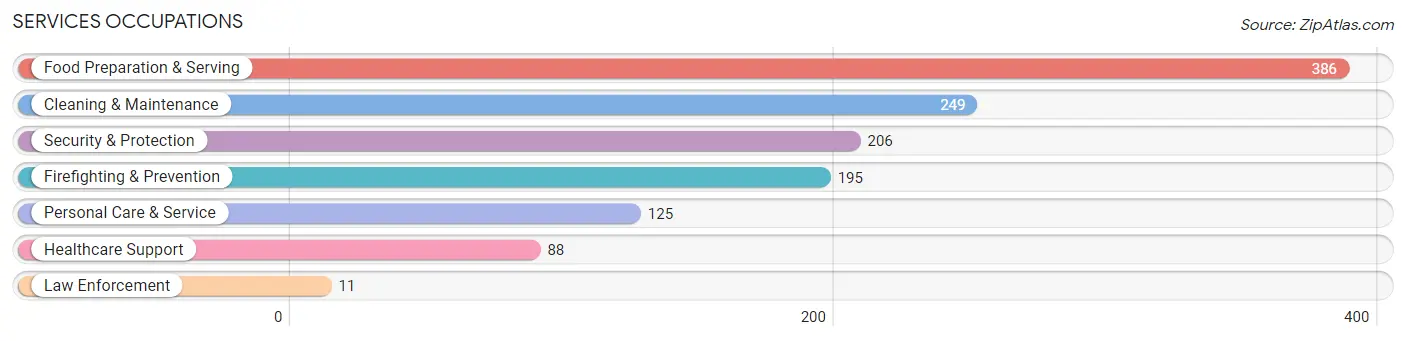
Services Occupations
The most common Services occupations in Claymont are Food Preparation & Serving (386 | 6.8%), Cleaning & Maintenance (249 | 4.4%), Security & Protection (206 | 3.6%), Firefighting & Prevention (195 | 3.5%), and Personal Care & Service (125 | 2.2%).
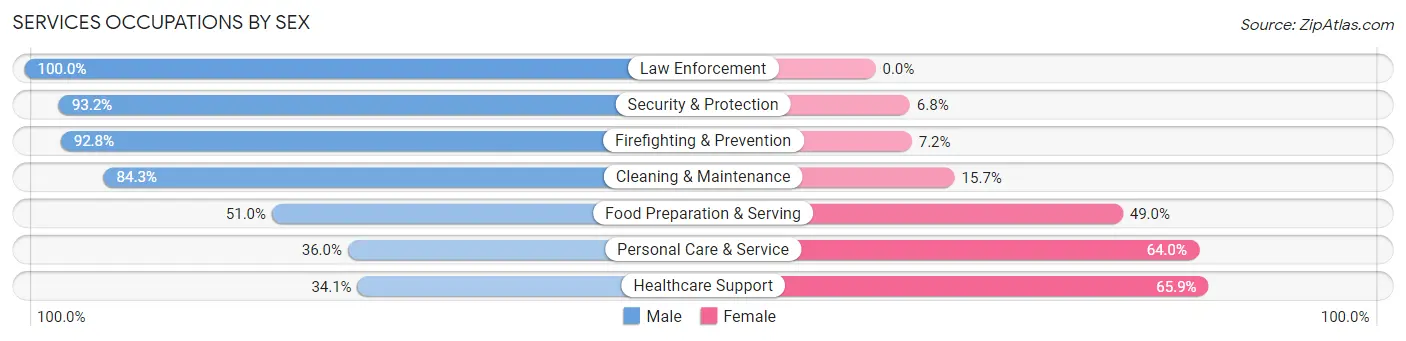
Services Occupations by Sex
Within the Services occupations in Claymont, the most male-oriented occupations are Law Enforcement (100.0%), Security & Protection (93.2%), and Firefighting & Prevention (92.8%), while the most female-oriented occupations are Healthcare Support (65.9%), Personal Care & Service (64.0%), and Food Preparation & Serving (49.0%).
| Occupation | Male | Female |
| Healthcare Support | 30 (34.1%) | 58 (65.9%) |
| Security & Protection | 192 (93.2%) | 14 (6.8%) |
| Firefighting & Prevention | 181 (92.8%) | 14 (7.2%) |
| Law Enforcement | 11 (100.0%) | 0 (0.0%) |
| Food Preparation & Serving | 197 (51.0%) | 189 (49.0%) |
| Cleaning & Maintenance | 210 (84.3%) | 39 (15.7%) |
| Personal Care & Service | 45 (36.0%) | 80 (64.0%) |
| Total (Category) | 674 (63.9%) | 380 (36.0%) |
| Total (Overall) | 3,036 (53.7%) | 2,616 (46.3%) |
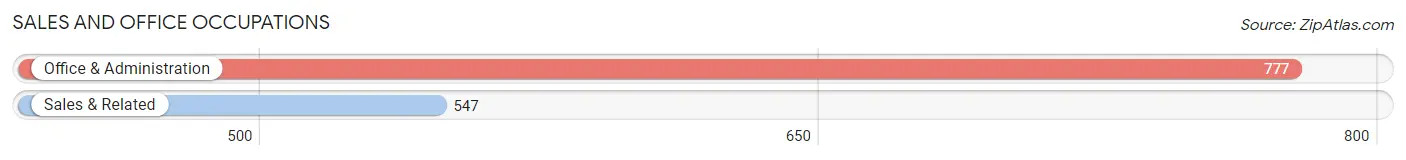
Sales and Office Occupations
The most common Sales and Office occupations in Claymont are Office & Administration (777 | 13.8%), and Sales & Related (547 | 9.7%).
Sales and Office Occupations by Sex
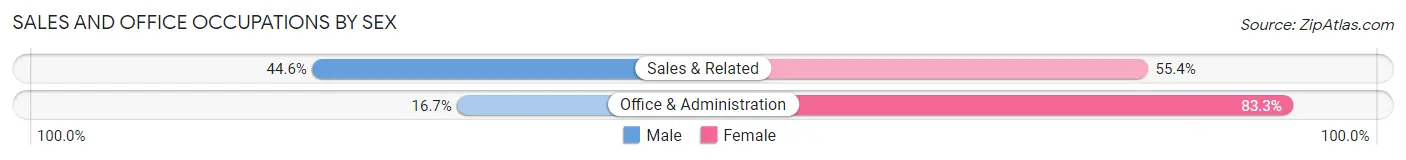
| Occupation | Male | Female |
| Sales & Related | 244 (44.6%) | 303 (55.4%) |
| Office & Administration | 130 (16.7%) | 647 (83.3%) |
| Total (Category) | 374 (28.2%) | 950 (71.8%) |
| Total (Overall) | 3,036 (53.7%) | 2,616 (46.3%) |
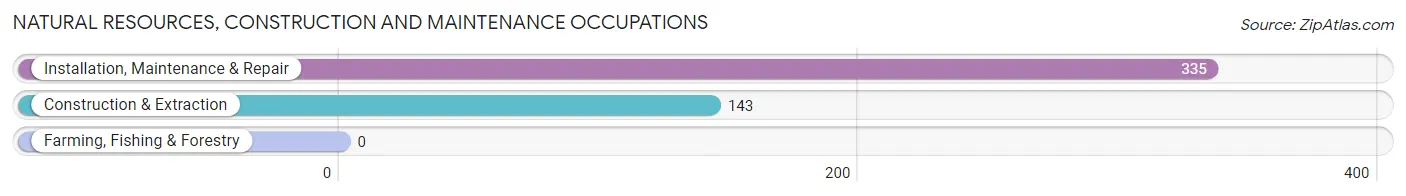
Natural Resources, Construction and Maintenance Occupations
The most common Natural Resources, Construction and Maintenance occupations in Claymont are Installation, Maintenance & Repair (335 | 5.9%), and Construction & Extraction (143 | 2.5%).
Natural Resources, Construction and Maintenance Occupations by Sex
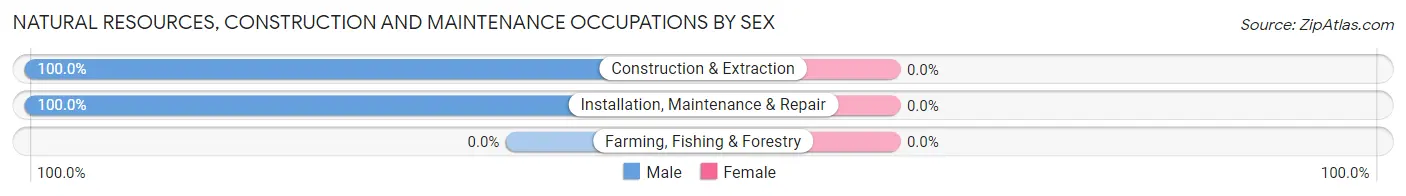
| Occupation | Male | Female |
| Farming, Fishing & Forestry | 0 (0.0%) | 0 (0.0%) |
| Construction & Extraction | 143 (100.0%) | 0 (0.0%) |
| Installation, Maintenance & Repair | 335 (100.0%) | 0 (0.0%) |
| Total (Category) | 478 (100.0%) | 0 (0.0%) |
| Total (Overall) | 3,036 (53.7%) | 2,616 (46.3%) |
Production, Transportation and Moving Occupations
The most common Production, Transportation and Moving occupations in Claymont are Transportation (216 | 3.8%), Material Moving (185 | 3.3%), and Production (177 | 3.1%).
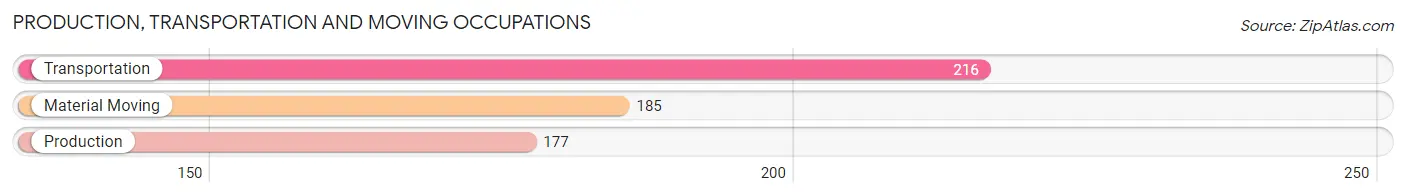
Production, Transportation and Moving Occupations by Sex
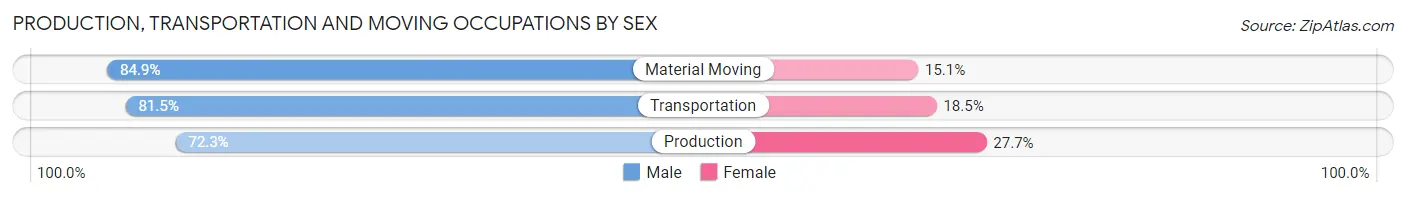
| Occupation | Male | Female |
| Production | 128 (72.3%) | 49 (27.7%) |
| Transportation | 176 (81.5%) | 40 (18.5%) |
| Material Moving | 157 (84.9%) | 28 (15.1%) |
| Total (Category) | 461 (79.8%) | 117 (20.2%) |
| Total (Overall) | 3,036 (53.7%) | 2,616 (46.3%) |
Employment Industries by Sex in Claymont
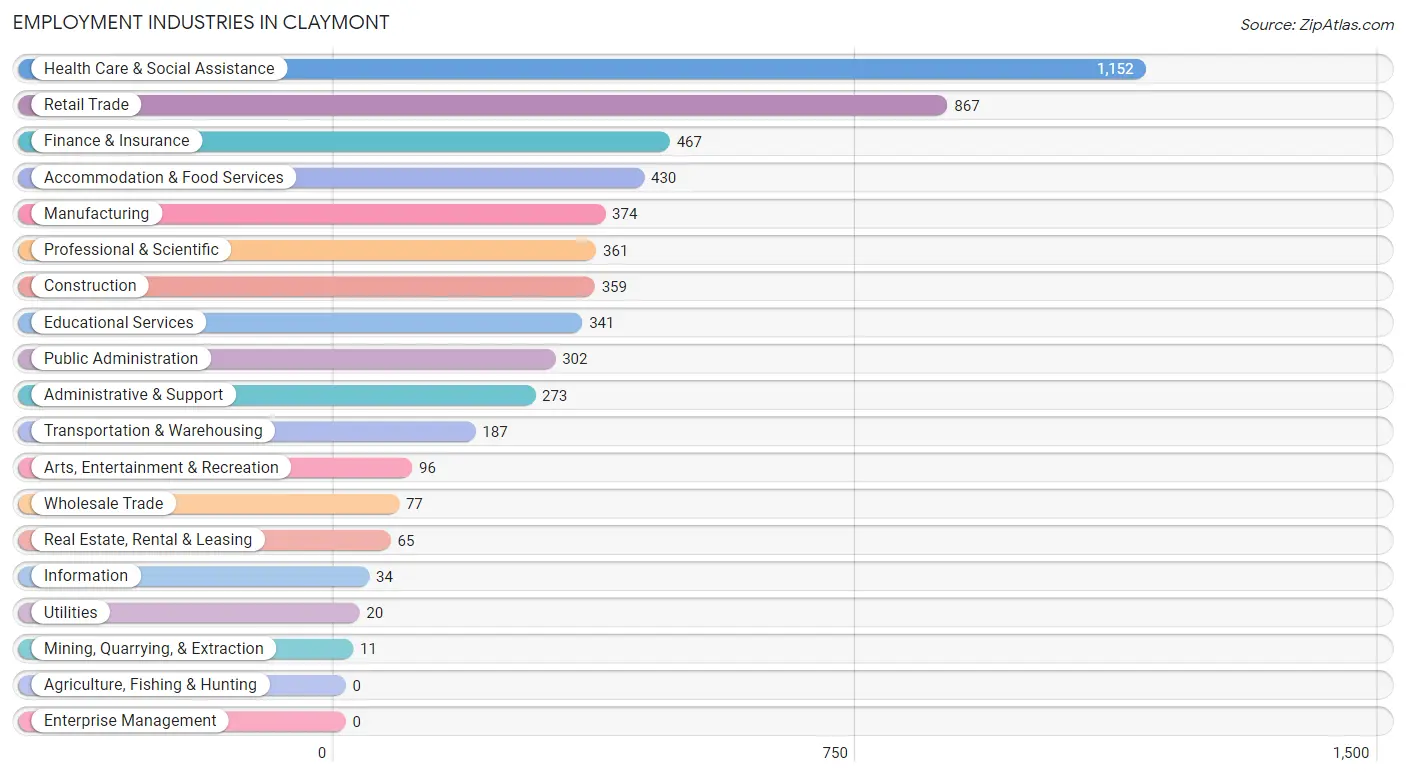
Employment Industries in Claymont
The major employment industries in Claymont include Health Care & Social Assistance (1,152 | 20.4%), Retail Trade (867 | 15.3%), Finance & Insurance (467 | 8.3%), Accommodation & Food Services (430 | 7.6%), and Manufacturing (374 | 6.6%).
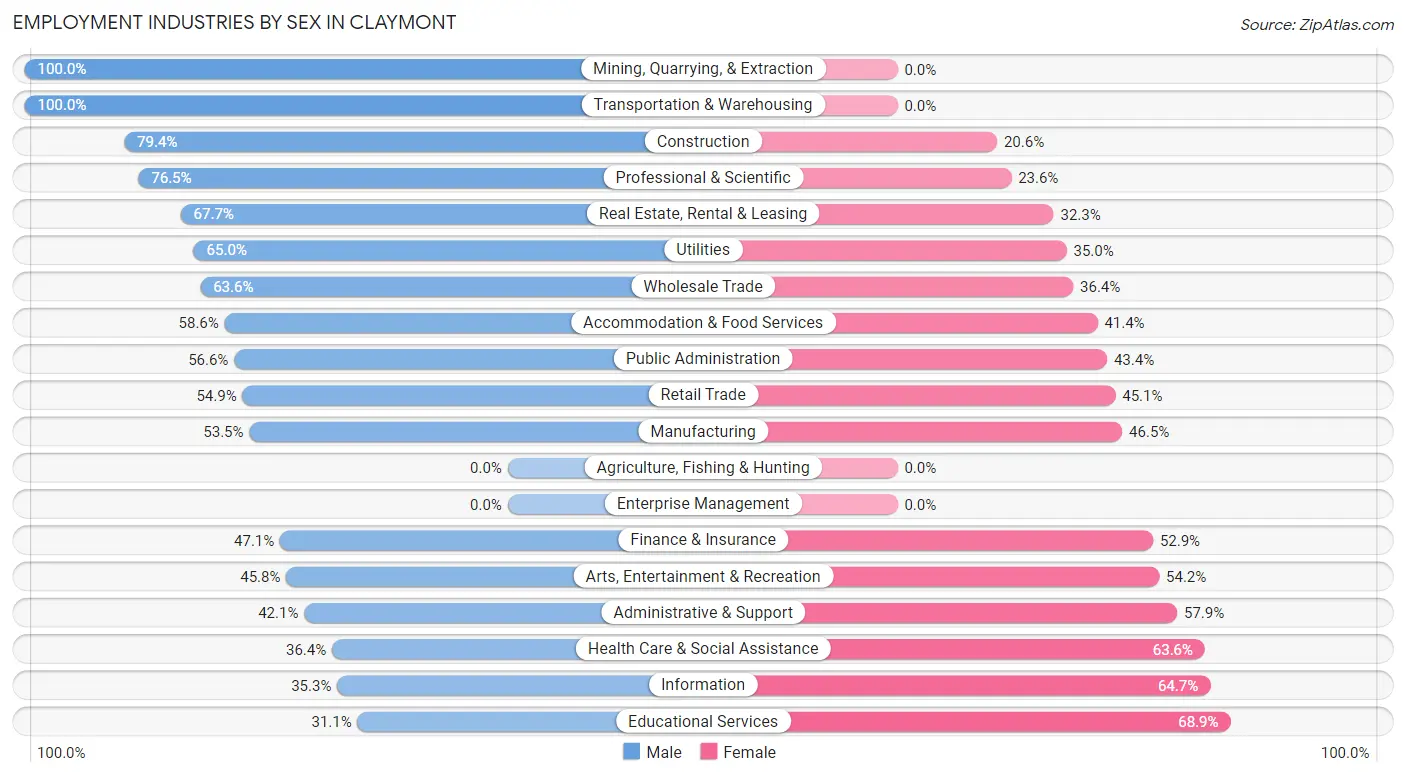
Employment Industries by Sex in Claymont
The Claymont industries that see more men than women are Mining, Quarrying, & Extraction (100.0%), Transportation & Warehousing (100.0%), and Construction (79.4%), whereas the industries that tend to have a higher number of women are Educational Services (68.9%), Information (64.7%), and Health Care & Social Assistance (63.6%).
| Industry | Male | Female |
| Agriculture, Fishing & Hunting | 0 (0.0%) | 0 (0.0%) |
| Mining, Quarrying, & Extraction | 11 (100.0%) | 0 (0.0%) |
| Construction | 285 (79.4%) | 74 (20.6%) |
| Manufacturing | 200 (53.5%) | 174 (46.5%) |
| Wholesale Trade | 49 (63.6%) | 28 (36.4%) |
| Retail Trade | 476 (54.9%) | 391 (45.1%) |
| Transportation & Warehousing | 187 (100.0%) | 0 (0.0%) |
| Utilities | 13 (65.0%) | 7 (35.0%) |
| Information | 12 (35.3%) | 22 (64.7%) |
| Finance & Insurance | 220 (47.1%) | 247 (52.9%) |
| Real Estate, Rental & Leasing | 44 (67.7%) | 21 (32.3%) |
| Professional & Scientific | 276 (76.4%) | 85 (23.5%) |
| Enterprise Management | 0 (0.0%) | 0 (0.0%) |
| Administrative & Support | 115 (42.1%) | 158 (57.9%) |
| Educational Services | 106 (31.1%) | 235 (68.9%) |
| Health Care & Social Assistance | 419 (36.4%) | 733 (63.6%) |
| Arts, Entertainment & Recreation | 44 (45.8%) | 52 (54.2%) |
| Accommodation & Food Services | 252 (58.6%) | 178 (41.4%) |
| Public Administration | 171 (56.6%) | 131 (43.4%) |
| Total | 3,036 (53.7%) | 2,616 (46.3%) |
Education in Claymont
School Enrollment in Claymont
The most common levels of schooling among the 1,939 students in Claymont are middle school (477 | 24.6%), college / undergraduate (349 | 18.0%), and elementary school (317 | 16.4%).
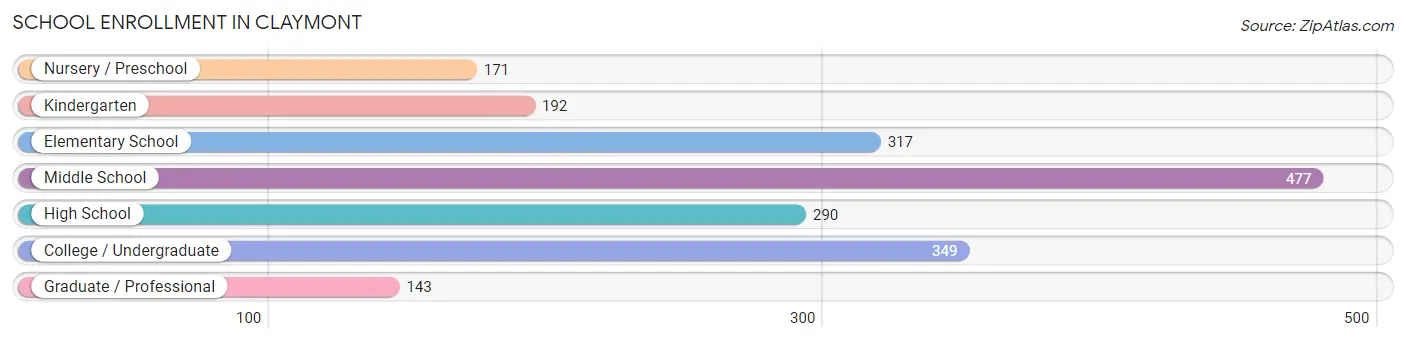
| School Level | # Students | % Students |
| Nursery / Preschool | 171 | 8.8% |
| Kindergarten | 192 | 9.9% |
| Elementary School | 317 | 16.4% |
| Middle School | 477 | 24.6% |
| High School | 290 | 15.0% |
| College / Undergraduate | 349 | 18.0% |
| Graduate / Professional | 143 | 7.4% |
| Total | 1,939 | 100.0% |
School Enrollment by Age by Funding Source in Claymont
Out of a total of 1,939 students who are enrolled in schools in Claymont, 318 (16.4%) attend a private institution, while the remaining 1,621 (83.6%) are enrolled in public schools. The age group of 25 to 34 year olds has the highest likelihood of being enrolled in private schools, with 76 (65.0% in the age bracket) enrolled. Conversely, the age group of 35 years and over has the lowest likelihood of being enrolled in a private school, with 126 (92.0% in the age bracket) attending a public institution.
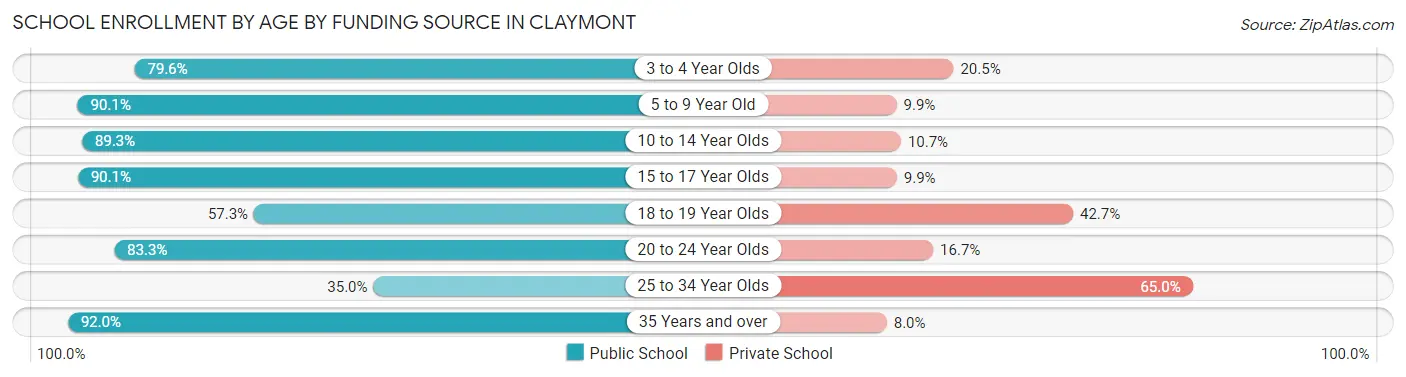
| Age Bracket | Public School | Private School |
| 3 to 4 Year Olds | 105 (79.5%) | 27 (20.4%) |
| 5 to 9 Year Old | 439 (90.1%) | 48 (9.9%) |
| 10 to 14 Year Olds | 519 (89.3%) | 62 (10.7%) |
| 15 to 17 Year Olds | 182 (90.1%) | 20 (9.9%) |
| 18 to 19 Year Olds | 59 (57.3%) | 44 (42.7%) |
| 20 to 24 Year Olds | 150 (83.3%) | 30 (16.7%) |
| 25 to 34 Year Olds | 41 (35.0%) | 76 (65.0%) |
| 35 Years and over | 126 (92.0%) | 11 (8.0%) |
| Total | 1,621 (83.6%) | 318 (16.4%) |
Educational Attainment by Field of Study in Claymont
Business (518 | 19.9%), arts & humanities (300 | 11.5%), science & technology (294 | 11.3%), education (246 | 9.4%), and social sciences (224 | 8.6%) are the most common fields of study among 2,608 individuals in Claymont who have obtained a bachelor's degree or higher.
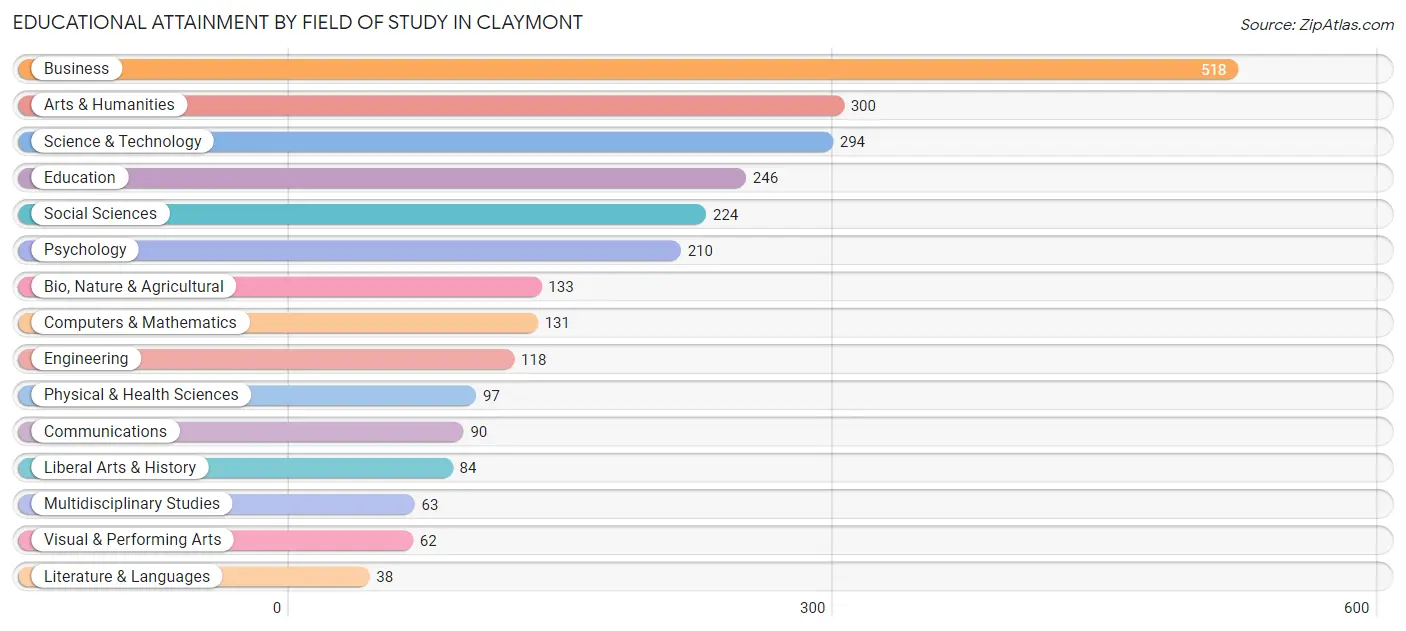
| Field of Study | # Graduates | % Graduates |
| Computers & Mathematics | 131 | 5.0% |
| Bio, Nature & Agricultural | 133 | 5.1% |
| Physical & Health Sciences | 97 | 3.7% |
| Psychology | 210 | 8.1% |
| Social Sciences | 224 | 8.6% |
| Engineering | 118 | 4.5% |
| Multidisciplinary Studies | 63 | 2.4% |
| Science & Technology | 294 | 11.3% |
| Business | 518 | 19.9% |
| Education | 246 | 9.4% |
| Literature & Languages | 38 | 1.5% |
| Liberal Arts & History | 84 | 3.2% |
| Visual & Performing Arts | 62 | 2.4% |
| Communications | 90 | 3.5% |
| Arts & Humanities | 300 | 11.5% |
| Total | 2,608 | 100.0% |
Transportation & Commute in Claymont
Vehicle Availability by Sex in Claymont
The most prevalent vehicle ownership categories in Claymont are males with 2 vehicles (1,159, accounting for 38.8%) and females with 2 vehicles (989, making up 45.8%).
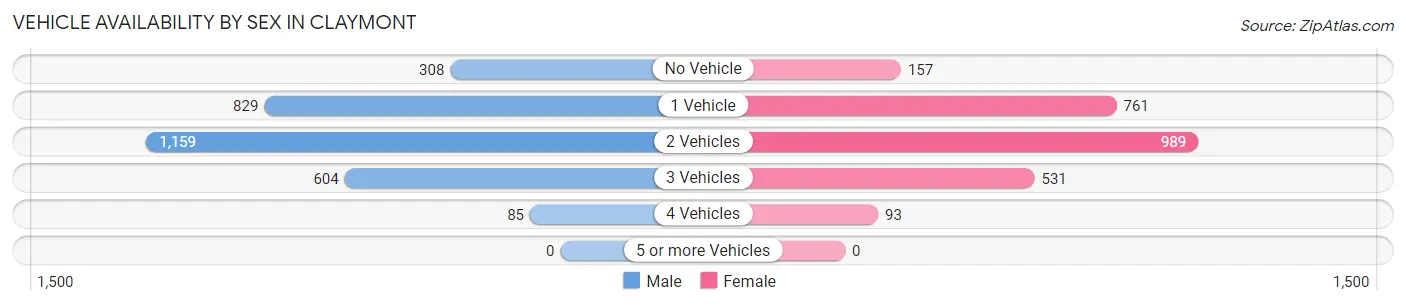
| Vehicles Available | Male | Female |
| No Vehicle | 308 (10.3%) | 157 (6.2%) |
| 1 Vehicle | 829 (27.8%) | 761 (30.1%) |
| 2 Vehicles | 1,159 (38.8%) | 989 (39.1%) |
| 3 Vehicles | 604 (20.2%) | 531 (21.0%) |
| 4 Vehicles | 85 (2.9%) | 93 (3.7%) |
| 5 or more Vehicles | 0 (0.0%) | 0 (0.0%) |
| Total | 2,985 (100.0%) | 2,531 (100.0%) |
Commute Time in Claymont
The most frequently occuring commute durations in Claymont are 20 to 24 minutes (1,215 commuters, 25.5%), 30 to 34 minutes (742 commuters, 15.5%), and 15 to 19 minutes (626 commuters, 13.1%).
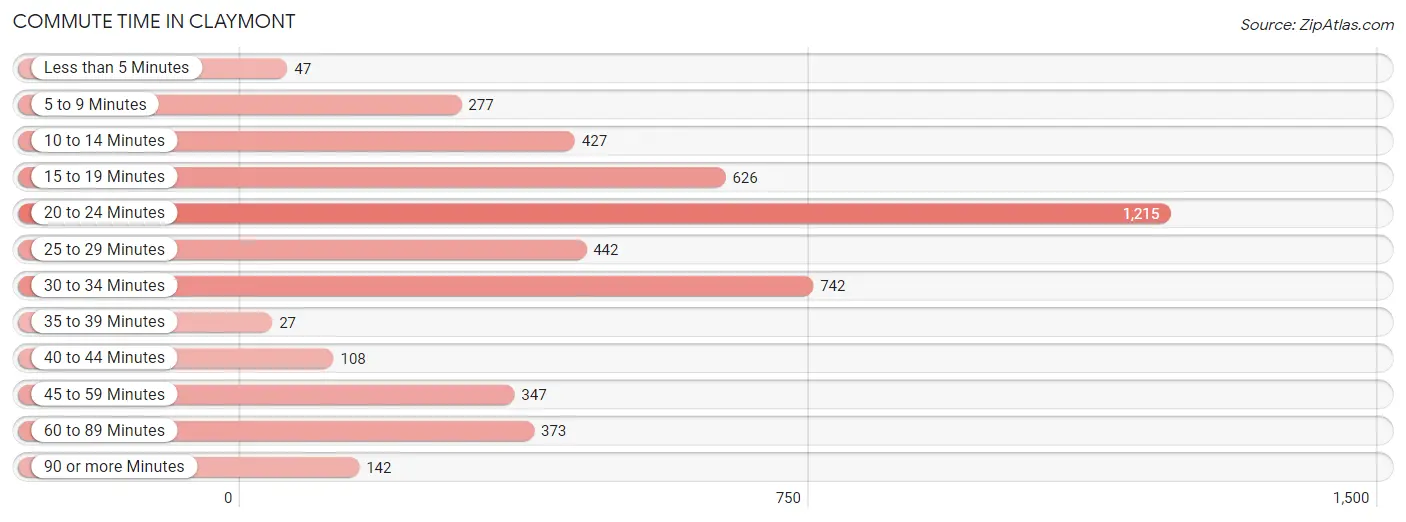
| Commute Time | # Commuters | % Commuters |
| Less than 5 Minutes | 47 | 1.0% |
| 5 to 9 Minutes | 277 | 5.8% |
| 10 to 14 Minutes | 427 | 8.9% |
| 15 to 19 Minutes | 626 | 13.1% |
| 20 to 24 Minutes | 1,215 | 25.5% |
| 25 to 29 Minutes | 442 | 9.3% |
| 30 to 34 Minutes | 742 | 15.5% |
| 35 to 39 Minutes | 27 | 0.6% |
| 40 to 44 Minutes | 108 | 2.3% |
| 45 to 59 Minutes | 347 | 7.3% |
| 60 to 89 Minutes | 373 | 7.8% |
| 90 or more Minutes | 142 | 3.0% |
Commute Time by Sex in Claymont
The most common commute times in Claymont are 20 to 24 minutes (675 commuters, 25.8%) for males and 20 to 24 minutes (540 commuters, 25.0%) for females.
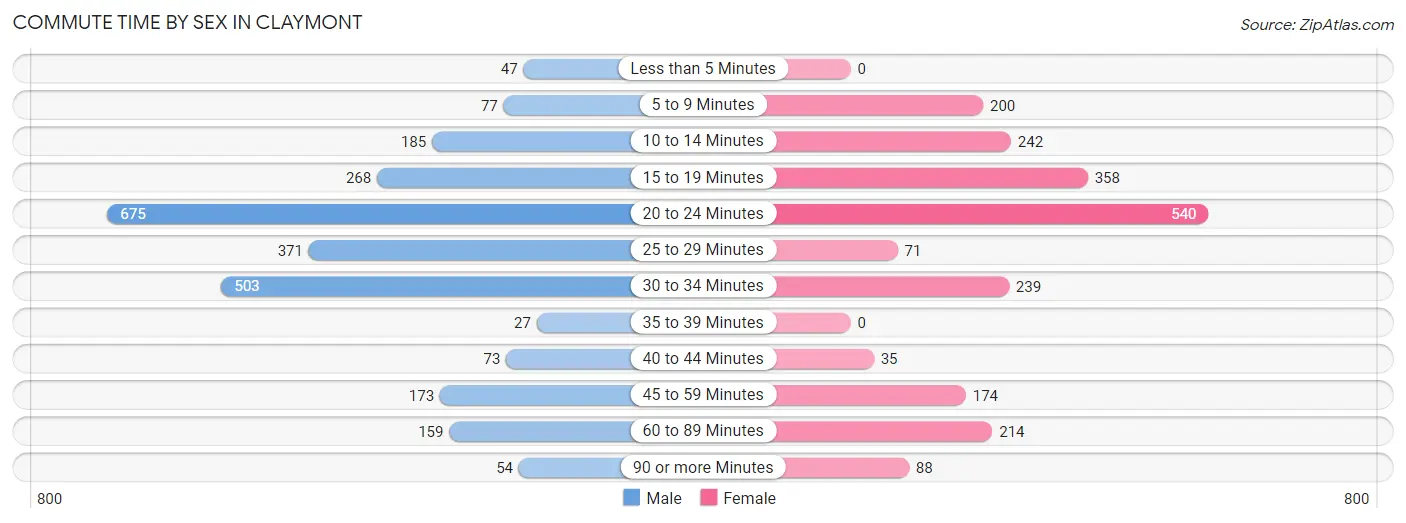
| Commute Time | Male | Female |
| Less than 5 Minutes | 47 (1.8%) | 0 (0.0%) |
| 5 to 9 Minutes | 77 (2.9%) | 200 (9.2%) |
| 10 to 14 Minutes | 185 (7.1%) | 242 (11.2%) |
| 15 to 19 Minutes | 268 (10.3%) | 358 (16.6%) |
| 20 to 24 Minutes | 675 (25.8%) | 540 (25.0%) |
| 25 to 29 Minutes | 371 (14.2%) | 71 (3.3%) |
| 30 to 34 Minutes | 503 (19.3%) | 239 (11.1%) |
| 35 to 39 Minutes | 27 (1.0%) | 0 (0.0%) |
| 40 to 44 Minutes | 73 (2.8%) | 35 (1.6%) |
| 45 to 59 Minutes | 173 (6.6%) | 174 (8.1%) |
| 60 to 89 Minutes | 159 (6.1%) | 214 (9.9%) |
| 90 or more Minutes | 54 (2.1%) | 88 (4.1%) |
Time of Departure to Work by Sex in Claymont
The most frequent times of departure to work in Claymont are 8:00 AM to 8:29 AM (339, 13.0%) for males and 8:00 AM to 8:29 AM (508, 23.5%) for females.
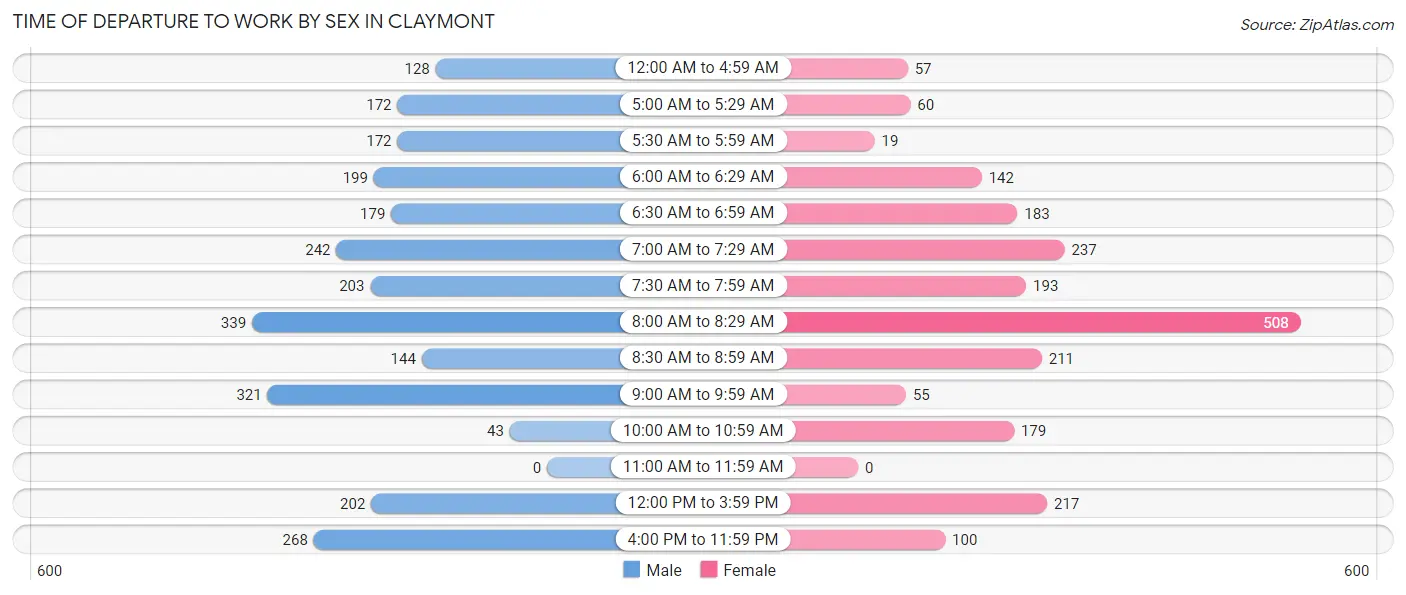
| Time of Departure | Male | Female |
| 12:00 AM to 4:59 AM | 128 (4.9%) | 57 (2.6%) |
| 5:00 AM to 5:29 AM | 172 (6.6%) | 60 (2.8%) |
| 5:30 AM to 5:59 AM | 172 (6.6%) | 19 (0.9%) |
| 6:00 AM to 6:29 AM | 199 (7.6%) | 142 (6.6%) |
| 6:30 AM to 6:59 AM | 179 (6.9%) | 183 (8.5%) |
| 7:00 AM to 7:29 AM | 242 (9.3%) | 237 (11.0%) |
| 7:30 AM to 7:59 AM | 203 (7.8%) | 193 (8.9%) |
| 8:00 AM to 8:29 AM | 339 (13.0%) | 508 (23.5%) |
| 8:30 AM to 8:59 AM | 144 (5.5%) | 211 (9.8%) |
| 9:00 AM to 9:59 AM | 321 (12.3%) | 55 (2.5%) |
| 10:00 AM to 10:59 AM | 43 (1.7%) | 179 (8.3%) |
| 11:00 AM to 11:59 AM | 0 (0.0%) | 0 (0.0%) |
| 12:00 PM to 3:59 PM | 202 (7.7%) | 217 (10.0%) |
| 4:00 PM to 11:59 PM | 268 (10.3%) | 100 (4.6%) |
| Total | 2,612 (100.0%) | 2,161 (100.0%) |
Housing Occupancy in Claymont
Occupancy by Ownership in Claymont
Of the total 4,174 dwellings in Claymont, owner-occupied units account for 2,251 (53.9%), while renter-occupied units make up 1,923 (46.1%).
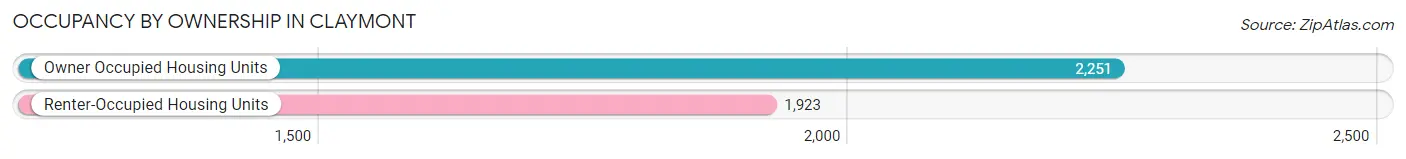
| Occupancy | # Housing Units | % Housing Units |
| Owner Occupied Housing Units | 2,251 | 53.9% |
| Renter-Occupied Housing Units | 1,923 | 46.1% |
| Total Occupied Housing Units | 4,174 | 100.0% |
Occupancy by Household Size in Claymont
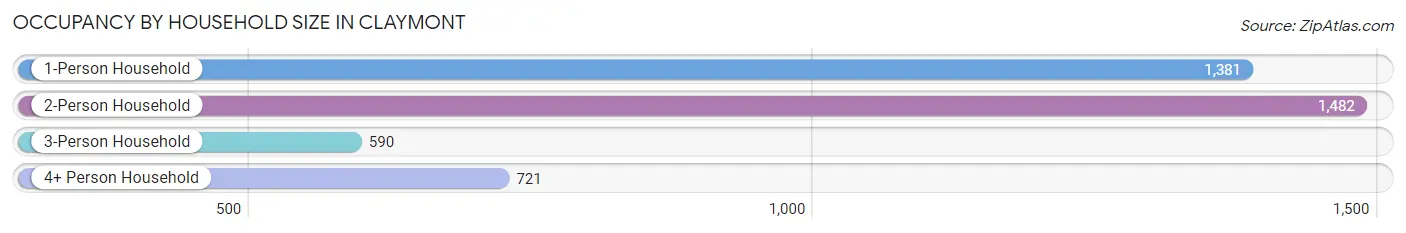
| Household Size | # Housing Units | % Housing Units |
| 1-Person Household | 1,381 | 33.1% |
| 2-Person Household | 1,482 | 35.5% |
| 3-Person Household | 590 | 14.1% |
| 4+ Person Household | 721 | 17.3% |
| Total Housing Units | 4,174 | 100.0% |
Occupancy by Ownership by Household Size in Claymont
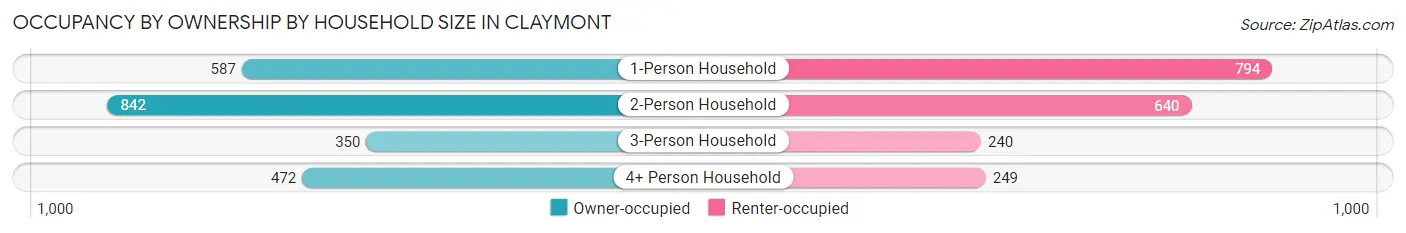
| Household Size | Owner-occupied | Renter-occupied |
| 1-Person Household | 587 (42.5%) | 794 (57.5%) |
| 2-Person Household | 842 (56.8%) | 640 (43.2%) |
| 3-Person Household | 350 (59.3%) | 240 (40.7%) |
| 4+ Person Household | 472 (65.5%) | 249 (34.5%) |
| Total Housing Units | 2,251 (53.9%) | 1,923 (46.1%) |
Occupancy by Educational Attainment in Claymont
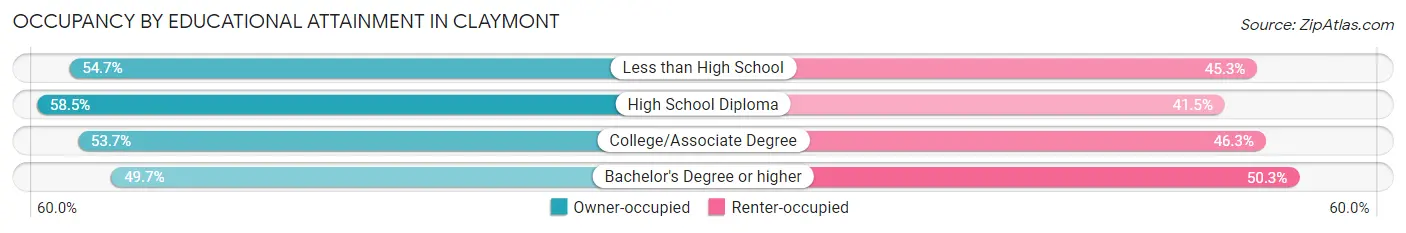
| Household Size | Owner-occupied | Renter-occupied |
| Less than High School | 76 (54.7%) | 63 (45.3%) |
| High School Diploma | 806 (58.5%) | 571 (41.5%) |
| College/Associate Degree | 653 (53.7%) | 564 (46.3%) |
| Bachelor's Degree or higher | 716 (49.7%) | 725 (50.3%) |
Occupancy by Age of Householder in Claymont
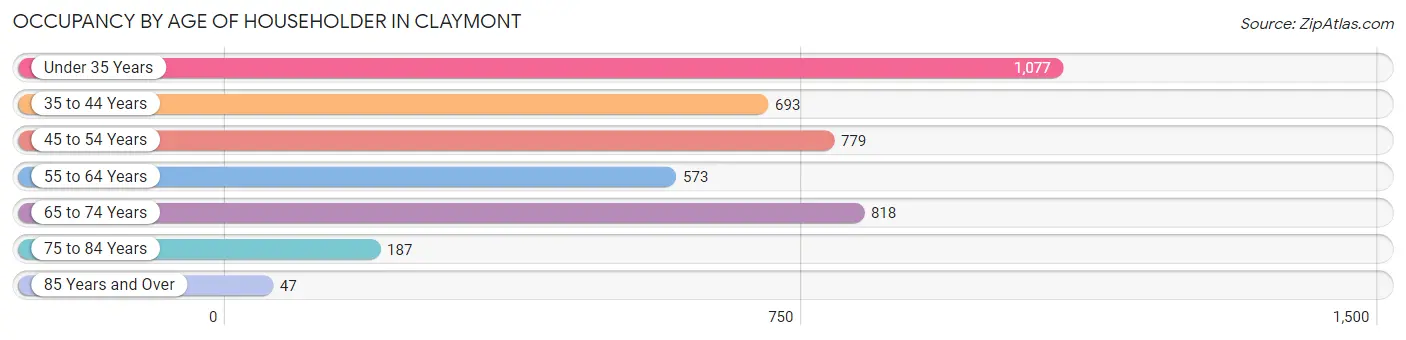
| Age Bracket | # Households | % Households |
| Under 35 Years | 1,077 | 25.8% |
| 35 to 44 Years | 693 | 16.6% |
| 45 to 54 Years | 779 | 18.7% |
| 55 to 64 Years | 573 | 13.7% |
| 65 to 74 Years | 818 | 19.6% |
| 75 to 84 Years | 187 | 4.5% |
| 85 Years and Over | 47 | 1.1% |
| Total | 4,174 | 100.0% |
Housing Finances in Claymont
Median Income by Occupancy in Claymont
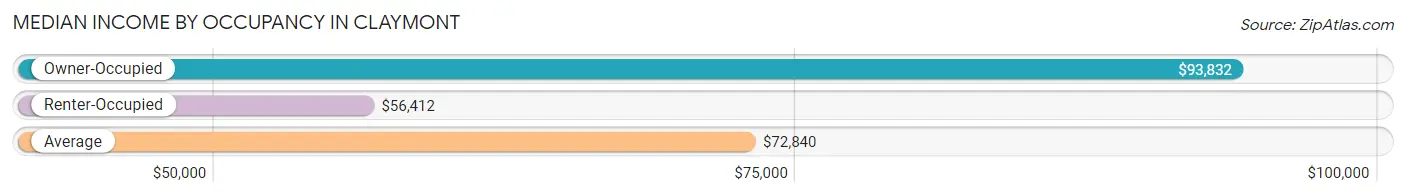
| Occupancy Type | # Households | Median Income |
| Owner-Occupied | 2,251 (53.9%) | $93,832 |
| Renter-Occupied | 1,923 (46.1%) | $56,412 |
| Average | 4,174 (100.0%) | $72,840 |
Occupancy by Householder Income Bracket in Claymont
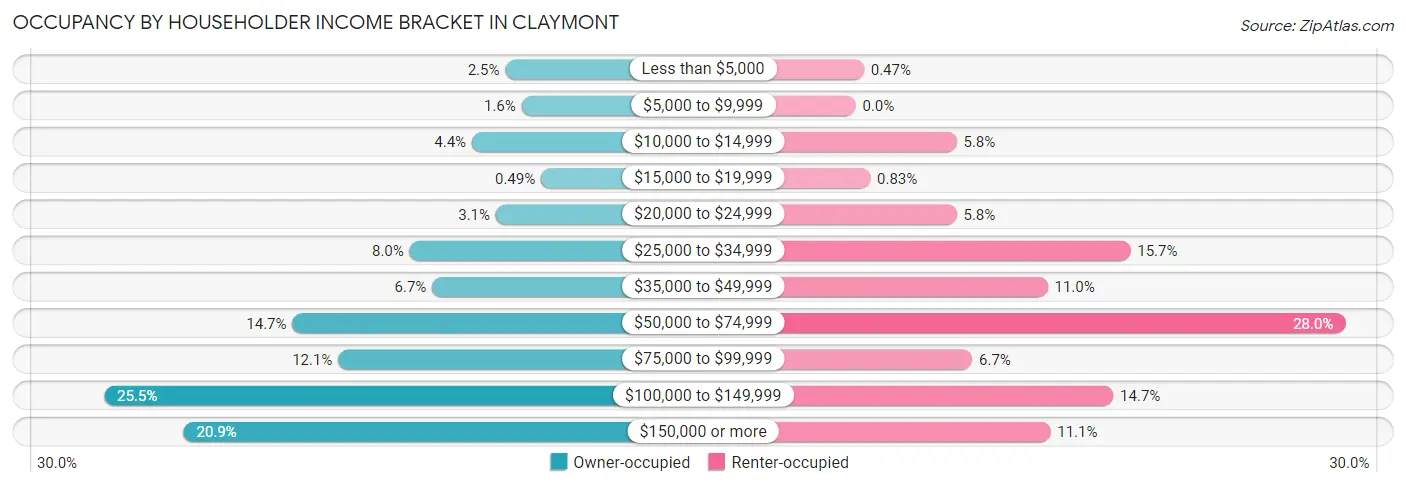
| Income Bracket | Owner-occupied | Renter-occupied |
| Less than $5,000 | 57 (2.5%) | 9 (0.5%) |
| $5,000 to $9,999 | 36 (1.6%) | 0 (0.0%) |
| $10,000 to $14,999 | 100 (4.4%) | 111 (5.8%) |
| $15,000 to $19,999 | 11 (0.5%) | 16 (0.8%) |
| $20,000 to $24,999 | 69 (3.1%) | 111 (5.8%) |
| $25,000 to $34,999 | 180 (8.0%) | 302 (15.7%) |
| $35,000 to $49,999 | 151 (6.7%) | 211 (11.0%) |
| $50,000 to $74,999 | 331 (14.7%) | 538 (28.0%) |
| $75,000 to $99,999 | 272 (12.1%) | 128 (6.7%) |
| $100,000 to $149,999 | 573 (25.5%) | 283 (14.7%) |
| $150,000 or more | 471 (20.9%) | 214 (11.1%) |
| Total | 2,251 (100.0%) | 1,923 (100.0%) |
Monthly Housing Cost Tiers in Claymont
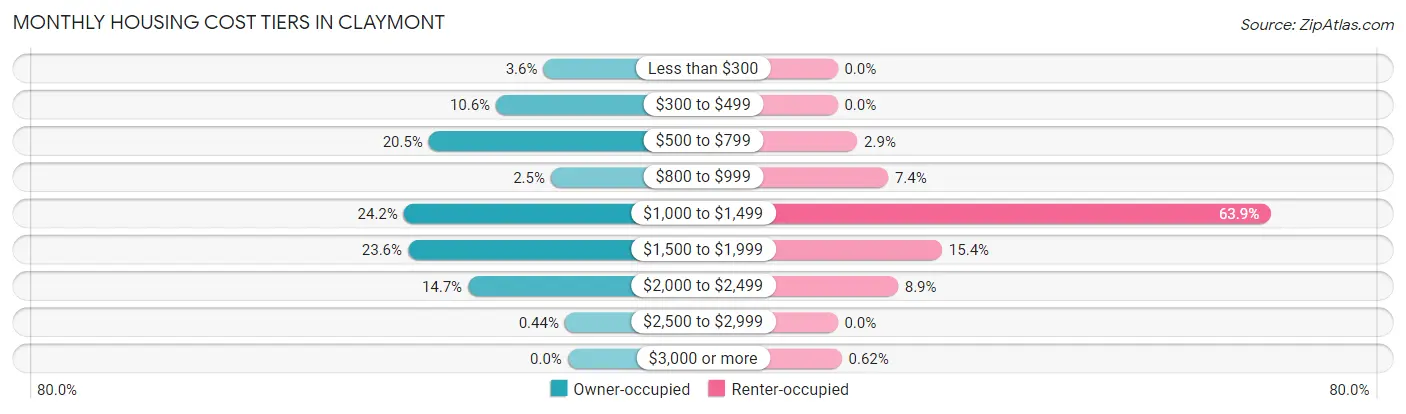
| Monthly Cost | Owner-occupied | Renter-occupied |
| Less than $300 | 81 (3.6%) | 0 (0.0%) |
| $300 to $499 | 238 (10.6%) | 0 (0.0%) |
| $500 to $799 | 461 (20.5%) | 56 (2.9%) |
| $800 to $999 | 56 (2.5%) | 143 (7.4%) |
| $1,000 to $1,499 | 544 (24.2%) | 1,228 (63.9%) |
| $1,500 to $1,999 | 530 (23.5%) | 296 (15.4%) |
| $2,000 to $2,499 | 331 (14.7%) | 171 (8.9%) |
| $2,500 to $2,999 | 10 (0.4%) | 0 (0.0%) |
| $3,000 or more | 0 (0.0%) | 12 (0.6%) |
| Total | 2,251 (100.0%) | 1,923 (100.0%) |
Physical Housing Characteristics in Claymont
Housing Structures in Claymont
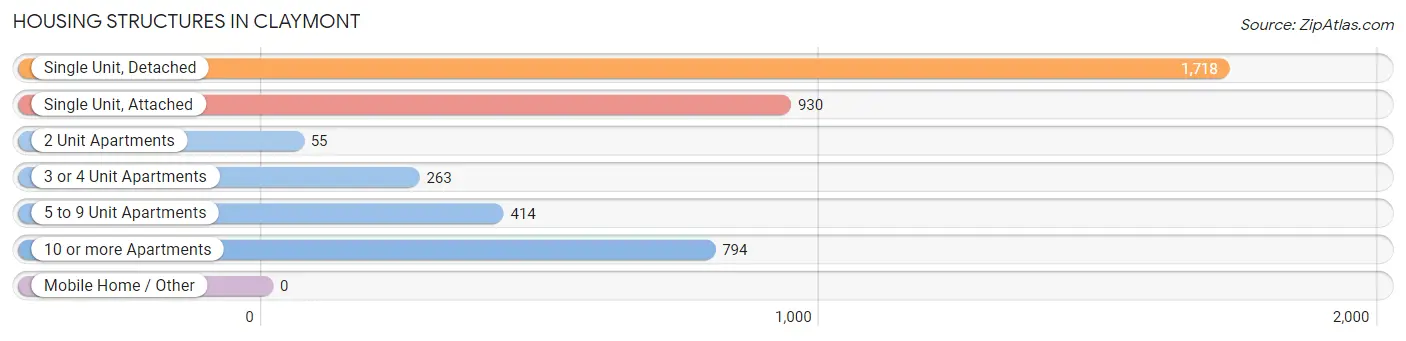
| Structure Type | # Housing Units | % Housing Units |
| Single Unit, Detached | 1,718 | 41.2% |
| Single Unit, Attached | 930 | 22.3% |
| 2 Unit Apartments | 55 | 1.3% |
| 3 or 4 Unit Apartments | 263 | 6.3% |
| 5 to 9 Unit Apartments | 414 | 9.9% |
| 10 or more Apartments | 794 | 19.0% |
| Mobile Home / Other | 0 | 0.0% |
| Total | 4,174 | 100.0% |
Housing Structures by Occupancy in Claymont
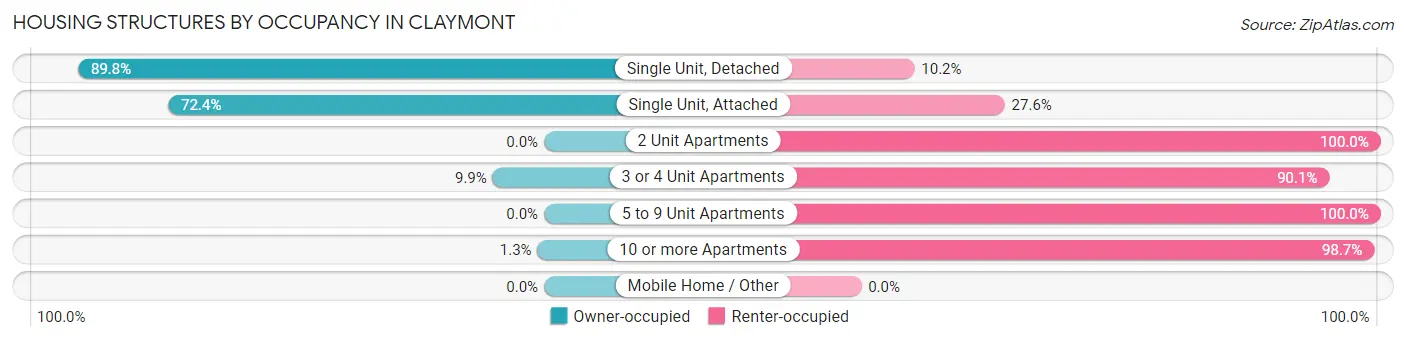
| Structure Type | Owner-occupied | Renter-occupied |
| Single Unit, Detached | 1,542 (89.8%) | 176 (10.2%) |
| Single Unit, Attached | 673 (72.4%) | 257 (27.6%) |
| 2 Unit Apartments | 0 (0.0%) | 55 (100.0%) |
| 3 or 4 Unit Apartments | 26 (9.9%) | 237 (90.1%) |
| 5 to 9 Unit Apartments | 0 (0.0%) | 414 (100.0%) |
| 10 or more Apartments | 10 (1.3%) | 784 (98.7%) |
| Mobile Home / Other | 0 (0.0%) | 0 (0.0%) |
| Total | 2,251 (53.9%) | 1,923 (46.1%) |
Housing Structures by Number of Rooms in Claymont
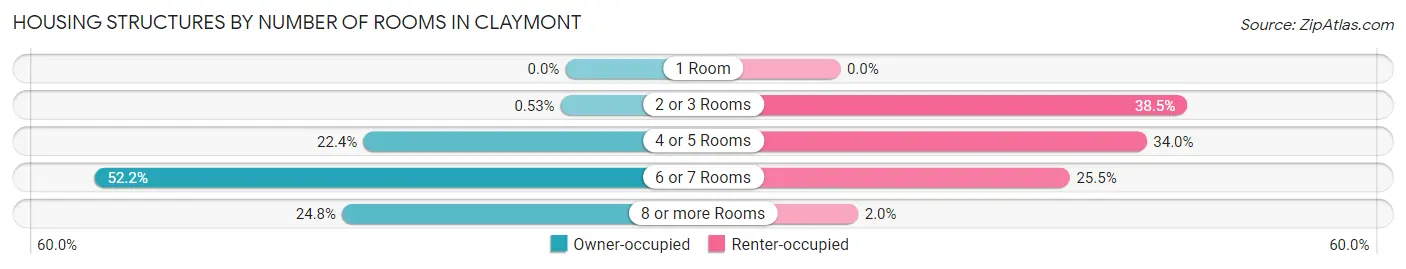
| Number of Rooms | Owner-occupied | Renter-occupied |
| 1 Room | 0 (0.0%) | 0 (0.0%) |
| 2 or 3 Rooms | 12 (0.5%) | 741 (38.5%) |
| 4 or 5 Rooms | 505 (22.4%) | 654 (34.0%) |
| 6 or 7 Rooms | 1,176 (52.2%) | 490 (25.5%) |
| 8 or more Rooms | 558 (24.8%) | 38 (2.0%) |
| Total | 2,251 (100.0%) | 1,923 (100.0%) |
Housing Structure by Heating Type in Claymont
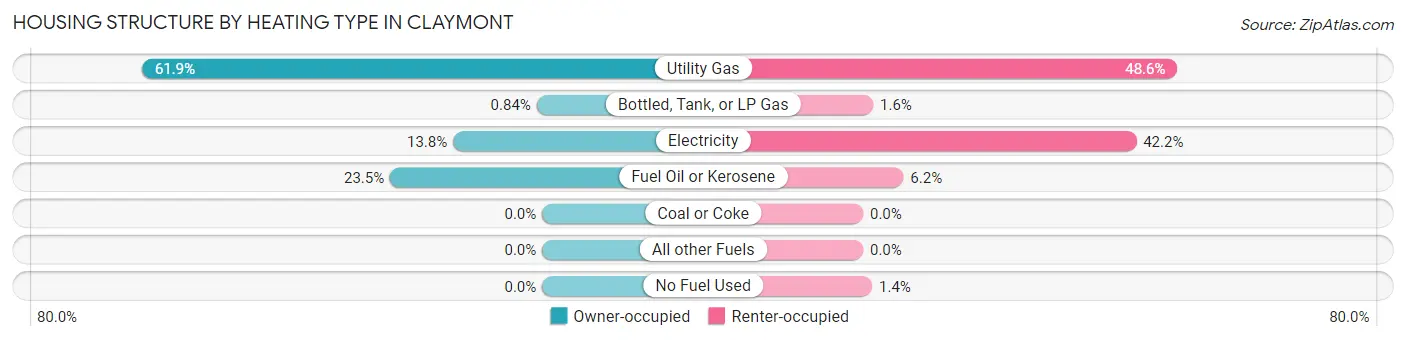
| Heating Type | Owner-occupied | Renter-occupied |
| Utility Gas | 1,393 (61.9%) | 934 (48.6%) |
| Bottled, Tank, or LP Gas | 19 (0.8%) | 30 (1.6%) |
| Electricity | 310 (13.8%) | 812 (42.2%) |
| Fuel Oil or Kerosene | 529 (23.5%) | 120 (6.2%) |
| Coal or Coke | 0 (0.0%) | 0 (0.0%) |
| All other Fuels | 0 (0.0%) | 0 (0.0%) |
| No Fuel Used | 0 (0.0%) | 27 (1.4%) |
| Total | 2,251 (100.0%) | 1,923 (100.0%) |
Household Vehicle Usage in Claymont
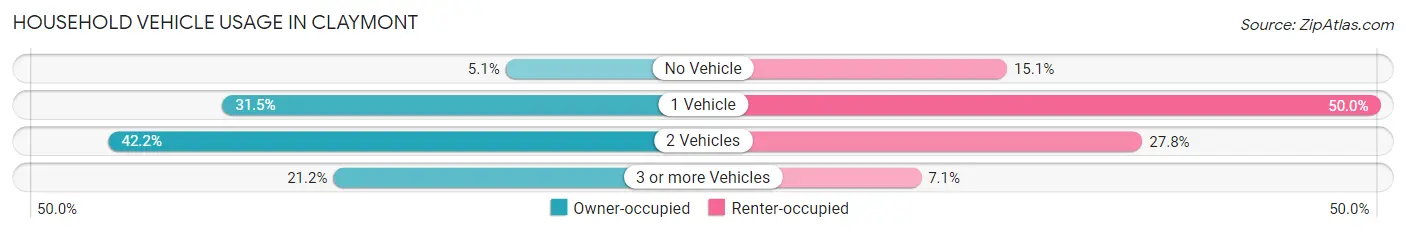
| Vehicles per Household | Owner-occupied | Renter-occupied |
| No Vehicle | 115 (5.1%) | 291 (15.1%) |
| 1 Vehicle | 710 (31.5%) | 961 (50.0%) |
| 2 Vehicles | 949 (42.2%) | 534 (27.8%) |
| 3 or more Vehicles | 477 (21.2%) | 137 (7.1%) |
| Total | 2,251 (100.0%) | 1,923 (100.0%) |
Real Estate & Mortgages in Claymont
Real Estate and Mortgage Overview in Claymont
| Characteristic | Without Mortgage | With Mortgage |
| Housing Units | 716 | 1,535 |
| Median Property Value | $229,700 | $264,100 |
| Median Household Income | $50,256 | $395 |
| Monthly Housing Costs | $522 | $0 |
| Real Estate Taxes | $1,196 | $20 |
Property Value by Mortgage Status in Claymont
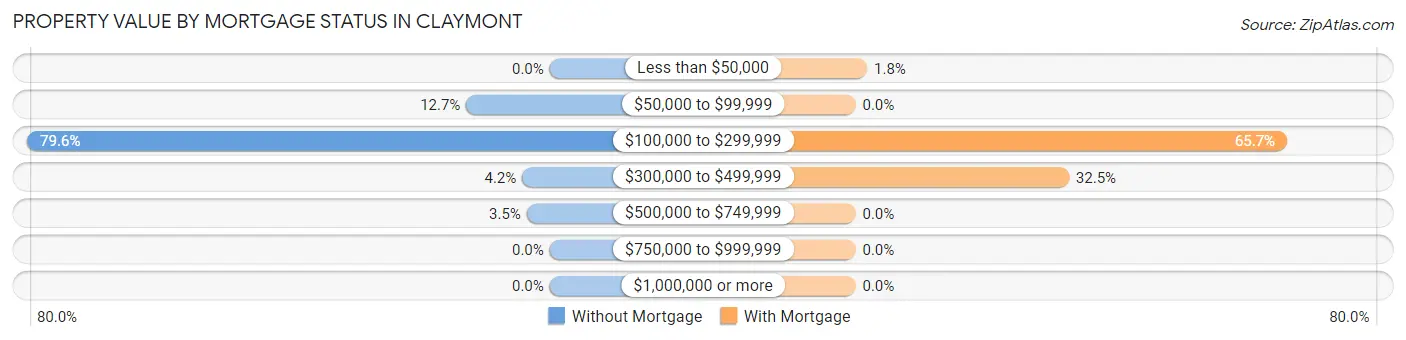
| Property Value | Without Mortgage | With Mortgage |
| Less than $50,000 | 0 (0.0%) | 27 (1.8%) |
| $50,000 to $99,999 | 91 (12.7%) | 0 (0.0%) |
| $100,000 to $299,999 | 570 (79.6%) | 1,009 (65.7%) |
| $300,000 to $499,999 | 30 (4.2%) | 499 (32.5%) |
| $500,000 to $749,999 | 25 (3.5%) | 0 (0.0%) |
| $750,000 to $999,999 | 0 (0.0%) | 0 (0.0%) |
| $1,000,000 or more | 0 (0.0%) | 0 (0.0%) |
| Total | 716 (100.0%) | 1,535 (100.0%) |
Household Income by Mortgage Status in Claymont
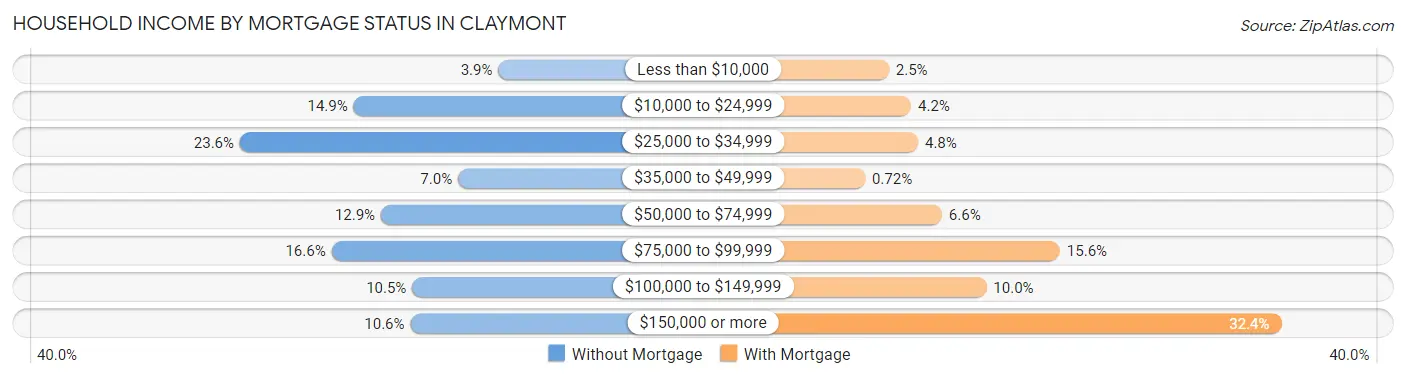
| Household Income | Without Mortgage | With Mortgage |
| Less than $10,000 | 28 (3.9%) | 39 (2.5%) |
| $10,000 to $24,999 | 107 (14.9%) | 65 (4.2%) |
| $25,000 to $34,999 | 169 (23.6%) | 73 (4.8%) |
| $35,000 to $49,999 | 50 (7.0%) | 11 (0.7%) |
| $50,000 to $74,999 | 92 (12.9%) | 101 (6.6%) |
| $75,000 to $99,999 | 119 (16.6%) | 239 (15.6%) |
| $100,000 to $149,999 | 75 (10.5%) | 153 (10.0%) |
| $150,000 or more | 76 (10.6%) | 498 (32.4%) |
| Total | 716 (100.0%) | 1,535 (100.0%) |
Property Value to Household Income Ratio in Claymont
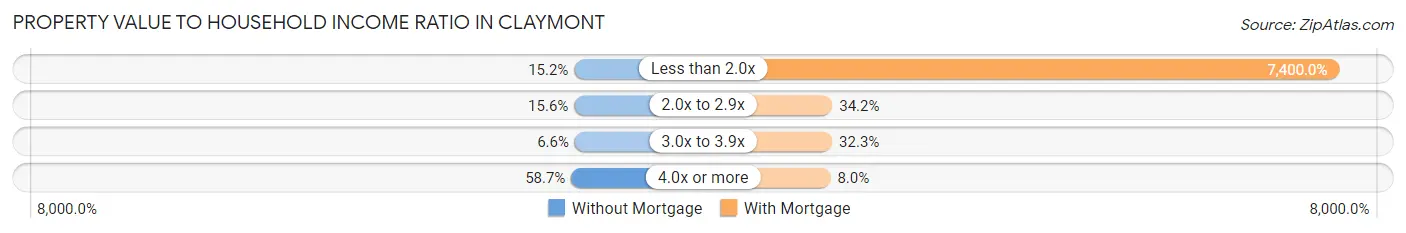
| Value-to-Income Ratio | Without Mortgage | With Mortgage |
| Less than 2.0x | 109 (15.2%) | 113,590 (7,400.0%) |
| 2.0x to 2.9x | 112 (15.6%) | 525 (34.2%) |
| 3.0x to 3.9x | 47 (6.6%) | 495 (32.3%) |
| 4.0x or more | 420 (58.7%) | 123 (8.0%) |
| Total | 716 (100.0%) | 1,535 (100.0%) |
Real Estate Taxes by Mortgage Status in Claymont
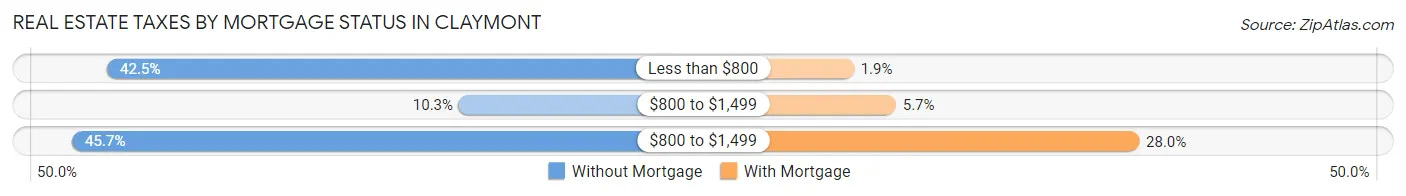
| Property Taxes | Without Mortgage | With Mortgage |
| Less than $800 | 304 (42.5%) | 29 (1.9%) |
| $800 to $1,499 | 74 (10.3%) | 88 (5.7%) |
| $800 to $1,499 | 327 (45.7%) | 429 (28.0%) |
| Total | 716 (100.0%) | 1,535 (100.0%) |
Health & Disability in Claymont
Health Insurance Coverage by Age in Claymont
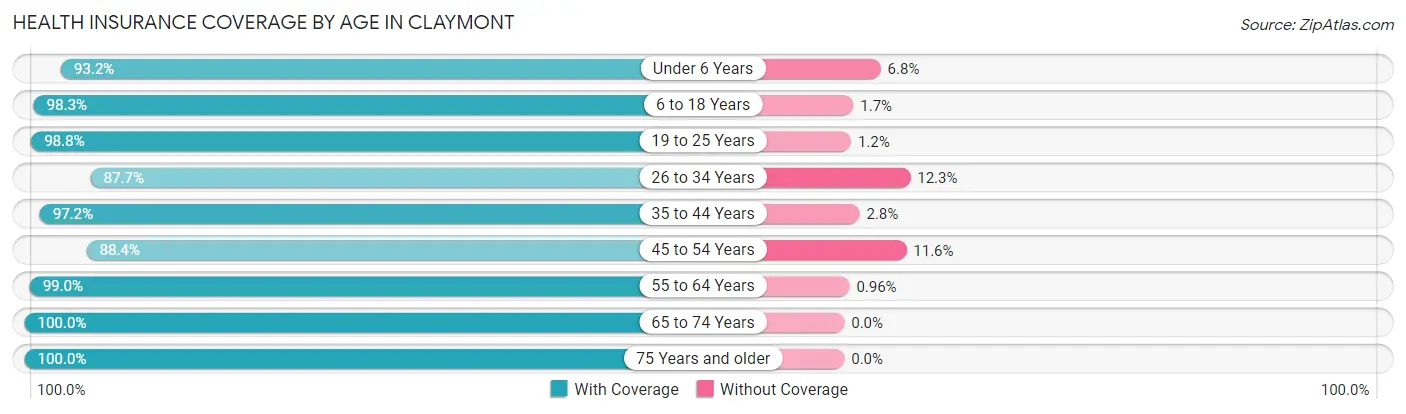
| Age Bracket | With Coverage | Without Coverage |
| Under 6 Years | 687 (93.2%) | 50 (6.8%) |
| 6 to 18 Years | 1,219 (98.3%) | 21 (1.7%) |
| 19 to 25 Years | 953 (98.8%) | 12 (1.2%) |
| 26 to 34 Years | 1,595 (87.7%) | 224 (12.3%) |
| 35 to 44 Years | 1,198 (97.2%) | 35 (2.8%) |
| 45 to 54 Years | 1,231 (88.4%) | 161 (11.6%) |
| 55 to 64 Years | 1,232 (99.0%) | 12 (1.0%) |
| 65 to 74 Years | 1,150 (100.0%) | 0 (0.0%) |
| 75 Years and older | 406 (100.0%) | 0 (0.0%) |
| Total | 9,671 (94.9%) | 515 (5.1%) |
Health Insurance Coverage by Citizenship Status in Claymont
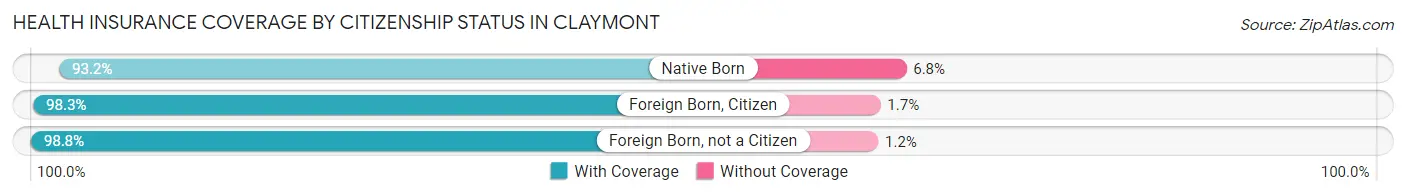
| Citizenship Status | With Coverage | Without Coverage |
| Native Born | 687 (93.2%) | 50 (6.8%) |
| Foreign Born, Citizen | 1,219 (98.3%) | 21 (1.7%) |
| Foreign Born, not a Citizen | 953 (98.8%) | 12 (1.2%) |
Health Insurance Coverage by Household Income in Claymont
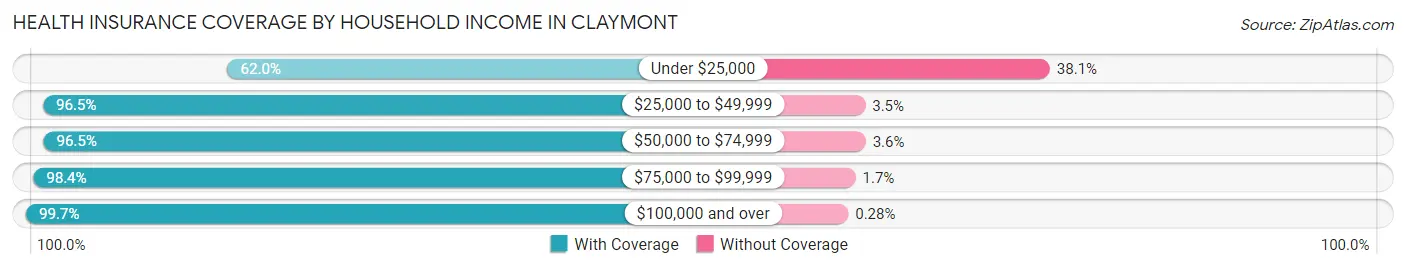
| Household Income | With Coverage | Without Coverage |
| Under $25,000 | 586 (62.0%) | 360 (38.1%) |
| $25,000 to $49,999 | 1,617 (96.5%) | 58 (3.5%) |
| $50,000 to $74,999 | 1,737 (96.5%) | 64 (3.5%) |
| $75,000 to $99,999 | 1,071 (98.4%) | 18 (1.7%) |
| $100,000 and over | 4,653 (99.7%) | 13 (0.3%) |
Public vs Private Health Insurance Coverage by Age in Claymont
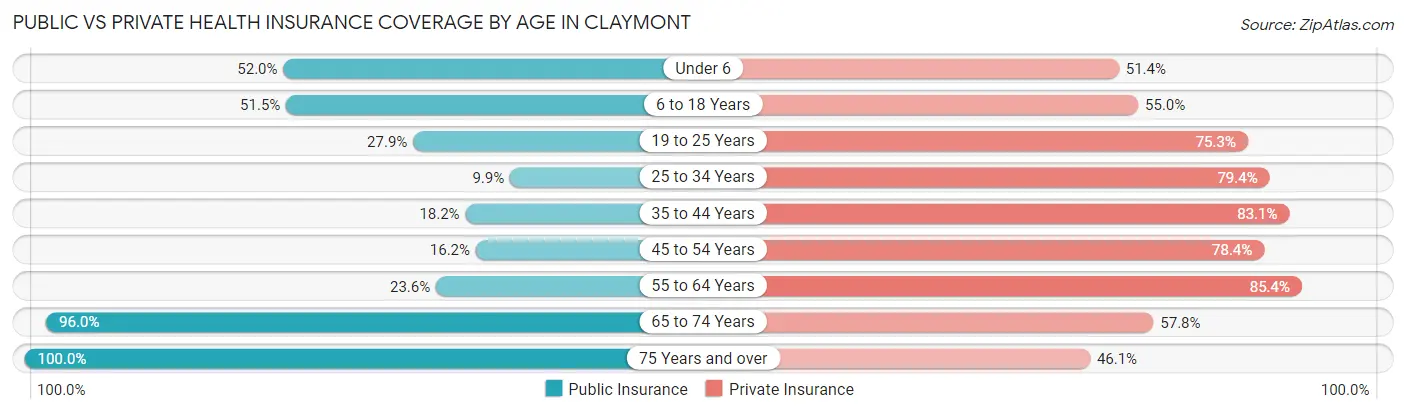
| Age Bracket | Public Insurance | Private Insurance |
| Under 6 | 383 (52.0%) | 379 (51.4%) |
| 6 to 18 Years | 638 (51.4%) | 682 (55.0%) |
| 19 to 25 Years | 269 (27.9%) | 727 (75.3%) |
| 25 to 34 Years | 180 (9.9%) | 1,444 (79.4%) |
| 35 to 44 Years | 224 (18.2%) | 1,024 (83.1%) |
| 45 to 54 Years | 226 (16.2%) | 1,091 (78.4%) |
| 55 to 64 Years | 294 (23.6%) | 1,062 (85.4%) |
| 65 to 74 Years | 1,104 (96.0%) | 665 (57.8%) |
| 75 Years and over | 406 (100.0%) | 187 (46.1%) |
| Total | 3,724 (36.6%) | 7,261 (71.3%) |
Disability Status by Sex by Age in Claymont
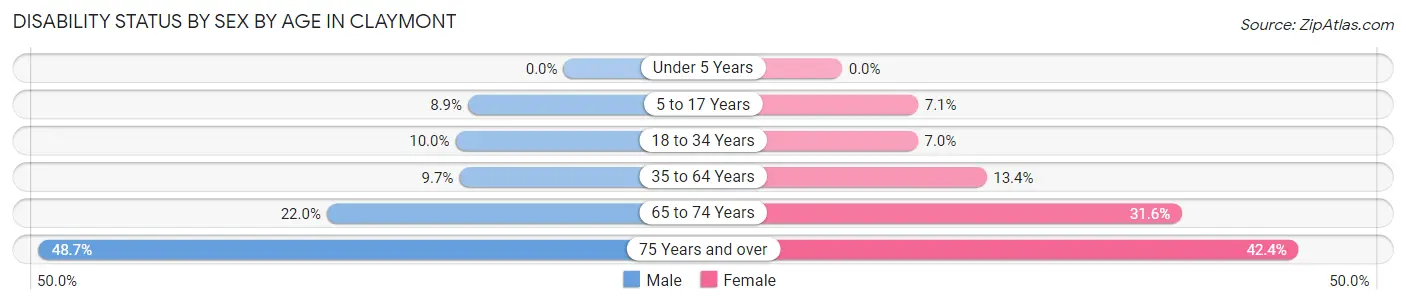
| Age Bracket | Male | Female |
| Under 5 Years | 0 (0.0%) | 0 (0.0%) |
| 5 to 17 Years | 69 (8.9%) | 38 (7.0%) |
| 18 to 34 Years | 151 (10.0%) | 99 (7.0%) |
| 35 to 64 Years | 191 (9.7%) | 254 (13.4%) |
| 65 to 74 Years | 103 (22.0%) | 215 (31.6%) |
| 75 Years and over | 92 (48.7%) | 92 (42.4%) |
Disability Class by Sex by Age in Claymont
Disability Class: Hearing Difficulty
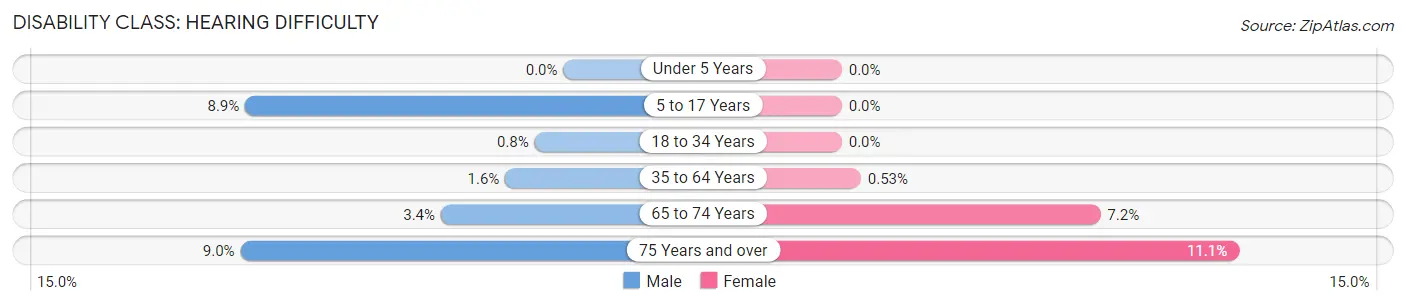
| Age Bracket | Male | Female |
| Under 5 Years | 0 (0.0%) | 0 (0.0%) |
| 5 to 17 Years | 69 (8.9%) | 0 (0.0%) |
| 18 to 34 Years | 12 (0.8%) | 0 (0.0%) |
| 35 to 64 Years | 32 (1.6%) | 10 (0.5%) |
| 65 to 74 Years | 16 (3.4%) | 49 (7.2%) |
| 75 Years and over | 17 (9.0%) | 24 (11.1%) |
Disability Class: Vision Difficulty
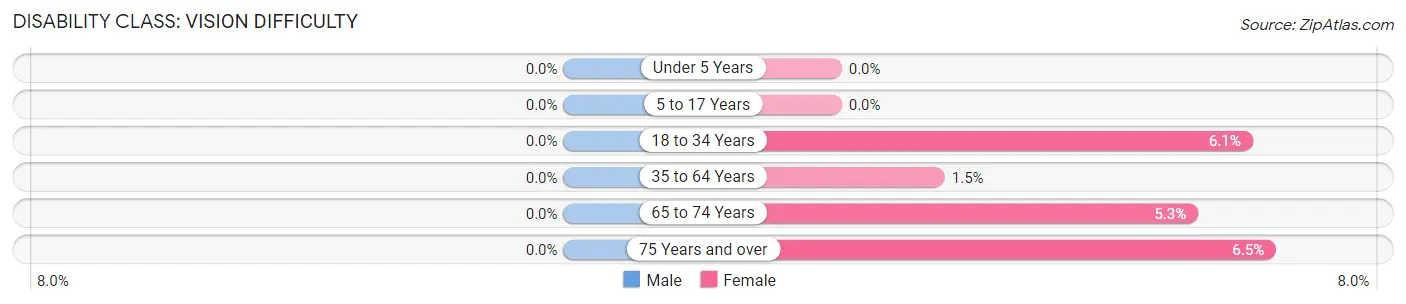
| Age Bracket | Male | Female |
| Under 5 Years | 0 (0.0%) | 0 (0.0%) |
| 5 to 17 Years | 0 (0.0%) | 0 (0.0%) |
| 18 to 34 Years | 0 (0.0%) | 86 (6.1%) |
| 35 to 64 Years | 0 (0.0%) | 29 (1.5%) |
| 65 to 74 Years | 0 (0.0%) | 36 (5.3%) |
| 75 Years and over | 0 (0.0%) | 14 (6.5%) |
Disability Class: Cognitive Difficulty
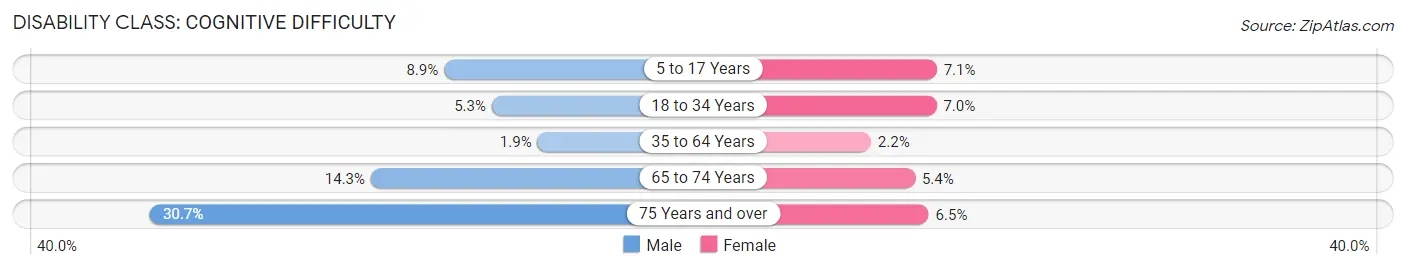
| Age Bracket | Male | Female |
| 5 to 17 Years | 69 (8.9%) | 38 (7.0%) |
| 18 to 34 Years | 80 (5.3%) | 99 (7.0%) |
| 35 to 64 Years | 38 (1.9%) | 41 (2.2%) |
| 65 to 74 Years | 67 (14.3%) | 37 (5.4%) |
| 75 Years and over | 58 (30.7%) | 14 (6.5%) |
Disability Class: Ambulatory Difficulty
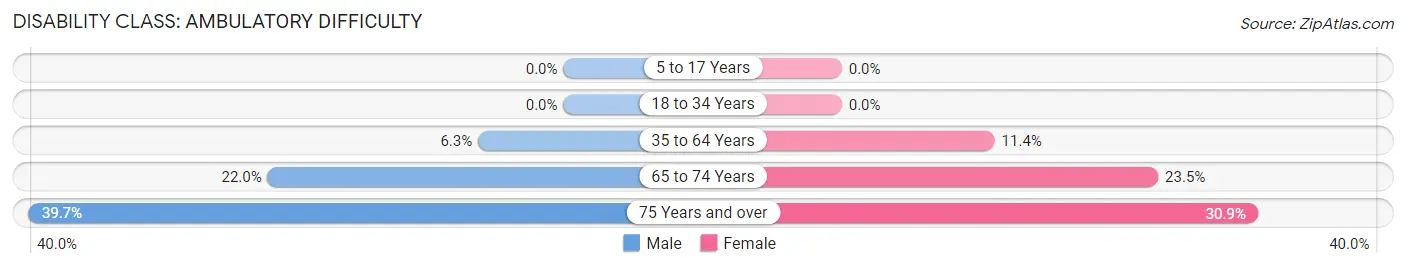
| Age Bracket | Male | Female |
| 5 to 17 Years | 0 (0.0%) | 0 (0.0%) |
| 18 to 34 Years | 0 (0.0%) | 0 (0.0%) |
| 35 to 64 Years | 125 (6.3%) | 215 (11.4%) |
| 65 to 74 Years | 103 (22.0%) | 160 (23.5%) |
| 75 Years and over | 75 (39.7%) | 67 (30.9%) |
Disability Class: Self-Care Difficulty
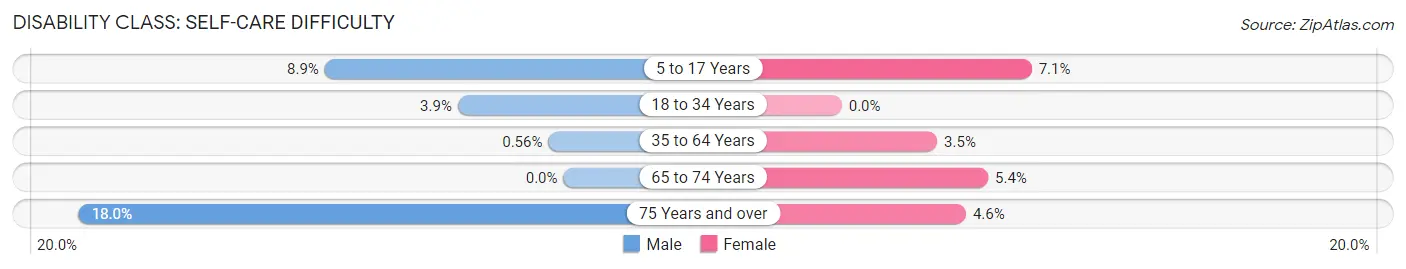
| Age Bracket | Male | Female |
| 5 to 17 Years | 69 (8.9%) | 38 (7.0%) |
| 18 to 34 Years | 59 (3.9%) | 0 (0.0%) |
| 35 to 64 Years | 11 (0.6%) | 67 (3.5%) |
| 65 to 74 Years | 0 (0.0%) | 37 (5.4%) |
| 75 Years and over | 34 (18.0%) | 10 (4.6%) |
Technology Access in Claymont
Computing Device Access in Claymont
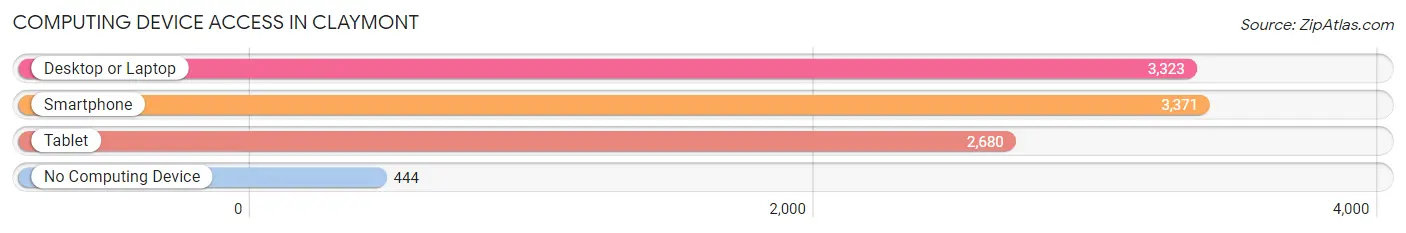
| Device Type | # Households | % Households |
| Desktop or Laptop | 3,323 | 79.6% |
| Smartphone | 3,371 | 80.8% |
| Tablet | 2,680 | 64.2% |
| No Computing Device | 444 | 10.6% |
| Total | 4,174 | 100.0% |
Internet Access in Claymont
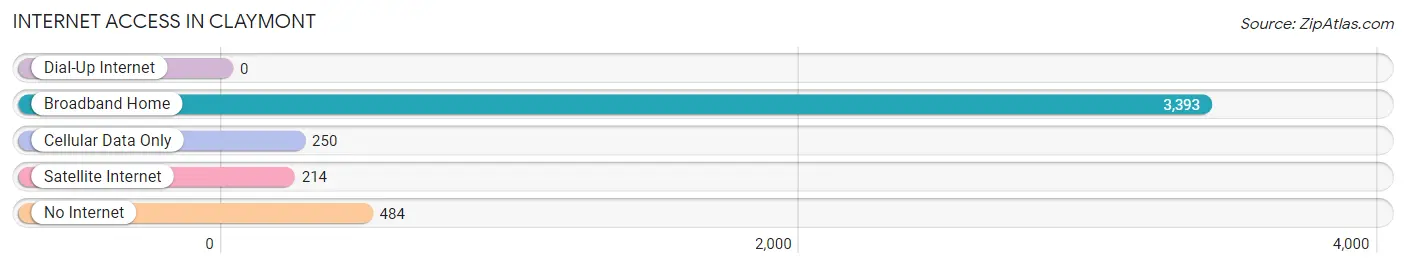
| Internet Type | # Households | % Households |
| Dial-Up Internet | 0 | 0.0% |
| Broadband Home | 3,393 | 81.3% |
| Cellular Data Only | 250 | 6.0% |
| Satellite Internet | 214 | 5.1% |
| No Internet | 484 | 11.6% |
| Total | 4,174 | 100.0% |
Claymont Summary
Claymont is a census-designated place (CDP) located in New Castle County, Delaware, United States. It is located along the Delaware River, just south of Wilmington. The population was 8,253 at the 2010 census.
History
Claymont was first settled in 1680 by Swedish and Finnish settlers. The area was originally known as "New Sweden" and was part of the Dutch colony of New Netherland. In 1682, the area was taken over by the English and renamed "Claymont". The name is derived from the clay deposits found in the area.
In the late 1700s, Claymont was a thriving agricultural community. The area was known for its production of wheat, corn, and other grains. In the early 1800s, the area began to industrialize and the population began to grow. The first railroad line in Delaware was built in Claymont in 1837.
The area continued to grow and by the late 1800s, Claymont was a bustling industrial town. The area was home to several factories, including a steel mill, a paper mill, and a brickyard. The population of Claymont peaked in the early 1900s, with over 10,000 residents.
Geography
Claymont is located at 39°48'17" North, 75°31'17" West (39.804, -75.521). According to the United States Census Bureau, the CDP has a total area of 4.2 square miles (10.8 km2), all of it land.
Economy
Claymont is home to several large employers, including the DuPont Company, AstraZeneca, and the Claymont Steel Company. The area is also home to several small businesses, including restaurants, retail stores, and professional services.
Demographics
As of the 2010 census, there were 8,253 people, 3,541 households, and 2,092 families residing in the CDP. The population density was 1,958.3 people per square mile (756.2/km2). There were 3,845 housing units at an average density of 917.2 per square mile (354.2/km2). The racial makeup of the CDP was 79.2% White, 11.7% African American, 0.3% Native American, 2.2% Asian, 0.1% Pacific Islander, 4.2% from other races, and 2.4% from two or more races. Hispanic or Latino of any race were 8.7% of the population.
There were 3,541 households, out of which 28.2% had children under the age of 18 living with them, 38.2% were married couples living together, 15.7% had a female householder with no husband present, and 40.2% were non-families. 33.2% of all households were made up of individuals, and 11.2% had someone living alone who was 65 years of age or older. The average household size was 2.32 and the average family size was 2.97.
In the CDP, the population was spread out, with 23.2% under the age of 18, 8.2% from 18 to 24, 30.2% from 25 to 44, 24.2% from 45 to 64, and 14.2% who were 65 years of age or older. The median age was 37 years. For every 100 females, there were 93.2 males. For every 100 females age 18 and over, there were 90.2 males.
The median income for a household in the CDP was $41,944, and the median income for a family was $50,902. Males had a median income of $37,917 versus $30,917 for females. The per capita income for the CDP was $20,945. About 8.2% of families and 10.2% of the population were below the poverty line, including 14.2% of those under age 18 and 8.2% of those age 65 or over.
Common Questions
What is Per Capita Income in Claymont?
Per Capita income in Claymont is $40,226.
What is the Median Family Income in Claymont?
Median Family Income in Claymont is $99,440.
What is the Median Household income in Claymont?
Median Household Income in Claymont is $72,840.
What is Income or Wage Gap in Claymont?
Income or Wage Gap in Claymont is 20.4%.
Women in Claymont earn 79.6 cents for every dollar earned by a man.
What is Inequality or Gini Index in Claymont?
Inequality or Gini Index in Claymont is 0.42.
What is the Total Population of Claymont?
Total Population of Claymont is 10,191.
What is the Total Male Population of Claymont?
Total Male Population of Claymont is 5,205.
What is the Total Female Population of Claymont?
Total Female Population of Claymont is 4,986.
What is the Ratio of Males per 100 Females in Claymont?
There are 104.39 Males per 100 Females in Claymont.
What is the Ratio of Females per 100 Males in Claymont?
There are 95.79 Females per 100 Males in Claymont.
What is the Median Population Age in Claymont?
Median Population Age in Claymont is 37.2 Years.
What is the Average Family Size in Claymont
Average Family Size in Claymont is 3.2 People.
What is the Average Household Size in Claymont
Average Household Size in Claymont is 2.4 People.
How Large is the Labor Force in Claymont?
There are 5,885 People in the Labor Forcein in Claymont.
What is the Percentage of People in the Labor Force in Claymont?
69.2% of People are in the Labor Force in Claymont.
What is the Unemployment Rate in Claymont?
Unemployment Rate in Claymont is 3.9%.