Limestone Creek, FL Map & Demographics
Limestone Creek Map
Limestone Creek Overview
$25,476
PER CAPITA INCOME
$64,135
AVG FAMILY INCOME
$85,691
AVG HOUSEHOLD INCOME
3.8%
WAGE / INCOME GAP [ % ]
96.2¢/ $1
WAGE / INCOME GAP [ $ ]
0.30
INEQUALITY / GINI INDEX
1,460
TOTAL POPULATION
966
MALE POPULATION
494
FEMALE POPULATION
195.55
MALES / 100 FEMALES
51.14
FEMALES / 100 MALES
39.7
MEDIAN AGE
4.8
AVG FAMILY SIZE
4.2
AVG HOUSEHOLD SIZE
1,049
LABOR FORCE [ PEOPLE ]
82.7%
PERCENT IN LABOR FORCE
5.1%
UNEMPLOYMENT RATE
Income in Limestone Creek
Income Overview in Limestone Creek
Per Capita Income in Limestone Creek is $25,476, while median incomes of families and households are $64,135 and $85,691 respectively.
| Characteristic | Number | Measure |
| Per Capita Income | 1,460 | $25,476 |
| Median Family Income | 200 | $64,135 |
| Mean Family Income | 200 | $84,654 |
| Median Household Income | 344 | $85,691 |
| Mean Household Income | 344 | $91,257 |
| Income Deficit | 200 | $0 |
| Wage / Income Gap (%) | 1,460 | 3.77% |
| Wage / Income Gap ($) | 1,460 | 96.23¢ per $1 |
| Gini / Inequality Index | 1,460 | 0.30 |
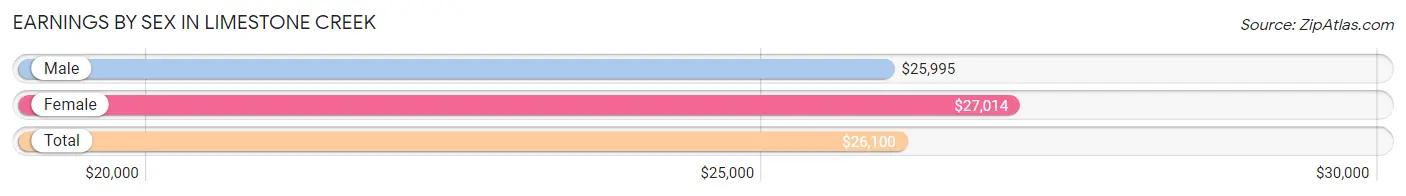
Earnings by Sex in Limestone Creek
Average Earnings in Limestone Creek are $26,100, $25,995 for men and $27,014 for women, a difference of 3.8%.
| Sex | Number | Average Earnings |
| Male | 797 (77.2%) | $25,995 |
| Female | 235 (22.8%) | $27,014 |
| Total | 1,032 (100.0%) | $26,100 |
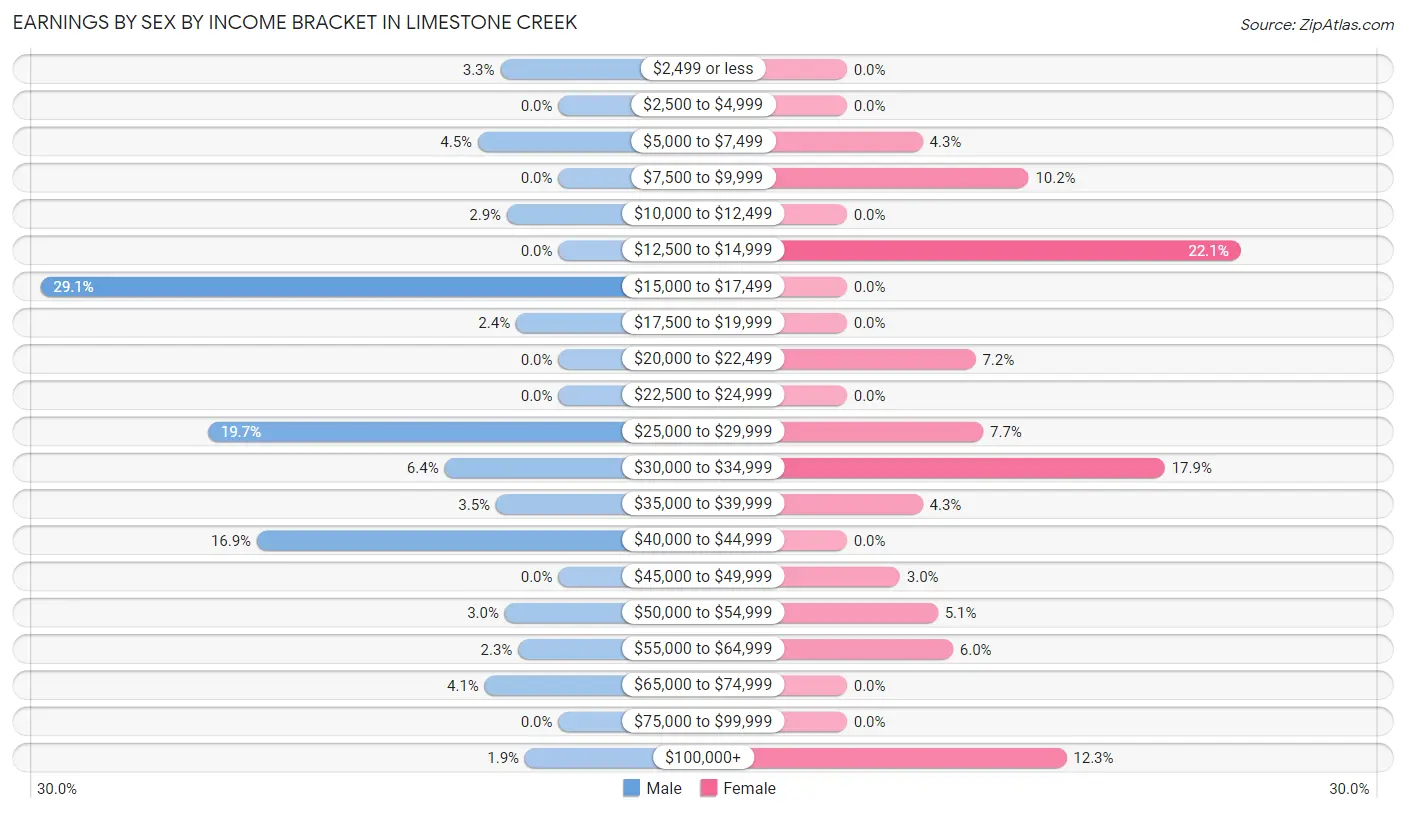
Earnings by Sex by Income Bracket in Limestone Creek
The most common earnings brackets in Limestone Creek are $15,000 to $17,499 for men (232 | 29.1%) and $12,500 to $14,999 for women (52 | 22.1%).
| Income | Male | Female |
| $2,499 or less | 26 (3.3%) | 0 (0.0%) |
| $2,500 to $4,999 | 0 (0.0%) | 0 (0.0%) |
| $5,000 to $7,499 | 36 (4.5%) | 10 (4.3%) |
| $7,500 to $9,999 | 0 (0.0%) | 24 (10.2%) |
| $10,000 to $12,499 | 23 (2.9%) | 0 (0.0%) |
| $12,500 to $14,999 | 0 (0.0%) | 52 (22.1%) |
| $15,000 to $17,499 | 232 (29.1%) | 0 (0.0%) |
| $17,500 to $19,999 | 19 (2.4%) | 0 (0.0%) |
| $20,000 to $22,499 | 0 (0.0%) | 17 (7.2%) |
| $22,500 to $24,999 | 0 (0.0%) | 0 (0.0%) |
| $25,000 to $29,999 | 157 (19.7%) | 18 (7.7%) |
| $30,000 to $34,999 | 51 (6.4%) | 42 (17.9%) |
| $35,000 to $39,999 | 28 (3.5%) | 10 (4.3%) |
| $40,000 to $44,999 | 135 (16.9%) | 0 (0.0%) |
| $45,000 to $49,999 | 0 (0.0%) | 7 (3.0%) |
| $50,000 to $54,999 | 24 (3.0%) | 12 (5.1%) |
| $55,000 to $64,999 | 18 (2.3%) | 14 (6.0%) |
| $65,000 to $74,999 | 33 (4.1%) | 0 (0.0%) |
| $75,000 to $99,999 | 0 (0.0%) | 0 (0.0%) |
| $100,000+ | 15 (1.9%) | 29 (12.3%) |
| Total | 797 (100.0%) | 235 (100.0%) |
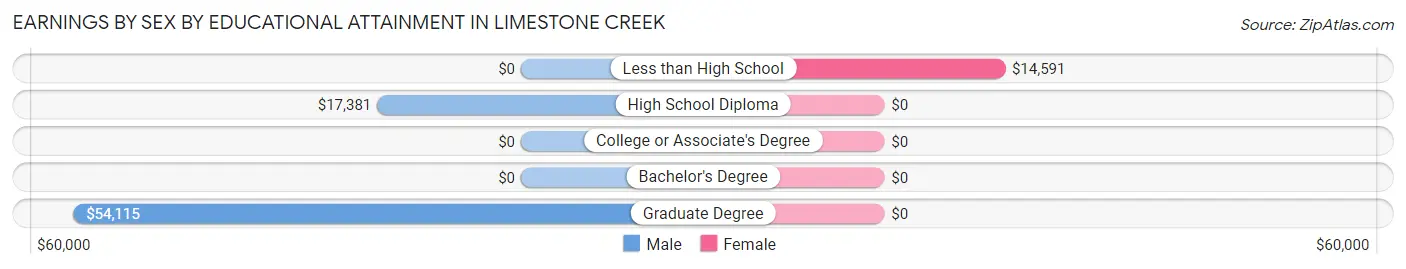
Earnings by Sex by Educational Attainment in Limestone Creek
Average earnings in Limestone Creek are $26,091 for men and $33,125 for women, a difference of 21.2%. Men with an educational attainment of graduate degree enjoy the highest average annual earnings of $54,115, while those with high school diploma education earn the least with $17,381. Women with an educational attainment of less than high school earn the most with the average annual earnings of $14,591, while those with less than high school education have the smallest earnings of $14,591.
| Educational Attainment | Male Income | Female Income |
| Less than High School | - | - |
| High School Diploma | $17,381 | $0 |
| College or Associate's Degree | - | - |
| Bachelor's Degree | - | - |
| Graduate Degree | $54,115 | $0 |
| Total | $26,091 | $33,125 |
Family Income in Limestone Creek
Family Income Brackets in Limestone Creek
According to the Limestone Creek family income data, there are 64 families falling into the $50,000 to $74,999 income range, which is the most common income bracket and makes up 32.0% of all families.
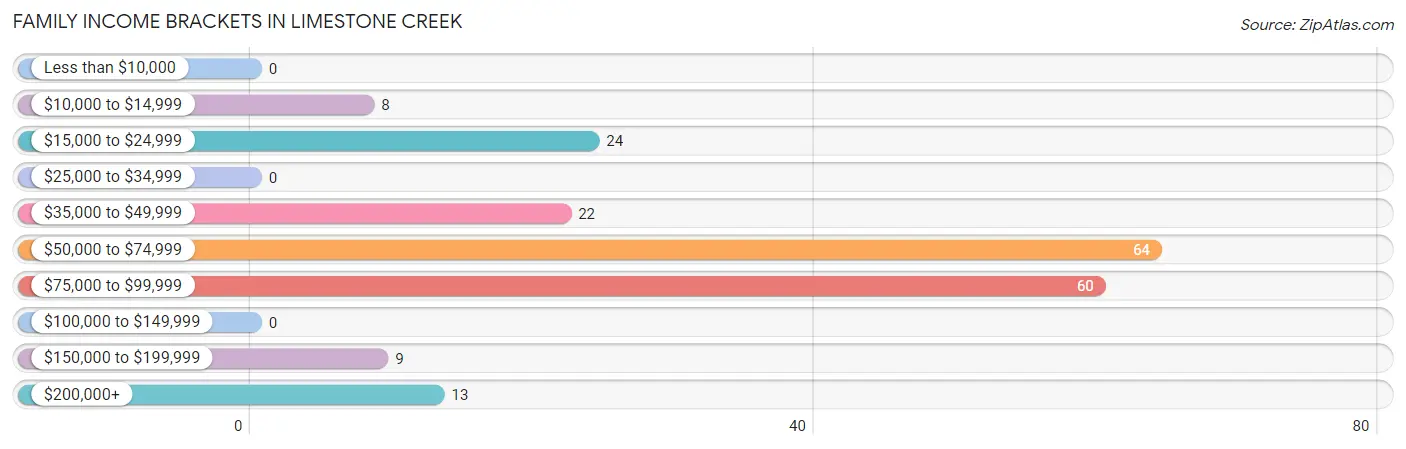
| Income Bracket | # Families | % Families |
| Less than $10,000 | 0 | 0.0% |
| $10,000 to $14,999 | 8 | 4.0% |
| $15,000 to $24,999 | 24 | 12.0% |
| $25,000 to $34,999 | 0 | 0.0% |
| $35,000 to $49,999 | 22 | 11.0% |
| $50,000 to $74,999 | 64 | 32.0% |
| $75,000 to $99,999 | 60 | 30.0% |
| $100,000 to $149,999 | 0 | 0.0% |
| $150,000 to $199,999 | 9 | 4.5% |
| $200,000+ | 13 | 6.5% |
Family Income by Famaliy Size in Limestone Creek
3-person families (83 | 41.5%) account for the highest median family income in Limestone Creek with $63,630 per family, while 3-person families (83 | 41.5%) have the highest median income of $21,210 per family member.
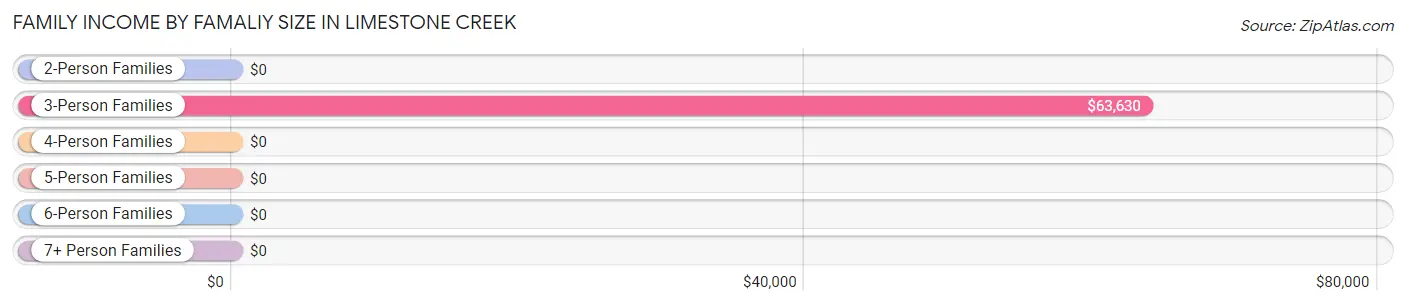
| Income Bracket | # Families | Median Income |
| 2-Person Families | 23 (11.5%) | $0 |
| 3-Person Families | 83 (41.5%) | $63,630 |
| 4-Person Families | 41 (20.5%) | $0 |
| 5-Person Families | 24 (12.0%) | $0 |
| 6-Person Families | 9 (4.5%) | $0 |
| 7+ Person Families | 20 (10.0%) | $0 |
| Total | 200 (100.0%) | $64,135 |
Family Income by Number of Earners in Limestone Creek
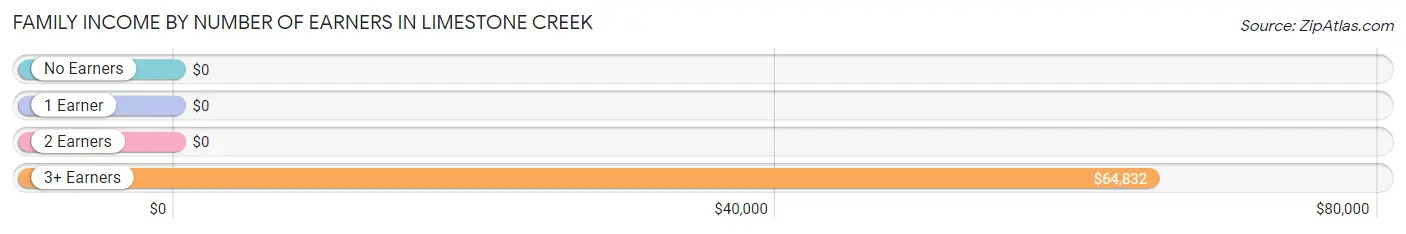
| Number of Earners | # Families | Median Income |
| No Earners | 20 (10.0%) | $0 |
| 1 Earner | 47 (23.5%) | $0 |
| 2 Earners | 36 (18.0%) | $0 |
| 3+ Earners | 97 (48.5%) | $64,832 |
| Total | 200 (100.0%) | $64,135 |
Household Income in Limestone Creek
Household Income Brackets in Limestone Creek
With 163 households falling in the category, the $75,000 to $99,999 income range is the most frequent in Limestone Creek, accounting for 47.4% of all households.
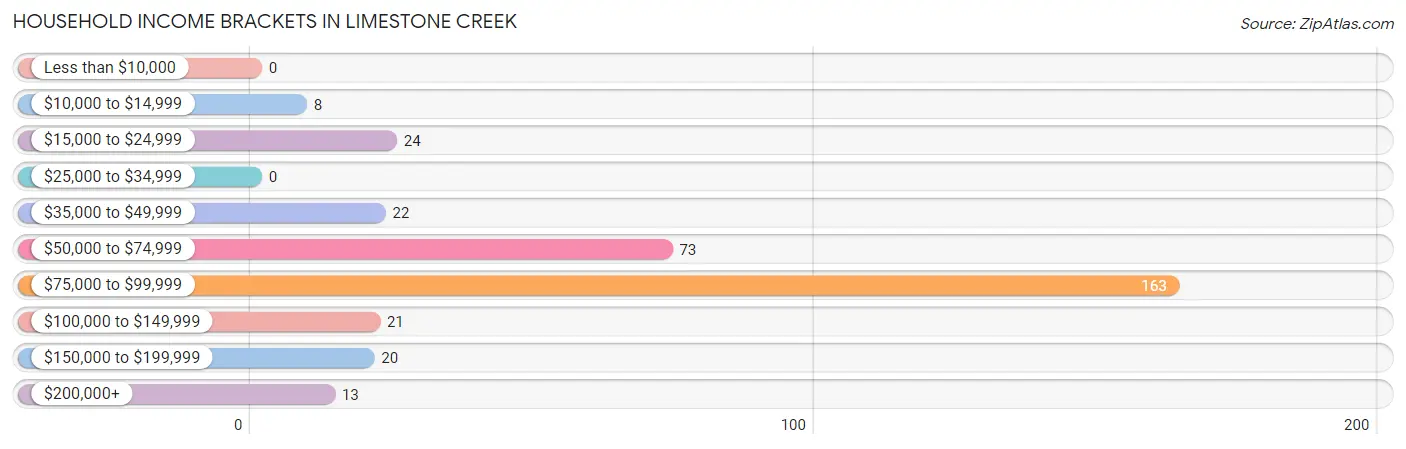
| Income Bracket | # Households | % Households |
| Less than $10,000 | 0 | 0.0% |
| $10,000 to $14,999 | 8 | 2.3% |
| $15,000 to $24,999 | 24 | 7.0% |
| $25,000 to $34,999 | 0 | 0.0% |
| $35,000 to $49,999 | 22 | 6.4% |
| $50,000 to $74,999 | 73 | 21.2% |
| $75,000 to $99,999 | 163 | 47.4% |
| $100,000 to $149,999 | 21 | 6.1% |
| $150,000 to $199,999 | 20 | 5.8% |
| $200,000+ | 13 | 3.8% |
Household Income by Householder Age in Limestone Creek
The median household income in Limestone Creek is $85,691, with the highest median household income of $86,044 found in the 25 to 44 years age bracket for the primary householder. A total of 148 households (43.0%) fall into this category.
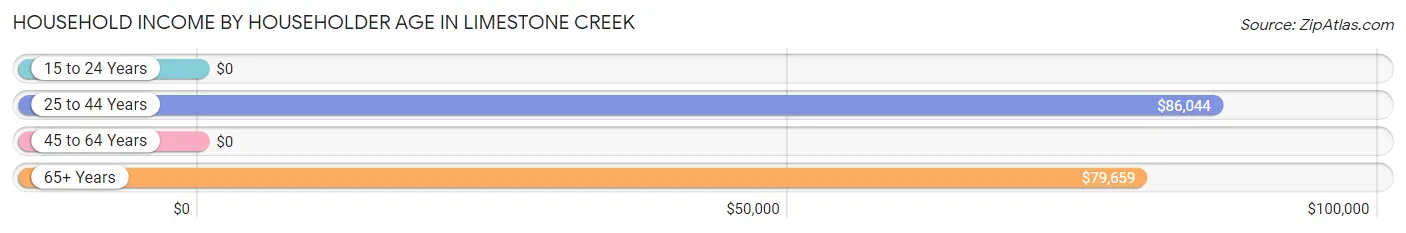
| Income Bracket | # Households | Median Income |
| 15 to 24 Years | 0 (0.0%) | $0 |
| 25 to 44 Years | 148 (43.0%) | $86,044 |
| 45 to 64 Years | 153 (44.5%) | $0 |
| 65+ Years | 43 (12.5%) | $79,659 |
| Total | 344 (100.0%) | $85,691 |
Poverty in Limestone Creek
Income Below Poverty by Sex and Age in Limestone Creek
With 10.5% poverty level for males and 13.2% for females among the residents of Limestone Creek, 6 to 11 year old males and 18 to 24 year old females are the most vulnerable to poverty, with 25 males (64.1%) and 33 females (41.8%) in their respective age groups living below the poverty level.
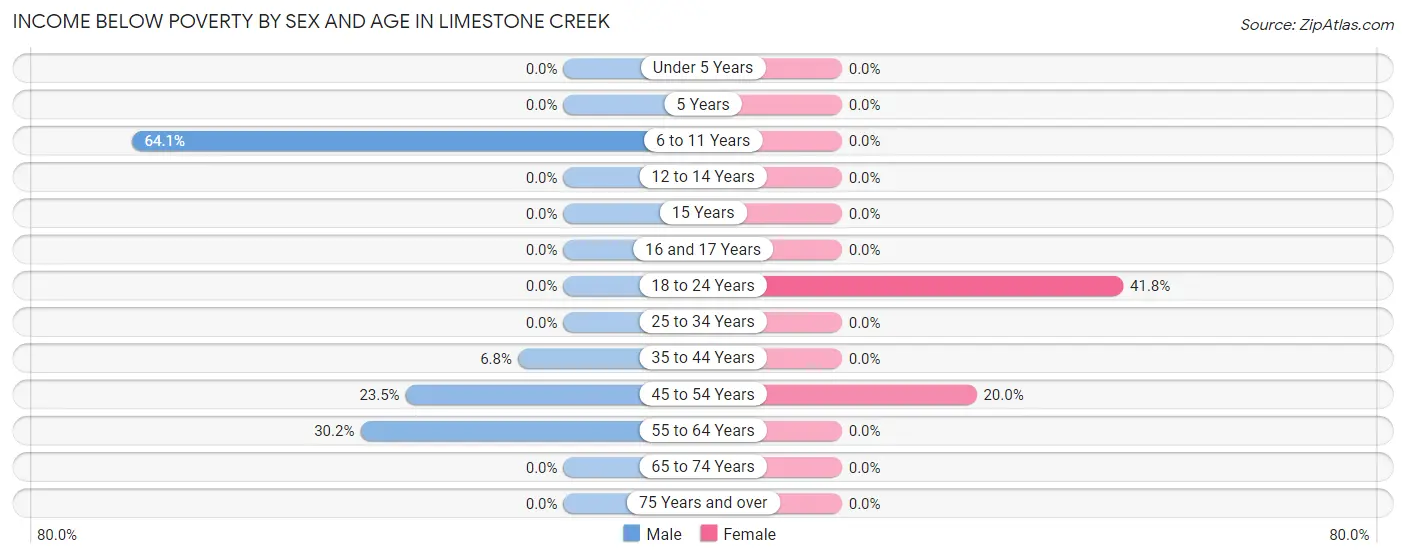
| Age Bracket | Male | Female |
| Under 5 Years | 0 (0.0%) | 0 (0.0%) |
| 5 Years | 0 (0.0%) | 0 (0.0%) |
| 6 to 11 Years | 25 (64.1%) | 0 (0.0%) |
| 12 to 14 Years | 0 (0.0%) | 0 (0.0%) |
| 15 Years | 0 (0.0%) | 0 (0.0%) |
| 16 and 17 Years | 0 (0.0%) | 0 (0.0%) |
| 18 to 24 Years | 0 (0.0%) | 33 (41.8%) |
| 25 to 34 Years | 0 (0.0%) | 0 (0.0%) |
| 35 to 44 Years | 23 (6.8%) | 0 (0.0%) |
| 45 to 54 Years | 34 (23.4%) | 32 (20.0%) |
| 55 to 64 Years | 19 (30.2%) | 0 (0.0%) |
| 65 to 74 Years | 0 (0.0%) | 0 (0.0%) |
| 75 Years and over | 0 (0.0%) | 0 (0.0%) |
| Total | 101 (10.5%) | 65 (13.2%) |
Income Above Poverty by Sex and Age in Limestone Creek
According to the poverty statistics in Limestone Creek, males aged under 5 years and females aged under 5 years are the age groups that are most secure financially, with 100.0% of males and 100.0% of females in these age groups living above the poverty line.
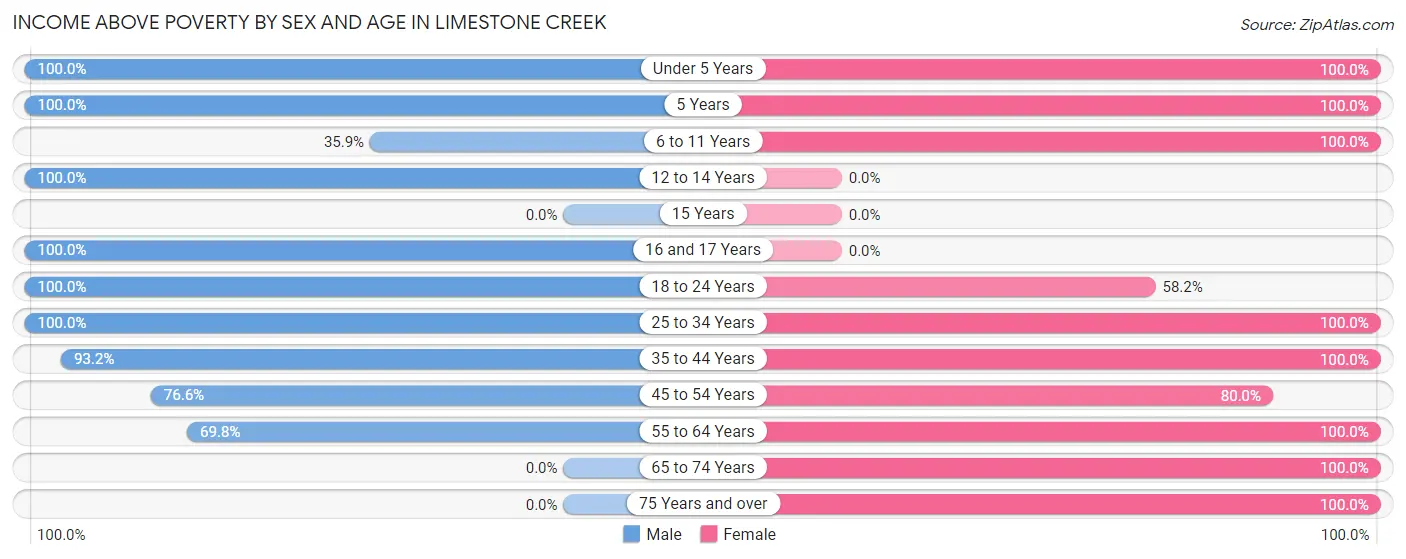
| Age Bracket | Male | Female |
| Under 5 Years | 30 (100.0%) | 8 (100.0%) |
| 5 Years | 11 (100.0%) | 27 (100.0%) |
| 6 to 11 Years | 14 (35.9%) | 48 (100.0%) |
| 12 to 14 Years | 28 (100.0%) | 0 (0.0%) |
| 15 Years | 0 (0.0%) | 0 (0.0%) |
| 16 and 17 Years | 11 (100.0%) | 0 (0.0%) |
| 18 to 24 Years | 28 (100.0%) | 46 (58.2%) |
| 25 to 34 Years | 271 (100.0%) | 43 (100.0%) |
| 35 to 44 Years | 317 (93.2%) | 38 (100.0%) |
| 45 to 54 Years | 111 (76.5%) | 128 (80.0%) |
| 55 to 64 Years | 44 (69.8%) | 30 (100.0%) |
| 65 to 74 Years | 0 (0.0%) | 12 (100.0%) |
| 75 Years and over | 0 (0.0%) | 49 (100.0%) |
| Total | 865 (89.5%) | 429 (86.8%) |
Income Below Poverty Among Married-Couple Families in Limestone Creek
The poverty statistics for married-couple families in Limestone Creek show that 23.4% or 32 of the total 137 families live below the poverty line. Families with 1 or 2 children have the highest poverty rate of 82.8%, comprising of 24 families. On the other hand, families with 3 or 4 children have the lowest poverty rate of 0.0%, which includes 0 families.
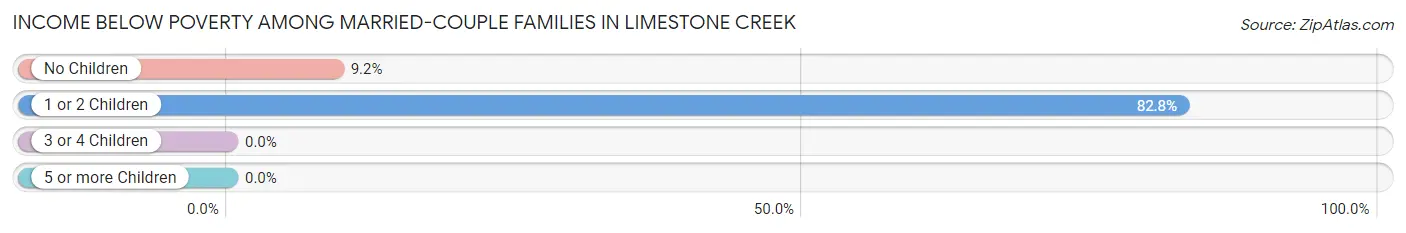
| Children | Above Poverty | Below Poverty |
| No Children | 79 (90.8%) | 8 (9.2%) |
| 1 or 2 Children | 5 (17.2%) | 24 (82.8%) |
| 3 or 4 Children | 21 (100.0%) | 0 (0.0%) |
| 5 or more Children | 0 (0.0%) | 0 (0.0%) |
| Total | 105 (76.6%) | 32 (23.4%) |
Income Below Poverty Among Single-Parent Households in Limestone Creek
| Children | Single Father | Single Mother |
| No Children | 0 (0.0%) | 0 (0.0%) |
| 1 or 2 Children | 0 (0.0%) | 0 (0.0%) |
| 3 or 4 Children | 0 (0.0%) | 0 (0.0%) |
| 5 or more Children | 0 (0.0%) | 0 (0.0%) |
| Total | 0 (0.0%) | 0 (0.0%) |
Income Below Poverty Among Married-Couple vs Single-Parent Households in Limestone Creek
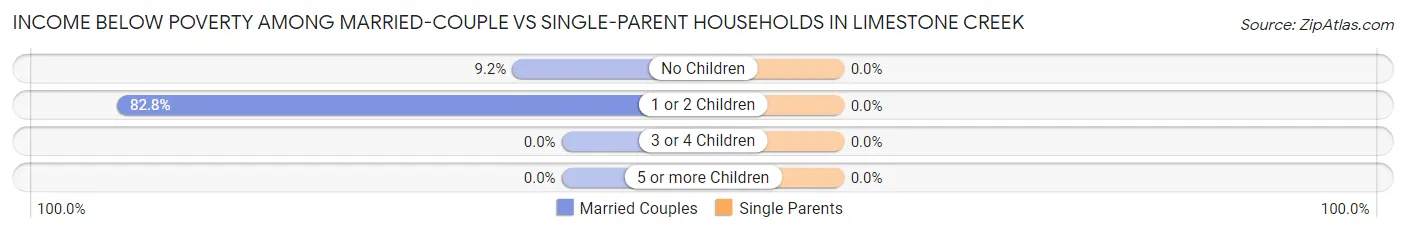
| Children | Married-Couple Families | Single-Parent Households |
| No Children | 8 (9.2%) | 0 (0.0%) |
| 1 or 2 Children | 24 (82.8%) | 0 (0.0%) |
| 3 or 4 Children | 0 (0.0%) | 0 (0.0%) |
| 5 or more Children | 0 (0.0%) | 0 (0.0%) |
| Total | 32 (23.4%) | 0 (0.0%) |
Race in Limestone Creek
The most populous races in Limestone Creek are Two or more Races (610 | 41.8%), Hispanic or Latino (564 | 38.6%), and Black / African American (458 | 31.4%).
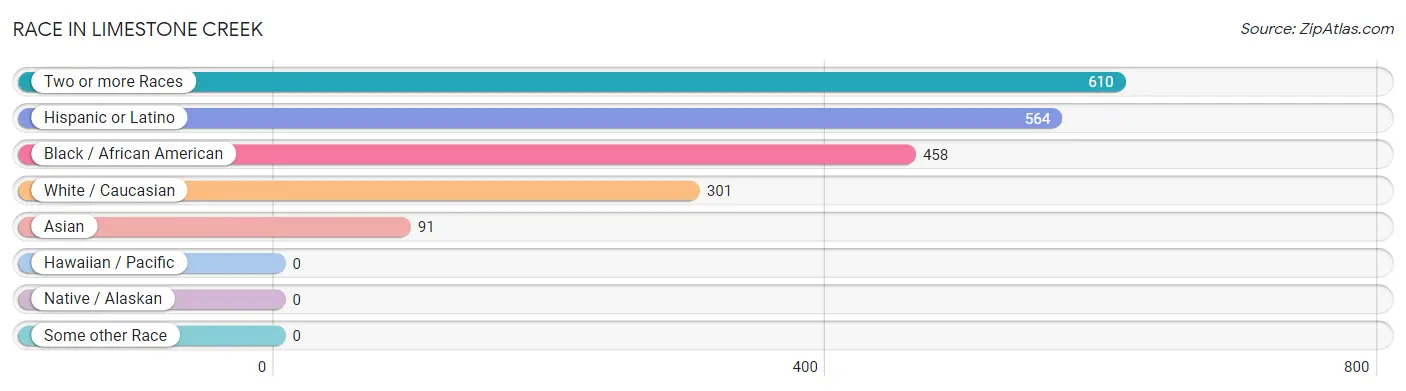
| Race | # Population | % Population |
| Asian | 91 | 6.2% |
| Black / African American | 458 | 31.4% |
| Hawaiian / Pacific | 0 | 0.0% |
| Hispanic or Latino | 564 | 38.6% |
| Native / Alaskan | 0 | 0.0% |
| White / Caucasian | 301 | 20.6% |
| Two or more Races | 610 | 41.8% |
| Some other Race | 0 | 0.0% |
| Total | 1,460 | 100.0% |
Ancestry in Limestone Creek
The most populous ancestries reported in Limestone Creek are Mexican (284 | 19.5%), Central American (280 | 19.2%), Guatemalan (280 | 19.2%), English (151 | 10.3%), and Haitian (143 | 9.8%), together accounting for 77.9% of all Limestone Creek residents.
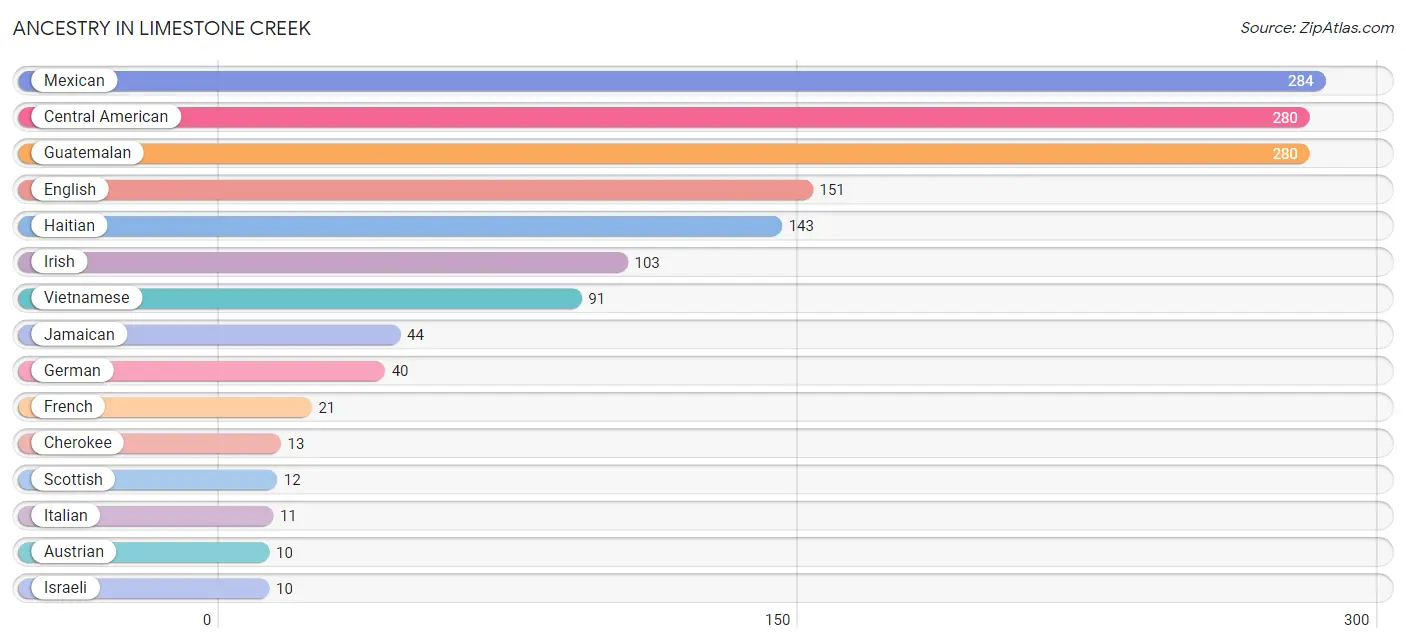
| Ancestry | # Population | % Population |
| Austrian | 10 | 0.7% |
| Central American | 280 | 19.2% |
| Cherokee | 13 | 0.9% |
| English | 151 | 10.3% |
| French | 21 | 1.4% |
| German | 40 | 2.7% |
| Guatemalan | 280 | 19.2% |
| Haitian | 143 | 9.8% |
| Irish | 103 | 7.0% |
| Israeli | 10 | 0.7% |
| Italian | 11 | 0.7% |
| Jamaican | 44 | 3.0% |
| Mexican | 284 | 19.5% |
| Romanian | 7 | 0.5% |
| Scottish | 12 | 0.8% |
| Vietnamese | 91 | 6.2% | View All 16 Rows |
Immigrants in Limestone Creek
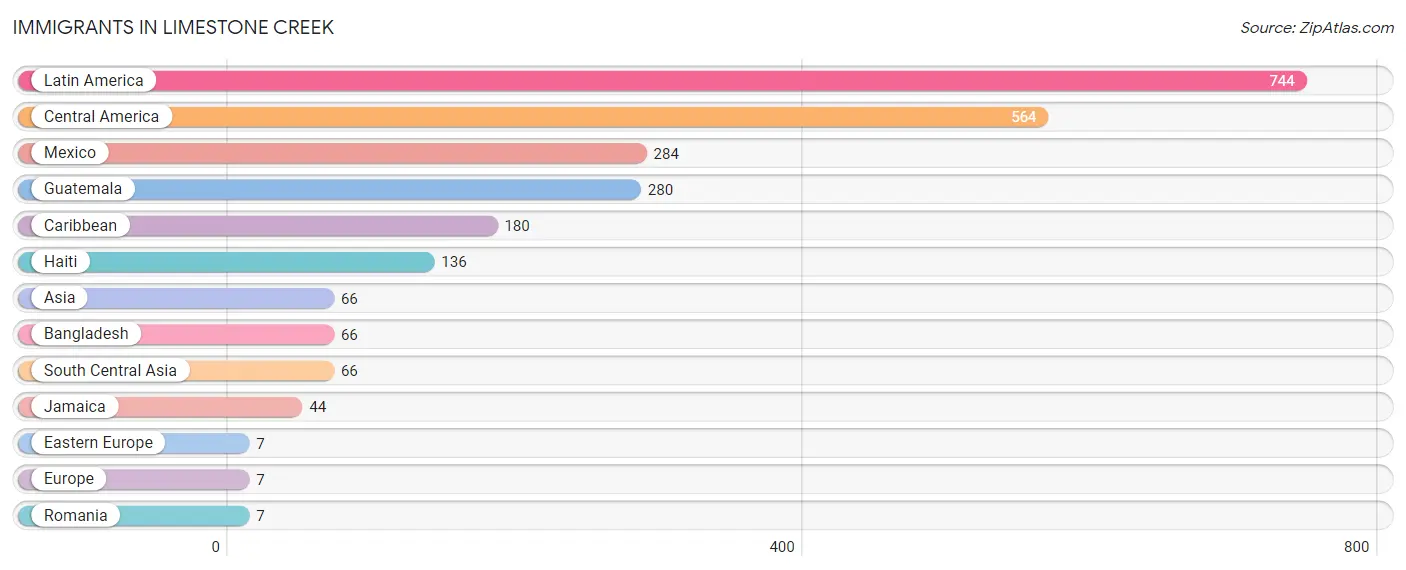
The most numerous immigrant groups reported in Limestone Creek came from Latin America (744 | 51.0%), Central America (564 | 38.6%), Mexico (284 | 19.5%), Guatemala (280 | 19.2%), and Caribbean (180 | 12.3%), together accounting for 140.5% of all Limestone Creek residents.
| Immigration Origin | # Population | % Population |
| Asia | 66 | 4.5% |
| Bangladesh | 66 | 4.5% |
| Caribbean | 180 | 12.3% |
| Central America | 564 | 38.6% |
| Eastern Europe | 7 | 0.5% |
| Europe | 7 | 0.5% |
| Guatemala | 280 | 19.2% |
| Haiti | 136 | 9.3% |
| Jamaica | 44 | 3.0% |
| Latin America | 744 | 51.0% |
| Mexico | 284 | 19.5% |
| Romania | 7 | 0.5% |
| South Central Asia | 66 | 4.5% | View All 13 Rows |
Sex and Age in Limestone Creek
Sex and Age in Limestone Creek
The most populous age groups in Limestone Creek are 30 to 34 Years (235 | 24.3%) for men and 45 to 49 Years (80 | 16.2%) for women.
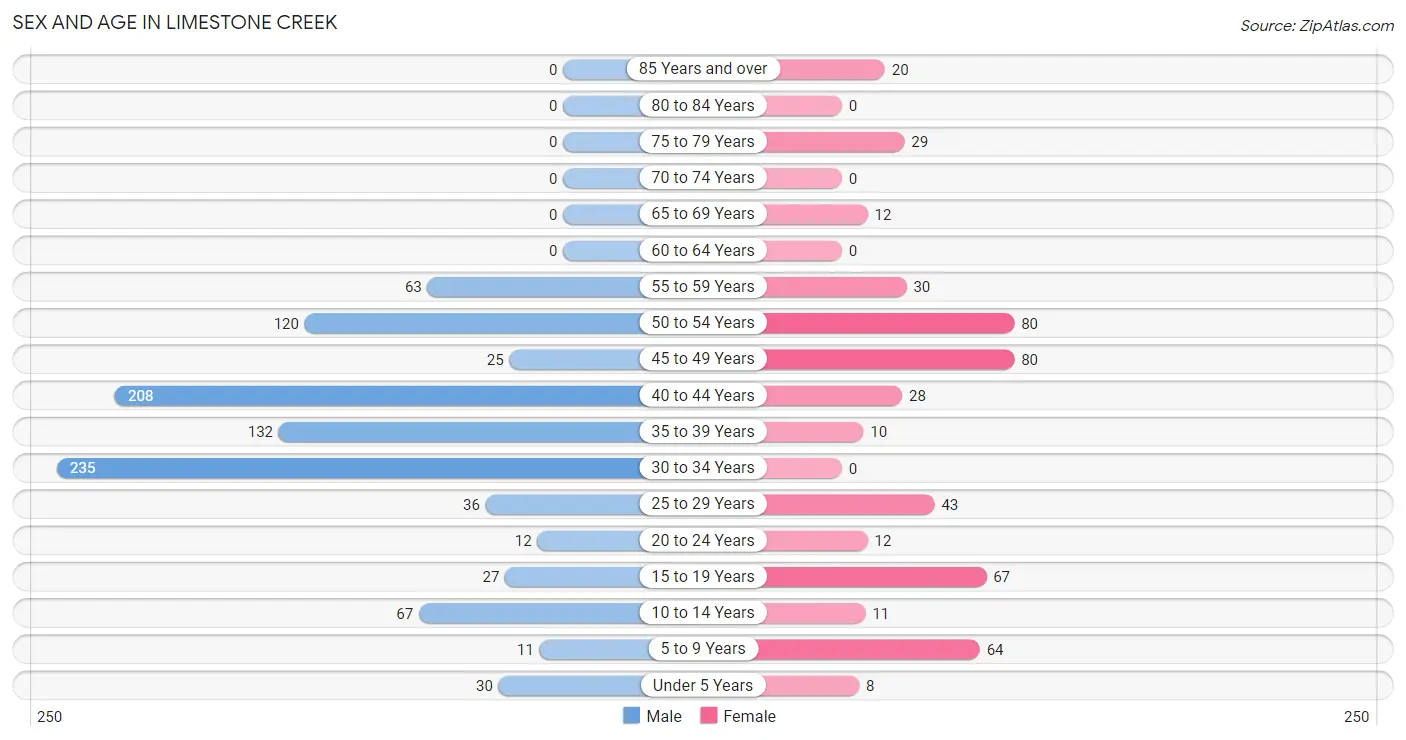
| Age Bracket | Male | Female |
| Under 5 Years | 30 (3.1%) | 8 (1.6%) |
| 5 to 9 Years | 11 (1.1%) | 64 (13.0%) |
| 10 to 14 Years | 67 (6.9%) | 11 (2.2%) |
| 15 to 19 Years | 27 (2.8%) | 67 (13.6%) |
| 20 to 24 Years | 12 (1.2%) | 12 (2.4%) |
| 25 to 29 Years | 36 (3.7%) | 43 (8.7%) |
| 30 to 34 Years | 235 (24.3%) | 0 (0.0%) |
| 35 to 39 Years | 132 (13.7%) | 10 (2.0%) |
| 40 to 44 Years | 208 (21.5%) | 28 (5.7%) |
| 45 to 49 Years | 25 (2.6%) | 80 (16.2%) |
| 50 to 54 Years | 120 (12.4%) | 80 (16.2%) |
| 55 to 59 Years | 63 (6.5%) | 30 (6.1%) |
| 60 to 64 Years | 0 (0.0%) | 0 (0.0%) |
| 65 to 69 Years | 0 (0.0%) | 12 (2.4%) |
| 70 to 74 Years | 0 (0.0%) | 0 (0.0%) |
| 75 to 79 Years | 0 (0.0%) | 29 (5.9%) |
| 80 to 84 Years | 0 (0.0%) | 0 (0.0%) |
| 85 Years and over | 0 (0.0%) | 20 (4.1%) |
| Total | 966 (100.0%) | 494 (100.0%) |
Families and Households in Limestone Creek
Median Family Size in Limestone Creek
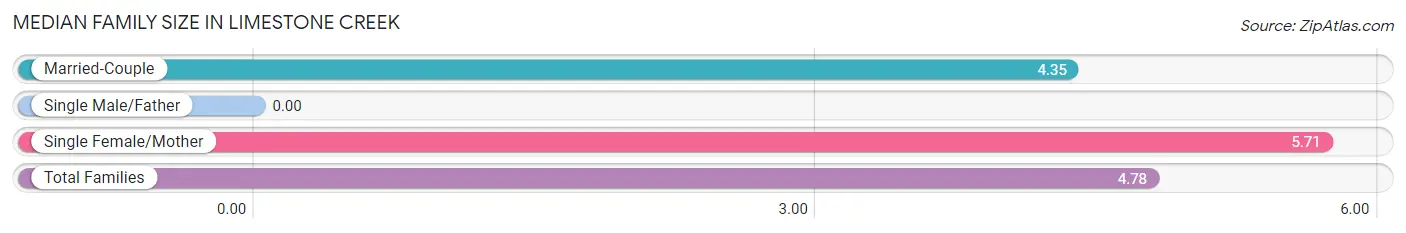
| Family Type | # Families | Family Size |
| Married-Couple | 137 (68.5%) | 4.35 |
| Single Male/Father | 0 (0.0%) | - |
| Single Female/Mother | 63 (31.5%) | 5.71 |
| Total Families | 200 (100.0%) | 4.78 |
Median Household Size in Limestone Creek
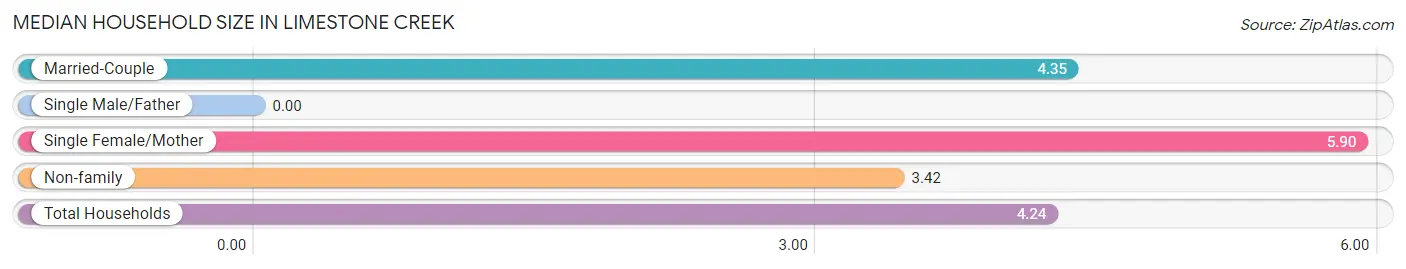
| Household Type | # Households | Household Size |
| Married-Couple | 137 (39.8%) | 4.35 |
| Single Male/Father | 0 (0.0%) | - |
| Single Female/Mother | 63 (18.3%) | 5.90 |
| Non-family | 144 (41.9%) | 3.42 |
| Total Households | 344 (100.0%) | 4.24 |
Household Size by Marriage Status in Limestone Creek
Out of a total of 344 households in Limestone Creek, 200 (58.1%) are family households, while 144 (41.9%) are nonfamily households. The most numerous type of family households are 3-person households, comprising 75, and the most common type of nonfamily households are 3-person households, comprising 114.
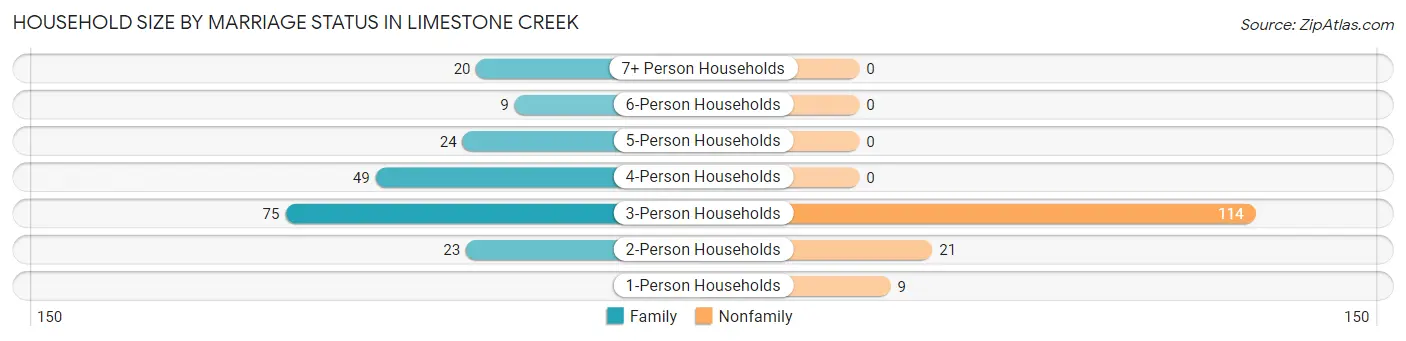
| Household Size | Family Households | Nonfamily Households |
| 1-Person Households | - | 9 (2.6%) |
| 2-Person Households | 23 (6.7%) | 21 (6.1%) |
| 3-Person Households | 75 (21.8%) | 114 (33.1%) |
| 4-Person Households | 49 (14.2%) | 0 (0.0%) |
| 5-Person Households | 24 (7.0%) | 0 (0.0%) |
| 6-Person Households | 9 (2.6%) | 0 (0.0%) |
| 7+ Person Households | 20 (5.8%) | 0 (0.0%) |
| Total | 200 (58.1%) | 144 (41.9%) |
Female Fertility in Limestone Creek
Fertility by Age in Limestone Creek
| Age Bracket | Women with Births | Births / 1,000 Women |
| 15 to 19 years | 0 (0.0%) | 0.0 |
| 20 to 34 years | 0 (0.0%) | 0.0 |
| 35 to 50 years | 0 (0.0%) | 0.0 |
| Total | 0 (0.0%) | 0.0 |
Fertility by Age by Marriage Status in Limestone Creek
| Age Bracket | Married | Unmarried |
| 15 to 19 years | 0 (0.0%) | 0 (0.0%) |
| 20 to 34 years | 0 (0.0%) | 0 (0.0%) |
| 35 to 50 years | 0 (0.0%) | 0 (0.0%) |
| Total | 0 (0.0%) | 0 (0.0%) |
Fertility by Education in Limestone Creek
| Educational Attainment | Women with Births | Births / 1,000 Women |
| Less than High School | 0 (0.0%) | 0.0 |
| High School Diploma | 0 (0.0%) | 0.0 |
| College or Associate's Degree | 0 (0.0%) | 0.0 |
| Bachelor's Degree | 0 (0.0%) | 0.0 |
| Graduate Degree | 0 (0.0%) | 0.0 |
| Total | 0 (0.0%) | 0.0 |
Fertility by Education by Marriage Status in Limestone Creek
| Educational Attainment | Married | Unmarried |
| Less than High School | 0 (0.0%) | 0 (0.0%) |
| High School Diploma | 0 (0.0%) | 0 (0.0%) |
| College or Associate's Degree | 0 (0.0%) | 0 (0.0%) |
| Bachelor's Degree | 0 (0.0%) | 0 (0.0%) |
| Graduate Degree | 0 (0.0%) | 0 (0.0%) |
| Total | 0 (0.0%) | 0 (0.0%) |
Employment Characteristics in Limestone Creek
Employment by Class of Employer in Limestone Creek
Among the 978 employed individuals in Limestone Creek, private company employees (850 | 86.9%), state government employees (37 | 3.8%), and not-for-profit organizations (34 | 3.5%) make up the most common classes of employment.
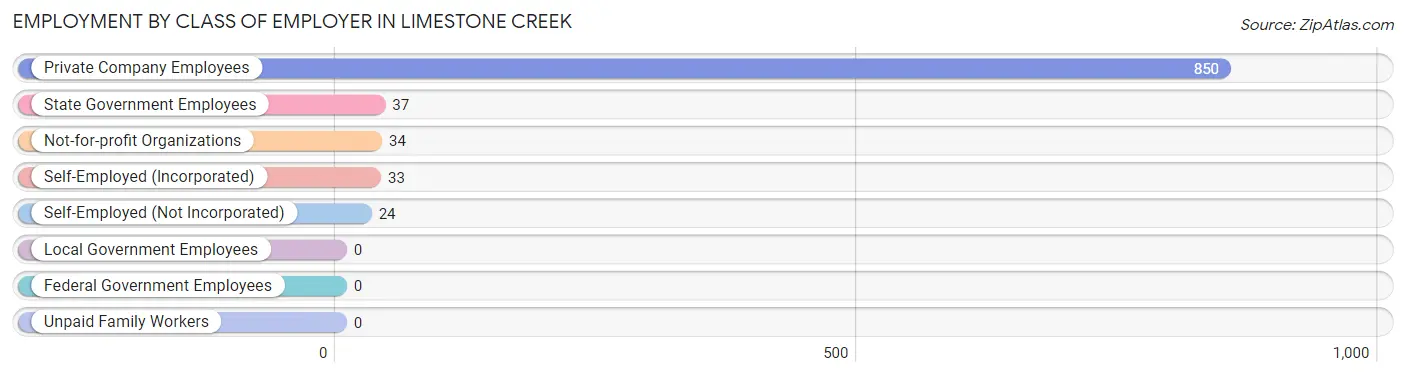
| Employer Class | # Employees | % Employees |
| Private Company Employees | 850 | 86.9% |
| Self-Employed (Incorporated) | 33 | 3.4% |
| Self-Employed (Not Incorporated) | 24 | 2.5% |
| Not-for-profit Organizations | 34 | 3.5% |
| Local Government Employees | 0 | 0.0% |
| State Government Employees | 37 | 3.8% |
| Federal Government Employees | 0 | 0.0% |
| Unpaid Family Workers | 0 | 0.0% |
| Total | 978 | 100.0% |
Employment Status by Age in Limestone Creek
According to the labor force statistics for Limestone Creek, out of the total population over 16 years of age (1,269), 82.7% or 1,049 individuals are in the labor force, with 5.1% or 53 of them unemployed. The age group with the highest labor force participation rate is 25 to 29 years, with 100.0% or 79 individuals in the labor force. Within the labor force, the 16 to 19 years age range has the highest percentage of unemployed individuals, with 70.6% or 24 of them being unemployed.
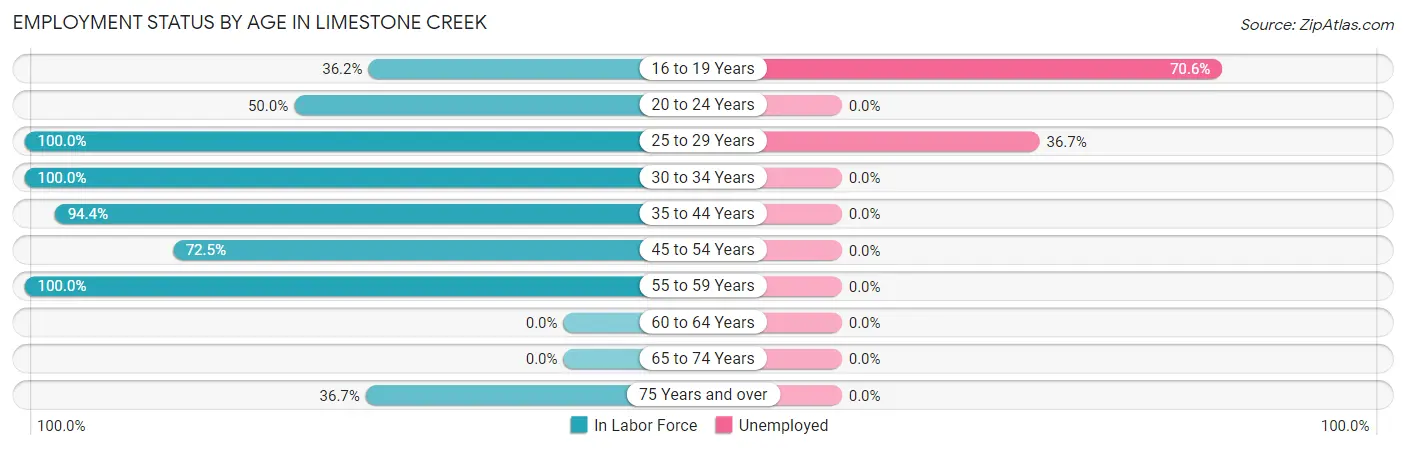
| Age Bracket | In Labor Force | Unemployed |
| 16 to 19 Years | 34 (36.2%) | 24 (70.6%) |
| 20 to 24 Years | 12 (50.0%) | 0 (0.0%) |
| 25 to 29 Years | 79 (100.0%) | 29 (36.7%) |
| 30 to 34 Years | 235 (100.0%) | 0 (0.0%) |
| 35 to 44 Years | 357 (94.4%) | 0 (0.0%) |
| 45 to 54 Years | 221 (72.5%) | 0 (0.0%) |
| 55 to 59 Years | 93 (100.0%) | 0 (0.0%) |
| 60 to 64 Years | 0 (0.0%) | 0 (0.0%) |
| 65 to 74 Years | 0 (0.0%) | 0 (0.0%) |
| 75 Years and over | 18 (36.7%) | 0 (0.0%) |
| Total | 1,049 (82.7%) | 53 (5.1%) |
Employment Status by Educational Attainment in Limestone Creek
According to labor force statistics for Limestone Creek, 90.4% of individuals (985) out of the total population between 25 and 64 years of age (1,090) are in the labor force, with 2.9% or 29 of them being unemployed. The group with the highest labor force participation rate are those with the educational attainment of less than high school, with 95.2% or 218 individuals in the labor force. Within the labor force, individuals with college / associate degree education have the highest percentage of unemployment, with 49.2% or 29 of them being unemployed.
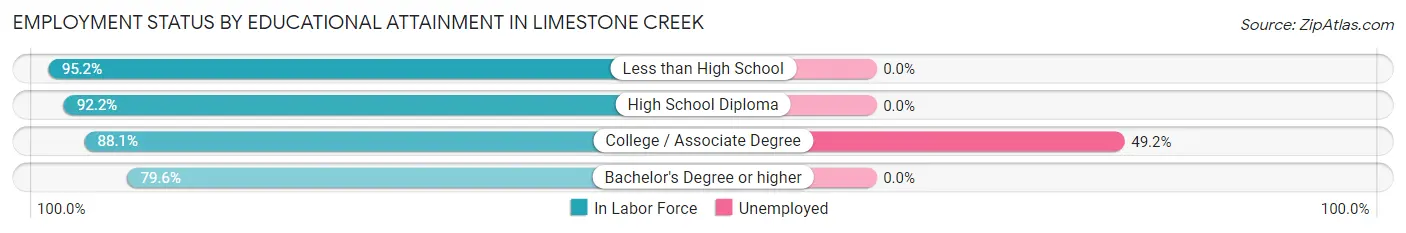
| Educational Attainment | In Labor Force | Unemployed |
| Less than High School | 218 (95.2%) | 0 (0.0%) |
| High School Diploma | 556 (92.2%) | 0 (0.0%) |
| College / Associate Degree | 59 (88.1%) | 33 (49.2%) |
| Bachelor's Degree or higher | 152 (79.6%) | 0 (0.0%) |
| Total | 985 (90.4%) | 32 (2.9%) |
Employment Occupations by Sex in Limestone Creek
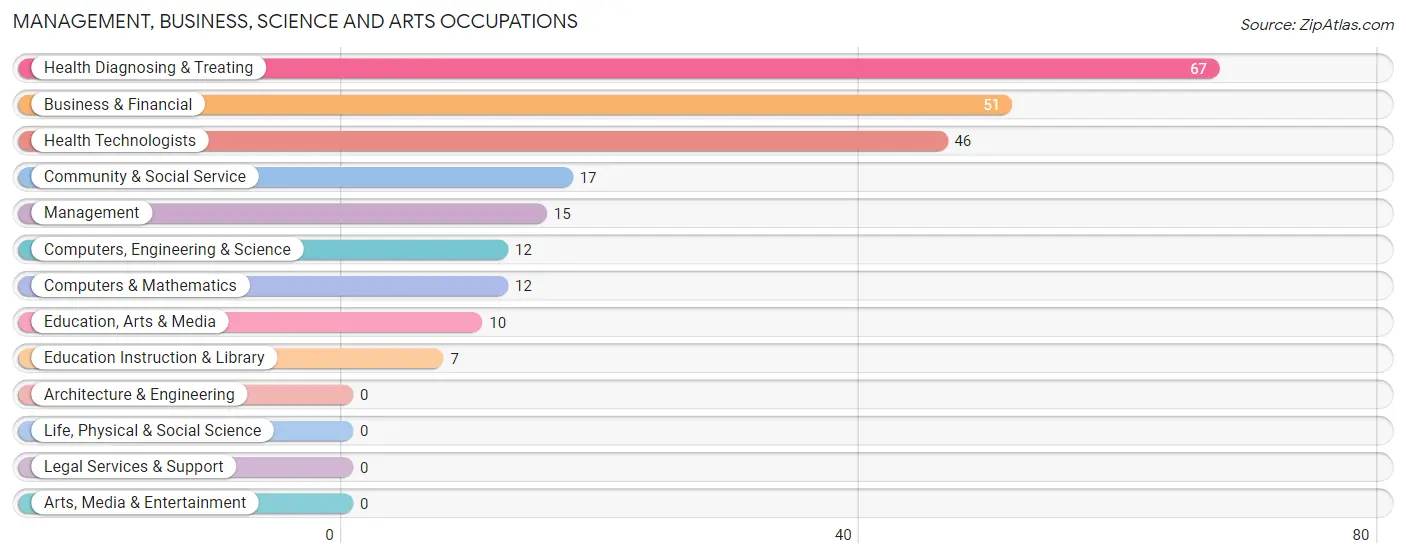
Management, Business, Science and Arts Occupations
The most common Management, Business, Science and Arts occupations in Limestone Creek are Health Diagnosing & Treating (67 | 6.7%), Business & Financial (51 | 5.1%), Health Technologists (46 | 4.6%), Community & Social Service (17 | 1.7%), and Management (15 | 1.5%).
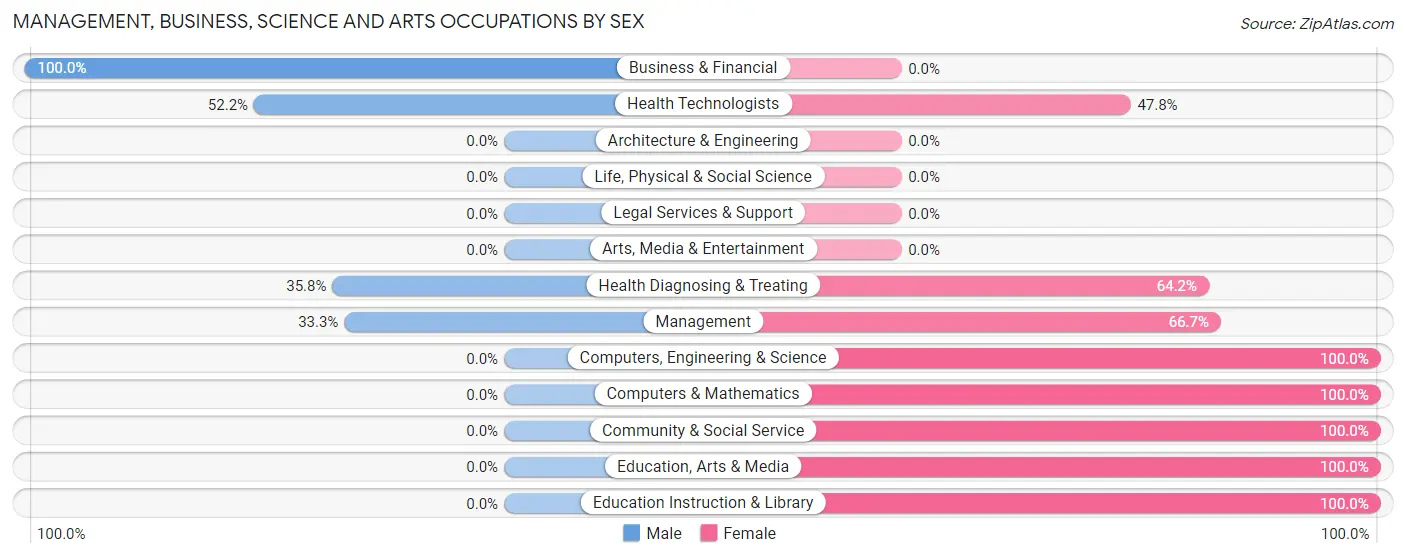
Management, Business, Science and Arts Occupations by Sex
Within the Management, Business, Science and Arts occupations in Limestone Creek, the most male-oriented occupations are Business & Financial (100.0%), Health Technologists (52.2%), and Health Diagnosing & Treating (35.8%), while the most female-oriented occupations are Computers, Engineering & Science (100.0%), Computers & Mathematics (100.0%), and Community & Social Service (100.0%).
| Occupation | Male | Female |
| Management | 5 (33.3%) | 10 (66.7%) |
| Business & Financial | 51 (100.0%) | 0 (0.0%) |
| Computers, Engineering & Science | 0 (0.0%) | 12 (100.0%) |
| Computers & Mathematics | 0 (0.0%) | 12 (100.0%) |
| Architecture & Engineering | 0 (0.0%) | 0 (0.0%) |
| Life, Physical & Social Science | 0 (0.0%) | 0 (0.0%) |
| Community & Social Service | 0 (0.0%) | 17 (100.0%) |
| Education, Arts & Media | 0 (0.0%) | 10 (100.0%) |
| Legal Services & Support | 0 (0.0%) | 0 (0.0%) |
| Education Instruction & Library | 0 (0.0%) | 7 (100.0%) |
| Arts, Media & Entertainment | 0 (0.0%) | 0 (0.0%) |
| Health Diagnosing & Treating | 24 (35.8%) | 43 (64.2%) |
| Health Technologists | 24 (52.2%) | 22 (47.8%) |
| Total (Category) | 80 (49.4%) | 82 (50.6%) |
| Total (Overall) | 785 (78.8%) | 211 (21.2%) |
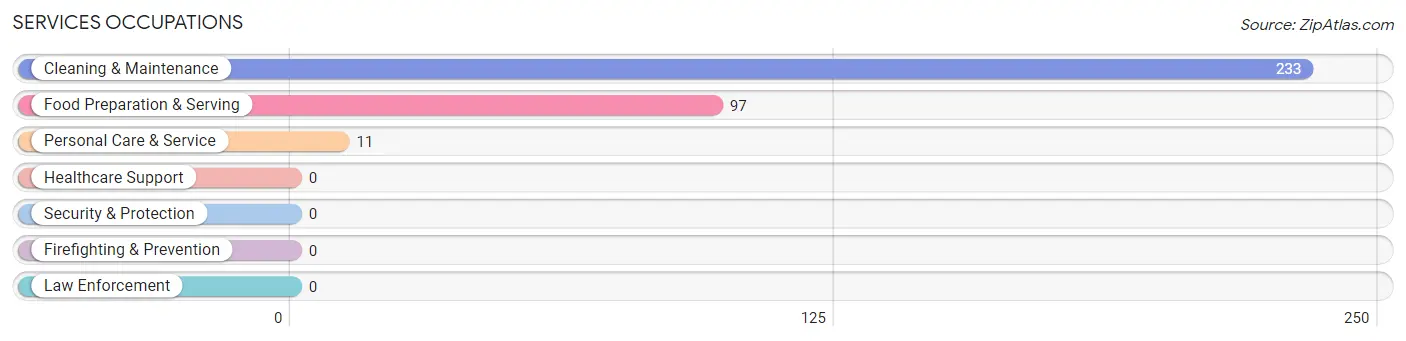
Services Occupations
The most common Services occupations in Limestone Creek are Cleaning & Maintenance (233 | 23.4%), Food Preparation & Serving (97 | 9.7%), and Personal Care & Service (11 | 1.1%).
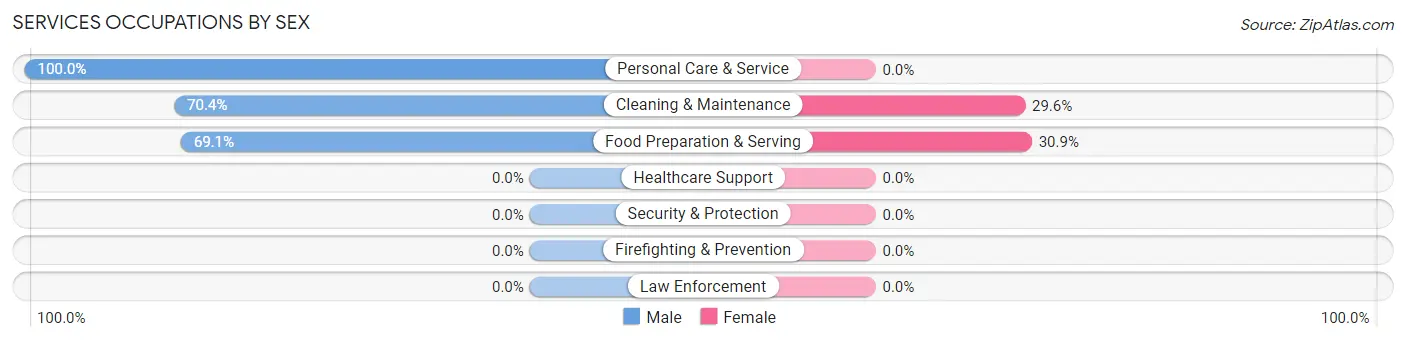
Services Occupations by Sex
Within the Services occupations in Limestone Creek, the most male-oriented occupations are Personal Care & Service (100.0%), Cleaning & Maintenance (70.4%), and Food Preparation & Serving (69.1%), while the most female-oriented occupations are Food Preparation & Serving (30.9%), and Cleaning & Maintenance (29.6%).
| Occupation | Male | Female |
| Healthcare Support | 0 (0.0%) | 0 (0.0%) |
| Security & Protection | 0 (0.0%) | 0 (0.0%) |
| Firefighting & Prevention | 0 (0.0%) | 0 (0.0%) |
| Law Enforcement | 0 (0.0%) | 0 (0.0%) |
| Food Preparation & Serving | 67 (69.1%) | 30 (30.9%) |
| Cleaning & Maintenance | 164 (70.4%) | 69 (29.6%) |
| Personal Care & Service | 11 (100.0%) | 0 (0.0%) |
| Total (Category) | 242 (71.0%) | 99 (29.0%) |
| Total (Overall) | 785 (78.8%) | 211 (21.2%) |
Sales and Office Occupations
The most common Sales and Office occupations in Limestone Creek are Sales & Related (31 | 3.1%), and Office & Administration (19 | 1.9%).
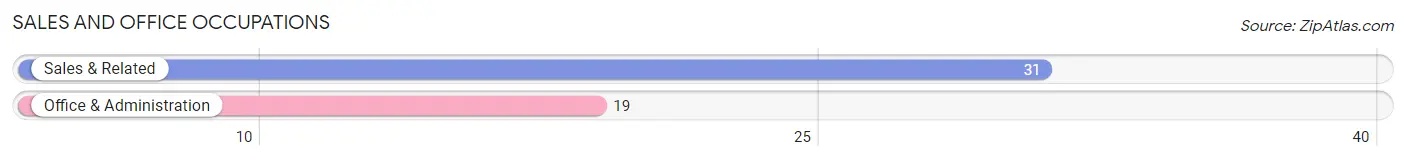
Sales and Office Occupations by Sex

| Occupation | Male | Female |
| Sales & Related | 19 (61.3%) | 12 (38.7%) |
| Office & Administration | 19 (100.0%) | 0 (0.0%) |
| Total (Category) | 38 (76.0%) | 12 (24.0%) |
| Total (Overall) | 785 (78.8%) | 211 (21.2%) |
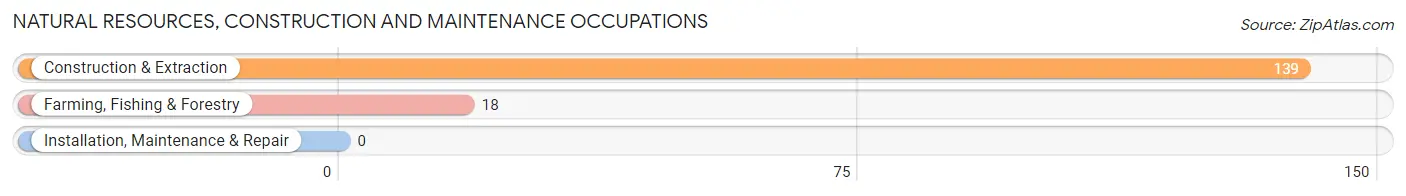
Natural Resources, Construction and Maintenance Occupations
The most common Natural Resources, Construction and Maintenance occupations in Limestone Creek are Construction & Extraction (139 | 14.0%), and Farming, Fishing & Forestry (18 | 1.8%).
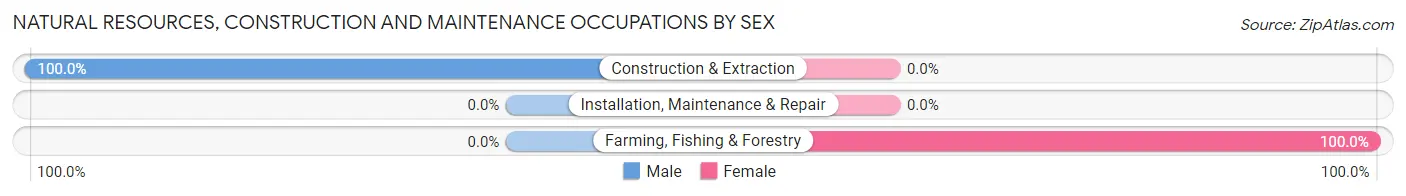
Natural Resources, Construction and Maintenance Occupations by Sex
| Occupation | Male | Female |
| Farming, Fishing & Forestry | 0 (0.0%) | 18 (100.0%) |
| Construction & Extraction | 139 (100.0%) | 0 (0.0%) |
| Installation, Maintenance & Repair | 0 (0.0%) | 0 (0.0%) |
| Total (Category) | 139 (88.5%) | 18 (11.5%) |
| Total (Overall) | 785 (78.8%) | 211 (21.2%) |
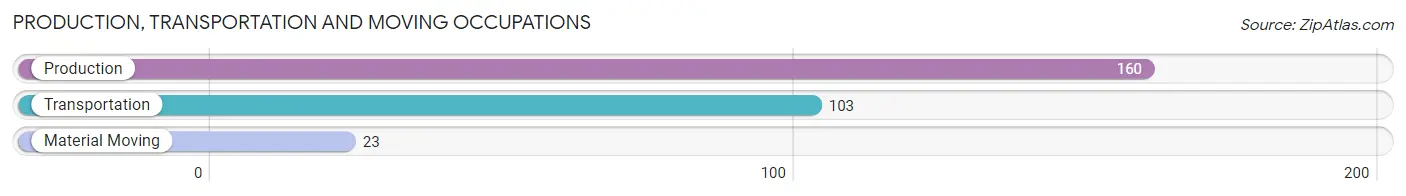
Production, Transportation and Moving Occupations
The most common Production, Transportation and Moving occupations in Limestone Creek are Production (160 | 16.1%), Transportation (103 | 10.3%), and Material Moving (23 | 2.3%).
Production, Transportation and Moving Occupations by Sex
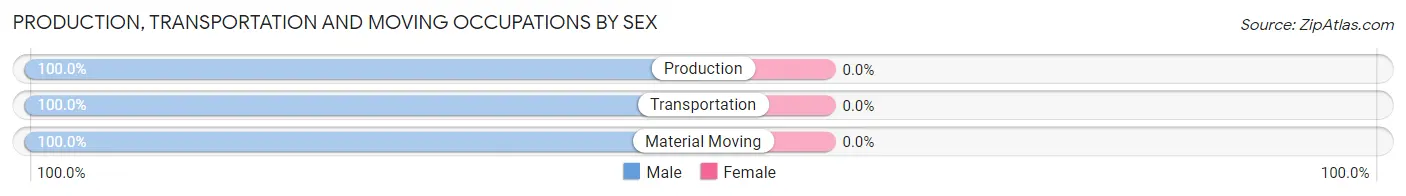
| Occupation | Male | Female |
| Production | 160 (100.0%) | 0 (0.0%) |
| Transportation | 103 (100.0%) | 0 (0.0%) |
| Material Moving | 23 (100.0%) | 0 (0.0%) |
| Total (Category) | 286 (100.0%) | 0 (0.0%) |
| Total (Overall) | 785 (78.8%) | 211 (21.2%) |
Employment Industries by Sex in Limestone Creek
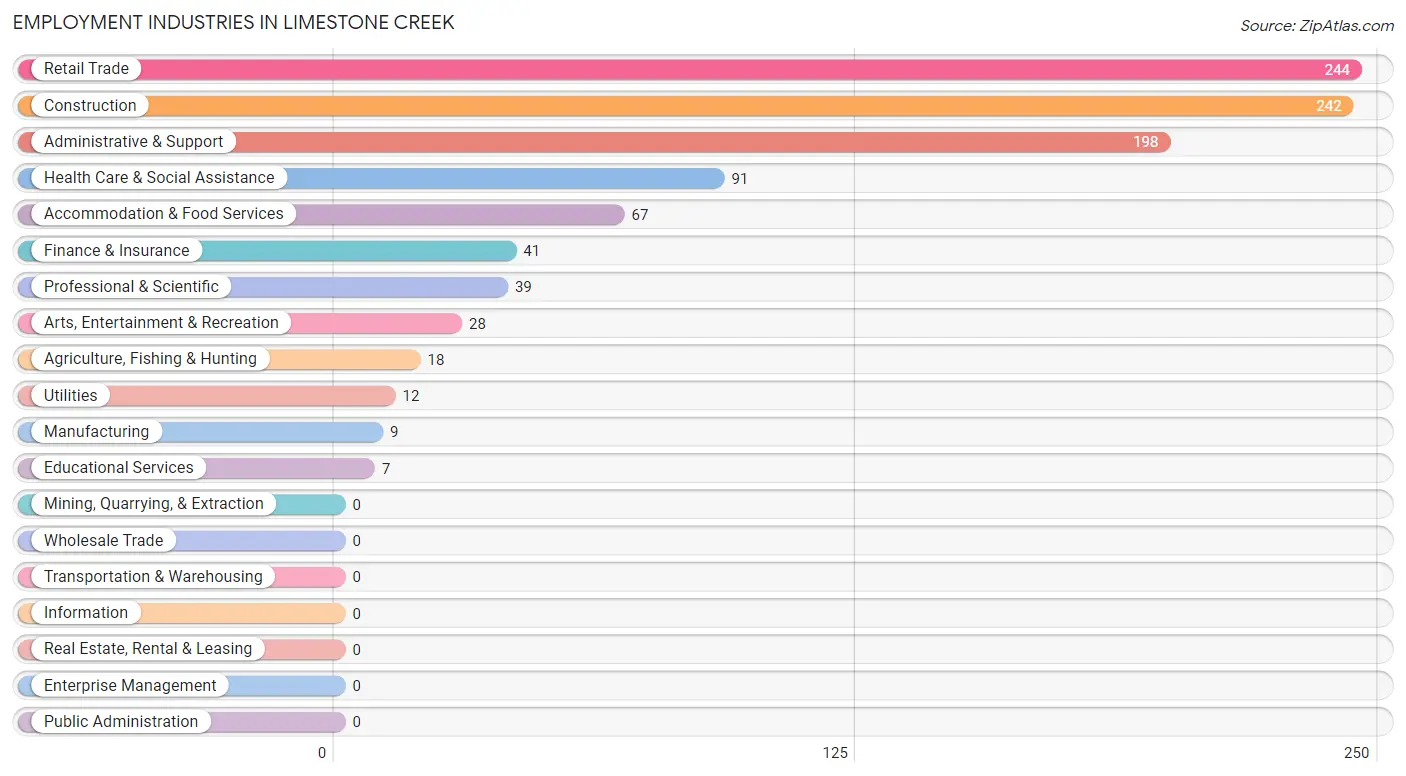
Employment Industries in Limestone Creek
The major employment industries in Limestone Creek include Retail Trade (244 | 24.5%), Construction (242 | 24.3%), Administrative & Support (198 | 19.9%), Health Care & Social Assistance (91 | 9.1%), and Accommodation & Food Services (67 | 6.7%).
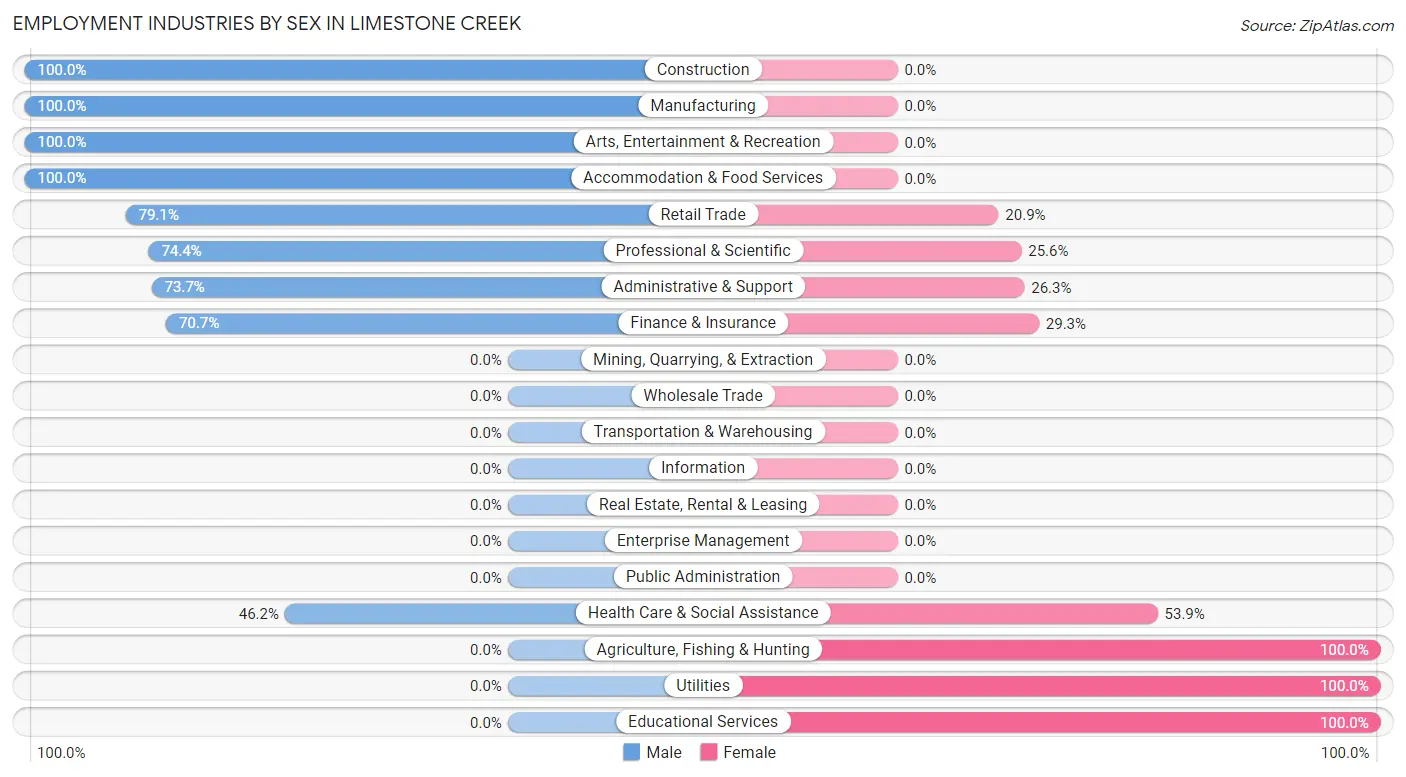
Employment Industries by Sex in Limestone Creek
The Limestone Creek industries that see more men than women are Construction (100.0%), Manufacturing (100.0%), and Arts, Entertainment & Recreation (100.0%), whereas the industries that tend to have a higher number of women are Agriculture, Fishing & Hunting (100.0%), Utilities (100.0%), and Educational Services (100.0%).
| Industry | Male | Female |
| Agriculture, Fishing & Hunting | 0 (0.0%) | 18 (100.0%) |
| Mining, Quarrying, & Extraction | 0 (0.0%) | 0 (0.0%) |
| Construction | 242 (100.0%) | 0 (0.0%) |
| Manufacturing | 9 (100.0%) | 0 (0.0%) |
| Wholesale Trade | 0 (0.0%) | 0 (0.0%) |
| Retail Trade | 193 (79.1%) | 51 (20.9%) |
| Transportation & Warehousing | 0 (0.0%) | 0 (0.0%) |
| Utilities | 0 (0.0%) | 12 (100.0%) |
| Information | 0 (0.0%) | 0 (0.0%) |
| Finance & Insurance | 29 (70.7%) | 12 (29.3%) |
| Real Estate, Rental & Leasing | 0 (0.0%) | 0 (0.0%) |
| Professional & Scientific | 29 (74.4%) | 10 (25.6%) |
| Enterprise Management | 0 (0.0%) | 0 (0.0%) |
| Administrative & Support | 146 (73.7%) | 52 (26.3%) |
| Educational Services | 0 (0.0%) | 7 (100.0%) |
| Health Care & Social Assistance | 42 (46.2%) | 49 (53.8%) |
| Arts, Entertainment & Recreation | 28 (100.0%) | 0 (0.0%) |
| Accommodation & Food Services | 67 (100.0%) | 0 (0.0%) |
| Public Administration | 0 (0.0%) | 0 (0.0%) |
| Total | 785 (78.8%) | 211 (21.2%) |
Education in Limestone Creek
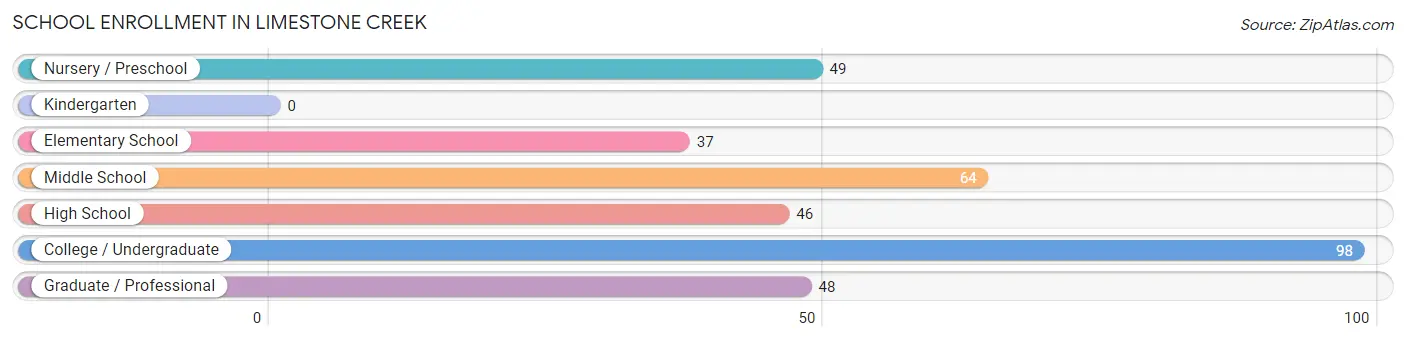
School Enrollment in Limestone Creek
The most common levels of schooling among the 342 students in Limestone Creek are college / undergraduate (98 | 28.6%), middle school (64 | 18.7%), and nursery / preschool (49 | 14.3%).
| School Level | # Students | % Students |
| Nursery / Preschool | 49 | 14.3% |
| Kindergarten | 0 | 0.0% |
| Elementary School | 37 | 10.8% |
| Middle School | 64 | 18.7% |
| High School | 46 | 13.5% |
| College / Undergraduate | 98 | 28.6% |
| Graduate / Professional | 48 | 14.0% |
| Total | 342 | 100.0% |
School Enrollment by Age by Funding Source in Limestone Creek
Out of a total of 342 students who are enrolled in schools in Limestone Creek, 72 (21.1%) attend a private institution, while the remaining 270 (78.9%) are enrolled in public schools. The age group of 3 to 4 year olds has the highest likelihood of being enrolled in private schools, with 38 (100.0% in the age bracket) enrolled. Conversely, the age group of 15 to 17 year olds has the lowest likelihood of being enrolled in a private school, with 11 (100.0% in the age bracket) attending a public institution.
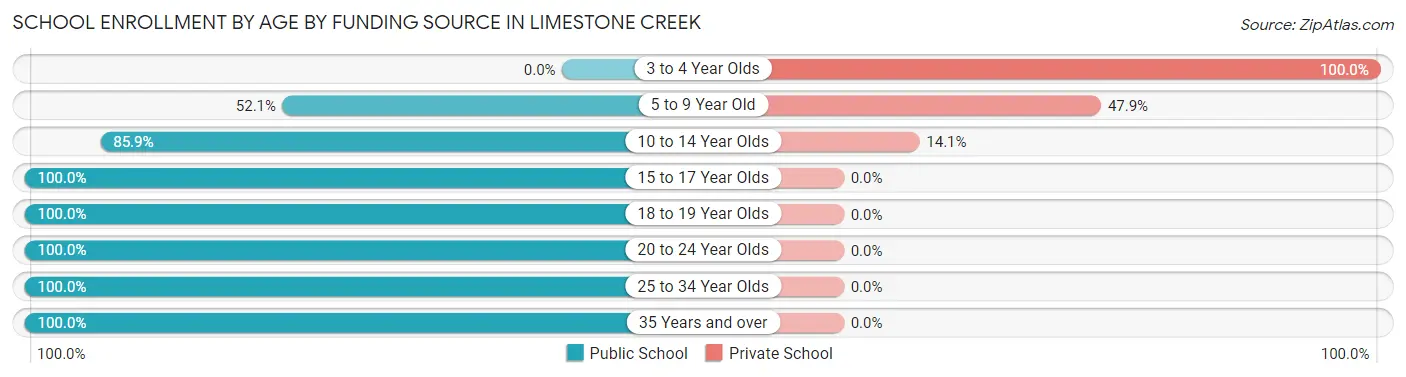
| Age Bracket | Public School | Private School |
| 3 to 4 Year Olds | 0 (0.0%) | 38 (100.0%) |
| 5 to 9 Year Old | 25 (52.1%) | 23 (47.9%) |
| 10 to 14 Year Olds | 67 (85.9%) | 11 (14.1%) |
| 15 to 17 Year Olds | 11 (100.0%) | 0 (0.0%) |
| 18 to 19 Year Olds | 67 (100.0%) | 0 (0.0%) |
| 20 to 24 Year Olds | 12 (100.0%) | 0 (0.0%) |
| 25 to 34 Year Olds | 29 (100.0%) | 0 (0.0%) |
| 35 Years and over | 59 (100.0%) | 0 (0.0%) |
| Total | 270 (78.9%) | 72 (21.1%) |
Educational Attainment by Field of Study in Limestone Creek
Business (67 | 33.0%), science & technology (38 | 18.7%), social sciences (29 | 14.3%), psychology (27 | 13.3%), and bio, nature & agricultural (20 | 9.9%) are the most common fields of study among 203 individuals in Limestone Creek who have obtained a bachelor's degree or higher.
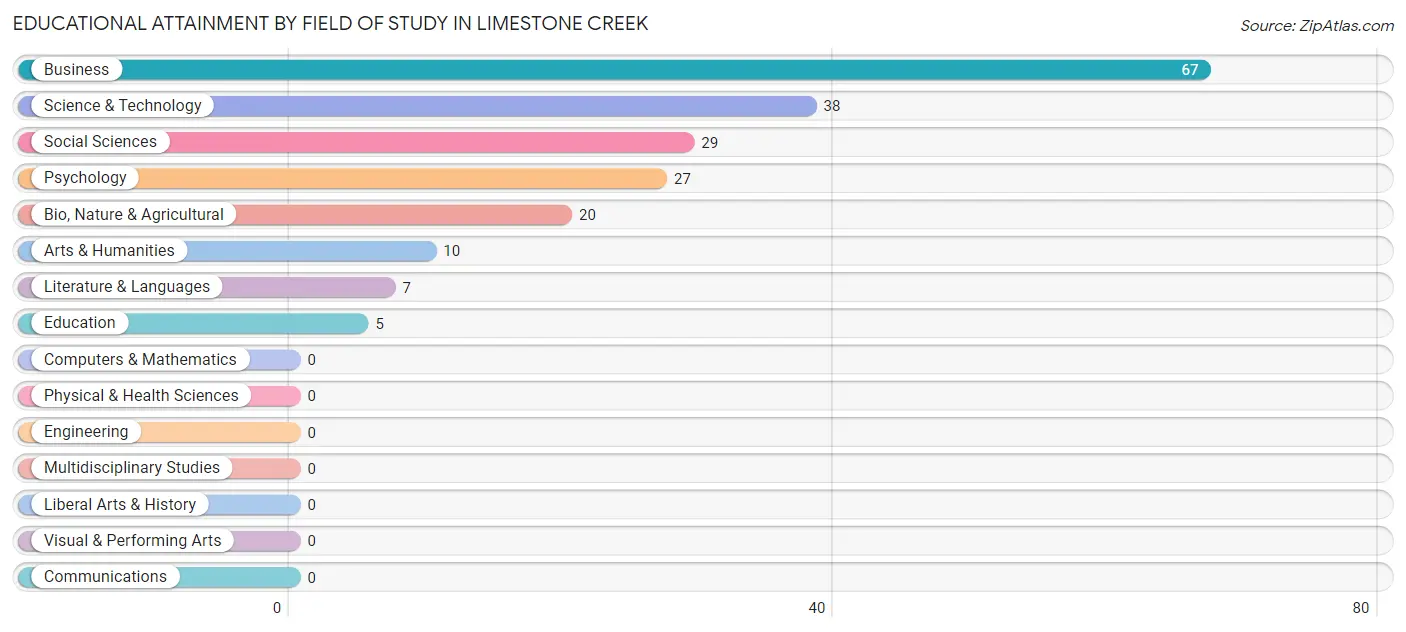
| Field of Study | # Graduates | % Graduates |
| Computers & Mathematics | 0 | 0.0% |
| Bio, Nature & Agricultural | 20 | 9.9% |
| Physical & Health Sciences | 0 | 0.0% |
| Psychology | 27 | 13.3% |
| Social Sciences | 29 | 14.3% |
| Engineering | 0 | 0.0% |
| Multidisciplinary Studies | 0 | 0.0% |
| Science & Technology | 38 | 18.7% |
| Business | 67 | 33.0% |
| Education | 5 | 2.5% |
| Literature & Languages | 7 | 3.5% |
| Liberal Arts & History | 0 | 0.0% |
| Visual & Performing Arts | 0 | 0.0% |
| Communications | 0 | 0.0% |
| Arts & Humanities | 10 | 4.9% |
| Total | 203 | 100.0% |
Transportation & Commute in Limestone Creek
Vehicle Availability by Sex in Limestone Creek
The most prevalent vehicle ownership categories in Limestone Creek are males with 2 vehicles (656, accounting for 83.6%) and females with 2 vehicles (139, making up 339.9%).
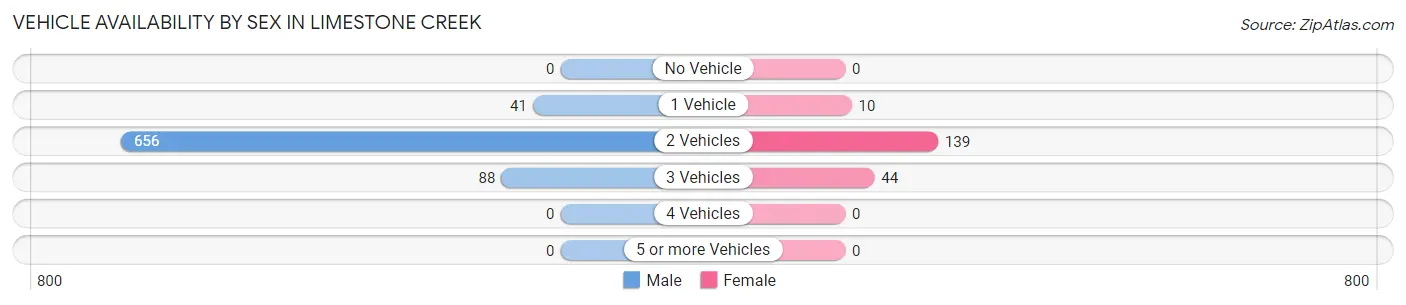
| Vehicles Available | Male | Female |
| No Vehicle | 0 (0.0%) | 0 (0.0%) |
| 1 Vehicle | 41 (5.2%) | 10 (5.2%) |
| 2 Vehicles | 656 (83.6%) | 139 (72.0%) |
| 3 Vehicles | 88 (11.2%) | 44 (22.8%) |
| 4 Vehicles | 0 (0.0%) | 0 (0.0%) |
| 5 or more Vehicles | 0 (0.0%) | 0 (0.0%) |
| Total | 785 (100.0%) | 193 (100.0%) |
Commute Time in Limestone Creek
The most frequently occuring commute durations in Limestone Creek are 10 to 14 minutes (238 commuters, 24.8%), 20 to 24 minutes (158 commuters, 16.4%), and 15 to 19 minutes (128 commuters, 13.3%).
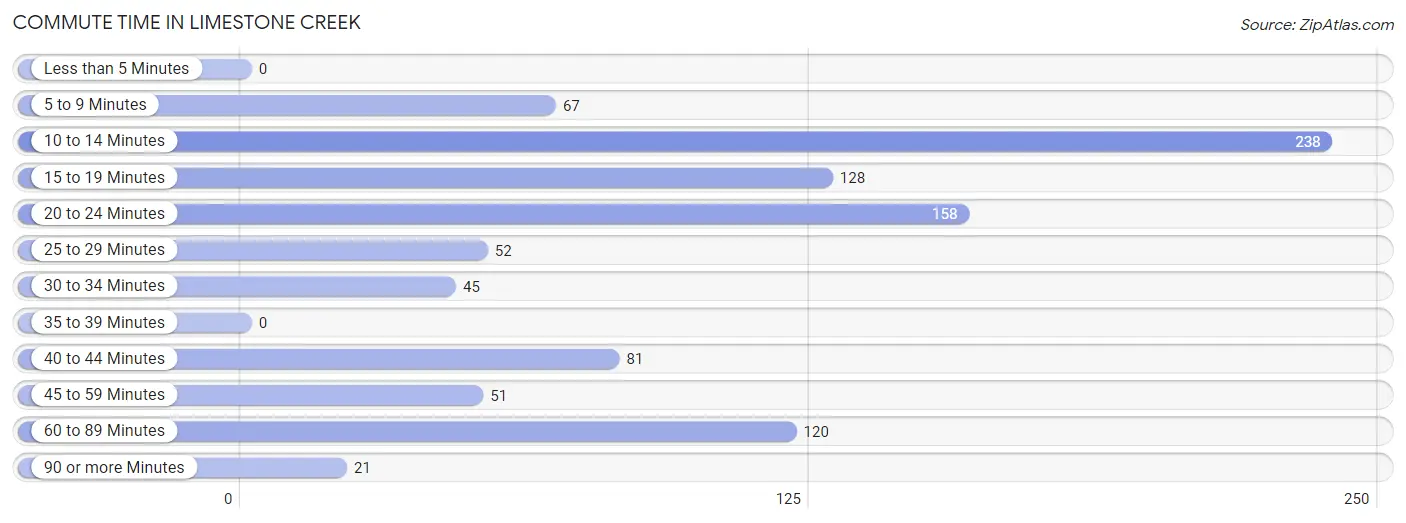
| Commute Time | # Commuters | % Commuters |
| Less than 5 Minutes | 0 | 0.0% |
| 5 to 9 Minutes | 67 | 7.0% |
| 10 to 14 Minutes | 238 | 24.8% |
| 15 to 19 Minutes | 128 | 13.3% |
| 20 to 24 Minutes | 158 | 16.4% |
| 25 to 29 Minutes | 52 | 5.4% |
| 30 to 34 Minutes | 45 | 4.7% |
| 35 to 39 Minutes | 0 | 0.0% |
| 40 to 44 Minutes | 81 | 8.4% |
| 45 to 59 Minutes | 51 | 5.3% |
| 60 to 89 Minutes | 120 | 12.5% |
| 90 or more Minutes | 21 | 2.2% |
Commute Time by Sex in Limestone Creek
The most common commute times in Limestone Creek are 10 to 14 minutes (200 commuters, 25.6%) for males and 25 to 29 minutes (52 commuters, 28.7%) for females.
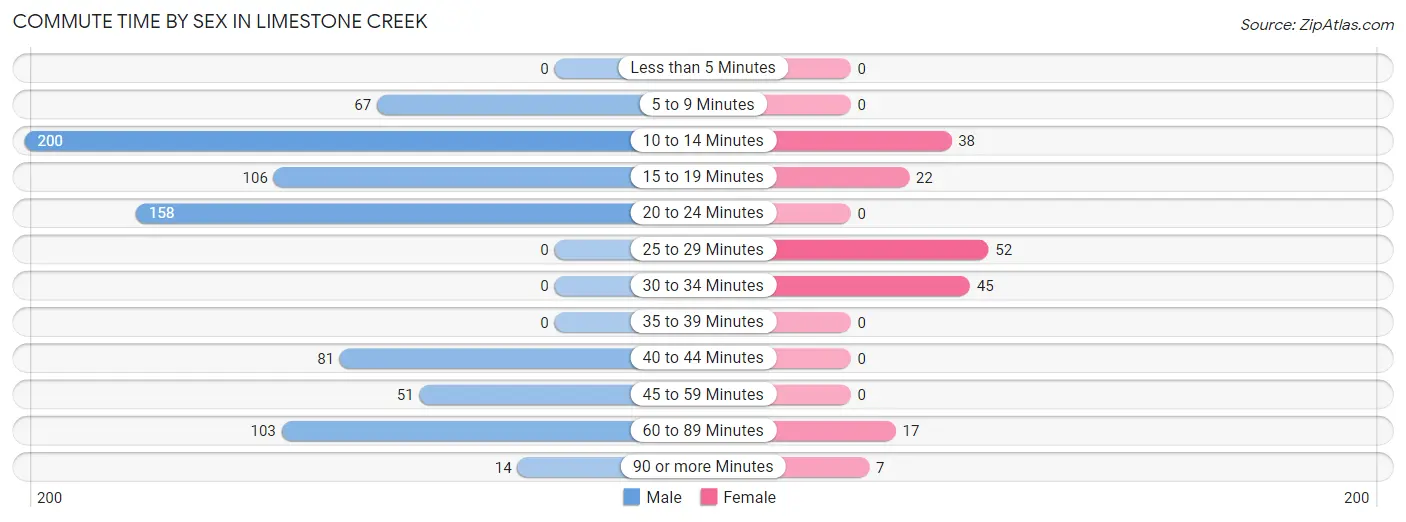
| Commute Time | Male | Female |
| Less than 5 Minutes | 0 (0.0%) | 0 (0.0%) |
| 5 to 9 Minutes | 67 (8.6%) | 0 (0.0%) |
| 10 to 14 Minutes | 200 (25.6%) | 38 (21.0%) |
| 15 to 19 Minutes | 106 (13.6%) | 22 (12.1%) |
| 20 to 24 Minutes | 158 (20.3%) | 0 (0.0%) |
| 25 to 29 Minutes | 0 (0.0%) | 52 (28.7%) |
| 30 to 34 Minutes | 0 (0.0%) | 45 (24.9%) |
| 35 to 39 Minutes | 0 (0.0%) | 0 (0.0%) |
| 40 to 44 Minutes | 81 (10.4%) | 0 (0.0%) |
| 45 to 59 Minutes | 51 (6.5%) | 0 (0.0%) |
| 60 to 89 Minutes | 103 (13.2%) | 17 (9.4%) |
| 90 or more Minutes | 14 (1.8%) | 7 (3.9%) |
Time of Departure to Work by Sex in Limestone Creek
The most frequent times of departure to work in Limestone Creek are 7:00 AM to 7:29 AM (277, 35.5%) for males and 8:00 AM to 8:29 AM (52, 28.7%) for females.
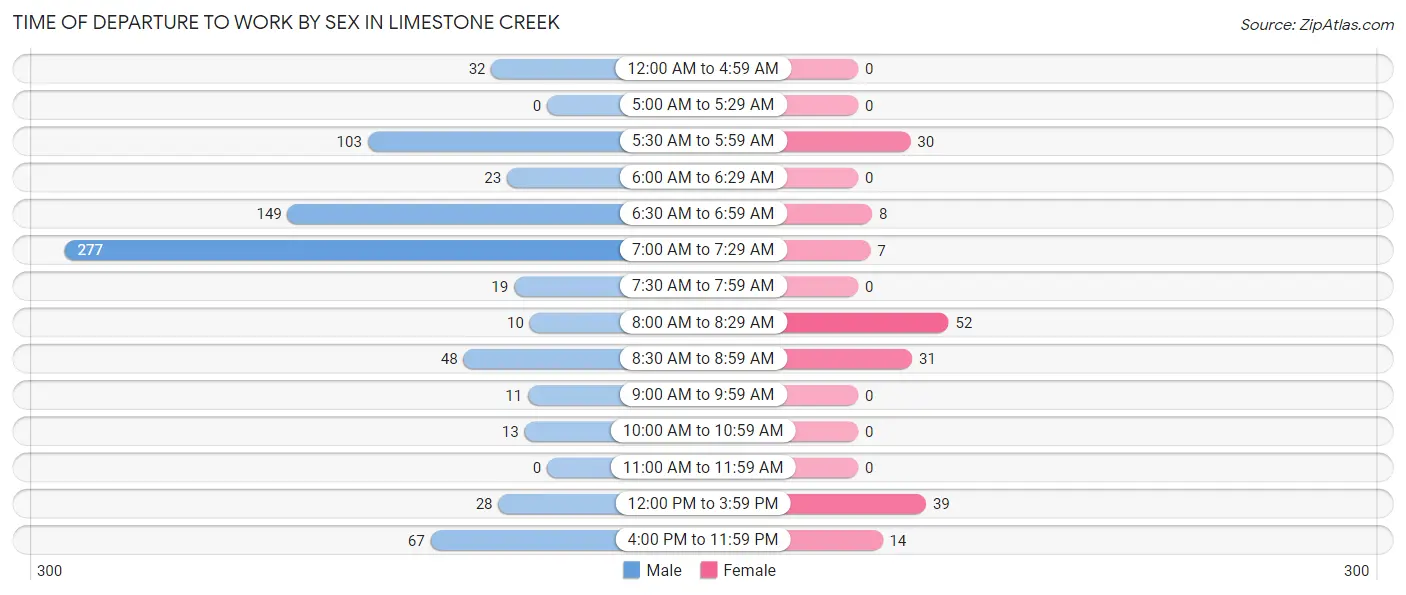
| Time of Departure | Male | Female |
| 12:00 AM to 4:59 AM | 32 (4.1%) | 0 (0.0%) |
| 5:00 AM to 5:29 AM | 0 (0.0%) | 0 (0.0%) |
| 5:30 AM to 5:59 AM | 103 (13.2%) | 30 (16.6%) |
| 6:00 AM to 6:29 AM | 23 (2.9%) | 0 (0.0%) |
| 6:30 AM to 6:59 AM | 149 (19.1%) | 8 (4.4%) |
| 7:00 AM to 7:29 AM | 277 (35.5%) | 7 (3.9%) |
| 7:30 AM to 7:59 AM | 19 (2.4%) | 0 (0.0%) |
| 8:00 AM to 8:29 AM | 10 (1.3%) | 52 (28.7%) |
| 8:30 AM to 8:59 AM | 48 (6.1%) | 31 (17.1%) |
| 9:00 AM to 9:59 AM | 11 (1.4%) | 0 (0.0%) |
| 10:00 AM to 10:59 AM | 13 (1.7%) | 0 (0.0%) |
| 11:00 AM to 11:59 AM | 0 (0.0%) | 0 (0.0%) |
| 12:00 PM to 3:59 PM | 28 (3.6%) | 39 (21.5%) |
| 4:00 PM to 11:59 PM | 67 (8.6%) | 14 (7.7%) |
| Total | 780 (100.0%) | 181 (100.0%) |
Housing Occupancy in Limestone Creek
Occupancy by Ownership in Limestone Creek
Of the total 344 dwellings in Limestone Creek, owner-occupied units account for 171 (49.7%), while renter-occupied units make up 173 (50.3%).
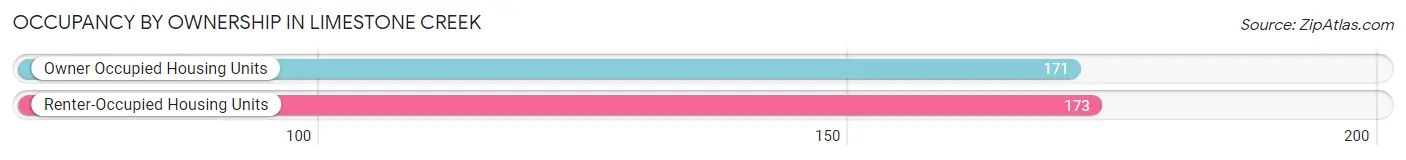
| Occupancy | # Housing Units | % Housing Units |
| Owner Occupied Housing Units | 171 | 49.7% |
| Renter-Occupied Housing Units | 173 | 50.3% |
| Total Occupied Housing Units | 344 | 100.0% |
Occupancy by Household Size in Limestone Creek
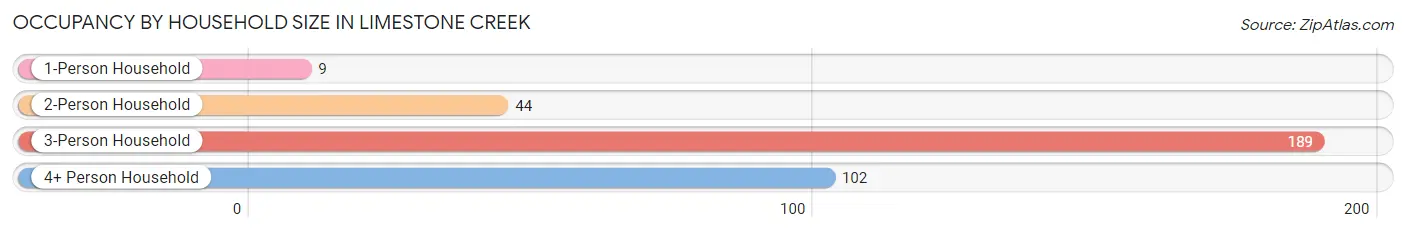
| Household Size | # Housing Units | % Housing Units |
| 1-Person Household | 9 | 2.6% |
| 2-Person Household | 44 | 12.8% |
| 3-Person Household | 189 | 54.9% |
| 4+ Person Household | 102 | 29.6% |
| Total Housing Units | 344 | 100.0% |
Occupancy by Ownership by Household Size in Limestone Creek
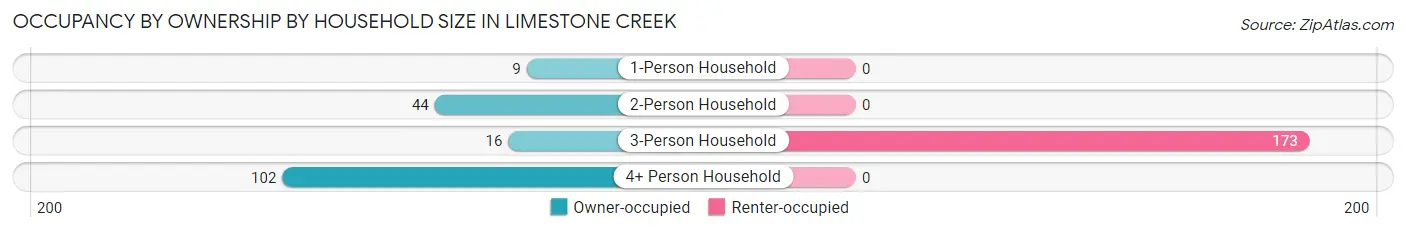
| Household Size | Owner-occupied | Renter-occupied |
| 1-Person Household | 9 (100.0%) | 0 (0.0%) |
| 2-Person Household | 44 (100.0%) | 0 (0.0%) |
| 3-Person Household | 16 (8.5%) | 173 (91.5%) |
| 4+ Person Household | 102 (100.0%) | 0 (0.0%) |
| Total Housing Units | 171 (49.7%) | 173 (50.3%) |
Occupancy by Educational Attainment in Limestone Creek
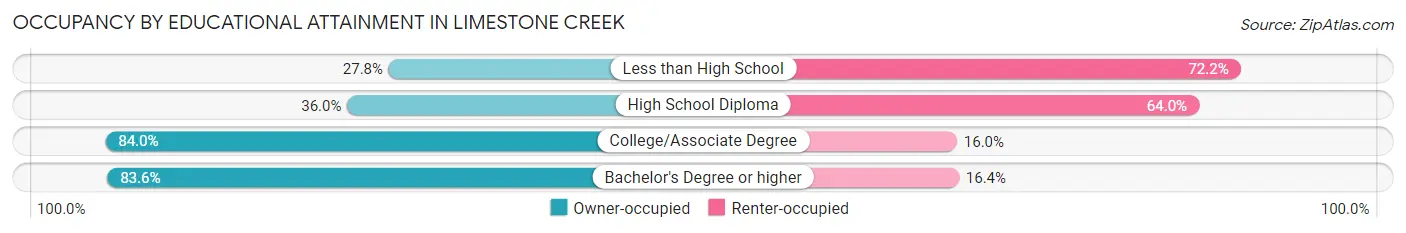
| Household Size | Owner-occupied | Renter-occupied |
| Less than High School | 20 (27.8%) | 52 (72.2%) |
| High School Diploma | 58 (36.0%) | 103 (64.0%) |
| College/Associate Degree | 42 (84.0%) | 8 (16.0%) |
| Bachelor's Degree or higher | 51 (83.6%) | 10 (16.4%) |
Occupancy by Age of Householder in Limestone Creek
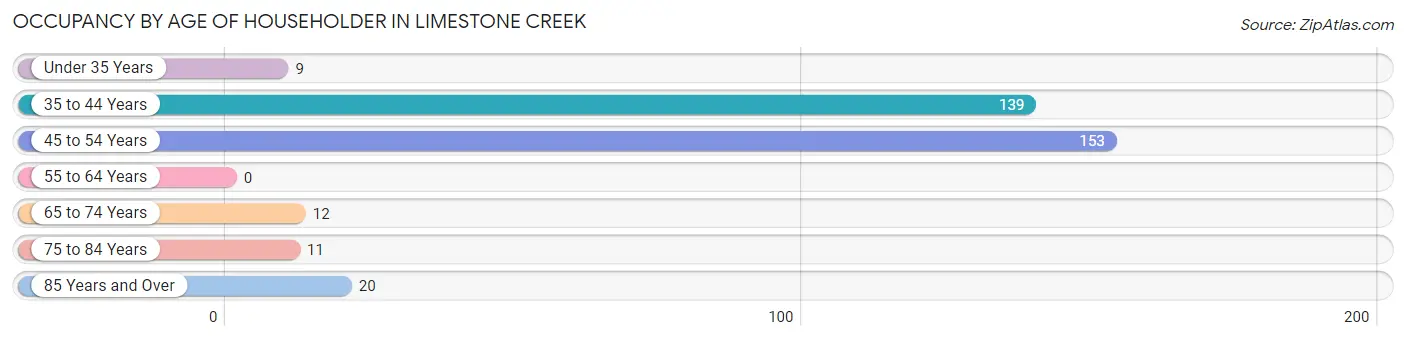
| Age Bracket | # Households | % Households |
| Under 35 Years | 9 | 2.6% |
| 35 to 44 Years | 139 | 40.4% |
| 45 to 54 Years | 153 | 44.5% |
| 55 to 64 Years | 0 | 0.0% |
| 65 to 74 Years | 12 | 3.5% |
| 75 to 84 Years | 11 | 3.2% |
| 85 Years and Over | 20 | 5.8% |
| Total | 344 | 100.0% |
Housing Finances in Limestone Creek
Median Income by Occupancy in Limestone Creek
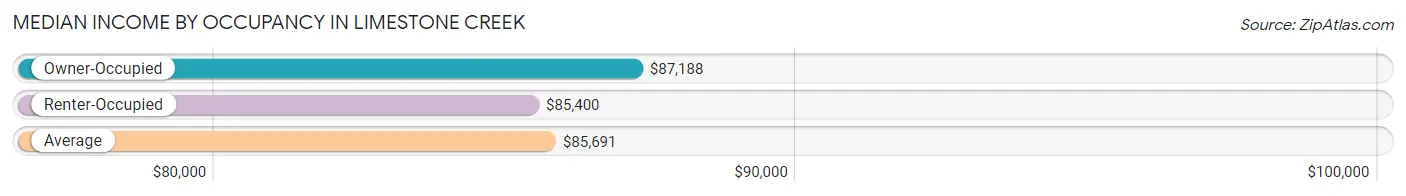
| Occupancy Type | # Households | Median Income |
| Owner-Occupied | 171 (49.7%) | $87,188 |
| Renter-Occupied | 173 (50.3%) | $85,400 |
| Average | 344 (100.0%) | $85,691 |
Occupancy by Householder Income Bracket in Limestone Creek
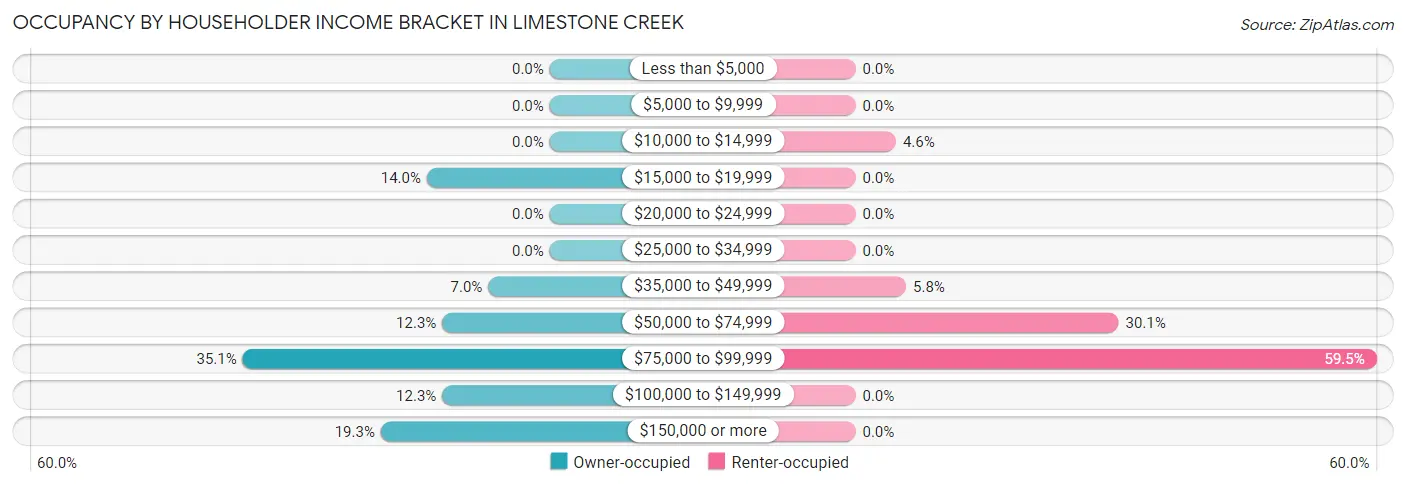
| Income Bracket | Owner-occupied | Renter-occupied |
| Less than $5,000 | 0 (0.0%) | 0 (0.0%) |
| $5,000 to $9,999 | 0 (0.0%) | 0 (0.0%) |
| $10,000 to $14,999 | 0 (0.0%) | 8 (4.6%) |
| $15,000 to $19,999 | 24 (14.0%) | 0 (0.0%) |
| $20,000 to $24,999 | 0 (0.0%) | 0 (0.0%) |
| $25,000 to $34,999 | 0 (0.0%) | 0 (0.0%) |
| $35,000 to $49,999 | 12 (7.0%) | 10 (5.8%) |
| $50,000 to $74,999 | 21 (12.3%) | 52 (30.1%) |
| $75,000 to $99,999 | 60 (35.1%) | 103 (59.5%) |
| $100,000 to $149,999 | 21 (12.3%) | 0 (0.0%) |
| $150,000 or more | 33 (19.3%) | 0 (0.0%) |
| Total | 171 (100.0%) | 173 (100.0%) |
Monthly Housing Cost Tiers in Limestone Creek
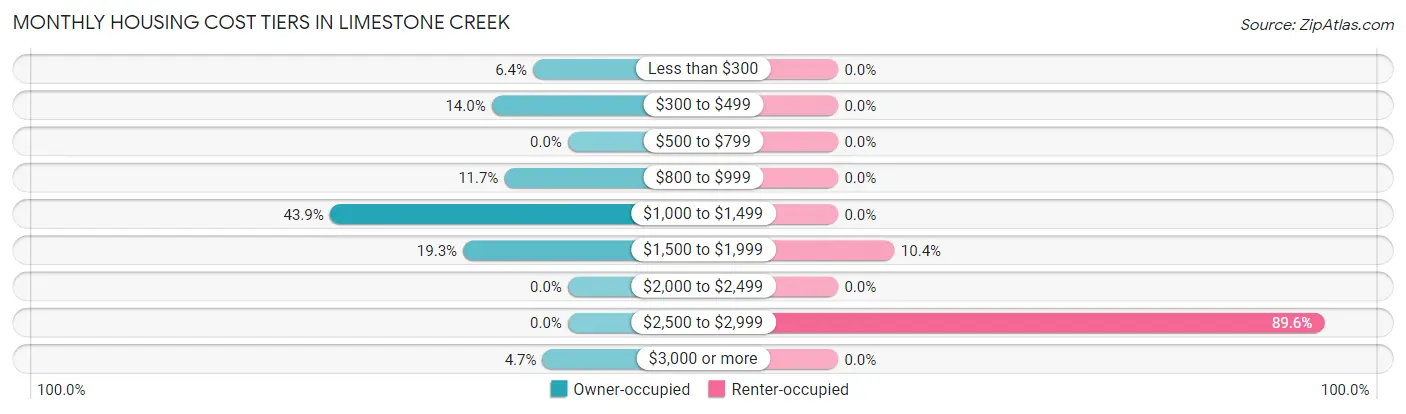
| Monthly Cost | Owner-occupied | Renter-occupied |
| Less than $300 | 11 (6.4%) | 0 (0.0%) |
| $300 to $499 | 24 (14.0%) | 0 (0.0%) |
| $500 to $799 | 0 (0.0%) | 0 (0.0%) |
| $800 to $999 | 20 (11.7%) | 0 (0.0%) |
| $1,000 to $1,499 | 75 (43.9%) | 0 (0.0%) |
| $1,500 to $1,999 | 33 (19.3%) | 18 (10.4%) |
| $2,000 to $2,499 | 0 (0.0%) | 0 (0.0%) |
| $2,500 to $2,999 | 0 (0.0%) | 155 (89.6%) |
| $3,000 or more | 8 (4.7%) | 0 (0.0%) |
| Total | 171 (100.0%) | 173 (100.0%) |
Physical Housing Characteristics in Limestone Creek
Housing Structures in Limestone Creek
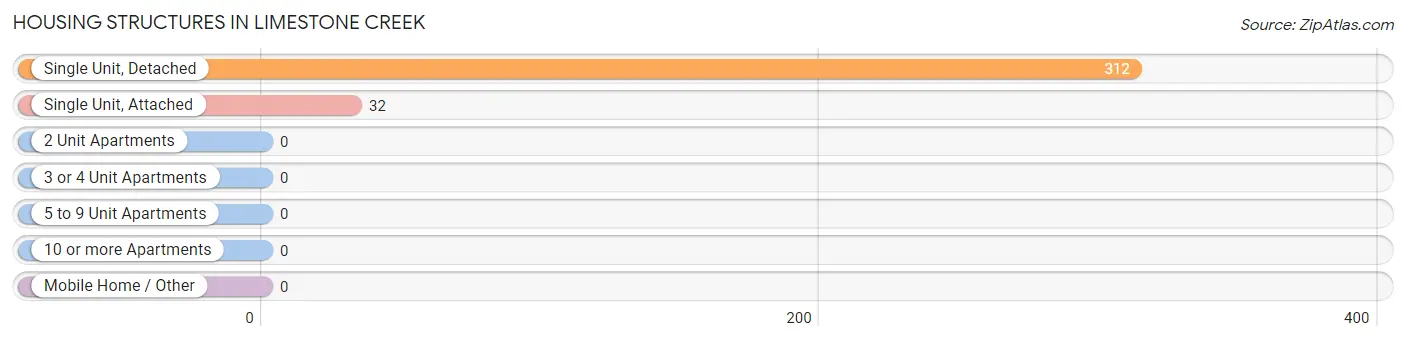
| Structure Type | # Housing Units | % Housing Units |
| Single Unit, Detached | 312 | 90.7% |
| Single Unit, Attached | 32 | 9.3% |
| 2 Unit Apartments | 0 | 0.0% |
| 3 or 4 Unit Apartments | 0 | 0.0% |
| 5 to 9 Unit Apartments | 0 | 0.0% |
| 10 or more Apartments | 0 | 0.0% |
| Mobile Home / Other | 0 | 0.0% |
| Total | 344 | 100.0% |
Housing Structures by Occupancy in Limestone Creek
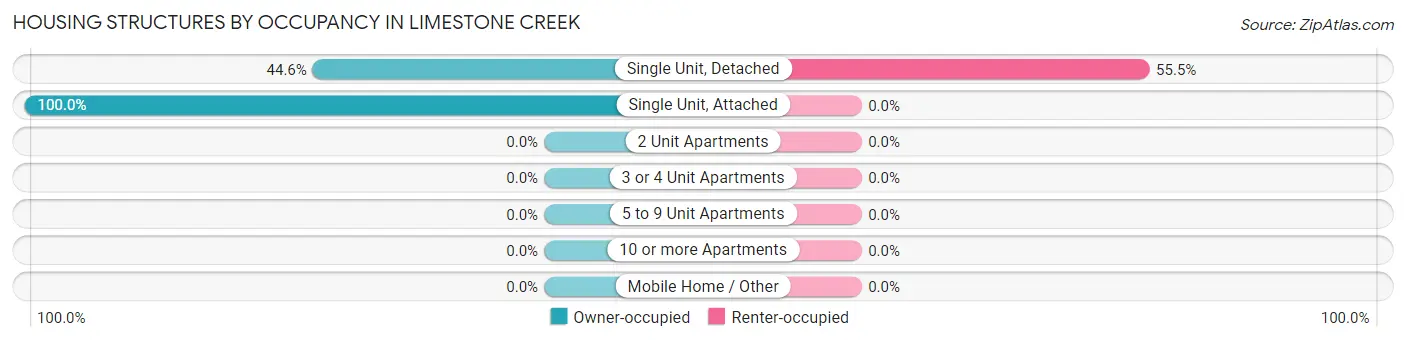
| Structure Type | Owner-occupied | Renter-occupied |
| Single Unit, Detached | 139 (44.6%) | 173 (55.4%) |
| Single Unit, Attached | 32 (100.0%) | 0 (0.0%) |
| 2 Unit Apartments | 0 (0.0%) | 0 (0.0%) |
| 3 or 4 Unit Apartments | 0 (0.0%) | 0 (0.0%) |
| 5 to 9 Unit Apartments | 0 (0.0%) | 0 (0.0%) |
| 10 or more Apartments | 0 (0.0%) | 0 (0.0%) |
| Mobile Home / Other | 0 (0.0%) | 0 (0.0%) |
| Total | 171 (49.7%) | 173 (50.3%) |
Housing Structures by Number of Rooms in Limestone Creek
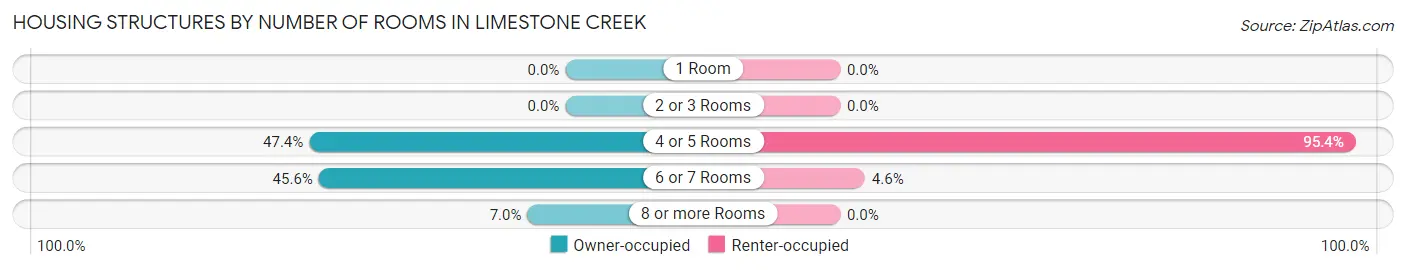
| Number of Rooms | Owner-occupied | Renter-occupied |
| 1 Room | 0 (0.0%) | 0 (0.0%) |
| 2 or 3 Rooms | 0 (0.0%) | 0 (0.0%) |
| 4 or 5 Rooms | 81 (47.4%) | 165 (95.4%) |
| 6 or 7 Rooms | 78 (45.6%) | 8 (4.6%) |
| 8 or more Rooms | 12 (7.0%) | 0 (0.0%) |
| Total | 171 (100.0%) | 173 (100.0%) |
Housing Structure by Heating Type in Limestone Creek
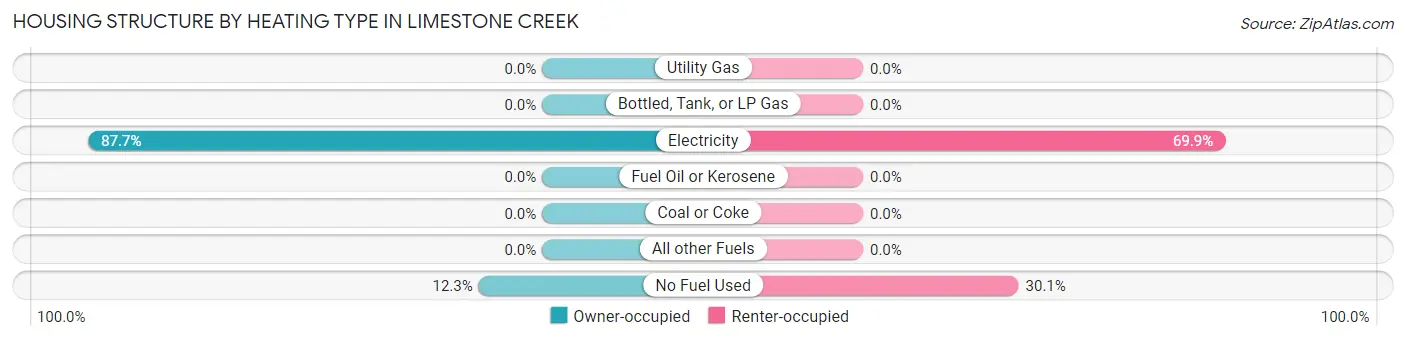
| Heating Type | Owner-occupied | Renter-occupied |
| Utility Gas | 0 (0.0%) | 0 (0.0%) |
| Bottled, Tank, or LP Gas | 0 (0.0%) | 0 (0.0%) |
| Electricity | 150 (87.7%) | 121 (69.9%) |
| Fuel Oil or Kerosene | 0 (0.0%) | 0 (0.0%) |
| Coal or Coke | 0 (0.0%) | 0 (0.0%) |
| All other Fuels | 0 (0.0%) | 0 (0.0%) |
| No Fuel Used | 21 (12.3%) | 52 (30.1%) |
| Total | 171 (100.0%) | 173 (100.0%) |
Household Vehicle Usage in Limestone Creek
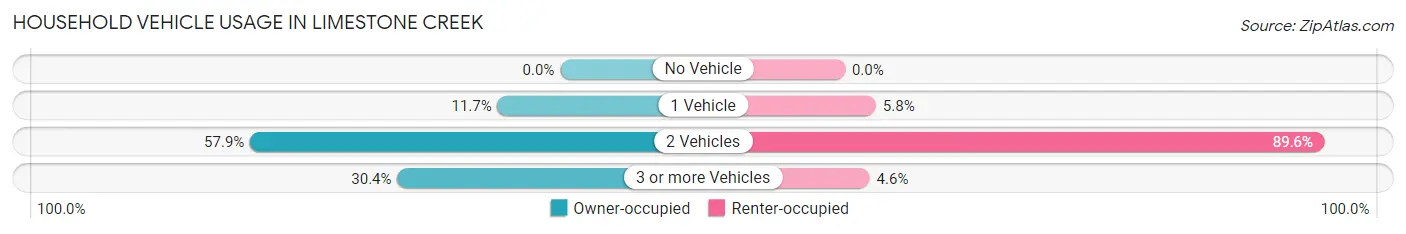
| Vehicles per Household | Owner-occupied | Renter-occupied |
| No Vehicle | 0 (0.0%) | 0 (0.0%) |
| 1 Vehicle | 20 (11.7%) | 10 (5.8%) |
| 2 Vehicles | 99 (57.9%) | 155 (89.6%) |
| 3 or more Vehicles | 52 (30.4%) | 8 (4.6%) |
| Total | 171 (100.0%) | 173 (100.0%) |
Real Estate & Mortgages in Limestone Creek
Real Estate and Mortgage Overview in Limestone Creek
| Characteristic | Without Mortgage | With Mortgage |
| Housing Units | 40 | 131 |
| Median Property Value | $267,400 | $352,900 |
| Median Household Income | $61,667 | $28 |
| Monthly Housing Costs | $388 | $8 |
| Real Estate Taxes | $1,188 | $0 |
Property Value by Mortgage Status in Limestone Creek
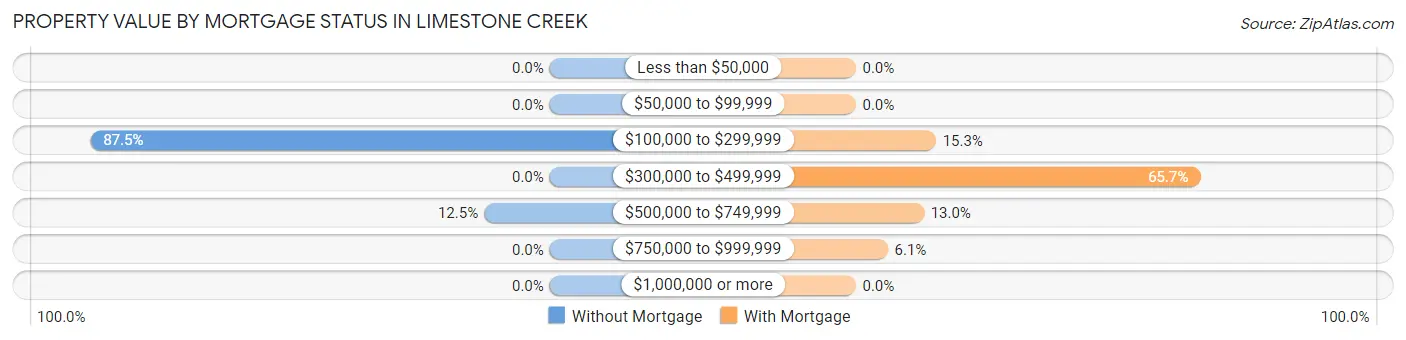
| Property Value | Without Mortgage | With Mortgage |
| Less than $50,000 | 0 (0.0%) | 0 (0.0%) |
| $50,000 to $99,999 | 0 (0.0%) | 0 (0.0%) |
| $100,000 to $299,999 | 35 (87.5%) | 20 (15.3%) |
| $300,000 to $499,999 | 0 (0.0%) | 86 (65.6%) |
| $500,000 to $749,999 | 5 (12.5%) | 17 (13.0%) |
| $750,000 to $999,999 | 0 (0.0%) | 8 (6.1%) |
| $1,000,000 or more | 0 (0.0%) | 0 (0.0%) |
| Total | 40 (100.0%) | 131 (100.0%) |
Household Income by Mortgage Status in Limestone Creek
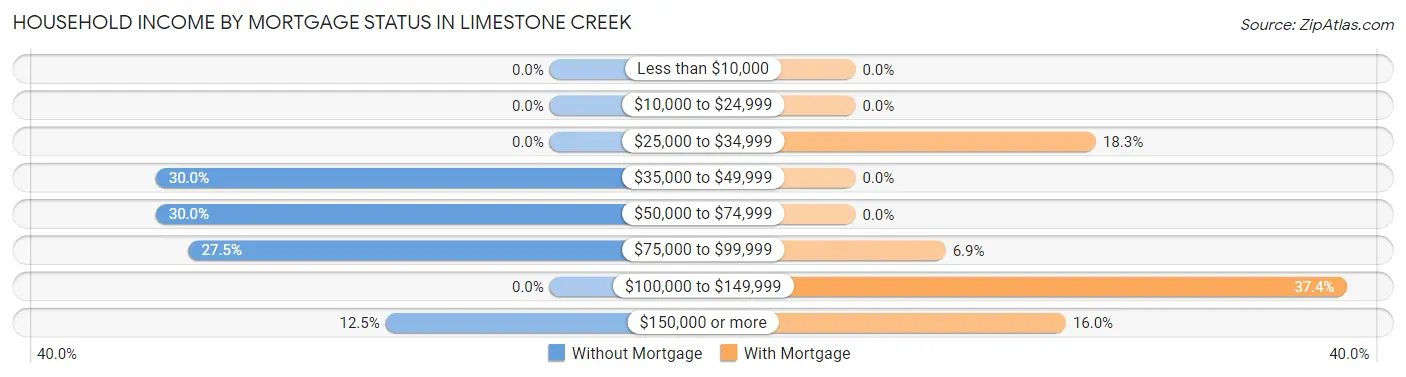
| Household Income | Without Mortgage | With Mortgage |
| Less than $10,000 | 0 (0.0%) | 0 (0.0%) |
| $10,000 to $24,999 | 0 (0.0%) | 0 (0.0%) |
| $25,000 to $34,999 | 0 (0.0%) | 24 (18.3%) |
| $35,000 to $49,999 | 12 (30.0%) | 0 (0.0%) |
| $50,000 to $74,999 | 12 (30.0%) | 0 (0.0%) |
| $75,000 to $99,999 | 11 (27.5%) | 9 (6.9%) |
| $100,000 to $149,999 | 0 (0.0%) | 49 (37.4%) |
| $150,000 or more | 5 (12.5%) | 21 (16.0%) |
| Total | 40 (100.0%) | 131 (100.0%) |
Property Value to Household Income Ratio in Limestone Creek
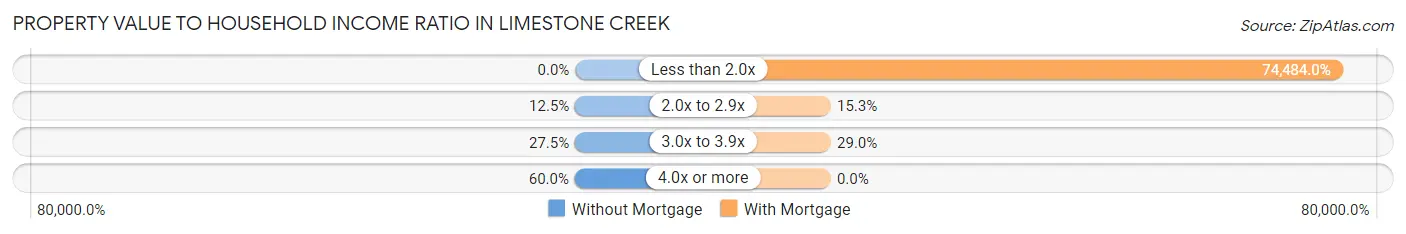
| Value-to-Income Ratio | Without Mortgage | With Mortgage |
| Less than 2.0x | 0 (0.0%) | 97,574 (74,484.0%) |
| 2.0x to 2.9x | 5 (12.5%) | 20 (15.3%) |
| 3.0x to 3.9x | 11 (27.5%) | 38 (29.0%) |
| 4.0x or more | 24 (60.0%) | 0 (0.0%) |
| Total | 40 (100.0%) | 131 (100.0%) |
Real Estate Taxes by Mortgage Status in Limestone Creek
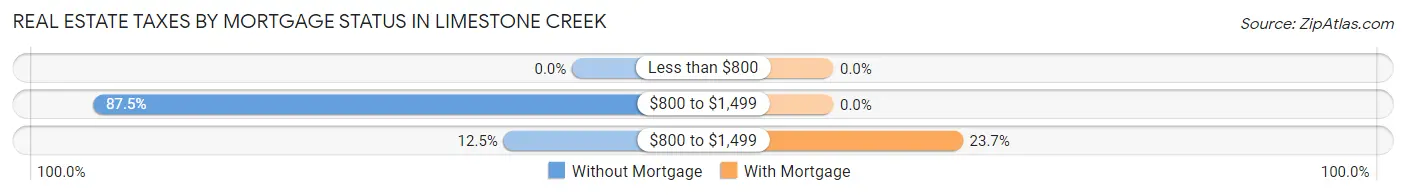
| Property Taxes | Without Mortgage | With Mortgage |
| Less than $800 | 0 (0.0%) | 0 (0.0%) |
| $800 to $1,499 | 35 (87.5%) | 0 (0.0%) |
| $800 to $1,499 | 5 (12.5%) | 31 (23.7%) |
| Total | 40 (100.0%) | 131 (100.0%) |
Health & Disability in Limestone Creek
Health Insurance Coverage by Age in Limestone Creek
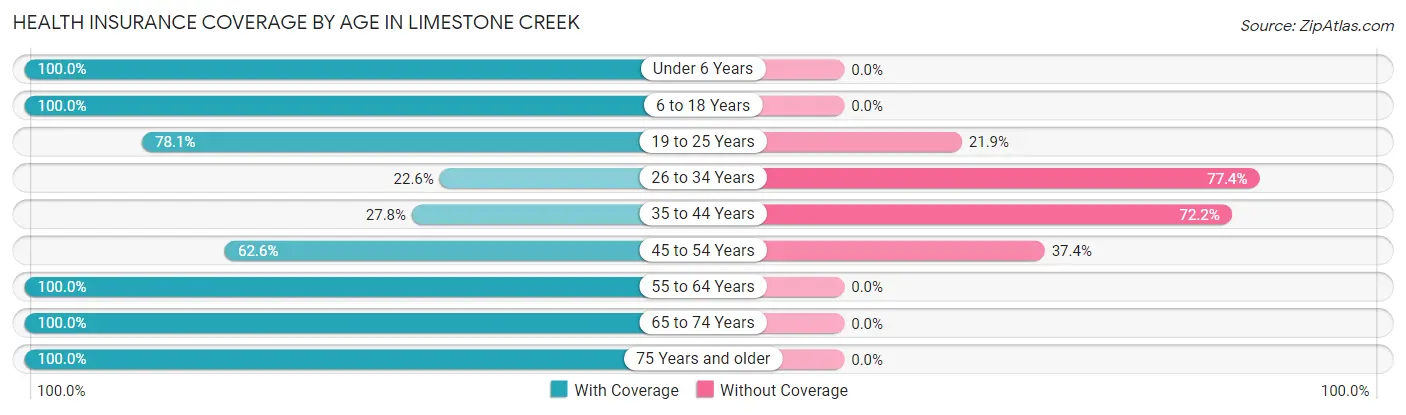
| Age Bracket | With Coverage | Without Coverage |
| Under 6 Years | 76 (100.0%) | 0 (0.0%) |
| 6 to 18 Years | 160 (100.0%) | 0 (0.0%) |
| 19 to 25 Years | 57 (78.1%) | 16 (21.9%) |
| 26 to 34 Years | 71 (22.6%) | 243 (77.4%) |
| 35 to 44 Years | 105 (27.8%) | 273 (72.2%) |
| 45 to 54 Years | 191 (62.6%) | 114 (37.4%) |
| 55 to 64 Years | 93 (100.0%) | 0 (0.0%) |
| 65 to 74 Years | 12 (100.0%) | 0 (0.0%) |
| 75 Years and older | 49 (100.0%) | 0 (0.0%) |
| Total | 814 (55.7%) | 646 (44.3%) |
Health Insurance Coverage by Citizenship Status in Limestone Creek
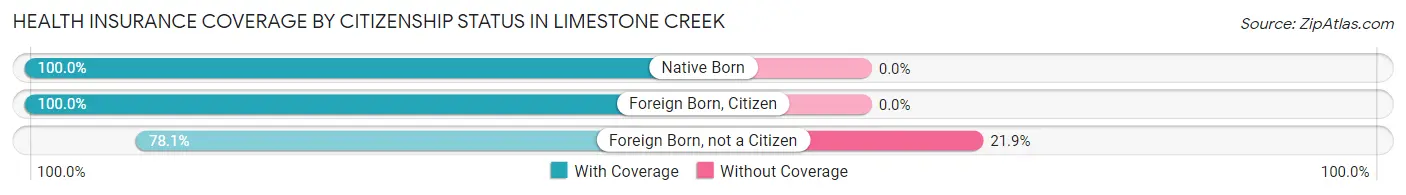
| Citizenship Status | With Coverage | Without Coverage |
| Native Born | 76 (100.0%) | 0 (0.0%) |
| Foreign Born, Citizen | 160 (100.0%) | 0 (0.0%) |
| Foreign Born, not a Citizen | 57 (78.1%) | 16 (21.9%) |
Health Insurance Coverage by Household Income in Limestone Creek
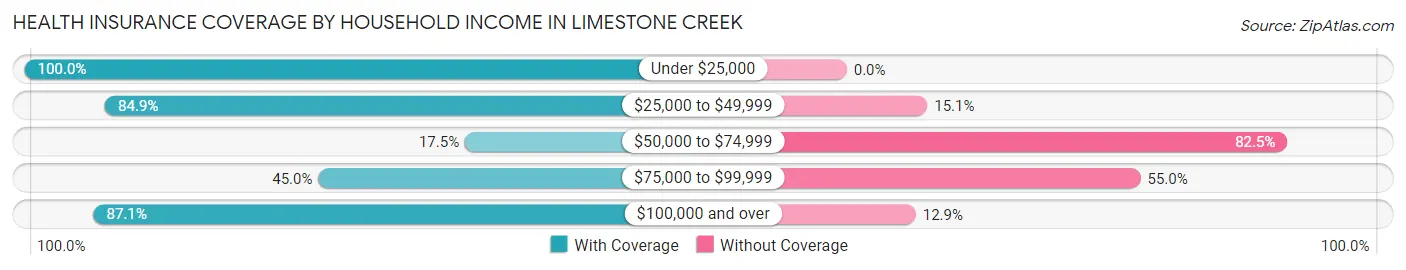
| Household Income | With Coverage | Without Coverage |
| Under $25,000 | 143 (100.0%) | 0 (0.0%) |
| $25,000 to $49,999 | 90 (84.9%) | 16 (15.1%) |
| $50,000 to $74,999 | 39 (17.5%) | 184 (82.5%) |
| $75,000 to $99,999 | 340 (45.0%) | 416 (55.0%) |
| $100,000 and over | 202 (87.1%) | 30 (12.9%) |
Public vs Private Health Insurance Coverage by Age in Limestone Creek
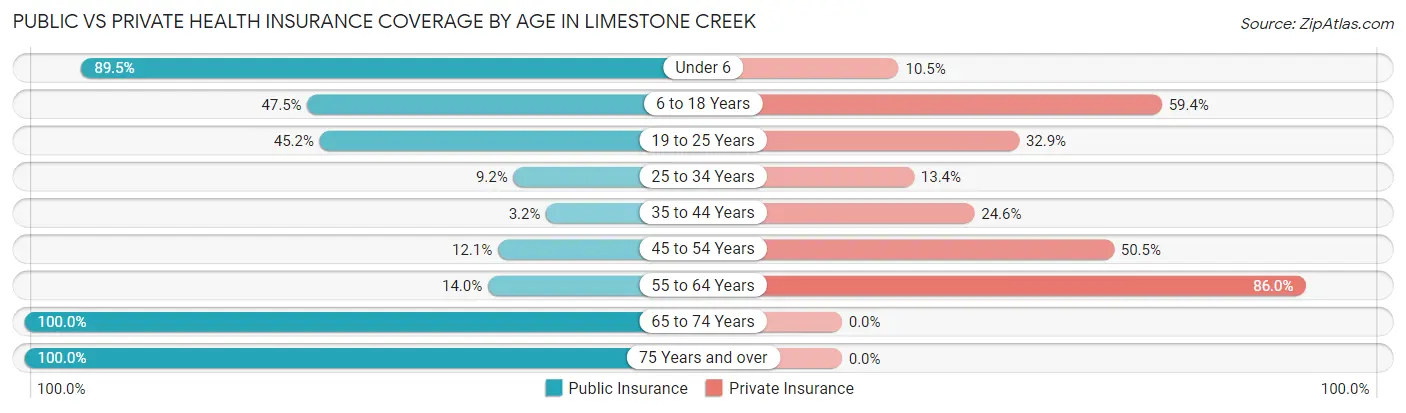
| Age Bracket | Public Insurance | Private Insurance |
| Under 6 | 68 (89.5%) | 8 (10.5%) |
| 6 to 18 Years | 76 (47.5%) | 95 (59.4%) |
| 19 to 25 Years | 33 (45.2%) | 24 (32.9%) |
| 25 to 34 Years | 29 (9.2%) | 42 (13.4%) |
| 35 to 44 Years | 12 (3.2%) | 93 (24.6%) |
| 45 to 54 Years | 37 (12.1%) | 154 (50.5%) |
| 55 to 64 Years | 13 (14.0%) | 80 (86.0%) |
| 65 to 74 Years | 12 (100.0%) | 0 (0.0%) |
| 75 Years and over | 49 (100.0%) | 0 (0.0%) |
| Total | 329 (22.5%) | 496 (34.0%) |
Disability Status by Sex by Age in Limestone Creek
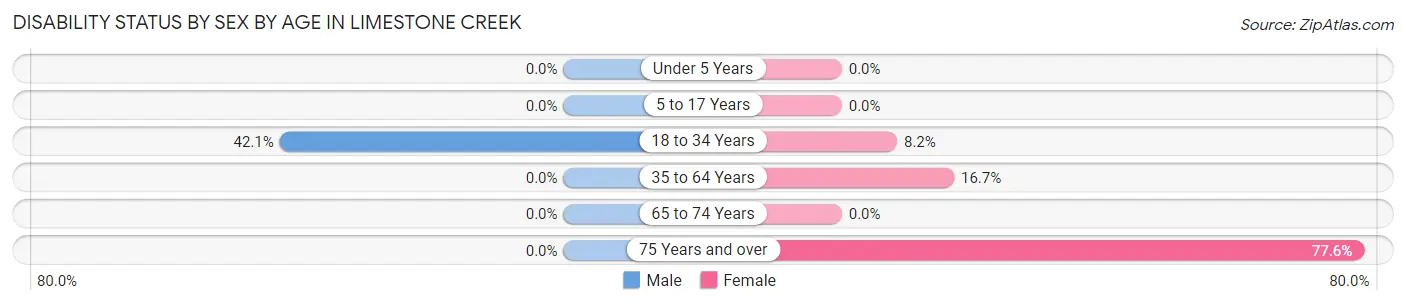
| Age Bracket | Male | Female |
| Under 5 Years | 0 (0.0%) | 0 (0.0%) |
| 5 to 17 Years | 0 (0.0%) | 0 (0.0%) |
| 18 to 34 Years | 126 (42.1%) | 10 (8.2%) |
| 35 to 64 Years | 0 (0.0%) | 38 (16.7%) |
| 65 to 74 Years | 0 (0.0%) | 0 (0.0%) |
| 75 Years and over | 0 (0.0%) | 38 (77.5%) |
Disability Class by Sex by Age in Limestone Creek
Disability Class: Hearing Difficulty
| Age Bracket | Male | Female |
| Under 5 Years | 0 (0.0%) | 0 (0.0%) |
| 5 to 17 Years | 0 (0.0%) | 0 (0.0%) |
| 18 to 34 Years | 0 (0.0%) | 0 (0.0%) |
| 35 to 64 Years | 0 (0.0%) | 0 (0.0%) |
| 65 to 74 Years | 0 (0.0%) | 0 (0.0%) |
| 75 Years and over | 0 (0.0%) | 0 (0.0%) |
Disability Class: Vision Difficulty
| Age Bracket | Male | Female |
| Under 5 Years | 0 (0.0%) | 0 (0.0%) |
| 5 to 17 Years | 0 (0.0%) | 0 (0.0%) |
| 18 to 34 Years | 0 (0.0%) | 0 (0.0%) |
| 35 to 64 Years | 0 (0.0%) | 0 (0.0%) |
| 65 to 74 Years | 0 (0.0%) | 0 (0.0%) |
| 75 Years and over | 0 (0.0%) | 0 (0.0%) |
Disability Class: Cognitive Difficulty
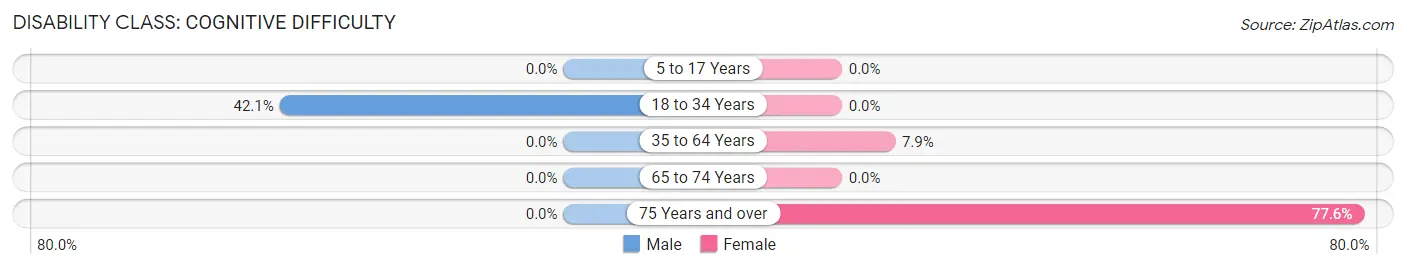
| Age Bracket | Male | Female |
| 5 to 17 Years | 0 (0.0%) | 0 (0.0%) |
| 18 to 34 Years | 126 (42.1%) | 0 (0.0%) |
| 35 to 64 Years | 0 (0.0%) | 18 (7.9%) |
| 65 to 74 Years | 0 (0.0%) | 0 (0.0%) |
| 75 Years and over | 0 (0.0%) | 38 (77.5%) |
Disability Class: Ambulatory Difficulty
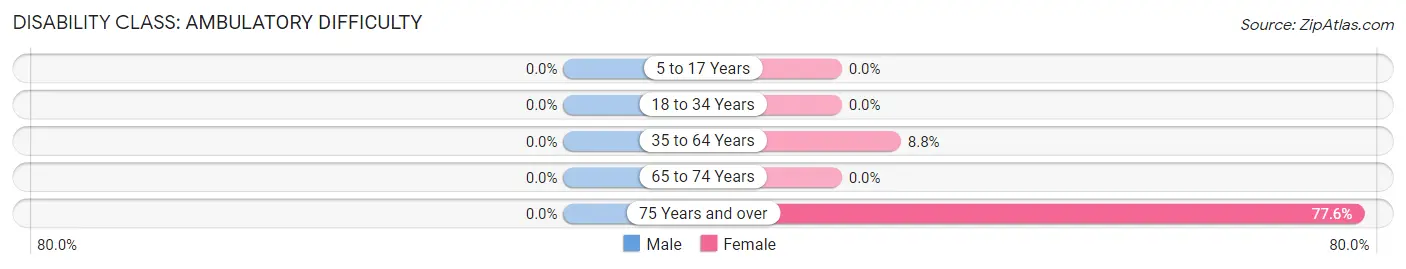
| Age Bracket | Male | Female |
| 5 to 17 Years | 0 (0.0%) | 0 (0.0%) |
| 18 to 34 Years | 0 (0.0%) | 0 (0.0%) |
| 35 to 64 Years | 0 (0.0%) | 20 (8.8%) |
| 65 to 74 Years | 0 (0.0%) | 0 (0.0%) |
| 75 Years and over | 0 (0.0%) | 38 (77.5%) |
Disability Class: Self-Care Difficulty
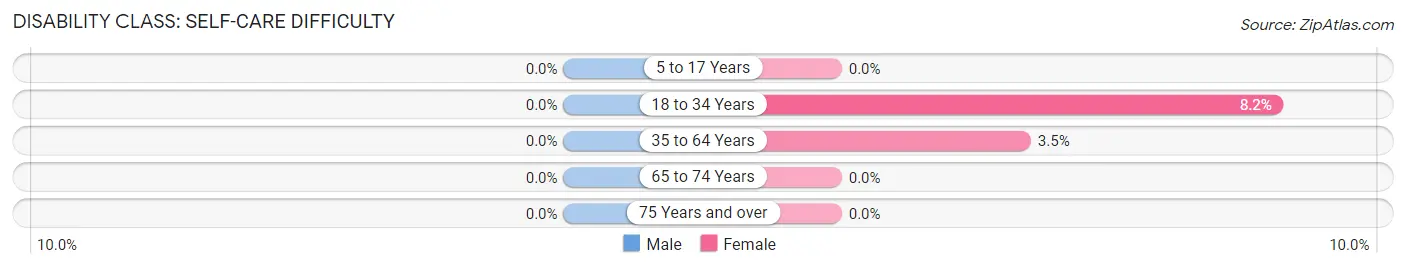
| Age Bracket | Male | Female |
| 5 to 17 Years | 0 (0.0%) | 0 (0.0%) |
| 18 to 34 Years | 0 (0.0%) | 10 (8.2%) |
| 35 to 64 Years | 0 (0.0%) | 8 (3.5%) |
| 65 to 74 Years | 0 (0.0%) | 0 (0.0%) |
| 75 Years and over | 0 (0.0%) | 0 (0.0%) |
Technology Access in Limestone Creek
Computing Device Access in Limestone Creek
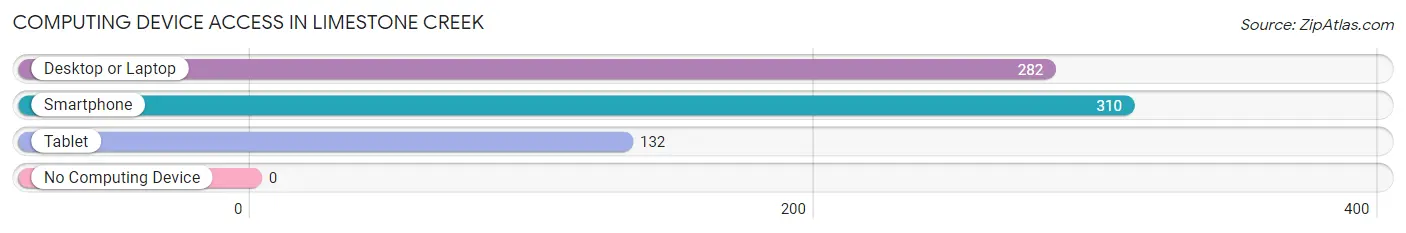
| Device Type | # Households | % Households |
| Desktop or Laptop | 282 | 82.0% |
| Smartphone | 310 | 90.1% |
| Tablet | 132 | 38.4% |
| No Computing Device | 0 | 0.0% |
| Total | 344 | 100.0% |
Internet Access in Limestone Creek
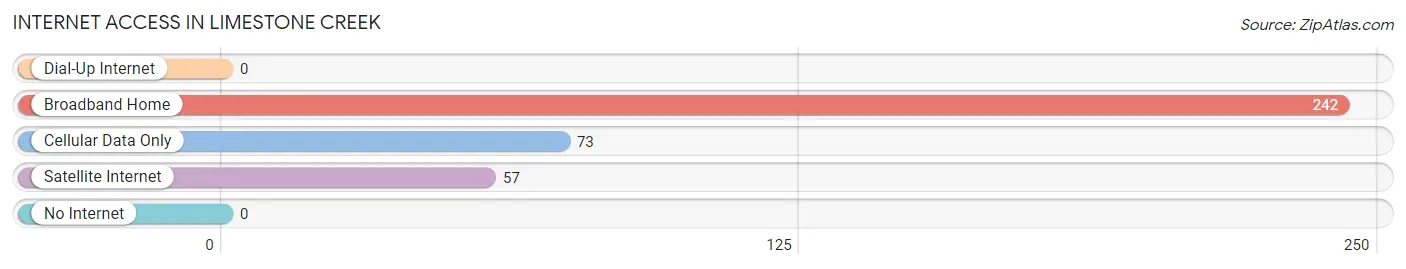
| Internet Type | # Households | % Households |
| Dial-Up Internet | 0 | 0.0% |
| Broadband Home | 242 | 70.4% |
| Cellular Data Only | 73 | 21.2% |
| Satellite Internet | 57 | 16.6% |
| No Internet | 0 | 0.0% |
| Total | 344 | 100.0% |
Limestone Creek Summary
Limestone Creek is a small unincorporated community located in the western part of St. Lucie County, Florida. It is situated on the banks of the St. Lucie River, just south of the city of Port St. Lucie. The community is home to a diverse population of approximately 1,000 people, and is known for its rural charm and laid-back lifestyle.
History
Limestone Creek was first settled in the late 1800s by settlers from the Bahamas. The area was originally known as “Limestone Creek Settlement” and was home to a small farming community. The settlement was named after the limestone deposits found in the area, which were used to build roads and other structures.
In the early 1900s, the area began to grow as more settlers moved in. The settlement was officially incorporated as the Town of Limestone Creek in 1925. The town was home to a variety of businesses, including a general store, a post office, a school, and a church.
In the 1950s, the town began to decline as many of the businesses closed and the population dwindled. In the 1970s, the town was annexed by the City of Port St. Lucie, and the area became known as Limestone Creek.
Geography
Limestone Creek is located in the western part of St. Lucie County, Florida. It is situated on the banks of the St. Lucie River, just south of the city of Port St. Lucie. The community is bordered by the cities of Fort Pierce and Port St. Lucie to the north, and the Indian River Lagoon to the east.
The area is characterized by flat terrain, with an elevation of just 10 feet above sea level. The climate is subtropical, with hot, humid summers and mild winters. The average annual temperature is around 75 degrees Fahrenheit.
Economy
The economy of Limestone Creek is largely based on agriculture and tourism. The area is home to several farms, which produce a variety of crops, including citrus, vegetables, and hay. The area is also home to several tourist attractions, including the St. Lucie County Aquarium and the Limestone Creek Nature Center.
The area is also home to several businesses, including restaurants, retail stores, and professional services. The area is served by the St. Lucie County School District, which operates several schools in the area.
Demographics
As of the 2010 census, the population of Limestone Creek was 1,000. The racial makeup of the community was 79.2% White, 14.2% African American, 0.7% Native American, 0.7% Asian, and 4.9% from other races. The median household income was $41,250, and the median age was 43.
Conclusion
Limestone Creek is a small unincorporated community located in the western part of St. Lucie County, Florida. It is situated on the banks of the St. Lucie River, just south of the city of Port St. Lucie. The community is home to a diverse population of approximately 1,000 people, and is known for its rural charm and laid-back lifestyle. The economy of Limestone Creek is largely based on agriculture and tourism, and the area is served by the St. Lucie County School District. The racial makeup of the community is 79.2% White, 14.2% African American, 0.7% Native American, 0.7% Asian, and 4.9% from other races. The median household income was $41,250, and the median age was 43.
Common Questions
What is Per Capita Income in Limestone Creek?
Per Capita income in Limestone Creek is $25,476.
What is the Median Family Income in Limestone Creek?
Median Family Income in Limestone Creek is $64,135.
What is the Median Household income in Limestone Creek?
Median Household Income in Limestone Creek is $85,691.
What is Income or Wage Gap in Limestone Creek?
Income or Wage Gap in Limestone Creek is 3.8%.
Women in Limestone Creek earn 96.2 cents for every dollar earned by a man.
What is Inequality or Gini Index in Limestone Creek?
Inequality or Gini Index in Limestone Creek is 0.30.
What is the Total Population of Limestone Creek?
Total Population of Limestone Creek is 1,460.
What is the Total Male Population of Limestone Creek?
Total Male Population of Limestone Creek is 966.
What is the Total Female Population of Limestone Creek?
Total Female Population of Limestone Creek is 494.
What is the Ratio of Males per 100 Females in Limestone Creek?
There are 195.55 Males per 100 Females in Limestone Creek.
What is the Ratio of Females per 100 Males in Limestone Creek?
There are 51.14 Females per 100 Males in Limestone Creek.
What is the Median Population Age in Limestone Creek?
Median Population Age in Limestone Creek is 39.7 Years.
What is the Average Family Size in Limestone Creek
Average Family Size in Limestone Creek is 4.8 People.
What is the Average Household Size in Limestone Creek
Average Household Size in Limestone Creek is 4.2 People.
How Large is the Labor Force in Limestone Creek?
There are 1,049 People in the Labor Forcein in Limestone Creek.
What is the Percentage of People in the Labor Force in Limestone Creek?
82.7% of People are in the Labor Force in Limestone Creek.
What is the Unemployment Rate in Limestone Creek?
Unemployment Rate in Limestone Creek is 5.1%.