Louisville, AL Map & Demographics
Louisville Map
Louisville Overview
$24,818
PER CAPITA INCOME
$40,721
AVG HOUSEHOLD INCOME
38.2%
WAGE / INCOME GAP [ % ]
61.8¢/ $1
WAGE / INCOME GAP [ $ ]
0.45
INEQUALITY / GINI INDEX
612
TOTAL POPULATION
309
MALE POPULATION
303
FEMALE POPULATION
101.98
MALES / 100 FEMALES
98.06
FEMALES / 100 MALES
32.5
MEDIAN AGE
3.8
AVG FAMILY SIZE
2.2
AVG HOUSEHOLD SIZE
350
LABOR FORCE [ PEOPLE ]
71.4%
PERCENT IN LABOR FORCE
3.4%
UNEMPLOYMENT RATE
Louisville Zip Codes
Louisville Area Codes
Income in Louisville
Income Overview in Louisville
| Characteristic | Number | Measure |
| Per Capita Income | 612 | $24,818 |
| Median Family Income | 116 | $0 |
| Mean Family Income | 116 | $68,527 |
| Median Household Income | 272 | $40,721 |
| Mean Household Income | 272 | $50,367 |
| Income Deficit | 116 | $0 |
| Wage / Income Gap (%) | 612 | 38.22% |
| Wage / Income Gap ($) | 612 | 61.78¢ per $1 |
| Gini / Inequality Index | 612 | 0.45 |
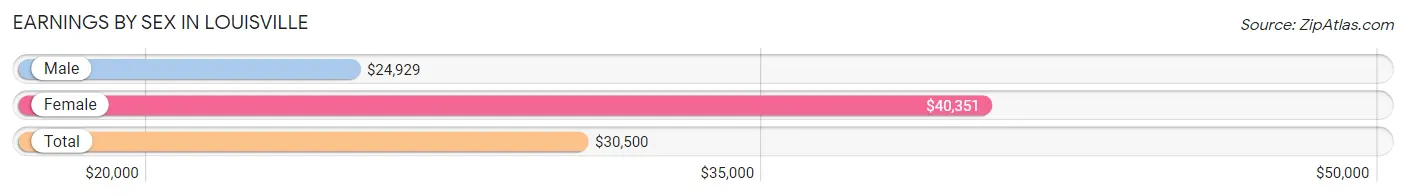
Earnings by Sex in Louisville
Average Earnings in Louisville are $30,500, $24,929 for men and $40,351 for women, a difference of 38.2%.
| Sex | Number | Average Earnings |
| Male | 202 (57.4%) | $24,929 |
| Female | 150 (42.6%) | $40,351 |
| Total | 352 (100.0%) | $30,500 |
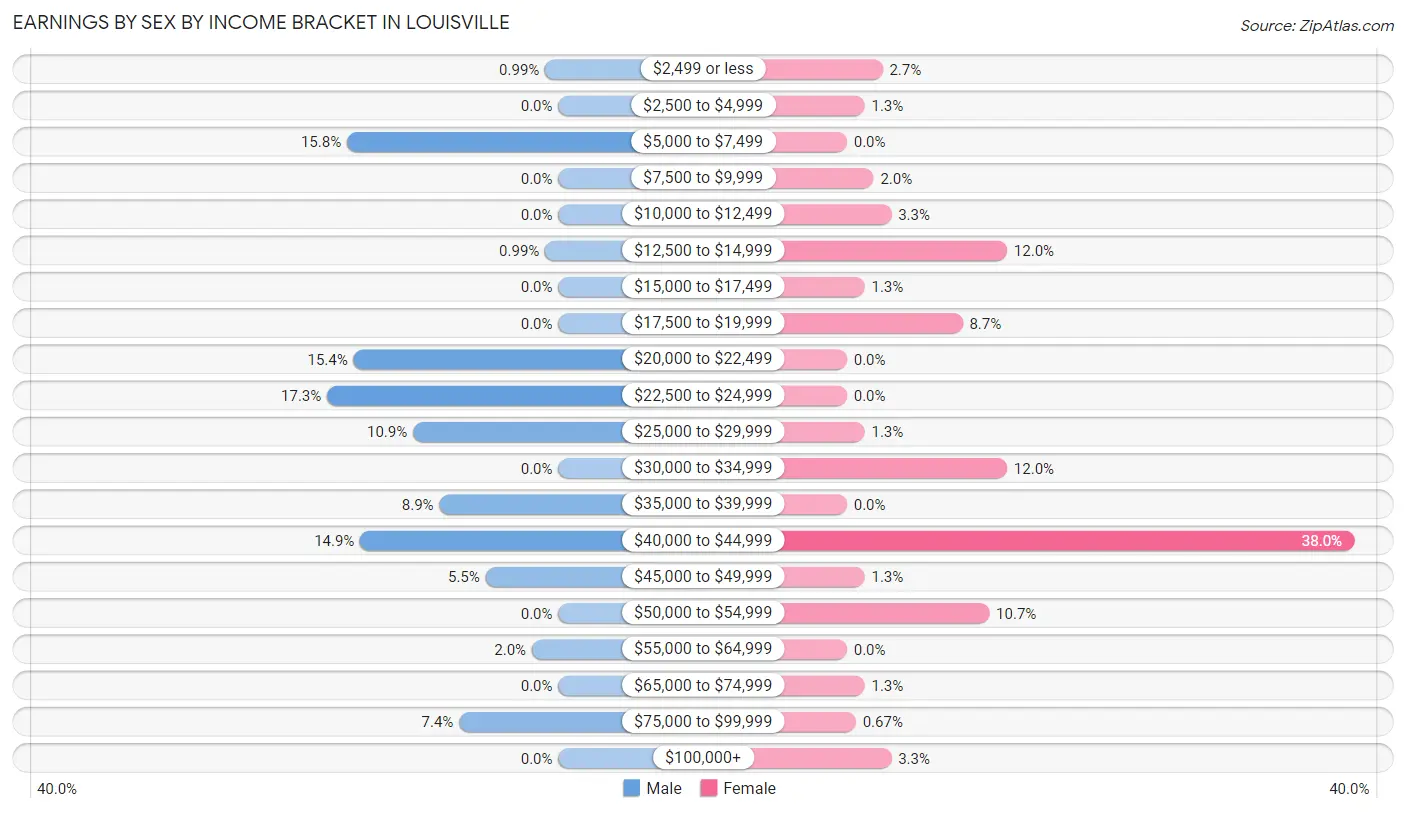
Earnings by Sex by Income Bracket in Louisville
The most common earnings brackets in Louisville are $22,500 to $24,999 for men (35 | 17.3%) and $40,000 to $44,999 for women (57 | 38.0%).
| Income | Male | Female |
| $2,499 or less | 2 (1.0%) | 4 (2.7%) |
| $2,500 to $4,999 | 0 (0.0%) | 2 (1.3%) |
| $5,000 to $7,499 | 32 (15.8%) | 0 (0.0%) |
| $7,500 to $9,999 | 0 (0.0%) | 3 (2.0%) |
| $10,000 to $12,499 | 0 (0.0%) | 5 (3.3%) |
| $12,500 to $14,999 | 2 (1.0%) | 18 (12.0%) |
| $15,000 to $17,499 | 0 (0.0%) | 2 (1.3%) |
| $17,500 to $19,999 | 0 (0.0%) | 13 (8.7%) |
| $20,000 to $22,499 | 31 (15.3%) | 0 (0.0%) |
| $22,500 to $24,999 | 35 (17.3%) | 0 (0.0%) |
| $25,000 to $29,999 | 22 (10.9%) | 2 (1.3%) |
| $30,000 to $34,999 | 0 (0.0%) | 18 (12.0%) |
| $35,000 to $39,999 | 18 (8.9%) | 0 (0.0%) |
| $40,000 to $44,999 | 30 (14.8%) | 57 (38.0%) |
| $45,000 to $49,999 | 11 (5.4%) | 2 (1.3%) |
| $50,000 to $54,999 | 0 (0.0%) | 16 (10.7%) |
| $55,000 to $64,999 | 4 (2.0%) | 0 (0.0%) |
| $65,000 to $74,999 | 0 (0.0%) | 2 (1.3%) |
| $75,000 to $99,999 | 15 (7.4%) | 1 (0.7%) |
| $100,000+ | 0 (0.0%) | 5 (3.3%) |
| Total | 202 (100.0%) | 150 (100.0%) |
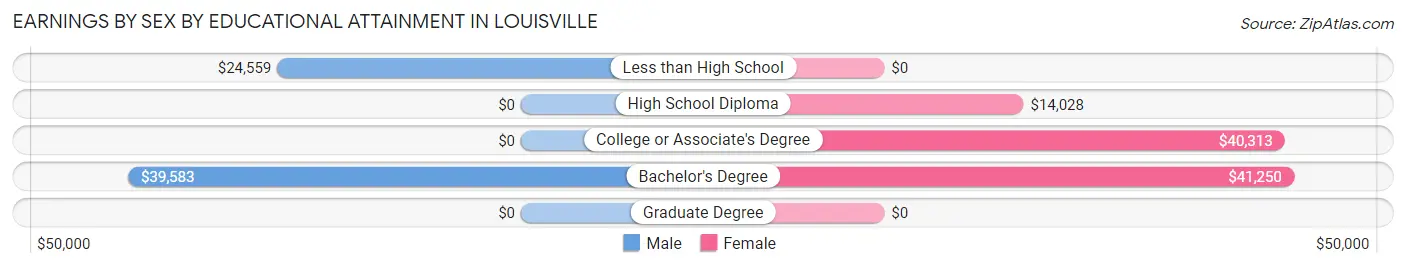
Earnings by Sex by Educational Attainment in Louisville
Average earnings in Louisville are $24,286 for men and $40,088 for women, a difference of 39.4%. Men with an educational attainment of bachelor's degree enjoy the highest average annual earnings of $39,583, while those with less than high school education earn the least with $24,559. Women with an educational attainment of bachelor's degree earn the most with the average annual earnings of $41,250, while those with high school diploma education have the smallest earnings of $14,028.
| Educational Attainment | Male Income | Female Income |
| Less than High School | $24,559 | $0 |
| High School Diploma | - | - |
| College or Associate's Degree | - | - |
| Bachelor's Degree | $39,583 | $41,250 |
| Graduate Degree | - | - |
| Total | $24,286 | $40,088 |
Family Income in Louisville
Family Income Brackets in Louisville
According to the Louisville family income data, there are 33 families falling into the $100,000 to $149,999 income range, which is the most common income bracket and makes up 28.4% of all families.
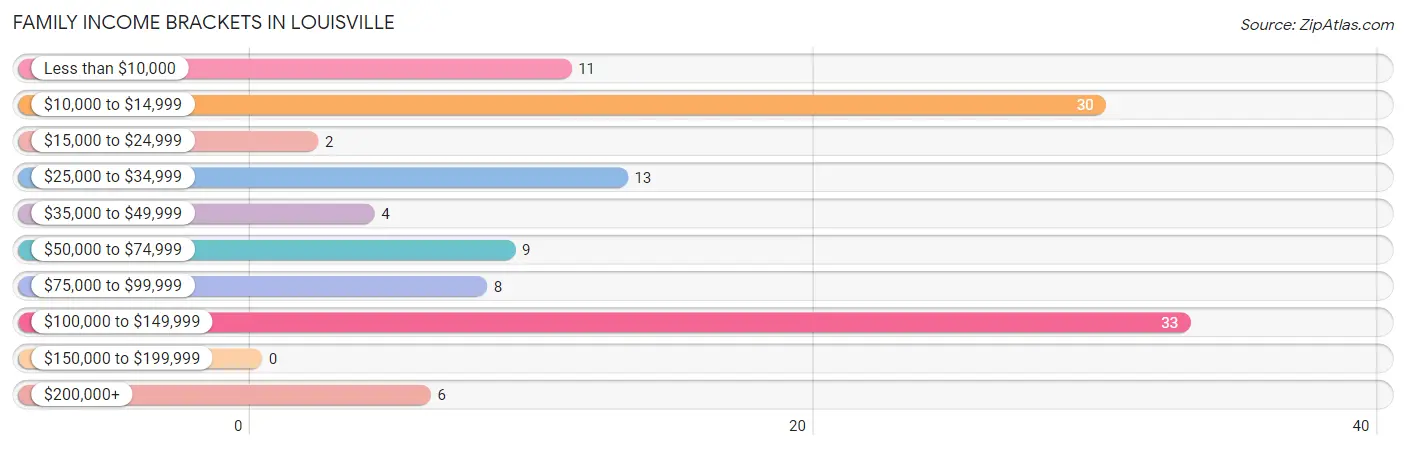
| Income Bracket | # Families | % Families |
| Less than $10,000 | 11 | 9.5% |
| $10,000 to $14,999 | 30 | 25.9% |
| $15,000 to $24,999 | 2 | 1.7% |
| $25,000 to $34,999 | 13 | 11.2% |
| $35,000 to $49,999 | 4 | 3.4% |
| $50,000 to $74,999 | 9 | 7.8% |
| $75,000 to $99,999 | 8 | 6.9% |
| $100,000 to $149,999 | 33 | 28.4% |
| $150,000 to $199,999 | 0 | 0.0% |
| $200,000+ | 6 | 5.2% |
Family Income by Famaliy Size in Louisville
4-person families (46 | 39.7%) account for the highest median family income in Louisville with $122,778 per family, while 4-person families (46 | 39.7%) have the highest median income of $30,694 per family member.
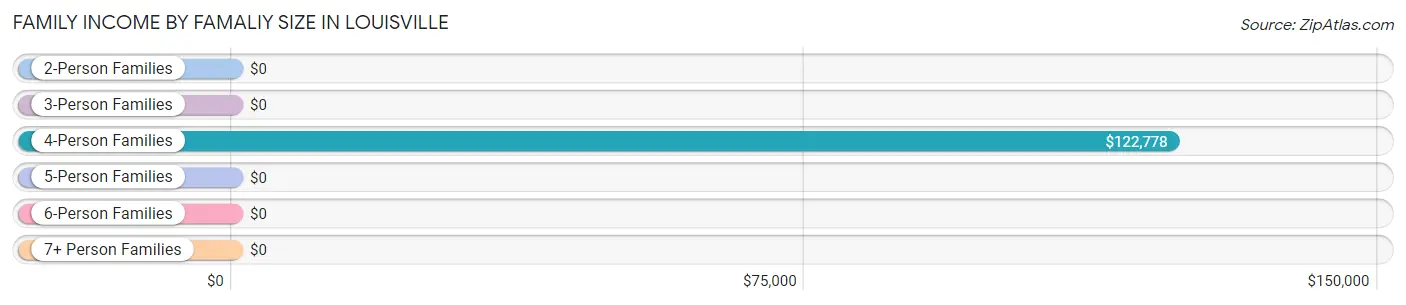
| Income Bracket | # Families | Median Income |
| 2-Person Families | 38 (32.8%) | $0 |
| 3-Person Families | 25 (21.5%) | $0 |
| 4-Person Families | 46 (39.7%) | $122,778 |
| 5-Person Families | 3 (2.6%) | $0 |
| 6-Person Families | 0 (0.0%) | $0 |
| 7+ Person Families | 4 (3.5%) | $0 |
| Total | 116 (100.0%) | $0 |
Family Income by Number of Earners in Louisville
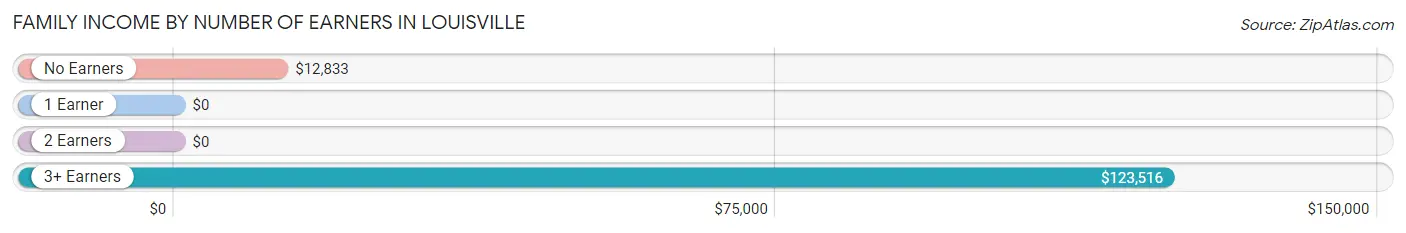
| Number of Earners | # Families | Median Income |
| No Earners | 42 (36.2%) | $12,833 |
| 1 Earner | 16 (13.8%) | $0 |
| 2 Earners | 39 (33.6%) | $0 |
| 3+ Earners | 19 (16.4%) | $123,516 |
| Total | 116 (100.0%) | $0 |
Household Income in Louisville
Household Income Brackets in Louisville
With 80 households falling in the category, the $35,000 to $49,999 income range is the most frequent in Louisville, accounting for 29.4% of all households.
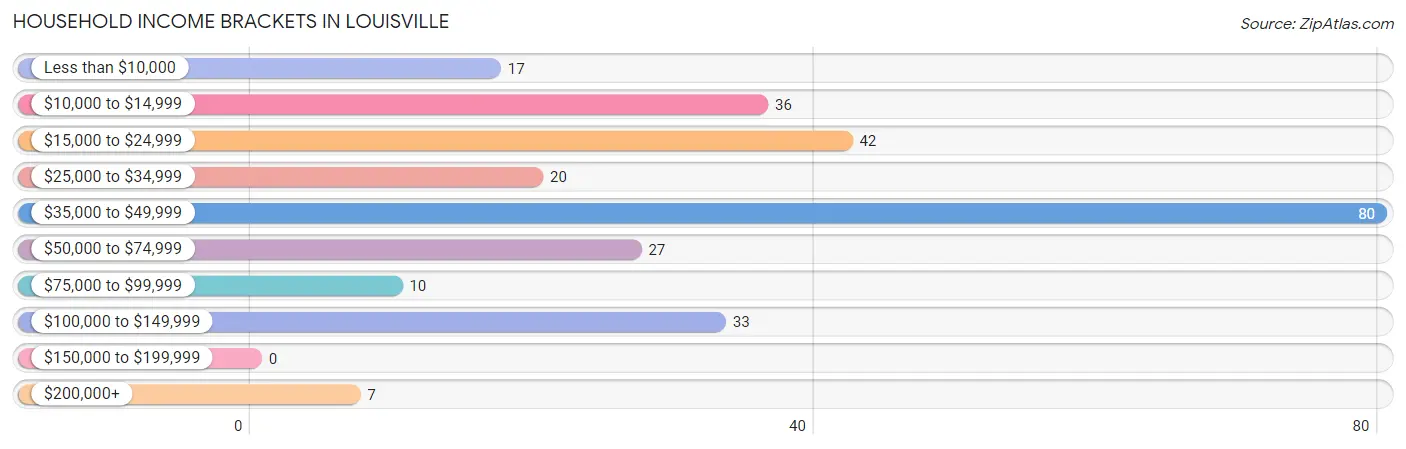
| Income Bracket | # Households | % Households |
| Less than $10,000 | 17 | 6.3% |
| $10,000 to $14,999 | 36 | 13.2% |
| $15,000 to $24,999 | 42 | 15.4% |
| $25,000 to $34,999 | 20 | 7.4% |
| $35,000 to $49,999 | 80 | 29.4% |
| $50,000 to $74,999 | 27 | 9.9% |
| $75,000 to $99,999 | 10 | 3.7% |
| $100,000 to $149,999 | 33 | 12.1% |
| $150,000 to $199,999 | 0 | 0.0% |
| $200,000+ | 7 | 2.6% |
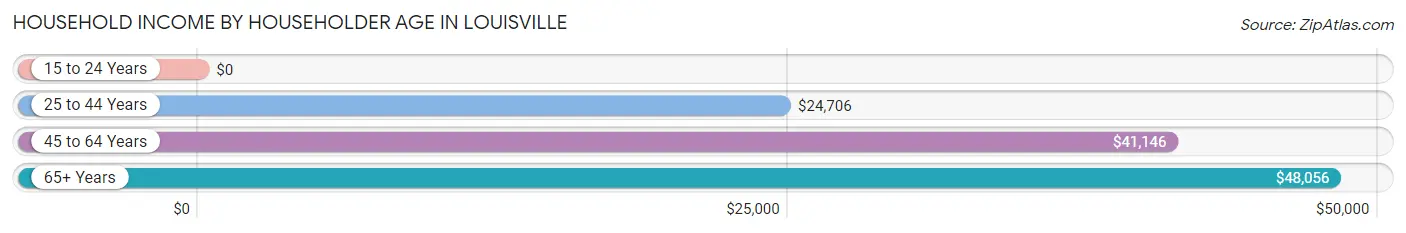
Household Income by Householder Age in Louisville
The median household income in Louisville is $40,721, with the highest median household income of $48,056 found in the 65+ years age bracket for the primary householder. A total of 60 households (22.1%) fall into this category. Meanwhile, the 15 to 24 years age bracket for the primary householder has the lowest median household income of $0, with 16 households (5.9%) in this group.
| Income Bracket | # Households | Median Income |
| 15 to 24 Years | 16 (5.9%) | $0 |
| 25 to 44 Years | 104 (38.2%) | $24,706 |
| 45 to 64 Years | 92 (33.8%) | $41,146 |
| 65+ Years | 60 (22.1%) | $48,056 |
| Total | 272 (100.0%) | $40,721 |
Poverty in Louisville
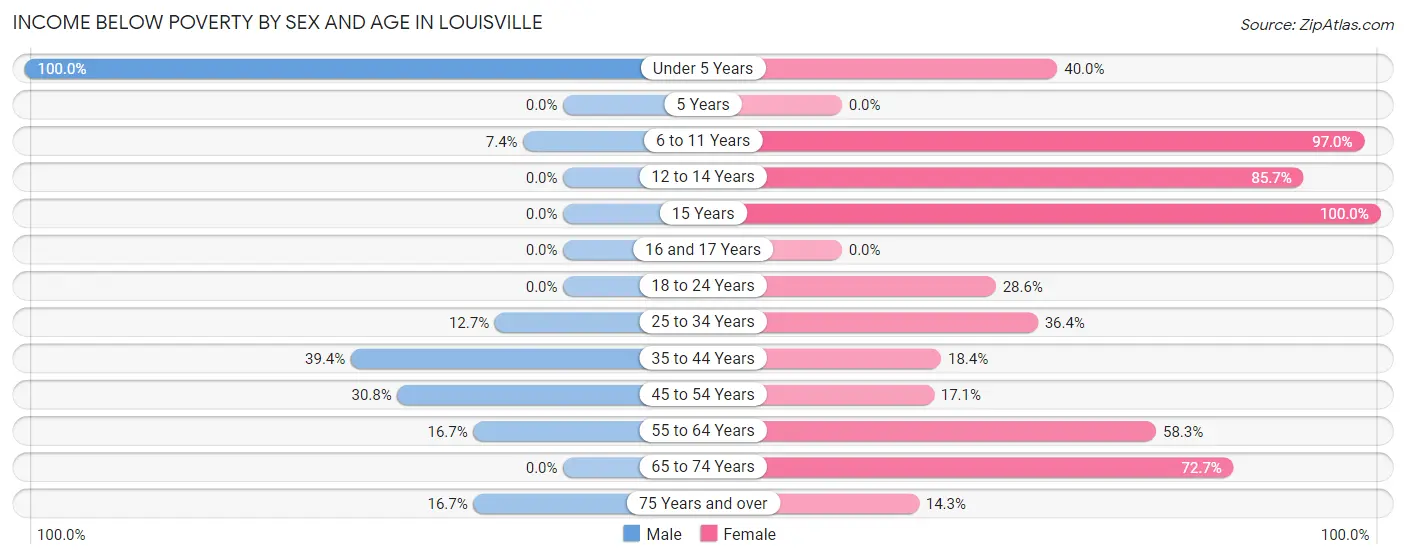
Income Below Poverty by Sex and Age in Louisville
With 15.5% poverty level for males and 35.6% for females among the residents of Louisville, under 5 year old males and 15 year old females are the most vulnerable to poverty, with 4 males (100.0%) and 2 females (100.0%) in their respective age groups living below the poverty level.
| Age Bracket | Male | Female |
| Under 5 Years | 4 (100.0%) | 2 (40.0%) |
| 5 Years | 0 (0.0%) | 0 (0.0%) |
| 6 to 11 Years | 2 (7.4%) | 32 (97.0%) |
| 12 to 14 Years | 0 (0.0%) | 12 (85.7%) |
| 15 Years | 0 (0.0%) | 2 (100.0%) |
| 16 and 17 Years | 0 (0.0%) | 0 (0.0%) |
| 18 to 24 Years | 0 (0.0%) | 8 (28.6%) |
| 25 to 34 Years | 17 (12.7%) | 12 (36.4%) |
| 35 to 44 Years | 13 (39.4%) | 7 (18.4%) |
| 45 to 54 Years | 8 (30.8%) | 14 (17.1%) |
| 55 to 64 Years | 1 (16.7%) | 7 (58.3%) |
| 65 to 74 Years | 0 (0.0%) | 8 (72.7%) |
| 75 Years and over | 3 (16.7%) | 4 (14.3%) |
| Total | 48 (15.5%) | 108 (35.6%) |
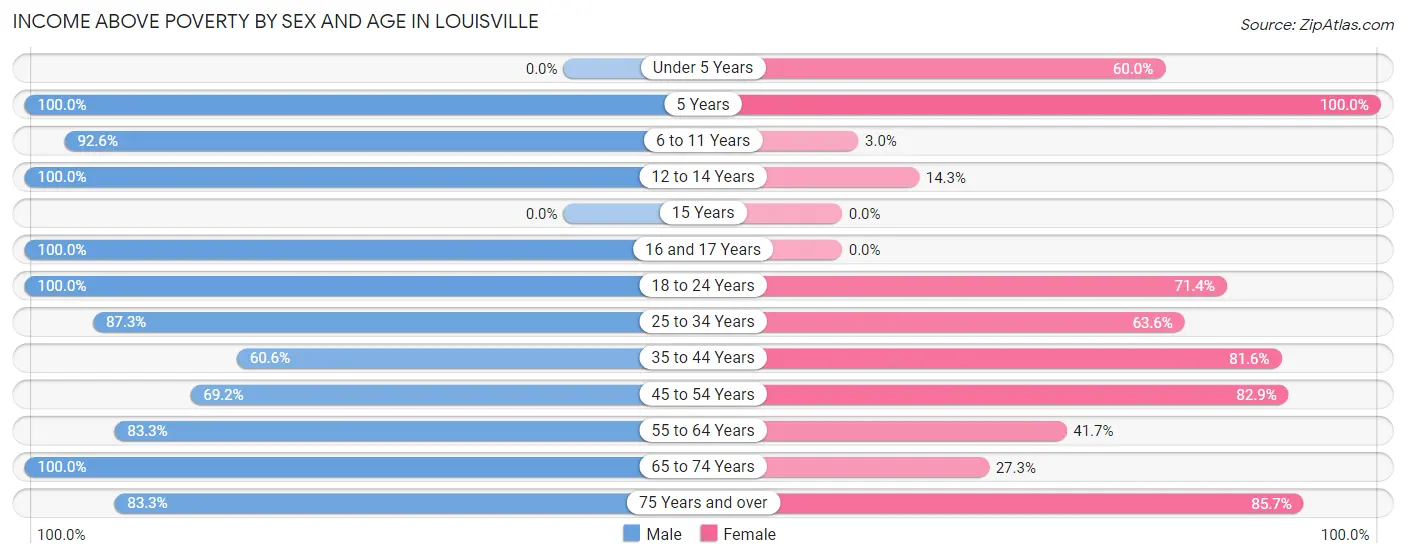
Income Above Poverty by Sex and Age in Louisville
According to the poverty statistics in Louisville, males aged 5 years and females aged 5 years are the age groups that are most secure financially, with 100.0% of males and 100.0% of females in these age groups living above the poverty line.
| Age Bracket | Male | Female |
| Under 5 Years | 0 (0.0%) | 3 (60.0%) |
| 5 Years | 16 (100.0%) | 17 (100.0%) |
| 6 to 11 Years | 25 (92.6%) | 1 (3.0%) |
| 12 to 14 Years | 4 (100.0%) | 2 (14.3%) |
| 15 Years | 0 (0.0%) | 0 (0.0%) |
| 16 and 17 Years | 3 (100.0%) | 0 (0.0%) |
| 18 to 24 Years | 18 (100.0%) | 20 (71.4%) |
| 25 to 34 Years | 117 (87.3%) | 21 (63.6%) |
| 35 to 44 Years | 20 (60.6%) | 31 (81.6%) |
| 45 to 54 Years | 18 (69.2%) | 68 (82.9%) |
| 55 to 64 Years | 5 (83.3%) | 5 (41.7%) |
| 65 to 74 Years | 20 (100.0%) | 3 (27.3%) |
| 75 Years and over | 15 (83.3%) | 24 (85.7%) |
| Total | 261 (84.5%) | 195 (64.4%) |
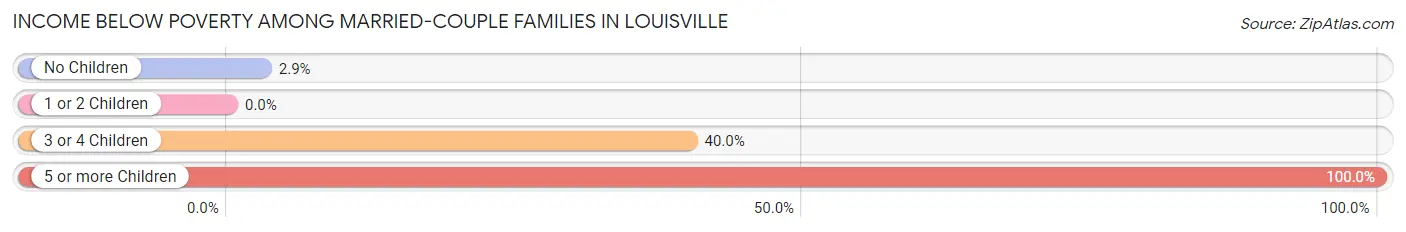
Income Below Poverty Among Married-Couple Families in Louisville
The poverty statistics for married-couple families in Louisville show that 7.9% or 5 of the total 63 families live below the poverty line. Families with 5 or more children have the highest poverty rate of 100.0%, comprising of 2 families. On the other hand, families with 1 or 2 children have the lowest poverty rate of 0.0%, which includes 0 families.
| Children | Above Poverty | Below Poverty |
| No Children | 33 (97.1%) | 1 (2.9%) |
| 1 or 2 Children | 22 (100.0%) | 0 (0.0%) |
| 3 or 4 Children | 3 (60.0%) | 2 (40.0%) |
| 5 or more Children | 0 (0.0%) | 2 (100.0%) |
| Total | 58 (92.1%) | 5 (7.9%) |
Income Below Poverty Among Single-Parent Households in Louisville
According to the poverty data in Louisville, 100.0% or 15 single-father households and 60.5% or 23 single-mother households are living below the poverty line. Among single-father households, those with 1 or 2 children have the highest poverty rate, with 15 households (100.0%) experiencing poverty. Likewise, among single-mother households, those with no children have the highest poverty rate, with 18 households (90.0%) falling below the poverty line.
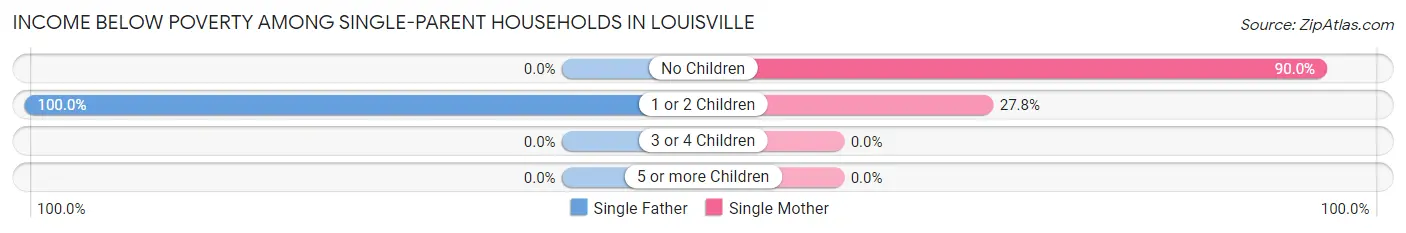
| Children | Single Father | Single Mother |
| No Children | 0 (0.0%) | 18 (90.0%) |
| 1 or 2 Children | 15 (100.0%) | 5 (27.8%) |
| 3 or 4 Children | 0 (0.0%) | 0 (0.0%) |
| 5 or more Children | 0 (0.0%) | 0 (0.0%) |
| Total | 15 (100.0%) | 23 (60.5%) |
Income Below Poverty Among Married-Couple vs Single-Parent Households in Louisville
The poverty data for Louisville shows that 5 of the married-couple family households (7.9%) and 38 of the single-parent households (71.7%) are living below the poverty level. Within the married-couple family households, those with 5 or more children have the highest poverty rate, with 2 households (100.0%) falling below the poverty line. Among the single-parent households, those with no children have the highest poverty rate, with 18 household (90.0%) living below poverty.
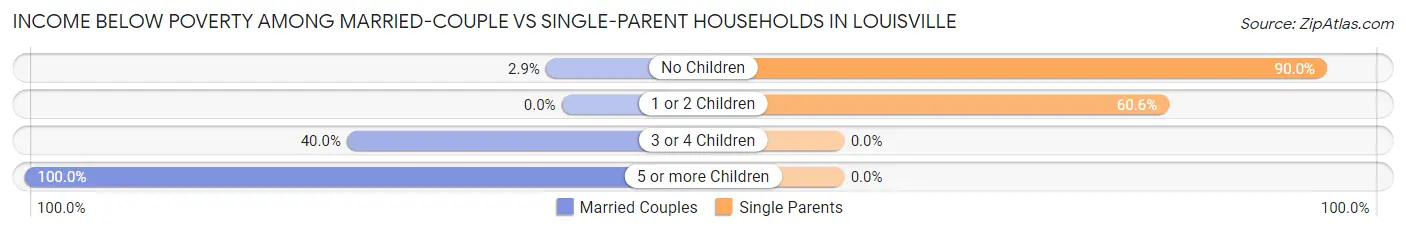
| Children | Married-Couple Families | Single-Parent Households |
| No Children | 1 (2.9%) | 18 (90.0%) |
| 1 or 2 Children | 0 (0.0%) | 20 (60.6%) |
| 3 or 4 Children | 2 (40.0%) | 0 (0.0%) |
| 5 or more Children | 2 (100.0%) | 0 (0.0%) |
| Total | 5 (7.9%) | 38 (71.7%) |
Race in Louisville
The most populous races in Louisville are Black / African American (311 | 50.8%), White / Caucasian (269 | 44.0%), and Two or more Races (29 | 4.7%).
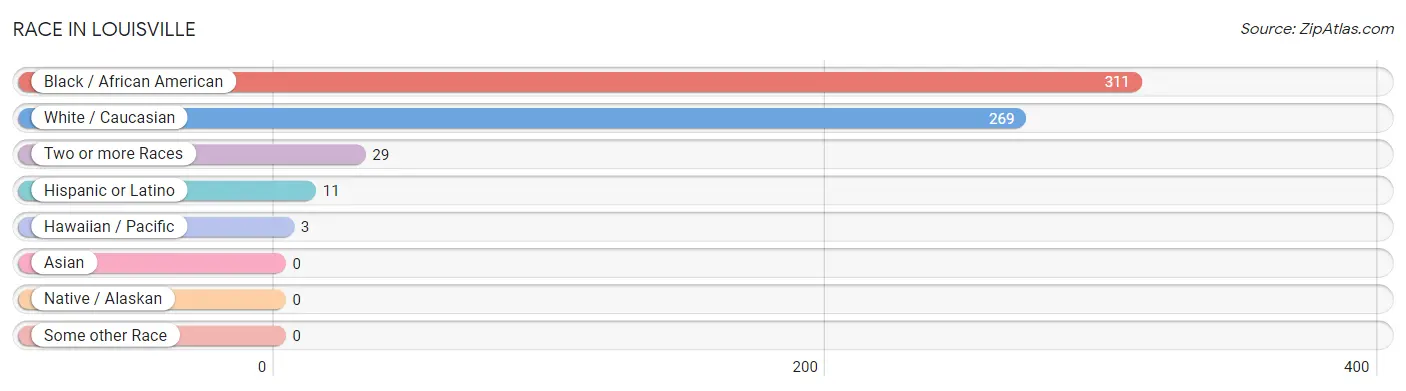
| Race | # Population | % Population |
| Asian | 0 | 0.0% |
| Black / African American | 311 | 50.8% |
| Hawaiian / Pacific | 3 | 0.5% |
| Hispanic or Latino | 11 | 1.8% |
| Native / Alaskan | 0 | 0.0% |
| White / Caucasian | 269 | 44.0% |
| Two or more Races | 29 | 4.7% |
| Some other Race | 0 | 0.0% |
| Total | 612 | 100.0% |
Ancestry in Louisville
The most populous ancestries reported in Louisville are American (75 | 12.2%), Irish (31 | 5.1%), German (26 | 4.3%), English (10 | 1.6%), and Mexican (9 | 1.5%), together accounting for 24.7% of all Louisville residents.
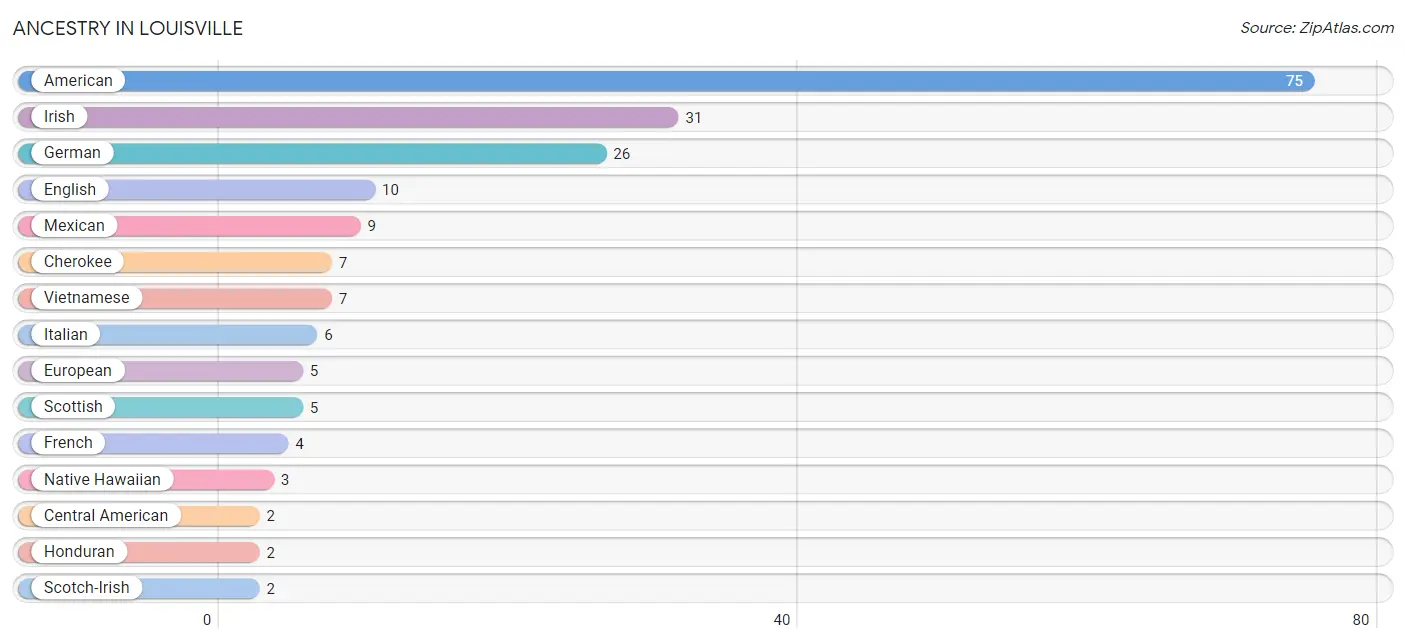
| Ancestry | # Population | % Population |
| American | 75 | 12.2% |
| Central American | 2 | 0.3% |
| Cherokee | 7 | 1.1% |
| English | 10 | 1.6% |
| European | 5 | 0.8% |
| French | 4 | 0.6% |
| German | 26 | 4.3% |
| Honduran | 2 | 0.3% |
| Irish | 31 | 5.1% |
| Italian | 6 | 1.0% |
| Mexican | 9 | 1.5% |
| Native Hawaiian | 3 | 0.5% |
| Scotch-Irish | 2 | 0.3% |
| Scottish | 5 | 0.8% |
| Vietnamese | 7 | 1.1% |
| Welsh | 2 | 0.3% | View All 16 Rows |
Immigrants in Louisville
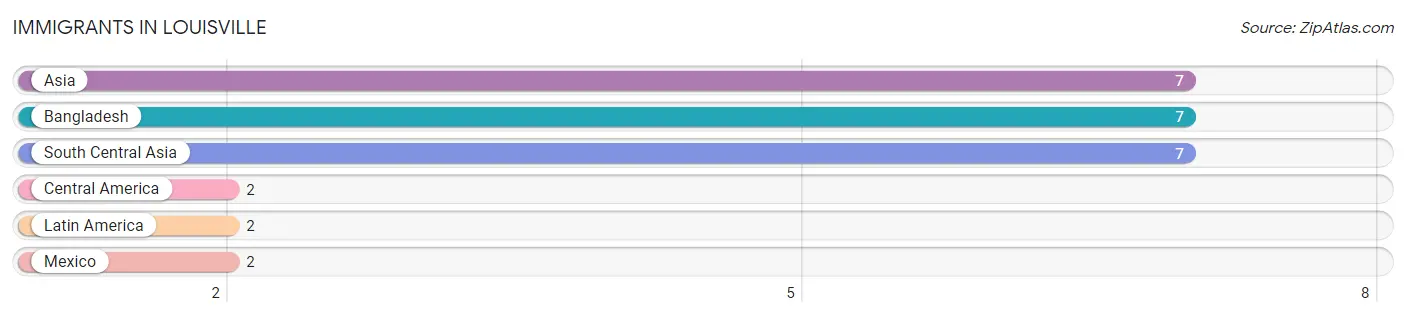
The most numerous immigrant groups reported in Louisville came from Asia (7 | 1.1%), Bangladesh (7 | 1.1%), South Central Asia (7 | 1.1%), Central America (2 | 0.3%), and Latin America (2 | 0.3%), together accounting for 4.1% of all Louisville residents.
| Immigration Origin | # Population | % Population |
| Asia | 7 | 1.1% |
| Bangladesh | 7 | 1.1% |
| Central America | 2 | 0.3% |
| Latin America | 2 | 0.3% |
| Mexico | 2 | 0.3% |
| South Central Asia | 7 | 1.1% | View All 6 Rows |
Sex and Age in Louisville
Sex and Age in Louisville
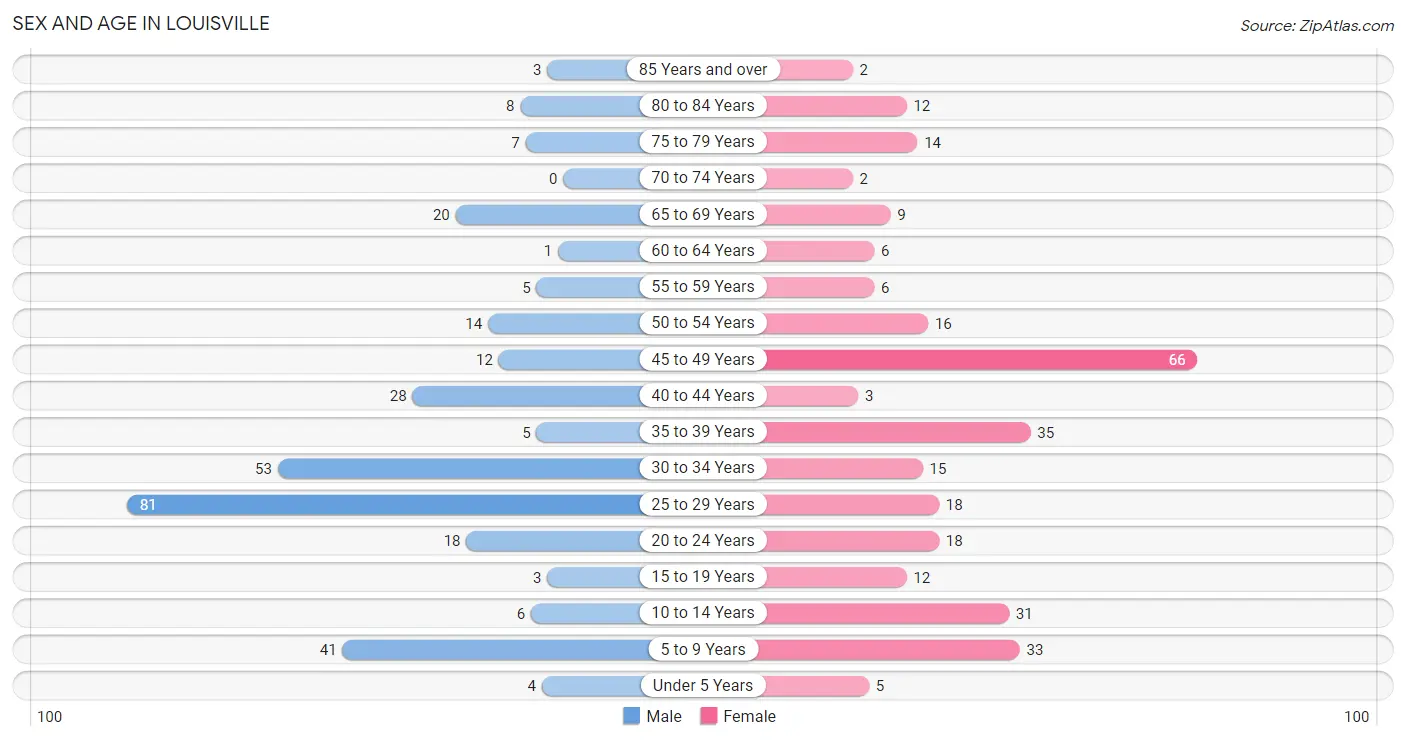
The most populous age groups in Louisville are 25 to 29 Years (81 | 26.2%) for men and 45 to 49 Years (66 | 21.8%) for women.
| Age Bracket | Male | Female |
| Under 5 Years | 4 (1.3%) | 5 (1.7%) |
| 5 to 9 Years | 41 (13.3%) | 33 (10.9%) |
| 10 to 14 Years | 6 (1.9%) | 31 (10.2%) |
| 15 to 19 Years | 3 (1.0%) | 12 (4.0%) |
| 20 to 24 Years | 18 (5.8%) | 18 (5.9%) |
| 25 to 29 Years | 81 (26.2%) | 18 (5.9%) |
| 30 to 34 Years | 53 (17.2%) | 15 (5.0%) |
| 35 to 39 Years | 5 (1.6%) | 35 (11.6%) |
| 40 to 44 Years | 28 (9.1%) | 3 (1.0%) |
| 45 to 49 Years | 12 (3.9%) | 66 (21.8%) |
| 50 to 54 Years | 14 (4.5%) | 16 (5.3%) |
| 55 to 59 Years | 5 (1.6%) | 6 (2.0%) |
| 60 to 64 Years | 1 (0.3%) | 6 (2.0%) |
| 65 to 69 Years | 20 (6.5%) | 9 (3.0%) |
| 70 to 74 Years | 0 (0.0%) | 2 (0.7%) |
| 75 to 79 Years | 7 (2.3%) | 14 (4.6%) |
| 80 to 84 Years | 8 (2.6%) | 12 (4.0%) |
| 85 Years and over | 3 (1.0%) | 2 (0.7%) |
| Total | 309 (100.0%) | 303 (100.0%) |
Families and Households in Louisville
Median Family Size in Louisville
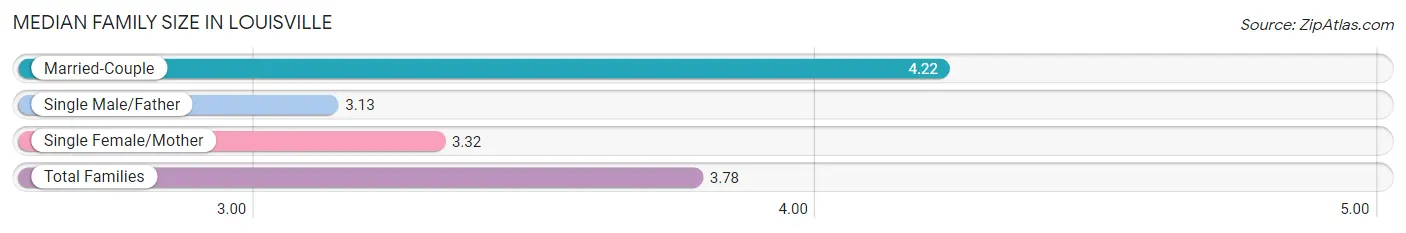
The median family size in Louisville is 3.78 persons per family, with married-couple families (63 | 54.3%) accounting for the largest median family size of 4.22 persons per family. On the other hand, single male/father families (15 | 12.9%) represent the smallest median family size with 3.13 persons per family.
| Family Type | # Families | Family Size |
| Married-Couple | 63 (54.3%) | 4.22 |
| Single Male/Father | 15 (12.9%) | 3.13 |
| Single Female/Mother | 38 (32.8%) | 3.32 |
| Total Families | 116 (100.0%) | 3.78 |
Median Household Size in Louisville
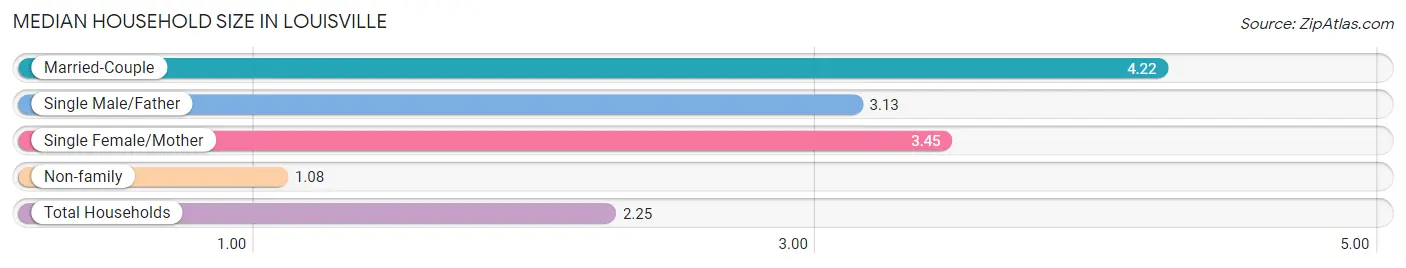
The median household size in Louisville is 2.25 persons per household, with married-couple households (63 | 23.2%) accounting for the largest median household size of 4.22 persons per household. non-family households (156 | 57.4%) represent the smallest median household size with 1.08 persons per household.
| Household Type | # Households | Household Size |
| Married-Couple | 63 (23.2%) | 4.22 |
| Single Male/Father | 15 (5.5%) | 3.13 |
| Single Female/Mother | 38 (14.0%) | 3.45 |
| Non-family | 156 (57.4%) | 1.08 |
| Total Households | 272 (100.0%) | 2.25 |
Household Size by Marriage Status in Louisville
Out of a total of 272 households in Louisville, 116 (42.6%) are family households, while 156 (57.4%) are nonfamily households. The most numerous type of family households are 4-person households, comprising 46, and the most common type of nonfamily households are 1-person households, comprising 145.
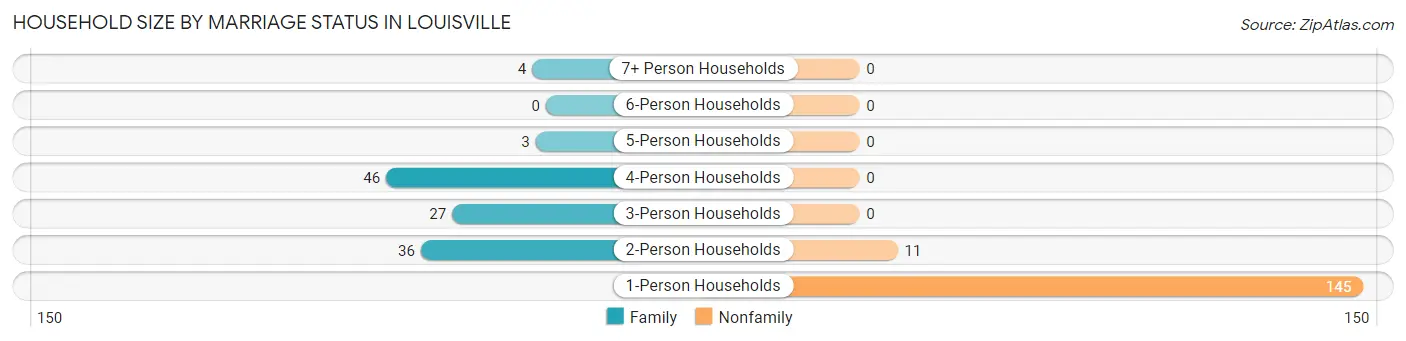
| Household Size | Family Households | Nonfamily Households |
| 1-Person Households | - | 145 (53.3%) |
| 2-Person Households | 36 (13.2%) | 11 (4.0%) |
| 3-Person Households | 27 (9.9%) | 0 (0.0%) |
| 4-Person Households | 46 (16.9%) | 0 (0.0%) |
| 5-Person Households | 3 (1.1%) | 0 (0.0%) |
| 6-Person Households | 0 (0.0%) | 0 (0.0%) |
| 7+ Person Households | 4 (1.5%) | 0 (0.0%) |
| Total | 116 (42.6%) | 156 (57.4%) |
Female Fertility in Louisville
Fertility by Age in Louisville
Average fertility rate in Louisville is 36.0 births per 1,000 women. Women in the age bracket of 20 to 34 years have the highest fertility rate with 78.0 births per 1,000 women. Women in the age bracket of 20 to 34 years acount for 66.7% of all women with births.
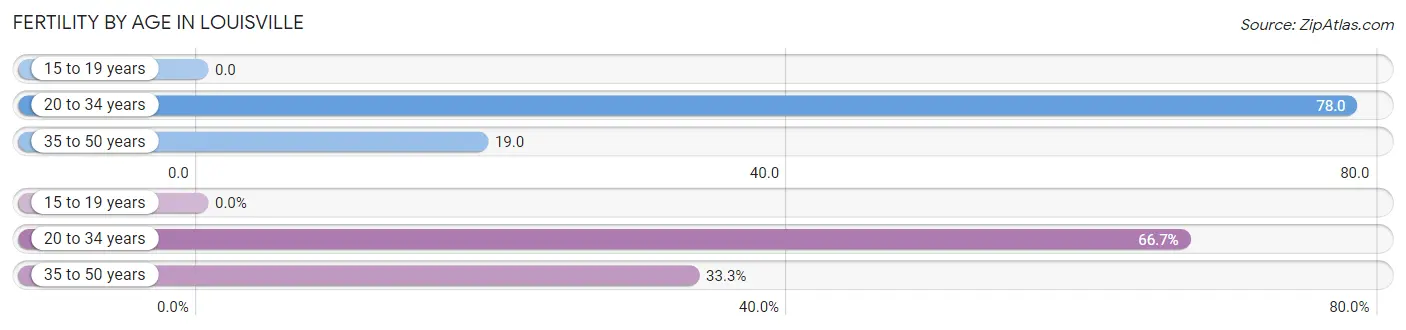
| Age Bracket | Women with Births | Births / 1,000 Women |
| 15 to 19 years | 0 (0.0%) | 0.0 |
| 20 to 34 years | 4 (66.7%) | 78.0 |
| 35 to 50 years | 2 (33.3%) | 19.0 |
| Total | 6 (100.0%) | 36.0 |
Fertility by Age by Marriage Status in Louisville
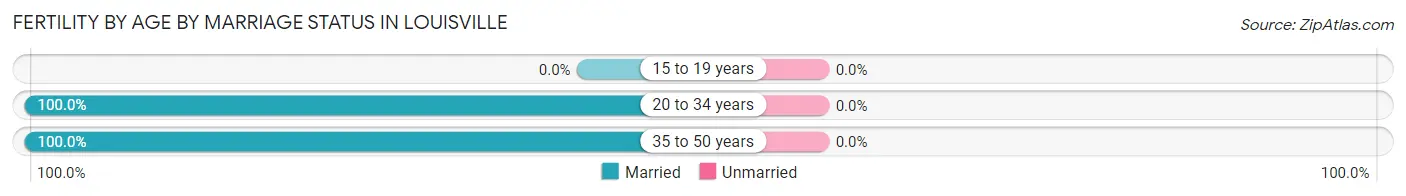
| Age Bracket | Married | Unmarried |
| 15 to 19 years | 0 (0.0%) | 0 (0.0%) |
| 20 to 34 years | 4 (100.0%) | 0 (0.0%) |
| 35 to 50 years | 2 (100.0%) | 0 (0.0%) |
| Total | 6 (100.0%) | 0 (0.0%) |
Fertility by Education in Louisville
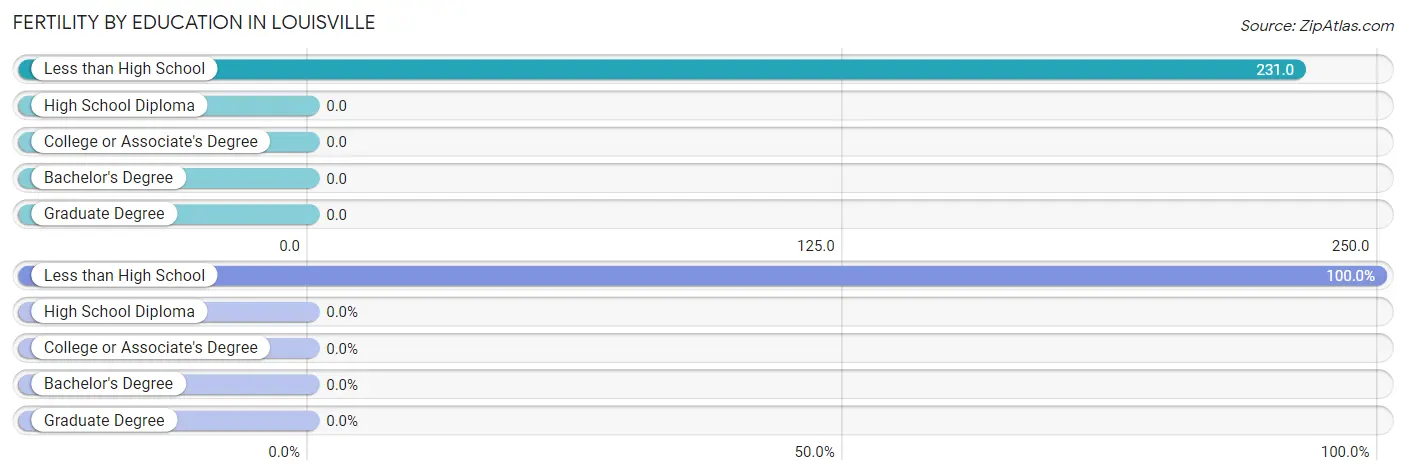
| Educational Attainment | Women with Births | Births / 1,000 Women |
| Less than High School | 6 (100.0%) | 231.0 |
| High School Diploma | 0 (0.0%) | 0.0 |
| College or Associate's Degree | 0 (0.0%) | 0.0 |
| Bachelor's Degree | 0 (0.0%) | 0.0 |
| Graduate Degree | 0 (0.0%) | 0.0 |
| Total | 6 (100.0%) | 36.0 |
Fertility by Education by Marriage Status in Louisville
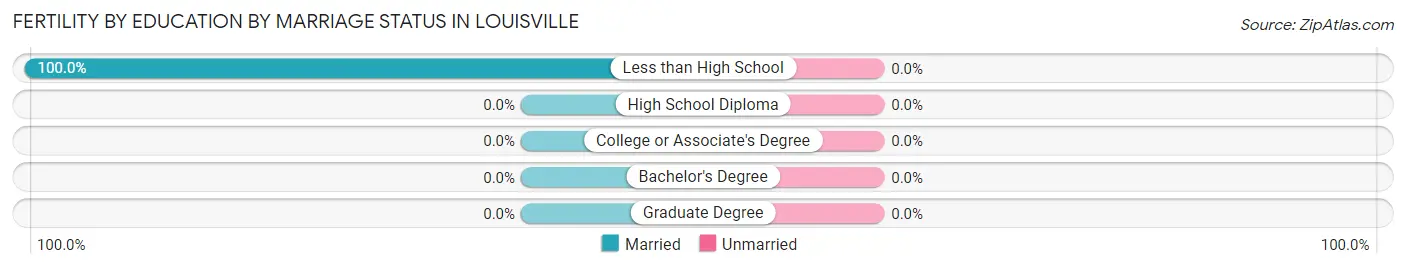
| Educational Attainment | Married | Unmarried |
| Less than High School | 6 (100.0%) | 0 (0.0%) |
| High School Diploma | 0 (0.0%) | 0 (0.0%) |
| College or Associate's Degree | 0 (0.0%) | 0 (0.0%) |
| Bachelor's Degree | 0 (0.0%) | 0 (0.0%) |
| Graduate Degree | 0 (0.0%) | 0 (0.0%) |
| Total | 6 (100.0%) | 0 (0.0%) |
Employment Characteristics in Louisville
Employment by Class of Employer in Louisville
Among the 338 employed individuals in Louisville, private company employees (236 | 69.8%), state government employees (55 | 16.3%), and self-employed (not incorporated) (13 | 3.8%) make up the most common classes of employment.
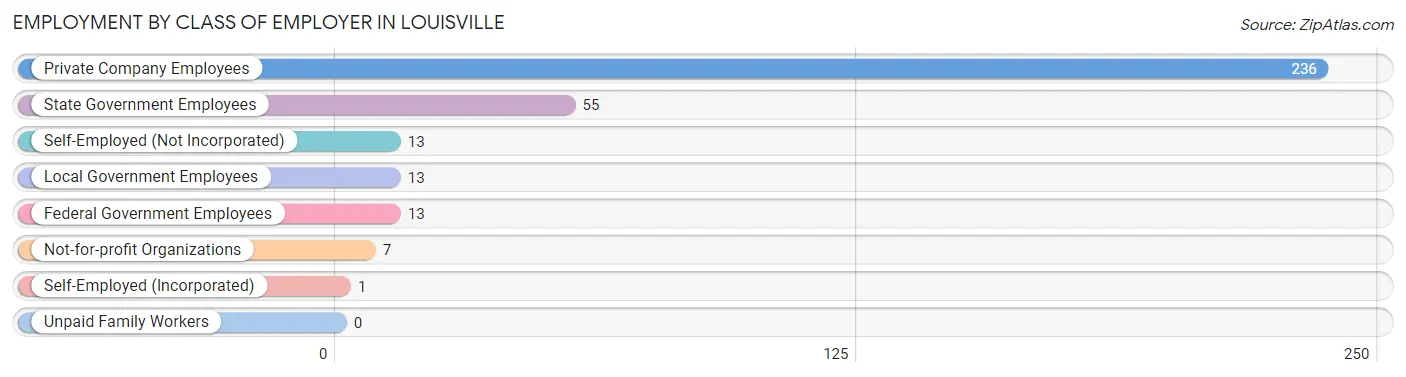
| Employer Class | # Employees | % Employees |
| Private Company Employees | 236 | 69.8% |
| Self-Employed (Incorporated) | 1 | 0.3% |
| Self-Employed (Not Incorporated) | 13 | 3.8% |
| Not-for-profit Organizations | 7 | 2.1% |
| Local Government Employees | 13 | 3.8% |
| State Government Employees | 55 | 16.3% |
| Federal Government Employees | 13 | 3.8% |
| Unpaid Family Workers | 0 | 0.0% |
| Total | 338 | 100.0% |
Employment Status by Age in Louisville
According to the labor force statistics for Louisville, out of the total population over 16 years of age (490), 71.4% or 350 individuals are in the labor force, with 3.4% or 12 of them unemployed. The age group with the highest labor force participation rate is 20 to 24 years, with 100.0% or 36 individuals in the labor force. Within the labor force, the 45 to 54 years age range has the highest percentage of unemployed individuals, with 11.1% or 10 of them being unemployed.
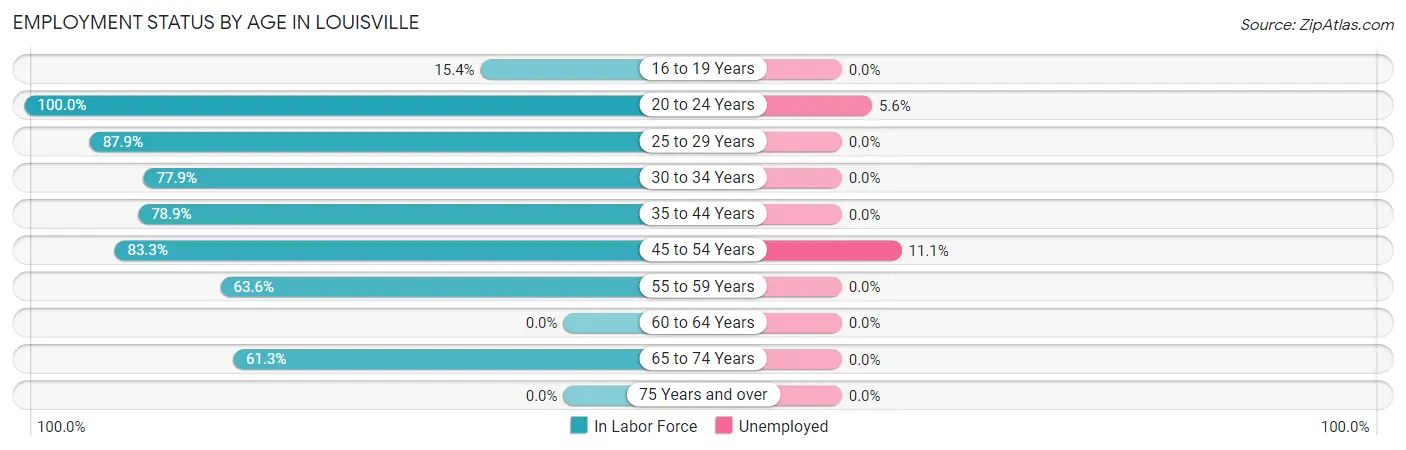
| Age Bracket | In Labor Force | Unemployed |
| 16 to 19 Years | 2 (15.4%) | 0 (0.0%) |
| 20 to 24 Years | 36 (100.0%) | 2 (5.6%) |
| 25 to 29 Years | 87 (87.9%) | 0 (0.0%) |
| 30 to 34 Years | 53 (77.9%) | 0 (0.0%) |
| 35 to 44 Years | 56 (78.9%) | 0 (0.0%) |
| 45 to 54 Years | 90 (83.3%) | 10 (11.1%) |
| 55 to 59 Years | 7 (63.6%) | 0 (0.0%) |
| 60 to 64 Years | 0 (0.0%) | 0 (0.0%) |
| 65 to 74 Years | 19 (61.3%) | 0 (0.0%) |
| 75 Years and over | 0 (0.0%) | 0 (0.0%) |
| Total | 350 (71.4%) | 12 (3.4%) |
Employment Status by Educational Attainment in Louisville
According to labor force statistics for Louisville, 80.5% of individuals (293) out of the total population between 25 and 64 years of age (364) are in the labor force, with 3.4% or 10 of them being unemployed. The group with the highest labor force participation rate are those with the educational attainment of bachelor's degree or higher, with 100.0% or 24 individuals in the labor force. Within the labor force, individuals with college / associate degree education have the highest percentage of unemployment, with 8.4% or 10 of them being unemployed.
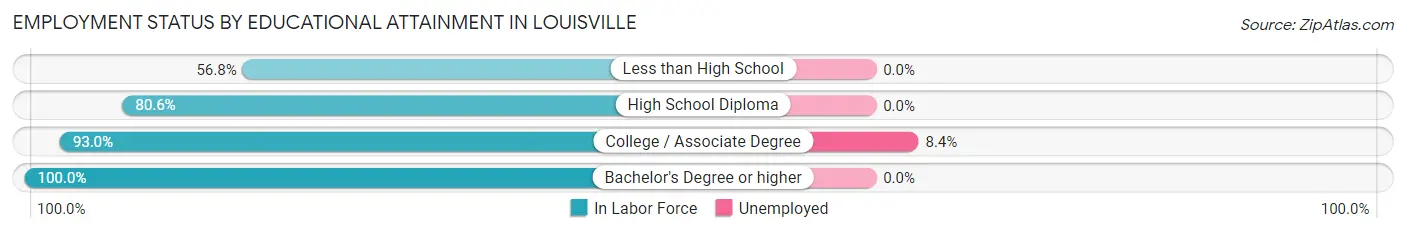
| Educational Attainment | In Labor Force | Unemployed |
| Less than High School | 50 (56.8%) | 0 (0.0%) |
| High School Diploma | 100 (80.6%) | 0 (0.0%) |
| College / Associate Degree | 119 (93.0%) | 11 (8.4%) |
| Bachelor's Degree or higher | 24 (100.0%) | 0 (0.0%) |
| Total | 293 (80.5%) | 12 (3.4%) |
Employment Occupations by Sex in Louisville
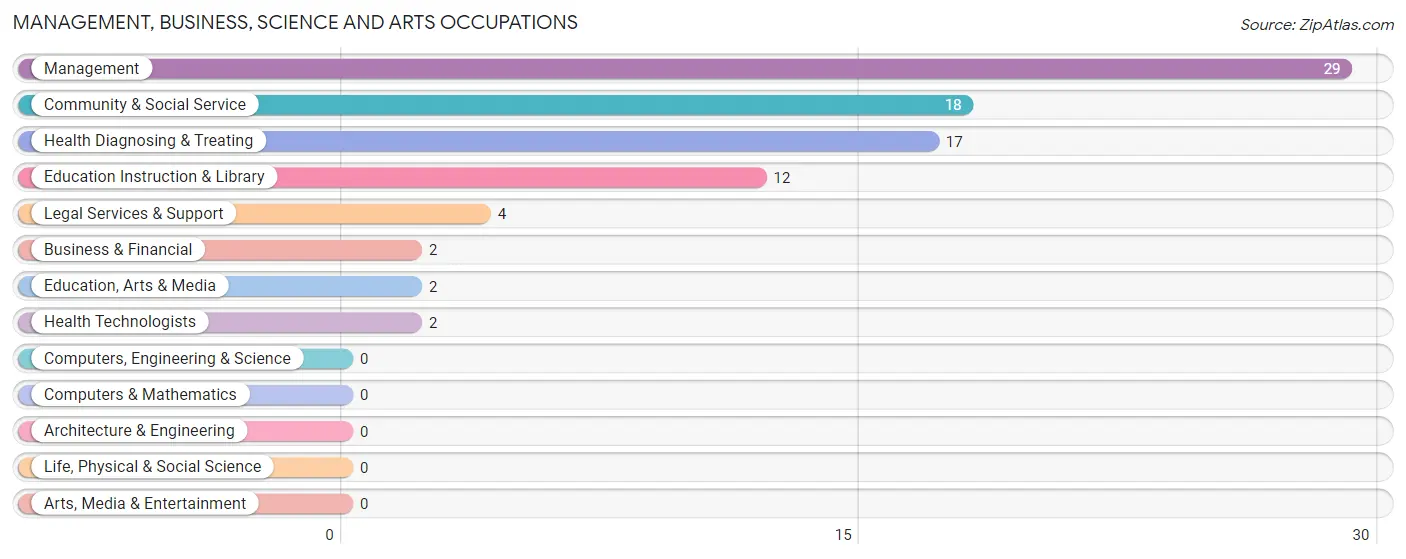
Management, Business, Science and Arts Occupations
The most common Management, Business, Science and Arts occupations in Louisville are Management (29 | 8.6%), Community & Social Service (18 | 5.3%), Health Diagnosing & Treating (17 | 5.0%), Education Instruction & Library (12 | 3.5%), and Legal Services & Support (4 | 1.2%).
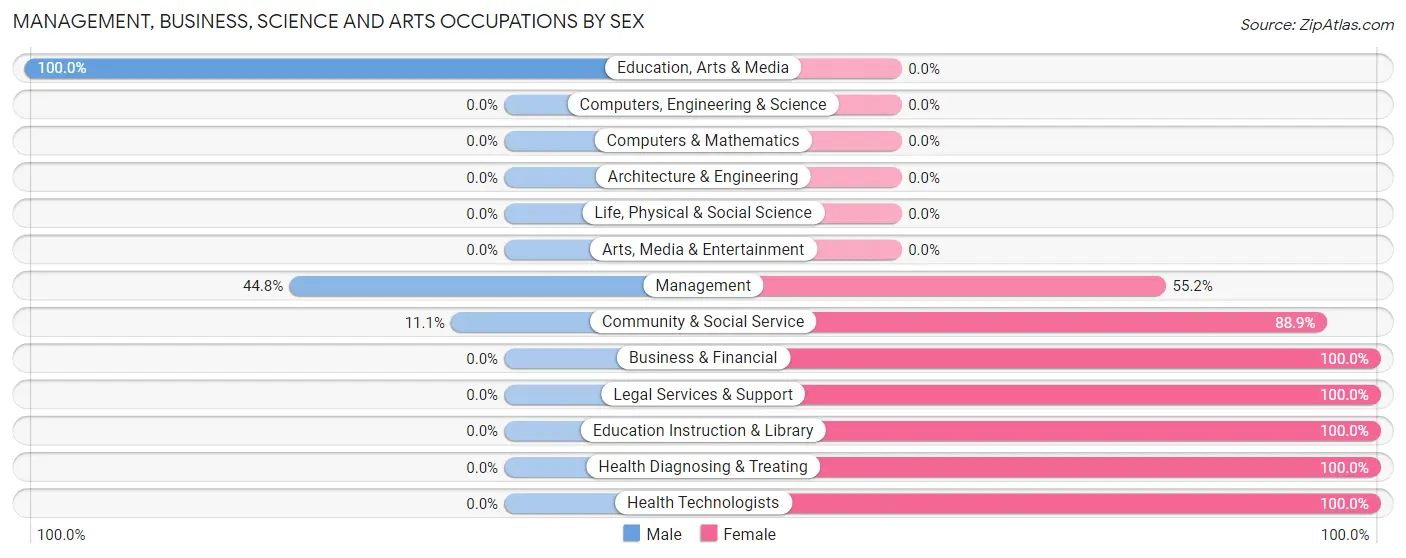
Management, Business, Science and Arts Occupations by Sex
Within the Management, Business, Science and Arts occupations in Louisville, the most male-oriented occupations are Education, Arts & Media (100.0%), Management (44.8%), and Community & Social Service (11.1%), while the most female-oriented occupations are Business & Financial (100.0%), Legal Services & Support (100.0%), and Education Instruction & Library (100.0%).
| Occupation | Male | Female |
| Management | 13 (44.8%) | 16 (55.2%) |
| Business & Financial | 0 (0.0%) | 2 (100.0%) |
| Computers, Engineering & Science | 0 (0.0%) | 0 (0.0%) |
| Computers & Mathematics | 0 (0.0%) | 0 (0.0%) |
| Architecture & Engineering | 0 (0.0%) | 0 (0.0%) |
| Life, Physical & Social Science | 0 (0.0%) | 0 (0.0%) |
| Community & Social Service | 2 (11.1%) | 16 (88.9%) |
| Education, Arts & Media | 2 (100.0%) | 0 (0.0%) |
| Legal Services & Support | 0 (0.0%) | 4 (100.0%) |
| Education Instruction & Library | 0 (0.0%) | 12 (100.0%) |
| Arts, Media & Entertainment | 0 (0.0%) | 0 (0.0%) |
| Health Diagnosing & Treating | 0 (0.0%) | 17 (100.0%) |
| Health Technologists | 0 (0.0%) | 2 (100.0%) |
| Total (Category) | 15 (22.7%) | 51 (77.3%) |
| Total (Overall) | 194 (57.4%) | 144 (42.6%) |
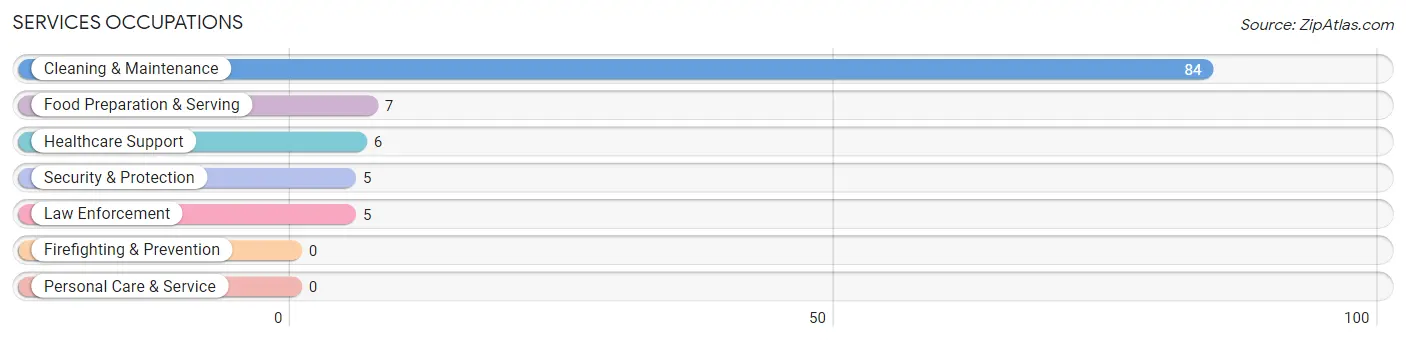
Services Occupations
The most common Services occupations in Louisville are Cleaning & Maintenance (84 | 24.8%), Food Preparation & Serving (7 | 2.1%), Healthcare Support (6 | 1.8%), Security & Protection (5 | 1.5%), and Law Enforcement (5 | 1.5%).
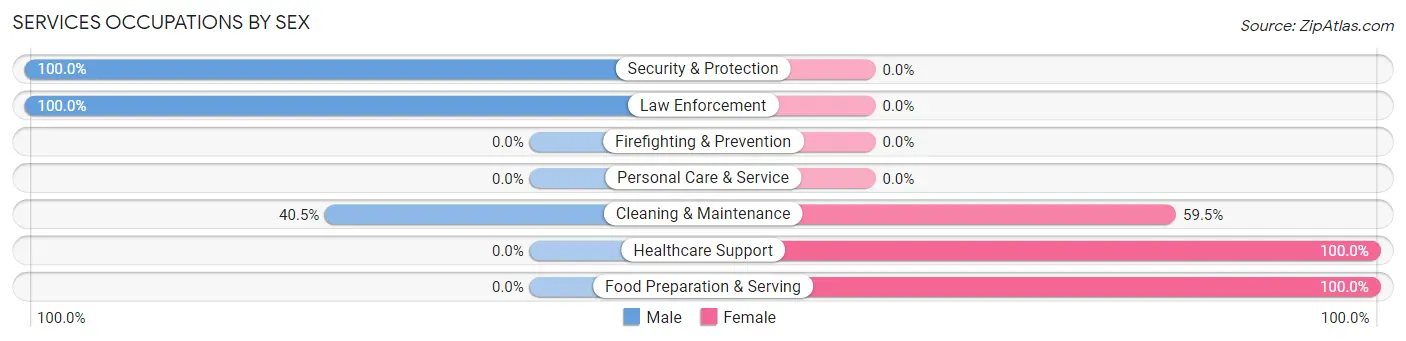
Services Occupations by Sex
Within the Services occupations in Louisville, the most male-oriented occupations are Security & Protection (100.0%), Law Enforcement (100.0%), and Cleaning & Maintenance (40.5%), while the most female-oriented occupations are Healthcare Support (100.0%), Food Preparation & Serving (100.0%), and Cleaning & Maintenance (59.5%).
| Occupation | Male | Female |
| Healthcare Support | 0 (0.0%) | 6 (100.0%) |
| Security & Protection | 5 (100.0%) | 0 (0.0%) |
| Firefighting & Prevention | 0 (0.0%) | 0 (0.0%) |
| Law Enforcement | 5 (100.0%) | 0 (0.0%) |
| Food Preparation & Serving | 0 (0.0%) | 7 (100.0%) |
| Cleaning & Maintenance | 34 (40.5%) | 50 (59.5%) |
| Personal Care & Service | 0 (0.0%) | 0 (0.0%) |
| Total (Category) | 39 (38.2%) | 63 (61.8%) |
| Total (Overall) | 194 (57.4%) | 144 (42.6%) |
Sales and Office Occupations
The most common Sales and Office occupations in Louisville are Office & Administration (15 | 4.4%), and Sales & Related (9 | 2.7%).

Sales and Office Occupations by Sex
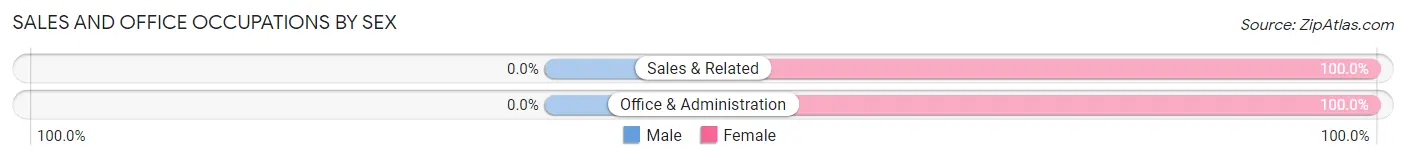
| Occupation | Male | Female |
| Sales & Related | 0 (0.0%) | 9 (100.0%) |
| Office & Administration | 0 (0.0%) | 15 (100.0%) |
| Total (Category) | 0 (0.0%) | 24 (100.0%) |
| Total (Overall) | 194 (57.4%) | 144 (42.6%) |
Natural Resources, Construction and Maintenance Occupations
The most common Natural Resources, Construction and Maintenance occupations in Louisville are Installation, Maintenance & Repair (10 | 3.0%), and Farming, Fishing & Forestry (1 | 0.3%).

Natural Resources, Construction and Maintenance Occupations by Sex

| Occupation | Male | Female |
| Farming, Fishing & Forestry | 1 (100.0%) | 0 (0.0%) |
| Construction & Extraction | 0 (0.0%) | 0 (0.0%) |
| Installation, Maintenance & Repair | 10 (100.0%) | 0 (0.0%) |
| Total (Category) | 11 (100.0%) | 0 (0.0%) |
| Total (Overall) | 194 (57.4%) | 144 (42.6%) |
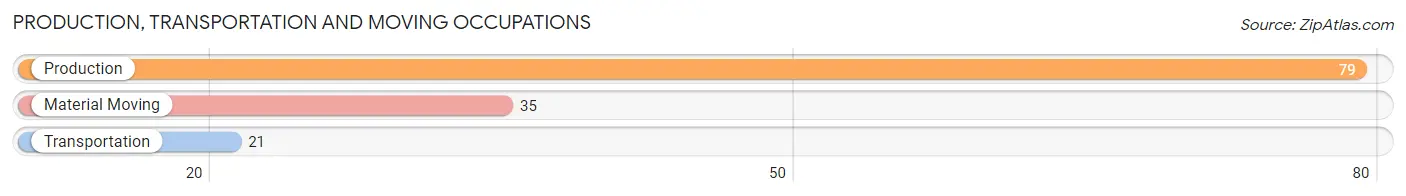
Production, Transportation and Moving Occupations
The most common Production, Transportation and Moving occupations in Louisville are Production (79 | 23.4%), Material Moving (35 | 10.4%), and Transportation (21 | 6.2%).
Production, Transportation and Moving Occupations by Sex
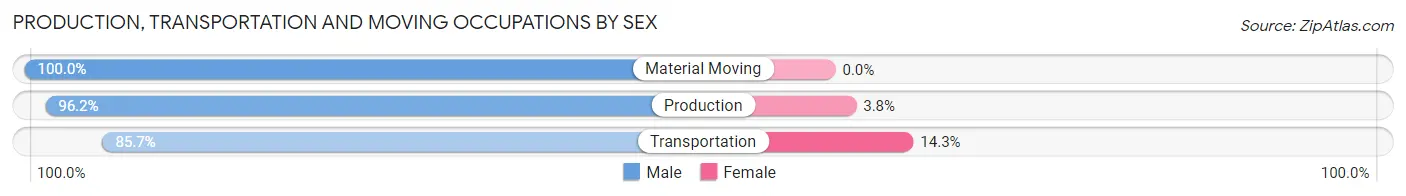
| Occupation | Male | Female |
| Production | 76 (96.2%) | 3 (3.8%) |
| Transportation | 18 (85.7%) | 3 (14.3%) |
| Material Moving | 35 (100.0%) | 0 (0.0%) |
| Total (Category) | 129 (95.6%) | 6 (4.4%) |
| Total (Overall) | 194 (57.4%) | 144 (42.6%) |
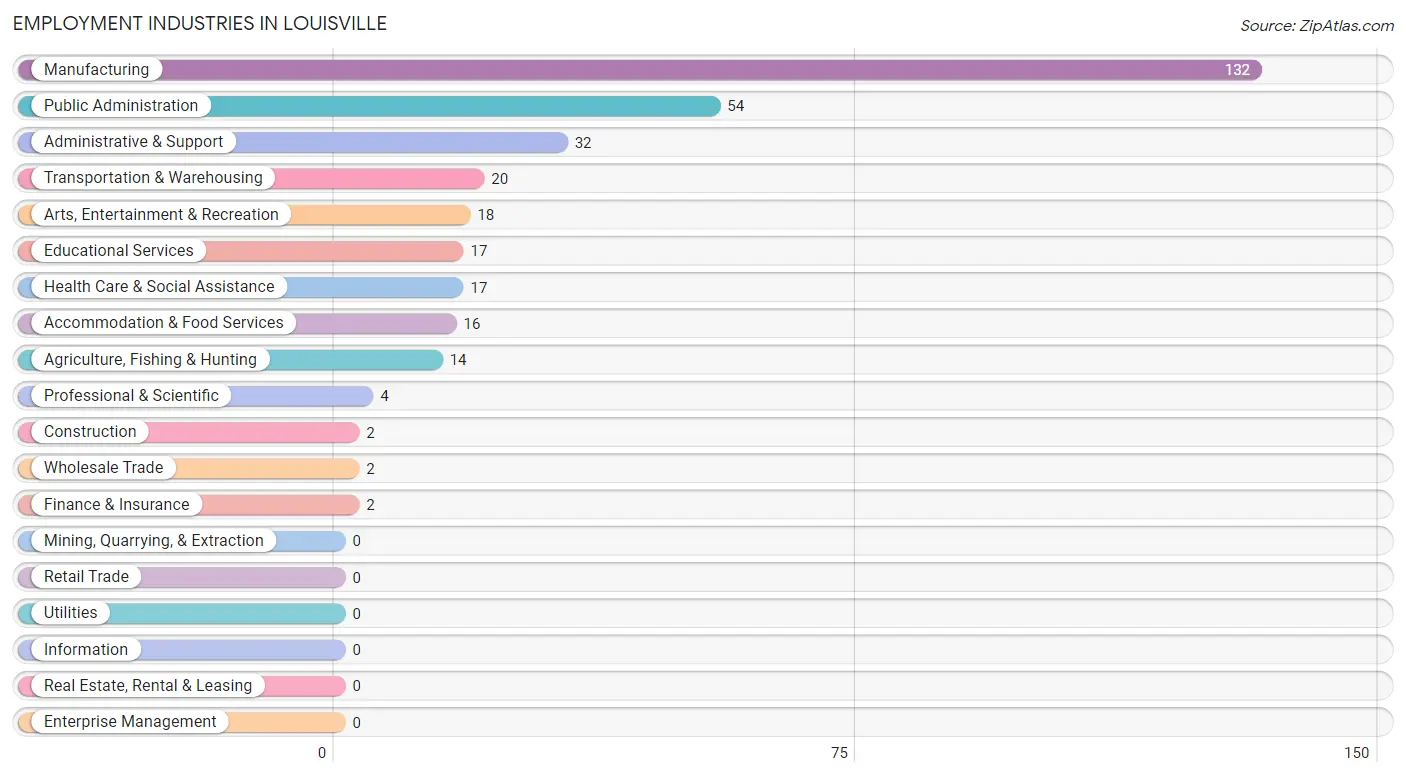
Employment Industries by Sex in Louisville
Employment Industries in Louisville
The major employment industries in Louisville include Manufacturing (132 | 39.1%), Public Administration (54 | 16.0%), Administrative & Support (32 | 9.5%), Transportation & Warehousing (20 | 5.9%), and Arts, Entertainment & Recreation (18 | 5.3%).
Employment Industries by Sex in Louisville
The Louisville industries that see more men than women are Agriculture, Fishing & Hunting (100.0%), Construction (100.0%), and Administrative & Support (100.0%), whereas the industries that tend to have a higher number of women are Finance & Insurance (100.0%), Professional & Scientific (100.0%), and Educational Services (100.0%).
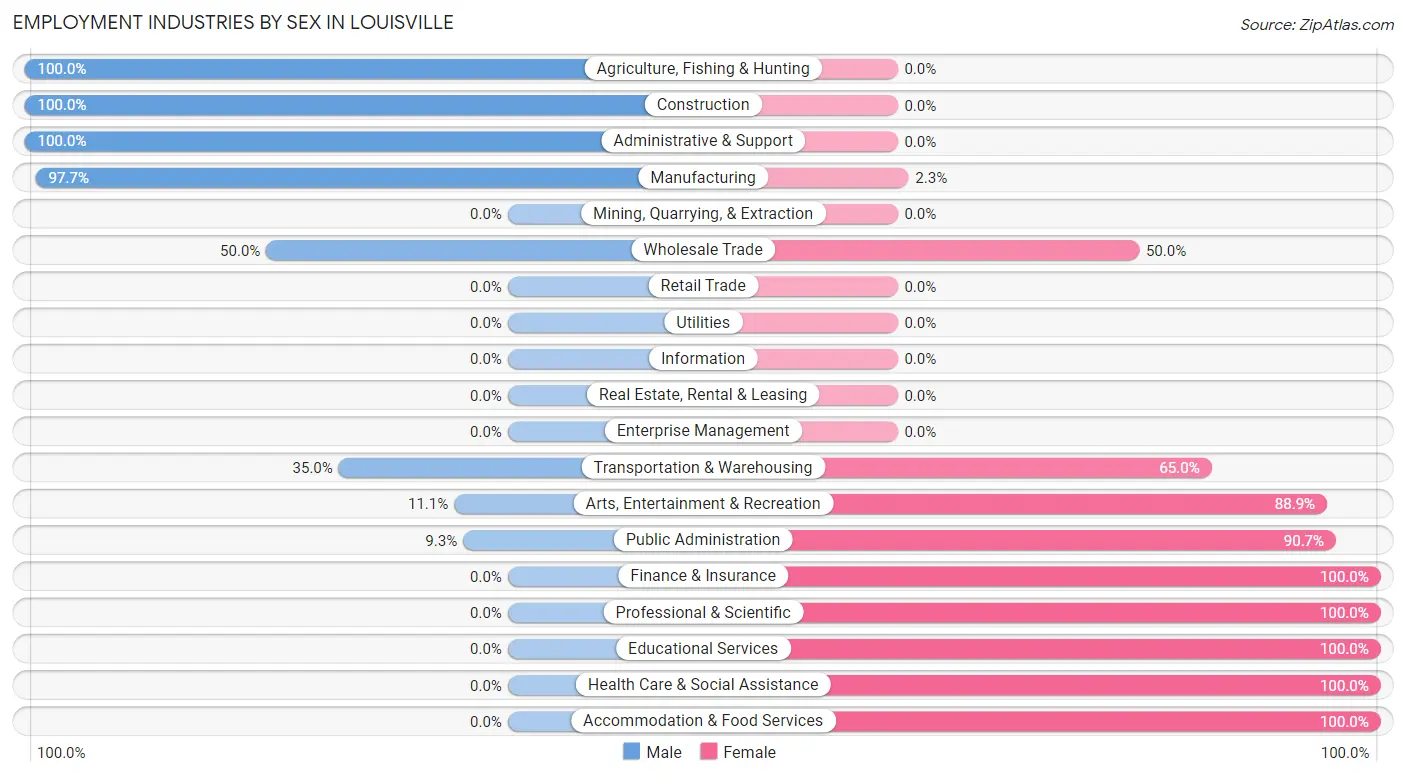
| Industry | Male | Female |
| Agriculture, Fishing & Hunting | 14 (100.0%) | 0 (0.0%) |
| Mining, Quarrying, & Extraction | 0 (0.0%) | 0 (0.0%) |
| Construction | 2 (100.0%) | 0 (0.0%) |
| Manufacturing | 129 (97.7%) | 3 (2.3%) |
| Wholesale Trade | 1 (50.0%) | 1 (50.0%) |
| Retail Trade | 0 (0.0%) | 0 (0.0%) |
| Transportation & Warehousing | 7 (35.0%) | 13 (65.0%) |
| Utilities | 0 (0.0%) | 0 (0.0%) |
| Information | 0 (0.0%) | 0 (0.0%) |
| Finance & Insurance | 0 (0.0%) | 2 (100.0%) |
| Real Estate, Rental & Leasing | 0 (0.0%) | 0 (0.0%) |
| Professional & Scientific | 0 (0.0%) | 4 (100.0%) |
| Enterprise Management | 0 (0.0%) | 0 (0.0%) |
| Administrative & Support | 32 (100.0%) | 0 (0.0%) |
| Educational Services | 0 (0.0%) | 17 (100.0%) |
| Health Care & Social Assistance | 0 (0.0%) | 17 (100.0%) |
| Arts, Entertainment & Recreation | 2 (11.1%) | 16 (88.9%) |
| Accommodation & Food Services | 0 (0.0%) | 16 (100.0%) |
| Public Administration | 5 (9.3%) | 49 (90.7%) |
| Total | 194 (57.4%) | 144 (42.6%) |
Education in Louisville
School Enrollment in Louisville
The most common levels of schooling among the 155 students in Louisville are elementary school (42 | 27.1%), college / undergraduate (38 | 24.5%), and middle school (31 | 20.0%).
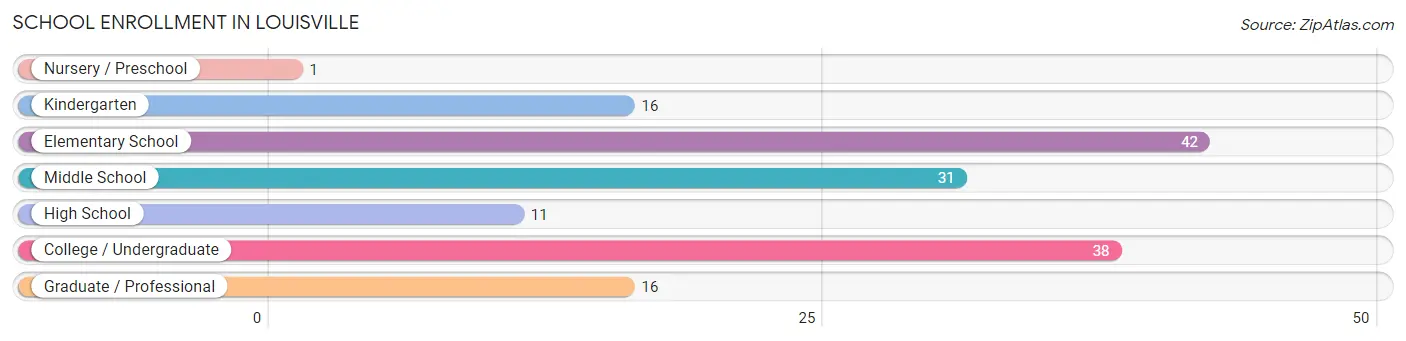
| School Level | # Students | % Students |
| Nursery / Preschool | 1 | 0.6% |
| Kindergarten | 16 | 10.3% |
| Elementary School | 42 | 27.1% |
| Middle School | 31 | 20.0% |
| High School | 11 | 7.1% |
| College / Undergraduate | 38 | 24.5% |
| Graduate / Professional | 16 | 10.3% |
| Total | 155 | 100.0% |
School Enrollment by Age by Funding Source in Louisville
Out of a total of 155 students who are enrolled in schools in Louisville, 56 (36.1%) attend a private institution, while the remaining 99 (63.9%) are enrolled in public schools. The age group of 3 to 4 year olds has the highest likelihood of being enrolled in private schools, with 1 (100.0% in the age bracket) enrolled. Conversely, the age group of 20 to 24 year olds has the lowest likelihood of being enrolled in a private school, with 16 (100.0% in the age bracket) attending a public institution.
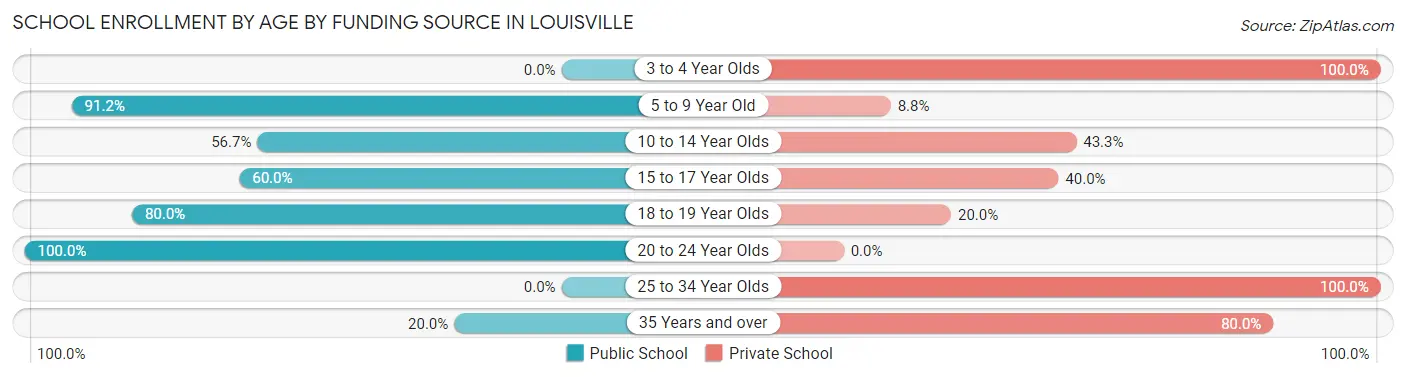
| Age Bracket | Public School | Private School |
| 3 to 4 Year Olds | 0 (0.0%) | 1 (100.0%) |
| 5 to 9 Year Old | 52 (91.2%) | 5 (8.8%) |
| 10 to 14 Year Olds | 17 (56.7%) | 13 (43.3%) |
| 15 to 17 Year Olds | 3 (60.0%) | 2 (40.0%) |
| 18 to 19 Year Olds | 8 (80.0%) | 2 (20.0%) |
| 20 to 24 Year Olds | 16 (100.0%) | 0 (0.0%) |
| 25 to 34 Year Olds | 0 (0.0%) | 21 (100.0%) |
| 35 Years and over | 3 (20.0%) | 12 (80.0%) |
| Total | 99 (63.9%) | 56 (36.1%) |
Educational Attainment by Field of Study in Louisville
Education (11 | 23.4%), business (9 | 19.2%), literature & languages (6 | 12.8%), liberal arts & history (5 | 10.6%), and bio, nature & agricultural (4 | 8.5%) are the most common fields of study among 47 individuals in Louisville who have obtained a bachelor's degree or higher.
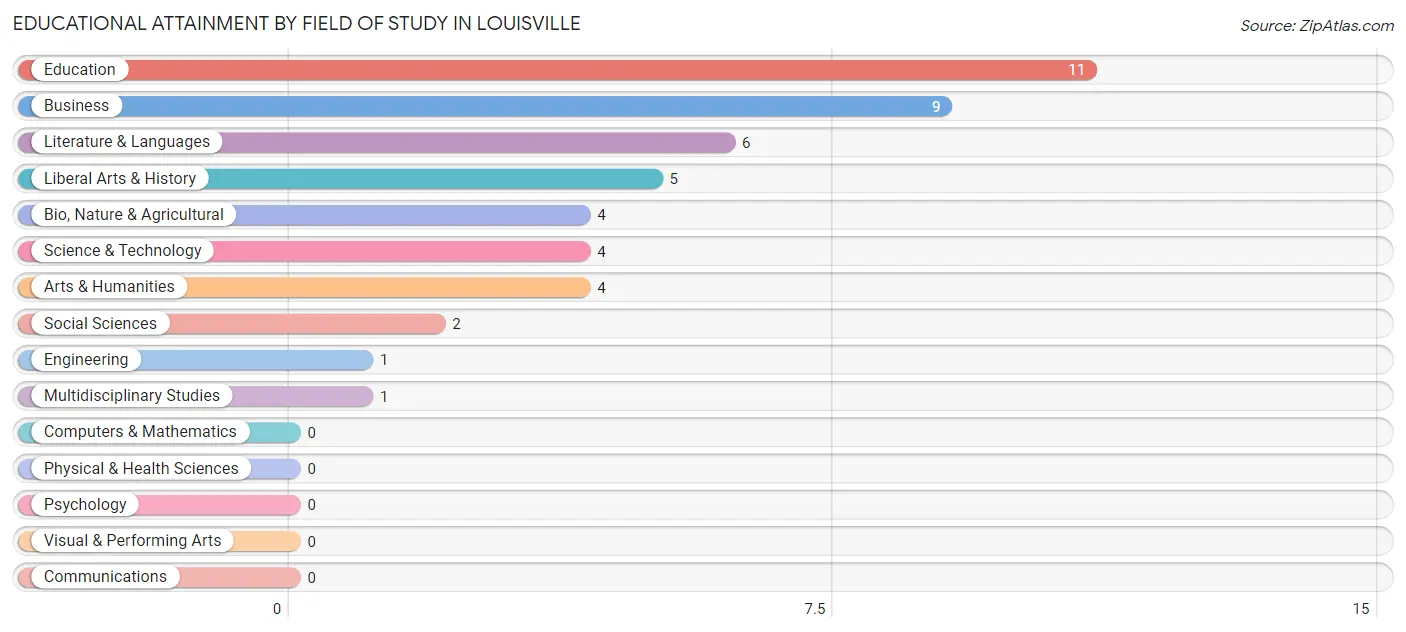
| Field of Study | # Graduates | % Graduates |
| Computers & Mathematics | 0 | 0.0% |
| Bio, Nature & Agricultural | 4 | 8.5% |
| Physical & Health Sciences | 0 | 0.0% |
| Psychology | 0 | 0.0% |
| Social Sciences | 2 | 4.3% |
| Engineering | 1 | 2.1% |
| Multidisciplinary Studies | 1 | 2.1% |
| Science & Technology | 4 | 8.5% |
| Business | 9 | 19.2% |
| Education | 11 | 23.4% |
| Literature & Languages | 6 | 12.8% |
| Liberal Arts & History | 5 | 10.6% |
| Visual & Performing Arts | 0 | 0.0% |
| Communications | 0 | 0.0% |
| Arts & Humanities | 4 | 8.5% |
| Total | 47 | 100.0% |
Transportation & Commute in Louisville
Vehicle Availability by Sex in Louisville
The most prevalent vehicle ownership categories in Louisville are males with 2 vehicles (60, accounting for 30.9%) and females with 2 vehicles (75, making up 41.7%).
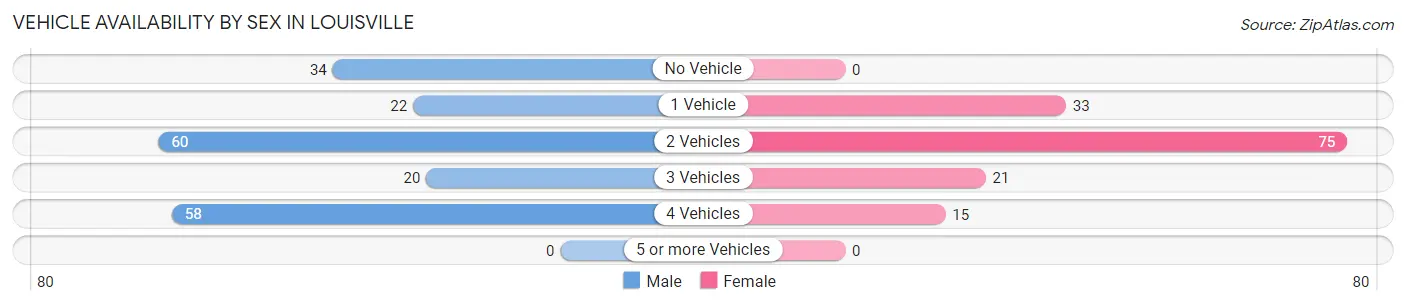
| Vehicles Available | Male | Female |
| No Vehicle | 34 (17.5%) | 0 (0.0%) |
| 1 Vehicle | 22 (11.3%) | 33 (22.9%) |
| 2 Vehicles | 60 (30.9%) | 75 (52.1%) |
| 3 Vehicles | 20 (10.3%) | 21 (14.6%) |
| 4 Vehicles | 58 (29.9%) | 15 (10.4%) |
| 5 or more Vehicles | 0 (0.0%) | 0 (0.0%) |
| Total | 194 (100.0%) | 144 (100.0%) |
Commute Time in Louisville
The most frequently occuring commute durations in Louisville are 30 to 34 minutes (141 commuters, 42.1%), less than 5 minutes (72 commuters, 21.5%), and 5 to 9 minutes (45 commuters, 13.4%).
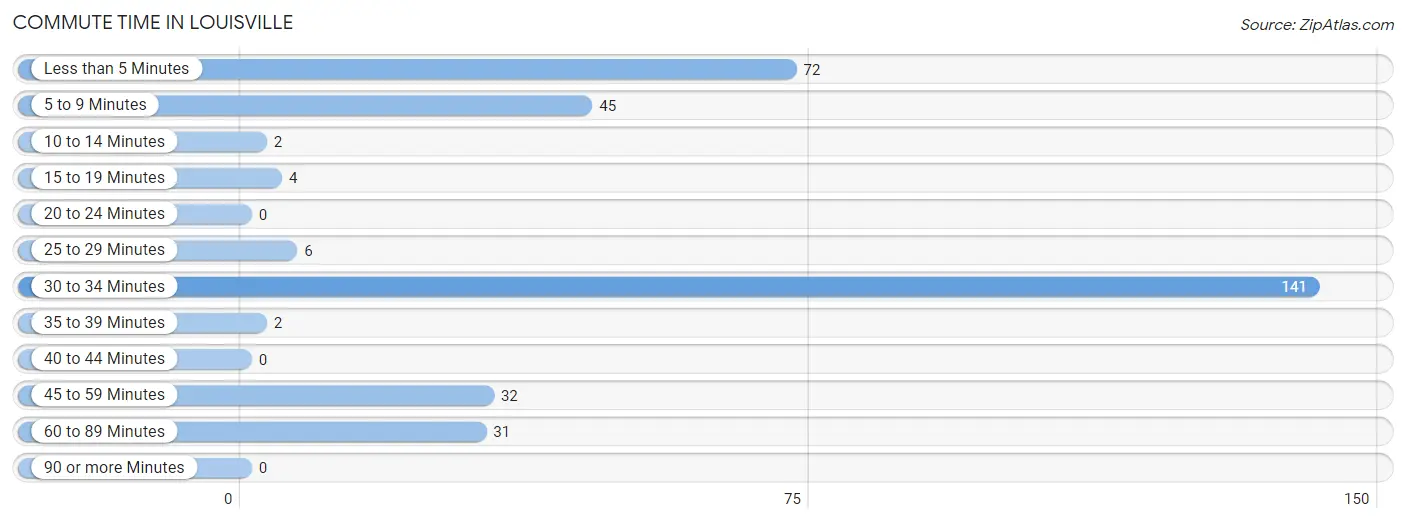
| Commute Time | # Commuters | % Commuters |
| Less than 5 Minutes | 72 | 21.5% |
| 5 to 9 Minutes | 45 | 13.4% |
| 10 to 14 Minutes | 2 | 0.6% |
| 15 to 19 Minutes | 4 | 1.2% |
| 20 to 24 Minutes | 0 | 0.0% |
| 25 to 29 Minutes | 6 | 1.8% |
| 30 to 34 Minutes | 141 | 42.1% |
| 35 to 39 Minutes | 2 | 0.6% |
| 40 to 44 Minutes | 0 | 0.0% |
| 45 to 59 Minutes | 32 | 9.6% |
| 60 to 89 Minutes | 31 | 9.2% |
| 90 or more Minutes | 0 | 0.0% |
Commute Time by Sex in Louisville
The most common commute times in Louisville are 30 to 34 minutes (68 commuters, 35.0%) for males and 30 to 34 minutes (73 commuters, 51.8%) for females.
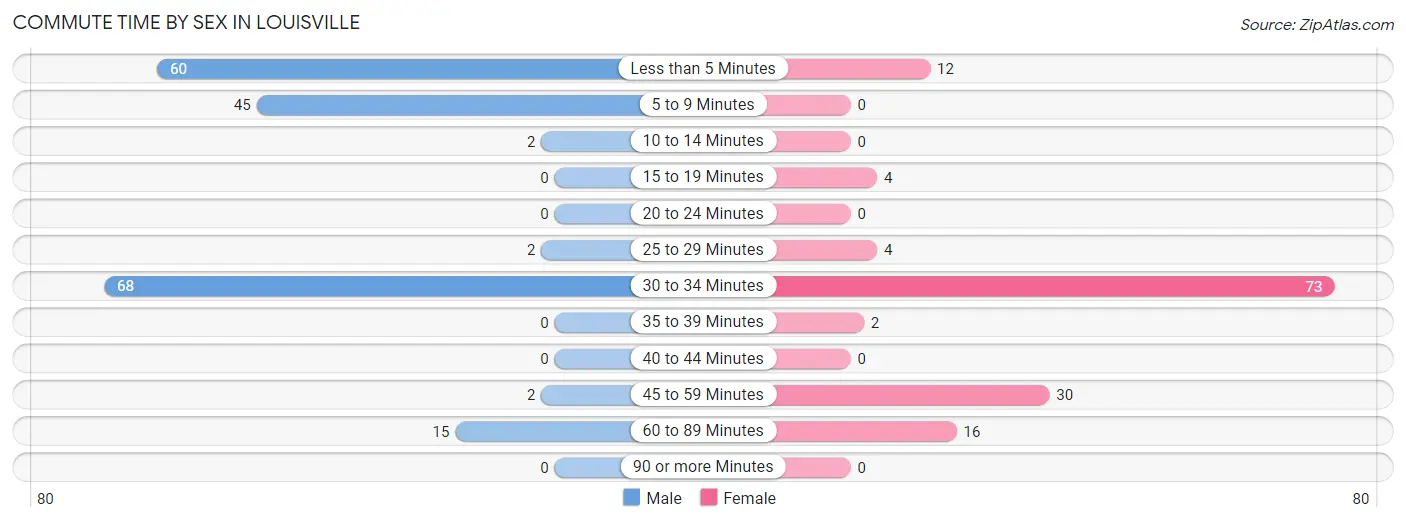
| Commute Time | Male | Female |
| Less than 5 Minutes | 60 (30.9%) | 12 (8.5%) |
| 5 to 9 Minutes | 45 (23.2%) | 0 (0.0%) |
| 10 to 14 Minutes | 2 (1.0%) | 0 (0.0%) |
| 15 to 19 Minutes | 0 (0.0%) | 4 (2.8%) |
| 20 to 24 Minutes | 0 (0.0%) | 0 (0.0%) |
| 25 to 29 Minutes | 2 (1.0%) | 4 (2.8%) |
| 30 to 34 Minutes | 68 (35.0%) | 73 (51.8%) |
| 35 to 39 Minutes | 0 (0.0%) | 2 (1.4%) |
| 40 to 44 Minutes | 0 (0.0%) | 0 (0.0%) |
| 45 to 59 Minutes | 2 (1.0%) | 30 (21.3%) |
| 60 to 89 Minutes | 15 (7.7%) | 16 (11.4%) |
| 90 or more Minutes | 0 (0.0%) | 0 (0.0%) |
Time of Departure to Work by Sex in Louisville
The most frequent times of departure to work in Louisville are 12:00 PM to 3:59 PM (37, 19.1%) for males and 7:00 AM to 7:29 AM (92, 65.2%) for females.
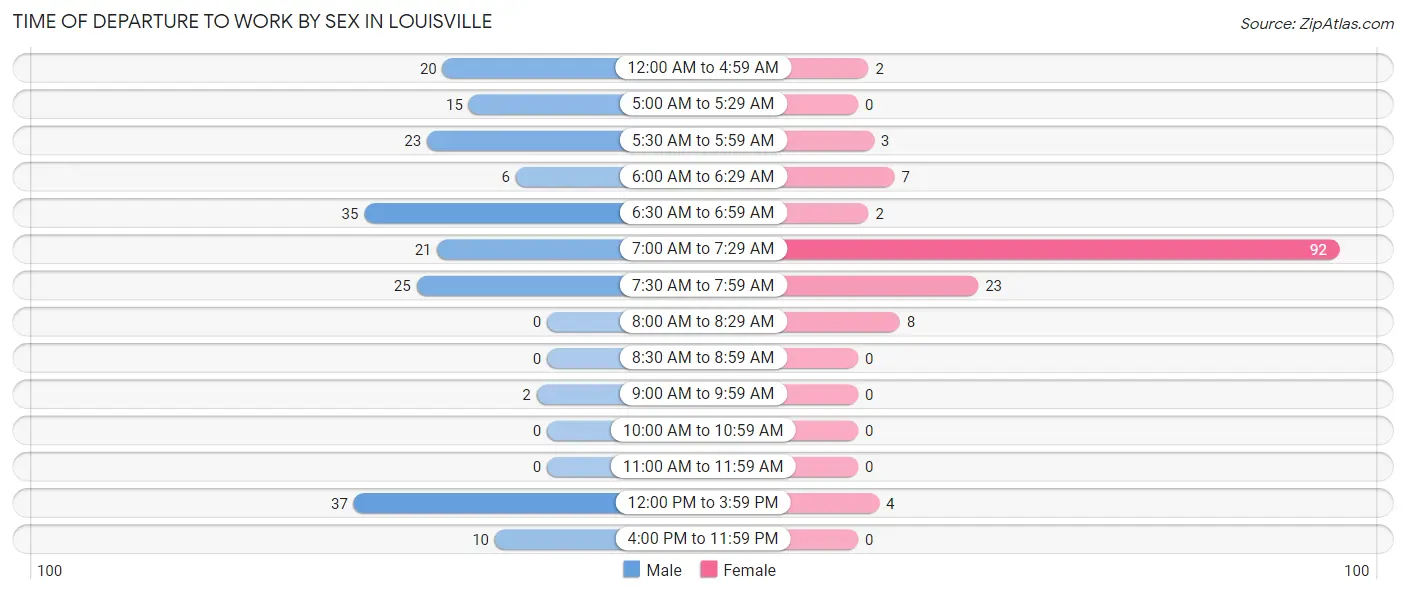
| Time of Departure | Male | Female |
| 12:00 AM to 4:59 AM | 20 (10.3%) | 2 (1.4%) |
| 5:00 AM to 5:29 AM | 15 (7.7%) | 0 (0.0%) |
| 5:30 AM to 5:59 AM | 23 (11.9%) | 3 (2.1%) |
| 6:00 AM to 6:29 AM | 6 (3.1%) | 7 (5.0%) |
| 6:30 AM to 6:59 AM | 35 (18.0%) | 2 (1.4%) |
| 7:00 AM to 7:29 AM | 21 (10.8%) | 92 (65.2%) |
| 7:30 AM to 7:59 AM | 25 (12.9%) | 23 (16.3%) |
| 8:00 AM to 8:29 AM | 0 (0.0%) | 8 (5.7%) |
| 8:30 AM to 8:59 AM | 0 (0.0%) | 0 (0.0%) |
| 9:00 AM to 9:59 AM | 2 (1.0%) | 0 (0.0%) |
| 10:00 AM to 10:59 AM | 0 (0.0%) | 0 (0.0%) |
| 11:00 AM to 11:59 AM | 0 (0.0%) | 0 (0.0%) |
| 12:00 PM to 3:59 PM | 37 (19.1%) | 4 (2.8%) |
| 4:00 PM to 11:59 PM | 10 (5.1%) | 0 (0.0%) |
| Total | 194 (100.0%) | 141 (100.0%) |
Housing Occupancy in Louisville
Occupancy by Ownership in Louisville
Of the total 272 dwellings in Louisville, owner-occupied units account for 143 (52.6%), while renter-occupied units make up 129 (47.4%).
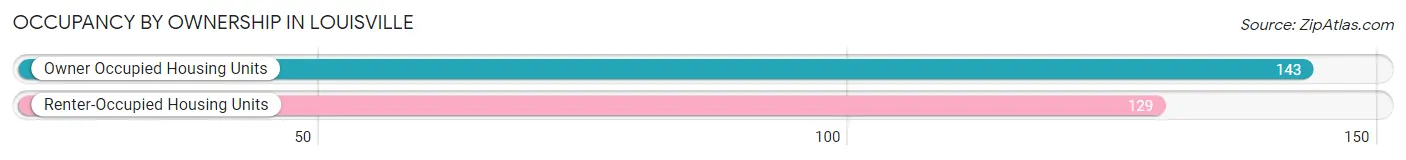
| Occupancy | # Housing Units | % Housing Units |
| Owner Occupied Housing Units | 143 | 52.6% |
| Renter-Occupied Housing Units | 129 | 47.4% |
| Total Occupied Housing Units | 272 | 100.0% |
Occupancy by Household Size in Louisville
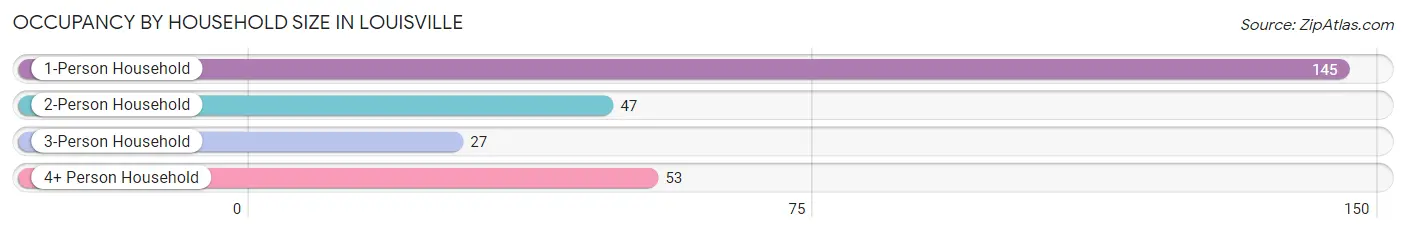
| Household Size | # Housing Units | % Housing Units |
| 1-Person Household | 145 | 53.3% |
| 2-Person Household | 47 | 17.3% |
| 3-Person Household | 27 | 9.9% |
| 4+ Person Household | 53 | 19.5% |
| Total Housing Units | 272 | 100.0% |
Occupancy by Ownership by Household Size in Louisville
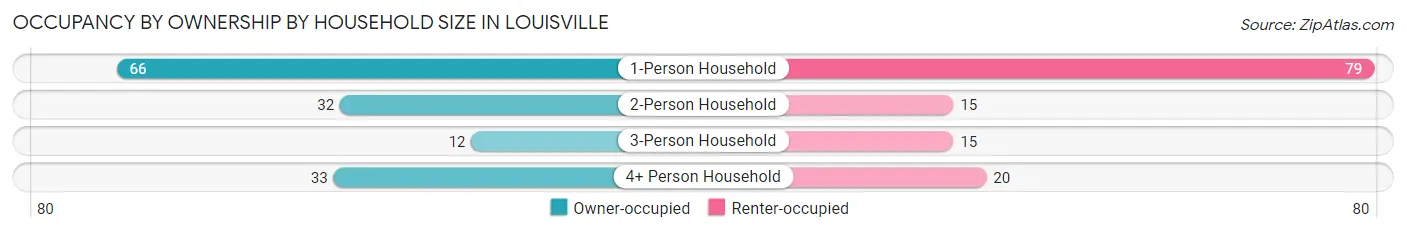
| Household Size | Owner-occupied | Renter-occupied |
| 1-Person Household | 66 (45.5%) | 79 (54.5%) |
| 2-Person Household | 32 (68.1%) | 15 (31.9%) |
| 3-Person Household | 12 (44.4%) | 15 (55.6%) |
| 4+ Person Household | 33 (62.3%) | 20 (37.7%) |
| Total Housing Units | 143 (52.6%) | 129 (47.4%) |
Occupancy by Educational Attainment in Louisville
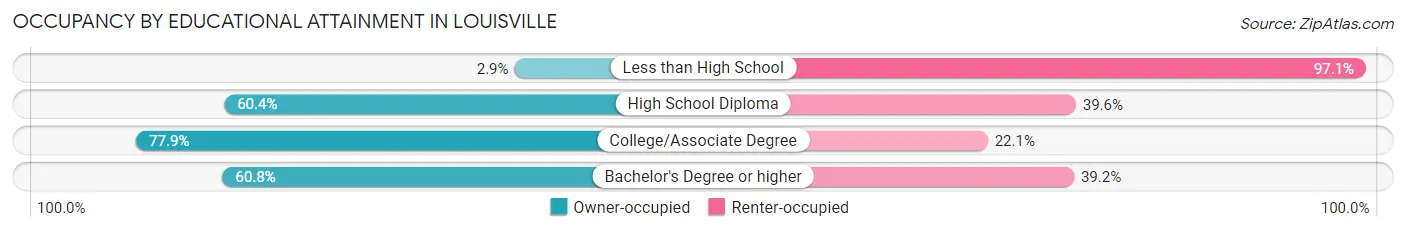
| Household Size | Owner-occupied | Renter-occupied |
| Less than High School | 2 (2.9%) | 67 (97.1%) |
| High School Diploma | 29 (60.4%) | 19 (39.6%) |
| College/Associate Degree | 81 (77.9%) | 23 (22.1%) |
| Bachelor's Degree or higher | 31 (60.8%) | 20 (39.2%) |
Occupancy by Age of Householder in Louisville
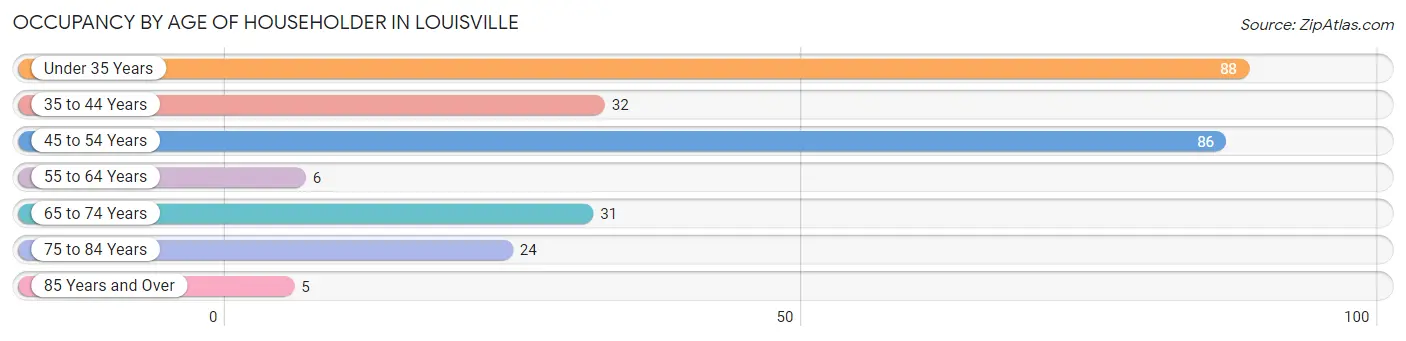
| Age Bracket | # Households | % Households |
| Under 35 Years | 88 | 32.4% |
| 35 to 44 Years | 32 | 11.8% |
| 45 to 54 Years | 86 | 31.6% |
| 55 to 64 Years | 6 | 2.2% |
| 65 to 74 Years | 31 | 11.4% |
| 75 to 84 Years | 24 | 8.8% |
| 85 Years and Over | 5 | 1.8% |
| Total | 272 | 100.0% |
Housing Finances in Louisville
Median Income by Occupancy in Louisville
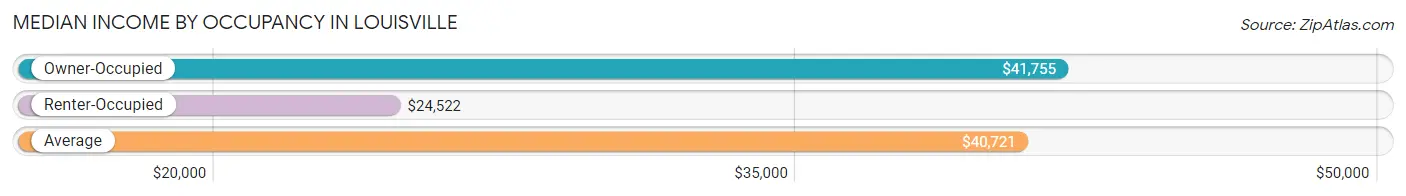
| Occupancy Type | # Households | Median Income |
| Owner-Occupied | 143 (52.6%) | $41,755 |
| Renter-Occupied | 129 (47.4%) | $24,522 |
| Average | 272 (100.0%) | $40,721 |
Occupancy by Householder Income Bracket in Louisville
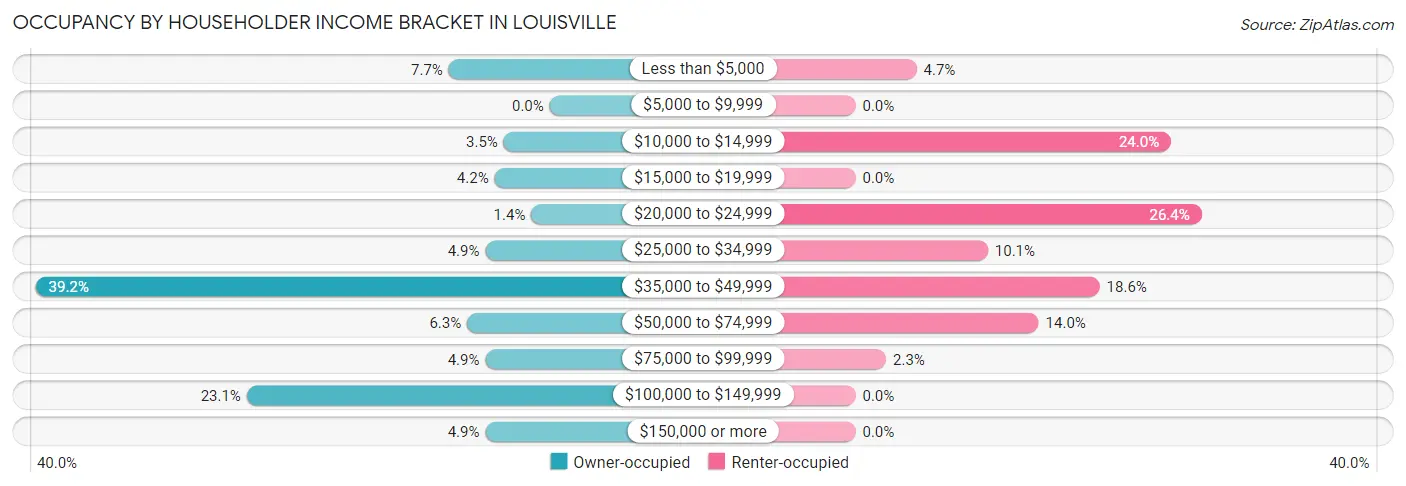
| Income Bracket | Owner-occupied | Renter-occupied |
| Less than $5,000 | 11 (7.7%) | 6 (4.6%) |
| $5,000 to $9,999 | 0 (0.0%) | 0 (0.0%) |
| $10,000 to $14,999 | 5 (3.5%) | 31 (24.0%) |
| $15,000 to $19,999 | 6 (4.2%) | 0 (0.0%) |
| $20,000 to $24,999 | 2 (1.4%) | 34 (26.4%) |
| $25,000 to $34,999 | 7 (4.9%) | 13 (10.1%) |
| $35,000 to $49,999 | 56 (39.2%) | 24 (18.6%) |
| $50,000 to $74,999 | 9 (6.3%) | 18 (14.0%) |
| $75,000 to $99,999 | 7 (4.9%) | 3 (2.3%) |
| $100,000 to $149,999 | 33 (23.1%) | 0 (0.0%) |
| $150,000 or more | 7 (4.9%) | 0 (0.0%) |
| Total | 143 (100.0%) | 129 (100.0%) |
Monthly Housing Cost Tiers in Louisville
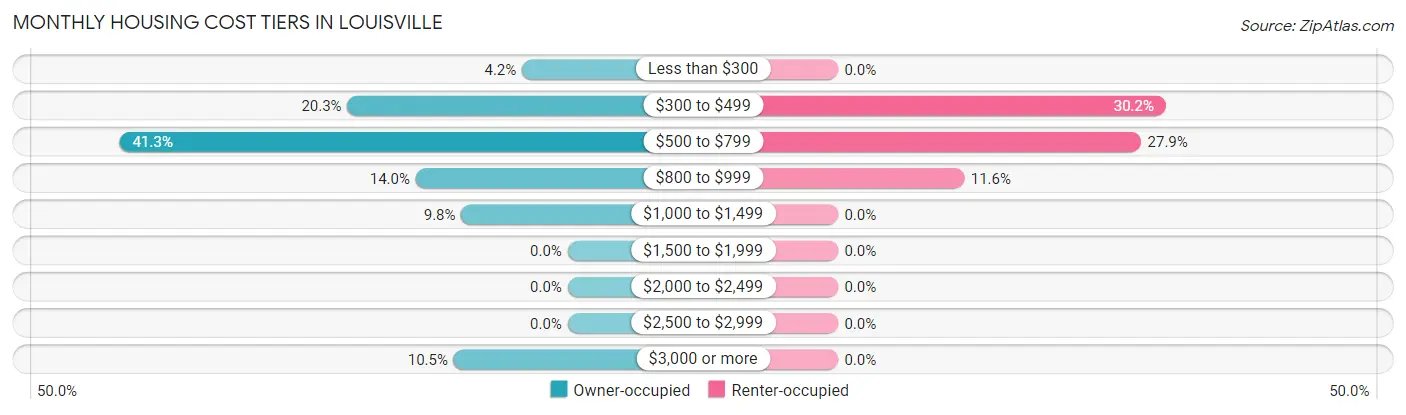
| Monthly Cost | Owner-occupied | Renter-occupied |
| Less than $300 | 6 (4.2%) | 0 (0.0%) |
| $300 to $499 | 29 (20.3%) | 39 (30.2%) |
| $500 to $799 | 59 (41.3%) | 36 (27.9%) |
| $800 to $999 | 20 (14.0%) | 15 (11.6%) |
| $1,000 to $1,499 | 14 (9.8%) | 0 (0.0%) |
| $1,500 to $1,999 | 0 (0.0%) | 0 (0.0%) |
| $2,000 to $2,499 | 0 (0.0%) | 0 (0.0%) |
| $2,500 to $2,999 | 0 (0.0%) | 0 (0.0%) |
| $3,000 or more | 15 (10.5%) | 0 (0.0%) |
| Total | 143 (100.0%) | 129 (100.0%) |
Physical Housing Characteristics in Louisville
Housing Structures in Louisville
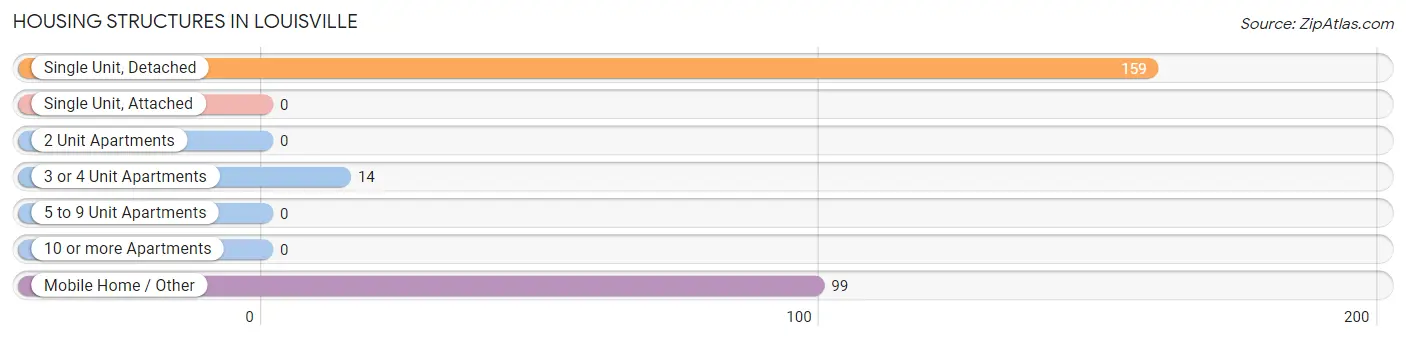
| Structure Type | # Housing Units | % Housing Units |
| Single Unit, Detached | 159 | 58.5% |
| Single Unit, Attached | 0 | 0.0% |
| 2 Unit Apartments | 0 | 0.0% |
| 3 or 4 Unit Apartments | 14 | 5.1% |
| 5 to 9 Unit Apartments | 0 | 0.0% |
| 10 or more Apartments | 0 | 0.0% |
| Mobile Home / Other | 99 | 36.4% |
| Total | 272 | 100.0% |
Housing Structures by Occupancy in Louisville
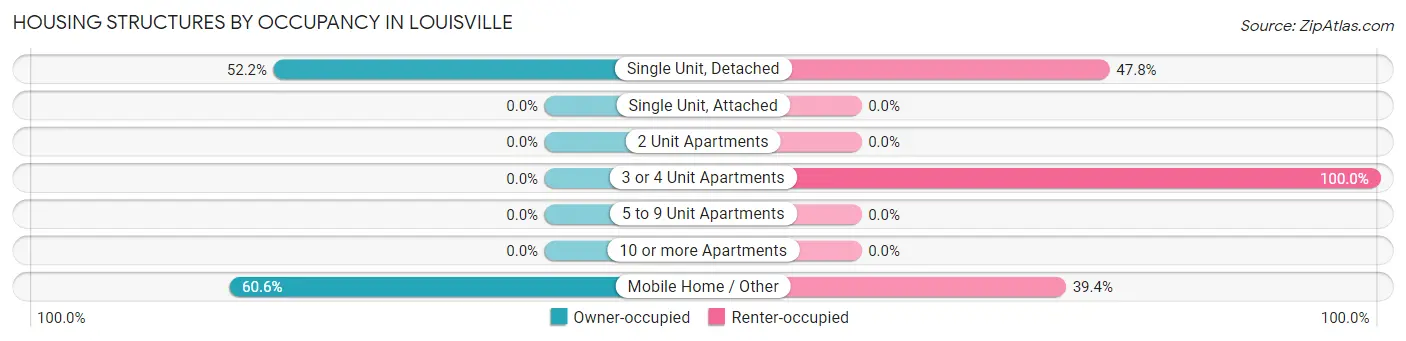
| Structure Type | Owner-occupied | Renter-occupied |
| Single Unit, Detached | 83 (52.2%) | 76 (47.8%) |
| Single Unit, Attached | 0 (0.0%) | 0 (0.0%) |
| 2 Unit Apartments | 0 (0.0%) | 0 (0.0%) |
| 3 or 4 Unit Apartments | 0 (0.0%) | 14 (100.0%) |
| 5 to 9 Unit Apartments | 0 (0.0%) | 0 (0.0%) |
| 10 or more Apartments | 0 (0.0%) | 0 (0.0%) |
| Mobile Home / Other | 60 (60.6%) | 39 (39.4%) |
| Total | 143 (52.6%) | 129 (47.4%) |
Housing Structures by Number of Rooms in Louisville
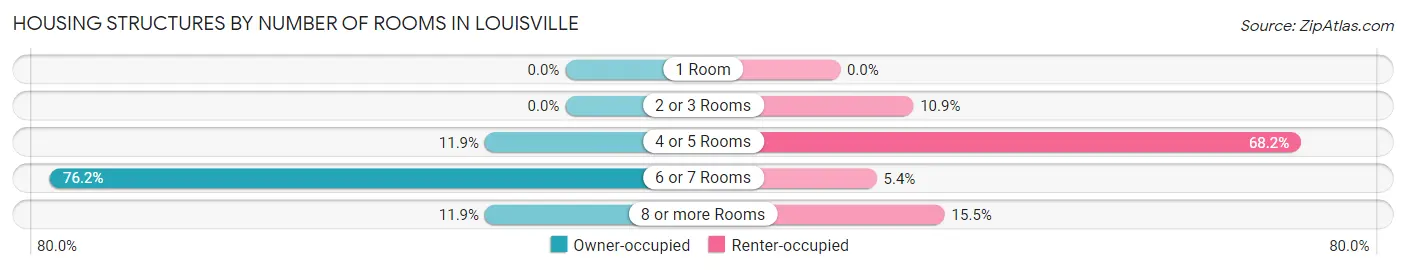
| Number of Rooms | Owner-occupied | Renter-occupied |
| 1 Room | 0 (0.0%) | 0 (0.0%) |
| 2 or 3 Rooms | 0 (0.0%) | 14 (10.8%) |
| 4 or 5 Rooms | 17 (11.9%) | 88 (68.2%) |
| 6 or 7 Rooms | 109 (76.2%) | 7 (5.4%) |
| 8 or more Rooms | 17 (11.9%) | 20 (15.5%) |
| Total | 143 (100.0%) | 129 (100.0%) |
Housing Structure by Heating Type in Louisville
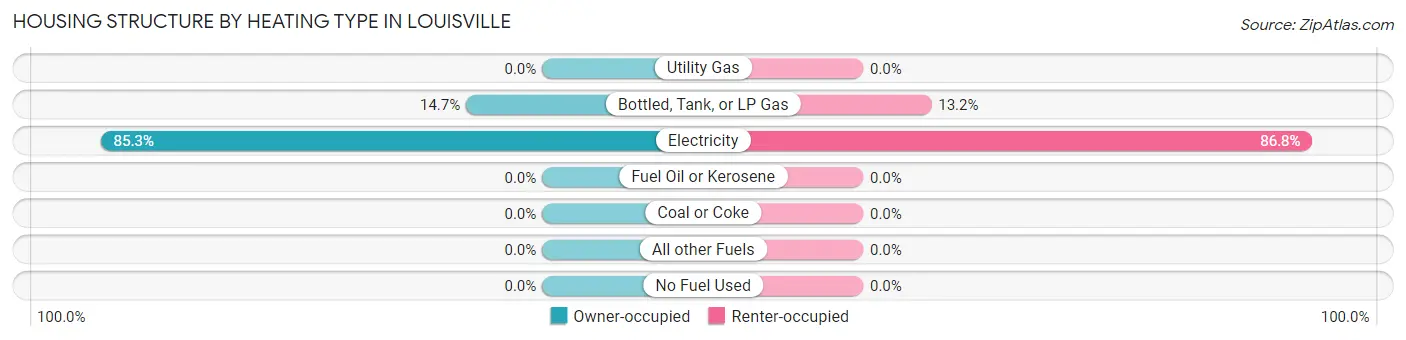
| Heating Type | Owner-occupied | Renter-occupied |
| Utility Gas | 0 (0.0%) | 0 (0.0%) |
| Bottled, Tank, or LP Gas | 21 (14.7%) | 17 (13.2%) |
| Electricity | 122 (85.3%) | 112 (86.8%) |
| Fuel Oil or Kerosene | 0 (0.0%) | 0 (0.0%) |
| Coal or Coke | 0 (0.0%) | 0 (0.0%) |
| All other Fuels | 0 (0.0%) | 0 (0.0%) |
| No Fuel Used | 0 (0.0%) | 0 (0.0%) |
| Total | 143 (100.0%) | 129 (100.0%) |
Household Vehicle Usage in Louisville
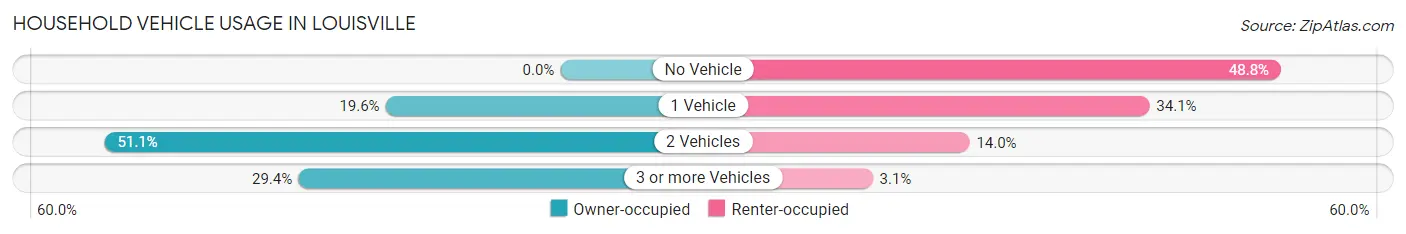
| Vehicles per Household | Owner-occupied | Renter-occupied |
| No Vehicle | 0 (0.0%) | 63 (48.8%) |
| 1 Vehicle | 28 (19.6%) | 44 (34.1%) |
| 2 Vehicles | 73 (51.0%) | 18 (14.0%) |
| 3 or more Vehicles | 42 (29.4%) | 4 (3.1%) |
| Total | 143 (100.0%) | 129 (100.0%) |
Real Estate & Mortgages in Louisville
Real Estate and Mortgage Overview in Louisville
| Characteristic | Without Mortgage | With Mortgage |
| Housing Units | 50 | 93 |
| Median Property Value | $97,800 | $0 |
| Median Household Income | $28,000 | $4 |
| Monthly Housing Costs | $460 | $15 |
| Real Estate Taxes | $393 | $21 |
Property Value by Mortgage Status in Louisville
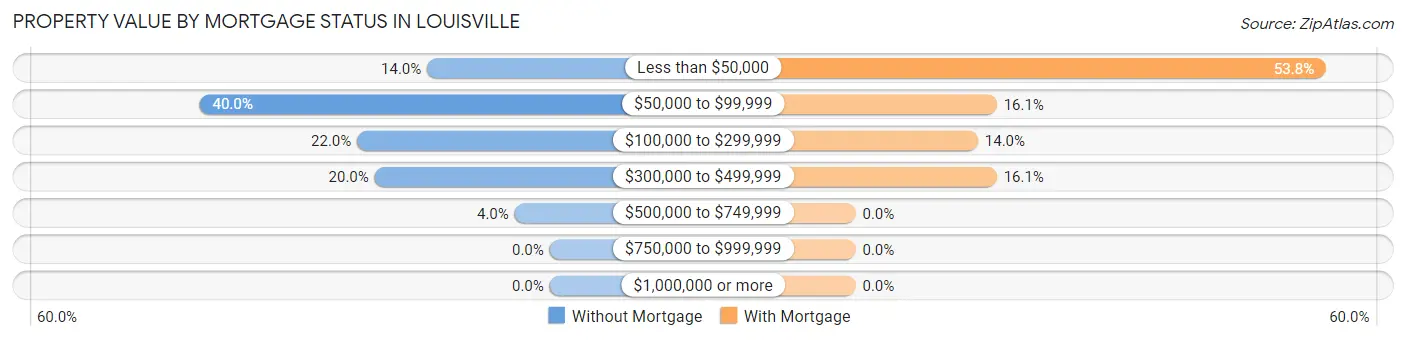
| Property Value | Without Mortgage | With Mortgage |
| Less than $50,000 | 7 (14.0%) | 50 (53.8%) |
| $50,000 to $99,999 | 20 (40.0%) | 15 (16.1%) |
| $100,000 to $299,999 | 11 (22.0%) | 13 (14.0%) |
| $300,000 to $499,999 | 10 (20.0%) | 15 (16.1%) |
| $500,000 to $749,999 | 2 (4.0%) | 0 (0.0%) |
| $750,000 to $999,999 | 0 (0.0%) | 0 (0.0%) |
| $1,000,000 or more | 0 (0.0%) | 0 (0.0%) |
| Total | 50 (100.0%) | 93 (100.0%) |
Household Income by Mortgage Status in Louisville
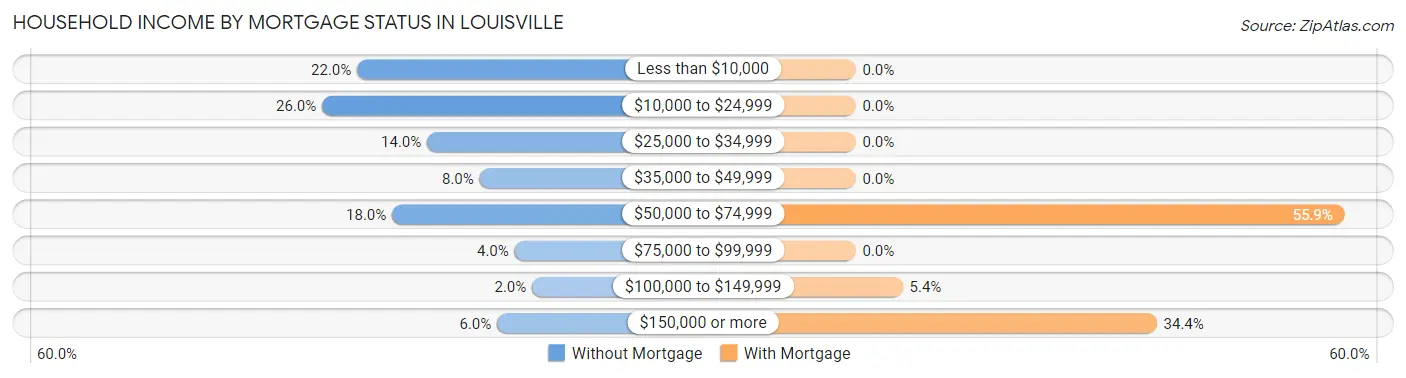
| Household Income | Without Mortgage | With Mortgage |
| Less than $10,000 | 11 (22.0%) | 0 (0.0%) |
| $10,000 to $24,999 | 13 (26.0%) | 0 (0.0%) |
| $25,000 to $34,999 | 7 (14.0%) | 0 (0.0%) |
| $35,000 to $49,999 | 4 (8.0%) | 0 (0.0%) |
| $50,000 to $74,999 | 9 (18.0%) | 52 (55.9%) |
| $75,000 to $99,999 | 2 (4.0%) | 0 (0.0%) |
| $100,000 to $149,999 | 1 (2.0%) | 5 (5.4%) |
| $150,000 or more | 3 (6.0%) | 32 (34.4%) |
| Total | 50 (100.0%) | 93 (100.0%) |
Property Value to Household Income Ratio in Louisville
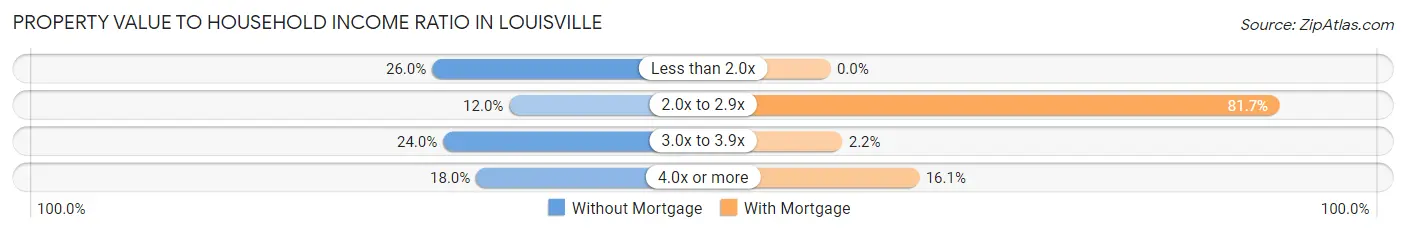
| Value-to-Income Ratio | Without Mortgage | With Mortgage |
| Less than 2.0x | 13 (26.0%) | 0 (0.0%) |
| 2.0x to 2.9x | 6 (12.0%) | 76 (81.7%) |
| 3.0x to 3.9x | 12 (24.0%) | 2 (2.1%) |
| 4.0x or more | 9 (18.0%) | 15 (16.1%) |
| Total | 50 (100.0%) | 93 (100.0%) |
Real Estate Taxes by Mortgage Status in Louisville
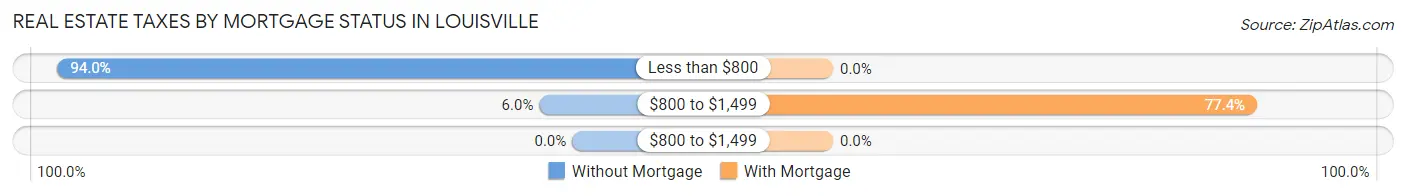
| Property Taxes | Without Mortgage | With Mortgage |
| Less than $800 | 47 (94.0%) | 0 (0.0%) |
| $800 to $1,499 | 3 (6.0%) | 72 (77.4%) |
| $800 to $1,499 | 0 (0.0%) | 0 (0.0%) |
| Total | 50 (100.0%) | 93 (100.0%) |
Health & Disability in Louisville
Health Insurance Coverage by Age in Louisville
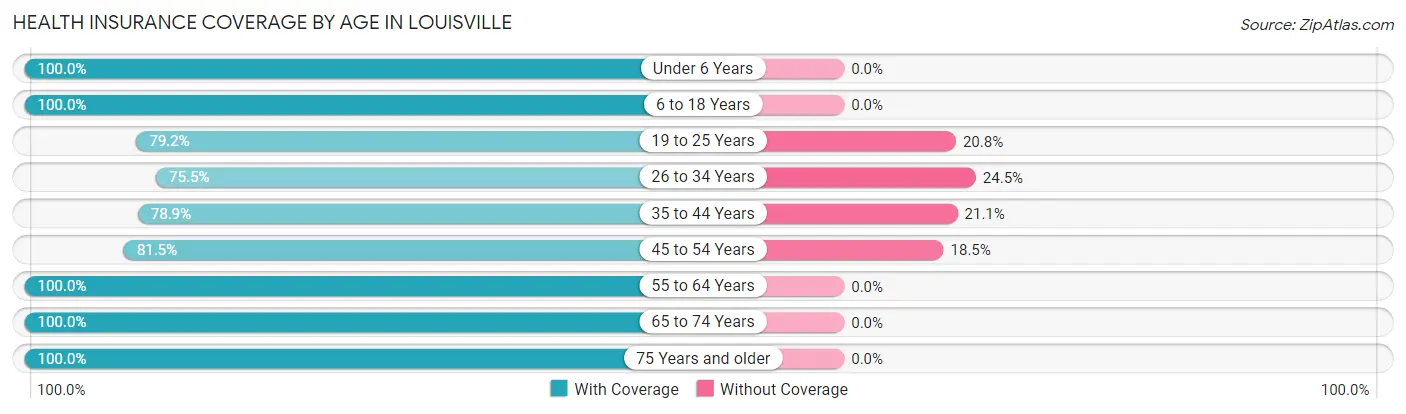
| Age Bracket | With Coverage | Without Coverage |
| Under 6 Years | 42 (100.0%) | 0 (0.0%) |
| 6 to 18 Years | 85 (100.0%) | 0 (0.0%) |
| 19 to 25 Years | 38 (79.2%) | 10 (20.8%) |
| 26 to 34 Years | 123 (75.5%) | 40 (24.5%) |
| 35 to 44 Years | 56 (78.9%) | 15 (21.1%) |
| 45 to 54 Years | 88 (81.5%) | 20 (18.5%) |
| 55 to 64 Years | 18 (100.0%) | 0 (0.0%) |
| 65 to 74 Years | 31 (100.0%) | 0 (0.0%) |
| 75 Years and older | 46 (100.0%) | 0 (0.0%) |
| Total | 527 (86.1%) | 85 (13.9%) |
Health Insurance Coverage by Citizenship Status in Louisville
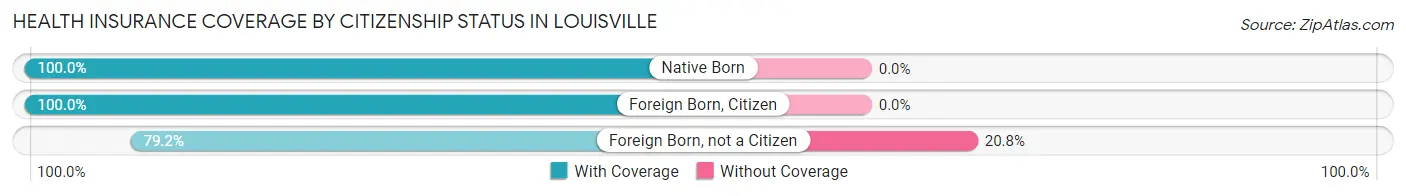
| Citizenship Status | With Coverage | Without Coverage |
| Native Born | 42 (100.0%) | 0 (0.0%) |
| Foreign Born, Citizen | 85 (100.0%) | 0 (0.0%) |
| Foreign Born, not a Citizen | 38 (79.2%) | 10 (20.8%) |
Health Insurance Coverage by Household Income in Louisville
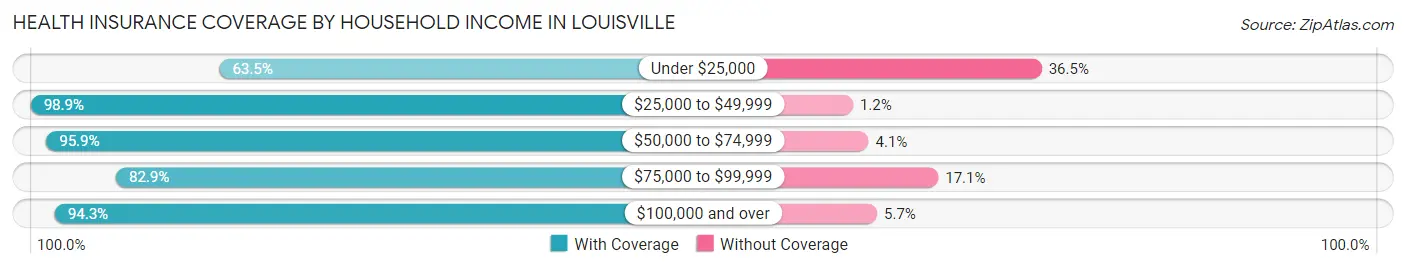
| Household Income | With Coverage | Without Coverage |
| Under $25,000 | 113 (63.5%) | 65 (36.5%) |
| $25,000 to $49,999 | 172 (98.9%) | 2 (1.1%) |
| $50,000 to $74,999 | 47 (95.9%) | 2 (4.1%) |
| $75,000 to $99,999 | 29 (82.9%) | 6 (17.1%) |
| $100,000 and over | 166 (94.3%) | 10 (5.7%) |
Public vs Private Health Insurance Coverage by Age in Louisville
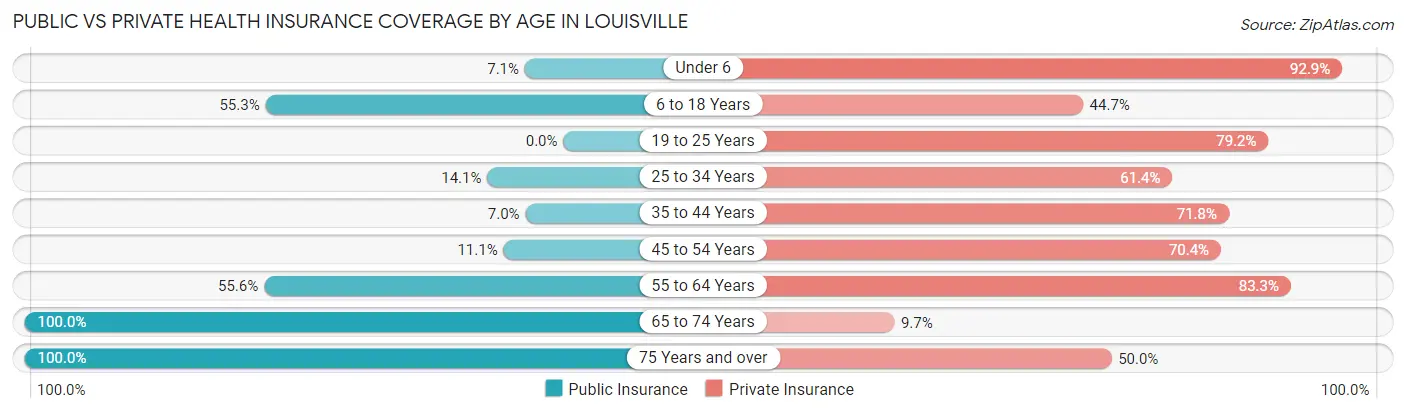
| Age Bracket | Public Insurance | Private Insurance |
| Under 6 | 3 (7.1%) | 39 (92.9%) |
| 6 to 18 Years | 47 (55.3%) | 38 (44.7%) |
| 19 to 25 Years | 0 (0.0%) | 38 (79.2%) |
| 25 to 34 Years | 23 (14.1%) | 100 (61.4%) |
| 35 to 44 Years | 5 (7.0%) | 51 (71.8%) |
| 45 to 54 Years | 12 (11.1%) | 76 (70.4%) |
| 55 to 64 Years | 10 (55.6%) | 15 (83.3%) |
| 65 to 74 Years | 31 (100.0%) | 3 (9.7%) |
| 75 Years and over | 46 (100.0%) | 23 (50.0%) |
| Total | 177 (28.9%) | 383 (62.6%) |
Disability Status by Sex by Age in Louisville
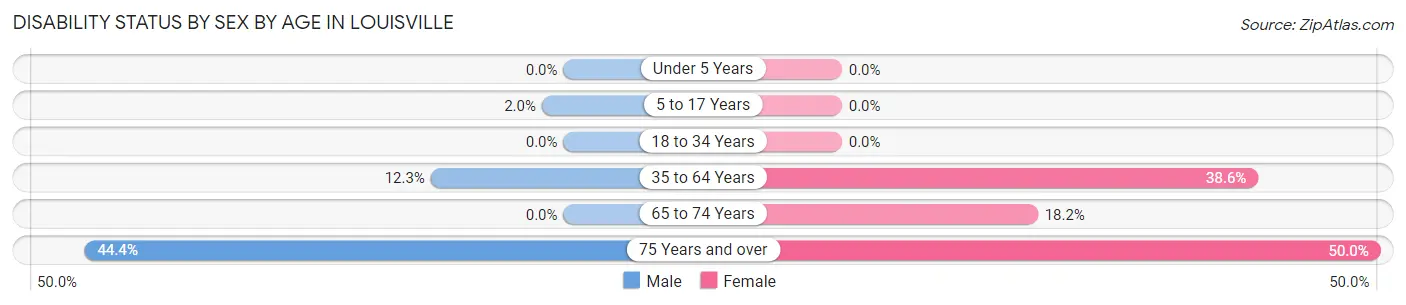
| Age Bracket | Male | Female |
| Under 5 Years | 0 (0.0%) | 0 (0.0%) |
| 5 to 17 Years | 1 (2.0%) | 0 (0.0%) |
| 18 to 34 Years | 0 (0.0%) | 0 (0.0%) |
| 35 to 64 Years | 8 (12.3%) | 51 (38.6%) |
| 65 to 74 Years | 0 (0.0%) | 2 (18.2%) |
| 75 Years and over | 8 (44.4%) | 14 (50.0%) |
Disability Class by Sex by Age in Louisville
Disability Class: Hearing Difficulty
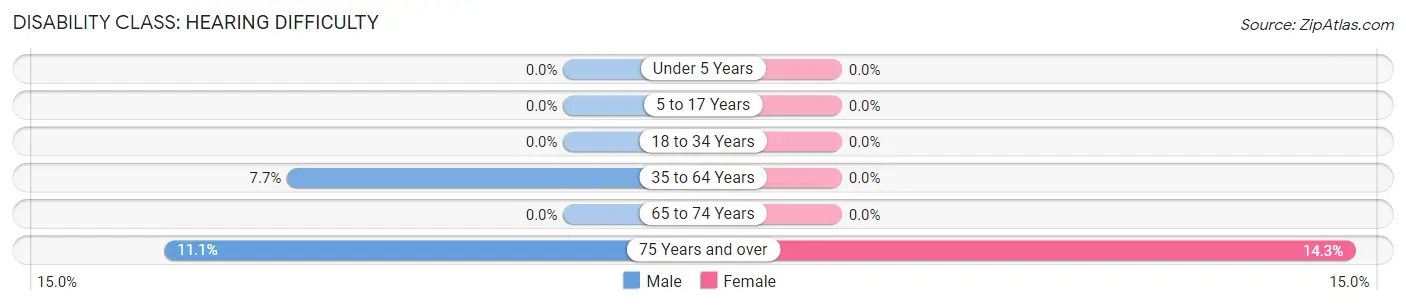
| Age Bracket | Male | Female |
| Under 5 Years | 0 (0.0%) | 0 (0.0%) |
| 5 to 17 Years | 0 (0.0%) | 0 (0.0%) |
| 18 to 34 Years | 0 (0.0%) | 0 (0.0%) |
| 35 to 64 Years | 5 (7.7%) | 0 (0.0%) |
| 65 to 74 Years | 0 (0.0%) | 0 (0.0%) |
| 75 Years and over | 2 (11.1%) | 4 (14.3%) |
Disability Class: Vision Difficulty
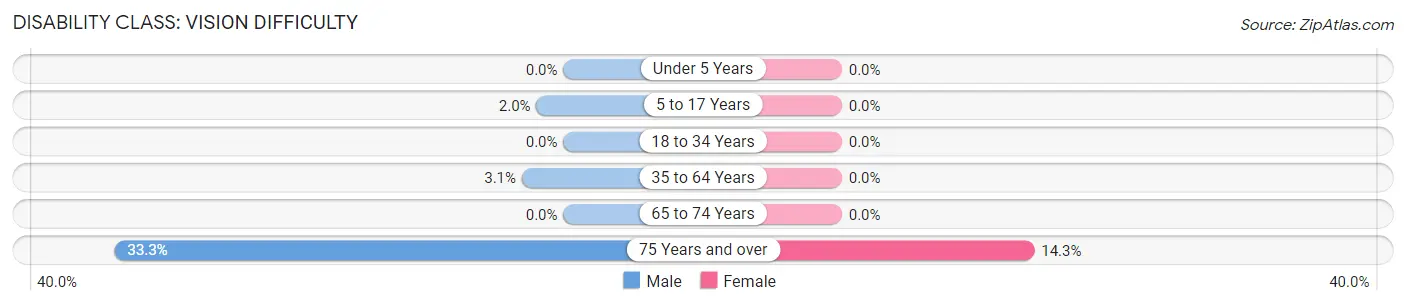
| Age Bracket | Male | Female |
| Under 5 Years | 0 (0.0%) | 0 (0.0%) |
| 5 to 17 Years | 1 (2.0%) | 0 (0.0%) |
| 18 to 34 Years | 0 (0.0%) | 0 (0.0%) |
| 35 to 64 Years | 2 (3.1%) | 0 (0.0%) |
| 65 to 74 Years | 0 (0.0%) | 0 (0.0%) |
| 75 Years and over | 6 (33.3%) | 4 (14.3%) |
Disability Class: Cognitive Difficulty
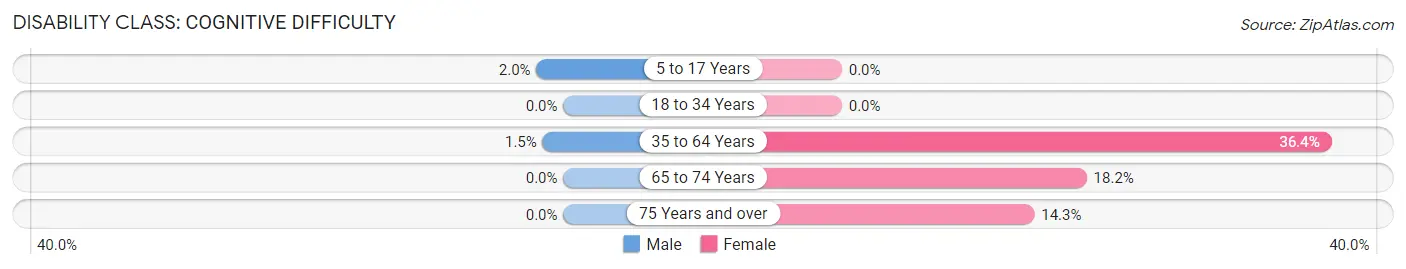
| Age Bracket | Male | Female |
| 5 to 17 Years | 1 (2.0%) | 0 (0.0%) |
| 18 to 34 Years | 0 (0.0%) | 0 (0.0%) |
| 35 to 64 Years | 1 (1.5%) | 48 (36.4%) |
| 65 to 74 Years | 0 (0.0%) | 2 (18.2%) |
| 75 Years and over | 0 (0.0%) | 4 (14.3%) |
Disability Class: Ambulatory Difficulty
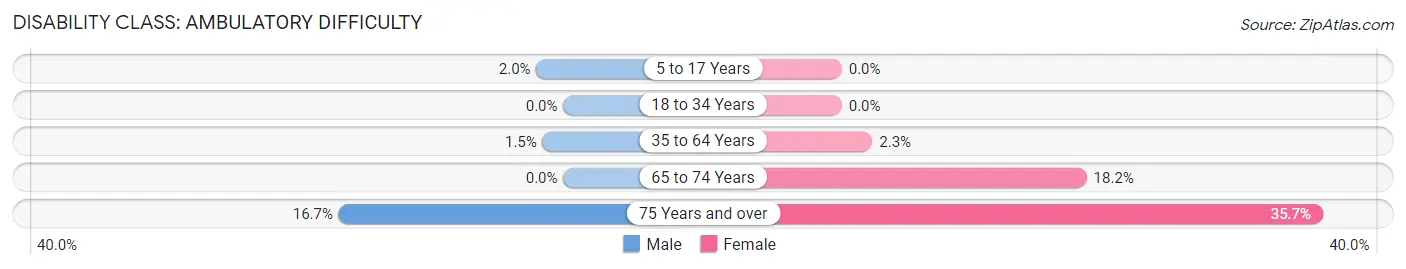
| Age Bracket | Male | Female |
| 5 to 17 Years | 1 (2.0%) | 0 (0.0%) |
| 18 to 34 Years | 0 (0.0%) | 0 (0.0%) |
| 35 to 64 Years | 1 (1.5%) | 3 (2.3%) |
| 65 to 74 Years | 0 (0.0%) | 2 (18.2%) |
| 75 Years and over | 3 (16.7%) | 10 (35.7%) |
Disability Class: Self-Care Difficulty
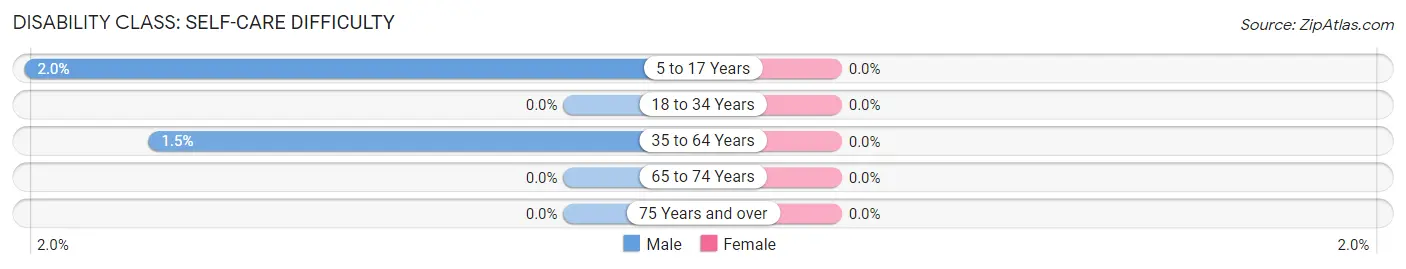
| Age Bracket | Male | Female |
| 5 to 17 Years | 1 (2.0%) | 0 (0.0%) |
| 18 to 34 Years | 0 (0.0%) | 0 (0.0%) |
| 35 to 64 Years | 1 (1.5%) | 0 (0.0%) |
| 65 to 74 Years | 0 (0.0%) | 0 (0.0%) |
| 75 Years and over | 0 (0.0%) | 0 (0.0%) |
Technology Access in Louisville
Computing Device Access in Louisville
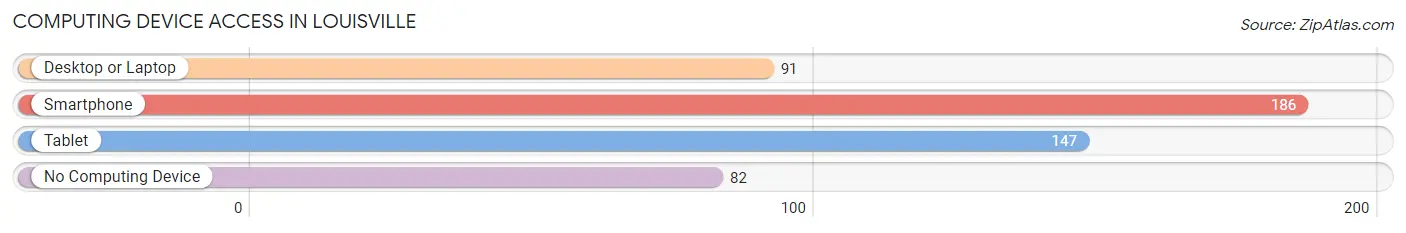
| Device Type | # Households | % Households |
| Desktop or Laptop | 91 | 33.5% |
| Smartphone | 186 | 68.4% |
| Tablet | 147 | 54.0% |
| No Computing Device | 82 | 30.1% |
| Total | 272 | 100.0% |
Internet Access in Louisville
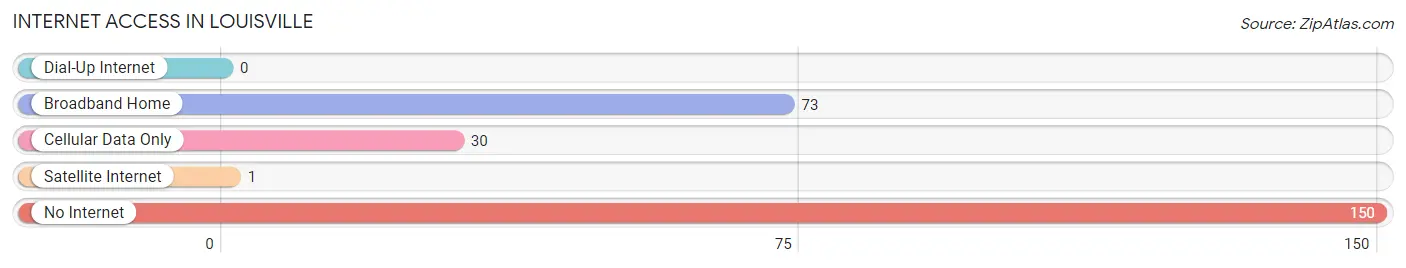
| Internet Type | # Households | % Households |
| Dial-Up Internet | 0 | 0.0% |
| Broadband Home | 73 | 26.8% |
| Cellular Data Only | 30 | 11.0% |
| Satellite Internet | 1 | 0.4% |
| No Internet | 150 | 55.1% |
| Total | 272 | 100.0% |
Louisville Summary
Louisville, Alabama is a small town located in the east-central part of the state, in the foothills of the Appalachian Mountains. It is the county seat of Barbour County and is located about 30 miles south of the state capital, Montgomery. The town has a population of approximately 2,500 people and is part of the Dothan Metropolitan Statistical Area.
History
The area that is now Louisville was first settled in the early 1800s by settlers from Georgia and South Carolina. The town was originally known as “Newville” and was later renamed “Louisville” in honor of General Louis Wigfall, a Confederate general who was killed in the Battle of Gettysburg. The town was officially incorporated in 1883.
In the late 19th century, Louisville was a thriving agricultural center, with cotton, corn, and peanuts being the main crops. The town also had a number of sawmills and gristmills, as well as a number of stores and other businesses.
In the early 20th century, Louisville began to experience a decline in its economy. The Great Depression hit the town hard, and many of the businesses and mills closed. The town’s population also began to decline, as many people moved away in search of better economic opportunities.
Geography
Louisville is located in east-central Alabama, in the foothills of the Appalachian Mountains. The town is situated on the banks of the Choctawhatchee River, which flows through the town and is a popular spot for fishing and other recreational activities. The town is surrounded by rolling hills and forests, and is located about 30 miles south of the state capital, Montgomery.
Economy
The economy of Louisville is largely based on agriculture and forestry. The town is home to a number of farms, which produce cotton, corn, peanuts, and other crops. The town also has a number of sawmills and gristmills, which produce lumber and other wood products.
In addition to agriculture and forestry, Louisville also has a number of small businesses, including restaurants, retail stores, and service providers. The town is also home to a number of manufacturing companies, which produce a variety of products, including furniture, clothing, and automotive parts.
Demographics
As of the 2010 census, Louisville had a population of 2,500 people. The racial makeup of the town was 79.2% White, 17.2% African American, 0.4% Native American, 0.4% Asian, and 2.8% from other races. The median household income was $25,000, and the median family income was $31,000.
Conclusion
Louisville, Alabama is a small town located in the east-central part of the state, in the foothills of the Appalachian Mountains. It is the county seat of Barbour County and is located about 30 miles south of the state capital, Montgomery. The town has a population of approximately 2,500 people and is part of the Dothan Metropolitan Statistical Area. The economy of Louisville is largely based on agriculture and forestry, and the town is also home to a number of small businesses. The racial makeup of the town is 79.2% White, 17.2% African American, 0.4% Native American, 0.4% Asian, and 2.8% from other races. The median household income was $25,000, and the median family income was $31,000.
Common Questions
What is Per Capita Income in Louisville?
Per Capita income in Louisville is $24,818.
What is the Median Household income in Louisville?
Median Household Income in Louisville is $40,721.
What is Income or Wage Gap in Louisville?
Income or Wage Gap in Louisville is 38.2%.
Women in Louisville earn 61.8 cents for every dollar earned by a man.
What is Inequality or Gini Index in Louisville?
Inequality or Gini Index in Louisville is 0.45.
What is the Total Population of Louisville?
Total Population of Louisville is 612.
What is the Total Male Population of Louisville?
Total Male Population of Louisville is 309.
What is the Total Female Population of Louisville?
Total Female Population of Louisville is 303.
What is the Ratio of Males per 100 Females in Louisville?
There are 101.98 Males per 100 Females in Louisville.
What is the Ratio of Females per 100 Males in Louisville?
There are 98.06 Females per 100 Males in Louisville.
What is the Median Population Age in Louisville?
Median Population Age in Louisville is 32.5 Years.
What is the Average Family Size in Louisville
Average Family Size in Louisville is 3.8 People.
What is the Average Household Size in Louisville
Average Household Size in Louisville is 2.2 People.
How Large is the Labor Force in Louisville?
There are 350 People in the Labor Forcein in Louisville.
What is the Percentage of People in the Labor Force in Louisville?
71.4% of People are in the Labor Force in Louisville.
What is the Unemployment Rate in Louisville?
Unemployment Rate in Louisville is 3.4%.