Rosemount, MN Map & Demographics
Rosemount Map
Rosemount Overview
$54,250
PER CAPITA INCOME
$142,642
AVG FAMILY INCOME
$127,252
AVG HOUSEHOLD INCOME
22.4%
WAGE / INCOME GAP [ % ]
77.6¢/ $1
WAGE / INCOME GAP [ $ ]
0.38
INEQUALITY / GINI INDEX
25,993
TOTAL POPULATION
13,180
MALE POPULATION
12,813
FEMALE POPULATION
102.86
MALES / 100 FEMALES
97.22
FEMALES / 100 MALES
37.8
MEDIAN AGE
3.1
AVG FAMILY SIZE
2.8
AVG HOUSEHOLD SIZE
14,919
LABOR FORCE [ PEOPLE ]
74.6%
PERCENT IN LABOR FORCE
3.1%
UNEMPLOYMENT RATE
Rosemount Zip Codes
Income in Rosemount
Income Overview in Rosemount
Per Capita Income in Rosemount is $54,250, while median incomes of families and households are $142,642 and $127,252 respectively.
| Characteristic | Number | Measure |
| Per Capita Income | 25,993 | $54,250 |
| Median Family Income | 7,439 | $142,642 |
| Mean Family Income | 7,439 | $165,844 |
| Median Household Income | 9,229 | $127,252 |
| Mean Household Income | 9,229 | $150,699 |
| Income Deficit | 7,439 | $0 |
| Wage / Income Gap (%) | 25,993 | 22.42% |
| Wage / Income Gap ($) | 25,993 | 77.58¢ per $1 |
| Gini / Inequality Index | 25,993 | 0.38 |
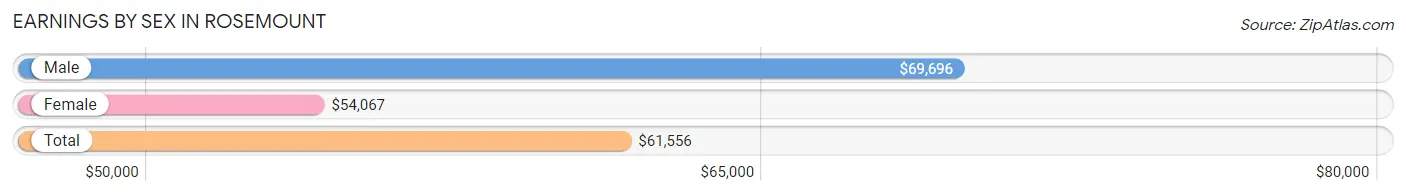
Earnings by Sex in Rosemount
Average Earnings in Rosemount are $61,556, $69,696 for men and $54,067 for women, a difference of 22.4%.
| Sex | Number | Average Earnings |
| Male | 8,251 (52.8%) | $69,696 |
| Female | 7,385 (47.2%) | $54,067 |
| Total | 15,636 (100.0%) | $61,556 |
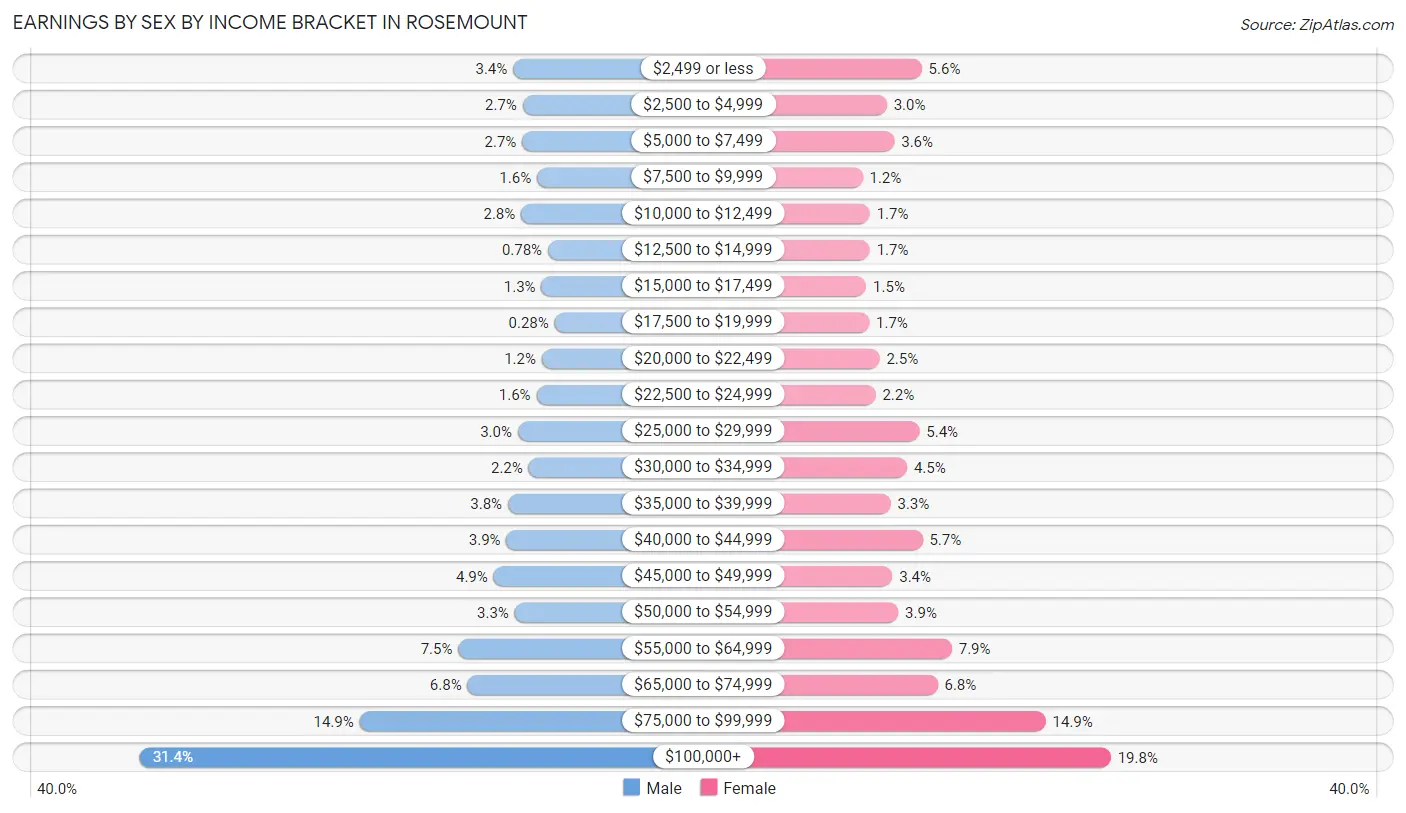
Earnings by Sex by Income Bracket in Rosemount
The most common earnings brackets in Rosemount are $100,000+ for men (2,588 | 31.4%) and $100,000+ for women (1,461 | 19.8%).
| Income | Male | Female |
| $2,499 or less | 280 (3.4%) | 414 (5.6%) |
| $2,500 to $4,999 | 220 (2.7%) | 221 (3.0%) |
| $5,000 to $7,499 | 224 (2.7%) | 263 (3.6%) |
| $7,500 to $9,999 | 132 (1.6%) | 87 (1.2%) |
| $10,000 to $12,499 | 230 (2.8%) | 127 (1.7%) |
| $12,500 to $14,999 | 64 (0.8%) | 127 (1.7%) |
| $15,000 to $17,499 | 105 (1.3%) | 107 (1.5%) |
| $17,500 to $19,999 | 23 (0.3%) | 123 (1.7%) |
| $20,000 to $22,499 | 102 (1.2%) | 181 (2.5%) |
| $22,500 to $24,999 | 135 (1.6%) | 159 (2.1%) |
| $25,000 to $29,999 | 251 (3.0%) | 402 (5.4%) |
| $30,000 to $34,999 | 184 (2.2%) | 333 (4.5%) |
| $35,000 to $39,999 | 312 (3.8%) | 242 (3.3%) |
| $40,000 to $44,999 | 321 (3.9%) | 419 (5.7%) |
| $45,000 to $49,999 | 400 (4.9%) | 252 (3.4%) |
| $50,000 to $54,999 | 270 (3.3%) | 284 (3.8%) |
| $55,000 to $64,999 | 619 (7.5%) | 581 (7.9%) |
| $65,000 to $74,999 | 562 (6.8%) | 502 (6.8%) |
| $75,000 to $99,999 | 1,229 (14.9%) | 1,100 (14.9%) |
| $100,000+ | 2,588 (31.4%) | 1,461 (19.8%) |
| Total | 8,251 (100.0%) | 7,385 (100.0%) |
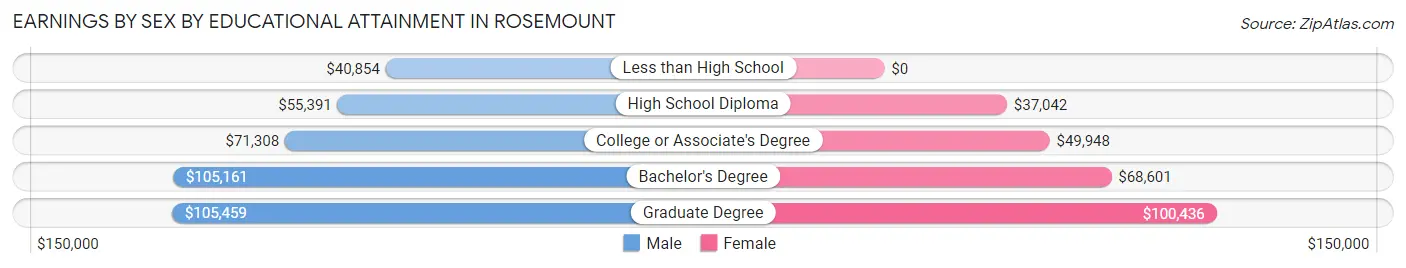
Earnings by Sex by Educational Attainment in Rosemount
Average earnings in Rosemount are $78,095 for men and $62,574 for women, a difference of 19.9%. Men with an educational attainment of graduate degree enjoy the highest average annual earnings of $105,459, while those with less than high school education earn the least with $40,854. Women with an educational attainment of graduate degree earn the most with the average annual earnings of $100,436, while those with high school diploma education have the smallest earnings of $37,042.
| Educational Attainment | Male Income | Female Income |
| Less than High School | $40,854 | $0 |
| High School Diploma | $55,391 | $37,042 |
| College or Associate's Degree | $71,308 | $49,948 |
| Bachelor's Degree | $105,161 | $68,601 |
| Graduate Degree | $105,459 | $100,436 |
| Total | $78,095 | $62,574 |
Family Income in Rosemount
Family Income Brackets in Rosemount
According to the Rosemount family income data, there are 2,016 families falling into the $200,000+ income range, which is the most common income bracket and makes up 27.1% of all families. Conversely, the $15,000 to $24,999 income bracket is the least frequent group with only 7 families (0.1%) belonging to this category.
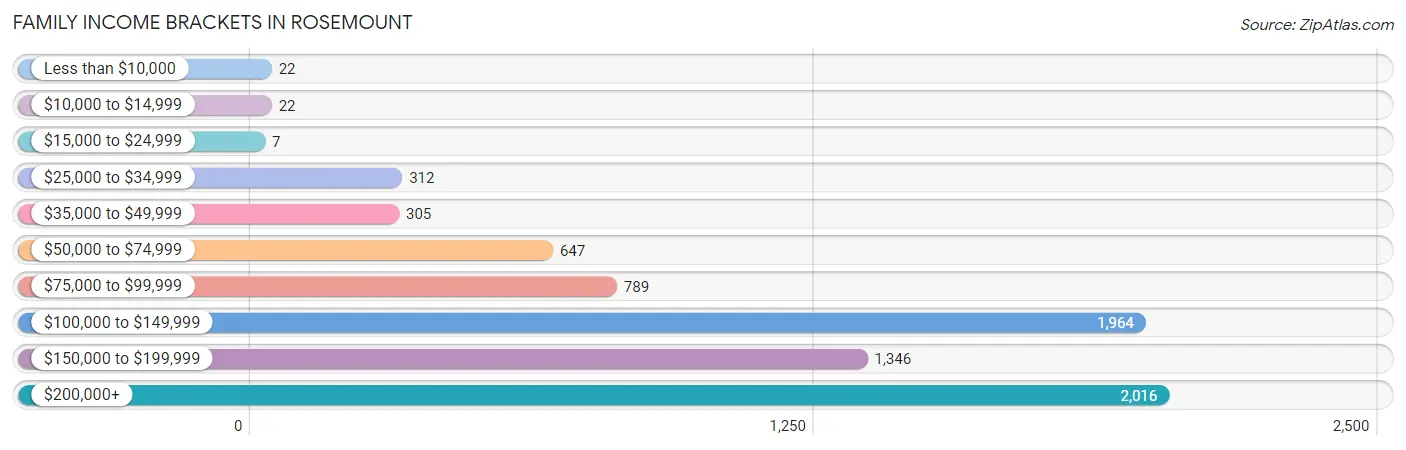
| Income Bracket | # Families | % Families |
| Less than $10,000 | 22 | 0.3% |
| $10,000 to $14,999 | 22 | 0.3% |
| $15,000 to $24,999 | 7 | 0.1% |
| $25,000 to $34,999 | 312 | 4.2% |
| $35,000 to $49,999 | 305 | 4.1% |
| $50,000 to $74,999 | 647 | 8.7% |
| $75,000 to $99,999 | 789 | 10.6% |
| $100,000 to $149,999 | 1,964 | 26.4% |
| $150,000 to $199,999 | 1,346 | 18.1% |
| $200,000+ | 2,016 | 27.1% |
Family Income by Famaliy Size in Rosemount
6-person families (149 | 2.0%) account for the highest median family income in Rosemount with $235,190 per family, while 2-person families (3,295 | 44.3%) have the highest median income of $54,487 per family member.

| Income Bracket | # Families | Median Income |
| 2-Person Families | 3,295 (44.3%) | $108,974 |
| 3-Person Families | 1,420 (19.1%) | $133,462 |
| 4-Person Families | 1,889 (25.4%) | $176,250 |
| 5-Person Families | 676 (9.1%) | $173,300 |
| 6-Person Families | 149 (2.0%) | $235,190 |
| 7+ Person Families | 10 (0.1%) | $0 |
| Total | 7,439 (100.0%) | $142,642 |
Family Income by Number of Earners in Rosemount
The median family income in Rosemount is $142,642, with families comprising 3+ earners (1,155) having the highest median family income of $202,466, while families with no earners (668) have the lowest median family income of $64,444, accounting for 15.5% and 9.0% of families, respectively.
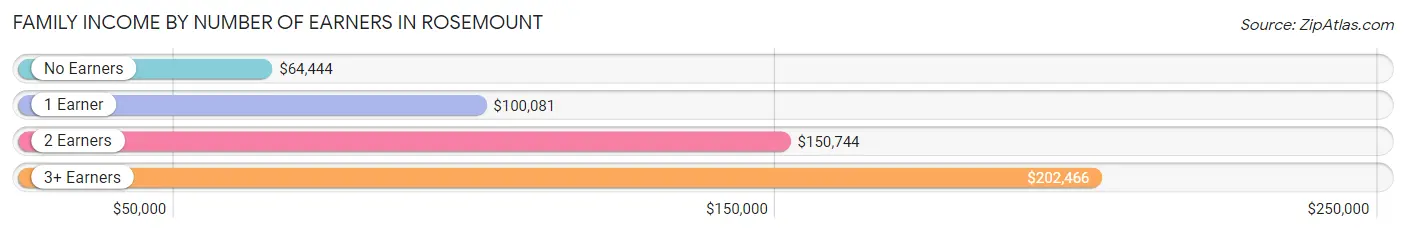
| Number of Earners | # Families | Median Income |
| No Earners | 668 (9.0%) | $64,444 |
| 1 Earner | 1,551 (20.8%) | $100,081 |
| 2 Earners | 4,065 (54.6%) | $150,744 |
| 3+ Earners | 1,155 (15.5%) | $202,466 |
| Total | 7,439 (100.0%) | $142,642 |
Household Income in Rosemount
Household Income Brackets in Rosemount
With 2,095 households falling in the category, the $200,000+ income range is the most frequent in Rosemount, accounting for 22.7% of all households. In contrast, only 92 households (1.0%) fall into the $10,000 to $14,999 income bracket, making it the least populous group.
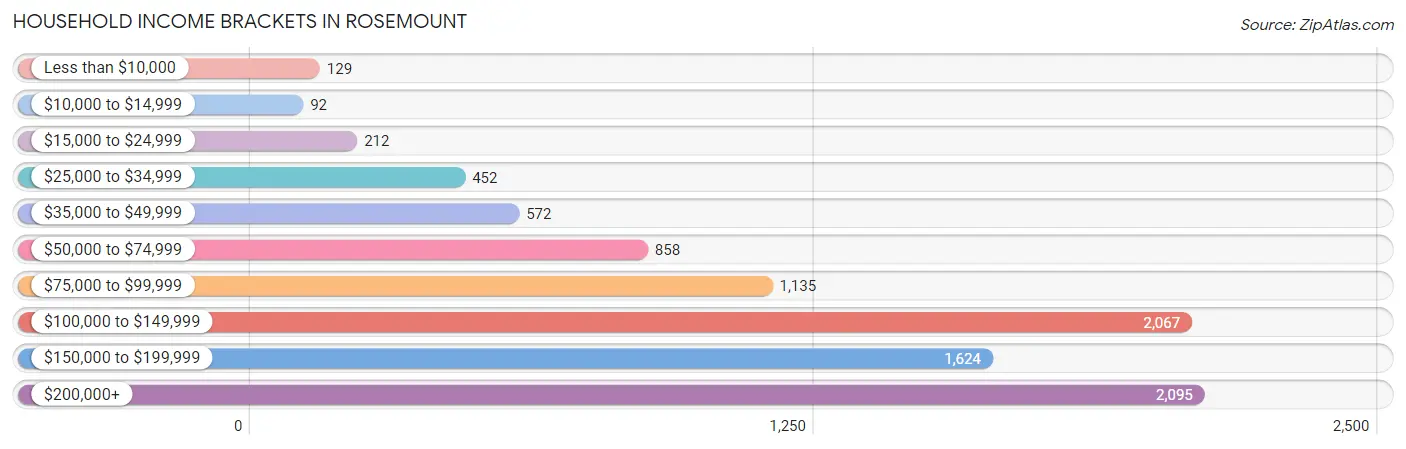
| Income Bracket | # Households | % Households |
| Less than $10,000 | 129 | 1.4% |
| $10,000 to $14,999 | 92 | 1.0% |
| $15,000 to $24,999 | 212 | 2.3% |
| $25,000 to $34,999 | 452 | 4.9% |
| $35,000 to $49,999 | 572 | 6.2% |
| $50,000 to $74,999 | 858 | 9.3% |
| $75,000 to $99,999 | 1,135 | 12.3% |
| $100,000 to $149,999 | 2,067 | 22.4% |
| $150,000 to $199,999 | 1,624 | 17.6% |
| $200,000+ | 2,095 | 22.7% |
Household Income by Householder Age in Rosemount
The median household income in Rosemount is $127,252, with the highest median household income of $166,575 found in the 45 to 64 years age bracket for the primary householder. A total of 3,920 households (42.5%) fall into this category. Meanwhile, the 65+ years age bracket for the primary householder has the lowest median household income of $65,962, with 2,086 households (22.6%) in this group.
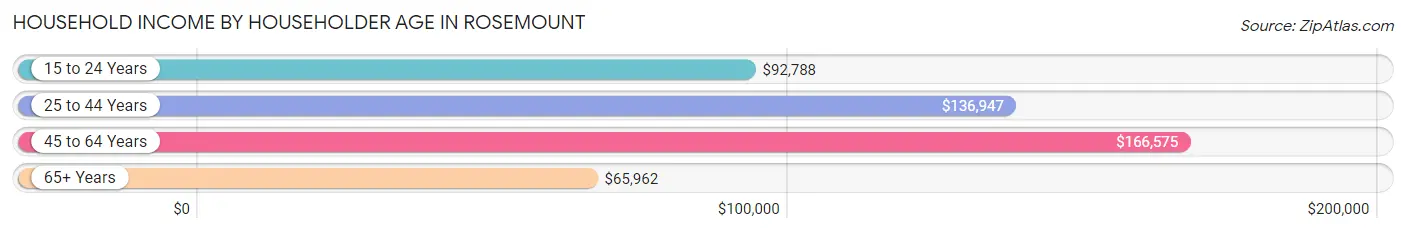
| Income Bracket | # Households | Median Income |
| 15 to 24 Years | 153 (1.7%) | $92,788 |
| 25 to 44 Years | 3,070 (33.3%) | $136,947 |
| 45 to 64 Years | 3,920 (42.5%) | $166,575 |
| 65+ Years | 2,086 (22.6%) | $65,962 |
| Total | 9,229 (100.0%) | $127,252 |
Poverty in Rosemount
Income Below Poverty by Sex and Age in Rosemount
With 1.6% poverty level for males and 2.3% for females among the residents of Rosemount, 55 to 64 year old males and 75 year old and over females are the most vulnerable to poverty, with 70 males (4.3%) and 47 females (7.0%) in their respective age groups living below the poverty level.
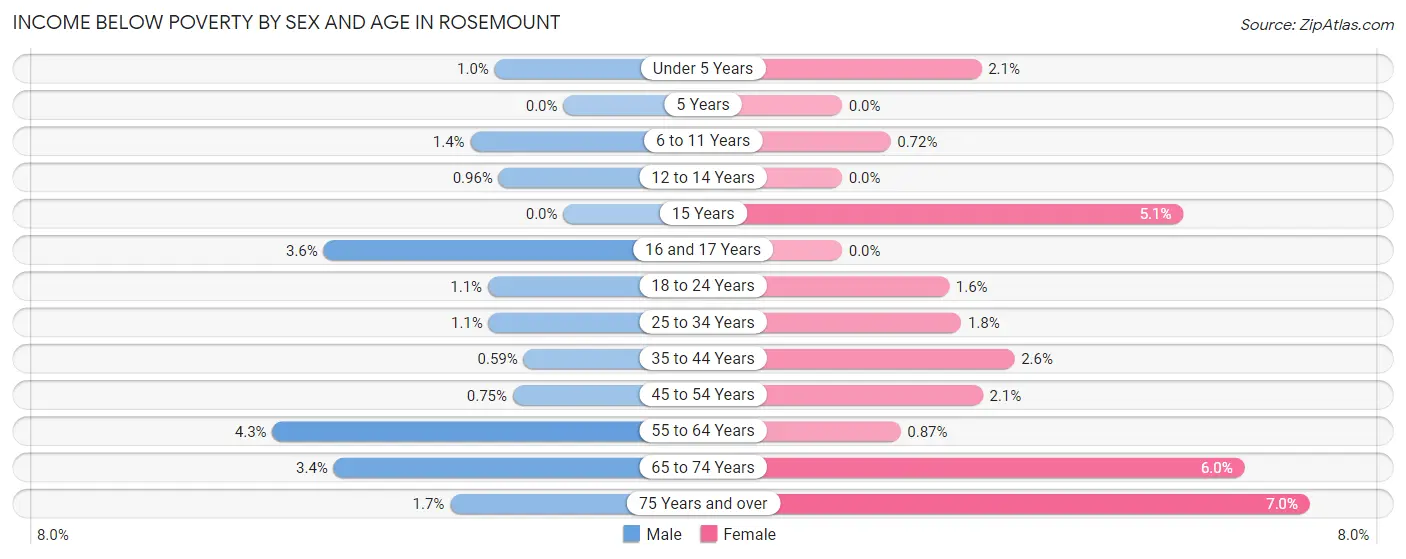
| Age Bracket | Male | Female |
| Under 5 Years | 10 (1.0%) | 14 (2.1%) |
| 5 Years | 0 (0.0%) | 0 (0.0%) |
| 6 to 11 Years | 17 (1.4%) | 9 (0.7%) |
| 12 to 14 Years | 6 (1.0%) | 0 (0.0%) |
| 15 Years | 0 (0.0%) | 7 (5.1%) |
| 16 and 17 Years | 16 (3.6%) | 0 (0.0%) |
| 18 to 24 Years | 13 (1.1%) | 15 (1.6%) |
| 25 to 34 Years | 17 (1.1%) | 25 (1.8%) |
| 35 to 44 Years | 10 (0.6%) | 48 (2.6%) |
| 45 to 54 Years | 15 (0.7%) | 43 (2.1%) |
| 55 to 64 Years | 70 (4.3%) | 13 (0.9%) |
| 65 to 74 Years | 31 (3.4%) | 69 (6.0%) |
| 75 Years and over | 9 (1.7%) | 47 (7.0%) |
| Total | 214 (1.6%) | 290 (2.3%) |
Income Above Poverty by Sex and Age in Rosemount
According to the poverty statistics in Rosemount, males aged 5 years and females aged 5 years are the age groups that are most secure financially, with 100.0% of males and 100.0% of females in these age groups living above the poverty line.
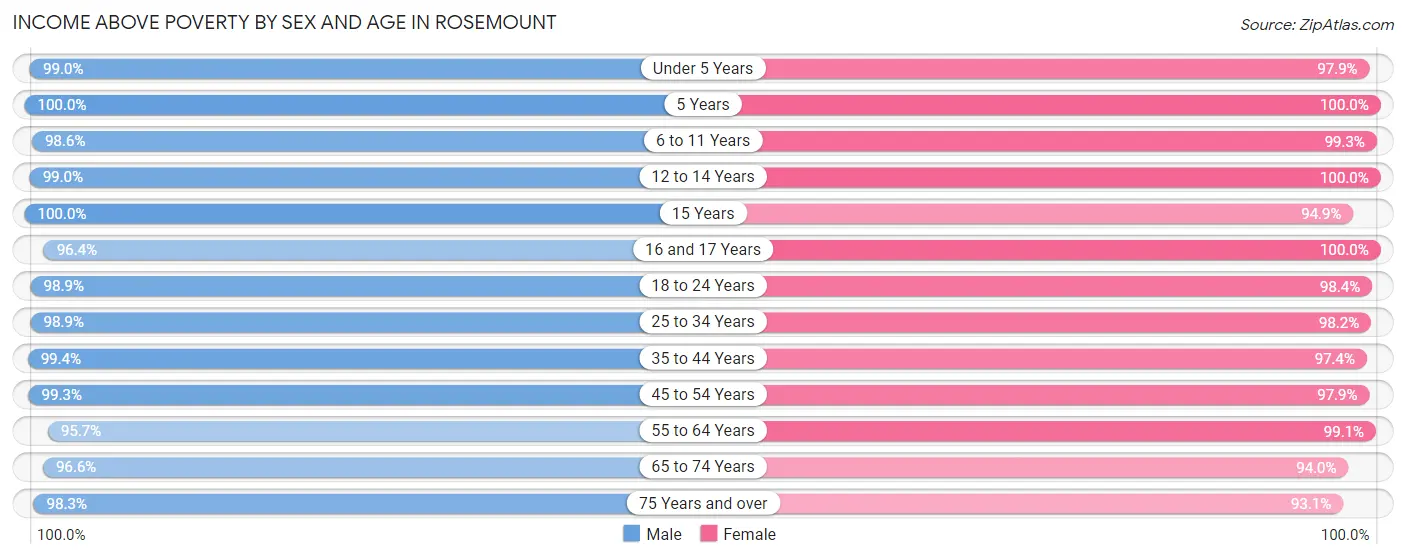
| Age Bracket | Male | Female |
| Under 5 Years | 970 (99.0%) | 662 (97.9%) |
| 5 Years | 160 (100.0%) | 167 (100.0%) |
| 6 to 11 Years | 1,217 (98.6%) | 1,248 (99.3%) |
| 12 to 14 Years | 621 (99.0%) | 498 (100.0%) |
| 15 Years | 244 (100.0%) | 131 (94.9%) |
| 16 and 17 Years | 434 (96.4%) | 456 (100.0%) |
| 18 to 24 Years | 1,143 (98.9%) | 928 (98.4%) |
| 25 to 34 Years | 1,515 (98.9%) | 1,388 (98.2%) |
| 35 to 44 Years | 1,680 (99.4%) | 1,827 (97.4%) |
| 45 to 54 Years | 1,992 (99.3%) | 2,017 (97.9%) |
| 55 to 64 Years | 1,551 (95.7%) | 1,481 (99.1%) |
| 65 to 74 Years | 877 (96.6%) | 1,085 (94.0%) |
| 75 Years and over | 527 (98.3%) | 629 (93.0%) |
| Total | 12,931 (98.4%) | 12,517 (97.7%) |
Income Below Poverty Among Married-Couple Families in Rosemount
The poverty statistics for married-couple families in Rosemount show that 0.5% or 31 of the total 6,242 families live below the poverty line. Families with no children have the highest poverty rate of 0.7%, comprising of 24 families. On the other hand, families with 3 or 4 children have the lowest poverty rate of 0.0%, which includes 0 families.
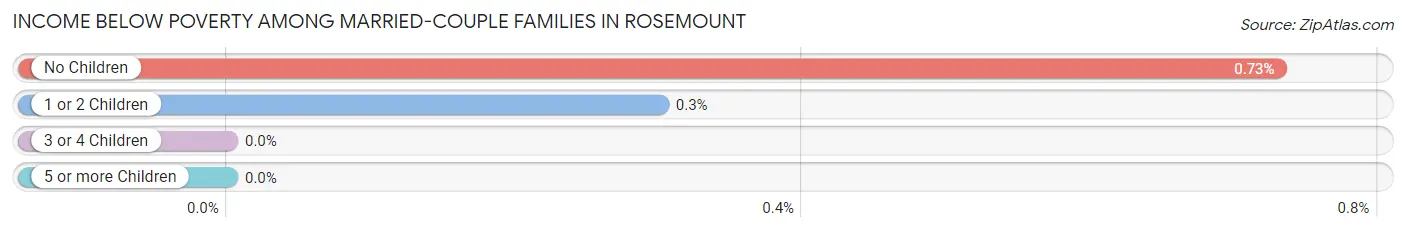
| Children | Above Poverty | Below Poverty |
| No Children | 3,264 (99.3%) | 24 (0.7%) |
| 1 or 2 Children | 2,302 (99.7%) | 7 (0.3%) |
| 3 or 4 Children | 637 (100.0%) | 0 (0.0%) |
| 5 or more Children | 8 (100.0%) | 0 (0.0%) |
| Total | 6,211 (99.5%) | 31 (0.5%) |
Income Below Poverty Among Single-Parent Households in Rosemount
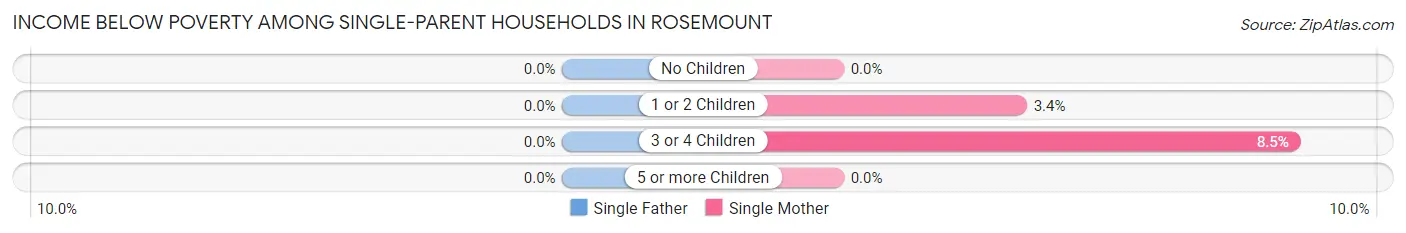
| Children | Single Father | Single Mother |
| No Children | 0 (0.0%) | 0 (0.0%) |
| 1 or 2 Children | 0 (0.0%) | 17 (3.4%) |
| 3 or 4 Children | 0 (0.0%) | 8 (8.5%) |
| 5 or more Children | 0 (0.0%) | 0 (0.0%) |
| Total | 0 (0.0%) | 25 (3.1%) |
Income Below Poverty Among Married-Couple vs Single-Parent Households in Rosemount
The poverty data for Rosemount shows that 31 of the married-couple family households (0.5%) and 25 of the single-parent households (2.1%) are living below the poverty level. Within the married-couple family households, those with no children have the highest poverty rate, with 24 households (0.7%) falling below the poverty line. Among the single-parent households, those with 3 or 4 children have the highest poverty rate, with 8 household (4.6%) living below poverty.
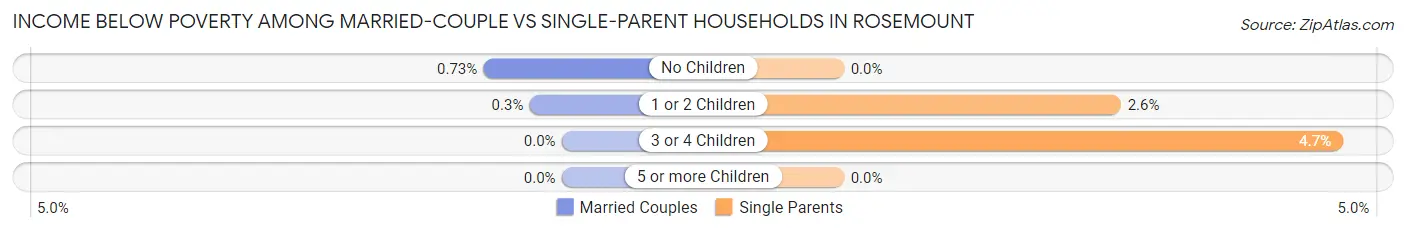
| Children | Married-Couple Families | Single-Parent Households |
| No Children | 24 (0.7%) | 0 (0.0%) |
| 1 or 2 Children | 7 (0.3%) | 17 (2.6%) |
| 3 or 4 Children | 0 (0.0%) | 8 (4.6%) |
| 5 or more Children | 0 (0.0%) | 0 (0.0%) |
| Total | 31 (0.5%) | 25 (2.1%) |
Race in Rosemount
The most populous races in Rosemount are White / Caucasian (22,188 | 85.4%), Two or more Races (1,466 | 5.6%), and Asian (1,124 | 4.3%).
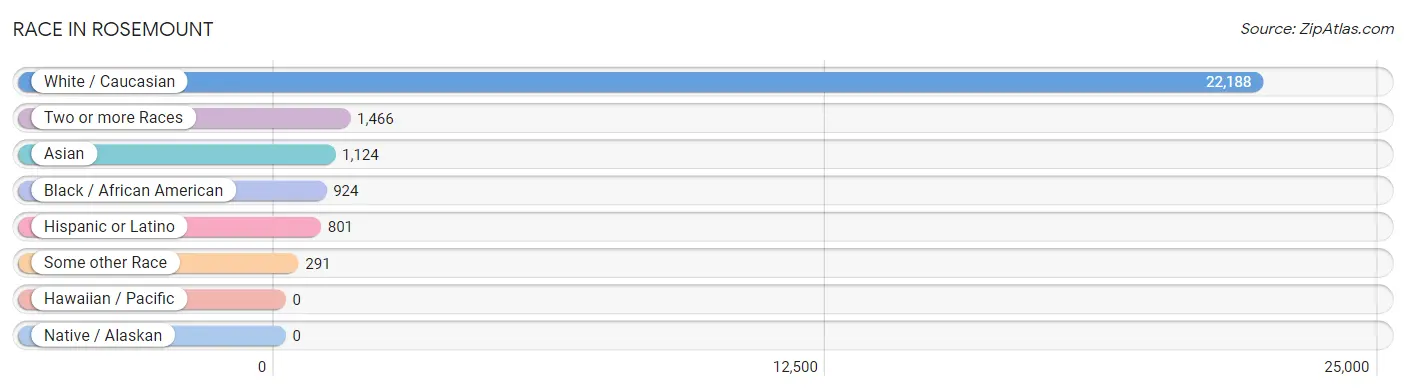
| Race | # Population | % Population |
| Asian | 1,124 | 4.3% |
| Black / African American | 924 | 3.5% |
| Hawaiian / Pacific | 0 | 0.0% |
| Hispanic or Latino | 801 | 3.1% |
| Native / Alaskan | 0 | 0.0% |
| White / Caucasian | 22,188 | 85.4% |
| Two or more Races | 1,466 | 5.6% |
| Some other Race | 291 | 1.1% |
| Total | 25,993 | 100.0% |
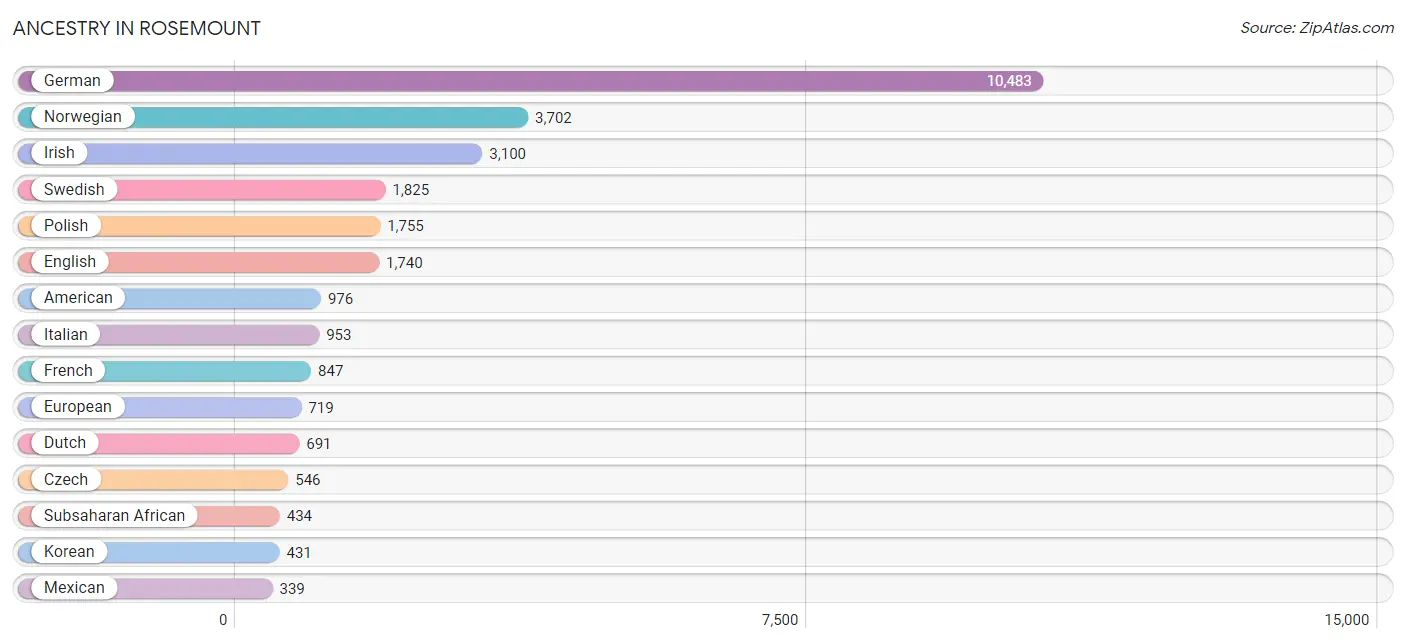
Ancestry in Rosemount
The most populous ancestries reported in Rosemount are German (10,483 | 40.3%), Norwegian (3,702 | 14.2%), Irish (3,100 | 11.9%), Swedish (1,825 | 7.0%), and Polish (1,755 | 6.8%), together accounting for 80.3% of all Rosemount residents.
| Ancestry | # Population | % Population |
| African | 44 | 0.2% |
| American | 976 | 3.7% |
| Arab | 137 | 0.5% |
| Armenian | 54 | 0.2% |
| Australian | 5 | 0.0% |
| Austrian | 21 | 0.1% |
| Bangladeshi | 49 | 0.2% |
| Belgian | 41 | 0.2% |
| Bhutanese | 36 | 0.1% |
| Blackfeet | 12 | 0.1% |
| Brazilian | 20 | 0.1% |
| British | 84 | 0.3% |
| Burmese | 328 | 1.3% |
| Canadian | 40 | 0.2% |
| Celtic | 29 | 0.1% |
| Central American | 191 | 0.7% |
| Cherokee | 77 | 0.3% |
| Chippewa | 63 | 0.2% |
| Choctaw | 12 | 0.1% |
| Colombian | 31 | 0.1% |
| Cree | 7 | 0.0% |
| Croatian | 74 | 0.3% |
| Cuban | 14 | 0.1% |
| Czech | 546 | 2.1% |
| Czechoslovakian | 70 | 0.3% |
| Danish | 286 | 1.1% |
| Dutch | 691 | 2.7% |
| Eastern European | 47 | 0.2% |
| English | 1,740 | 6.7% |
| European | 719 | 2.8% |
| Finnish | 217 | 0.8% |
| French | 847 | 3.3% |
| French Canadian | 157 | 0.6% |
| German | 10,483 | 40.3% |
| Greek | 59 | 0.2% |
| Guatemalan | 20 | 0.1% |
| Hungarian | 53 | 0.2% |
| Icelander | 13 | 0.1% |
| Indian (Asian) | 155 | 0.6% |
| Iranian | 11 | 0.0% |
| Irish | 3,100 | 11.9% |
| Italian | 953 | 3.7% |
| Jamaican | 23 | 0.1% |
| Japanese | 4 | 0.0% |
| Kenyan | 33 | 0.1% |
| Korean | 431 | 1.7% |
| Laotian | 10 | 0.0% |
| Lebanese | 119 | 0.5% |
| Lithuanian | 30 | 0.1% |
| Luxembourger | 20 | 0.1% |
| Malaysian | 22 | 0.1% |
| Mexican | 339 | 1.3% |
| Nigerian | 10 | 0.0% |
| Northern European | 77 | 0.3% |
| Norwegian | 3,702 | 14.2% |
| Palestinian | 18 | 0.1% |
| Polish | 1,755 | 6.8% |
| Portuguese | 69 | 0.3% |
| Puerto Rican | 108 | 0.4% |
| Romanian | 5 | 0.0% |
| Russian | 300 | 1.1% |
| Salvadoran | 171 | 0.7% |
| Scandinavian | 337 | 1.3% |
| Scotch-Irish | 77 | 0.3% |
| Scottish | 300 | 1.1% |
| Sioux | 12 | 0.1% |
| Slavic | 17 | 0.1% |
| Slovak | 32 | 0.1% |
| Slovene | 20 | 0.1% |
| Somali | 258 | 1.0% |
| South American | 31 | 0.1% |
| Spanish | 83 | 0.3% |
| Sri Lankan | 100 | 0.4% |
| Subsaharan African | 434 | 1.7% |
| Swedish | 1,825 | 7.0% |
| Swiss | 57 | 0.2% |
| Thai | 131 | 0.5% |
| Ukrainian | 77 | 0.3% |
| Welsh | 68 | 0.3% |
| Yugoslavian | 5 | 0.0% | View All 80 Rows |
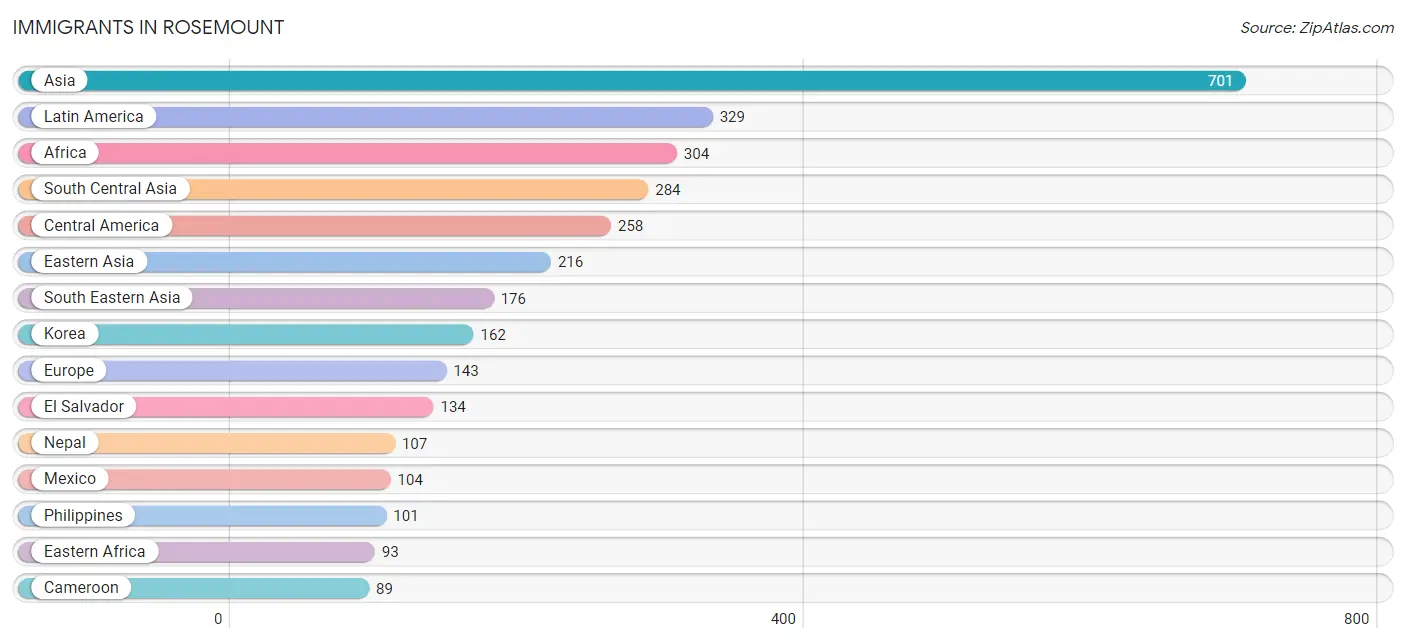
Immigrants in Rosemount
The most numerous immigrant groups reported in Rosemount came from Asia (701 | 2.7%), Latin America (329 | 1.3%), Africa (304 | 1.2%), South Central Asia (284 | 1.1%), and Central America (258 | 1.0%), together accounting for 7.2% of all Rosemount residents.
| Immigration Origin | # Population | % Population |
| Africa | 304 | 1.2% |
| Asia | 701 | 2.7% |
| Australia | 5 | 0.0% |
| Brazil | 20 | 0.1% |
| Cameroon | 89 | 0.3% |
| Canada | 34 | 0.1% |
| Caribbean | 24 | 0.1% |
| Central America | 258 | 1.0% |
| China | 54 | 0.2% |
| Colombia | 23 | 0.1% |
| Cuba | 14 | 0.1% |
| Eastern Africa | 93 | 0.4% |
| Eastern Asia | 216 | 0.8% |
| Eastern Europe | 74 | 0.3% |
| El Salvador | 134 | 0.5% |
| England | 11 | 0.0% |
| Europe | 143 | 0.5% |
| France | 13 | 0.1% |
| Germany | 16 | 0.1% |
| Guatemala | 20 | 0.1% |
| Guyana | 4 | 0.0% |
| India | 66 | 0.3% |
| Indonesia | 10 | 0.0% |
| Iran | 11 | 0.0% |
| Italy | 29 | 0.1% |
| Jamaica | 10 | 0.0% |
| Kazakhstan | 18 | 0.1% |
| Kenya | 26 | 0.1% |
| Korea | 162 | 0.6% |
| Kuwait | 18 | 0.1% |
| Laos | 22 | 0.1% |
| Latin America | 329 | 1.3% |
| Mexico | 104 | 0.4% |
| Middle Africa | 89 | 0.3% |
| Nepal | 107 | 0.4% |
| Nigeria | 10 | 0.0% |
| Northern Europe | 11 | 0.0% |
| Oceania | 5 | 0.0% |
| Pakistan | 54 | 0.2% |
| Philippines | 101 | 0.4% |
| Poland | 17 | 0.1% |
| Russia | 57 | 0.2% |
| Somalia | 59 | 0.2% |
| South Africa | 44 | 0.2% |
| South America | 47 | 0.2% |
| South Central Asia | 284 | 1.1% |
| South Eastern Asia | 176 | 0.7% |
| Southern Europe | 29 | 0.1% |
| Sri Lanka | 28 | 0.1% |
| Syria | 7 | 0.0% |
| Vietnam | 43 | 0.2% |
| Western Africa | 10 | 0.0% |
| Western Asia | 25 | 0.1% |
| Western Europe | 29 | 0.1% | View All 54 Rows |
Sex and Age in Rosemount
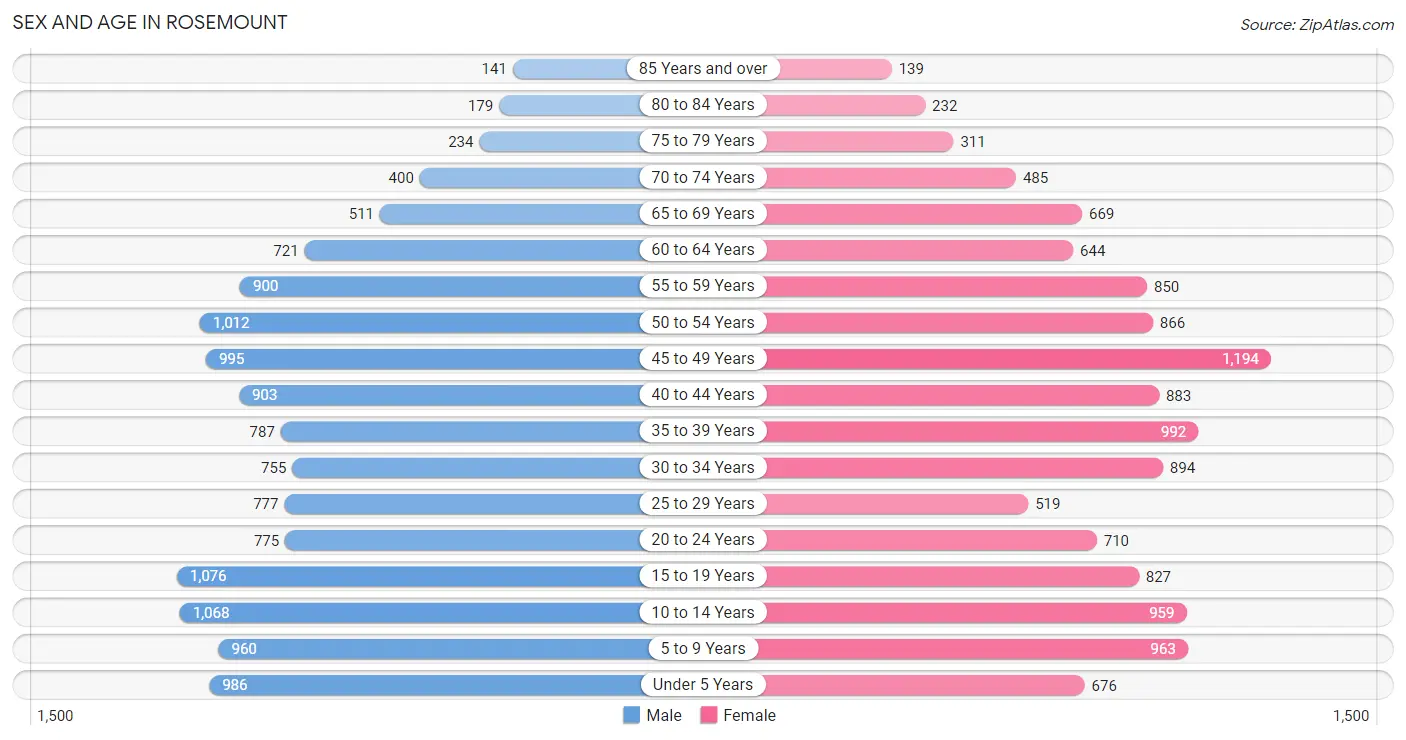
Sex and Age in Rosemount
The most populous age groups in Rosemount are 15 to 19 Years (1,076 | 8.2%) for men and 45 to 49 Years (1,194 | 9.3%) for women.
| Age Bracket | Male | Female |
| Under 5 Years | 986 (7.5%) | 676 (5.3%) |
| 5 to 9 Years | 960 (7.3%) | 963 (7.5%) |
| 10 to 14 Years | 1,068 (8.1%) | 959 (7.5%) |
| 15 to 19 Years | 1,076 (8.2%) | 827 (6.5%) |
| 20 to 24 Years | 775 (5.9%) | 710 (5.5%) |
| 25 to 29 Years | 777 (5.9%) | 519 (4.1%) |
| 30 to 34 Years | 755 (5.7%) | 894 (7.0%) |
| 35 to 39 Years | 787 (6.0%) | 992 (7.7%) |
| 40 to 44 Years | 903 (6.9%) | 883 (6.9%) |
| 45 to 49 Years | 995 (7.5%) | 1,194 (9.3%) |
| 50 to 54 Years | 1,012 (7.7%) | 866 (6.8%) |
| 55 to 59 Years | 900 (6.8%) | 850 (6.6%) |
| 60 to 64 Years | 721 (5.5%) | 644 (5.0%) |
| 65 to 69 Years | 511 (3.9%) | 669 (5.2%) |
| 70 to 74 Years | 400 (3.0%) | 485 (3.8%) |
| 75 to 79 Years | 234 (1.8%) | 311 (2.4%) |
| 80 to 84 Years | 179 (1.4%) | 232 (1.8%) |
| 85 Years and over | 141 (1.1%) | 139 (1.1%) |
| Total | 13,180 (100.0%) | 12,813 (100.0%) |
Families and Households in Rosemount
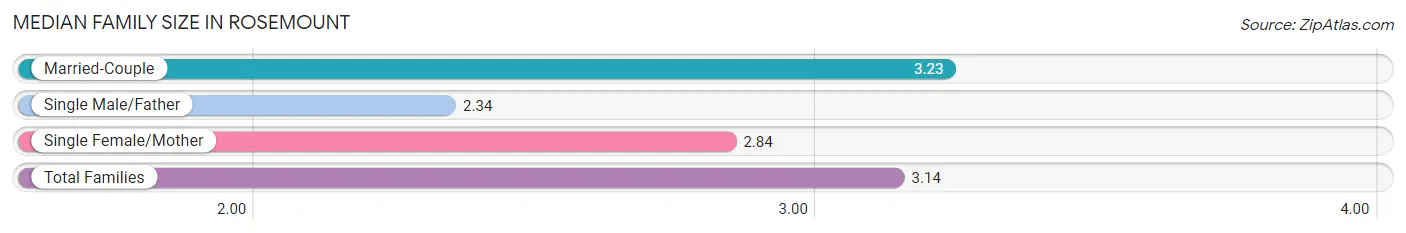
Median Family Size in Rosemount
The median family size in Rosemount is 3.14 persons per family, with married-couple families (6,242 | 83.9%) accounting for the largest median family size of 3.23 persons per family. On the other hand, single male/father families (391 | 5.3%) represent the smallest median family size with 2.34 persons per family.
| Family Type | # Families | Family Size |
| Married-Couple | 6,242 (83.9%) | 3.23 |
| Single Male/Father | 391 (5.3%) | 2.34 |
| Single Female/Mother | 806 (10.8%) | 2.84 |
| Total Families | 7,439 (100.0%) | 3.14 |
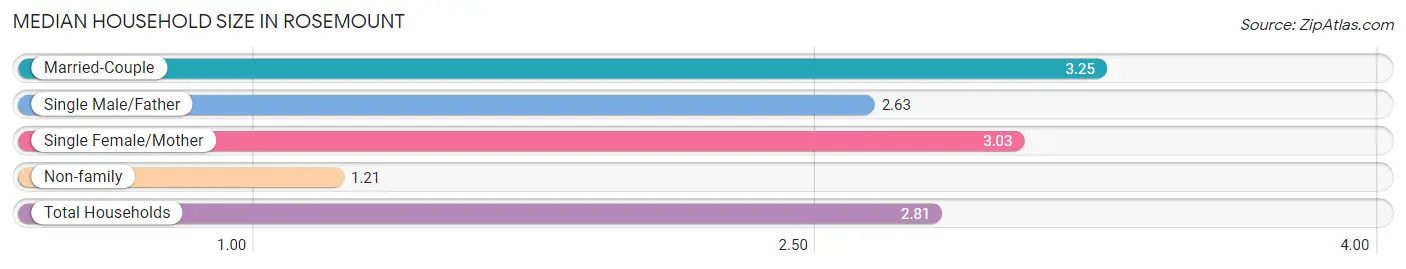
Median Household Size in Rosemount
The median household size in Rosemount is 2.81 persons per household, with married-couple households (6,242 | 67.6%) accounting for the largest median household size of 3.25 persons per household. non-family households (1,790 | 19.4%) represent the smallest median household size with 1.21 persons per household.
| Household Type | # Households | Household Size |
| Married-Couple | 6,242 (67.6%) | 3.25 |
| Single Male/Father | 391 (4.2%) | 2.63 |
| Single Female/Mother | 806 (8.7%) | 3.03 |
| Non-family | 1,790 (19.4%) | 1.21 |
| Total Households | 9,229 (100.0%) | 2.81 |
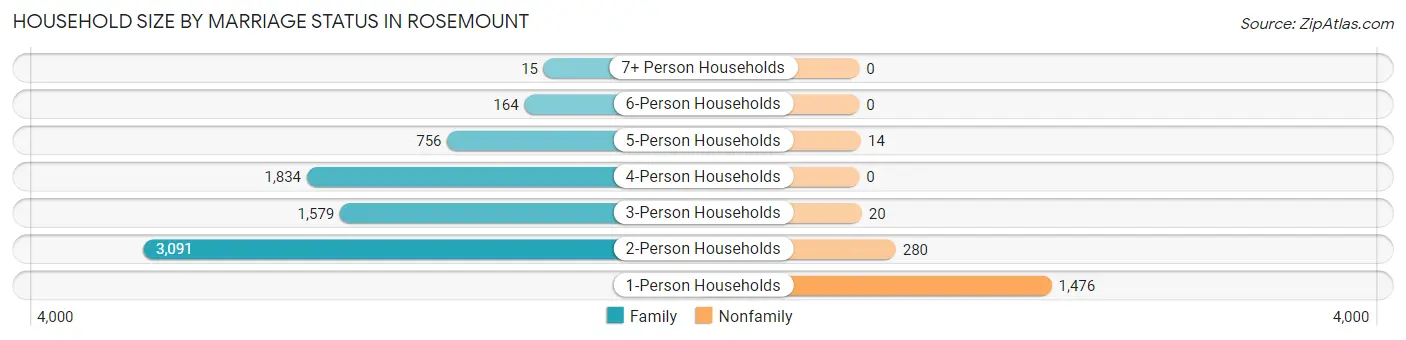
Household Size by Marriage Status in Rosemount
Out of a total of 9,229 households in Rosemount, 7,439 (80.6%) are family households, while 1,790 (19.4%) are nonfamily households. The most numerous type of family households are 2-person households, comprising 3,091, and the most common type of nonfamily households are 1-person households, comprising 1,476.
| Household Size | Family Households | Nonfamily Households |
| 1-Person Households | - | 1,476 (16.0%) |
| 2-Person Households | 3,091 (33.5%) | 280 (3.0%) |
| 3-Person Households | 1,579 (17.1%) | 20 (0.2%) |
| 4-Person Households | 1,834 (19.9%) | 0 (0.0%) |
| 5-Person Households | 756 (8.2%) | 14 (0.2%) |
| 6-Person Households | 164 (1.8%) | 0 (0.0%) |
| 7+ Person Households | 15 (0.2%) | 0 (0.0%) |
| Total | 7,439 (80.6%) | 1,790 (19.4%) |
Female Fertility in Rosemount
Fertility by Age in Rosemount
Average fertility rate in Rosemount is 60.0 births per 1,000 women. Women in the age bracket of 20 to 34 years have the highest fertility rate with 116.0 births per 1,000 women. Women in the age bracket of 20 to 34 years acount for 65.9% of all women with births.
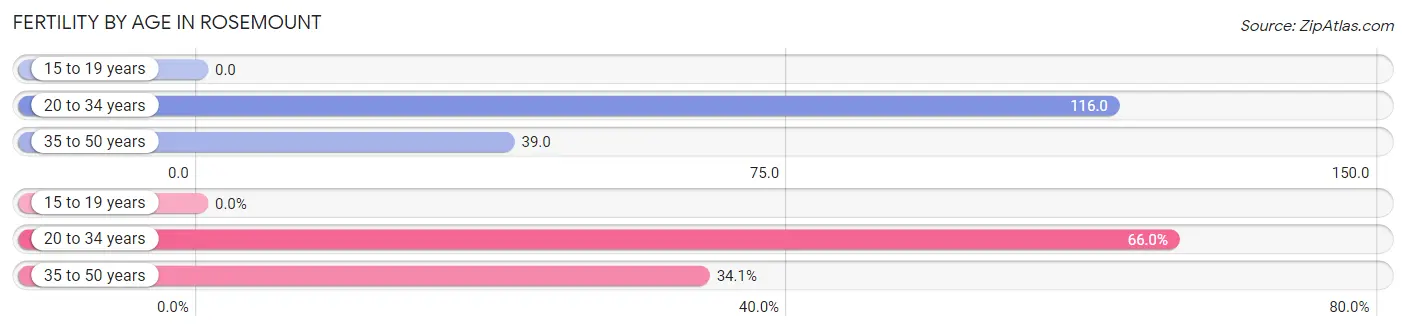
| Age Bracket | Women with Births | Births / 1,000 Women |
| 15 to 19 years | 0 (0.0%) | 0.0 |
| 20 to 34 years | 246 (65.9%) | 116.0 |
| 35 to 50 years | 127 (34.1%) | 39.0 |
| Total | 373 (100.0%) | 60.0 |
Fertility by Age by Marriage Status in Rosemount
85.0% of women with births (373) in Rosemount are married. The highest percentage of unmarried women with births falls into 20 to 34 years age bracket with 19.1% of them unmarried at the time of birth, while the lowest percentage of unmarried women with births belong to 35 to 50 years age bracket with 7.1% of them unmarried.
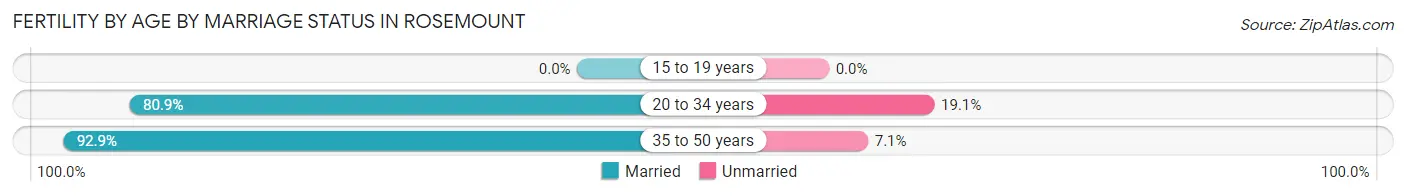
| Age Bracket | Married | Unmarried |
| 15 to 19 years | 0 (0.0%) | 0 (0.0%) |
| 20 to 34 years | 199 (80.9%) | 47 (19.1%) |
| 35 to 50 years | 118 (92.9%) | 9 (7.1%) |
| Total | 317 (85.0%) | 56 (15.0%) |
Fertility by Education in Rosemount
Average fertility rate in Rosemount is 60.0 births per 1,000 women. Women with the education attainment of bachelor's degree have the highest fertility rate of 95.0 births per 1,000 women, while women with the education attainment of less than high school have the lowest fertility at 28.0 births per 1,000 women. Women with the education attainment of bachelor's degree represent 51.2% of all women with births.
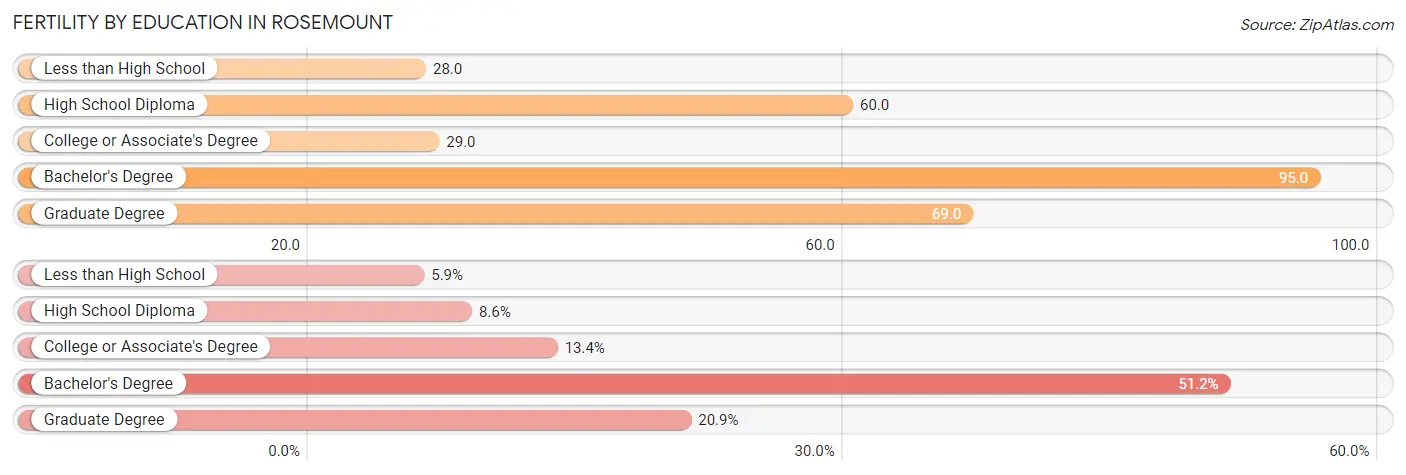
| Educational Attainment | Women with Births | Births / 1,000 Women |
| Less than High School | 22 (5.9%) | 28.0 |
| High School Diploma | 32 (8.6%) | 60.0 |
| College or Associate's Degree | 50 (13.4%) | 29.0 |
| Bachelor's Degree | 191 (51.2%) | 95.0 |
| Graduate Degree | 78 (20.9%) | 69.0 |
| Total | 373 (100.0%) | 60.0 |
Fertility by Education by Marriage Status in Rosemount
15.0% of women with births in Rosemount are unmarried. Women with the educational attainment of less than high school are most likely to be married with 100.0% of them married at childbirth, while women with the educational attainment of high school diploma are least likely to be married with 87.5% of them unmarried at childbirth.
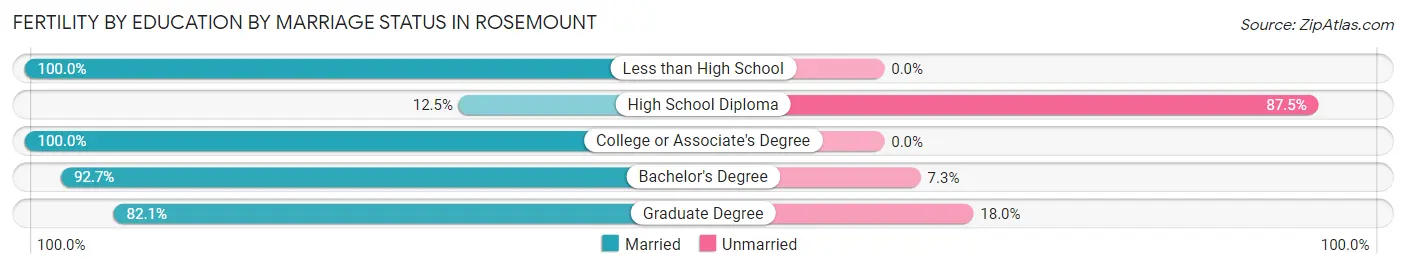
| Educational Attainment | Married | Unmarried |
| Less than High School | 22 (100.0%) | 0 (0.0%) |
| High School Diploma | 4 (12.5%) | 28 (87.5%) |
| College or Associate's Degree | 50 (100.0%) | 0 (0.0%) |
| Bachelor's Degree | 177 (92.7%) | 14 (7.3%) |
| Graduate Degree | 64 (82.1%) | 14 (17.9%) |
| Total | 317 (85.0%) | 56 (15.0%) |
Employment Characteristics in Rosemount
Employment by Class of Employer in Rosemount
Among the 14,253 employed individuals in Rosemount, private company employees (9,913 | 69.6%), local government employees (1,337 | 9.4%), and not-for-profit organizations (1,278 | 9.0%) make up the most common classes of employment.
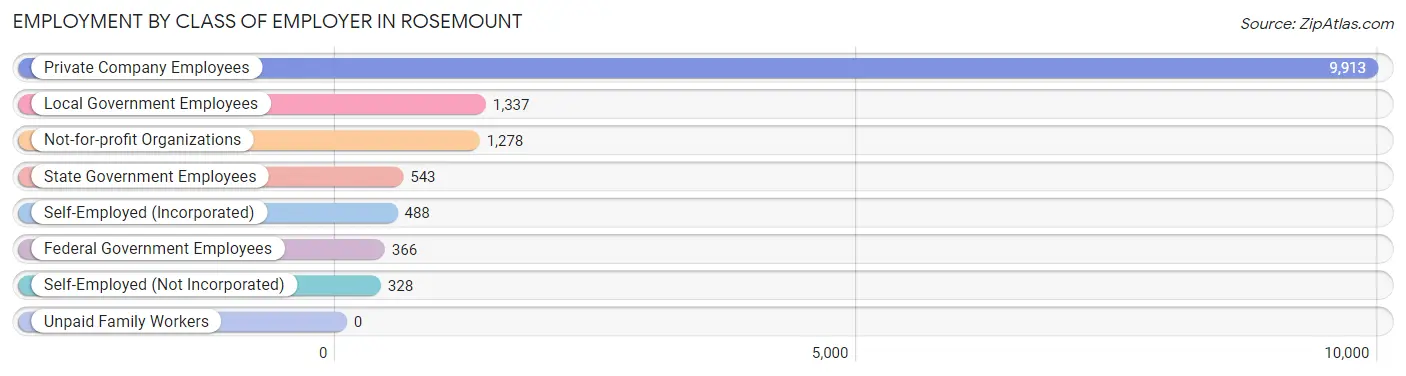
| Employer Class | # Employees | % Employees |
| Private Company Employees | 9,913 | 69.6% |
| Self-Employed (Incorporated) | 488 | 3.4% |
| Self-Employed (Not Incorporated) | 328 | 2.3% |
| Not-for-profit Organizations | 1,278 | 9.0% |
| Local Government Employees | 1,337 | 9.4% |
| State Government Employees | 543 | 3.8% |
| Federal Government Employees | 366 | 2.6% |
| Unpaid Family Workers | 0 | 0.0% |
| Total | 14,253 | 100.0% |
Employment Status by Age in Rosemount
According to the labor force statistics for Rosemount, out of the total population over 16 years of age (19,999), 74.6% or 14,919 individuals are in the labor force, with 3.1% or 462 of them unemployed. The age group with the highest labor force participation rate is 45 to 54 years, with 94.0% or 3,823 individuals in the labor force. Within the labor force, the 60 to 64 years age range has the highest percentage of unemployed individuals, with 7.7% or 81 of them being unemployed.
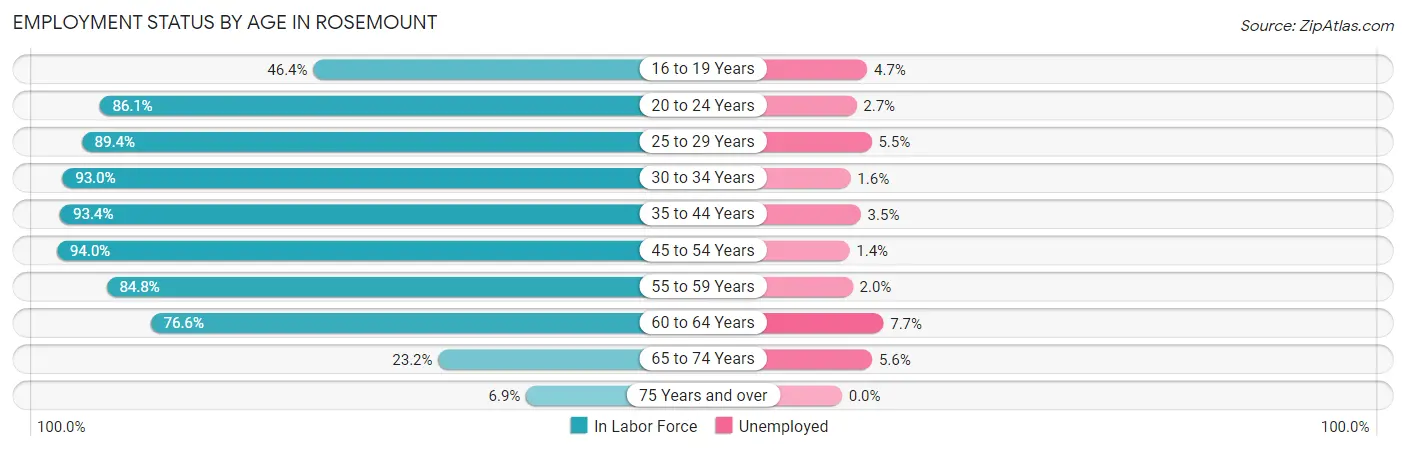
| Age Bracket | In Labor Force | Unemployed |
| 16 to 19 Years | 706 (46.4%) | 33 (4.7%) |
| 20 to 24 Years | 1,279 (86.1%) | 35 (2.7%) |
| 25 to 29 Years | 1,159 (89.4%) | 64 (5.5%) |
| 30 to 34 Years | 1,534 (93.0%) | 25 (1.6%) |
| 35 to 44 Years | 3,330 (93.4%) | 117 (3.5%) |
| 45 to 54 Years | 3,823 (94.0%) | 54 (1.4%) |
| 55 to 59 Years | 1,484 (84.8%) | 30 (2.0%) |
| 60 to 64 Years | 1,046 (76.6%) | 81 (7.7%) |
| 65 to 74 Years | 479 (23.2%) | 27 (5.6%) |
| 75 Years and over | 85 (6.9%) | 0 (0.0%) |
| Total | 14,919 (74.6%) | 462 (3.1%) |
Employment Status by Educational Attainment in Rosemount
According to labor force statistics for Rosemount, 90.4% of individuals (12,378) out of the total population between 25 and 64 years of age (13,692) are in the labor force, with 3.0% or 371 of them being unemployed. The group with the highest labor force participation rate are those with the educational attainment of bachelor's degree or higher, with 93.1% or 6,899 individuals in the labor force. Within the labor force, individuals with high school diploma education have the highest percentage of unemployment, with 5.2% or 77 of them being unemployed.
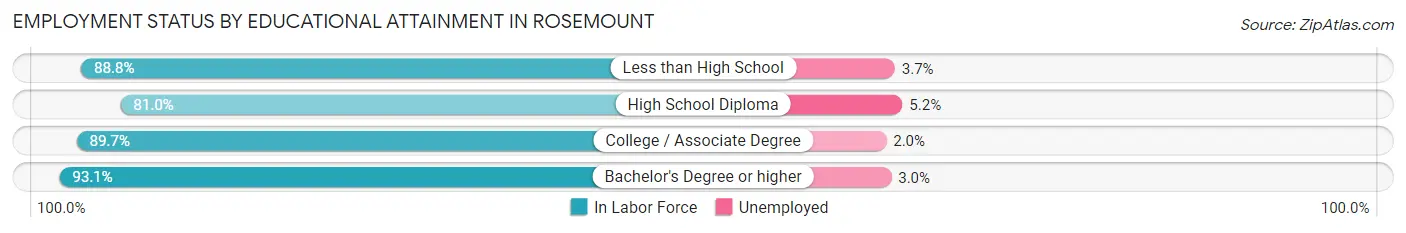
| Educational Attainment | In Labor Force | Unemployed |
| Less than High School | 190 (88.8%) | 8 (3.7%) |
| High School Diploma | 1,487 (81.0%) | 95 (5.2%) |
| College / Associate Degree | 3,796 (89.7%) | 85 (2.0%) |
| Bachelor's Degree or higher | 6,899 (93.1%) | 222 (3.0%) |
| Total | 12,378 (90.4%) | 411 (3.0%) |
Employment Occupations by Sex in Rosemount
Management, Business, Science and Arts Occupations
The most common Management, Business, Science and Arts occupations in Rosemount are Management (1,916 | 13.3%), Community & Social Service (1,651 | 11.4%), Business & Financial (1,345 | 9.3%), Computers, Engineering & Science (1,247 | 8.6%), and Education Instruction & Library (1,074 | 7.4%).
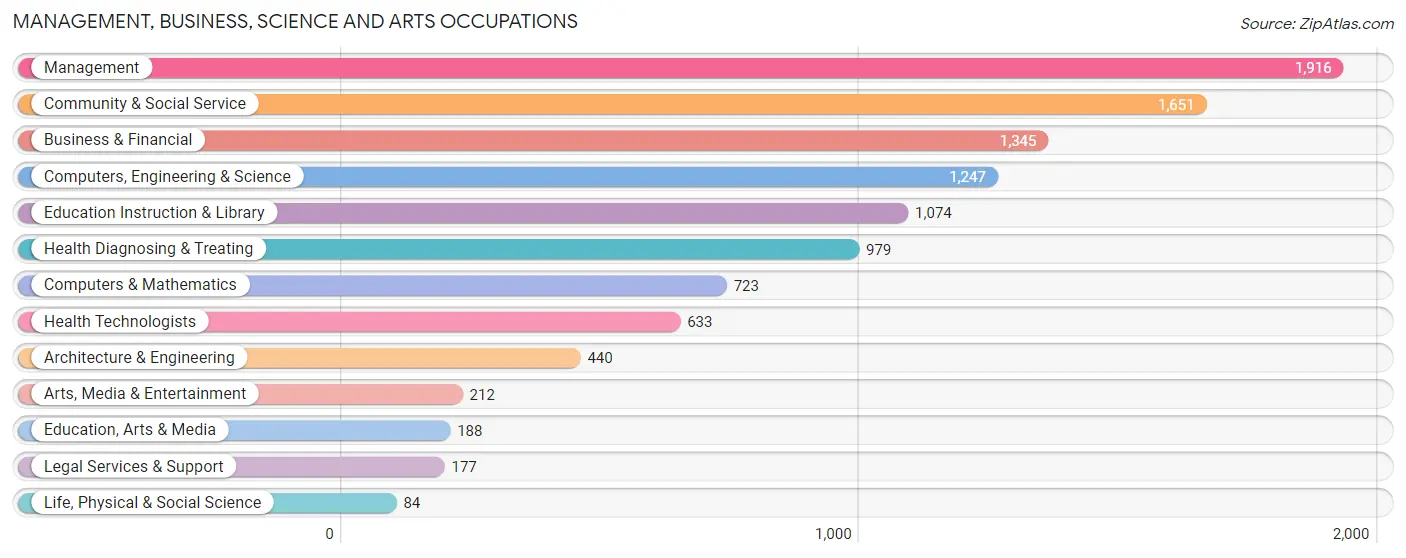
Management, Business, Science and Arts Occupations by Sex
Within the Management, Business, Science and Arts occupations in Rosemount, the most male-oriented occupations are Architecture & Engineering (84.8%), Computers, Engineering & Science (70.8%), and Management (65.2%), while the most female-oriented occupations are Health Technologists (92.7%), Health Diagnosing & Treating (91.2%), and Legal Services & Support (67.8%).
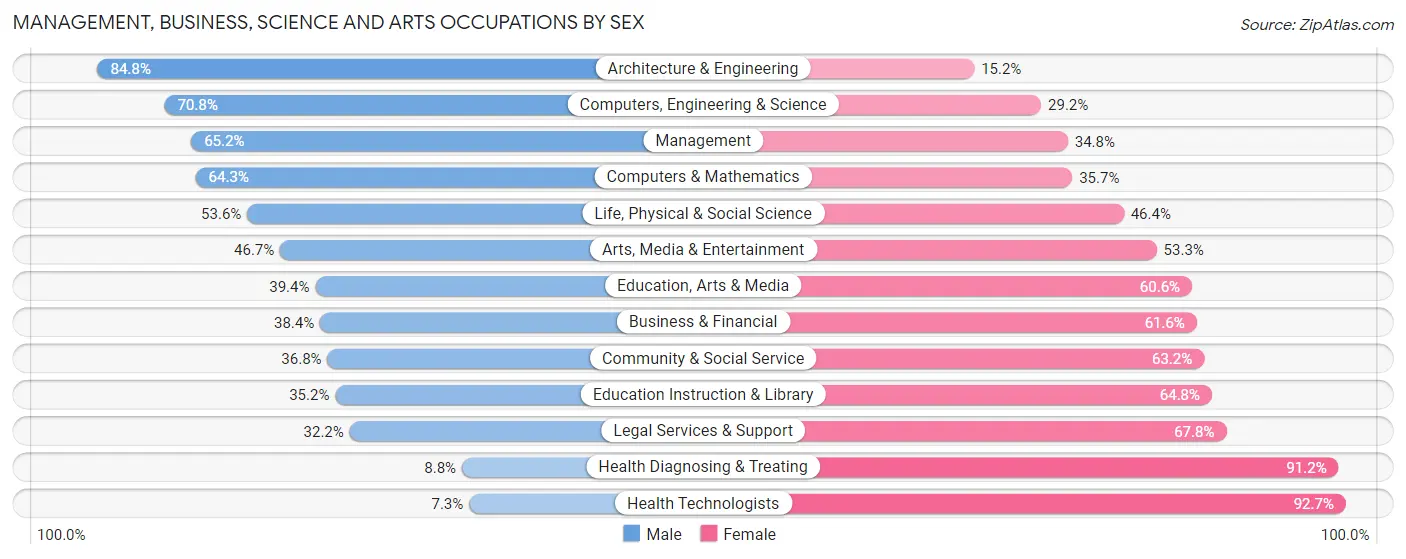
| Occupation | Male | Female |
| Management | 1,250 (65.2%) | 666 (34.8%) |
| Business & Financial | 516 (38.4%) | 829 (61.6%) |
| Computers, Engineering & Science | 883 (70.8%) | 364 (29.2%) |
| Computers & Mathematics | 465 (64.3%) | 258 (35.7%) |
| Architecture & Engineering | 373 (84.8%) | 67 (15.2%) |
| Life, Physical & Social Science | 45 (53.6%) | 39 (46.4%) |
| Community & Social Service | 608 (36.8%) | 1,043 (63.2%) |
| Education, Arts & Media | 74 (39.4%) | 114 (60.6%) |
| Legal Services & Support | 57 (32.2%) | 120 (67.8%) |
| Education Instruction & Library | 378 (35.2%) | 696 (64.8%) |
| Arts, Media & Entertainment | 99 (46.7%) | 113 (53.3%) |
| Health Diagnosing & Treating | 86 (8.8%) | 893 (91.2%) |
| Health Technologists | 46 (7.3%) | 587 (92.7%) |
| Total (Category) | 3,343 (46.8%) | 3,795 (53.2%) |
| Total (Overall) | 7,688 (53.2%) | 6,755 (46.8%) |
Services Occupations
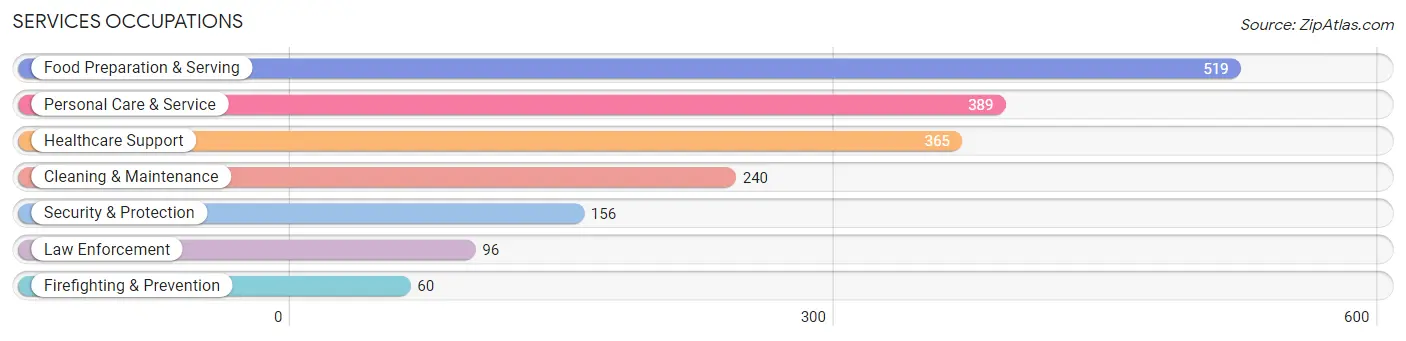
The most common Services occupations in Rosemount are Food Preparation & Serving (519 | 3.6%), Personal Care & Service (389 | 2.7%), Healthcare Support (365 | 2.5%), Cleaning & Maintenance (240 | 1.7%), and Security & Protection (156 | 1.1%).
Services Occupations by Sex
Within the Services occupations in Rosemount, the most male-oriented occupations are Cleaning & Maintenance (82.5%), Law Enforcement (82.3%), and Security & Protection (80.8%), while the most female-oriented occupations are Healthcare Support (94.8%), Personal Care & Service (70.4%), and Food Preparation & Serving (52.8%).
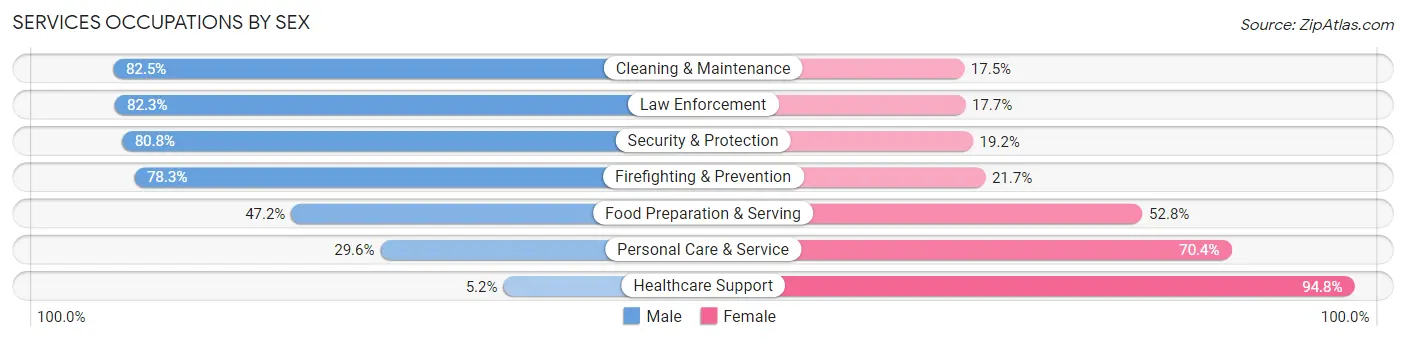
| Occupation | Male | Female |
| Healthcare Support | 19 (5.2%) | 346 (94.8%) |
| Security & Protection | 126 (80.8%) | 30 (19.2%) |
| Firefighting & Prevention | 47 (78.3%) | 13 (21.7%) |
| Law Enforcement | 79 (82.3%) | 17 (17.7%) |
| Food Preparation & Serving | 245 (47.2%) | 274 (52.8%) |
| Cleaning & Maintenance | 198 (82.5%) | 42 (17.5%) |
| Personal Care & Service | 115 (29.6%) | 274 (70.4%) |
| Total (Category) | 703 (42.1%) | 966 (57.9%) |
| Total (Overall) | 7,688 (53.2%) | 6,755 (46.8%) |
Sales and Office Occupations
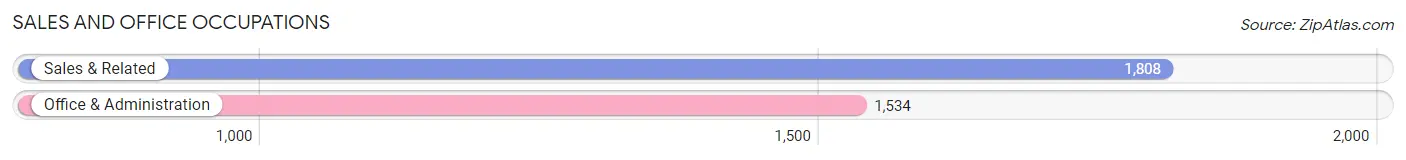
The most common Sales and Office occupations in Rosemount are Sales & Related (1,808 | 12.5%), and Office & Administration (1,534 | 10.6%).
Sales and Office Occupations by Sex
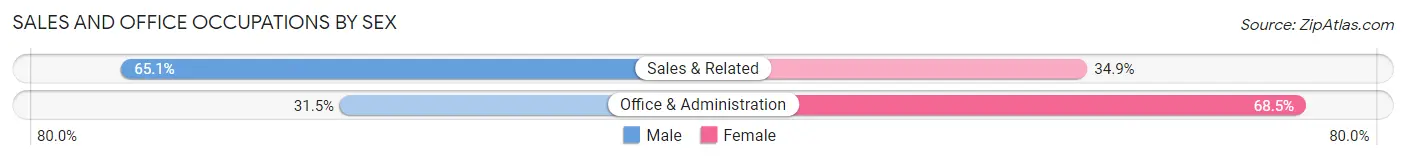
| Occupation | Male | Female |
| Sales & Related | 1,177 (65.1%) | 631 (34.9%) |
| Office & Administration | 483 (31.5%) | 1,051 (68.5%) |
| Total (Category) | 1,660 (49.7%) | 1,682 (50.3%) |
| Total (Overall) | 7,688 (53.2%) | 6,755 (46.8%) |
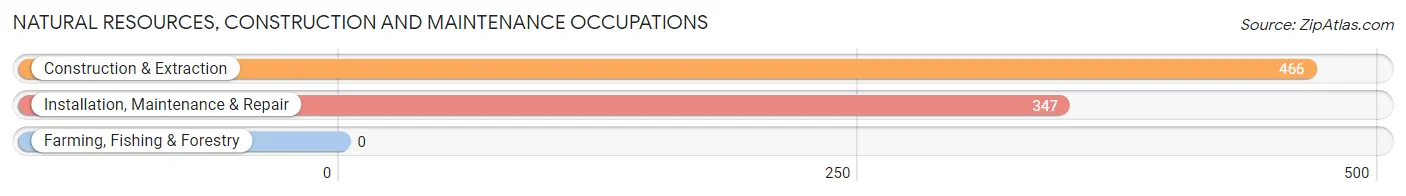
Natural Resources, Construction and Maintenance Occupations
The most common Natural Resources, Construction and Maintenance occupations in Rosemount are Construction & Extraction (466 | 3.2%), and Installation, Maintenance & Repair (347 | 2.4%).
Natural Resources, Construction and Maintenance Occupations by Sex
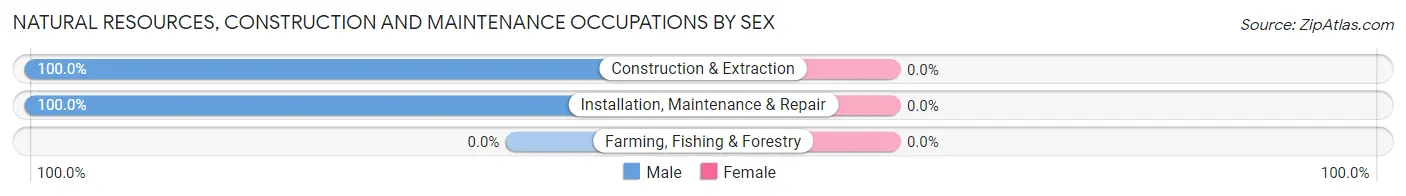
| Occupation | Male | Female |
| Farming, Fishing & Forestry | 0 (0.0%) | 0 (0.0%) |
| Construction & Extraction | 466 (100.0%) | 0 (0.0%) |
| Installation, Maintenance & Repair | 347 (100.0%) | 0 (0.0%) |
| Total (Category) | 813 (100.0%) | 0 (0.0%) |
| Total (Overall) | 7,688 (53.2%) | 6,755 (46.8%) |
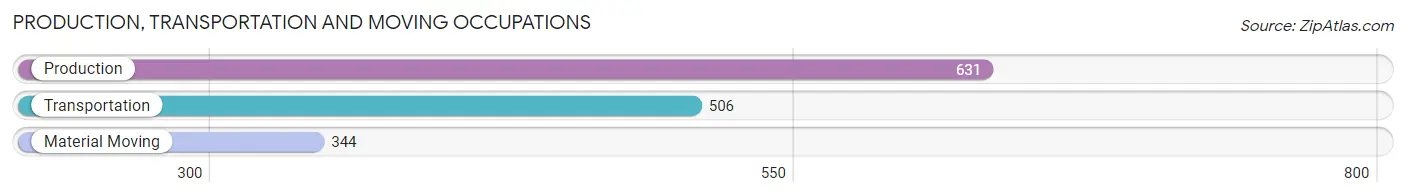
Production, Transportation and Moving Occupations
The most common Production, Transportation and Moving occupations in Rosemount are Production (631 | 4.4%), Transportation (506 | 3.5%), and Material Moving (344 | 2.4%).
Production, Transportation and Moving Occupations by Sex
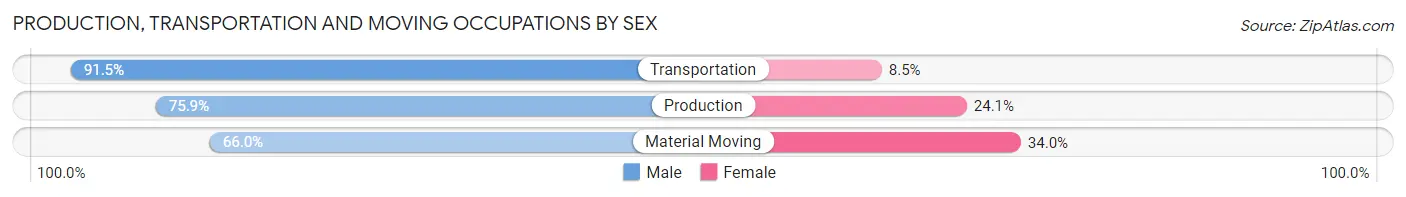
| Occupation | Male | Female |
| Production | 479 (75.9%) | 152 (24.1%) |
| Transportation | 463 (91.5%) | 43 (8.5%) |
| Material Moving | 227 (66.0%) | 117 (34.0%) |
| Total (Category) | 1,169 (78.9%) | 312 (21.1%) |
| Total (Overall) | 7,688 (53.2%) | 6,755 (46.8%) |
Employment Industries by Sex in Rosemount
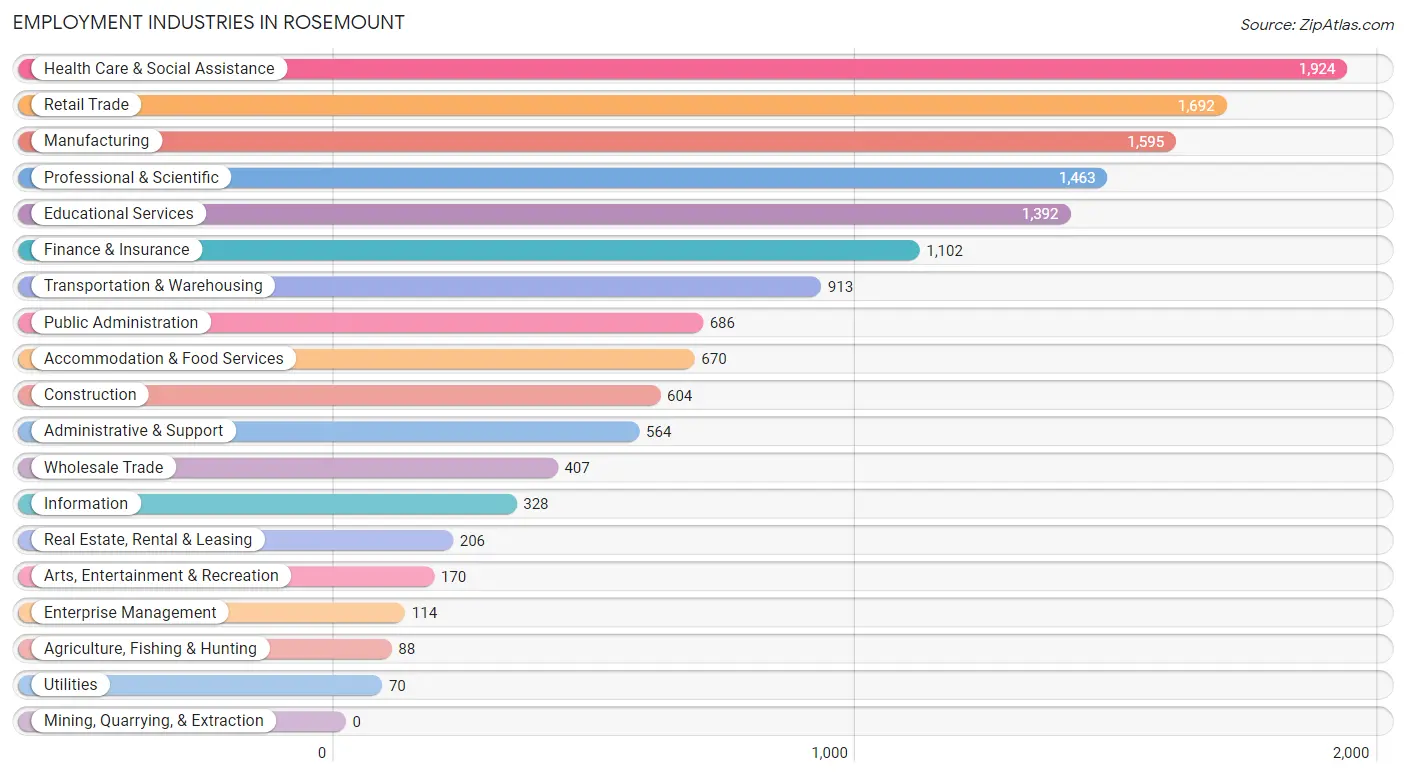
Employment Industries in Rosemount
The major employment industries in Rosemount include Health Care & Social Assistance (1,924 | 13.3%), Retail Trade (1,692 | 11.7%), Manufacturing (1,595 | 11.0%), Professional & Scientific (1,463 | 10.1%), and Educational Services (1,392 | 9.6%).
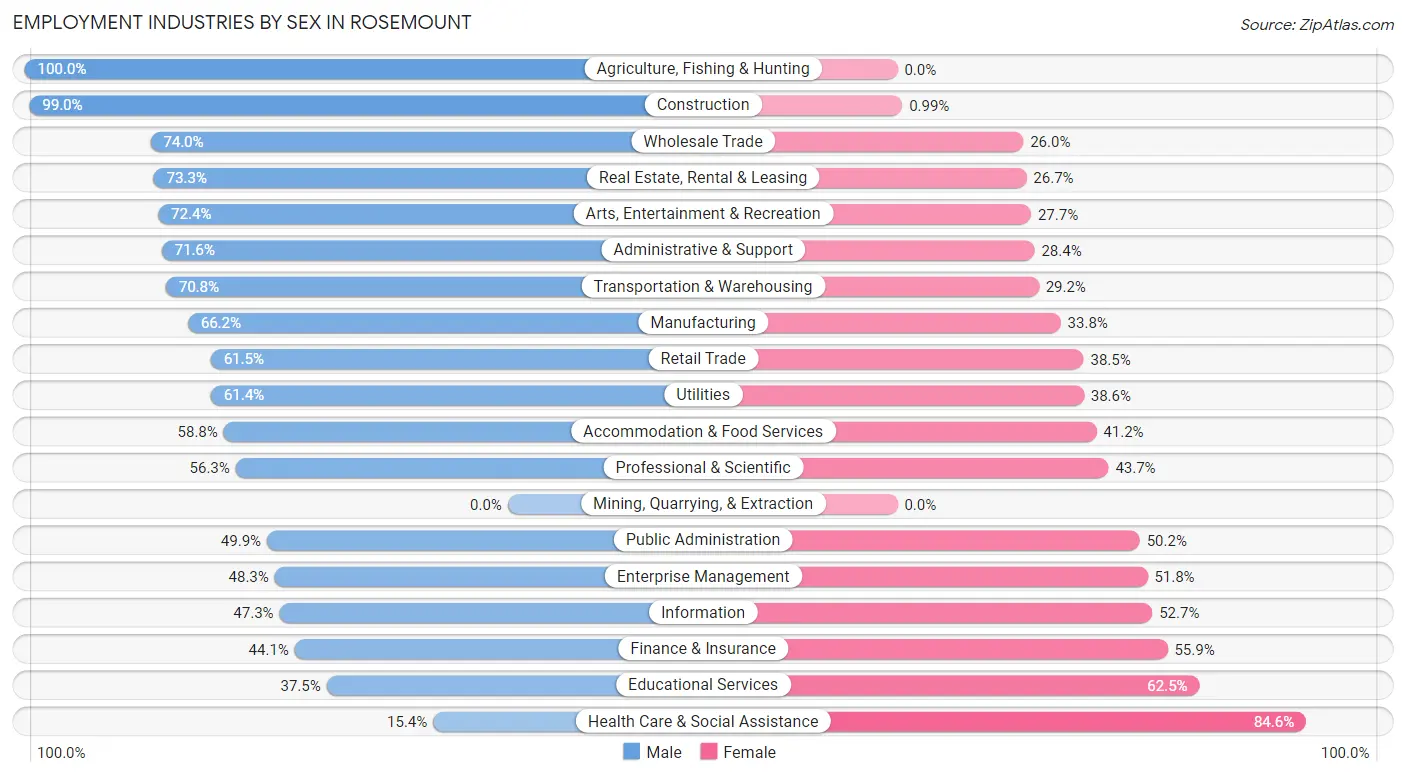
Employment Industries by Sex in Rosemount
The Rosemount industries that see more men than women are Agriculture, Fishing & Hunting (100.0%), Construction (99.0%), and Wholesale Trade (74.0%), whereas the industries that tend to have a higher number of women are Health Care & Social Assistance (84.6%), Educational Services (62.5%), and Finance & Insurance (55.9%).
| Industry | Male | Female |
| Agriculture, Fishing & Hunting | 88 (100.0%) | 0 (0.0%) |
| Mining, Quarrying, & Extraction | 0 (0.0%) | 0 (0.0%) |
| Construction | 598 (99.0%) | 6 (1.0%) |
| Manufacturing | 1,056 (66.2%) | 539 (33.8%) |
| Wholesale Trade | 301 (74.0%) | 106 (26.0%) |
| Retail Trade | 1,040 (61.5%) | 652 (38.5%) |
| Transportation & Warehousing | 646 (70.8%) | 267 (29.2%) |
| Utilities | 43 (61.4%) | 27 (38.6%) |
| Information | 155 (47.3%) | 173 (52.7%) |
| Finance & Insurance | 486 (44.1%) | 616 (55.9%) |
| Real Estate, Rental & Leasing | 151 (73.3%) | 55 (26.7%) |
| Professional & Scientific | 824 (56.3%) | 639 (43.7%) |
| Enterprise Management | 55 (48.2%) | 59 (51.7%) |
| Administrative & Support | 404 (71.6%) | 160 (28.4%) |
| Educational Services | 522 (37.5%) | 870 (62.5%) |
| Health Care & Social Assistance | 297 (15.4%) | 1,627 (84.6%) |
| Arts, Entertainment & Recreation | 123 (72.4%) | 47 (27.7%) |
| Accommodation & Food Services | 394 (58.8%) | 276 (41.2%) |
| Public Administration | 342 (49.8%) | 344 (50.1%) |
| Total | 7,688 (53.2%) | 6,755 (46.8%) |
Education in Rosemount
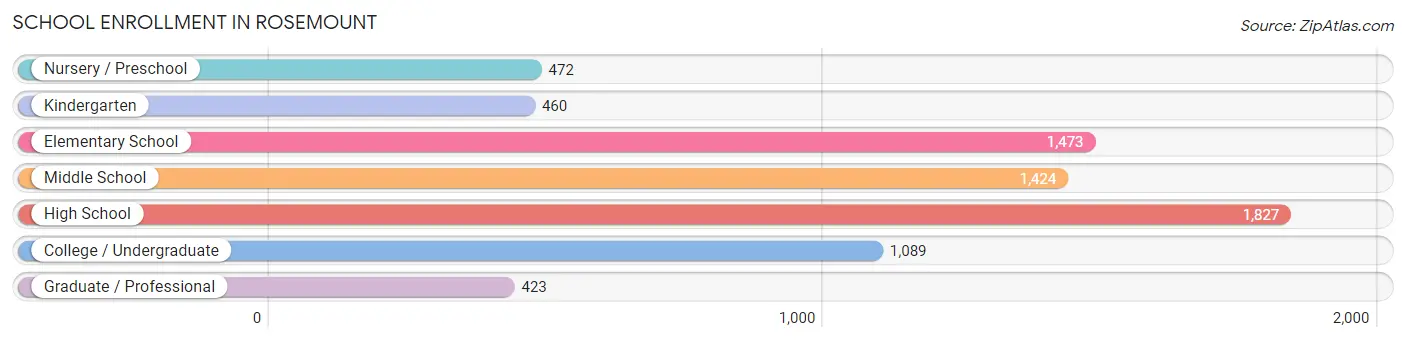
School Enrollment in Rosemount
The most common levels of schooling among the 7,168 students in Rosemount are high school (1,827 | 25.5%), elementary school (1,473 | 20.5%), and middle school (1,424 | 19.9%).
| School Level | # Students | % Students |
| Nursery / Preschool | 472 | 6.6% |
| Kindergarten | 460 | 6.4% |
| Elementary School | 1,473 | 20.5% |
| Middle School | 1,424 | 19.9% |
| High School | 1,827 | 25.5% |
| College / Undergraduate | 1,089 | 15.2% |
| Graduate / Professional | 423 | 5.9% |
| Total | 7,168 | 100.0% |
School Enrollment by Age by Funding Source in Rosemount
Out of a total of 7,168 students who are enrolled in schools in Rosemount, 918 (12.8%) attend a private institution, while the remaining 6,250 (87.2%) are enrolled in public schools. The age group of 3 to 4 year olds has the highest likelihood of being enrolled in private schools, with 200 (57.6% in the age bracket) enrolled. Conversely, the age group of 15 to 17 year olds has the lowest likelihood of being enrolled in a private school, with 1,142 (95.3% in the age bracket) attending a public institution.
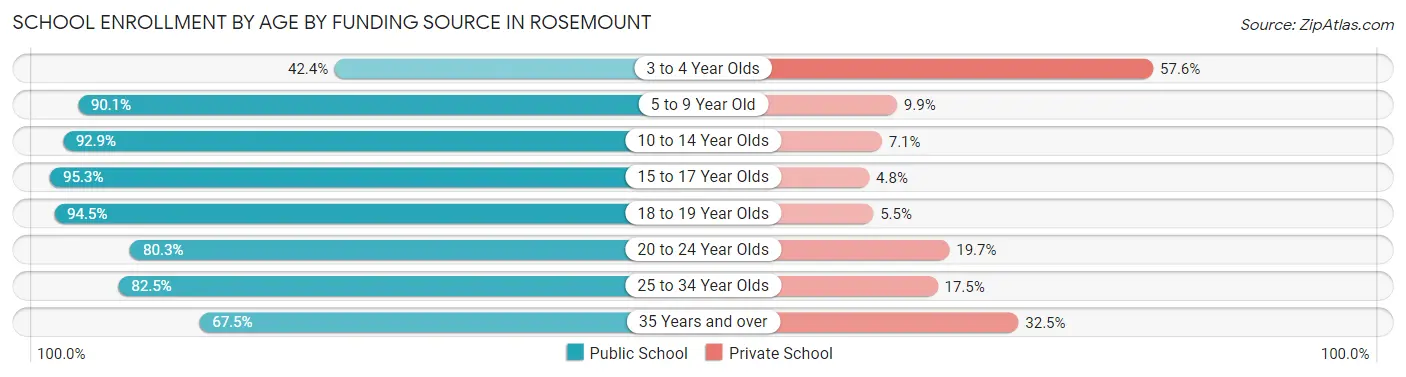
| Age Bracket | Public School | Private School |
| 3 to 4 Year Olds | 147 (42.4%) | 200 (57.6%) |
| 5 to 9 Year Old | 1,653 (90.1%) | 182 (9.9%) |
| 10 to 14 Year Olds | 1,741 (92.9%) | 133 (7.1%) |
| 15 to 17 Year Olds | 1,142 (95.3%) | 57 (4.8%) |
| 18 to 19 Year Olds | 464 (94.5%) | 27 (5.5%) |
| 20 to 24 Year Olds | 494 (80.3%) | 121 (19.7%) |
| 25 to 34 Year Olds | 354 (82.5%) | 75 (17.5%) |
| 35 Years and over | 255 (67.5%) | 123 (32.5%) |
| Total | 6,250 (87.2%) | 918 (12.8%) |
Educational Attainment by Field of Study in Rosemount
Business (2,257 | 24.2%), education (1,073 | 11.5%), social sciences (931 | 10.0%), arts & humanities (774 | 8.3%), and science & technology (612 | 6.6%) are the most common fields of study among 9,315 individuals in Rosemount who have obtained a bachelor's degree or higher.
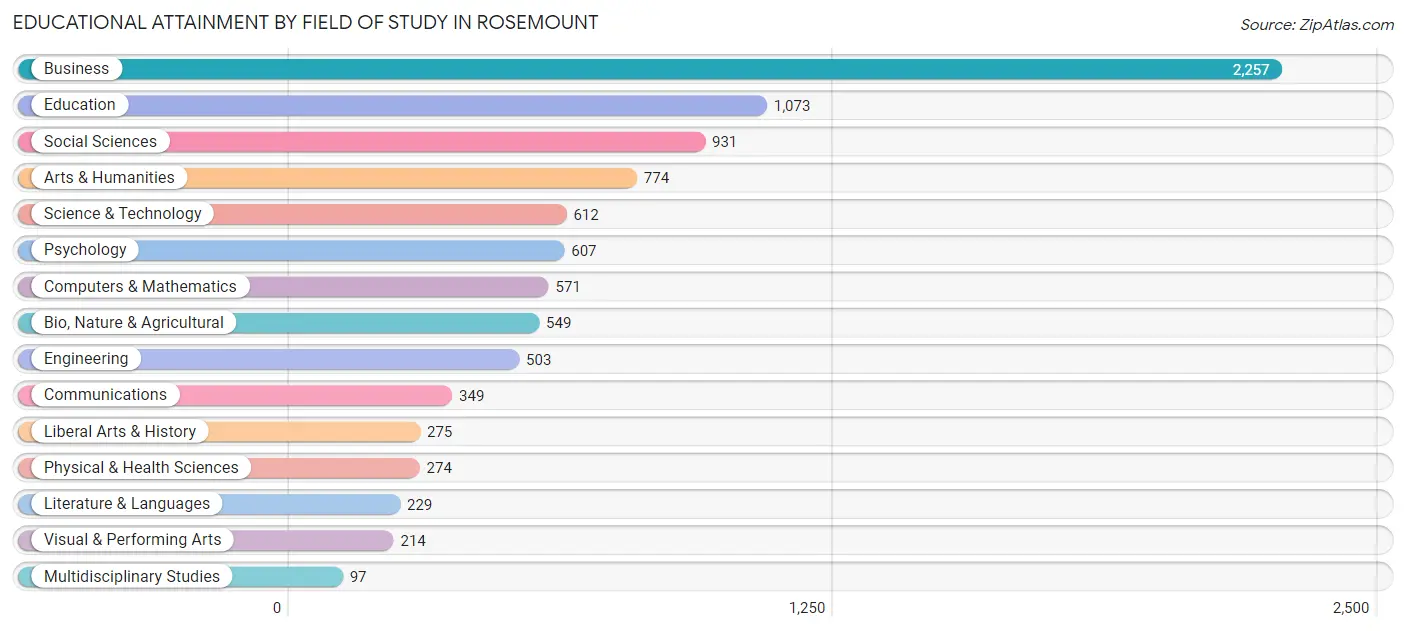
| Field of Study | # Graduates | % Graduates |
| Computers & Mathematics | 571 | 6.1% |
| Bio, Nature & Agricultural | 549 | 5.9% |
| Physical & Health Sciences | 274 | 2.9% |
| Psychology | 607 | 6.5% |
| Social Sciences | 931 | 10.0% |
| Engineering | 503 | 5.4% |
| Multidisciplinary Studies | 97 | 1.0% |
| Science & Technology | 612 | 6.6% |
| Business | 2,257 | 24.2% |
| Education | 1,073 | 11.5% |
| Literature & Languages | 229 | 2.5% |
| Liberal Arts & History | 275 | 2.9% |
| Visual & Performing Arts | 214 | 2.3% |
| Communications | 349 | 3.7% |
| Arts & Humanities | 774 | 8.3% |
| Total | 9,315 | 100.0% |
Transportation & Commute in Rosemount
Vehicle Availability by Sex in Rosemount
The most prevalent vehicle ownership categories in Rosemount are males with 2 vehicles (3,878, accounting for 50.8%) and females with 2 vehicles (3,601, making up 58.7%).
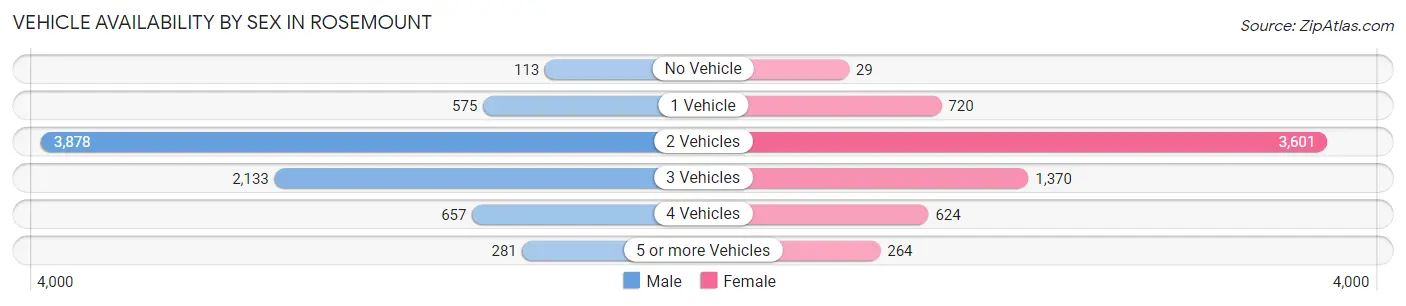
| Vehicles Available | Male | Female |
| No Vehicle | 113 (1.5%) | 29 (0.4%) |
| 1 Vehicle | 575 (7.5%) | 720 (10.9%) |
| 2 Vehicles | 3,878 (50.8%) | 3,601 (54.5%) |
| 3 Vehicles | 2,133 (27.9%) | 1,370 (20.7%) |
| 4 Vehicles | 657 (8.6%) | 624 (9.4%) |
| 5 or more Vehicles | 281 (3.7%) | 264 (4.0%) |
| Total | 7,637 (100.0%) | 6,608 (100.0%) |
Commute Time in Rosemount
The most frequently occuring commute durations in Rosemount are 30 to 34 minutes (1,910 commuters, 16.3%), 15 to 19 minutes (1,692 commuters, 14.5%), and 20 to 24 minutes (1,545 commuters, 13.2%).
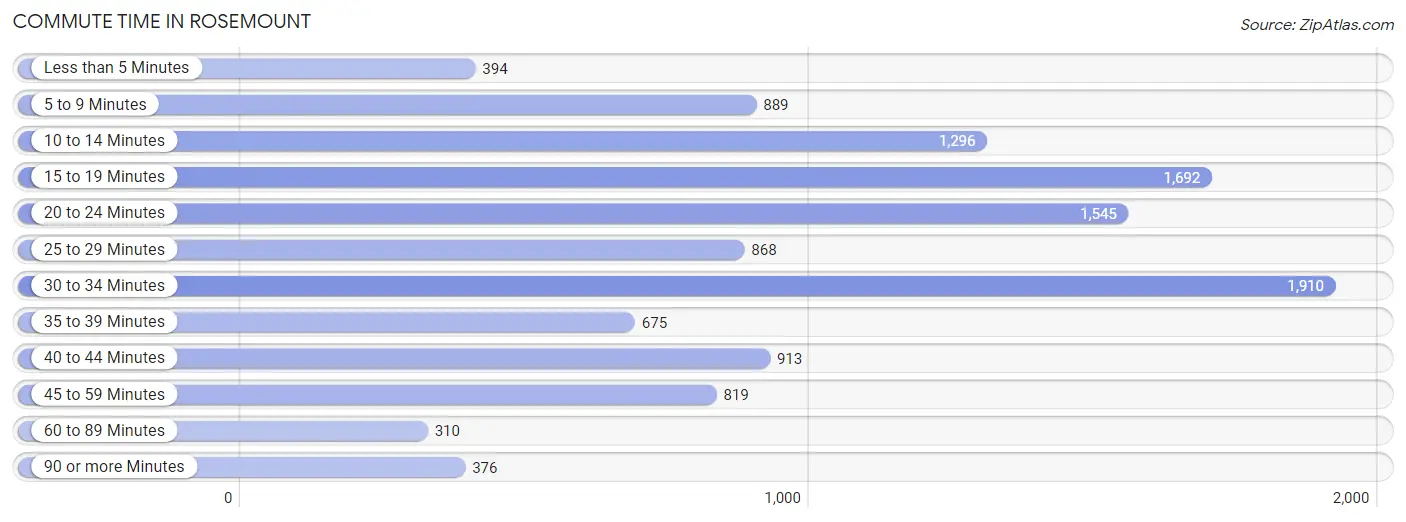
| Commute Time | # Commuters | % Commuters |
| Less than 5 Minutes | 394 | 3.4% |
| 5 to 9 Minutes | 889 | 7.6% |
| 10 to 14 Minutes | 1,296 | 11.1% |
| 15 to 19 Minutes | 1,692 | 14.5% |
| 20 to 24 Minutes | 1,545 | 13.2% |
| 25 to 29 Minutes | 868 | 7.4% |
| 30 to 34 Minutes | 1,910 | 16.3% |
| 35 to 39 Minutes | 675 | 5.8% |
| 40 to 44 Minutes | 913 | 7.8% |
| 45 to 59 Minutes | 819 | 7.0% |
| 60 to 89 Minutes | 310 | 2.6% |
| 90 or more Minutes | 376 | 3.2% |
Commute Time by Sex in Rosemount
The most common commute times in Rosemount are 30 to 34 minutes (1,129 commuters, 17.1%) for males and 20 to 24 minutes (793 commuters, 15.6%) for females.
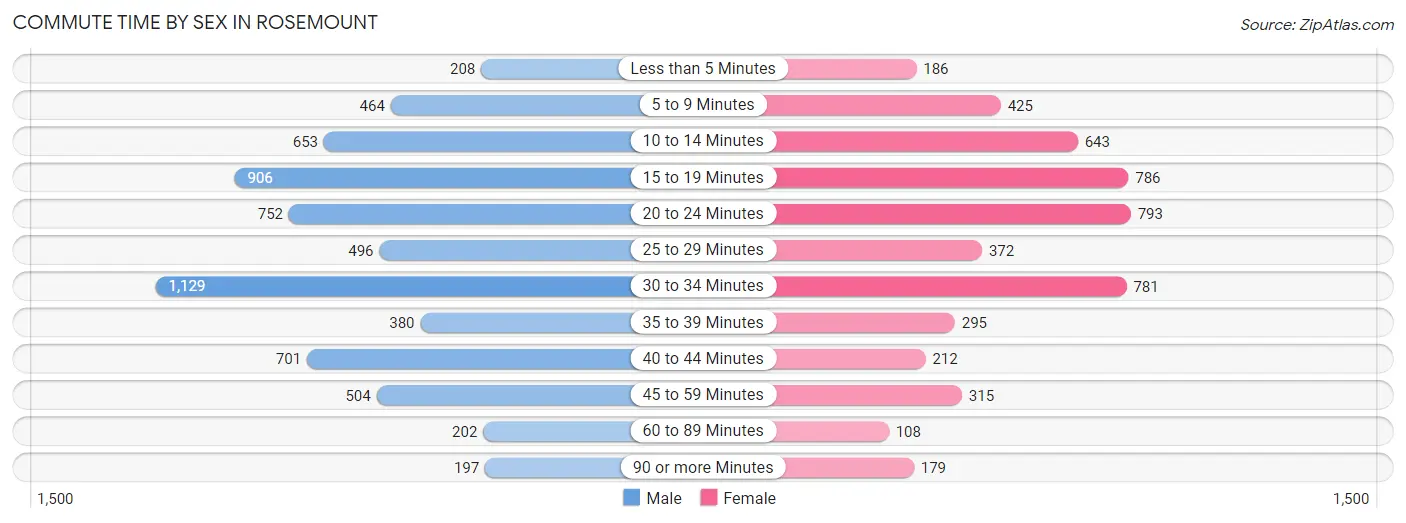
| Commute Time | Male | Female |
| Less than 5 Minutes | 208 (3.2%) | 186 (3.6%) |
| 5 to 9 Minutes | 464 (7.0%) | 425 (8.3%) |
| 10 to 14 Minutes | 653 (9.9%) | 643 (12.6%) |
| 15 to 19 Minutes | 906 (13.7%) | 786 (15.4%) |
| 20 to 24 Minutes | 752 (11.4%) | 793 (15.6%) |
| 25 to 29 Minutes | 496 (7.5%) | 372 (7.3%) |
| 30 to 34 Minutes | 1,129 (17.1%) | 781 (15.3%) |
| 35 to 39 Minutes | 380 (5.8%) | 295 (5.8%) |
| 40 to 44 Minutes | 701 (10.6%) | 212 (4.2%) |
| 45 to 59 Minutes | 504 (7.6%) | 315 (6.2%) |
| 60 to 89 Minutes | 202 (3.1%) | 108 (2.1%) |
| 90 or more Minutes | 197 (3.0%) | 179 (3.5%) |
Time of Departure to Work by Sex in Rosemount
The most frequent times of departure to work in Rosemount are 7:00 AM to 7:29 AM (944, 14.3%) for males and 7:30 AM to 7:59 AM (954, 18.7%) for females.
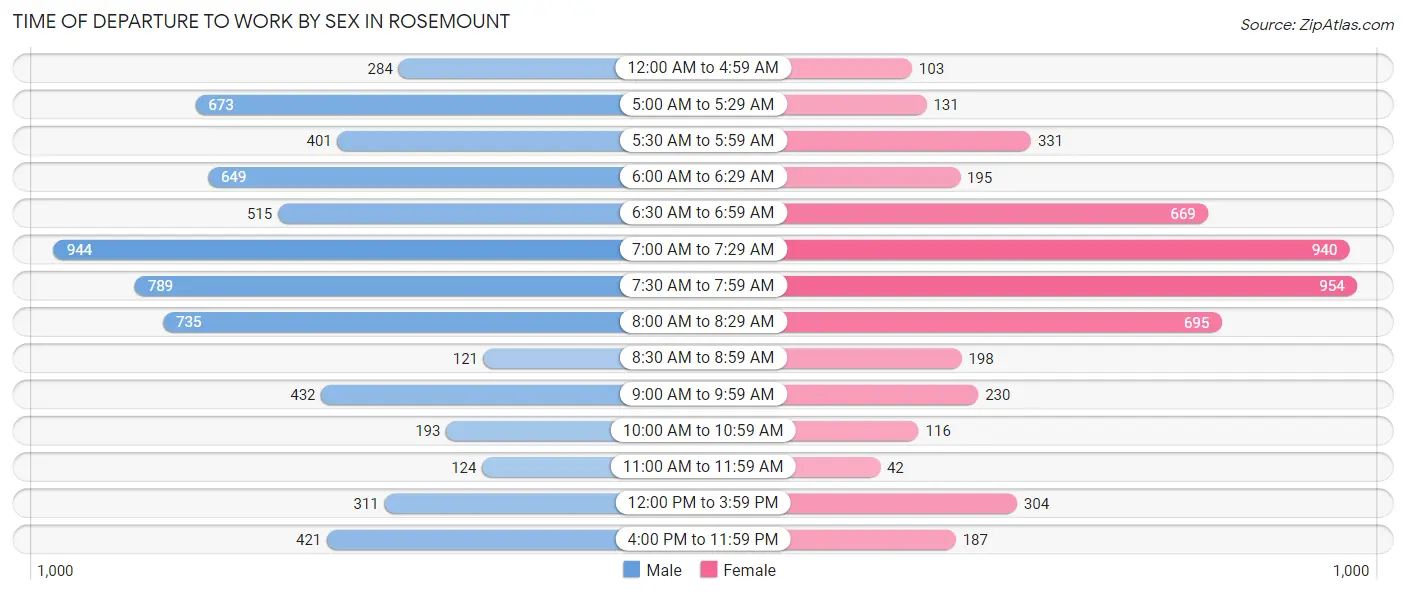
| Time of Departure | Male | Female |
| 12:00 AM to 4:59 AM | 284 (4.3%) | 103 (2.0%) |
| 5:00 AM to 5:29 AM | 673 (10.2%) | 131 (2.6%) |
| 5:30 AM to 5:59 AM | 401 (6.1%) | 331 (6.5%) |
| 6:00 AM to 6:29 AM | 649 (9.9%) | 195 (3.8%) |
| 6:30 AM to 6:59 AM | 515 (7.8%) | 669 (13.1%) |
| 7:00 AM to 7:29 AM | 944 (14.3%) | 940 (18.4%) |
| 7:30 AM to 7:59 AM | 789 (12.0%) | 954 (18.7%) |
| 8:00 AM to 8:29 AM | 735 (11.2%) | 695 (13.6%) |
| 8:30 AM to 8:59 AM | 121 (1.8%) | 198 (3.9%) |
| 9:00 AM to 9:59 AM | 432 (6.6%) | 230 (4.5%) |
| 10:00 AM to 10:59 AM | 193 (2.9%) | 116 (2.3%) |
| 11:00 AM to 11:59 AM | 124 (1.9%) | 42 (0.8%) |
| 12:00 PM to 3:59 PM | 311 (4.7%) | 304 (6.0%) |
| 4:00 PM to 11:59 PM | 421 (6.4%) | 187 (3.7%) |
| Total | 6,592 (100.0%) | 5,095 (100.0%) |
Housing Occupancy in Rosemount
Occupancy by Ownership in Rosemount
Of the total 9,229 dwellings in Rosemount, owner-occupied units account for 7,998 (86.7%), while renter-occupied units make up 1,231 (13.3%).
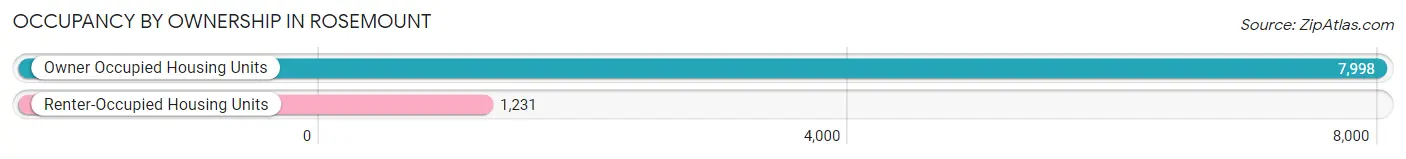
| Occupancy | # Housing Units | % Housing Units |
| Owner Occupied Housing Units | 7,998 | 86.7% |
| Renter-Occupied Housing Units | 1,231 | 13.3% |
| Total Occupied Housing Units | 9,229 | 100.0% |
Occupancy by Household Size in Rosemount
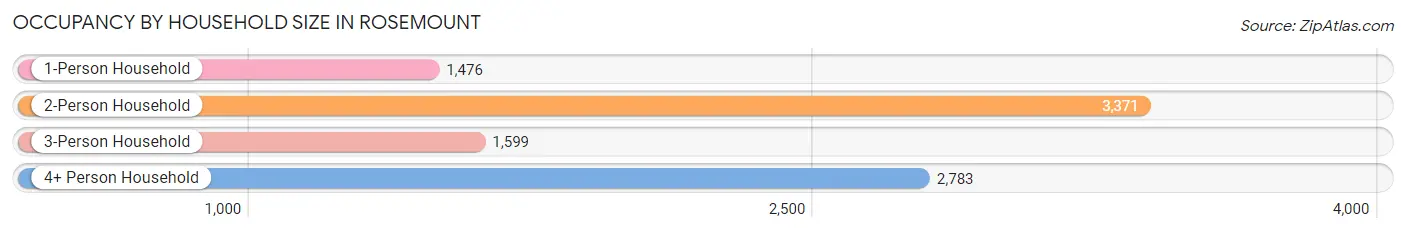
| Household Size | # Housing Units | % Housing Units |
| 1-Person Household | 1,476 | 16.0% |
| 2-Person Household | 3,371 | 36.5% |
| 3-Person Household | 1,599 | 17.3% |
| 4+ Person Household | 2,783 | 30.1% |
| Total Housing Units | 9,229 | 100.0% |
Occupancy by Ownership by Household Size in Rosemount
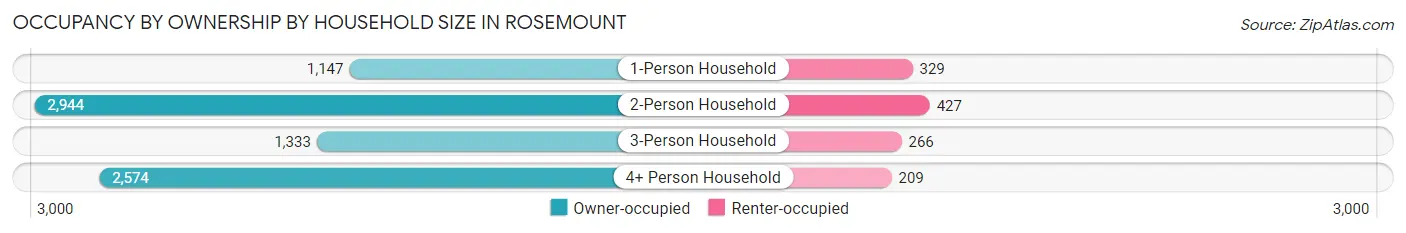
| Household Size | Owner-occupied | Renter-occupied |
| 1-Person Household | 1,147 (77.7%) | 329 (22.3%) |
| 2-Person Household | 2,944 (87.3%) | 427 (12.7%) |
| 3-Person Household | 1,333 (83.4%) | 266 (16.6%) |
| 4+ Person Household | 2,574 (92.5%) | 209 (7.5%) |
| Total Housing Units | 7,998 (86.7%) | 1,231 (13.3%) |
Occupancy by Educational Attainment in Rosemount
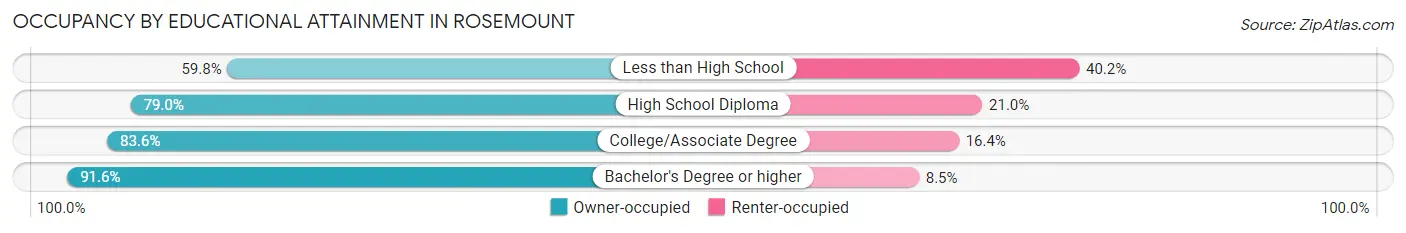
| Household Size | Owner-occupied | Renter-occupied |
| Less than High School | 104 (59.8%) | 70 (40.2%) |
| High School Diploma | 1,008 (79.0%) | 268 (21.0%) |
| College/Associate Degree | 2,490 (83.6%) | 487 (16.4%) |
| Bachelor's Degree or higher | 4,396 (91.5%) | 406 (8.5%) |
Occupancy by Age of Householder in Rosemount
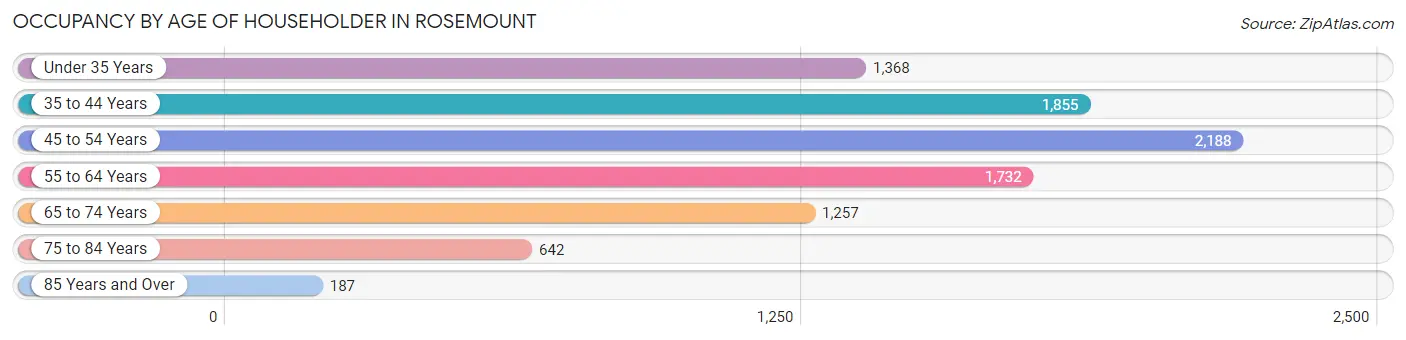
| Age Bracket | # Households | % Households |
| Under 35 Years | 1,368 | 14.8% |
| 35 to 44 Years | 1,855 | 20.1% |
| 45 to 54 Years | 2,188 | 23.7% |
| 55 to 64 Years | 1,732 | 18.8% |
| 65 to 74 Years | 1,257 | 13.6% |
| 75 to 84 Years | 642 | 7.0% |
| 85 Years and Over | 187 | 2.0% |
| Total | 9,229 | 100.0% |
Housing Finances in Rosemount
Median Income by Occupancy in Rosemount
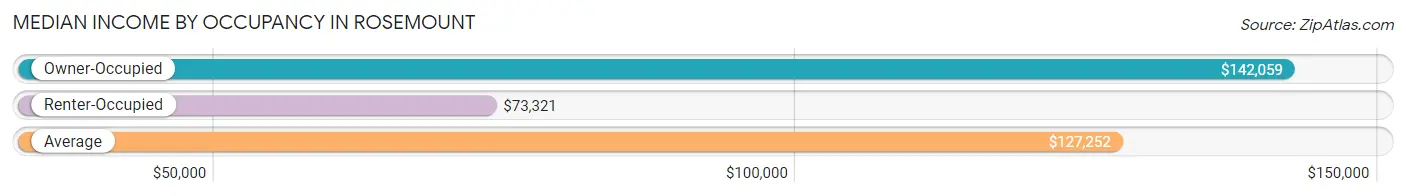
| Occupancy Type | # Households | Median Income |
| Owner-Occupied | 7,998 (86.7%) | $142,059 |
| Renter-Occupied | 1,231 (13.3%) | $73,321 |
| Average | 9,229 (100.0%) | $127,252 |
Occupancy by Householder Income Bracket in Rosemount
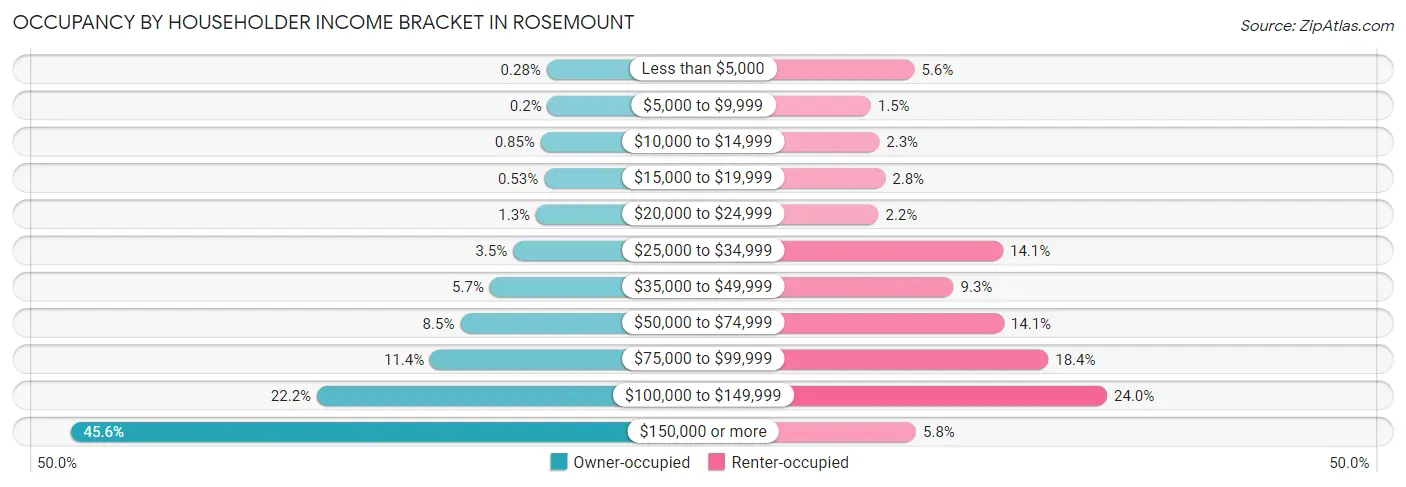
| Income Bracket | Owner-occupied | Renter-occupied |
| Less than $5,000 | 22 (0.3%) | 69 (5.6%) |
| $5,000 to $9,999 | 16 (0.2%) | 18 (1.5%) |
| $10,000 to $14,999 | 68 (0.9%) | 28 (2.3%) |
| $15,000 to $19,999 | 42 (0.5%) | 35 (2.8%) |
| $20,000 to $24,999 | 104 (1.3%) | 27 (2.2%) |
| $25,000 to $34,999 | 278 (3.5%) | 173 (14.1%) |
| $35,000 to $49,999 | 456 (5.7%) | 115 (9.3%) |
| $50,000 to $74,999 | 681 (8.5%) | 174 (14.1%) |
| $75,000 to $99,999 | 911 (11.4%) | 226 (18.4%) |
| $100,000 to $149,999 | 1,772 (22.2%) | 295 (24.0%) |
| $150,000 or more | 3,648 (45.6%) | 71 (5.8%) |
| Total | 7,998 (100.0%) | 1,231 (100.0%) |
Monthly Housing Cost Tiers in Rosemount
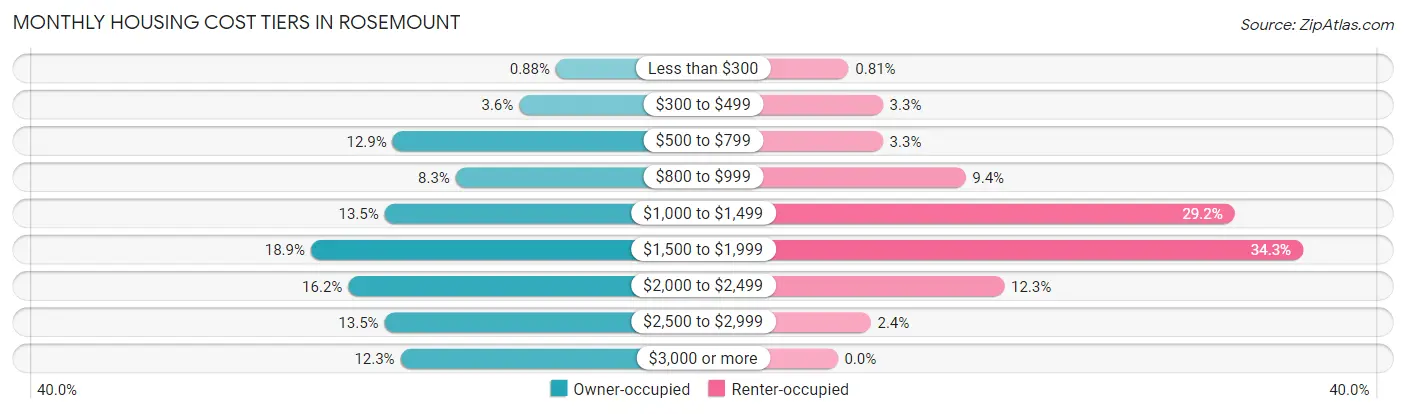
| Monthly Cost | Owner-occupied | Renter-occupied |
| Less than $300 | 70 (0.9%) | 10 (0.8%) |
| $300 to $499 | 286 (3.6%) | 41 (3.3%) |
| $500 to $799 | 1,032 (12.9%) | 41 (3.3%) |
| $800 to $999 | 660 (8.3%) | 116 (9.4%) |
| $1,000 to $1,499 | 1,079 (13.5%) | 360 (29.2%) |
| $1,500 to $1,999 | 1,513 (18.9%) | 422 (34.3%) |
| $2,000 to $2,499 | 1,293 (16.2%) | 151 (12.3%) |
| $2,500 to $2,999 | 1,080 (13.5%) | 30 (2.4%) |
| $3,000 or more | 985 (12.3%) | 0 (0.0%) |
| Total | 7,998 (100.0%) | 1,231 (100.0%) |
Physical Housing Characteristics in Rosemount
Housing Structures in Rosemount
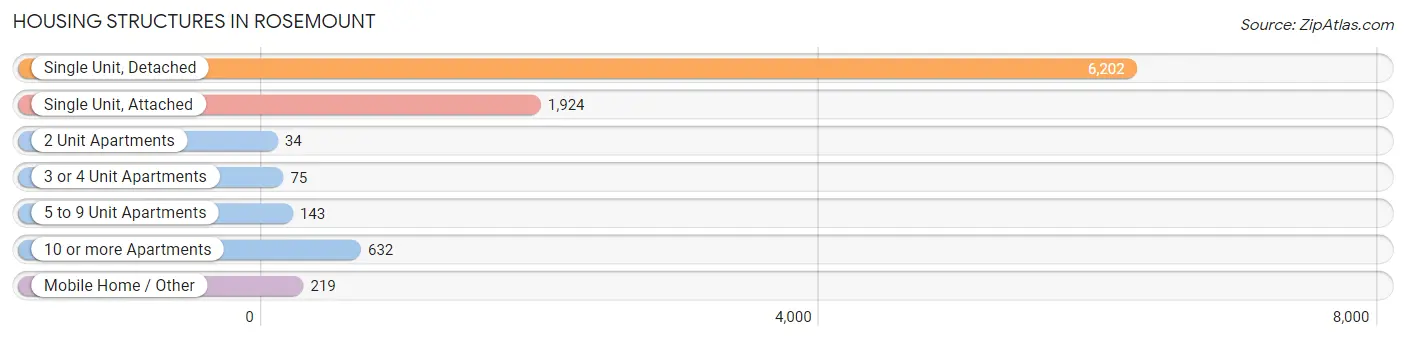
| Structure Type | # Housing Units | % Housing Units |
| Single Unit, Detached | 6,202 | 67.2% |
| Single Unit, Attached | 1,924 | 20.8% |
| 2 Unit Apartments | 34 | 0.4% |
| 3 or 4 Unit Apartments | 75 | 0.8% |
| 5 to 9 Unit Apartments | 143 | 1.5% |
| 10 or more Apartments | 632 | 6.9% |
| Mobile Home / Other | 219 | 2.4% |
| Total | 9,229 | 100.0% |
Housing Structures by Occupancy in Rosemount
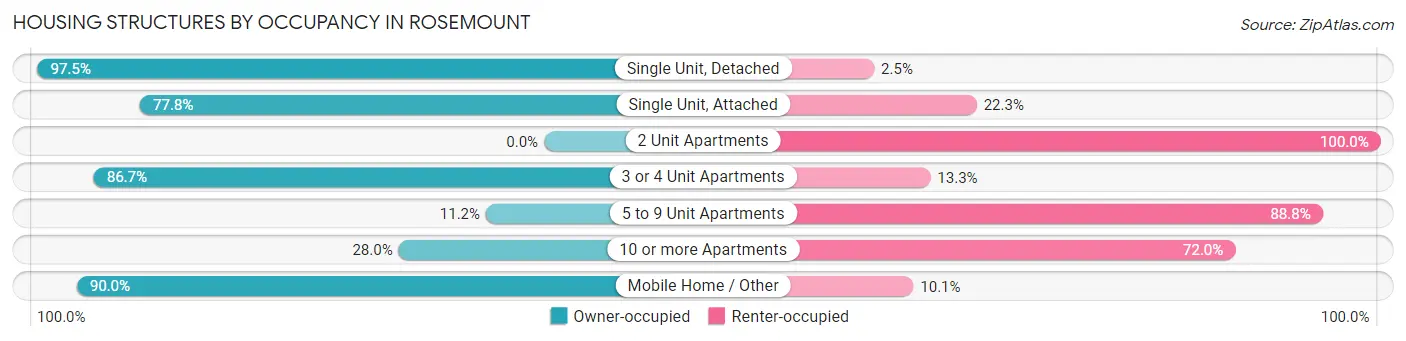
| Structure Type | Owner-occupied | Renter-occupied |
| Single Unit, Detached | 6,047 (97.5%) | 155 (2.5%) |
| Single Unit, Attached | 1,496 (77.7%) | 428 (22.3%) |
| 2 Unit Apartments | 0 (0.0%) | 34 (100.0%) |
| 3 or 4 Unit Apartments | 65 (86.7%) | 10 (13.3%) |
| 5 to 9 Unit Apartments | 16 (11.2%) | 127 (88.8%) |
| 10 or more Apartments | 177 (28.0%) | 455 (72.0%) |
| Mobile Home / Other | 197 (89.9%) | 22 (10.1%) |
| Total | 7,998 (86.7%) | 1,231 (13.3%) |
Housing Structures by Number of Rooms in Rosemount
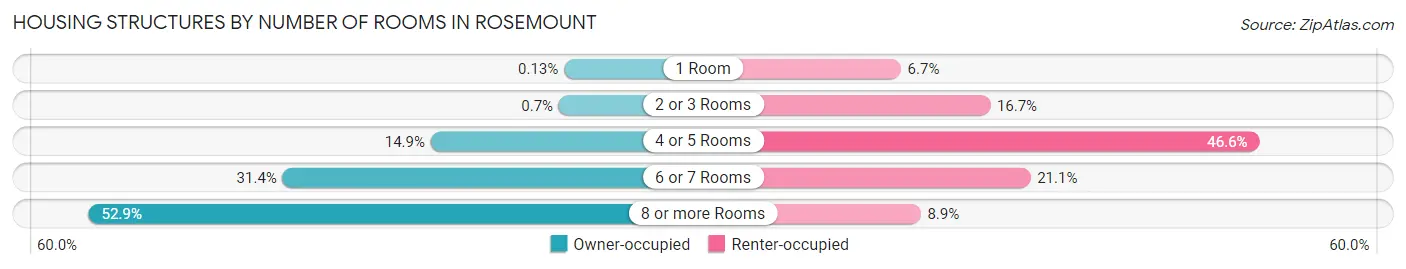
| Number of Rooms | Owner-occupied | Renter-occupied |
| 1 Room | 10 (0.1%) | 83 (6.7%) |
| 2 or 3 Rooms | 56 (0.7%) | 205 (16.7%) |
| 4 or 5 Rooms | 1,193 (14.9%) | 573 (46.6%) |
| 6 or 7 Rooms | 2,508 (31.4%) | 260 (21.1%) |
| 8 or more Rooms | 4,231 (52.9%) | 110 (8.9%) |
| Total | 7,998 (100.0%) | 1,231 (100.0%) |
Housing Structure by Heating Type in Rosemount
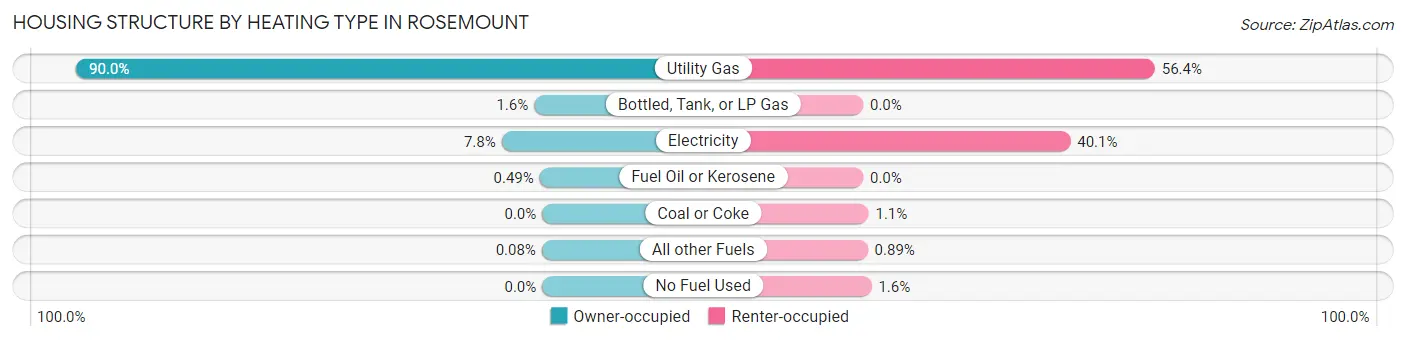
| Heating Type | Owner-occupied | Renter-occupied |
| Utility Gas | 7,201 (90.0%) | 694 (56.4%) |
| Bottled, Tank, or LP Gas | 125 (1.6%) | 0 (0.0%) |
| Electricity | 627 (7.8%) | 493 (40.1%) |
| Fuel Oil or Kerosene | 39 (0.5%) | 0 (0.0%) |
| Coal or Coke | 0 (0.0%) | 13 (1.1%) |
| All other Fuels | 6 (0.1%) | 11 (0.9%) |
| No Fuel Used | 0 (0.0%) | 20 (1.6%) |
| Total | 7,998 (100.0%) | 1,231 (100.0%) |
Household Vehicle Usage in Rosemount
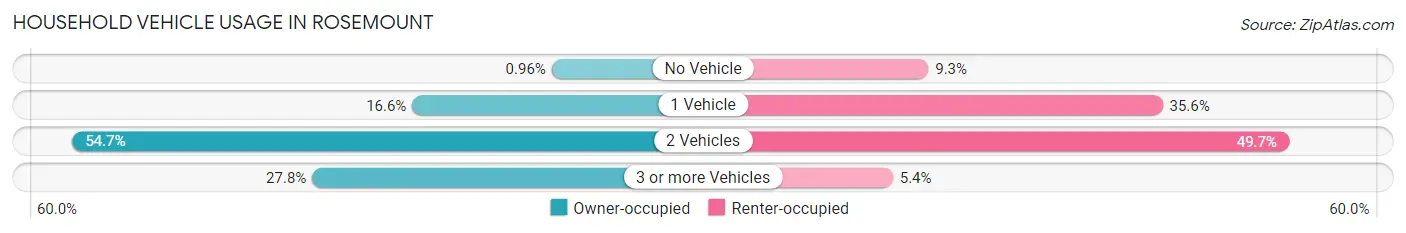
| Vehicles per Household | Owner-occupied | Renter-occupied |
| No Vehicle | 77 (1.0%) | 115 (9.3%) |
| 1 Vehicle | 1,326 (16.6%) | 438 (35.6%) |
| 2 Vehicles | 4,372 (54.7%) | 612 (49.7%) |
| 3 or more Vehicles | 2,223 (27.8%) | 66 (5.4%) |
| Total | 7,998 (100.0%) | 1,231 (100.0%) |
Real Estate & Mortgages in Rosemount
Real Estate and Mortgage Overview in Rosemount
| Characteristic | Without Mortgage | With Mortgage |
| Housing Units | 2,202 | 5,796 |
| Median Property Value | $348,100 | $387,200 |
| Median Household Income | $99,651 | $3,087 |
| Monthly Housing Costs | $735 | $968 |
| Real Estate Taxes | $3,642 | $57 |
Property Value by Mortgage Status in Rosemount
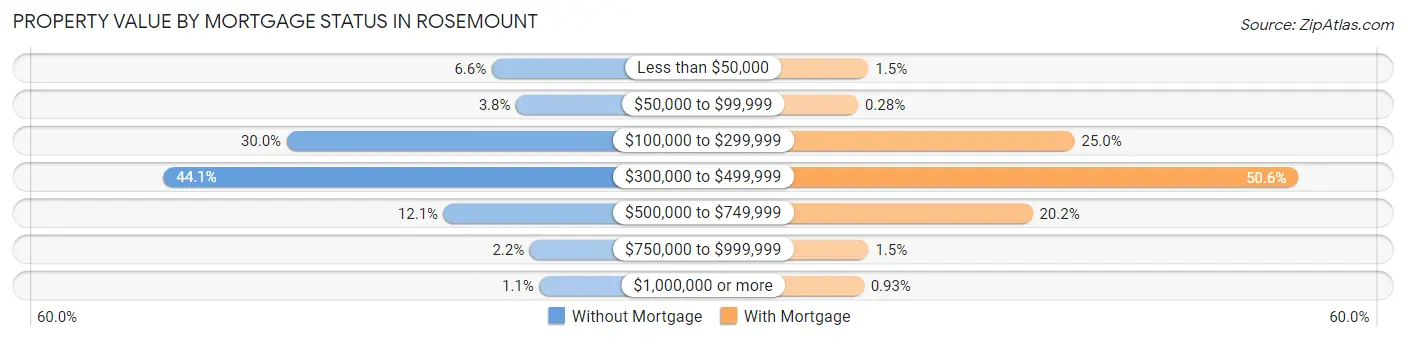
| Property Value | Without Mortgage | With Mortgage |
| Less than $50,000 | 145 (6.6%) | 85 (1.5%) |
| $50,000 to $99,999 | 84 (3.8%) | 16 (0.3%) |
| $100,000 to $299,999 | 661 (30.0%) | 1,451 (25.0%) |
| $300,000 to $499,999 | 972 (44.1%) | 2,932 (50.6%) |
| $500,000 to $749,999 | 266 (12.1%) | 1,172 (20.2%) |
| $750,000 to $999,999 | 49 (2.2%) | 86 (1.5%) |
| $1,000,000 or more | 25 (1.1%) | 54 (0.9%) |
| Total | 2,202 (100.0%) | 5,796 (100.0%) |
Household Income by Mortgage Status in Rosemount
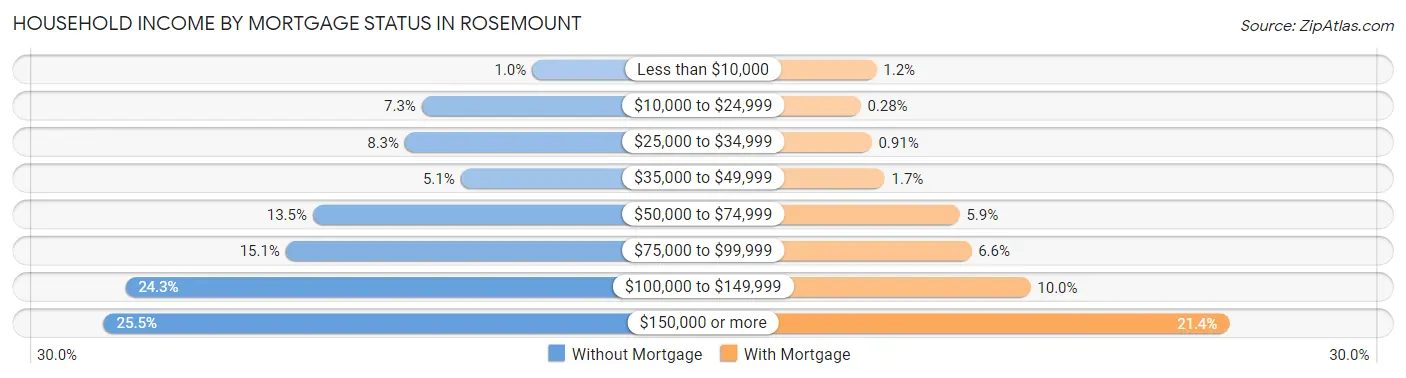
| Household Income | Without Mortgage | With Mortgage |
| Less than $10,000 | 22 (1.0%) | 69 (1.2%) |
| $10,000 to $24,999 | 161 (7.3%) | 16 (0.3%) |
| $25,000 to $34,999 | 182 (8.3%) | 53 (0.9%) |
| $35,000 to $49,999 | 112 (5.1%) | 96 (1.7%) |
| $50,000 to $74,999 | 298 (13.5%) | 344 (5.9%) |
| $75,000 to $99,999 | 332 (15.1%) | 383 (6.6%) |
| $100,000 to $149,999 | 534 (24.2%) | 579 (10.0%) |
| $150,000 or more | 561 (25.5%) | 1,238 (21.4%) |
| Total | 2,202 (100.0%) | 5,796 (100.0%) |
Property Value to Household Income Ratio in Rosemount
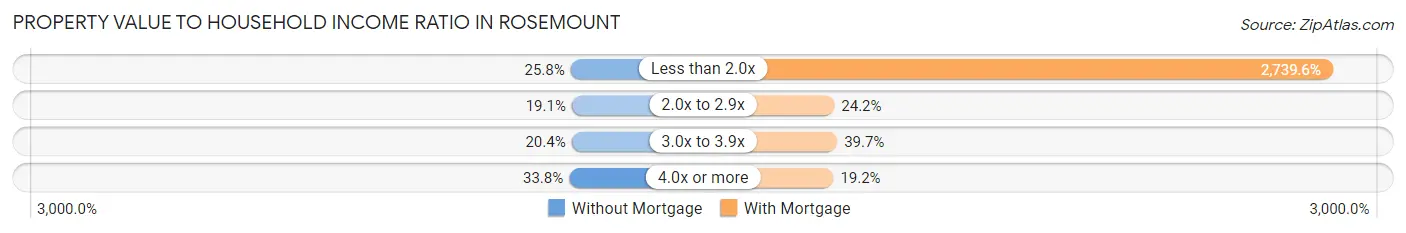
| Value-to-Income Ratio | Without Mortgage | With Mortgage |
| Less than 2.0x | 567 (25.8%) | 158,789 (2,739.6%) |
| 2.0x to 2.9x | 420 (19.1%) | 1,404 (24.2%) |
| 3.0x to 3.9x | 449 (20.4%) | 2,298 (39.7%) |
| 4.0x or more | 744 (33.8%) | 1,111 (19.2%) |
| Total | 2,202 (100.0%) | 5,796 (100.0%) |
Real Estate Taxes by Mortgage Status in Rosemount
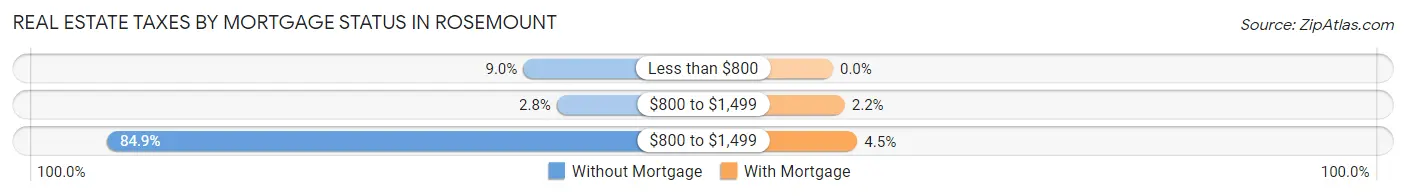
| Property Taxes | Without Mortgage | With Mortgage |
| Less than $800 | 197 (8.9%) | 0 (0.0%) |
| $800 to $1,499 | 62 (2.8%) | 125 (2.2%) |
| $800 to $1,499 | 1,870 (84.9%) | 258 (4.4%) |
| Total | 2,202 (100.0%) | 5,796 (100.0%) |
Health & Disability in Rosemount
Health Insurance Coverage by Age in Rosemount
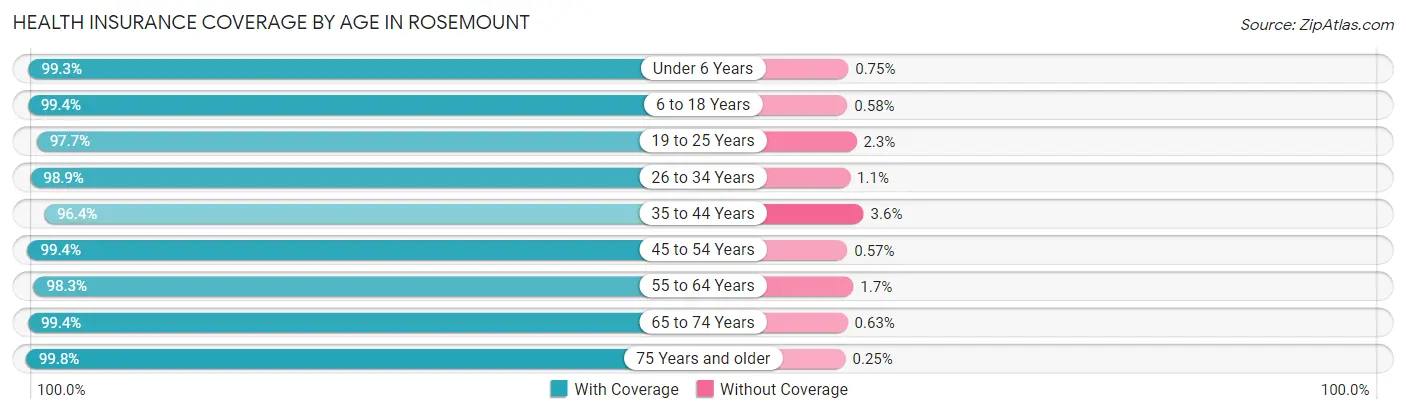
| Age Bracket | With Coverage | Without Coverage |
| Under 6 Years | 1,974 (99.3%) | 15 (0.7%) |
| 6 to 18 Years | 5,283 (99.4%) | 31 (0.6%) |
| 19 to 25 Years | 2,028 (97.7%) | 47 (2.3%) |
| 26 to 34 Years | 2,538 (98.9%) | 28 (1.1%) |
| 35 to 44 Years | 3,418 (96.4%) | 128 (3.6%) |
| 45 to 54 Years | 4,044 (99.4%) | 23 (0.6%) |
| 55 to 64 Years | 3,062 (98.3%) | 53 (1.7%) |
| 65 to 74 Years | 2,049 (99.4%) | 13 (0.6%) |
| 75 Years and older | 1,209 (99.8%) | 3 (0.3%) |
| Total | 25,605 (98.7%) | 341 (1.3%) |
Health Insurance Coverage by Citizenship Status in Rosemount
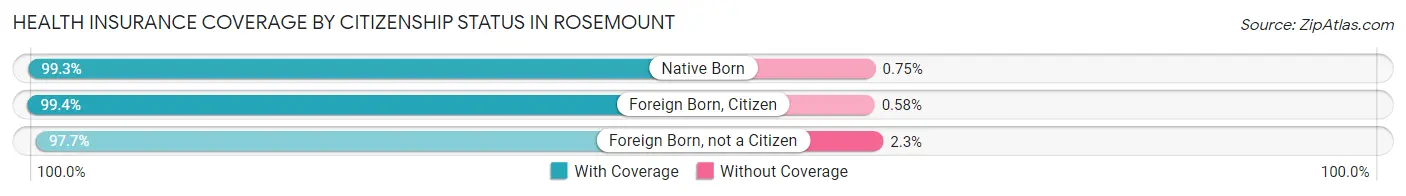
| Citizenship Status | With Coverage | Without Coverage |
| Native Born | 1,974 (99.3%) | 15 (0.7%) |
| Foreign Born, Citizen | 5,283 (99.4%) | 31 (0.6%) |
| Foreign Born, not a Citizen | 2,028 (97.7%) | 47 (2.3%) |
Health Insurance Coverage by Household Income in Rosemount
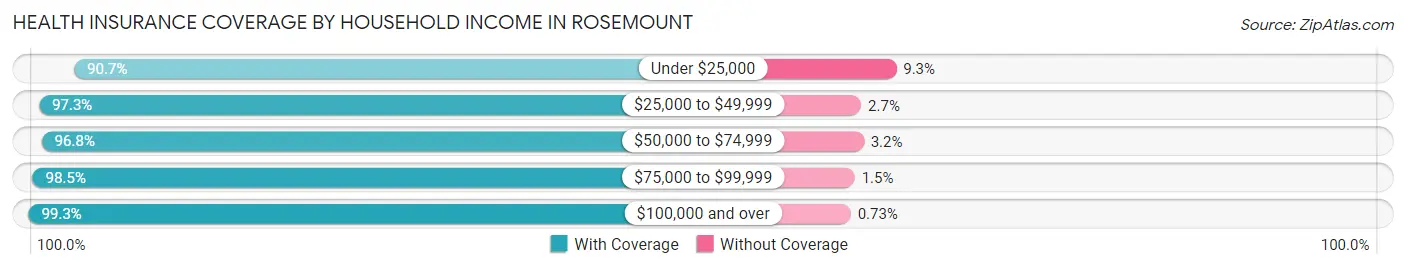
| Household Income | With Coverage | Without Coverage |
| Under $25,000 | 460 (90.7%) | 47 (9.3%) |
| $25,000 to $49,999 | 2,022 (97.3%) | 56 (2.7%) |
| $50,000 to $74,999 | 1,863 (96.8%) | 61 (3.2%) |
| $75,000 to $99,999 | 2,779 (98.5%) | 42 (1.5%) |
| $100,000 and over | 18,451 (99.3%) | 135 (0.7%) |
Public vs Private Health Insurance Coverage by Age in Rosemount
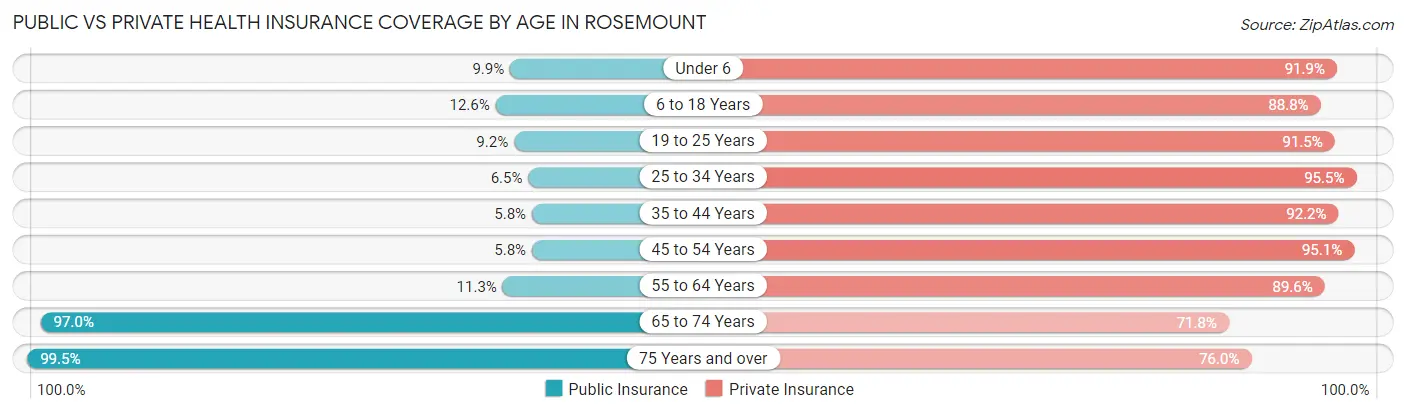
| Age Bracket | Public Insurance | Private Insurance |
| Under 6 | 197 (9.9%) | 1,827 (91.9%) |
| 6 to 18 Years | 669 (12.6%) | 4,721 (88.8%) |
| 19 to 25 Years | 190 (9.2%) | 1,898 (91.5%) |
| 25 to 34 Years | 167 (6.5%) | 2,450 (95.5%) |
| 35 to 44 Years | 207 (5.8%) | 3,268 (92.2%) |
| 45 to 54 Years | 237 (5.8%) | 3,866 (95.1%) |
| 55 to 64 Years | 351 (11.3%) | 2,791 (89.6%) |
| 65 to 74 Years | 2,001 (97.0%) | 1,481 (71.8%) |
| 75 Years and over | 1,206 (99.5%) | 921 (76.0%) |
| Total | 5,225 (20.1%) | 23,223 (89.5%) |
Disability Status by Sex by Age in Rosemount
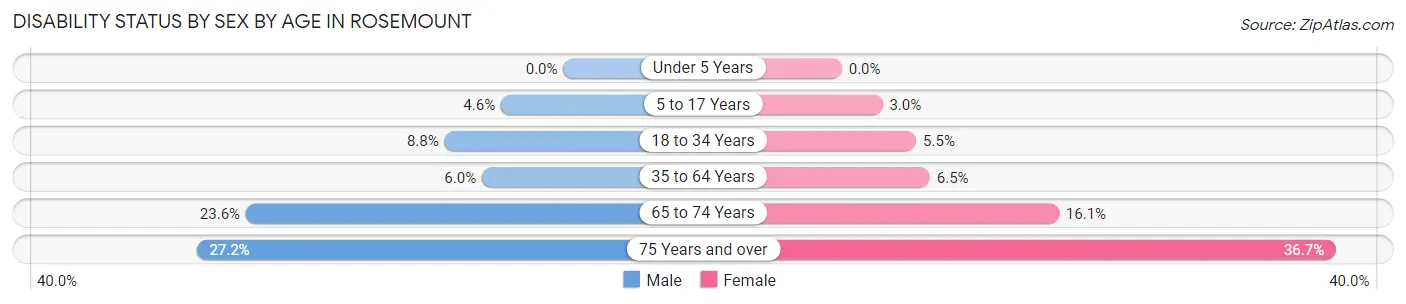
| Age Bracket | Male | Female |
| Under 5 Years | 0 (0.0%) | 0 (0.0%) |
| 5 to 17 Years | 126 (4.6%) | 76 (3.0%) |
| 18 to 34 Years | 237 (8.8%) | 130 (5.5%) |
| 35 to 64 Years | 320 (6.0%) | 355 (6.5%) |
| 65 to 74 Years | 214 (23.6%) | 186 (16.1%) |
| 75 Years and over | 146 (27.2%) | 248 (36.7%) |
Disability Class by Sex by Age in Rosemount
Disability Class: Hearing Difficulty
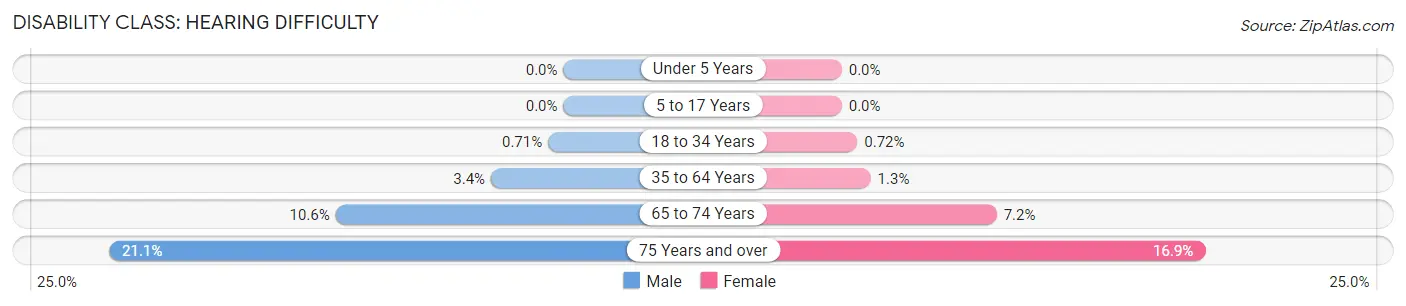
| Age Bracket | Male | Female |
| Under 5 Years | 0 (0.0%) | 0 (0.0%) |
| 5 to 17 Years | 0 (0.0%) | 0 (0.0%) |
| 18 to 34 Years | 19 (0.7%) | 17 (0.7%) |
| 35 to 64 Years | 178 (3.4%) | 73 (1.3%) |
| 65 to 74 Years | 96 (10.6%) | 83 (7.2%) |
| 75 Years and over | 113 (21.1%) | 114 (16.9%) |
Disability Class: Vision Difficulty
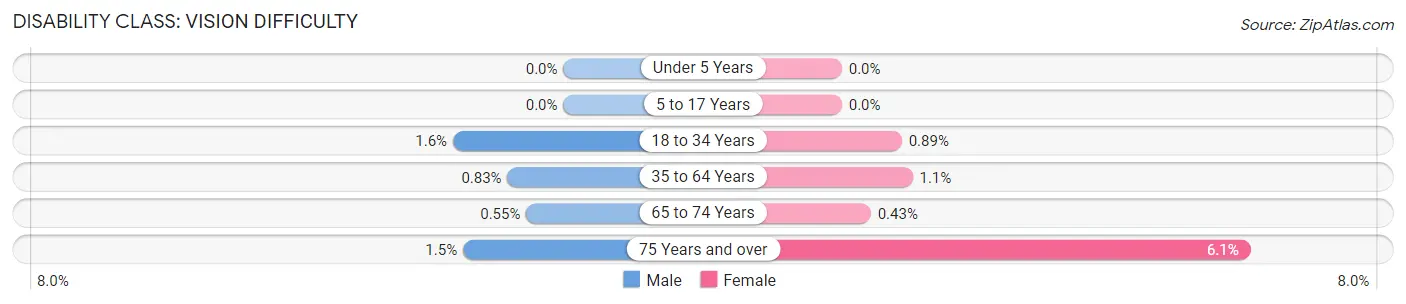
| Age Bracket | Male | Female |
| Under 5 Years | 0 (0.0%) | 0 (0.0%) |
| 5 to 17 Years | 0 (0.0%) | 0 (0.0%) |
| 18 to 34 Years | 44 (1.6%) | 21 (0.9%) |
| 35 to 64 Years | 44 (0.8%) | 57 (1.1%) |
| 65 to 74 Years | 5 (0.5%) | 5 (0.4%) |
| 75 Years and over | 8 (1.5%) | 41 (6.1%) |
Disability Class: Cognitive Difficulty
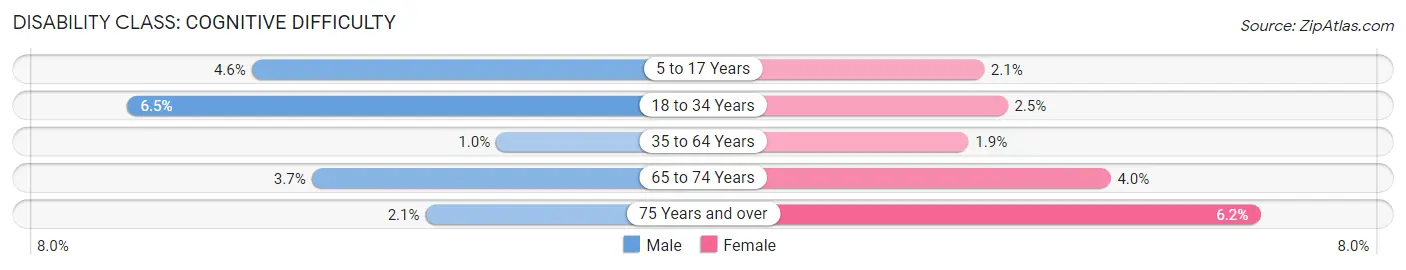
| Age Bracket | Male | Female |
| 5 to 17 Years | 126 (4.6%) | 53 (2.1%) |
| 18 to 34 Years | 174 (6.5%) | 58 (2.5%) |
| 35 to 64 Years | 53 (1.0%) | 102 (1.9%) |
| 65 to 74 Years | 34 (3.7%) | 46 (4.0%) |
| 75 Years and over | 11 (2.1%) | 42 (6.2%) |
Disability Class: Ambulatory Difficulty
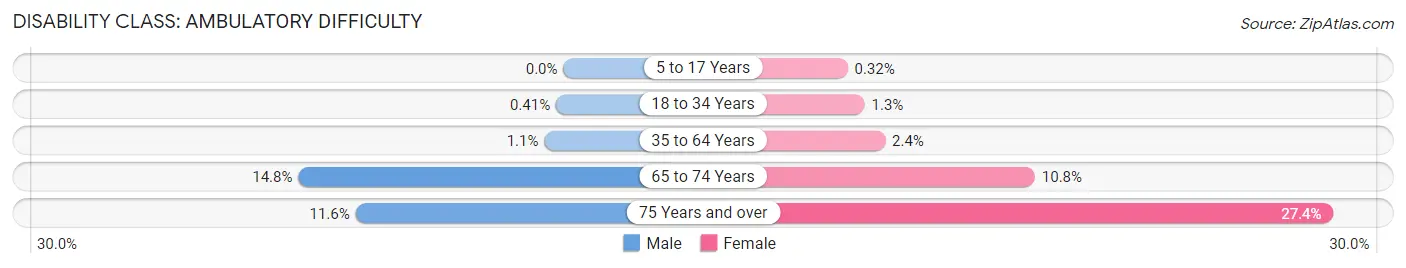
| Age Bracket | Male | Female |
| 5 to 17 Years | 0 (0.0%) | 8 (0.3%) |
| 18 to 34 Years | 11 (0.4%) | 30 (1.3%) |
| 35 to 64 Years | 56 (1.1%) | 131 (2.4%) |
| 65 to 74 Years | 134 (14.8%) | 124 (10.7%) |
| 75 Years and over | 62 (11.6%) | 185 (27.4%) |
Disability Class: Self-Care Difficulty
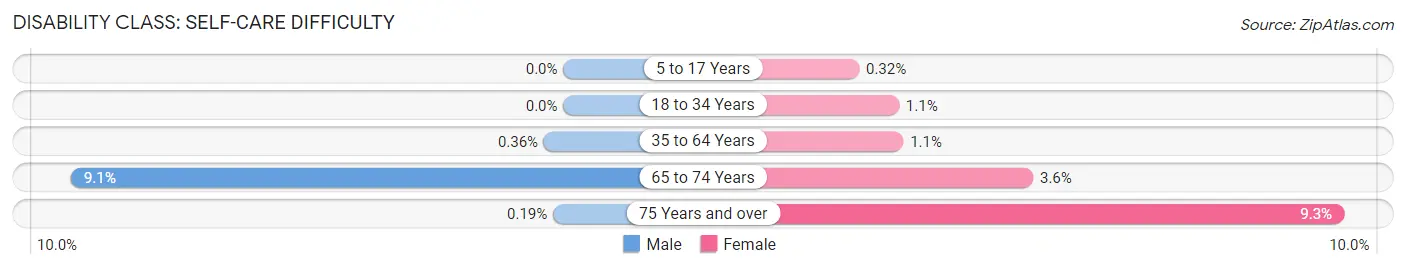
| Age Bracket | Male | Female |
| 5 to 17 Years | 0 (0.0%) | 8 (0.3%) |
| 18 to 34 Years | 0 (0.0%) | 25 (1.1%) |
| 35 to 64 Years | 19 (0.4%) | 62 (1.1%) |
| 65 to 74 Years | 83 (9.1%) | 41 (3.5%) |
| 75 Years and over | 1 (0.2%) | 63 (9.3%) |
Technology Access in Rosemount
Computing Device Access in Rosemount
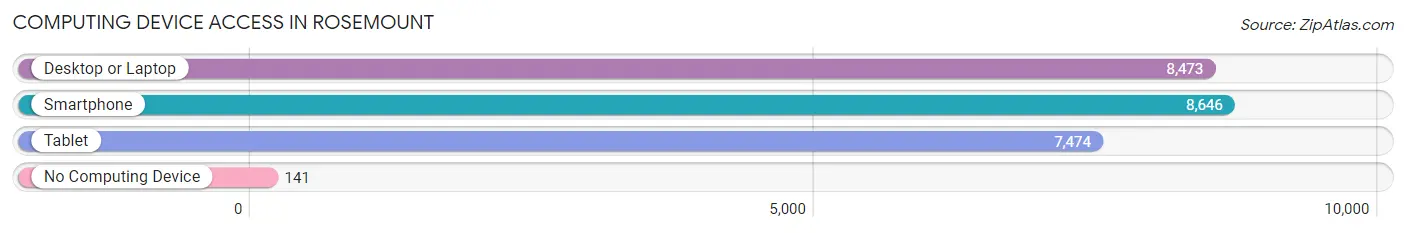
| Device Type | # Households | % Households |
| Desktop or Laptop | 8,473 | 91.8% |
| Smartphone | 8,646 | 93.7% |
| Tablet | 7,474 | 81.0% |
| No Computing Device | 141 | 1.5% |
| Total | 9,229 | 100.0% |
Internet Access in Rosemount
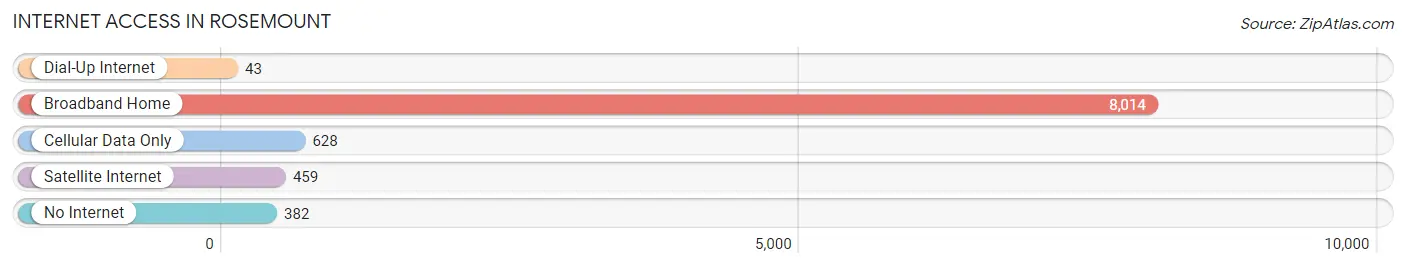
| Internet Type | # Households | % Households |
| Dial-Up Internet | 43 | 0.5% |
| Broadband Home | 8,014 | 86.8% |
| Cellular Data Only | 628 | 6.8% |
| Satellite Internet | 459 | 5.0% |
| No Internet | 382 | 4.1% |
| Total | 9,229 | 100.0% |
Rosemount Summary
Rosemount, Minnesota is a city located in Dakota County, Minnesota, United States. The population was 21,874 at the 2010 census. It is one of the southern suburbs of the Twin Cities metropolitan area. Rosemount is a rapidly growing city, with a population that has more than doubled since 2000.
History
The area that is now Rosemount was first settled in 1854 by Irish immigrants. The town was originally called Rosemount after the Rosemount Estate, a large estate owned by the O'Connor family. The estate was named after the rose bushes that grew in the area. The town was officially incorporated in 1972.
Geography
Rosemount is located in Dakota County, Minnesota, about 20 miles south of Minneapolis. It is situated on the south bank of the Minnesota River, and is bordered by the cities of Apple Valley, Eagan, and Farmington. The city covers an area of approximately 11.5 square miles, and has a population density of 1,890 people per square mile.
Economy
Rosemount is home to a variety of businesses, including manufacturing, retail, and service industries. The city is home to several large employers, including 3M, Andersen Windows, and the University of Minnesota. The city also has a thriving small business community, with many locally owned businesses.
Demographics
As of the 2010 census, the population of Rosemount was 21,874. The racial makeup of the city was 87.3% White, 5.2% African American, 0.7% Native American, 2.7% Asian, 0.1% Pacific Islander, 1.7% from other races, and 2.4% from two or more races. Hispanic or Latino of any race were 4.3% of the population.
The median income for a household in Rosemount was $76,845, and the median income for a family was $90,945. The per capita income for the city was $31,945. About 3.2% of families and 4.7% of the population were below the poverty line, including 5.3% of those under age 18 and 4.2% of those age 65 or over.
Rosemount is a rapidly growing city, with a population that has more than doubled since 2000. The city is home to a diverse population, with a variety of businesses and industries. Rosemount is a great place to live, work, and play, and is a great example of the growth and development of the Twin Cities metropolitan area.
Common Questions
What is Per Capita Income in Rosemount?
Per Capita income in Rosemount is $54,250.
What is the Median Family Income in Rosemount?
Median Family Income in Rosemount is $142,642.
What is the Median Household income in Rosemount?
Median Household Income in Rosemount is $127,252.
What is Income or Wage Gap in Rosemount?
Income or Wage Gap in Rosemount is 22.4%.
Women in Rosemount earn 77.6 cents for every dollar earned by a man.
What is Inequality or Gini Index in Rosemount?
Inequality or Gini Index in Rosemount is 0.38.
What is the Total Population of Rosemount?
Total Population of Rosemount is 25,993.
What is the Total Male Population of Rosemount?
Total Male Population of Rosemount is 13,180.
What is the Total Female Population of Rosemount?
Total Female Population of Rosemount is 12,813.
What is the Ratio of Males per 100 Females in Rosemount?
There are 102.86 Males per 100 Females in Rosemount.
What is the Ratio of Females per 100 Males in Rosemount?
There are 97.22 Females per 100 Males in Rosemount.
What is the Median Population Age in Rosemount?
Median Population Age in Rosemount is 37.8 Years.
What is the Average Family Size in Rosemount
Average Family Size in Rosemount is 3.1 People.
What is the Average Household Size in Rosemount
Average Household Size in Rosemount is 2.8 People.
How Large is the Labor Force in Rosemount?
There are 14,919 People in the Labor Forcein in Rosemount.
What is the Percentage of People in the Labor Force in Rosemount?
74.6% of People are in the Labor Force in Rosemount.
What is the Unemployment Rate in Rosemount?
Unemployment Rate in Rosemount is 3.1%.