Mahtomedi, MN Map & Demographics
Mahtomedi Map
Mahtomedi Overview
$66,253
PER CAPITA INCOME
$154,261
AVG FAMILY INCOME
$126,579
AVG HOUSEHOLD INCOME
39.6%
WAGE / INCOME GAP [ % ]
60.4¢/ $1
WAGE / INCOME GAP [ $ ]
0.49
INEQUALITY / GINI INDEX
8,073
TOTAL POPULATION
3,884
MALE POPULATION
4,189
FEMALE POPULATION
92.72
MALES / 100 FEMALES
107.85
FEMALES / 100 MALES
43.6
MEDIAN AGE
3.2
AVG FAMILY SIZE
2.7
AVG HOUSEHOLD SIZE
4,040
LABOR FORCE [ PEOPLE ]
63.0%
PERCENT IN LABOR FORCE
3.2%
UNEMPLOYMENT RATE
Mahtomedi Area Codes
Income in Mahtomedi
Income Overview in Mahtomedi
Per Capita Income in Mahtomedi is $66,253, while median incomes of families and households are $154,261 and $126,579 respectively.
| Characteristic | Number | Measure |
| Per Capita Income | 8,073 | $66,253 |
| Median Family Income | 2,229 | $154,261 |
| Mean Family Income | 2,229 | $211,766 |
| Median Household Income | 2,926 | $126,579 |
| Mean Household Income | 2,926 | $177,470 |
| Income Deficit | 2,229 | $0 |
| Wage / Income Gap (%) | 8,073 | 39.59% |
| Wage / Income Gap ($) | 8,073 | 60.41¢ per $1 |
| Gini / Inequality Index | 8,073 | 0.49 |
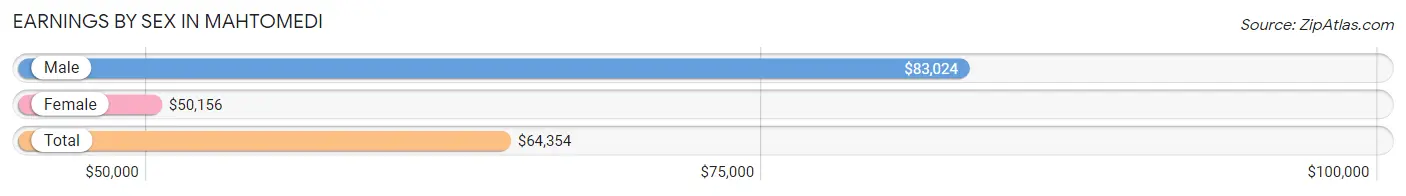
Earnings by Sex in Mahtomedi
Average Earnings in Mahtomedi are $64,354, $83,024 for men and $50,156 for women, a difference of 39.6%.
| Sex | Number | Average Earnings |
| Male | 2,289 (52.6%) | $83,024 |
| Female | 2,066 (47.4%) | $50,156 |
| Total | 4,355 (100.0%) | $64,354 |
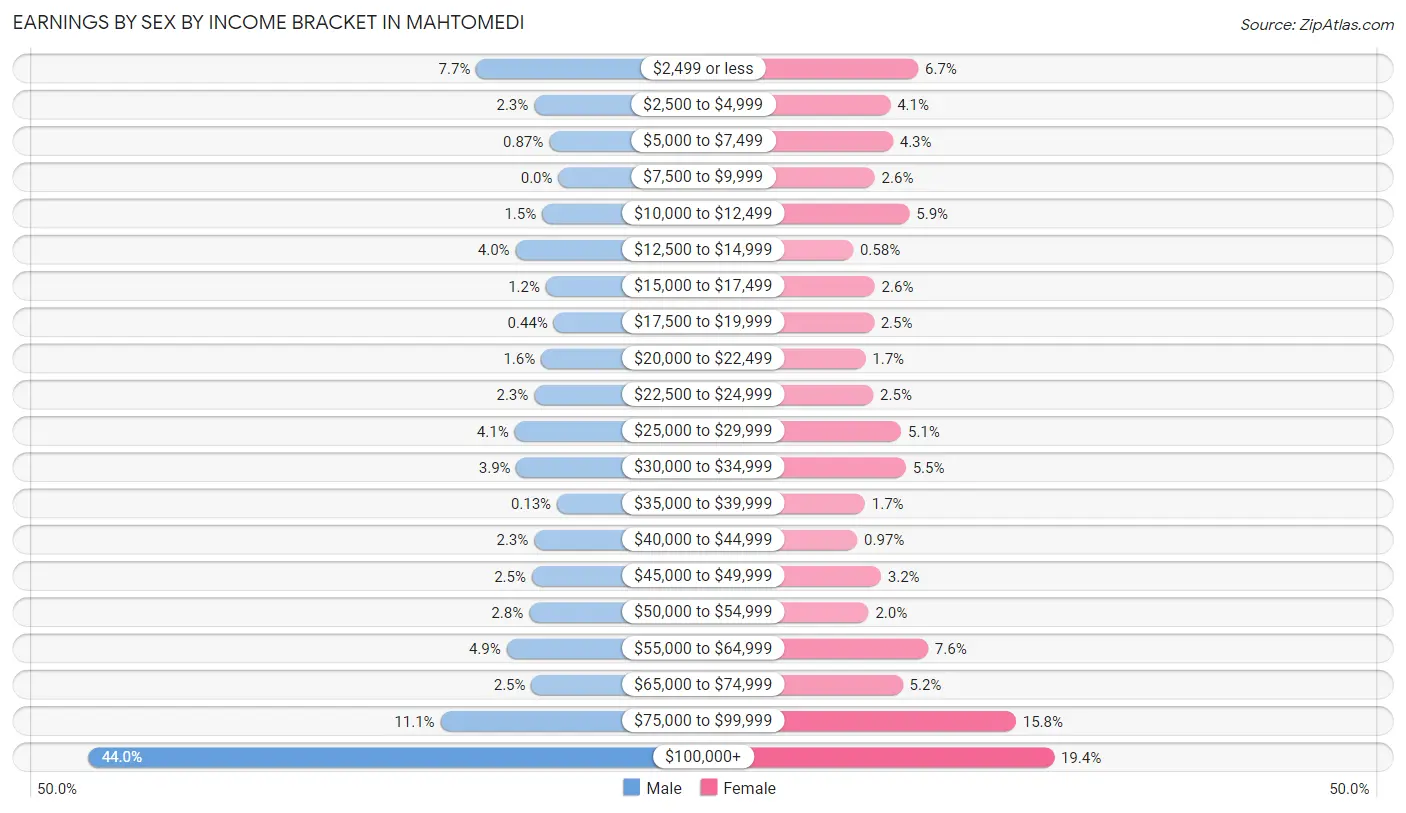
Earnings by Sex by Income Bracket in Mahtomedi
The most common earnings brackets in Mahtomedi are $100,000+ for men (1,007 | 44.0%) and $100,000+ for women (401 | 19.4%).
| Income | Male | Female |
| $2,499 or less | 176 (7.7%) | 138 (6.7%) |
| $2,500 to $4,999 | 52 (2.3%) | 84 (4.1%) |
| $5,000 to $7,499 | 20 (0.9%) | 89 (4.3%) |
| $7,500 to $9,999 | 0 (0.0%) | 54 (2.6%) |
| $10,000 to $12,499 | 35 (1.5%) | 121 (5.9%) |
| $12,500 to $14,999 | 92 (4.0%) | 12 (0.6%) |
| $15,000 to $17,499 | 27 (1.2%) | 54 (2.6%) |
| $17,500 to $19,999 | 10 (0.4%) | 52 (2.5%) |
| $20,000 to $22,499 | 37 (1.6%) | 36 (1.7%) |
| $22,500 to $24,999 | 52 (2.3%) | 51 (2.5%) |
| $25,000 to $29,999 | 94 (4.1%) | 105 (5.1%) |
| $30,000 to $34,999 | 90 (3.9%) | 114 (5.5%) |
| $35,000 to $39,999 | 3 (0.1%) | 35 (1.7%) |
| $40,000 to $44,999 | 52 (2.3%) | 20 (1.0%) |
| $45,000 to $49,999 | 57 (2.5%) | 66 (3.2%) |
| $50,000 to $54,999 | 63 (2.8%) | 42 (2.0%) |
| $55,000 to $64,999 | 111 (4.9%) | 157 (7.6%) |
| $65,000 to $74,999 | 58 (2.5%) | 108 (5.2%) |
| $75,000 to $99,999 | 253 (11.1%) | 327 (15.8%) |
| $100,000+ | 1,007 (44.0%) | 401 (19.4%) |
| Total | 2,289 (100.0%) | 2,066 (100.0%) |
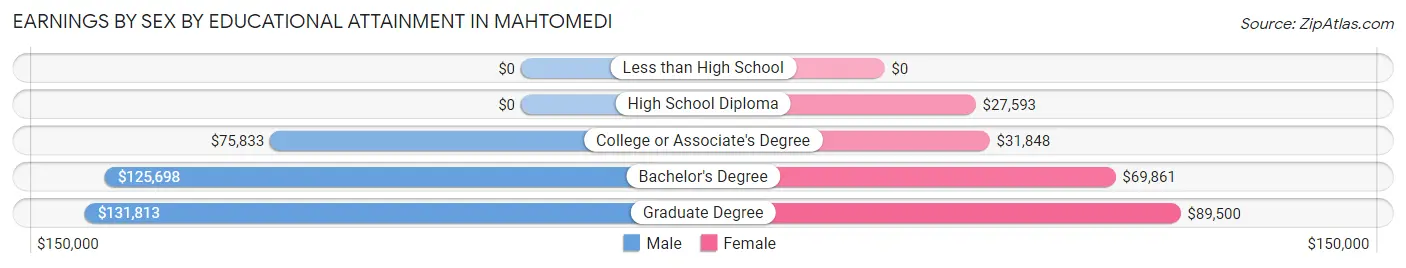
Earnings by Sex by Educational Attainment in Mahtomedi
Average earnings in Mahtomedi are $111,648 for men and $64,688 for women, a difference of 42.1%. Men with an educational attainment of graduate degree enjoy the highest average annual earnings of $131,813, while those with college or associate's degree education earn the least with $75,833. Women with an educational attainment of graduate degree earn the most with the average annual earnings of $89,500, while those with high school diploma education have the smallest earnings of $27,593.
| Educational Attainment | Male Income | Female Income |
| Less than High School | - | - |
| High School Diploma | - | - |
| College or Associate's Degree | $75,833 | $31,848 |
| Bachelor's Degree | $125,698 | $69,861 |
| Graduate Degree | $131,813 | $89,500 |
| Total | $111,648 | $64,688 |
Family Income in Mahtomedi
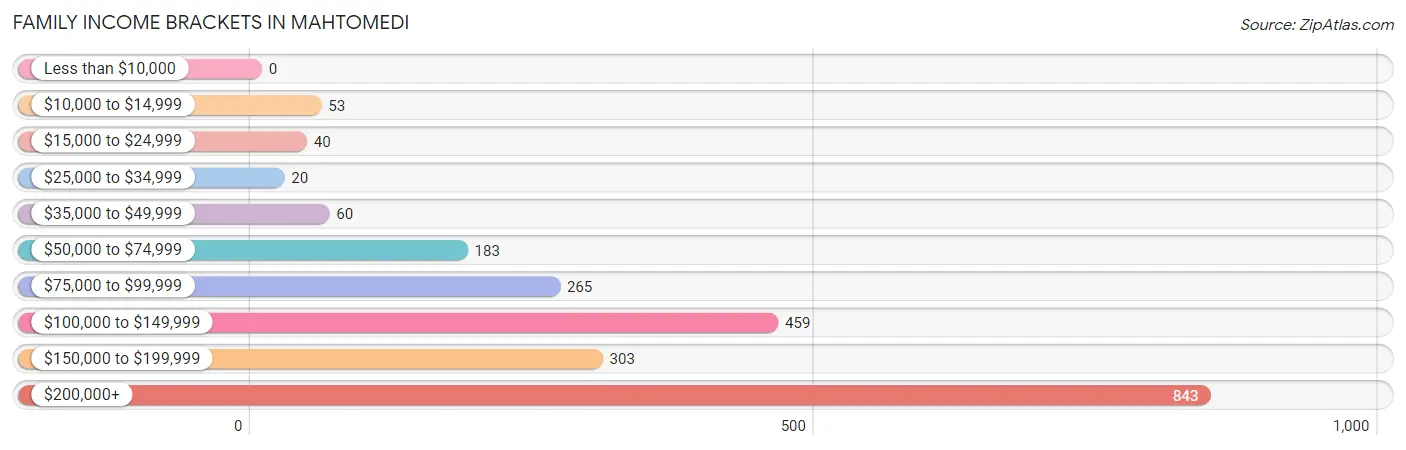
Family Income Brackets in Mahtomedi
According to the Mahtomedi family income data, there are 843 families falling into the $200,000+ income range, which is the most common income bracket and makes up 37.8% of all families.
| Income Bracket | # Families | % Families |
| Less than $10,000 | 0 | 0.0% |
| $10,000 to $14,999 | 53 | 2.4% |
| $15,000 to $24,999 | 40 | 1.8% |
| $25,000 to $34,999 | 20 | 0.9% |
| $35,000 to $49,999 | 60 | 2.7% |
| $50,000 to $74,999 | 183 | 8.2% |
| $75,000 to $99,999 | 265 | 11.9% |
| $100,000 to $149,999 | 459 | 20.6% |
| $150,000 to $199,999 | 303 | 13.6% |
| $200,000+ | 843 | 37.8% |
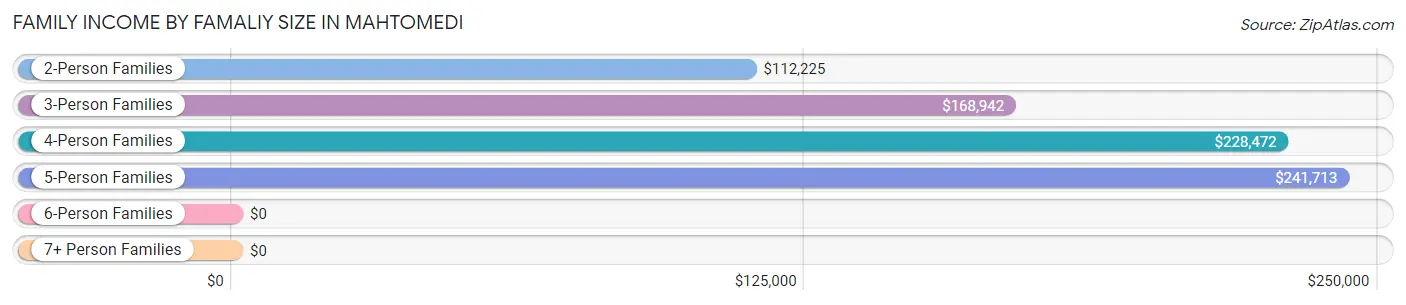
Family Income by Famaliy Size in Mahtomedi
5-person families (258 | 11.6%) account for the highest median family income in Mahtomedi with $241,713 per family, while 4-person families (463 | 20.8%) have the highest median income of $57,118 per family member.
| Income Bracket | # Families | Median Income |
| 2-Person Families | 1,019 (45.7%) | $112,225 |
| 3-Person Families | 411 (18.4%) | $168,942 |
| 4-Person Families | 463 (20.8%) | $228,472 |
| 5-Person Families | 258 (11.6%) | $241,713 |
| 6-Person Families | 78 (3.5%) | $0 |
| 7+ Person Families | 0 (0.0%) | $0 |
| Total | 2,229 (100.0%) | $154,261 |
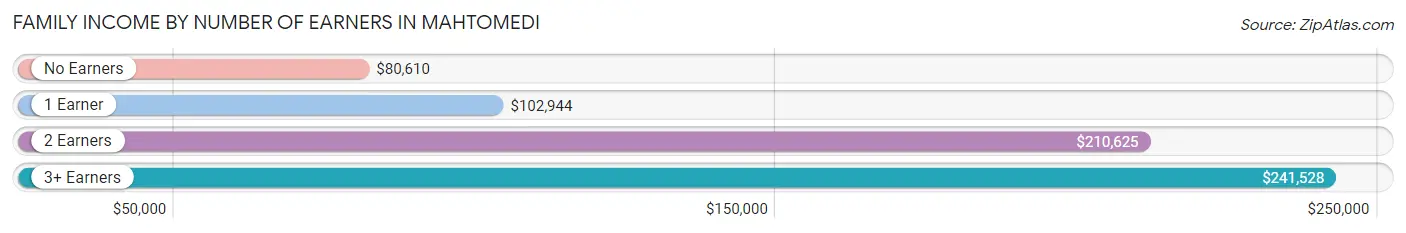
Family Income by Number of Earners in Mahtomedi
The median family income in Mahtomedi is $154,261, with families comprising 3+ earners (392) having the highest median family income of $241,528, while families with no earners (343) have the lowest median family income of $80,610, accounting for 17.6% and 15.4% of families, respectively.
| Number of Earners | # Families | Median Income |
| No Earners | 343 (15.4%) | $80,610 |
| 1 Earner | 577 (25.9%) | $102,944 |
| 2 Earners | 917 (41.1%) | $210,625 |
| 3+ Earners | 392 (17.6%) | $241,528 |
| Total | 2,229 (100.0%) | $154,261 |
Household Income in Mahtomedi
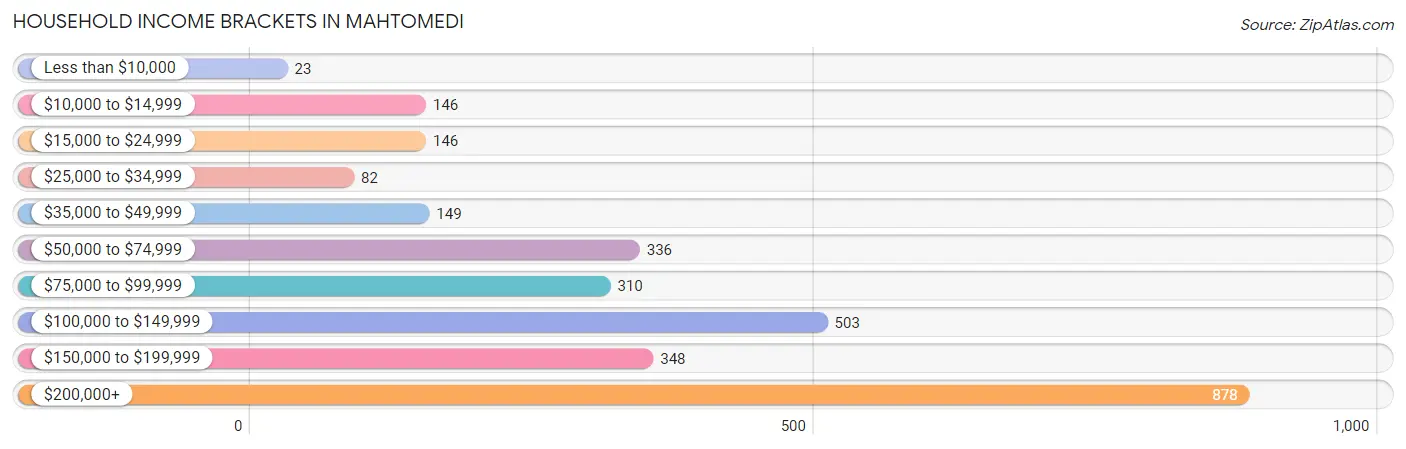
Household Income Brackets in Mahtomedi
With 878 households falling in the category, the $200,000+ income range is the most frequent in Mahtomedi, accounting for 30.0% of all households. In contrast, only 23 households (0.8%) fall into the less than $10,000 income bracket, making it the least populous group.
| Income Bracket | # Households | % Households |
| Less than $10,000 | 23 | 0.8% |
| $10,000 to $14,999 | 146 | 5.0% |
| $15,000 to $24,999 | 146 | 5.0% |
| $25,000 to $34,999 | 82 | 2.8% |
| $35,000 to $49,999 | 149 | 5.1% |
| $50,000 to $74,999 | 336 | 11.5% |
| $75,000 to $99,999 | 310 | 10.6% |
| $100,000 to $149,999 | 503 | 17.2% |
| $150,000 to $199,999 | 348 | 11.9% |
| $200,000+ | 878 | 30.0% |
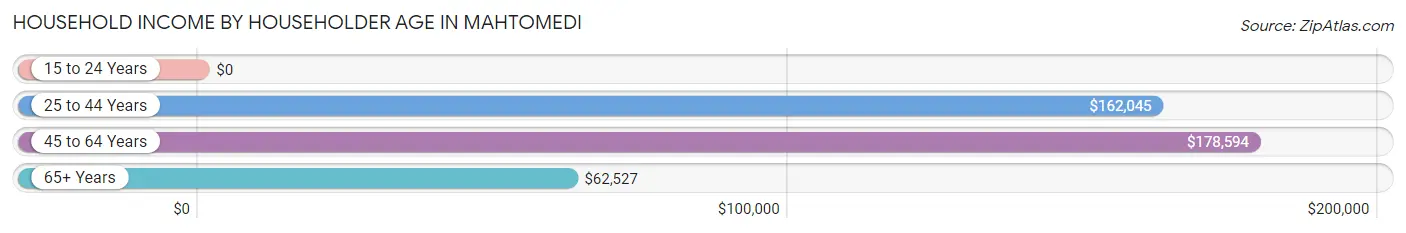
Household Income by Householder Age in Mahtomedi
The median household income in Mahtomedi is $126,579, with the highest median household income of $178,594 found in the 45 to 64 years age bracket for the primary householder. A total of 1,197 households (40.9%) fall into this category.
| Income Bracket | # Households | Median Income |
| 15 to 24 Years | 0 (0.0%) | $0 |
| 25 to 44 Years | 640 (21.9%) | $162,045 |
| 45 to 64 Years | 1,197 (40.9%) | $178,594 |
| 65+ Years | 1,089 (37.2%) | $62,527 |
| Total | 2,926 (100.0%) | $126,579 |
Poverty in Mahtomedi
Income Below Poverty by Sex and Age in Mahtomedi
With 4.9% poverty level for males and 4.2% for females among the residents of Mahtomedi, 25 to 34 year old males and 75 year old and over females are the most vulnerable to poverty, with 80 males (21.4%) and 66 females (14.5%) in their respective age groups living below the poverty level.
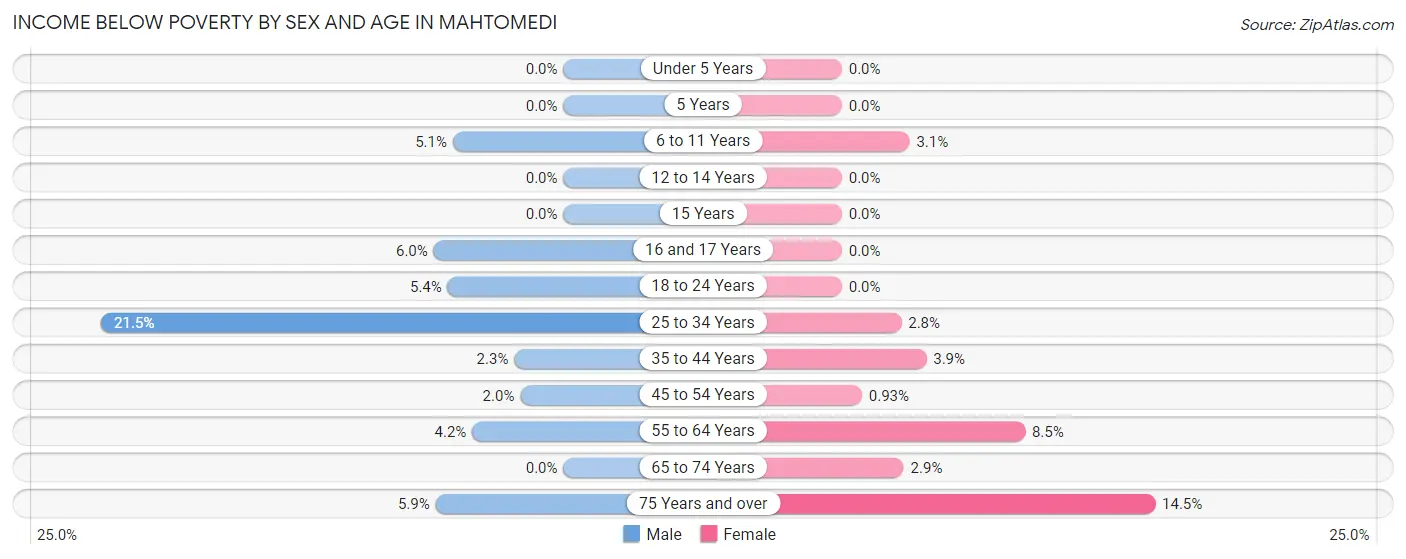
| Age Bracket | Male | Female |
| Under 5 Years | 0 (0.0%) | 0 (0.0%) |
| 5 Years | 0 (0.0%) | 0 (0.0%) |
| 6 to 11 Years | 20 (5.1%) | 10 (3.1%) |
| 12 to 14 Years | 0 (0.0%) | 0 (0.0%) |
| 15 Years | 0 (0.0%) | 0 (0.0%) |
| 16 and 17 Years | 10 (6.0%) | 0 (0.0%) |
| 18 to 24 Years | 18 (5.4%) | 0 (0.0%) |
| 25 to 34 Years | 80 (21.4%) | 11 (2.8%) |
| 35 to 44 Years | 10 (2.3%) | 14 (3.9%) |
| 45 to 54 Years | 8 (2.0%) | 5 (0.9%) |
| 55 to 64 Years | 29 (4.2%) | 54 (8.5%) |
| 65 to 74 Years | 0 (0.0%) | 16 (2.9%) |
| 75 Years and over | 15 (5.9%) | 66 (14.5%) |
| Total | 190 (4.9%) | 176 (4.2%) |
Income Above Poverty by Sex and Age in Mahtomedi
According to the poverty statistics in Mahtomedi, males aged under 5 years and females aged under 5 years are the age groups that are most secure financially, with 100.0% of males and 100.0% of females in these age groups living above the poverty line.
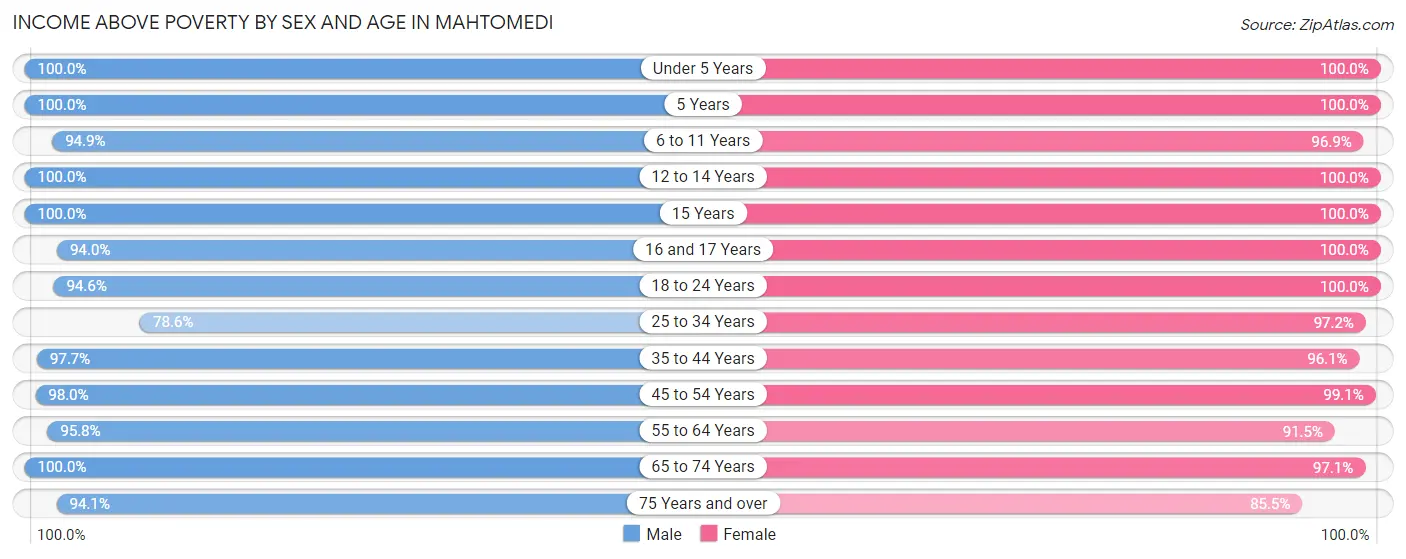
| Age Bracket | Male | Female |
| Under 5 Years | 319 (100.0%) | 256 (100.0%) |
| 5 Years | 11 (100.0%) | 46 (100.0%) |
| 6 to 11 Years | 370 (94.9%) | 308 (96.9%) |
| 12 to 14 Years | 124 (100.0%) | 102 (100.0%) |
| 15 Years | 35 (100.0%) | 60 (100.0%) |
| 16 and 17 Years | 156 (94.0%) | 81 (100.0%) |
| 18 to 24 Years | 317 (94.6%) | 359 (100.0%) |
| 25 to 34 Years | 293 (78.5%) | 388 (97.2%) |
| 35 to 44 Years | 429 (97.7%) | 343 (96.1%) |
| 45 to 54 Years | 392 (98.0%) | 535 (99.1%) |
| 55 to 64 Years | 656 (95.8%) | 581 (91.5%) |
| 65 to 74 Years | 354 (100.0%) | 541 (97.1%) |
| 75 Years and over | 238 (94.1%) | 388 (85.5%) |
| Total | 3,694 (95.1%) | 3,988 (95.8%) |
Income Below Poverty Among Married-Couple Families in Mahtomedi
The poverty statistics for married-couple families in Mahtomedi show that 0.5% or 9 of the total 1,874 families live below the poverty line. Families with 3 or 4 children have the highest poverty rate of 3.7%, comprising of 9 families. On the other hand, families with no children have the lowest poverty rate of 0.0%, which includes 0 families.
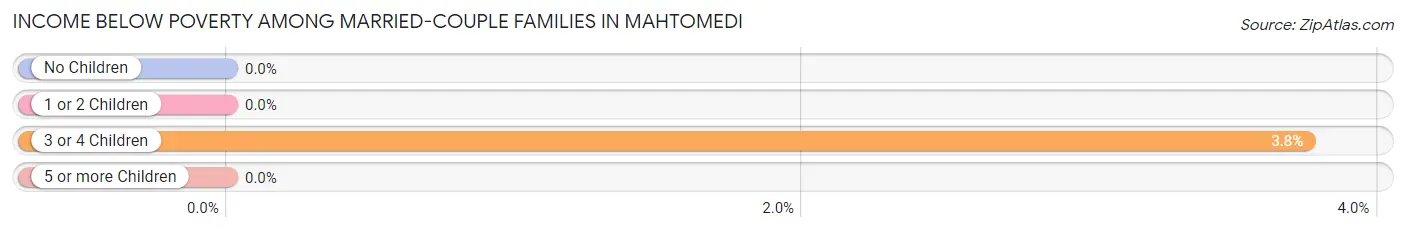
| Children | Above Poverty | Below Poverty |
| No Children | 1,080 (100.0%) | 0 (0.0%) |
| 1 or 2 Children | 554 (100.0%) | 0 (0.0%) |
| 3 or 4 Children | 231 (96.3%) | 9 (3.7%) |
| 5 or more Children | 0 (0.0%) | 0 (0.0%) |
| Total | 1,865 (99.5%) | 9 (0.5%) |
Income Below Poverty Among Single-Parent Households in Mahtomedi
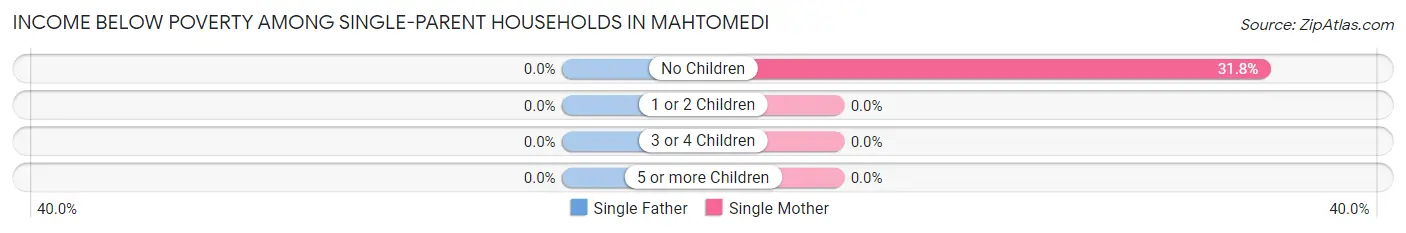
| Children | Single Father | Single Mother |
| No Children | 0 (0.0%) | 54 (31.8%) |
| 1 or 2 Children | 0 (0.0%) | 0 (0.0%) |
| 3 or 4 Children | 0 (0.0%) | 0 (0.0%) |
| 5 or more Children | 0 (0.0%) | 0 (0.0%) |
| Total | 0 (0.0%) | 54 (26.1%) |
Income Below Poverty Among Married-Couple vs Single-Parent Households in Mahtomedi
The poverty data for Mahtomedi shows that 9 of the married-couple family households (0.5%) and 54 of the single-parent households (15.2%) are living below the poverty level. Within the married-couple family households, those with 3 or 4 children have the highest poverty rate, with 9 households (3.7%) falling below the poverty line. Among the single-parent households, those with no children have the highest poverty rate, with 54 household (24.8%) living below poverty.
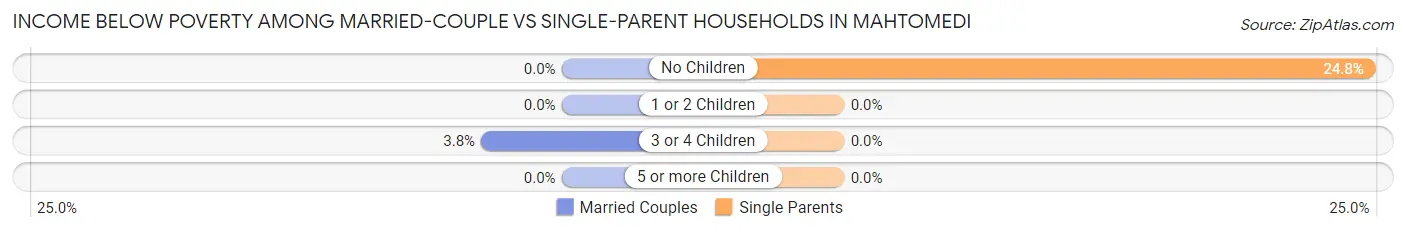
| Children | Married-Couple Families | Single-Parent Households |
| No Children | 0 (0.0%) | 54 (24.8%) |
| 1 or 2 Children | 0 (0.0%) | 0 (0.0%) |
| 3 or 4 Children | 9 (3.7%) | 0 (0.0%) |
| 5 or more Children | 0 (0.0%) | 0 (0.0%) |
| Total | 9 (0.5%) | 54 (15.2%) |
Race in Mahtomedi
The most populous races in Mahtomedi are White / Caucasian (7,486 | 92.7%), Black / African American (232 | 2.9%), and Two or more Races (206 | 2.5%).
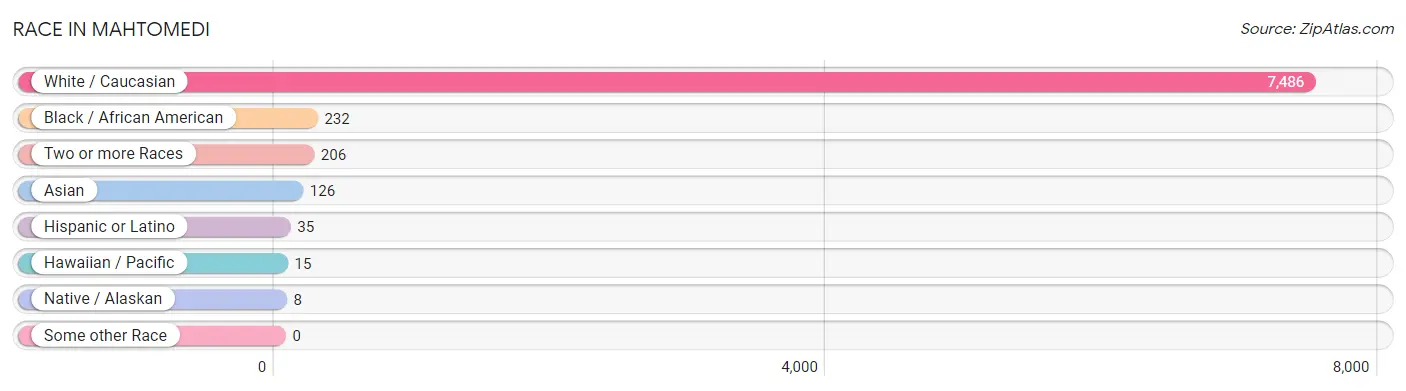
| Race | # Population | % Population |
| Asian | 126 | 1.6% |
| Black / African American | 232 | 2.9% |
| Hawaiian / Pacific | 15 | 0.2% |
| Hispanic or Latino | 35 | 0.4% |
| Native / Alaskan | 8 | 0.1% |
| White / Caucasian | 7,486 | 92.7% |
| Two or more Races | 206 | 2.5% |
| Some other Race | 0 | 0.0% |
| Total | 8,073 | 100.0% |
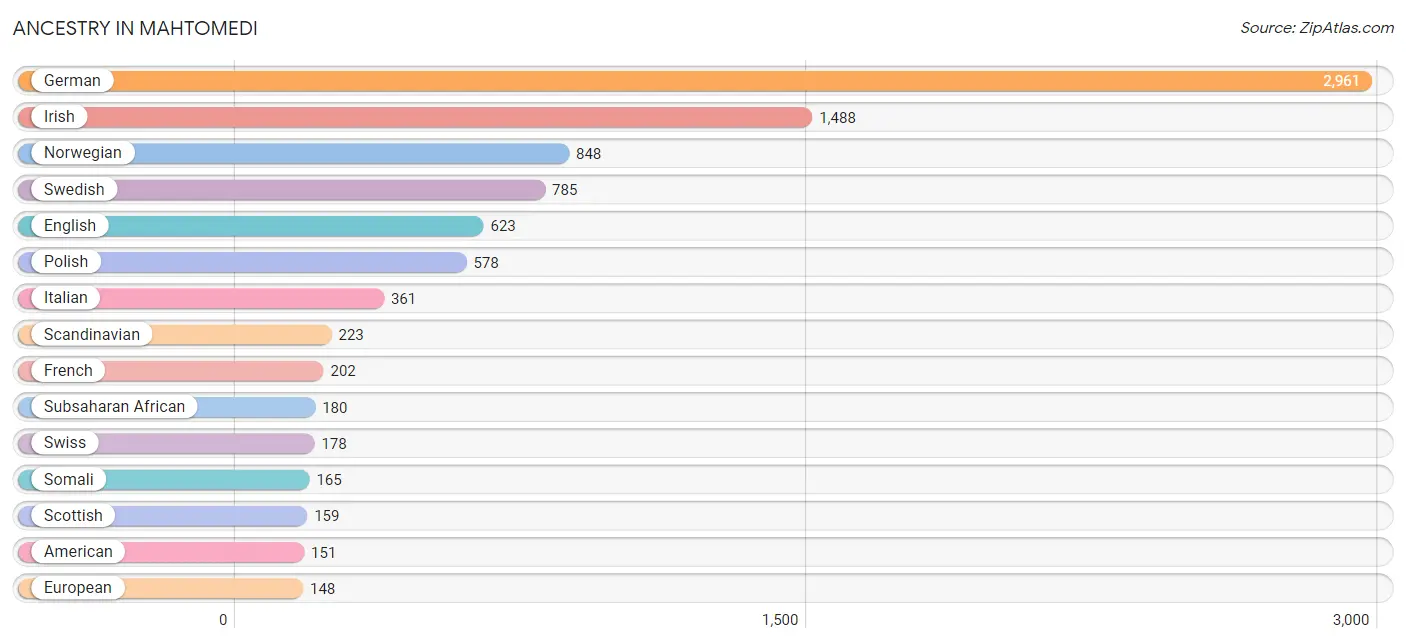
Ancestry in Mahtomedi
The most populous ancestries reported in Mahtomedi are German (2,961 | 36.7%), Irish (1,488 | 18.4%), Norwegian (848 | 10.5%), Swedish (785 | 9.7%), and English (623 | 7.7%), together accounting for 83.1% of all Mahtomedi residents.
| Ancestry | # Population | % Population |
| American | 151 | 1.9% |
| Arab | 13 | 0.2% |
| Austrian | 55 | 0.7% |
| Bangladeshi | 19 | 0.2% |
| British | 67 | 0.8% |
| Chippewa | 10 | 0.1% |
| Croatian | 26 | 0.3% |
| Czech | 134 | 1.7% |
| Czechoslovakian | 10 | 0.1% |
| Danish | 84 | 1.0% |
| Dutch | 120 | 1.5% |
| Eastern European | 108 | 1.3% |
| Egyptian | 13 | 0.2% |
| English | 623 | 7.7% |
| European | 148 | 1.8% |
| Finnish | 44 | 0.5% |
| French | 202 | 2.5% |
| French Canadian | 88 | 1.1% |
| German | 2,961 | 36.7% |
| Greek | 21 | 0.3% |
| Hungarian | 16 | 0.2% |
| Indian (Asian) | 124 | 1.5% |
| Irish | 1,488 | 18.4% |
| Italian | 361 | 4.5% |
| Korean | 20 | 0.3% |
| Luxembourger | 12 | 0.2% |
| Native Hawaiian | 15 | 0.2% |
| Nigerian | 15 | 0.2% |
| Northern European | 37 | 0.5% |
| Norwegian | 848 | 10.5% |
| Okinawan | 44 | 0.5% |
| Paraguayan | 10 | 0.1% |
| Polish | 578 | 7.2% |
| Russian | 22 | 0.3% |
| Scandinavian | 223 | 2.8% |
| Scottish | 159 | 2.0% |
| Serbian | 36 | 0.4% |
| Sioux | 15 | 0.2% |
| Slavic | 4 | 0.1% |
| Slovak | 9 | 0.1% |
| Slovene | 30 | 0.4% |
| Somali | 165 | 2.0% |
| South American | 10 | 0.1% |
| Spaniard | 10 | 0.1% |
| Subsaharan African | 180 | 2.2% |
| Swedish | 785 | 9.7% |
| Swiss | 178 | 2.2% |
| Thai | 16 | 0.2% |
| Ukrainian | 14 | 0.2% |
| Welsh | 116 | 1.4% | View All 50 Rows |
Immigrants in Mahtomedi
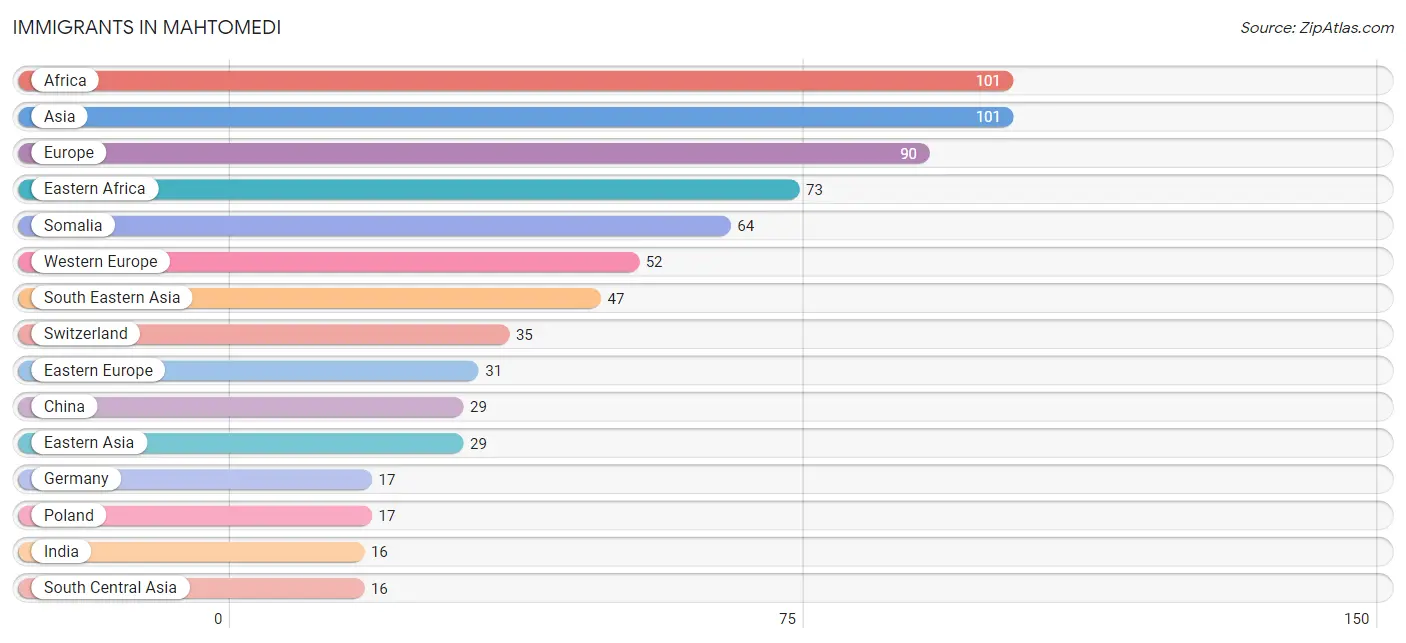
The most numerous immigrant groups reported in Mahtomedi came from Africa (101 | 1.3%), Asia (101 | 1.3%), Europe (90 | 1.1%), Eastern Africa (73 | 0.9%), and Somalia (64 | 0.8%), together accounting for 5.3% of all Mahtomedi residents.
| Immigration Origin | # Population | % Population |
| Africa | 101 | 1.3% |
| Asia | 101 | 1.3% |
| Canada | 5 | 0.1% |
| China | 29 | 0.4% |
| Eastern Africa | 73 | 0.9% |
| Eastern Asia | 29 | 0.4% |
| Eastern Europe | 31 | 0.4% |
| Egypt | 13 | 0.2% |
| Ethiopia | 9 | 0.1% |
| Europe | 90 | 1.1% |
| Germany | 17 | 0.2% |
| India | 16 | 0.2% |
| Latin America | 10 | 0.1% |
| Lebanon | 9 | 0.1% |
| Malaysia | 7 | 0.1% |
| Northern Africa | 13 | 0.2% |
| Northern Europe | 7 | 0.1% |
| Philippines | 7 | 0.1% |
| Poland | 17 | 0.2% |
| Russia | 14 | 0.2% |
| Singapore | 12 | 0.2% |
| Somalia | 64 | 0.8% |
| South America | 10 | 0.1% |
| South Central Asia | 16 | 0.2% |
| South Eastern Asia | 47 | 0.6% |
| Sweden | 7 | 0.1% |
| Switzerland | 35 | 0.4% |
| Western Asia | 9 | 0.1% |
| Western Europe | 52 | 0.6% | View All 29 Rows |
Sex and Age in Mahtomedi
Sex and Age in Mahtomedi
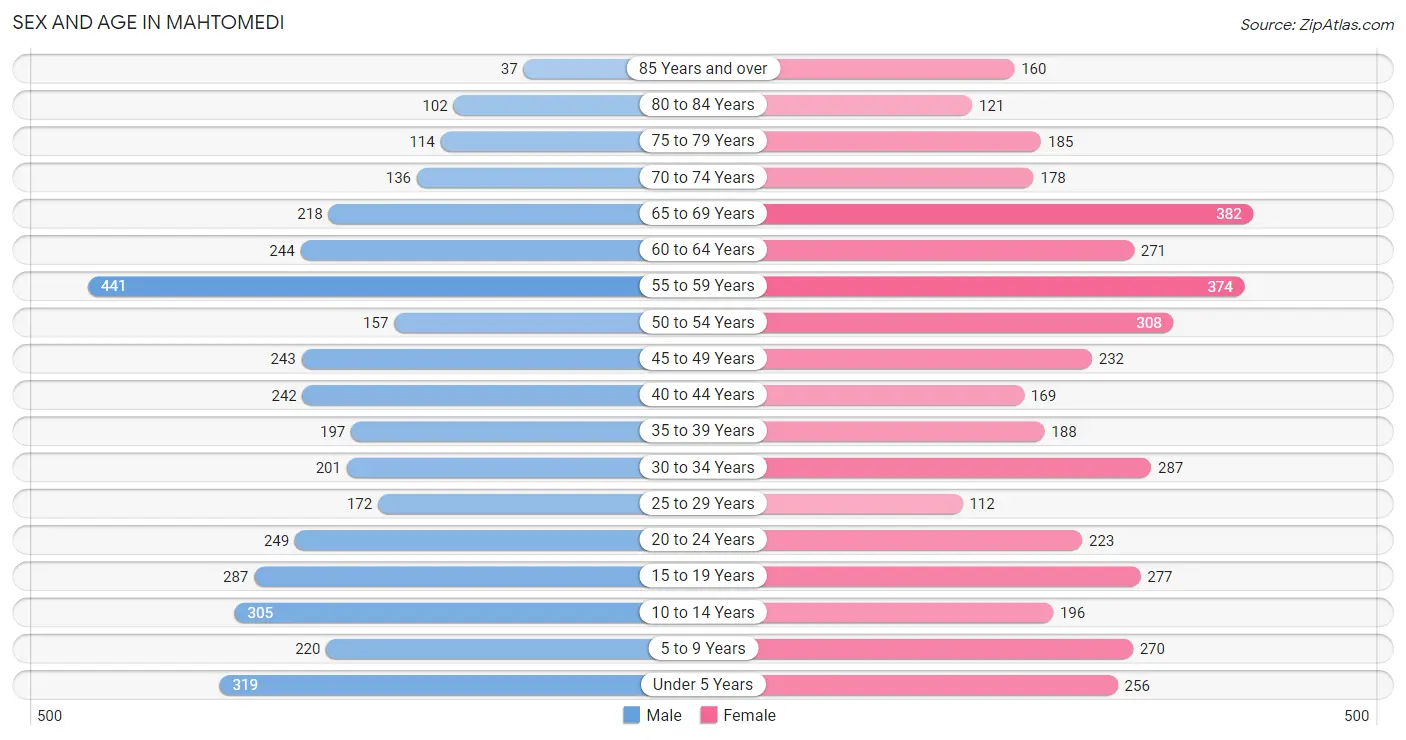
The most populous age groups in Mahtomedi are 55 to 59 Years (441 | 11.4%) for men and 65 to 69 Years (382 | 9.1%) for women.
| Age Bracket | Male | Female |
| Under 5 Years | 319 (8.2%) | 256 (6.1%) |
| 5 to 9 Years | 220 (5.7%) | 270 (6.5%) |
| 10 to 14 Years | 305 (7.9%) | 196 (4.7%) |
| 15 to 19 Years | 287 (7.4%) | 277 (6.6%) |
| 20 to 24 Years | 249 (6.4%) | 223 (5.3%) |
| 25 to 29 Years | 172 (4.4%) | 112 (2.7%) |
| 30 to 34 Years | 201 (5.2%) | 287 (6.9%) |
| 35 to 39 Years | 197 (5.1%) | 188 (4.5%) |
| 40 to 44 Years | 242 (6.2%) | 169 (4.0%) |
| 45 to 49 Years | 243 (6.3%) | 232 (5.5%) |
| 50 to 54 Years | 157 (4.0%) | 308 (7.3%) |
| 55 to 59 Years | 441 (11.4%) | 374 (8.9%) |
| 60 to 64 Years | 244 (6.3%) | 271 (6.5%) |
| 65 to 69 Years | 218 (5.6%) | 382 (9.1%) |
| 70 to 74 Years | 136 (3.5%) | 178 (4.3%) |
| 75 to 79 Years | 114 (2.9%) | 185 (4.4%) |
| 80 to 84 Years | 102 (2.6%) | 121 (2.9%) |
| 85 Years and over | 37 (0.9%) | 160 (3.8%) |
| Total | 3,884 (100.0%) | 4,189 (100.0%) |
Families and Households in Mahtomedi
Median Family Size in Mahtomedi
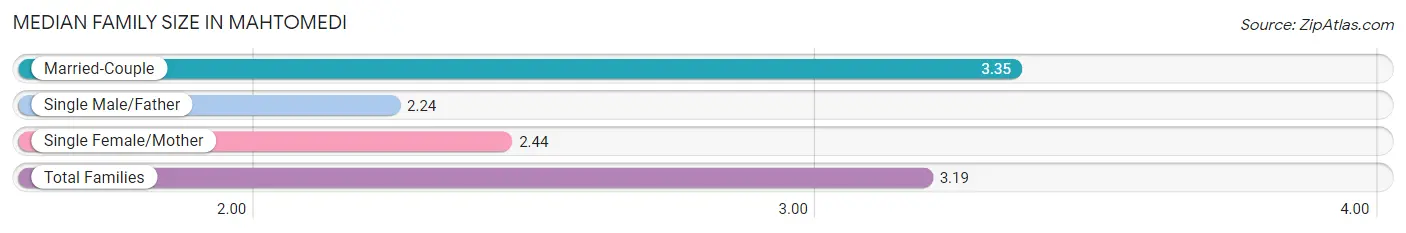
The median family size in Mahtomedi is 3.19 persons per family, with married-couple families (1,874 | 84.1%) accounting for the largest median family size of 3.35 persons per family. On the other hand, single male/father families (148 | 6.6%) represent the smallest median family size with 2.24 persons per family.
| Family Type | # Families | Family Size |
| Married-Couple | 1,874 (84.1%) | 3.35 |
| Single Male/Father | 148 (6.6%) | 2.24 |
| Single Female/Mother | 207 (9.3%) | 2.44 |
| Total Families | 2,229 (100.0%) | 3.19 |
Median Household Size in Mahtomedi
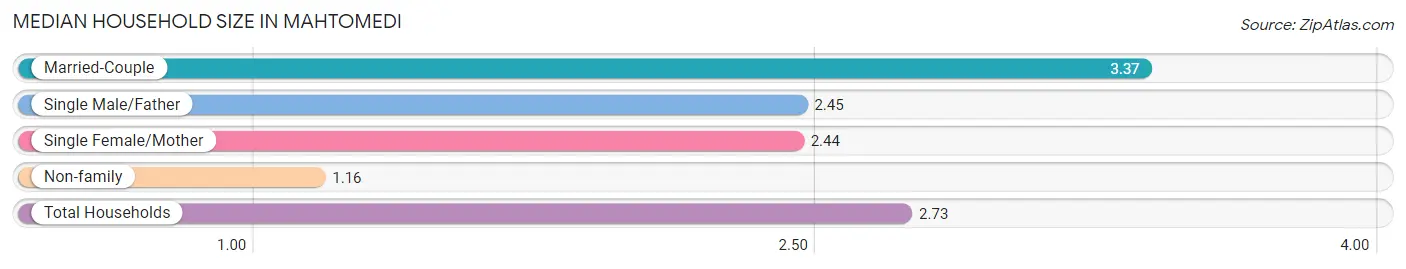
The median household size in Mahtomedi is 2.73 persons per household, with married-couple households (1,874 | 64.0%) accounting for the largest median household size of 3.37 persons per household. non-family households (697 | 23.8%) represent the smallest median household size with 1.16 persons per household.
| Household Type | # Households | Household Size |
| Married-Couple | 1,874 (64.0%) | 3.37 |
| Single Male/Father | 148 (5.1%) | 2.45 |
| Single Female/Mother | 207 (7.1%) | 2.44 |
| Non-family | 697 (23.8%) | 1.16 |
| Total Households | 2,926 (100.0%) | 2.73 |
Household Size by Marriage Status in Mahtomedi
Out of a total of 2,926 households in Mahtomedi, 2,229 (76.2%) are family households, while 697 (23.8%) are nonfamily households. The most numerous type of family households are 2-person households, comprising 1,008, and the most common type of nonfamily households are 1-person households, comprising 620.
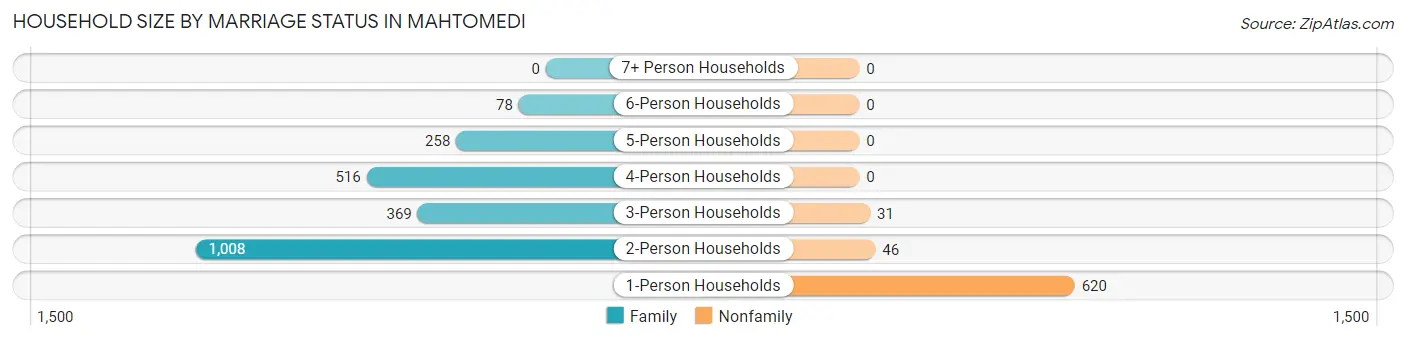
| Household Size | Family Households | Nonfamily Households |
| 1-Person Households | - | 620 (21.2%) |
| 2-Person Households | 1,008 (34.4%) | 46 (1.6%) |
| 3-Person Households | 369 (12.6%) | 31 (1.1%) |
| 4-Person Households | 516 (17.6%) | 0 (0.0%) |
| 5-Person Households | 258 (8.8%) | 0 (0.0%) |
| 6-Person Households | 78 (2.7%) | 0 (0.0%) |
| 7+ Person Households | 0 (0.0%) | 0 (0.0%) |
| Total | 2,229 (76.2%) | 697 (23.8%) |
Female Fertility in Mahtomedi
Fertility by Age in Mahtomedi
Average fertility rate in Mahtomedi is 94.0 births per 1,000 women. Women in the age bracket of 20 to 34 years have the highest fertility rate with 159.0 births per 1,000 women. Women in the age bracket of 20 to 34 years acount for 66.4% of all women with births.
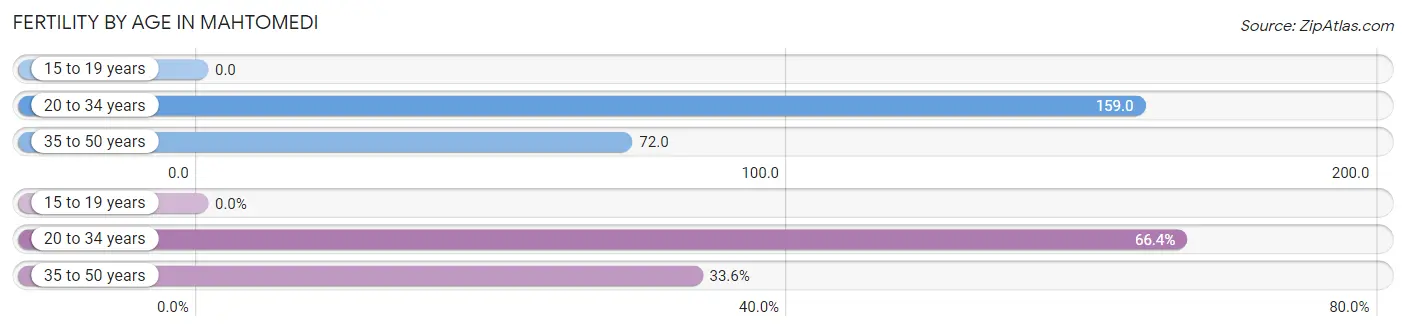
| Age Bracket | Women with Births | Births / 1,000 Women |
| 15 to 19 years | 0 (0.0%) | 0.0 |
| 20 to 34 years | 99 (66.4%) | 159.0 |
| 35 to 50 years | 50 (33.6%) | 72.0 |
| Total | 149 (100.0%) | 94.0 |
Fertility by Age by Marriage Status in Mahtomedi
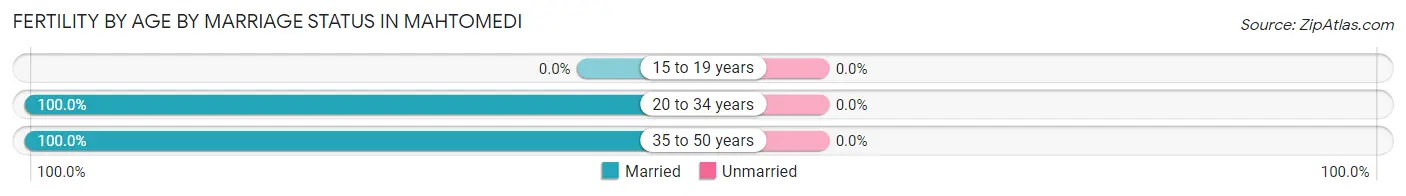
| Age Bracket | Married | Unmarried |
| 15 to 19 years | 0 (0.0%) | 0 (0.0%) |
| 20 to 34 years | 99 (100.0%) | 0 (0.0%) |
| 35 to 50 years | 50 (100.0%) | 0 (0.0%) |
| Total | 149 (100.0%) | 0 (0.0%) |
Fertility by Education in Mahtomedi
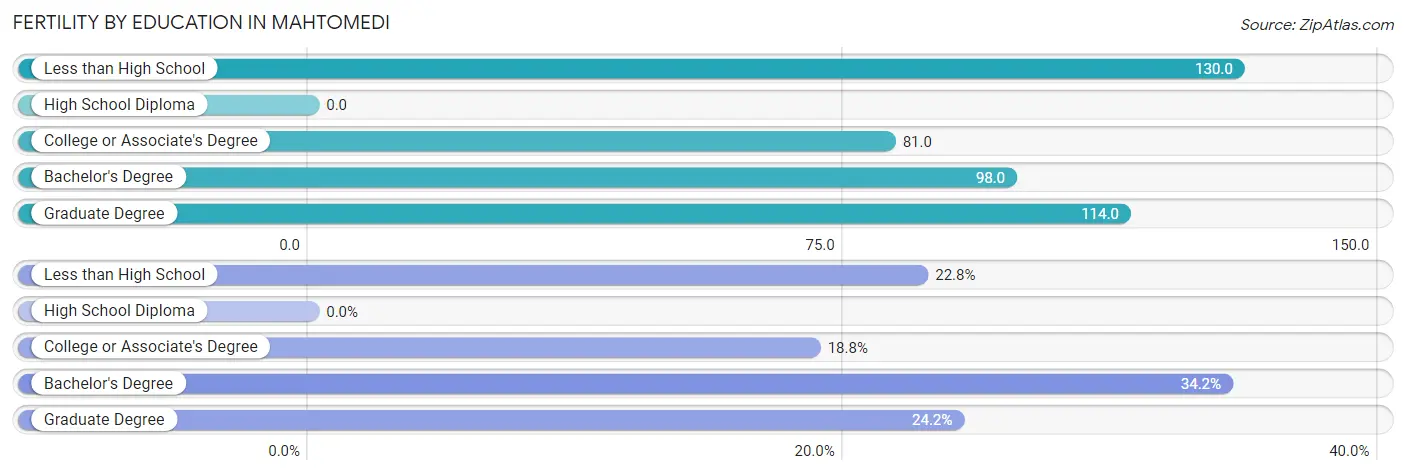
| Educational Attainment | Women with Births | Births / 1,000 Women |
| Less than High School | 34 (22.8%) | 130.0 |
| High School Diploma | 0 (0.0%) | 0.0 |
| College or Associate's Degree | 28 (18.8%) | 81.0 |
| Bachelor's Degree | 51 (34.2%) | 98.0 |
| Graduate Degree | 36 (24.2%) | 114.0 |
| Total | 149 (100.0%) | 94.0 |
Fertility by Education by Marriage Status in Mahtomedi
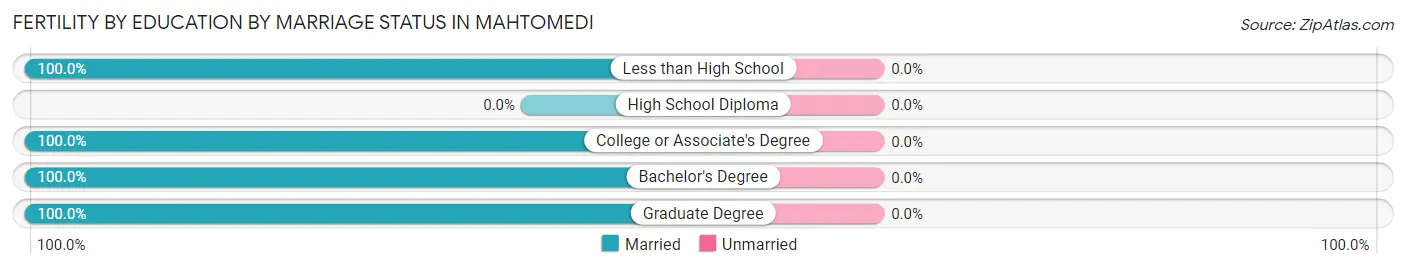
| Educational Attainment | Married | Unmarried |
| Less than High School | 34 (100.0%) | 0 (0.0%) |
| High School Diploma | 0 (0.0%) | 0 (0.0%) |
| College or Associate's Degree | 28 (100.0%) | 0 (0.0%) |
| Bachelor's Degree | 51 (100.0%) | 0 (0.0%) |
| Graduate Degree | 36 (100.0%) | 0 (0.0%) |
| Total | 149 (100.0%) | 0 (0.0%) |
Employment Characteristics in Mahtomedi
Employment by Class of Employer in Mahtomedi
Among the 3,786 employed individuals in Mahtomedi, private company employees (2,311 | 61.0%), local government employees (516 | 13.6%), and not-for-profit organizations (404 | 10.7%) make up the most common classes of employment.
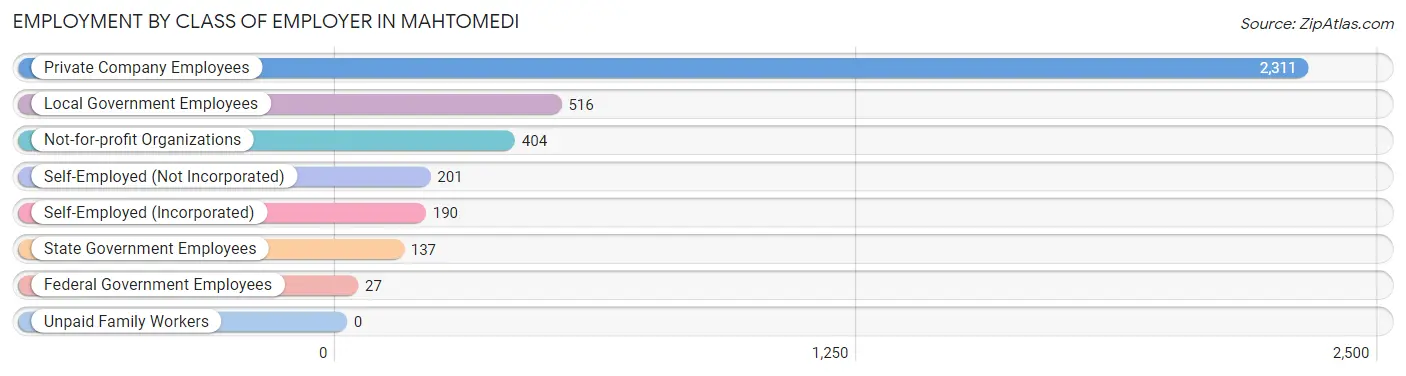
| Employer Class | # Employees | % Employees |
| Private Company Employees | 2,311 | 61.0% |
| Self-Employed (Incorporated) | 190 | 5.0% |
| Self-Employed (Not Incorporated) | 201 | 5.3% |
| Not-for-profit Organizations | 404 | 10.7% |
| Local Government Employees | 516 | 13.6% |
| State Government Employees | 137 | 3.6% |
| Federal Government Employees | 27 | 0.7% |
| Unpaid Family Workers | 0 | 0.0% |
| Total | 3,786 | 100.0% |
Employment Status by Age in Mahtomedi
According to the labor force statistics for Mahtomedi, out of the total population over 16 years of age (6,412), 63.0% or 4,040 individuals are in the labor force, with 3.2% or 129 of them unemployed. The age group with the highest labor force participation rate is 25 to 29 years, with 91.9% or 261 individuals in the labor force. Within the labor force, the 16 to 19 years age range has the highest percentage of unemployed individuals, with 16.9% or 34 of them being unemployed.
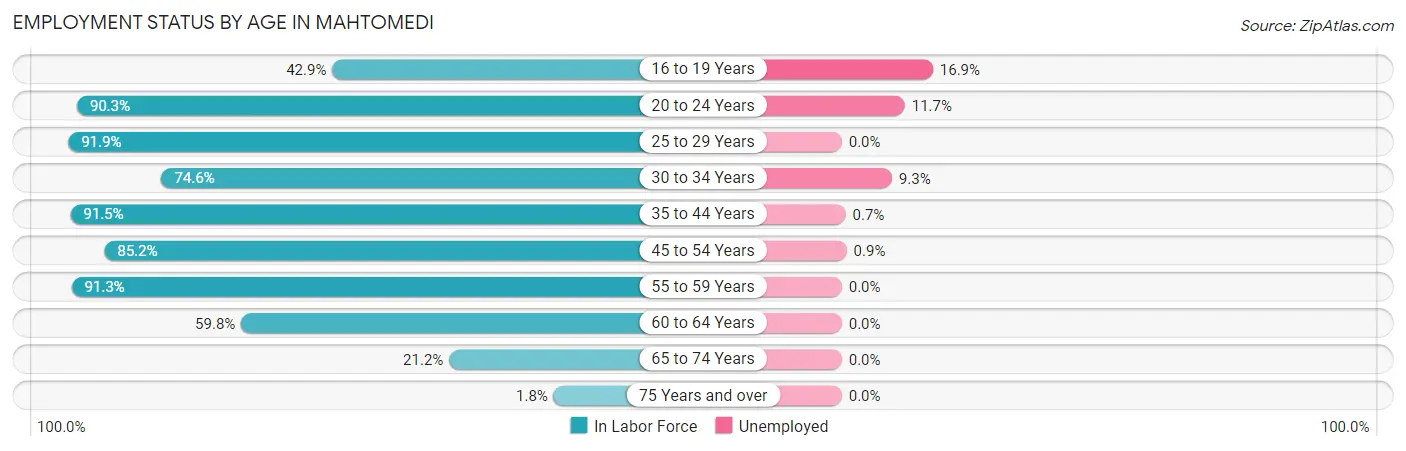
| Age Bracket | In Labor Force | Unemployed |
| 16 to 19 Years | 201 (42.9%) | 34 (16.9%) |
| 20 to 24 Years | 426 (90.3%) | 50 (11.7%) |
| 25 to 29 Years | 261 (91.9%) | 0 (0.0%) |
| 30 to 34 Years | 364 (74.6%) | 34 (9.3%) |
| 35 to 44 Years | 728 (91.5%) | 5 (0.7%) |
| 45 to 54 Years | 801 (85.2%) | 7 (0.9%) |
| 55 to 59 Years | 744 (91.3%) | 0 (0.0%) |
| 60 to 64 Years | 308 (59.8%) | 0 (0.0%) |
| 65 to 74 Years | 194 (21.2%) | 0 (0.0%) |
| 75 Years and over | 13 (1.8%) | 0 (0.0%) |
| Total | 4,040 (63.0%) | 129 (3.2%) |
Employment Status by Educational Attainment in Mahtomedi
According to labor force statistics for Mahtomedi, 83.5% of individuals (3,205) out of the total population between 25 and 64 years of age (3,838) are in the labor force, with 1.4% or 45 of them being unemployed. The group with the highest labor force participation rate are those with the educational attainment of bachelor's degree or higher, with 86.5% or 2,284 individuals in the labor force. Within the labor force, individuals with less than high school education have the highest percentage of unemployment, with 18.9% or 7 of them being unemployed.
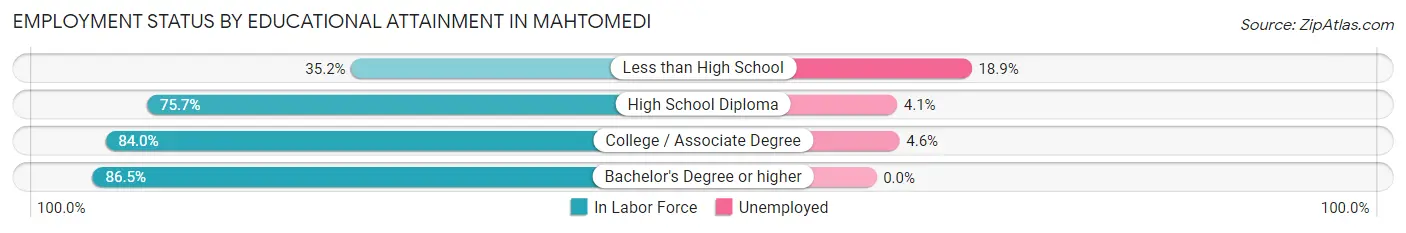
| Educational Attainment | In Labor Force | Unemployed |
| Less than High School | 37 (35.2%) | 20 (18.9%) |
| High School Diploma | 293 (75.7%) | 16 (4.1%) |
| College / Associate Degree | 592 (84.0%) | 32 (4.6%) |
| Bachelor's Degree or higher | 2,284 (86.5%) | 0 (0.0%) |
| Total | 3,205 (83.5%) | 54 (1.4%) |
Employment Occupations by Sex in Mahtomedi
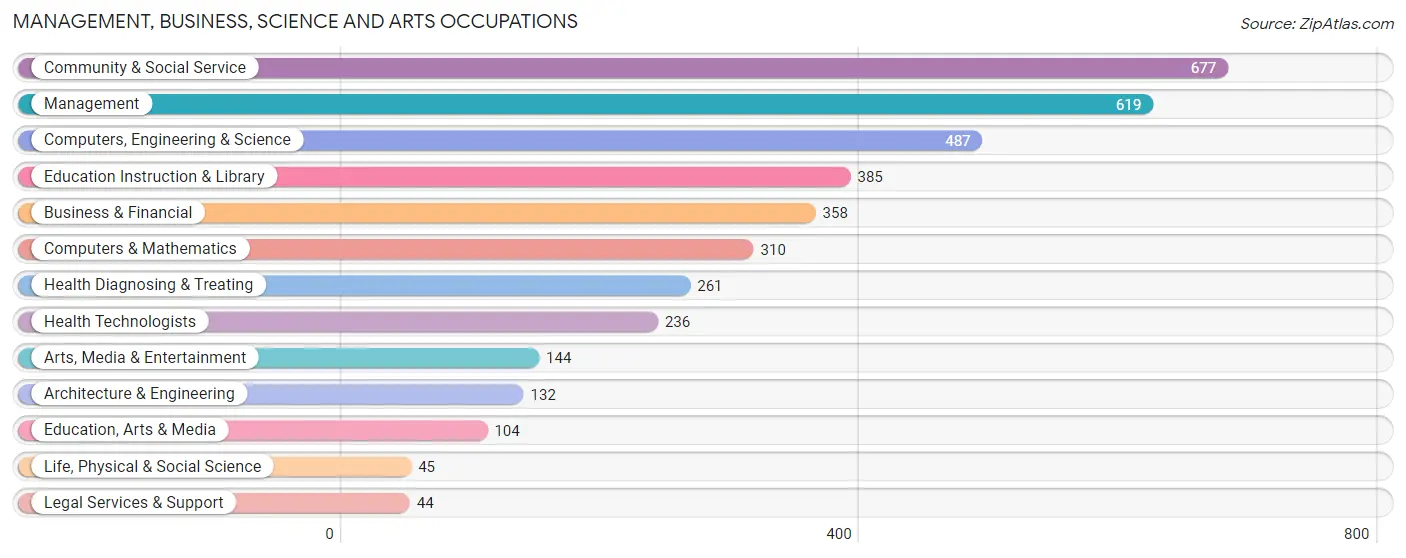
Management, Business, Science and Arts Occupations
The most common Management, Business, Science and Arts occupations in Mahtomedi are Community & Social Service (677 | 17.3%), Management (619 | 15.8%), Computers, Engineering & Science (487 | 12.5%), Education Instruction & Library (385 | 9.9%), and Business & Financial (358 | 9.2%).
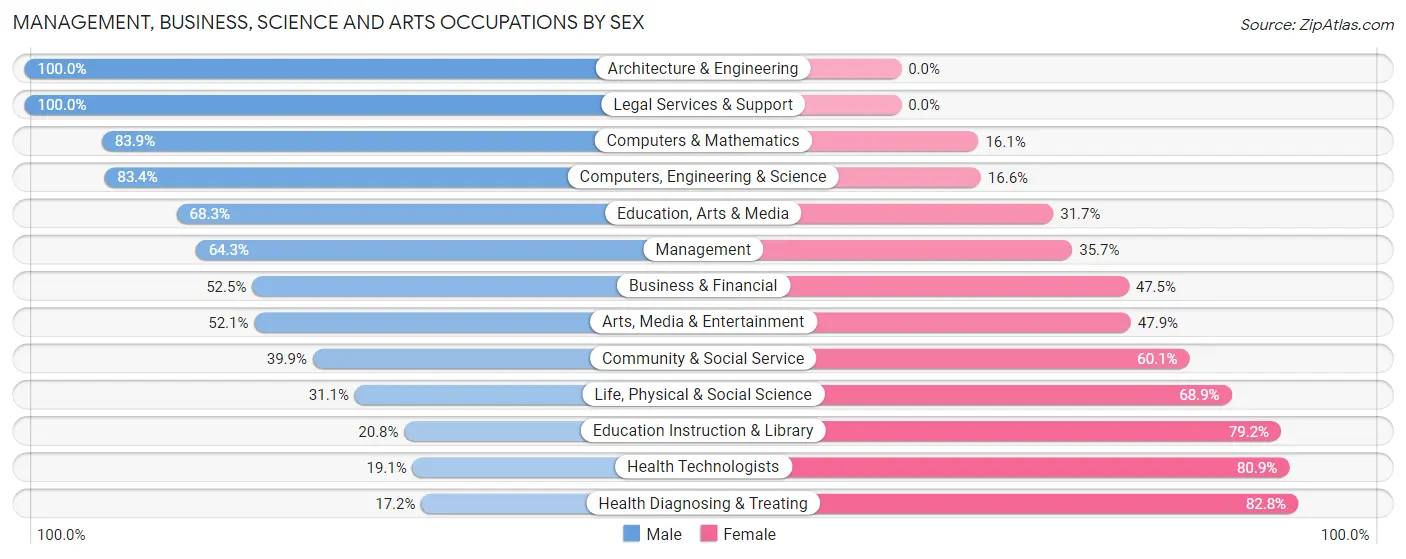
Management, Business, Science and Arts Occupations by Sex
Within the Management, Business, Science and Arts occupations in Mahtomedi, the most male-oriented occupations are Architecture & Engineering (100.0%), Legal Services & Support (100.0%), and Computers & Mathematics (83.9%), while the most female-oriented occupations are Health Diagnosing & Treating (82.8%), Health Technologists (80.9%), and Education Instruction & Library (79.2%).
| Occupation | Male | Female |
| Management | 398 (64.3%) | 221 (35.7%) |
| Business & Financial | 188 (52.5%) | 170 (47.5%) |
| Computers, Engineering & Science | 406 (83.4%) | 81 (16.6%) |
| Computers & Mathematics | 260 (83.9%) | 50 (16.1%) |
| Architecture & Engineering | 132 (100.0%) | 0 (0.0%) |
| Life, Physical & Social Science | 14 (31.1%) | 31 (68.9%) |
| Community & Social Service | 270 (39.9%) | 407 (60.1%) |
| Education, Arts & Media | 71 (68.3%) | 33 (31.7%) |
| Legal Services & Support | 44 (100.0%) | 0 (0.0%) |
| Education Instruction & Library | 80 (20.8%) | 305 (79.2%) |
| Arts, Media & Entertainment | 75 (52.1%) | 69 (47.9%) |
| Health Diagnosing & Treating | 45 (17.2%) | 216 (82.8%) |
| Health Technologists | 45 (19.1%) | 191 (80.9%) |
| Total (Category) | 1,307 (54.4%) | 1,095 (45.6%) |
| Total (Overall) | 2,100 (53.7%) | 1,810 (46.3%) |
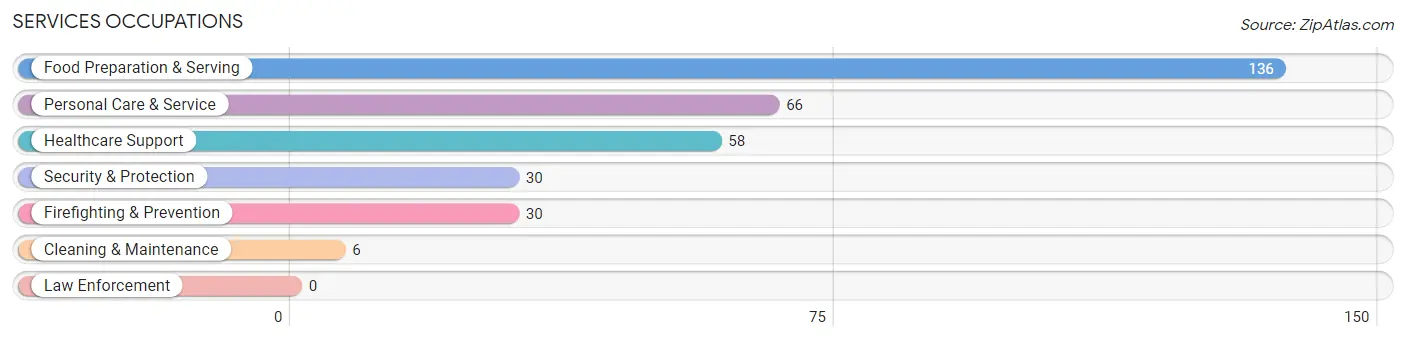
Services Occupations
The most common Services occupations in Mahtomedi are Food Preparation & Serving (136 | 3.5%), Personal Care & Service (66 | 1.7%), Healthcare Support (58 | 1.5%), Security & Protection (30 | 0.8%), and Firefighting & Prevention (30 | 0.8%).
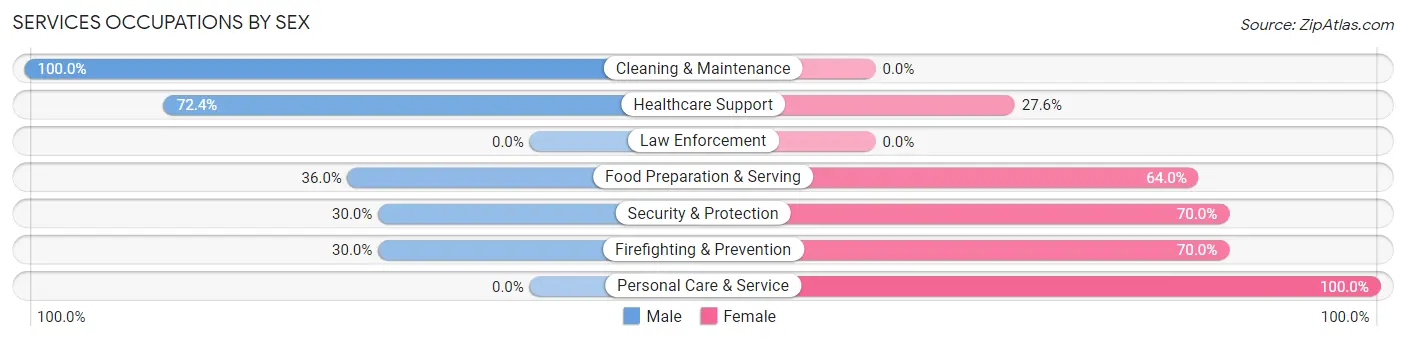
Services Occupations by Sex
Within the Services occupations in Mahtomedi, the most male-oriented occupations are Cleaning & Maintenance (100.0%), Healthcare Support (72.4%), and Food Preparation & Serving (36.0%), while the most female-oriented occupations are Personal Care & Service (100.0%), Security & Protection (70.0%), and Firefighting & Prevention (70.0%).
| Occupation | Male | Female |
| Healthcare Support | 42 (72.4%) | 16 (27.6%) |
| Security & Protection | 9 (30.0%) | 21 (70.0%) |
| Firefighting & Prevention | 9 (30.0%) | 21 (70.0%) |
| Law Enforcement | 0 (0.0%) | 0 (0.0%) |
| Food Preparation & Serving | 49 (36.0%) | 87 (64.0%) |
| Cleaning & Maintenance | 6 (100.0%) | 0 (0.0%) |
| Personal Care & Service | 0 (0.0%) | 66 (100.0%) |
| Total (Category) | 106 (35.8%) | 190 (64.2%) |
| Total (Overall) | 2,100 (53.7%) | 1,810 (46.3%) |
Sales and Office Occupations
The most common Sales and Office occupations in Mahtomedi are Office & Administration (493 | 12.6%), and Sales & Related (360 | 9.2%).
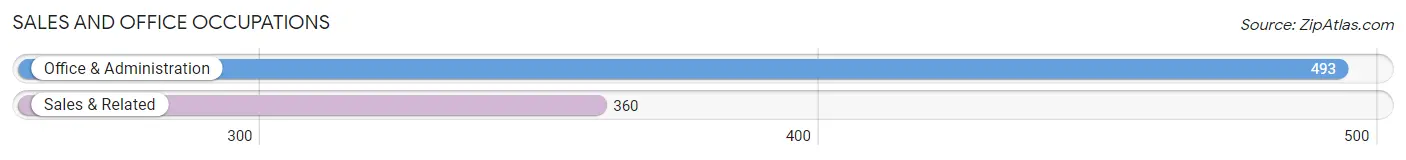
Sales and Office Occupations by Sex
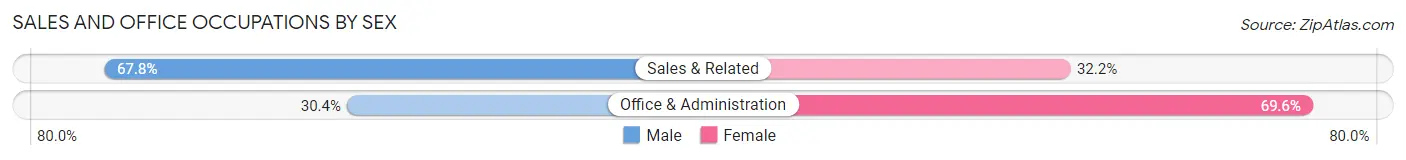
| Occupation | Male | Female |
| Sales & Related | 244 (67.8%) | 116 (32.2%) |
| Office & Administration | 150 (30.4%) | 343 (69.6%) |
| Total (Category) | 394 (46.2%) | 459 (53.8%) |
| Total (Overall) | 2,100 (53.7%) | 1,810 (46.3%) |
Natural Resources, Construction and Maintenance Occupations
The most common Natural Resources, Construction and Maintenance occupations in Mahtomedi are Construction & Extraction (78 | 2.0%), Installation, Maintenance & Repair (50 | 1.3%), and Farming, Fishing & Forestry (7 | 0.2%).
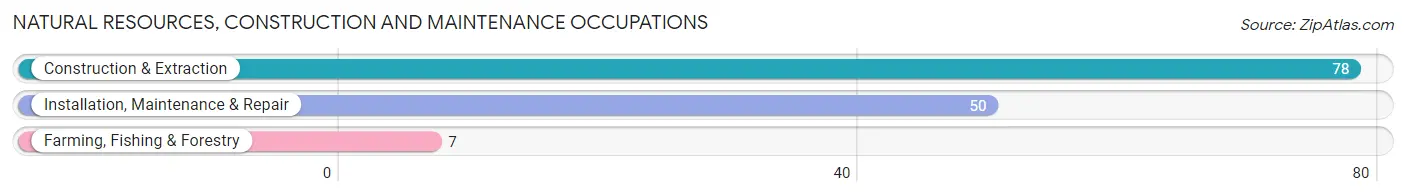
Natural Resources, Construction and Maintenance Occupations by Sex
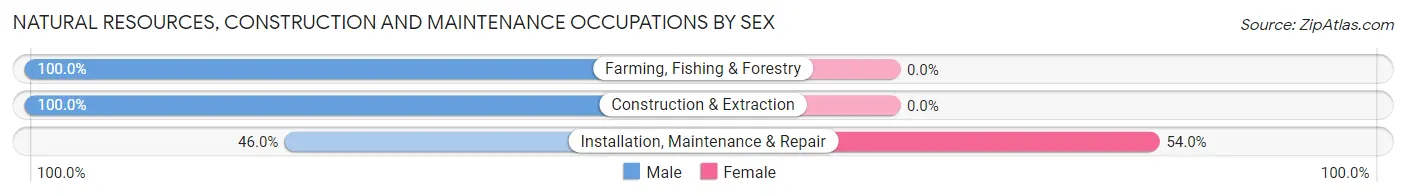
| Occupation | Male | Female |
| Farming, Fishing & Forestry | 7 (100.0%) | 0 (0.0%) |
| Construction & Extraction | 78 (100.0%) | 0 (0.0%) |
| Installation, Maintenance & Repair | 23 (46.0%) | 27 (54.0%) |
| Total (Category) | 108 (80.0%) | 27 (20.0%) |
| Total (Overall) | 2,100 (53.7%) | 1,810 (46.3%) |
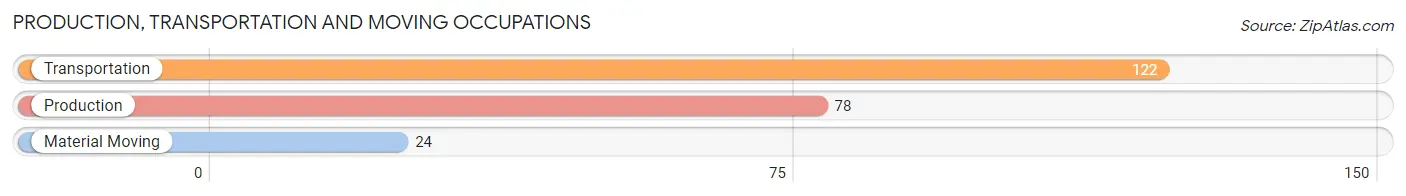
Production, Transportation and Moving Occupations
The most common Production, Transportation and Moving occupations in Mahtomedi are Transportation (122 | 3.1%), Production (78 | 2.0%), and Material Moving (24 | 0.6%).
Production, Transportation and Moving Occupations by Sex
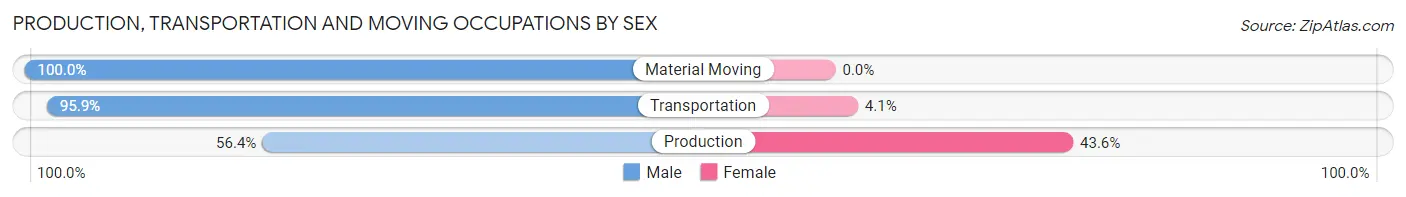
| Occupation | Male | Female |
| Production | 44 (56.4%) | 34 (43.6%) |
| Transportation | 117 (95.9%) | 5 (4.1%) |
| Material Moving | 24 (100.0%) | 0 (0.0%) |
| Total (Category) | 185 (82.6%) | 39 (17.4%) |
| Total (Overall) | 2,100 (53.7%) | 1,810 (46.3%) |
Employment Industries by Sex in Mahtomedi
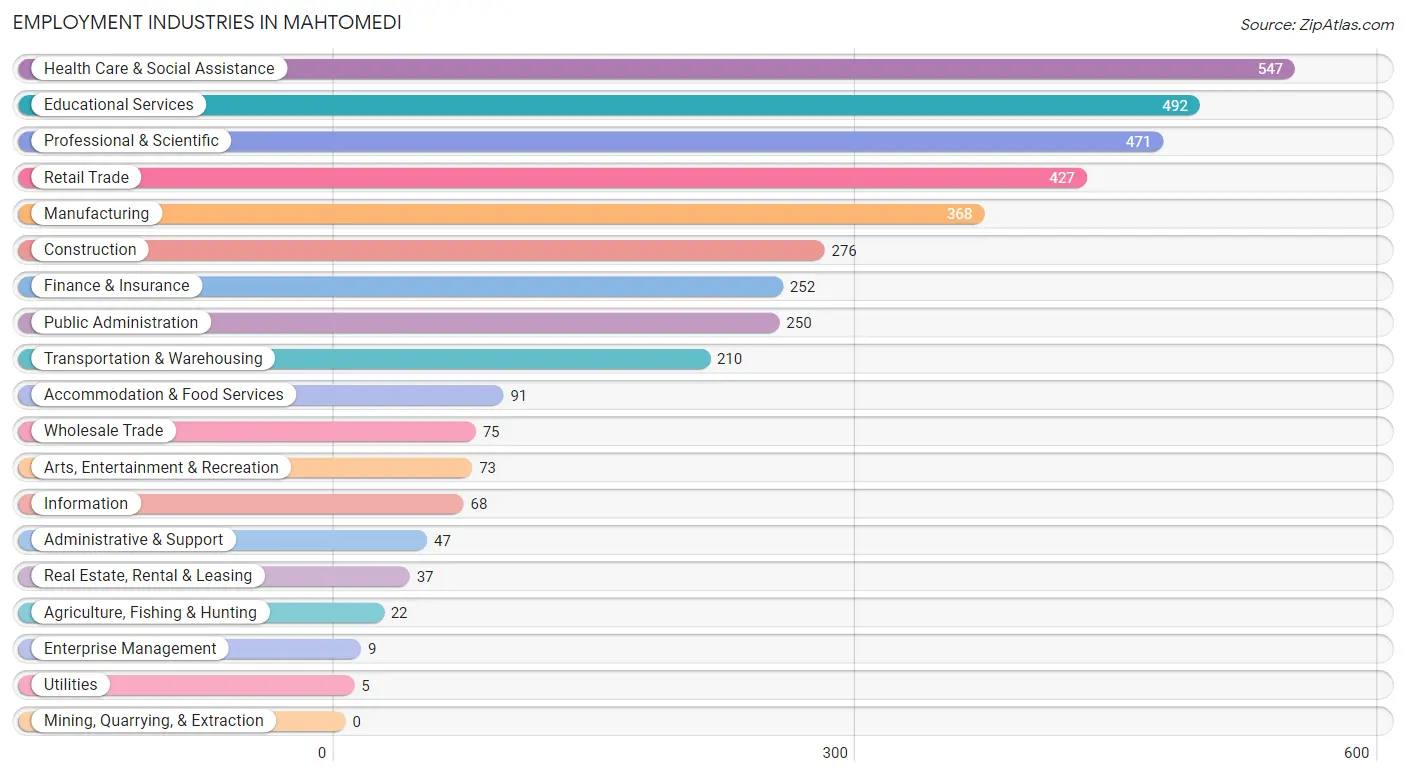
Employment Industries in Mahtomedi
The major employment industries in Mahtomedi include Health Care & Social Assistance (547 | 14.0%), Educational Services (492 | 12.6%), Professional & Scientific (471 | 12.0%), Retail Trade (427 | 10.9%), and Manufacturing (368 | 9.4%).
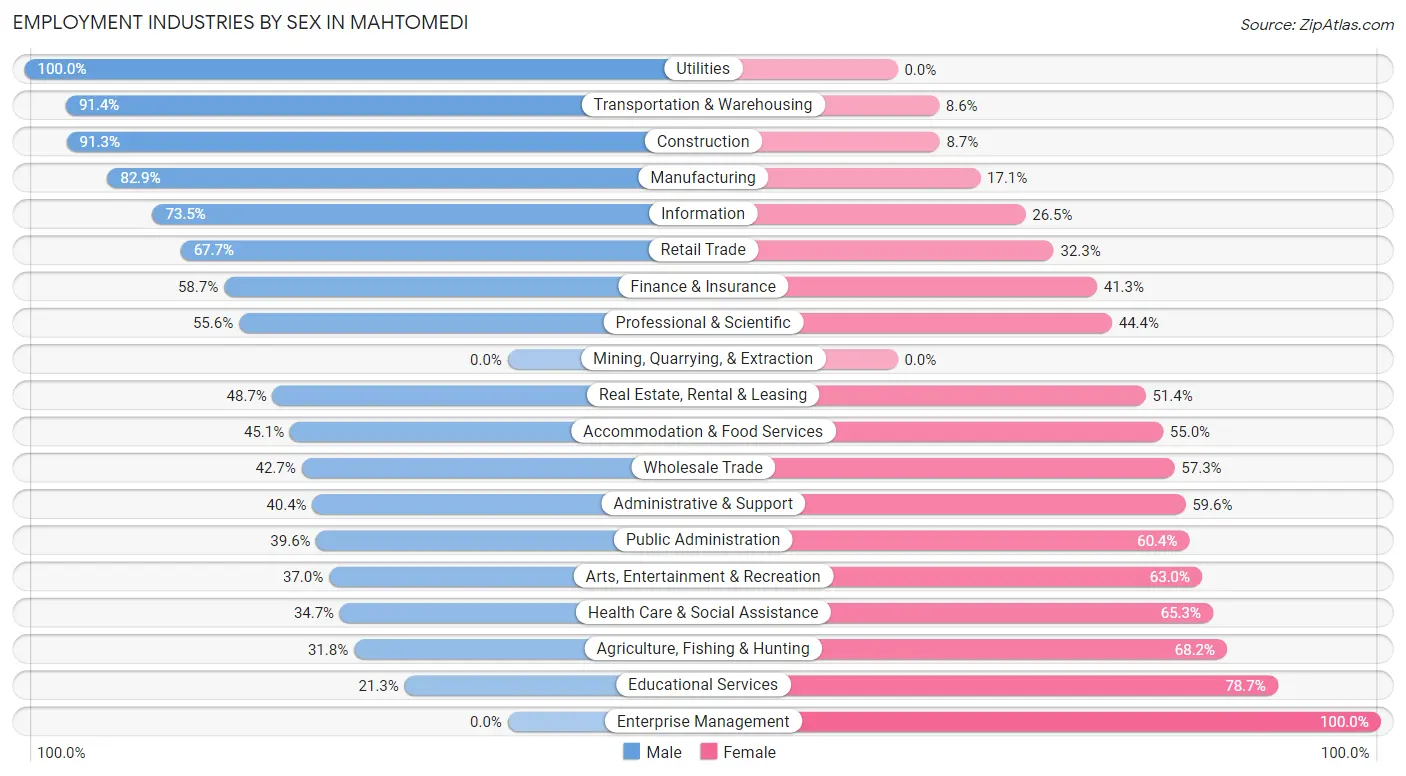
Employment Industries by Sex in Mahtomedi
The Mahtomedi industries that see more men than women are Utilities (100.0%), Transportation & Warehousing (91.4%), and Construction (91.3%), whereas the industries that tend to have a higher number of women are Enterprise Management (100.0%), Educational Services (78.7%), and Agriculture, Fishing & Hunting (68.2%).
| Industry | Male | Female |
| Agriculture, Fishing & Hunting | 7 (31.8%) | 15 (68.2%) |
| Mining, Quarrying, & Extraction | 0 (0.0%) | 0 (0.0%) |
| Construction | 252 (91.3%) | 24 (8.7%) |
| Manufacturing | 305 (82.9%) | 63 (17.1%) |
| Wholesale Trade | 32 (42.7%) | 43 (57.3%) |
| Retail Trade | 289 (67.7%) | 138 (32.3%) |
| Transportation & Warehousing | 192 (91.4%) | 18 (8.6%) |
| Utilities | 5 (100.0%) | 0 (0.0%) |
| Information | 50 (73.5%) | 18 (26.5%) |
| Finance & Insurance | 148 (58.7%) | 104 (41.3%) |
| Real Estate, Rental & Leasing | 18 (48.6%) | 19 (51.3%) |
| Professional & Scientific | 262 (55.6%) | 209 (44.4%) |
| Enterprise Management | 0 (0.0%) | 9 (100.0%) |
| Administrative & Support | 19 (40.4%) | 28 (59.6%) |
| Educational Services | 105 (21.3%) | 387 (78.7%) |
| Health Care & Social Assistance | 190 (34.7%) | 357 (65.3%) |
| Arts, Entertainment & Recreation | 27 (37.0%) | 46 (63.0%) |
| Accommodation & Food Services | 41 (45.1%) | 50 (54.9%) |
| Public Administration | 99 (39.6%) | 151 (60.4%) |
| Total | 2,100 (53.7%) | 1,810 (46.3%) |
Education in Mahtomedi
School Enrollment in Mahtomedi
The most common levels of schooling among the 1,840 students in Mahtomedi are elementary school (487 | 26.5%), high school (426 | 23.2%), and middle school (408 | 22.2%).
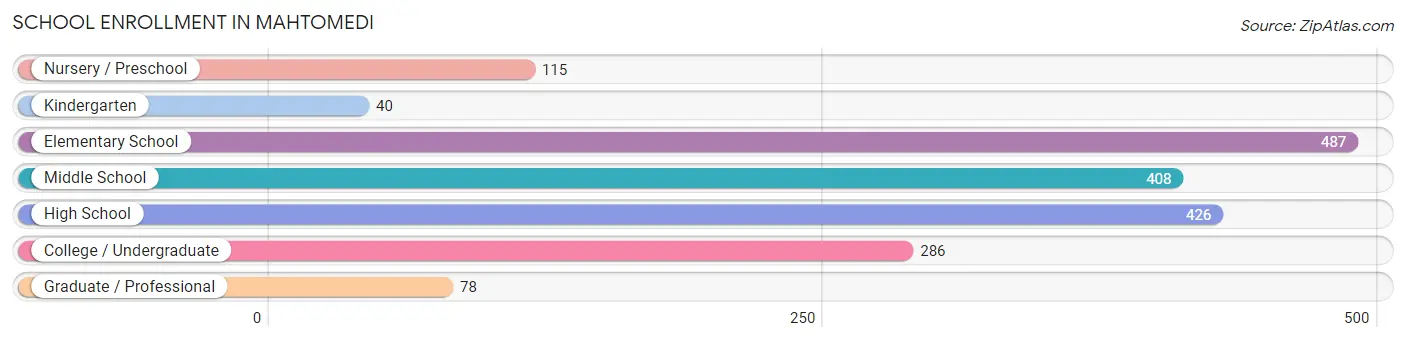
| School Level | # Students | % Students |
| Nursery / Preschool | 115 | 6.2% |
| Kindergarten | 40 | 2.2% |
| Elementary School | 487 | 26.5% |
| Middle School | 408 | 22.2% |
| High School | 426 | 23.2% |
| College / Undergraduate | 286 | 15.5% |
| Graduate / Professional | 78 | 4.2% |
| Total | 1,840 | 100.0% |
School Enrollment by Age by Funding Source in Mahtomedi
Out of a total of 1,840 students who are enrolled in schools in Mahtomedi, 442 (24.0%) attend a private institution, while the remaining 1,398 (76.0%) are enrolled in public schools. The age group of 35 years and over has the highest likelihood of being enrolled in private schools, with 43 (84.3% in the age bracket) enrolled. Conversely, the age group of 15 to 17 year olds has the lowest likelihood of being enrolled in a private school, with 342 (100.0% in the age bracket) attending a public institution.
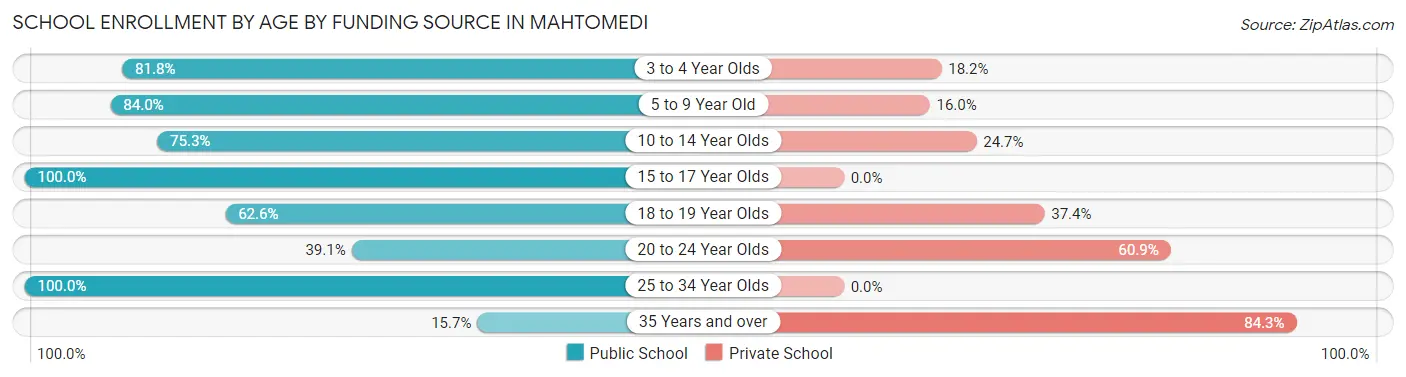
| Age Bracket | Public School | Private School |
| 3 to 4 Year Olds | 81 (81.8%) | 18 (18.2%) |
| 5 to 9 Year Old | 394 (84.0%) | 75 (16.0%) |
| 10 to 14 Year Olds | 372 (75.3%) | 122 (24.7%) |
| 15 to 17 Year Olds | 342 (100.0%) | 0 (0.0%) |
| 18 to 19 Year Olds | 124 (62.6%) | 74 (37.4%) |
| 20 to 24 Year Olds | 70 (39.1%) | 109 (60.9%) |
| 25 to 34 Year Olds | 8 (100.0%) | 0 (0.0%) |
| 35 Years and over | 8 (15.7%) | 43 (84.3%) |
| Total | 1,398 (76.0%) | 442 (24.0%) |
Educational Attainment by Field of Study in Mahtomedi
Business (642 | 17.3%), education (482 | 13.0%), social sciences (373 | 10.0%), science & technology (339 | 9.1%), and engineering (275 | 7.4%) are the most common fields of study among 3,714 individuals in Mahtomedi who have obtained a bachelor's degree or higher.
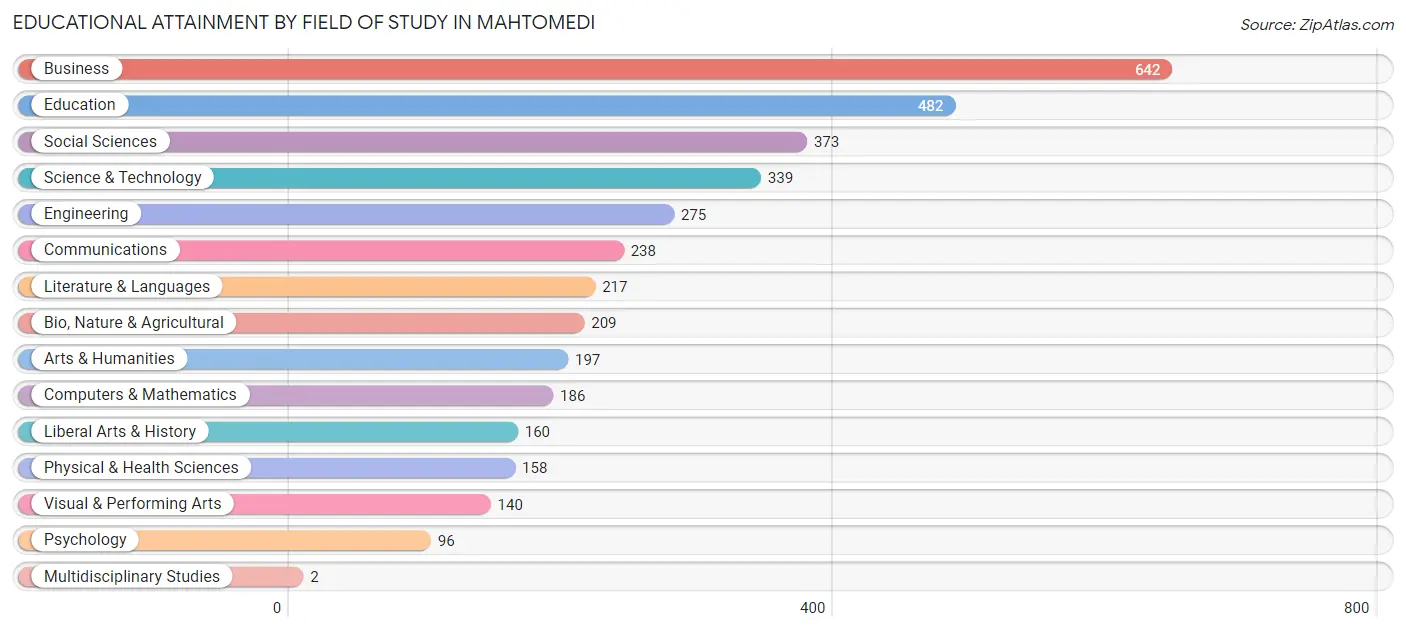
| Field of Study | # Graduates | % Graduates |
| Computers & Mathematics | 186 | 5.0% |
| Bio, Nature & Agricultural | 209 | 5.6% |
| Physical & Health Sciences | 158 | 4.3% |
| Psychology | 96 | 2.6% |
| Social Sciences | 373 | 10.0% |
| Engineering | 275 | 7.4% |
| Multidisciplinary Studies | 2 | 0.1% |
| Science & Technology | 339 | 9.1% |
| Business | 642 | 17.3% |
| Education | 482 | 13.0% |
| Literature & Languages | 217 | 5.8% |
| Liberal Arts & History | 160 | 4.3% |
| Visual & Performing Arts | 140 | 3.8% |
| Communications | 238 | 6.4% |
| Arts & Humanities | 197 | 5.3% |
| Total | 3,714 | 100.0% |
Transportation & Commute in Mahtomedi
Vehicle Availability by Sex in Mahtomedi
The most prevalent vehicle ownership categories in Mahtomedi are males with 2 vehicles (996, accounting for 49.4%) and females with 2 vehicles (699, making up 56.5%).
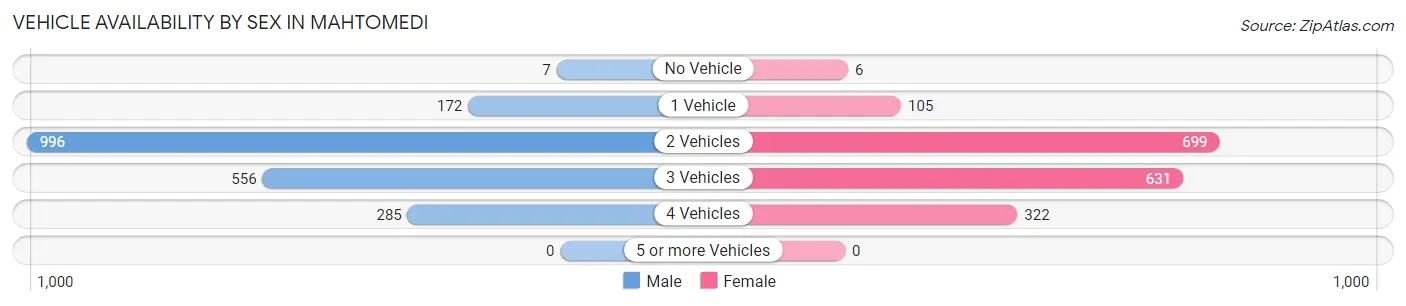
| Vehicles Available | Male | Female |
| No Vehicle | 7 (0.4%) | 6 (0.3%) |
| 1 Vehicle | 172 (8.5%) | 105 (6.0%) |
| 2 Vehicles | 996 (49.4%) | 699 (39.7%) |
| 3 Vehicles | 556 (27.6%) | 631 (35.8%) |
| 4 Vehicles | 285 (14.1%) | 322 (18.3%) |
| 5 or more Vehicles | 0 (0.0%) | 0 (0.0%) |
| Total | 2,016 (100.0%) | 1,763 (100.0%) |
Commute Time in Mahtomedi
The most frequently occuring commute durations in Mahtomedi are 20 to 24 minutes (497 commuters, 17.5%), 30 to 34 minutes (497 commuters, 17.5%), and 15 to 19 minutes (359 commuters, 12.7%).
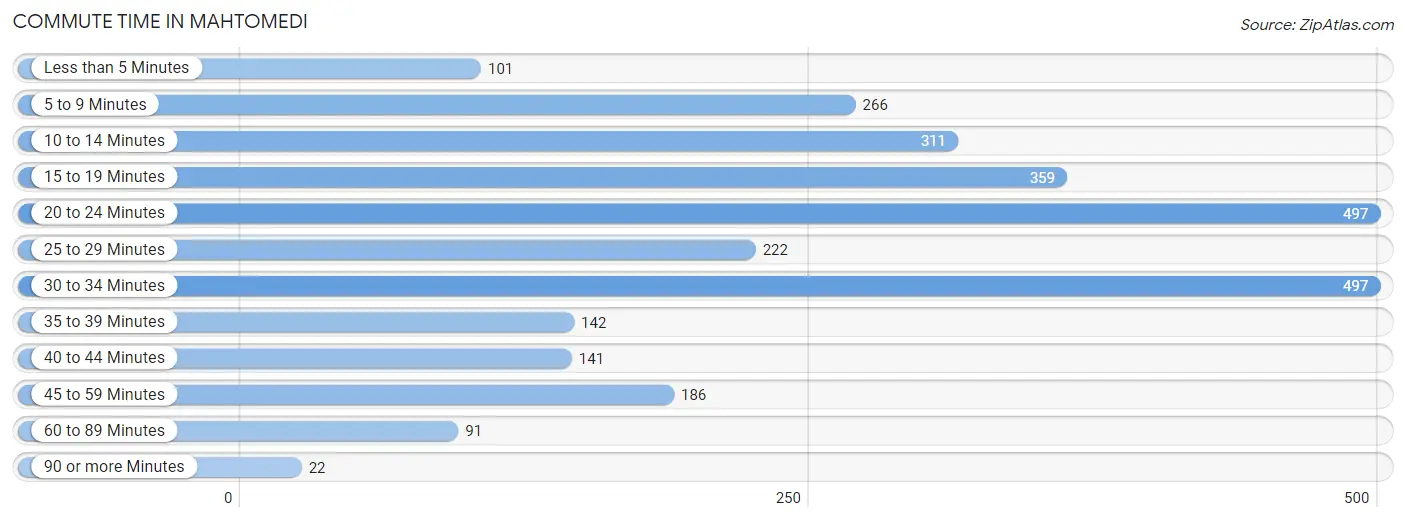
| Commute Time | # Commuters | % Commuters |
| Less than 5 Minutes | 101 | 3.6% |
| 5 to 9 Minutes | 266 | 9.4% |
| 10 to 14 Minutes | 311 | 11.0% |
| 15 to 19 Minutes | 359 | 12.7% |
| 20 to 24 Minutes | 497 | 17.5% |
| 25 to 29 Minutes | 222 | 7.8% |
| 30 to 34 Minutes | 497 | 17.5% |
| 35 to 39 Minutes | 142 | 5.0% |
| 40 to 44 Minutes | 141 | 5.0% |
| 45 to 59 Minutes | 186 | 6.6% |
| 60 to 89 Minutes | 91 | 3.2% |
| 90 or more Minutes | 22 | 0.8% |
Commute Time by Sex in Mahtomedi
The most common commute times in Mahtomedi are 20 to 24 minutes (323 commuters, 21.4%) for males and 30 to 34 minutes (207 commuters, 15.6%) for females.
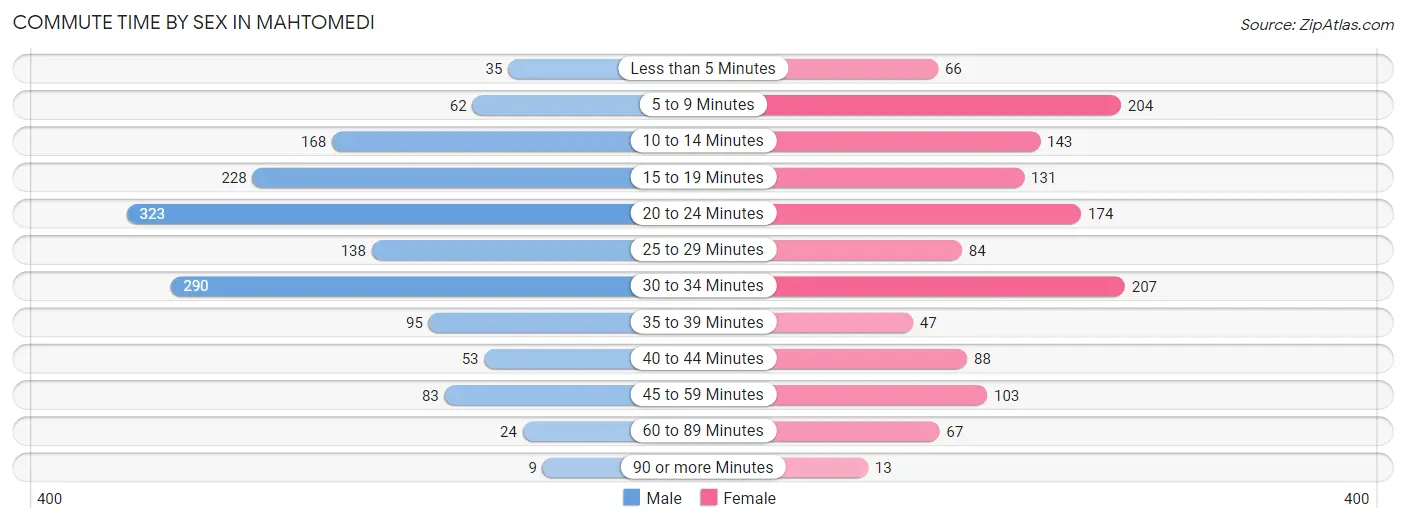
| Commute Time | Male | Female |
| Less than 5 Minutes | 35 (2.3%) | 66 (5.0%) |
| 5 to 9 Minutes | 62 (4.1%) | 204 (15.4%) |
| 10 to 14 Minutes | 168 (11.1%) | 143 (10.8%) |
| 15 to 19 Minutes | 228 (15.1%) | 131 (9.9%) |
| 20 to 24 Minutes | 323 (21.4%) | 174 (13.1%) |
| 25 to 29 Minutes | 138 (9.1%) | 84 (6.3%) |
| 30 to 34 Minutes | 290 (19.2%) | 207 (15.6%) |
| 35 to 39 Minutes | 95 (6.3%) | 47 (3.5%) |
| 40 to 44 Minutes | 53 (3.5%) | 88 (6.6%) |
| 45 to 59 Minutes | 83 (5.5%) | 103 (7.8%) |
| 60 to 89 Minutes | 24 (1.6%) | 67 (5.1%) |
| 90 or more Minutes | 9 (0.6%) | 13 (1.0%) |
Time of Departure to Work by Sex in Mahtomedi
The most frequent times of departure to work in Mahtomedi are 7:00 AM to 7:29 AM (242, 16.1%) for males and 7:00 AM to 7:29 AM (276, 20.8%) for females.
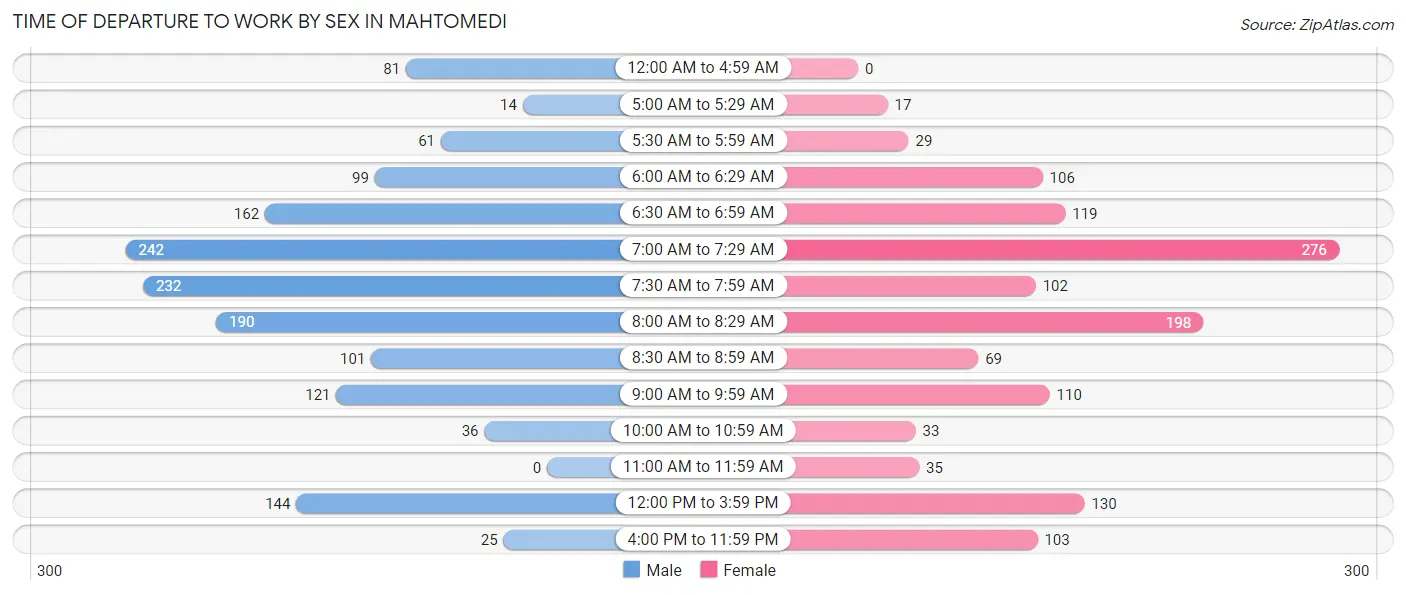
| Time of Departure | Male | Female |
| 12:00 AM to 4:59 AM | 81 (5.4%) | 0 (0.0%) |
| 5:00 AM to 5:29 AM | 14 (0.9%) | 17 (1.3%) |
| 5:30 AM to 5:59 AM | 61 (4.1%) | 29 (2.2%) |
| 6:00 AM to 6:29 AM | 99 (6.6%) | 106 (8.0%) |
| 6:30 AM to 6:59 AM | 162 (10.7%) | 119 (9.0%) |
| 7:00 AM to 7:29 AM | 242 (16.1%) | 276 (20.8%) |
| 7:30 AM to 7:59 AM | 232 (15.4%) | 102 (7.7%) |
| 8:00 AM to 8:29 AM | 190 (12.6%) | 198 (14.9%) |
| 8:30 AM to 8:59 AM | 101 (6.7%) | 69 (5.2%) |
| 9:00 AM to 9:59 AM | 121 (8.0%) | 110 (8.3%) |
| 10:00 AM to 10:59 AM | 36 (2.4%) | 33 (2.5%) |
| 11:00 AM to 11:59 AM | 0 (0.0%) | 35 (2.6%) |
| 12:00 PM to 3:59 PM | 144 (9.6%) | 130 (9.8%) |
| 4:00 PM to 11:59 PM | 25 (1.7%) | 103 (7.8%) |
| Total | 1,508 (100.0%) | 1,327 (100.0%) |
Housing Occupancy in Mahtomedi
Occupancy by Ownership in Mahtomedi
Of the total 2,926 dwellings in Mahtomedi, owner-occupied units account for 2,348 (80.2%), while renter-occupied units make up 578 (19.8%).
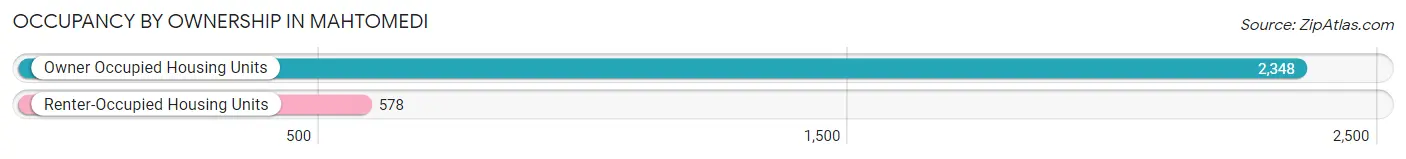
| Occupancy | # Housing Units | % Housing Units |
| Owner Occupied Housing Units | 2,348 | 80.2% |
| Renter-Occupied Housing Units | 578 | 19.8% |
| Total Occupied Housing Units | 2,926 | 100.0% |
Occupancy by Household Size in Mahtomedi
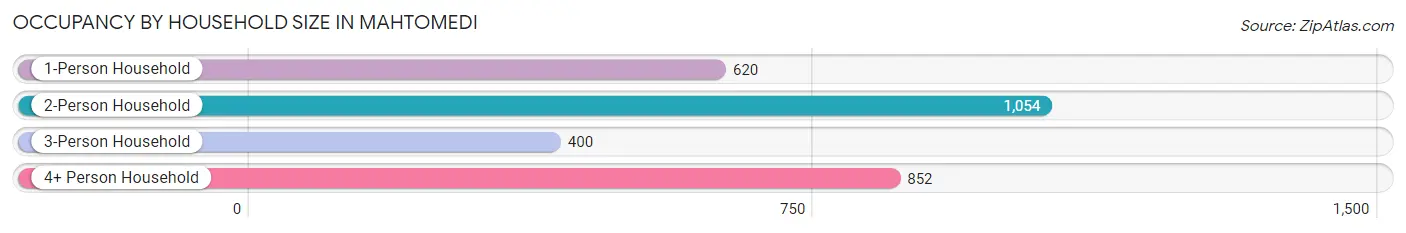
| Household Size | # Housing Units | % Housing Units |
| 1-Person Household | 620 | 21.2% |
| 2-Person Household | 1,054 | 36.0% |
| 3-Person Household | 400 | 13.7% |
| 4+ Person Household | 852 | 29.1% |
| Total Housing Units | 2,926 | 100.0% |
Occupancy by Ownership by Household Size in Mahtomedi
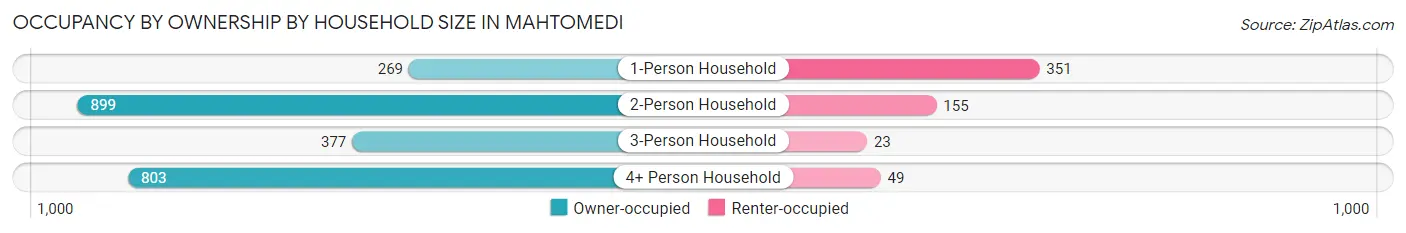
| Household Size | Owner-occupied | Renter-occupied |
| 1-Person Household | 269 (43.4%) | 351 (56.6%) |
| 2-Person Household | 899 (85.3%) | 155 (14.7%) |
| 3-Person Household | 377 (94.3%) | 23 (5.8%) |
| 4+ Person Household | 803 (94.3%) | 49 (5.8%) |
| Total Housing Units | 2,348 (80.2%) | 578 (19.8%) |
Occupancy by Educational Attainment in Mahtomedi
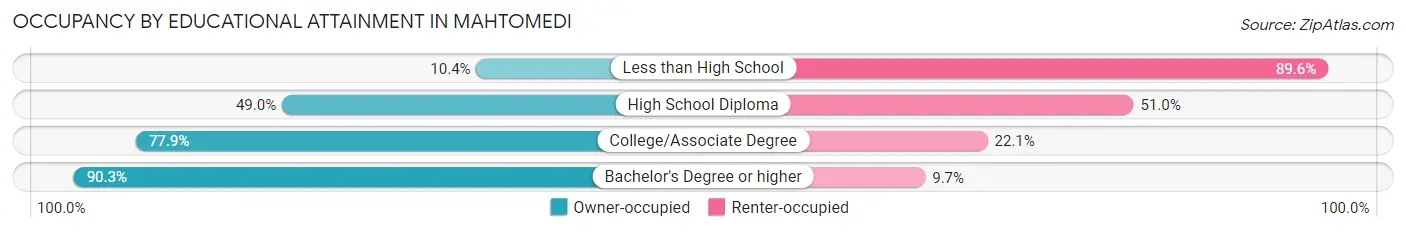
| Household Size | Owner-occupied | Renter-occupied |
| Less than High School | 5 (10.4%) | 43 (89.6%) |
| High School Diploma | 190 (49.0%) | 198 (51.0%) |
| College/Associate Degree | 596 (77.9%) | 169 (22.1%) |
| Bachelor's Degree or higher | 1,557 (90.3%) | 168 (9.7%) |
Occupancy by Age of Householder in Mahtomedi
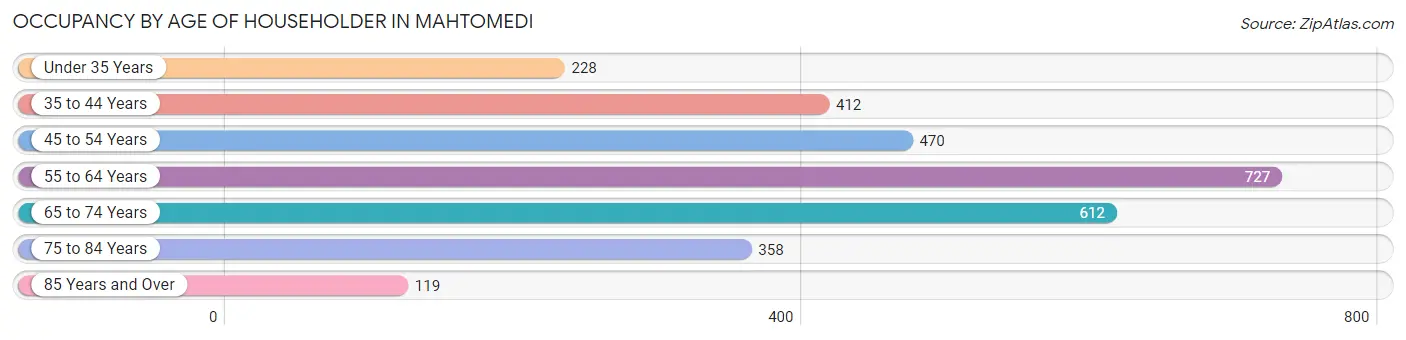
| Age Bracket | # Households | % Households |
| Under 35 Years | 228 | 7.8% |
| 35 to 44 Years | 412 | 14.1% |
| 45 to 54 Years | 470 | 16.1% |
| 55 to 64 Years | 727 | 24.8% |
| 65 to 74 Years | 612 | 20.9% |
| 75 to 84 Years | 358 | 12.2% |
| 85 Years and Over | 119 | 4.1% |
| Total | 2,926 | 100.0% |
Housing Finances in Mahtomedi
Median Income by Occupancy in Mahtomedi
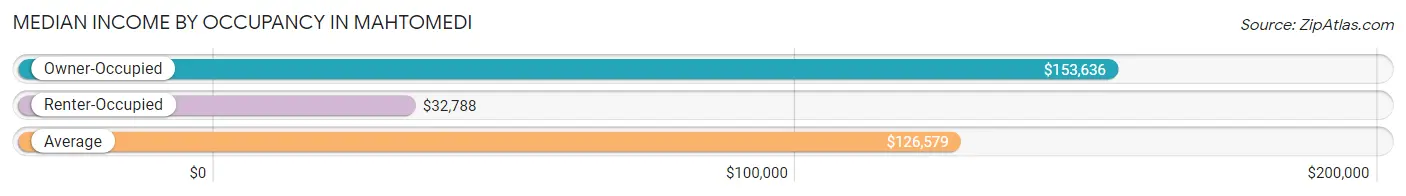
| Occupancy Type | # Households | Median Income |
| Owner-Occupied | 2,348 (80.2%) | $153,636 |
| Renter-Occupied | 578 (19.8%) | $32,788 |
| Average | 2,926 (100.0%) | $126,579 |
Occupancy by Householder Income Bracket in Mahtomedi
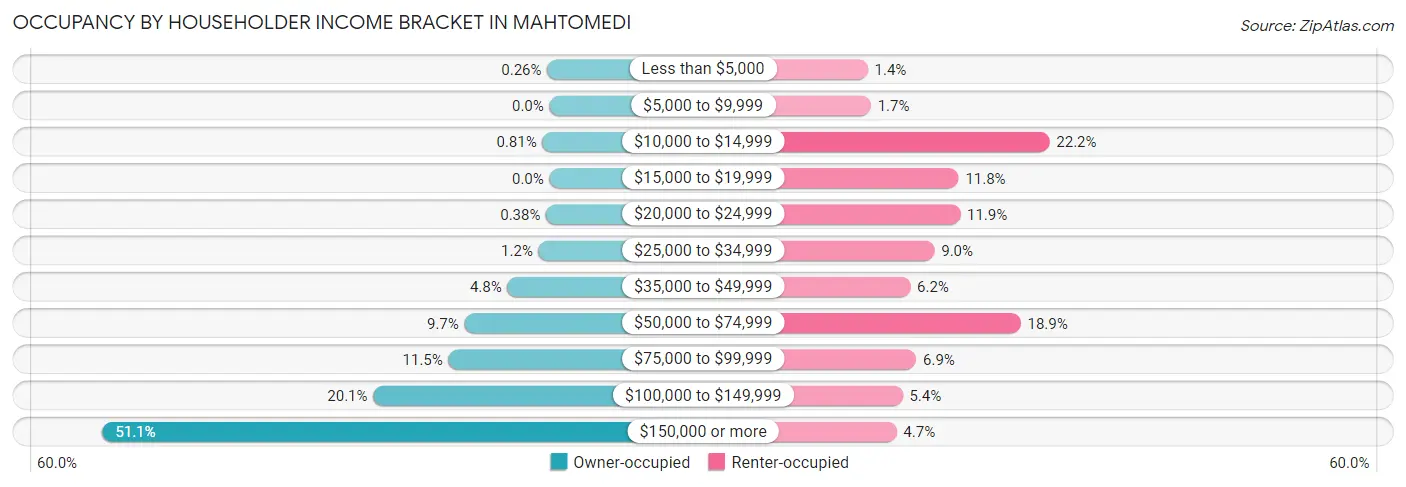
| Income Bracket | Owner-occupied | Renter-occupied |
| Less than $5,000 | 6 (0.3%) | 8 (1.4%) |
| $5,000 to $9,999 | 0 (0.0%) | 10 (1.7%) |
| $10,000 to $14,999 | 19 (0.8%) | 128 (22.2%) |
| $15,000 to $19,999 | 0 (0.0%) | 68 (11.8%) |
| $20,000 to $24,999 | 9 (0.4%) | 69 (11.9%) |
| $25,000 to $34,999 | 29 (1.2%) | 52 (9.0%) |
| $35,000 to $49,999 | 113 (4.8%) | 36 (6.2%) |
| $50,000 to $74,999 | 228 (9.7%) | 109 (18.9%) |
| $75,000 to $99,999 | 271 (11.5%) | 40 (6.9%) |
| $100,000 to $149,999 | 473 (20.1%) | 31 (5.4%) |
| $150,000 or more | 1,200 (51.1%) | 27 (4.7%) |
| Total | 2,348 (100.0%) | 578 (100.0%) |
Monthly Housing Cost Tiers in Mahtomedi
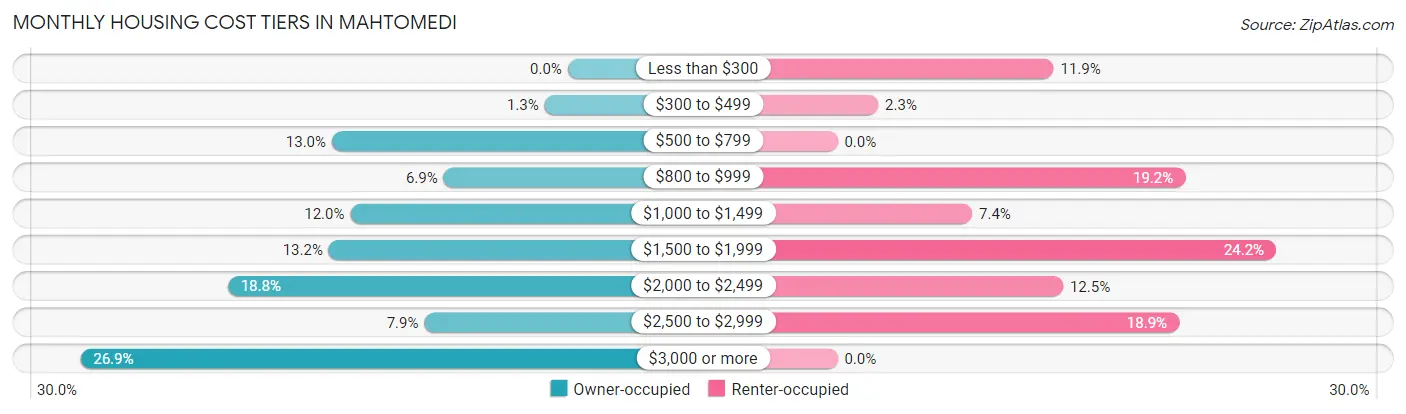
| Monthly Cost | Owner-occupied | Renter-occupied |
| Less than $300 | 0 (0.0%) | 69 (11.9%) |
| $300 to $499 | 30 (1.3%) | 13 (2.2%) |
| $500 to $799 | 306 (13.0%) | 0 (0.0%) |
| $800 to $999 | 161 (6.9%) | 111 (19.2%) |
| $1,000 to $1,499 | 282 (12.0%) | 43 (7.4%) |
| $1,500 to $1,999 | 310 (13.2%) | 140 (24.2%) |
| $2,000 to $2,499 | 441 (18.8%) | 72 (12.5%) |
| $2,500 to $2,999 | 186 (7.9%) | 109 (18.9%) |
| $3,000 or more | 632 (26.9%) | 0 (0.0%) |
| Total | 2,348 (100.0%) | 578 (100.0%) |
Physical Housing Characteristics in Mahtomedi
Housing Structures in Mahtomedi
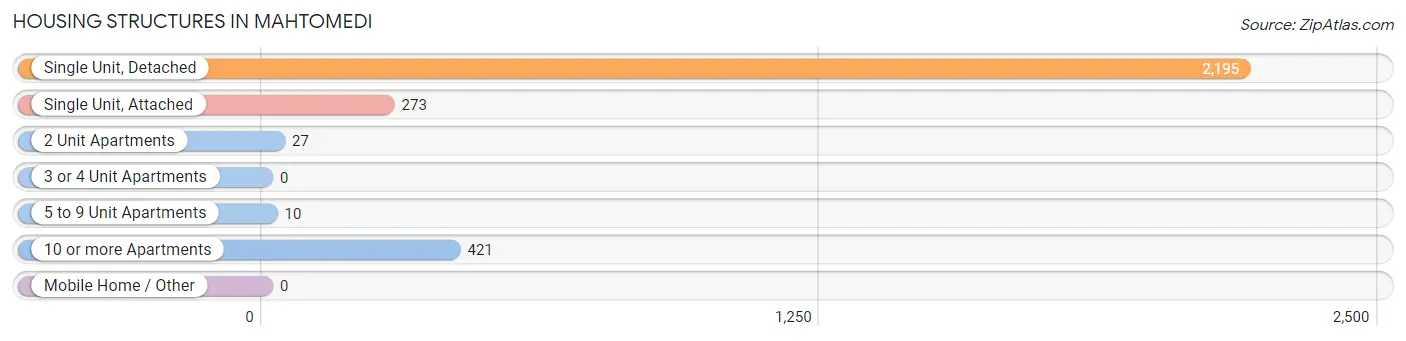
| Structure Type | # Housing Units | % Housing Units |
| Single Unit, Detached | 2,195 | 75.0% |
| Single Unit, Attached | 273 | 9.3% |
| 2 Unit Apartments | 27 | 0.9% |
| 3 or 4 Unit Apartments | 0 | 0.0% |
| 5 to 9 Unit Apartments | 10 | 0.3% |
| 10 or more Apartments | 421 | 14.4% |
| Mobile Home / Other | 0 | 0.0% |
| Total | 2,926 | 100.0% |
Housing Structures by Occupancy in Mahtomedi
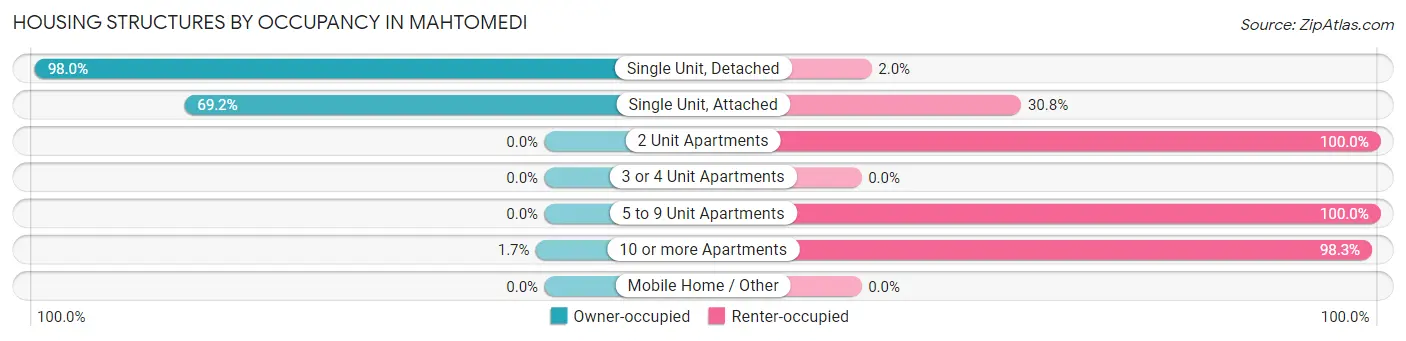
| Structure Type | Owner-occupied | Renter-occupied |
| Single Unit, Detached | 2,152 (98.0%) | 43 (2.0%) |
| Single Unit, Attached | 189 (69.2%) | 84 (30.8%) |
| 2 Unit Apartments | 0 (0.0%) | 27 (100.0%) |
| 3 or 4 Unit Apartments | 0 (0.0%) | 0 (0.0%) |
| 5 to 9 Unit Apartments | 0 (0.0%) | 10 (100.0%) |
| 10 or more Apartments | 7 (1.7%) | 414 (98.3%) |
| Mobile Home / Other | 0 (0.0%) | 0 (0.0%) |
| Total | 2,348 (80.2%) | 578 (19.8%) |
Housing Structures by Number of Rooms in Mahtomedi
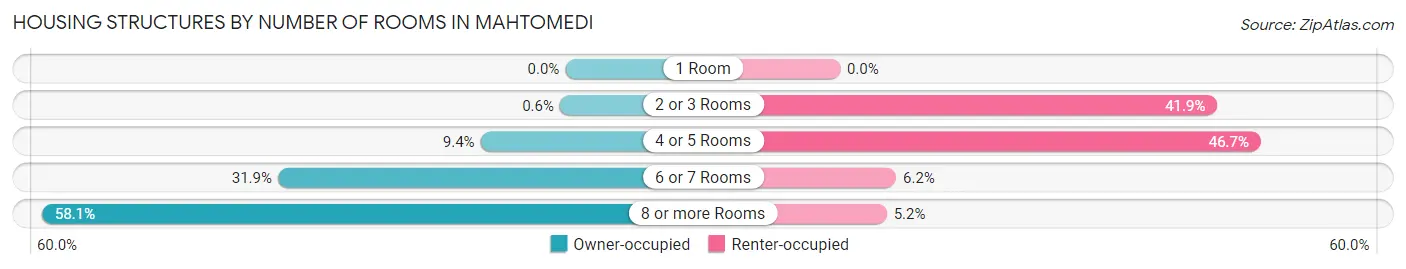
| Number of Rooms | Owner-occupied | Renter-occupied |
| 1 Room | 0 (0.0%) | 0 (0.0%) |
| 2 or 3 Rooms | 14 (0.6%) | 242 (41.9%) |
| 4 or 5 Rooms | 221 (9.4%) | 270 (46.7%) |
| 6 or 7 Rooms | 749 (31.9%) | 36 (6.2%) |
| 8 or more Rooms | 1,364 (58.1%) | 30 (5.2%) |
| Total | 2,348 (100.0%) | 578 (100.0%) |
Housing Structure by Heating Type in Mahtomedi
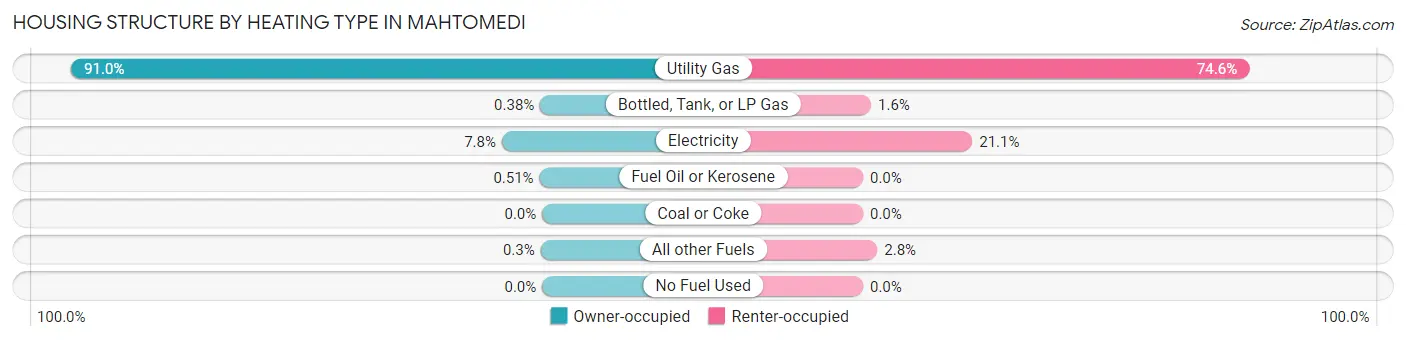
| Heating Type | Owner-occupied | Renter-occupied |
| Utility Gas | 2,137 (91.0%) | 431 (74.6%) |
| Bottled, Tank, or LP Gas | 9 (0.4%) | 9 (1.6%) |
| Electricity | 183 (7.8%) | 122 (21.1%) |
| Fuel Oil or Kerosene | 12 (0.5%) | 0 (0.0%) |
| Coal or Coke | 0 (0.0%) | 0 (0.0%) |
| All other Fuels | 7 (0.3%) | 16 (2.8%) |
| No Fuel Used | 0 (0.0%) | 0 (0.0%) |
| Total | 2,348 (100.0%) | 578 (100.0%) |
Household Vehicle Usage in Mahtomedi
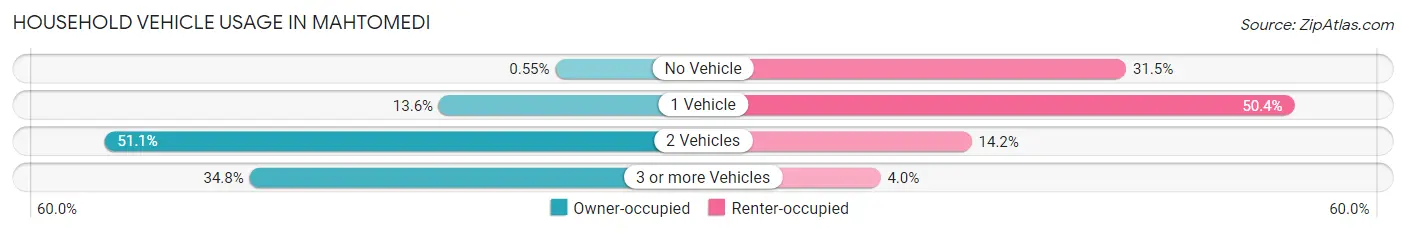
| Vehicles per Household | Owner-occupied | Renter-occupied |
| No Vehicle | 13 (0.5%) | 182 (31.5%) |
| 1 Vehicle | 319 (13.6%) | 291 (50.3%) |
| 2 Vehicles | 1,199 (51.1%) | 82 (14.2%) |
| 3 or more Vehicles | 817 (34.8%) | 23 (4.0%) |
| Total | 2,348 (100.0%) | 578 (100.0%) |
Real Estate & Mortgages in Mahtomedi
Real Estate and Mortgage Overview in Mahtomedi
| Characteristic | Without Mortgage | With Mortgage |
| Housing Units | 611 | 1,737 |
| Median Property Value | $413,400 | $447,600 |
| Median Household Income | $110,583 | $1,011 |
| Monthly Housing Costs | $784 | $618 |
| Real Estate Taxes | $4,525 | $5 |
Property Value by Mortgage Status in Mahtomedi
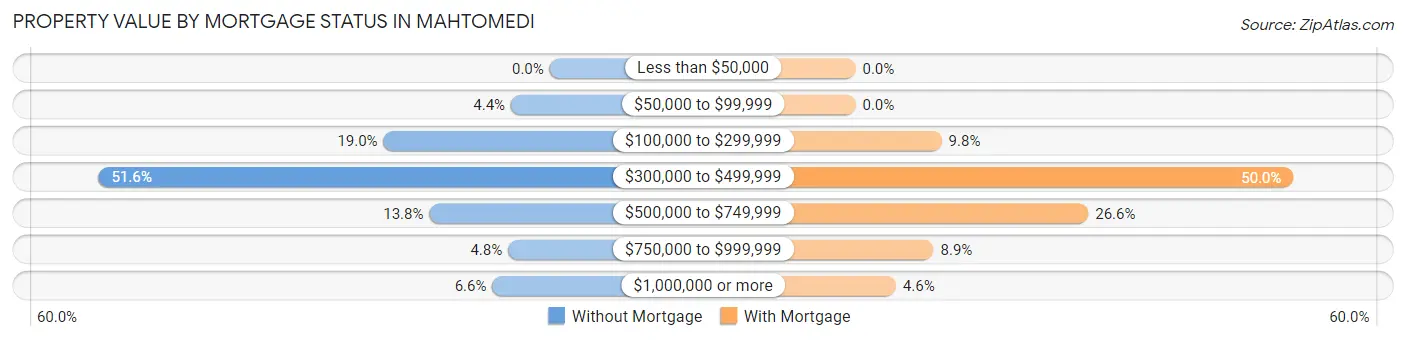
| Property Value | Without Mortgage | With Mortgage |
| Less than $50,000 | 0 (0.0%) | 0 (0.0%) |
| $50,000 to $99,999 | 27 (4.4%) | 0 (0.0%) |
| $100,000 to $299,999 | 116 (19.0%) | 171 (9.8%) |
| $300,000 to $499,999 | 315 (51.5%) | 869 (50.0%) |
| $500,000 to $749,999 | 84 (13.8%) | 462 (26.6%) |
| $750,000 to $999,999 | 29 (4.8%) | 155 (8.9%) |
| $1,000,000 or more | 40 (6.6%) | 80 (4.6%) |
| Total | 611 (100.0%) | 1,737 (100.0%) |
Household Income by Mortgage Status in Mahtomedi
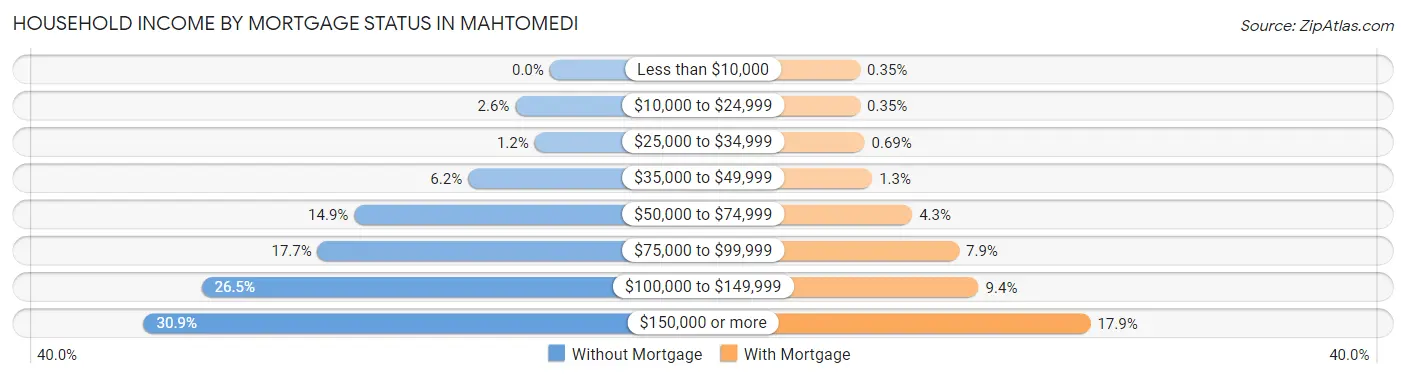
| Household Income | Without Mortgage | With Mortgage |
| Less than $10,000 | 0 (0.0%) | 6 (0.4%) |
| $10,000 to $24,999 | 16 (2.6%) | 6 (0.4%) |
| $25,000 to $34,999 | 7 (1.1%) | 12 (0.7%) |
| $35,000 to $49,999 | 38 (6.2%) | 22 (1.3%) |
| $50,000 to $74,999 | 91 (14.9%) | 75 (4.3%) |
| $75,000 to $99,999 | 108 (17.7%) | 137 (7.9%) |
| $100,000 to $149,999 | 162 (26.5%) | 163 (9.4%) |
| $150,000 or more | 189 (30.9%) | 311 (17.9%) |
| Total | 611 (100.0%) | 1,737 (100.0%) |
Property Value to Household Income Ratio in Mahtomedi
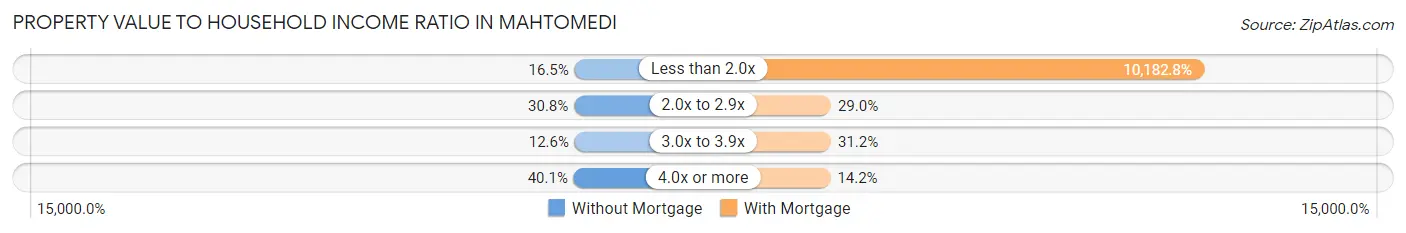
| Value-to-Income Ratio | Without Mortgage | With Mortgage |
| Less than 2.0x | 101 (16.5%) | 176,875 (10,182.8%) |
| 2.0x to 2.9x | 188 (30.8%) | 503 (29.0%) |
| 3.0x to 3.9x | 77 (12.6%) | 542 (31.2%) |
| 4.0x or more | 245 (40.1%) | 246 (14.2%) |
| Total | 611 (100.0%) | 1,737 (100.0%) |
Real Estate Taxes by Mortgage Status in Mahtomedi
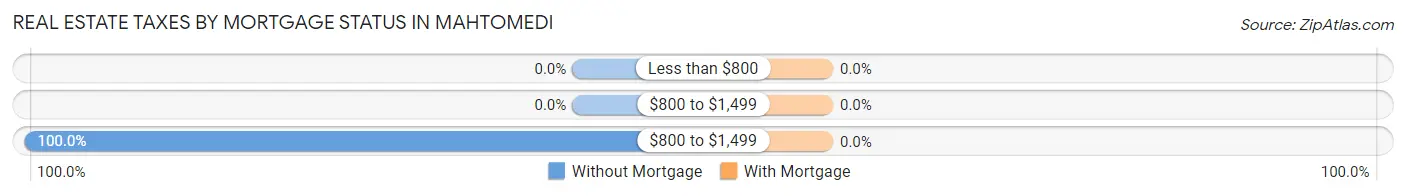
| Property Taxes | Without Mortgage | With Mortgage |
| Less than $800 | 0 (0.0%) | 0 (0.0%) |
| $800 to $1,499 | 0 (0.0%) | 0 (0.0%) |
| $800 to $1,499 | 611 (100.0%) | 0 (0.0%) |
| Total | 611 (100.0%) | 1,737 (100.0%) |
Health & Disability in Mahtomedi
Health Insurance Coverage by Age in Mahtomedi
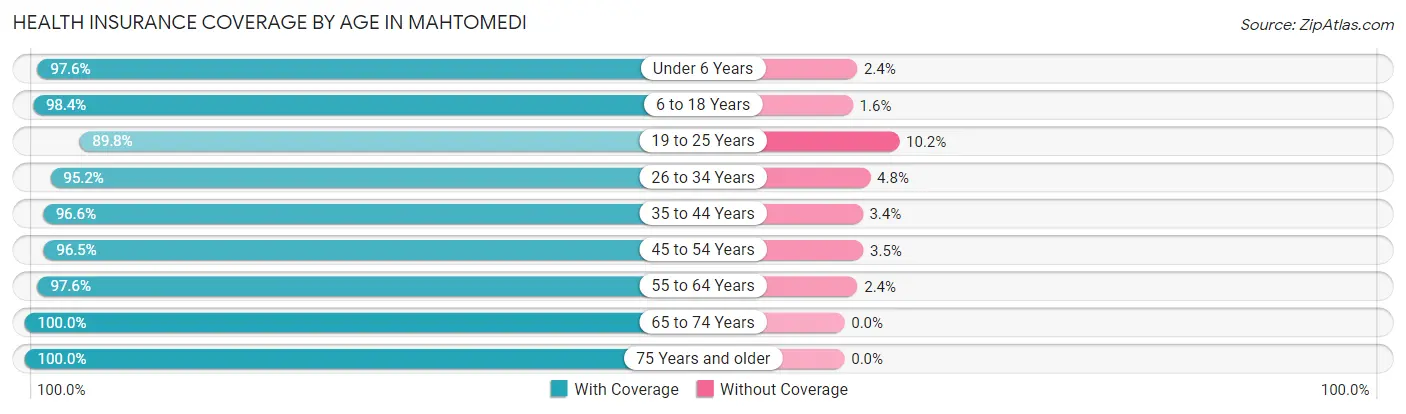
| Age Bracket | With Coverage | Without Coverage |
| Under 6 Years | 617 (97.6%) | 15 (2.4%) |
| 6 to 18 Years | 1,390 (98.4%) | 22 (1.6%) |
| 19 to 25 Years | 580 (89.8%) | 66 (10.2%) |
| 26 to 34 Years | 651 (95.2%) | 33 (4.8%) |
| 35 to 44 Years | 769 (96.6%) | 27 (3.4%) |
| 45 to 54 Years | 907 (96.5%) | 33 (3.5%) |
| 55 to 64 Years | 1,288 (97.6%) | 32 (2.4%) |
| 65 to 74 Years | 911 (100.0%) | 0 (0.0%) |
| 75 Years and older | 707 (100.0%) | 0 (0.0%) |
| Total | 7,820 (97.2%) | 228 (2.8%) |
Health Insurance Coverage by Citizenship Status in Mahtomedi
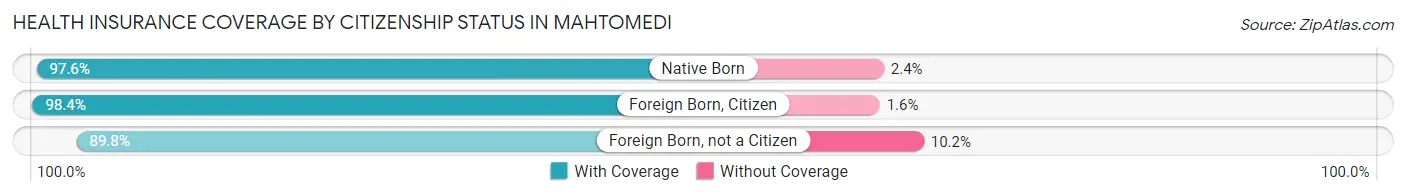
| Citizenship Status | With Coverage | Without Coverage |
| Native Born | 617 (97.6%) | 15 (2.4%) |
| Foreign Born, Citizen | 1,390 (98.4%) | 22 (1.6%) |
| Foreign Born, not a Citizen | 580 (89.8%) | 66 (10.2%) |
Health Insurance Coverage by Household Income in Mahtomedi
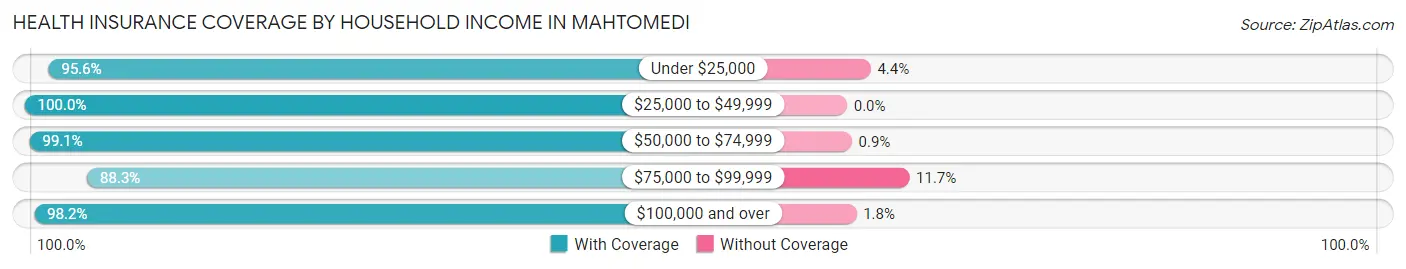
| Household Income | With Coverage | Without Coverage |
| Under $25,000 | 430 (95.6%) | 20 (4.4%) |
| $25,000 to $49,999 | 339 (100.0%) | 0 (0.0%) |
| $50,000 to $74,999 | 657 (99.1%) | 6 (0.9%) |
| $75,000 to $99,999 | 741 (88.3%) | 98 (11.7%) |
| $100,000 and over | 5,598 (98.2%) | 101 (1.8%) |
Public vs Private Health Insurance Coverage by Age in Mahtomedi
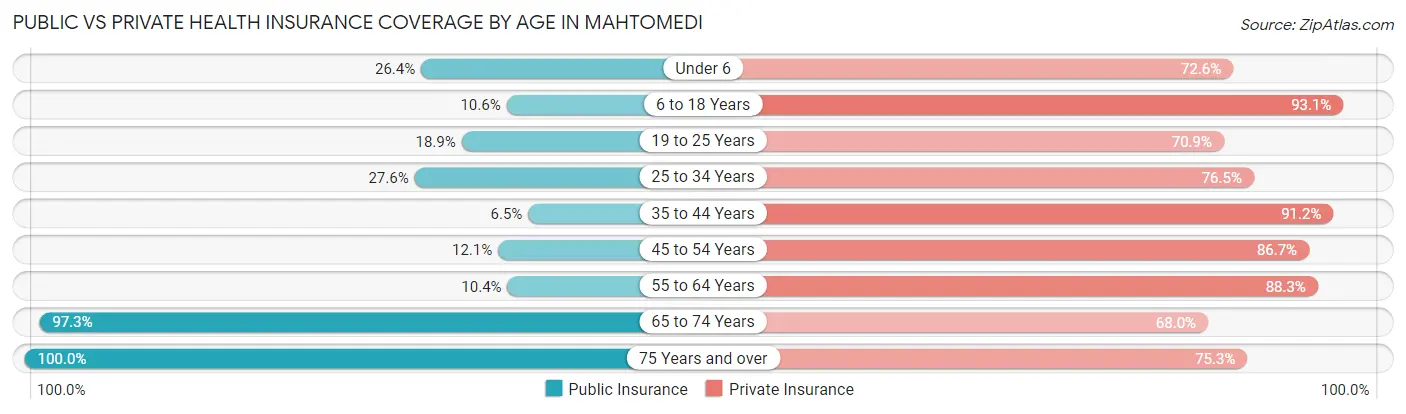
| Age Bracket | Public Insurance | Private Insurance |
| Under 6 | 167 (26.4%) | 459 (72.6%) |
| 6 to 18 Years | 149 (10.5%) | 1,314 (93.1%) |
| 19 to 25 Years | 122 (18.9%) | 458 (70.9%) |
| 25 to 34 Years | 189 (27.6%) | 523 (76.5%) |
| 35 to 44 Years | 52 (6.5%) | 726 (91.2%) |
| 45 to 54 Years | 114 (12.1%) | 815 (86.7%) |
| 55 to 64 Years | 137 (10.4%) | 1,166 (88.3%) |
| 65 to 74 Years | 886 (97.3%) | 619 (67.9%) |
| 75 Years and over | 707 (100.0%) | 532 (75.2%) |
| Total | 2,523 (31.4%) | 6,612 (82.2%) |
Disability Status by Sex by Age in Mahtomedi
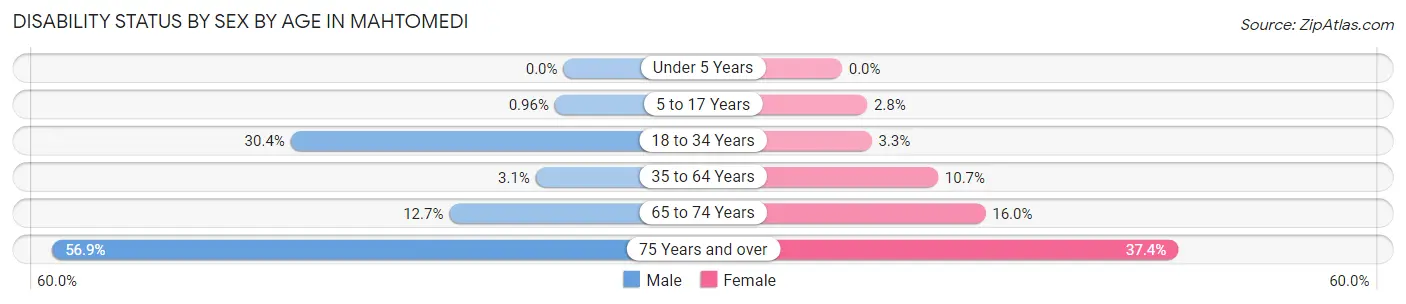
| Age Bracket | Male | Female |
| Under 5 Years | 0 (0.0%) | 0 (0.0%) |
| 5 to 17 Years | 7 (1.0%) | 17 (2.8%) |
| 18 to 34 Years | 215 (30.4%) | 25 (3.3%) |
| 35 to 64 Years | 47 (3.1%) | 164 (10.7%) |
| 65 to 74 Years | 45 (12.7%) | 89 (16.0%) |
| 75 Years and over | 144 (56.9%) | 170 (37.4%) |
Disability Class by Sex by Age in Mahtomedi
Disability Class: Hearing Difficulty
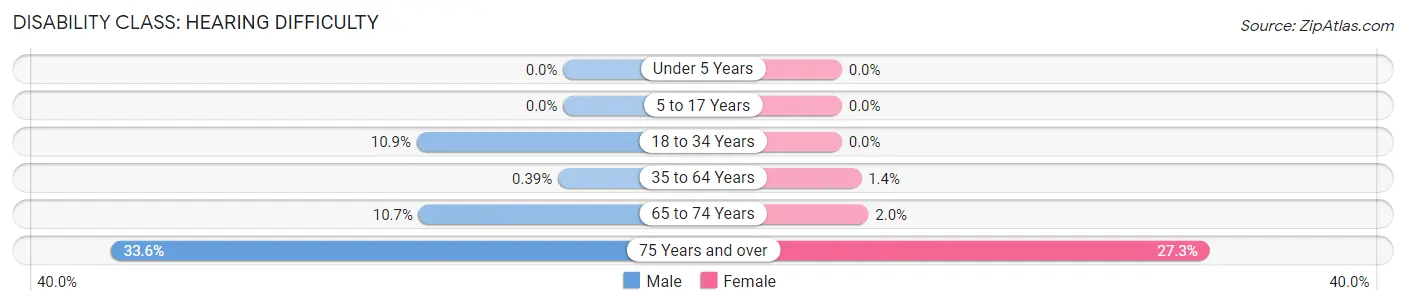
| Age Bracket | Male | Female |
| Under 5 Years | 0 (0.0%) | 0 (0.0%) |
| 5 to 17 Years | 0 (0.0%) | 0 (0.0%) |
| 18 to 34 Years | 77 (10.9%) | 0 (0.0%) |
| 35 to 64 Years | 6 (0.4%) | 22 (1.4%) |
| 65 to 74 Years | 38 (10.7%) | 11 (2.0%) |
| 75 Years and over | 85 (33.6%) | 124 (27.3%) |
Disability Class: Vision Difficulty
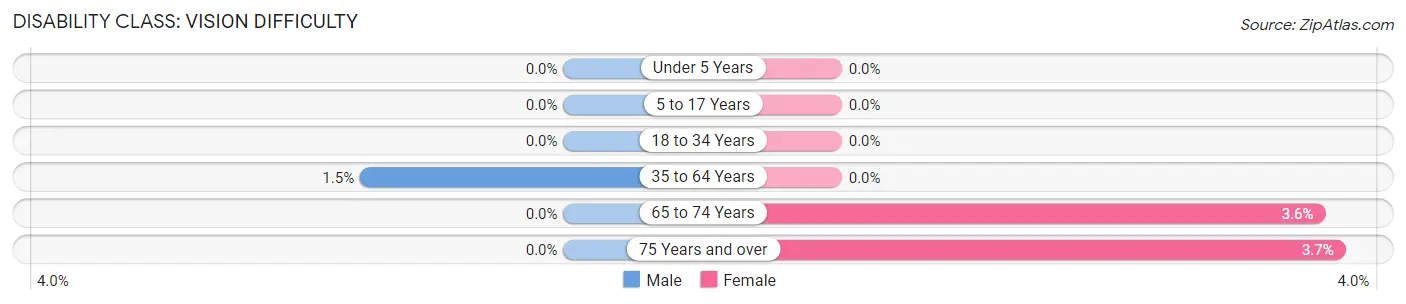
| Age Bracket | Male | Female |
| Under 5 Years | 0 (0.0%) | 0 (0.0%) |
| 5 to 17 Years | 0 (0.0%) | 0 (0.0%) |
| 18 to 34 Years | 0 (0.0%) | 0 (0.0%) |
| 35 to 64 Years | 23 (1.5%) | 0 (0.0%) |
| 65 to 74 Years | 0 (0.0%) | 20 (3.6%) |
| 75 Years and over | 0 (0.0%) | 17 (3.7%) |
Disability Class: Cognitive Difficulty
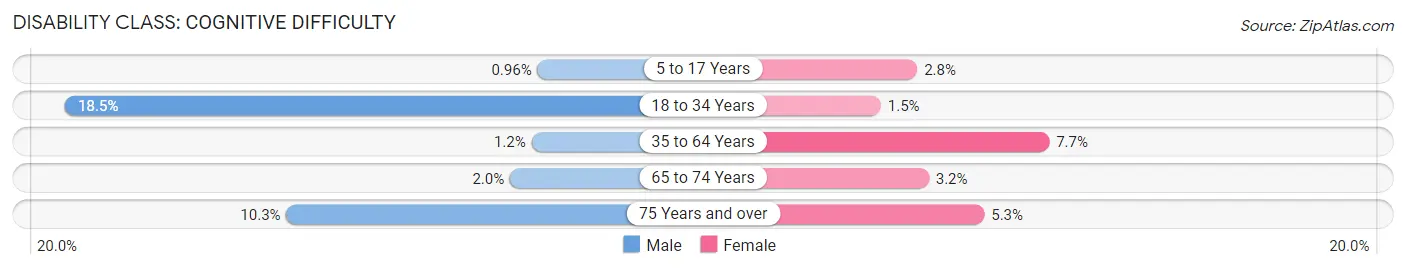
| Age Bracket | Male | Female |
| 5 to 17 Years | 7 (1.0%) | 17 (2.8%) |
| 18 to 34 Years | 131 (18.5%) | 11 (1.5%) |
| 35 to 64 Years | 18 (1.2%) | 118 (7.7%) |
| 65 to 74 Years | 7 (2.0%) | 18 (3.2%) |
| 75 Years and over | 26 (10.3%) | 24 (5.3%) |
Disability Class: Ambulatory Difficulty
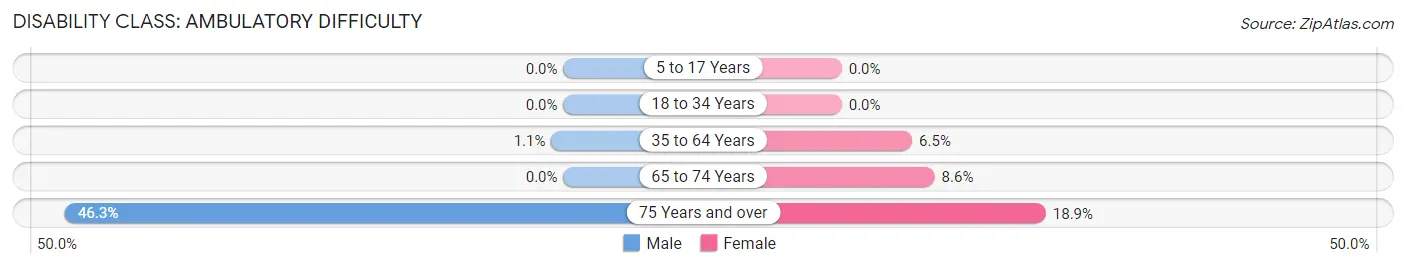
| Age Bracket | Male | Female |
| 5 to 17 Years | 0 (0.0%) | 0 (0.0%) |
| 18 to 34 Years | 0 (0.0%) | 0 (0.0%) |
| 35 to 64 Years | 17 (1.1%) | 100 (6.5%) |
| 65 to 74 Years | 0 (0.0%) | 48 (8.6%) |
| 75 Years and over | 117 (46.3%) | 86 (18.9%) |
Disability Class: Self-Care Difficulty
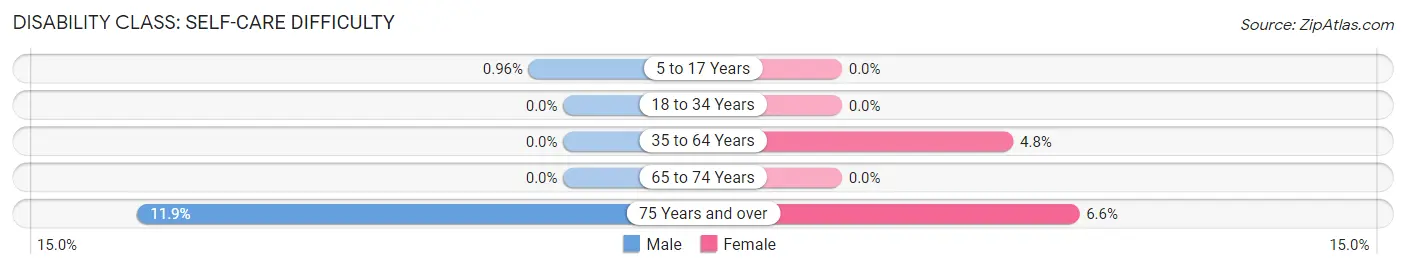
| Age Bracket | Male | Female |
| 5 to 17 Years | 7 (1.0%) | 0 (0.0%) |
| 18 to 34 Years | 0 (0.0%) | 0 (0.0%) |
| 35 to 64 Years | 0 (0.0%) | 73 (4.8%) |
| 65 to 74 Years | 0 (0.0%) | 0 (0.0%) |
| 75 Years and over | 30 (11.9%) | 30 (6.6%) |
Technology Access in Mahtomedi
Computing Device Access in Mahtomedi
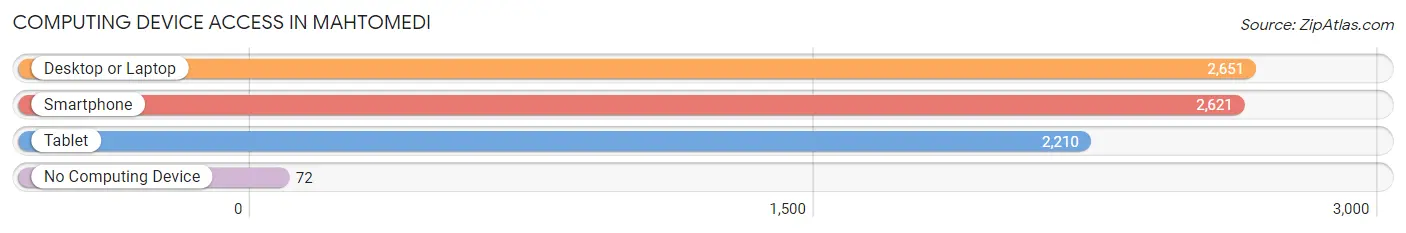
| Device Type | # Households | % Households |
| Desktop or Laptop | 2,651 | 90.6% |
| Smartphone | 2,621 | 89.6% |
| Tablet | 2,210 | 75.5% |
| No Computing Device | 72 | 2.5% |
| Total | 2,926 | 100.0% |
Internet Access in Mahtomedi
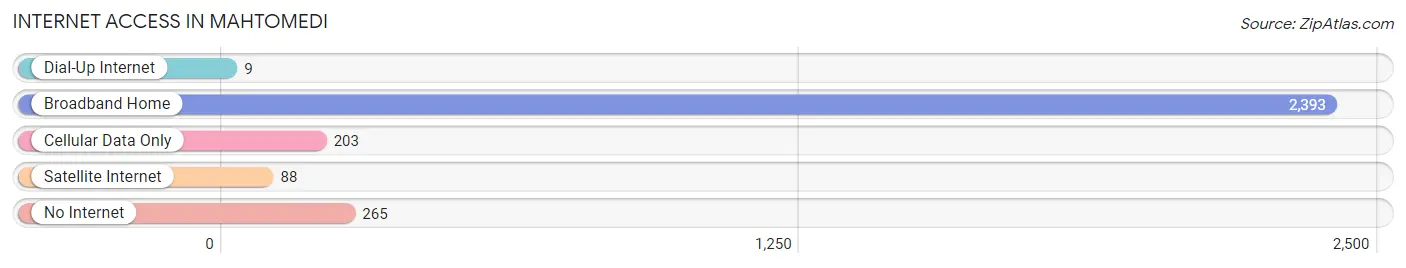
| Internet Type | # Households | % Households |
| Dial-Up Internet | 9 | 0.3% |
| Broadband Home | 2,393 | 81.8% |
| Cellular Data Only | 203 | 6.9% |
| Satellite Internet | 88 | 3.0% |
| No Internet | 265 | 9.1% |
| Total | 2,926 | 100.0% |
Mahtomedi Summary
Mahtomedi, Minnesota is a small city located in Washington County, just east of the Twin Cities metropolitan area. The city is situated on the banks of the White Bear Lake, and is home to a population of approximately 8,000 people. The city is known for its small-town charm and its proximity to the Twin Cities.
History
The area that is now Mahtomedi was first settled in the late 1800s by a group of Swedish immigrants. The city was originally known as White Bear Lake Station, and was a stop on the St. Paul and Duluth Railroad. In 1887, the city was renamed Mahtomedi, which is derived from the Dakota word for “White Bear Lake.”
The city was officially incorporated in 1921, and the population grew steadily throughout the 20th century. In the 1950s, the city began to experience a population boom, as many people moved to the area to take advantage of the city’s proximity to the Twin Cities.
Geography
Mahtomedi is located in Washington County, just east of the Twin Cities metropolitan area. The city is situated on the banks of the White Bear Lake, and is surrounded by a number of smaller lakes and wetlands. The city is located at an elevation of 890 feet above sea level.
The city has a total area of 4.2 square miles, of which 3.9 square miles is land and 0.3 square miles is water. The city is located in a humid continental climate zone, with cold winters and warm summers.
Economy
The economy of Mahtomedi is largely based on the service industry. The city is home to a number of small businesses, including restaurants, retail stores, and professional services. The city is also home to a number of corporate offices, including those of 3M, Target, and Best Buy.
The city is also home to a number of educational institutions, including Mahtomedi High School, Mahtomedi Middle School, and Mahtomedi Elementary School.
Demographics
As of the 2010 census, the population of Mahtomedi was 8,095. The racial makeup of the city was 94.2% White, 1.3% African American, 0.3% Native American, 1.7% Asian, 0.1% Pacific Islander, 0.9% from other races, and 1.7% from two or more races. Hispanic or Latino of any race were 2.3% of the population.
The median income for a household in the city was $68,945, and the median income for a family was $77,917. The per capita income for the city was $31,945. About 3.2% of families and 4.3% of the population were below the poverty line, including 5.2% of those under age 18 and 4.2% of those age 65 or over.
Common Questions
What is Per Capita Income in Mahtomedi?
Per Capita income in Mahtomedi is $66,253.
What is the Median Family Income in Mahtomedi?
Median Family Income in Mahtomedi is $154,261.
What is the Median Household income in Mahtomedi?
Median Household Income in Mahtomedi is $126,579.
What is Income or Wage Gap in Mahtomedi?
Income or Wage Gap in Mahtomedi is 39.6%.
Women in Mahtomedi earn 60.4 cents for every dollar earned by a man.
What is Inequality or Gini Index in Mahtomedi?
Inequality or Gini Index in Mahtomedi is 0.49.
What is the Total Population of Mahtomedi?
Total Population of Mahtomedi is 8,073.
What is the Total Male Population of Mahtomedi?
Total Male Population of Mahtomedi is 3,884.
What is the Total Female Population of Mahtomedi?
Total Female Population of Mahtomedi is 4,189.
What is the Ratio of Males per 100 Females in Mahtomedi?
There are 92.72 Males per 100 Females in Mahtomedi.
What is the Ratio of Females per 100 Males in Mahtomedi?
There are 107.85 Females per 100 Males in Mahtomedi.
What is the Median Population Age in Mahtomedi?
Median Population Age in Mahtomedi is 43.6 Years.
What is the Average Family Size in Mahtomedi
Average Family Size in Mahtomedi is 3.2 People.
What is the Average Household Size in Mahtomedi
Average Household Size in Mahtomedi is 2.7 People.
How Large is the Labor Force in Mahtomedi?
There are 4,040 People in the Labor Forcein in Mahtomedi.
What is the Percentage of People in the Labor Force in Mahtomedi?
63.0% of People are in the Labor Force in Mahtomedi.
What is the Unemployment Rate in Mahtomedi?
Unemployment Rate in Mahtomedi is 3.2%.