Fort Morgan, CO Map & Demographics
Fort Morgan Map
Fort Morgan Overview
$26,883
PER CAPITA INCOME
$68,508
AVG FAMILY INCOME
$55,407
AVG HOUSEHOLD INCOME
39.6%
WAGE / INCOME GAP [ % ]
60.4¢/ $1
WAGE / INCOME GAP [ $ ]
$13,514
FAMILY INCOME DEFICIT
0.42
INEQUALITY / GINI INDEX
11,501
TOTAL POPULATION
5,796
MALE POPULATION
5,705
FEMALE POPULATION
101.60
MALES / 100 FEMALES
98.43
FEMALES / 100 MALES
32.8
MEDIAN AGE
3.4
AVG FAMILY SIZE
2.6
AVG HOUSEHOLD SIZE
5,564
LABOR FORCE [ PEOPLE ]
65.0%
PERCENT IN LABOR FORCE
4.9%
UNEMPLOYMENT RATE
Fort Morgan Zip Codes
Fort Morgan Area Codes
Income in Fort Morgan
Income Overview in Fort Morgan
Per Capita Income in Fort Morgan is $26,883, while median incomes of families and households are $68,508 and $55,407 respectively.
| Characteristic | Number | Measure |
| Per Capita Income | 11,501 | $26,883 |
| Median Family Income | 2,732 | $68,508 |
| Mean Family Income | 2,732 | $80,523 |
| Median Household Income | 4,322 | $55,407 |
| Mean Household Income | 4,322 | $68,983 |
| Income Deficit | 2,732 | $13,514 |
| Wage / Income Gap (%) | 11,501 | 39.56% |
| Wage / Income Gap ($) | 11,501 | 60.44¢ per $1 |
| Gini / Inequality Index | 11,501 | 0.42 |
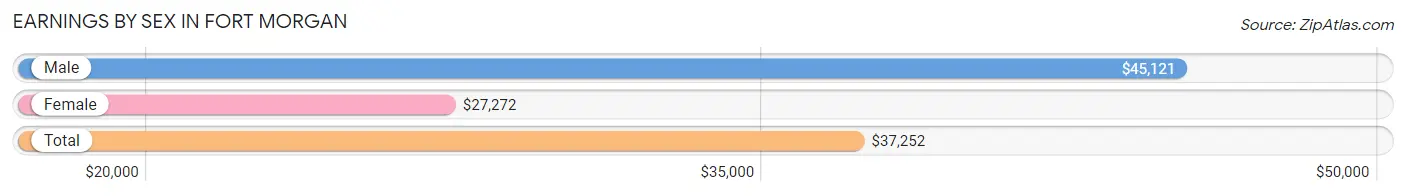
Earnings by Sex in Fort Morgan
Average Earnings in Fort Morgan are $37,252, $45,121 for men and $27,272 for women, a difference of 39.6%.
| Sex | Number | Average Earnings |
| Male | 3,490 (58.8%) | $45,121 |
| Female | 2,449 (41.2%) | $27,272 |
| Total | 5,939 (100.0%) | $37,252 |
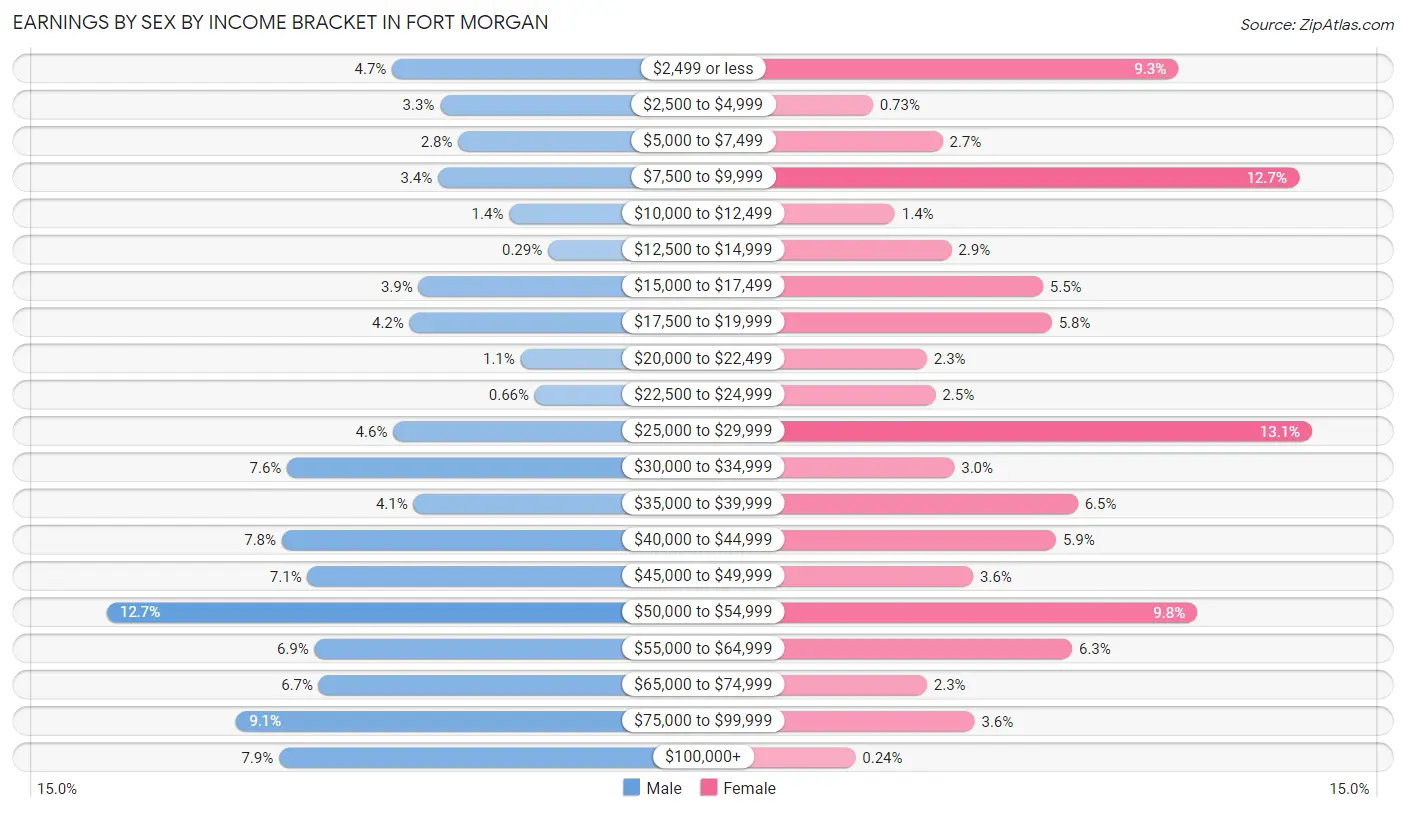
Earnings by Sex by Income Bracket in Fort Morgan
The most common earnings brackets in Fort Morgan are $50,000 to $54,999 for men (443 | 12.7%) and $25,000 to $29,999 for women (320 | 13.1%).
| Income | Male | Female |
| $2,499 or less | 163 (4.7%) | 228 (9.3%) |
| $2,500 to $4,999 | 116 (3.3%) | 18 (0.7%) |
| $5,000 to $7,499 | 98 (2.8%) | 66 (2.7%) |
| $7,500 to $9,999 | 118 (3.4%) | 311 (12.7%) |
| $10,000 to $12,499 | 48 (1.4%) | 33 (1.3%) |
| $12,500 to $14,999 | 10 (0.3%) | 72 (2.9%) |
| $15,000 to $17,499 | 137 (3.9%) | 135 (5.5%) |
| $17,500 to $19,999 | 146 (4.2%) | 141 (5.8%) |
| $20,000 to $22,499 | 37 (1.1%) | 55 (2.2%) |
| $22,500 to $24,999 | 23 (0.7%) | 61 (2.5%) |
| $25,000 to $29,999 | 162 (4.6%) | 320 (13.1%) |
| $30,000 to $34,999 | 266 (7.6%) | 74 (3.0%) |
| $35,000 to $39,999 | 142 (4.1%) | 159 (6.5%) |
| $40,000 to $44,999 | 271 (7.8%) | 144 (5.9%) |
| $45,000 to $49,999 | 246 (7.0%) | 87 (3.5%) |
| $50,000 to $54,999 | 443 (12.7%) | 241 (9.8%) |
| $55,000 to $64,999 | 239 (6.9%) | 155 (6.3%) |
| $65,000 to $74,999 | 235 (6.7%) | 55 (2.2%) |
| $75,000 to $99,999 | 316 (9.0%) | 88 (3.6%) |
| $100,000+ | 274 (7.9%) | 6 (0.2%) |
| Total | 3,490 (100.0%) | 2,449 (100.0%) |
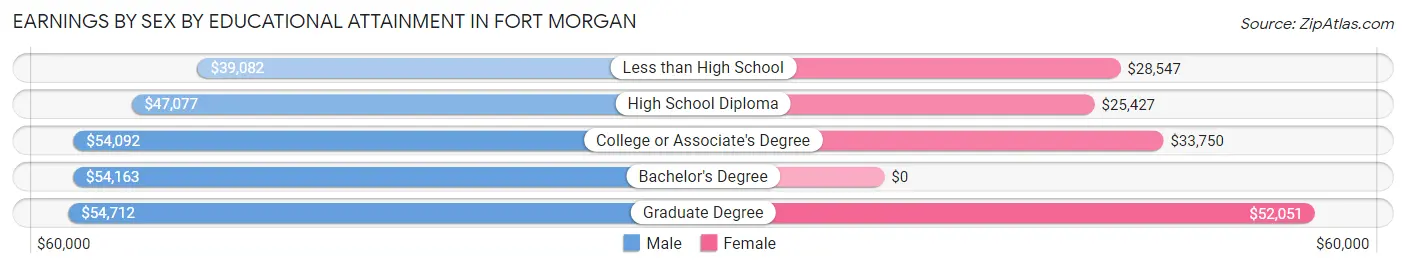
Earnings by Sex by Educational Attainment in Fort Morgan
Average earnings in Fort Morgan are $49,213 for men and $29,148 for women, a difference of 40.8%. Men with an educational attainment of graduate degree enjoy the highest average annual earnings of $54,712, while those with less than high school education earn the least with $39,082. Women with an educational attainment of graduate degree earn the most with the average annual earnings of $52,051, while those with high school diploma education have the smallest earnings of $25,427.
| Educational Attainment | Male Income | Female Income |
| Less than High School | $39,082 | $28,547 |
| High School Diploma | $47,077 | $25,427 |
| College or Associate's Degree | $54,092 | $33,750 |
| Bachelor's Degree | $54,163 | $0 |
| Graduate Degree | $54,712 | $52,051 |
| Total | $49,213 | $29,148 |
Family Income in Fort Morgan
Family Income Brackets in Fort Morgan
According to the Fort Morgan family income data, there are 803 families falling into the $50,000 to $74,999 income range, which is the most common income bracket and makes up 29.4% of all families. Conversely, the $10,000 to $14,999 income bracket is the least frequent group with only 22 families (0.8%) belonging to this category.
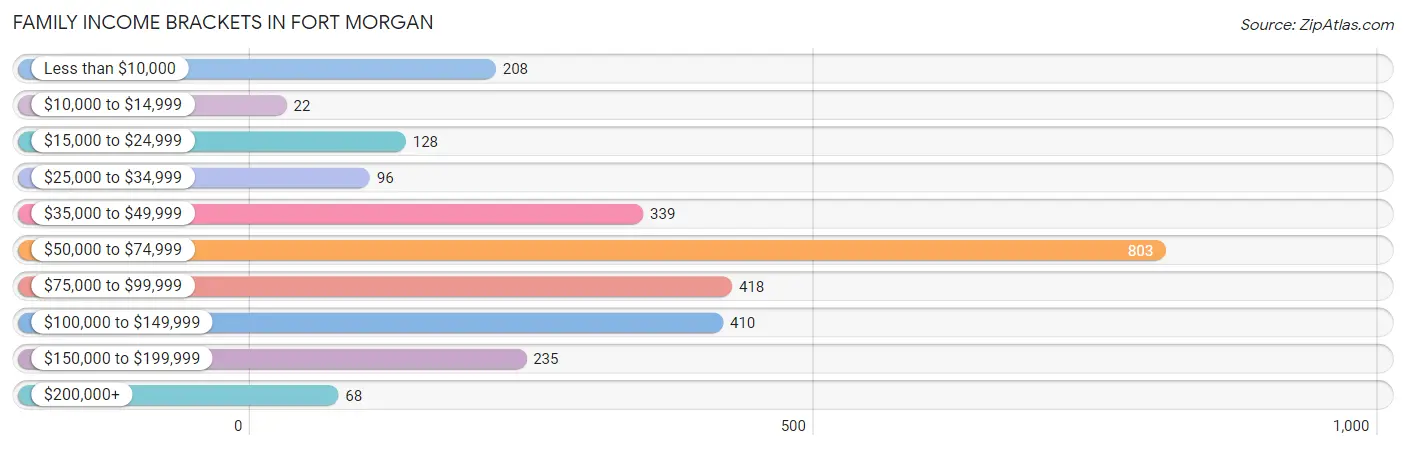
| Income Bracket | # Families | % Families |
| Less than $10,000 | 208 | 7.6% |
| $10,000 to $14,999 | 22 | 0.8% |
| $15,000 to $24,999 | 128 | 4.7% |
| $25,000 to $34,999 | 96 | 3.5% |
| $35,000 to $49,999 | 339 | 12.4% |
| $50,000 to $74,999 | 803 | 29.4% |
| $75,000 to $99,999 | 418 | 15.3% |
| $100,000 to $149,999 | 410 | 15.0% |
| $150,000 to $199,999 | 235 | 8.6% |
| $200,000+ | 68 | 2.5% |
Family Income by Famaliy Size in Fort Morgan
6-person families (82 | 3.0%) account for the highest median family income in Fort Morgan with $179,141 per family, while 2-person families (958 | 35.1%) have the highest median income of $32,726 per family member.
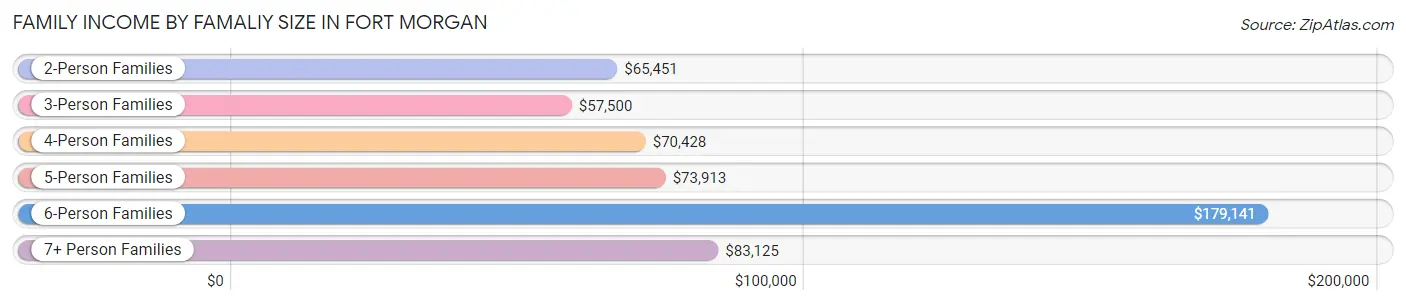
| Income Bracket | # Families | Median Income |
| 2-Person Families | 958 (35.1%) | $65,451 |
| 3-Person Families | 518 (19.0%) | $57,500 |
| 4-Person Families | 777 (28.4%) | $70,428 |
| 5-Person Families | 290 (10.6%) | $73,913 |
| 6-Person Families | 82 (3.0%) | $179,141 |
| 7+ Person Families | 107 (3.9%) | $83,125 |
| Total | 2,732 (100.0%) | $68,508 |
Family Income by Number of Earners in Fort Morgan
The median family income in Fort Morgan is $68,508, with families comprising 3+ earners (442) having the highest median family income of $113,041, while families with no earners (312) have the lowest median family income of $33,472, accounting for 16.2% and 11.4% of families, respectively.
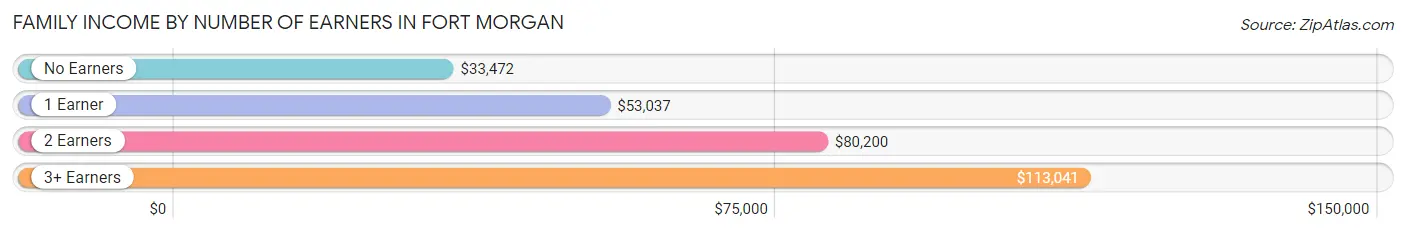
| Number of Earners | # Families | Median Income |
| No Earners | 312 (11.4%) | $33,472 |
| 1 Earner | 1,014 (37.1%) | $53,037 |
| 2 Earners | 964 (35.3%) | $80,200 |
| 3+ Earners | 442 (16.2%) | $113,041 |
| Total | 2,732 (100.0%) | $68,508 |
Household Income in Fort Morgan
Household Income Brackets in Fort Morgan
With 1,063 households falling in the category, the $50,000 to $74,999 income range is the most frequent in Fort Morgan, accounting for 24.6% of all households. In contrast, only 86 households (2.0%) fall into the $200,000+ income bracket, making it the least populous group.
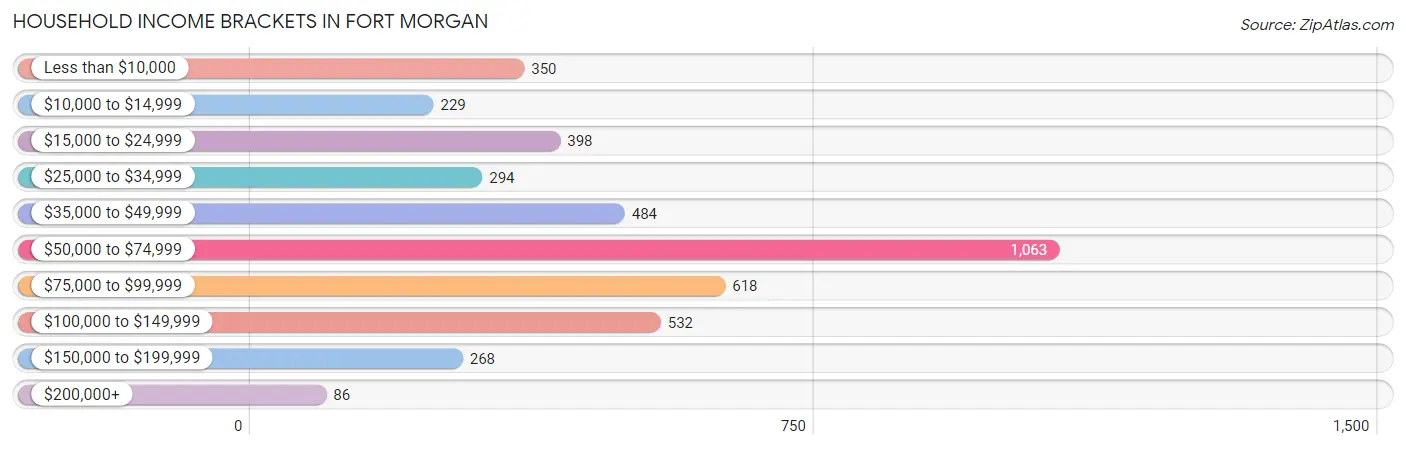
| Income Bracket | # Households | % Households |
| Less than $10,000 | 350 | 8.1% |
| $10,000 to $14,999 | 229 | 5.3% |
| $15,000 to $24,999 | 398 | 9.2% |
| $25,000 to $34,999 | 294 | 6.8% |
| $35,000 to $49,999 | 484 | 11.2% |
| $50,000 to $74,999 | 1,063 | 24.6% |
| $75,000 to $99,999 | 618 | 14.3% |
| $100,000 to $149,999 | 532 | 12.3% |
| $150,000 to $199,999 | 268 | 6.2% |
| $200,000+ | 86 | 2.0% |
Household Income by Householder Age in Fort Morgan
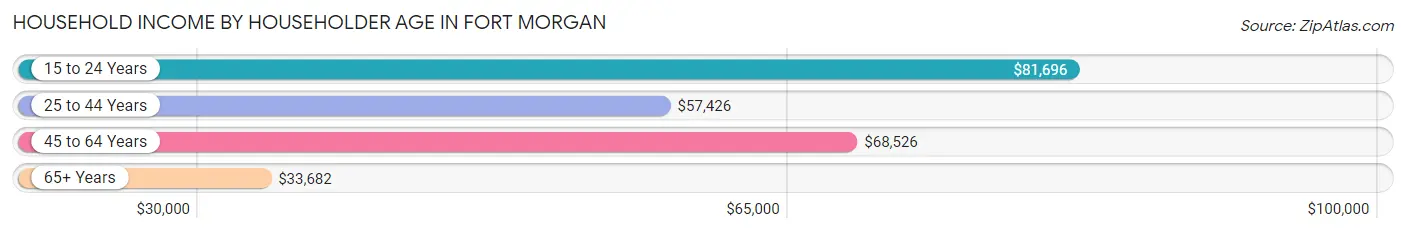
The median household income in Fort Morgan is $55,407, with the highest median household income of $81,696 found in the 15 to 24 years age bracket for the primary householder. A total of 179 households (4.1%) fall into this category. Meanwhile, the 65+ years age bracket for the primary householder has the lowest median household income of $33,682, with 1,222 households (28.3%) in this group.
| Income Bracket | # Households | Median Income |
| 15 to 24 Years | 179 (4.1%) | $81,696 |
| 25 to 44 Years | 1,787 (41.3%) | $57,426 |
| 45 to 64 Years | 1,134 (26.2%) | $68,526 |
| 65+ Years | 1,222 (28.3%) | $33,682 |
| Total | 4,322 (100.0%) | $55,407 |
Poverty in Fort Morgan
Income Below Poverty by Sex and Age in Fort Morgan
With 12.6% poverty level for males and 18.8% for females among the residents of Fort Morgan, 16 and 17 year old males and 55 to 64 year old females are the most vulnerable to poverty, with 60 males (43.8%) and 178 females (31.0%) in their respective age groups living below the poverty level.
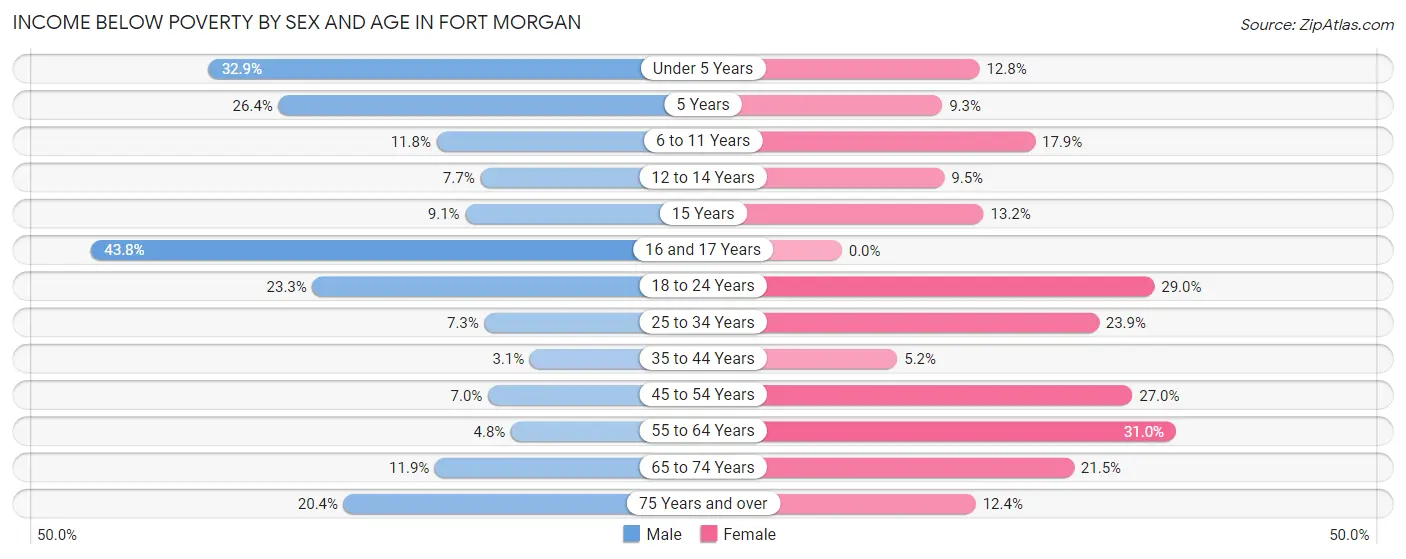
| Age Bracket | Male | Female |
| Under 5 Years | 130 (32.9%) | 63 (12.8%) |
| 5 Years | 14 (26.4%) | 11 (9.3%) |
| 6 to 11 Years | 96 (11.7%) | 96 (17.9%) |
| 12 to 14 Years | 9 (7.7%) | 16 (9.5%) |
| 15 Years | 7 (9.1%) | 15 (13.2%) |
| 16 and 17 Years | 60 (43.8%) | 0 (0.0%) |
| 18 to 24 Years | 141 (23.3%) | 163 (29.0%) |
| 25 to 34 Years | 70 (7.3%) | 166 (23.8%) |
| 35 to 44 Years | 26 (3.1%) | 43 (5.1%) |
| 45 to 54 Years | 41 (7.0%) | 141 (27.0%) |
| 55 to 64 Years | 20 (4.8%) | 178 (31.0%) |
| 65 to 74 Years | 50 (11.9%) | 106 (21.5%) |
| 75 Years and over | 44 (20.4%) | 63 (12.4%) |
| Total | 708 (12.6%) | 1,061 (18.8%) |
Income Above Poverty by Sex and Age in Fort Morgan
According to the poverty statistics in Fort Morgan, males aged 35 to 44 years and females aged 16 and 17 years are the age groups that are most secure financially, with 96.9% of males and 100.0% of females in these age groups living above the poverty line.
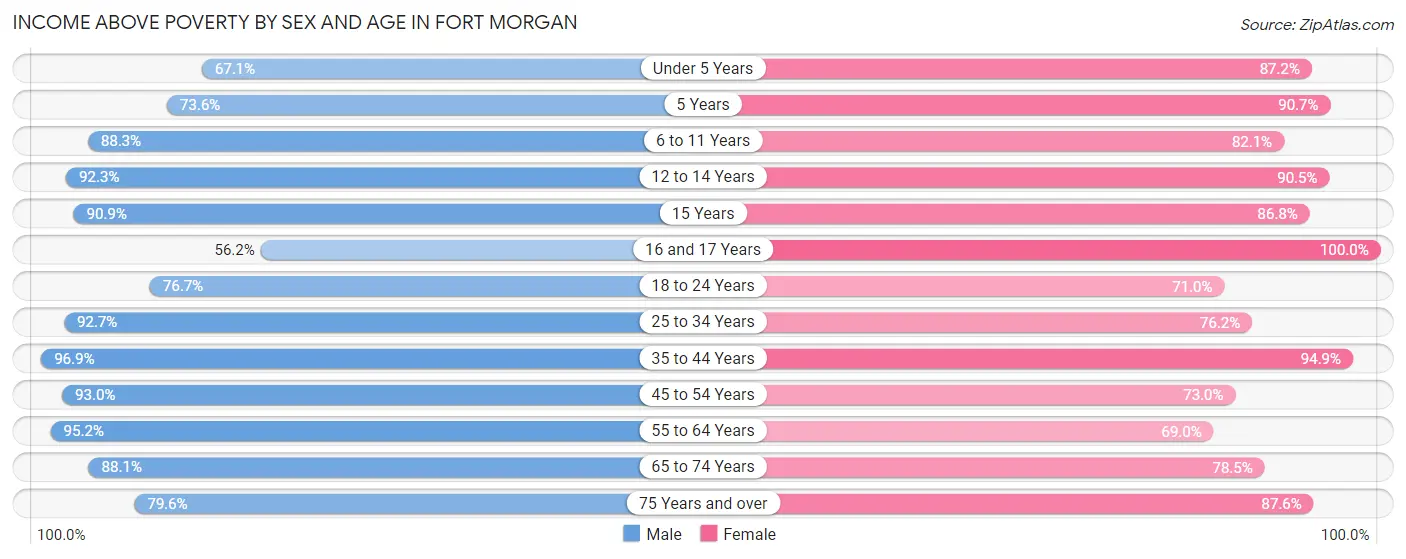
| Age Bracket | Male | Female |
| Under 5 Years | 265 (67.1%) | 430 (87.2%) |
| 5 Years | 39 (73.6%) | 107 (90.7%) |
| 6 to 11 Years | 721 (88.2%) | 439 (82.1%) |
| 12 to 14 Years | 108 (92.3%) | 152 (90.5%) |
| 15 Years | 70 (90.9%) | 99 (86.8%) |
| 16 and 17 Years | 77 (56.2%) | 42 (100.0%) |
| 18 to 24 Years | 465 (76.7%) | 399 (71.0%) |
| 25 to 34 Years | 888 (92.7%) | 530 (76.1%) |
| 35 to 44 Years | 815 (96.9%) | 792 (94.9%) |
| 45 to 54 Years | 546 (93.0%) | 382 (73.0%) |
| 55 to 64 Years | 393 (95.2%) | 396 (69.0%) |
| 65 to 74 Years | 370 (88.1%) | 386 (78.5%) |
| 75 Years and over | 172 (79.6%) | 444 (87.6%) |
| Total | 4,929 (87.4%) | 4,598 (81.2%) |
Income Below Poverty Among Married-Couple Families in Fort Morgan
The poverty statistics for married-couple families in Fort Morgan show that 3.5% or 66 of the total 1,869 families live below the poverty line. Families with no children have the highest poverty rate of 7.4%, comprising of 56 families. On the other hand, families with 1 or 2 children have the lowest poverty rate of 0.0%, which includes 0 families.
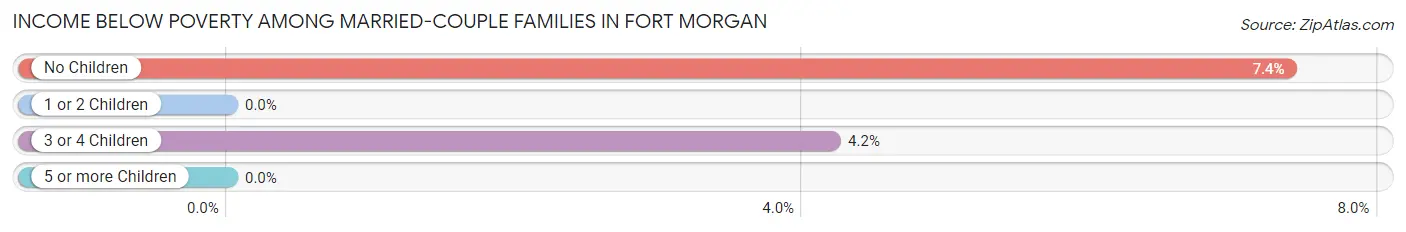
| Children | Above Poverty | Below Poverty |
| No Children | 704 (92.6%) | 56 (7.4%) |
| 1 or 2 Children | 861 (100.0%) | 0 (0.0%) |
| 3 or 4 Children | 228 (95.8%) | 10 (4.2%) |
| 5 or more Children | 10 (100.0%) | 0 (0.0%) |
| Total | 1,803 (96.5%) | 66 (3.5%) |
Income Below Poverty Among Single-Parent Households in Fort Morgan
According to the poverty data in Fort Morgan, 32.5% or 105 single-father households and 29.1% or 157 single-mother households are living below the poverty line. Among single-father households, those with 1 or 2 children have the highest poverty rate, with 105 households (39.8%) experiencing poverty. Likewise, among single-mother households, those with 3 or 4 children have the highest poverty rate, with 104 households (75.9%) falling below the poverty line.
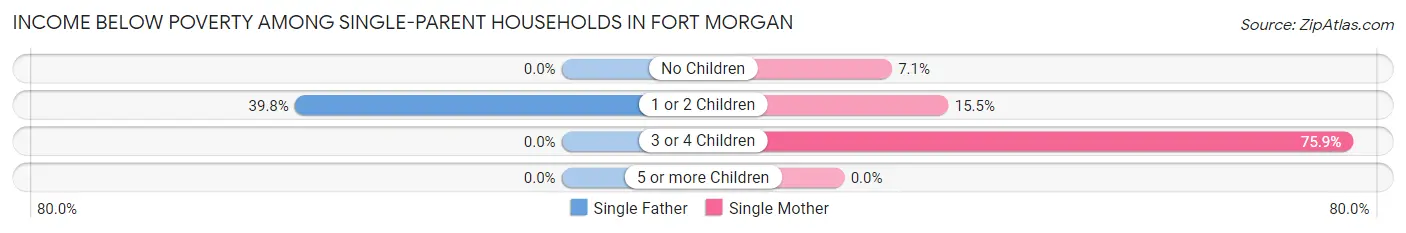
| Children | Single Father | Single Mother |
| No Children | 0 (0.0%) | 8 (7.1%) |
| 1 or 2 Children | 105 (39.8%) | 45 (15.5%) |
| 3 or 4 Children | 0 (0.0%) | 104 (75.9%) |
| 5 or more Children | 0 (0.0%) | 0 (0.0%) |
| Total | 105 (32.5%) | 157 (29.1%) |
Income Below Poverty Among Married-Couple vs Single-Parent Households in Fort Morgan
The poverty data for Fort Morgan shows that 66 of the married-couple family households (3.5%) and 262 of the single-parent households (30.4%) are living below the poverty level. Within the married-couple family households, those with no children have the highest poverty rate, with 56 households (7.4%) falling below the poverty line. Among the single-parent households, those with 3 or 4 children have the highest poverty rate, with 104 household (75.9%) living below poverty.
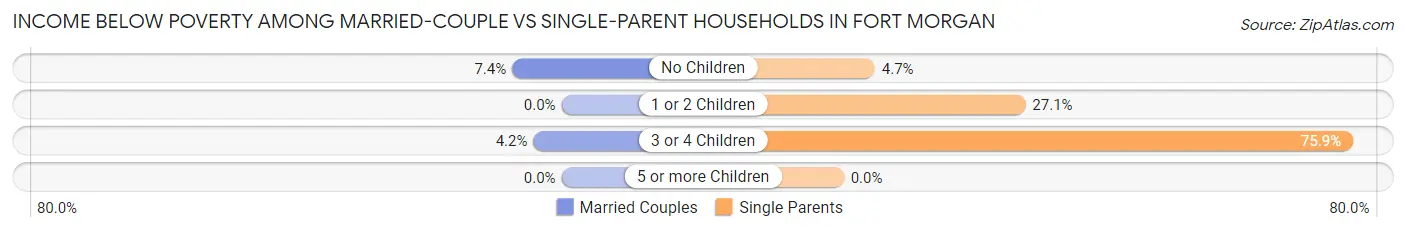
| Children | Married-Couple Families | Single-Parent Households |
| No Children | 56 (7.4%) | 8 (4.6%) |
| 1 or 2 Children | 0 (0.0%) | 150 (27.1%) |
| 3 or 4 Children | 10 (4.2%) | 104 (75.9%) |
| 5 or more Children | 0 (0.0%) | 0 (0.0%) |
| Total | 66 (3.5%) | 262 (30.4%) |
Race in Fort Morgan
The most populous races in Fort Morgan are White / Caucasian (6,708 | 58.3%), Hispanic or Latino (5,637 | 49.0%), and Two or more Races (2,644 | 23.0%).
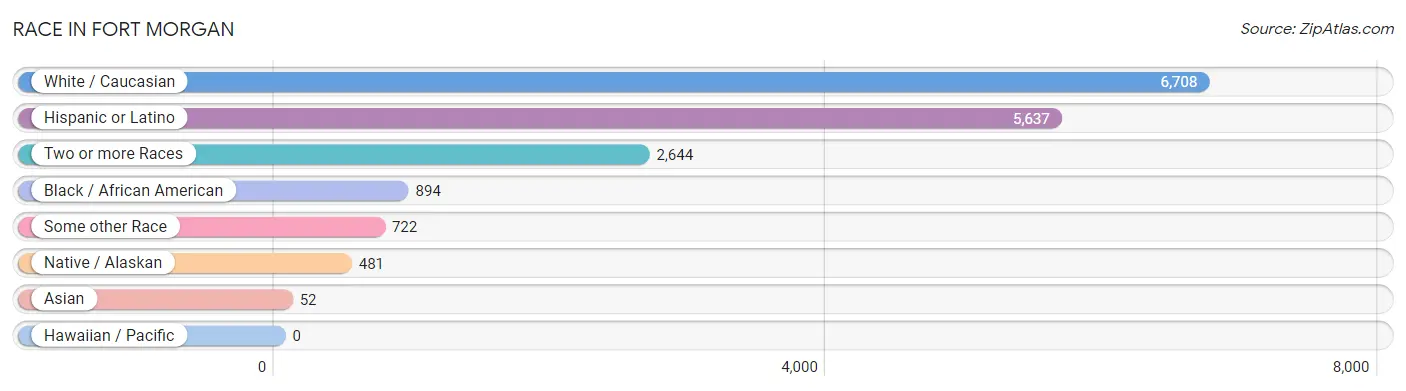
| Race | # Population | % Population |
| Asian | 52 | 0.4% |
| Black / African American | 894 | 7.8% |
| Hawaiian / Pacific | 0 | 0.0% |
| Hispanic or Latino | 5,637 | 49.0% |
| Native / Alaskan | 481 | 4.2% |
| White / Caucasian | 6,708 | 58.3% |
| Two or more Races | 2,644 | 23.0% |
| Some other Race | 722 | 6.3% |
| Total | 11,501 | 100.0% |
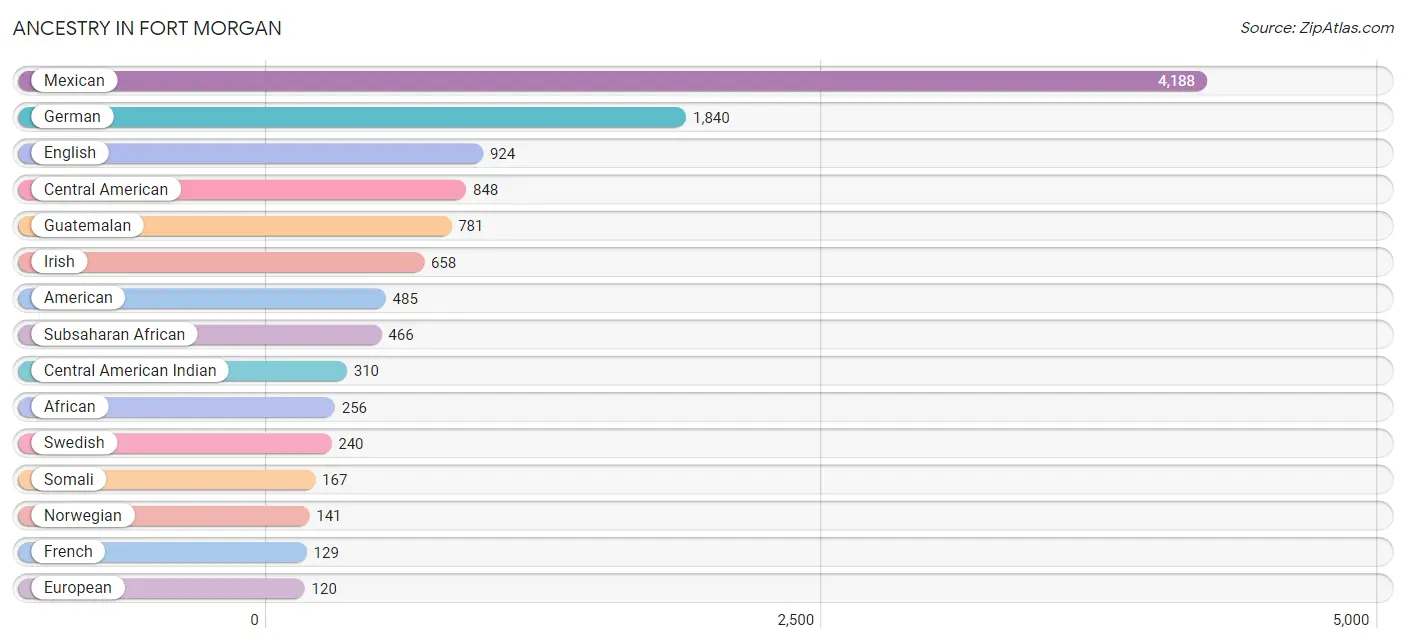
Ancestry in Fort Morgan
The most populous ancestries reported in Fort Morgan are Mexican (4,188 | 36.4%), German (1,840 | 16.0%), English (924 | 8.0%), Central American (848 | 7.4%), and Guatemalan (781 | 6.8%), together accounting for 74.6% of all Fort Morgan residents.
| Ancestry | # Population | % Population |
| African | 256 | 2.2% |
| American | 485 | 4.2% |
| Apache | 57 | 0.5% |
| Arapaho | 11 | 0.1% |
| Blackfeet | 17 | 0.2% |
| Canadian | 11 | 0.1% |
| Central American | 848 | 7.4% |
| Central American Indian | 310 | 2.7% |
| Cherokee | 21 | 0.2% |
| Colombian | 16 | 0.1% |
| Cuban | 12 | 0.1% |
| Czech | 22 | 0.2% |
| Danish | 95 | 0.8% |
| Dominican | 30 | 0.3% |
| Dutch | 96 | 0.8% |
| Ecuadorian | 79 | 0.7% |
| English | 924 | 8.0% |
| Ethiopian | 43 | 0.4% |
| European | 120 | 1.0% |
| French | 129 | 1.1% |
| French Canadian | 35 | 0.3% |
| German | 1,840 | 16.0% |
| Greek | 22 | 0.2% |
| Guatemalan | 781 | 6.8% |
| Indian (Asian) | 32 | 0.3% |
| Iranian | 5 | 0.0% |
| Irish | 658 | 5.7% |
| Italian | 91 | 0.8% |
| Korean | 48 | 0.4% |
| Mexican | 4,188 | 36.4% |
| Mexican American Indian | 4 | 0.0% |
| Navajo | 117 | 1.0% |
| Northern European | 7 | 0.1% |
| Norwegian | 141 | 1.2% |
| Pennsylvania German | 10 | 0.1% |
| Peruvian | 12 | 0.1% |
| Polish | 78 | 0.7% |
| Puerto Rican | 87 | 0.8% |
| Russian | 90 | 0.8% |
| Salvadoran | 67 | 0.6% |
| Scandinavian | 11 | 0.1% |
| Scotch-Irish | 25 | 0.2% |
| Scottish | 98 | 0.9% |
| Sioux | 55 | 0.5% |
| Slovak | 13 | 0.1% |
| Somali | 167 | 1.5% |
| South American | 107 | 0.9% |
| South American Indian | 12 | 0.1% |
| Spaniard | 31 | 0.3% |
| Spanish | 25 | 0.2% |
| Subsaharan African | 466 | 4.1% |
| Swedish | 240 | 2.1% |
| Swiss | 20 | 0.2% |
| Welsh | 5 | 0.0% |
| Yugoslavian | 18 | 0.2% | View All 55 Rows |
Immigrants in Fort Morgan
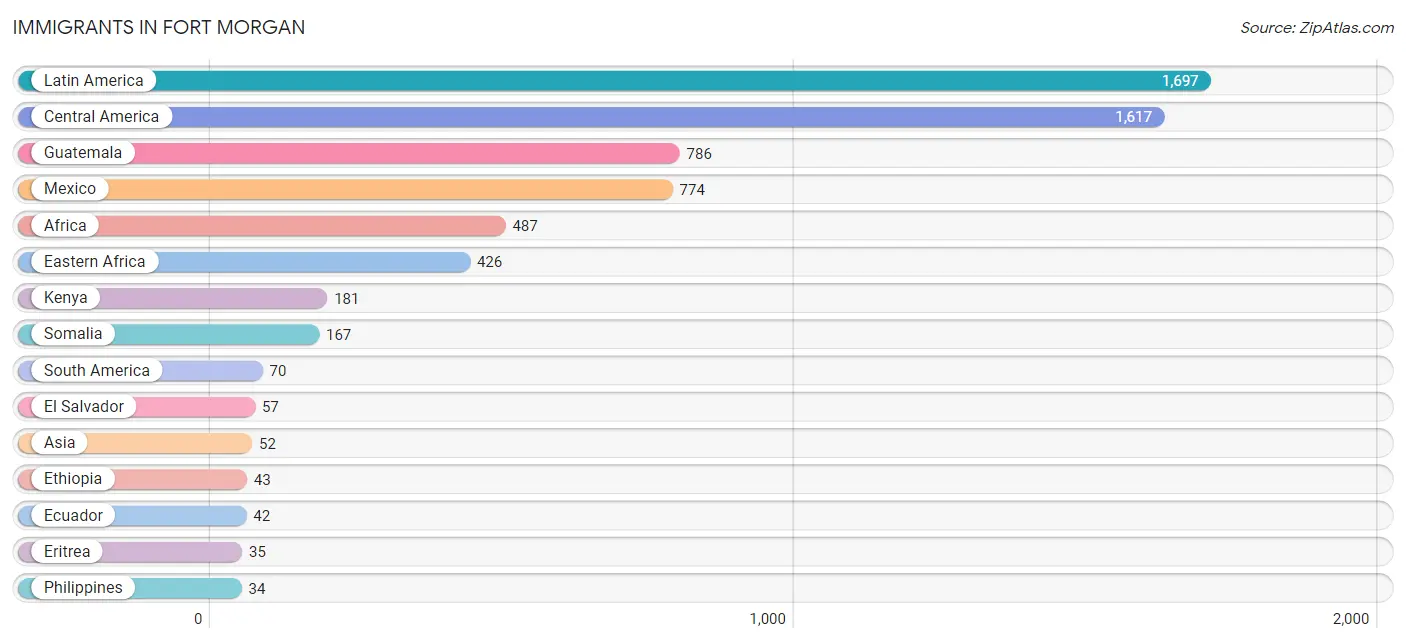
The most numerous immigrant groups reported in Fort Morgan came from Latin America (1,697 | 14.8%), Central America (1,617 | 14.1%), Guatemala (786 | 6.8%), Mexico (774 | 6.7%), and Africa (487 | 4.2%), together accounting for 46.6% of all Fort Morgan residents.
| Immigration Origin | # Population | % Population |
| Africa | 487 | 4.2% |
| Asia | 52 | 0.4% |
| Bosnia and Herzegovina | 5 | 0.0% |
| Canada | 11 | 0.1% |
| Caribbean | 10 | 0.1% |
| Central America | 1,617 | 14.1% |
| China | 13 | 0.1% |
| Colombia | 16 | 0.1% |
| Dominican Republic | 10 | 0.1% |
| Eastern Africa | 426 | 3.7% |
| Eastern Asia | 13 | 0.1% |
| Eastern Europe | 5 | 0.0% |
| Ecuador | 42 | 0.4% |
| El Salvador | 57 | 0.5% |
| Eritrea | 35 | 0.3% |
| Ethiopia | 43 | 0.4% |
| Europe | 5 | 0.0% |
| Guatemala | 786 | 6.8% |
| Iran | 5 | 0.0% |
| Kenya | 181 | 1.6% |
| Latin America | 1,697 | 14.8% |
| Mexico | 774 | 6.7% |
| Peru | 12 | 0.1% |
| Philippines | 34 | 0.3% |
| Somalia | 167 | 1.5% |
| South America | 70 | 0.6% |
| South Central Asia | 5 | 0.0% |
| South Eastern Asia | 34 | 0.3% | View All 28 Rows |
Sex and Age in Fort Morgan
Sex and Age in Fort Morgan
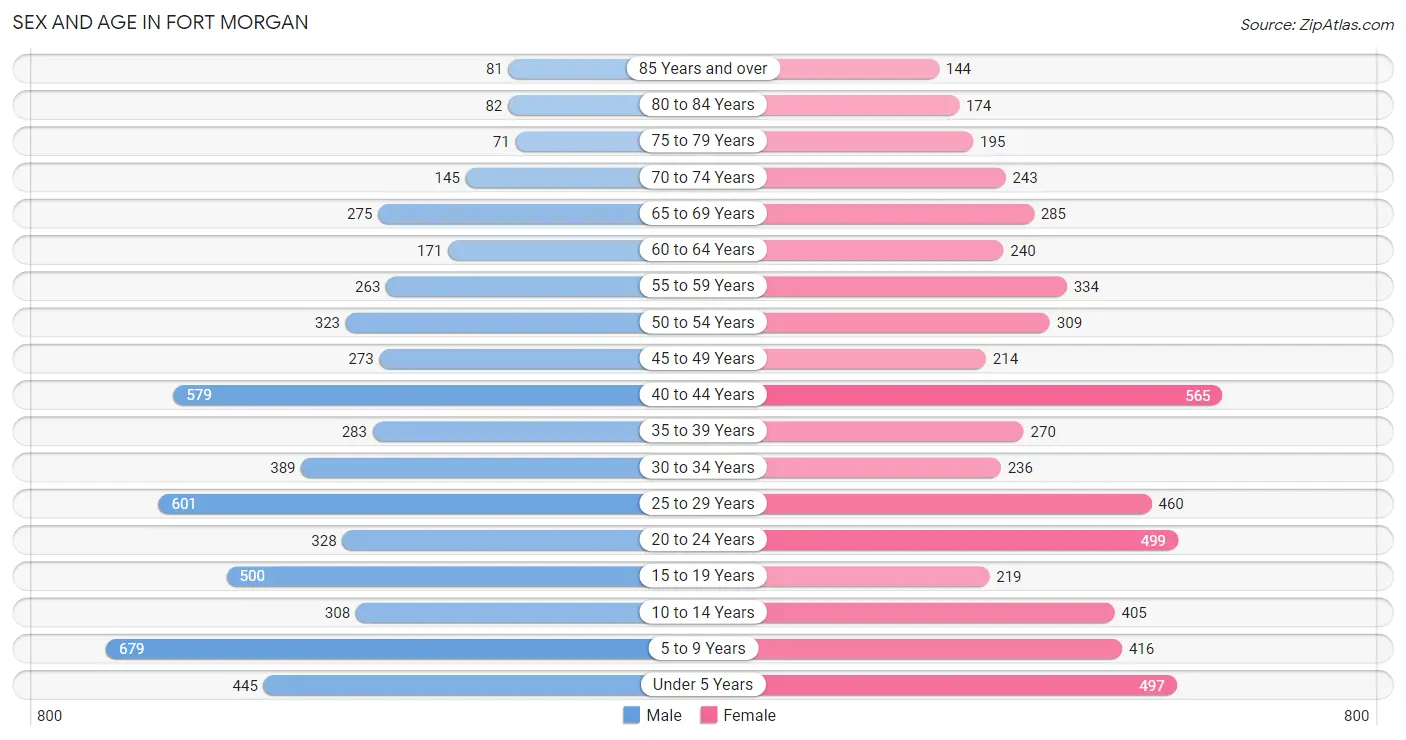
The most populous age groups in Fort Morgan are 5 to 9 Years (679 | 11.7%) for men and 40 to 44 Years (565 | 9.9%) for women.
| Age Bracket | Male | Female |
| Under 5 Years | 445 (7.7%) | 497 (8.7%) |
| 5 to 9 Years | 679 (11.7%) | 416 (7.3%) |
| 10 to 14 Years | 308 (5.3%) | 405 (7.1%) |
| 15 to 19 Years | 500 (8.6%) | 219 (3.8%) |
| 20 to 24 Years | 328 (5.7%) | 499 (8.7%) |
| 25 to 29 Years | 601 (10.4%) | 460 (8.1%) |
| 30 to 34 Years | 389 (6.7%) | 236 (4.1%) |
| 35 to 39 Years | 283 (4.9%) | 270 (4.7%) |
| 40 to 44 Years | 579 (10.0%) | 565 (9.9%) |
| 45 to 49 Years | 273 (4.7%) | 214 (3.7%) |
| 50 to 54 Years | 323 (5.6%) | 309 (5.4%) |
| 55 to 59 Years | 263 (4.5%) | 334 (5.9%) |
| 60 to 64 Years | 171 (2.9%) | 240 (4.2%) |
| 65 to 69 Years | 275 (4.7%) | 285 (5.0%) |
| 70 to 74 Years | 145 (2.5%) | 243 (4.3%) |
| 75 to 79 Years | 71 (1.2%) | 195 (3.4%) |
| 80 to 84 Years | 82 (1.4%) | 174 (3.0%) |
| 85 Years and over | 81 (1.4%) | 144 (2.5%) |
| Total | 5,796 (100.0%) | 5,705 (100.0%) |
Families and Households in Fort Morgan
Median Family Size in Fort Morgan
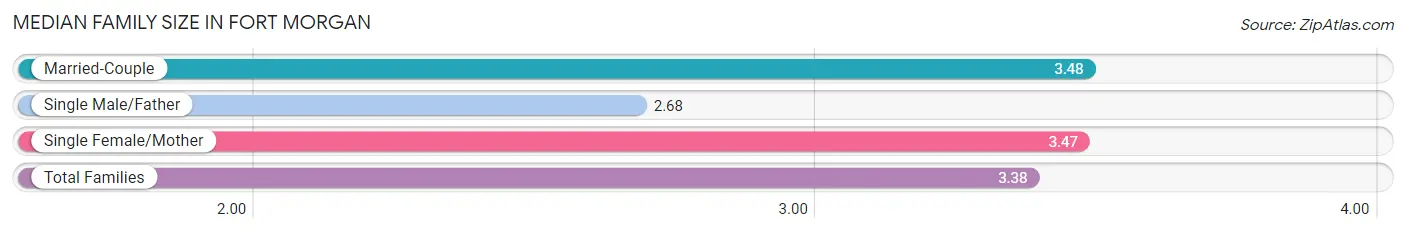
The median family size in Fort Morgan is 3.38 persons per family, with married-couple families (1,869 | 68.4%) accounting for the largest median family size of 3.48 persons per family. On the other hand, single male/father families (323 | 11.8%) represent the smallest median family size with 2.68 persons per family.
| Family Type | # Families | Family Size |
| Married-Couple | 1,869 (68.4%) | 3.48 |
| Single Male/Father | 323 (11.8%) | 2.68 |
| Single Female/Mother | 540 (19.8%) | 3.47 |
| Total Families | 2,732 (100.0%) | 3.38 |
Median Household Size in Fort Morgan
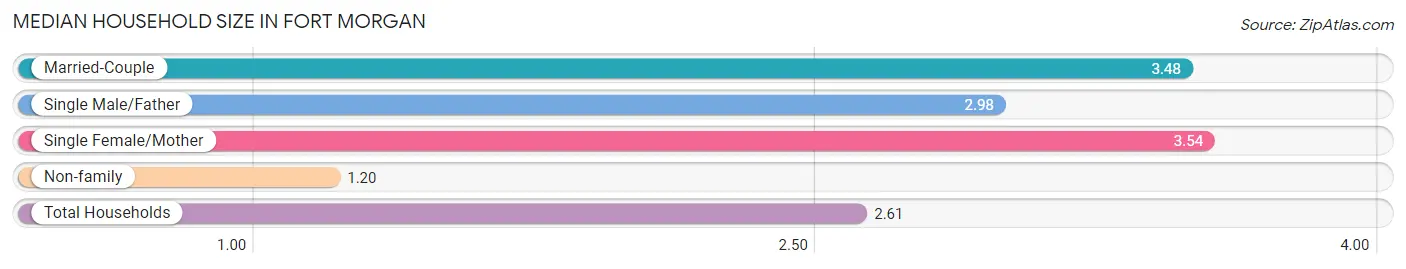
The median household size in Fort Morgan is 2.61 persons per household, with single female/mother households (540 | 12.5%) accounting for the largest median household size of 3.54 persons per household. non-family households (1,590 | 36.8%) represent the smallest median household size with 1.20 persons per household.
| Household Type | # Households | Household Size |
| Married-Couple | 1,869 (43.2%) | 3.48 |
| Single Male/Father | 323 (7.5%) | 2.98 |
| Single Female/Mother | 540 (12.5%) | 3.54 |
| Non-family | 1,590 (36.8%) | 1.20 |
| Total Households | 4,322 (100.0%) | 2.61 |
Household Size by Marriage Status in Fort Morgan
Out of a total of 4,322 households in Fort Morgan, 2,732 (63.2%) are family households, while 1,590 (36.8%) are nonfamily households. The most numerous type of family households are 2-person households, comprising 903, and the most common type of nonfamily households are 1-person households, comprising 1,397.
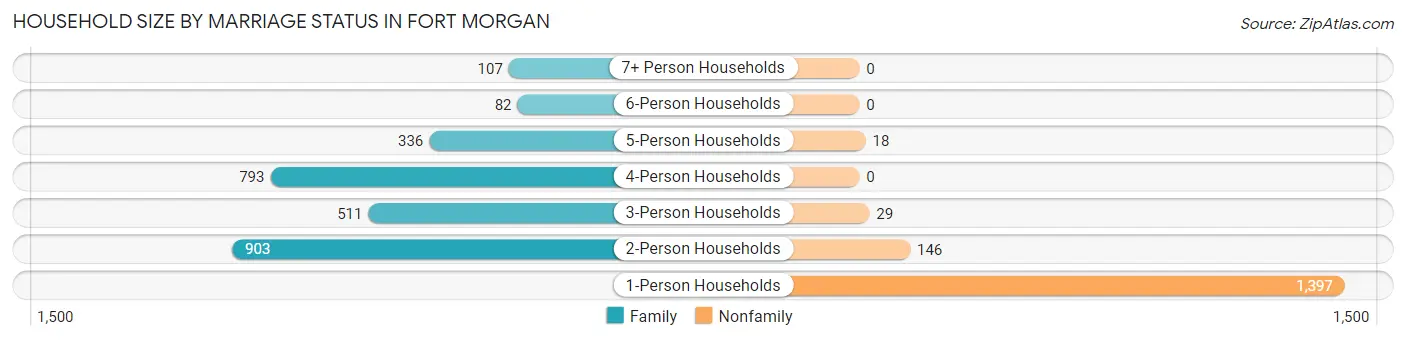
| Household Size | Family Households | Nonfamily Households |
| 1-Person Households | - | 1,397 (32.3%) |
| 2-Person Households | 903 (20.9%) | 146 (3.4%) |
| 3-Person Households | 511 (11.8%) | 29 (0.7%) |
| 4-Person Households | 793 (18.3%) | 0 (0.0%) |
| 5-Person Households | 336 (7.8%) | 18 (0.4%) |
| 6-Person Households | 82 (1.9%) | 0 (0.0%) |
| 7+ Person Households | 107 (2.5%) | 0 (0.0%) |
| Total | 2,732 (63.2%) | 1,590 (36.8%) |
Female Fertility in Fort Morgan
Fertility by Age in Fort Morgan
Average fertility rate in Fort Morgan is 103.0 births per 1,000 women. Women in the age bracket of 20 to 34 years have the highest fertility rate with 152.0 births per 1,000 women. Women in the age bracket of 20 to 34 years acount for 69.5% of all women with births.
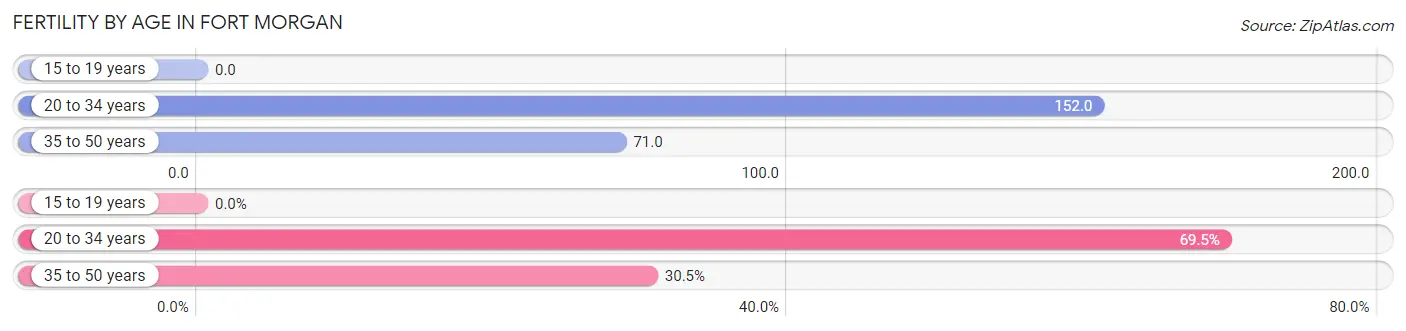
| Age Bracket | Women with Births | Births / 1,000 Women |
| 15 to 19 years | 0 (0.0%) | 0.0 |
| 20 to 34 years | 182 (69.5%) | 152.0 |
| 35 to 50 years | 80 (30.5%) | 71.0 |
| Total | 262 (100.0%) | 103.0 |
Fertility by Age by Marriage Status in Fort Morgan
49.6% of women with births (262) in Fort Morgan are married. The highest percentage of unmarried women with births falls into 35 to 50 years age bracket with 66.2% of them unmarried at the time of birth, while the lowest percentage of unmarried women with births belong to 20 to 34 years age bracket with 43.4% of them unmarried.
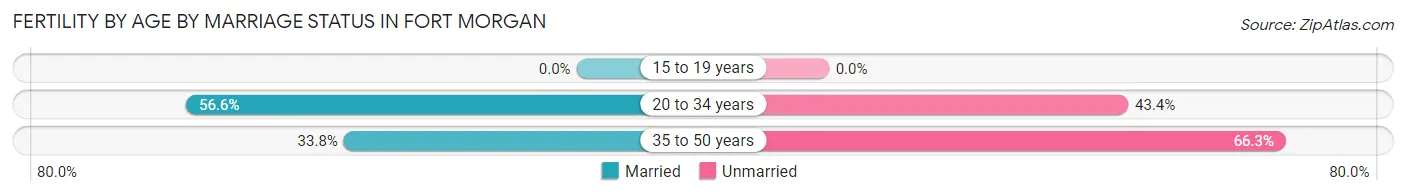
| Age Bracket | Married | Unmarried |
| 15 to 19 years | 0 (0.0%) | 0 (0.0%) |
| 20 to 34 years | 103 (56.6%) | 79 (43.4%) |
| 35 to 50 years | 27 (33.8%) | 53 (66.2%) |
| Total | 130 (49.6%) | 132 (50.4%) |
Fertility by Education in Fort Morgan
Average fertility rate in Fort Morgan is 103.0 births per 1,000 women. Women with the education attainment of graduate degree have the highest fertility rate of 427.0 births per 1,000 women, while women with the education attainment of less than high school have the lowest fertility at 19.0 births per 1,000 women. Women with the education attainment of college or associate's degree represent 58.0% of all women with births.
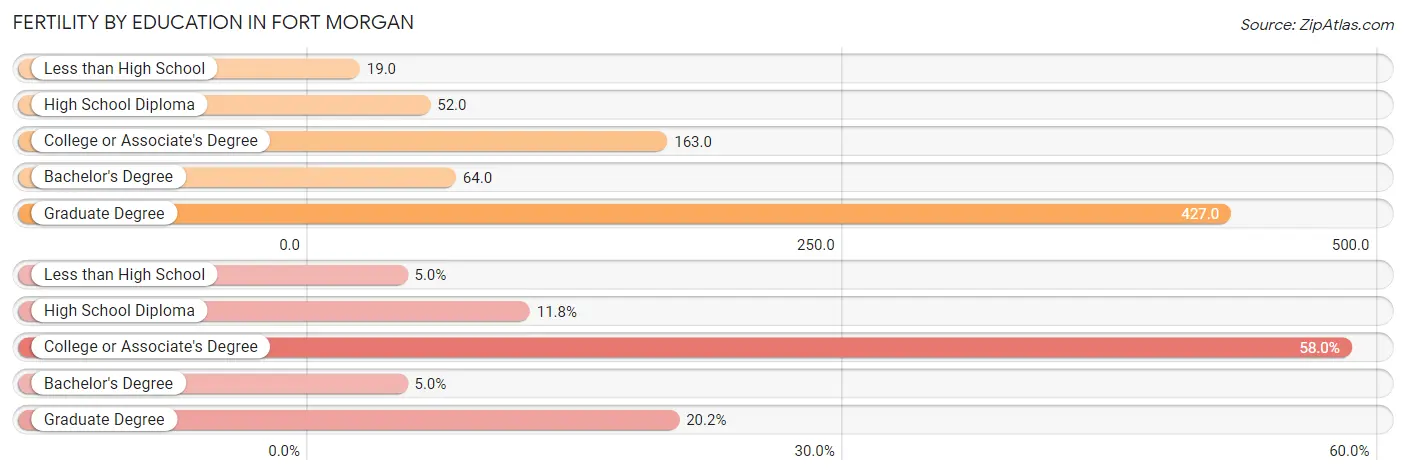
| Educational Attainment | Women with Births | Births / 1,000 Women |
| Less than High School | 13 (5.0%) | 19.0 |
| High School Diploma | 31 (11.8%) | 52.0 |
| College or Associate's Degree | 152 (58.0%) | 163.0 |
| Bachelor's Degree | 13 (5.0%) | 64.0 |
| Graduate Degree | 53 (20.2%) | 427.0 |
| Total | 262 (100.0%) | 103.0 |
Fertility by Education by Marriage Status in Fort Morgan
50.4% of women with births in Fort Morgan are unmarried. Women with the educational attainment of less than high school are most likely to be married with 100.0% of them married at childbirth, while women with the educational attainment of graduate degree are least likely to be married with 100.0% of them unmarried at childbirth.
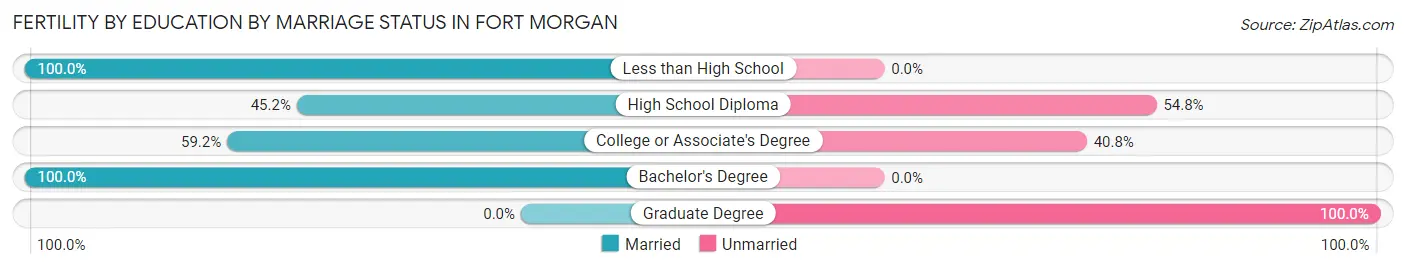
| Educational Attainment | Married | Unmarried |
| Less than High School | 13 (100.0%) | 0 (0.0%) |
| High School Diploma | 14 (45.2%) | 17 (54.8%) |
| College or Associate's Degree | 90 (59.2%) | 62 (40.8%) |
| Bachelor's Degree | 13 (100.0%) | 0 (0.0%) |
| Graduate Degree | 0 (0.0%) | 53 (100.0%) |
| Total | 130 (49.6%) | 132 (50.4%) |
Employment Characteristics in Fort Morgan
Employment by Class of Employer in Fort Morgan
Among the 5,184 employed individuals in Fort Morgan, private company employees (3,824 | 73.8%), local government employees (475 | 9.2%), and not-for-profit organizations (356 | 6.9%) make up the most common classes of employment.
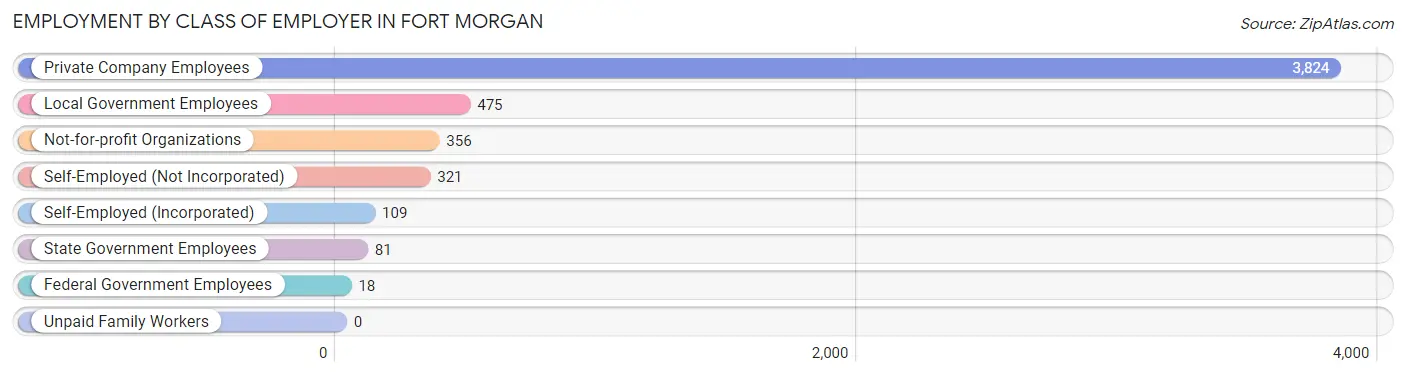
| Employer Class | # Employees | % Employees |
| Private Company Employees | 3,824 | 73.8% |
| Self-Employed (Incorporated) | 109 | 2.1% |
| Self-Employed (Not Incorporated) | 321 | 6.2% |
| Not-for-profit Organizations | 356 | 6.9% |
| Local Government Employees | 475 | 9.2% |
| State Government Employees | 81 | 1.6% |
| Federal Government Employees | 18 | 0.4% |
| Unpaid Family Workers | 0 | 0.0% |
| Total | 5,184 | 100.0% |
Employment Status by Age in Fort Morgan
According to the labor force statistics for Fort Morgan, out of the total population over 16 years of age (8,560), 65.0% or 5,564 individuals are in the labor force, with 4.9% or 273 of them unemployed. The age group with the highest labor force participation rate is 30 to 34 years, with 93.8% or 586 individuals in the labor force. Within the labor force, the 16 to 19 years age range has the highest percentage of unemployed individuals, with 19.4% or 32 of them being unemployed.
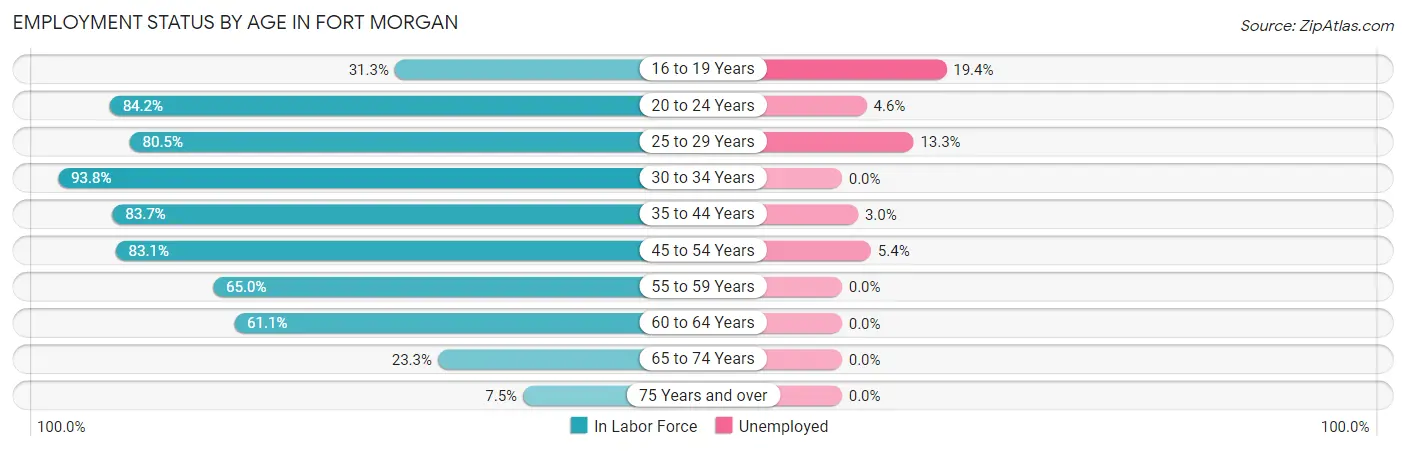
| Age Bracket | In Labor Force | Unemployed |
| 16 to 19 Years | 165 (31.3%) | 32 (19.4%) |
| 20 to 24 Years | 696 (84.2%) | 32 (4.6%) |
| 25 to 29 Years | 854 (80.5%) | 114 (13.3%) |
| 30 to 34 Years | 586 (93.8%) | 0 (0.0%) |
| 35 to 44 Years | 1,420 (83.7%) | 43 (3.0%) |
| 45 to 54 Years | 930 (83.1%) | 50 (5.4%) |
| 55 to 59 Years | 388 (65.0%) | 0 (0.0%) |
| 60 to 64 Years | 251 (61.1%) | 0 (0.0%) |
| 65 to 74 Years | 221 (23.3%) | 0 (0.0%) |
| 75 Years and over | 56 (7.5%) | 0 (0.0%) |
| Total | 5,564 (65.0%) | 273 (4.9%) |
Employment Status by Educational Attainment in Fort Morgan
According to labor force statistics for Fort Morgan, 80.4% of individuals (4,430) out of the total population between 25 and 64 years of age (5,510) are in the labor force, with 4.7% or 208 of them being unemployed. The group with the highest labor force participation rate are those with the educational attainment of bachelor's degree or higher, with 87.2% or 881 individuals in the labor force. Within the labor force, individuals with college / associate degree education have the highest percentage of unemployment, with 7.4% or 91 of them being unemployed.
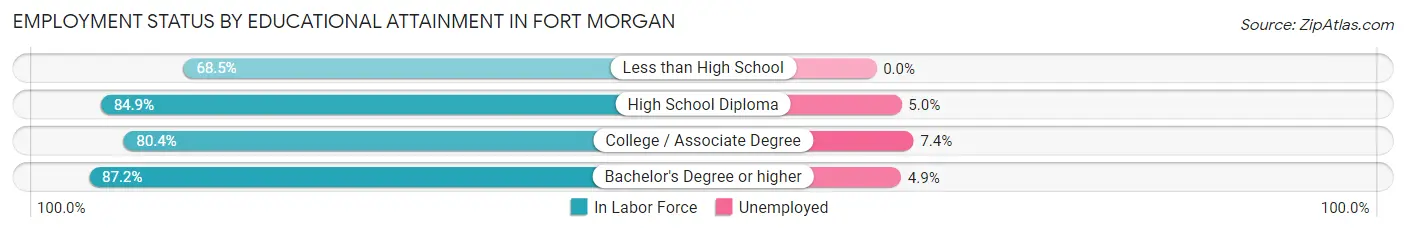
| Educational Attainment | In Labor Force | Unemployed |
| Less than High School | 851 (68.5%) | 0 (0.0%) |
| High School Diploma | 1,468 (84.9%) | 86 (5.0%) |
| College / Associate Degree | 1,229 (80.4%) | 113 (7.4%) |
| Bachelor's Degree or higher | 881 (87.2%) | 49 (4.9%) |
| Total | 4,430 (80.4%) | 259 (4.7%) |
Employment Occupations by Sex in Fort Morgan
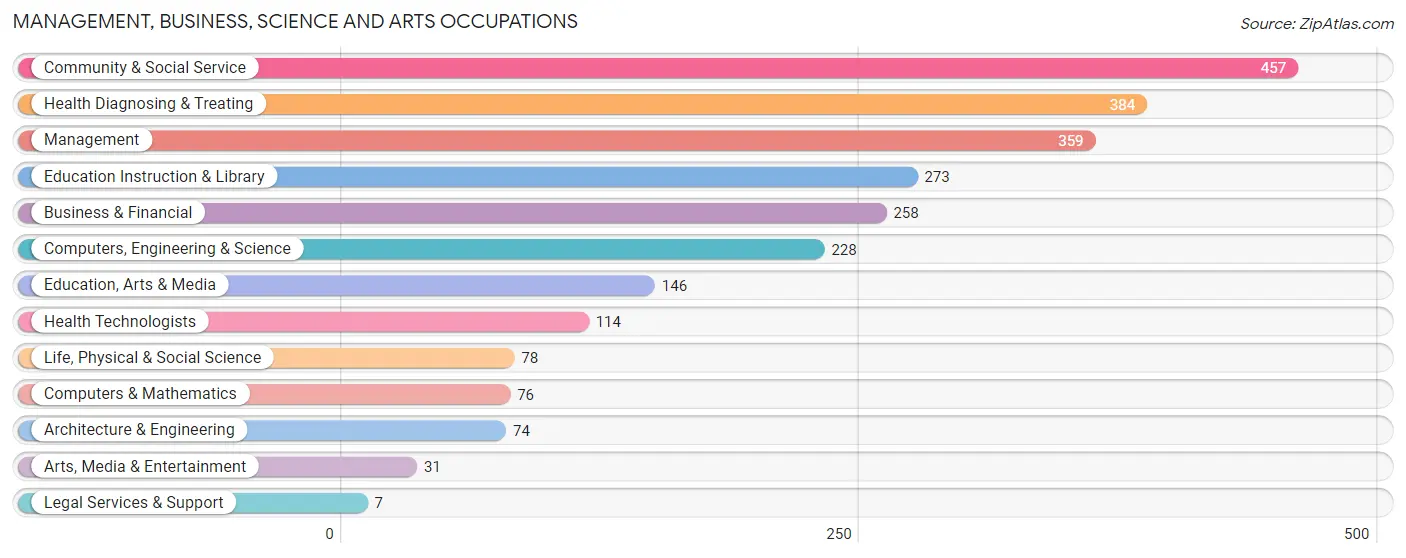
Management, Business, Science and Arts Occupations
The most common Management, Business, Science and Arts occupations in Fort Morgan are Community & Social Service (457 | 8.6%), Health Diagnosing & Treating (384 | 7.2%), Management (359 | 6.8%), Education Instruction & Library (273 | 5.1%), and Business & Financial (258 | 4.9%).
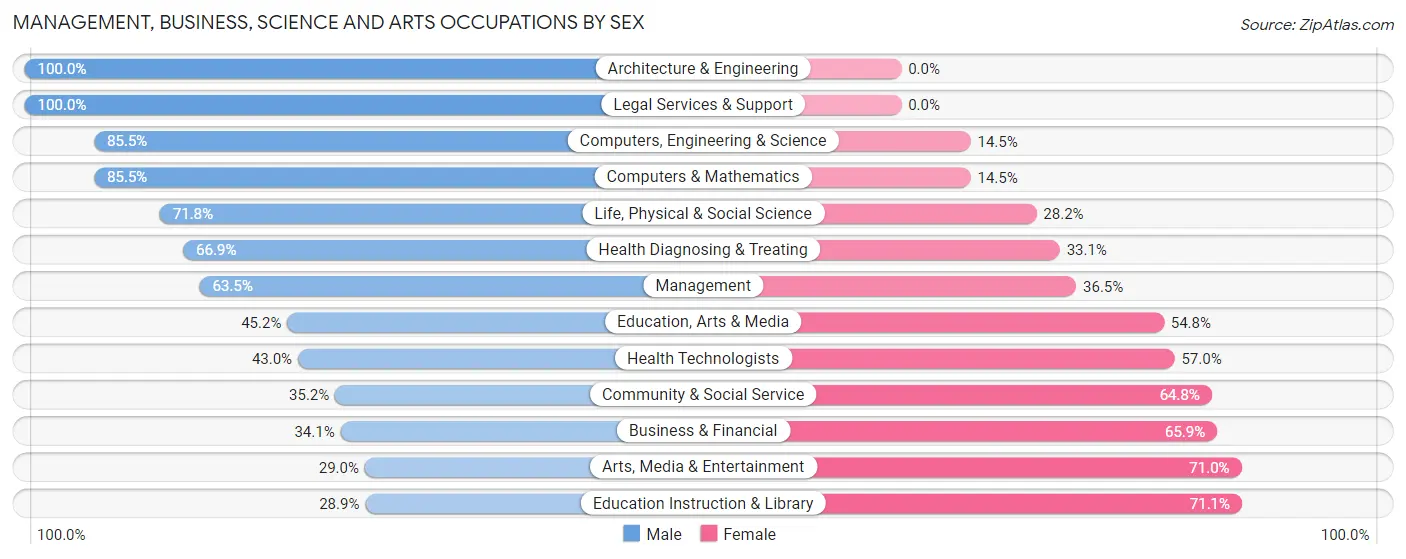
Management, Business, Science and Arts Occupations by Sex
Within the Management, Business, Science and Arts occupations in Fort Morgan, the most male-oriented occupations are Architecture & Engineering (100.0%), Legal Services & Support (100.0%), and Computers, Engineering & Science (85.5%), while the most female-oriented occupations are Education Instruction & Library (71.1%), Arts, Media & Entertainment (71.0%), and Business & Financial (65.9%).
| Occupation | Male | Female |
| Management | 228 (63.5%) | 131 (36.5%) |
| Business & Financial | 88 (34.1%) | 170 (65.9%) |
| Computers, Engineering & Science | 195 (85.5%) | 33 (14.5%) |
| Computers & Mathematics | 65 (85.5%) | 11 (14.5%) |
| Architecture & Engineering | 74 (100.0%) | 0 (0.0%) |
| Life, Physical & Social Science | 56 (71.8%) | 22 (28.2%) |
| Community & Social Service | 161 (35.2%) | 296 (64.8%) |
| Education, Arts & Media | 66 (45.2%) | 80 (54.8%) |
| Legal Services & Support | 7 (100.0%) | 0 (0.0%) |
| Education Instruction & Library | 79 (28.9%) | 194 (71.1%) |
| Arts, Media & Entertainment | 9 (29.0%) | 22 (71.0%) |
| Health Diagnosing & Treating | 257 (66.9%) | 127 (33.1%) |
| Health Technologists | 49 (43.0%) | 65 (57.0%) |
| Total (Category) | 929 (55.1%) | 757 (44.9%) |
| Total (Overall) | 3,102 (58.6%) | 2,194 (41.4%) |
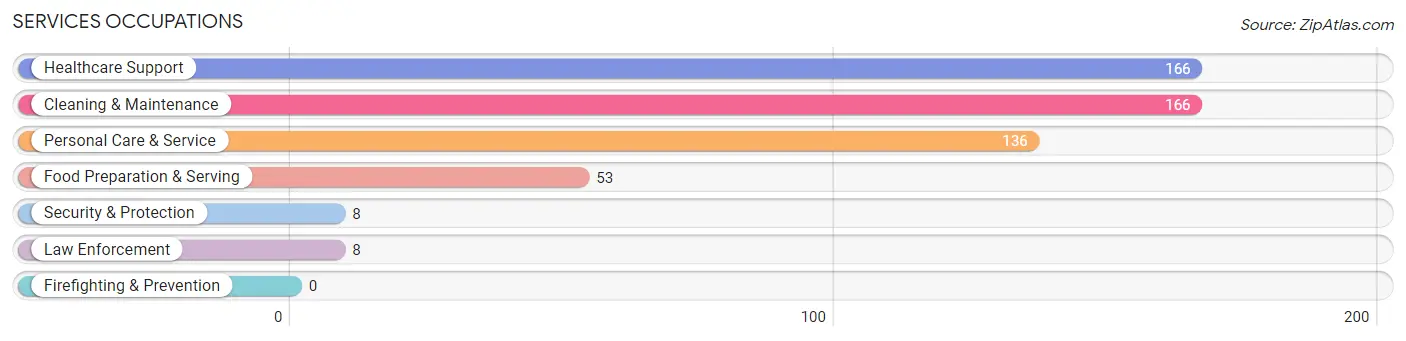
Services Occupations
The most common Services occupations in Fort Morgan are Healthcare Support (166 | 3.1%), Cleaning & Maintenance (166 | 3.1%), Personal Care & Service (136 | 2.6%), Food Preparation & Serving (53 | 1.0%), and Security & Protection (8 | 0.2%).
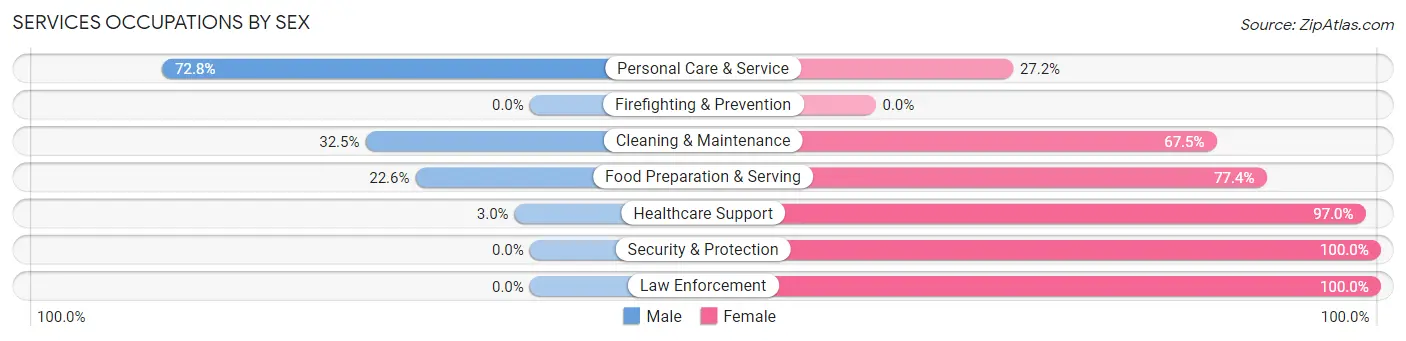
Services Occupations by Sex
Within the Services occupations in Fort Morgan, the most male-oriented occupations are Personal Care & Service (72.8%), Cleaning & Maintenance (32.5%), and Food Preparation & Serving (22.6%), while the most female-oriented occupations are Security & Protection (100.0%), Law Enforcement (100.0%), and Healthcare Support (97.0%).
| Occupation | Male | Female |
| Healthcare Support | 5 (3.0%) | 161 (97.0%) |
| Security & Protection | 0 (0.0%) | 8 (100.0%) |
| Firefighting & Prevention | 0 (0.0%) | 0 (0.0%) |
| Law Enforcement | 0 (0.0%) | 8 (100.0%) |
| Food Preparation & Serving | 12 (22.6%) | 41 (77.4%) |
| Cleaning & Maintenance | 54 (32.5%) | 112 (67.5%) |
| Personal Care & Service | 99 (72.8%) | 37 (27.2%) |
| Total (Category) | 170 (32.1%) | 359 (67.9%) |
| Total (Overall) | 3,102 (58.6%) | 2,194 (41.4%) |
Sales and Office Occupations
The most common Sales and Office occupations in Fort Morgan are Office & Administration (455 | 8.6%), and Sales & Related (279 | 5.3%).
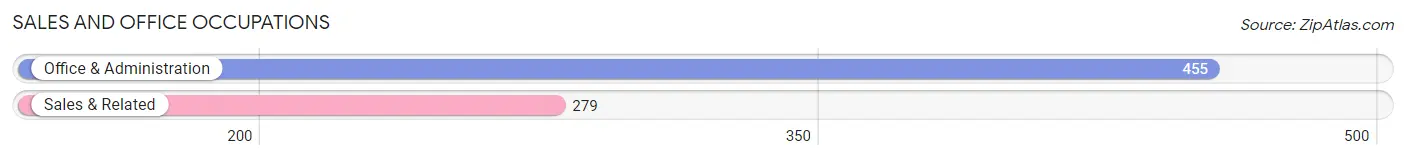
Sales and Office Occupations by Sex
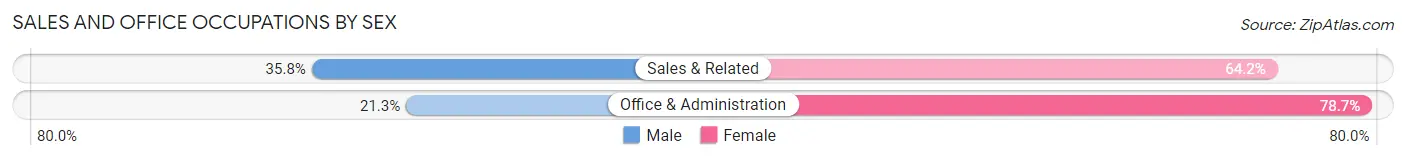
| Occupation | Male | Female |
| Sales & Related | 100 (35.8%) | 179 (64.2%) |
| Office & Administration | 97 (21.3%) | 358 (78.7%) |
| Total (Category) | 197 (26.8%) | 537 (73.2%) |
| Total (Overall) | 3,102 (58.6%) | 2,194 (41.4%) |
Natural Resources, Construction and Maintenance Occupations
The most common Natural Resources, Construction and Maintenance occupations in Fort Morgan are Construction & Extraction (411 | 7.8%), Farming, Fishing & Forestry (275 | 5.2%), and Installation, Maintenance & Repair (178 | 3.4%).
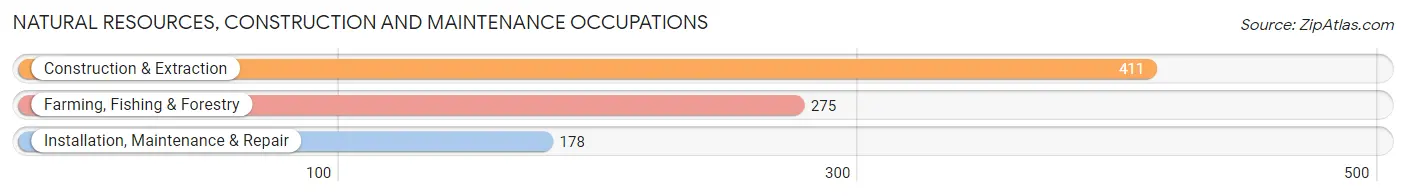
Natural Resources, Construction and Maintenance Occupations by Sex
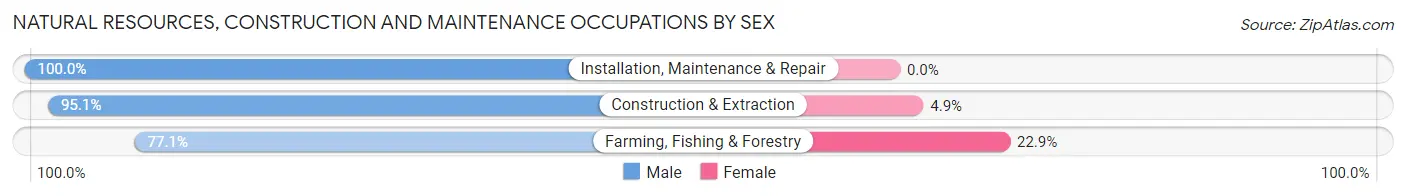
| Occupation | Male | Female |
| Farming, Fishing & Forestry | 212 (77.1%) | 63 (22.9%) |
| Construction & Extraction | 391 (95.1%) | 20 (4.9%) |
| Installation, Maintenance & Repair | 178 (100.0%) | 0 (0.0%) |
| Total (Category) | 781 (90.4%) | 83 (9.6%) |
| Total (Overall) | 3,102 (58.6%) | 2,194 (41.4%) |
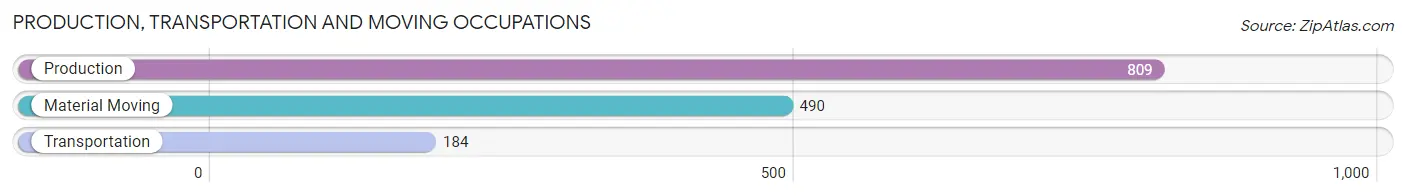
Production, Transportation and Moving Occupations
The most common Production, Transportation and Moving occupations in Fort Morgan are Production (809 | 15.3%), Material Moving (490 | 9.2%), and Transportation (184 | 3.5%).
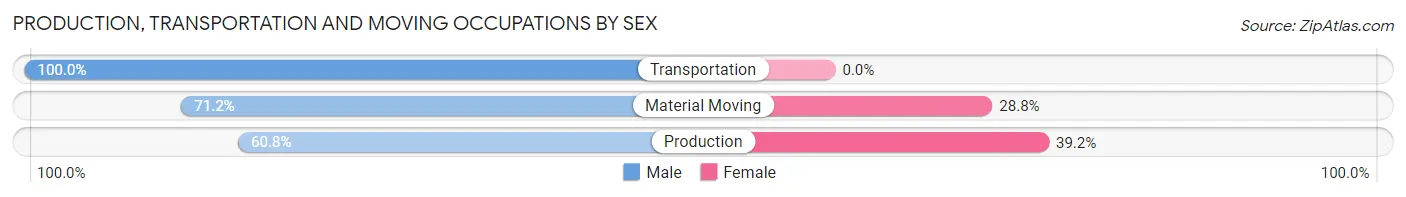
Production, Transportation and Moving Occupations by Sex
| Occupation | Male | Female |
| Production | 492 (60.8%) | 317 (39.2%) |
| Transportation | 184 (100.0%) | 0 (0.0%) |
| Material Moving | 349 (71.2%) | 141 (28.8%) |
| Total (Category) | 1,025 (69.1%) | 458 (30.9%) |
| Total (Overall) | 3,102 (58.6%) | 2,194 (41.4%) |
Employment Industries by Sex in Fort Morgan
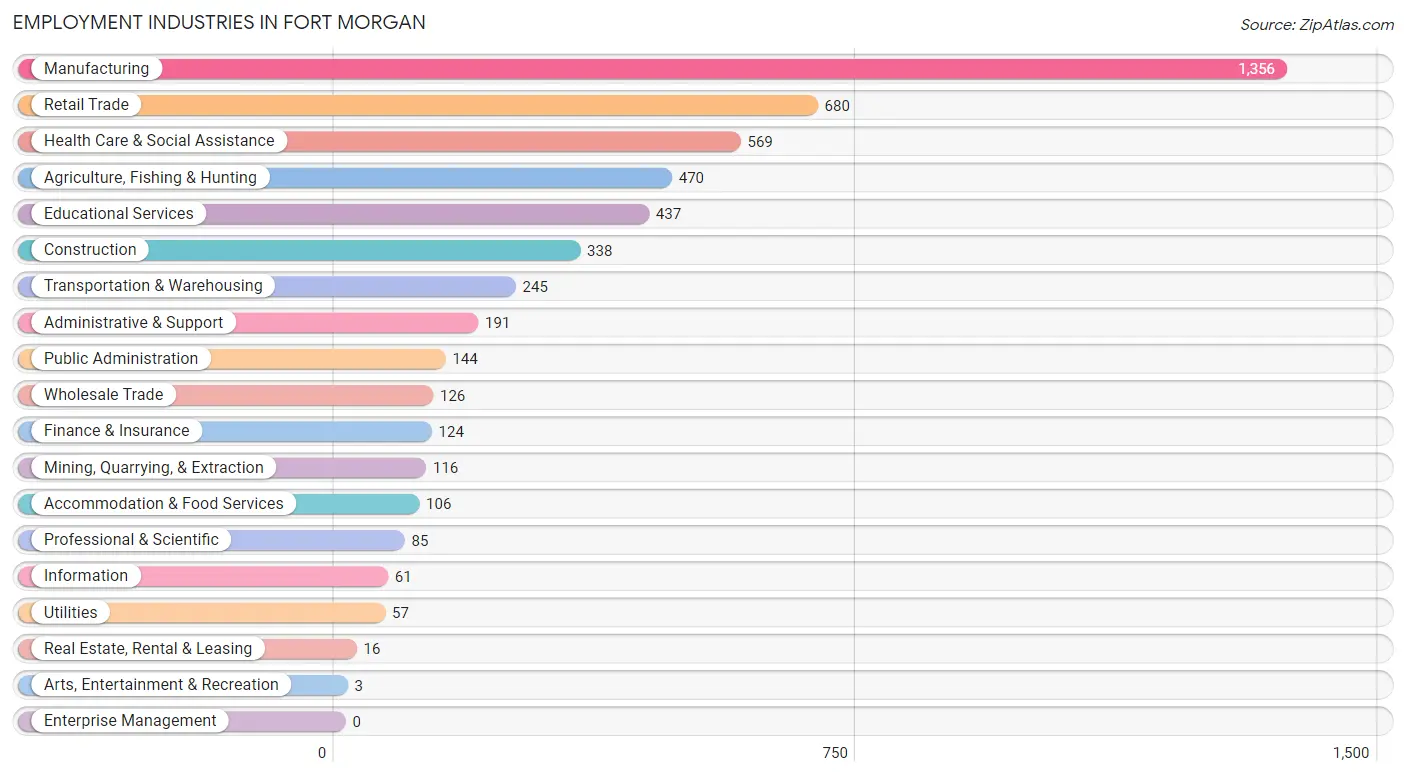
Employment Industries in Fort Morgan
The major employment industries in Fort Morgan include Manufacturing (1,356 | 25.6%), Retail Trade (680 | 12.8%), Health Care & Social Assistance (569 | 10.7%), Agriculture, Fishing & Hunting (470 | 8.9%), and Educational Services (437 | 8.3%).
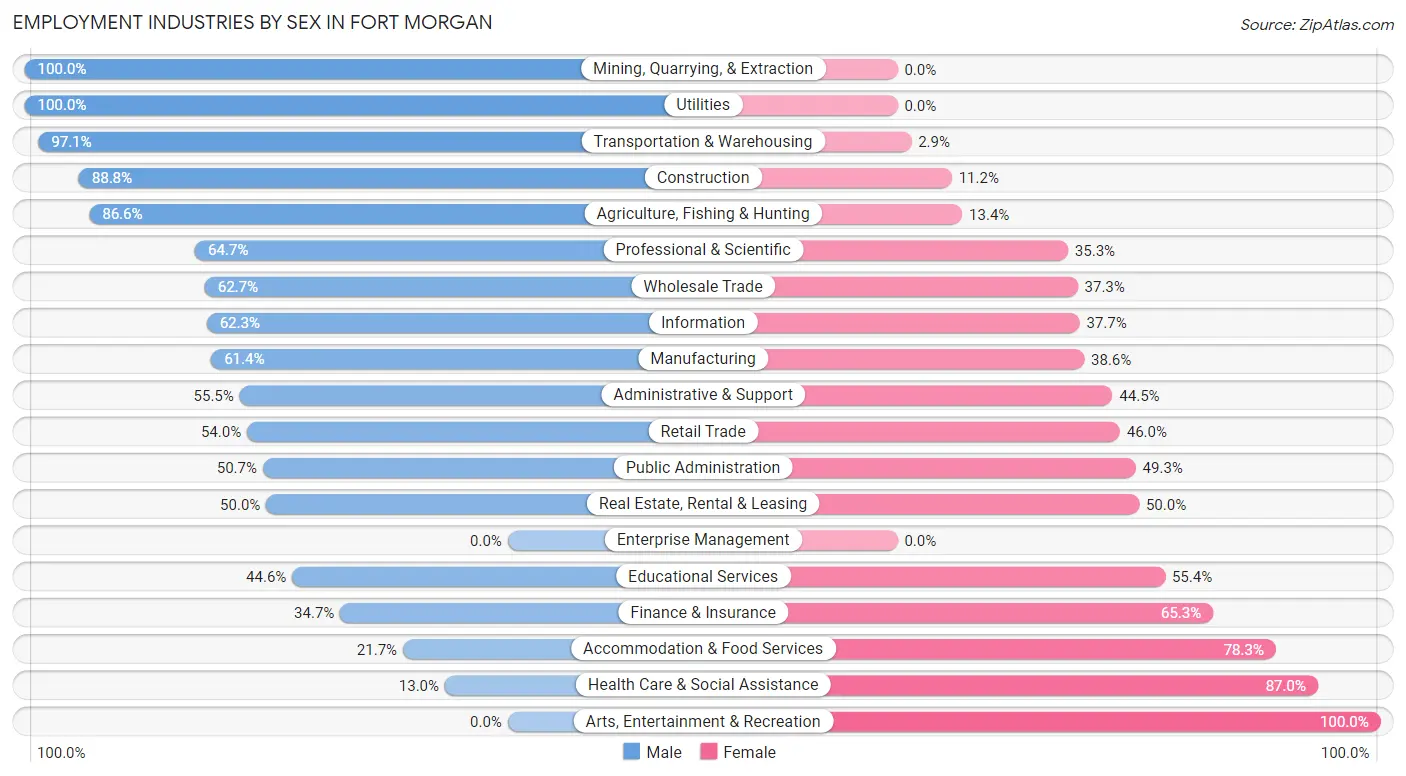
Employment Industries by Sex in Fort Morgan
The Fort Morgan industries that see more men than women are Mining, Quarrying, & Extraction (100.0%), Utilities (100.0%), and Transportation & Warehousing (97.1%), whereas the industries that tend to have a higher number of women are Arts, Entertainment & Recreation (100.0%), Health Care & Social Assistance (87.0%), and Accommodation & Food Services (78.3%).
| Industry | Male | Female |
| Agriculture, Fishing & Hunting | 407 (86.6%) | 63 (13.4%) |
| Mining, Quarrying, & Extraction | 116 (100.0%) | 0 (0.0%) |
| Construction | 300 (88.8%) | 38 (11.2%) |
| Manufacturing | 832 (61.4%) | 524 (38.6%) |
| Wholesale Trade | 79 (62.7%) | 47 (37.3%) |
| Retail Trade | 367 (54.0%) | 313 (46.0%) |
| Transportation & Warehousing | 238 (97.1%) | 7 (2.9%) |
| Utilities | 57 (100.0%) | 0 (0.0%) |
| Information | 38 (62.3%) | 23 (37.7%) |
| Finance & Insurance | 43 (34.7%) | 81 (65.3%) |
| Real Estate, Rental & Leasing | 8 (50.0%) | 8 (50.0%) |
| Professional & Scientific | 55 (64.7%) | 30 (35.3%) |
| Enterprise Management | 0 (0.0%) | 0 (0.0%) |
| Administrative & Support | 106 (55.5%) | 85 (44.5%) |
| Educational Services | 195 (44.6%) | 242 (55.4%) |
| Health Care & Social Assistance | 74 (13.0%) | 495 (87.0%) |
| Arts, Entertainment & Recreation | 0 (0.0%) | 3 (100.0%) |
| Accommodation & Food Services | 23 (21.7%) | 83 (78.3%) |
| Public Administration | 73 (50.7%) | 71 (49.3%) |
| Total | 3,102 (58.6%) | 2,194 (41.4%) |
Education in Fort Morgan
School Enrollment in Fort Morgan
The most common levels of schooling among the 2,651 students in Fort Morgan are elementary school (1,035 | 39.0%), high school (423 | 16.0%), and middle school (419 | 15.8%).
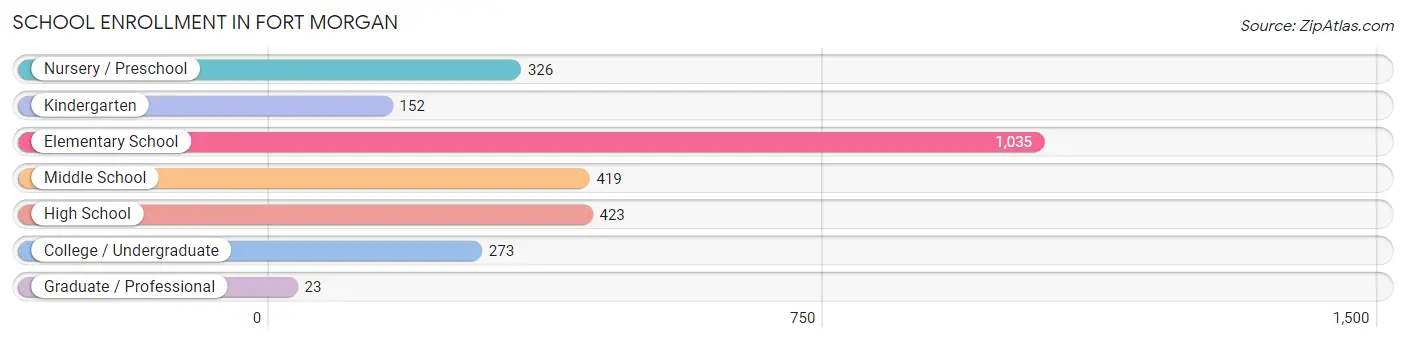
| School Level | # Students | % Students |
| Nursery / Preschool | 326 | 12.3% |
| Kindergarten | 152 | 5.7% |
| Elementary School | 1,035 | 39.0% |
| Middle School | 419 | 15.8% |
| High School | 423 | 16.0% |
| College / Undergraduate | 273 | 10.3% |
| Graduate / Professional | 23 | 0.9% |
| Total | 2,651 | 100.0% |
School Enrollment by Age by Funding Source in Fort Morgan
Out of a total of 2,651 students who are enrolled in schools in Fort Morgan, 265 (10.0%) attend a private institution, while the remaining 2,386 (90.0%) are enrolled in public schools. The age group of 3 to 4 year olds has the highest likelihood of being enrolled in private schools, with 50 (22.4% in the age bracket) enrolled. Conversely, the age group of 18 to 19 year olds has the lowest likelihood of being enrolled in a private school, with 86 (100.0% in the age bracket) attending a public institution.
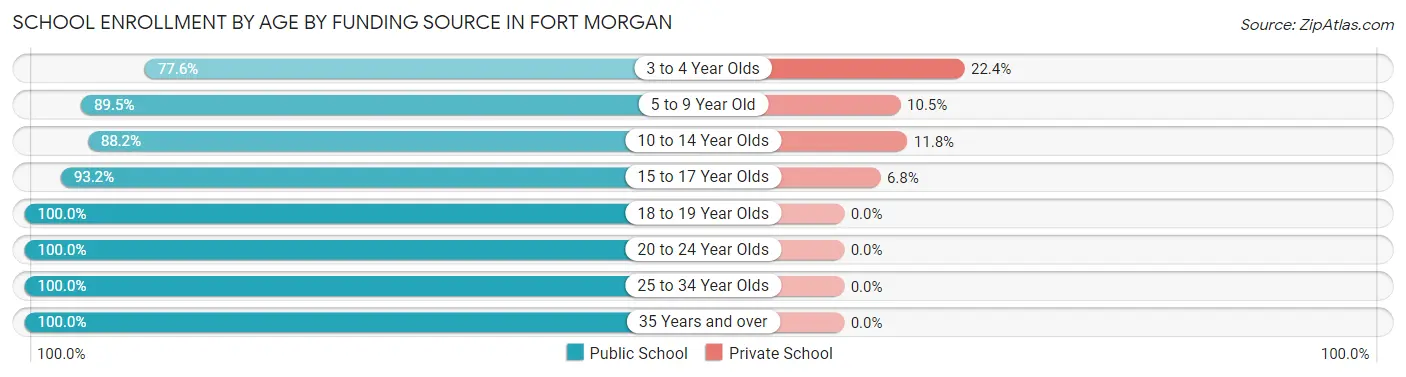
| Age Bracket | Public School | Private School |
| 3 to 4 Year Olds | 173 (77.6%) | 50 (22.4%) |
| 5 to 9 Year Old | 894 (89.5%) | 105 (10.5%) |
| 10 to 14 Year Olds | 629 (88.2%) | 84 (11.8%) |
| 15 to 17 Year Olds | 345 (93.2%) | 25 (6.8%) |
| 18 to 19 Year Olds | 86 (100.0%) | 0 (0.0%) |
| 20 to 24 Year Olds | 95 (100.0%) | 0 (0.0%) |
| 25 to 34 Year Olds | 104 (100.0%) | 0 (0.0%) |
| 35 Years and over | 61 (100.0%) | 0 (0.0%) |
| Total | 2,386 (90.0%) | 265 (10.0%) |
Educational Attainment by Field of Study in Fort Morgan
Business (389 | 27.8%), education (276 | 19.7%), bio, nature & agricultural (130 | 9.3%), liberal arts & history (125 | 8.9%), and psychology (111 | 7.9%) are the most common fields of study among 1,399 individuals in Fort Morgan who have obtained a bachelor's degree or higher.
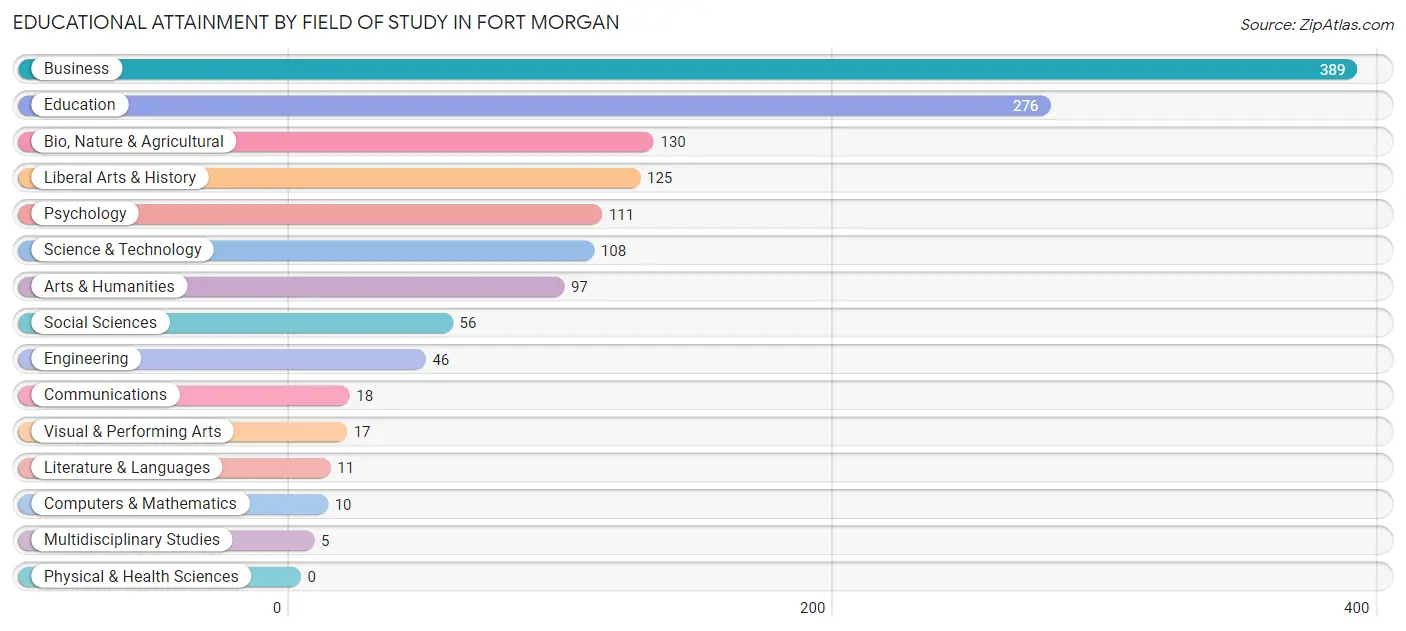
| Field of Study | # Graduates | % Graduates |
| Computers & Mathematics | 10 | 0.7% |
| Bio, Nature & Agricultural | 130 | 9.3% |
| Physical & Health Sciences | 0 | 0.0% |
| Psychology | 111 | 7.9% |
| Social Sciences | 56 | 4.0% |
| Engineering | 46 | 3.3% |
| Multidisciplinary Studies | 5 | 0.4% |
| Science & Technology | 108 | 7.7% |
| Business | 389 | 27.8% |
| Education | 276 | 19.7% |
| Literature & Languages | 11 | 0.8% |
| Liberal Arts & History | 125 | 8.9% |
| Visual & Performing Arts | 17 | 1.2% |
| Communications | 18 | 1.3% |
| Arts & Humanities | 97 | 6.9% |
| Total | 1,399 | 100.0% |
Transportation & Commute in Fort Morgan
Vehicle Availability by Sex in Fort Morgan
The most prevalent vehicle ownership categories in Fort Morgan are males with 2 vehicles (1,163, accounting for 38.3%) and females with 2 vehicles (969, making up 55.6%).
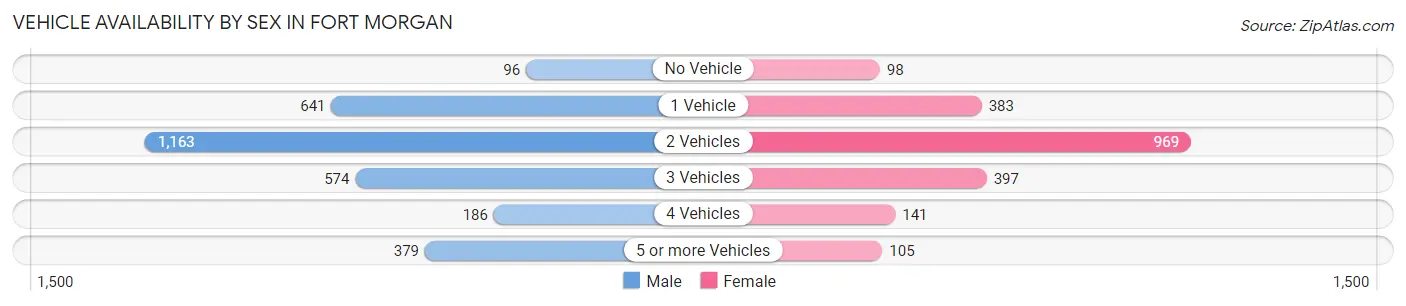
| Vehicles Available | Male | Female |
| No Vehicle | 96 (3.2%) | 98 (4.7%) |
| 1 Vehicle | 641 (21.1%) | 383 (18.3%) |
| 2 Vehicles | 1,163 (38.3%) | 969 (46.3%) |
| 3 Vehicles | 574 (18.9%) | 397 (19.0%) |
| 4 Vehicles | 186 (6.1%) | 141 (6.7%) |
| 5 or more Vehicles | 379 (12.5%) | 105 (5.0%) |
| Total | 3,039 (100.0%) | 2,093 (100.0%) |
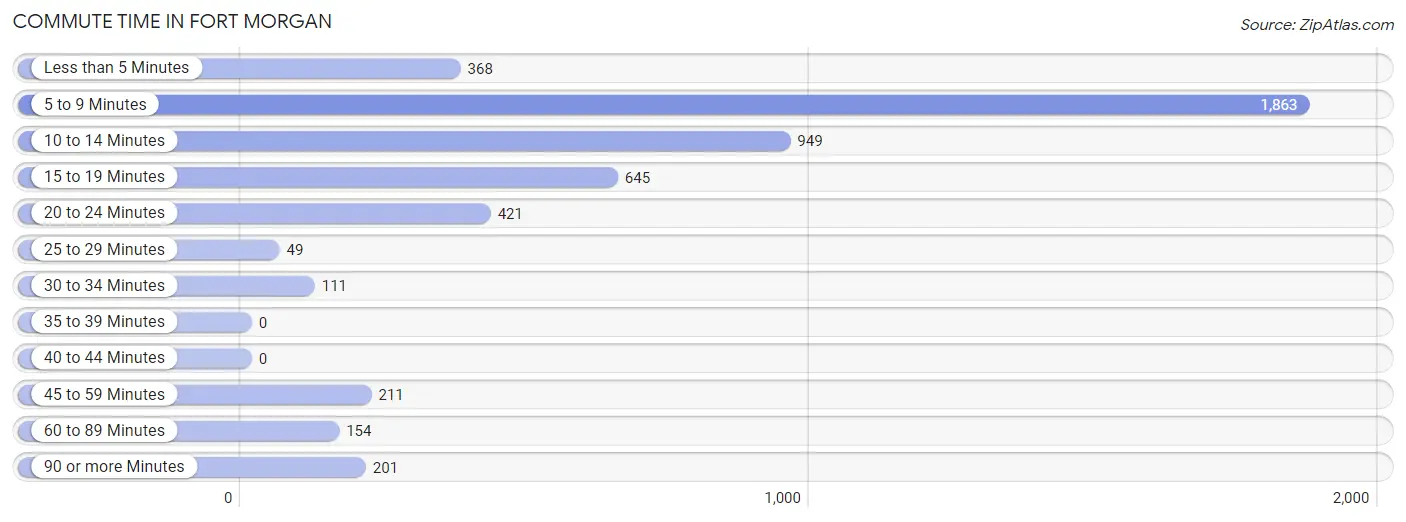
Commute Time in Fort Morgan
The most frequently occuring commute durations in Fort Morgan are 5 to 9 minutes (1,863 commuters, 37.5%), 10 to 14 minutes (949 commuters, 19.1%), and 15 to 19 minutes (645 commuters, 13.0%).
| Commute Time | # Commuters | % Commuters |
| Less than 5 Minutes | 368 | 7.4% |
| 5 to 9 Minutes | 1,863 | 37.5% |
| 10 to 14 Minutes | 949 | 19.1% |
| 15 to 19 Minutes | 645 | 13.0% |
| 20 to 24 Minutes | 421 | 8.5% |
| 25 to 29 Minutes | 49 | 1.0% |
| 30 to 34 Minutes | 111 | 2.2% |
| 35 to 39 Minutes | 0 | 0.0% |
| 40 to 44 Minutes | 0 | 0.0% |
| 45 to 59 Minutes | 211 | 4.2% |
| 60 to 89 Minutes | 154 | 3.1% |
| 90 or more Minutes | 201 | 4.0% |
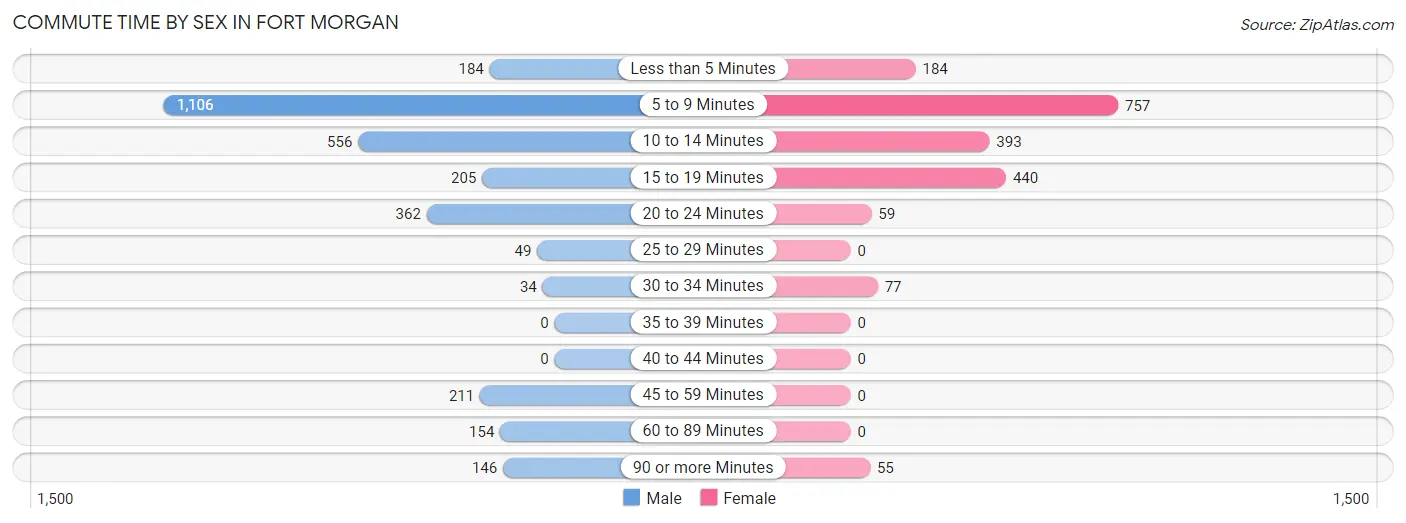
Commute Time by Sex in Fort Morgan
The most common commute times in Fort Morgan are 5 to 9 minutes (1,106 commuters, 36.8%) for males and 5 to 9 minutes (757 commuters, 38.5%) for females.
| Commute Time | Male | Female |
| Less than 5 Minutes | 184 (6.1%) | 184 (9.4%) |
| 5 to 9 Minutes | 1,106 (36.8%) | 757 (38.5%) |
| 10 to 14 Minutes | 556 (18.5%) | 393 (20.0%) |
| 15 to 19 Minutes | 205 (6.8%) | 440 (22.4%) |
| 20 to 24 Minutes | 362 (12.0%) | 59 (3.0%) |
| 25 to 29 Minutes | 49 (1.6%) | 0 (0.0%) |
| 30 to 34 Minutes | 34 (1.1%) | 77 (3.9%) |
| 35 to 39 Minutes | 0 (0.0%) | 0 (0.0%) |
| 40 to 44 Minutes | 0 (0.0%) | 0 (0.0%) |
| 45 to 59 Minutes | 211 (7.0%) | 0 (0.0%) |
| 60 to 89 Minutes | 154 (5.1%) | 0 (0.0%) |
| 90 or more Minutes | 146 (4.9%) | 55 (2.8%) |
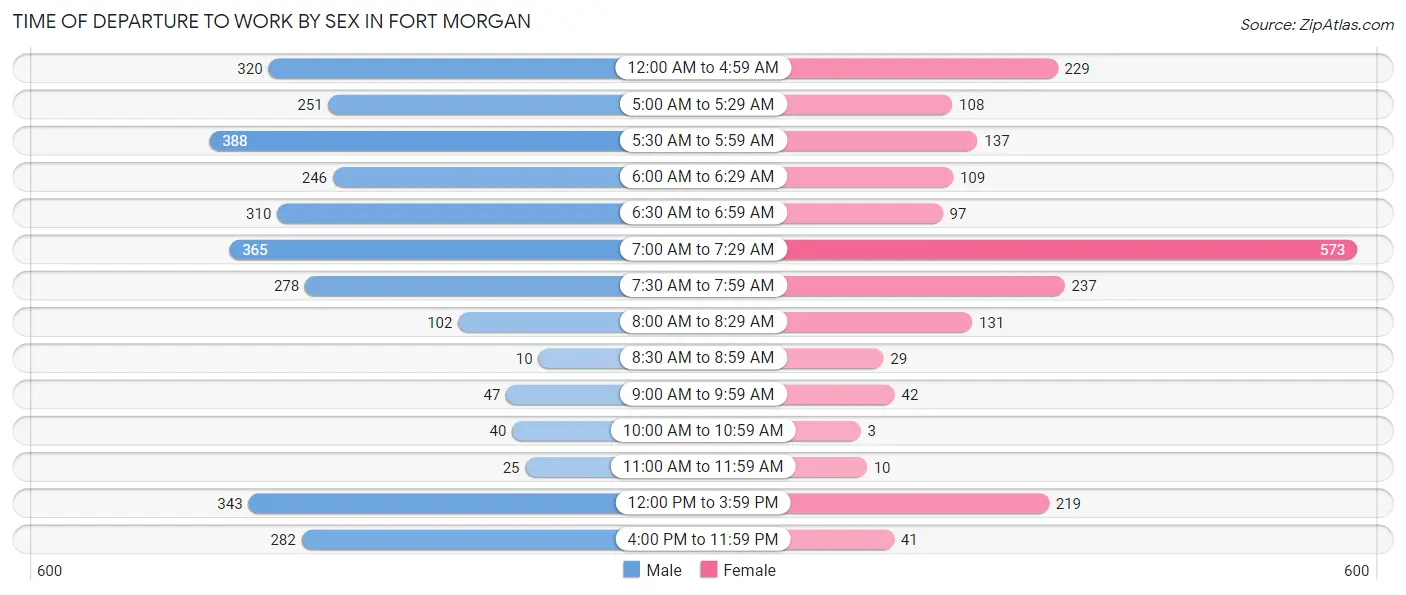
Time of Departure to Work by Sex in Fort Morgan
The most frequent times of departure to work in Fort Morgan are 5:30 AM to 5:59 AM (388, 12.9%) for males and 7:00 AM to 7:29 AM (573, 29.2%) for females.
| Time of Departure | Male | Female |
| 12:00 AM to 4:59 AM | 320 (10.6%) | 229 (11.7%) |
| 5:00 AM to 5:29 AM | 251 (8.4%) | 108 (5.5%) |
| 5:30 AM to 5:59 AM | 388 (12.9%) | 137 (7.0%) |
| 6:00 AM to 6:29 AM | 246 (8.2%) | 109 (5.6%) |
| 6:30 AM to 6:59 AM | 310 (10.3%) | 97 (4.9%) |
| 7:00 AM to 7:29 AM | 365 (12.1%) | 573 (29.2%) |
| 7:30 AM to 7:59 AM | 278 (9.2%) | 237 (12.1%) |
| 8:00 AM to 8:29 AM | 102 (3.4%) | 131 (6.7%) |
| 8:30 AM to 8:59 AM | 10 (0.3%) | 29 (1.5%) |
| 9:00 AM to 9:59 AM | 47 (1.6%) | 42 (2.1%) |
| 10:00 AM to 10:59 AM | 40 (1.3%) | 3 (0.2%) |
| 11:00 AM to 11:59 AM | 25 (0.8%) | 10 (0.5%) |
| 12:00 PM to 3:59 PM | 343 (11.4%) | 219 (11.2%) |
| 4:00 PM to 11:59 PM | 282 (9.4%) | 41 (2.1%) |
| Total | 3,007 (100.0%) | 1,965 (100.0%) |
Housing Occupancy in Fort Morgan
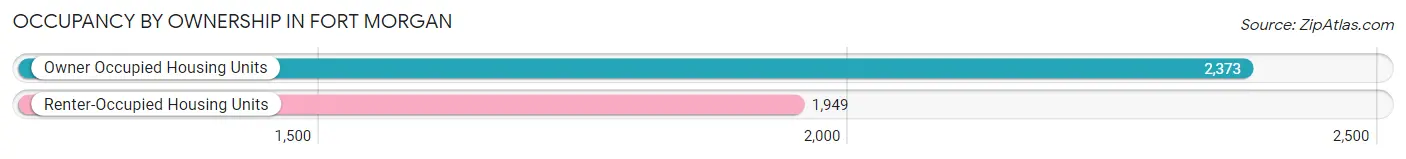
Occupancy by Ownership in Fort Morgan
Of the total 4,322 dwellings in Fort Morgan, owner-occupied units account for 2,373 (54.9%), while renter-occupied units make up 1,949 (45.1%).
| Occupancy | # Housing Units | % Housing Units |
| Owner Occupied Housing Units | 2,373 | 54.9% |
| Renter-Occupied Housing Units | 1,949 | 45.1% |
| Total Occupied Housing Units | 4,322 | 100.0% |
Occupancy by Household Size in Fort Morgan
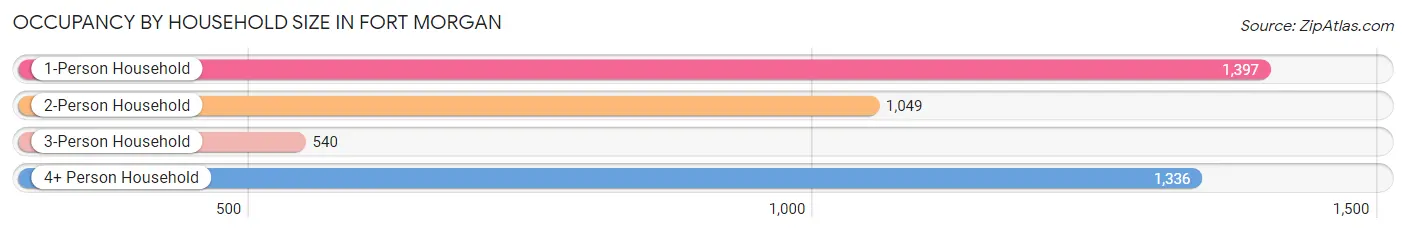
| Household Size | # Housing Units | % Housing Units |
| 1-Person Household | 1,397 | 32.3% |
| 2-Person Household | 1,049 | 24.3% |
| 3-Person Household | 540 | 12.5% |
| 4+ Person Household | 1,336 | 30.9% |
| Total Housing Units | 4,322 | 100.0% |
Occupancy by Ownership by Household Size in Fort Morgan
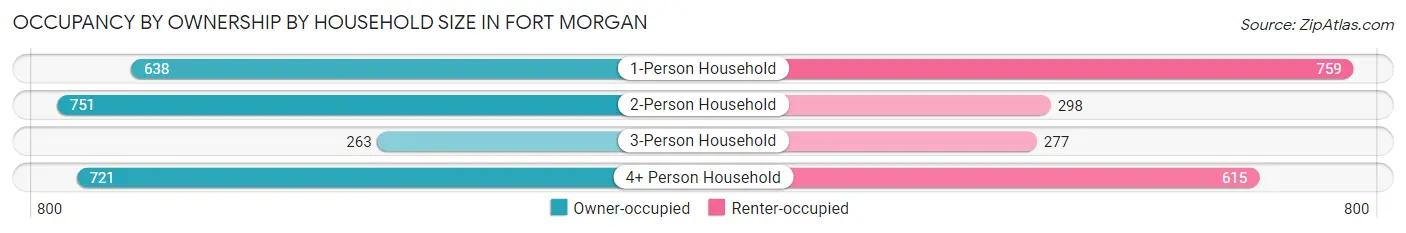
| Household Size | Owner-occupied | Renter-occupied |
| 1-Person Household | 638 (45.7%) | 759 (54.3%) |
| 2-Person Household | 751 (71.6%) | 298 (28.4%) |
| 3-Person Household | 263 (48.7%) | 277 (51.3%) |
| 4+ Person Household | 721 (54.0%) | 615 (46.0%) |
| Total Housing Units | 2,373 (54.9%) | 1,949 (45.1%) |
Occupancy by Educational Attainment in Fort Morgan
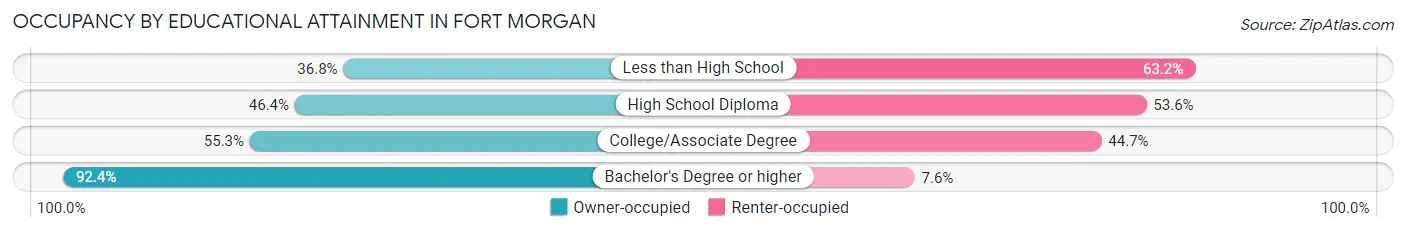
| Household Size | Owner-occupied | Renter-occupied |
| Less than High School | 291 (36.8%) | 500 (63.2%) |
| High School Diploma | 701 (46.4%) | 809 (53.6%) |
| College/Associate Degree | 726 (55.3%) | 586 (44.7%) |
| Bachelor's Degree or higher | 655 (92.4%) | 54 (7.6%) |
Occupancy by Age of Householder in Fort Morgan
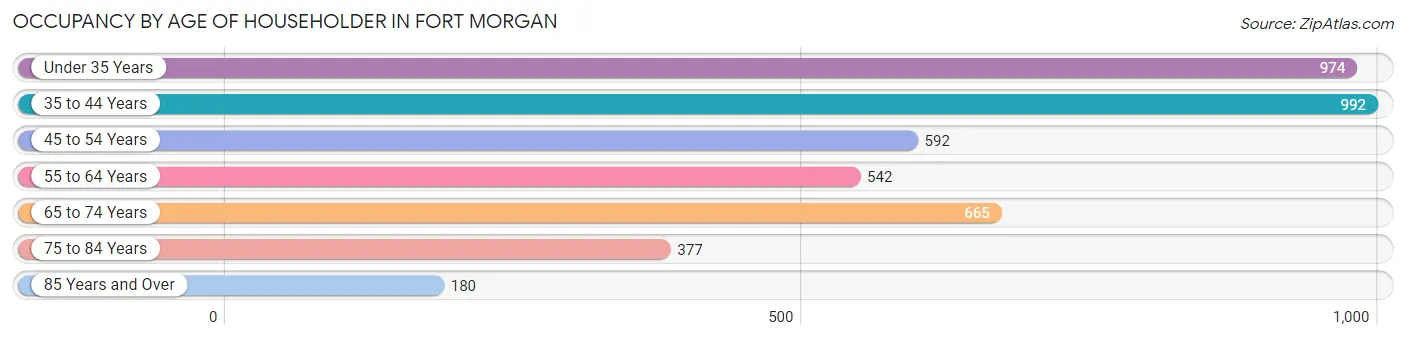
| Age Bracket | # Households | % Households |
| Under 35 Years | 974 | 22.5% |
| 35 to 44 Years | 992 | 23.0% |
| 45 to 54 Years | 592 | 13.7% |
| 55 to 64 Years | 542 | 12.5% |
| 65 to 74 Years | 665 | 15.4% |
| 75 to 84 Years | 377 | 8.7% |
| 85 Years and Over | 180 | 4.2% |
| Total | 4,322 | 100.0% |
Housing Finances in Fort Morgan
Median Income by Occupancy in Fort Morgan
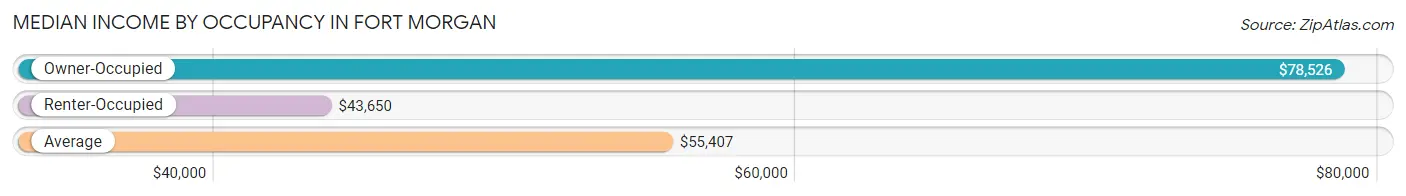
| Occupancy Type | # Households | Median Income |
| Owner-Occupied | 2,373 (54.9%) | $78,526 |
| Renter-Occupied | 1,949 (45.1%) | $43,650 |
| Average | 4,322 (100.0%) | $55,407 |
Occupancy by Householder Income Bracket in Fort Morgan
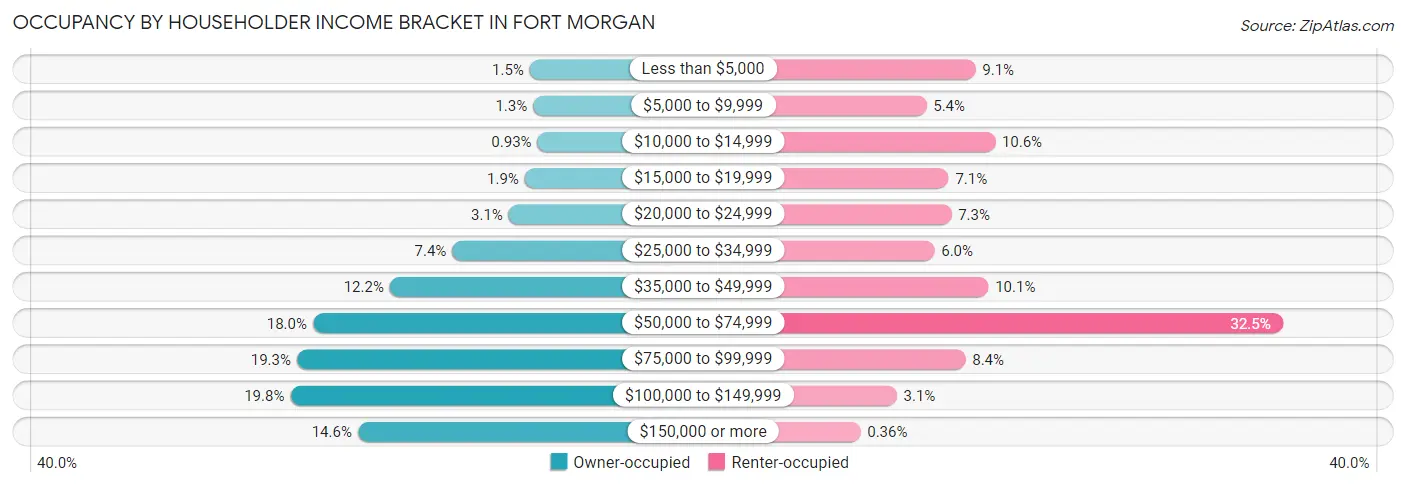
| Income Bracket | Owner-occupied | Renter-occupied |
| Less than $5,000 | 36 (1.5%) | 178 (9.1%) |
| $5,000 to $9,999 | 30 (1.3%) | 105 (5.4%) |
| $10,000 to $14,999 | 22 (0.9%) | 207 (10.6%) |
| $15,000 to $19,999 | 45 (1.9%) | 138 (7.1%) |
| $20,000 to $24,999 | 74 (3.1%) | 142 (7.3%) |
| $25,000 to $34,999 | 176 (7.4%) | 117 (6.0%) |
| $35,000 to $49,999 | 289 (12.2%) | 197 (10.1%) |
| $50,000 to $74,999 | 428 (18.0%) | 634 (32.5%) |
| $75,000 to $99,999 | 457 (19.3%) | 163 (8.4%) |
| $100,000 to $149,999 | 469 (19.8%) | 61 (3.1%) |
| $150,000 or more | 347 (14.6%) | 7 (0.4%) |
| Total | 2,373 (100.0%) | 1,949 (100.0%) |
Monthly Housing Cost Tiers in Fort Morgan
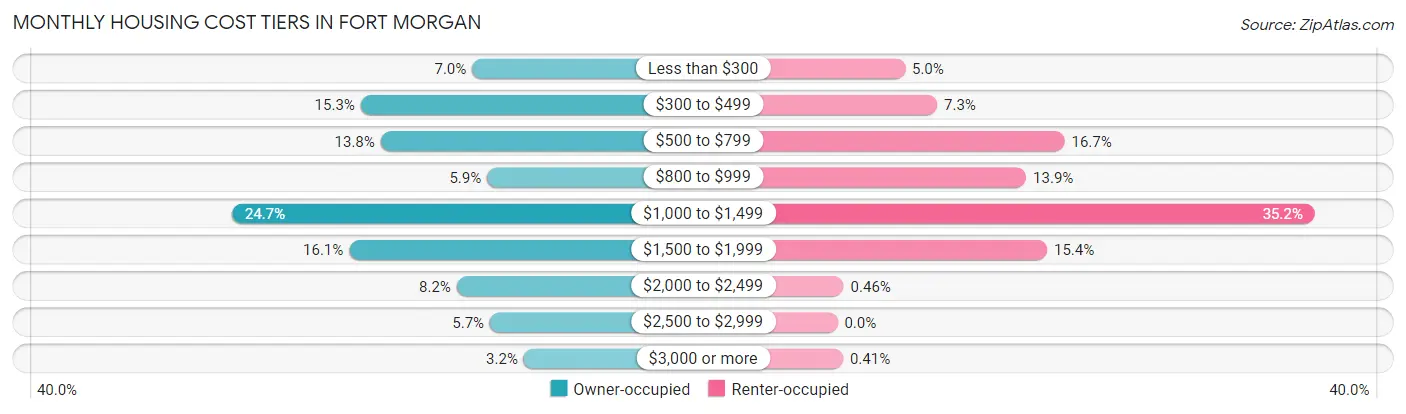
| Monthly Cost | Owner-occupied | Renter-occupied |
| Less than $300 | 167 (7.0%) | 97 (5.0%) |
| $300 to $499 | 362 (15.2%) | 143 (7.3%) |
| $500 to $799 | 327 (13.8%) | 326 (16.7%) |
| $800 to $999 | 141 (5.9%) | 271 (13.9%) |
| $1,000 to $1,499 | 587 (24.7%) | 685 (35.1%) |
| $1,500 to $1,999 | 382 (16.1%) | 301 (15.4%) |
| $2,000 to $2,499 | 194 (8.2%) | 9 (0.5%) |
| $2,500 to $2,999 | 136 (5.7%) | 0 (0.0%) |
| $3,000 or more | 77 (3.2%) | 8 (0.4%) |
| Total | 2,373 (100.0%) | 1,949 (100.0%) |
Physical Housing Characteristics in Fort Morgan
Housing Structures in Fort Morgan
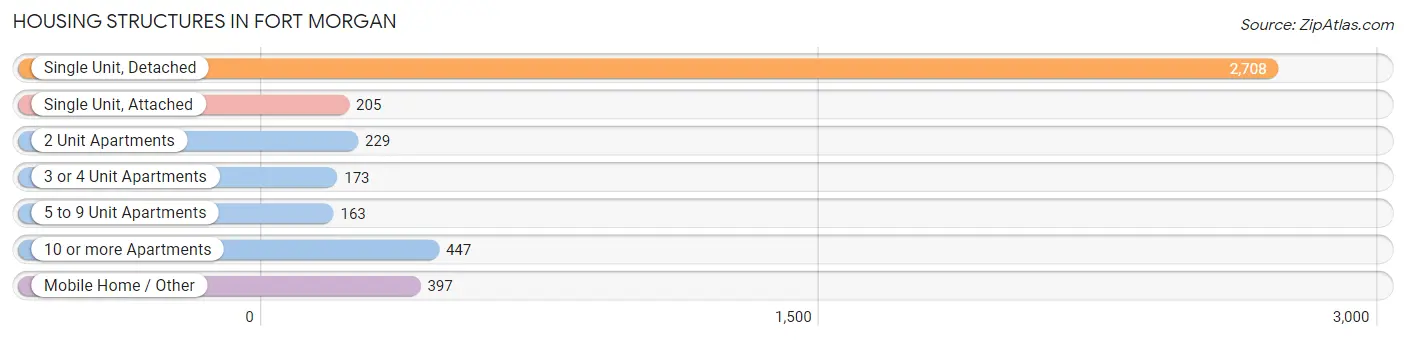
| Structure Type | # Housing Units | % Housing Units |
| Single Unit, Detached | 2,708 | 62.7% |
| Single Unit, Attached | 205 | 4.7% |
| 2 Unit Apartments | 229 | 5.3% |
| 3 or 4 Unit Apartments | 173 | 4.0% |
| 5 to 9 Unit Apartments | 163 | 3.8% |
| 10 or more Apartments | 447 | 10.3% |
| Mobile Home / Other | 397 | 9.2% |
| Total | 4,322 | 100.0% |
Housing Structures by Occupancy in Fort Morgan
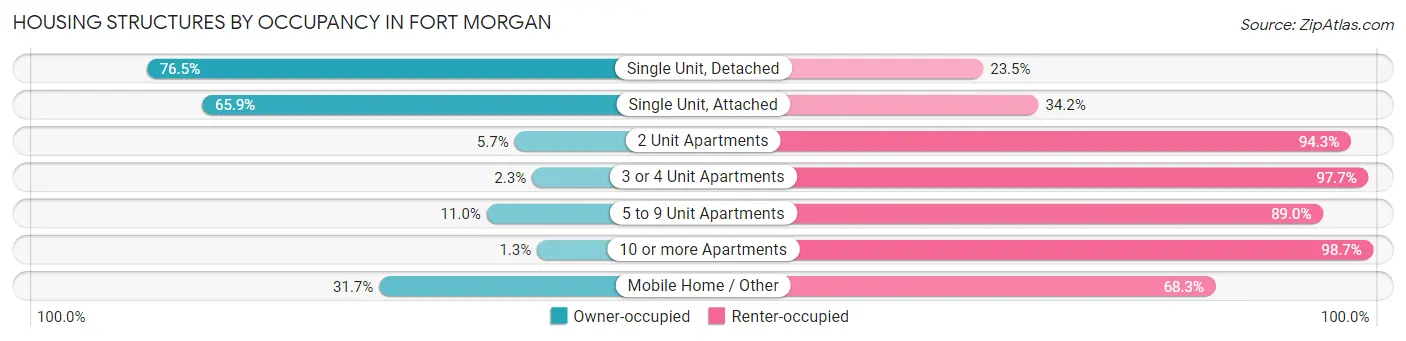
| Structure Type | Owner-occupied | Renter-occupied |
| Single Unit, Detached | 2,071 (76.5%) | 637 (23.5%) |
| Single Unit, Attached | 135 (65.8%) | 70 (34.2%) |
| 2 Unit Apartments | 13 (5.7%) | 216 (94.3%) |
| 3 or 4 Unit Apartments | 4 (2.3%) | 169 (97.7%) |
| 5 to 9 Unit Apartments | 18 (11.0%) | 145 (89.0%) |
| 10 or more Apartments | 6 (1.3%) | 441 (98.7%) |
| Mobile Home / Other | 126 (31.7%) | 271 (68.3%) |
| Total | 2,373 (54.9%) | 1,949 (45.1%) |
Housing Structures by Number of Rooms in Fort Morgan
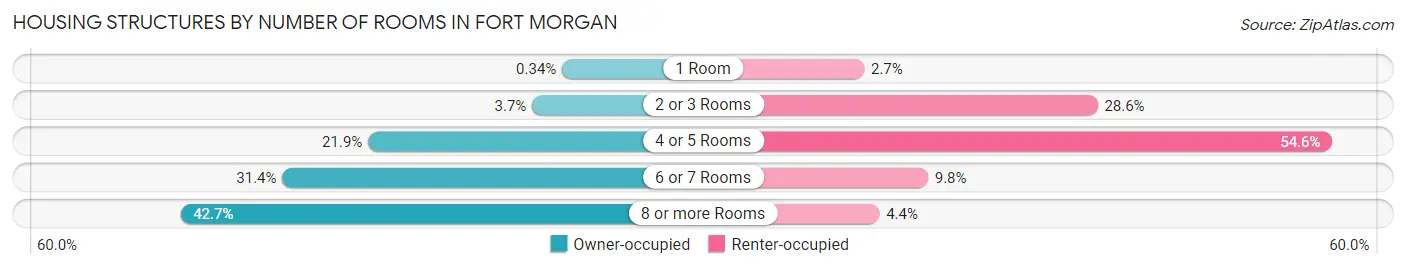
| Number of Rooms | Owner-occupied | Renter-occupied |
| 1 Room | 8 (0.3%) | 52 (2.7%) |
| 2 or 3 Rooms | 87 (3.7%) | 557 (28.6%) |
| 4 or 5 Rooms | 519 (21.9%) | 1,065 (54.6%) |
| 6 or 7 Rooms | 745 (31.4%) | 190 (9.8%) |
| 8 or more Rooms | 1,014 (42.7%) | 85 (4.4%) |
| Total | 2,373 (100.0%) | 1,949 (100.0%) |
Housing Structure by Heating Type in Fort Morgan
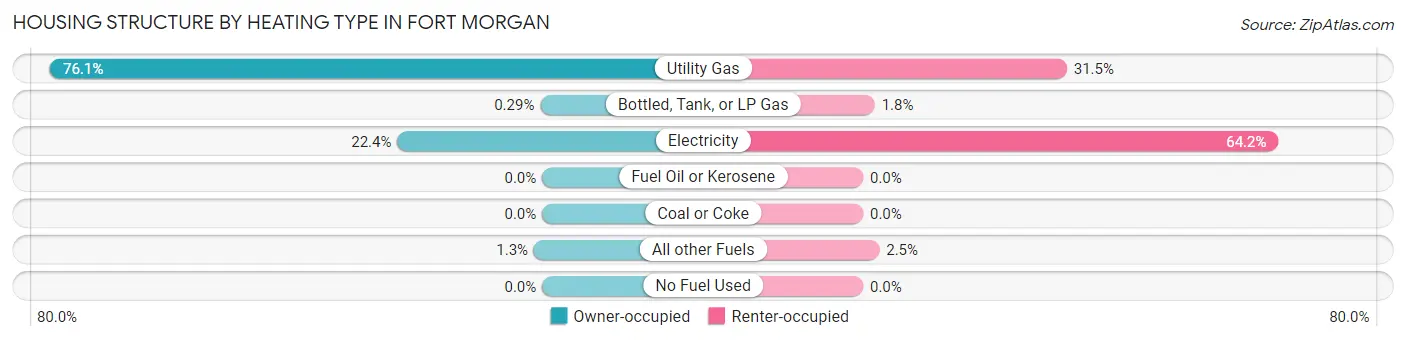
| Heating Type | Owner-occupied | Renter-occupied |
| Utility Gas | 1,805 (76.1%) | 614 (31.5%) |
| Bottled, Tank, or LP Gas | 7 (0.3%) | 35 (1.8%) |
| Electricity | 531 (22.4%) | 1,251 (64.2%) |
| Fuel Oil or Kerosene | 0 (0.0%) | 0 (0.0%) |
| Coal or Coke | 0 (0.0%) | 0 (0.0%) |
| All other Fuels | 30 (1.3%) | 49 (2.5%) |
| No Fuel Used | 0 (0.0%) | 0 (0.0%) |
| Total | 2,373 (100.0%) | 1,949 (100.0%) |
Household Vehicle Usage in Fort Morgan
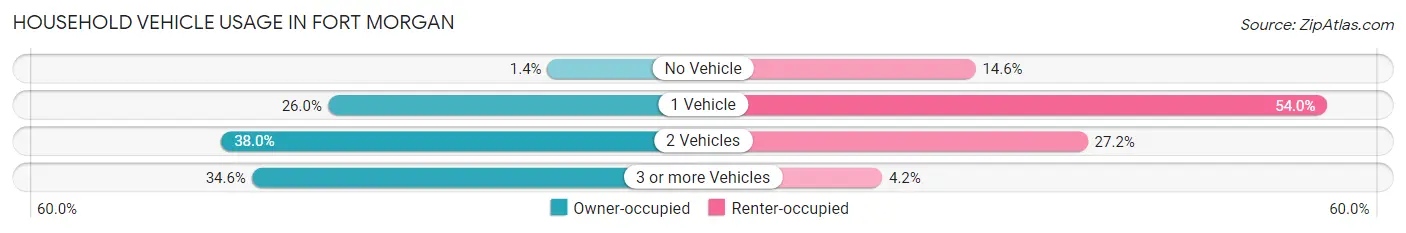
| Vehicles per Household | Owner-occupied | Renter-occupied |
| No Vehicle | 34 (1.4%) | 285 (14.6%) |
| 1 Vehicle | 618 (26.0%) | 1,053 (54.0%) |
| 2 Vehicles | 901 (38.0%) | 530 (27.2%) |
| 3 or more Vehicles | 820 (34.6%) | 81 (4.2%) |
| Total | 2,373 (100.0%) | 1,949 (100.0%) |
Real Estate & Mortgages in Fort Morgan
Real Estate and Mortgage Overview in Fort Morgan
| Characteristic | Without Mortgage | With Mortgage |
| Housing Units | 908 | 1,465 |
| Median Property Value | $237,600 | $259,100 |
| Median Household Income | $68,261 | $178 |
| Monthly Housing Costs | $465 | $77 |
| Real Estate Taxes | $1,075 | $50 |
Property Value by Mortgage Status in Fort Morgan
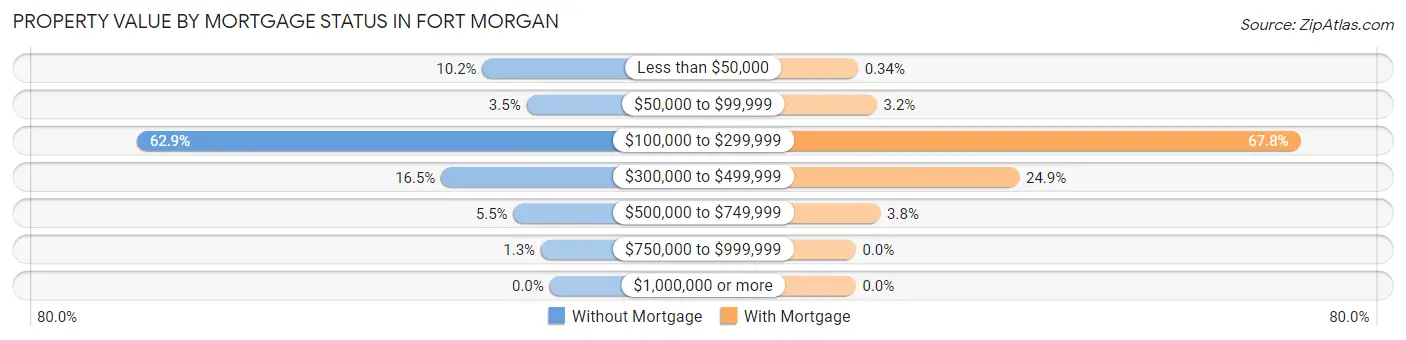
| Property Value | Without Mortgage | With Mortgage |
| Less than $50,000 | 93 (10.2%) | 5 (0.3%) |
| $50,000 to $99,999 | 32 (3.5%) | 47 (3.2%) |
| $100,000 to $299,999 | 571 (62.9%) | 993 (67.8%) |
| $300,000 to $499,999 | 150 (16.5%) | 365 (24.9%) |
| $500,000 to $749,999 | 50 (5.5%) | 55 (3.7%) |
| $750,000 to $999,999 | 12 (1.3%) | 0 (0.0%) |
| $1,000,000 or more | 0 (0.0%) | 0 (0.0%) |
| Total | 908 (100.0%) | 1,465 (100.0%) |
Household Income by Mortgage Status in Fort Morgan
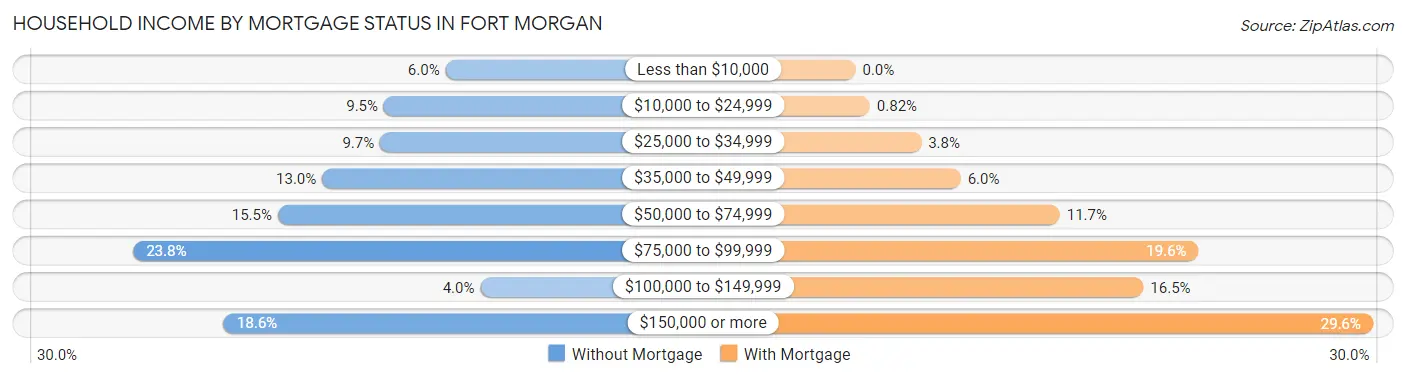
| Household Income | Without Mortgage | With Mortgage |
| Less than $10,000 | 54 (5.9%) | 0 (0.0%) |
| $10,000 to $24,999 | 86 (9.5%) | 12 (0.8%) |
| $25,000 to $34,999 | 88 (9.7%) | 55 (3.7%) |
| $35,000 to $49,999 | 118 (13.0%) | 88 (6.0%) |
| $50,000 to $74,999 | 141 (15.5%) | 171 (11.7%) |
| $75,000 to $99,999 | 216 (23.8%) | 287 (19.6%) |
| $100,000 to $149,999 | 36 (4.0%) | 241 (16.5%) |
| $150,000 or more | 169 (18.6%) | 433 (29.6%) |
| Total | 908 (100.0%) | 1,465 (100.0%) |
Property Value to Household Income Ratio in Fort Morgan
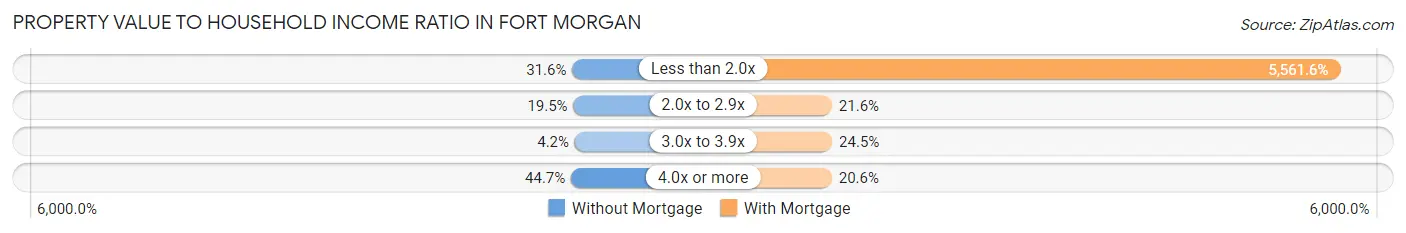
| Value-to-Income Ratio | Without Mortgage | With Mortgage |
| Less than 2.0x | 287 (31.6%) | 81,477 (5,561.6%) |
| 2.0x to 2.9x | 177 (19.5%) | 317 (21.6%) |
| 3.0x to 3.9x | 38 (4.2%) | 359 (24.5%) |
| 4.0x or more | 406 (44.7%) | 302 (20.6%) |
| Total | 908 (100.0%) | 1,465 (100.0%) |
Real Estate Taxes by Mortgage Status in Fort Morgan
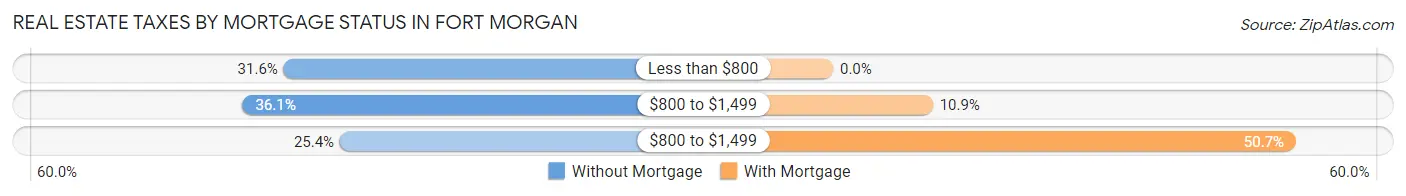
| Property Taxes | Without Mortgage | With Mortgage |
| Less than $800 | 287 (31.6%) | 0 (0.0%) |
| $800 to $1,499 | 328 (36.1%) | 160 (10.9%) |
| $800 to $1,499 | 231 (25.4%) | 743 (50.7%) |
| Total | 908 (100.0%) | 1,465 (100.0%) |
Health & Disability in Fort Morgan
Health Insurance Coverage by Age in Fort Morgan
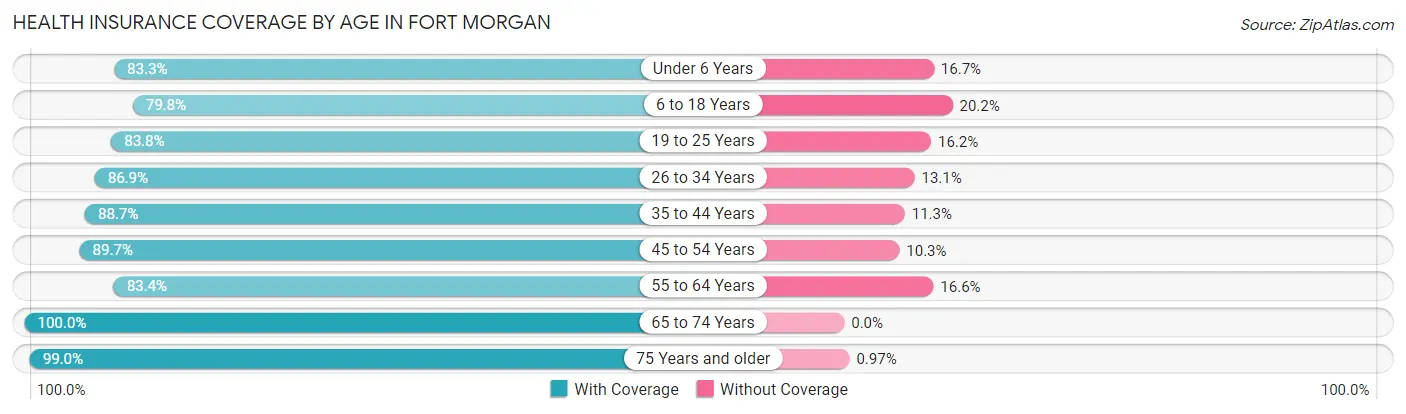
| Age Bracket | With Coverage | Without Coverage |
| Under 6 Years | 927 (83.3%) | 186 (16.7%) |
| 6 to 18 Years | 1,709 (79.8%) | 432 (20.2%) |
| 19 to 25 Years | 1,057 (83.8%) | 204 (16.2%) |
| 26 to 34 Years | 1,240 (86.9%) | 187 (13.1%) |
| 35 to 44 Years | 1,487 (88.7%) | 189 (11.3%) |
| 45 to 54 Years | 996 (89.7%) | 114 (10.3%) |
| 55 to 64 Years | 823 (83.4%) | 164 (16.6%) |
| 65 to 74 Years | 912 (100.0%) | 0 (0.0%) |
| 75 Years and older | 716 (99.0%) | 7 (1.0%) |
| Total | 9,867 (86.9%) | 1,483 (13.1%) |
Health Insurance Coverage by Citizenship Status in Fort Morgan
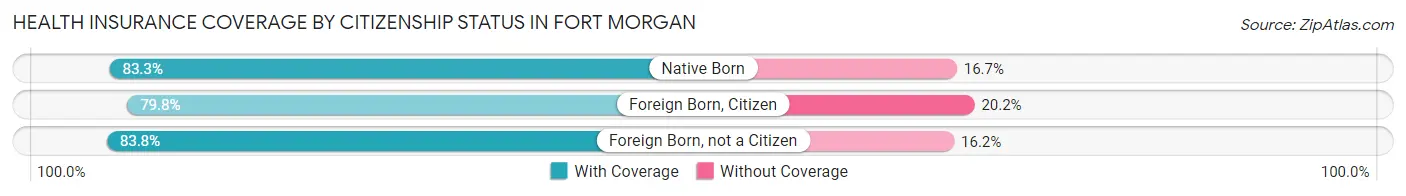
| Citizenship Status | With Coverage | Without Coverage |
| Native Born | 927 (83.3%) | 186 (16.7%) |
| Foreign Born, Citizen | 1,709 (79.8%) | 432 (20.2%) |
| Foreign Born, not a Citizen | 1,057 (83.8%) | 204 (16.2%) |
Health Insurance Coverage by Household Income in Fort Morgan
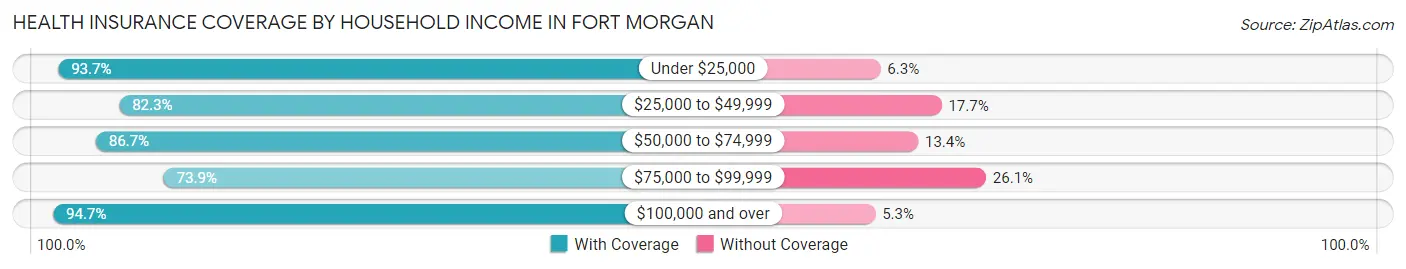
| Household Income | With Coverage | Without Coverage |
| Under $25,000 | 1,829 (93.7%) | 123 (6.3%) |
| $25,000 to $49,999 | 1,201 (82.3%) | 259 (17.7%) |
| $50,000 to $74,999 | 2,649 (86.7%) | 408 (13.4%) |
| $75,000 to $99,999 | 1,538 (73.9%) | 542 (26.1%) |
| $100,000 and over | 2,576 (94.7%) | 145 (5.3%) |
Public vs Private Health Insurance Coverage by Age in Fort Morgan
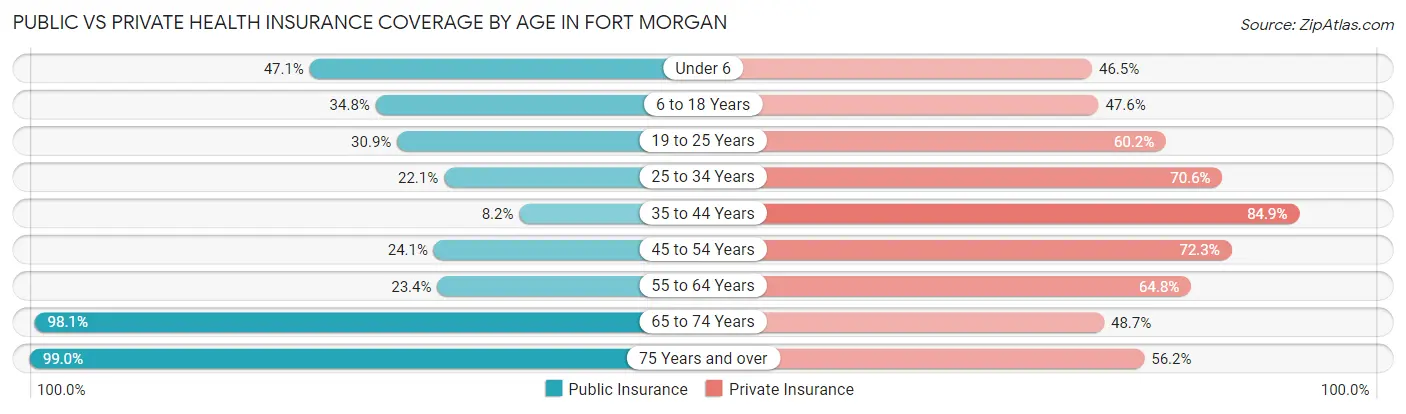
| Age Bracket | Public Insurance | Private Insurance |
| Under 6 | 524 (47.1%) | 517 (46.5%) |
| 6 to 18 Years | 746 (34.8%) | 1,020 (47.6%) |
| 19 to 25 Years | 389 (30.8%) | 759 (60.2%) |
| 25 to 34 Years | 316 (22.1%) | 1,008 (70.6%) |
| 35 to 44 Years | 137 (8.2%) | 1,423 (84.9%) |
| 45 to 54 Years | 267 (24.0%) | 803 (72.3%) |
| 55 to 64 Years | 231 (23.4%) | 640 (64.8%) |
| 65 to 74 Years | 895 (98.1%) | 444 (48.7%) |
| 75 Years and over | 716 (99.0%) | 406 (56.1%) |
| Total | 4,221 (37.2%) | 7,020 (61.9%) |
Disability Status by Sex by Age in Fort Morgan
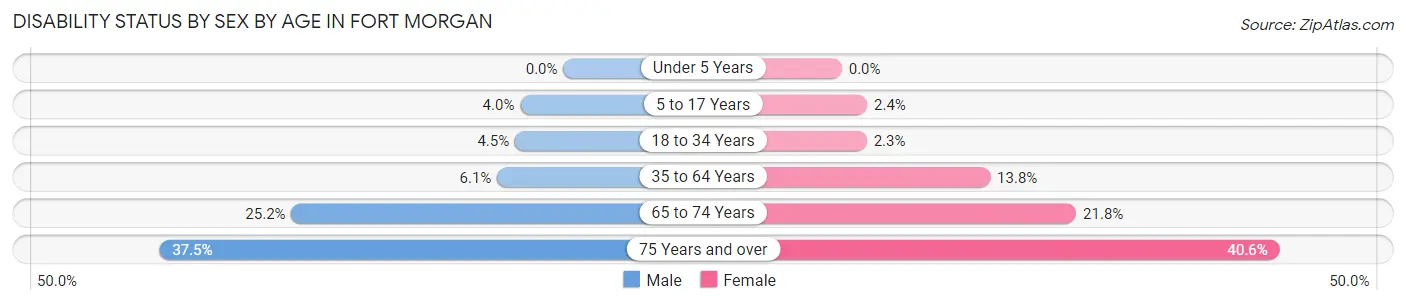
| Age Bracket | Male | Female |
| Under 5 Years | 0 (0.0%) | 0 (0.0%) |
| 5 to 17 Years | 48 (4.0%) | 23 (2.4%) |
| 18 to 34 Years | 70 (4.5%) | 29 (2.3%) |
| 35 to 64 Years | 113 (6.1%) | 266 (13.8%) |
| 65 to 74 Years | 106 (25.2%) | 107 (21.7%) |
| 75 Years and over | 81 (37.5%) | 206 (40.6%) |
Disability Class by Sex by Age in Fort Morgan
Disability Class: Hearing Difficulty
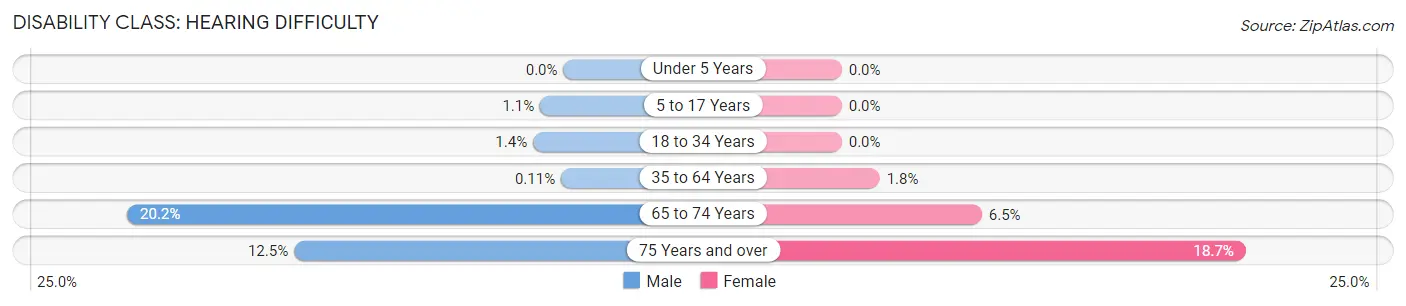
| Age Bracket | Male | Female |
| Under 5 Years | 0 (0.0%) | 0 (0.0%) |
| 5 to 17 Years | 13 (1.1%) | 0 (0.0%) |
| 18 to 34 Years | 22 (1.4%) | 0 (0.0%) |
| 35 to 64 Years | 2 (0.1%) | 34 (1.8%) |
| 65 to 74 Years | 85 (20.2%) | 32 (6.5%) |
| 75 Years and over | 27 (12.5%) | 95 (18.7%) |
Disability Class: Vision Difficulty
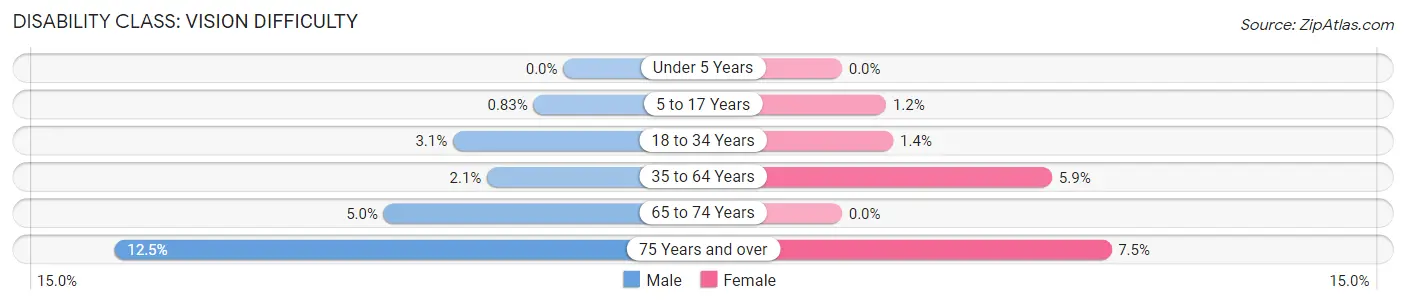
| Age Bracket | Male | Female |
| Under 5 Years | 0 (0.0%) | 0 (0.0%) |
| 5 to 17 Years | 10 (0.8%) | 12 (1.2%) |
| 18 to 34 Years | 48 (3.1%) | 18 (1.4%) |
| 35 to 64 Years | 39 (2.1%) | 113 (5.9%) |
| 65 to 74 Years | 21 (5.0%) | 0 (0.0%) |
| 75 Years and over | 27 (12.5%) | 38 (7.5%) |
Disability Class: Cognitive Difficulty
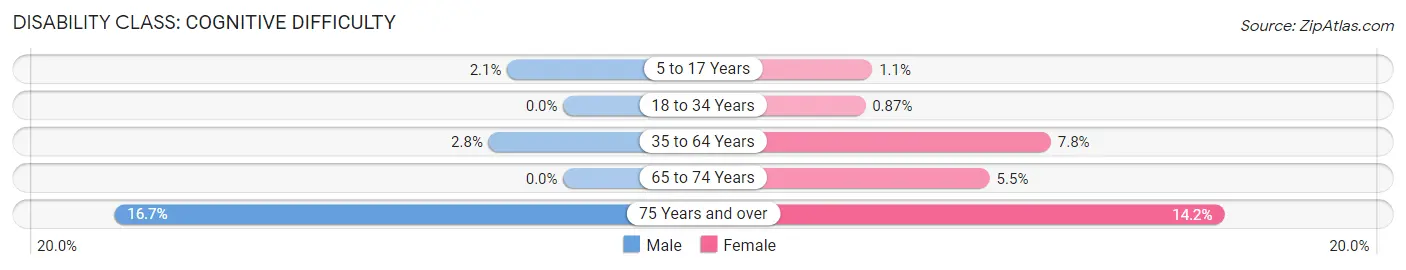
| Age Bracket | Male | Female |
| 5 to 17 Years | 25 (2.1%) | 11 (1.1%) |
| 18 to 34 Years | 0 (0.0%) | 11 (0.9%) |
| 35 to 64 Years | 51 (2.8%) | 150 (7.8%) |
| 65 to 74 Years | 0 (0.0%) | 27 (5.5%) |
| 75 Years and over | 36 (16.7%) | 72 (14.2%) |
Disability Class: Ambulatory Difficulty
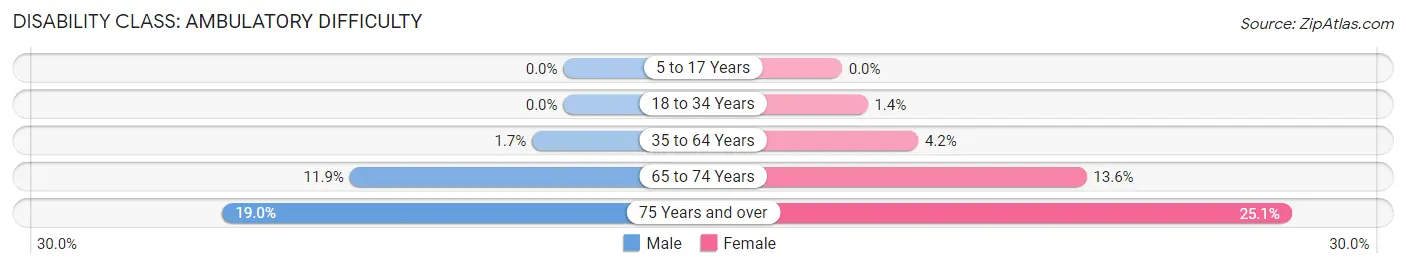
| Age Bracket | Male | Female |
| 5 to 17 Years | 0 (0.0%) | 0 (0.0%) |
| 18 to 34 Years | 0 (0.0%) | 18 (1.4%) |
| 35 to 64 Years | 32 (1.7%) | 82 (4.2%) |
| 65 to 74 Years | 50 (11.9%) | 67 (13.6%) |
| 75 Years and over | 41 (19.0%) | 127 (25.1%) |
Disability Class: Self-Care Difficulty
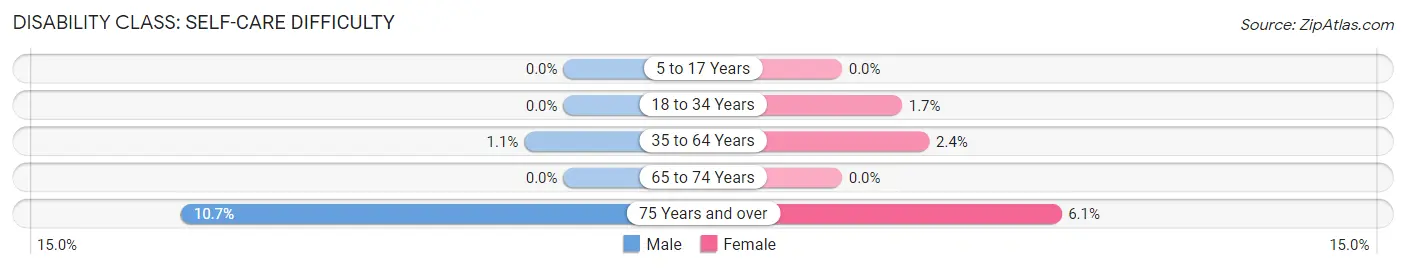
| Age Bracket | Male | Female |
| 5 to 17 Years | 0 (0.0%) | 0 (0.0%) |
| 18 to 34 Years | 0 (0.0%) | 21 (1.7%) |
| 35 to 64 Years | 20 (1.1%) | 47 (2.4%) |
| 65 to 74 Years | 0 (0.0%) | 0 (0.0%) |
| 75 Years and over | 23 (10.6%) | 31 (6.1%) |
Technology Access in Fort Morgan
Computing Device Access in Fort Morgan
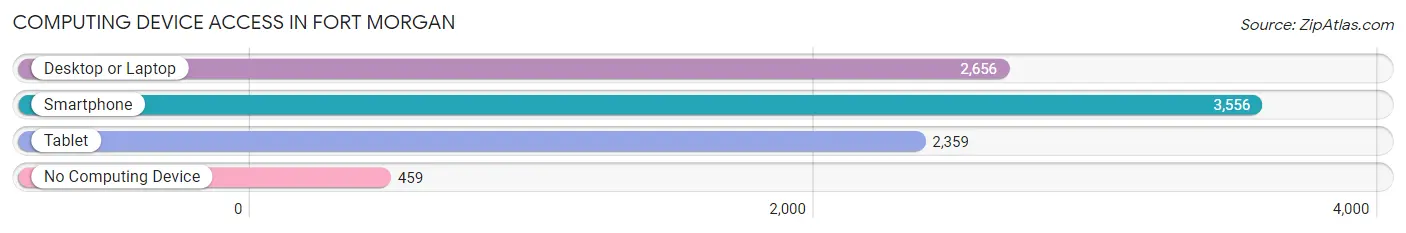
| Device Type | # Households | % Households |
| Desktop or Laptop | 2,656 | 61.5% |
| Smartphone | 3,556 | 82.3% |
| Tablet | 2,359 | 54.6% |
| No Computing Device | 459 | 10.6% |
| Total | 4,322 | 100.0% |
Internet Access in Fort Morgan
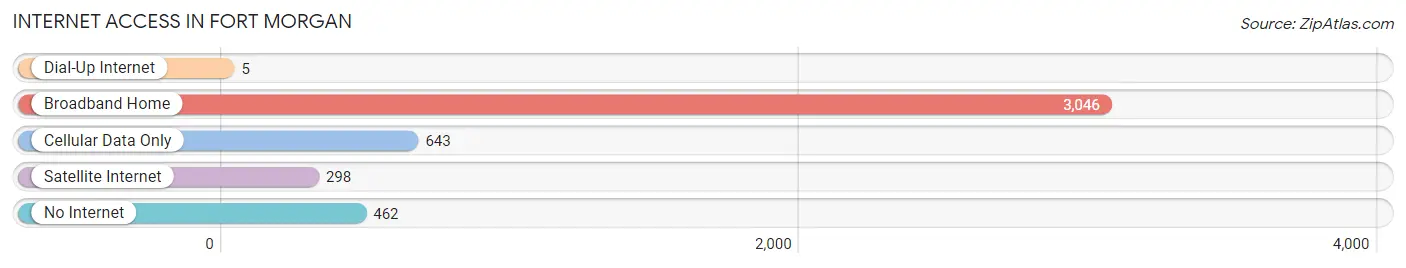
| Internet Type | # Households | % Households |
| Dial-Up Internet | 5 | 0.1% |
| Broadband Home | 3,046 | 70.5% |
| Cellular Data Only | 643 | 14.9% |
| Satellite Internet | 298 | 6.9% |
| No Internet | 462 | 10.7% |
| Total | 4,322 | 100.0% |
Fort Morgan Summary
Morgan County, Colorado is located in the northeastern corner of the state, and is bordered by Weld County to the north, Logan County to the east, Washington County to the south, and Adams County to the west. The county seat is Fort Morgan, which is located in the center of the county. The county was named after Colonel Christopher A. Morgan, a Civil War veteran and the first governor of Colorado.
History
The area that is now Morgan County was originally inhabited by the Arapaho and Cheyenne Native American tribes. The first white settlers arrived in the area in the late 1860s, and the county was officially established in 1889. The county was named after Colonel Christopher A. Morgan, a Civil War veteran and the first governor of Colorado.
The county was largely agricultural in its early years, with the main crops being wheat, corn, and sugar beets. The sugar beet industry was particularly important to the county, and the Great Western Sugar Company built a large factory in Fort Morgan in 1901. The factory was the largest of its kind in the world at the time, and it helped to spur the growth of the town.
In the early 20th century, the county also saw an influx of immigrants from Europe, particularly from Germany, Italy, and Russia. These immigrants helped to shape the culture of the county, and many of their descendants still live in the area today.
Geography
Morgan County is located in the northeastern corner of Colorado, and is bordered by Weld County to the north, Logan County to the east, Washington County to the south, and Adams County to the west. The county covers an area of 1,619 square miles, and is mostly flat, with some rolling hills in the western part of the county. The county is home to several rivers, including the South Platte River, the Cache la Poudre River, and the Big Thompson River.
The county is also home to several reservoirs, including Jackson Lake, Carter Lake, and Horsetooth Reservoir. These reservoirs provide recreational opportunities for residents and visitors alike.
Economy
The economy of Morgan County is largely based on agriculture, with the main crops being wheat, corn, and sugar beets. The sugar beet industry is still important to the county, and the Great Western Sugar Company still operates a factory in Fort Morgan.
The county is also home to several manufacturing companies, including a large meatpacking plant in Fort Morgan. The county is also home to several oil and gas companies, and there are several wind farms in the area.
Demographics
As of the 2010 census, the population of Morgan County was 28,159. The population is largely white (90.2%), with small percentages of Hispanic (4.7%), African American (2.2%), and Asian (1.2%) residents. The median household income in the county is $50,945, and the median home value is $179,400.
The county is home to several small towns, including Fort Morgan, Brush, Wiggins, and Hillrose. The county seat is Fort Morgan, which is located in the center of the county. The town has a population of 11,315, and is the largest town in the county.
Common Questions
What is Per Capita Income in Fort Morgan?
Per Capita income in Fort Morgan is $26,883.
What is the Median Family Income in Fort Morgan?
Median Family Income in Fort Morgan is $68,508.
What is the Median Household income in Fort Morgan?
Median Household Income in Fort Morgan is $55,407.
What is Income or Wage Gap in Fort Morgan?
Income or Wage Gap in Fort Morgan is 39.6%.
Women in Fort Morgan earn 60.4 cents for every dollar earned by a man.
What is Family Income Deficit in Fort Morgan?
Family Income Deficit in Fort Morgan is $13,514.
Families that are below poverty line in Fort Morgan earn $13,514 less on average than the poverty threshold level.
What is Inequality or Gini Index in Fort Morgan?
Inequality or Gini Index in Fort Morgan is 0.42.
What is the Total Population of Fort Morgan?
Total Population of Fort Morgan is 11,501.
What is the Total Male Population of Fort Morgan?
Total Male Population of Fort Morgan is 5,796.
What is the Total Female Population of Fort Morgan?
Total Female Population of Fort Morgan is 5,705.
What is the Ratio of Males per 100 Females in Fort Morgan?
There are 101.60 Males per 100 Females in Fort Morgan.
What is the Ratio of Females per 100 Males in Fort Morgan?
There are 98.43 Females per 100 Males in Fort Morgan.
What is the Median Population Age in Fort Morgan?
Median Population Age in Fort Morgan is 32.8 Years.
What is the Average Family Size in Fort Morgan
Average Family Size in Fort Morgan is 3.4 People.
What is the Average Household Size in Fort Morgan
Average Household Size in Fort Morgan is 2.6 People.
How Large is the Labor Force in Fort Morgan?
There are 5,564 People in the Labor Forcein in Fort Morgan.
What is the Percentage of People in the Labor Force in Fort Morgan?
65.0% of People are in the Labor Force in Fort Morgan.
What is the Unemployment Rate in Fort Morgan?
Unemployment Rate in Fort Morgan is 4.9%.