Dilworth, MN Map & Demographics
Dilworth Map
Dilworth Overview
$43,804
PER CAPITA INCOME
$125,952
AVG FAMILY INCOME
$84,602
AVG HOUSEHOLD INCOME
17.9%
WAGE / INCOME GAP [ % ]
82.1¢/ $1
WAGE / INCOME GAP [ $ ]
0.45
INEQUALITY / GINI INDEX
4,621
TOTAL POPULATION
2,236
MALE POPULATION
2,385
FEMALE POPULATION
93.75
MALES / 100 FEMALES
106.66
FEMALES / 100 MALES
39.3
MEDIAN AGE
3.0
AVG FAMILY SIZE
2.4
AVG HOUSEHOLD SIZE
2,734
LABOR FORCE [ PEOPLE ]
75.6%
PERCENT IN LABOR FORCE
1.1%
UNEMPLOYMENT RATE
Dilworth Zip Codes
Dilworth Area Codes
Income in Dilworth
Income Overview in Dilworth
Per Capita Income in Dilworth is $43,804, while median incomes of families and households are $125,952 and $84,602 respectively.
| Characteristic | Number | Measure |
| Per Capita Income | 4,621 | $43,804 |
| Median Family Income | 1,292 | $125,952 |
| Mean Family Income | 1,292 | $136,869 |
| Median Household Income | 1,889 | $84,602 |
| Mean Household Income | 1,889 | $106,376 |
| Income Deficit | 1,292 | $0 |
| Wage / Income Gap (%) | 4,621 | 17.87% |
| Wage / Income Gap ($) | 4,621 | 82.13¢ per $1 |
| Gini / Inequality Index | 4,621 | 0.45 |
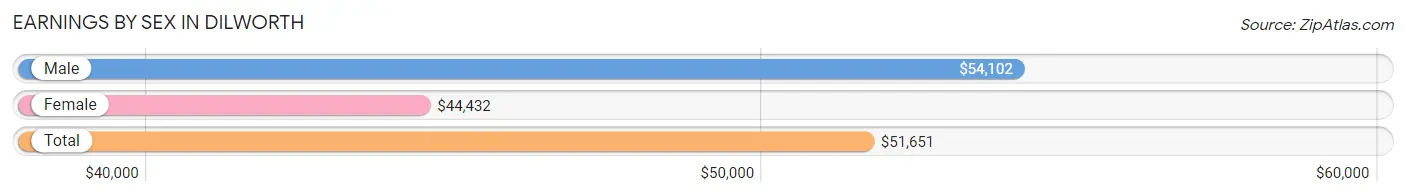
Earnings by Sex in Dilworth
Average Earnings in Dilworth are $51,651, $54,102 for men and $44,432 for women, a difference of 17.9%.
| Sex | Number | Average Earnings |
| Male | 1,375 (49.3%) | $54,102 |
| Female | 1,411 (50.6%) | $44,432 |
| Total | 2,786 (100.0%) | $51,651 |
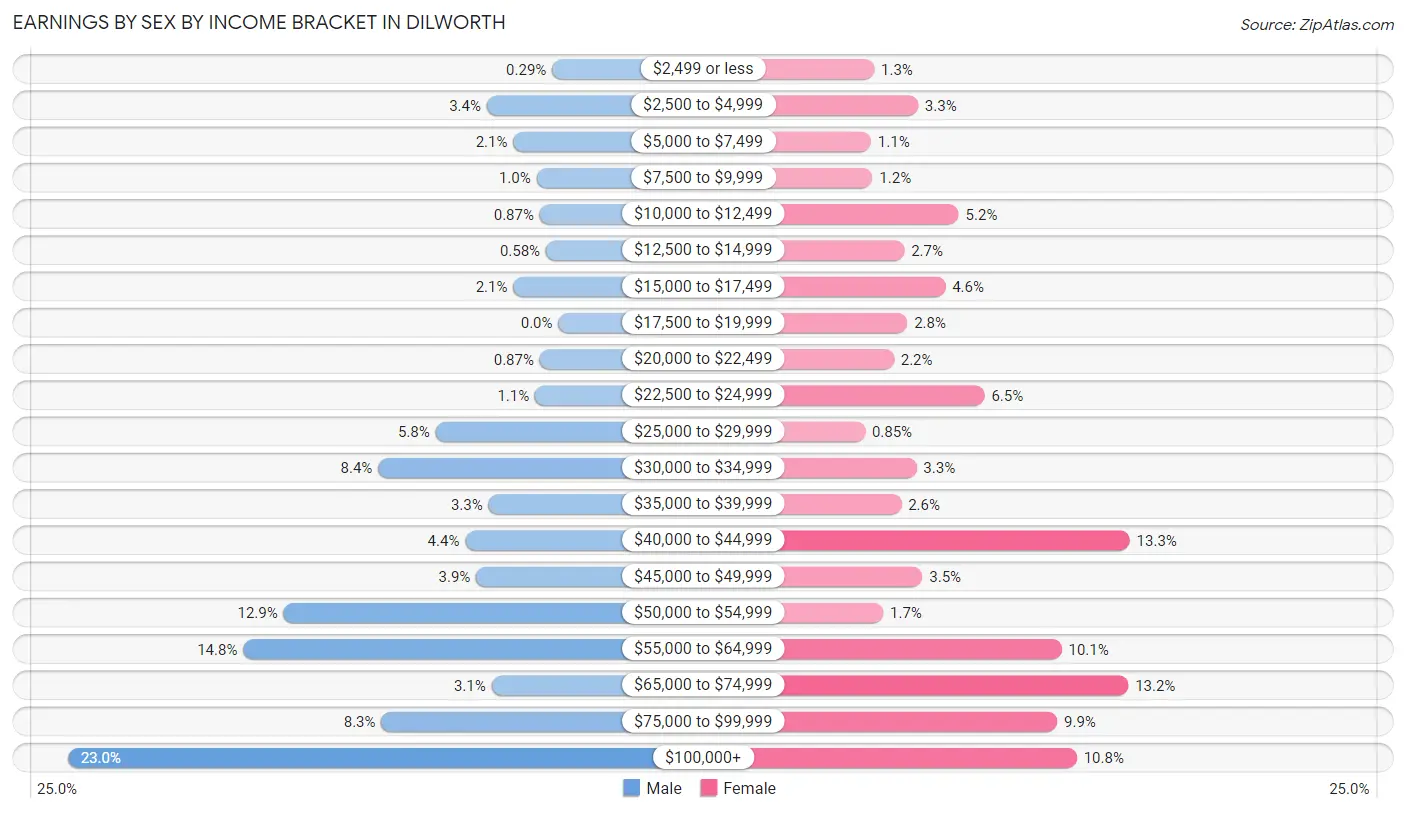
Earnings by Sex by Income Bracket in Dilworth
The most common earnings brackets in Dilworth are $100,000+ for men (316 | 23.0%) and $40,000 to $44,999 for women (187 | 13.3%).
| Income | Male | Female |
| $2,499 or less | 4 (0.3%) | 18 (1.3%) |
| $2,500 to $4,999 | 46 (3.4%) | 47 (3.3%) |
| $5,000 to $7,499 | 29 (2.1%) | 16 (1.1%) |
| $7,500 to $9,999 | 14 (1.0%) | 17 (1.2%) |
| $10,000 to $12,499 | 12 (0.9%) | 74 (5.2%) |
| $12,500 to $14,999 | 8 (0.6%) | 38 (2.7%) |
| $15,000 to $17,499 | 29 (2.1%) | 65 (4.6%) |
| $17,500 to $19,999 | 0 (0.0%) | 40 (2.8%) |
| $20,000 to $22,499 | 12 (0.9%) | 31 (2.2%) |
| $22,500 to $24,999 | 15 (1.1%) | 91 (6.5%) |
| $25,000 to $29,999 | 79 (5.8%) | 12 (0.9%) |
| $30,000 to $34,999 | 116 (8.4%) | 46 (3.3%) |
| $35,000 to $39,999 | 45 (3.3%) | 36 (2.5%) |
| $40,000 to $44,999 | 60 (4.4%) | 187 (13.3%) |
| $45,000 to $49,999 | 53 (3.8%) | 50 (3.5%) |
| $50,000 to $54,999 | 177 (12.9%) | 24 (1.7%) |
| $55,000 to $64,999 | 203 (14.8%) | 142 (10.1%) |
| $65,000 to $74,999 | 43 (3.1%) | 186 (13.2%) |
| $75,000 to $99,999 | 114 (8.3%) | 139 (9.9%) |
| $100,000+ | 316 (23.0%) | 152 (10.8%) |
| Total | 1,375 (100.0%) | 1,411 (100.0%) |
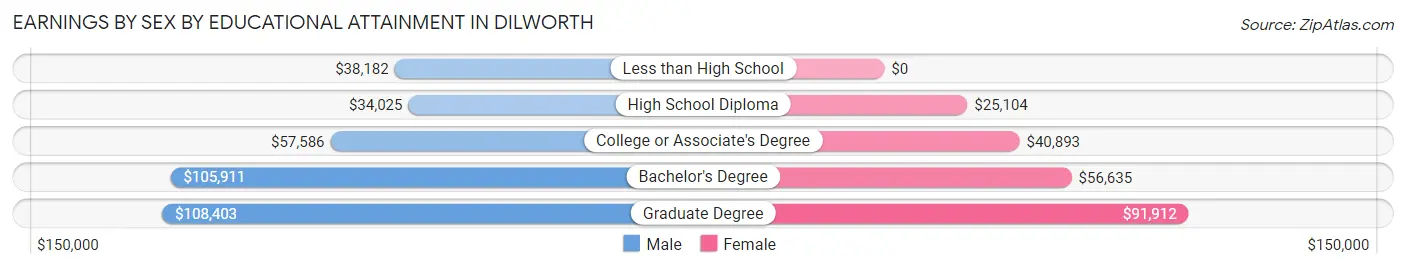
Earnings by Sex by Educational Attainment in Dilworth
Average earnings in Dilworth are $58,490 for men and $50,909 for women, a difference of 13.0%. Men with an educational attainment of graduate degree enjoy the highest average annual earnings of $108,403, while those with high school diploma education earn the least with $34,025. Women with an educational attainment of graduate degree earn the most with the average annual earnings of $91,912, while those with high school diploma education have the smallest earnings of $25,104.
| Educational Attainment | Male Income | Female Income |
| Less than High School | $38,182 | $0 |
| High School Diploma | $34,025 | $25,104 |
| College or Associate's Degree | $57,586 | $40,893 |
| Bachelor's Degree | $105,911 | $56,635 |
| Graduate Degree | $108,403 | $91,912 |
| Total | $58,490 | $50,909 |
Family Income in Dilworth
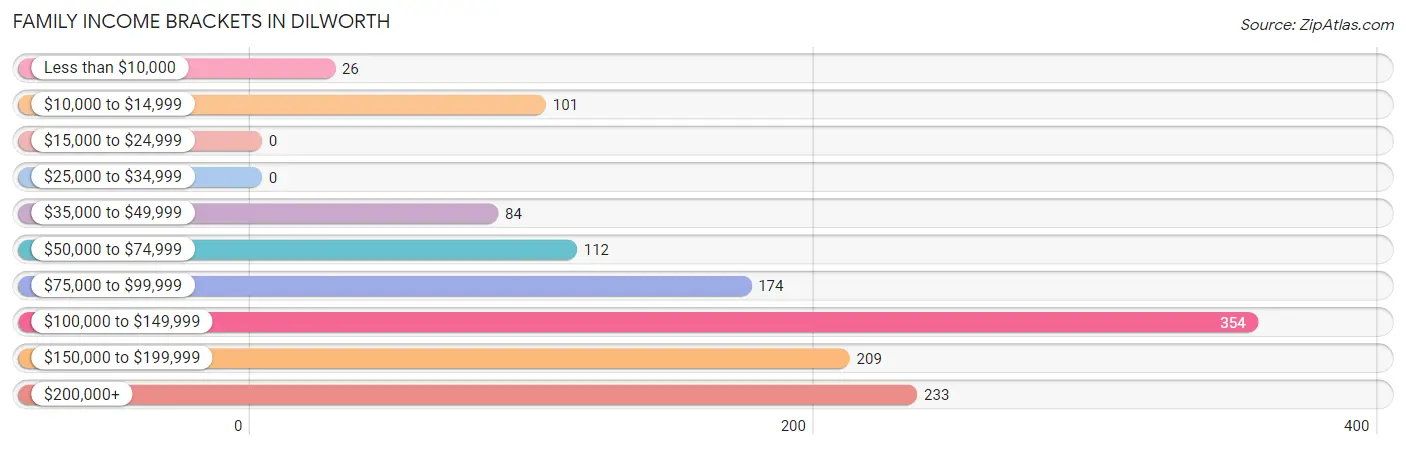
Family Income Brackets in Dilworth
According to the Dilworth family income data, there are 354 families falling into the $100,000 to $149,999 income range, which is the most common income bracket and makes up 27.4% of all families.
| Income Bracket | # Families | % Families |
| Less than $10,000 | 26 | 2.0% |
| $10,000 to $14,999 | 101 | 7.8% |
| $15,000 to $24,999 | 0 | 0.0% |
| $25,000 to $34,999 | 0 | 0.0% |
| $35,000 to $49,999 | 84 | 6.5% |
| $50,000 to $74,999 | 112 | 8.7% |
| $75,000 to $99,999 | 174 | 13.5% |
| $100,000 to $149,999 | 354 | 27.4% |
| $150,000 to $199,999 | 209 | 16.2% |
| $200,000+ | 233 | 18.0% |
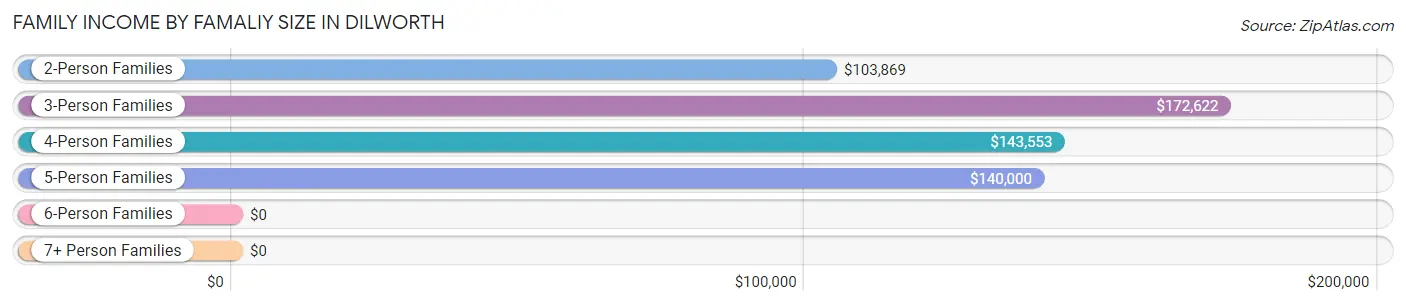
Family Income by Famaliy Size in Dilworth
3-person families (375 | 29.0%) account for the highest median family income in Dilworth with $172,622 per family, while 3-person families (375 | 29.0%) have the highest median income of $57,541 per family member.
| Income Bracket | # Families | Median Income |
| 2-Person Families | 479 (37.1%) | $103,869 |
| 3-Person Families | 375 (29.0%) | $172,622 |
| 4-Person Families | 294 (22.8%) | $143,553 |
| 5-Person Families | 118 (9.1%) | $140,000 |
| 6-Person Families | 26 (2.0%) | $0 |
| 7+ Person Families | 0 (0.0%) | $0 |
| Total | 1,292 (100.0%) | $125,952 |
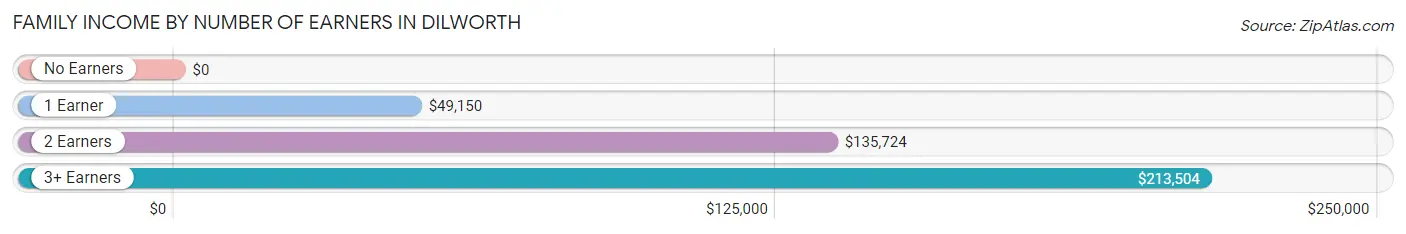
Family Income by Number of Earners in Dilworth
| Number of Earners | # Families | Median Income |
| No Earners | 174 (13.5%) | $0 |
| 1 Earner | 187 (14.5%) | $49,150 |
| 2 Earners | 682 (52.8%) | $135,724 |
| 3+ Earners | 249 (19.3%) | $213,504 |
| Total | 1,292 (100.0%) | $125,952 |
Household Income in Dilworth
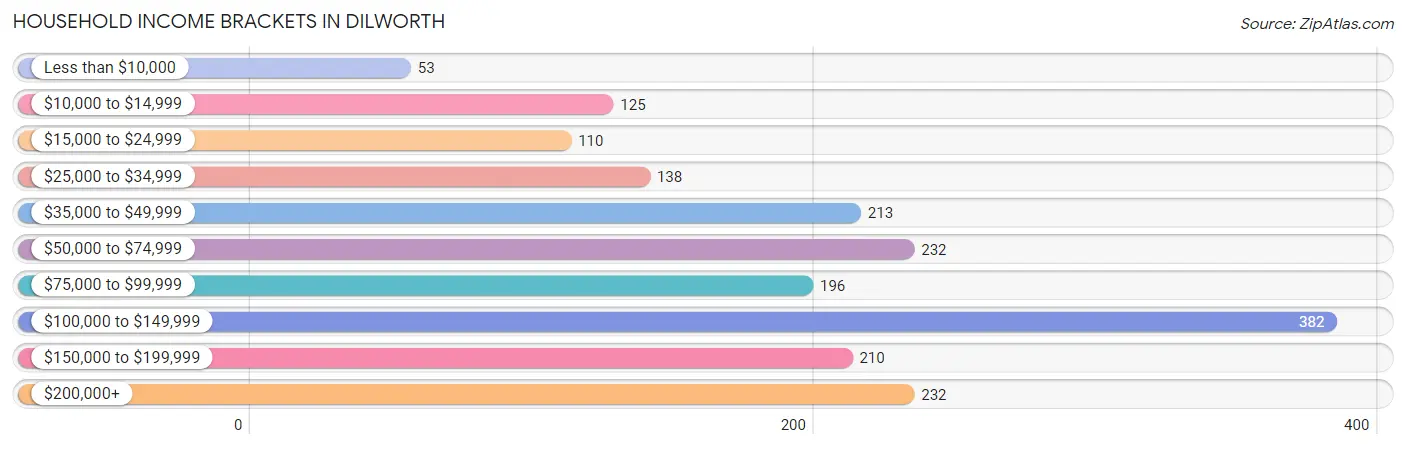
Household Income Brackets in Dilworth
With 382 households falling in the category, the $100,000 to $149,999 income range is the most frequent in Dilworth, accounting for 20.2% of all households. In contrast, only 53 households (2.8%) fall into the less than $10,000 income bracket, making it the least populous group.
| Income Bracket | # Households | % Households |
| Less than $10,000 | 53 | 2.8% |
| $10,000 to $14,999 | 125 | 6.6% |
| $15,000 to $24,999 | 110 | 5.8% |
| $25,000 to $34,999 | 138 | 7.3% |
| $35,000 to $49,999 | 213 | 11.3% |
| $50,000 to $74,999 | 232 | 12.3% |
| $75,000 to $99,999 | 196 | 10.4% |
| $100,000 to $149,999 | 382 | 20.2% |
| $150,000 to $199,999 | 210 | 11.1% |
| $200,000+ | 232 | 12.3% |
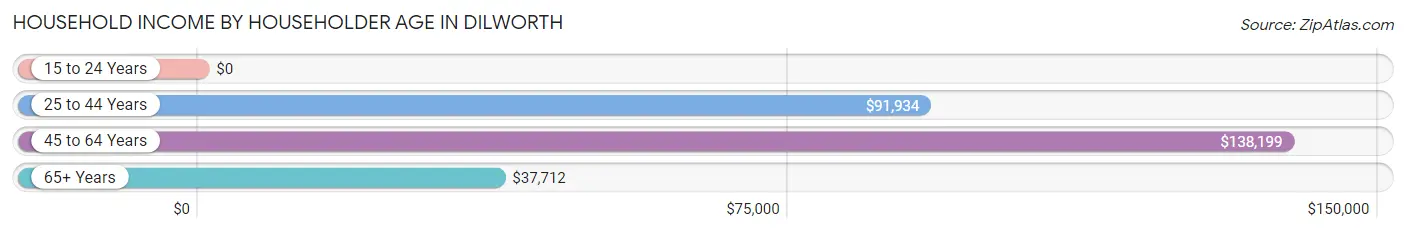
Household Income by Householder Age in Dilworth
The median household income in Dilworth is $84,602, with the highest median household income of $138,199 found in the 45 to 64 years age bracket for the primary householder. A total of 674 households (35.7%) fall into this category. Meanwhile, the 15 to 24 years age bracket for the primary householder has the lowest median household income of $0, with 24 households (1.3%) in this group.
| Income Bracket | # Households | Median Income |
| 15 to 24 Years | 24 (1.3%) | $0 |
| 25 to 44 Years | 768 (40.7%) | $91,934 |
| 45 to 64 Years | 674 (35.7%) | $138,199 |
| 65+ Years | 423 (22.4%) | $37,712 |
| Total | 1,889 (100.0%) | $84,602 |
Poverty in Dilworth
Income Below Poverty by Sex and Age in Dilworth
With 10.3% poverty level for males and 9.8% for females among the residents of Dilworth, 12 to 14 year old males and 18 to 24 year old females are the most vulnerable to poverty, with 118 males (43.4%) and 103 females (51.0%) in their respective age groups living below the poverty level.
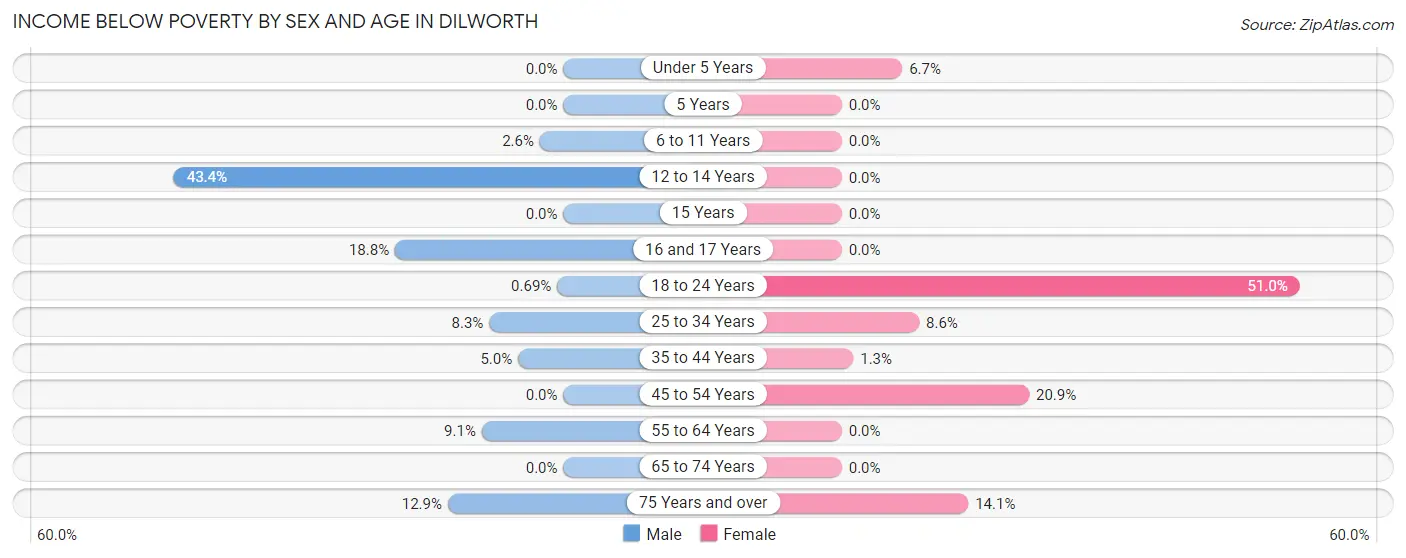
| Age Bracket | Male | Female |
| Under 5 Years | 0 (0.0%) | 7 (6.7%) |
| 5 Years | 0 (0.0%) | 0 (0.0%) |
| 6 to 11 Years | 6 (2.6%) | 0 (0.0%) |
| 12 to 14 Years | 118 (43.4%) | 0 (0.0%) |
| 15 Years | 0 (0.0%) | 0 (0.0%) |
| 16 and 17 Years | 12 (18.8%) | 0 (0.0%) |
| 18 to 24 Years | 1 (0.7%) | 103 (51.0%) |
| 25 to 34 Years | 28 (8.3%) | 23 (8.6%) |
| 35 to 44 Years | 20 (5.0%) | 6 (1.3%) |
| 45 to 54 Years | 0 (0.0%) | 74 (20.8%) |
| 55 to 64 Years | 32 (9.1%) | 0 (0.0%) |
| 65 to 74 Years | 0 (0.0%) | 0 (0.0%) |
| 75 Years and over | 13 (12.9%) | 20 (14.1%) |
| Total | 230 (10.3%) | 233 (9.8%) |
Income Above Poverty by Sex and Age in Dilworth
According to the poverty statistics in Dilworth, males aged 15 years and females aged 5 years are the age groups that are most secure financially, with 100.0% of males and 100.0% of females in these age groups living above the poverty line.
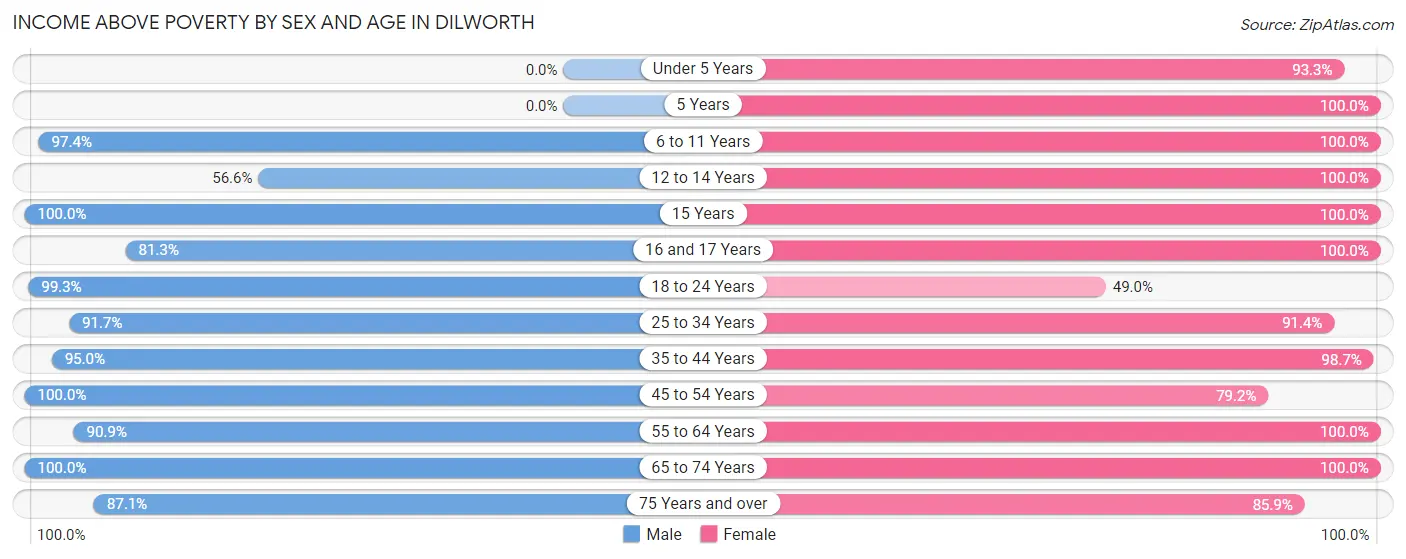
| Age Bracket | Male | Female |
| Under 5 Years | 0 (0.0%) | 97 (93.3%) |
| 5 Years | 0 (0.0%) | 31 (100.0%) |
| 6 to 11 Years | 223 (97.4%) | 193 (100.0%) |
| 12 to 14 Years | 154 (56.6%) | 93 (100.0%) |
| 15 Years | 29 (100.0%) | 53 (100.0%) |
| 16 and 17 Years | 52 (81.2%) | 36 (100.0%) |
| 18 to 24 Years | 144 (99.3%) | 99 (49.0%) |
| 25 to 34 Years | 311 (91.7%) | 244 (91.4%) |
| 35 to 44 Years | 377 (95.0%) | 462 (98.7%) |
| 45 to 54 Years | 196 (100.0%) | 281 (79.1%) |
| 55 to 64 Years | 320 (90.9%) | 232 (100.0%) |
| 65 to 74 Years | 111 (100.0%) | 207 (100.0%) |
| 75 Years and over | 88 (87.1%) | 122 (85.9%) |
| Total | 2,005 (89.7%) | 2,150 (90.2%) |
Income Below Poverty Among Married-Couple Families in Dilworth
The poverty statistics for married-couple families in Dilworth show that 3.3% or 33 of the total 989 families live below the poverty line. Families with no children have the highest poverty rate of 7.0%, comprising of 33 families. On the other hand, families with 1 or 2 children have the lowest poverty rate of 0.0%, which includes 0 families.
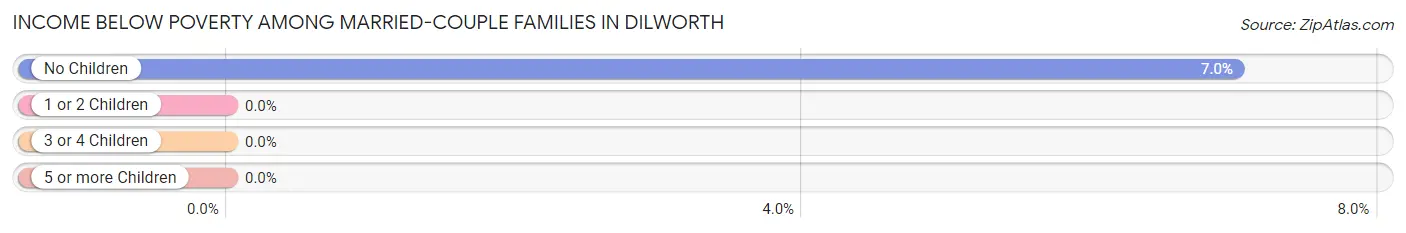
| Children | Above Poverty | Below Poverty |
| No Children | 438 (93.0%) | 33 (7.0%) |
| 1 or 2 Children | 402 (100.0%) | 0 (0.0%) |
| 3 or 4 Children | 116 (100.0%) | 0 (0.0%) |
| 5 or more Children | 0 (0.0%) | 0 (0.0%) |
| Total | 956 (96.7%) | 33 (3.3%) |
Income Below Poverty Among Single-Parent Households in Dilworth
According to the poverty data in Dilworth, 43.7% or 31 single-father households and 27.2% or 63 single-mother households are living below the poverty line. Among single-father households, those with no children have the highest poverty rate, with 31 households (43.7%) experiencing poverty. Likewise, among single-mother households, those with 1 or 2 children have the highest poverty rate, with 63 households (42.6%) falling below the poverty line.
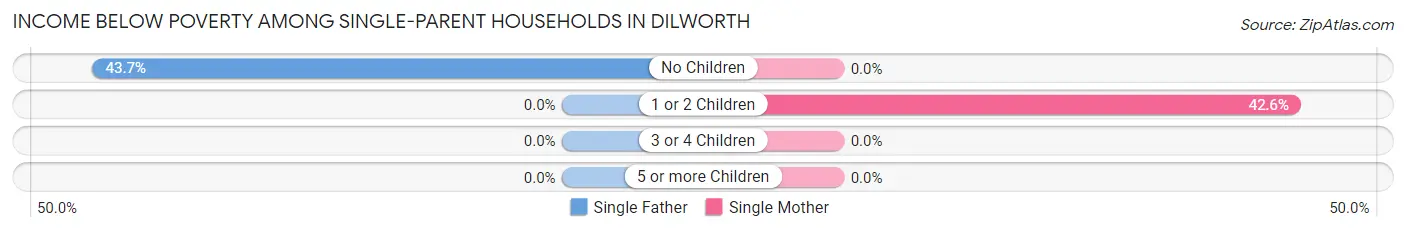
| Children | Single Father | Single Mother |
| No Children | 31 (43.7%) | 0 (0.0%) |
| 1 or 2 Children | 0 (0.0%) | 63 (42.6%) |
| 3 or 4 Children | 0 (0.0%) | 0 (0.0%) |
| 5 or more Children | 0 (0.0%) | 0 (0.0%) |
| Total | 31 (43.7%) | 63 (27.2%) |
Income Below Poverty Among Married-Couple vs Single-Parent Households in Dilworth
The poverty data for Dilworth shows that 33 of the married-couple family households (3.3%) and 94 of the single-parent households (31.0%) are living below the poverty level. Within the married-couple family households, those with no children have the highest poverty rate, with 33 households (7.0%) falling below the poverty line. Among the single-parent households, those with 1 or 2 children have the highest poverty rate, with 63 household (42.6%) living below poverty.
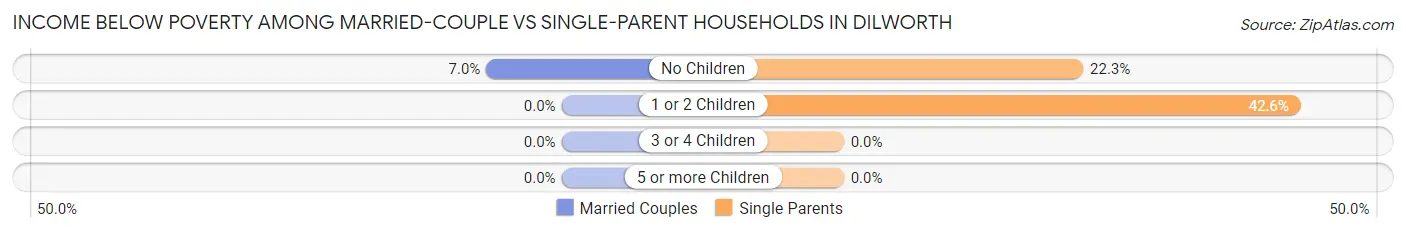
| Children | Married-Couple Families | Single-Parent Households |
| No Children | 33 (7.0%) | 31 (22.3%) |
| 1 or 2 Children | 0 (0.0%) | 63 (42.6%) |
| 3 or 4 Children | 0 (0.0%) | 0 (0.0%) |
| 5 or more Children | 0 (0.0%) | 0 (0.0%) |
| Total | 33 (3.3%) | 94 (31.0%) |
Race in Dilworth
The most populous races in Dilworth are White / Caucasian (4,041 | 87.5%), Two or more Races (293 | 6.3%), and Hispanic or Latino (281 | 6.1%).
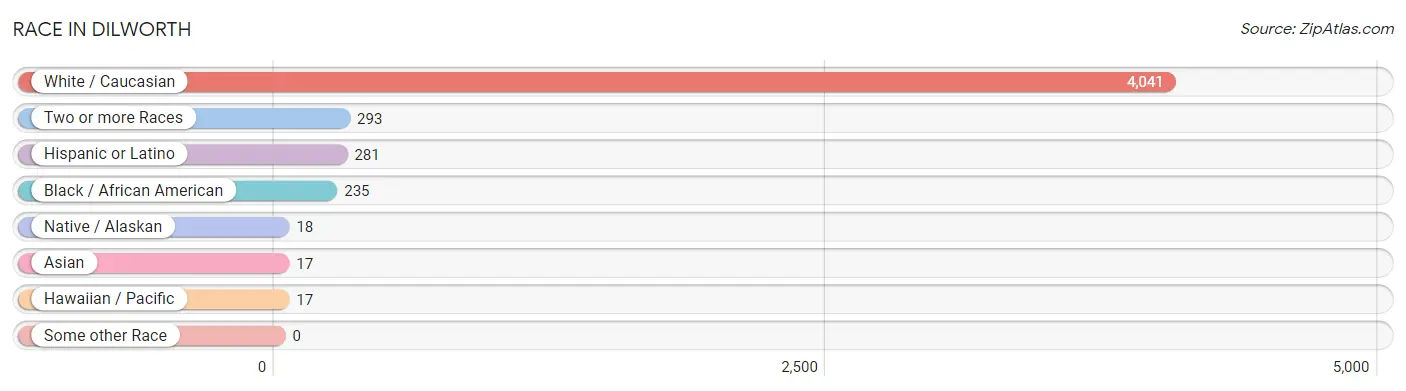
| Race | # Population | % Population |
| Asian | 17 | 0.4% |
| Black / African American | 235 | 5.1% |
| Hawaiian / Pacific | 17 | 0.4% |
| Hispanic or Latino | 281 | 6.1% |
| Native / Alaskan | 18 | 0.4% |
| White / Caucasian | 4,041 | 87.5% |
| Two or more Races | 293 | 6.3% |
| Some other Race | 0 | 0.0% |
| Total | 4,621 | 100.0% |
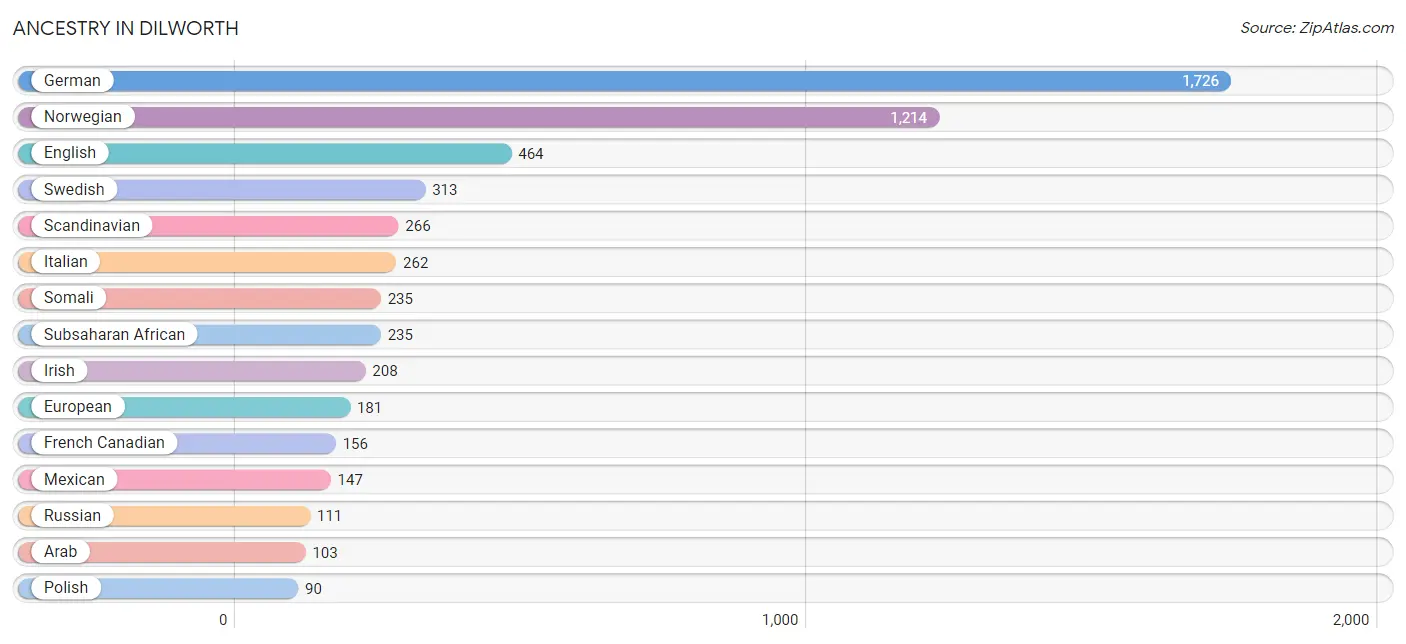
Ancestry in Dilworth
The most populous ancestries reported in Dilworth are German (1,726 | 37.3%), Norwegian (1,214 | 26.3%), English (464 | 10.0%), Swedish (313 | 6.8%), and Scandinavian (266 | 5.8%), together accounting for 86.2% of all Dilworth residents.
| Ancestry | # Population | % Population |
| American | 14 | 0.3% |
| Arab | 103 | 2.2% |
| Cambodian | 24 | 0.5% |
| Chippewa | 18 | 0.4% |
| Czech | 49 | 1.1% |
| Dutch | 40 | 0.9% |
| English | 464 | 10.0% |
| European | 181 | 3.9% |
| Finnish | 20 | 0.4% |
| French | 49 | 1.1% |
| French Canadian | 156 | 3.4% |
| German | 1,726 | 37.3% |
| Icelander | 30 | 0.6% |
| Indian (Asian) | 17 | 0.4% |
| Irish | 208 | 4.5% |
| Italian | 262 | 5.7% |
| Mexican | 147 | 3.2% |
| Norwegian | 1,214 | 26.3% |
| Polish | 90 | 1.9% |
| Puerto Rican | 14 | 0.3% |
| Russian | 111 | 2.4% |
| Scandinavian | 266 | 5.8% |
| Scottish | 34 | 0.7% |
| Somali | 235 | 5.1% |
| Subsaharan African | 235 | 5.1% |
| Swedish | 313 | 6.8% |
| Welsh | 34 | 0.7% | View All 27 Rows |
Immigrants in Dilworth
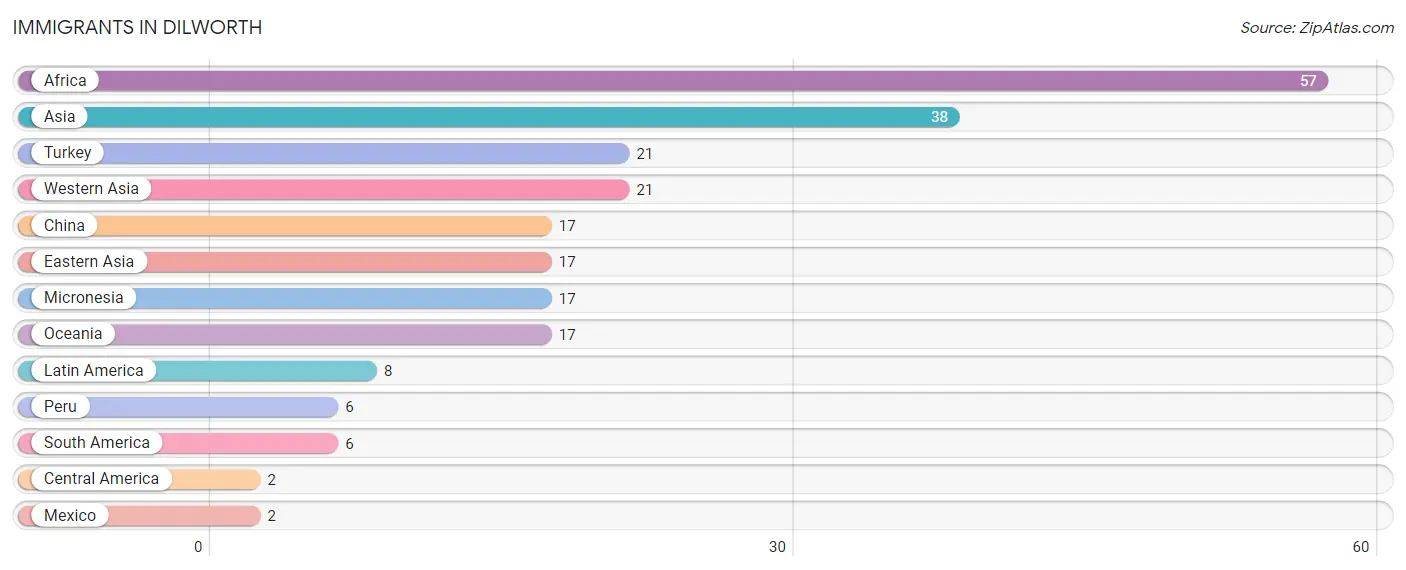
The most numerous immigrant groups reported in Dilworth came from Africa (57 | 1.2%), Asia (38 | 0.8%), Turkey (21 | 0.4%), Western Asia (21 | 0.4%), and China (17 | 0.4%), together accounting for 3.3% of all Dilworth residents.
| Immigration Origin | # Population | % Population |
| Africa | 57 | 1.2% |
| Asia | 38 | 0.8% |
| Central America | 2 | 0.0% |
| China | 17 | 0.4% |
| Eastern Asia | 17 | 0.4% |
| Latin America | 8 | 0.2% |
| Mexico | 2 | 0.0% |
| Micronesia | 17 | 0.4% |
| Oceania | 17 | 0.4% |
| Peru | 6 | 0.1% |
| South America | 6 | 0.1% |
| Turkey | 21 | 0.4% |
| Western Asia | 21 | 0.4% | View All 13 Rows |
Sex and Age in Dilworth
Sex and Age in Dilworth
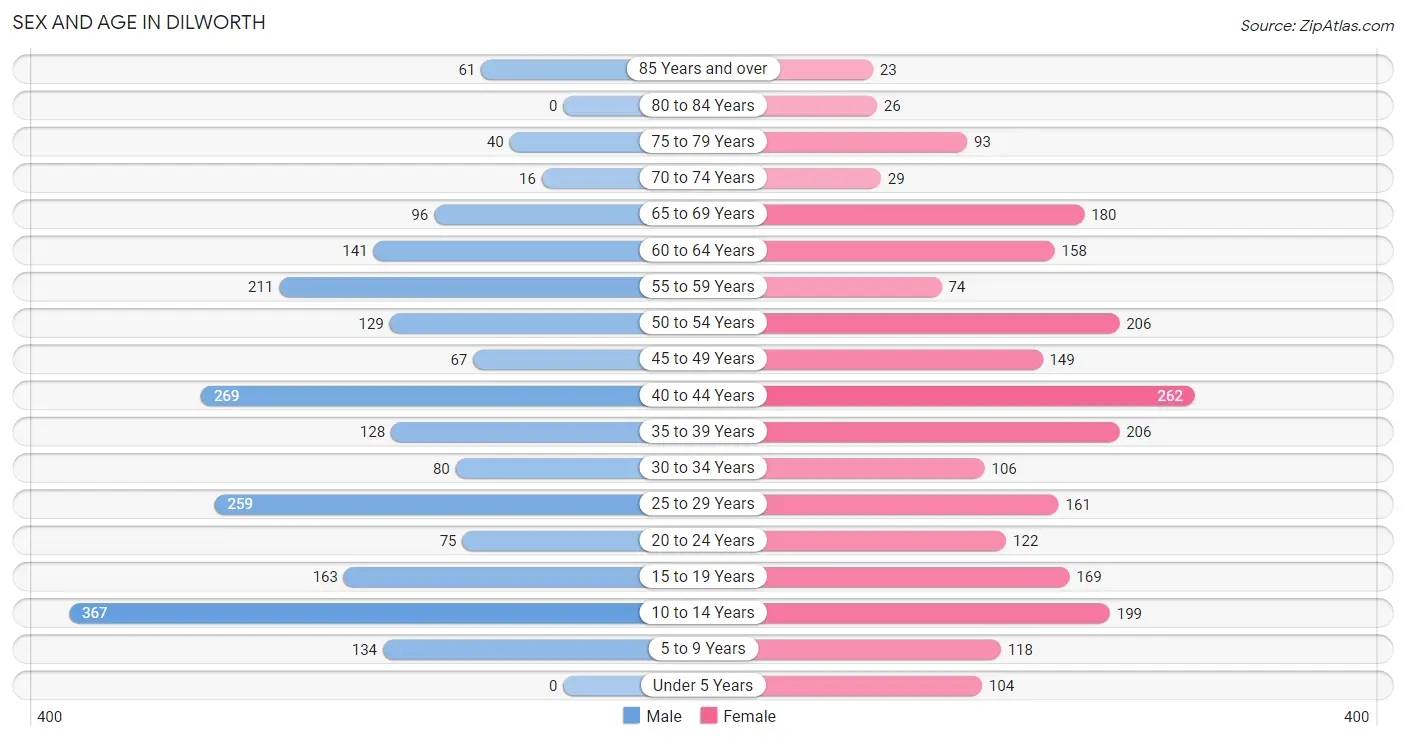
The most populous age groups in Dilworth are 10 to 14 Years (367 | 16.4%) for men and 40 to 44 Years (262 | 11.0%) for women.
| Age Bracket | Male | Female |
| Under 5 Years | 0 (0.0%) | 104 (4.4%) |
| 5 to 9 Years | 134 (6.0%) | 118 (5.0%) |
| 10 to 14 Years | 367 (16.4%) | 199 (8.3%) |
| 15 to 19 Years | 163 (7.3%) | 169 (7.1%) |
| 20 to 24 Years | 75 (3.4%) | 122 (5.1%) |
| 25 to 29 Years | 259 (11.6%) | 161 (6.8%) |
| 30 to 34 Years | 80 (3.6%) | 106 (4.4%) |
| 35 to 39 Years | 128 (5.7%) | 206 (8.6%) |
| 40 to 44 Years | 269 (12.0%) | 262 (11.0%) |
| 45 to 49 Years | 67 (3.0%) | 149 (6.2%) |
| 50 to 54 Years | 129 (5.8%) | 206 (8.6%) |
| 55 to 59 Years | 211 (9.4%) | 74 (3.1%) |
| 60 to 64 Years | 141 (6.3%) | 158 (6.6%) |
| 65 to 69 Years | 96 (4.3%) | 180 (7.5%) |
| 70 to 74 Years | 16 (0.7%) | 29 (1.2%) |
| 75 to 79 Years | 40 (1.8%) | 93 (3.9%) |
| 80 to 84 Years | 0 (0.0%) | 26 (1.1%) |
| 85 Years and over | 61 (2.7%) | 23 (1.0%) |
| Total | 2,236 (100.0%) | 2,385 (100.0%) |
Families and Households in Dilworth
Median Family Size in Dilworth
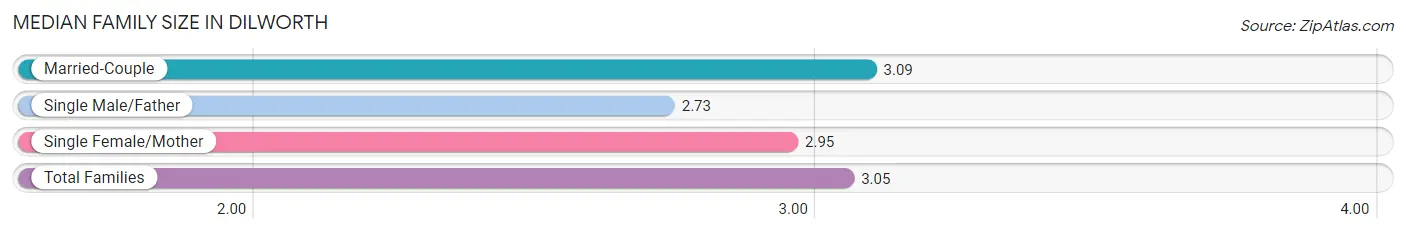
The median family size in Dilworth is 3.05 persons per family, with married-couple families (989 | 76.5%) accounting for the largest median family size of 3.09 persons per family. On the other hand, single male/father families (71 | 5.5%) represent the smallest median family size with 2.73 persons per family.
| Family Type | # Families | Family Size |
| Married-Couple | 989 (76.5%) | 3.09 |
| Single Male/Father | 71 (5.5%) | 2.73 |
| Single Female/Mother | 232 (18.0%) | 2.95 |
| Total Families | 1,292 (100.0%) | 3.05 |
Median Household Size in Dilworth
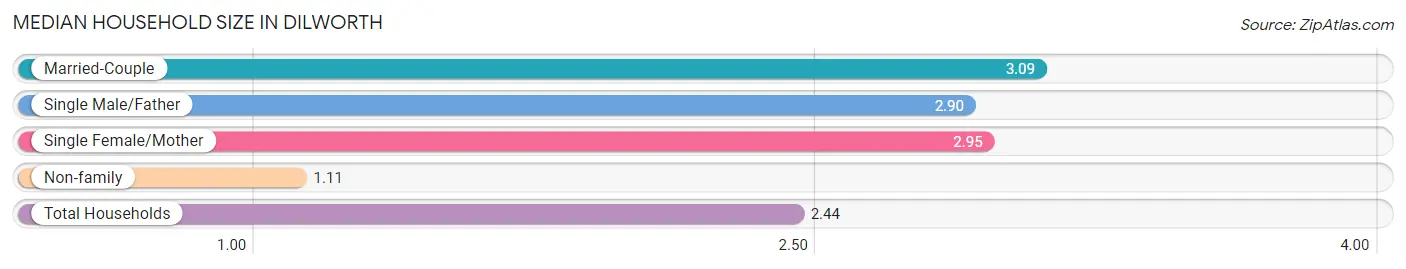
The median household size in Dilworth is 2.44 persons per household, with married-couple households (989 | 52.4%) accounting for the largest median household size of 3.09 persons per household. non-family households (597 | 31.6%) represent the smallest median household size with 1.11 persons per household.
| Household Type | # Households | Household Size |
| Married-Couple | 989 (52.4%) | 3.09 |
| Single Male/Father | 71 (3.8%) | 2.90 |
| Single Female/Mother | 232 (12.3%) | 2.95 |
| Non-family | 597 (31.6%) | 1.11 |
| Total Households | 1,889 (100.0%) | 2.44 |
Household Size by Marriage Status in Dilworth
Out of a total of 1,889 households in Dilworth, 1,292 (68.4%) are family households, while 597 (31.6%) are nonfamily households. The most numerous type of family households are 2-person households, comprising 471, and the most common type of nonfamily households are 1-person households, comprising 554.
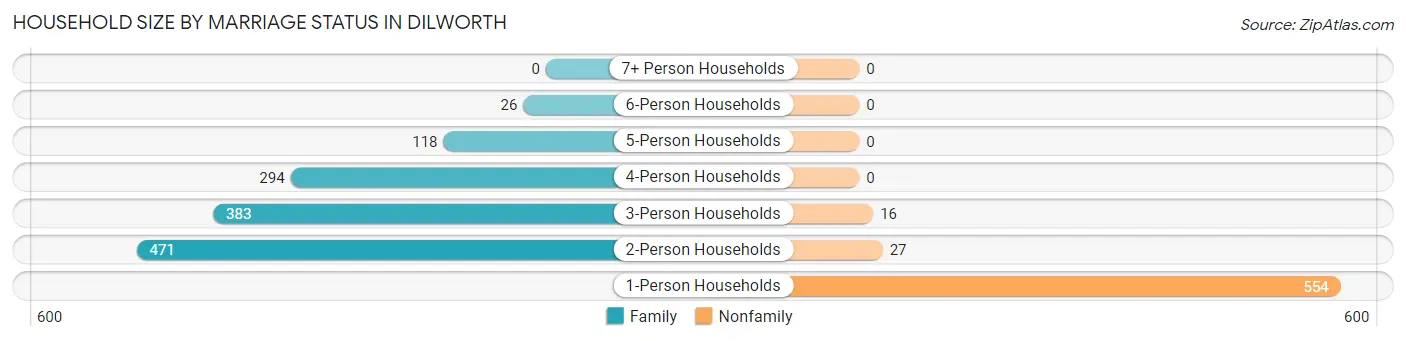
| Household Size | Family Households | Nonfamily Households |
| 1-Person Households | - | 554 (29.3%) |
| 2-Person Households | 471 (24.9%) | 27 (1.4%) |
| 3-Person Households | 383 (20.3%) | 16 (0.9%) |
| 4-Person Households | 294 (15.6%) | 0 (0.0%) |
| 5-Person Households | 118 (6.2%) | 0 (0.0%) |
| 6-Person Households | 26 (1.4%) | 0 (0.0%) |
| 7+ Person Households | 0 (0.0%) | 0 (0.0%) |
| Total | 1,292 (68.4%) | 597 (31.6%) |
Female Fertility in Dilworth
Fertility by Age in Dilworth
Average fertility rate in Dilworth is 41.0 births per 1,000 women. Women in the age bracket of 20 to 34 years have the highest fertility rate with 123.0 births per 1,000 women. Women in the age bracket of 20 to 34 years acount for 100.0% of all women with births.
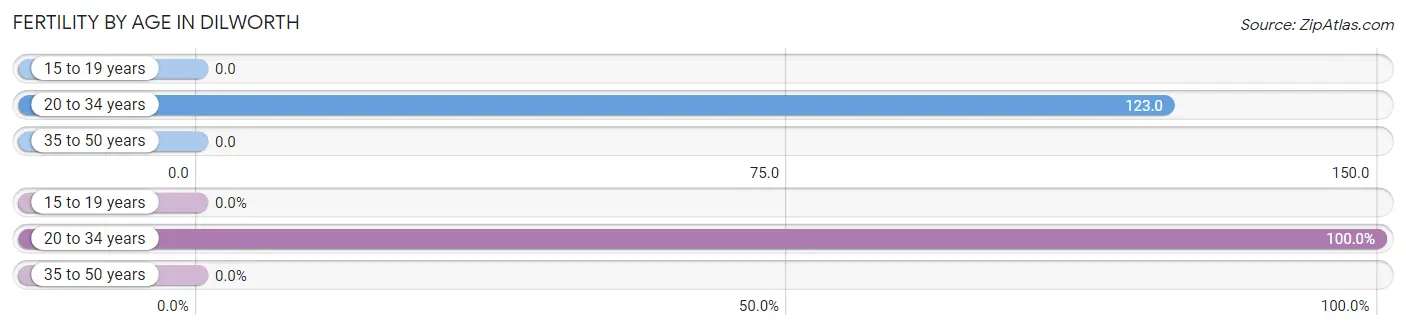
| Age Bracket | Women with Births | Births / 1,000 Women |
| 15 to 19 years | 0 (0.0%) | 0.0 |
| 20 to 34 years | 48 (100.0%) | 123.0 |
| 35 to 50 years | 0 (0.0%) | 0.0 |
| Total | 48 (100.0%) | 41.0 |
Fertility by Age by Marriage Status in Dilworth
87.5% of women with births (48) in Dilworth are married. The highest percentage of unmarried women with births falls into 20 to 34 years age bracket with 12.5% of them unmarried at the time of birth, while the lowest percentage of unmarried women with births belong to 20 to 34 years age bracket with 12.5% of them unmarried.
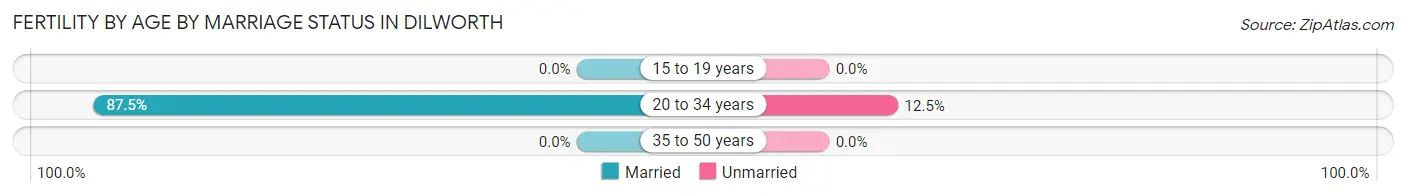
| Age Bracket | Married | Unmarried |
| 15 to 19 years | 0 (0.0%) | 0 (0.0%) |
| 20 to 34 years | 42 (87.5%) | 6 (12.5%) |
| 35 to 50 years | 0 (0.0%) | 0 (0.0%) |
| Total | 42 (87.5%) | 6 (12.5%) |
Fertility by Education in Dilworth
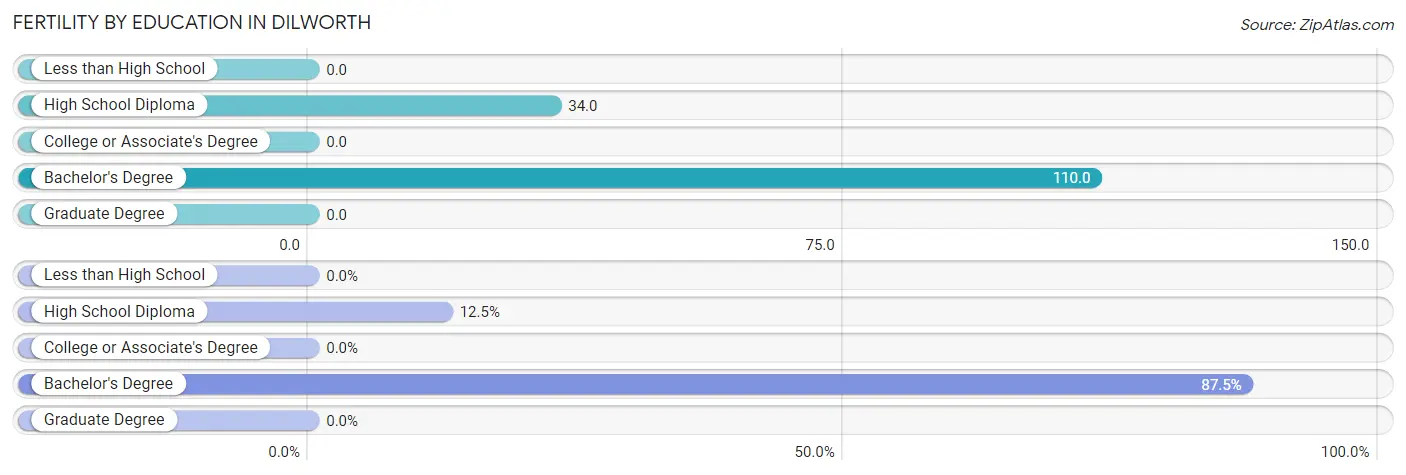
| Educational Attainment | Women with Births | Births / 1,000 Women |
| Less than High School | 0 (0.0%) | 0.0 |
| High School Diploma | 6 (12.5%) | 34.0 |
| College or Associate's Degree | 0 (0.0%) | 0.0 |
| Bachelor's Degree | 42 (87.5%) | 110.0 |
| Graduate Degree | 0 (0.0%) | 0.0 |
| Total | 48 (100.0%) | 41.0 |
Fertility by Education by Marriage Status in Dilworth
12.5% of women with births in Dilworth are unmarried. Women with the educational attainment of bachelor's degree are most likely to be married with 100.0% of them married at childbirth, while women with the educational attainment of high school diploma are least likely to be married with 100.0% of them unmarried at childbirth.
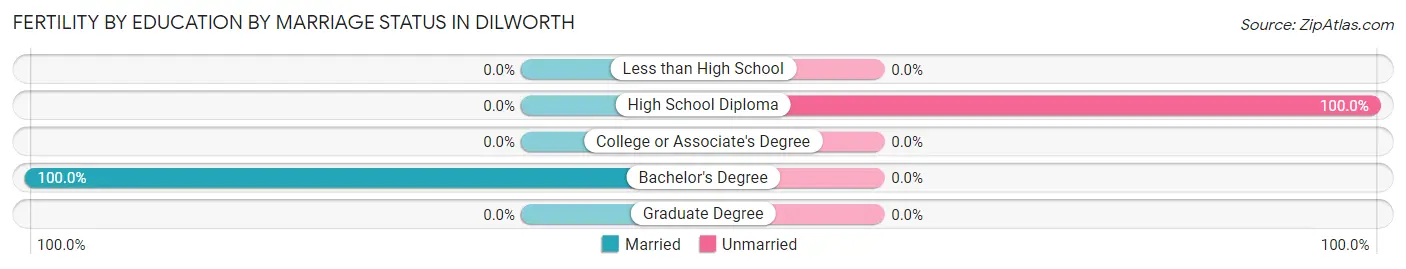
| Educational Attainment | Married | Unmarried |
| Less than High School | 0 (0.0%) | 0 (0.0%) |
| High School Diploma | 0 (0.0%) | 6 (100.0%) |
| College or Associate's Degree | 0 (0.0%) | 0 (0.0%) |
| Bachelor's Degree | 42 (100.0%) | 0 (0.0%) |
| Graduate Degree | 0 (0.0%) | 0 (0.0%) |
| Total | 42 (87.5%) | 6 (12.5%) |
Employment Characteristics in Dilworth
Employment by Class of Employer in Dilworth
Among the 2,597 employed individuals in Dilworth, private company employees (1,484 | 57.1%), not-for-profit organizations (474 | 18.2%), and local government employees (319 | 12.3%) make up the most common classes of employment.
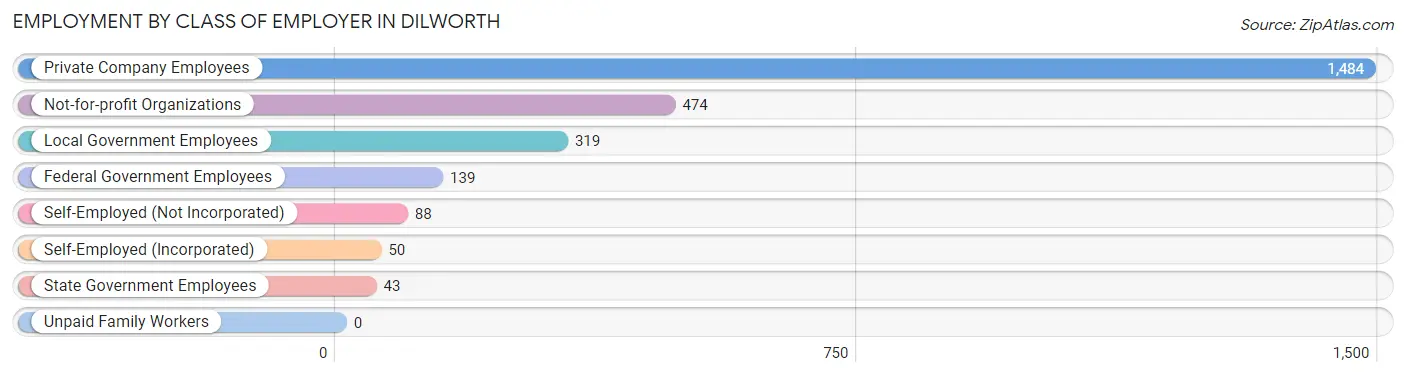
| Employer Class | # Employees | % Employees |
| Private Company Employees | 1,484 | 57.1% |
| Self-Employed (Incorporated) | 50 | 1.9% |
| Self-Employed (Not Incorporated) | 88 | 3.4% |
| Not-for-profit Organizations | 474 | 18.2% |
| Local Government Employees | 319 | 12.3% |
| State Government Employees | 43 | 1.7% |
| Federal Government Employees | 139 | 5.3% |
| Unpaid Family Workers | 0 | 0.0% |
| Total | 2,597 | 100.0% |
Employment Status by Age in Dilworth
According to the labor force statistics for Dilworth, out of the total population over 16 years of age (3,617), 75.6% or 2,734 individuals are in the labor force, with 1.1% or 30 of them unemployed. The age group with the highest labor force participation rate is 35 to 44 years, with 94.9% or 821 individuals in the labor force. Within the labor force, the 35 to 44 years age range has the highest percentage of unemployed individuals, with 3.3% or 27 of them being unemployed.
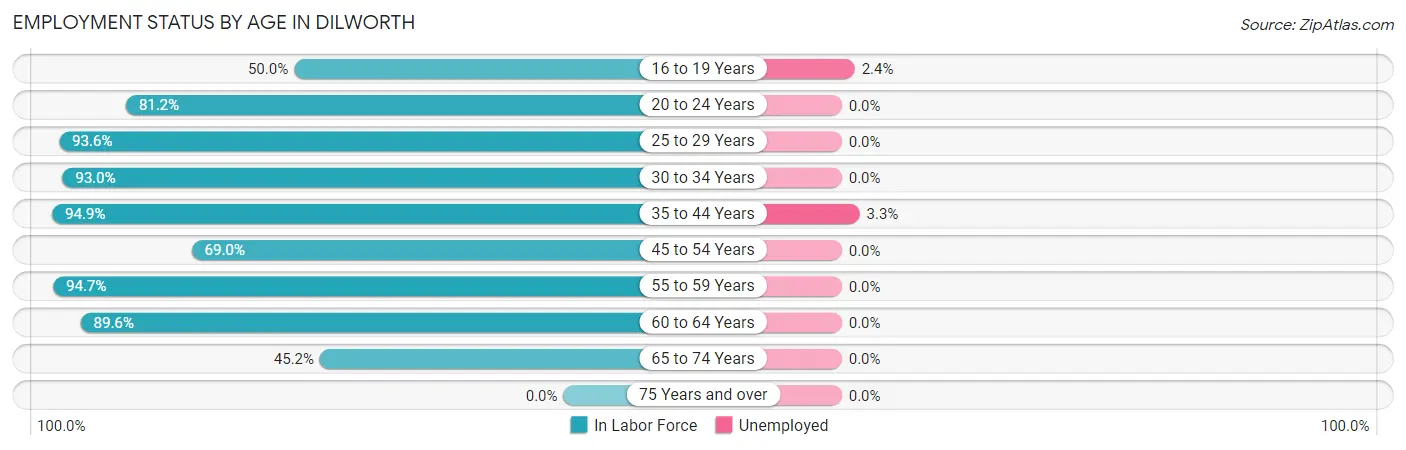
| Age Bracket | In Labor Force | Unemployed |
| 16 to 19 Years | 125 (50.0%) | 3 (2.4%) |
| 20 to 24 Years | 160 (81.2%) | 0 (0.0%) |
| 25 to 29 Years | 393 (93.6%) | 0 (0.0%) |
| 30 to 34 Years | 173 (93.0%) | 0 (0.0%) |
| 35 to 44 Years | 821 (94.9%) | 27 (3.3%) |
| 45 to 54 Years | 380 (69.0%) | 0 (0.0%) |
| 55 to 59 Years | 270 (94.7%) | 0 (0.0%) |
| 60 to 64 Years | 268 (89.6%) | 0 (0.0%) |
| 65 to 74 Years | 145 (45.2%) | 0 (0.0%) |
| 75 Years and over | 0 (0.0%) | 0 (0.0%) |
| Total | 2,734 (75.6%) | 30 (1.1%) |
Employment Status by Educational Attainment in Dilworth
According to labor force statistics for Dilworth, 88.4% of individuals (2,304) out of the total population between 25 and 64 years of age (2,606) are in the labor force, with 1.1% or 25 of them being unemployed. The group with the highest labor force participation rate are those with the educational attainment of bachelor's degree or higher, with 96.6% or 1,130 individuals in the labor force. Within the labor force, individuals with college / associate degree education have the highest percentage of unemployment, with 3.2% or 26 of them being unemployed.
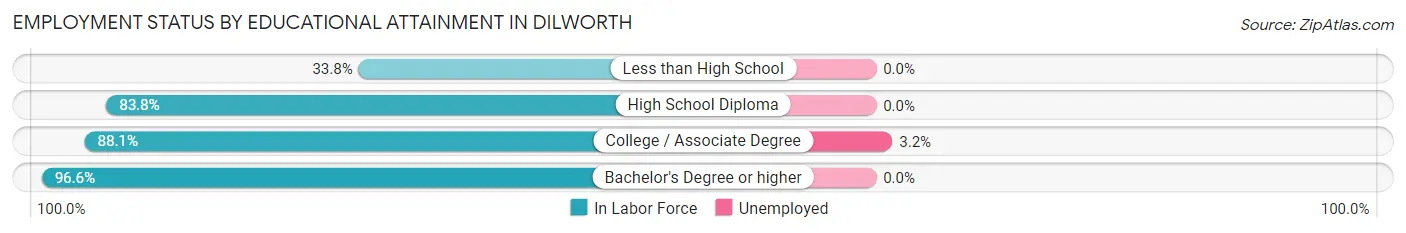
| Educational Attainment | In Labor Force | Unemployed |
| Less than High School | 46 (33.8%) | 0 (0.0%) |
| High School Diploma | 321 (83.8%) | 0 (0.0%) |
| College / Associate Degree | 808 (88.1%) | 29 (3.2%) |
| Bachelor's Degree or higher | 1,130 (96.6%) | 0 (0.0%) |
| Total | 2,304 (88.4%) | 29 (1.1%) |
Employment Occupations by Sex in Dilworth
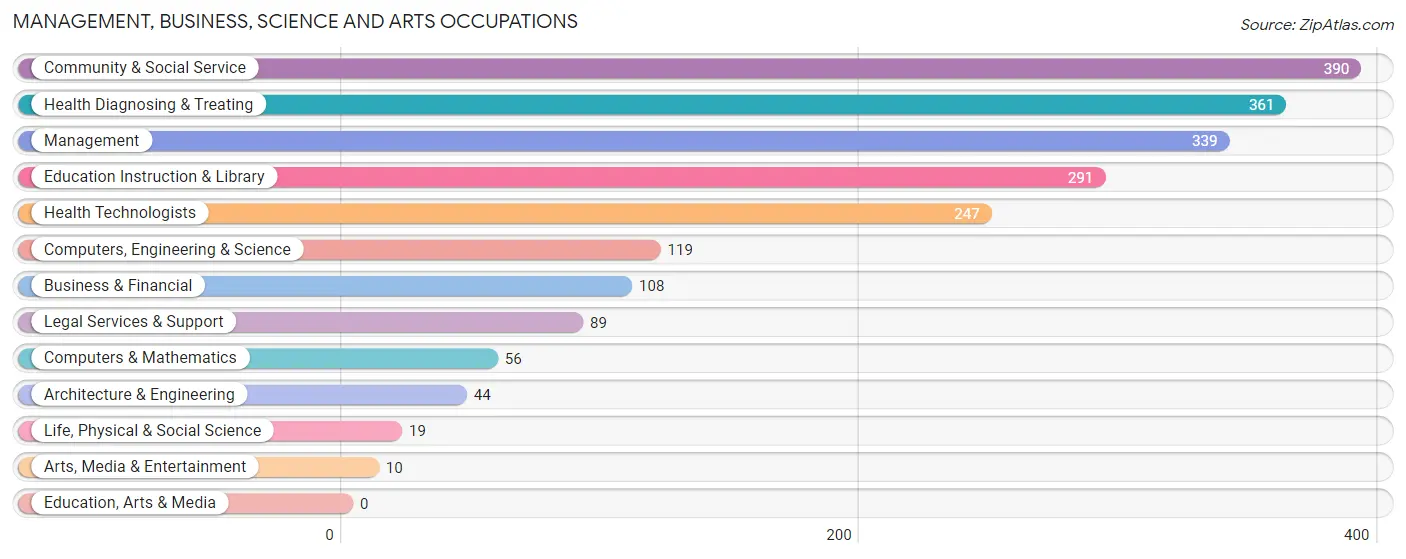
Management, Business, Science and Arts Occupations
The most common Management, Business, Science and Arts occupations in Dilworth are Community & Social Service (390 | 14.5%), Health Diagnosing & Treating (361 | 13.5%), Management (339 | 12.6%), Education Instruction & Library (291 | 10.8%), and Health Technologists (247 | 9.2%).
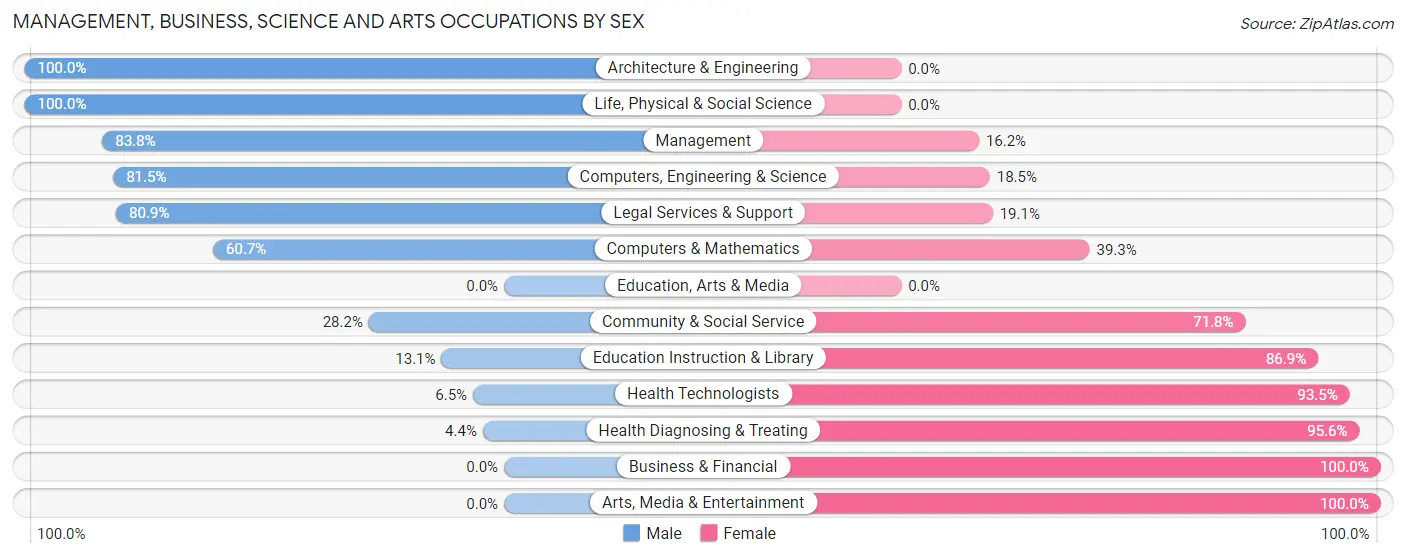
Management, Business, Science and Arts Occupations by Sex
Within the Management, Business, Science and Arts occupations in Dilworth, the most male-oriented occupations are Architecture & Engineering (100.0%), Life, Physical & Social Science (100.0%), and Management (83.8%), while the most female-oriented occupations are Business & Financial (100.0%), Arts, Media & Entertainment (100.0%), and Health Diagnosing & Treating (95.6%).
| Occupation | Male | Female |
| Management | 284 (83.8%) | 55 (16.2%) |
| Business & Financial | 0 (0.0%) | 108 (100.0%) |
| Computers, Engineering & Science | 97 (81.5%) | 22 (18.5%) |
| Computers & Mathematics | 34 (60.7%) | 22 (39.3%) |
| Architecture & Engineering | 44 (100.0%) | 0 (0.0%) |
| Life, Physical & Social Science | 19 (100.0%) | 0 (0.0%) |
| Community & Social Service | 110 (28.2%) | 280 (71.8%) |
| Education, Arts & Media | 0 (0.0%) | 0 (0.0%) |
| Legal Services & Support | 72 (80.9%) | 17 (19.1%) |
| Education Instruction & Library | 38 (13.1%) | 253 (86.9%) |
| Arts, Media & Entertainment | 0 (0.0%) | 10 (100.0%) |
| Health Diagnosing & Treating | 16 (4.4%) | 345 (95.6%) |
| Health Technologists | 16 (6.5%) | 231 (93.5%) |
| Total (Category) | 507 (38.5%) | 810 (61.5%) |
| Total (Overall) | 1,333 (49.7%) | 1,350 (50.3%) |
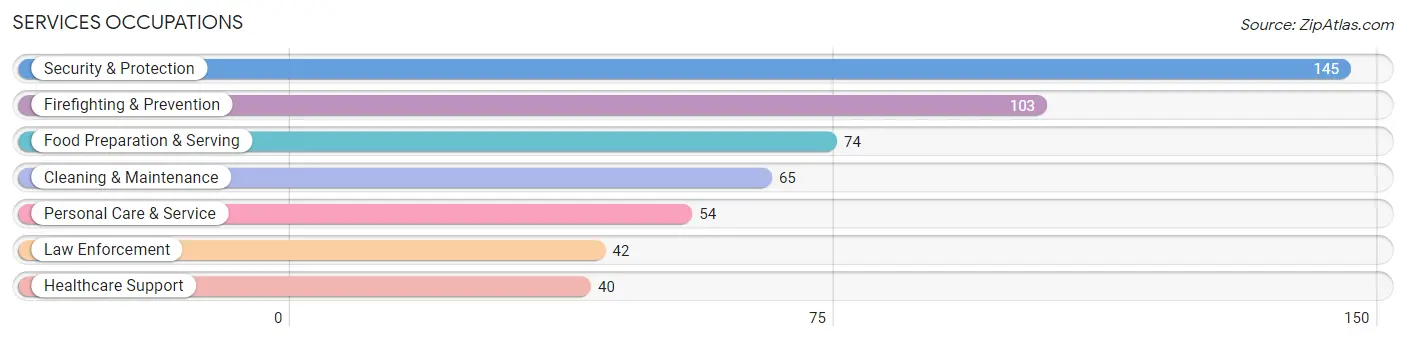
Services Occupations
The most common Services occupations in Dilworth are Security & Protection (145 | 5.4%), Firefighting & Prevention (103 | 3.8%), Food Preparation & Serving (74 | 2.8%), Cleaning & Maintenance (65 | 2.4%), and Personal Care & Service (54 | 2.0%).
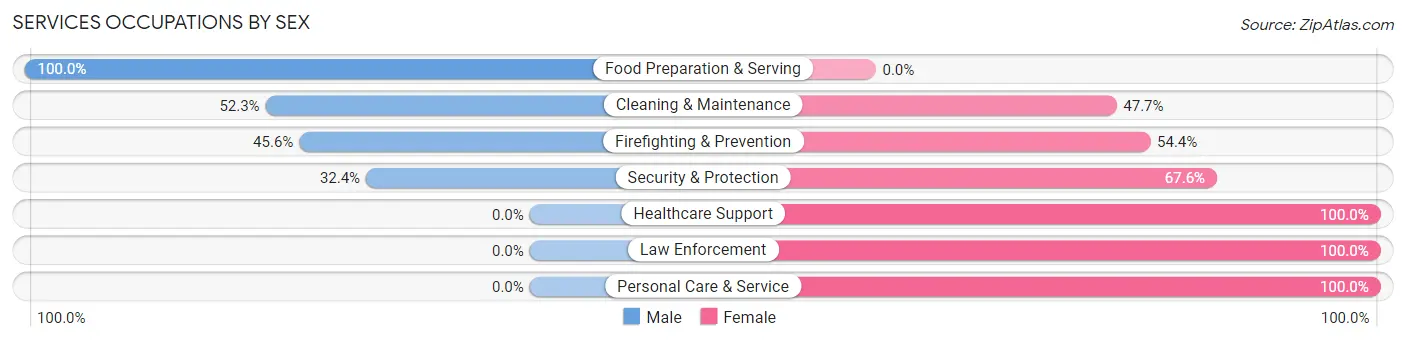
Services Occupations by Sex
Within the Services occupations in Dilworth, the most male-oriented occupations are Food Preparation & Serving (100.0%), Cleaning & Maintenance (52.3%), and Firefighting & Prevention (45.6%), while the most female-oriented occupations are Healthcare Support (100.0%), Law Enforcement (100.0%), and Personal Care & Service (100.0%).
| Occupation | Male | Female |
| Healthcare Support | 0 (0.0%) | 40 (100.0%) |
| Security & Protection | 47 (32.4%) | 98 (67.6%) |
| Firefighting & Prevention | 47 (45.6%) | 56 (54.4%) |
| Law Enforcement | 0 (0.0%) | 42 (100.0%) |
| Food Preparation & Serving | 74 (100.0%) | 0 (0.0%) |
| Cleaning & Maintenance | 34 (52.3%) | 31 (47.7%) |
| Personal Care & Service | 0 (0.0%) | 54 (100.0%) |
| Total (Category) | 155 (41.0%) | 223 (59.0%) |
| Total (Overall) | 1,333 (49.7%) | 1,350 (50.3%) |
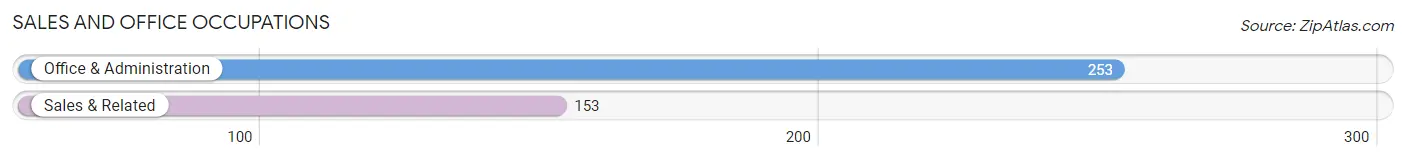
Sales and Office Occupations
The most common Sales and Office occupations in Dilworth are Office & Administration (253 | 9.4%), and Sales & Related (153 | 5.7%).
Sales and Office Occupations by Sex
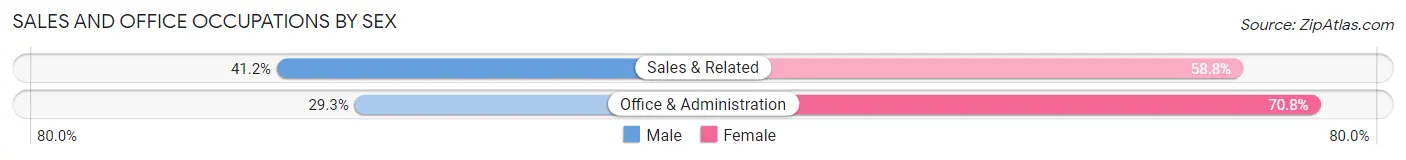
| Occupation | Male | Female |
| Sales & Related | 63 (41.2%) | 90 (58.8%) |
| Office & Administration | 74 (29.2%) | 179 (70.8%) |
| Total (Category) | 137 (33.7%) | 269 (66.3%) |
| Total (Overall) | 1,333 (49.7%) | 1,350 (50.3%) |
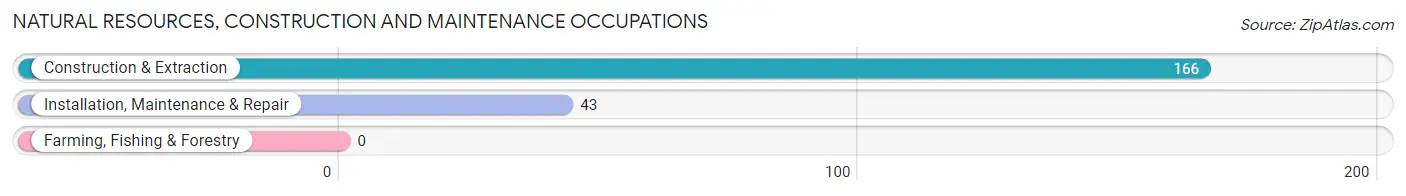
Natural Resources, Construction and Maintenance Occupations
The most common Natural Resources, Construction and Maintenance occupations in Dilworth are Construction & Extraction (166 | 6.2%), and Installation, Maintenance & Repair (43 | 1.6%).
Natural Resources, Construction and Maintenance Occupations by Sex
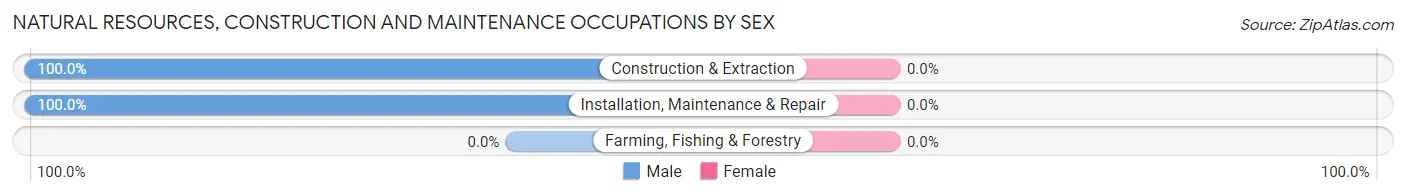
| Occupation | Male | Female |
| Farming, Fishing & Forestry | 0 (0.0%) | 0 (0.0%) |
| Construction & Extraction | 166 (100.0%) | 0 (0.0%) |
| Installation, Maintenance & Repair | 43 (100.0%) | 0 (0.0%) |
| Total (Category) | 209 (100.0%) | 0 (0.0%) |
| Total (Overall) | 1,333 (49.7%) | 1,350 (50.3%) |
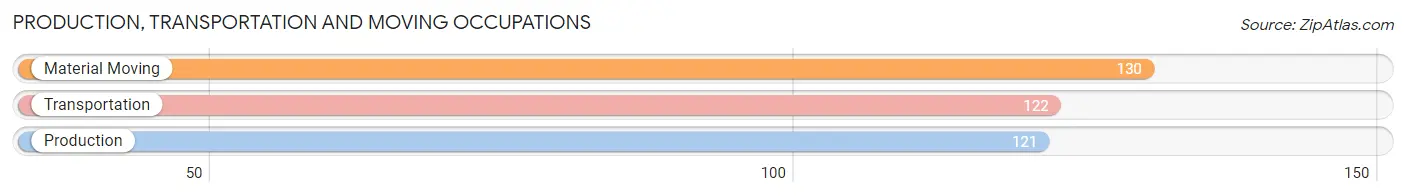
Production, Transportation and Moving Occupations
The most common Production, Transportation and Moving occupations in Dilworth are Material Moving (130 | 4.9%), Transportation (122 | 4.5%), and Production (121 | 4.5%).
Production, Transportation and Moving Occupations by Sex
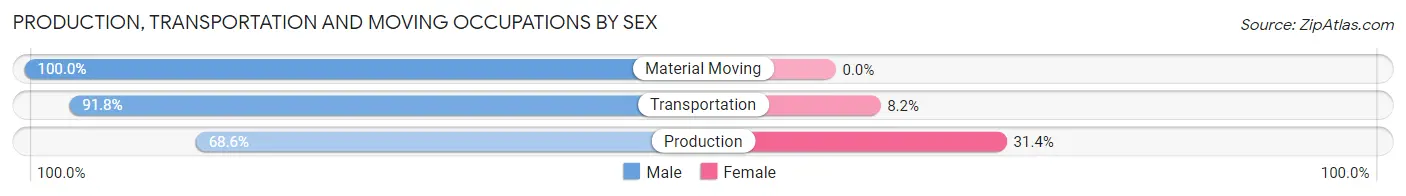
| Occupation | Male | Female |
| Production | 83 (68.6%) | 38 (31.4%) |
| Transportation | 112 (91.8%) | 10 (8.2%) |
| Material Moving | 130 (100.0%) | 0 (0.0%) |
| Total (Category) | 325 (87.1%) | 48 (12.9%) |
| Total (Overall) | 1,333 (49.7%) | 1,350 (50.3%) |
Employment Industries by Sex in Dilworth
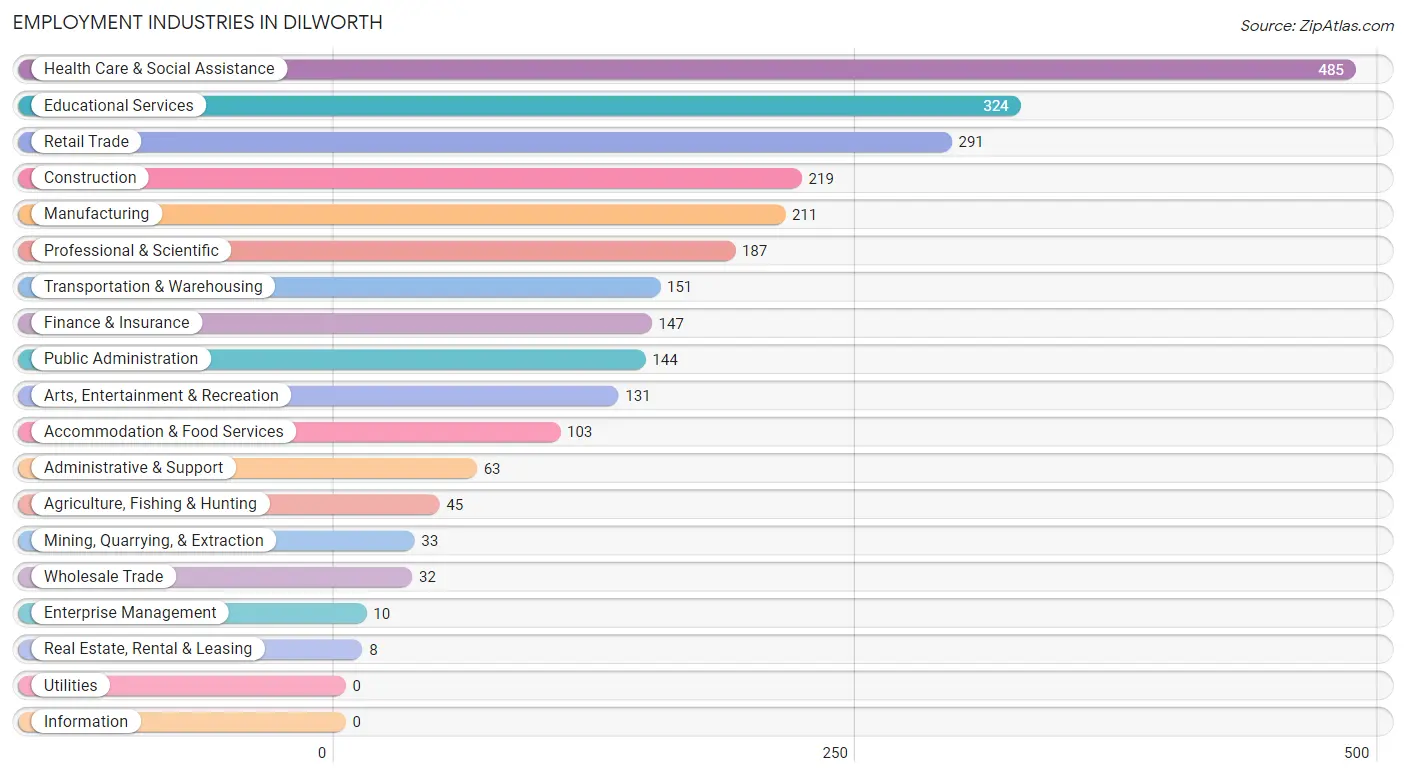
Employment Industries in Dilworth
The major employment industries in Dilworth include Health Care & Social Assistance (485 | 18.1%), Educational Services (324 | 12.1%), Retail Trade (291 | 10.8%), Construction (219 | 8.2%), and Manufacturing (211 | 7.9%).
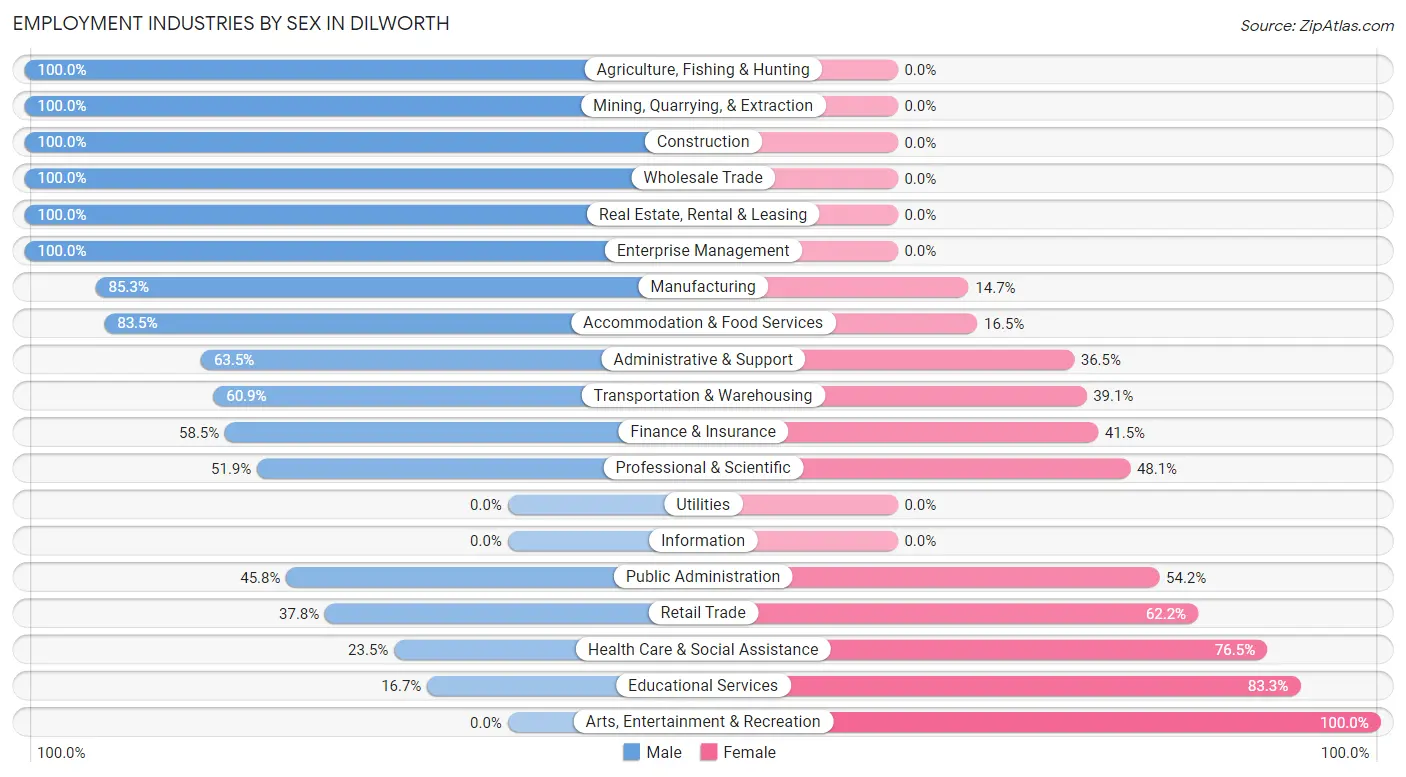
Employment Industries by Sex in Dilworth
The Dilworth industries that see more men than women are Agriculture, Fishing & Hunting (100.0%), Mining, Quarrying, & Extraction (100.0%), and Construction (100.0%), whereas the industries that tend to have a higher number of women are Arts, Entertainment & Recreation (100.0%), Educational Services (83.3%), and Health Care & Social Assistance (76.5%).
| Industry | Male | Female |
| Agriculture, Fishing & Hunting | 45 (100.0%) | 0 (0.0%) |
| Mining, Quarrying, & Extraction | 33 (100.0%) | 0 (0.0%) |
| Construction | 219 (100.0%) | 0 (0.0%) |
| Manufacturing | 180 (85.3%) | 31 (14.7%) |
| Wholesale Trade | 32 (100.0%) | 0 (0.0%) |
| Retail Trade | 110 (37.8%) | 181 (62.2%) |
| Transportation & Warehousing | 92 (60.9%) | 59 (39.1%) |
| Utilities | 0 (0.0%) | 0 (0.0%) |
| Information | 0 (0.0%) | 0 (0.0%) |
| Finance & Insurance | 86 (58.5%) | 61 (41.5%) |
| Real Estate, Rental & Leasing | 8 (100.0%) | 0 (0.0%) |
| Professional & Scientific | 97 (51.9%) | 90 (48.1%) |
| Enterprise Management | 10 (100.0%) | 0 (0.0%) |
| Administrative & Support | 40 (63.5%) | 23 (36.5%) |
| Educational Services | 54 (16.7%) | 270 (83.3%) |
| Health Care & Social Assistance | 114 (23.5%) | 371 (76.5%) |
| Arts, Entertainment & Recreation | 0 (0.0%) | 131 (100.0%) |
| Accommodation & Food Services | 86 (83.5%) | 17 (16.5%) |
| Public Administration | 66 (45.8%) | 78 (54.2%) |
| Total | 1,333 (49.7%) | 1,350 (50.3%) |
Education in Dilworth
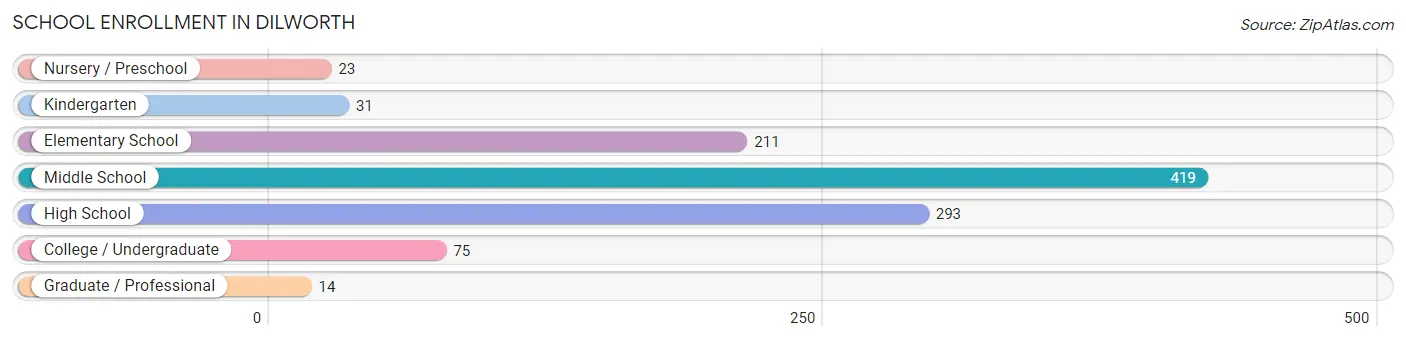
School Enrollment in Dilworth
The most common levels of schooling among the 1,066 students in Dilworth are middle school (419 | 39.3%), high school (293 | 27.5%), and elementary school (211 | 19.8%).
| School Level | # Students | % Students |
| Nursery / Preschool | 23 | 2.2% |
| Kindergarten | 31 | 2.9% |
| Elementary School | 211 | 19.8% |
| Middle School | 419 | 39.3% |
| High School | 293 | 27.5% |
| College / Undergraduate | 75 | 7.0% |
| Graduate / Professional | 14 | 1.3% |
| Total | 1,066 | 100.0% |
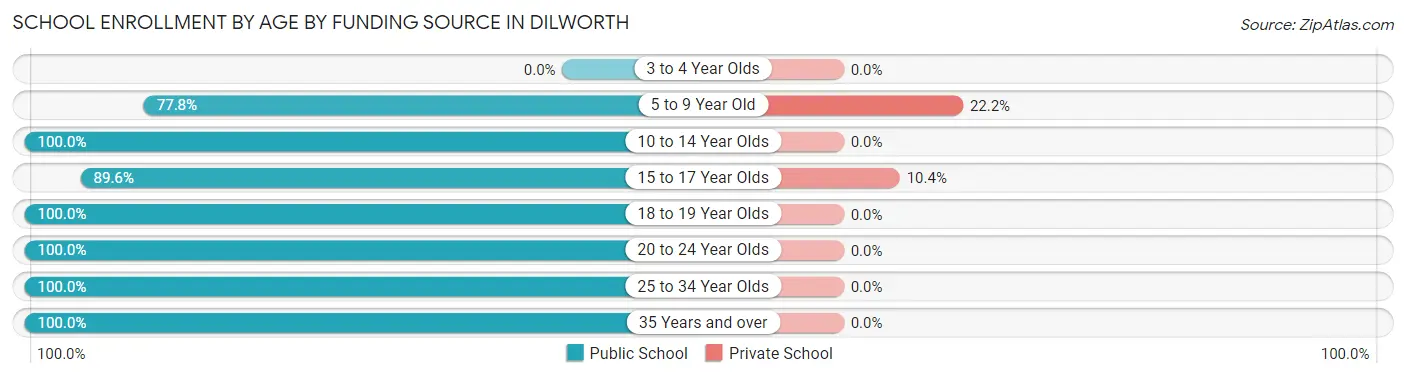
School Enrollment by Age by Funding Source in Dilworth
Out of a total of 1,066 students who are enrolled in schools in Dilworth, 65 (6.1%) attend a private institution, while the remaining 1,001 (93.9%) are enrolled in public schools. The age group of 5 to 9 year old has the highest likelihood of being enrolled in private schools, with 46 (22.2% in the age bracket) enrolled. Conversely, the age group of 10 to 14 year olds has the lowest likelihood of being enrolled in a private school, with 544 (100.0% in the age bracket) attending a public institution.
| Age Bracket | Public School | Private School |
| 3 to 4 Year Olds | 0 (0.0%) | 0 (0.0%) |
| 5 to 9 Year Old | 161 (77.8%) | 46 (22.2%) |
| 10 to 14 Year Olds | 544 (100.0%) | 0 (0.0%) |
| 15 to 17 Year Olds | 163 (89.6%) | 19 (10.4%) |
| 18 to 19 Year Olds | 43 (100.0%) | 0 (0.0%) |
| 20 to 24 Year Olds | 45 (100.0%) | 0 (0.0%) |
| 25 to 34 Year Olds | 17 (100.0%) | 0 (0.0%) |
| 35 Years and over | 28 (100.0%) | 0 (0.0%) |
| Total | 1,001 (93.9%) | 65 (6.1%) |
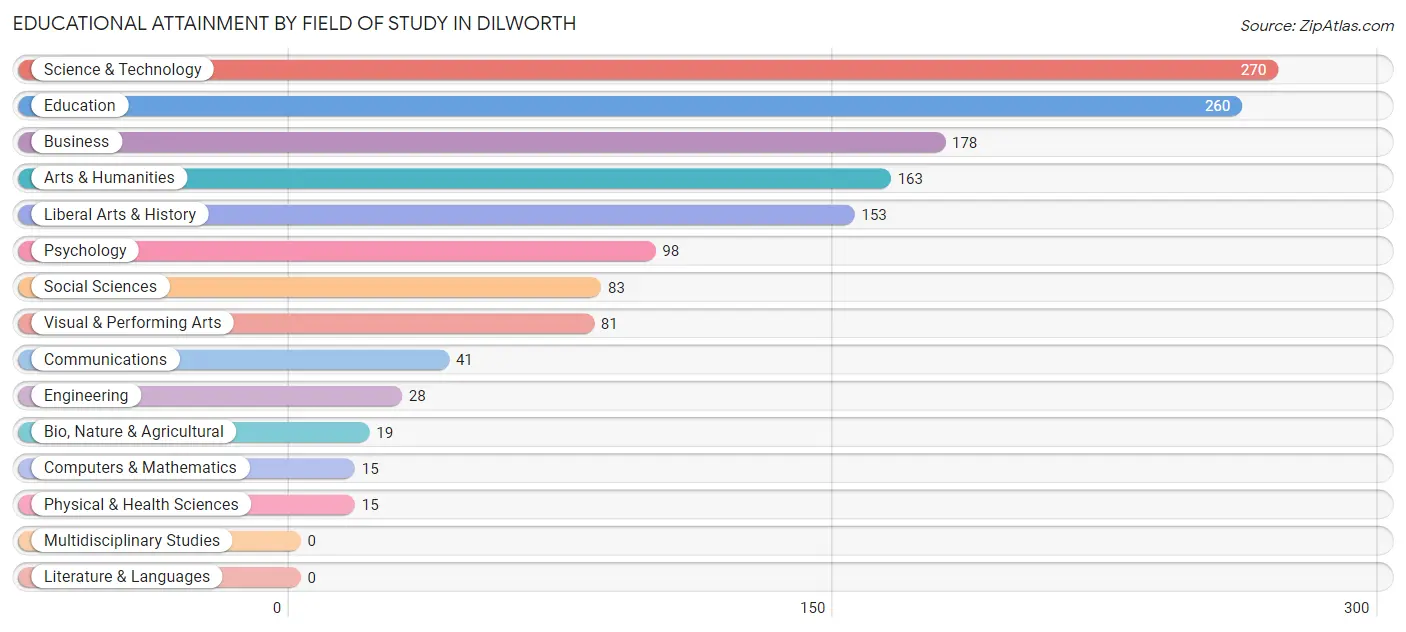
Educational Attainment by Field of Study in Dilworth
Science & technology (270 | 19.2%), education (260 | 18.5%), business (178 | 12.7%), arts & humanities (163 | 11.6%), and liberal arts & history (153 | 10.9%) are the most common fields of study among 1,404 individuals in Dilworth who have obtained a bachelor's degree or higher.
| Field of Study | # Graduates | % Graduates |
| Computers & Mathematics | 15 | 1.1% |
| Bio, Nature & Agricultural | 19 | 1.3% |
| Physical & Health Sciences | 15 | 1.1% |
| Psychology | 98 | 7.0% |
| Social Sciences | 83 | 5.9% |
| Engineering | 28 | 2.0% |
| Multidisciplinary Studies | 0 | 0.0% |
| Science & Technology | 270 | 19.2% |
| Business | 178 | 12.7% |
| Education | 260 | 18.5% |
| Literature & Languages | 0 | 0.0% |
| Liberal Arts & History | 153 | 10.9% |
| Visual & Performing Arts | 81 | 5.8% |
| Communications | 41 | 2.9% |
| Arts & Humanities | 163 | 11.6% |
| Total | 1,404 | 100.0% |
Transportation & Commute in Dilworth
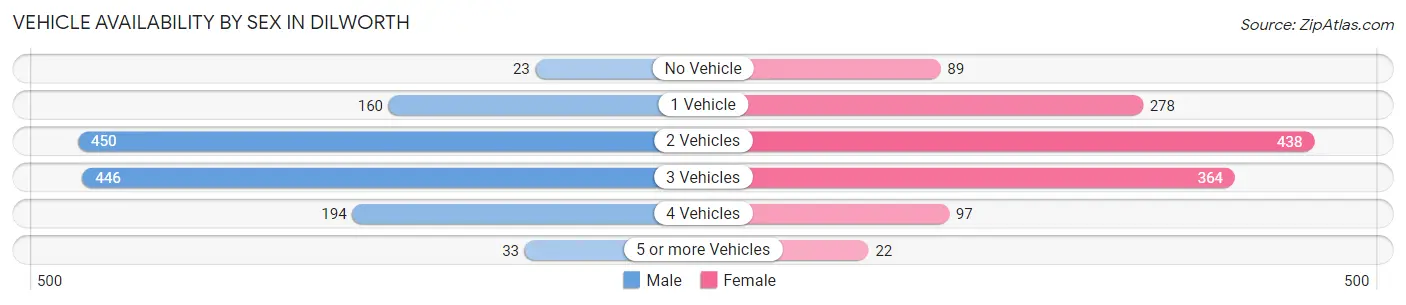
Vehicle Availability by Sex in Dilworth
The most prevalent vehicle ownership categories in Dilworth are males with 2 vehicles (450, accounting for 34.5%) and females with 2 vehicles (438, making up 34.9%).
| Vehicles Available | Male | Female |
| No Vehicle | 23 (1.8%) | 89 (6.9%) |
| 1 Vehicle | 160 (12.2%) | 278 (21.6%) |
| 2 Vehicles | 450 (34.5%) | 438 (34.0%) |
| 3 Vehicles | 446 (34.2%) | 364 (28.3%) |
| 4 Vehicles | 194 (14.8%) | 97 (7.5%) |
| 5 or more Vehicles | 33 (2.5%) | 22 (1.7%) |
| Total | 1,306 (100.0%) | 1,288 (100.0%) |
Commute Time in Dilworth
The most frequently occuring commute durations in Dilworth are 15 to 19 minutes (586 commuters, 23.1%), 20 to 24 minutes (578 commuters, 22.8%), and 10 to 14 minutes (372 commuters, 14.6%).
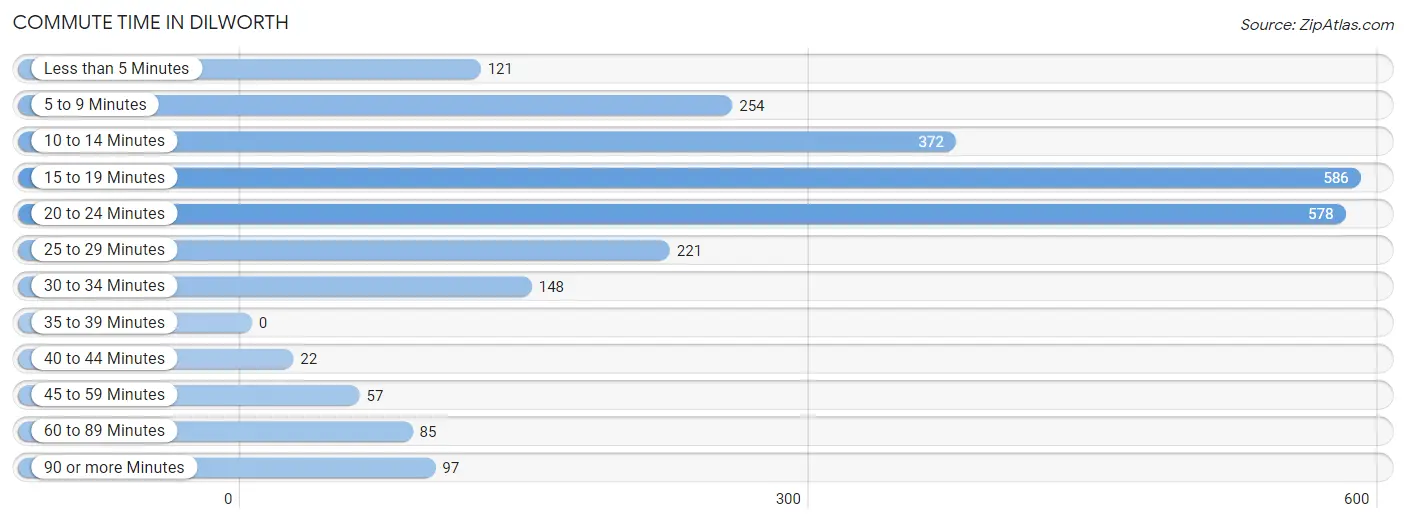
| Commute Time | # Commuters | % Commuters |
| Less than 5 Minutes | 121 | 4.8% |
| 5 to 9 Minutes | 254 | 10.0% |
| 10 to 14 Minutes | 372 | 14.6% |
| 15 to 19 Minutes | 586 | 23.1% |
| 20 to 24 Minutes | 578 | 22.8% |
| 25 to 29 Minutes | 221 | 8.7% |
| 30 to 34 Minutes | 148 | 5.8% |
| 35 to 39 Minutes | 0 | 0.0% |
| 40 to 44 Minutes | 22 | 0.9% |
| 45 to 59 Minutes | 57 | 2.2% |
| 60 to 89 Minutes | 85 | 3.4% |
| 90 or more Minutes | 97 | 3.8% |
Commute Time by Sex in Dilworth
The most common commute times in Dilworth are 15 to 19 minutes (361 commuters, 28.2%) for males and 20 to 24 minutes (226 commuters, 17.9%) for females.
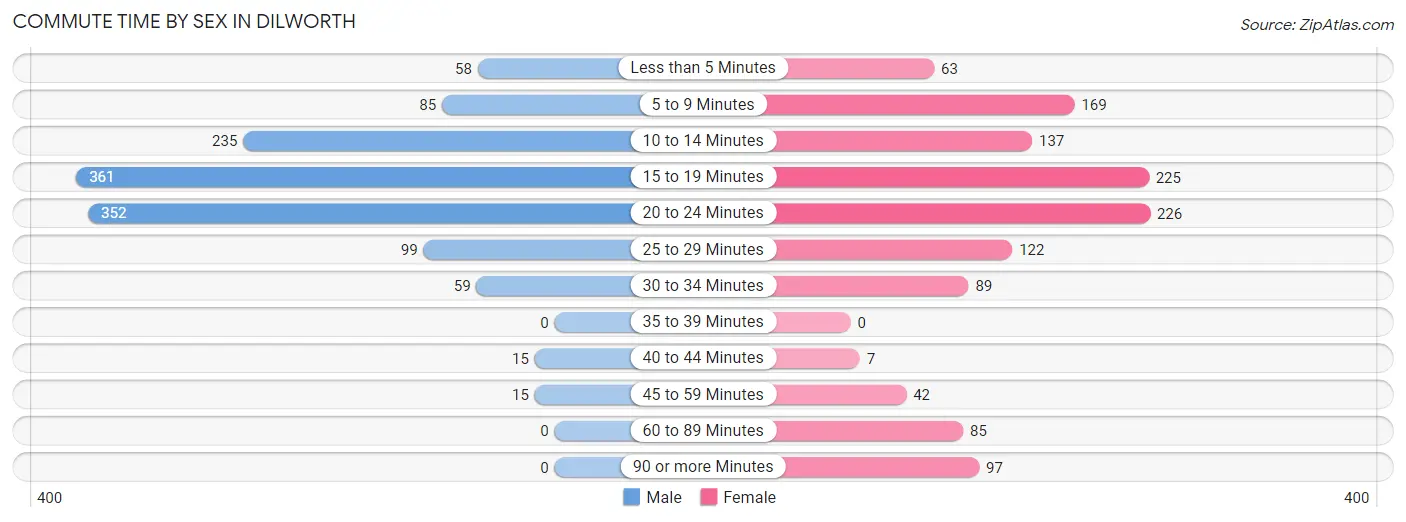
| Commute Time | Male | Female |
| Less than 5 Minutes | 58 (4.5%) | 63 (5.0%) |
| 5 to 9 Minutes | 85 (6.7%) | 169 (13.4%) |
| 10 to 14 Minutes | 235 (18.4%) | 137 (10.9%) |
| 15 to 19 Minutes | 361 (28.2%) | 225 (17.8%) |
| 20 to 24 Minutes | 352 (27.5%) | 226 (17.9%) |
| 25 to 29 Minutes | 99 (7.7%) | 122 (9.7%) |
| 30 to 34 Minutes | 59 (4.6%) | 89 (7.0%) |
| 35 to 39 Minutes | 0 (0.0%) | 0 (0.0%) |
| 40 to 44 Minutes | 15 (1.2%) | 7 (0.5%) |
| 45 to 59 Minutes | 15 (1.2%) | 42 (3.3%) |
| 60 to 89 Minutes | 0 (0.0%) | 85 (6.7%) |
| 90 or more Minutes | 0 (0.0%) | 97 (7.7%) |
Time of Departure to Work by Sex in Dilworth
The most frequent times of departure to work in Dilworth are 7:00 AM to 7:29 AM (221, 17.3%) for males and 7:30 AM to 7:59 AM (426, 33.8%) for females.
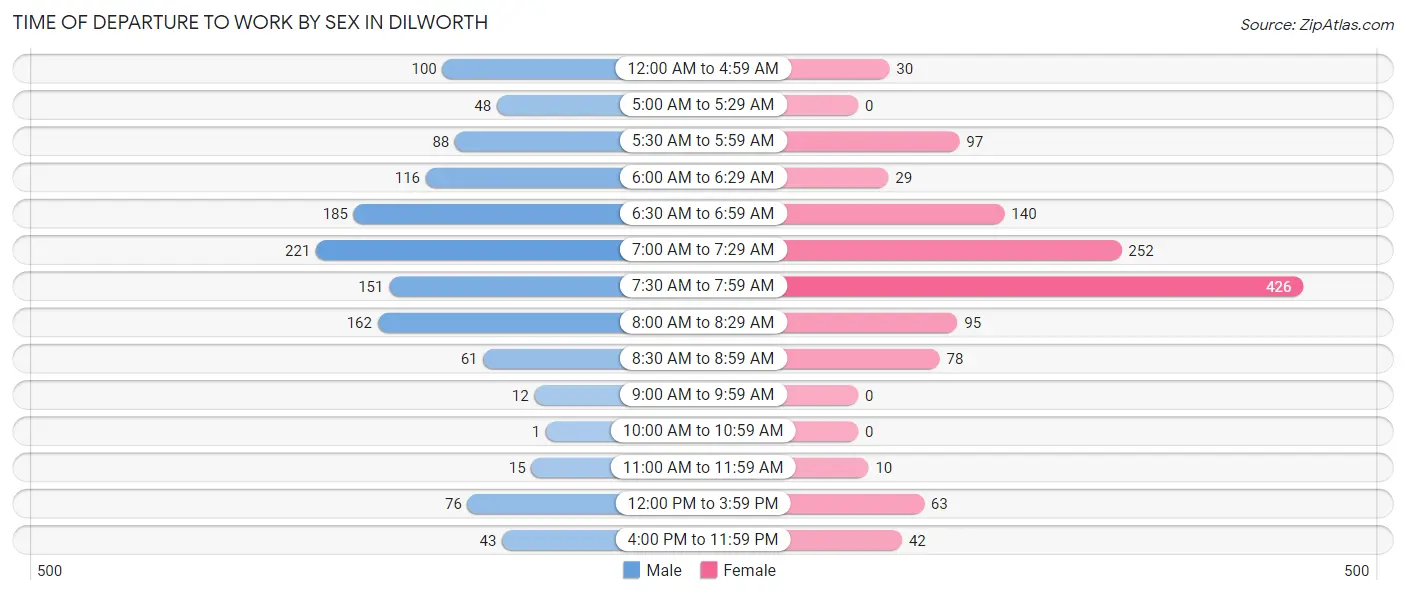
| Time of Departure | Male | Female |
| 12:00 AM to 4:59 AM | 100 (7.8%) | 30 (2.4%) |
| 5:00 AM to 5:29 AM | 48 (3.7%) | 0 (0.0%) |
| 5:30 AM to 5:59 AM | 88 (6.9%) | 97 (7.7%) |
| 6:00 AM to 6:29 AM | 116 (9.1%) | 29 (2.3%) |
| 6:30 AM to 6:59 AM | 185 (14.5%) | 140 (11.1%) |
| 7:00 AM to 7:29 AM | 221 (17.3%) | 252 (20.0%) |
| 7:30 AM to 7:59 AM | 151 (11.8%) | 426 (33.8%) |
| 8:00 AM to 8:29 AM | 162 (12.7%) | 95 (7.5%) |
| 8:30 AM to 8:59 AM | 61 (4.8%) | 78 (6.2%) |
| 9:00 AM to 9:59 AM | 12 (0.9%) | 0 (0.0%) |
| 10:00 AM to 10:59 AM | 1 (0.1%) | 0 (0.0%) |
| 11:00 AM to 11:59 AM | 15 (1.2%) | 10 (0.8%) |
| 12:00 PM to 3:59 PM | 76 (5.9%) | 63 (5.0%) |
| 4:00 PM to 11:59 PM | 43 (3.4%) | 42 (3.3%) |
| Total | 1,279 (100.0%) | 1,262 (100.0%) |
Housing Occupancy in Dilworth
Occupancy by Ownership in Dilworth
Of the total 1,889 dwellings in Dilworth, owner-occupied units account for 1,498 (79.3%), while renter-occupied units make up 391 (20.7%).
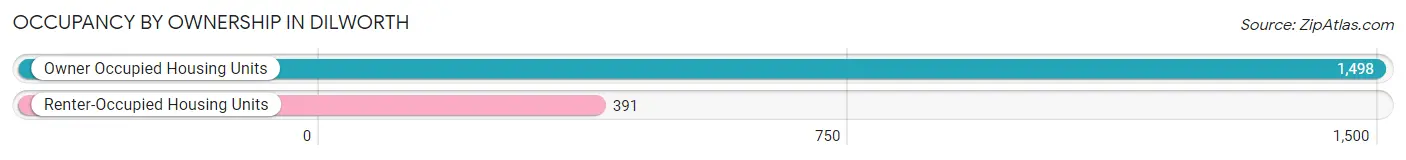
| Occupancy | # Housing Units | % Housing Units |
| Owner Occupied Housing Units | 1,498 | 79.3% |
| Renter-Occupied Housing Units | 391 | 20.7% |
| Total Occupied Housing Units | 1,889 | 100.0% |
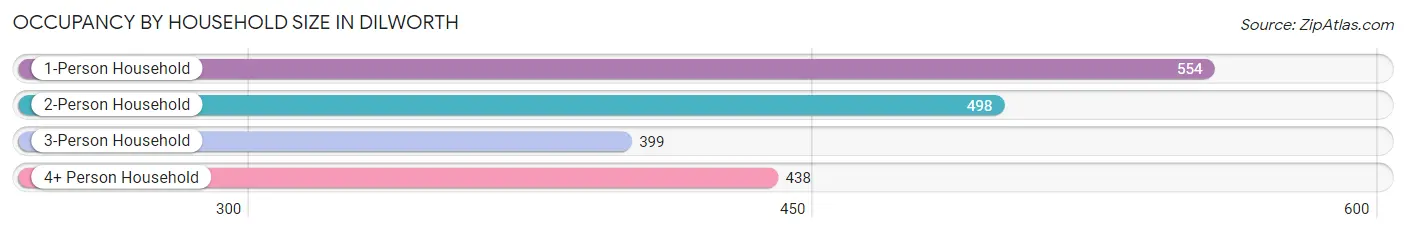
Occupancy by Household Size in Dilworth
| Household Size | # Housing Units | % Housing Units |
| 1-Person Household | 554 | 29.3% |
| 2-Person Household | 498 | 26.4% |
| 3-Person Household | 399 | 21.1% |
| 4+ Person Household | 438 | 23.2% |
| Total Housing Units | 1,889 | 100.0% |
Occupancy by Ownership by Household Size in Dilworth
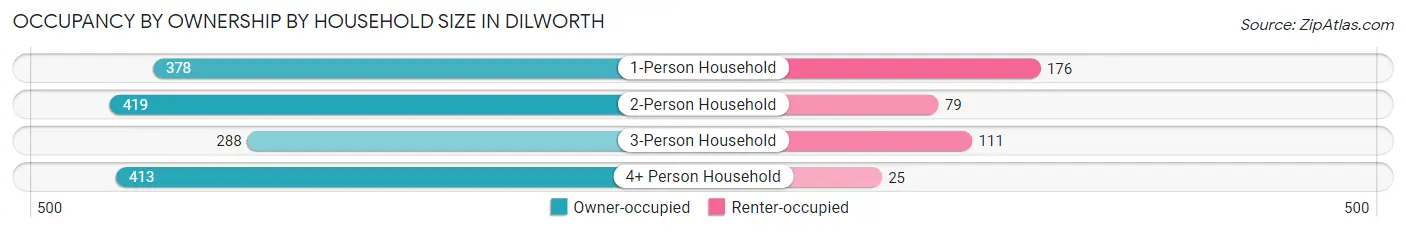
| Household Size | Owner-occupied | Renter-occupied |
| 1-Person Household | 378 (68.2%) | 176 (31.8%) |
| 2-Person Household | 419 (84.1%) | 79 (15.9%) |
| 3-Person Household | 288 (72.2%) | 111 (27.8%) |
| 4+ Person Household | 413 (94.3%) | 25 (5.7%) |
| Total Housing Units | 1,498 (79.3%) | 391 (20.7%) |
Occupancy by Educational Attainment in Dilworth
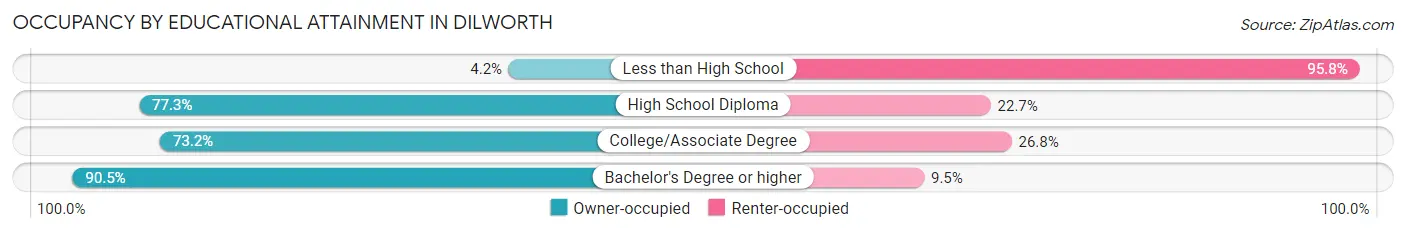
| Household Size | Owner-occupied | Renter-occupied |
| Less than High School | 2 (4.2%) | 46 (95.8%) |
| High School Diploma | 293 (77.3%) | 86 (22.7%) |
| College/Associate Degree | 507 (73.2%) | 186 (26.8%) |
| Bachelor's Degree or higher | 696 (90.5%) | 73 (9.5%) |
Occupancy by Age of Householder in Dilworth
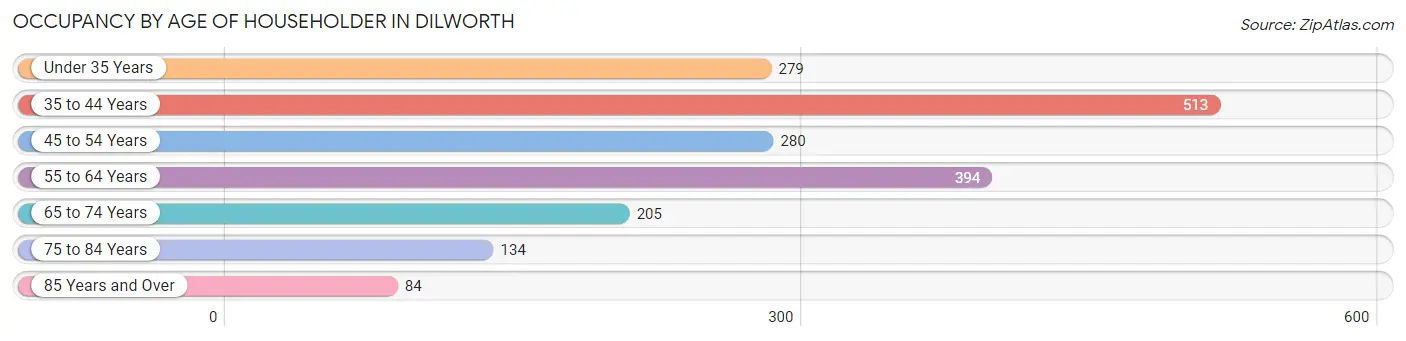
| Age Bracket | # Households | % Households |
| Under 35 Years | 279 | 14.8% |
| 35 to 44 Years | 513 | 27.2% |
| 45 to 54 Years | 280 | 14.8% |
| 55 to 64 Years | 394 | 20.9% |
| 65 to 74 Years | 205 | 10.8% |
| 75 to 84 Years | 134 | 7.1% |
| 85 Years and Over | 84 | 4.4% |
| Total | 1,889 | 100.0% |
Housing Finances in Dilworth
Median Income by Occupancy in Dilworth
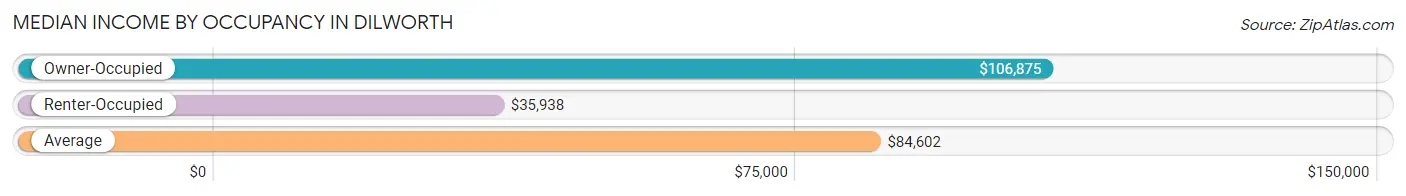
| Occupancy Type | # Households | Median Income |
| Owner-Occupied | 1,498 (79.3%) | $106,875 |
| Renter-Occupied | 391 (20.7%) | $35,938 |
| Average | 1,889 (100.0%) | $84,602 |
Occupancy by Householder Income Bracket in Dilworth
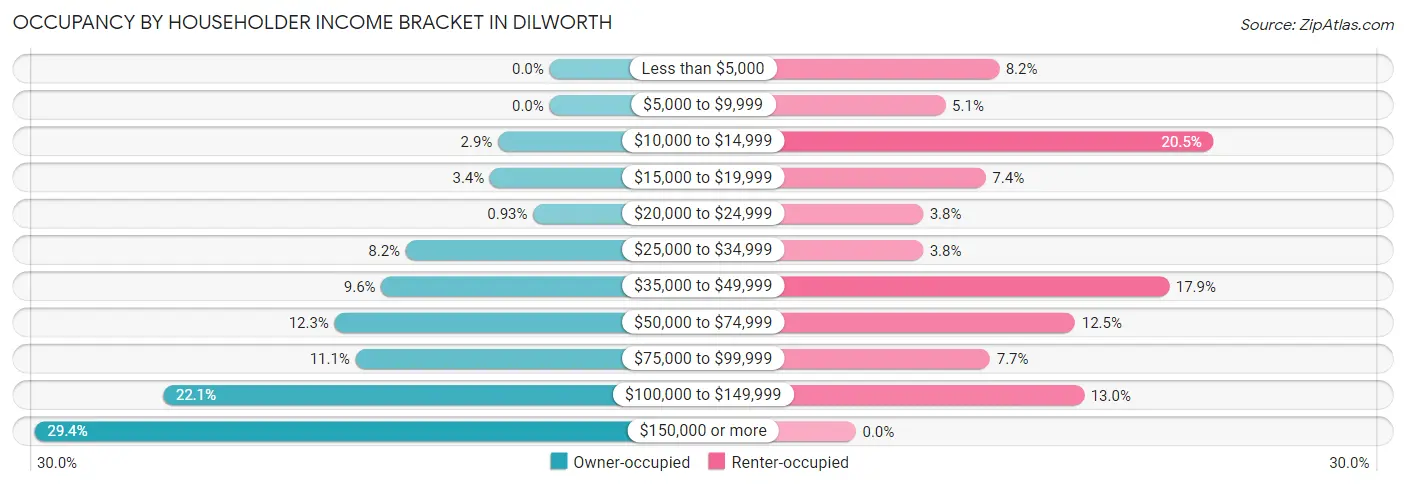
| Income Bracket | Owner-occupied | Renter-occupied |
| Less than $5,000 | 0 (0.0%) | 32 (8.2%) |
| $5,000 to $9,999 | 0 (0.0%) | 20 (5.1%) |
| $10,000 to $14,999 | 44 (2.9%) | 80 (20.5%) |
| $15,000 to $19,999 | 51 (3.4%) | 29 (7.4%) |
| $20,000 to $24,999 | 14 (0.9%) | 15 (3.8%) |
| $25,000 to $34,999 | 123 (8.2%) | 15 (3.8%) |
| $35,000 to $49,999 | 144 (9.6%) | 70 (17.9%) |
| $50,000 to $74,999 | 184 (12.3%) | 49 (12.5%) |
| $75,000 to $99,999 | 166 (11.1%) | 30 (7.7%) |
| $100,000 to $149,999 | 331 (22.1%) | 51 (13.0%) |
| $150,000 or more | 441 (29.4%) | 0 (0.0%) |
| Total | 1,498 (100.0%) | 391 (100.0%) |
Monthly Housing Cost Tiers in Dilworth
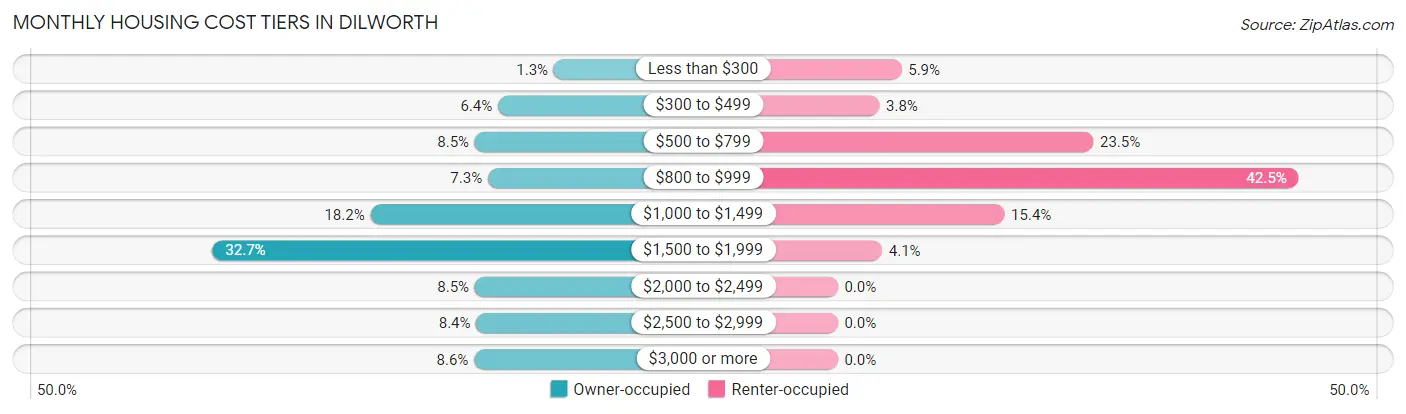
| Monthly Cost | Owner-occupied | Renter-occupied |
| Less than $300 | 19 (1.3%) | 23 (5.9%) |
| $300 to $499 | 96 (6.4%) | 15 (3.8%) |
| $500 to $799 | 128 (8.5%) | 92 (23.5%) |
| $800 to $999 | 110 (7.3%) | 166 (42.5%) |
| $1,000 to $1,499 | 272 (18.2%) | 60 (15.3%) |
| $1,500 to $1,999 | 490 (32.7%) | 16 (4.1%) |
| $2,000 to $2,499 | 128 (8.5%) | 0 (0.0%) |
| $2,500 to $2,999 | 126 (8.4%) | 0 (0.0%) |
| $3,000 or more | 129 (8.6%) | 0 (0.0%) |
| Total | 1,498 (100.0%) | 391 (100.0%) |
Physical Housing Characteristics in Dilworth
Housing Structures in Dilworth
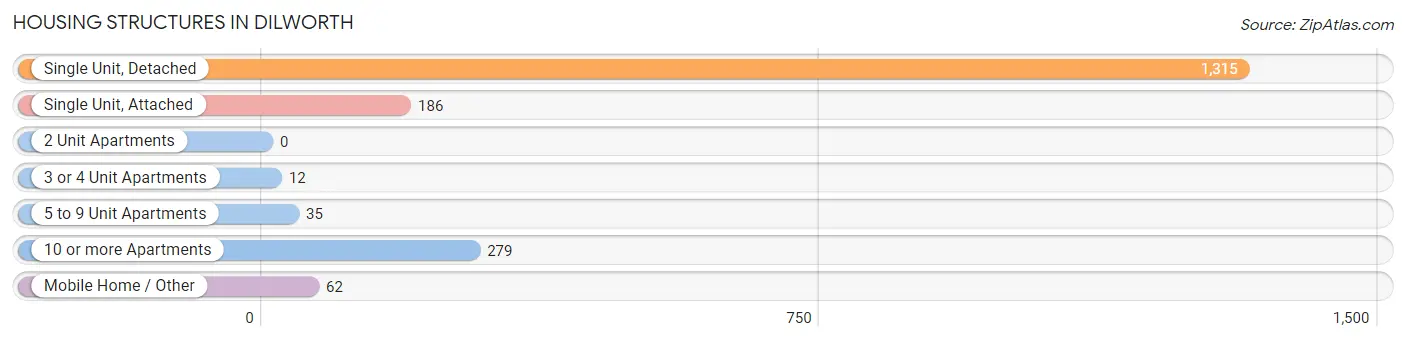
| Structure Type | # Housing Units | % Housing Units |
| Single Unit, Detached | 1,315 | 69.6% |
| Single Unit, Attached | 186 | 9.9% |
| 2 Unit Apartments | 0 | 0.0% |
| 3 or 4 Unit Apartments | 12 | 0.6% |
| 5 to 9 Unit Apartments | 35 | 1.8% |
| 10 or more Apartments | 279 | 14.8% |
| Mobile Home / Other | 62 | 3.3% |
| Total | 1,889 | 100.0% |
Housing Structures by Occupancy in Dilworth
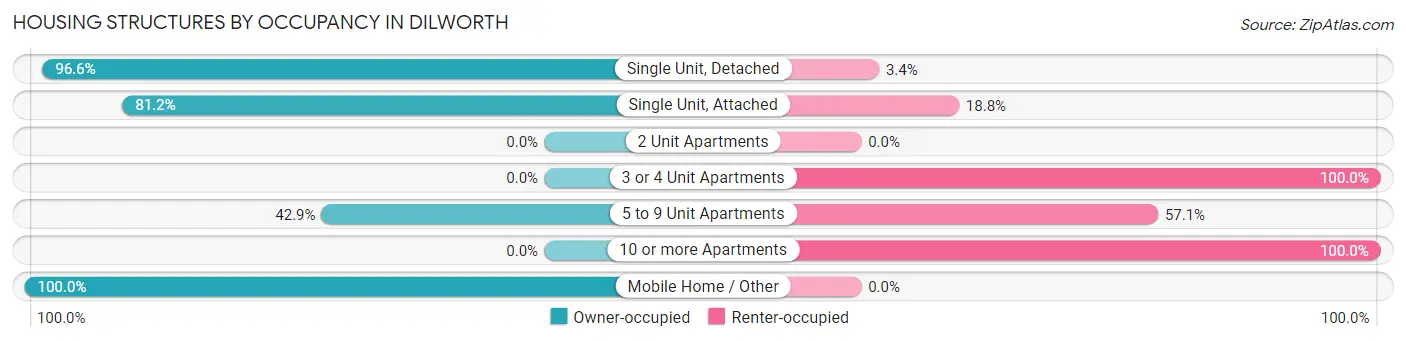
| Structure Type | Owner-occupied | Renter-occupied |
| Single Unit, Detached | 1,270 (96.6%) | 45 (3.4%) |
| Single Unit, Attached | 151 (81.2%) | 35 (18.8%) |
| 2 Unit Apartments | 0 (0.0%) | 0 (0.0%) |
| 3 or 4 Unit Apartments | 0 (0.0%) | 12 (100.0%) |
| 5 to 9 Unit Apartments | 15 (42.9%) | 20 (57.1%) |
| 10 or more Apartments | 0 (0.0%) | 279 (100.0%) |
| Mobile Home / Other | 62 (100.0%) | 0 (0.0%) |
| Total | 1,498 (79.3%) | 391 (20.7%) |
Housing Structures by Number of Rooms in Dilworth
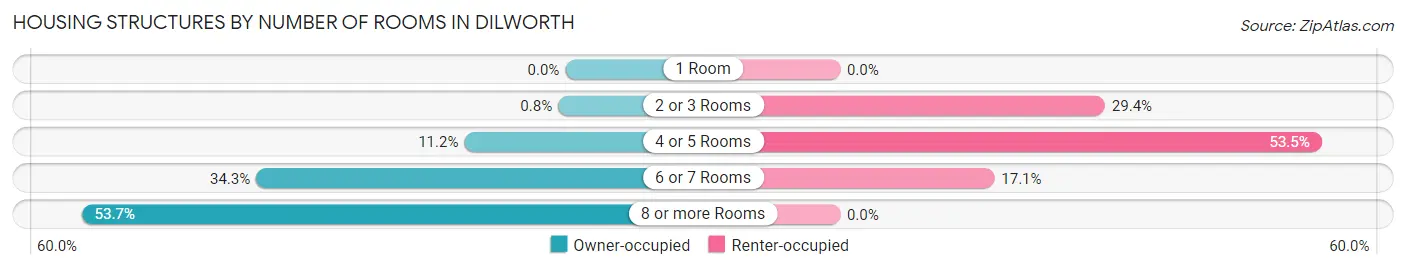
| Number of Rooms | Owner-occupied | Renter-occupied |
| 1 Room | 0 (0.0%) | 0 (0.0%) |
| 2 or 3 Rooms | 12 (0.8%) | 115 (29.4%) |
| 4 or 5 Rooms | 168 (11.2%) | 209 (53.4%) |
| 6 or 7 Rooms | 514 (34.3%) | 67 (17.1%) |
| 8 or more Rooms | 804 (53.7%) | 0 (0.0%) |
| Total | 1,498 (100.0%) | 391 (100.0%) |
Housing Structure by Heating Type in Dilworth
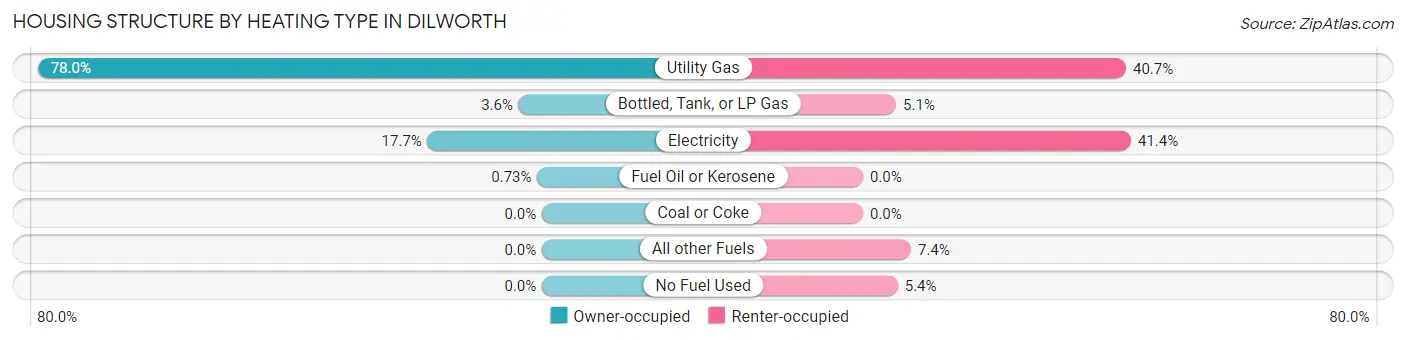
| Heating Type | Owner-occupied | Renter-occupied |
| Utility Gas | 1,168 (78.0%) | 159 (40.7%) |
| Bottled, Tank, or LP Gas | 54 (3.6%) | 20 (5.1%) |
| Electricity | 265 (17.7%) | 162 (41.4%) |
| Fuel Oil or Kerosene | 11 (0.7%) | 0 (0.0%) |
| Coal or Coke | 0 (0.0%) | 0 (0.0%) |
| All other Fuels | 0 (0.0%) | 29 (7.4%) |
| No Fuel Used | 0 (0.0%) | 21 (5.4%) |
| Total | 1,498 (100.0%) | 391 (100.0%) |
Household Vehicle Usage in Dilworth
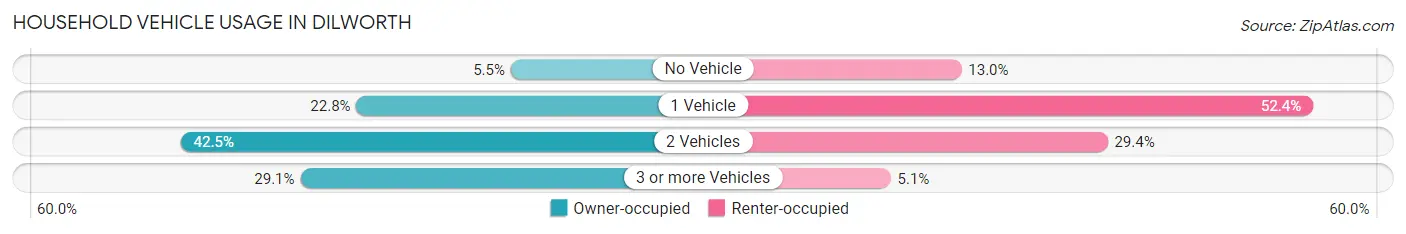
| Vehicles per Household | Owner-occupied | Renter-occupied |
| No Vehicle | 83 (5.5%) | 51 (13.0%) |
| 1 Vehicle | 342 (22.8%) | 205 (52.4%) |
| 2 Vehicles | 637 (42.5%) | 115 (29.4%) |
| 3 or more Vehicles | 436 (29.1%) | 20 (5.1%) |
| Total | 1,498 (100.0%) | 391 (100.0%) |
Real Estate & Mortgages in Dilworth
Real Estate and Mortgage Overview in Dilworth
| Characteristic | Without Mortgage | With Mortgage |
| Housing Units | 321 | 1,177 |
| Median Property Value | $169,700 | $285,800 |
| Median Household Income | $73,403 | $379 |
| Monthly Housing Costs | $608 | $129 |
| Real Estate Taxes | $2,421 | $37 |
Property Value by Mortgage Status in Dilworth
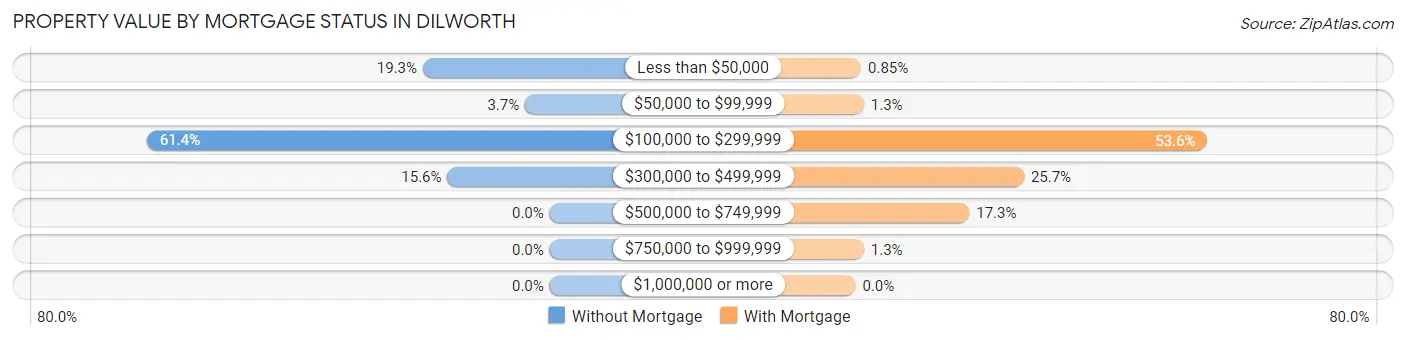
| Property Value | Without Mortgage | With Mortgage |
| Less than $50,000 | 62 (19.3%) | 10 (0.9%) |
| $50,000 to $99,999 | 12 (3.7%) | 15 (1.3%) |
| $100,000 to $299,999 | 197 (61.4%) | 631 (53.6%) |
| $300,000 to $499,999 | 50 (15.6%) | 302 (25.7%) |
| $500,000 to $749,999 | 0 (0.0%) | 204 (17.3%) |
| $750,000 to $999,999 | 0 (0.0%) | 15 (1.3%) |
| $1,000,000 or more | 0 (0.0%) | 0 (0.0%) |
| Total | 321 (100.0%) | 1,177 (100.0%) |
Household Income by Mortgage Status in Dilworth
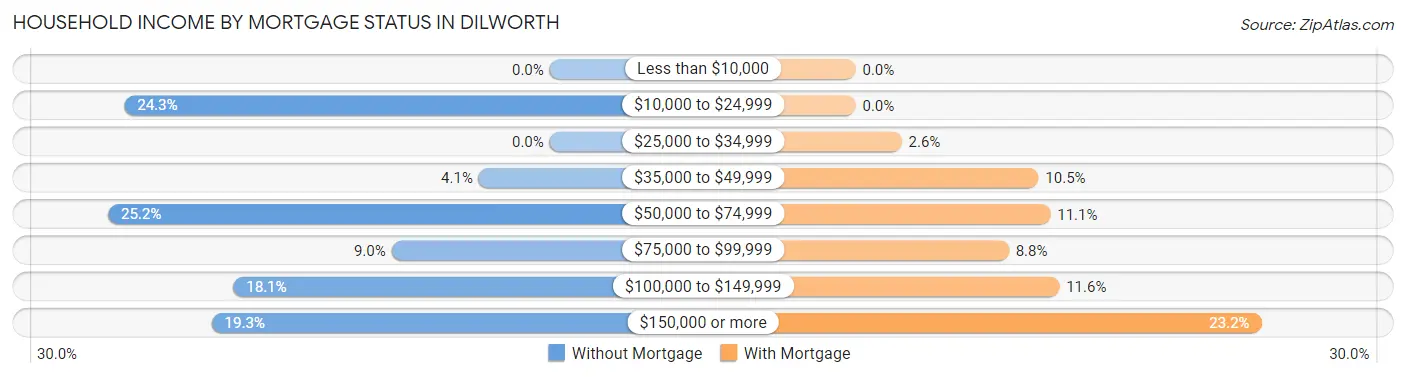
| Household Income | Without Mortgage | With Mortgage |
| Less than $10,000 | 0 (0.0%) | 0 (0.0%) |
| $10,000 to $24,999 | 78 (24.3%) | 0 (0.0%) |
| $25,000 to $34,999 | 0 (0.0%) | 31 (2.6%) |
| $35,000 to $49,999 | 13 (4.1%) | 123 (10.4%) |
| $50,000 to $74,999 | 81 (25.2%) | 131 (11.1%) |
| $75,000 to $99,999 | 29 (9.0%) | 103 (8.7%) |
| $100,000 to $149,999 | 58 (18.1%) | 137 (11.6%) |
| $150,000 or more | 62 (19.3%) | 273 (23.2%) |
| Total | 321 (100.0%) | 1,177 (100.0%) |
Property Value to Household Income Ratio in Dilworth
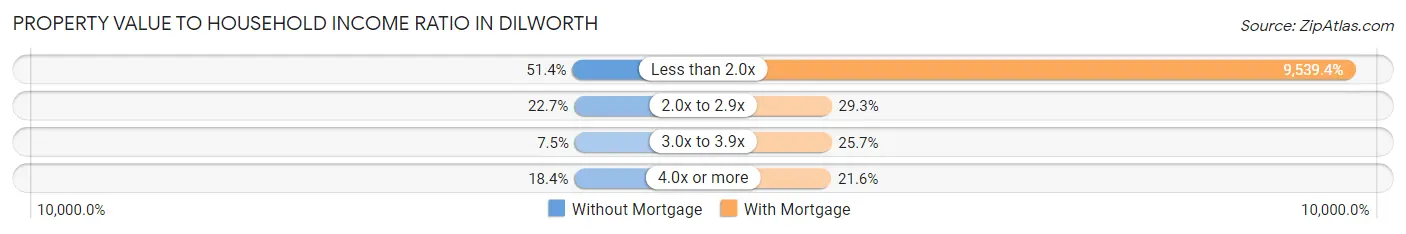
| Value-to-Income Ratio | Without Mortgage | With Mortgage |
| Less than 2.0x | 165 (51.4%) | 112,279 (9,539.4%) |
| 2.0x to 2.9x | 73 (22.7%) | 345 (29.3%) |
| 3.0x to 3.9x | 24 (7.5%) | 302 (25.7%) |
| 4.0x or more | 59 (18.4%) | 254 (21.6%) |
| Total | 321 (100.0%) | 1,177 (100.0%) |
Real Estate Taxes by Mortgage Status in Dilworth
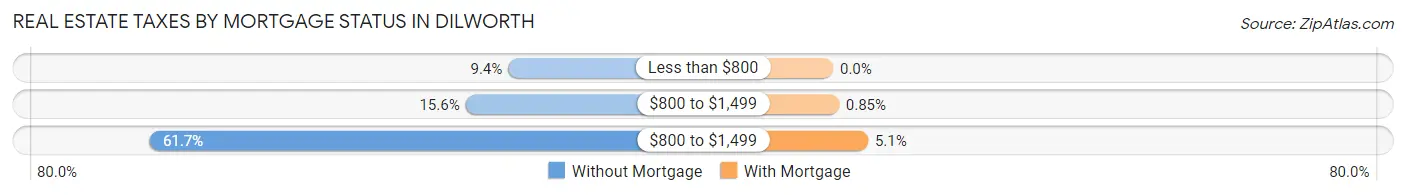
| Property Taxes | Without Mortgage | With Mortgage |
| Less than $800 | 30 (9.3%) | 0 (0.0%) |
| $800 to $1,499 | 50 (15.6%) | 10 (0.9%) |
| $800 to $1,499 | 198 (61.7%) | 60 (5.1%) |
| Total | 321 (100.0%) | 1,177 (100.0%) |
Health & Disability in Dilworth
Health Insurance Coverage by Age in Dilworth
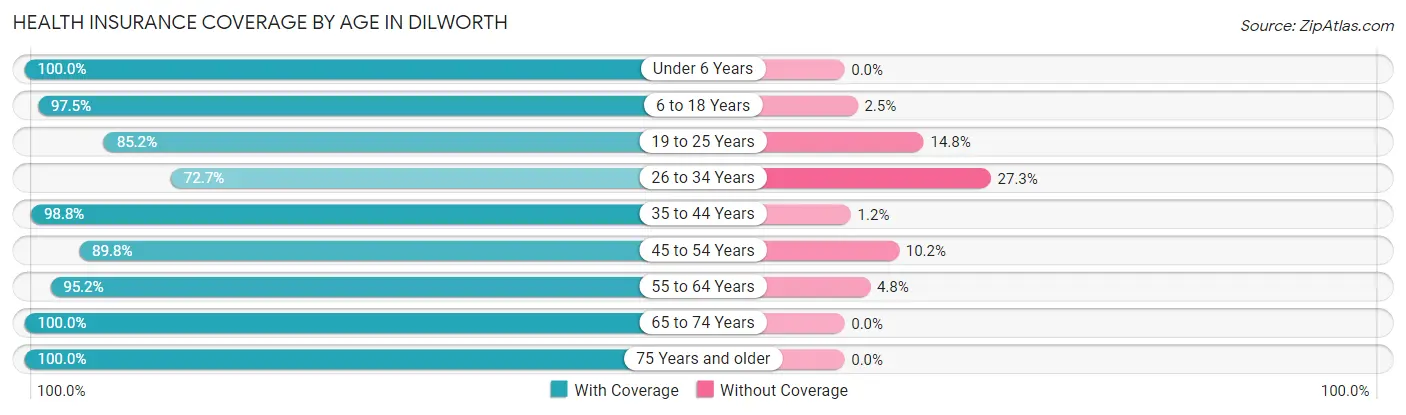
| Age Bracket | With Coverage | Without Coverage |
| Under 6 Years | 135 (100.0%) | 0 (0.0%) |
| 6 to 18 Years | 1,033 (97.5%) | 26 (2.5%) |
| 19 to 25 Years | 317 (85.2%) | 55 (14.8%) |
| 26 to 34 Years | 357 (72.7%) | 134 (27.3%) |
| 35 to 44 Years | 832 (98.8%) | 10 (1.2%) |
| 45 to 54 Years | 495 (89.8%) | 56 (10.2%) |
| 55 to 64 Years | 556 (95.2%) | 28 (4.8%) |
| 65 to 74 Years | 318 (100.0%) | 0 (0.0%) |
| 75 Years and older | 243 (100.0%) | 0 (0.0%) |
| Total | 4,286 (93.3%) | 309 (6.7%) |
Health Insurance Coverage by Citizenship Status in Dilworth
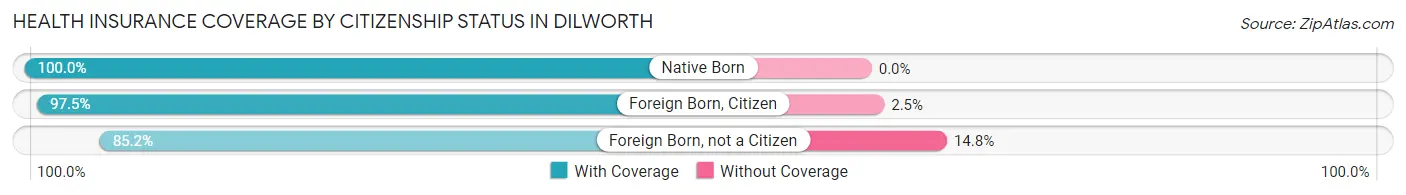
| Citizenship Status | With Coverage | Without Coverage |
| Native Born | 135 (100.0%) | 0 (0.0%) |
| Foreign Born, Citizen | 1,033 (97.5%) | 26 (2.5%) |
| Foreign Born, not a Citizen | 317 (85.2%) | 55 (14.8%) |
Health Insurance Coverage by Household Income in Dilworth
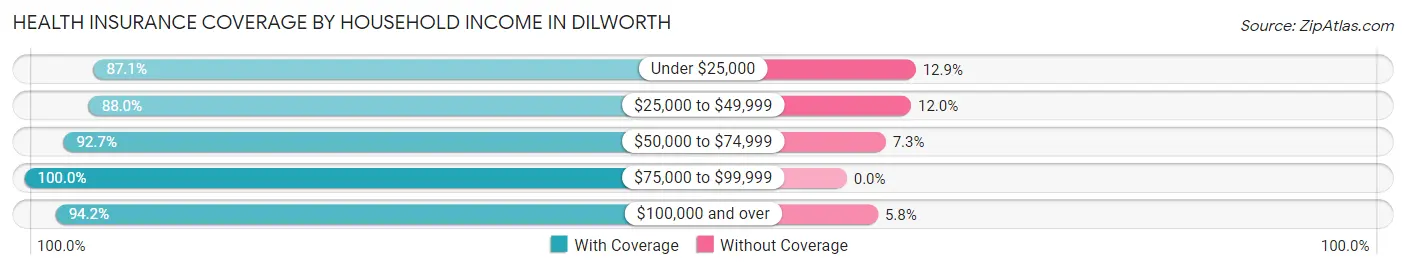
| Household Income | With Coverage | Without Coverage |
| Under $25,000 | 472 (87.1%) | 70 (12.9%) |
| $25,000 to $49,999 | 475 (88.0%) | 65 (12.0%) |
| $50,000 to $74,999 | 356 (92.7%) | 28 (7.3%) |
| $75,000 to $99,999 | 626 (100.0%) | 0 (0.0%) |
| $100,000 and over | 2,352 (94.2%) | 146 (5.8%) |
Public vs Private Health Insurance Coverage by Age in Dilworth
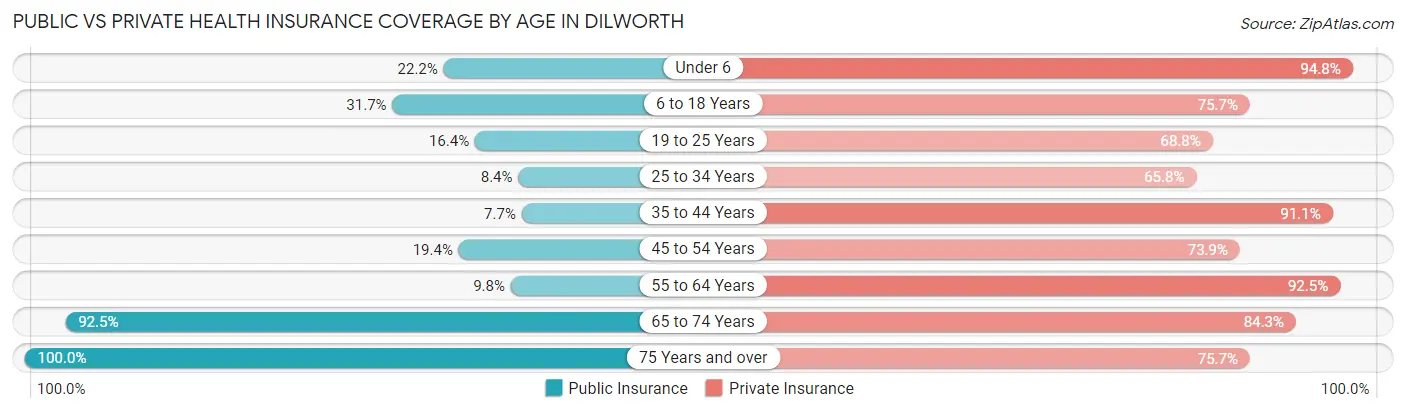
| Age Bracket | Public Insurance | Private Insurance |
| Under 6 | 30 (22.2%) | 128 (94.8%) |
| 6 to 18 Years | 336 (31.7%) | 802 (75.7%) |
| 19 to 25 Years | 61 (16.4%) | 256 (68.8%) |
| 25 to 34 Years | 41 (8.4%) | 323 (65.8%) |
| 35 to 44 Years | 65 (7.7%) | 767 (91.1%) |
| 45 to 54 Years | 107 (19.4%) | 407 (73.9%) |
| 55 to 64 Years | 57 (9.8%) | 540 (92.5%) |
| 65 to 74 Years | 294 (92.4%) | 268 (84.3%) |
| 75 Years and over | 243 (100.0%) | 184 (75.7%) |
| Total | 1,234 (26.9%) | 3,675 (80.0%) |
Disability Status by Sex by Age in Dilworth
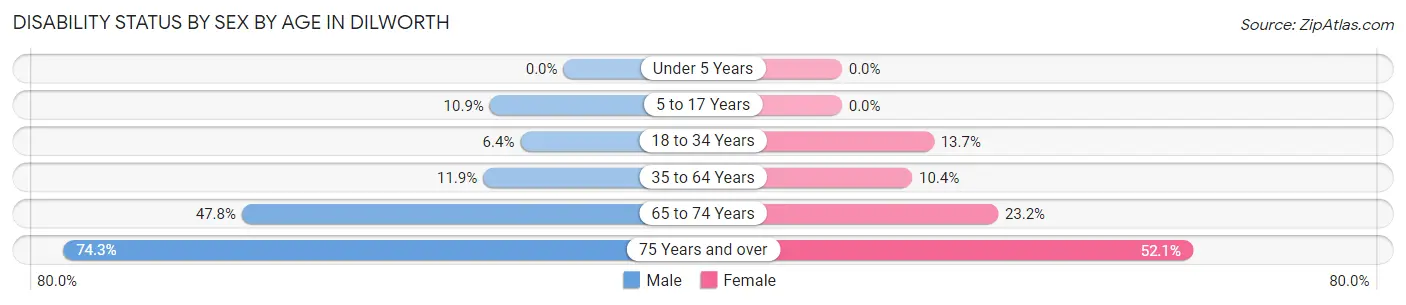
| Age Bracket | Male | Female |
| Under 5 Years | 0 (0.0%) | 0 (0.0%) |
| 5 to 17 Years | 65 (10.9%) | 0 (0.0%) |
| 18 to 34 Years | 31 (6.4%) | 64 (13.7%) |
| 35 to 64 Years | 110 (11.9%) | 110 (10.4%) |
| 65 to 74 Years | 53 (47.7%) | 48 (23.2%) |
| 75 Years and over | 75 (74.3%) | 74 (52.1%) |
Disability Class by Sex by Age in Dilworth
Disability Class: Hearing Difficulty
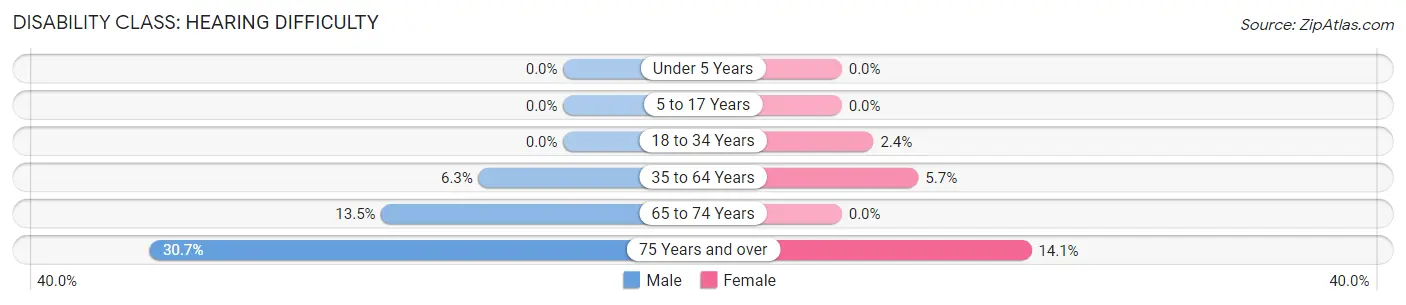
| Age Bracket | Male | Female |
| Under 5 Years | 0 (0.0%) | 0 (0.0%) |
| 5 to 17 Years | 0 (0.0%) | 0 (0.0%) |
| 18 to 34 Years | 0 (0.0%) | 11 (2.4%) |
| 35 to 64 Years | 58 (6.3%) | 60 (5.7%) |
| 65 to 74 Years | 15 (13.5%) | 0 (0.0%) |
| 75 Years and over | 31 (30.7%) | 20 (14.1%) |
Disability Class: Vision Difficulty
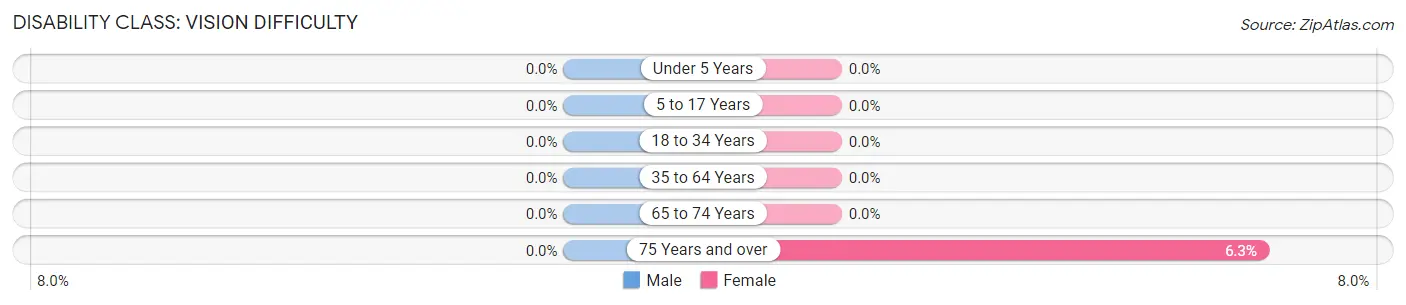
| Age Bracket | Male | Female |
| Under 5 Years | 0 (0.0%) | 0 (0.0%) |
| 5 to 17 Years | 0 (0.0%) | 0 (0.0%) |
| 18 to 34 Years | 0 (0.0%) | 0 (0.0%) |
| 35 to 64 Years | 0 (0.0%) | 0 (0.0%) |
| 65 to 74 Years | 0 (0.0%) | 0 (0.0%) |
| 75 Years and over | 0 (0.0%) | 9 (6.3%) |
Disability Class: Cognitive Difficulty
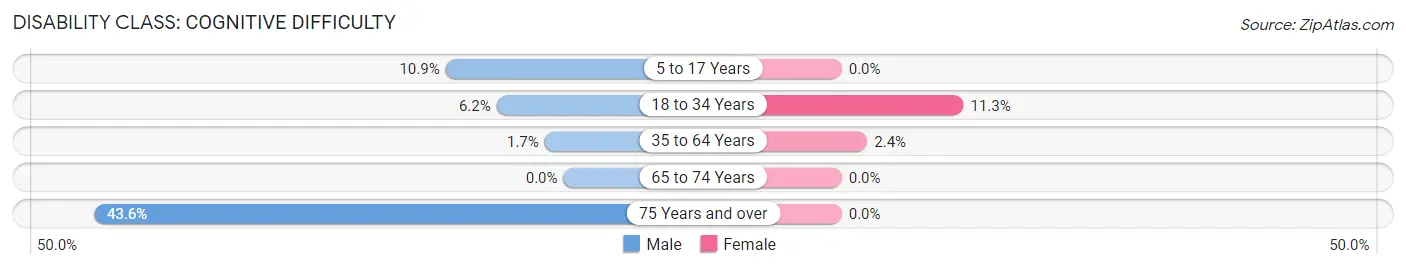
| Age Bracket | Male | Female |
| 5 to 17 Years | 65 (10.9%) | 0 (0.0%) |
| 18 to 34 Years | 30 (6.2%) | 53 (11.3%) |
| 35 to 64 Years | 16 (1.7%) | 25 (2.4%) |
| 65 to 74 Years | 0 (0.0%) | 0 (0.0%) |
| 75 Years and over | 44 (43.6%) | 0 (0.0%) |
Disability Class: Ambulatory Difficulty
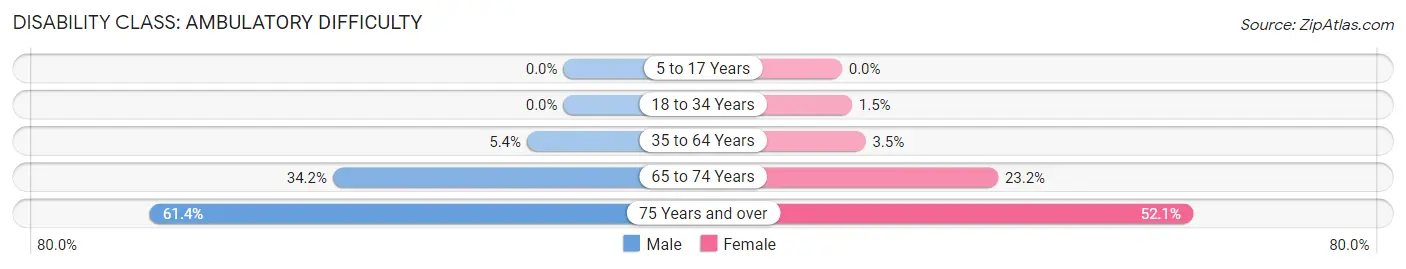
| Age Bracket | Male | Female |
| 5 to 17 Years | 0 (0.0%) | 0 (0.0%) |
| 18 to 34 Years | 0 (0.0%) | 7 (1.5%) |
| 35 to 64 Years | 50 (5.4%) | 37 (3.5%) |
| 65 to 74 Years | 38 (34.2%) | 48 (23.2%) |
| 75 Years and over | 62 (61.4%) | 74 (52.1%) |
Disability Class: Self-Care Difficulty
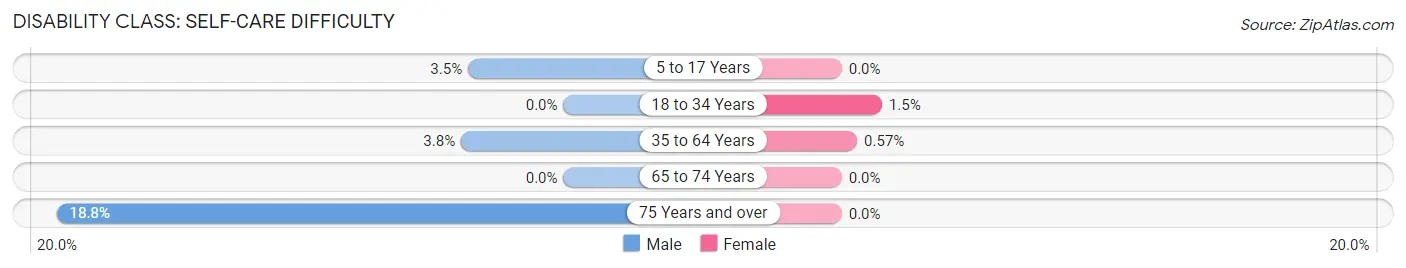
| Age Bracket | Male | Female |
| 5 to 17 Years | 21 (3.5%) | 0 (0.0%) |
| 18 to 34 Years | 0 (0.0%) | 7 (1.5%) |
| 35 to 64 Years | 35 (3.8%) | 6 (0.6%) |
| 65 to 74 Years | 0 (0.0%) | 0 (0.0%) |
| 75 Years and over | 19 (18.8%) | 0 (0.0%) |
Technology Access in Dilworth
Computing Device Access in Dilworth
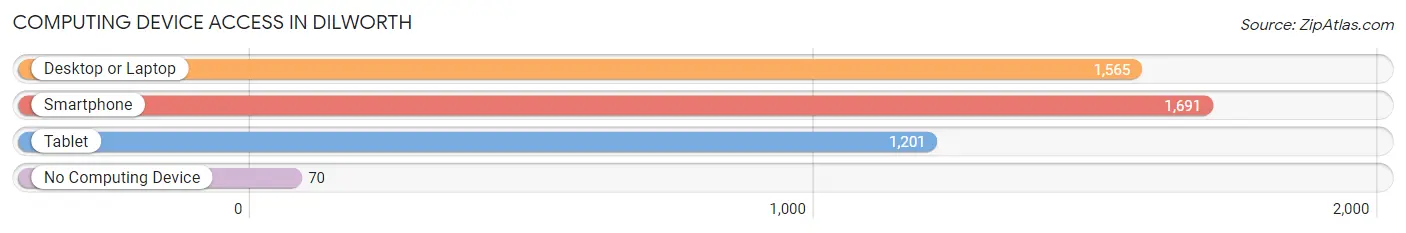
| Device Type | # Households | % Households |
| Desktop or Laptop | 1,565 | 82.9% |
| Smartphone | 1,691 | 89.5% |
| Tablet | 1,201 | 63.6% |
| No Computing Device | 70 | 3.7% |
| Total | 1,889 | 100.0% |
Internet Access in Dilworth
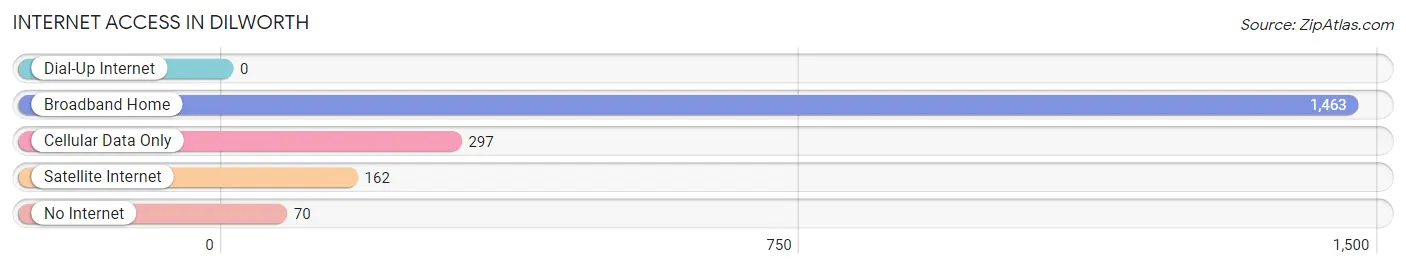
| Internet Type | # Households | % Households |
| Dial-Up Internet | 0 | 0.0% |
| Broadband Home | 1,463 | 77.4% |
| Cellular Data Only | 297 | 15.7% |
| Satellite Internet | 162 | 8.6% |
| No Internet | 70 | 3.7% |
| Total | 1,889 | 100.0% |
Dilworth Summary
Dilworth is a city located in Clay County, Minnesota, United States. The population was 3,945 at the 2010 census. It is part of the Fargo-Moorhead metropolitan area.
History
Dilworth was founded in 1882 by the Northern Pacific Railroad. The city was named after William Dilworth, a railroad official. The first settlers arrived in 1883 and the city was incorporated in 1887.
Geography
Dilworth is located at the intersection of Interstate 94 and U.S. Route 10. It is situated on the Red River of the North, which forms the border between Minnesota and North Dakota. The city is located approximately 10 miles west of Moorhead, Minnesota and 15 miles east of Fargo, North Dakota.
The city has a total area of 2 2 square miles all of it land
Economy
Dilworth is home to several businesses, including a variety of retail stores, restaurants, and service providers. The city is also home to a number of manufacturing companies, including a large food processing plant.
Demographics
As of the census of 2010, there were 3,945 people, 1,619 households, and 1,039 families residing in the city. The population density was 1,788.6 people per square mile. The racial makeup of the city was 94.2% White, 0.7% African American, 0.7% Native American, 0.7% Asian, 0.1% Pacific Islander, 1.7% from other races, and 2.0% from two or more races. Hispanic or Latino of any race were 4.2% of the population.
The median income for a household in the city was $45,938, and the median income for a family was $54,938. Males had a median income of $37,938 versus $27,938 for females. The per capita income for the city was $21,938. About 4.2% of families and 6.2% of the population were below the poverty line, including 8.2% of those under age 18 and 4.2% of those age 65 or over.
Conclusion
Dilworth is a city located in Clay County, Minnesota, United States. It is part of the Fargo-Moorhead metropolitan area and has a population of 3,945 as of the 2010 census. The city was founded in 1882 by the Northern Pacific Railroad and has a variety of businesses, including retail stores, restaurants, and manufacturing companies. The median income for a household in the city was $45,938, and the median income for a family was $54,938. Dilworth is a vibrant city with a diverse economy and population.
Common Questions
What is Per Capita Income in Dilworth?
Per Capita income in Dilworth is $43,804.
What is the Median Family Income in Dilworth?
Median Family Income in Dilworth is $125,952.
What is the Median Household income in Dilworth?
Median Household Income in Dilworth is $84,602.
What is Income or Wage Gap in Dilworth?
Income or Wage Gap in Dilworth is 17.9%.
Women in Dilworth earn 82.1 cents for every dollar earned by a man.
What is Inequality or Gini Index in Dilworth?
Inequality or Gini Index in Dilworth is 0.45.
What is the Total Population of Dilworth?
Total Population of Dilworth is 4,621.
What is the Total Male Population of Dilworth?
Total Male Population of Dilworth is 2,236.
What is the Total Female Population of Dilworth?
Total Female Population of Dilworth is 2,385.
What is the Ratio of Males per 100 Females in Dilworth?
There are 93.75 Males per 100 Females in Dilworth.
What is the Ratio of Females per 100 Males in Dilworth?
There are 106.66 Females per 100 Males in Dilworth.
What is the Median Population Age in Dilworth?
Median Population Age in Dilworth is 39.3 Years.
What is the Average Family Size in Dilworth
Average Family Size in Dilworth is 3.0 People.
What is the Average Household Size in Dilworth
Average Household Size in Dilworth is 2.4 People.
How Large is the Labor Force in Dilworth?
There are 2,734 People in the Labor Forcein in Dilworth.
What is the Percentage of People in the Labor Force in Dilworth?
75.6% of People are in the Labor Force in Dilworth.
What is the Unemployment Rate in Dilworth?
Unemployment Rate in Dilworth is 1.1%.