St Leo, MN Map & Demographics
St Leo Map
St Leo Overview
$28,362
PER CAPITA INCOME
$83,750
AVG FAMILY INCOME
$54,500
AVG HOUSEHOLD INCOME
24.9%
WAGE / INCOME GAP [ % ]
75.1¢/ $1
WAGE / INCOME GAP [ $ ]
0.35
INEQUALITY / GINI INDEX
151
TOTAL POPULATION
80
MALE POPULATION
71
FEMALE POPULATION
112.68
MALES / 100 FEMALES
88.75
FEMALES / 100 MALES
58.2
MEDIAN AGE
2.8
AVG FAMILY SIZE
2.1
AVG HOUSEHOLD SIZE
60
LABOR FORCE [ PEOPLE ]
44.8%
PERCENT IN LABOR FORCE
5.0%
UNEMPLOYMENT RATE
Income in St Leo
Income Overview in St Leo
Per Capita Income in St Leo is $28,362, while median incomes of families and households are $83,750 and $54,500 respectively.
| Characteristic | Number | Measure |
| Per Capita Income | 151 | $28,362 |
| Median Family Income | 40 | $83,750 |
| Mean Family Income | 40 | $74,708 |
| Median Household Income | 72 | $54,500 |
| Mean Household Income | 72 | $55,544 |
| Income Deficit | 40 | $0 |
| Wage / Income Gap (%) | 151 | 24.87% |
| Wage / Income Gap ($) | 151 | 75.13¢ per $1 |
| Gini / Inequality Index | 151 | 0.35 |
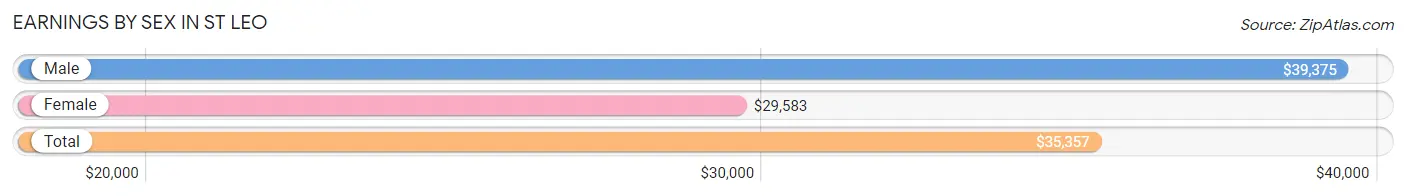
Earnings by Sex in St Leo
Average Earnings in St Leo are $35,357, $39,375 for men and $29,583 for women, a difference of 24.9%.
| Sex | Number | Average Earnings |
| Male | 29 (48.3%) | $39,375 |
| Female | 31 (51.7%) | $29,583 |
| Total | 60 (100.0%) | $35,357 |
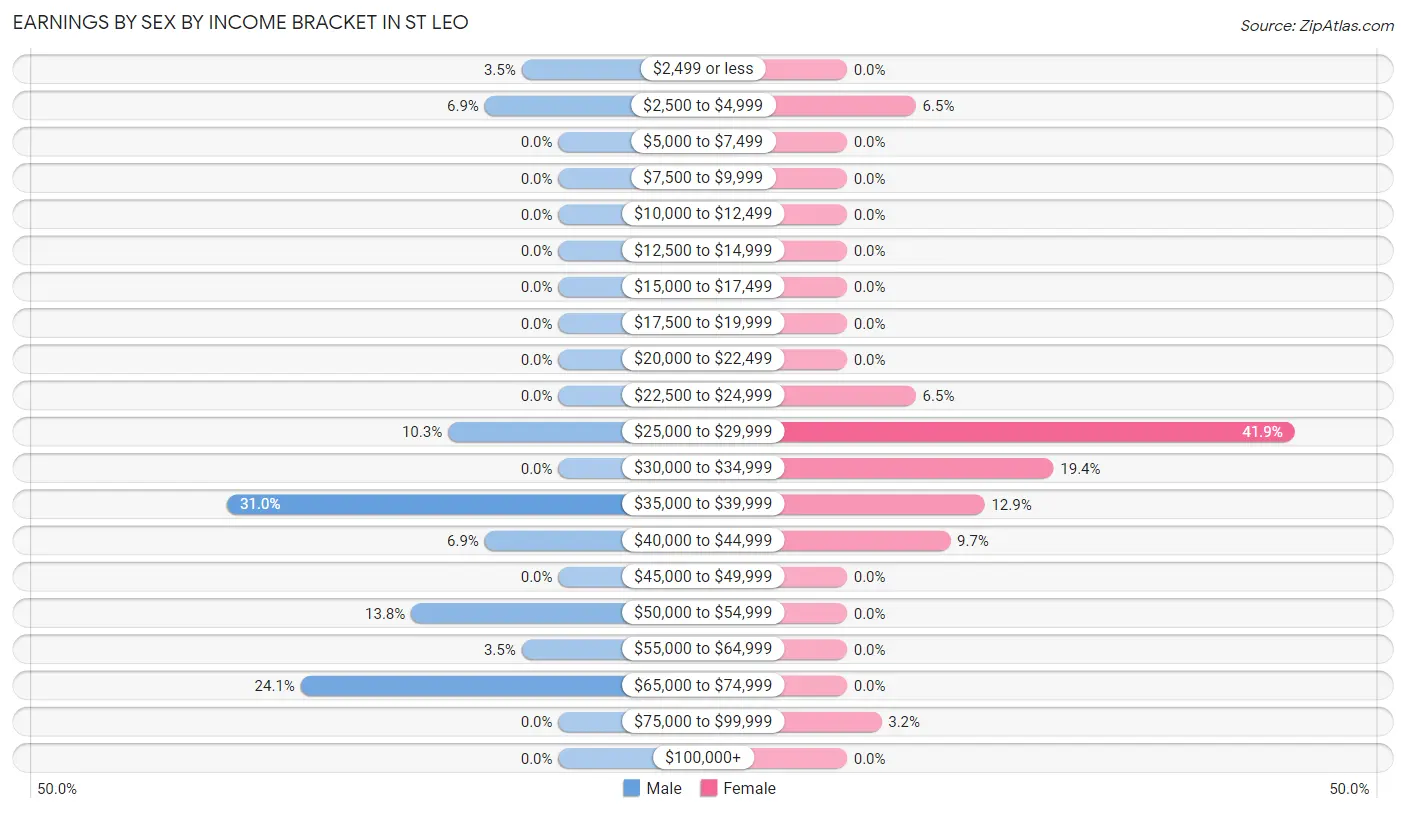
Earnings by Sex by Income Bracket in St Leo
The most common earnings brackets in St Leo are $35,000 to $39,999 for men (9 | 31.0%) and $25,000 to $29,999 for women (13 | 41.9%).
| Income | Male | Female |
| $2,499 or less | 1 (3.5%) | 0 (0.0%) |
| $2,500 to $4,999 | 2 (6.9%) | 2 (6.5%) |
| $5,000 to $7,499 | 0 (0.0%) | 0 (0.0%) |
| $7,500 to $9,999 | 0 (0.0%) | 0 (0.0%) |
| $10,000 to $12,499 | 0 (0.0%) | 0 (0.0%) |
| $12,500 to $14,999 | 0 (0.0%) | 0 (0.0%) |
| $15,000 to $17,499 | 0 (0.0%) | 0 (0.0%) |
| $17,500 to $19,999 | 0 (0.0%) | 0 (0.0%) |
| $20,000 to $22,499 | 0 (0.0%) | 0 (0.0%) |
| $22,500 to $24,999 | 0 (0.0%) | 2 (6.5%) |
| $25,000 to $29,999 | 3 (10.3%) | 13 (41.9%) |
| $30,000 to $34,999 | 0 (0.0%) | 6 (19.4%) |
| $35,000 to $39,999 | 9 (31.0%) | 4 (12.9%) |
| $40,000 to $44,999 | 2 (6.9%) | 3 (9.7%) |
| $45,000 to $49,999 | 0 (0.0%) | 0 (0.0%) |
| $50,000 to $54,999 | 4 (13.8%) | 0 (0.0%) |
| $55,000 to $64,999 | 1 (3.5%) | 0 (0.0%) |
| $65,000 to $74,999 | 7 (24.1%) | 0 (0.0%) |
| $75,000 to $99,999 | 0 (0.0%) | 1 (3.2%) |
| $100,000+ | 0 (0.0%) | 0 (0.0%) |
| Total | 29 (100.0%) | 31 (100.0%) |
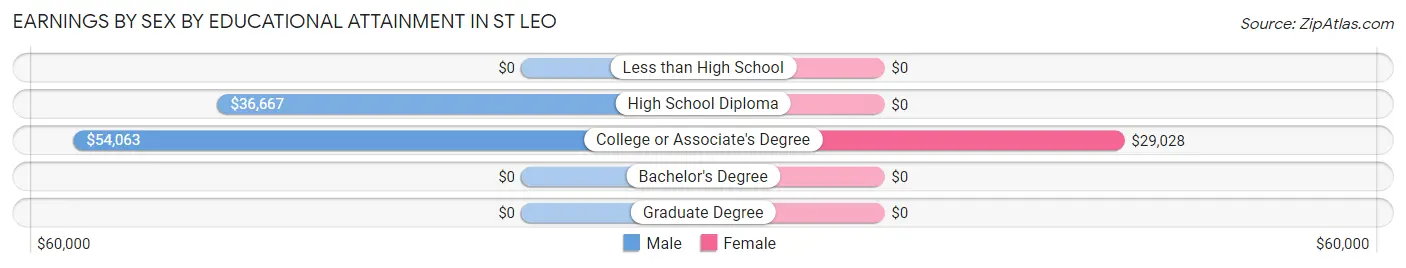
Earnings by Sex by Educational Attainment in St Leo
Average earnings in St Leo are $43,125 for men and $29,306 for women, a difference of 32.0%. Men with an educational attainment of college or associate's degree enjoy the highest average annual earnings of $54,063, while those with high school diploma education earn the least with $36,667. Women with an educational attainment of college or associate's degree earn the most with the average annual earnings of $29,028, while those with college or associate's degree education have the smallest earnings of $29,028.
| Educational Attainment | Male Income | Female Income |
| Less than High School | - | - |
| High School Diploma | $36,667 | $0 |
| College or Associate's Degree | $54,063 | $29,028 |
| Bachelor's Degree | - | - |
| Graduate Degree | - | - |
| Total | $43,125 | $29,306 |
Family Income in St Leo
Family Income Brackets in St Leo
According to the St Leo family income data, there are 19 families falling into the $75,000 to $99,999 income range, which is the most common income bracket and makes up 47.5% of all families.
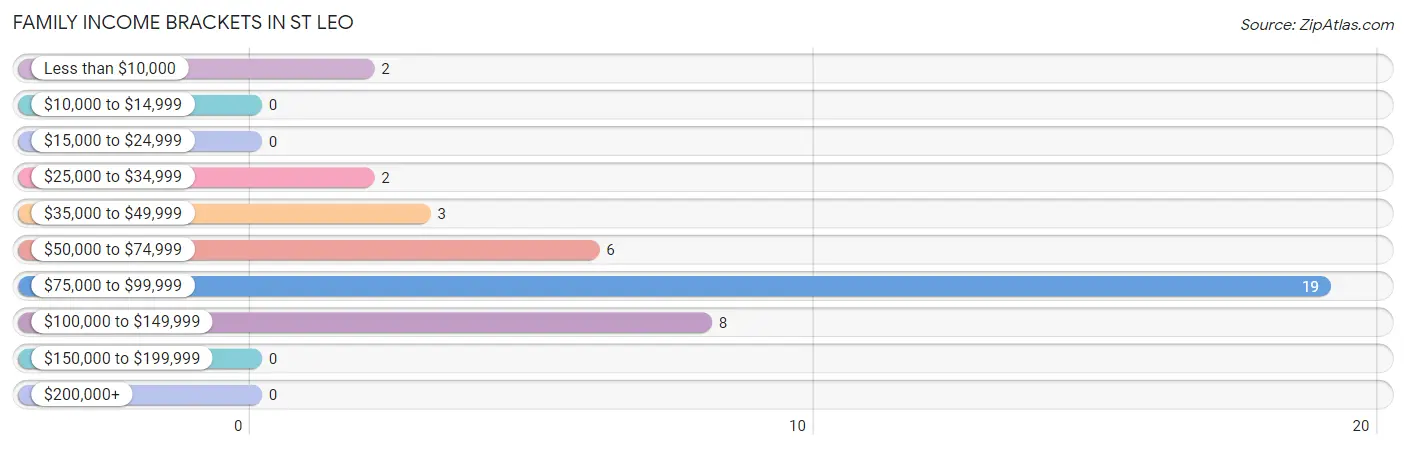
| Income Bracket | # Families | % Families |
| Less than $10,000 | 2 | 5.0% |
| $10,000 to $14,999 | 0 | 0.0% |
| $15,000 to $24,999 | 0 | 0.0% |
| $25,000 to $34,999 | 2 | 5.0% |
| $35,000 to $49,999 | 3 | 7.5% |
| $50,000 to $74,999 | 6 | 15.0% |
| $75,000 to $99,999 | 19 | 47.5% |
| $100,000 to $149,999 | 8 | 20.0% |
| $150,000 to $199,999 | 0 | 0.0% |
| $200,000+ | 0 | 0.0% |
Family Income by Famaliy Size in St Leo
2-person families (31 | 77.5%) account for the highest median family income in St Leo with $83,304 per family, while 2-person families (31 | 77.5%) have the highest median income of $41,652 per family member.
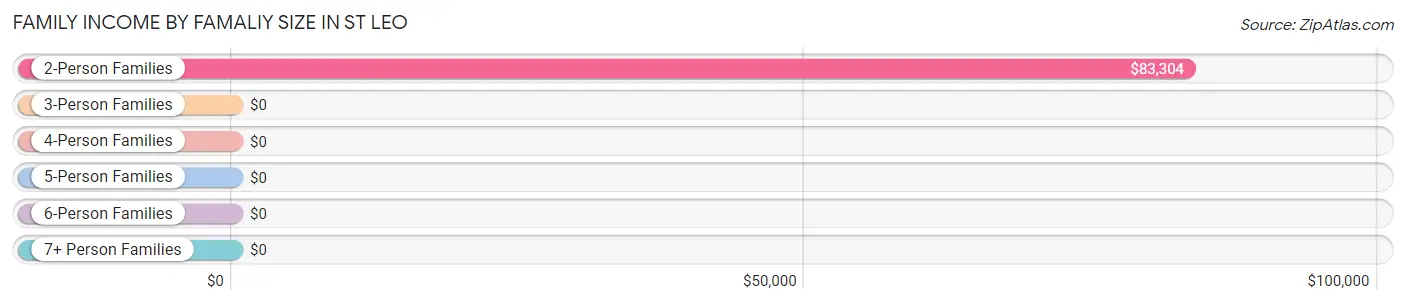
| Income Bracket | # Families | Median Income |
| 2-Person Families | 31 (77.5%) | $83,304 |
| 3-Person Families | 9 (22.5%) | $0 |
| 4-Person Families | 0 (0.0%) | $0 |
| 5-Person Families | 0 (0.0%) | $0 |
| 6-Person Families | 0 (0.0%) | $0 |
| 7+ Person Families | 0 (0.0%) | $0 |
| Total | 40 (100.0%) | $83,750 |
Family Income by Number of Earners in St Leo
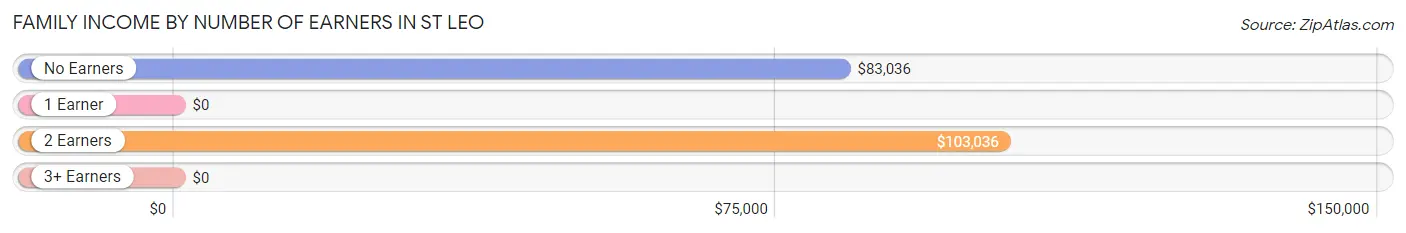
| Number of Earners | # Families | Median Income |
| No Earners | 22 (55.0%) | $83,036 |
| 1 Earner | 3 (7.5%) | $0 |
| 2 Earners | 13 (32.5%) | $103,036 |
| 3+ Earners | 2 (5.0%) | $0 |
| Total | 40 (100.0%) | $83,750 |
Household Income in St Leo
Household Income Brackets in St Leo
With 19 households falling in the category, the $75,000 to $99,999 income range is the most frequent in St Leo, accounting for 26.4% of all households.
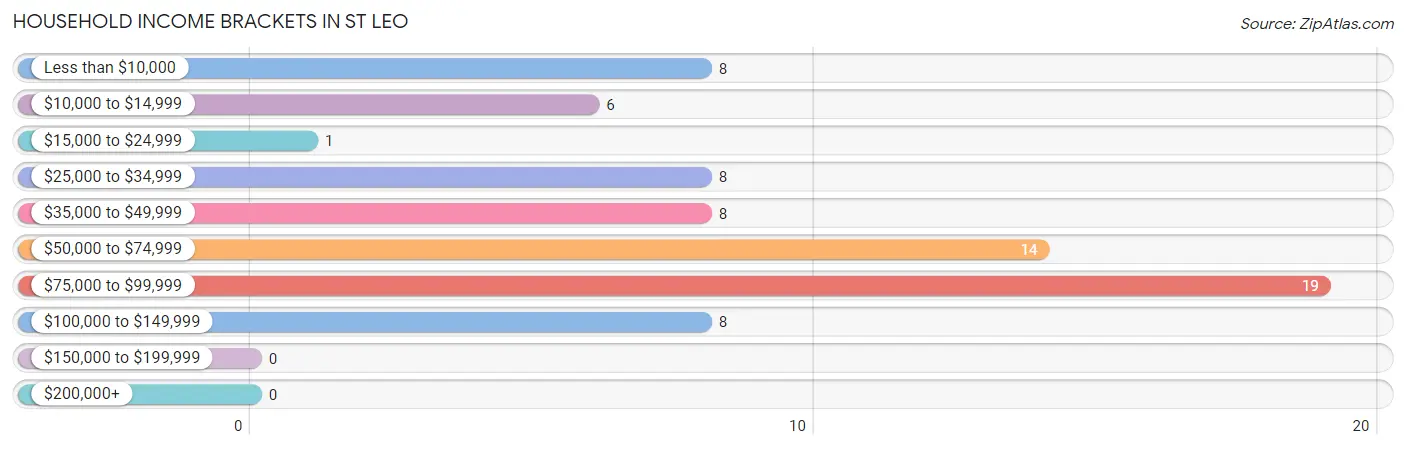
| Income Bracket | # Households | % Households |
| Less than $10,000 | 8 | 11.1% |
| $10,000 to $14,999 | 6 | 8.3% |
| $15,000 to $24,999 | 1 | 1.4% |
| $25,000 to $34,999 | 8 | 11.1% |
| $35,000 to $49,999 | 8 | 11.1% |
| $50,000 to $74,999 | 14 | 19.4% |
| $75,000 to $99,999 | 19 | 26.4% |
| $100,000 to $149,999 | 8 | 11.1% |
| $150,000 to $199,999 | 0 | 0.0% |
| $200,000+ | 0 | 0.0% |
Household Income by Householder Age in St Leo
The median household income in St Leo is $54,500, with the highest median household income of $82,768 found in the 65+ years age bracket for the primary householder. A total of 25 households (34.7%) fall into this category.
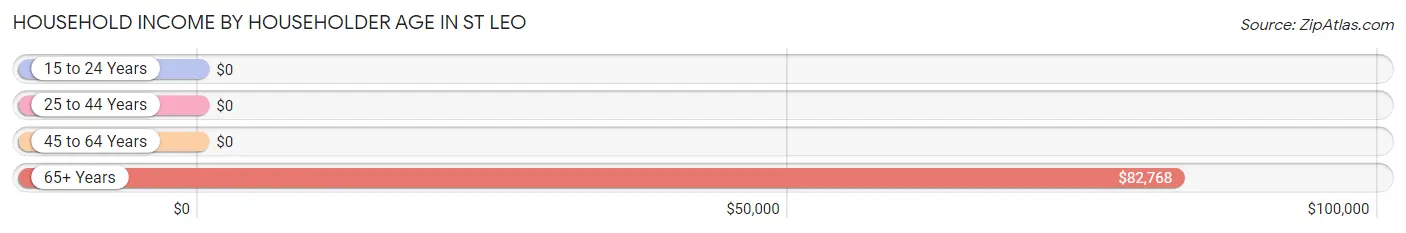
| Income Bracket | # Households | Median Income |
| 15 to 24 Years | 0 (0.0%) | $0 |
| 25 to 44 Years | 27 (37.5%) | $0 |
| 45 to 64 Years | 20 (27.8%) | $0 |
| 65+ Years | 25 (34.7%) | $82,768 |
| Total | 72 (100.0%) | $54,500 |
Poverty in St Leo
Income Below Poverty by Sex and Age in St Leo
With 16.3% poverty level for males and 4.2% for females among the residents of St Leo, 45 to 54 year old males and 75 year old and over females are the most vulnerable to poverty, with 4 males (66.7%) and 1 females (12.5%) in their respective age groups living below the poverty level.
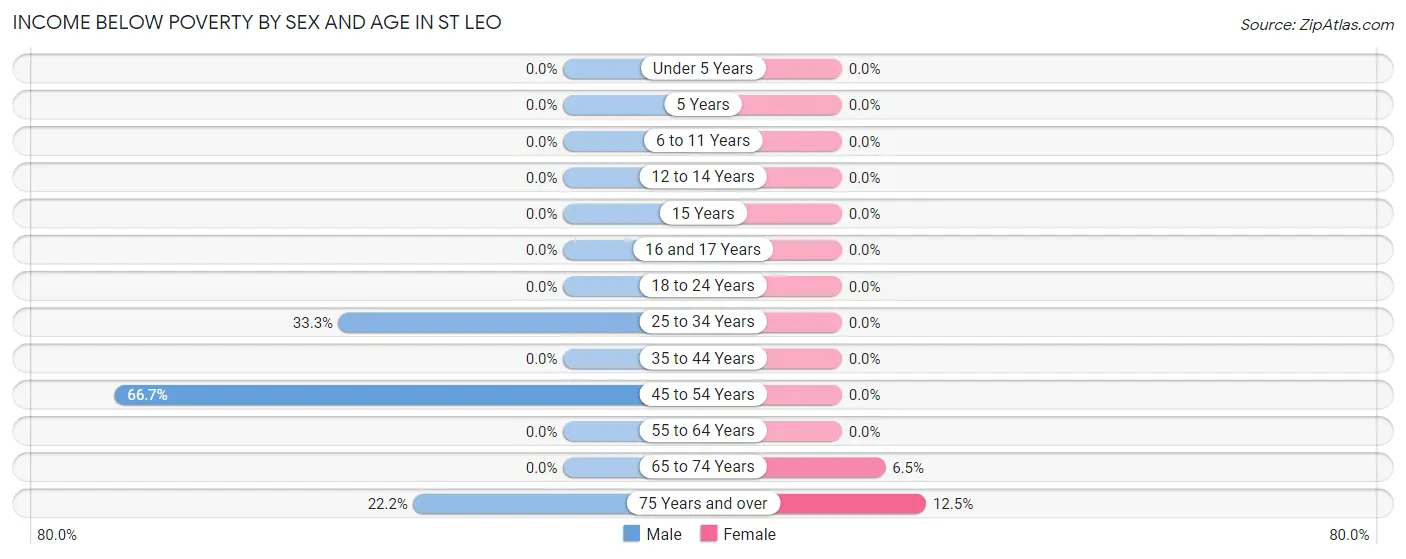
| Age Bracket | Male | Female |
| Under 5 Years | 0 (0.0%) | 0 (0.0%) |
| 5 Years | 0 (0.0%) | 0 (0.0%) |
| 6 to 11 Years | 0 (0.0%) | 0 (0.0%) |
| 12 to 14 Years | 0 (0.0%) | 0 (0.0%) |
| 15 Years | 0 (0.0%) | 0 (0.0%) |
| 16 and 17 Years | 0 (0.0%) | 0 (0.0%) |
| 18 to 24 Years | 0 (0.0%) | 0 (0.0%) |
| 25 to 34 Years | 7 (33.3%) | 0 (0.0%) |
| 35 to 44 Years | 0 (0.0%) | 0 (0.0%) |
| 45 to 54 Years | 4 (66.7%) | 0 (0.0%) |
| 55 to 64 Years | 0 (0.0%) | 0 (0.0%) |
| 65 to 74 Years | 0 (0.0%) | 2 (6.5%) |
| 75 Years and over | 2 (22.2%) | 1 (12.5%) |
| Total | 13 (16.3%) | 3 (4.2%) |
Income Above Poverty by Sex and Age in St Leo
According to the poverty statistics in St Leo, males aged under 5 years and females aged 6 to 11 years are the age groups that are most secure financially, with 100.0% of males and 100.0% of females in these age groups living above the poverty line.
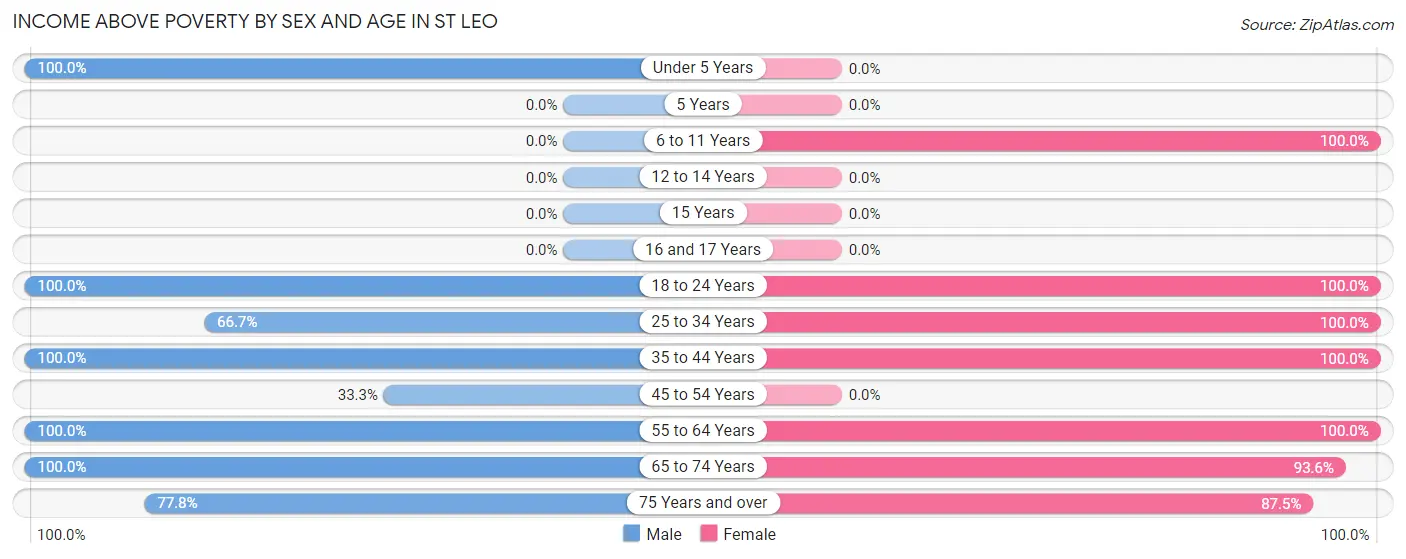
| Age Bracket | Male | Female |
| Under 5 Years | 16 (100.0%) | 0 (0.0%) |
| 5 Years | 0 (0.0%) | 0 (0.0%) |
| 6 to 11 Years | 0 (0.0%) | 1 (100.0%) |
| 12 to 14 Years | 0 (0.0%) | 0 (0.0%) |
| 15 Years | 0 (0.0%) | 0 (0.0%) |
| 16 and 17 Years | 0 (0.0%) | 0 (0.0%) |
| 18 to 24 Years | 2 (100.0%) | 6 (100.0%) |
| 25 to 34 Years | 14 (66.7%) | 11 (100.0%) |
| 35 to 44 Years | 4 (100.0%) | 2 (100.0%) |
| 45 to 54 Years | 2 (33.3%) | 0 (0.0%) |
| 55 to 64 Years | 7 (100.0%) | 12 (100.0%) |
| 65 to 74 Years | 15 (100.0%) | 29 (93.5%) |
| 75 Years and over | 7 (77.8%) | 7 (87.5%) |
| Total | 67 (83.8%) | 68 (95.8%) |
Income Below Poverty Among Married-Couple Families in St Leo
The poverty statistics for married-couple families in St Leo show that 5.6% or 2 of the total 36 families live below the poverty line. Families with no children have the highest poverty rate of 6.9%, comprising of 2 families. On the other hand, families with 1 or 2 children have the lowest poverty rate of 0.0%, which includes 0 families.
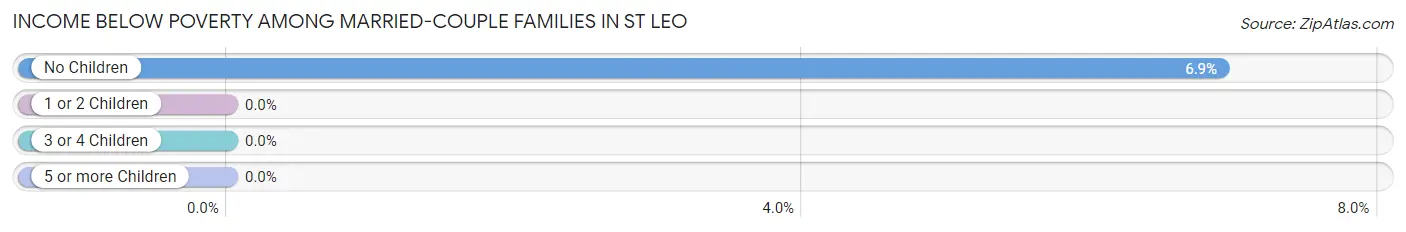
| Children | Above Poverty | Below Poverty |
| No Children | 27 (93.1%) | 2 (6.9%) |
| 1 or 2 Children | 7 (100.0%) | 0 (0.0%) |
| 3 or 4 Children | 0 (0.0%) | 0 (0.0%) |
| 5 or more Children | 0 (0.0%) | 0 (0.0%) |
| Total | 34 (94.4%) | 2 (5.6%) |
Income Below Poverty Among Single-Parent Households in St Leo
| Children | Single Father | Single Mother |
| No Children | 0 (0.0%) | 0 (0.0%) |
| 1 or 2 Children | 0 (0.0%) | 0 (0.0%) |
| 3 or 4 Children | 0 (0.0%) | 0 (0.0%) |
| 5 or more Children | 0 (0.0%) | 0 (0.0%) |
| Total | 0 (0.0%) | 0 (0.0%) |
Income Below Poverty Among Married-Couple vs Single-Parent Households in St Leo
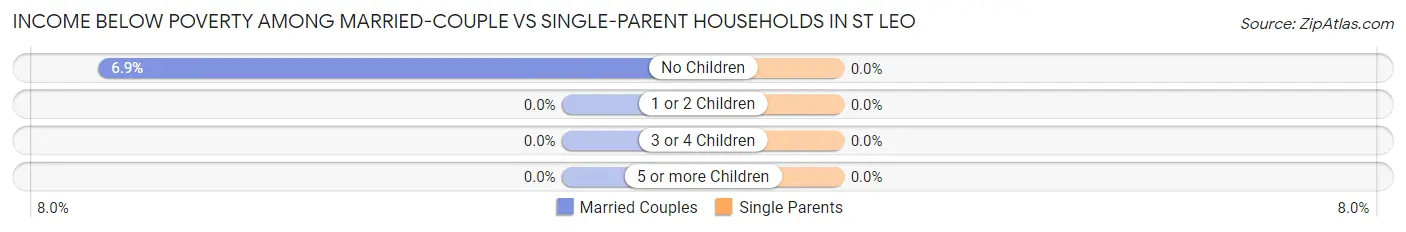
| Children | Married-Couple Families | Single-Parent Households |
| No Children | 2 (6.9%) | 0 (0.0%) |
| 1 or 2 Children | 0 (0.0%) | 0 (0.0%) |
| 3 or 4 Children | 0 (0.0%) | 0 (0.0%) |
| 5 or more Children | 0 (0.0%) | 0 (0.0%) |
| Total | 2 (5.6%) | 0 (0.0%) |
Race in St Leo
The most populous races in St Leo are White / Caucasian (141 | 93.4%), Black / African American (6 | 4.0%), and Two or more Races (4 | 2.6%).
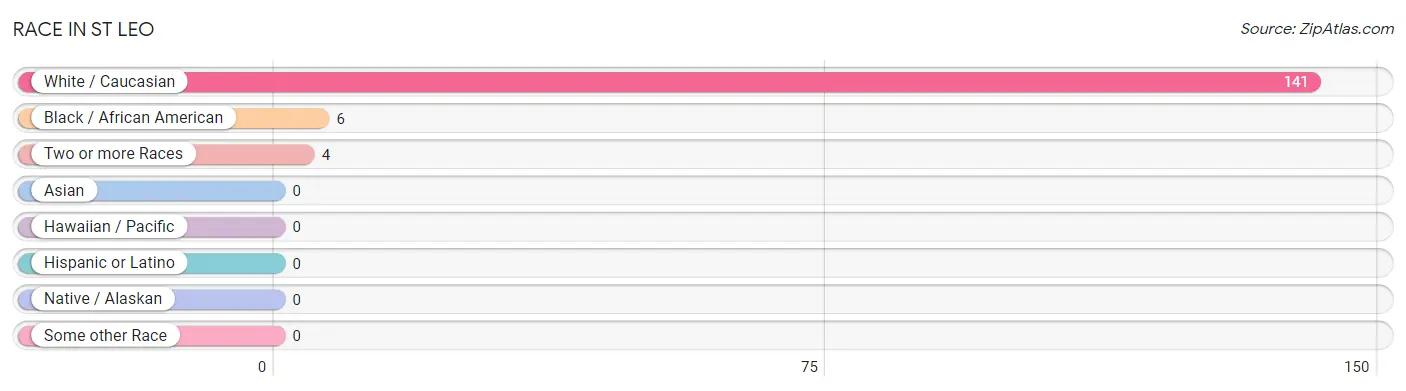
| Race | # Population | % Population |
| Asian | 0 | 0.0% |
| Black / African American | 6 | 4.0% |
| Hawaiian / Pacific | 0 | 0.0% |
| Hispanic or Latino | 0 | 0.0% |
| Native / Alaskan | 0 | 0.0% |
| White / Caucasian | 141 | 93.4% |
| Two or more Races | 4 | 2.6% |
| Some other Race | 0 | 0.0% |
| Total | 151 | 100.0% |
Ancestry in St Leo
The most populous ancestries reported in St Leo are German (71 | 47.0%), Norwegian (41 | 27.2%), Polish (7 | 4.6%), Somali (6 | 4.0%), and Subsaharan African (6 | 4.0%), together accounting for 86.7% of all St Leo residents.
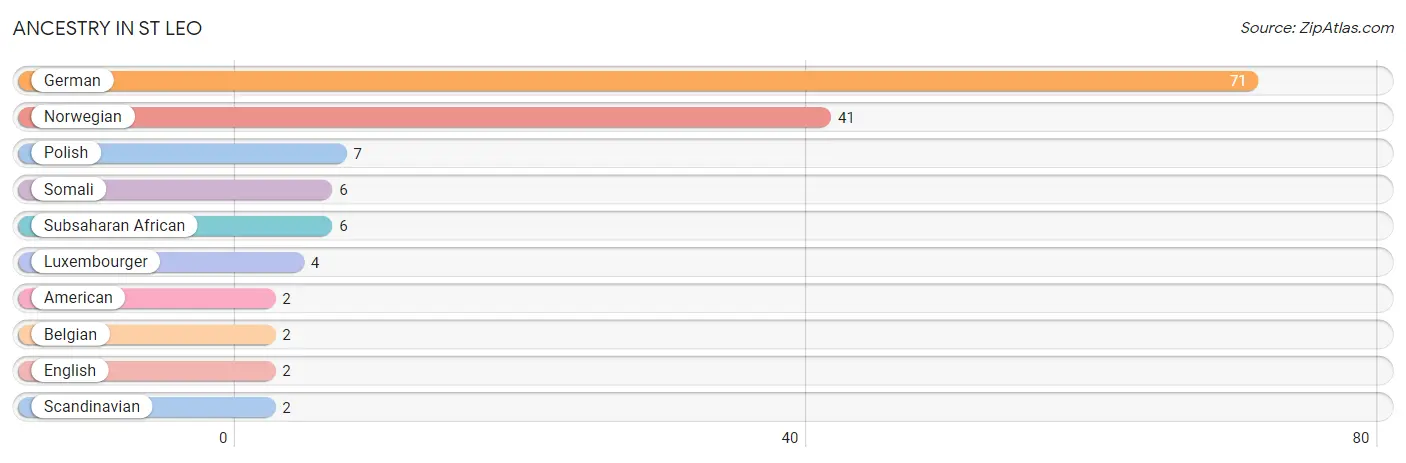
| Ancestry | # Population | % Population |
| American | 2 | 1.3% |
| Belgian | 2 | 1.3% |
| English | 2 | 1.3% |
| German | 71 | 47.0% |
| Luxembourger | 4 | 2.6% |
| Norwegian | 41 | 27.2% |
| Polish | 7 | 4.6% |
| Scandinavian | 2 | 1.3% |
| Somali | 6 | 4.0% |
| Subsaharan African | 6 | 4.0% | View All 10 Rows |
Immigrants in St Leo
The most numerous immigrant groups reported in St Leo came from Africa (6 | 4.0%), Eastern Africa (6 | 4.0%), and Somalia (6 | 4.0%), together accounting for 11.9% of all St Leo residents.
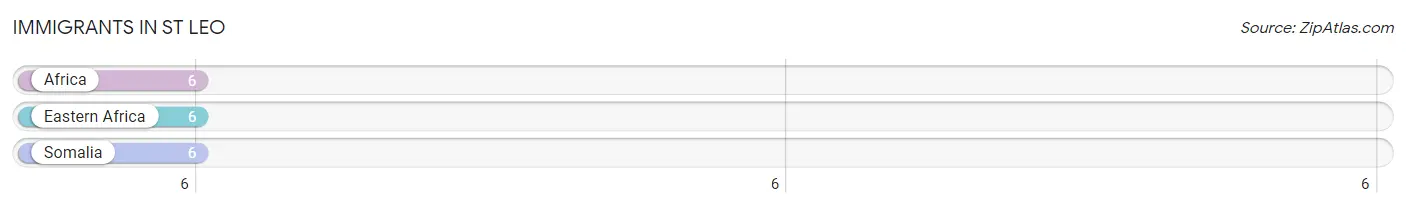
| Immigration Origin | # Population | % Population |
| Africa | 6 | 4.0% |
| Eastern Africa | 6 | 4.0% |
| Somalia | 6 | 4.0% | View All 3 Rows |
Sex and Age in St Leo
Sex and Age in St Leo
The most populous age groups in St Leo are Under 5 Years (16 | 20.0%) for men and 70 to 74 Years (29 | 40.8%) for women.
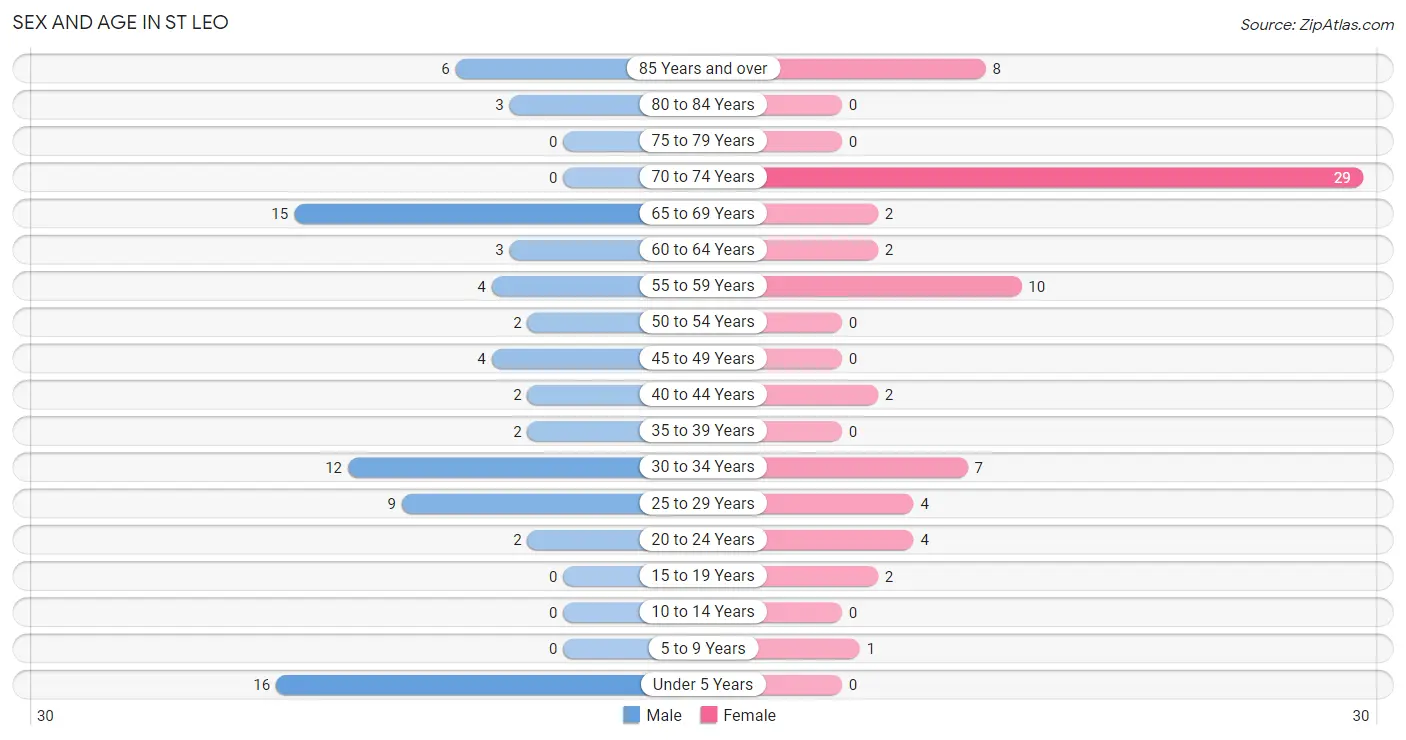
| Age Bracket | Male | Female |
| Under 5 Years | 16 (20.0%) | 0 (0.0%) |
| 5 to 9 Years | 0 (0.0%) | 1 (1.4%) |
| 10 to 14 Years | 0 (0.0%) | 0 (0.0%) |
| 15 to 19 Years | 0 (0.0%) | 2 (2.8%) |
| 20 to 24 Years | 2 (2.5%) | 4 (5.6%) |
| 25 to 29 Years | 9 (11.3%) | 4 (5.6%) |
| 30 to 34 Years | 12 (15.0%) | 7 (9.9%) |
| 35 to 39 Years | 2 (2.5%) | 0 (0.0%) |
| 40 to 44 Years | 2 (2.5%) | 2 (2.8%) |
| 45 to 49 Years | 4 (5.0%) | 0 (0.0%) |
| 50 to 54 Years | 2 (2.5%) | 0 (0.0%) |
| 55 to 59 Years | 4 (5.0%) | 10 (14.1%) |
| 60 to 64 Years | 3 (3.7%) | 2 (2.8%) |
| 65 to 69 Years | 15 (18.8%) | 2 (2.8%) |
| 70 to 74 Years | 0 (0.0%) | 29 (40.8%) |
| 75 to 79 Years | 0 (0.0%) | 0 (0.0%) |
| 80 to 84 Years | 3 (3.7%) | 0 (0.0%) |
| 85 Years and over | 6 (7.5%) | 8 (11.3%) |
| Total | 80 (100.0%) | 71 (100.0%) |
Families and Households in St Leo
Median Family Size in St Leo
The median family size in St Leo is 2.80 persons per family, with single female/mother families (2 | 5.0%) accounting for the largest median family size of 3 persons per family. On the other hand, single male/father families (2 | 5.0%) represent the smallest median family size with 1.50 persons per family.
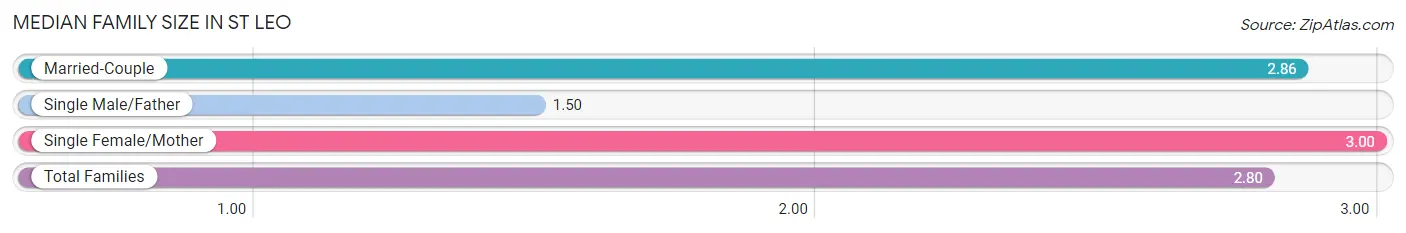
| Family Type | # Families | Family Size |
| Married-Couple | 36 (90.0%) | 2.86 |
| Single Male/Father | 2 (5.0%) | 1.50 |
| Single Female/Mother | 2 (5.0%) | 3.00 |
| Total Families | 40 (100.0%) | 2.80 |
Median Household Size in St Leo
The median household size in St Leo is 2.10 persons per household, with single female/mother households (2 | 2.8%) accounting for the largest median household size of 3 persons per household. non-family households (32 | 44.4%) represent the smallest median household size with 1.22 persons per household.
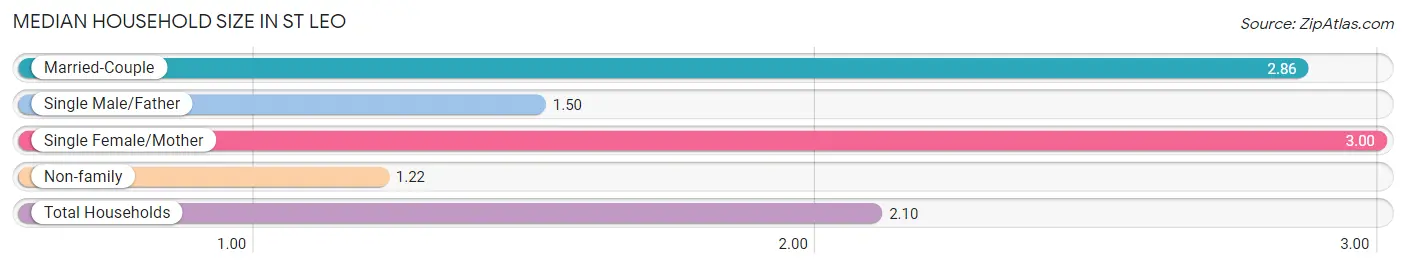
| Household Type | # Households | Household Size |
| Married-Couple | 36 (50.0%) | 2.86 |
| Single Male/Father | 2 (2.8%) | 1.50 |
| Single Female/Mother | 2 (2.8%) | 3.00 |
| Non-family | 32 (44.4%) | 1.22 |
| Total Households | 72 (100.0%) | 2.10 |
Household Size by Marriage Status in St Leo
Out of a total of 72 households in St Leo, 40 (55.6%) are family households, while 32 (44.4%) are nonfamily households. The most numerous type of family households are 2-person households, comprising 31, and the most common type of nonfamily households are 1-person households, comprising 26.
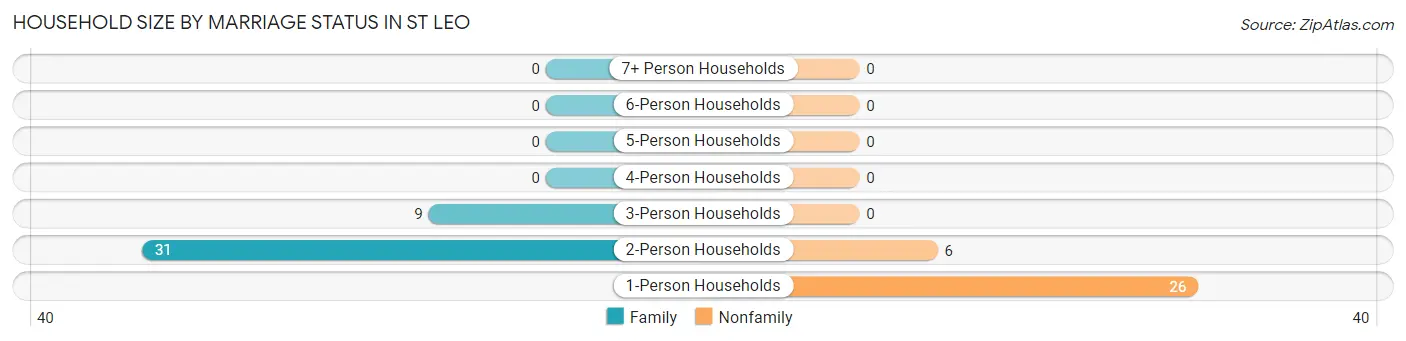
| Household Size | Family Households | Nonfamily Households |
| 1-Person Households | - | 26 (36.1%) |
| 2-Person Households | 31 (43.1%) | 6 (8.3%) |
| 3-Person Households | 9 (12.5%) | 0 (0.0%) |
| 4-Person Households | 0 (0.0%) | 0 (0.0%) |
| 5-Person Households | 0 (0.0%) | 0 (0.0%) |
| 6-Person Households | 0 (0.0%) | 0 (0.0%) |
| 7+ Person Households | 0 (0.0%) | 0 (0.0%) |
| Total | 40 (55.6%) | 32 (44.4%) |
Female Fertility in St Leo
Fertility by Age in St Leo
| Age Bracket | Women with Births | Births / 1,000 Women |
| 15 to 19 years | 0 (0.0%) | 0.0 |
| 20 to 34 years | 0 (0.0%) | 0.0 |
| 35 to 50 years | 0 (0.0%) | 0.0 |
| Total | 0 (0.0%) | 0.0 |
Fertility by Age by Marriage Status in St Leo
| Age Bracket | Married | Unmarried |
| 15 to 19 years | 0 (0.0%) | 0 (0.0%) |
| 20 to 34 years | 0 (0.0%) | 0 (0.0%) |
| 35 to 50 years | 0 (0.0%) | 0 (0.0%) |
| Total | 0 (0.0%) | 0 (0.0%) |
Fertility by Education in St Leo
| Educational Attainment | Women with Births | Births / 1,000 Women |
| Less than High School | 0 (0.0%) | 0.0 |
| High School Diploma | 0 (0.0%) | 0.0 |
| College or Associate's Degree | 0 (0.0%) | 0.0 |
| Bachelor's Degree | 0 (0.0%) | 0.0 |
| Graduate Degree | 0 (0.0%) | 0.0 |
| Total | 0 (0.0%) | 0.0 |
Fertility by Education by Marriage Status in St Leo
| Educational Attainment | Married | Unmarried |
| Less than High School | 0 (0.0%) | 0 (0.0%) |
| High School Diploma | 0 (0.0%) | 0 (0.0%) |
| College or Associate's Degree | 0 (0.0%) | 0 (0.0%) |
| Bachelor's Degree | 0 (0.0%) | 0 (0.0%) |
| Graduate Degree | 0 (0.0%) | 0 (0.0%) |
| Total | 0 (0.0%) | 0 (0.0%) |
Employment Characteristics in St Leo
Employment by Class of Employer in St Leo
Among the 57 employed individuals in St Leo, private company employees (41 | 71.9%), self-employed (incorporated) (6 | 10.5%), and not-for-profit organizations (5 | 8.8%) make up the most common classes of employment.
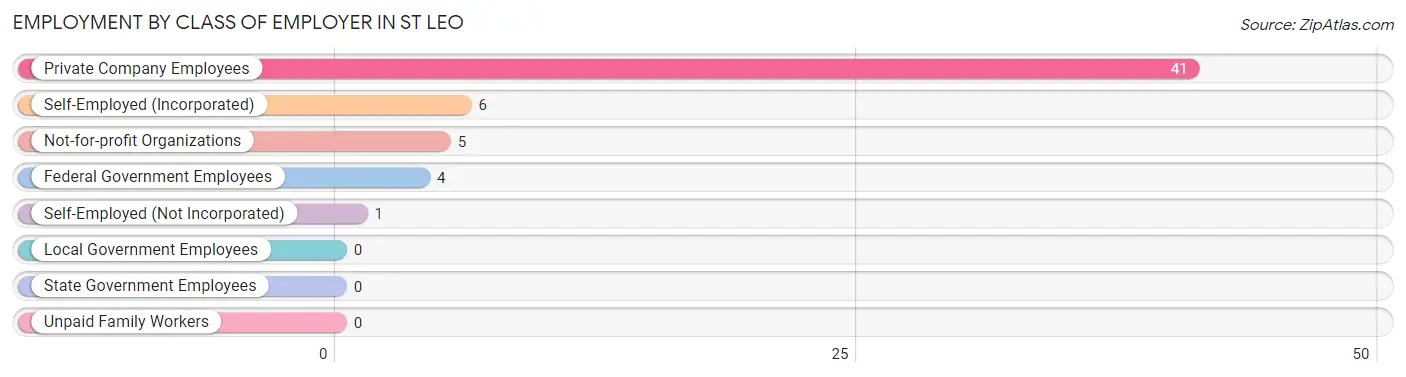
| Employer Class | # Employees | % Employees |
| Private Company Employees | 41 | 71.9% |
| Self-Employed (Incorporated) | 6 | 10.5% |
| Self-Employed (Not Incorporated) | 1 | 1.8% |
| Not-for-profit Organizations | 5 | 8.8% |
| Local Government Employees | 0 | 0.0% |
| State Government Employees | 0 | 0.0% |
| Federal Government Employees | 4 | 7.0% |
| Unpaid Family Workers | 0 | 0.0% |
| Total | 57 | 100.0% |
Employment Status by Age in St Leo
According to the labor force statistics for St Leo, out of the total population over 16 years of age (134), 44.8% or 60 individuals are in the labor force, with 5.0% or 3 of them unemployed. The age group with the highest labor force participation rate is 16 to 19 years, with 100.0% or 2 individuals in the labor force. Within the labor force, the 55 to 59 years age range has the highest percentage of unemployed individuals, with 21.4% or 3 of them being unemployed.
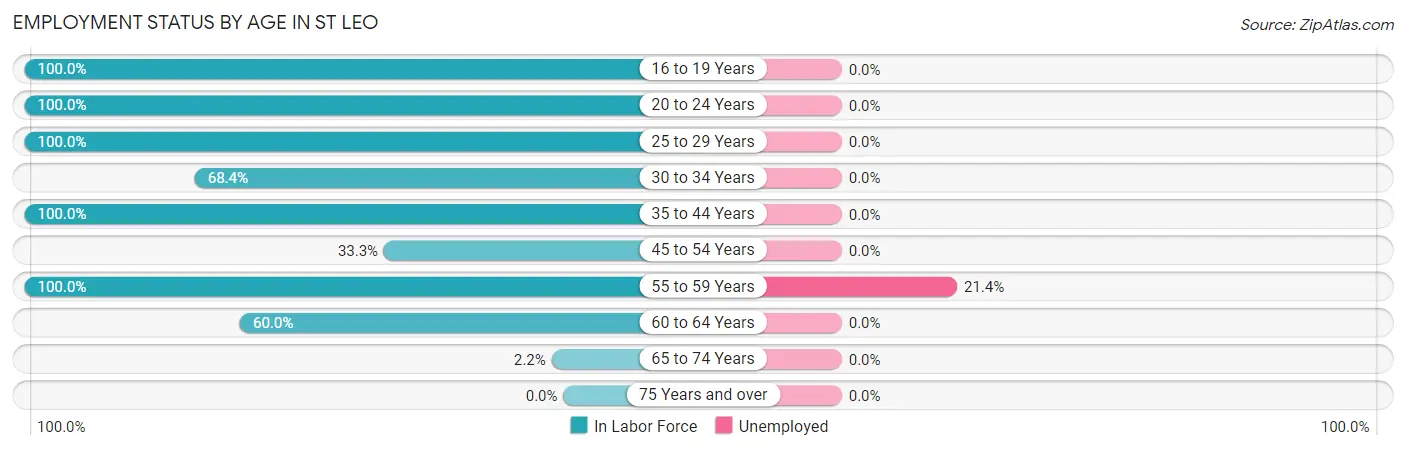
| Age Bracket | In Labor Force | Unemployed |
| 16 to 19 Years | 2 (100.0%) | 0 (0.0%) |
| 20 to 24 Years | 6 (100.0%) | 0 (0.0%) |
| 25 to 29 Years | 13 (100.0%) | 0 (0.0%) |
| 30 to 34 Years | 13 (68.4%) | 0 (0.0%) |
| 35 to 44 Years | 6 (100.0%) | 0 (0.0%) |
| 45 to 54 Years | 2 (33.3%) | 0 (0.0%) |
| 55 to 59 Years | 14 (100.0%) | 3 (21.4%) |
| 60 to 64 Years | 3 (60.0%) | 0 (0.0%) |
| 65 to 74 Years | 1 (2.2%) | 0 (0.0%) |
| 75 Years and over | 0 (0.0%) | 0 (0.0%) |
| Total | 60 (44.8%) | 3 (5.0%) |
Employment Status by Educational Attainment in St Leo
According to labor force statistics for St Leo, 81.0% of individuals (51) out of the total population between 25 and 64 years of age (63) are in the labor force, with 5.9% or 3 of them being unemployed. The group with the highest labor force participation rate are those with the educational attainment of college / associate degree, with 100.0% or 40 individuals in the labor force. Within the labor force, individuals with college / associate degree education have the highest percentage of unemployment, with 7.5% or 3 of them being unemployed.
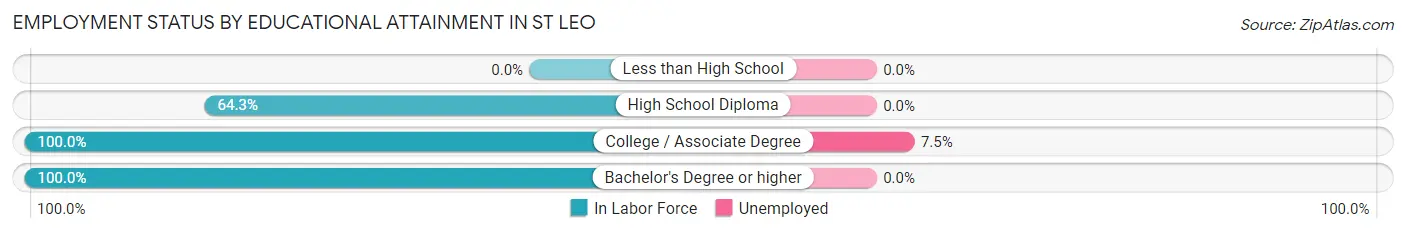
| Educational Attainment | In Labor Force | Unemployed |
| Less than High School | 0 (0.0%) | 0 (0.0%) |
| High School Diploma | 9 (64.3%) | 0 (0.0%) |
| College / Associate Degree | 40 (100.0%) | 3 (7.5%) |
| Bachelor's Degree or higher | 2 (100.0%) | 0 (0.0%) |
| Total | 51 (81.0%) | 4 (5.9%) |
Employment Occupations by Sex in St Leo
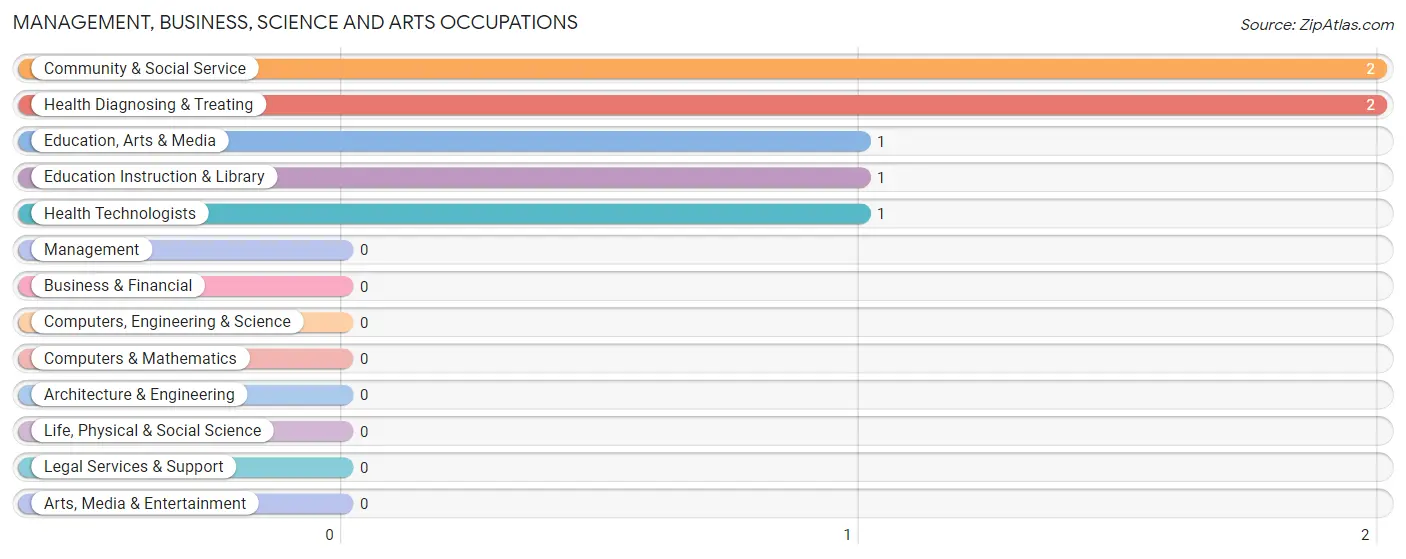
Management, Business, Science and Arts Occupations
The most common Management, Business, Science and Arts occupations in St Leo are Community & Social Service (2 | 3.5%), Health Diagnosing & Treating (2 | 3.5%), Education, Arts & Media (1 | 1.8%), Education Instruction & Library (1 | 1.8%), and Health Technologists (1 | 1.8%).
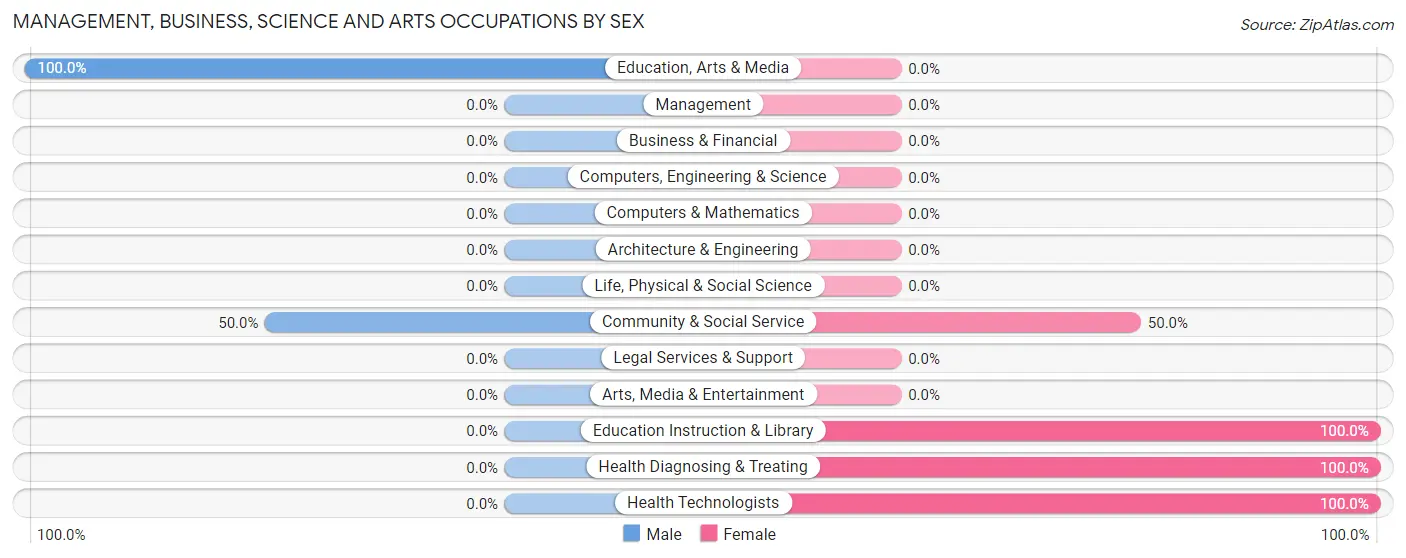
Management, Business, Science and Arts Occupations by Sex
Within the Management, Business, Science and Arts occupations in St Leo, the most male-oriented occupations are Education, Arts & Media (100.0%), and Community & Social Service (50.0%), while the most female-oriented occupations are Education Instruction & Library (100.0%), Health Diagnosing & Treating (100.0%), and Health Technologists (100.0%).
| Occupation | Male | Female |
| Management | 0 (0.0%) | 0 (0.0%) |
| Business & Financial | 0 (0.0%) | 0 (0.0%) |
| Computers, Engineering & Science | 0 (0.0%) | 0 (0.0%) |
| Computers & Mathematics | 0 (0.0%) | 0 (0.0%) |
| Architecture & Engineering | 0 (0.0%) | 0 (0.0%) |
| Life, Physical & Social Science | 0 (0.0%) | 0 (0.0%) |
| Community & Social Service | 1 (50.0%) | 1 (50.0%) |
| Education, Arts & Media | 1 (100.0%) | 0 (0.0%) |
| Legal Services & Support | 0 (0.0%) | 0 (0.0%) |
| Education Instruction & Library | 0 (0.0%) | 1 (100.0%) |
| Arts, Media & Entertainment | 0 (0.0%) | 0 (0.0%) |
| Health Diagnosing & Treating | 0 (0.0%) | 2 (100.0%) |
| Health Technologists | 0 (0.0%) | 1 (100.0%) |
| Total (Category) | 1 (25.0%) | 3 (75.0%) |
| Total (Overall) | 29 (50.9%) | 28 (49.1%) |
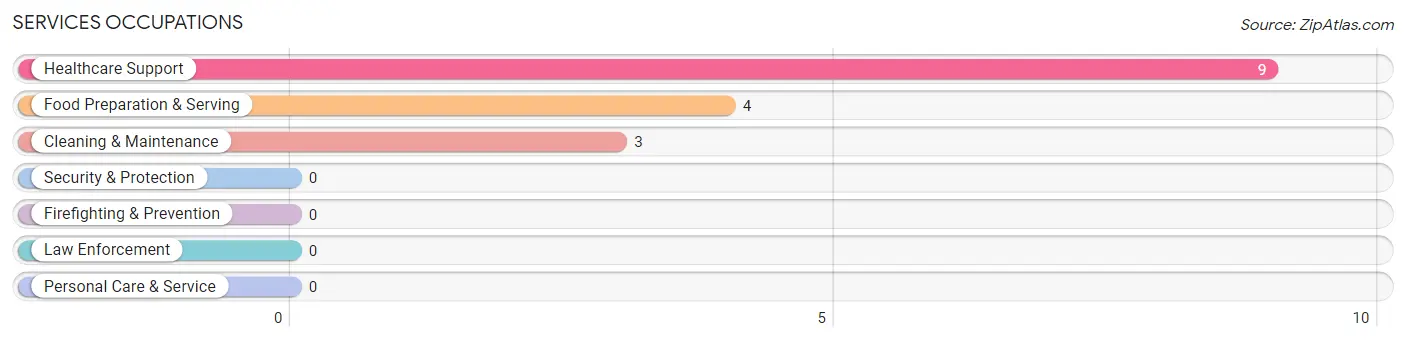
Services Occupations
The most common Services occupations in St Leo are Healthcare Support (9 | 15.8%), Food Preparation & Serving (4 | 7.0%), and Cleaning & Maintenance (3 | 5.3%).
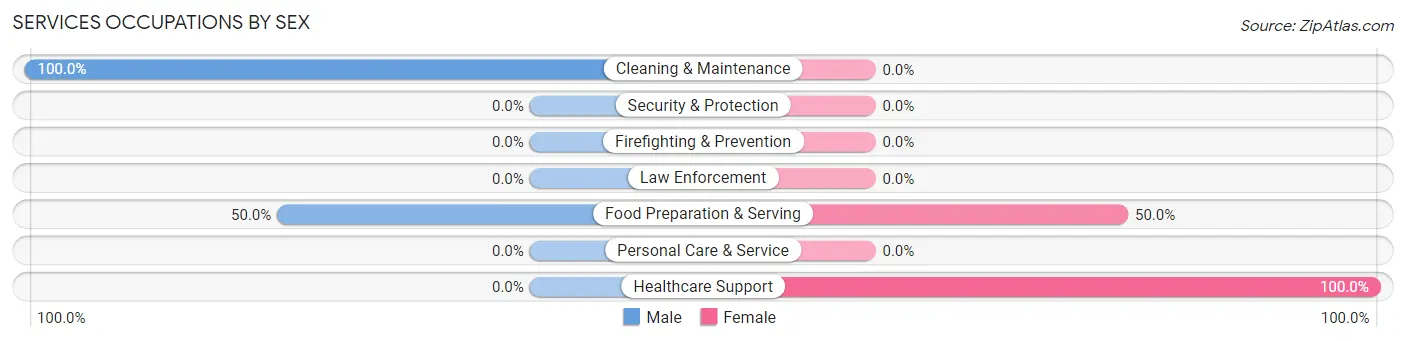
Services Occupations by Sex
Within the Services occupations in St Leo, the most male-oriented occupations are Cleaning & Maintenance (100.0%), and Food Preparation & Serving (50.0%), while the most female-oriented occupations are Healthcare Support (100.0%), and Food Preparation & Serving (50.0%).
| Occupation | Male | Female |
| Healthcare Support | 0 (0.0%) | 9 (100.0%) |
| Security & Protection | 0 (0.0%) | 0 (0.0%) |
| Firefighting & Prevention | 0 (0.0%) | 0 (0.0%) |
| Law Enforcement | 0 (0.0%) | 0 (0.0%) |
| Food Preparation & Serving | 2 (50.0%) | 2 (50.0%) |
| Cleaning & Maintenance | 3 (100.0%) | 0 (0.0%) |
| Personal Care & Service | 0 (0.0%) | 0 (0.0%) |
| Total (Category) | 5 (31.2%) | 11 (68.8%) |
| Total (Overall) | 29 (50.9%) | 28 (49.1%) |
Sales and Office Occupations
The most common Sales and Office occupations in St Leo are Office & Administration (7 | 12.3%), and Sales & Related (5 | 8.8%).
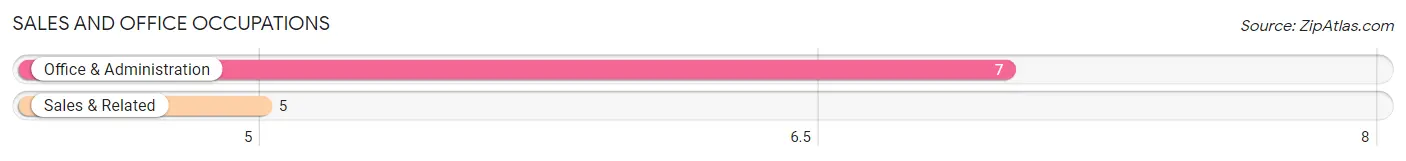
Sales and Office Occupations by Sex
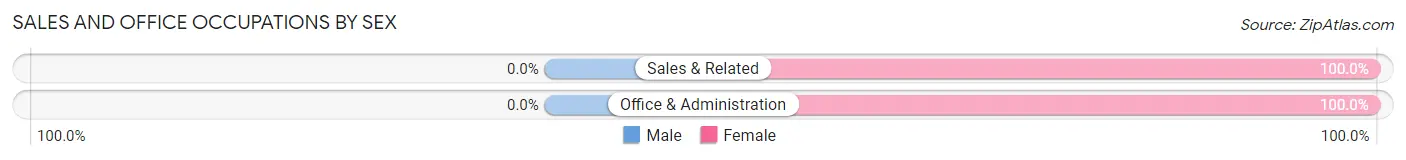
| Occupation | Male | Female |
| Sales & Related | 0 (0.0%) | 5 (100.0%) |
| Office & Administration | 0 (0.0%) | 7 (100.0%) |
| Total (Category) | 0 (0.0%) | 12 (100.0%) |
| Total (Overall) | 29 (50.9%) | 28 (49.1%) |
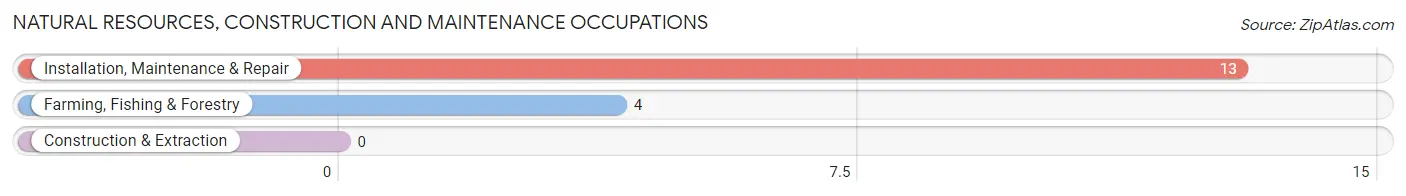
Natural Resources, Construction and Maintenance Occupations
The most common Natural Resources, Construction and Maintenance occupations in St Leo are Installation, Maintenance & Repair (13 | 22.8%), and Farming, Fishing & Forestry (4 | 7.0%).
Natural Resources, Construction and Maintenance Occupations by Sex
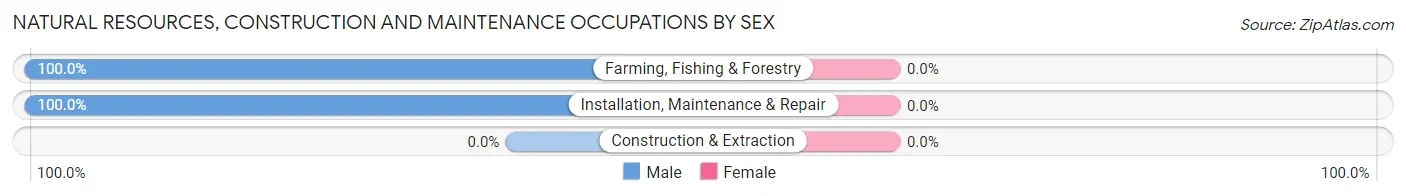
| Occupation | Male | Female |
| Farming, Fishing & Forestry | 4 (100.0%) | 0 (0.0%) |
| Construction & Extraction | 0 (0.0%) | 0 (0.0%) |
| Installation, Maintenance & Repair | 13 (100.0%) | 0 (0.0%) |
| Total (Category) | 17 (100.0%) | 0 (0.0%) |
| Total (Overall) | 29 (50.9%) | 28 (49.1%) |
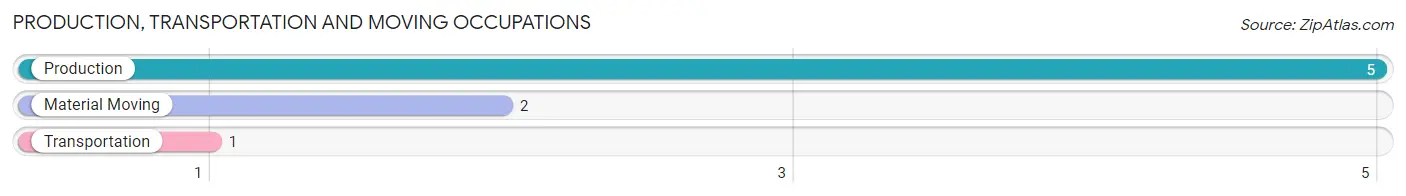
Production, Transportation and Moving Occupations
The most common Production, Transportation and Moving occupations in St Leo are Production (5 | 8.8%), Material Moving (2 | 3.5%), and Transportation (1 | 1.8%).
Production, Transportation and Moving Occupations by Sex
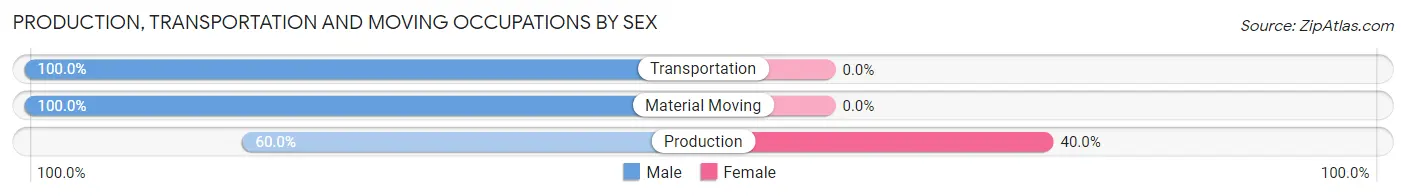
| Occupation | Male | Female |
| Production | 3 (60.0%) | 2 (40.0%) |
| Transportation | 1 (100.0%) | 0 (0.0%) |
| Material Moving | 2 (100.0%) | 0 (0.0%) |
| Total (Category) | 6 (75.0%) | 2 (25.0%) |
| Total (Overall) | 29 (50.9%) | 28 (49.1%) |
Employment Industries by Sex in St Leo
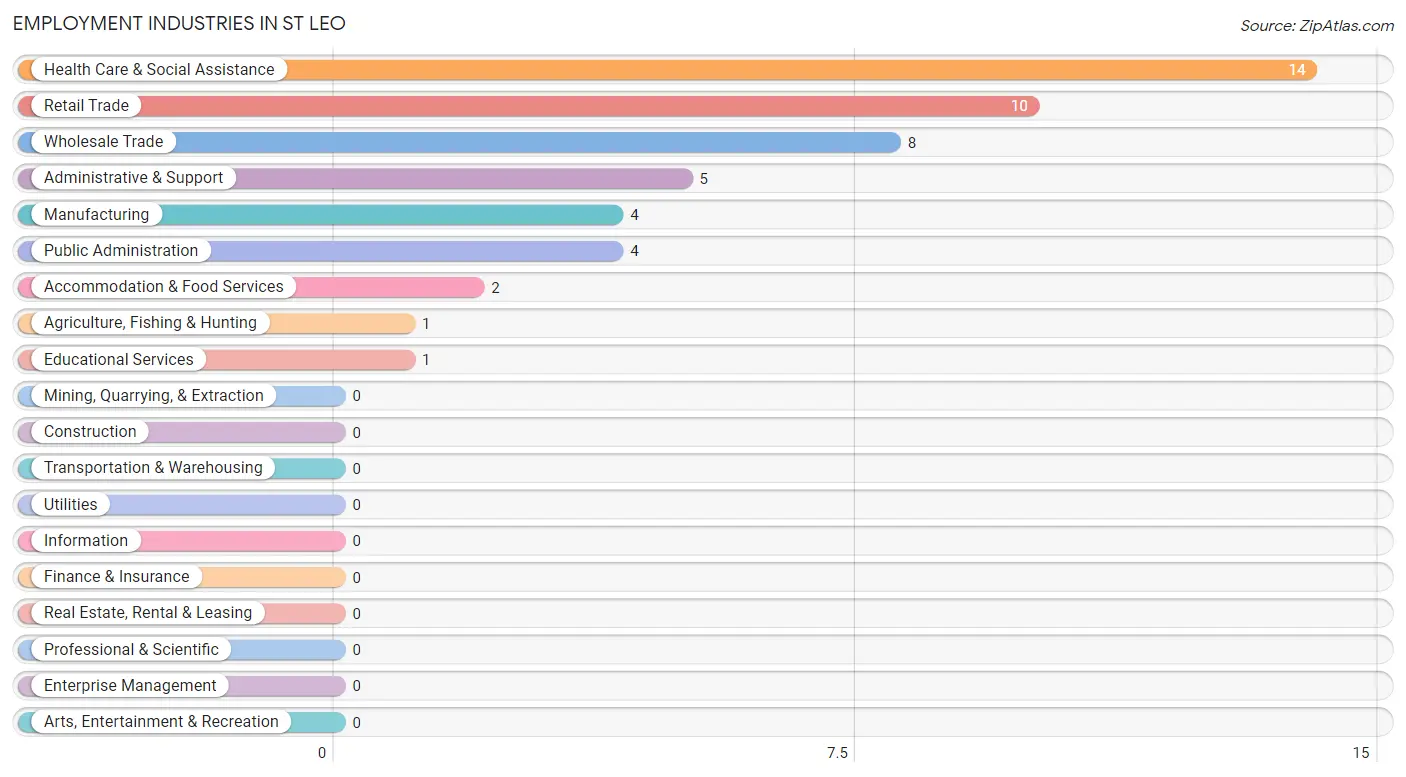
Employment Industries in St Leo
The major employment industries in St Leo include Health Care & Social Assistance (14 | 24.6%), Retail Trade (10 | 17.5%), Wholesale Trade (8 | 14.0%), Administrative & Support (5 | 8.8%), and Manufacturing (4 | 7.0%).
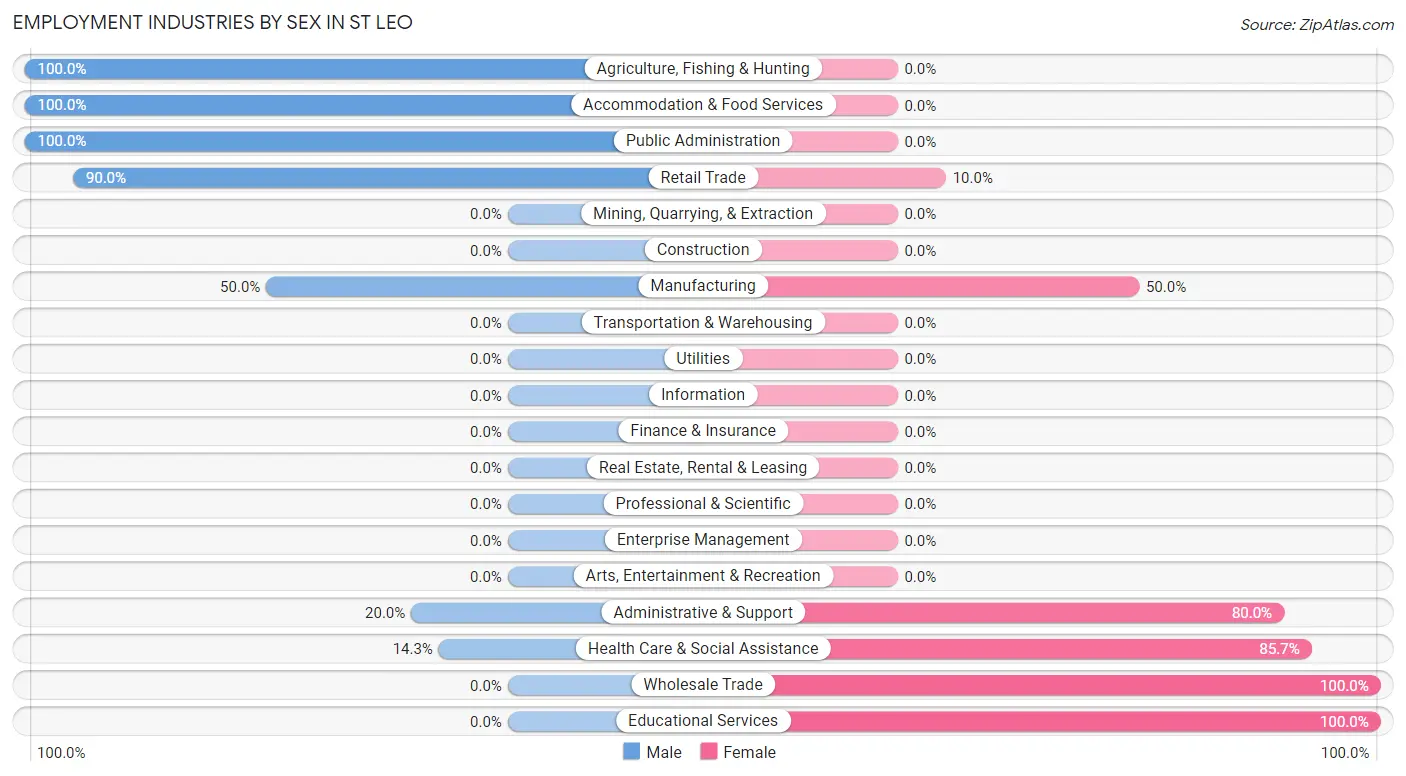
Employment Industries by Sex in St Leo
The St Leo industries that see more men than women are Agriculture, Fishing & Hunting (100.0%), Accommodation & Food Services (100.0%), and Public Administration (100.0%), whereas the industries that tend to have a higher number of women are Wholesale Trade (100.0%), Educational Services (100.0%), and Health Care & Social Assistance (85.7%).
| Industry | Male | Female |
| Agriculture, Fishing & Hunting | 1 (100.0%) | 0 (0.0%) |
| Mining, Quarrying, & Extraction | 0 (0.0%) | 0 (0.0%) |
| Construction | 0 (0.0%) | 0 (0.0%) |
| Manufacturing | 2 (50.0%) | 2 (50.0%) |
| Wholesale Trade | 0 (0.0%) | 8 (100.0%) |
| Retail Trade | 9 (90.0%) | 1 (10.0%) |
| Transportation & Warehousing | 0 (0.0%) | 0 (0.0%) |
| Utilities | 0 (0.0%) | 0 (0.0%) |
| Information | 0 (0.0%) | 0 (0.0%) |
| Finance & Insurance | 0 (0.0%) | 0 (0.0%) |
| Real Estate, Rental & Leasing | 0 (0.0%) | 0 (0.0%) |
| Professional & Scientific | 0 (0.0%) | 0 (0.0%) |
| Enterprise Management | 0 (0.0%) | 0 (0.0%) |
| Administrative & Support | 1 (20.0%) | 4 (80.0%) |
| Educational Services | 0 (0.0%) | 1 (100.0%) |
| Health Care & Social Assistance | 2 (14.3%) | 12 (85.7%) |
| Arts, Entertainment & Recreation | 0 (0.0%) | 0 (0.0%) |
| Accommodation & Food Services | 2 (100.0%) | 0 (0.0%) |
| Public Administration | 4 (100.0%) | 0 (0.0%) |
| Total | 29 (50.9%) | 28 (49.1%) |
Education in St Leo
School Enrollment in St Leo
The most common levels of schooling among the 3 students in St Leo are high school (2 | 66.7%), and elementary school (1 | 33.3%).
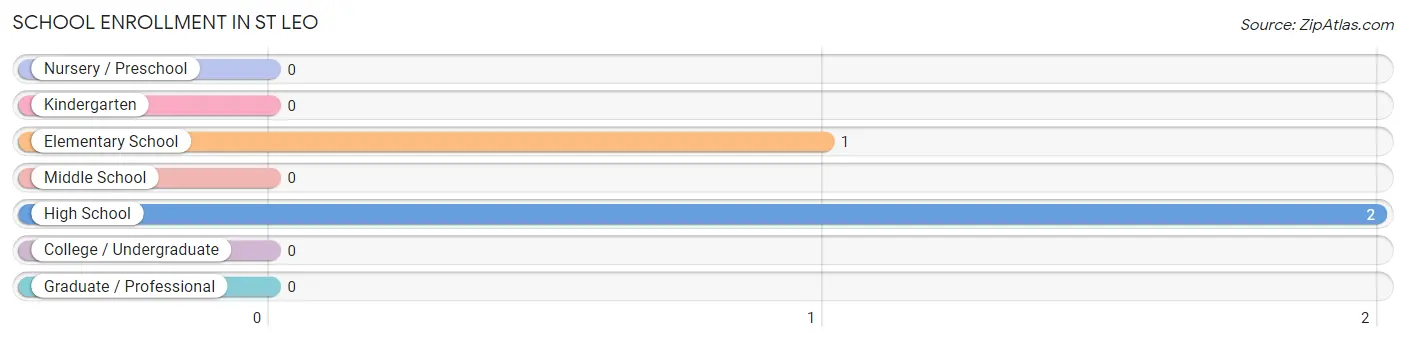
| School Level | # Students | % Students |
| Nursery / Preschool | 0 | 0.0% |
| Kindergarten | 0 | 0.0% |
| Elementary School | 1 | 33.3% |
| Middle School | 0 | 0.0% |
| High School | 2 | 66.7% |
| College / Undergraduate | 0 | 0.0% |
| Graduate / Professional | 0 | 0.0% |
| Total | 3 | 100.0% |
School Enrollment by Age by Funding Source in St Leo
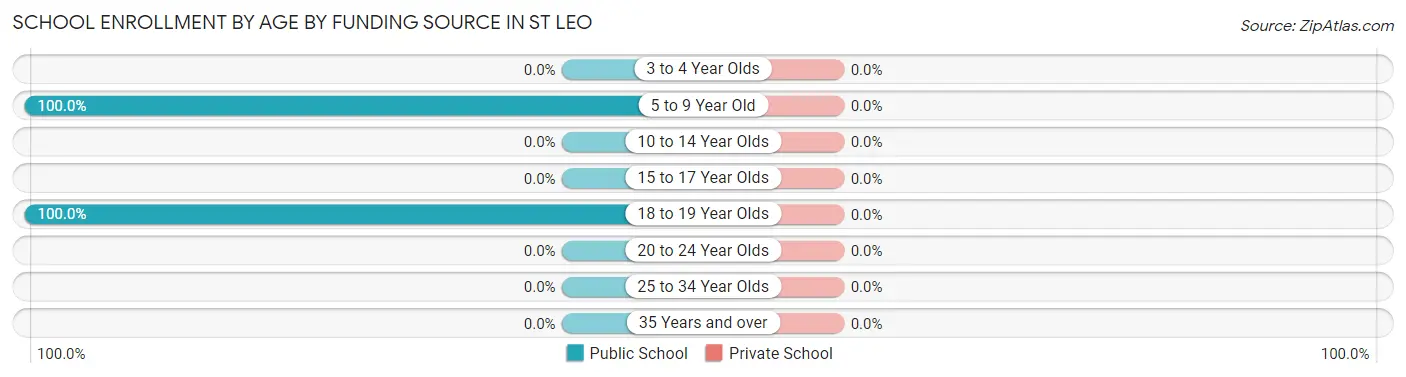
| Age Bracket | Public School | Private School |
| 3 to 4 Year Olds | 0 (0.0%) | 0 (0.0%) |
| 5 to 9 Year Old | 1 (100.0%) | 0 (0.0%) |
| 10 to 14 Year Olds | 0 (0.0%) | 0 (0.0%) |
| 15 to 17 Year Olds | 0 (0.0%) | 0 (0.0%) |
| 18 to 19 Year Olds | 2 (100.0%) | 0 (0.0%) |
| 20 to 24 Year Olds | 0 (0.0%) | 0 (0.0%) |
| 25 to 34 Year Olds | 0 (0.0%) | 0 (0.0%) |
| 35 Years and over | 0 (0.0%) | 0 (0.0%) |
| Total | 3 (100.0%) | 0 (0.0%) |
Educational Attainment by Field of Study in St Leo
Bio, nature & agricultural (1 | 33.3%), science & technology (1 | 33.3%), and liberal arts & history (1 | 33.3%) are the most common fields of study among 3 individuals in St Leo who have obtained a bachelor's degree or higher.
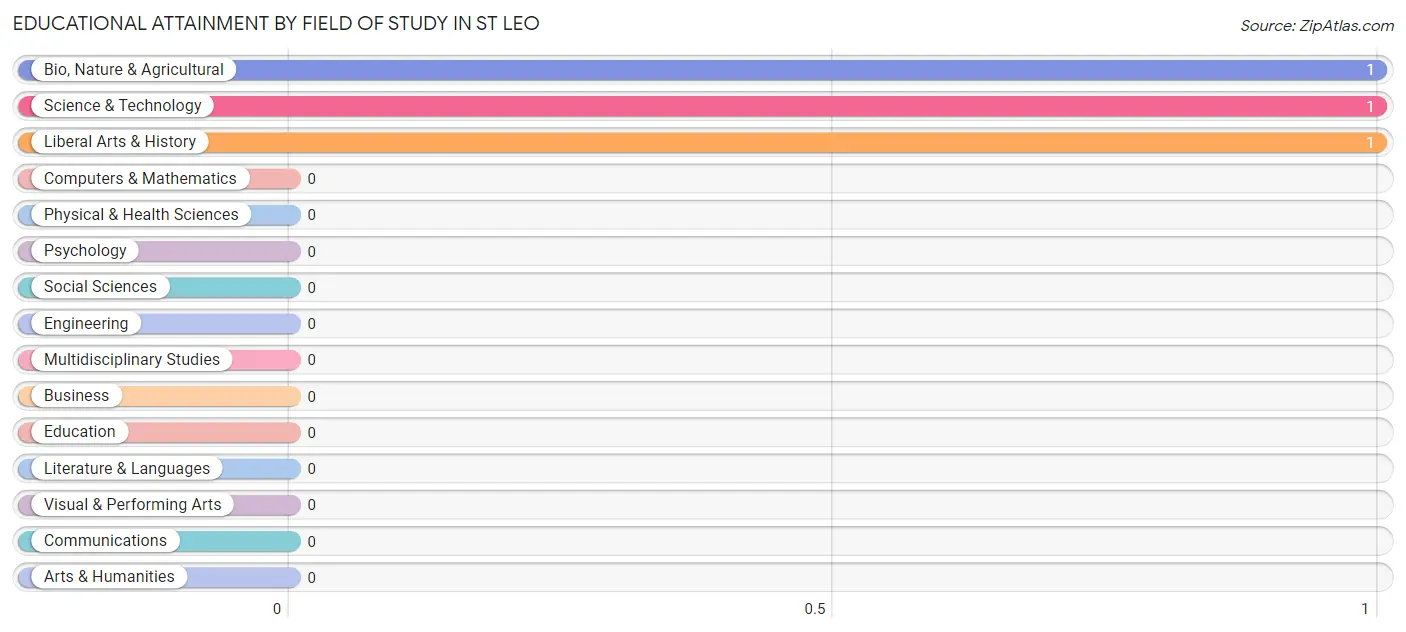
| Field of Study | # Graduates | % Graduates |
| Computers & Mathematics | 0 | 0.0% |
| Bio, Nature & Agricultural | 1 | 33.3% |
| Physical & Health Sciences | 0 | 0.0% |
| Psychology | 0 | 0.0% |
| Social Sciences | 0 | 0.0% |
| Engineering | 0 | 0.0% |
| Multidisciplinary Studies | 0 | 0.0% |
| Science & Technology | 1 | 33.3% |
| Business | 0 | 0.0% |
| Education | 0 | 0.0% |
| Literature & Languages | 0 | 0.0% |
| Liberal Arts & History | 1 | 33.3% |
| Visual & Performing Arts | 0 | 0.0% |
| Communications | 0 | 0.0% |
| Arts & Humanities | 0 | 0.0% |
| Total | 3 | 100.0% |
Transportation & Commute in St Leo
Vehicle Availability by Sex in St Leo
The most prevalent vehicle ownership categories in St Leo are males with 3 vehicles (11, accounting for 37.9%) and females with 3 vehicles (13, making up 39.3%).
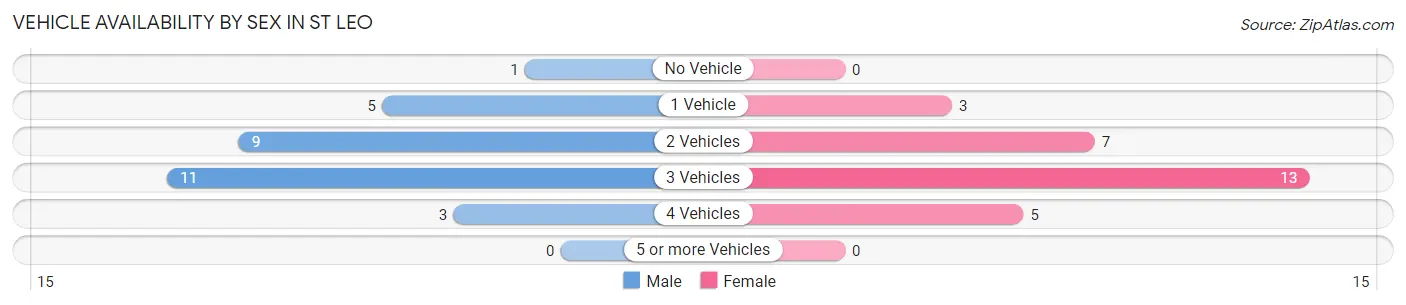
| Vehicles Available | Male | Female |
| No Vehicle | 1 (3.5%) | 0 (0.0%) |
| 1 Vehicle | 5 (17.2%) | 3 (10.7%) |
| 2 Vehicles | 9 (31.0%) | 7 (25.0%) |
| 3 Vehicles | 11 (37.9%) | 13 (46.4%) |
| 4 Vehicles | 3 (10.3%) | 5 (17.9%) |
| 5 or more Vehicles | 0 (0.0%) | 0 (0.0%) |
| Total | 29 (100.0%) | 28 (100.0%) |
Commute Time in St Leo
The most frequently occuring commute durations in St Leo are 45 to 59 minutes (15 commuters, 26.3%), 15 to 19 minutes (10 commuters, 17.5%), and less than 5 minutes (7 commuters, 12.3%).
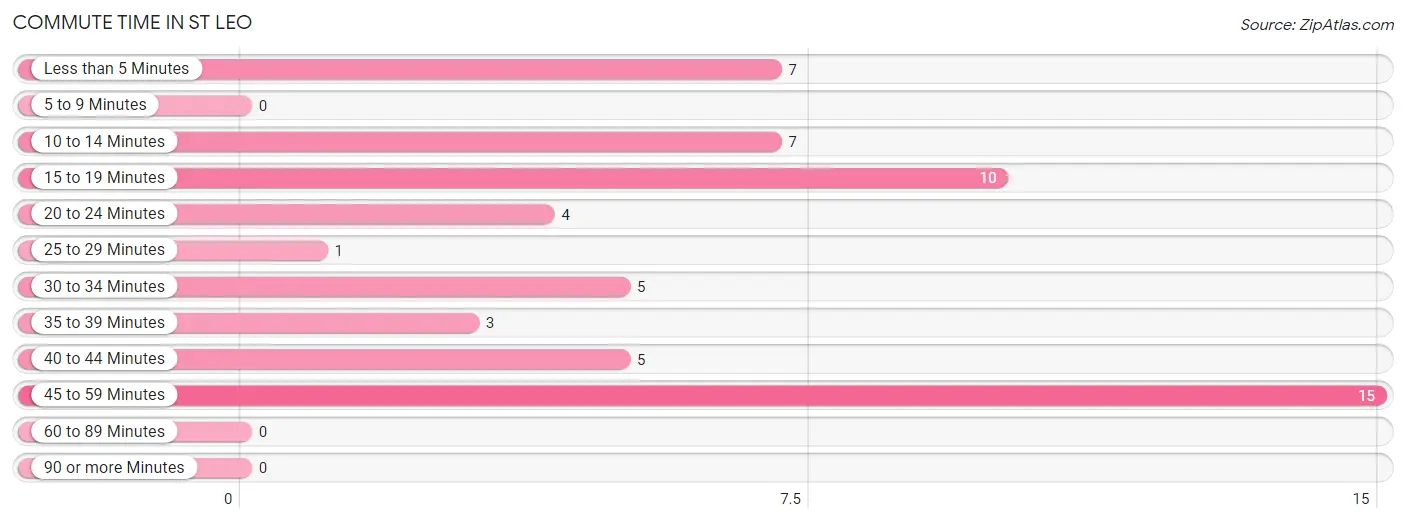
| Commute Time | # Commuters | % Commuters |
| Less than 5 Minutes | 7 | 12.3% |
| 5 to 9 Minutes | 0 | 0.0% |
| 10 to 14 Minutes | 7 | 12.3% |
| 15 to 19 Minutes | 10 | 17.5% |
| 20 to 24 Minutes | 4 | 7.0% |
| 25 to 29 Minutes | 1 | 1.8% |
| 30 to 34 Minutes | 5 | 8.8% |
| 35 to 39 Minutes | 3 | 5.3% |
| 40 to 44 Minutes | 5 | 8.8% |
| 45 to 59 Minutes | 15 | 26.3% |
| 60 to 89 Minutes | 0 | 0.0% |
| 90 or more Minutes | 0 | 0.0% |
Commute Time by Sex in St Leo
The most common commute times in St Leo are 15 to 19 minutes (8 commuters, 27.6%) for males and 45 to 59 minutes (7 commuters, 25.0%) for females.
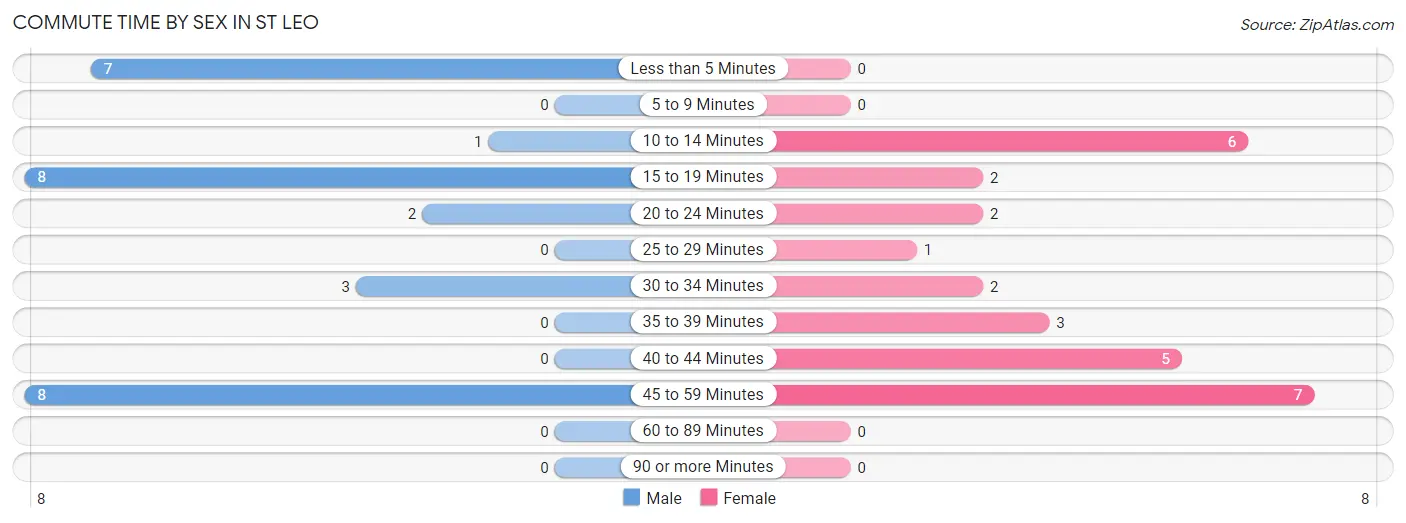
| Commute Time | Male | Female |
| Less than 5 Minutes | 7 (24.1%) | 0 (0.0%) |
| 5 to 9 Minutes | 0 (0.0%) | 0 (0.0%) |
| 10 to 14 Minutes | 1 (3.5%) | 6 (21.4%) |
| 15 to 19 Minutes | 8 (27.6%) | 2 (7.1%) |
| 20 to 24 Minutes | 2 (6.9%) | 2 (7.1%) |
| 25 to 29 Minutes | 0 (0.0%) | 1 (3.6%) |
| 30 to 34 Minutes | 3 (10.3%) | 2 (7.1%) |
| 35 to 39 Minutes | 0 (0.0%) | 3 (10.7%) |
| 40 to 44 Minutes | 0 (0.0%) | 5 (17.9%) |
| 45 to 59 Minutes | 8 (27.6%) | 7 (25.0%) |
| 60 to 89 Minutes | 0 (0.0%) | 0 (0.0%) |
| 90 or more Minutes | 0 (0.0%) | 0 (0.0%) |
Time of Departure to Work by Sex in St Leo
The most frequent times of departure to work in St Leo are 6:30 AM to 6:59 AM (10, 34.5%) for males and 7:00 AM to 7:29 AM (8, 28.6%) for females.
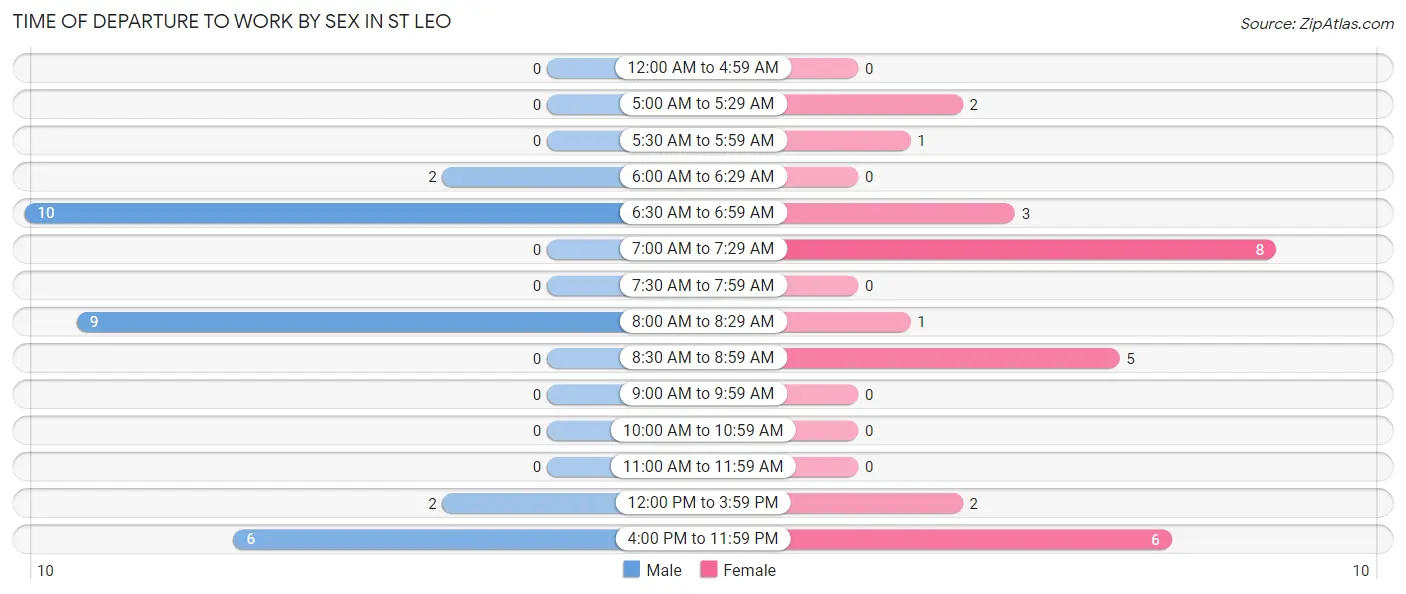
| Time of Departure | Male | Female |
| 12:00 AM to 4:59 AM | 0 (0.0%) | 0 (0.0%) |
| 5:00 AM to 5:29 AM | 0 (0.0%) | 2 (7.1%) |
| 5:30 AM to 5:59 AM | 0 (0.0%) | 1 (3.6%) |
| 6:00 AM to 6:29 AM | 2 (6.9%) | 0 (0.0%) |
| 6:30 AM to 6:59 AM | 10 (34.5%) | 3 (10.7%) |
| 7:00 AM to 7:29 AM | 0 (0.0%) | 8 (28.6%) |
| 7:30 AM to 7:59 AM | 0 (0.0%) | 0 (0.0%) |
| 8:00 AM to 8:29 AM | 9 (31.0%) | 1 (3.6%) |
| 8:30 AM to 8:59 AM | 0 (0.0%) | 5 (17.9%) |
| 9:00 AM to 9:59 AM | 0 (0.0%) | 0 (0.0%) |
| 10:00 AM to 10:59 AM | 0 (0.0%) | 0 (0.0%) |
| 11:00 AM to 11:59 AM | 0 (0.0%) | 0 (0.0%) |
| 12:00 PM to 3:59 PM | 2 (6.9%) | 2 (7.1%) |
| 4:00 PM to 11:59 PM | 6 (20.7%) | 6 (21.4%) |
| Total | 29 (100.0%) | 28 (100.0%) |
Housing Occupancy in St Leo
Occupancy by Ownership in St Leo
Of the total 72 dwellings in St Leo, owner-occupied units account for 47 (65.3%), while renter-occupied units make up 25 (34.7%).
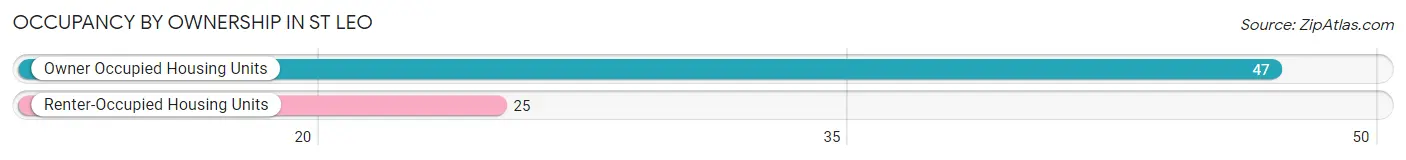
| Occupancy | # Housing Units | % Housing Units |
| Owner Occupied Housing Units | 47 | 65.3% |
| Renter-Occupied Housing Units | 25 | 34.7% |
| Total Occupied Housing Units | 72 | 100.0% |
Occupancy by Household Size in St Leo
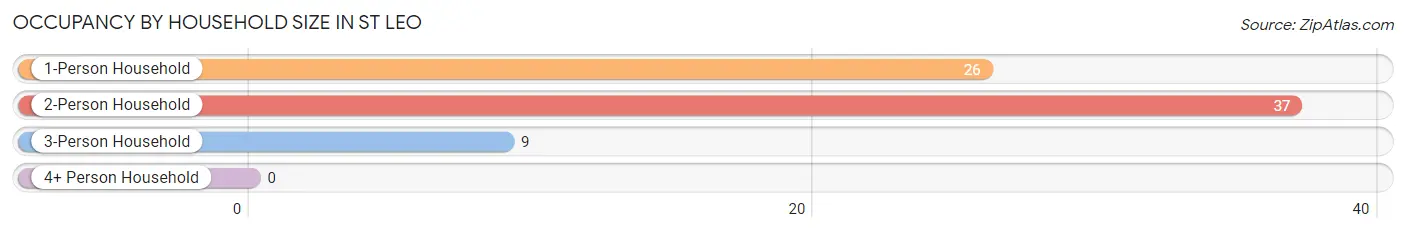
| Household Size | # Housing Units | % Housing Units |
| 1-Person Household | 26 | 36.1% |
| 2-Person Household | 37 | 51.4% |
| 3-Person Household | 9 | 12.5% |
| 4+ Person Household | 0 | 0.0% |
| Total Housing Units | 72 | 100.0% |
Occupancy by Ownership by Household Size in St Leo
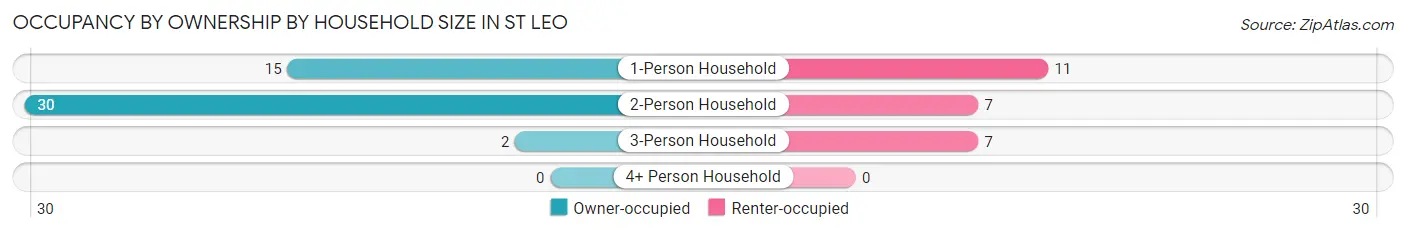
| Household Size | Owner-occupied | Renter-occupied |
| 1-Person Household | 15 (57.7%) | 11 (42.3%) |
| 2-Person Household | 30 (81.1%) | 7 (18.9%) |
| 3-Person Household | 2 (22.2%) | 7 (77.8%) |
| 4+ Person Household | 0 (0.0%) | 0 (0.0%) |
| Total Housing Units | 47 (65.3%) | 25 (34.7%) |
Occupancy by Educational Attainment in St Leo
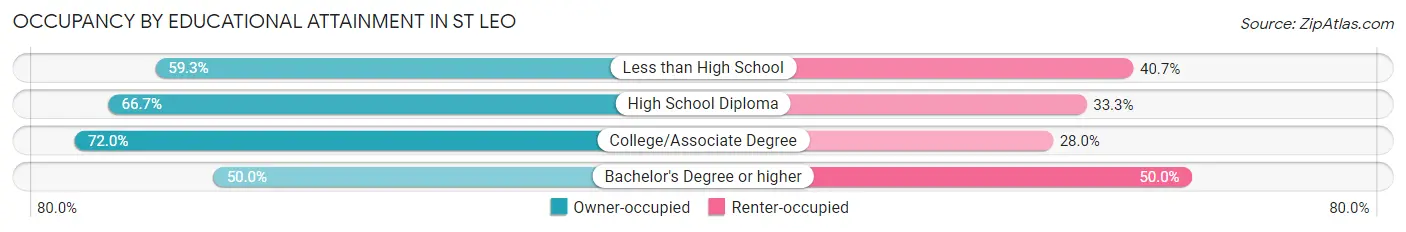
| Household Size | Owner-occupied | Renter-occupied |
| Less than High School | 16 (59.3%) | 11 (40.7%) |
| High School Diploma | 12 (66.7%) | 6 (33.3%) |
| College/Associate Degree | 18 (72.0%) | 7 (28.0%) |
| Bachelor's Degree or higher | 1 (50.0%) | 1 (50.0%) |
Occupancy by Age of Householder in St Leo
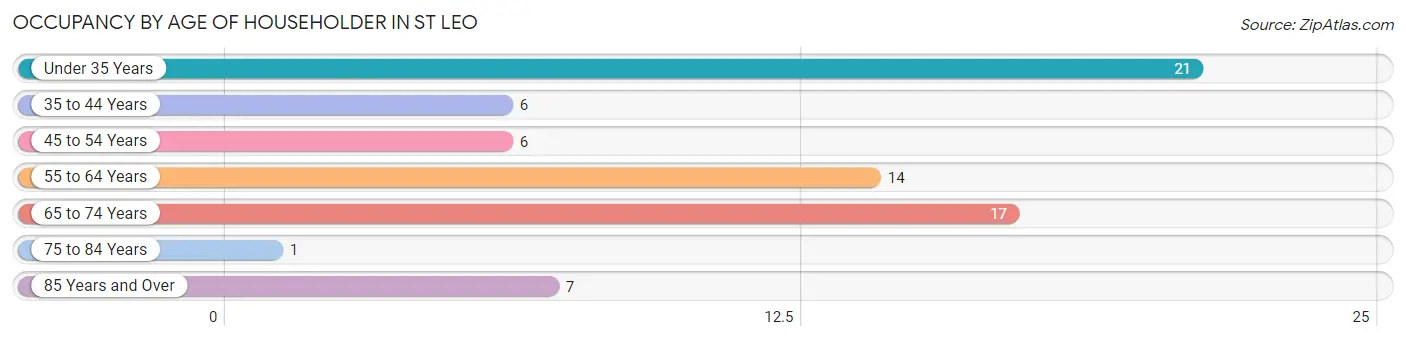
| Age Bracket | # Households | % Households |
| Under 35 Years | 21 | 29.2% |
| 35 to 44 Years | 6 | 8.3% |
| 45 to 54 Years | 6 | 8.3% |
| 55 to 64 Years | 14 | 19.4% |
| 65 to 74 Years | 17 | 23.6% |
| 75 to 84 Years | 1 | 1.4% |
| 85 Years and Over | 7 | 9.7% |
| Total | 72 | 100.0% |
Housing Finances in St Leo
Median Income by Occupancy in St Leo
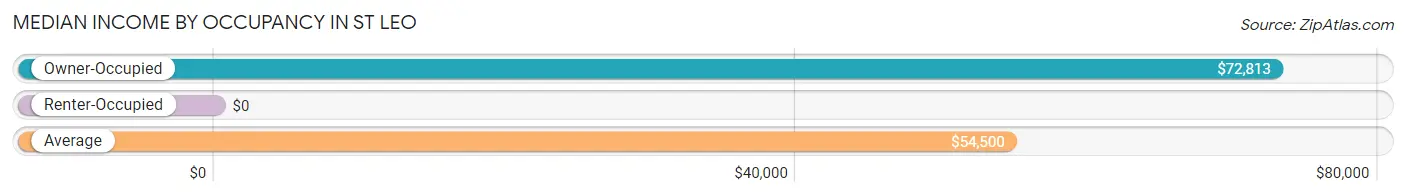
| Occupancy Type | # Households | Median Income |
| Owner-Occupied | 47 (65.3%) | $72,813 |
| Renter-Occupied | 25 (34.7%) | $0 |
| Average | 72 (100.0%) | $54,500 |
Occupancy by Householder Income Bracket in St Leo
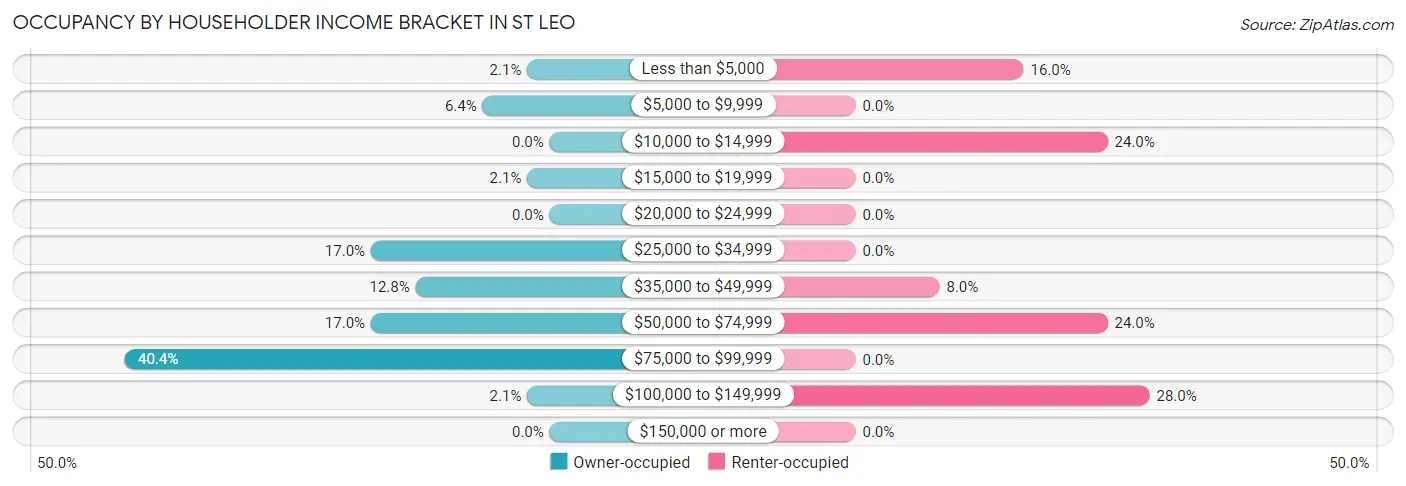
| Income Bracket | Owner-occupied | Renter-occupied |
| Less than $5,000 | 1 (2.1%) | 4 (16.0%) |
| $5,000 to $9,999 | 3 (6.4%) | 0 (0.0%) |
| $10,000 to $14,999 | 0 (0.0%) | 6 (24.0%) |
| $15,000 to $19,999 | 1 (2.1%) | 0 (0.0%) |
| $20,000 to $24,999 | 0 (0.0%) | 0 (0.0%) |
| $25,000 to $34,999 | 8 (17.0%) | 0 (0.0%) |
| $35,000 to $49,999 | 6 (12.8%) | 2 (8.0%) |
| $50,000 to $74,999 | 8 (17.0%) | 6 (24.0%) |
| $75,000 to $99,999 | 19 (40.4%) | 0 (0.0%) |
| $100,000 to $149,999 | 1 (2.1%) | 7 (28.0%) |
| $150,000 or more | 0 (0.0%) | 0 (0.0%) |
| Total | 47 (100.0%) | 25 (100.0%) |
Monthly Housing Cost Tiers in St Leo
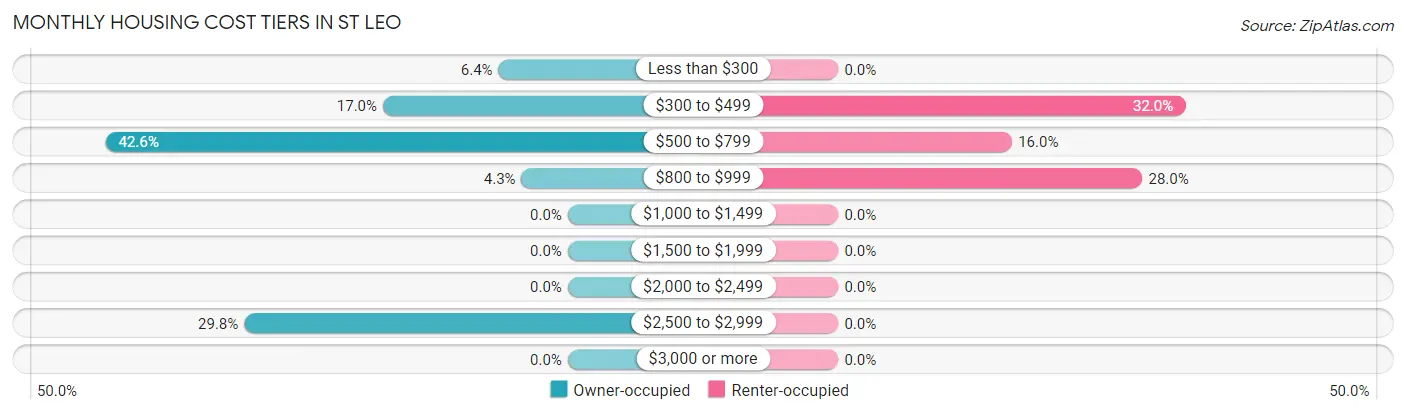
| Monthly Cost | Owner-occupied | Renter-occupied |
| Less than $300 | 3 (6.4%) | 0 (0.0%) |
| $300 to $499 | 8 (17.0%) | 8 (32.0%) |
| $500 to $799 | 20 (42.5%) | 4 (16.0%) |
| $800 to $999 | 2 (4.3%) | 7 (28.0%) |
| $1,000 to $1,499 | 0 (0.0%) | 0 (0.0%) |
| $1,500 to $1,999 | 0 (0.0%) | 0 (0.0%) |
| $2,000 to $2,499 | 0 (0.0%) | 0 (0.0%) |
| $2,500 to $2,999 | 14 (29.8%) | 0 (0.0%) |
| $3,000 or more | 0 (0.0%) | 0 (0.0%) |
| Total | 47 (100.0%) | 25 (100.0%) |
Physical Housing Characteristics in St Leo
Housing Structures in St Leo
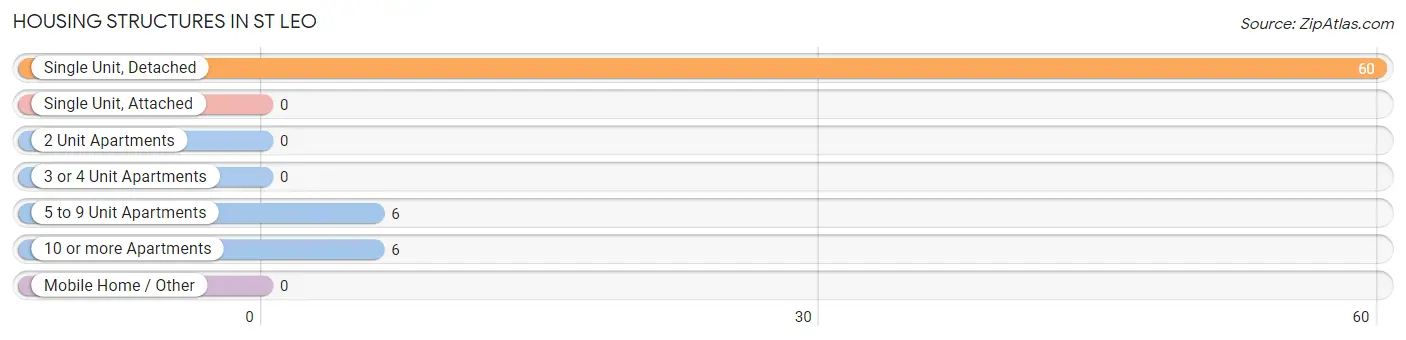
| Structure Type | # Housing Units | % Housing Units |
| Single Unit, Detached | 60 | 83.3% |
| Single Unit, Attached | 0 | 0.0% |
| 2 Unit Apartments | 0 | 0.0% |
| 3 or 4 Unit Apartments | 0 | 0.0% |
| 5 to 9 Unit Apartments | 6 | 8.3% |
| 10 or more Apartments | 6 | 8.3% |
| Mobile Home / Other | 0 | 0.0% |
| Total | 72 | 100.0% |
Housing Structures by Occupancy in St Leo
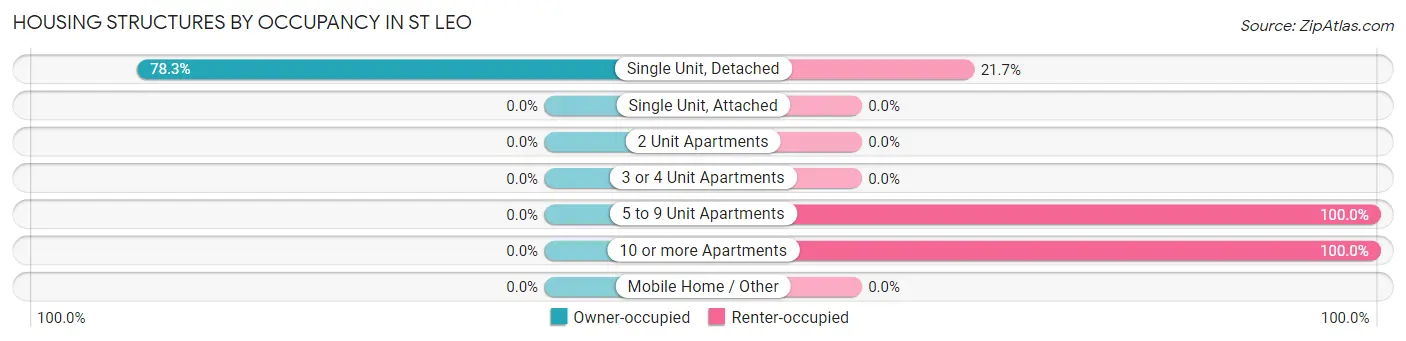
| Structure Type | Owner-occupied | Renter-occupied |
| Single Unit, Detached | 47 (78.3%) | 13 (21.7%) |
| Single Unit, Attached | 0 (0.0%) | 0 (0.0%) |
| 2 Unit Apartments | 0 (0.0%) | 0 (0.0%) |
| 3 or 4 Unit Apartments | 0 (0.0%) | 0 (0.0%) |
| 5 to 9 Unit Apartments | 0 (0.0%) | 6 (100.0%) |
| 10 or more Apartments | 0 (0.0%) | 6 (100.0%) |
| Mobile Home / Other | 0 (0.0%) | 0 (0.0%) |
| Total | 47 (65.3%) | 25 (34.7%) |
Housing Structures by Number of Rooms in St Leo
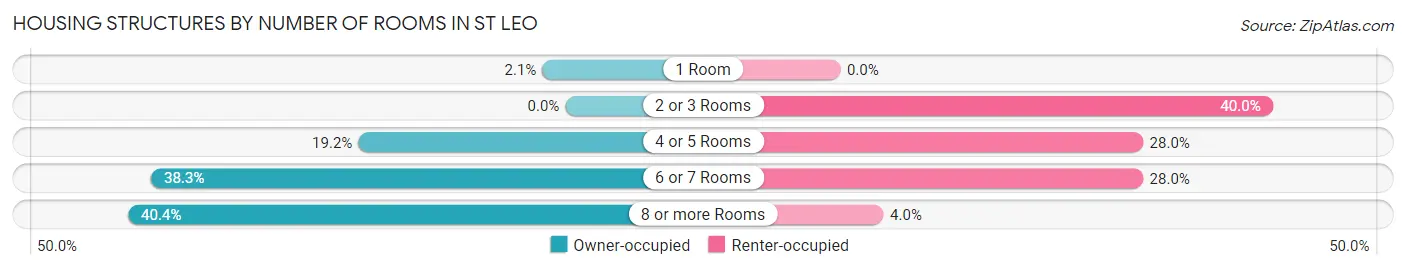
| Number of Rooms | Owner-occupied | Renter-occupied |
| 1 Room | 1 (2.1%) | 0 (0.0%) |
| 2 or 3 Rooms | 0 (0.0%) | 10 (40.0%) |
| 4 or 5 Rooms | 9 (19.2%) | 7 (28.0%) |
| 6 or 7 Rooms | 18 (38.3%) | 7 (28.0%) |
| 8 or more Rooms | 19 (40.4%) | 1 (4.0%) |
| Total | 47 (100.0%) | 25 (100.0%) |
Housing Structure by Heating Type in St Leo
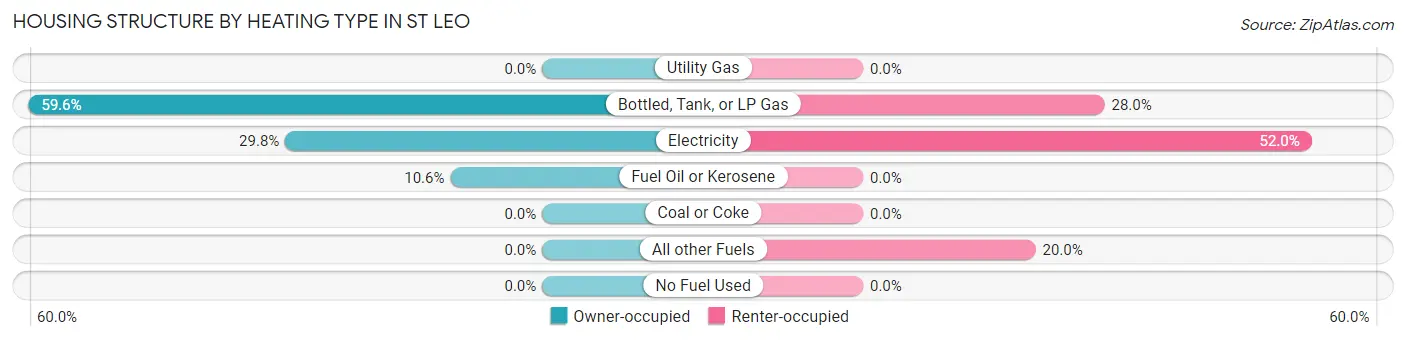
| Heating Type | Owner-occupied | Renter-occupied |
| Utility Gas | 0 (0.0%) | 0 (0.0%) |
| Bottled, Tank, or LP Gas | 28 (59.6%) | 7 (28.0%) |
| Electricity | 14 (29.8%) | 13 (52.0%) |
| Fuel Oil or Kerosene | 5 (10.6%) | 0 (0.0%) |
| Coal or Coke | 0 (0.0%) | 0 (0.0%) |
| All other Fuels | 0 (0.0%) | 5 (20.0%) |
| No Fuel Used | 0 (0.0%) | 0 (0.0%) |
| Total | 47 (100.0%) | 25 (100.0%) |
Household Vehicle Usage in St Leo
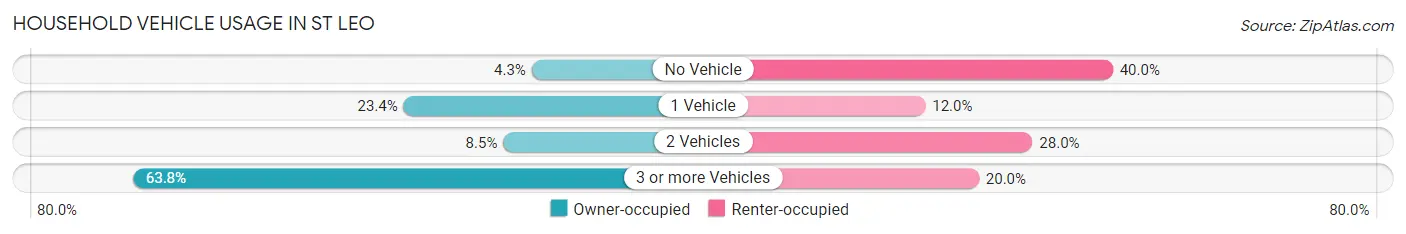
| Vehicles per Household | Owner-occupied | Renter-occupied |
| No Vehicle | 2 (4.3%) | 10 (40.0%) |
| 1 Vehicle | 11 (23.4%) | 3 (12.0%) |
| 2 Vehicles | 4 (8.5%) | 7 (28.0%) |
| 3 or more Vehicles | 30 (63.8%) | 5 (20.0%) |
| Total | 47 (100.0%) | 25 (100.0%) |
Real Estate & Mortgages in St Leo
Real Estate and Mortgage Overview in St Leo
| Characteristic | Without Mortgage | With Mortgage |
| Housing Units | 22 | 25 |
| Median Property Value | $35,000 | $0 |
| Median Household Income | $71,250 | $0 |
| Monthly Housing Costs | $520 | $0 |
| Real Estate Taxes | $370 | $0 |
Property Value by Mortgage Status in St Leo
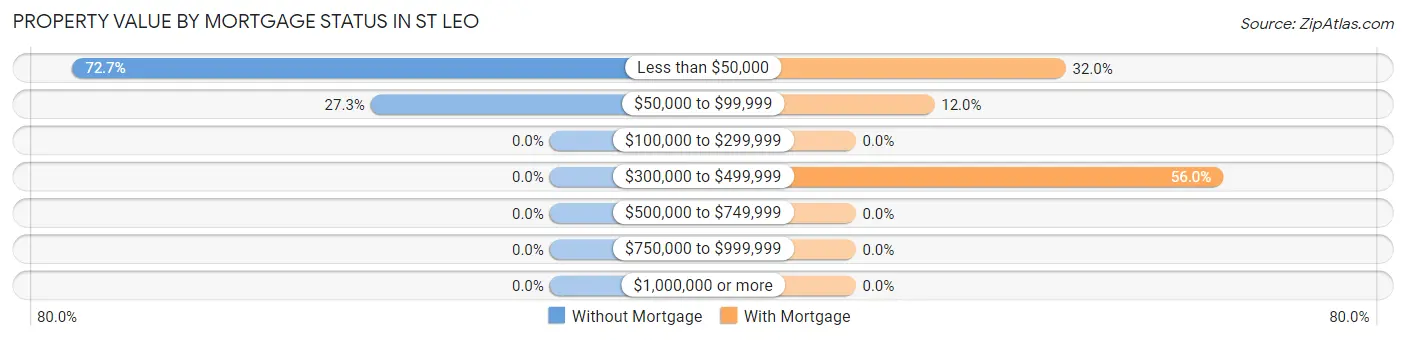
| Property Value | Without Mortgage | With Mortgage |
| Less than $50,000 | 16 (72.7%) | 8 (32.0%) |
| $50,000 to $99,999 | 6 (27.3%) | 3 (12.0%) |
| $100,000 to $299,999 | 0 (0.0%) | 0 (0.0%) |
| $300,000 to $499,999 | 0 (0.0%) | 14 (56.0%) |
| $500,000 to $749,999 | 0 (0.0%) | 0 (0.0%) |
| $750,000 to $999,999 | 0 (0.0%) | 0 (0.0%) |
| $1,000,000 or more | 0 (0.0%) | 0 (0.0%) |
| Total | 22 (100.0%) | 25 (100.0%) |
Household Income by Mortgage Status in St Leo
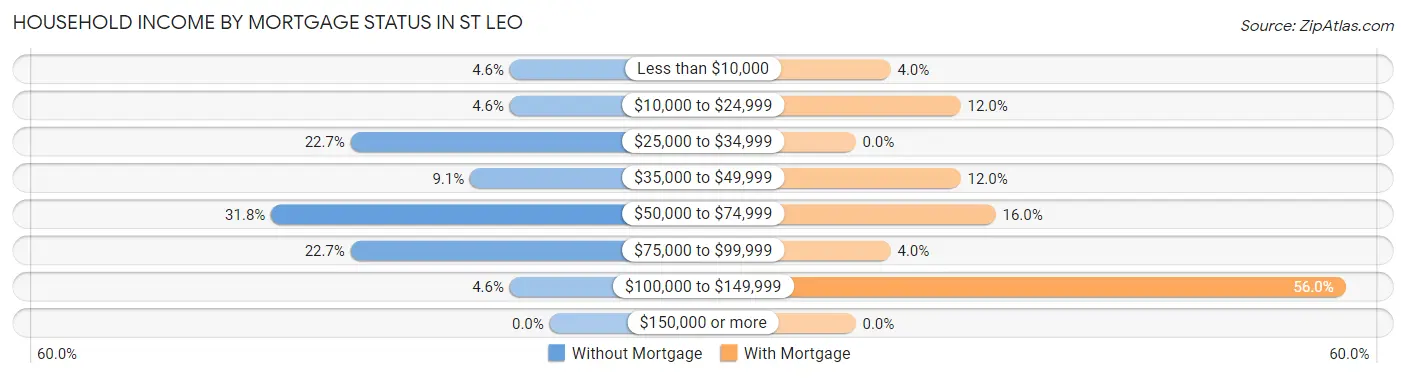
| Household Income | Without Mortgage | With Mortgage |
| Less than $10,000 | 1 (4.5%) | 1 (4.0%) |
| $10,000 to $24,999 | 1 (4.5%) | 3 (12.0%) |
| $25,000 to $34,999 | 5 (22.7%) | 0 (0.0%) |
| $35,000 to $49,999 | 2 (9.1%) | 3 (12.0%) |
| $50,000 to $74,999 | 7 (31.8%) | 4 (16.0%) |
| $75,000 to $99,999 | 5 (22.7%) | 1 (4.0%) |
| $100,000 to $149,999 | 1 (4.5%) | 14 (56.0%) |
| $150,000 or more | 0 (0.0%) | 0 (0.0%) |
| Total | 22 (100.0%) | 25 (100.0%) |
Property Value to Household Income Ratio in St Leo
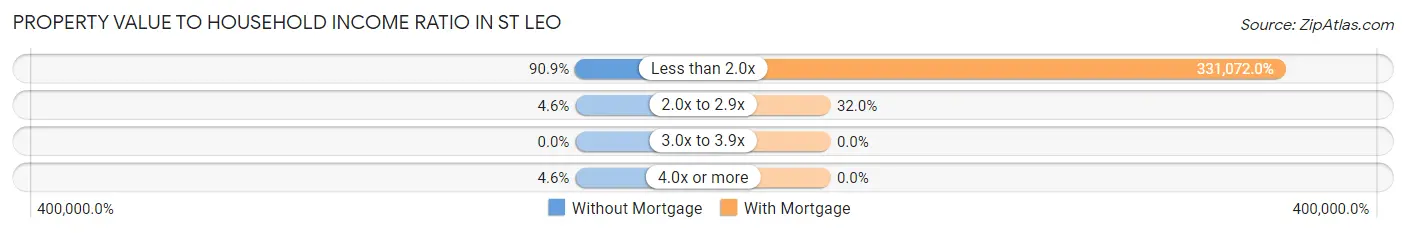
| Value-to-Income Ratio | Without Mortgage | With Mortgage |
| Less than 2.0x | 20 (90.9%) | 82,768 (331,072.0%) |
| 2.0x to 2.9x | 1 (4.5%) | 8 (32.0%) |
| 3.0x to 3.9x | 0 (0.0%) | 0 (0.0%) |
| 4.0x or more | 1 (4.5%) | 0 (0.0%) |
| Total | 22 (100.0%) | 25 (100.0%) |
Real Estate Taxes by Mortgage Status in St Leo
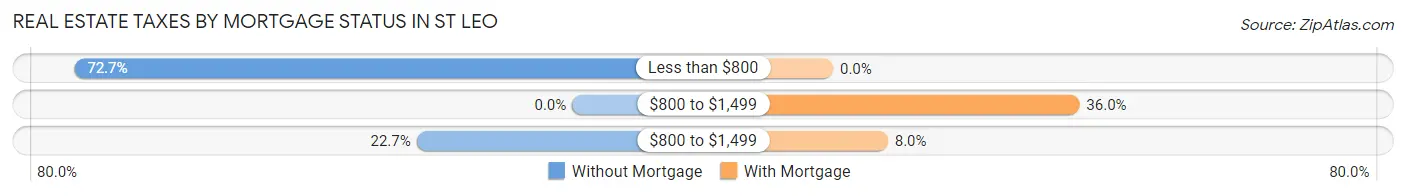
| Property Taxes | Without Mortgage | With Mortgage |
| Less than $800 | 16 (72.7%) | 0 (0.0%) |
| $800 to $1,499 | 0 (0.0%) | 9 (36.0%) |
| $800 to $1,499 | 5 (22.7%) | 2 (8.0%) |
| Total | 22 (100.0%) | 25 (100.0%) |
Health & Disability in St Leo
Health Insurance Coverage by Age in St Leo
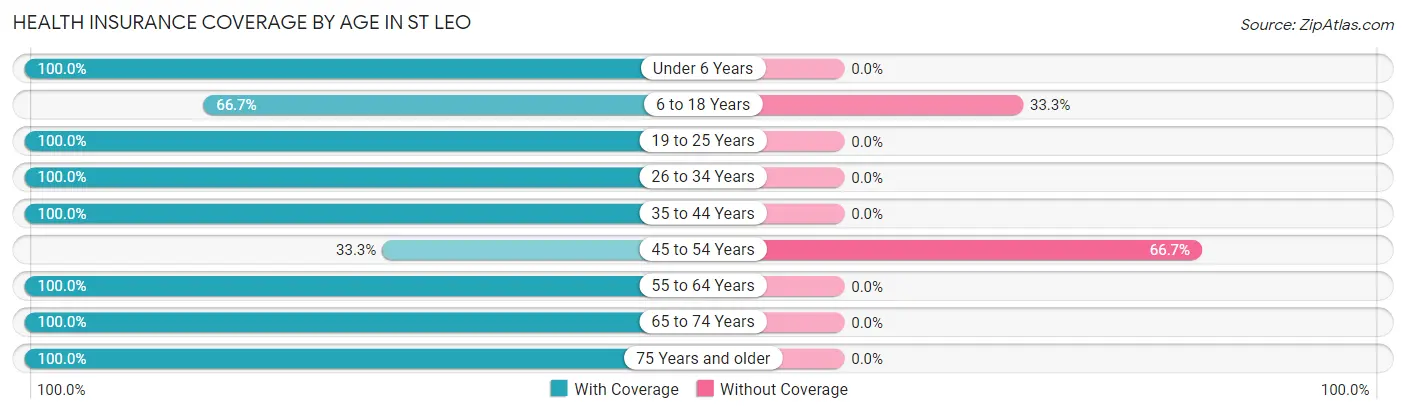
| Age Bracket | With Coverage | Without Coverage |
| Under 6 Years | 16 (100.0%) | 0 (0.0%) |
| 6 to 18 Years | 2 (66.7%) | 1 (33.3%) |
| 19 to 25 Years | 10 (100.0%) | 0 (0.0%) |
| 26 to 34 Years | 28 (100.0%) | 0 (0.0%) |
| 35 to 44 Years | 6 (100.0%) | 0 (0.0%) |
| 45 to 54 Years | 2 (33.3%) | 4 (66.7%) |
| 55 to 64 Years | 19 (100.0%) | 0 (0.0%) |
| 65 to 74 Years | 46 (100.0%) | 0 (0.0%) |
| 75 Years and older | 17 (100.0%) | 0 (0.0%) |
| Total | 146 (96.7%) | 5 (3.3%) |
Health Insurance Coverage by Citizenship Status in St Leo
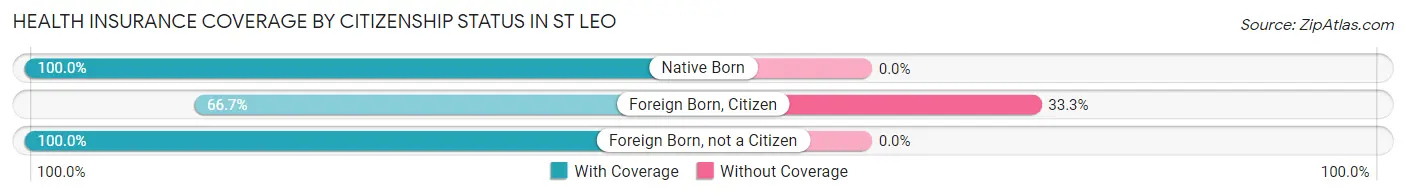
| Citizenship Status | With Coverage | Without Coverage |
| Native Born | 16 (100.0%) | 0 (0.0%) |
| Foreign Born, Citizen | 2 (66.7%) | 1 (33.3%) |
| Foreign Born, not a Citizen | 10 (100.0%) | 0 (0.0%) |
Health Insurance Coverage by Household Income in St Leo
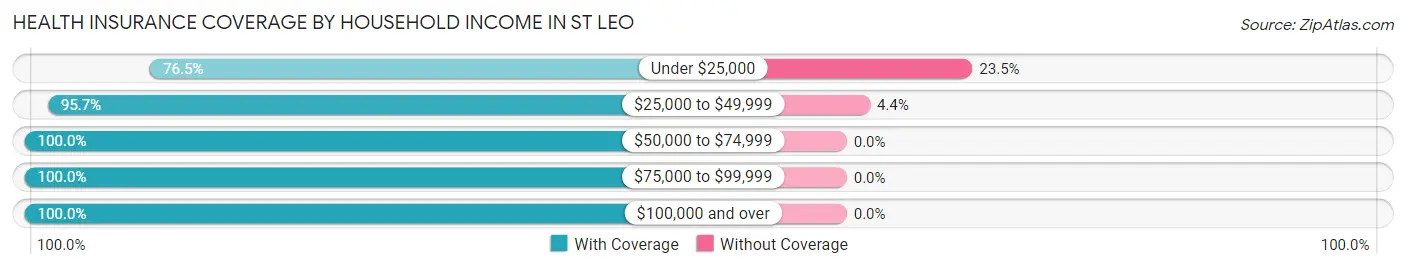
| Household Income | With Coverage | Without Coverage |
| Under $25,000 | 13 (76.5%) | 4 (23.5%) |
| $25,000 to $49,999 | 22 (95.7%) | 1 (4.3%) |
| $50,000 to $74,999 | 27 (100.0%) | 0 (0.0%) |
| $75,000 to $99,999 | 52 (100.0%) | 0 (0.0%) |
| $100,000 and over | 32 (100.0%) | 0 (0.0%) |
Public vs Private Health Insurance Coverage by Age in St Leo
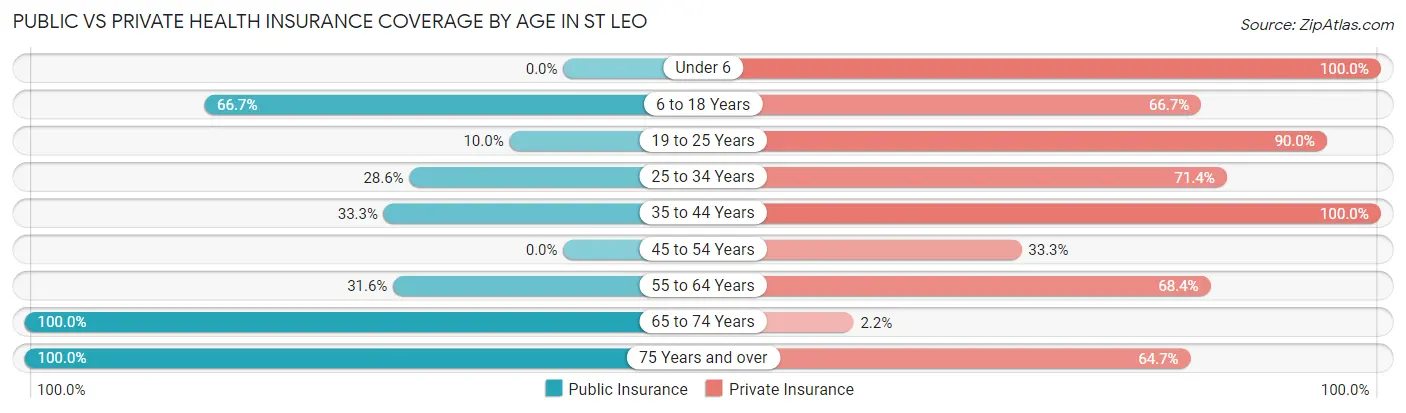
| Age Bracket | Public Insurance | Private Insurance |
| Under 6 | 0 (0.0%) | 16 (100.0%) |
| 6 to 18 Years | 2 (66.7%) | 2 (66.7%) |
| 19 to 25 Years | 1 (10.0%) | 9 (90.0%) |
| 25 to 34 Years | 8 (28.6%) | 20 (71.4%) |
| 35 to 44 Years | 2 (33.3%) | 6 (100.0%) |
| 45 to 54 Years | 0 (0.0%) | 2 (33.3%) |
| 55 to 64 Years | 6 (31.6%) | 13 (68.4%) |
| 65 to 74 Years | 46 (100.0%) | 1 (2.2%) |
| 75 Years and over | 17 (100.0%) | 11 (64.7%) |
| Total | 82 (54.3%) | 80 (53.0%) |
Disability Status by Sex by Age in St Leo
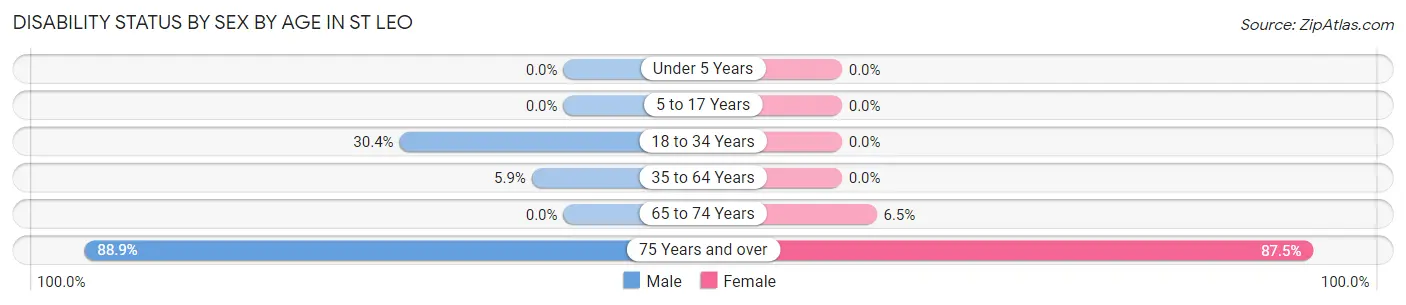
| Age Bracket | Male | Female |
| Under 5 Years | 0 (0.0%) | 0 (0.0%) |
| 5 to 17 Years | 0 (0.0%) | 0 (0.0%) |
| 18 to 34 Years | 7 (30.4%) | 0 (0.0%) |
| 35 to 64 Years | 1 (5.9%) | 0 (0.0%) |
| 65 to 74 Years | 0 (0.0%) | 2 (6.5%) |
| 75 Years and over | 8 (88.9%) | 7 (87.5%) |
Disability Class by Sex by Age in St Leo
Disability Class: Hearing Difficulty
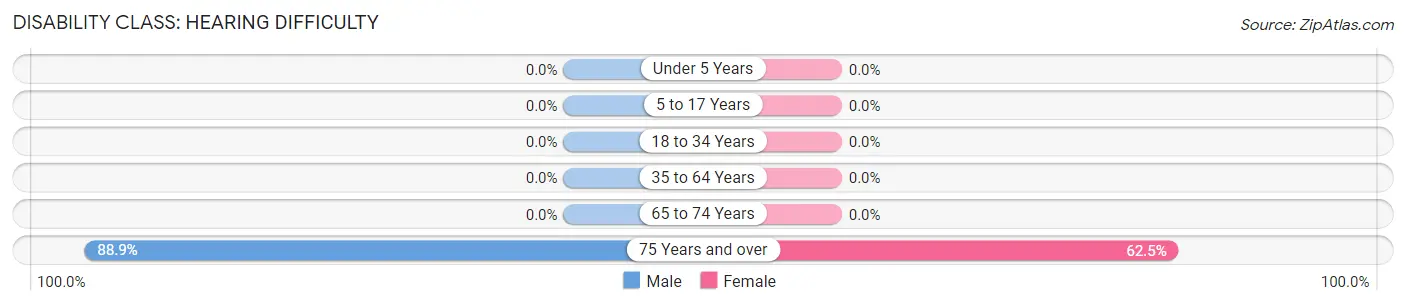
| Age Bracket | Male | Female |
| Under 5 Years | 0 (0.0%) | 0 (0.0%) |
| 5 to 17 Years | 0 (0.0%) | 0 (0.0%) |
| 18 to 34 Years | 0 (0.0%) | 0 (0.0%) |
| 35 to 64 Years | 0 (0.0%) | 0 (0.0%) |
| 65 to 74 Years | 0 (0.0%) | 0 (0.0%) |
| 75 Years and over | 8 (88.9%) | 5 (62.5%) |
Disability Class: Vision Difficulty
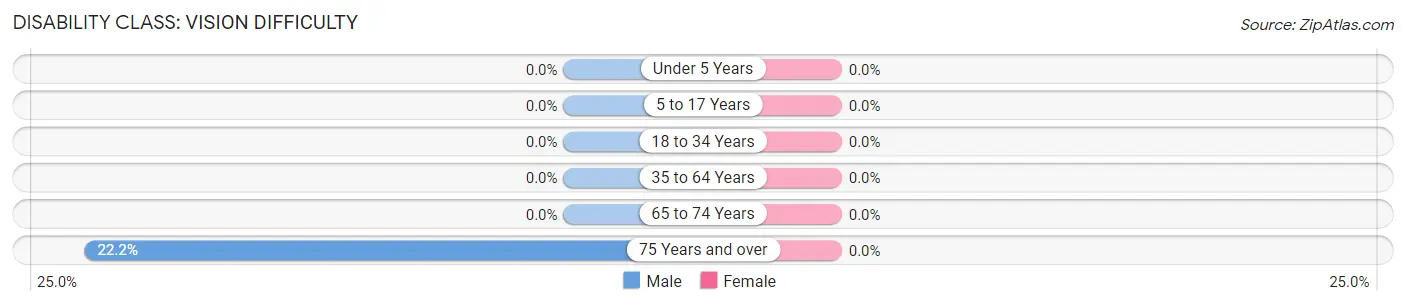
| Age Bracket | Male | Female |
| Under 5 Years | 0 (0.0%) | 0 (0.0%) |
| 5 to 17 Years | 0 (0.0%) | 0 (0.0%) |
| 18 to 34 Years | 0 (0.0%) | 0 (0.0%) |
| 35 to 64 Years | 0 (0.0%) | 0 (0.0%) |
| 65 to 74 Years | 0 (0.0%) | 0 (0.0%) |
| 75 Years and over | 2 (22.2%) | 0 (0.0%) |
Disability Class: Cognitive Difficulty
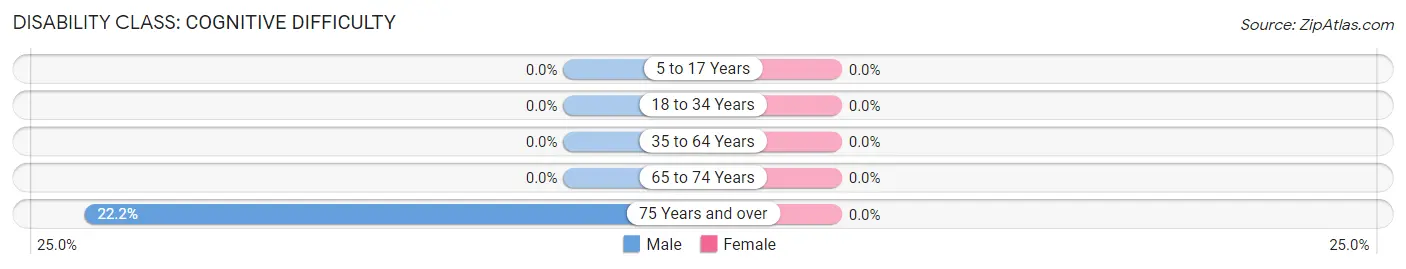
| Age Bracket | Male | Female |
| 5 to 17 Years | 0 (0.0%) | 0 (0.0%) |
| 18 to 34 Years | 0 (0.0%) | 0 (0.0%) |
| 35 to 64 Years | 0 (0.0%) | 0 (0.0%) |
| 65 to 74 Years | 0 (0.0%) | 0 (0.0%) |
| 75 Years and over | 2 (22.2%) | 0 (0.0%) |
Disability Class: Ambulatory Difficulty
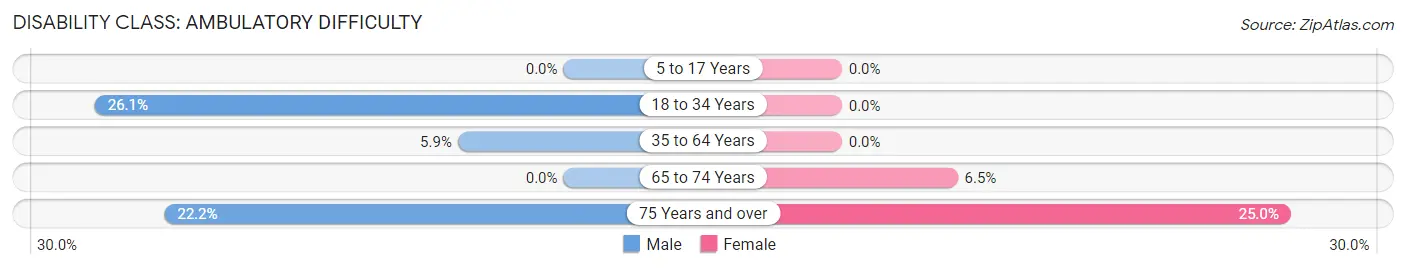
| Age Bracket | Male | Female |
| 5 to 17 Years | 0 (0.0%) | 0 (0.0%) |
| 18 to 34 Years | 6 (26.1%) | 0 (0.0%) |
| 35 to 64 Years | 1 (5.9%) | 0 (0.0%) |
| 65 to 74 Years | 0 (0.0%) | 2 (6.5%) |
| 75 Years and over | 2 (22.2%) | 2 (25.0%) |
Disability Class: Self-Care Difficulty
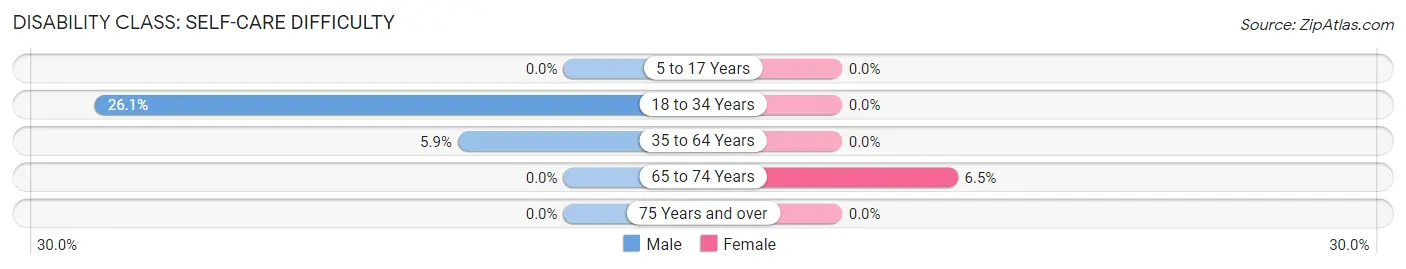
| Age Bracket | Male | Female |
| 5 to 17 Years | 0 (0.0%) | 0 (0.0%) |
| 18 to 34 Years | 6 (26.1%) | 0 (0.0%) |
| 35 to 64 Years | 1 (5.9%) | 0 (0.0%) |
| 65 to 74 Years | 0 (0.0%) | 2 (6.5%) |
| 75 Years and over | 0 (0.0%) | 0 (0.0%) |
Technology Access in St Leo
Computing Device Access in St Leo
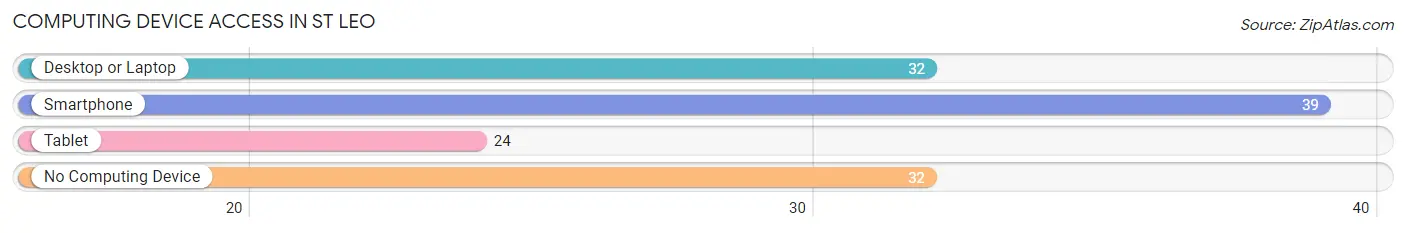
| Device Type | # Households | % Households |
| Desktop or Laptop | 32 | 44.4% |
| Smartphone | 39 | 54.2% |
| Tablet | 24 | 33.3% |
| No Computing Device | 32 | 44.4% |
| Total | 72 | 100.0% |
Internet Access in St Leo
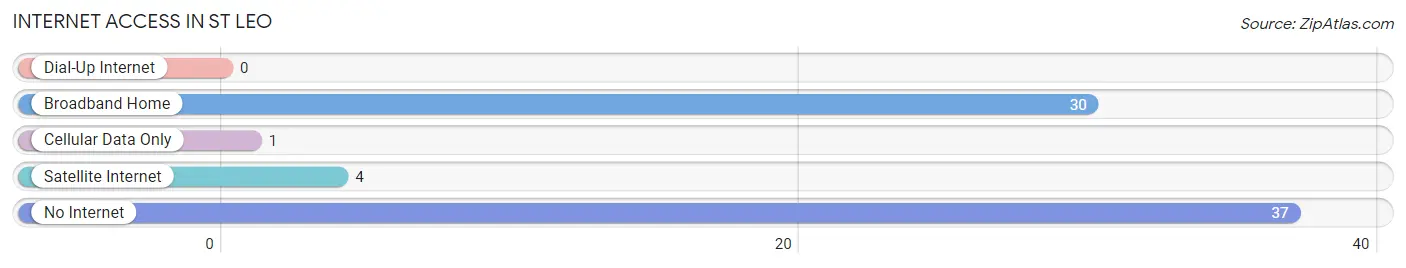
| Internet Type | # Households | % Households |
| Dial-Up Internet | 0 | 0.0% |
| Broadband Home | 30 | 41.7% |
| Cellular Data Only | 1 | 1.4% |
| Satellite Internet | 4 | 5.6% |
| No Internet | 37 | 51.4% |
| Total | 72 | 100.0% |
St Leo Summary
Leo, Minnesota is a small town located in the southeastern corner of the state, just north of the Iowa border. It is part of the Twin Cities metropolitan area and is located in Wabasha County. The population of Leo was 1,845 in the 2010 census.
Geography
Leo is located at the intersection of Minnesota State Highway 60 and U.S. Highway 61. It is situated on the banks of the Mississippi River, just north of the Iowa border. The town is surrounded by rolling hills and farmland, and is located in the Driftless Area of Minnesota. The area is known for its unique topography, which is characterized by steep hills and deep valleys.
The climate in Leo is typical of the Midwest, with cold winters and hot summers. The average annual temperature is around 40 degrees Fahrenheit, and the average annual precipitation is around 30 inches.
History
Leo was founded in 1856 by a group of settlers from Germany. The town was named after St. Leo the Great, a 5th century pope. The town grew slowly, and by the turn of the century, it had a population of just over 500.
In the early 1900s, Leo began to experience a period of growth and prosperity. The town was home to several businesses, including a flour mill, a creamery, and a sawmill. The town also had a railroad station, which connected it to the larger cities of the region.
In the 1950s, Leo began to experience a decline in population. This was due to the decline of the railroad industry and the rise of the automobile. By the 1970s, the population had dropped to just over 1,000.
Economy
Leo’s economy is largely based on agriculture. The town is home to several farms, which produce corn, soybeans, and other crops. The town also has a few small businesses, including a grocery store, a hardware store, and a few restaurants.
The town is also home to a few manufacturing companies, including a plastics manufacturer and a metal fabrication company.
Demographics
The population of Leo is predominantly white, with a small minority population. The median household income is around $45,000, and the median home value is around $150,000. The town has a low unemployment rate, and the poverty rate is below the national average.
Leo is a small town with a rich history and a bright future. It is a great place to live, work, and raise a family. The town is home to a diverse population, and it offers a variety of activities and amenities for its residents.
Common Questions
What is Per Capita Income in St Leo?
Per Capita income in St Leo is $28,362.
What is the Median Family Income in St Leo?
Median Family Income in St Leo is $83,750.
What is the Median Household income in St Leo?
Median Household Income in St Leo is $54,500.
What is Income or Wage Gap in St Leo?
Income or Wage Gap in St Leo is 24.9%.
Women in St Leo earn 75.1 cents for every dollar earned by a man.
What is Inequality or Gini Index in St Leo?
Inequality or Gini Index in St Leo is 0.35.
What is the Total Population of St Leo?
Total Population of St Leo is 151.
What is the Total Male Population of St Leo?
Total Male Population of St Leo is 80.
What is the Total Female Population of St Leo?
Total Female Population of St Leo is 71.
What is the Ratio of Males per 100 Females in St Leo?
There are 112.68 Males per 100 Females in St Leo.
What is the Ratio of Females per 100 Males in St Leo?
There are 88.75 Females per 100 Males in St Leo.
What is the Median Population Age in St Leo?
Median Population Age in St Leo is 58.2 Years.
What is the Average Family Size in St Leo
Average Family Size in St Leo is 2.8 People.
What is the Average Household Size in St Leo
Average Household Size in St Leo is 2.1 People.
How Large is the Labor Force in St Leo?
There are 60 People in the Labor Forcein in St Leo.
What is the Percentage of People in the Labor Force in St Leo?
44.8% of People are in the Labor Force in St Leo.
What is the Unemployment Rate in St Leo?
Unemployment Rate in St Leo is 5.0%.