Merrill, IA Map & Demographics
Merrill Map
Merrill Overview
$30,709
PER CAPITA INCOME
$93,063
AVG FAMILY INCOME
$76,250
AVG HOUSEHOLD INCOME
48.8%
WAGE / INCOME GAP [ % ]
51.2¢/ $1
WAGE / INCOME GAP [ $ ]
0.31
INEQUALITY / GINI INDEX
960
TOTAL POPULATION
517
MALE POPULATION
443
FEMALE POPULATION
116.70
MALES / 100 FEMALES
85.69
FEMALES / 100 MALES
34.9
MEDIAN AGE
3.3
AVG FAMILY SIZE
2.7
AVG HOUSEHOLD SIZE
509
LABOR FORCE [ PEOPLE ]
69.0%
PERCENT IN LABOR FORCE
2.8%
UNEMPLOYMENT RATE
Merrill Zip Codes
Merrill Area Codes
Income in Merrill
Income Overview in Merrill
Per Capita Income in Merrill is $30,709, while median incomes of families and households are $93,063 and $76,250 respectively.
| Characteristic | Number | Measure |
| Per Capita Income | 960 | $30,709 |
| Median Family Income | 243 | $93,063 |
| Mean Family Income | 243 | $93,569 |
| Median Household Income | 360 | $76,250 |
| Mean Household Income | 360 | $81,453 |
| Income Deficit | 243 | $0 |
| Wage / Income Gap (%) | 960 | 48.84% |
| Wage / Income Gap ($) | 960 | 51.16¢ per $1 |
| Gini / Inequality Index | 960 | 0.31 |
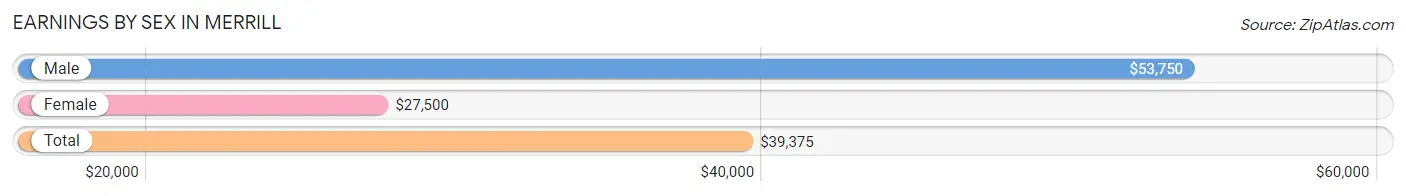
Earnings by Sex in Merrill
Average Earnings in Merrill are $39,375, $53,750 for men and $27,500 for women, a difference of 48.8%.
| Sex | Number | Average Earnings |
| Male | 297 (57.7%) | $53,750 |
| Female | 218 (42.3%) | $27,500 |
| Total | 515 (100.0%) | $39,375 |
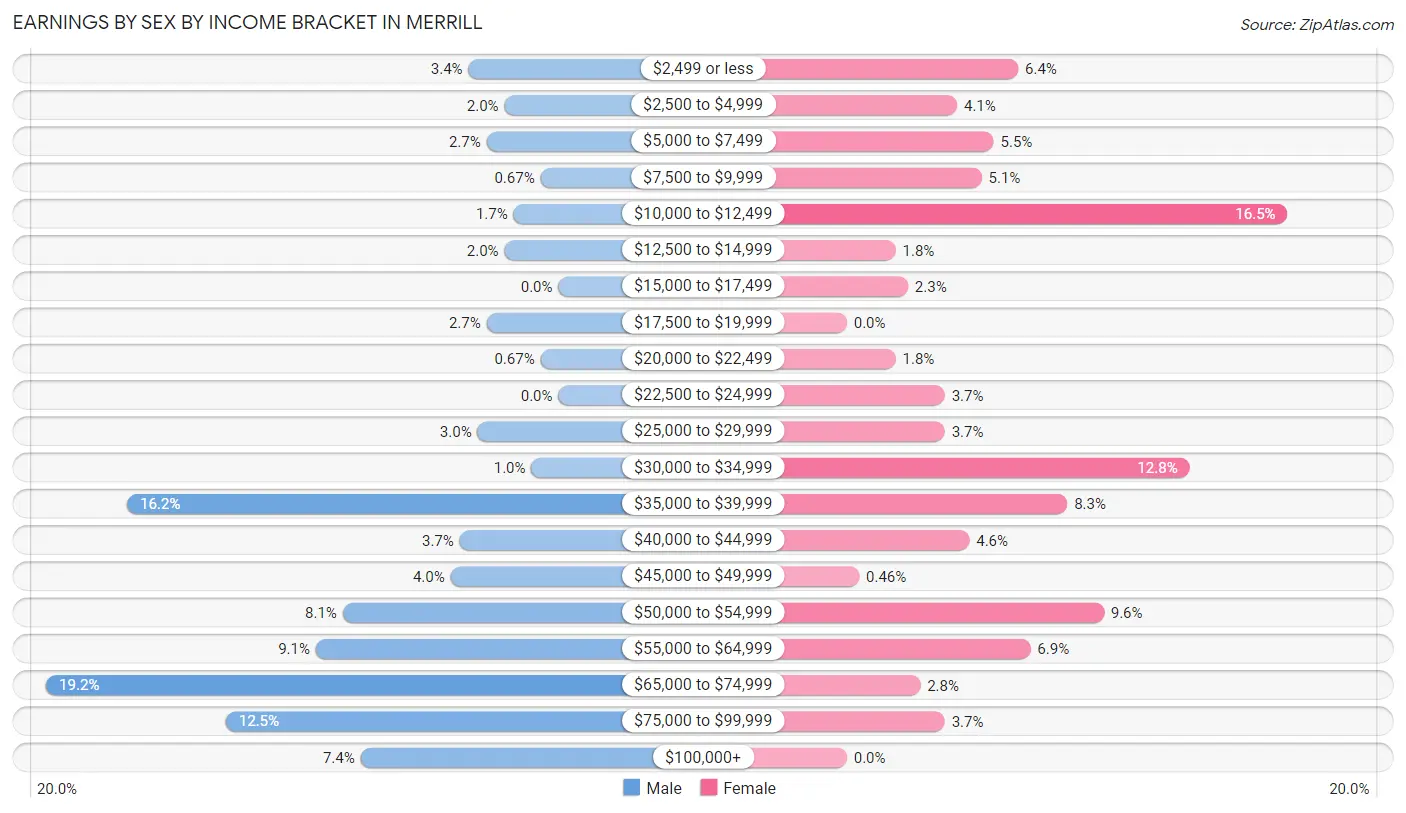
Earnings by Sex by Income Bracket in Merrill
The most common earnings brackets in Merrill are $65,000 to $74,999 for men (57 | 19.2%) and $10,000 to $12,499 for women (36 | 16.5%).
| Income | Male | Female |
| $2,499 or less | 10 (3.4%) | 14 (6.4%) |
| $2,500 to $4,999 | 6 (2.0%) | 9 (4.1%) |
| $5,000 to $7,499 | 8 (2.7%) | 12 (5.5%) |
| $7,500 to $9,999 | 2 (0.7%) | 11 (5.1%) |
| $10,000 to $12,499 | 5 (1.7%) | 36 (16.5%) |
| $12,500 to $14,999 | 6 (2.0%) | 4 (1.8%) |
| $15,000 to $17,499 | 0 (0.0%) | 5 (2.3%) |
| $17,500 to $19,999 | 8 (2.7%) | 0 (0.0%) |
| $20,000 to $22,499 | 2 (0.7%) | 4 (1.8%) |
| $22,500 to $24,999 | 0 (0.0%) | 8 (3.7%) |
| $25,000 to $29,999 | 9 (3.0%) | 8 (3.7%) |
| $30,000 to $34,999 | 3 (1.0%) | 28 (12.8%) |
| $35,000 to $39,999 | 48 (16.2%) | 18 (8.3%) |
| $40,000 to $44,999 | 11 (3.7%) | 10 (4.6%) |
| $45,000 to $49,999 | 12 (4.0%) | 1 (0.5%) |
| $50,000 to $54,999 | 24 (8.1%) | 21 (9.6%) |
| $55,000 to $64,999 | 27 (9.1%) | 15 (6.9%) |
| $65,000 to $74,999 | 57 (19.2%) | 6 (2.8%) |
| $75,000 to $99,999 | 37 (12.5%) | 8 (3.7%) |
| $100,000+ | 22 (7.4%) | 0 (0.0%) |
| Total | 297 (100.0%) | 218 (100.0%) |
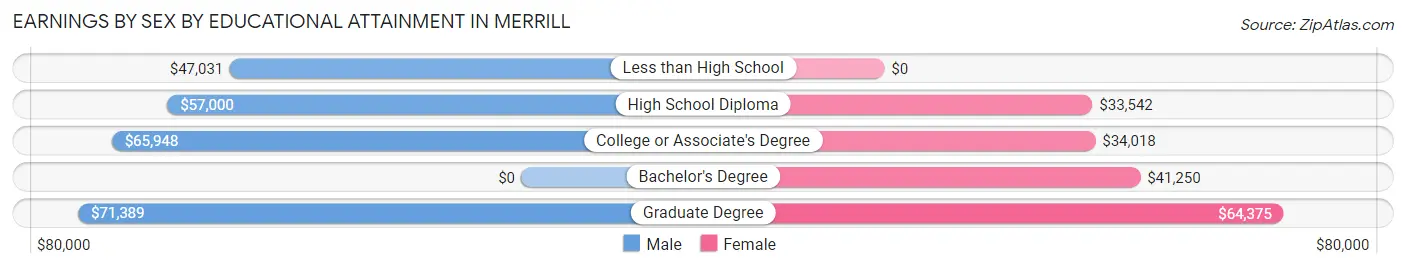
Earnings by Sex by Educational Attainment in Merrill
Average earnings in Merrill are $63,125 for men and $34,022 for women, a difference of 46.1%. Men with an educational attainment of graduate degree enjoy the highest average annual earnings of $71,389, while those with less than high school education earn the least with $47,031. Women with an educational attainment of graduate degree earn the most with the average annual earnings of $64,375, while those with high school diploma education have the smallest earnings of $33,542.
| Educational Attainment | Male Income | Female Income |
| Less than High School | $47,031 | $0 |
| High School Diploma | $57,000 | $33,542 |
| College or Associate's Degree | $65,948 | $34,018 |
| Bachelor's Degree | - | - |
| Graduate Degree | $71,389 | $64,375 |
| Total | $63,125 | $34,022 |
Family Income in Merrill
Family Income Brackets in Merrill
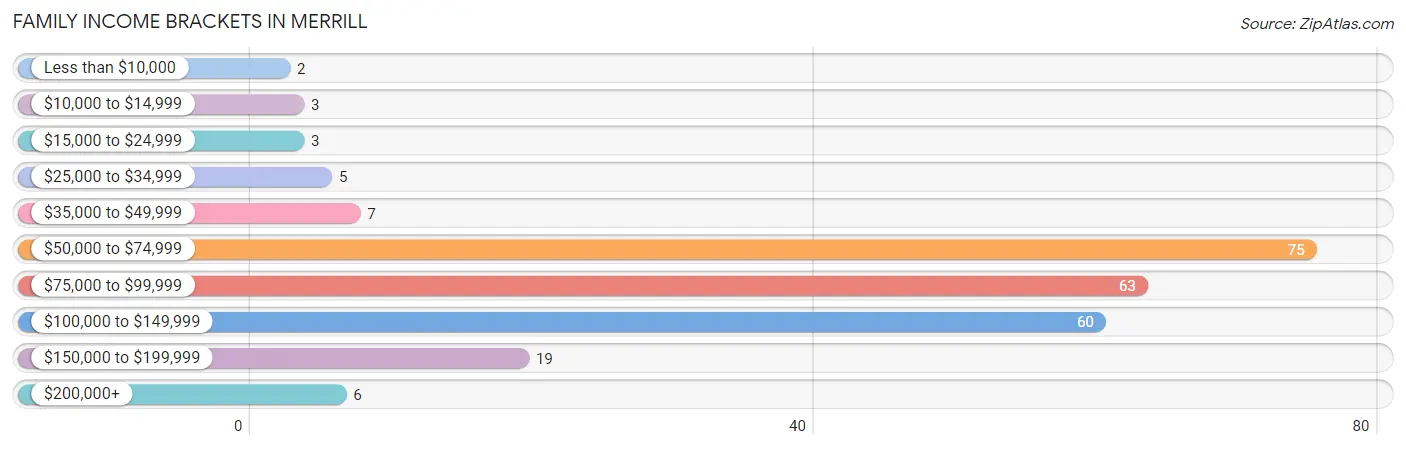
According to the Merrill family income data, there are 75 families falling into the $50,000 to $74,999 income range, which is the most common income bracket and makes up 30.9% of all families. Conversely, the less than $10,000 income bracket is the least frequent group with only 2 families (0.8%) belonging to this category.
| Income Bracket | # Families | % Families |
| Less than $10,000 | 2 | 0.8% |
| $10,000 to $14,999 | 3 | 1.2% |
| $15,000 to $24,999 | 3 | 1.2% |
| $25,000 to $34,999 | 5 | 2.1% |
| $35,000 to $49,999 | 7 | 2.9% |
| $50,000 to $74,999 | 75 | 30.9% |
| $75,000 to $99,999 | 63 | 25.9% |
| $100,000 to $149,999 | 60 | 24.7% |
| $150,000 to $199,999 | 19 | 7.8% |
| $200,000+ | 6 | 2.5% |
Family Income by Famaliy Size in Merrill
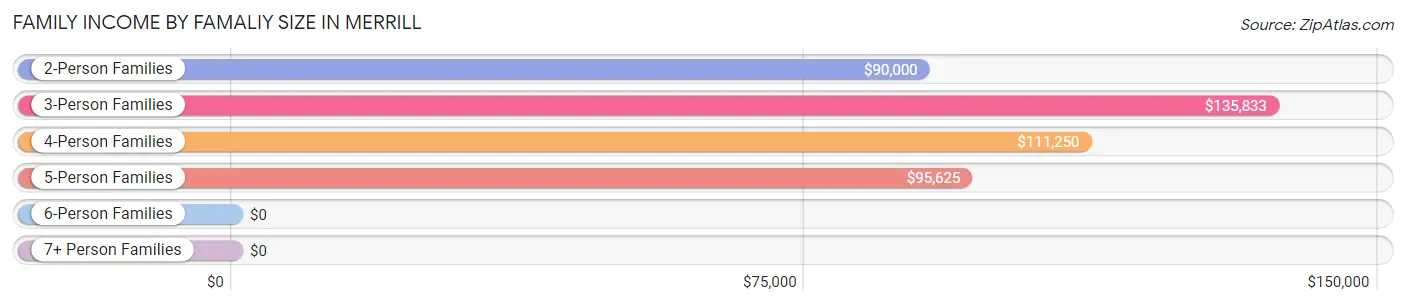
3-person families (32 | 13.2%) account for the highest median family income in Merrill with $135,833 per family, while 3-person families (32 | 13.2%) have the highest median income of $45,278 per family member.
| Income Bracket | # Families | Median Income |
| 2-Person Families | 90 (37.0%) | $90,000 |
| 3-Person Families | 32 (13.2%) | $135,833 |
| 4-Person Families | 55 (22.6%) | $111,250 |
| 5-Person Families | 40 (16.5%) | $95,625 |
| 6-Person Families | 26 (10.7%) | $0 |
| 7+ Person Families | 0 (0.0%) | $0 |
| Total | 243 (100.0%) | $93,063 |
Family Income by Number of Earners in Merrill
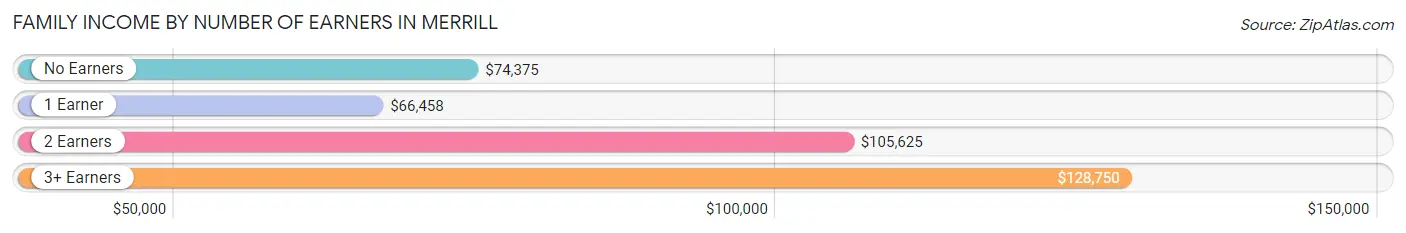
The median family income in Merrill is $93,063, with families comprising 3+ earners (48) having the highest median family income of $128,750, while families with 1 earner (68) have the lowest median family income of $66,458, accounting for 19.8% and 28.0% of families, respectively.
| Number of Earners | # Families | Median Income |
| No Earners | 31 (12.8%) | $74,375 |
| 1 Earner | 68 (28.0%) | $66,458 |
| 2 Earners | 96 (39.5%) | $105,625 |
| 3+ Earners | 48 (19.8%) | $128,750 |
| Total | 243 (100.0%) | $93,063 |
Household Income in Merrill
Household Income Brackets in Merrill
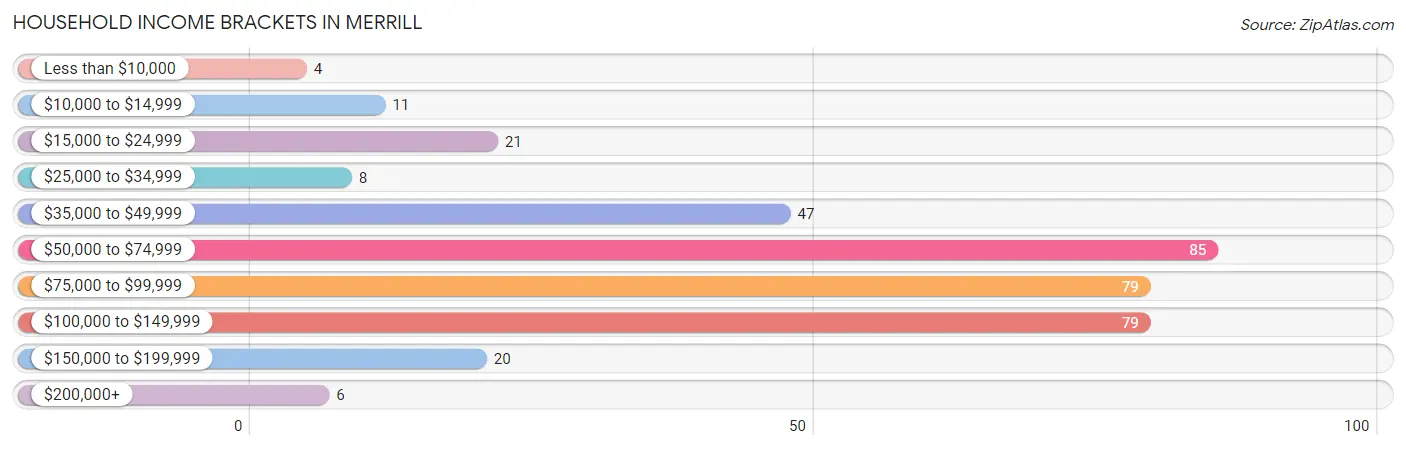
With 85 households falling in the category, the $50,000 to $74,999 income range is the most frequent in Merrill, accounting for 23.6% of all households. In contrast, only 4 households (1.1%) fall into the less than $10,000 income bracket, making it the least populous group.
| Income Bracket | # Households | % Households |
| Less than $10,000 | 4 | 1.1% |
| $10,000 to $14,999 | 11 | 3.1% |
| $15,000 to $24,999 | 21 | 5.8% |
| $25,000 to $34,999 | 8 | 2.2% |
| $35,000 to $49,999 | 47 | 13.1% |
| $50,000 to $74,999 | 85 | 23.6% |
| $75,000 to $99,999 | 79 | 21.9% |
| $100,000 to $149,999 | 79 | 21.9% |
| $150,000 to $199,999 | 20 | 5.6% |
| $200,000+ | 6 | 1.7% |
Household Income by Householder Age in Merrill
The median household income in Merrill is $76,250, with the highest median household income of $97,083 found in the 45 to 64 years age bracket for the primary householder. A total of 134 households (37.2%) fall into this category. Meanwhile, the 15 to 24 years age bracket for the primary householder has the lowest median household income of $36,542, with 37 households (10.3%) in this group.
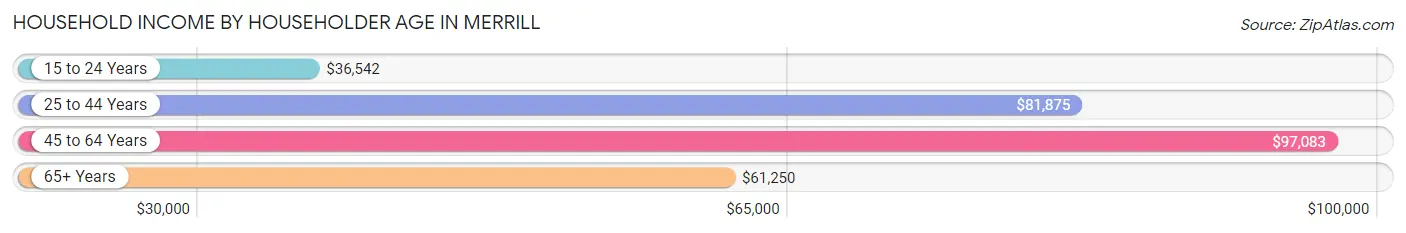
| Income Bracket | # Households | Median Income |
| 15 to 24 Years | 37 (10.3%) | $36,542 |
| 25 to 44 Years | 97 (26.9%) | $81,875 |
| 45 to 64 Years | 134 (37.2%) | $97,083 |
| 65+ Years | 92 (25.6%) | $61,250 |
| Total | 360 (100.0%) | $76,250 |
Poverty in Merrill
Income Below Poverty by Sex and Age in Merrill
With 3.5% poverty level for males and 9.0% for females among the residents of Merrill, 5 year old males and 45 to 54 year old females are the most vulnerable to poverty, with 2 males (100.0%) and 16 females (23.9%) in their respective age groups living below the poverty level.
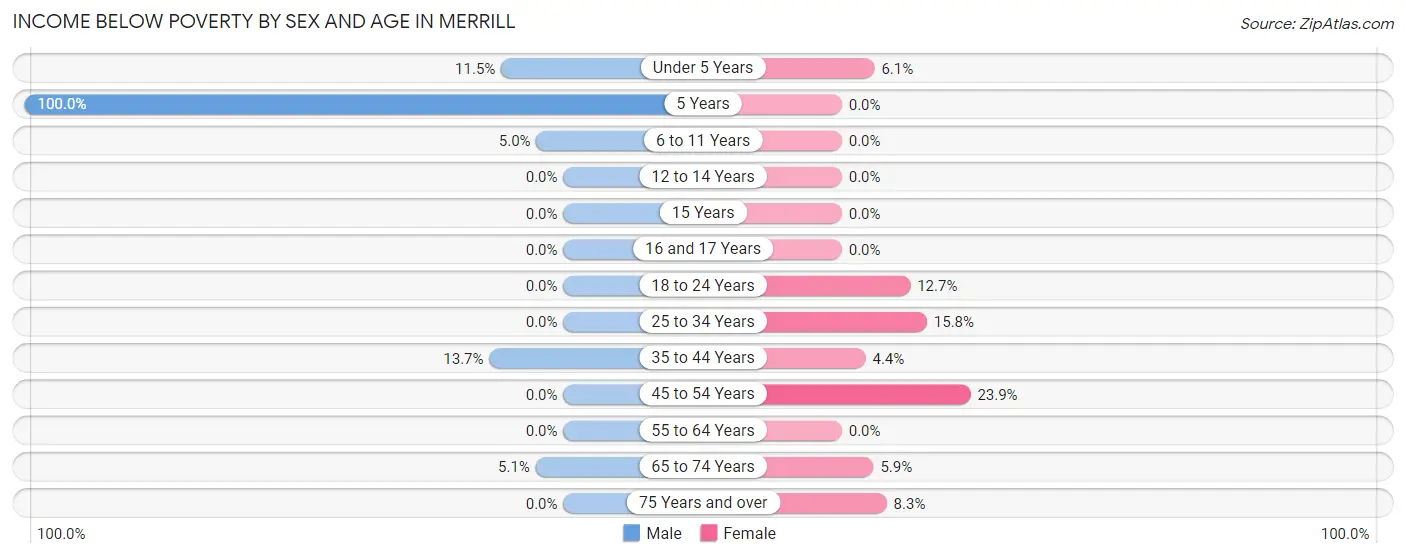
| Age Bracket | Male | Female |
| Under 5 Years | 3 (11.5%) | 2 (6.1%) |
| 5 Years | 2 (100.0%) | 0 (0.0%) |
| 6 to 11 Years | 4 (5.0%) | 0 (0.0%) |
| 12 to 14 Years | 0 (0.0%) | 0 (0.0%) |
| 15 Years | 0 (0.0%) | 0 (0.0%) |
| 16 and 17 Years | 0 (0.0%) | 0 (0.0%) |
| 18 to 24 Years | 0 (0.0%) | 8 (12.7%) |
| 25 to 34 Years | 0 (0.0%) | 6 (15.8%) |
| 35 to 44 Years | 7 (13.7%) | 3 (4.4%) |
| 45 to 54 Years | 0 (0.0%) | 16 (23.9%) |
| 55 to 64 Years | 0 (0.0%) | 0 (0.0%) |
| 65 to 74 Years | 2 (5.1%) | 2 (5.9%) |
| 75 Years and over | 0 (0.0%) | 3 (8.3%) |
| Total | 18 (3.5%) | 40 (9.0%) |
Income Above Poverty by Sex and Age in Merrill
According to the poverty statistics in Merrill, males aged 12 to 14 years and females aged 5 years are the age groups that are most secure financially, with 100.0% of males and 100.0% of females in these age groups living above the poverty line.
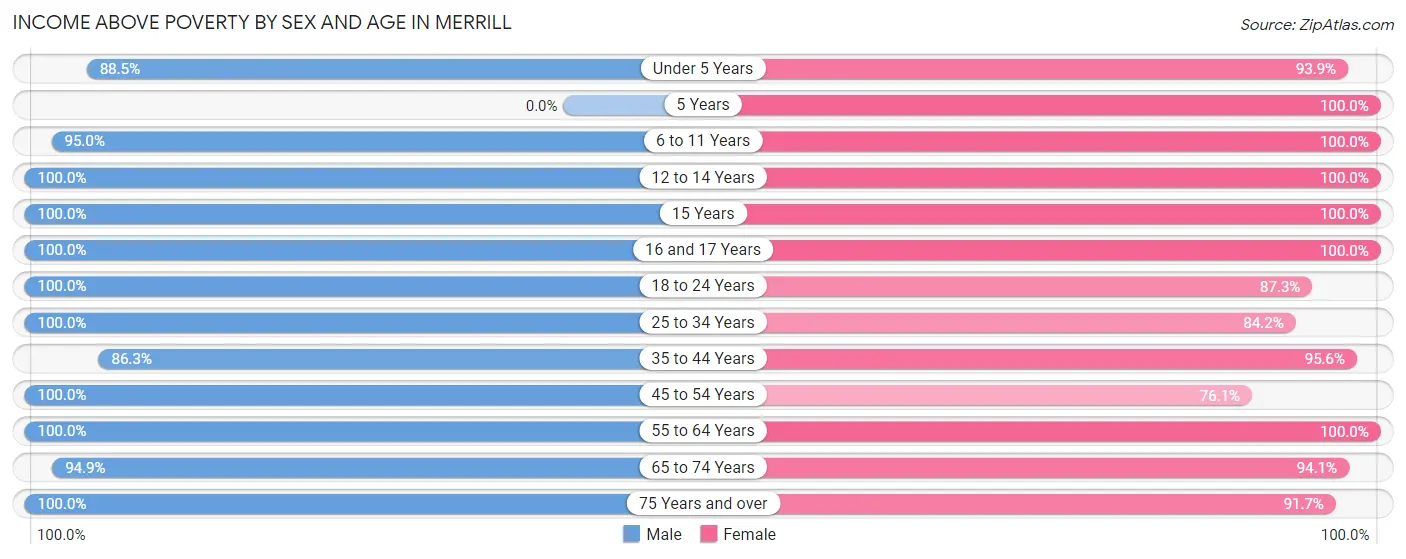
| Age Bracket | Male | Female |
| Under 5 Years | 23 (88.5%) | 31 (93.9%) |
| 5 Years | 0 (0.0%) | 8 (100.0%) |
| 6 to 11 Years | 76 (95.0%) | 36 (100.0%) |
| 12 to 14 Years | 23 (100.0%) | 6 (100.0%) |
| 15 Years | 6 (100.0%) | 2 (100.0%) |
| 16 and 17 Years | 40 (100.0%) | 22 (100.0%) |
| 18 to 24 Years | 55 (100.0%) | 55 (87.3%) |
| 25 to 34 Years | 41 (100.0%) | 32 (84.2%) |
| 35 to 44 Years | 44 (86.3%) | 65 (95.6%) |
| 45 to 54 Years | 64 (100.0%) | 51 (76.1%) |
| 55 to 64 Years | 70 (100.0%) | 30 (100.0%) |
| 65 to 74 Years | 37 (94.9%) | 32 (94.1%) |
| 75 Years and over | 20 (100.0%) | 33 (91.7%) |
| Total | 499 (96.5%) | 403 (91.0%) |
Income Below Poverty Among Married-Couple Families in Merrill
The poverty statistics for married-couple families in Merrill show that 2.4% or 5 of the total 209 families live below the poverty line. Families with 3 or 4 children have the highest poverty rate of 5.4%, comprising of 3 families. On the other hand, families with 1 or 2 children have the lowest poverty rate of 0.0%, which includes 0 families.
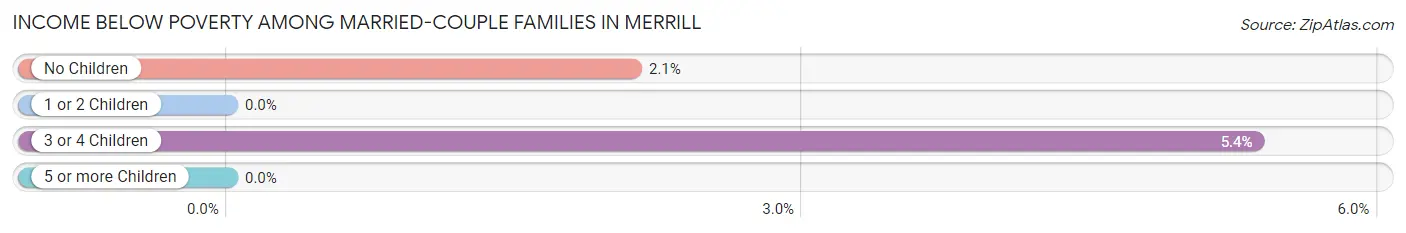
| Children | Above Poverty | Below Poverty |
| No Children | 93 (97.9%) | 2 (2.1%) |
| 1 or 2 Children | 58 (100.0%) | 0 (0.0%) |
| 3 or 4 Children | 53 (94.6%) | 3 (5.4%) |
| 5 or more Children | 0 (0.0%) | 0 (0.0%) |
| Total | 204 (97.6%) | 5 (2.4%) |
Income Below Poverty Among Single-Parent Households in Merrill
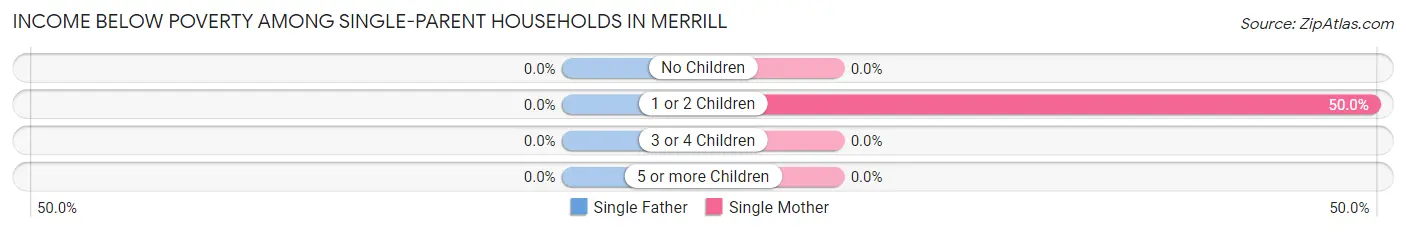
| Children | Single Father | Single Mother |
| No Children | 0 (0.0%) | 0 (0.0%) |
| 1 or 2 Children | 0 (0.0%) | 3 (50.0%) |
| 3 or 4 Children | 0 (0.0%) | 0 (0.0%) |
| 5 or more Children | 0 (0.0%) | 0 (0.0%) |
| Total | 0 (0.0%) | 3 (18.8%) |
Income Below Poverty Among Married-Couple vs Single-Parent Households in Merrill
The poverty data for Merrill shows that 5 of the married-couple family households (2.4%) and 3 of the single-parent households (8.8%) are living below the poverty level. Within the married-couple family households, those with 3 or 4 children have the highest poverty rate, with 3 households (5.4%) falling below the poverty line. Among the single-parent households, those with 1 or 2 children have the highest poverty rate, with 3 household (18.8%) living below poverty.
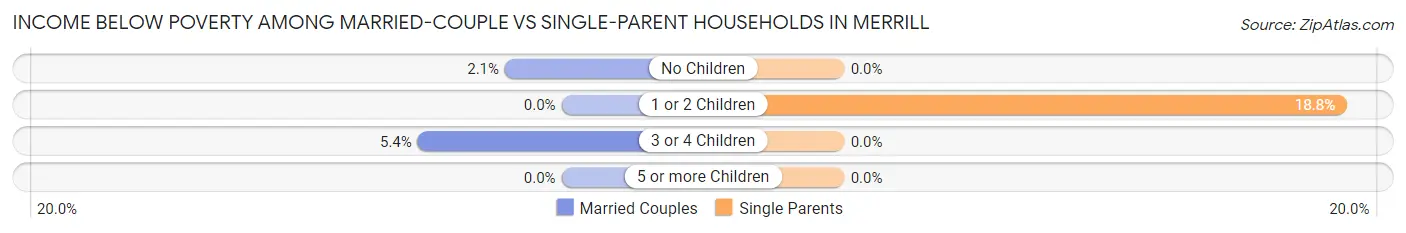
| Children | Married-Couple Families | Single-Parent Households |
| No Children | 2 (2.1%) | 0 (0.0%) |
| 1 or 2 Children | 0 (0.0%) | 3 (18.8%) |
| 3 or 4 Children | 3 (5.4%) | 0 (0.0%) |
| 5 or more Children | 0 (0.0%) | 0 (0.0%) |
| Total | 5 (2.4%) | 3 (8.8%) |
Race in Merrill
The most populous races in Merrill are White / Caucasian (899 | 93.6%), Hispanic or Latino (32 | 3.3%), and Some other Race (25 | 2.6%).
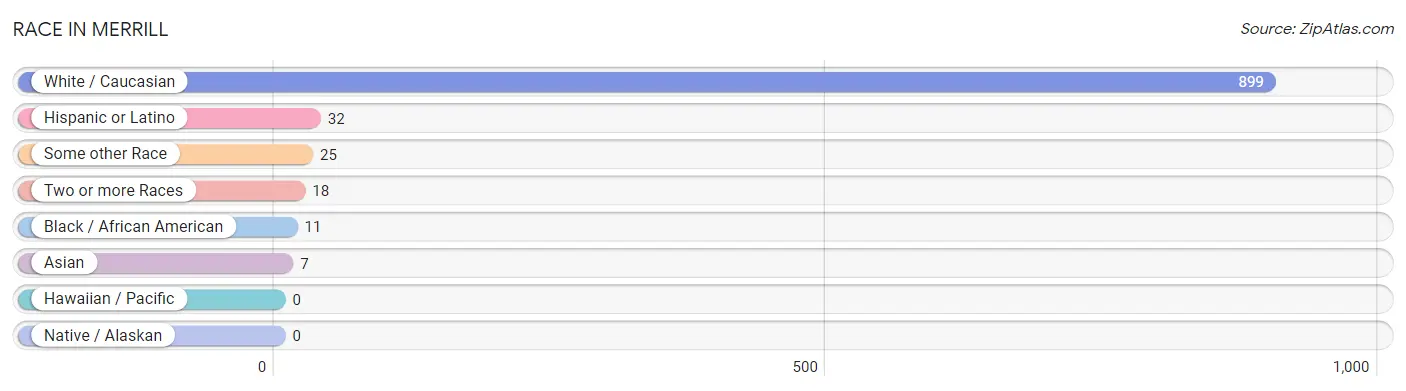
| Race | # Population | % Population |
| Asian | 7 | 0.7% |
| Black / African American | 11 | 1.1% |
| Hawaiian / Pacific | 0 | 0.0% |
| Hispanic or Latino | 32 | 3.3% |
| Native / Alaskan | 0 | 0.0% |
| White / Caucasian | 899 | 93.6% |
| Two or more Races | 18 | 1.9% |
| Some other Race | 25 | 2.6% |
| Total | 960 | 100.0% |
Ancestry in Merrill
The most populous ancestries reported in Merrill are German (460 | 47.9%), Irish (242 | 25.2%), English (84 | 8.7%), Dutch (62 | 6.5%), and Norwegian (52 | 5.4%), together accounting for 93.8% of all Merrill residents.
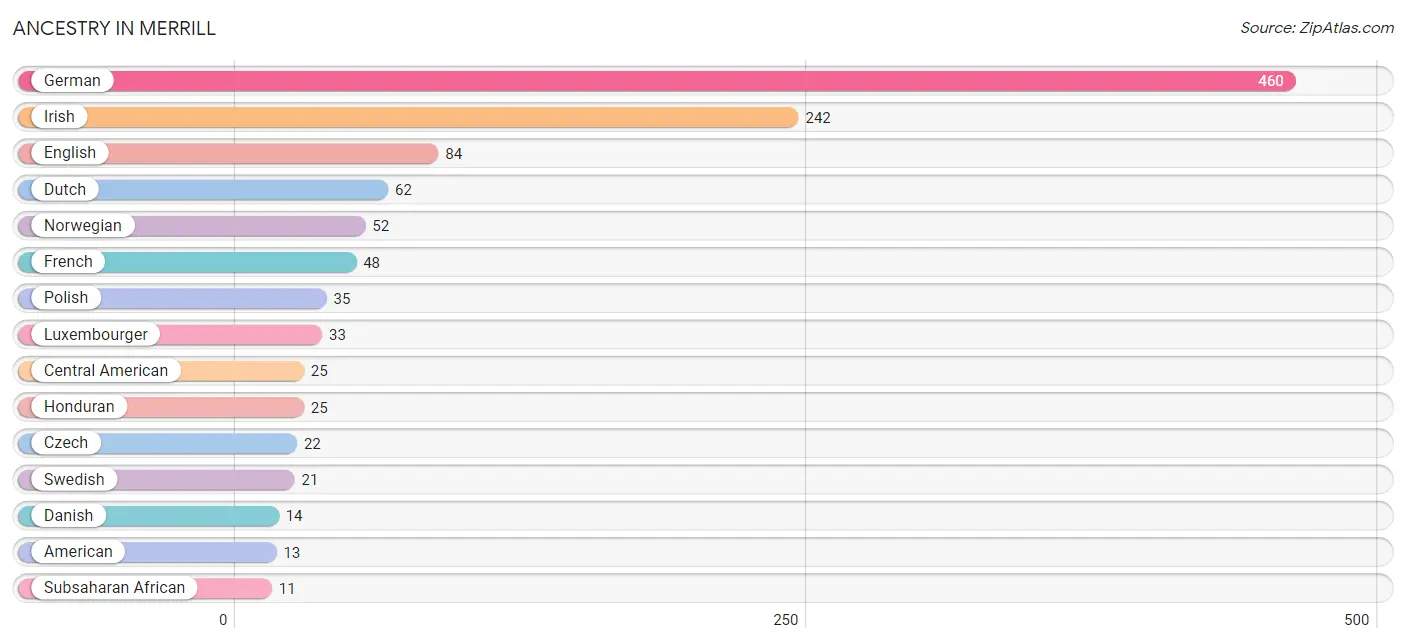
| Ancestry | # Population | % Population |
| African | 2 | 0.2% |
| American | 13 | 1.3% |
| Australian | 8 | 0.8% |
| Central American | 25 | 2.6% |
| Czech | 22 | 2.3% |
| Czechoslovakian | 1 | 0.1% |
| Danish | 14 | 1.5% |
| Dutch | 62 | 6.5% |
| English | 84 | 8.7% |
| European | 2 | 0.2% |
| French | 48 | 5.0% |
| German | 460 | 47.9% |
| Honduran | 25 | 2.6% |
| Irish | 242 | 25.2% |
| Luxembourger | 33 | 3.4% |
| Mexican | 3 | 0.3% |
| Mexican American Indian | 3 | 0.3% |
| Northern European | 3 | 0.3% |
| Norwegian | 52 | 5.4% |
| Polish | 35 | 3.6% |
| Portuguese | 2 | 0.2% |
| Puerto Rican | 4 | 0.4% |
| Russian | 8 | 0.8% |
| Scandinavian | 8 | 0.8% |
| Scottish | 2 | 0.2% |
| Somali | 9 | 0.9% |
| Subsaharan African | 11 | 1.1% |
| Swedish | 21 | 2.2% |
| Swiss | 4 | 0.4% |
| Thai | 7 | 0.7% | View All 30 Rows |
Immigrants in Merrill
The most numerous immigrant groups reported in Merrill came from Central America (25 | 2.6%), Honduras (25 | 2.6%), Latin America (25 | 2.6%), Africa (7 | 0.7%), and Asia (7 | 0.7%), together accounting for 9.3% of all Merrill residents.
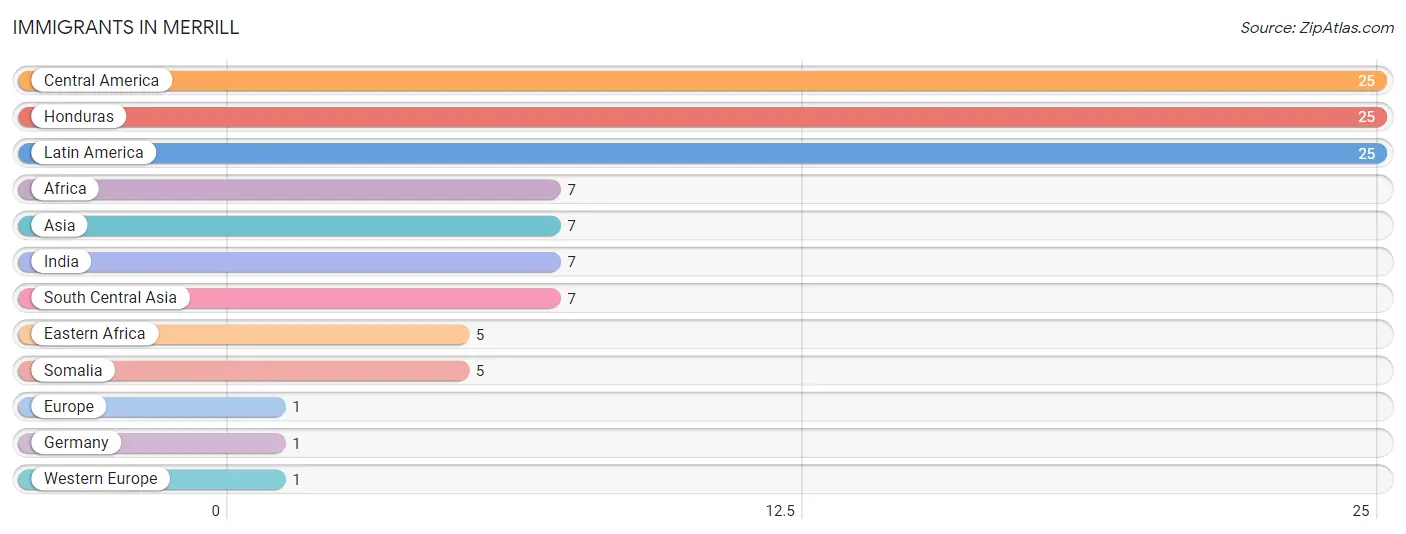
| Immigration Origin | # Population | % Population |
| Africa | 7 | 0.7% |
| Asia | 7 | 0.7% |
| Central America | 25 | 2.6% |
| Eastern Africa | 5 | 0.5% |
| Europe | 1 | 0.1% |
| Germany | 1 | 0.1% |
| Honduras | 25 | 2.6% |
| India | 7 | 0.7% |
| Latin America | 25 | 2.6% |
| Somalia | 5 | 0.5% |
| South Central Asia | 7 | 0.7% |
| Western Europe | 1 | 0.1% | View All 12 Rows |
Sex and Age in Merrill
Sex and Age in Merrill
The most populous age groups in Merrill are 5 to 9 Years (63 | 12.2%) for men and 20 to 24 Years (54 | 12.2%) for women.
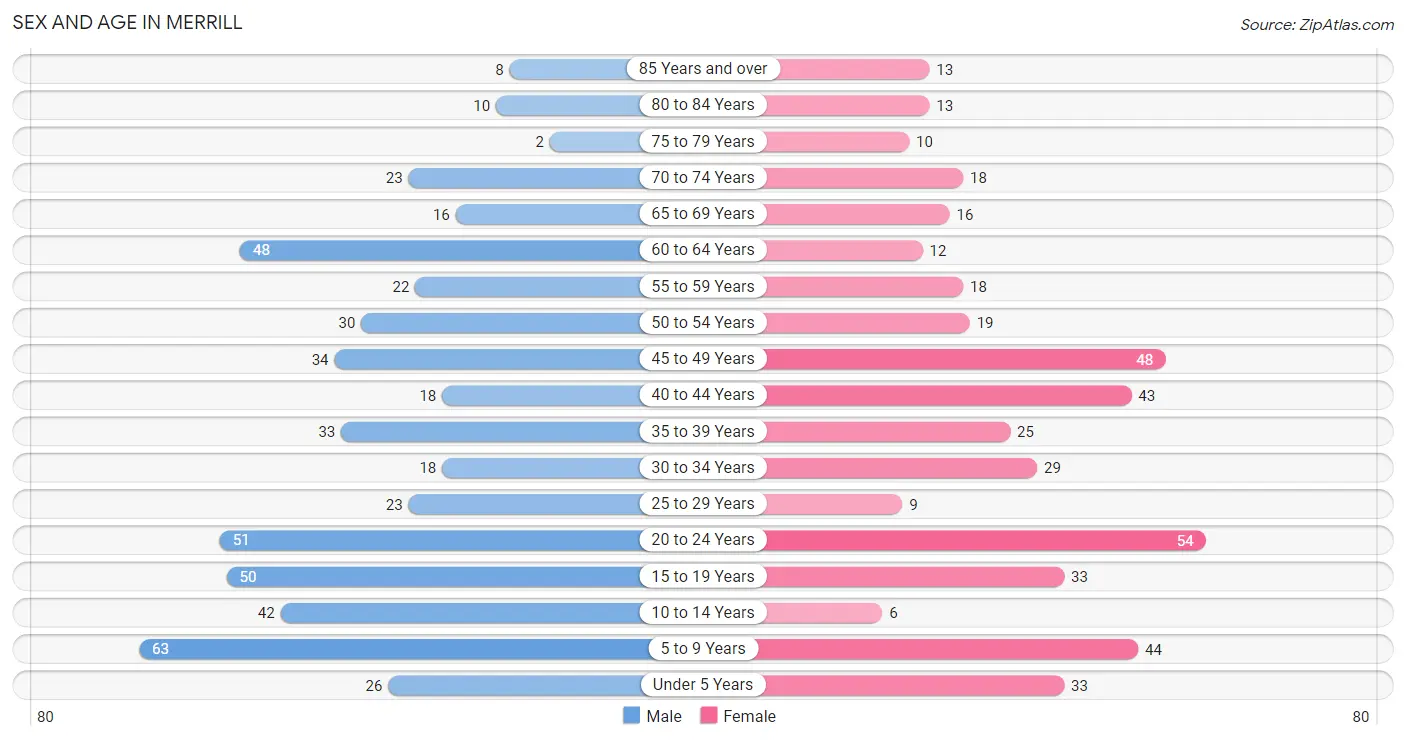
| Age Bracket | Male | Female |
| Under 5 Years | 26 (5.0%) | 33 (7.4%) |
| 5 to 9 Years | 63 (12.2%) | 44 (9.9%) |
| 10 to 14 Years | 42 (8.1%) | 6 (1.3%) |
| 15 to 19 Years | 50 (9.7%) | 33 (7.4%) |
| 20 to 24 Years | 51 (9.9%) | 54 (12.2%) |
| 25 to 29 Years | 23 (4.4%) | 9 (2.0%) |
| 30 to 34 Years | 18 (3.5%) | 29 (6.6%) |
| 35 to 39 Years | 33 (6.4%) | 25 (5.6%) |
| 40 to 44 Years | 18 (3.5%) | 43 (9.7%) |
| 45 to 49 Years | 34 (6.6%) | 48 (10.8%) |
| 50 to 54 Years | 30 (5.8%) | 19 (4.3%) |
| 55 to 59 Years | 22 (4.3%) | 18 (4.1%) |
| 60 to 64 Years | 48 (9.3%) | 12 (2.7%) |
| 65 to 69 Years | 16 (3.1%) | 16 (3.6%) |
| 70 to 74 Years | 23 (4.4%) | 18 (4.1%) |
| 75 to 79 Years | 2 (0.4%) | 10 (2.3%) |
| 80 to 84 Years | 10 (1.9%) | 13 (2.9%) |
| 85 Years and over | 8 (1.5%) | 13 (2.9%) |
| Total | 517 (100.0%) | 443 (100.0%) |
Families and Households in Merrill
Median Family Size in Merrill
The median family size in Merrill is 3.27 persons per family, with married-couple families (209 | 86.0%) accounting for the largest median family size of 3.38 persons per family. On the other hand, single male/father families (18 | 7.4%) represent the smallest median family size with 2.50 persons per family.
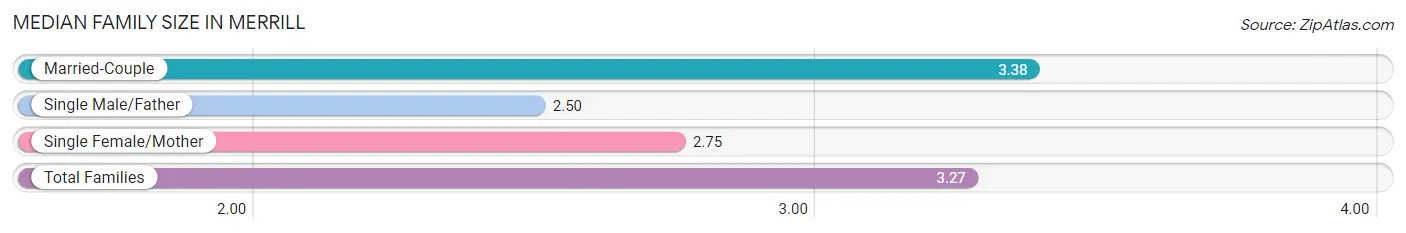
| Family Type | # Families | Family Size |
| Married-Couple | 209 (86.0%) | 3.38 |
| Single Male/Father | 18 (7.4%) | 2.50 |
| Single Female/Mother | 16 (6.6%) | 2.75 |
| Total Families | 243 (100.0%) | 3.27 |
Median Household Size in Merrill
The median household size in Merrill is 2.67 persons per household, with married-couple households (209 | 58.1%) accounting for the largest median household size of 3.38 persons per household. non-family households (117 | 32.5%) represent the smallest median household size with 1.33 persons per household.
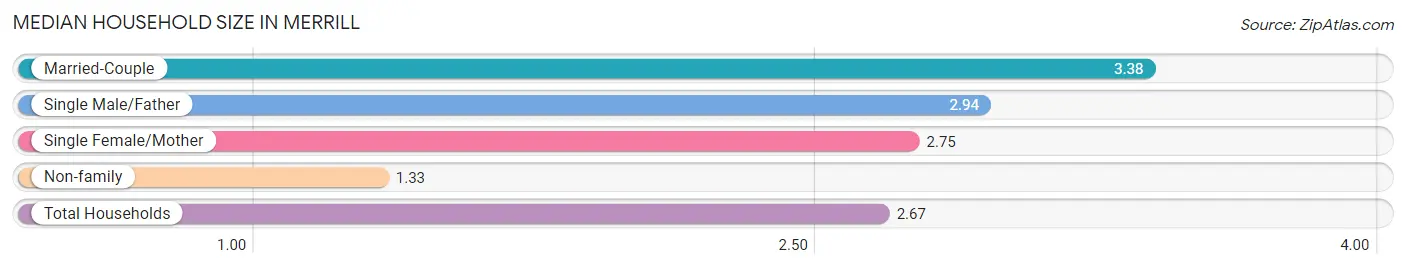
| Household Type | # Households | Household Size |
| Married-Couple | 209 (58.1%) | 3.38 |
| Single Male/Father | 18 (5.0%) | 2.94 |
| Single Female/Mother | 16 (4.4%) | 2.75 |
| Non-family | 117 (32.5%) | 1.33 |
| Total Households | 360 (100.0%) | 2.67 |
Household Size by Marriage Status in Merrill
Out of a total of 360 households in Merrill, 243 (67.5%) are family households, while 117 (32.5%) are nonfamily households. The most numerous type of family households are 2-person households, comprising 84, and the most common type of nonfamily households are 1-person households, comprising 93.
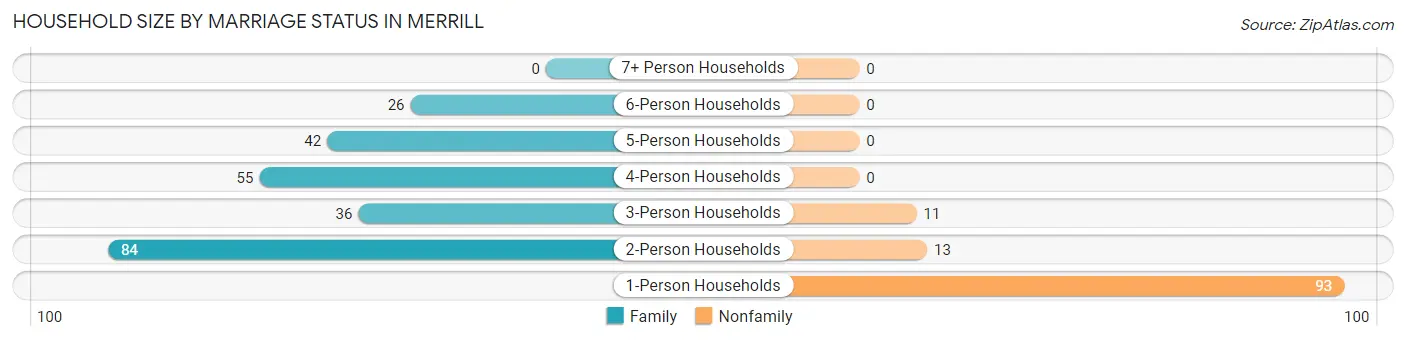
| Household Size | Family Households | Nonfamily Households |
| 1-Person Households | - | 93 (25.8%) |
| 2-Person Households | 84 (23.3%) | 13 (3.6%) |
| 3-Person Households | 36 (10.0%) | 11 (3.1%) |
| 4-Person Households | 55 (15.3%) | 0 (0.0%) |
| 5-Person Households | 42 (11.7%) | 0 (0.0%) |
| 6-Person Households | 26 (7.2%) | 0 (0.0%) |
| 7+ Person Households | 0 (0.0%) | 0 (0.0%) |
| Total | 243 (67.5%) | 117 (32.5%) |
Female Fertility in Merrill
Fertility by Age in Merrill
Average fertility rate in Merrill is 49.0 births per 1,000 women. Women in the age bracket of 20 to 34 years have the highest fertility rate with 130.0 births per 1,000 women. Women in the age bracket of 20 to 34 years acount for 100.0% of all women with births.
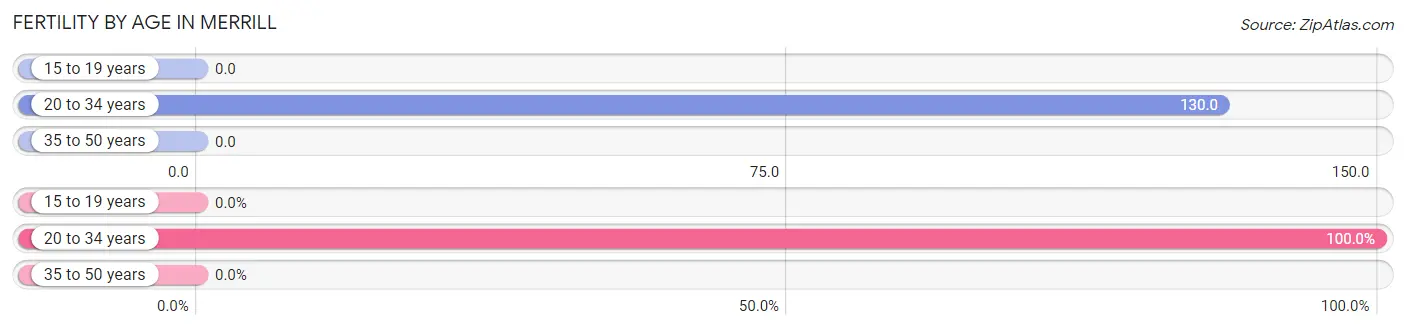
| Age Bracket | Women with Births | Births / 1,000 Women |
| 15 to 19 years | 0 (0.0%) | 0.0 |
| 20 to 34 years | 12 (100.0%) | 130.0 |
| 35 to 50 years | 0 (0.0%) | 0.0 |
| Total | 12 (100.0%) | 49.0 |
Fertility by Age by Marriage Status in Merrill
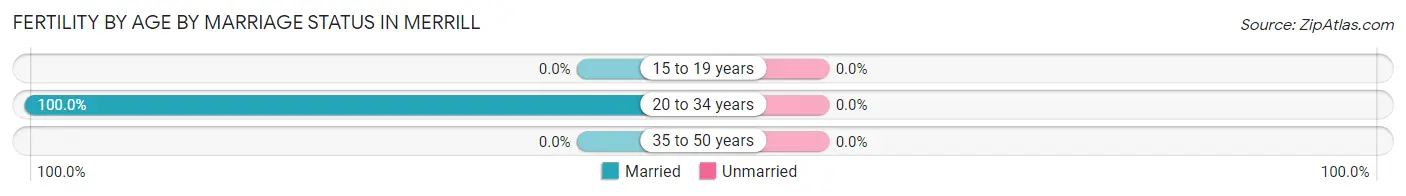
| Age Bracket | Married | Unmarried |
| 15 to 19 years | 0 (0.0%) | 0 (0.0%) |
| 20 to 34 years | 12 (100.0%) | 0 (0.0%) |
| 35 to 50 years | 0 (0.0%) | 0 (0.0%) |
| Total | 12 (100.0%) | 0 (0.0%) |
Fertility by Education in Merrill
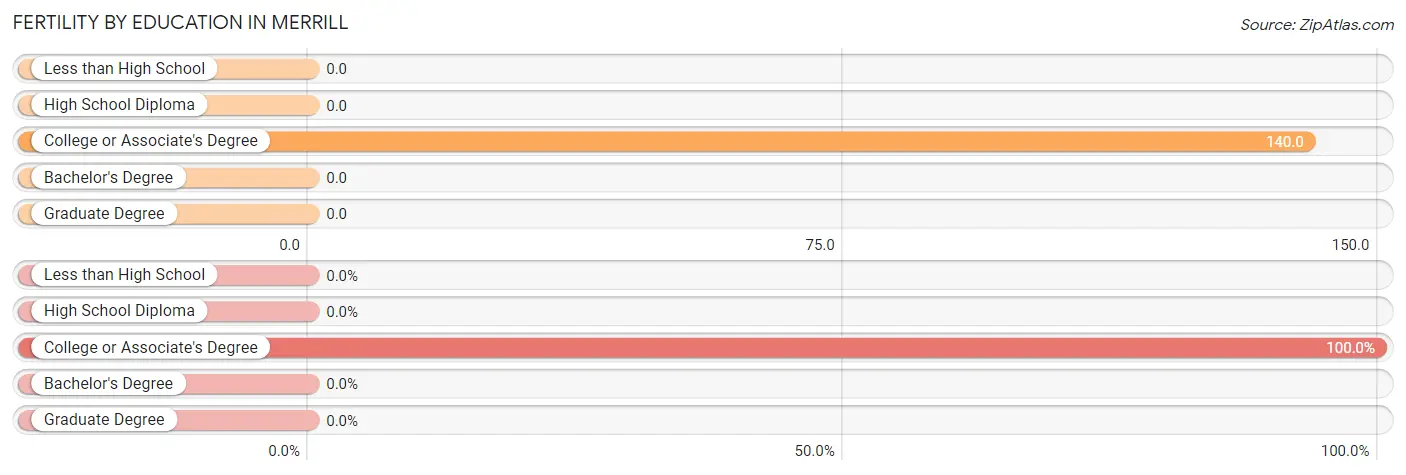
| Educational Attainment | Women with Births | Births / 1,000 Women |
| Less than High School | 0 (0.0%) | 0.0 |
| High School Diploma | 0 (0.0%) | 0.0 |
| College or Associate's Degree | 12 (100.0%) | 140.0 |
| Bachelor's Degree | 0 (0.0%) | 0.0 |
| Graduate Degree | 0 (0.0%) | 0.0 |
| Total | 12 (100.0%) | 49.0 |
Fertility by Education by Marriage Status in Merrill
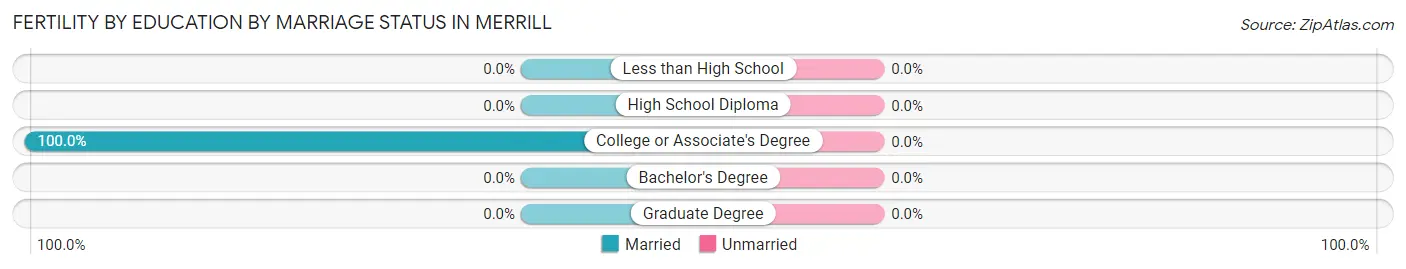
| Educational Attainment | Married | Unmarried |
| Less than High School | 0 (0.0%) | 0 (0.0%) |
| High School Diploma | 0 (0.0%) | 0 (0.0%) |
| College or Associate's Degree | 12 (100.0%) | 0 (0.0%) |
| Bachelor's Degree | 0 (0.0%) | 0 (0.0%) |
| Graduate Degree | 0 (0.0%) | 0 (0.0%) |
| Total | 12 (100.0%) | 0 (0.0%) |
Employment Characteristics in Merrill
Employment by Class of Employer in Merrill
Among the 487 employed individuals in Merrill, private company employees (395 | 81.1%), state government employees (32 | 6.6%), and not-for-profit organizations (24 | 4.9%) make up the most common classes of employment.
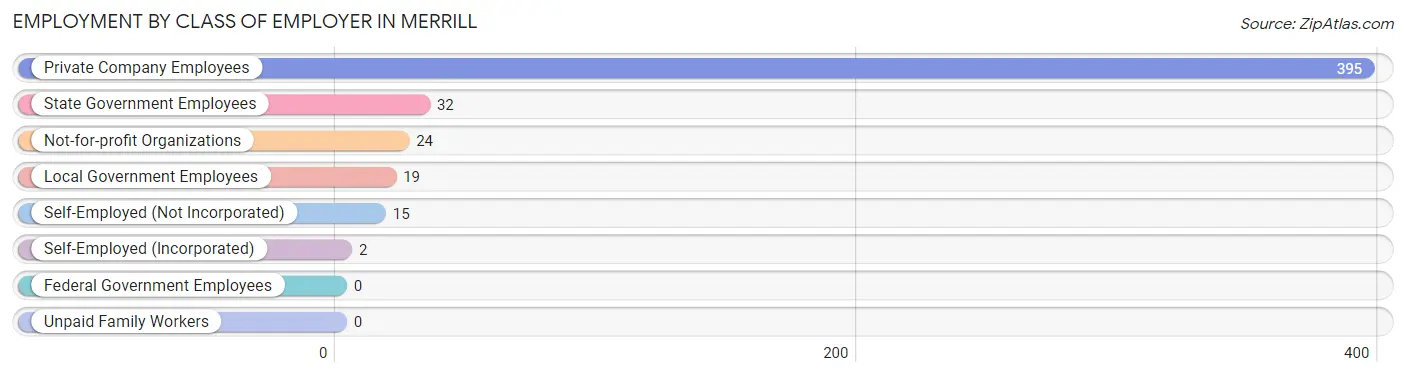
| Employer Class | # Employees | % Employees |
| Private Company Employees | 395 | 81.1% |
| Self-Employed (Incorporated) | 2 | 0.4% |
| Self-Employed (Not Incorporated) | 15 | 3.1% |
| Not-for-profit Organizations | 24 | 4.9% |
| Local Government Employees | 19 | 3.9% |
| State Government Employees | 32 | 6.6% |
| Federal Government Employees | 0 | 0.0% |
| Unpaid Family Workers | 0 | 0.0% |
| Total | 487 | 100.0% |
Employment Status by Age in Merrill
According to the labor force statistics for Merrill, out of the total population over 16 years of age (738), 69.0% or 509 individuals are in the labor force, with 2.8% or 14 of them unemployed. The age group with the highest labor force participation rate is 60 to 64 years, with 98.3% or 59 individuals in the labor force. Within the labor force, the 65 to 74 years age range has the highest percentage of unemployed individuals, with 13.3% or 2 of them being unemployed.
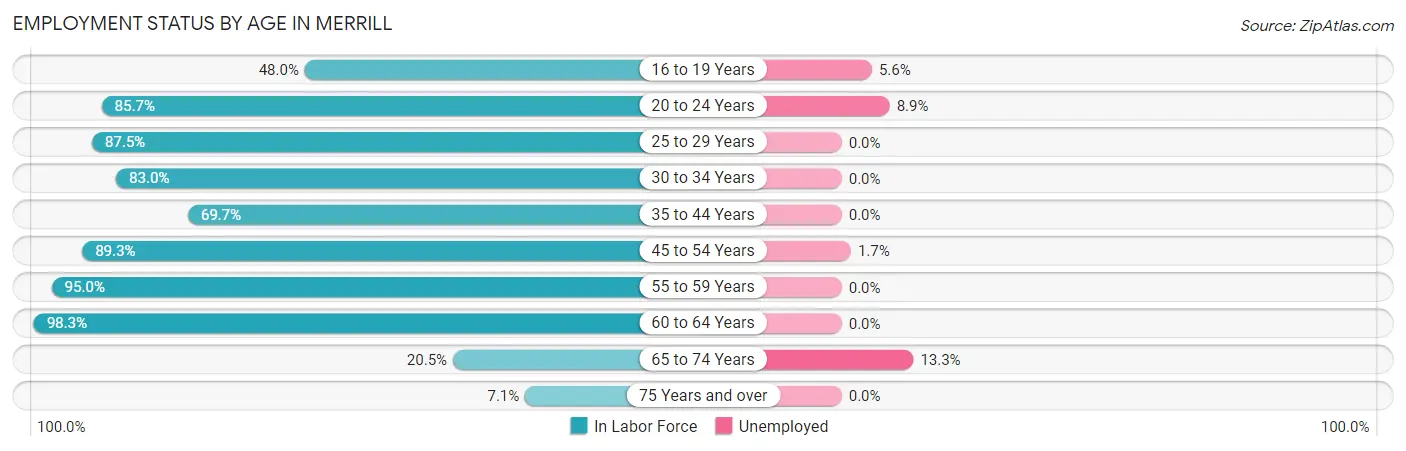
| Age Bracket | In Labor Force | Unemployed |
| 16 to 19 Years | 36 (48.0%) | 2 (5.6%) |
| 20 to 24 Years | 90 (85.7%) | 8 (8.9%) |
| 25 to 29 Years | 28 (87.5%) | 0 (0.0%) |
| 30 to 34 Years | 39 (83.0%) | 0 (0.0%) |
| 35 to 44 Years | 83 (69.7%) | 0 (0.0%) |
| 45 to 54 Years | 117 (89.3%) | 2 (1.7%) |
| 55 to 59 Years | 38 (95.0%) | 0 (0.0%) |
| 60 to 64 Years | 59 (98.3%) | 0 (0.0%) |
| 65 to 74 Years | 15 (20.5%) | 2 (13.3%) |
| 75 Years and over | 4 (7.1%) | 0 (0.0%) |
| Total | 509 (69.0%) | 14 (2.8%) |
Employment Status by Educational Attainment in Merrill
According to labor force statistics for Merrill, 84.8% of individuals (364) out of the total population between 25 and 64 years of age (429) are in the labor force, with 0.5% or 2 of them being unemployed. The group with the highest labor force participation rate are those with the educational attainment of high school diploma, with 94.5% or 121 individuals in the labor force. Within the labor force, individuals with high school diploma education have the highest percentage of unemployment, with 1.7% or 2 of them being unemployed.
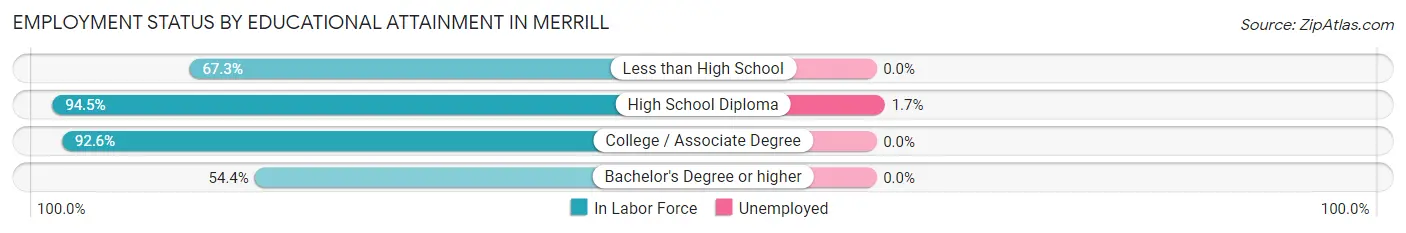
| Educational Attainment | In Labor Force | Unemployed |
| Less than High School | 37 (67.3%) | 0 (0.0%) |
| High School Diploma | 121 (94.5%) | 2 (1.7%) |
| College / Associate Degree | 175 (92.6%) | 0 (0.0%) |
| Bachelor's Degree or higher | 31 (54.4%) | 0 (0.0%) |
| Total | 364 (84.8%) | 2 (0.5%) |
Employment Occupations by Sex in Merrill
Management, Business, Science and Arts Occupations
The most common Management, Business, Science and Arts occupations in Merrill are Community & Social Service (56 | 11.3%), Management (32 | 6.5%), Health Diagnosing & Treating (32 | 6.5%), Arts, Media & Entertainment (30 | 6.1%), and Education Instruction & Library (24 | 4.9%).
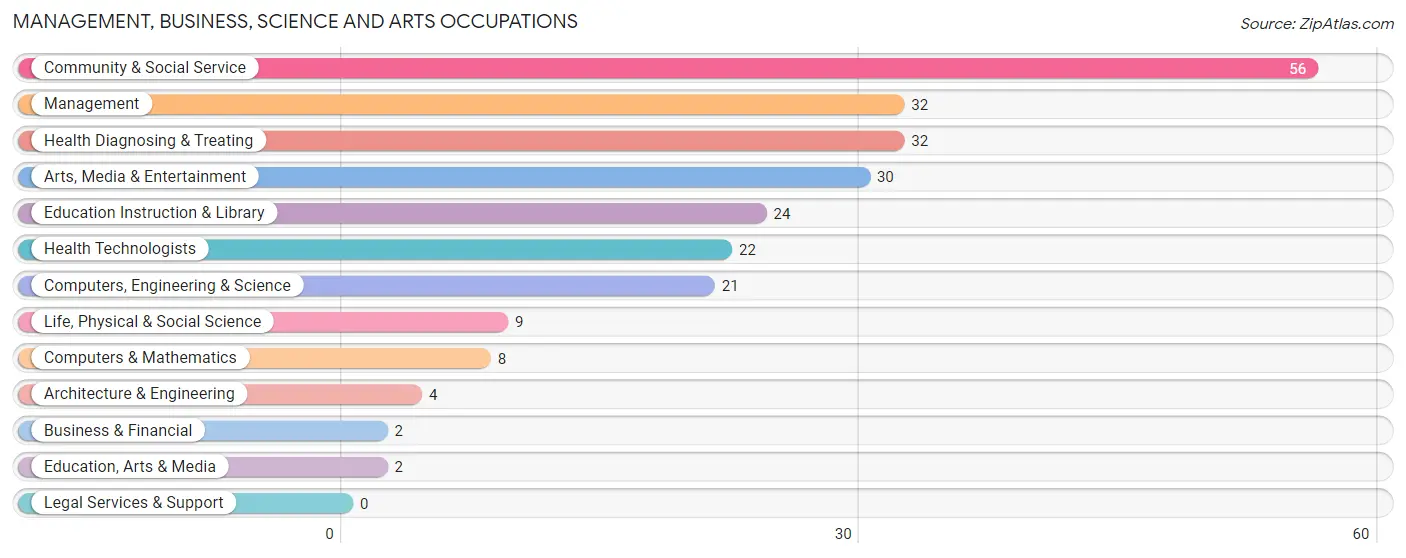
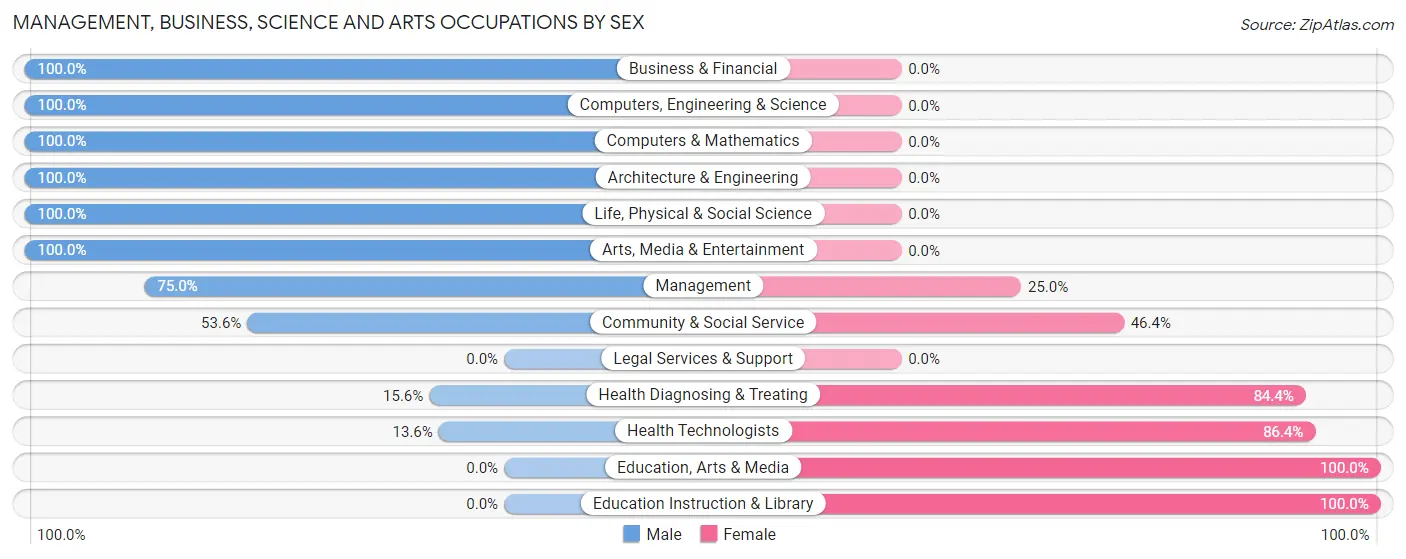
Management, Business, Science and Arts Occupations by Sex
Within the Management, Business, Science and Arts occupations in Merrill, the most male-oriented occupations are Business & Financial (100.0%), Computers, Engineering & Science (100.0%), and Computers & Mathematics (100.0%), while the most female-oriented occupations are Education, Arts & Media (100.0%), Education Instruction & Library (100.0%), and Health Technologists (86.4%).
| Occupation | Male | Female |
| Management | 24 (75.0%) | 8 (25.0%) |
| Business & Financial | 2 (100.0%) | 0 (0.0%) |
| Computers, Engineering & Science | 21 (100.0%) | 0 (0.0%) |
| Computers & Mathematics | 8 (100.0%) | 0 (0.0%) |
| Architecture & Engineering | 4 (100.0%) | 0 (0.0%) |
| Life, Physical & Social Science | 9 (100.0%) | 0 (0.0%) |
| Community & Social Service | 30 (53.6%) | 26 (46.4%) |
| Education, Arts & Media | 0 (0.0%) | 2 (100.0%) |
| Legal Services & Support | 0 (0.0%) | 0 (0.0%) |
| Education Instruction & Library | 0 (0.0%) | 24 (100.0%) |
| Arts, Media & Entertainment | 30 (100.0%) | 0 (0.0%) |
| Health Diagnosing & Treating | 5 (15.6%) | 27 (84.4%) |
| Health Technologists | 3 (13.6%) | 19 (86.4%) |
| Total (Category) | 82 (57.3%) | 61 (42.7%) |
| Total (Overall) | 280 (56.6%) | 215 (43.4%) |
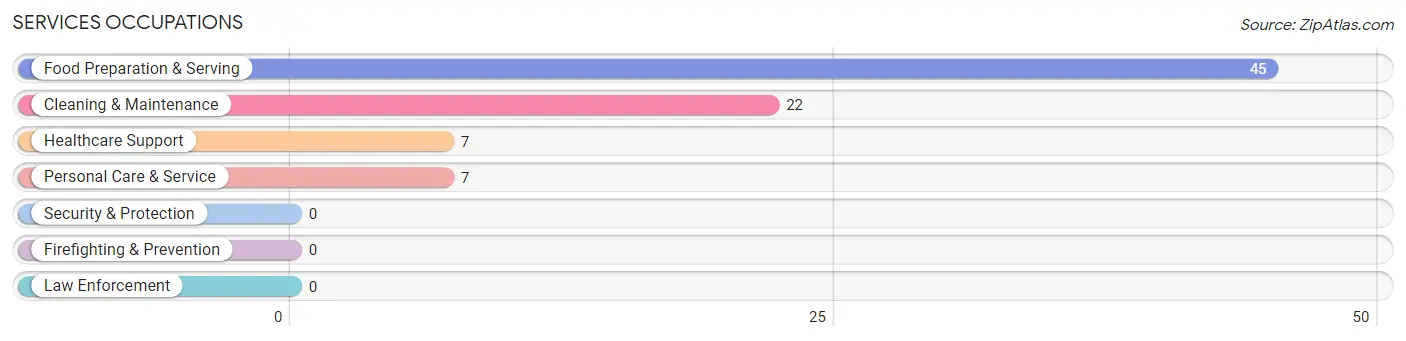
Services Occupations
The most common Services occupations in Merrill are Food Preparation & Serving (45 | 9.1%), Cleaning & Maintenance (22 | 4.4%), Healthcare Support (7 | 1.4%), and Personal Care & Service (7 | 1.4%).
Services Occupations by Sex
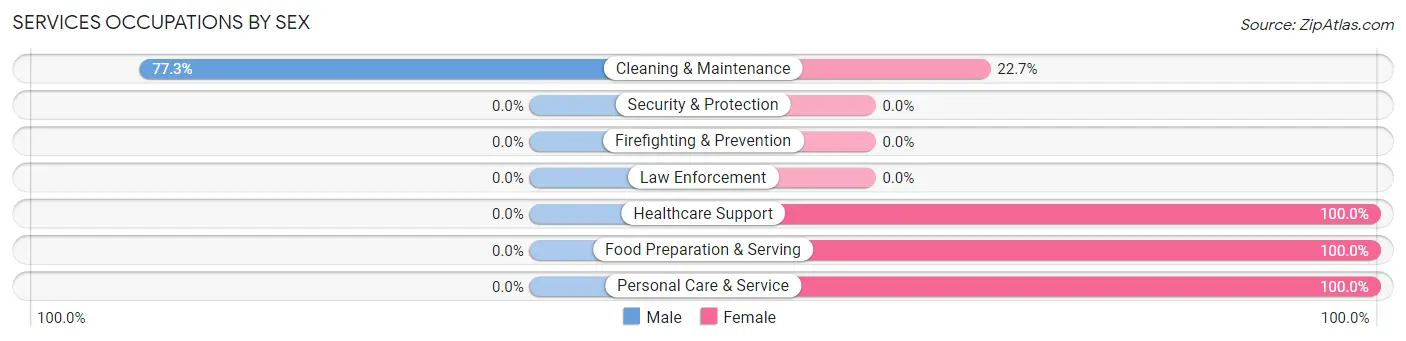
| Occupation | Male | Female |
| Healthcare Support | 0 (0.0%) | 7 (100.0%) |
| Security & Protection | 0 (0.0%) | 0 (0.0%) |
| Firefighting & Prevention | 0 (0.0%) | 0 (0.0%) |
| Law Enforcement | 0 (0.0%) | 0 (0.0%) |
| Food Preparation & Serving | 0 (0.0%) | 45 (100.0%) |
| Cleaning & Maintenance | 17 (77.3%) | 5 (22.7%) |
| Personal Care & Service | 0 (0.0%) | 7 (100.0%) |
| Total (Category) | 17 (21.0%) | 64 (79.0%) |
| Total (Overall) | 280 (56.6%) | 215 (43.4%) |
Sales and Office Occupations
The most common Sales and Office occupations in Merrill are Office & Administration (54 | 10.9%), and Sales & Related (50 | 10.1%).
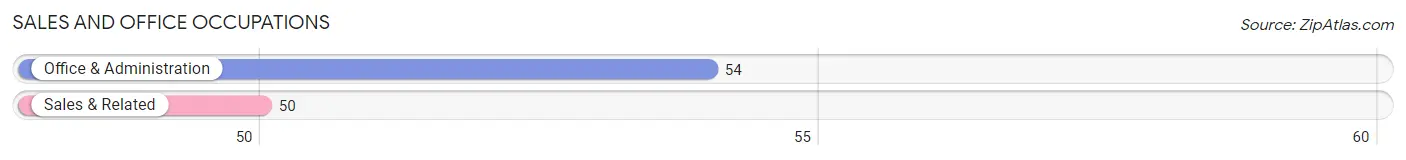
Sales and Office Occupations by Sex
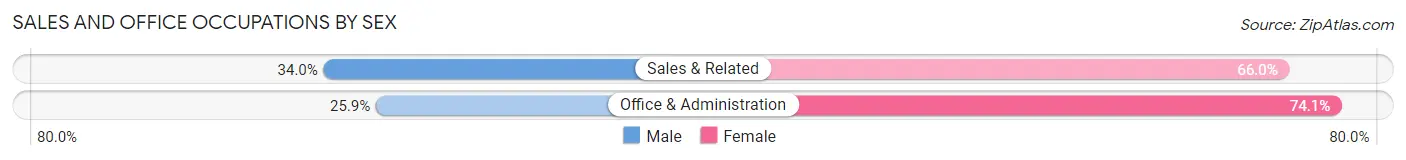
| Occupation | Male | Female |
| Sales & Related | 17 (34.0%) | 33 (66.0%) |
| Office & Administration | 14 (25.9%) | 40 (74.1%) |
| Total (Category) | 31 (29.8%) | 73 (70.2%) |
| Total (Overall) | 280 (56.6%) | 215 (43.4%) |
Natural Resources, Construction and Maintenance Occupations
The most common Natural Resources, Construction and Maintenance occupations in Merrill are Installation, Maintenance & Repair (18 | 3.6%), Construction & Extraction (11 | 2.2%), and Farming, Fishing & Forestry (10 | 2.0%).
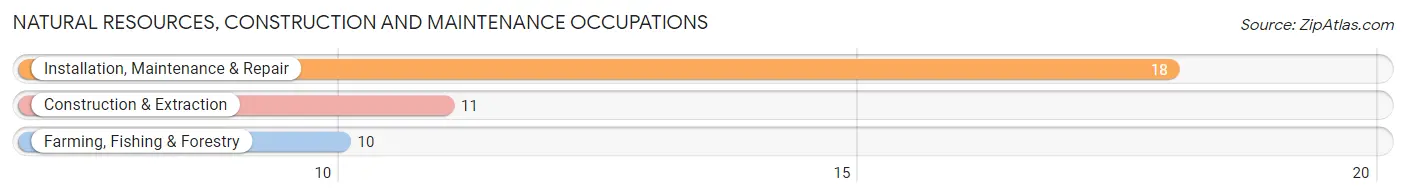
Natural Resources, Construction and Maintenance Occupations by Sex
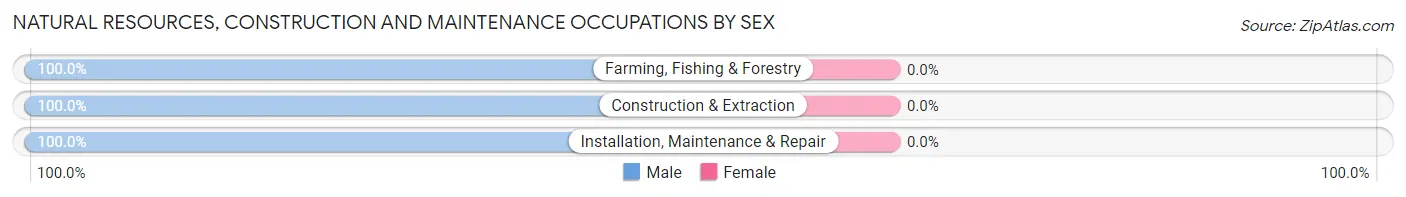
| Occupation | Male | Female |
| Farming, Fishing & Forestry | 10 (100.0%) | 0 (0.0%) |
| Construction & Extraction | 11 (100.0%) | 0 (0.0%) |
| Installation, Maintenance & Repair | 18 (100.0%) | 0 (0.0%) |
| Total (Category) | 39 (100.0%) | 0 (0.0%) |
| Total (Overall) | 280 (56.6%) | 215 (43.4%) |
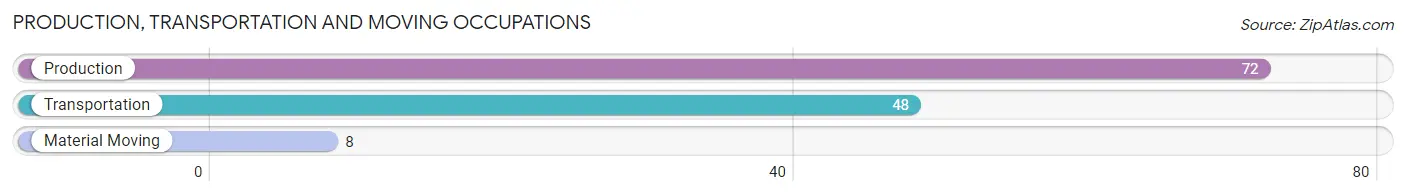
Production, Transportation and Moving Occupations
The most common Production, Transportation and Moving occupations in Merrill are Production (72 | 14.5%), Transportation (48 | 9.7%), and Material Moving (8 | 1.6%).
Production, Transportation and Moving Occupations by Sex
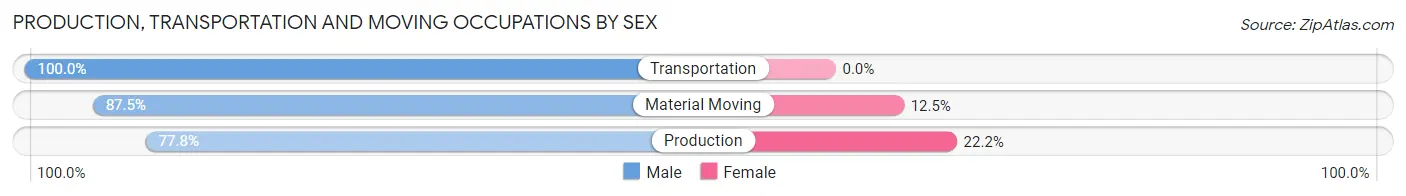
| Occupation | Male | Female |
| Production | 56 (77.8%) | 16 (22.2%) |
| Transportation | 48 (100.0%) | 0 (0.0%) |
| Material Moving | 7 (87.5%) | 1 (12.5%) |
| Total (Category) | 111 (86.7%) | 17 (13.3%) |
| Total (Overall) | 280 (56.6%) | 215 (43.4%) |
Employment Industries by Sex in Merrill
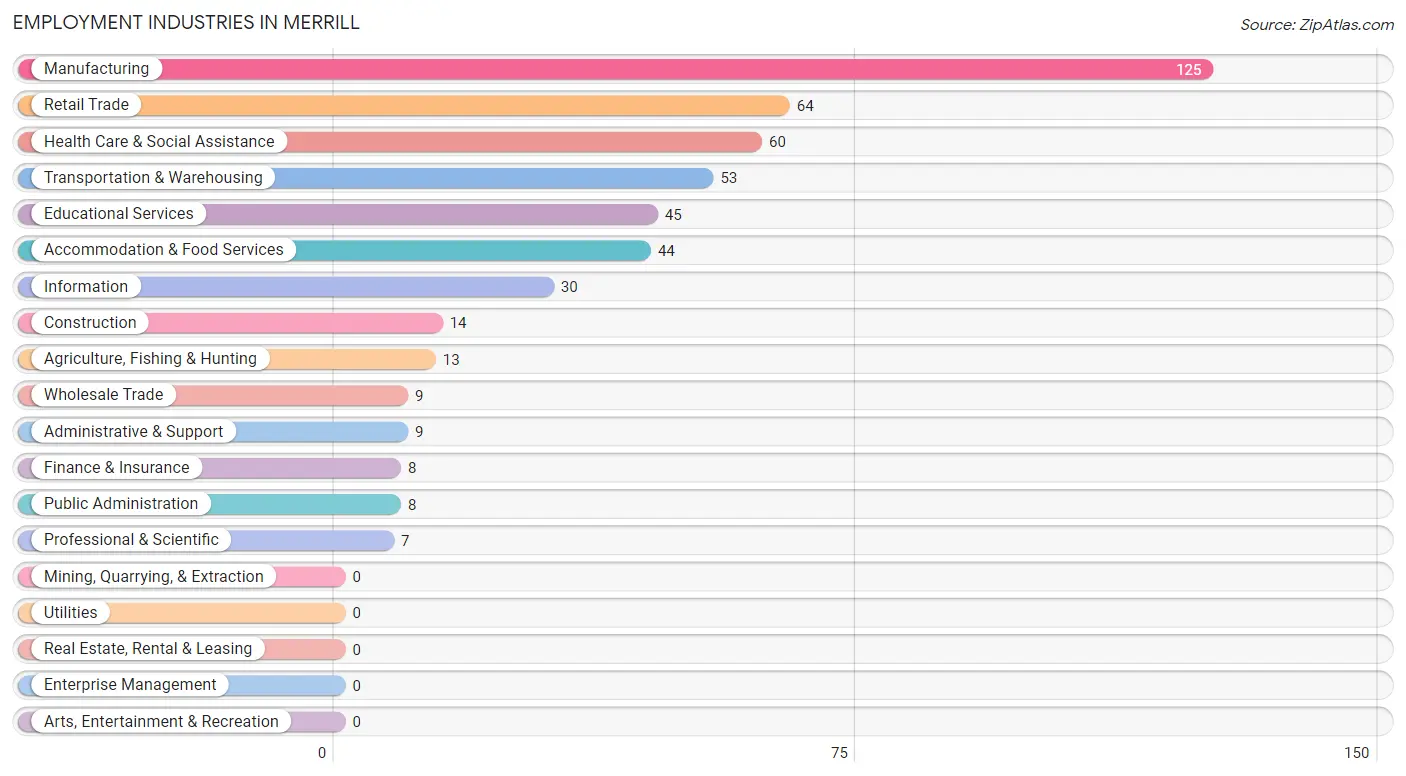
Employment Industries in Merrill
The major employment industries in Merrill include Manufacturing (125 | 25.3%), Retail Trade (64 | 12.9%), Health Care & Social Assistance (60 | 12.1%), Transportation & Warehousing (53 | 10.7%), and Educational Services (45 | 9.1%).
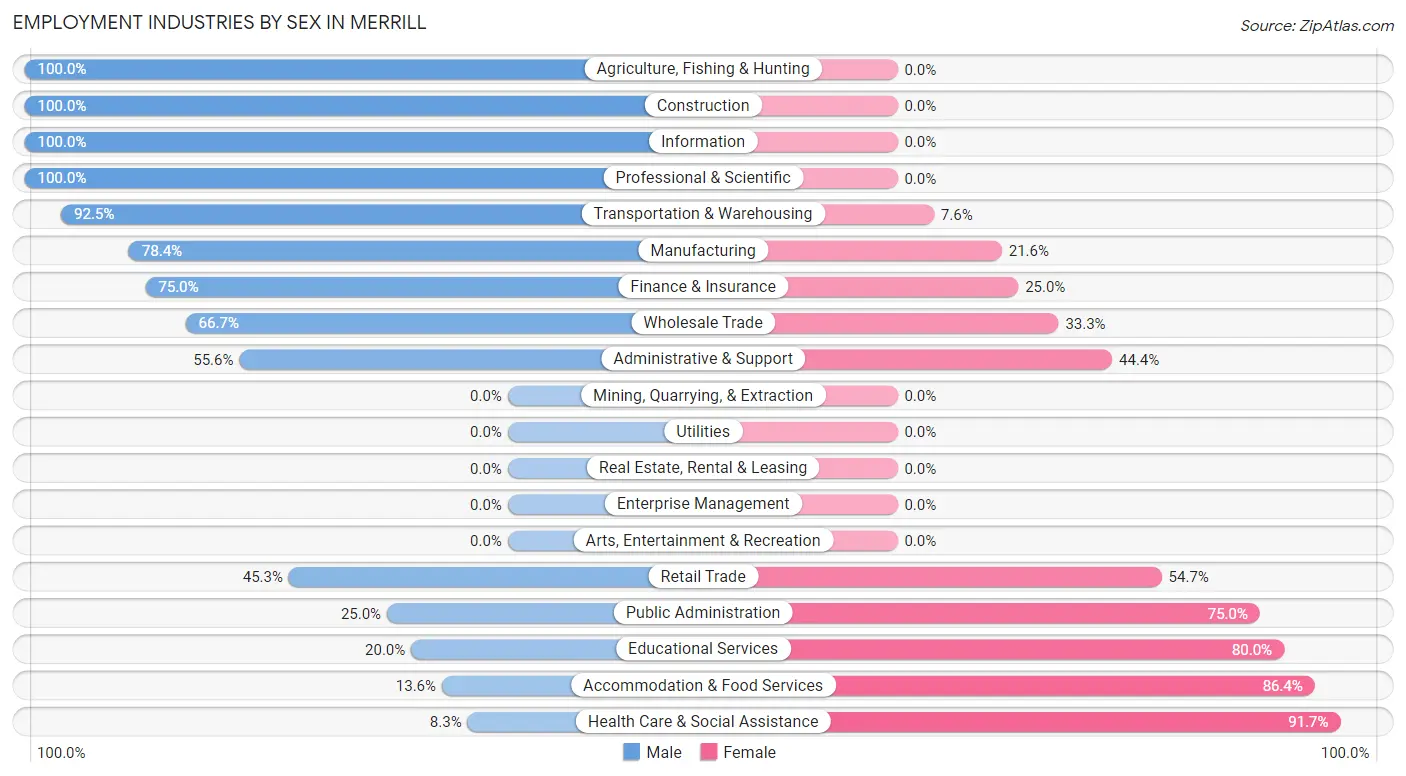
Employment Industries by Sex in Merrill
The Merrill industries that see more men than women are Agriculture, Fishing & Hunting (100.0%), Construction (100.0%), and Information (100.0%), whereas the industries that tend to have a higher number of women are Health Care & Social Assistance (91.7%), Accommodation & Food Services (86.4%), and Educational Services (80.0%).
| Industry | Male | Female |
| Agriculture, Fishing & Hunting | 13 (100.0%) | 0 (0.0%) |
| Mining, Quarrying, & Extraction | 0 (0.0%) | 0 (0.0%) |
| Construction | 14 (100.0%) | 0 (0.0%) |
| Manufacturing | 98 (78.4%) | 27 (21.6%) |
| Wholesale Trade | 6 (66.7%) | 3 (33.3%) |
| Retail Trade | 29 (45.3%) | 35 (54.7%) |
| Transportation & Warehousing | 49 (92.4%) | 4 (7.5%) |
| Utilities | 0 (0.0%) | 0 (0.0%) |
| Information | 30 (100.0%) | 0 (0.0%) |
| Finance & Insurance | 6 (75.0%) | 2 (25.0%) |
| Real Estate, Rental & Leasing | 0 (0.0%) | 0 (0.0%) |
| Professional & Scientific | 7 (100.0%) | 0 (0.0%) |
| Enterprise Management | 0 (0.0%) | 0 (0.0%) |
| Administrative & Support | 5 (55.6%) | 4 (44.4%) |
| Educational Services | 9 (20.0%) | 36 (80.0%) |
| Health Care & Social Assistance | 5 (8.3%) | 55 (91.7%) |
| Arts, Entertainment & Recreation | 0 (0.0%) | 0 (0.0%) |
| Accommodation & Food Services | 6 (13.6%) | 38 (86.4%) |
| Public Administration | 2 (25.0%) | 6 (75.0%) |
| Total | 280 (56.6%) | 215 (43.4%) |
Education in Merrill
School Enrollment in Merrill
The most common levels of schooling among the 289 students in Merrill are elementary school (91 | 31.5%), high school (80 | 27.7%), and middle school (48 | 16.6%).
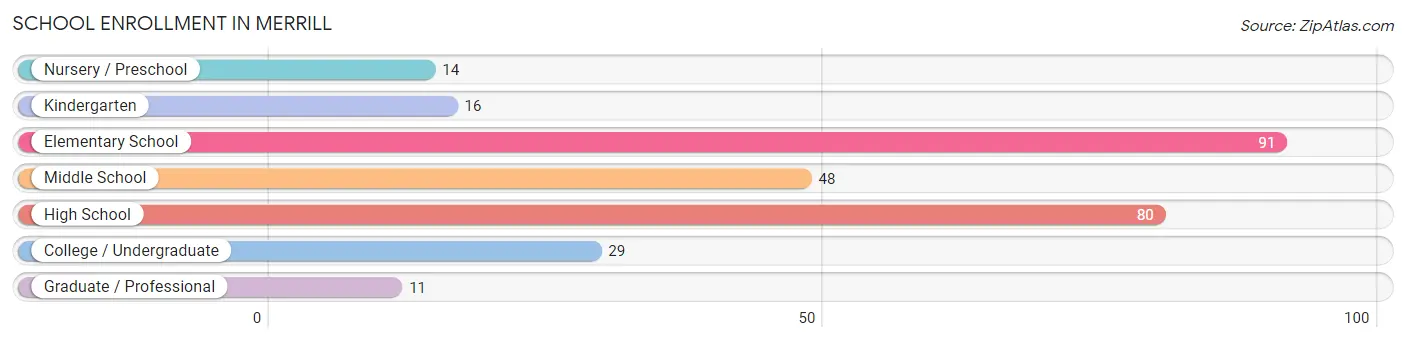
| School Level | # Students | % Students |
| Nursery / Preschool | 14 | 4.8% |
| Kindergarten | 16 | 5.5% |
| Elementary School | 91 | 31.5% |
| Middle School | 48 | 16.6% |
| High School | 80 | 27.7% |
| College / Undergraduate | 29 | 10.0% |
| Graduate / Professional | 11 | 3.8% |
| Total | 289 | 100.0% |
School Enrollment by Age by Funding Source in Merrill
Out of a total of 289 students who are enrolled in schools in Merrill, 49 (17.0%) attend a private institution, while the remaining 240 (83.0%) are enrolled in public schools. The age group of 3 to 4 year olds has the highest likelihood of being enrolled in private schools, with 5 (50.0% in the age bracket) enrolled. Conversely, the age group of 10 to 14 year olds has the lowest likelihood of being enrolled in a private school, with 48 (100.0% in the age bracket) attending a public institution.
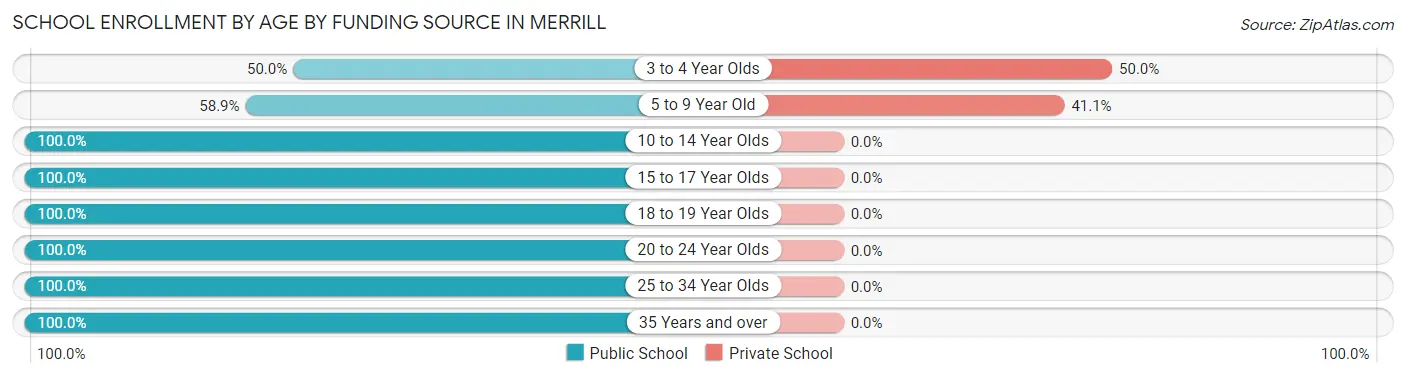
| Age Bracket | Public School | Private School |
| 3 to 4 Year Olds | 5 (50.0%) | 5 (50.0%) |
| 5 to 9 Year Old | 63 (58.9%) | 44 (41.1%) |
| 10 to 14 Year Olds | 48 (100.0%) | 0 (0.0%) |
| 15 to 17 Year Olds | 70 (100.0%) | 0 (0.0%) |
| 18 to 19 Year Olds | 11 (100.0%) | 0 (0.0%) |
| 20 to 24 Year Olds | 24 (100.0%) | 0 (0.0%) |
| 25 to 34 Year Olds | 12 (100.0%) | 0 (0.0%) |
| 35 Years and over | 7 (100.0%) | 0 (0.0%) |
| Total | 240 (83.0%) | 49 (17.0%) |
Educational Attainment by Field of Study in Merrill
Psychology (25 | 25.0%), arts & humanities (24 | 24.0%), education (14 | 14.0%), bio, nature & agricultural (9 | 9.0%), and business (8 | 8.0%) are the most common fields of study among 100 individuals in Merrill who have obtained a bachelor's degree or higher.
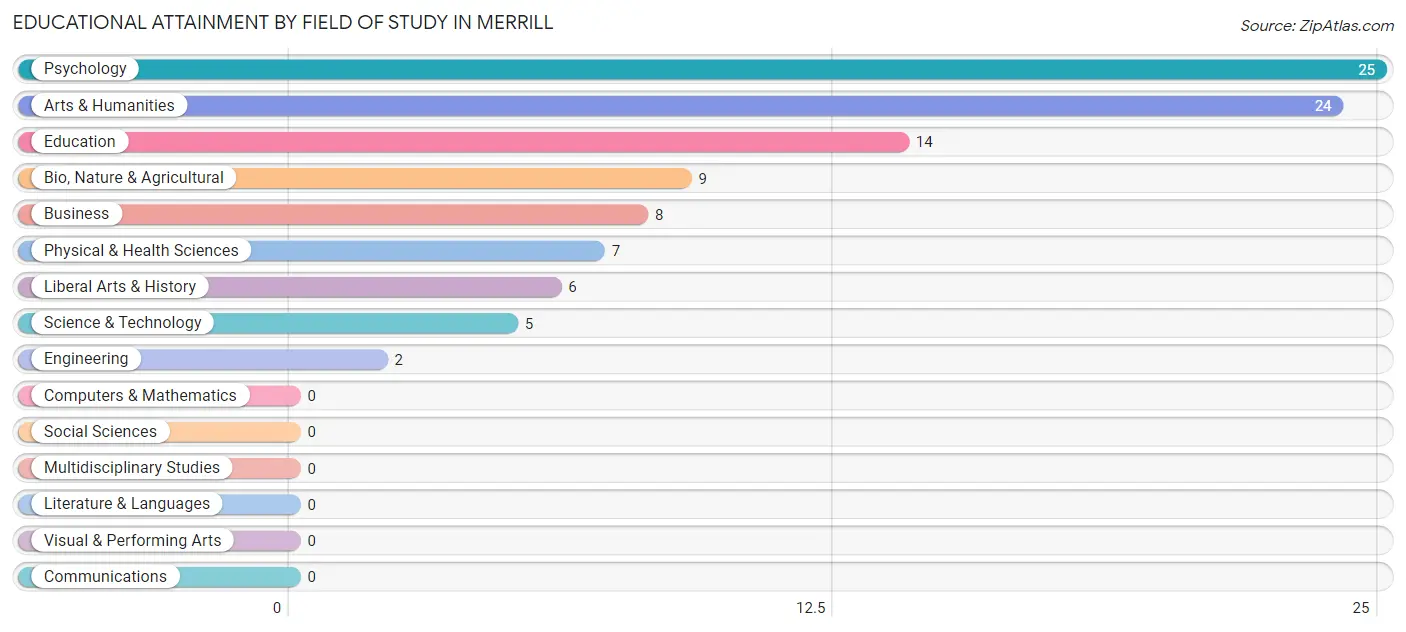
| Field of Study | # Graduates | % Graduates |
| Computers & Mathematics | 0 | 0.0% |
| Bio, Nature & Agricultural | 9 | 9.0% |
| Physical & Health Sciences | 7 | 7.0% |
| Psychology | 25 | 25.0% |
| Social Sciences | 0 | 0.0% |
| Engineering | 2 | 2.0% |
| Multidisciplinary Studies | 0 | 0.0% |
| Science & Technology | 5 | 5.0% |
| Business | 8 | 8.0% |
| Education | 14 | 14.0% |
| Literature & Languages | 0 | 0.0% |
| Liberal Arts & History | 6 | 6.0% |
| Visual & Performing Arts | 0 | 0.0% |
| Communications | 0 | 0.0% |
| Arts & Humanities | 24 | 24.0% |
| Total | 100 | 100.0% |
Transportation & Commute in Merrill
Vehicle Availability by Sex in Merrill
The most prevalent vehicle ownership categories in Merrill are males with 2 vehicles (106, accounting for 38.8%) and females with 2 vehicles (69, making up 49.5%).
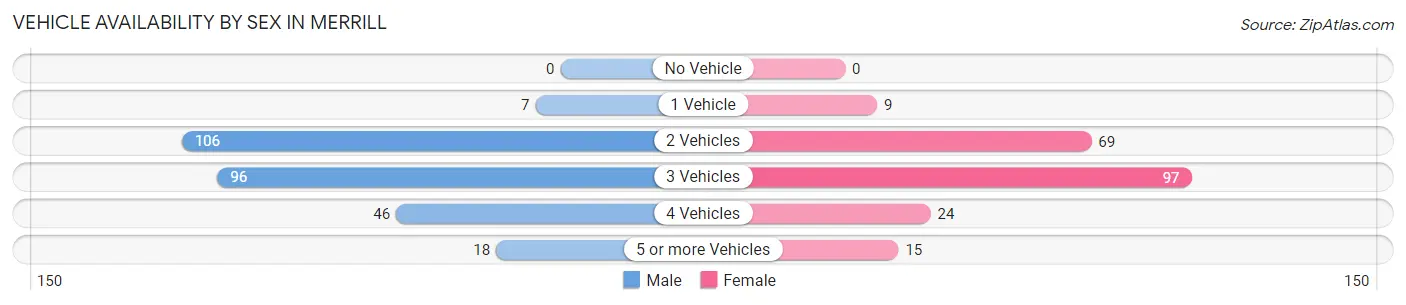
| Vehicles Available | Male | Female |
| No Vehicle | 0 (0.0%) | 0 (0.0%) |
| 1 Vehicle | 7 (2.6%) | 9 (4.2%) |
| 2 Vehicles | 106 (38.8%) | 69 (32.2%) |
| 3 Vehicles | 96 (35.2%) | 97 (45.3%) |
| 4 Vehicles | 46 (16.9%) | 24 (11.2%) |
| 5 or more Vehicles | 18 (6.6%) | 15 (7.0%) |
| Total | 273 (100.0%) | 214 (100.0%) |
Commute Time in Merrill
The most frequently occuring commute durations in Merrill are 30 to 34 minutes (103 commuters, 22.4%), 10 to 14 minutes (101 commuters, 22.0%), and 25 to 29 minutes (67 commuters, 14.6%).
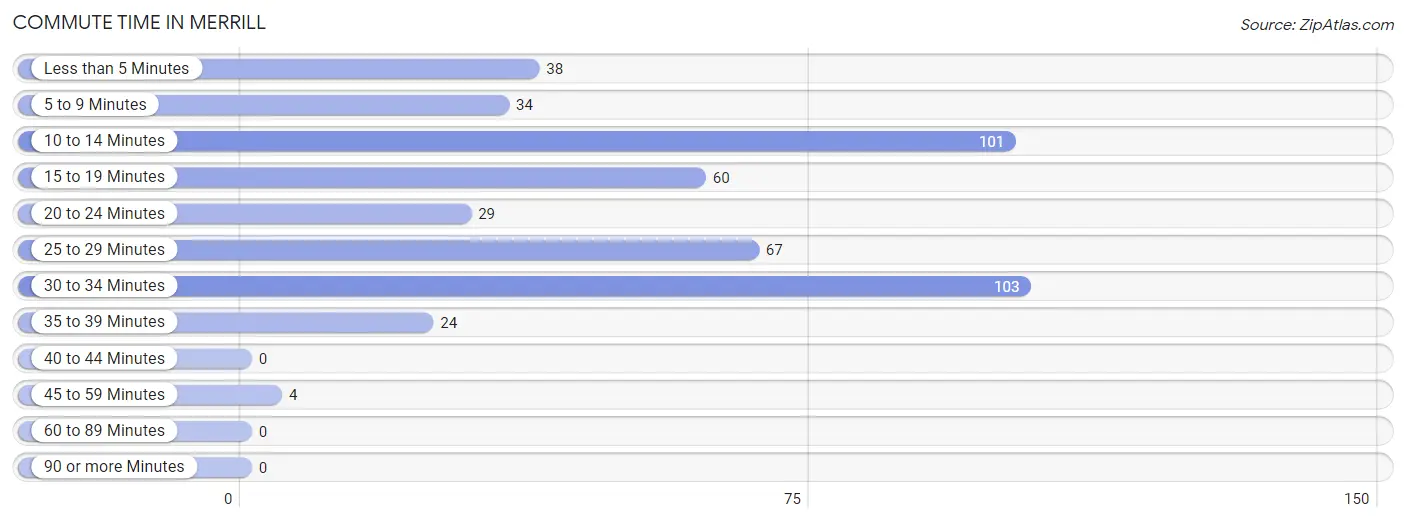
| Commute Time | # Commuters | % Commuters |
| Less than 5 Minutes | 38 | 8.3% |
| 5 to 9 Minutes | 34 | 7.4% |
| 10 to 14 Minutes | 101 | 22.0% |
| 15 to 19 Minutes | 60 | 13.0% |
| 20 to 24 Minutes | 29 | 6.3% |
| 25 to 29 Minutes | 67 | 14.6% |
| 30 to 34 Minutes | 103 | 22.4% |
| 35 to 39 Minutes | 24 | 5.2% |
| 40 to 44 Minutes | 0 | 0.0% |
| 45 to 59 Minutes | 4 | 0.9% |
| 60 to 89 Minutes | 0 | 0.0% |
| 90 or more Minutes | 0 | 0.0% |
Commute Time by Sex in Merrill
The most common commute times in Merrill are 10 to 14 minutes (66 commuters, 25.0%) for males and 30 to 34 minutes (49 commuters, 25.0%) for females.
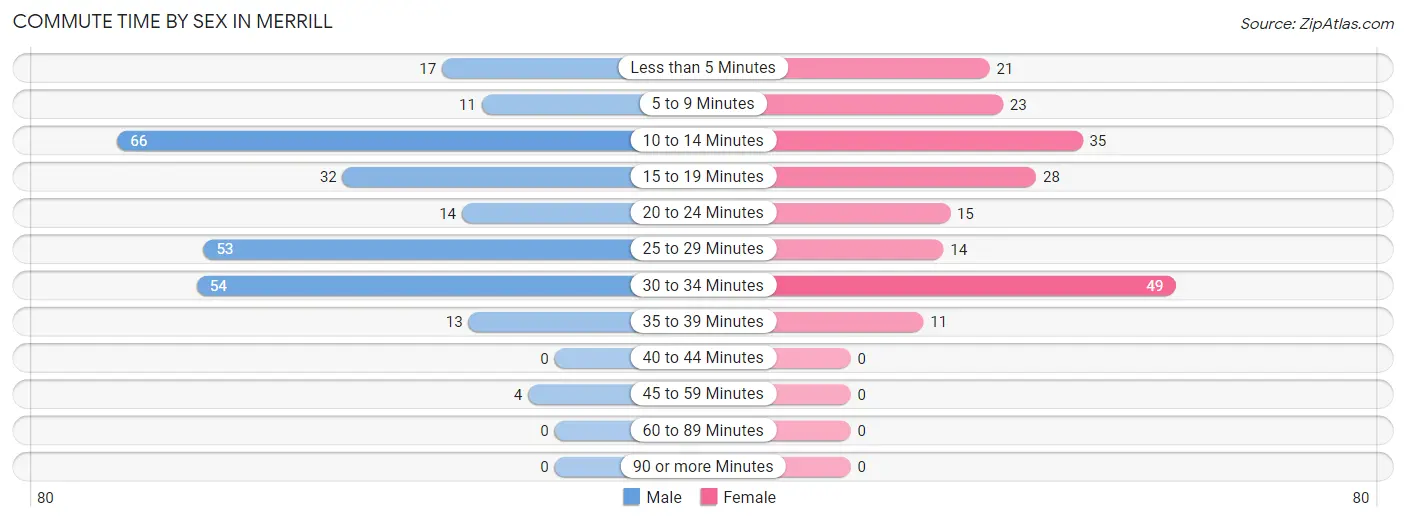
| Commute Time | Male | Female |
| Less than 5 Minutes | 17 (6.4%) | 21 (10.7%) |
| 5 to 9 Minutes | 11 (4.2%) | 23 (11.7%) |
| 10 to 14 Minutes | 66 (25.0%) | 35 (17.9%) |
| 15 to 19 Minutes | 32 (12.1%) | 28 (14.3%) |
| 20 to 24 Minutes | 14 (5.3%) | 15 (7.6%) |
| 25 to 29 Minutes | 53 (20.1%) | 14 (7.1%) |
| 30 to 34 Minutes | 54 (20.4%) | 49 (25.0%) |
| 35 to 39 Minutes | 13 (4.9%) | 11 (5.6%) |
| 40 to 44 Minutes | 0 (0.0%) | 0 (0.0%) |
| 45 to 59 Minutes | 4 (1.5%) | 0 (0.0%) |
| 60 to 89 Minutes | 0 (0.0%) | 0 (0.0%) |
| 90 or more Minutes | 0 (0.0%) | 0 (0.0%) |
Time of Departure to Work by Sex in Merrill
The most frequent times of departure to work in Merrill are 5:30 AM to 5:59 AM (63, 23.9%) for males and 7:30 AM to 7:59 AM (41, 20.9%) for females.
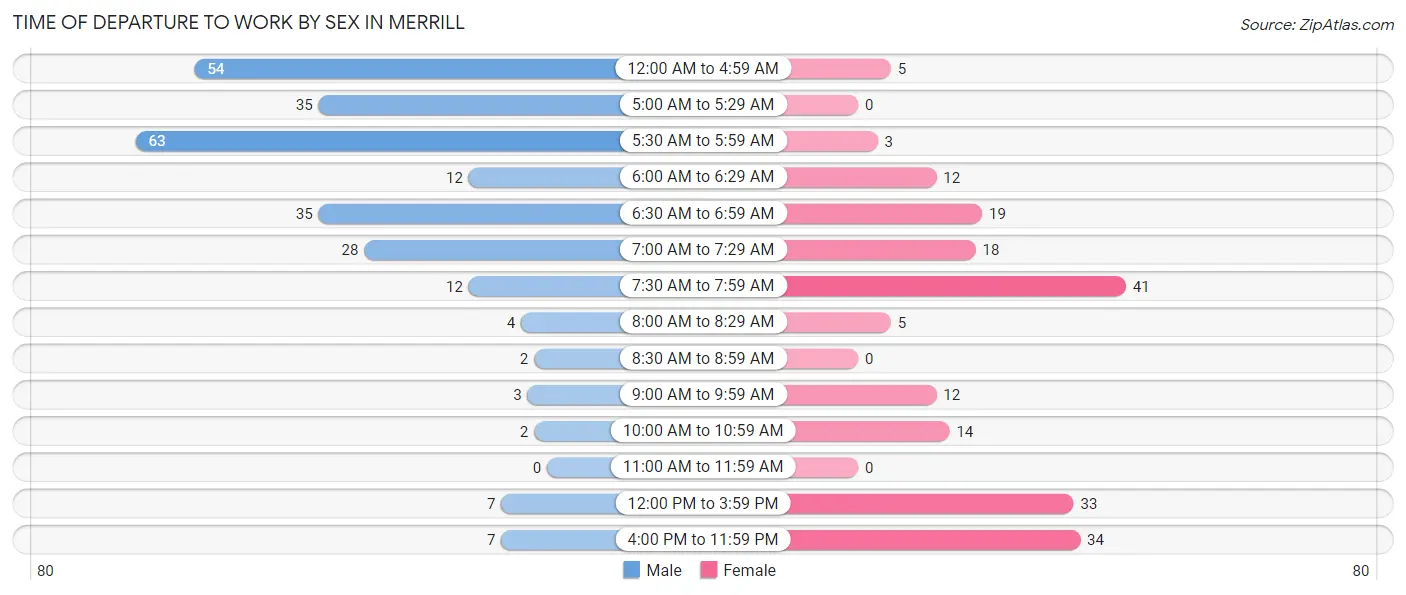
| Time of Departure | Male | Female |
| 12:00 AM to 4:59 AM | 54 (20.4%) | 5 (2.5%) |
| 5:00 AM to 5:29 AM | 35 (13.3%) | 0 (0.0%) |
| 5:30 AM to 5:59 AM | 63 (23.9%) | 3 (1.5%) |
| 6:00 AM to 6:29 AM | 12 (4.5%) | 12 (6.1%) |
| 6:30 AM to 6:59 AM | 35 (13.3%) | 19 (9.7%) |
| 7:00 AM to 7:29 AM | 28 (10.6%) | 18 (9.2%) |
| 7:30 AM to 7:59 AM | 12 (4.5%) | 41 (20.9%) |
| 8:00 AM to 8:29 AM | 4 (1.5%) | 5 (2.5%) |
| 8:30 AM to 8:59 AM | 2 (0.8%) | 0 (0.0%) |
| 9:00 AM to 9:59 AM | 3 (1.1%) | 12 (6.1%) |
| 10:00 AM to 10:59 AM | 2 (0.8%) | 14 (7.1%) |
| 11:00 AM to 11:59 AM | 0 (0.0%) | 0 (0.0%) |
| 12:00 PM to 3:59 PM | 7 (2.6%) | 33 (16.8%) |
| 4:00 PM to 11:59 PM | 7 (2.6%) | 34 (17.3%) |
| Total | 264 (100.0%) | 196 (100.0%) |
Housing Occupancy in Merrill
Occupancy by Ownership in Merrill
Of the total 360 dwellings in Merrill, owner-occupied units account for 284 (78.9%), while renter-occupied units make up 76 (21.1%).
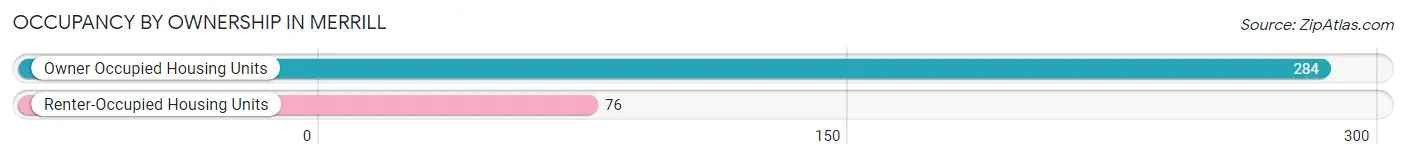
| Occupancy | # Housing Units | % Housing Units |
| Owner Occupied Housing Units | 284 | 78.9% |
| Renter-Occupied Housing Units | 76 | 21.1% |
| Total Occupied Housing Units | 360 | 100.0% |
Occupancy by Household Size in Merrill
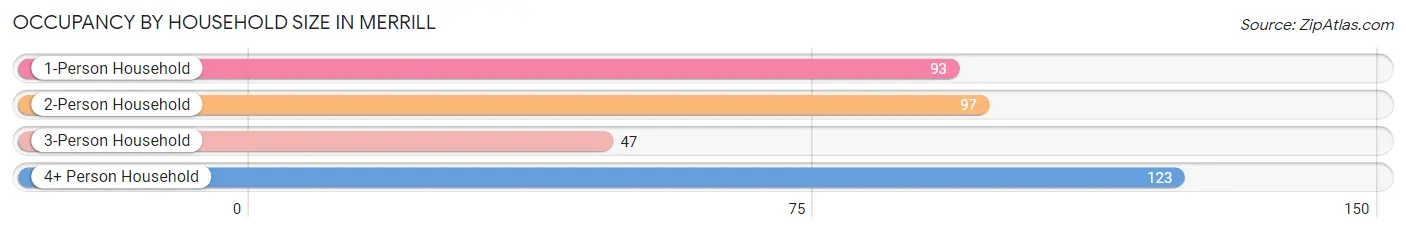
| Household Size | # Housing Units | % Housing Units |
| 1-Person Household | 93 | 25.8% |
| 2-Person Household | 97 | 26.9% |
| 3-Person Household | 47 | 13.1% |
| 4+ Person Household | 123 | 34.2% |
| Total Housing Units | 360 | 100.0% |
Occupancy by Ownership by Household Size in Merrill
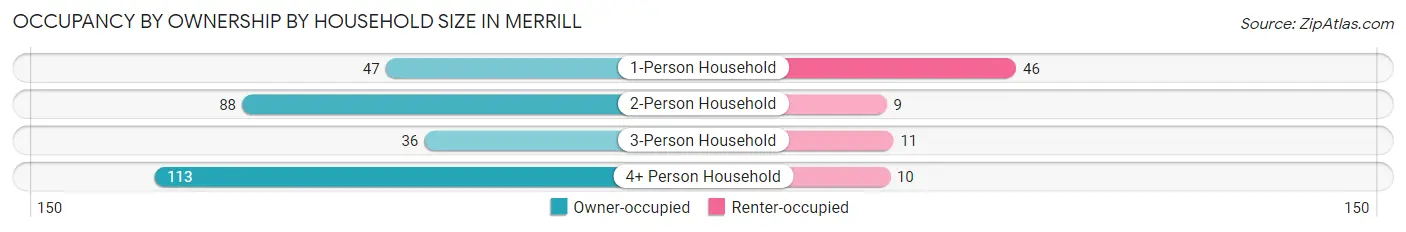
| Household Size | Owner-occupied | Renter-occupied |
| 1-Person Household | 47 (50.5%) | 46 (49.5%) |
| 2-Person Household | 88 (90.7%) | 9 (9.3%) |
| 3-Person Household | 36 (76.6%) | 11 (23.4%) |
| 4+ Person Household | 113 (91.9%) | 10 (8.1%) |
| Total Housing Units | 284 (78.9%) | 76 (21.1%) |
Occupancy by Educational Attainment in Merrill
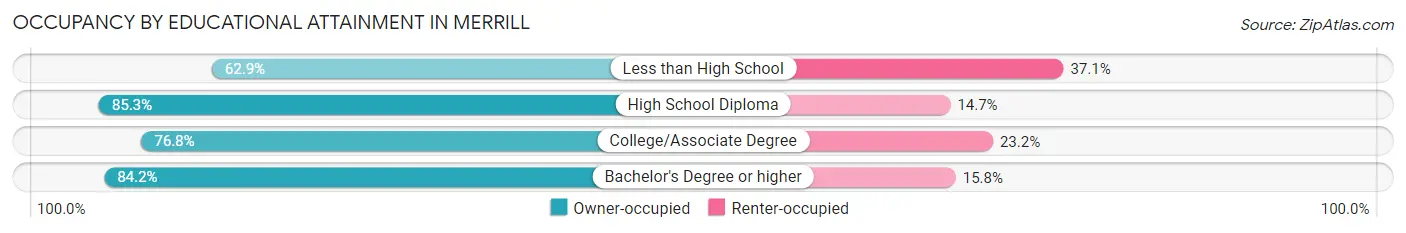
| Household Size | Owner-occupied | Renter-occupied |
| Less than High School | 22 (62.9%) | 13 (37.1%) |
| High School Diploma | 110 (85.3%) | 19 (14.7%) |
| College/Associate Degree | 136 (76.8%) | 41 (23.2%) |
| Bachelor's Degree or higher | 16 (84.2%) | 3 (15.8%) |
Occupancy by Age of Householder in Merrill
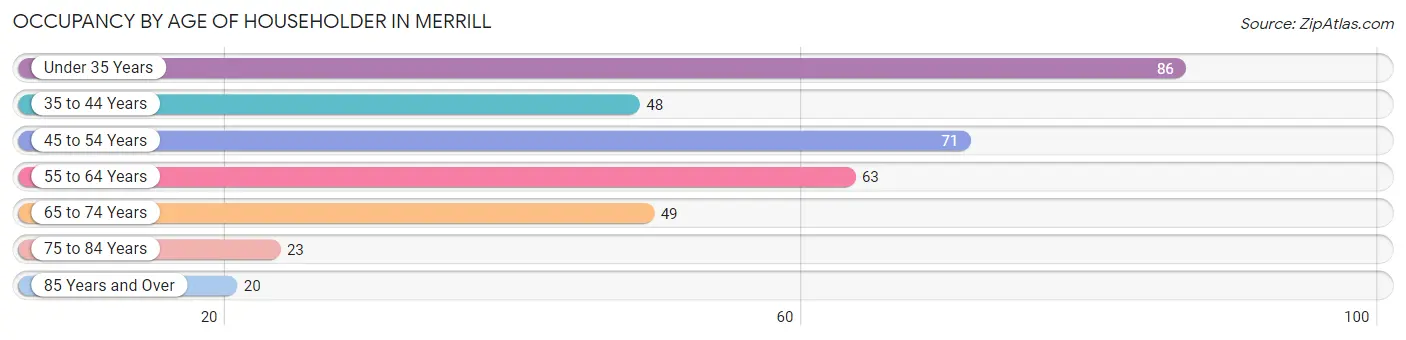
| Age Bracket | # Households | % Households |
| Under 35 Years | 86 | 23.9% |
| 35 to 44 Years | 48 | 13.3% |
| 45 to 54 Years | 71 | 19.7% |
| 55 to 64 Years | 63 | 17.5% |
| 65 to 74 Years | 49 | 13.6% |
| 75 to 84 Years | 23 | 6.4% |
| 85 Years and Over | 20 | 5.6% |
| Total | 360 | 100.0% |
Housing Finances in Merrill
Median Income by Occupancy in Merrill
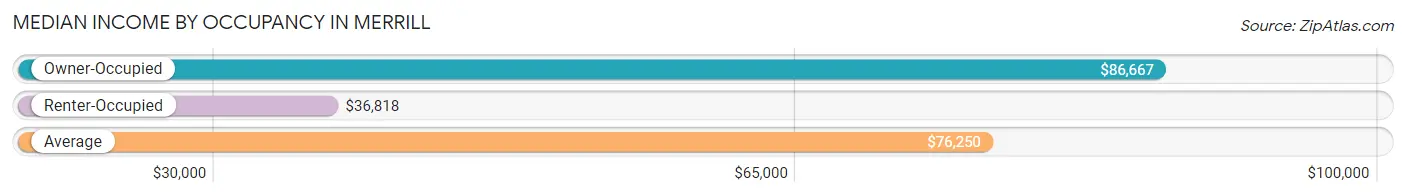
| Occupancy Type | # Households | Median Income |
| Owner-Occupied | 284 (78.9%) | $86,667 |
| Renter-Occupied | 76 (21.1%) | $36,818 |
| Average | 360 (100.0%) | $76,250 |
Occupancy by Householder Income Bracket in Merrill
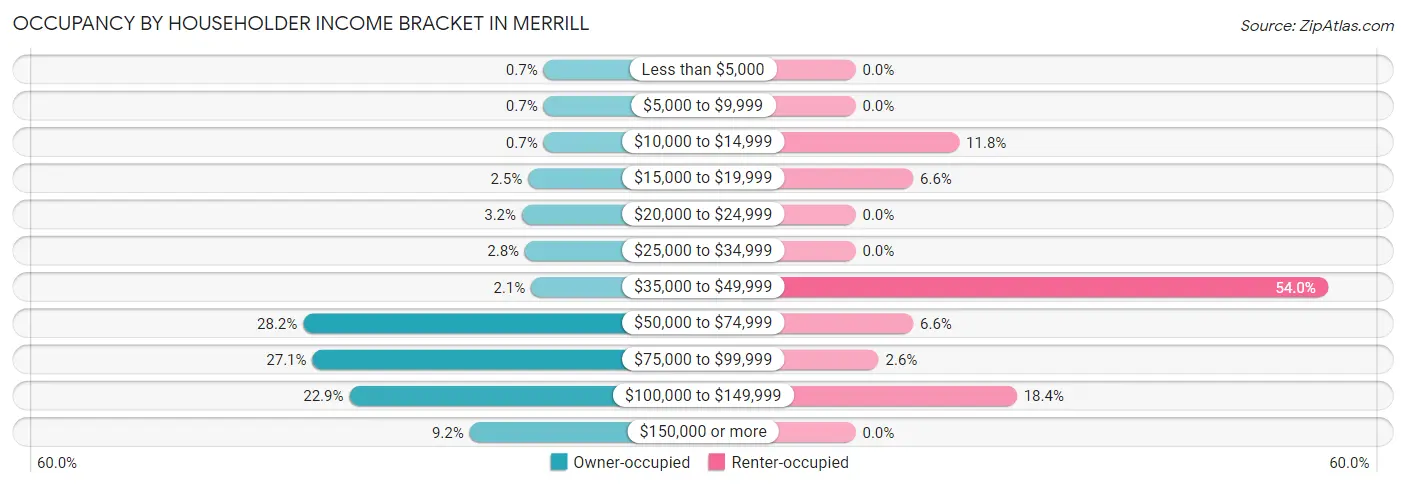
| Income Bracket | Owner-occupied | Renter-occupied |
| Less than $5,000 | 2 (0.7%) | 0 (0.0%) |
| $5,000 to $9,999 | 2 (0.7%) | 0 (0.0%) |
| $10,000 to $14,999 | 2 (0.7%) | 9 (11.8%) |
| $15,000 to $19,999 | 7 (2.5%) | 5 (6.6%) |
| $20,000 to $24,999 | 9 (3.2%) | 0 (0.0%) |
| $25,000 to $34,999 | 8 (2.8%) | 0 (0.0%) |
| $35,000 to $49,999 | 6 (2.1%) | 41 (53.9%) |
| $50,000 to $74,999 | 80 (28.2%) | 5 (6.6%) |
| $75,000 to $99,999 | 77 (27.1%) | 2 (2.6%) |
| $100,000 to $149,999 | 65 (22.9%) | 14 (18.4%) |
| $150,000 or more | 26 (9.1%) | 0 (0.0%) |
| Total | 284 (100.0%) | 76 (100.0%) |
Monthly Housing Cost Tiers in Merrill
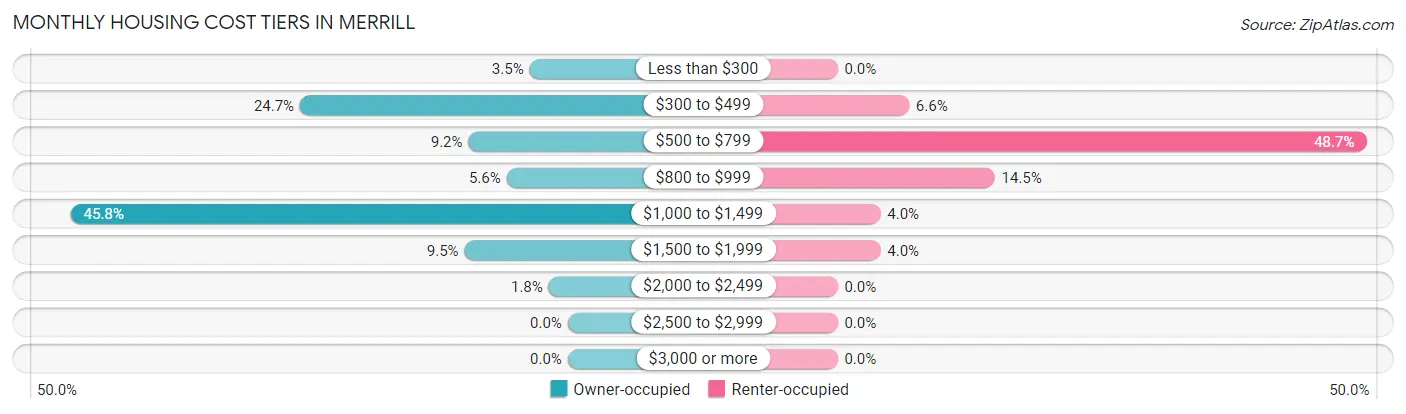
| Monthly Cost | Owner-occupied | Renter-occupied |
| Less than $300 | 10 (3.5%) | 0 (0.0%) |
| $300 to $499 | 70 (24.6%) | 5 (6.6%) |
| $500 to $799 | 26 (9.1%) | 37 (48.7%) |
| $800 to $999 | 16 (5.6%) | 11 (14.5%) |
| $1,000 to $1,499 | 130 (45.8%) | 3 (4.0%) |
| $1,500 to $1,999 | 27 (9.5%) | 3 (4.0%) |
| $2,000 to $2,499 | 5 (1.8%) | 0 (0.0%) |
| $2,500 to $2,999 | 0 (0.0%) | 0 (0.0%) |
| $3,000 or more | 0 (0.0%) | 0 (0.0%) |
| Total | 284 (100.0%) | 76 (100.0%) |
Physical Housing Characteristics in Merrill
Housing Structures in Merrill
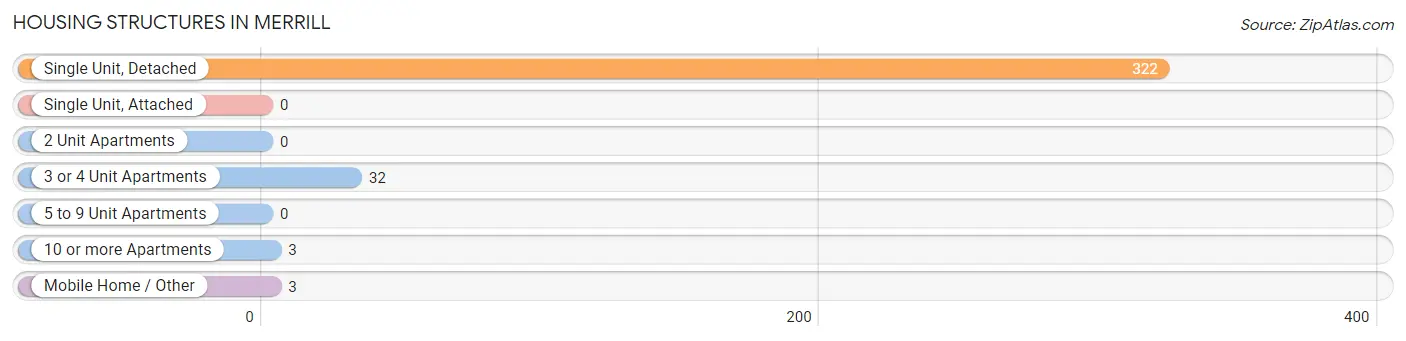
| Structure Type | # Housing Units | % Housing Units |
| Single Unit, Detached | 322 | 89.4% |
| Single Unit, Attached | 0 | 0.0% |
| 2 Unit Apartments | 0 | 0.0% |
| 3 or 4 Unit Apartments | 32 | 8.9% |
| 5 to 9 Unit Apartments | 0 | 0.0% |
| 10 or more Apartments | 3 | 0.8% |
| Mobile Home / Other | 3 | 0.8% |
| Total | 360 | 100.0% |
Housing Structures by Occupancy in Merrill
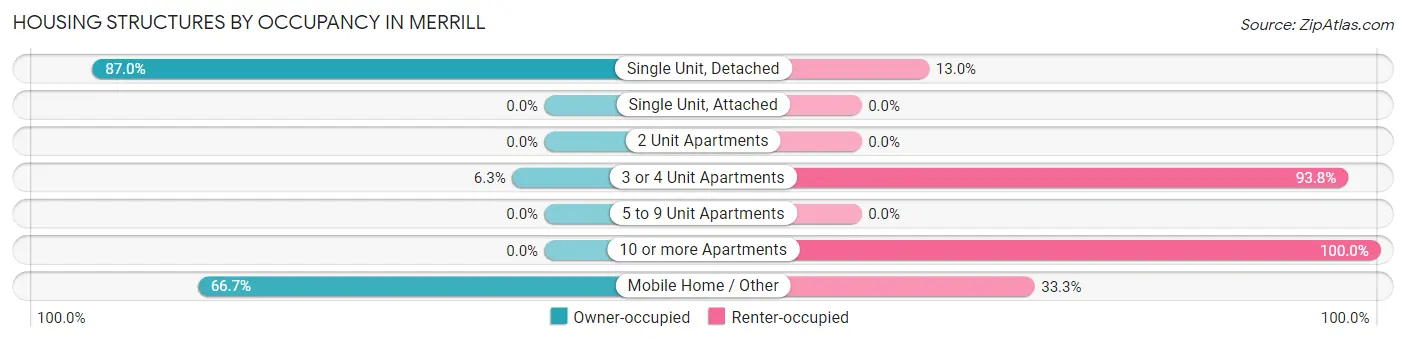
| Structure Type | Owner-occupied | Renter-occupied |
| Single Unit, Detached | 280 (87.0%) | 42 (13.0%) |
| Single Unit, Attached | 0 (0.0%) | 0 (0.0%) |
| 2 Unit Apartments | 0 (0.0%) | 0 (0.0%) |
| 3 or 4 Unit Apartments | 2 (6.2%) | 30 (93.8%) |
| 5 to 9 Unit Apartments | 0 (0.0%) | 0 (0.0%) |
| 10 or more Apartments | 0 (0.0%) | 3 (100.0%) |
| Mobile Home / Other | 2 (66.7%) | 1 (33.3%) |
| Total | 284 (78.9%) | 76 (21.1%) |
Housing Structures by Number of Rooms in Merrill
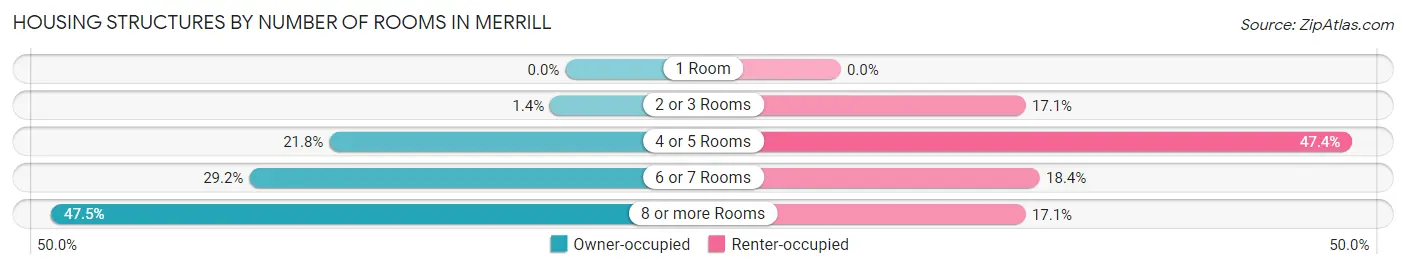
| Number of Rooms | Owner-occupied | Renter-occupied |
| 1 Room | 0 (0.0%) | 0 (0.0%) |
| 2 or 3 Rooms | 4 (1.4%) | 13 (17.1%) |
| 4 or 5 Rooms | 62 (21.8%) | 36 (47.4%) |
| 6 or 7 Rooms | 83 (29.2%) | 14 (18.4%) |
| 8 or more Rooms | 135 (47.5%) | 13 (17.1%) |
| Total | 284 (100.0%) | 76 (100.0%) |
Housing Structure by Heating Type in Merrill
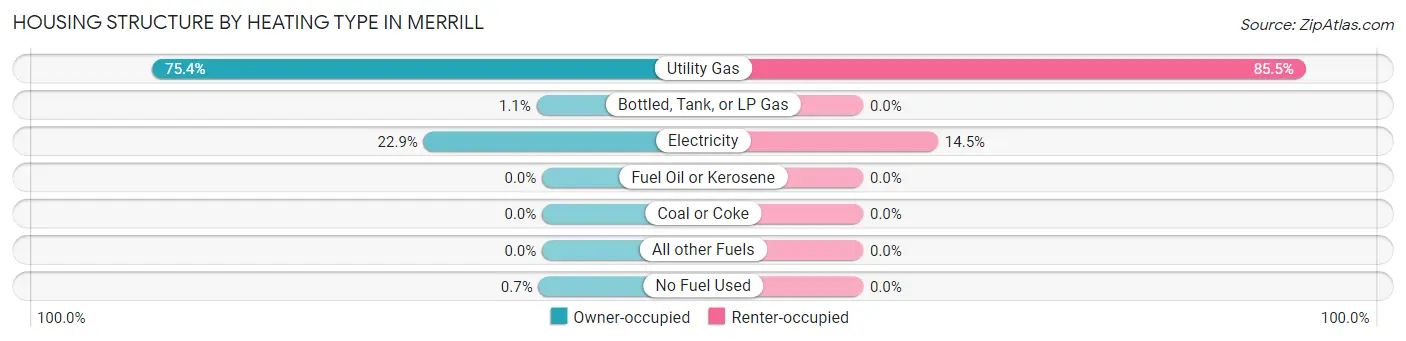
| Heating Type | Owner-occupied | Renter-occupied |
| Utility Gas | 214 (75.3%) | 65 (85.5%) |
| Bottled, Tank, or LP Gas | 3 (1.1%) | 0 (0.0%) |
| Electricity | 65 (22.9%) | 11 (14.5%) |
| Fuel Oil or Kerosene | 0 (0.0%) | 0 (0.0%) |
| Coal or Coke | 0 (0.0%) | 0 (0.0%) |
| All other Fuels | 0 (0.0%) | 0 (0.0%) |
| No Fuel Used | 2 (0.7%) | 0 (0.0%) |
| Total | 284 (100.0%) | 76 (100.0%) |
Household Vehicle Usage in Merrill
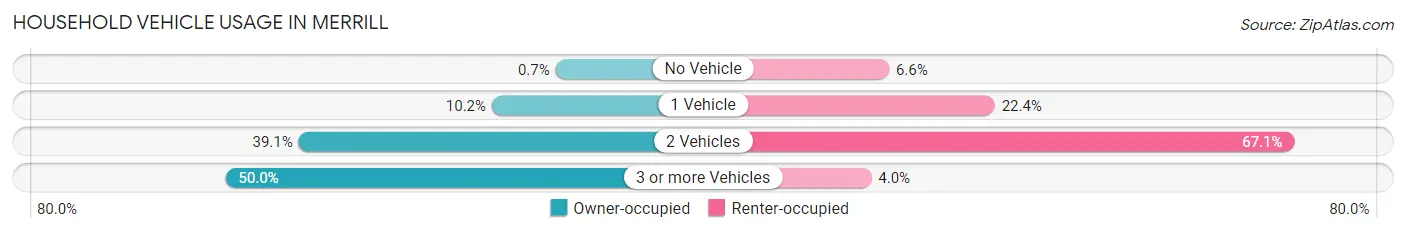
| Vehicles per Household | Owner-occupied | Renter-occupied |
| No Vehicle | 2 (0.7%) | 5 (6.6%) |
| 1 Vehicle | 29 (10.2%) | 17 (22.4%) |
| 2 Vehicles | 111 (39.1%) | 51 (67.1%) |
| 3 or more Vehicles | 142 (50.0%) | 3 (4.0%) |
| Total | 284 (100.0%) | 76 (100.0%) |
Real Estate & Mortgages in Merrill
Real Estate and Mortgage Overview in Merrill
| Characteristic | Without Mortgage | With Mortgage |
| Housing Units | 96 | 188 |
| Median Property Value | $147,500 | $153,400 |
| Median Household Income | $75,417 | $26 |
| Monthly Housing Costs | $387 | $0 |
| Real Estate Taxes | $1,556 | $2 |
Property Value by Mortgage Status in Merrill
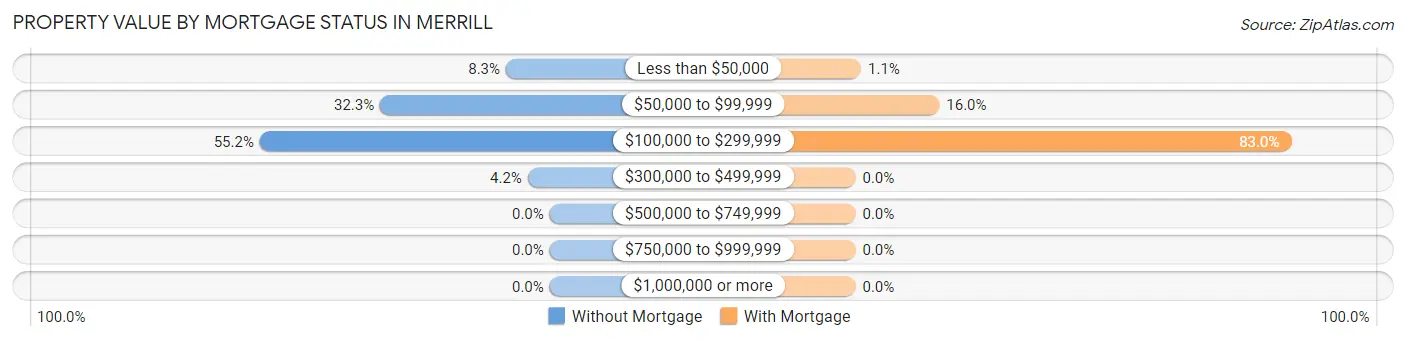
| Property Value | Without Mortgage | With Mortgage |
| Less than $50,000 | 8 (8.3%) | 2 (1.1%) |
| $50,000 to $99,999 | 31 (32.3%) | 30 (16.0%) |
| $100,000 to $299,999 | 53 (55.2%) | 156 (83.0%) |
| $300,000 to $499,999 | 4 (4.2%) | 0 (0.0%) |
| $500,000 to $749,999 | 0 (0.0%) | 0 (0.0%) |
| $750,000 to $999,999 | 0 (0.0%) | 0 (0.0%) |
| $1,000,000 or more | 0 (0.0%) | 0 (0.0%) |
| Total | 96 (100.0%) | 188 (100.0%) |
Household Income by Mortgage Status in Merrill
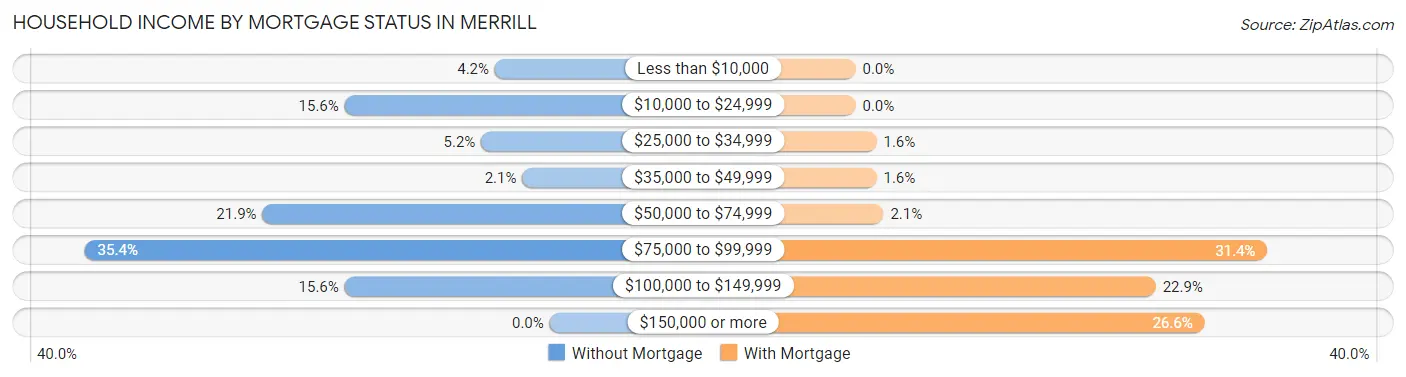
| Household Income | Without Mortgage | With Mortgage |
| Less than $10,000 | 4 (4.2%) | 0 (0.0%) |
| $10,000 to $24,999 | 15 (15.6%) | 0 (0.0%) |
| $25,000 to $34,999 | 5 (5.2%) | 3 (1.6%) |
| $35,000 to $49,999 | 2 (2.1%) | 3 (1.6%) |
| $50,000 to $74,999 | 21 (21.9%) | 4 (2.1%) |
| $75,000 to $99,999 | 34 (35.4%) | 59 (31.4%) |
| $100,000 to $149,999 | 15 (15.6%) | 43 (22.9%) |
| $150,000 or more | 0 (0.0%) | 50 (26.6%) |
| Total | 96 (100.0%) | 188 (100.0%) |
Property Value to Household Income Ratio in Merrill
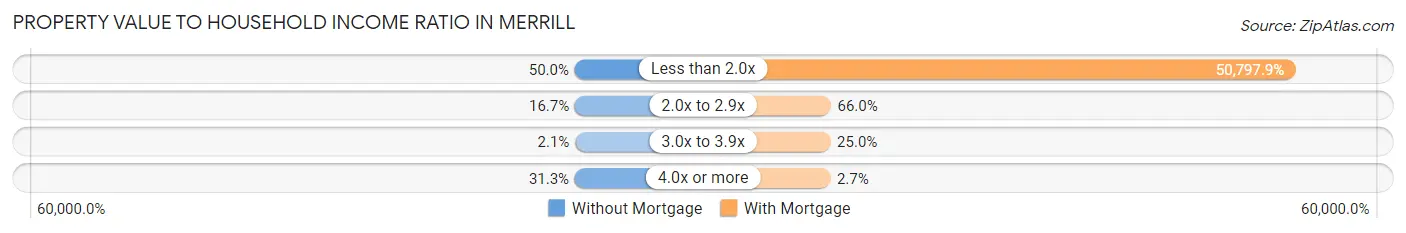
| Value-to-Income Ratio | Without Mortgage | With Mortgage |
| Less than 2.0x | 48 (50.0%) | 95,500 (50,797.9%) |
| 2.0x to 2.9x | 16 (16.7%) | 124 (66.0%) |
| 3.0x to 3.9x | 2 (2.1%) | 47 (25.0%) |
| 4.0x or more | 30 (31.2%) | 5 (2.7%) |
| Total | 96 (100.0%) | 188 (100.0%) |
Real Estate Taxes by Mortgage Status in Merrill
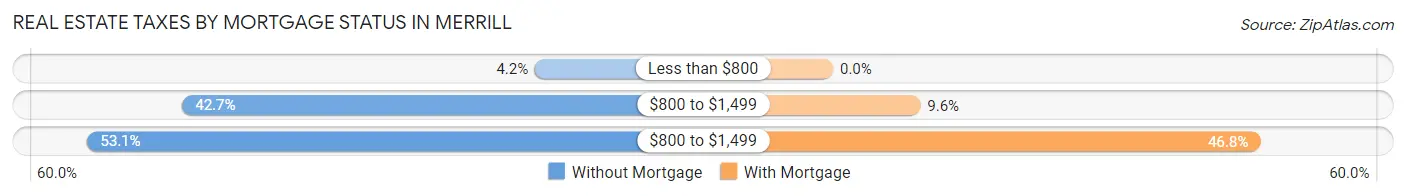
| Property Taxes | Without Mortgage | With Mortgage |
| Less than $800 | 4 (4.2%) | 0 (0.0%) |
| $800 to $1,499 | 41 (42.7%) | 18 (9.6%) |
| $800 to $1,499 | 51 (53.1%) | 88 (46.8%) |
| Total | 96 (100.0%) | 188 (100.0%) |
Health & Disability in Merrill
Health Insurance Coverage by Age in Merrill
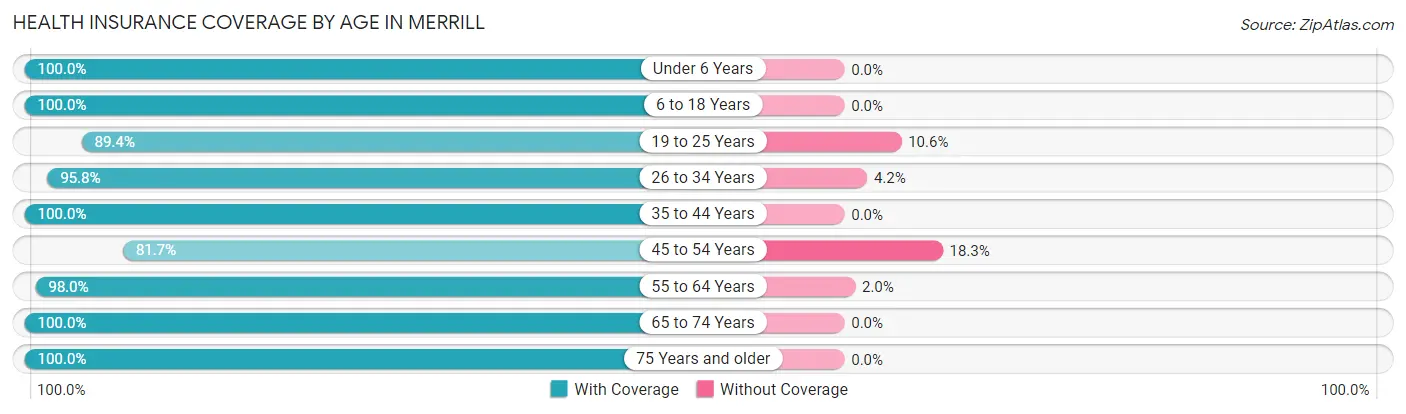
| Age Bracket | With Coverage | Without Coverage |
| Under 6 Years | 69 (100.0%) | 0 (0.0%) |
| 6 to 18 Years | 228 (100.0%) | 0 (0.0%) |
| 19 to 25 Years | 101 (89.4%) | 12 (10.6%) |
| 26 to 34 Years | 68 (95.8%) | 3 (4.2%) |
| 35 to 44 Years | 119 (100.0%) | 0 (0.0%) |
| 45 to 54 Years | 107 (81.7%) | 24 (18.3%) |
| 55 to 64 Years | 98 (98.0%) | 2 (2.0%) |
| 65 to 74 Years | 73 (100.0%) | 0 (0.0%) |
| 75 Years and older | 56 (100.0%) | 0 (0.0%) |
| Total | 919 (95.7%) | 41 (4.3%) |
Health Insurance Coverage by Citizenship Status in Merrill
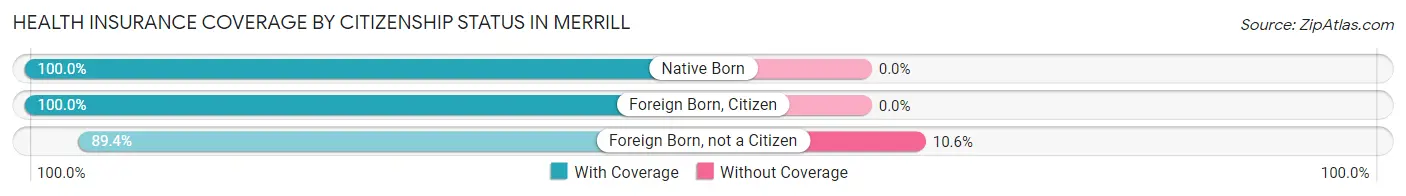
| Citizenship Status | With Coverage | Without Coverage |
| Native Born | 69 (100.0%) | 0 (0.0%) |
| Foreign Born, Citizen | 228 (100.0%) | 0 (0.0%) |
| Foreign Born, not a Citizen | 101 (89.4%) | 12 (10.6%) |
Health Insurance Coverage by Household Income in Merrill
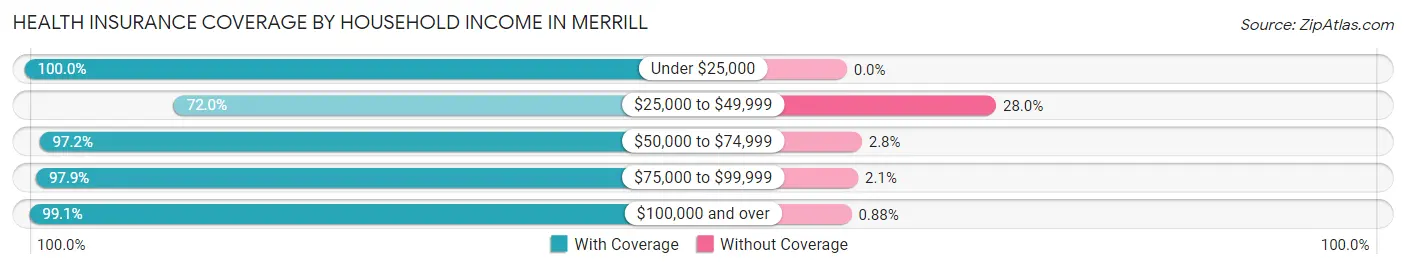
| Household Income | With Coverage | Without Coverage |
| Under $25,000 | 54 (100.0%) | 0 (0.0%) |
| $25,000 to $49,999 | 67 (72.0%) | 26 (28.0%) |
| $50,000 to $74,999 | 277 (97.2%) | 8 (2.8%) |
| $75,000 to $99,999 | 184 (97.9%) | 4 (2.1%) |
| $100,000 and over | 337 (99.1%) | 3 (0.9%) |
Public vs Private Health Insurance Coverage by Age in Merrill
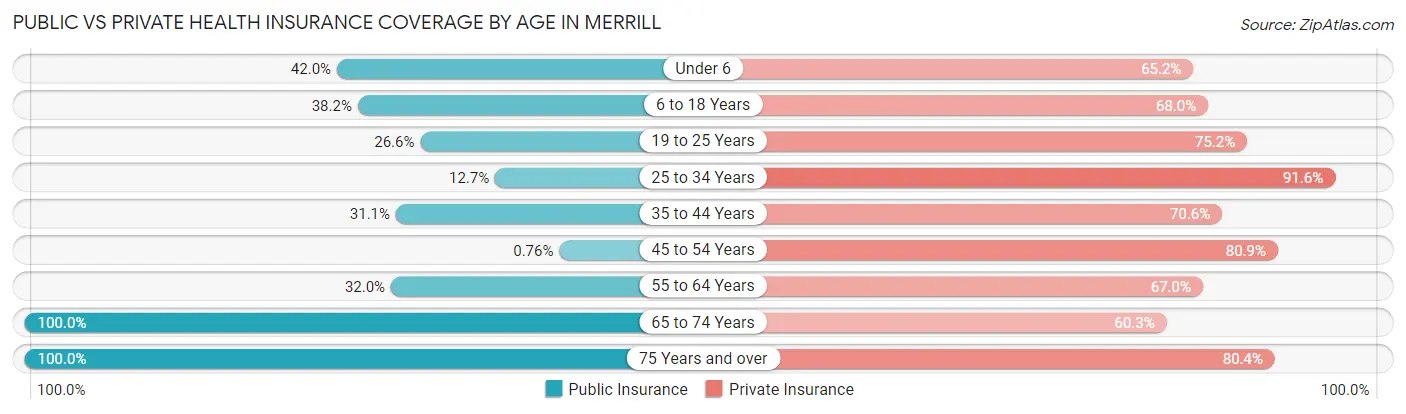
| Age Bracket | Public Insurance | Private Insurance |
| Under 6 | 29 (42.0%) | 45 (65.2%) |
| 6 to 18 Years | 87 (38.2%) | 155 (68.0%) |
| 19 to 25 Years | 30 (26.6%) | 85 (75.2%) |
| 25 to 34 Years | 9 (12.7%) | 65 (91.5%) |
| 35 to 44 Years | 37 (31.1%) | 84 (70.6%) |
| 45 to 54 Years | 1 (0.8%) | 106 (80.9%) |
| 55 to 64 Years | 32 (32.0%) | 67 (67.0%) |
| 65 to 74 Years | 73 (100.0%) | 44 (60.3%) |
| 75 Years and over | 56 (100.0%) | 45 (80.4%) |
| Total | 354 (36.9%) | 696 (72.5%) |
Disability Status by Sex by Age in Merrill
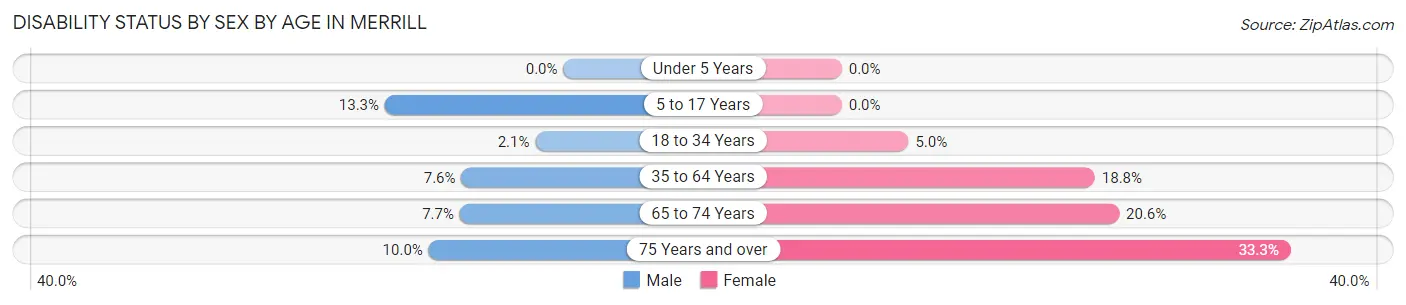
| Age Bracket | Male | Female |
| Under 5 Years | 0 (0.0%) | 0 (0.0%) |
| 5 to 17 Years | 20 (13.3%) | 0 (0.0%) |
| 18 to 34 Years | 2 (2.1%) | 5 (5.0%) |
| 35 to 64 Years | 14 (7.6%) | 31 (18.8%) |
| 65 to 74 Years | 3 (7.7%) | 7 (20.6%) |
| 75 Years and over | 2 (10.0%) | 12 (33.3%) |
Disability Class by Sex by Age in Merrill
Disability Class: Hearing Difficulty
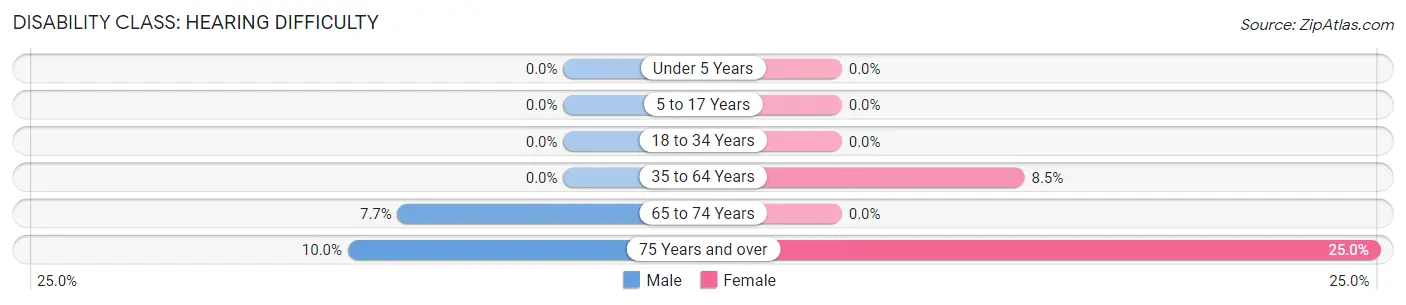
| Age Bracket | Male | Female |
| Under 5 Years | 0 (0.0%) | 0 (0.0%) |
| 5 to 17 Years | 0 (0.0%) | 0 (0.0%) |
| 18 to 34 Years | 0 (0.0%) | 0 (0.0%) |
| 35 to 64 Years | 0 (0.0%) | 14 (8.5%) |
| 65 to 74 Years | 3 (7.7%) | 0 (0.0%) |
| 75 Years and over | 2 (10.0%) | 9 (25.0%) |
Disability Class: Vision Difficulty
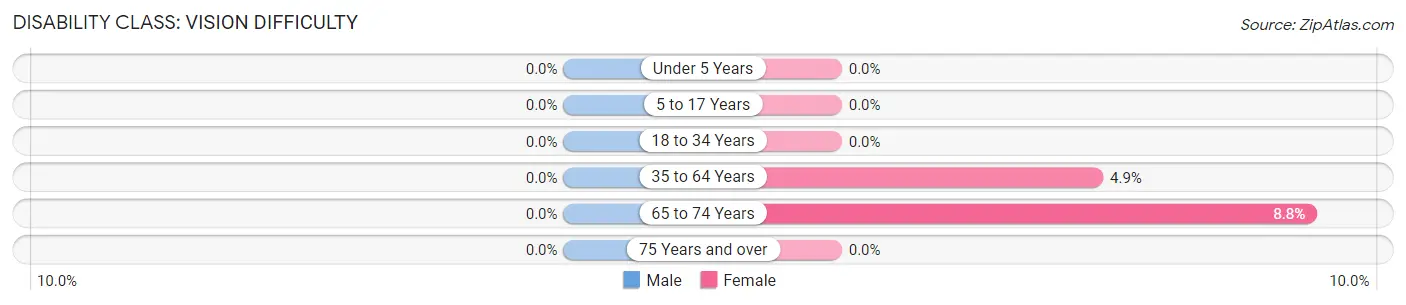
| Age Bracket | Male | Female |
| Under 5 Years | 0 (0.0%) | 0 (0.0%) |
| 5 to 17 Years | 0 (0.0%) | 0 (0.0%) |
| 18 to 34 Years | 0 (0.0%) | 0 (0.0%) |
| 35 to 64 Years | 0 (0.0%) | 8 (4.9%) |
| 65 to 74 Years | 0 (0.0%) | 3 (8.8%) |
| 75 Years and over | 0 (0.0%) | 0 (0.0%) |
Disability Class: Cognitive Difficulty
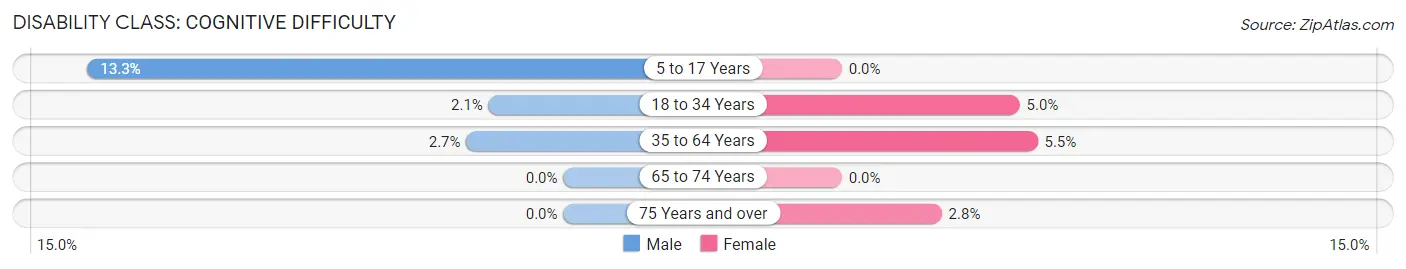
| Age Bracket | Male | Female |
| 5 to 17 Years | 20 (13.3%) | 0 (0.0%) |
| 18 to 34 Years | 2 (2.1%) | 5 (5.0%) |
| 35 to 64 Years | 5 (2.7%) | 9 (5.4%) |
| 65 to 74 Years | 0 (0.0%) | 0 (0.0%) |
| 75 Years and over | 0 (0.0%) | 1 (2.8%) |
Disability Class: Ambulatory Difficulty
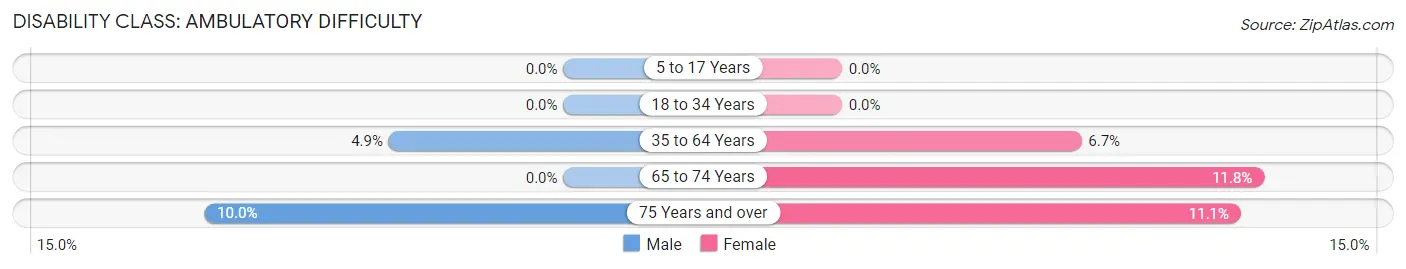
| Age Bracket | Male | Female |
| 5 to 17 Years | 0 (0.0%) | 0 (0.0%) |
| 18 to 34 Years | 0 (0.0%) | 0 (0.0%) |
| 35 to 64 Years | 9 (4.9%) | 11 (6.7%) |
| 65 to 74 Years | 0 (0.0%) | 4 (11.8%) |
| 75 Years and over | 2 (10.0%) | 4 (11.1%) |
Disability Class: Self-Care Difficulty
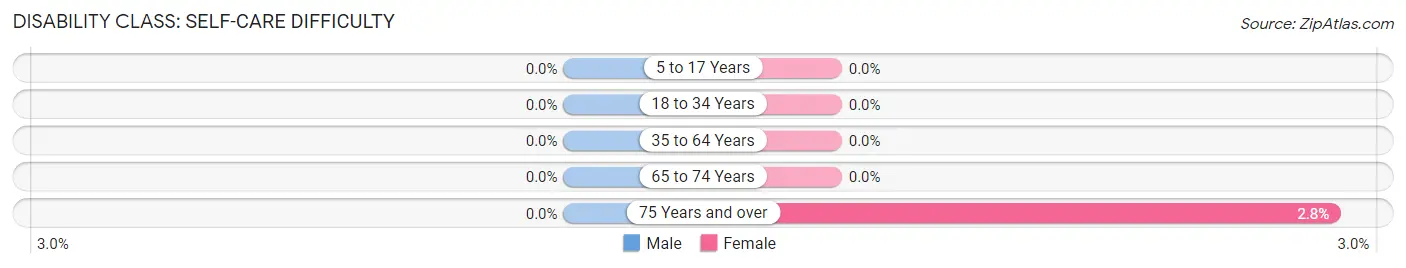
| Age Bracket | Male | Female |
| 5 to 17 Years | 0 (0.0%) | 0 (0.0%) |
| 18 to 34 Years | 0 (0.0%) | 0 (0.0%) |
| 35 to 64 Years | 0 (0.0%) | 0 (0.0%) |
| 65 to 74 Years | 0 (0.0%) | 0 (0.0%) |
| 75 Years and over | 0 (0.0%) | 1 (2.8%) |
Technology Access in Merrill
Computing Device Access in Merrill
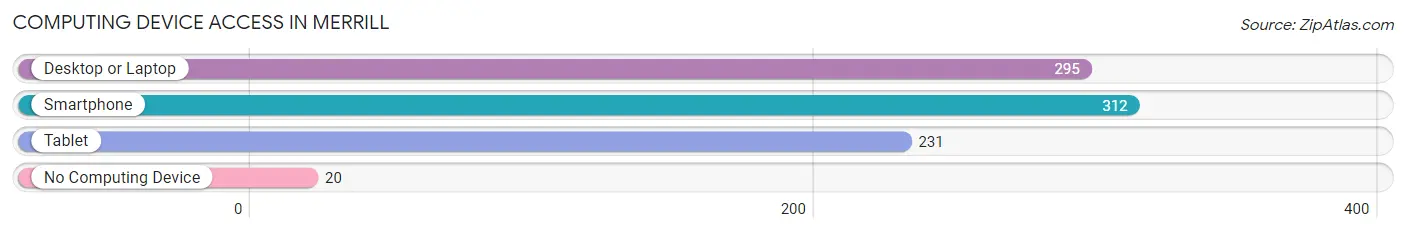
| Device Type | # Households | % Households |
| Desktop or Laptop | 295 | 81.9% |
| Smartphone | 312 | 86.7% |
| Tablet | 231 | 64.2% |
| No Computing Device | 20 | 5.6% |
| Total | 360 | 100.0% |
Internet Access in Merrill
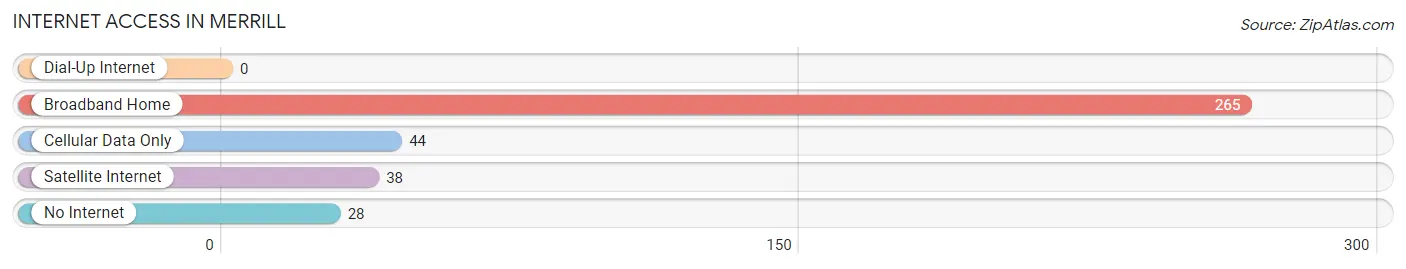
| Internet Type | # Households | % Households |
| Dial-Up Internet | 0 | 0.0% |
| Broadband Home | 265 | 73.6% |
| Cellular Data Only | 44 | 12.2% |
| Satellite Internet | 38 | 10.6% |
| No Internet | 28 | 7.8% |
| Total | 360 | 100.0% |
Merrill Summary
Merrill is a small city located in Plymouth County, Iowa, United States. The population was 1,093 at the 2010 census. It is part of the Sioux City, IA–NE–SD Metropolitan Statistical Area.
History
Merrill was founded in 1871 by a group of settlers from Merrill, Wisconsin. The city was named after the Wisconsin town. The first post office was established in 1872.
In 1876, the Chicago, St. Paul, Minneapolis and Omaha Railway (later the Chicago and North Western Railway) built a line through Merrill. This line was later extended to Sioux City, Iowa.
In 1883 the Merrill Times newspaper was established
In 1884 the first school was built in Merrill
In 1887 the first bank was established in Merrill
In 1889 the first telephone line was established in Merrill
In 1890 the first electric lights were installed in Merrill
In 1891 the first fire department was established in Merrill
In 1892 the first church was built in Merrill
In 1895 the first library was established in Merrill
In 1898 the first hospital was established in Merrill
In 1900 the population of Merrill was 545
In 1902 the first movie theater was established in Merrill
In 1904 the first automobile was purchased in Merrill
In 1906 the first paved street was built in Merrill
In 1910 the population of Merrill was 845
In 1912 the first public park was established in Merrill
In 1914 the first public swimming pool was established in Merrill
In 1916 the first public library was established in Merrill
In 1920 the population of Merrill was 1 039
In 1924 the first airport was established in Merrill
In 1928 the first radio station was established in Merrill
In 1930 the population of Merrill was 1 072
In 1934 the first television station was established in Merrill
In 1940 the population of Merrill was 1 093
Geography
Merrill is located at 42 45 17 N 96 25 17 W 42 754722 96 421389
According to the United States Census Bureau, the city has a total area of 0.77 square miles (1.99 km2), all of it land.
Economy
Merrill is a small city with a limited economy. The main industries in the city are agriculture, manufacturing, and retail.
Agriculture is the main industry in Merrill. The city is home to several farms that produce corn, soybeans, and other crops.
Manufacturing is also an important part of the economy in Merrill. The city is home to several factories that produce a variety of products, including furniture, clothing, and food products.
Retail is also an important part of the economy in Merrill. The city is home to several stores, including grocery stores, clothing stores, and other retail outlets.
Demographics
As of the census of 2010, there were 1,093 people, 441 households, and 287 families residing in the city. The population density was 1,417.3 people per square mile (547.2/km2). There were 471 housing units at an average density of 609.7 per square mile (235.2/km2). The racial makeup of the city was 97.2% White, 0.2% African American, 0.2% Native American, 0.2% Asian, 0.2% from other races, and 1.9% from two or more races. Hispanic or Latino of any race were 1.3% of the population.
There were 441 households, out of which 28.2% had children under the age of 18 living with them, 51.6% were married couples living together, 8.6% had a female householder with no husband present, and 36.2% were non-families. 32.2% of all households were made up of individuals, and 16.3% had someone living alone who was 65 years of age or older. The average household size was 2.37 and the average family size was 3.00.
In the city, the population was spread out, with 24.7% under the age of 18, 7.2% from 18 to 24, 24.7% from 25 to 44, 22.7% from 45 to 64, and 20.7% who were 65 years of age or older. The median age was 40 years. For every 100 females, there were 91.2 males. For every 100 females age 18 and over, there were 87.2 males.
The median income for a household in the city was $35,000, and the median income for a family was $41,250. Males had a median income of $30,000 versus $20,000 for females. The per capita income for the city was $17,845. About 6.2% of families and 8.2% of the population were below the poverty line, including 10.2% of those under age 18 and 8.2% of those age 65 or over.
Common Questions
What is Per Capita Income in Merrill?
Per Capita income in Merrill is $30,709.
What is the Median Family Income in Merrill?
Median Family Income in Merrill is $93,063.
What is the Median Household income in Merrill?
Median Household Income in Merrill is $76,250.
What is Income or Wage Gap in Merrill?
Income or Wage Gap in Merrill is 48.8%.
Women in Merrill earn 51.2 cents for every dollar earned by a man.
What is Inequality or Gini Index in Merrill?
Inequality or Gini Index in Merrill is 0.31.
What is the Total Population of Merrill?
Total Population of Merrill is 960.
What is the Total Male Population of Merrill?
Total Male Population of Merrill is 517.
What is the Total Female Population of Merrill?
Total Female Population of Merrill is 443.
What is the Ratio of Males per 100 Females in Merrill?
There are 116.70 Males per 100 Females in Merrill.
What is the Ratio of Females per 100 Males in Merrill?
There are 85.69 Females per 100 Males in Merrill.
What is the Median Population Age in Merrill?
Median Population Age in Merrill is 34.9 Years.
What is the Average Family Size in Merrill
Average Family Size in Merrill is 3.3 People.
What is the Average Household Size in Merrill
Average Household Size in Merrill is 2.7 People.
How Large is the Labor Force in Merrill?
There are 509 People in the Labor Forcein in Merrill.
What is the Percentage of People in the Labor Force in Merrill?
69.0% of People are in the Labor Force in Merrill.
What is the Unemployment Rate in Merrill?
Unemployment Rate in Merrill is 2.8%.