North Mankato, MN Map & Demographics
North Mankato Map
North Mankato Overview
$47,580
PER CAPITA INCOME
$96,667
AVG FAMILY INCOME
$74,602
AVG HOUSEHOLD INCOME
15.7%
WAGE / INCOME GAP [ % ]
84.3¢/ $1
WAGE / INCOME GAP [ $ ]
0.49
INEQUALITY / GINI INDEX
14,238
TOTAL POPULATION
6,846
MALE POPULATION
7,392
FEMALE POPULATION
92.61
MALES / 100 FEMALES
107.98
FEMALES / 100 MALES
37.4
MEDIAN AGE
3.0
AVG FAMILY SIZE
2.4
AVG HOUSEHOLD SIZE
7,892
LABOR FORCE [ PEOPLE ]
72.3%
PERCENT IN LABOR FORCE
2.0%
UNEMPLOYMENT RATE
North Mankato Area Codes
Income in North Mankato
Income Overview in North Mankato
Per Capita Income in North Mankato is $47,580, while median incomes of families and households are $96,667 and $74,602 respectively.
| Characteristic | Number | Measure |
| Per Capita Income | 14,238 | $47,580 |
| Median Family Income | 3,642 | $96,667 |
| Mean Family Income | 3,642 | $140,537 |
| Median Household Income | 5,923 | $74,602 |
| Mean Household Income | 5,923 | $110,241 |
| Income Deficit | 3,642 | $0 |
| Wage / Income Gap (%) | 14,238 | 15.73% |
| Wage / Income Gap ($) | 14,238 | 84.27¢ per $1 |
| Gini / Inequality Index | 14,238 | 0.49 |
Earnings by Sex in North Mankato
Average Earnings in North Mankato are $42,858, $47,474 for men and $40,004 for women, a difference of 15.7%.
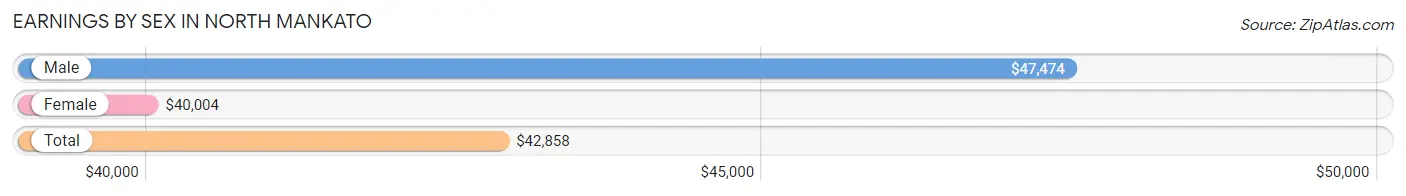
| Sex | Number | Average Earnings |
| Male | 4,078 (49.3%) | $47,474 |
| Female | 4,201 (50.7%) | $40,004 |
| Total | 8,279 (100.0%) | $42,858 |
Earnings by Sex by Income Bracket in North Mankato
The most common earnings brackets in North Mankato are $100,000+ for men (864 | 21.2%) and $55,000 to $64,999 for women (454 | 10.8%).
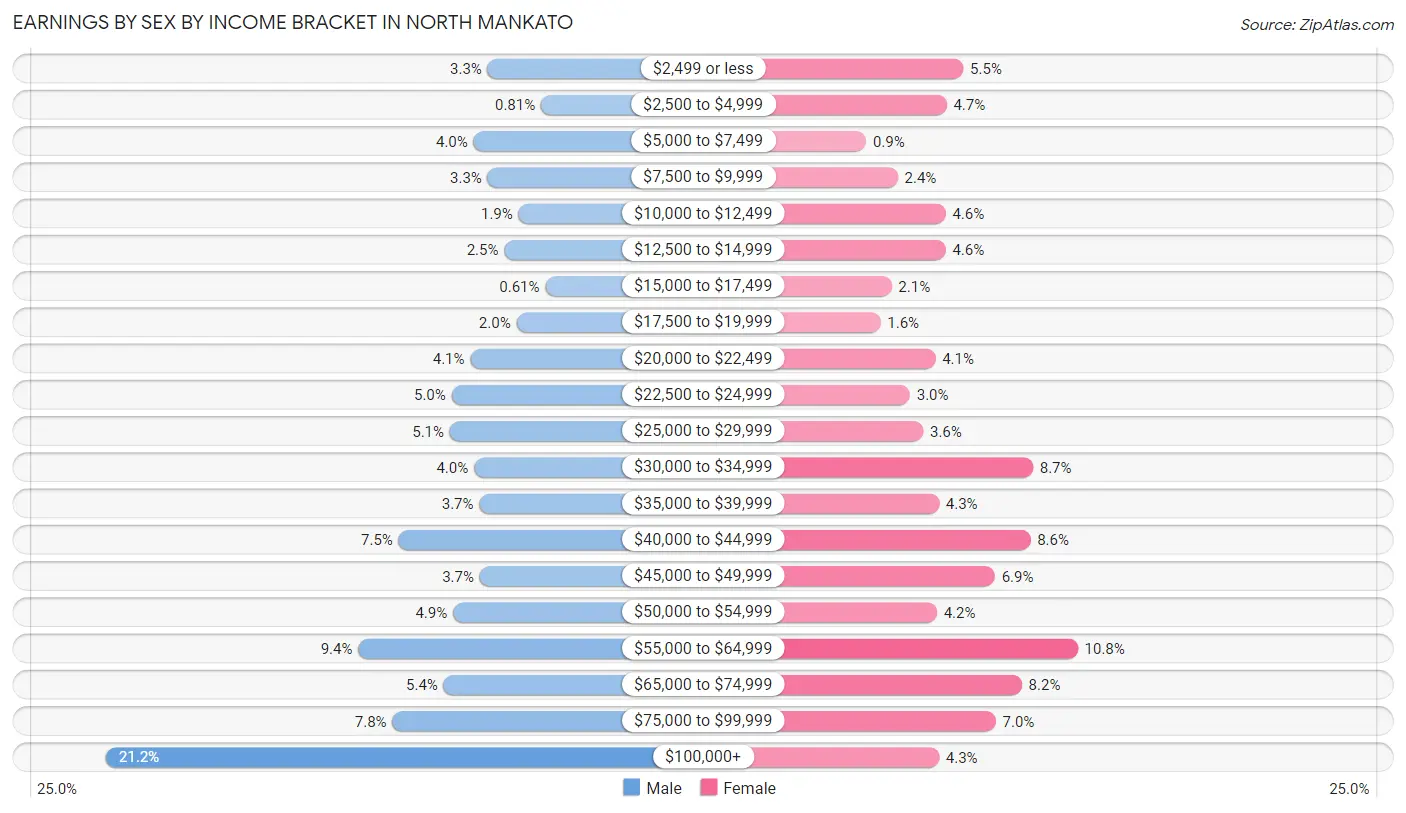
| Income | Male | Female |
| $2,499 or less | 135 (3.3%) | 229 (5.4%) |
| $2,500 to $4,999 | 33 (0.8%) | 196 (4.7%) |
| $5,000 to $7,499 | 162 (4.0%) | 38 (0.9%) |
| $7,500 to $9,999 | 135 (3.3%) | 100 (2.4%) |
| $10,000 to $12,499 | 76 (1.9%) | 194 (4.6%) |
| $12,500 to $14,999 | 103 (2.5%) | 194 (4.6%) |
| $15,000 to $17,499 | 25 (0.6%) | 88 (2.1%) |
| $17,500 to $19,999 | 80 (2.0%) | 66 (1.6%) |
| $20,000 to $22,499 | 168 (4.1%) | 174 (4.1%) |
| $22,500 to $24,999 | 204 (5.0%) | 124 (2.9%) |
| $25,000 to $29,999 | 207 (5.1%) | 150 (3.6%) |
| $30,000 to $34,999 | 161 (4.0%) | 366 (8.7%) |
| $35,000 to $39,999 | 151 (3.7%) | 181 (4.3%) |
| $40,000 to $44,999 | 305 (7.5%) | 361 (8.6%) |
| $45,000 to $49,999 | 150 (3.7%) | 291 (6.9%) |
| $50,000 to $54,999 | 201 (4.9%) | 177 (4.2%) |
| $55,000 to $64,999 | 382 (9.4%) | 454 (10.8%) |
| $65,000 to $74,999 | 219 (5.4%) | 344 (8.2%) |
| $75,000 to $99,999 | 317 (7.8%) | 293 (7.0%) |
| $100,000+ | 864 (21.2%) | 181 (4.3%) |
| Total | 4,078 (100.0%) | 4,201 (100.0%) |
Earnings by Sex by Educational Attainment in North Mankato
Average earnings in North Mankato are $55,508 for men and $42,126 for women, a difference of 24.1%. Men with an educational attainment of graduate degree enjoy the highest average annual earnings of $118,077, while those with high school diploma education earn the least with $37,000. Women with an educational attainment of graduate degree earn the most with the average annual earnings of $69,440, while those with high school diploma education have the smallest earnings of $24,933.
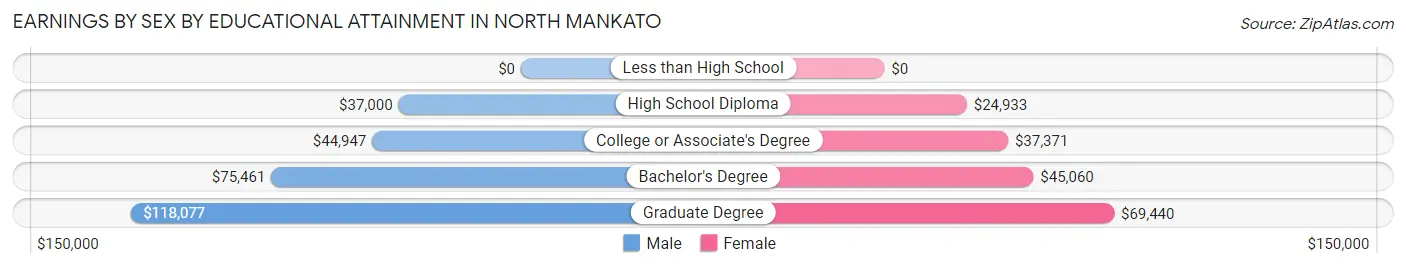
| Educational Attainment | Male Income | Female Income |
| Less than High School | - | - |
| High School Diploma | $37,000 | $24,933 |
| College or Associate's Degree | $44,947 | $37,371 |
| Bachelor's Degree | $75,461 | $45,060 |
| Graduate Degree | $118,077 | $69,440 |
| Total | $55,508 | $42,126 |
Family Income in North Mankato
Family Income Brackets in North Mankato
According to the North Mankato family income data, there are 889 families falling into the $100,000 to $149,999 income range, which is the most common income bracket and makes up 24.4% of all families. Conversely, the less than $10,000 income bracket is the least frequent group with only 25 families (0.7%) belonging to this category.
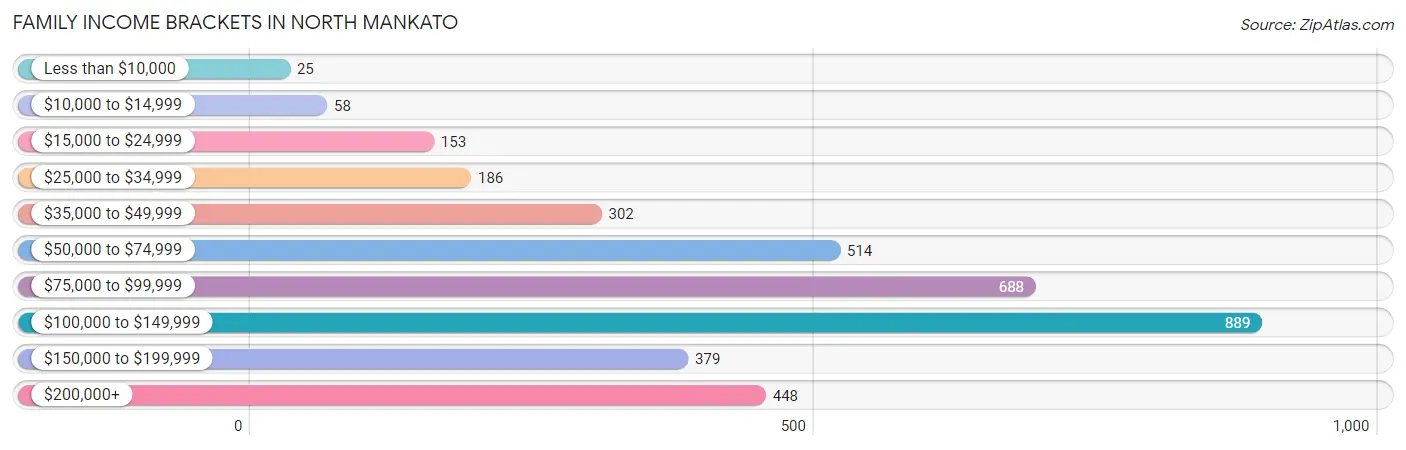
| Income Bracket | # Families | % Families |
| Less than $10,000 | 25 | 0.7% |
| $10,000 to $14,999 | 58 | 1.6% |
| $15,000 to $24,999 | 153 | 4.2% |
| $25,000 to $34,999 | 186 | 5.1% |
| $35,000 to $49,999 | 302 | 8.3% |
| $50,000 to $74,999 | 514 | 14.1% |
| $75,000 to $99,999 | 688 | 18.9% |
| $100,000 to $149,999 | 889 | 24.4% |
| $150,000 to $199,999 | 379 | 10.4% |
| $200,000+ | 448 | 12.3% |
Family Income by Famaliy Size in North Mankato
6-person families (99 | 2.7%) account for the highest median family income in North Mankato with $250,001 per family, while 6-person families (99 | 2.7%) have the highest median income of $41,667 per family member.
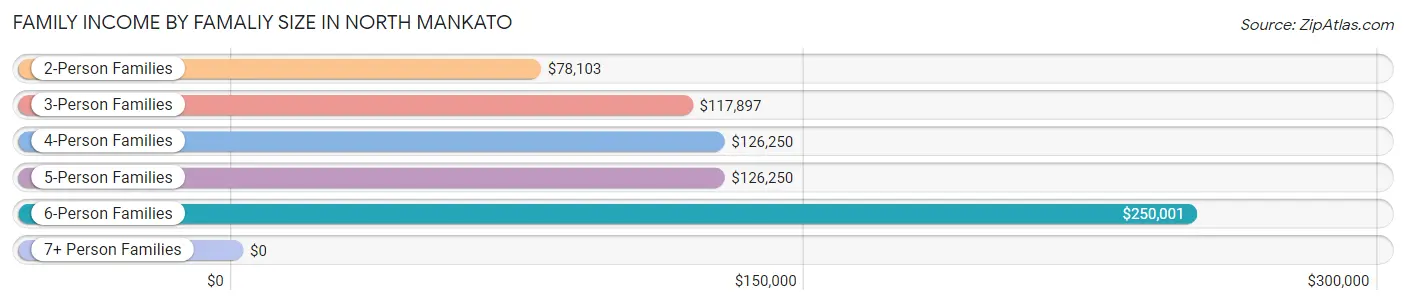
| Income Bracket | # Families | Median Income |
| 2-Person Families | 1,876 (51.5%) | $78,103 |
| 3-Person Families | 753 (20.7%) | $117,897 |
| 4-Person Families | 699 (19.2%) | $126,250 |
| 5-Person Families | 188 (5.2%) | $126,250 |
| 6-Person Families | 99 (2.7%) | $250,001 |
| 7+ Person Families | 27 (0.7%) | $0 |
| Total | 3,642 (100.0%) | $96,667 |
Family Income by Number of Earners in North Mankato
The median family income in North Mankato is $96,667, with families comprising 3+ earners (356) having the highest median family income of $133,583, while families with 1 earner (972) have the lowest median family income of $63,446, accounting for 9.8% and 26.7% of families, respectively.
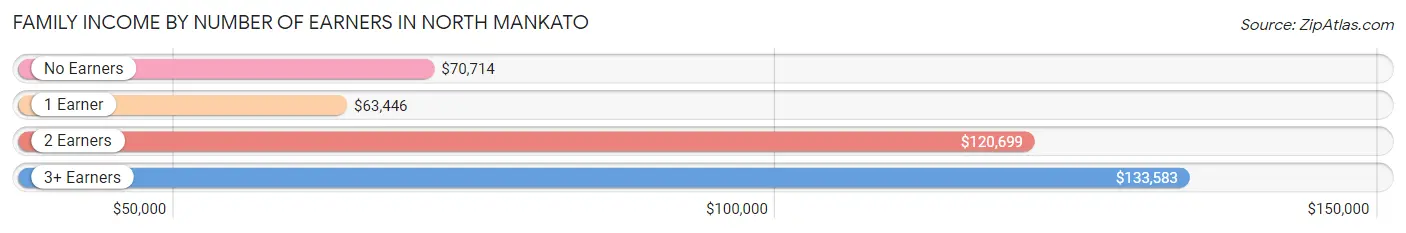
| Number of Earners | # Families | Median Income |
| No Earners | 552 (15.2%) | $70,714 |
| 1 Earner | 972 (26.7%) | $63,446 |
| 2 Earners | 1,762 (48.4%) | $120,699 |
| 3+ Earners | 356 (9.8%) | $133,583 |
| Total | 3,642 (100.0%) | $96,667 |
Household Income in North Mankato
Household Income Brackets in North Mankato
With 1,131 households falling in the category, the $100,000 to $149,999 income range is the most frequent in North Mankato, accounting for 19.1% of all households. In contrast, only 142 households (2.4%) fall into the less than $10,000 income bracket, making it the least populous group.
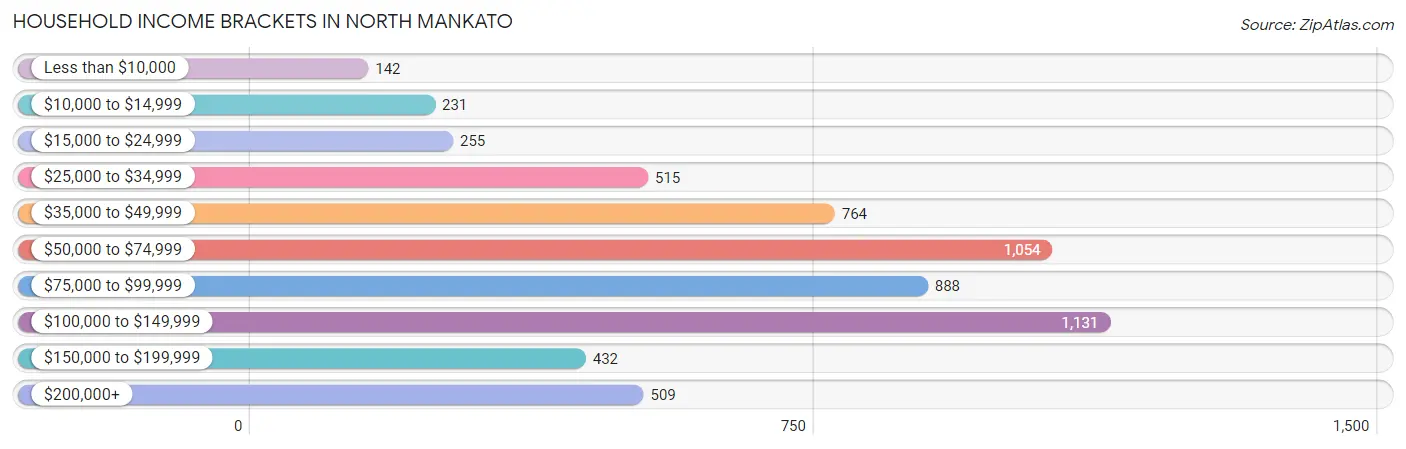
| Income Bracket | # Households | % Households |
| Less than $10,000 | 142 | 2.4% |
| $10,000 to $14,999 | 231 | 3.9% |
| $15,000 to $24,999 | 255 | 4.3% |
| $25,000 to $34,999 | 515 | 8.7% |
| $35,000 to $49,999 | 764 | 12.9% |
| $50,000 to $74,999 | 1,054 | 17.8% |
| $75,000 to $99,999 | 888 | 15.0% |
| $100,000 to $149,999 | 1,131 | 19.1% |
| $150,000 to $199,999 | 432 | 7.3% |
| $200,000+ | 509 | 8.6% |
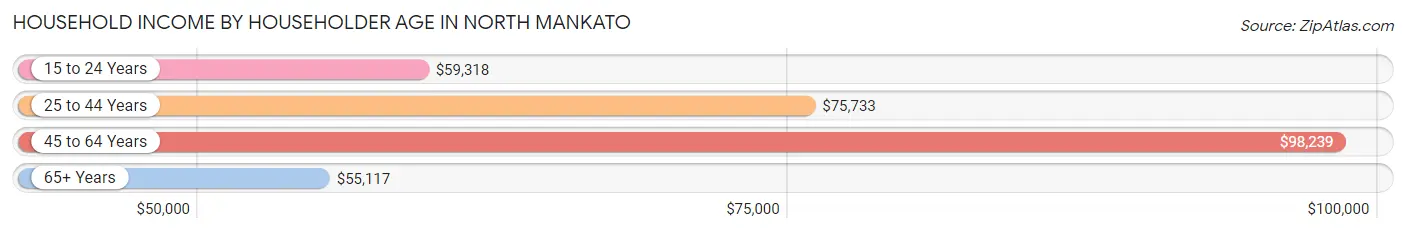
Household Income by Householder Age in North Mankato
The median household income in North Mankato is $74,602, with the highest median household income of $98,239 found in the 45 to 64 years age bracket for the primary householder. A total of 1,918 households (32.4%) fall into this category. Meanwhile, the 65+ years age bracket for the primary householder has the lowest median household income of $55,117, with 1,505 households (25.4%) in this group.
| Income Bracket | # Households | Median Income |
| 15 to 24 Years | 354 (6.0%) | $59,318 |
| 25 to 44 Years | 2,146 (36.2%) | $75,733 |
| 45 to 64 Years | 1,918 (32.4%) | $98,239 |
| 65+ Years | 1,505 (25.4%) | $55,117 |
| Total | 5,923 (100.0%) | $74,602 |
Poverty in North Mankato
Income Below Poverty by Sex and Age in North Mankato
With 6.7% poverty level for males and 10.6% for females among the residents of North Mankato, 12 to 14 year old males and 16 and 17 year old females are the most vulnerable to poverty, with 86 males (23.4%) and 52 females (29.4%) in their respective age groups living below the poverty level.
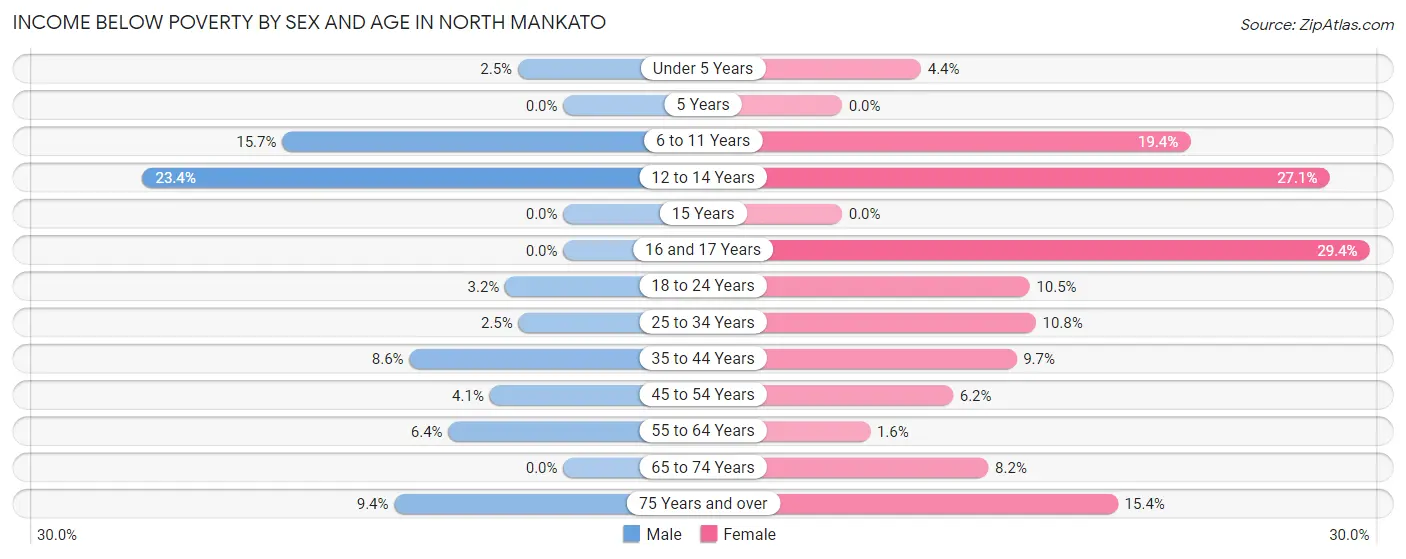
| Age Bracket | Male | Female |
| Under 5 Years | 9 (2.5%) | 24 (4.4%) |
| 5 Years | 0 (0.0%) | 0 (0.0%) |
| 6 to 11 Years | 87 (15.7%) | 120 (19.4%) |
| 12 to 14 Years | 86 (23.4%) | 92 (27.1%) |
| 15 Years | 0 (0.0%) | 0 (0.0%) |
| 16 and 17 Years | 0 (0.0%) | 52 (29.4%) |
| 18 to 24 Years | 19 (3.2%) | 60 (10.4%) |
| 25 to 34 Years | 18 (2.5%) | 107 (10.8%) |
| 35 to 44 Years | 92 (8.6%) | 105 (9.7%) |
| 45 to 54 Years | 35 (4.1%) | 53 (6.2%) |
| 55 to 64 Years | 53 (6.4%) | 11 (1.6%) |
| 65 to 74 Years | 0 (0.0%) | 59 (8.2%) |
| 75 Years and over | 45 (9.4%) | 94 (15.4%) |
| Total | 444 (6.7%) | 777 (10.6%) |
Income Above Poverty by Sex and Age in North Mankato
According to the poverty statistics in North Mankato, males aged 5 years and females aged 5 years are the age groups that are most secure financially, with 100.0% of males and 100.0% of females in these age groups living above the poverty line.
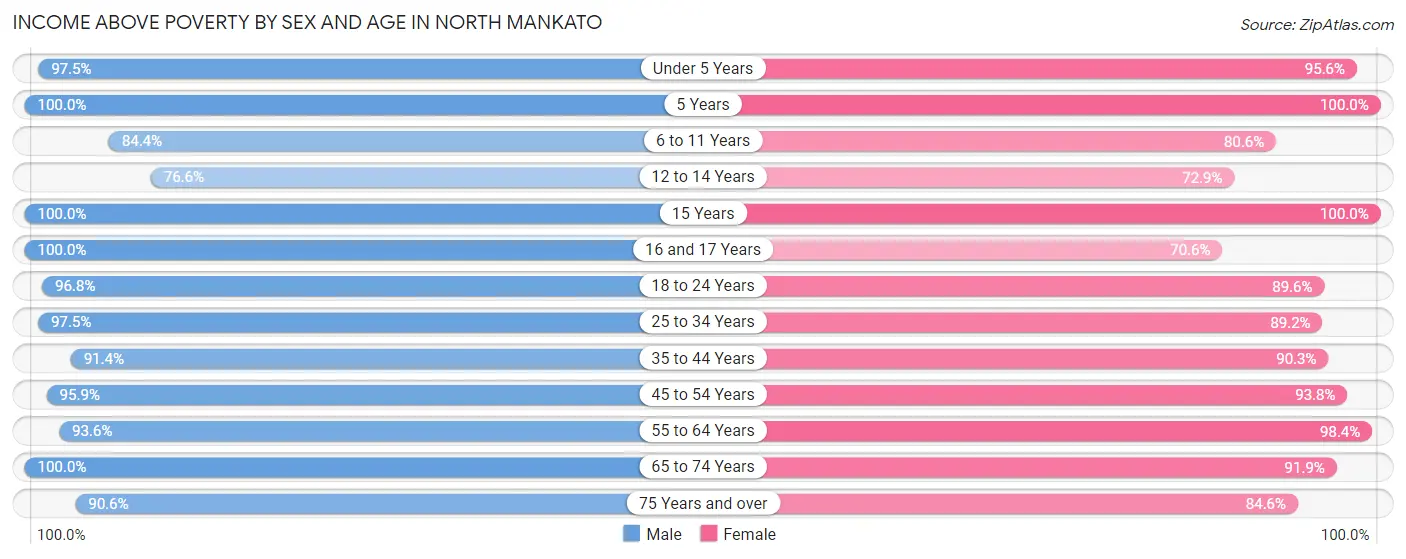
| Age Bracket | Male | Female |
| Under 5 Years | 347 (97.5%) | 521 (95.6%) |
| 5 Years | 106 (100.0%) | 99 (100.0%) |
| 6 to 11 Years | 469 (84.4%) | 499 (80.6%) |
| 12 to 14 Years | 281 (76.6%) | 247 (72.9%) |
| 15 Years | 172 (100.0%) | 39 (100.0%) |
| 16 and 17 Years | 111 (100.0%) | 125 (70.6%) |
| 18 to 24 Years | 567 (96.8%) | 514 (89.5%) |
| 25 to 34 Years | 704 (97.5%) | 885 (89.2%) |
| 35 to 44 Years | 981 (91.4%) | 976 (90.3%) |
| 45 to 54 Years | 818 (95.9%) | 804 (93.8%) |
| 55 to 64 Years | 775 (93.6%) | 691 (98.4%) |
| 65 to 74 Years | 471 (100.0%) | 665 (91.8%) |
| 75 Years and over | 433 (90.6%) | 518 (84.6%) |
| Total | 6,235 (93.3%) | 6,583 (89.4%) |
Income Below Poverty Among Married-Couple Families in North Mankato
The poverty statistics for married-couple families in North Mankato show that 0.5% or 13 of the total 2,598 families live below the poverty line. Families with 1 or 2 children have the highest poverty rate of 1.5%, comprising of 13 families. On the other hand, families with no children have the lowest poverty rate of 0.0%, which includes 0 families.
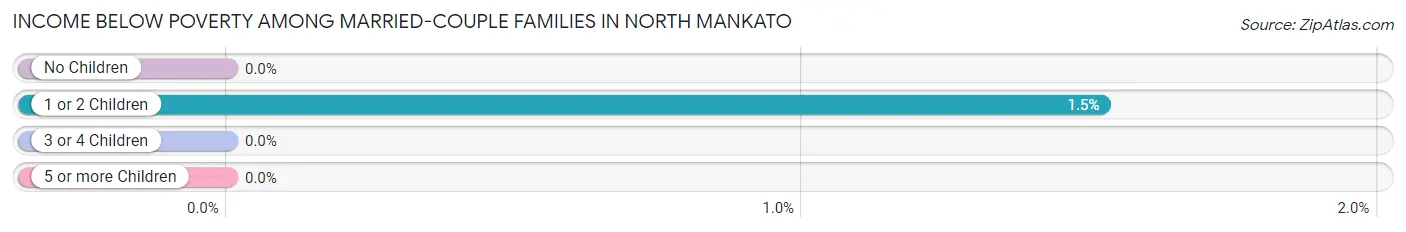
| Children | Above Poverty | Below Poverty |
| No Children | 1,535 (100.0%) | 0 (0.0%) |
| 1 or 2 Children | 841 (98.5%) | 13 (1.5%) |
| 3 or 4 Children | 192 (100.0%) | 0 (0.0%) |
| 5 or more Children | 17 (100.0%) | 0 (0.0%) |
| Total | 2,585 (99.5%) | 13 (0.5%) |
Income Below Poverty Among Single-Parent Households in North Mankato
According to the poverty data in North Mankato, 4.5% or 14 single-father households and 20.6% or 151 single-mother households are living below the poverty line. Among single-father households, those with 3 or 4 children have the highest poverty rate, with 14 households (20.6%) experiencing poverty. Likewise, among single-mother households, those with 3 or 4 children have the highest poverty rate, with 67 households (54.5%) falling below the poverty line.
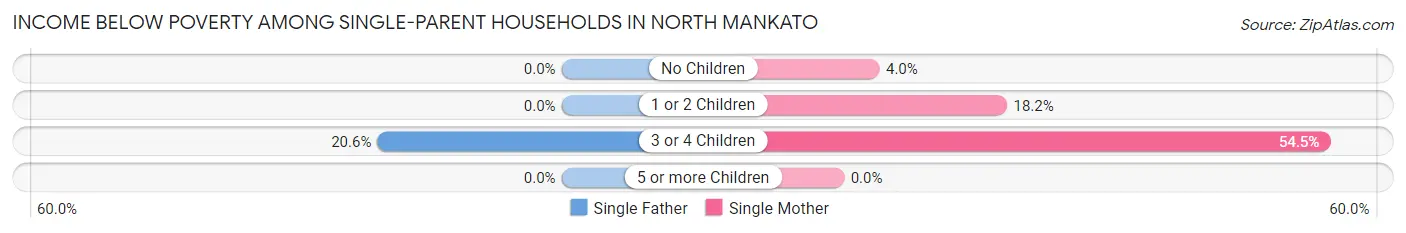
| Children | Single Father | Single Mother |
| No Children | 0 (0.0%) | 7 (4.0%) |
| 1 or 2 Children | 0 (0.0%) | 77 (18.2%) |
| 3 or 4 Children | 14 (20.6%) | 67 (54.5%) |
| 5 or more Children | 0 (0.0%) | 0 (0.0%) |
| Total | 14 (4.5%) | 151 (20.6%) |
Income Below Poverty Among Married-Couple vs Single-Parent Households in North Mankato
The poverty data for North Mankato shows that 13 of the married-couple family households (0.5%) and 165 of the single-parent households (15.8%) are living below the poverty level. Within the married-couple family households, those with 1 or 2 children have the highest poverty rate, with 13 households (1.5%) falling below the poverty line. Among the single-parent households, those with 3 or 4 children have the highest poverty rate, with 81 household (42.4%) living below poverty.
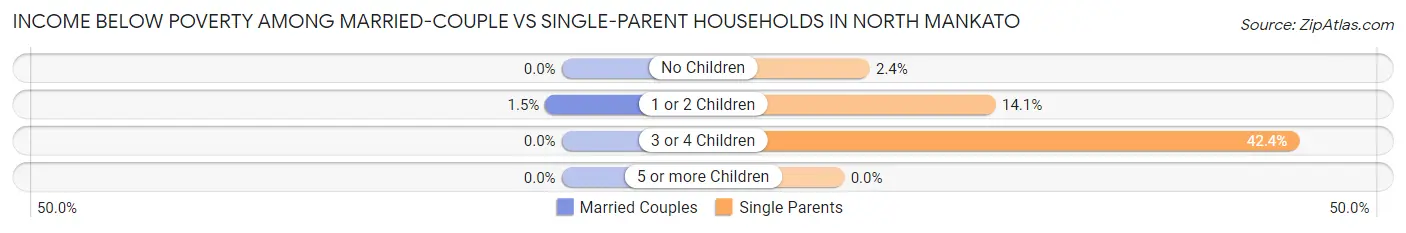
| Children | Married-Couple Families | Single-Parent Households |
| No Children | 0 (0.0%) | 7 (2.4%) |
| 1 or 2 Children | 13 (1.5%) | 77 (14.1%) |
| 3 or 4 Children | 0 (0.0%) | 81 (42.4%) |
| 5 or more Children | 0 (0.0%) | 0 (0.0%) |
| Total | 13 (0.5%) | 165 (15.8%) |
Race in North Mankato
The most populous races in North Mankato are White / Caucasian (12,634 | 88.7%), Two or more Races (986 | 6.9%), and Hispanic or Latino (595 | 4.2%).
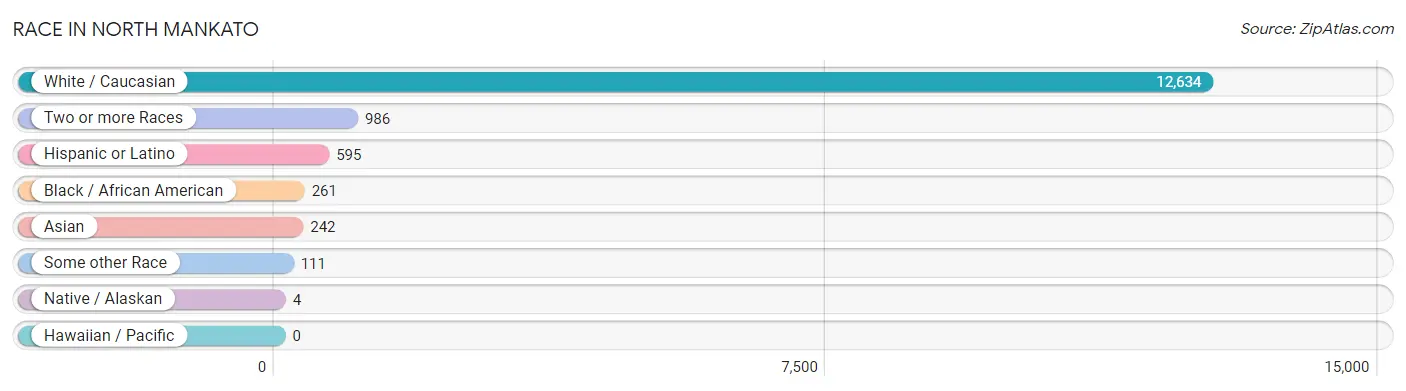
| Race | # Population | % Population |
| Asian | 242 | 1.7% |
| Black / African American | 261 | 1.8% |
| Hawaiian / Pacific | 0 | 0.0% |
| Hispanic or Latino | 595 | 4.2% |
| Native / Alaskan | 4 | 0.0% |
| White / Caucasian | 12,634 | 88.7% |
| Two or more Races | 986 | 6.9% |
| Some other Race | 111 | 0.8% |
| Total | 14,238 | 100.0% |
Ancestry in North Mankato
The most populous ancestries reported in North Mankato are German (6,329 | 44.5%), Norwegian (2,185 | 15.3%), Irish (1,373 | 9.6%), English (795 | 5.6%), and Swedish (726 | 5.1%), together accounting for 80.1% of all North Mankato residents.
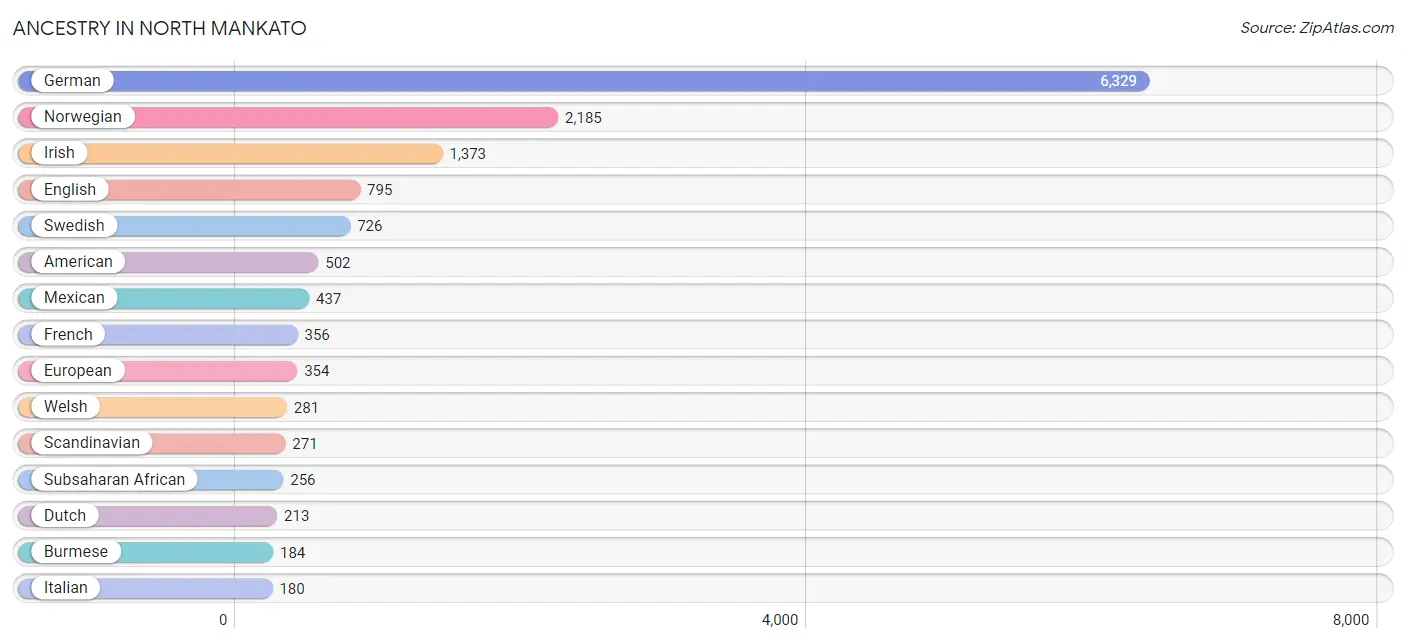
| Ancestry | # Population | % Population |
| African | 75 | 0.5% |
| American | 502 | 3.5% |
| Arab | 62 | 0.4% |
| Austrian | 43 | 0.3% |
| Belgian | 173 | 1.2% |
| British | 13 | 0.1% |
| Burmese | 184 | 1.3% |
| Central American | 89 | 0.6% |
| Chippewa | 40 | 0.3% |
| Cree | 1 | 0.0% |
| Cuban | 14 | 0.1% |
| Czech | 154 | 1.1% |
| Czechoslovakian | 47 | 0.3% |
| Danish | 159 | 1.1% |
| Dutch | 213 | 1.5% |
| Eastern European | 12 | 0.1% |
| Ecuadorian | 12 | 0.1% |
| English | 795 | 5.6% |
| Ethiopian | 28 | 0.2% |
| European | 354 | 2.5% |
| Finnish | 32 | 0.2% |
| French | 356 | 2.5% |
| French American Indian | 15 | 0.1% |
| French Canadian | 33 | 0.2% |
| German | 6,329 | 44.5% |
| Greek | 29 | 0.2% |
| Honduran | 55 | 0.4% |
| Indian (Asian) | 32 | 0.2% |
| Irish | 1,373 | 9.6% |
| Italian | 180 | 1.3% |
| Japanese | 26 | 0.2% |
| Korean | 49 | 0.3% |
| Malaysian | 21 | 0.2% |
| Mexican | 437 | 3.1% |
| Mongolian | 15 | 0.1% |
| Native Hawaiian | 63 | 0.4% |
| Navajo | 4 | 0.0% |
| Nigerian | 38 | 0.3% |
| Northern European | 30 | 0.2% |
| Norwegian | 2,185 | 15.3% |
| Polish | 158 | 1.1% |
| Puerto Rican | 19 | 0.1% |
| Russian | 36 | 0.3% |
| Salvadoran | 34 | 0.2% |
| Scandinavian | 271 | 1.9% |
| Scotch-Irish | 67 | 0.5% |
| Scottish | 55 | 0.4% |
| Somali | 115 | 0.8% |
| South American | 19 | 0.1% |
| Subsaharan African | 256 | 1.8% |
| Swedish | 726 | 5.1% |
| Syrian | 6 | 0.0% |
| Thai | 87 | 0.6% |
| Venezuelan | 7 | 0.1% |
| Welsh | 281 | 2.0% | View All 55 Rows |
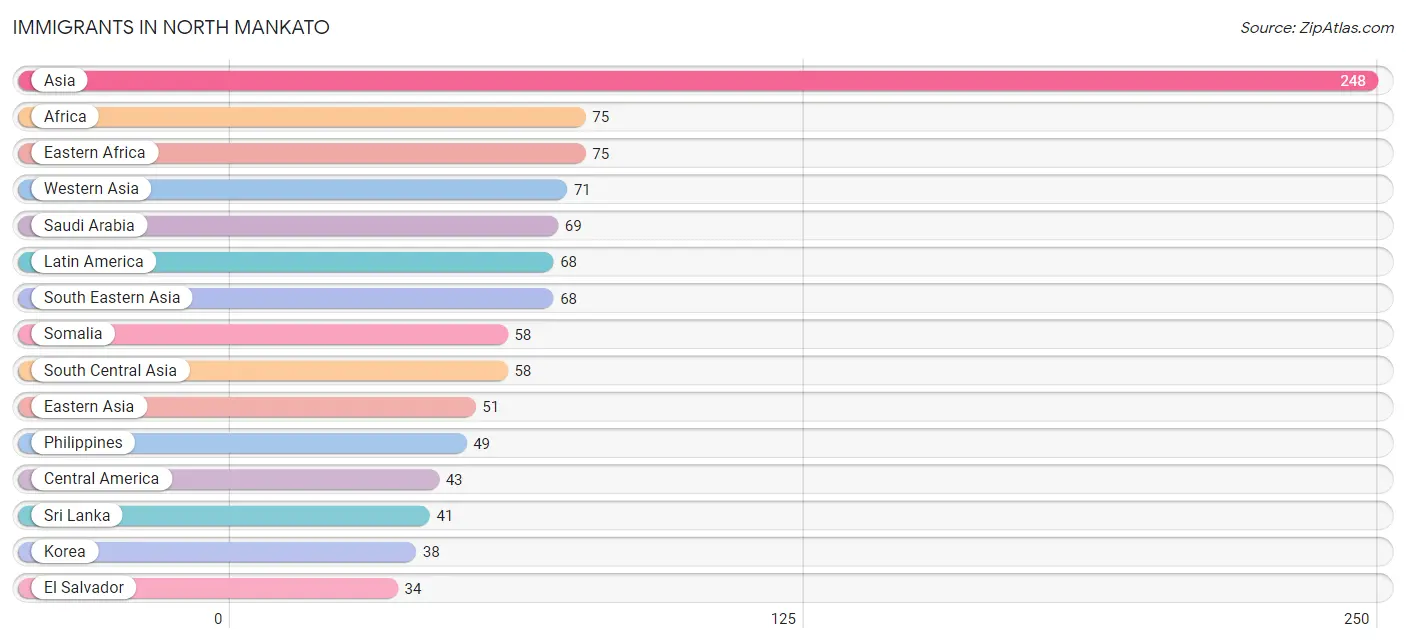
Immigrants in North Mankato
The most numerous immigrant groups reported in North Mankato came from Asia (248 | 1.7%), Africa (75 | 0.5%), Eastern Africa (75 | 0.5%), Western Asia (71 | 0.5%), and Saudi Arabia (69 | 0.5%), together accounting for 3.8% of all North Mankato residents.
| Immigration Origin | # Population | % Population |
| Africa | 75 | 0.5% |
| Asia | 248 | 1.7% |
| Bosnia and Herzegovina | 6 | 0.0% |
| Canada | 1 | 0.0% |
| Central America | 43 | 0.3% |
| China | 13 | 0.1% |
| Eastern Africa | 75 | 0.5% |
| Eastern Asia | 51 | 0.4% |
| Eastern Europe | 6 | 0.0% |
| El Salvador | 34 | 0.2% |
| England | 9 | 0.1% |
| Ethiopia | 17 | 0.1% |
| Europe | 33 | 0.2% |
| Guatemala | 9 | 0.1% |
| Guyana | 25 | 0.2% |
| India | 16 | 0.1% |
| Korea | 38 | 0.3% |
| Laos | 4 | 0.0% |
| Latin America | 68 | 0.5% |
| Malaysia | 15 | 0.1% |
| Netherlands | 10 | 0.1% |
| Northern Europe | 17 | 0.1% |
| Pakistan | 1 | 0.0% |
| Philippines | 49 | 0.3% |
| Saudi Arabia | 69 | 0.5% |
| Somalia | 58 | 0.4% |
| South America | 25 | 0.2% |
| South Central Asia | 58 | 0.4% |
| South Eastern Asia | 68 | 0.5% |
| Sri Lanka | 41 | 0.3% |
| Western Asia | 71 | 0.5% |
| Western Europe | 10 | 0.1% | View All 32 Rows |
Sex and Age in North Mankato
Sex and Age in North Mankato
The most populous age groups in North Mankato are 35 to 39 Years (642 | 9.4%) for men and 35 to 39 Years (623 | 8.4%) for women.
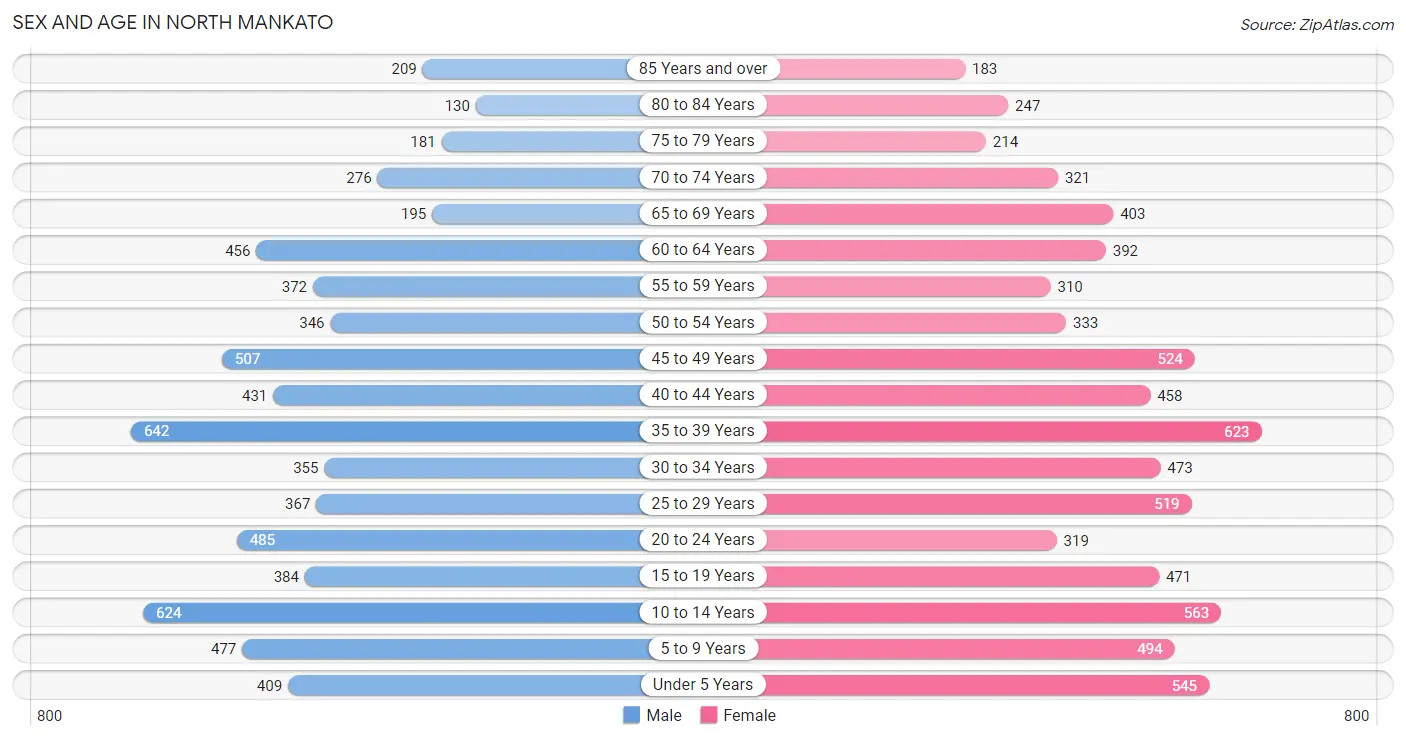
| Age Bracket | Male | Female |
| Under 5 Years | 409 (6.0%) | 545 (7.4%) |
| 5 to 9 Years | 477 (7.0%) | 494 (6.7%) |
| 10 to 14 Years | 624 (9.1%) | 563 (7.6%) |
| 15 to 19 Years | 384 (5.6%) | 471 (6.4%) |
| 20 to 24 Years | 485 (7.1%) | 319 (4.3%) |
| 25 to 29 Years | 367 (5.4%) | 519 (7.0%) |
| 30 to 34 Years | 355 (5.2%) | 473 (6.4%) |
| 35 to 39 Years | 642 (9.4%) | 623 (8.4%) |
| 40 to 44 Years | 431 (6.3%) | 458 (6.2%) |
| 45 to 49 Years | 507 (7.4%) | 524 (7.1%) |
| 50 to 54 Years | 346 (5.1%) | 333 (4.5%) |
| 55 to 59 Years | 372 (5.4%) | 310 (4.2%) |
| 60 to 64 Years | 456 (6.7%) | 392 (5.3%) |
| 65 to 69 Years | 195 (2.9%) | 403 (5.4%) |
| 70 to 74 Years | 276 (4.0%) | 321 (4.3%) |
| 75 to 79 Years | 181 (2.6%) | 214 (2.9%) |
| 80 to 84 Years | 130 (1.9%) | 247 (3.3%) |
| 85 Years and over | 209 (3.0%) | 183 (2.5%) |
| Total | 6,846 (100.0%) | 7,392 (100.0%) |
Families and Households in North Mankato
Median Family Size in North Mankato
The median family size in North Mankato is 2.97 persons per family, with married-couple families (2,598 | 71.3%) accounting for the largest median family size of 3.02 persons per family. On the other hand, single female/mother families (733 | 20.1%) represent the smallest median family size with 2.82 persons per family.
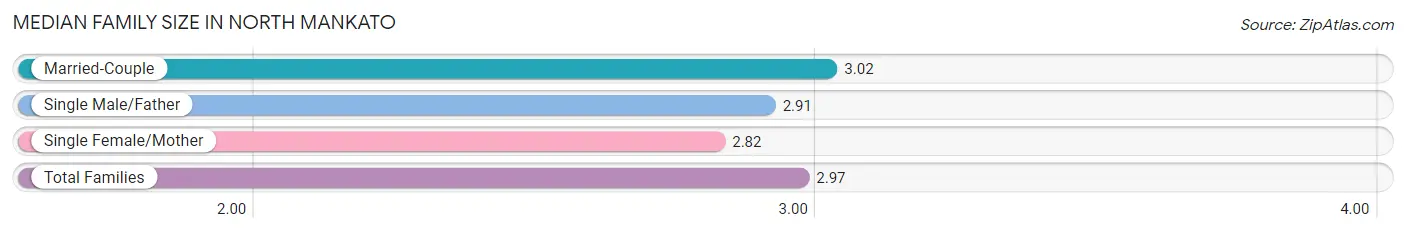
| Family Type | # Families | Family Size |
| Married-Couple | 2,598 (71.3%) | 3.02 |
| Single Male/Father | 311 (8.5%) | 2.91 |
| Single Female/Mother | 733 (20.1%) | 2.82 |
| Total Families | 3,642 (100.0%) | 2.97 |
Median Household Size in North Mankato
The median household size in North Mankato is 2.38 persons per household, with single male/father households (311 | 5.2%) accounting for the largest median household size of 3.45 persons per household. non-family households (2,281 | 38.5%) represent the smallest median household size with 1.29 persons per household.
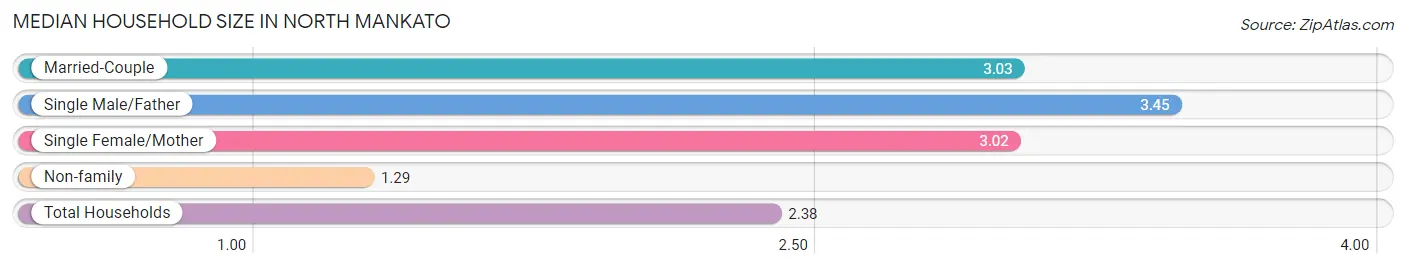
| Household Type | # Households | Household Size |
| Married-Couple | 2,598 (43.9%) | 3.03 |
| Single Male/Father | 311 (5.2%) | 3.45 |
| Single Female/Mother | 733 (12.4%) | 3.02 |
| Non-family | 2,281 (38.5%) | 1.29 |
| Total Households | 5,923 (100.0%) | 2.38 |
Household Size by Marriage Status in North Mankato
Out of a total of 5,923 households in North Mankato, 3,642 (61.5%) are family households, while 2,281 (38.5%) are nonfamily households. The most numerous type of family households are 2-person households, comprising 1,747, and the most common type of nonfamily households are 1-person households, comprising 1,908.
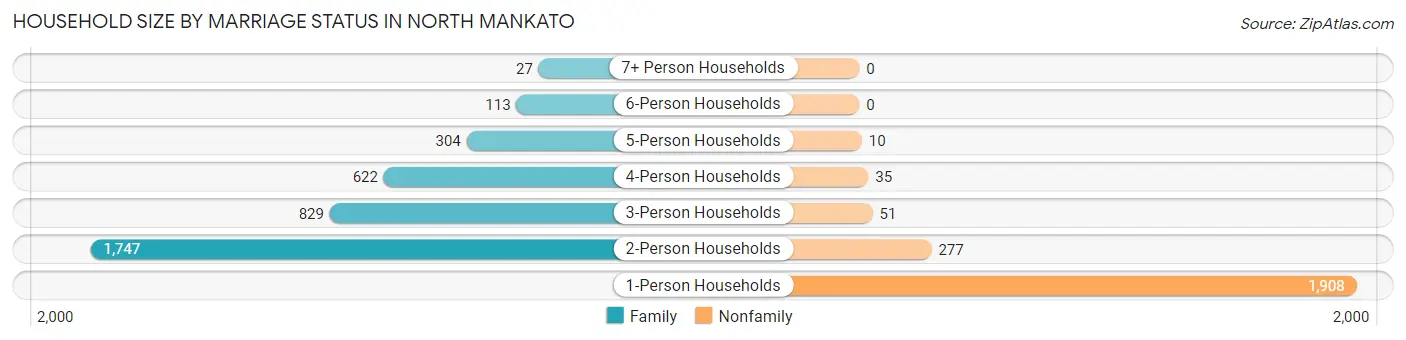
| Household Size | Family Households | Nonfamily Households |
| 1-Person Households | - | 1,908 (32.2%) |
| 2-Person Households | 1,747 (29.5%) | 277 (4.7%) |
| 3-Person Households | 829 (14.0%) | 51 (0.9%) |
| 4-Person Households | 622 (10.5%) | 35 (0.6%) |
| 5-Person Households | 304 (5.1%) | 10 (0.2%) |
| 6-Person Households | 113 (1.9%) | 0 (0.0%) |
| 7+ Person Households | 27 (0.5%) | 0 (0.0%) |
| Total | 3,642 (61.5%) | 2,281 (38.5%) |
Female Fertility in North Mankato
Fertility by Age in North Mankato
Average fertility rate in North Mankato is 49.0 births per 1,000 women. Women in the age bracket of 20 to 34 years have the highest fertility rate with 70.0 births per 1,000 women. Women in the age bracket of 20 to 34 years acount for 54.4% of all women with births.
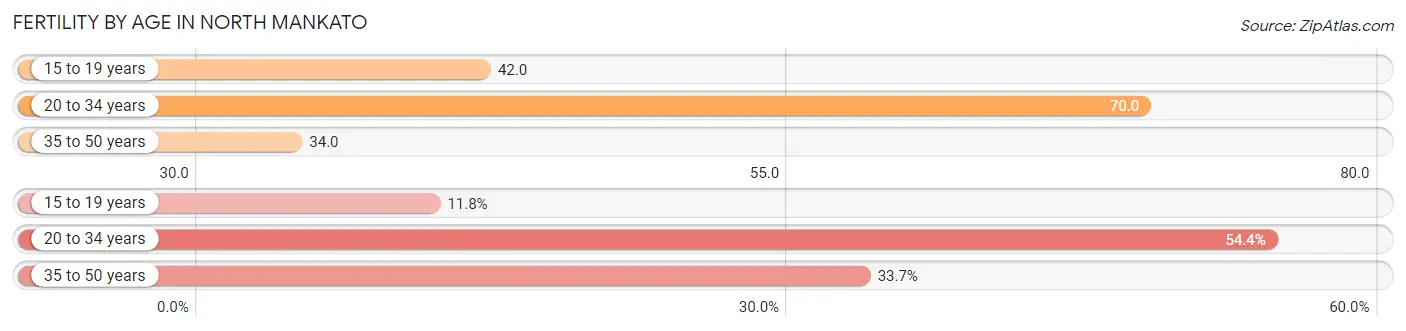
| Age Bracket | Women with Births | Births / 1,000 Women |
| 15 to 19 years | 20 (11.8%) | 42.0 |
| 20 to 34 years | 92 (54.4%) | 70.0 |
| 35 to 50 years | 57 (33.7%) | 34.0 |
| Total | 169 (100.0%) | 49.0 |
Fertility by Age by Marriage Status in North Mankato
49.1% of women with births (169) in North Mankato are married. The highest percentage of unmarried women with births falls into 15 to 19 years age bracket with 100.0% of them unmarried at the time of birth, while the lowest percentage of unmarried women with births belong to 20 to 34 years age bracket with 30.4% of them unmarried.
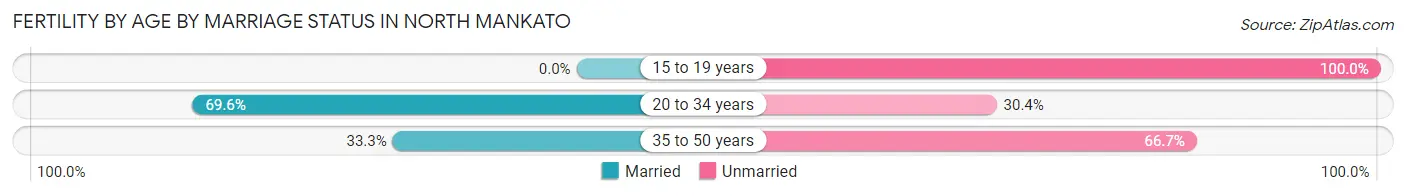
| Age Bracket | Married | Unmarried |
| 15 to 19 years | 0 (0.0%) | 20 (100.0%) |
| 20 to 34 years | 64 (69.6%) | 28 (30.4%) |
| 35 to 50 years | 19 (33.3%) | 38 (66.7%) |
| Total | 83 (49.1%) | 86 (50.9%) |
Fertility by Education in North Mankato
Average fertility rate in North Mankato is 49.0 births per 1,000 women. Women with the education attainment of less than high school have the highest fertility rate of 119.0 births per 1,000 women, while women with the education attainment of college or associate's degree have the lowest fertility at 11.0 births per 1,000 women. Women with the education attainment of bachelor's degree represent 44.4% of all women with births.
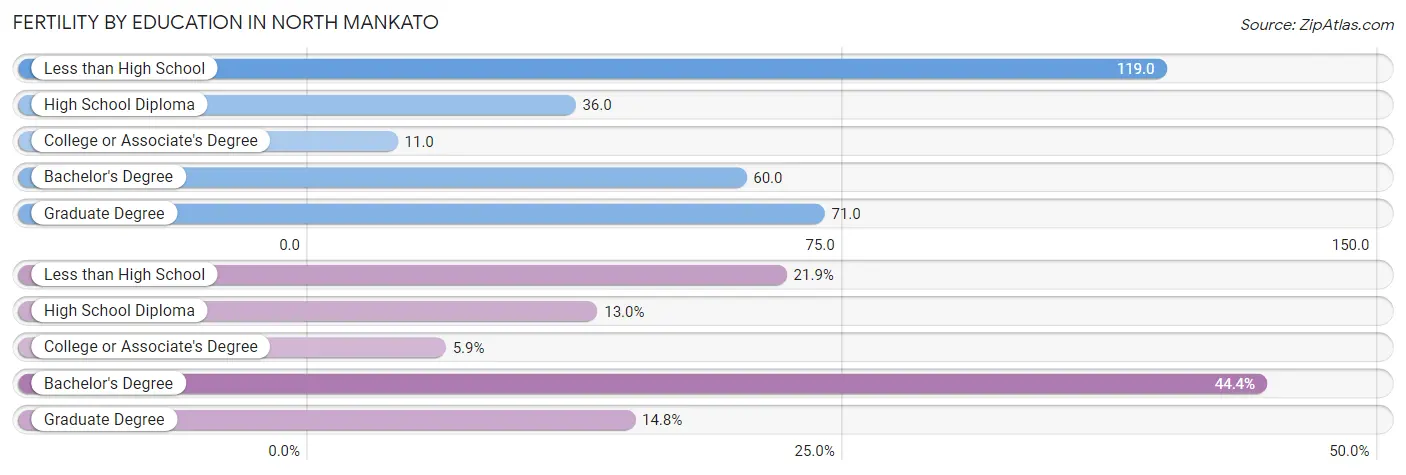
| Educational Attainment | Women with Births | Births / 1,000 Women |
| Less than High School | 37 (21.9%) | 119.0 |
| High School Diploma | 22 (13.0%) | 36.0 |
| College or Associate's Degree | 10 (5.9%) | 11.0 |
| Bachelor's Degree | 75 (44.4%) | 60.0 |
| Graduate Degree | 25 (14.8%) | 71.0 |
| Total | 169 (100.0%) | 49.0 |
Fertility by Education by Marriage Status in North Mankato
50.9% of women with births in North Mankato are unmarried. Women with the educational attainment of college or associate's degree are most likely to be married with 100.0% of them married at childbirth, while women with the educational attainment of less than high school are least likely to be married with 100.0% of them unmarried at childbirth.
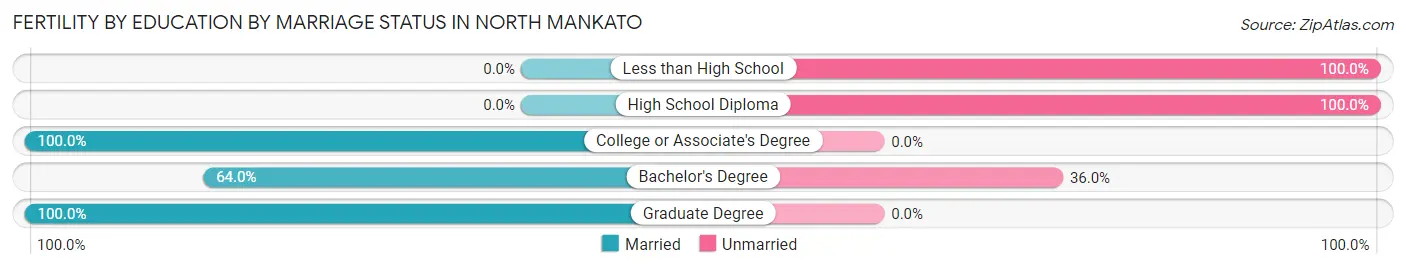
| Educational Attainment | Married | Unmarried |
| Less than High School | 0 (0.0%) | 37 (100.0%) |
| High School Diploma | 0 (0.0%) | 22 (100.0%) |
| College or Associate's Degree | 10 (100.0%) | 0 (0.0%) |
| Bachelor's Degree | 48 (64.0%) | 27 (36.0%) |
| Graduate Degree | 25 (100.0%) | 0 (0.0%) |
| Total | 83 (49.1%) | 86 (50.9%) |
Employment Characteristics in North Mankato
Employment by Class of Employer in North Mankato
Among the 7,545 employed individuals in North Mankato, private company employees (4,846 | 64.2%), not-for-profit organizations (995 | 13.2%), and state government employees (542 | 7.2%) make up the most common classes of employment.
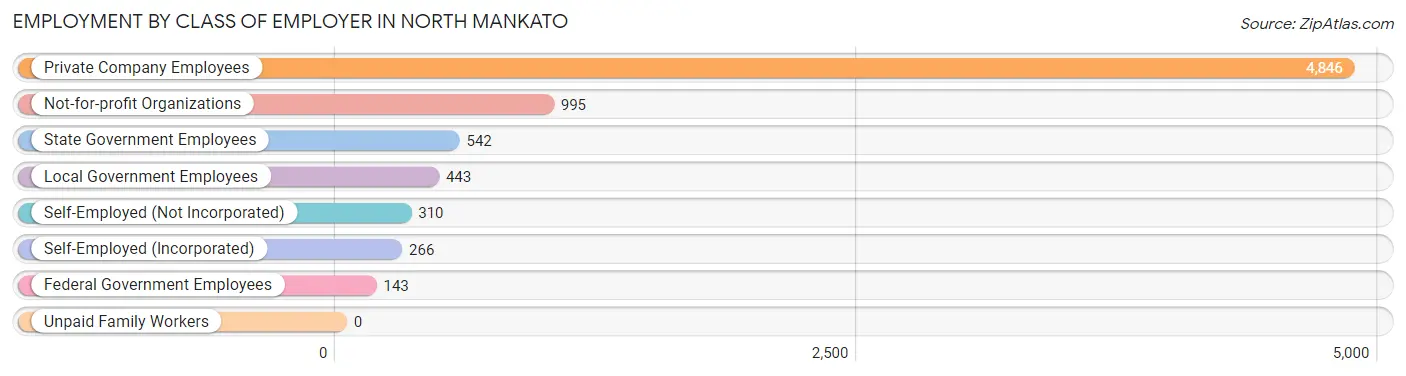
| Employer Class | # Employees | % Employees |
| Private Company Employees | 4,846 | 64.2% |
| Self-Employed (Incorporated) | 266 | 3.5% |
| Self-Employed (Not Incorporated) | 310 | 4.1% |
| Not-for-profit Organizations | 995 | 13.2% |
| Local Government Employees | 443 | 5.9% |
| State Government Employees | 542 | 7.2% |
| Federal Government Employees | 143 | 1.9% |
| Unpaid Family Workers | 0 | 0.0% |
| Total | 7,545 | 100.0% |
Employment Status by Age in North Mankato
According to the labor force statistics for North Mankato, out of the total population over 16 years of age (10,915), 72.3% or 7,892 individuals are in the labor force, with 2.0% or 158 of them unemployed. The age group with the highest labor force participation rate is 20 to 24 years, with 96.0% or 772 individuals in the labor force. Within the labor force, the 60 to 64 years age range has the highest percentage of unemployed individuals, with 7.4% or 40 of them being unemployed.
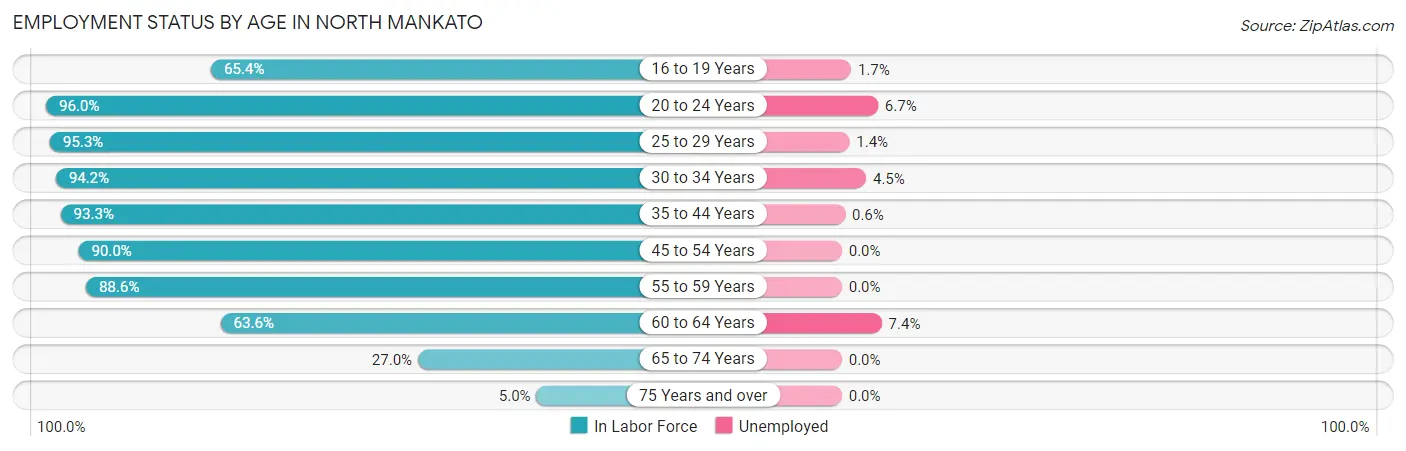
| Age Bracket | In Labor Force | Unemployed |
| 16 to 19 Years | 421 (65.4%) | 7 (1.7%) |
| 20 to 24 Years | 772 (96.0%) | 52 (6.7%) |
| 25 to 29 Years | 844 (95.3%) | 12 (1.4%) |
| 30 to 34 Years | 780 (94.2%) | 35 (4.5%) |
| 35 to 44 Years | 2,010 (93.3%) | 12 (0.6%) |
| 45 to 54 Years | 1,539 (90.0%) | 0 (0.0%) |
| 55 to 59 Years | 604 (88.6%) | 0 (0.0%) |
| 60 to 64 Years | 539 (63.6%) | 40 (7.4%) |
| 65 to 74 Years | 323 (27.0%) | 0 (0.0%) |
| 75 Years and over | 58 (5.0%) | 0 (0.0%) |
| Total | 7,892 (72.3%) | 158 (2.0%) |
Employment Status by Educational Attainment in North Mankato
According to labor force statistics for North Mankato, 88.8% of individuals (6,312) out of the total population between 25 and 64 years of age (7,108) are in the labor force, with 1.6% or 101 of them being unemployed. The group with the highest labor force participation rate are those with the educational attainment of bachelor's degree or higher, with 90.7% or 2,979 individuals in the labor force. Within the labor force, individuals with college / associate degree education have the highest percentage of unemployment, with 2.5% or 57 of them being unemployed.
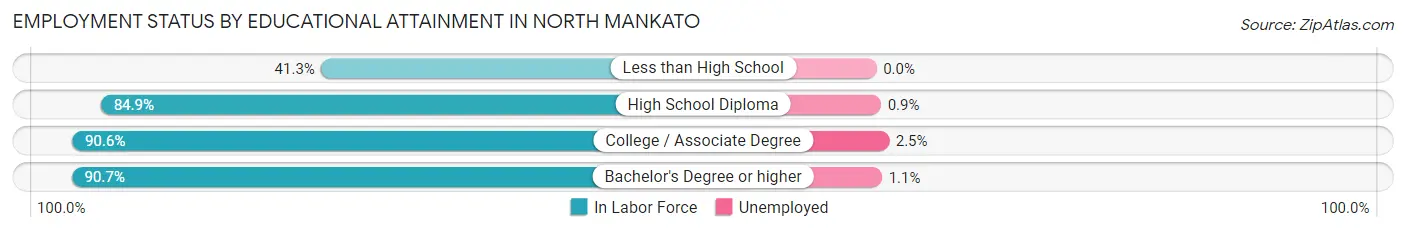
| Educational Attainment | In Labor Force | Unemployed |
| Less than High School | 50 (41.3%) | 0 (0.0%) |
| High School Diploma | 1,009 (84.9%) | 11 (0.9%) |
| College / Associate Degree | 2,279 (90.6%) | 63 (2.5%) |
| Bachelor's Degree or higher | 2,979 (90.7%) | 36 (1.1%) |
| Total | 6,312 (88.8%) | 114 (1.6%) |
Employment Occupations by Sex in North Mankato
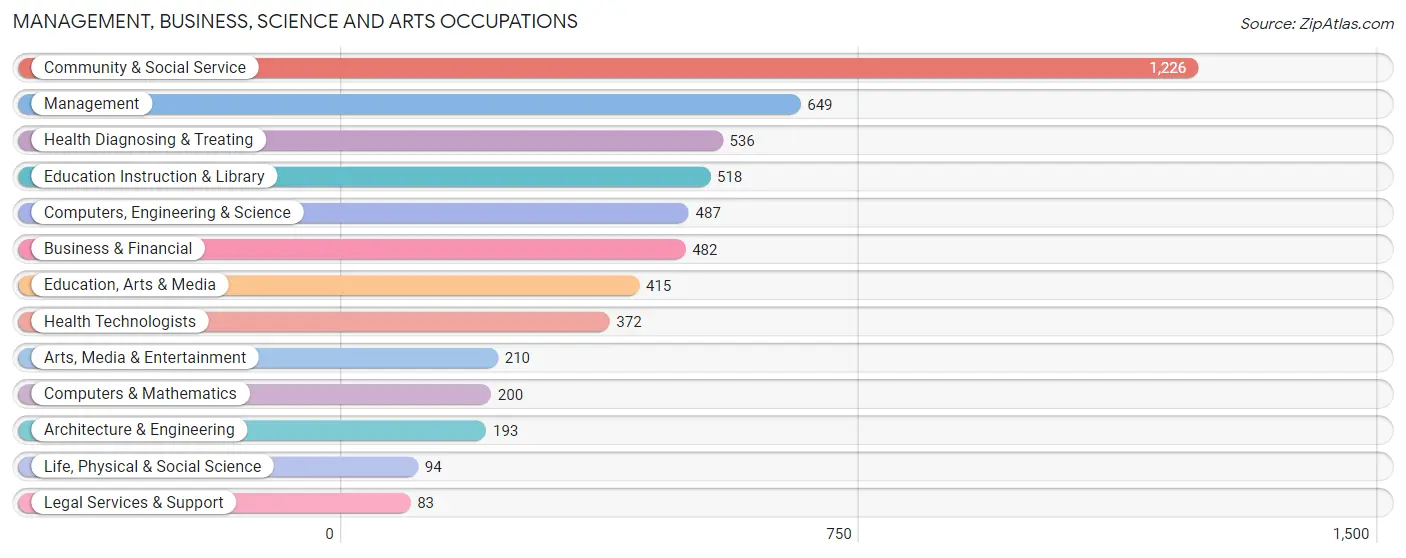
Management, Business, Science and Arts Occupations
The most common Management, Business, Science and Arts occupations in North Mankato are Community & Social Service (1,226 | 15.9%), Management (649 | 8.4%), Health Diagnosing & Treating (536 | 6.9%), Education Instruction & Library (518 | 6.7%), and Computers, Engineering & Science (487 | 6.3%).
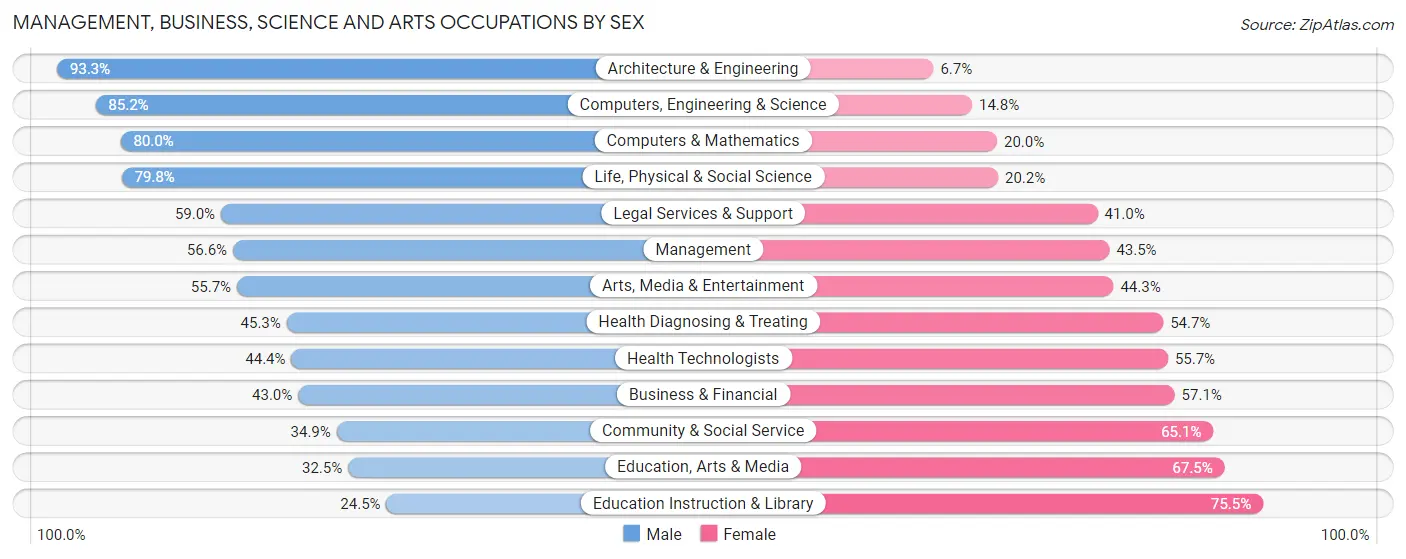
Management, Business, Science and Arts Occupations by Sex
Within the Management, Business, Science and Arts occupations in North Mankato, the most male-oriented occupations are Architecture & Engineering (93.3%), Computers, Engineering & Science (85.2%), and Computers & Mathematics (80.0%), while the most female-oriented occupations are Education Instruction & Library (75.5%), Education, Arts & Media (67.5%), and Community & Social Service (65.1%).
| Occupation | Male | Female |
| Management | 367 (56.6%) | 282 (43.4%) |
| Business & Financial | 207 (42.9%) | 275 (57.1%) |
| Computers, Engineering & Science | 415 (85.2%) | 72 (14.8%) |
| Computers & Mathematics | 160 (80.0%) | 40 (20.0%) |
| Architecture & Engineering | 180 (93.3%) | 13 (6.7%) |
| Life, Physical & Social Science | 75 (79.8%) | 19 (20.2%) |
| Community & Social Service | 428 (34.9%) | 798 (65.1%) |
| Education, Arts & Media | 135 (32.5%) | 280 (67.5%) |
| Legal Services & Support | 49 (59.0%) | 34 (41.0%) |
| Education Instruction & Library | 127 (24.5%) | 391 (75.5%) |
| Arts, Media & Entertainment | 117 (55.7%) | 93 (44.3%) |
| Health Diagnosing & Treating | 243 (45.3%) | 293 (54.7%) |
| Health Technologists | 165 (44.4%) | 207 (55.6%) |
| Total (Category) | 1,660 (49.1%) | 1,720 (50.9%) |
| Total (Overall) | 3,871 (50.1%) | 3,860 (49.9%) |
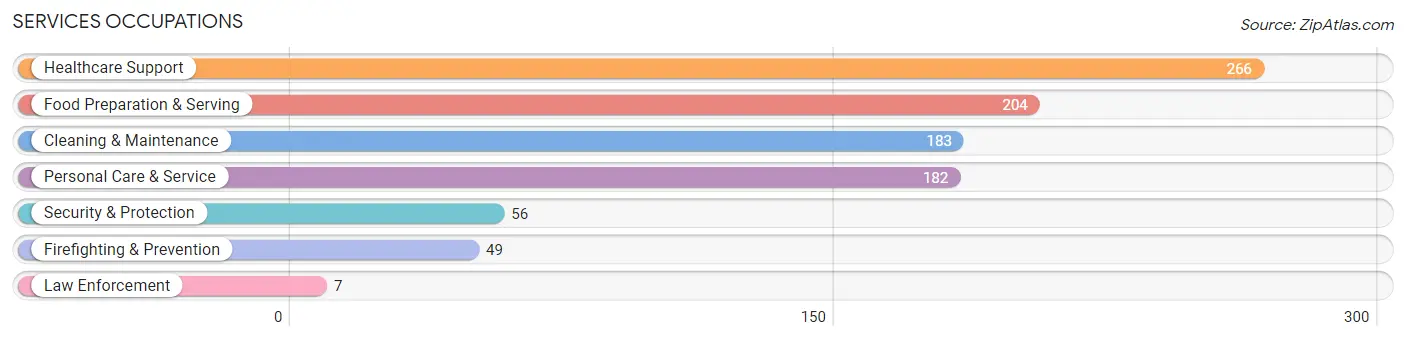
Services Occupations
The most common Services occupations in North Mankato are Healthcare Support (266 | 3.4%), Food Preparation & Serving (204 | 2.6%), Cleaning & Maintenance (183 | 2.4%), Personal Care & Service (182 | 2.4%), and Security & Protection (56 | 0.7%).
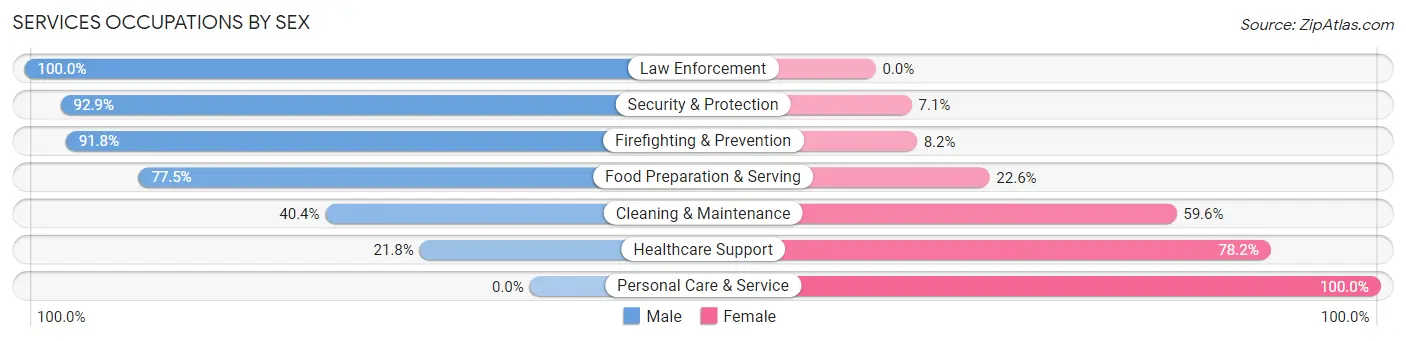
Services Occupations by Sex
Within the Services occupations in North Mankato, the most male-oriented occupations are Law Enforcement (100.0%), Security & Protection (92.9%), and Firefighting & Prevention (91.8%), while the most female-oriented occupations are Personal Care & Service (100.0%), Healthcare Support (78.2%), and Cleaning & Maintenance (59.6%).
| Occupation | Male | Female |
| Healthcare Support | 58 (21.8%) | 208 (78.2%) |
| Security & Protection | 52 (92.9%) | 4 (7.1%) |
| Firefighting & Prevention | 45 (91.8%) | 4 (8.2%) |
| Law Enforcement | 7 (100.0%) | 0 (0.0%) |
| Food Preparation & Serving | 158 (77.4%) | 46 (22.6%) |
| Cleaning & Maintenance | 74 (40.4%) | 109 (59.6%) |
| Personal Care & Service | 0 (0.0%) | 182 (100.0%) |
| Total (Category) | 342 (38.4%) | 549 (61.6%) |
| Total (Overall) | 3,871 (50.1%) | 3,860 (49.9%) |
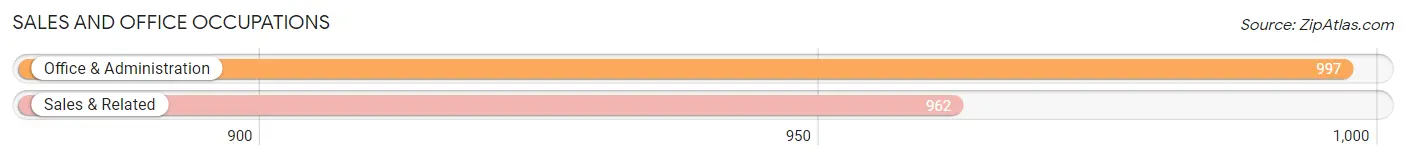
Sales and Office Occupations
The most common Sales and Office occupations in North Mankato are Office & Administration (997 | 12.9%), and Sales & Related (962 | 12.4%).
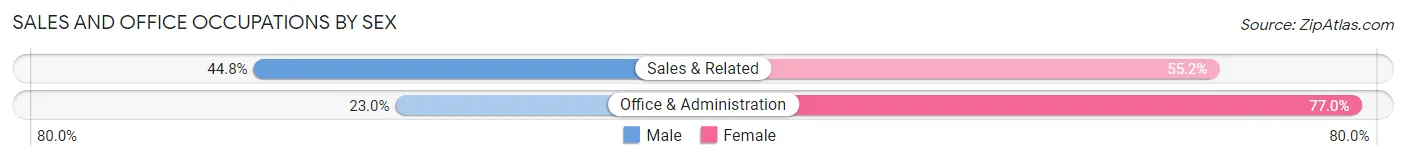
Sales and Office Occupations by Sex
| Occupation | Male | Female |
| Sales & Related | 431 (44.8%) | 531 (55.2%) |
| Office & Administration | 229 (23.0%) | 768 (77.0%) |
| Total (Category) | 660 (33.7%) | 1,299 (66.3%) |
| Total (Overall) | 3,871 (50.1%) | 3,860 (49.9%) |
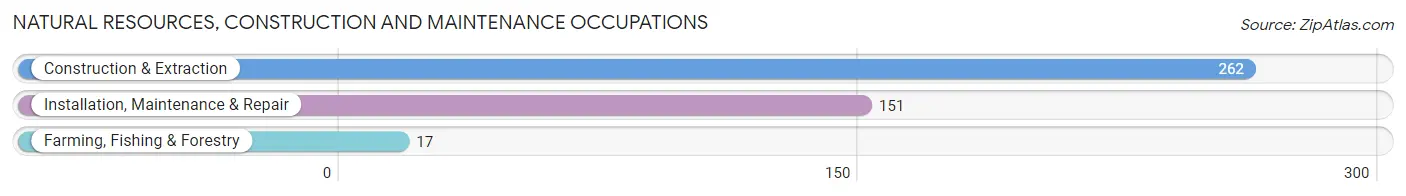
Natural Resources, Construction and Maintenance Occupations
The most common Natural Resources, Construction and Maintenance occupations in North Mankato are Construction & Extraction (262 | 3.4%), Installation, Maintenance & Repair (151 | 1.9%), and Farming, Fishing & Forestry (17 | 0.2%).
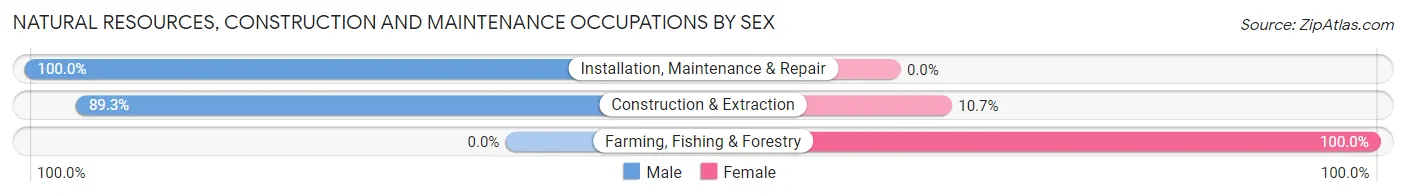
Natural Resources, Construction and Maintenance Occupations by Sex
| Occupation | Male | Female |
| Farming, Fishing & Forestry | 0 (0.0%) | 17 (100.0%) |
| Construction & Extraction | 234 (89.3%) | 28 (10.7%) |
| Installation, Maintenance & Repair | 151 (100.0%) | 0 (0.0%) |
| Total (Category) | 385 (89.5%) | 45 (10.5%) |
| Total (Overall) | 3,871 (50.1%) | 3,860 (49.9%) |
Production, Transportation and Moving Occupations
The most common Production, Transportation and Moving occupations in North Mankato are Production (468 | 6.0%), Material Moving (366 | 4.7%), and Transportation (237 | 3.1%).

Production, Transportation and Moving Occupations by Sex
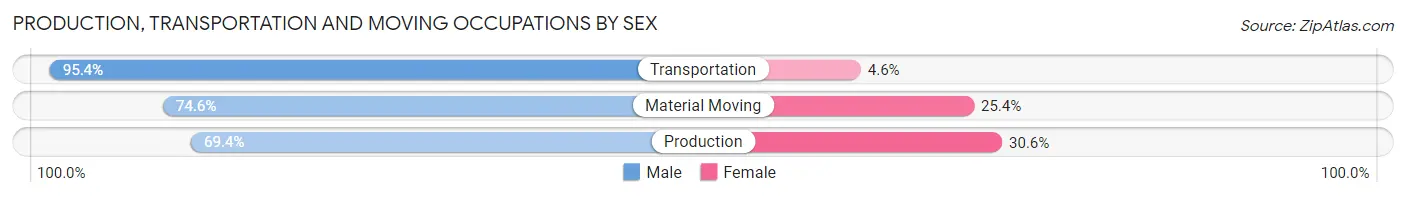
| Occupation | Male | Female |
| Production | 325 (69.4%) | 143 (30.6%) |
| Transportation | 226 (95.4%) | 11 (4.6%) |
| Material Moving | 273 (74.6%) | 93 (25.4%) |
| Total (Category) | 824 (76.9%) | 247 (23.1%) |
| Total (Overall) | 3,871 (50.1%) | 3,860 (49.9%) |
Employment Industries by Sex in North Mankato
Employment Industries in North Mankato
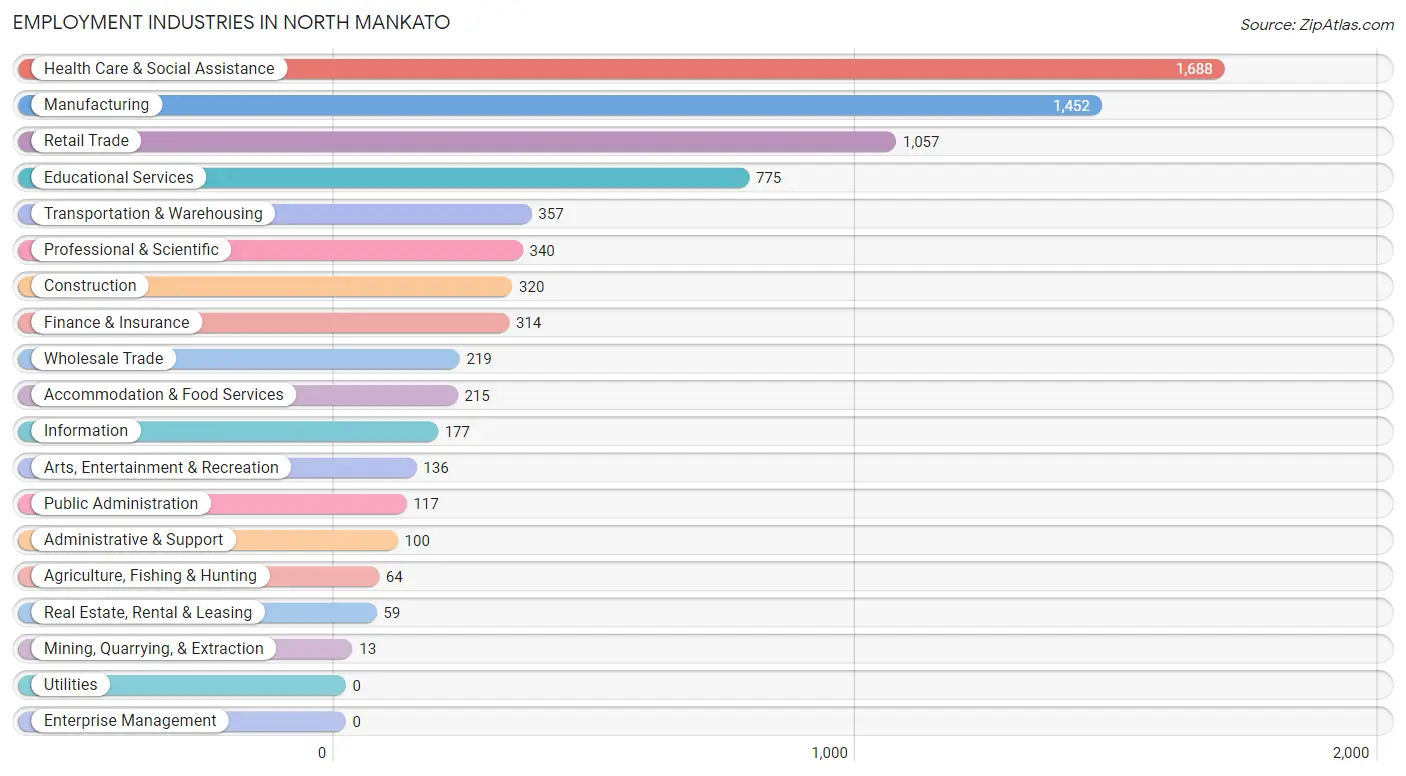
The major employment industries in North Mankato include Health Care & Social Assistance (1,688 | 21.8%), Manufacturing (1,452 | 18.8%), Retail Trade (1,057 | 13.7%), Educational Services (775 | 10.0%), and Transportation & Warehousing (357 | 4.6%).
Employment Industries by Sex in North Mankato
The North Mankato industries that see more men than women are Mining, Quarrying, & Extraction (100.0%), Wholesale Trade (81.7%), and Accommodation & Food Services (81.4%), whereas the industries that tend to have a higher number of women are Health Care & Social Assistance (75.9%), Information (71.8%), and Educational Services (66.6%).
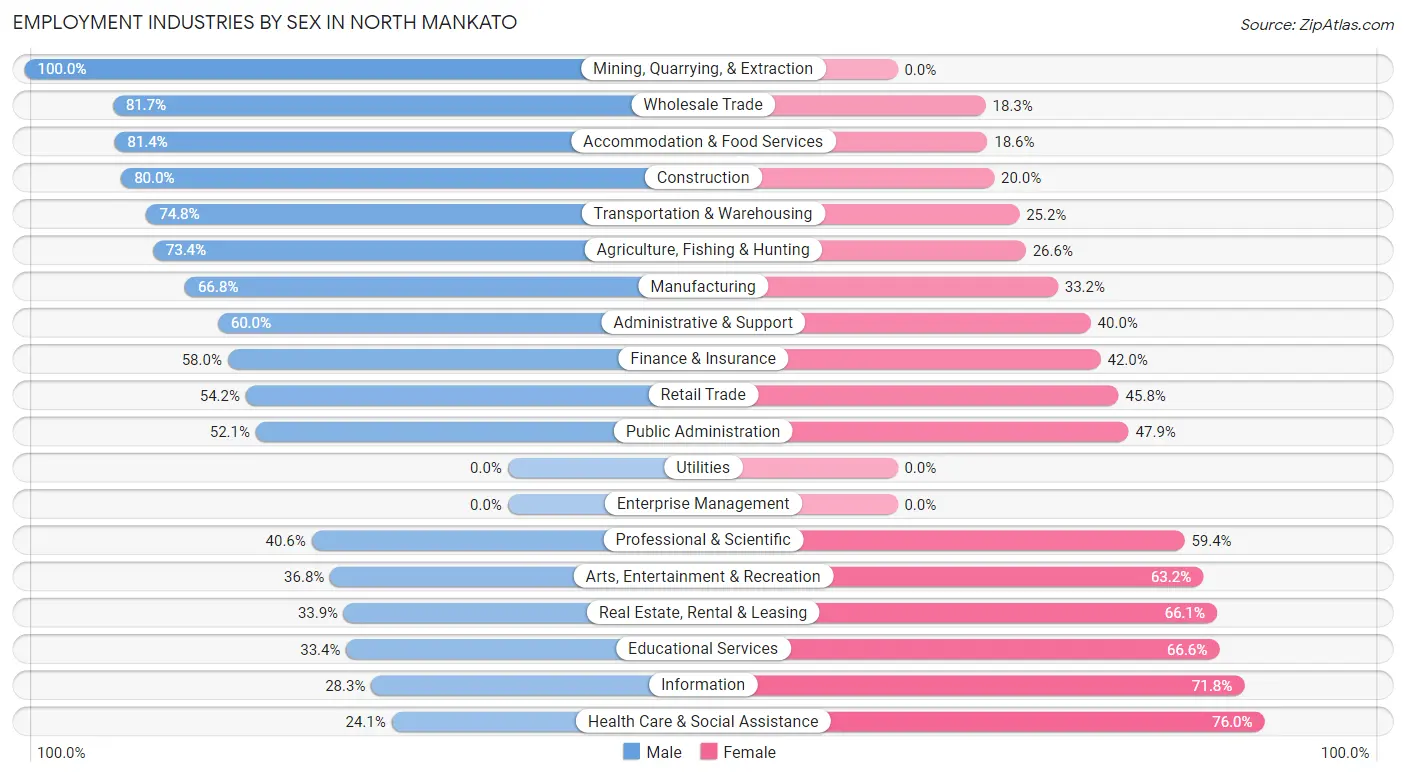
| Industry | Male | Female |
| Agriculture, Fishing & Hunting | 47 (73.4%) | 17 (26.6%) |
| Mining, Quarrying, & Extraction | 13 (100.0%) | 0 (0.0%) |
| Construction | 256 (80.0%) | 64 (20.0%) |
| Manufacturing | 970 (66.8%) | 482 (33.2%) |
| Wholesale Trade | 179 (81.7%) | 40 (18.3%) |
| Retail Trade | 573 (54.2%) | 484 (45.8%) |
| Transportation & Warehousing | 267 (74.8%) | 90 (25.2%) |
| Utilities | 0 (0.0%) | 0 (0.0%) |
| Information | 50 (28.2%) | 127 (71.8%) |
| Finance & Insurance | 182 (58.0%) | 132 (42.0%) |
| Real Estate, Rental & Leasing | 20 (33.9%) | 39 (66.1%) |
| Professional & Scientific | 138 (40.6%) | 202 (59.4%) |
| Enterprise Management | 0 (0.0%) | 0 (0.0%) |
| Administrative & Support | 60 (60.0%) | 40 (40.0%) |
| Educational Services | 259 (33.4%) | 516 (66.6%) |
| Health Care & Social Assistance | 406 (24.0%) | 1,282 (75.9%) |
| Arts, Entertainment & Recreation | 50 (36.8%) | 86 (63.2%) |
| Accommodation & Food Services | 175 (81.4%) | 40 (18.6%) |
| Public Administration | 61 (52.1%) | 56 (47.9%) |
| Total | 3,871 (50.1%) | 3,860 (49.9%) |
Education in North Mankato
School Enrollment in North Mankato
The most common levels of schooling among the 3,423 students in North Mankato are middle school (923 | 27.0%), elementary school (694 | 20.3%), and high school (553 | 16.2%).
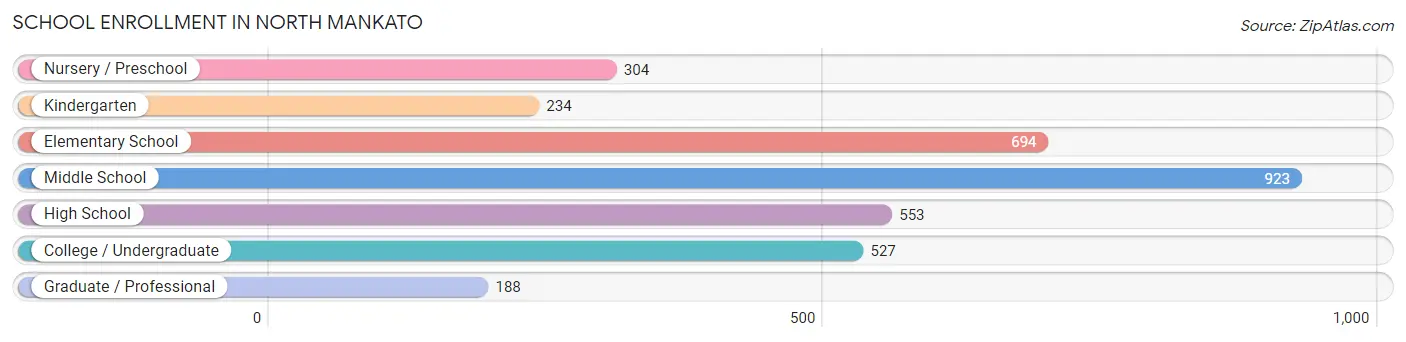
| School Level | # Students | % Students |
| Nursery / Preschool | 304 | 8.9% |
| Kindergarten | 234 | 6.8% |
| Elementary School | 694 | 20.3% |
| Middle School | 923 | 27.0% |
| High School | 553 | 16.2% |
| College / Undergraduate | 527 | 15.4% |
| Graduate / Professional | 188 | 5.5% |
| Total | 3,423 | 100.0% |
School Enrollment by Age by Funding Source in North Mankato
Out of a total of 3,423 students who are enrolled in schools in North Mankato, 780 (22.8%) attend a private institution, while the remaining 2,643 (77.2%) are enrolled in public schools. The age group of 3 to 4 year olds has the highest likelihood of being enrolled in private schools, with 99 (72.3% in the age bracket) enrolled. Conversely, the age group of 18 to 19 year olds has the lowest likelihood of being enrolled in a private school, with 165 (97.6% in the age bracket) attending a public institution.
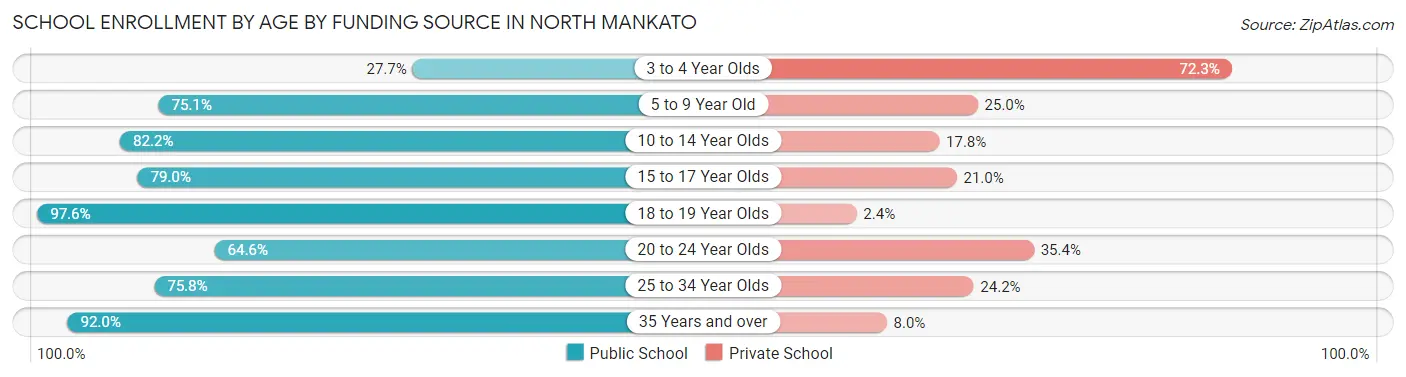
| Age Bracket | Public School | Private School |
| 3 to 4 Year Olds | 38 (27.7%) | 99 (72.3%) |
| 5 to 9 Year Old | 692 (75.0%) | 230 (24.9%) |
| 10 to 14 Year Olds | 976 (82.2%) | 211 (17.8%) |
| 15 to 17 Year Olds | 353 (79.0%) | 94 (21.0%) |
| 18 to 19 Year Olds | 165 (97.6%) | 4 (2.4%) |
| 20 to 24 Year Olds | 188 (64.6%) | 103 (35.4%) |
| 25 to 34 Year Olds | 91 (75.8%) | 29 (24.2%) |
| 35 Years and over | 138 (92.0%) | 12 (8.0%) |
| Total | 2,643 (77.2%) | 780 (22.8%) |
Educational Attainment by Field of Study in North Mankato
Business (780 | 17.5%), education (756 | 17.0%), science & technology (614 | 13.8%), arts & humanities (513 | 11.5%), and social sciences (316 | 7.1%) are the most common fields of study among 4,454 individuals in North Mankato who have obtained a bachelor's degree or higher.
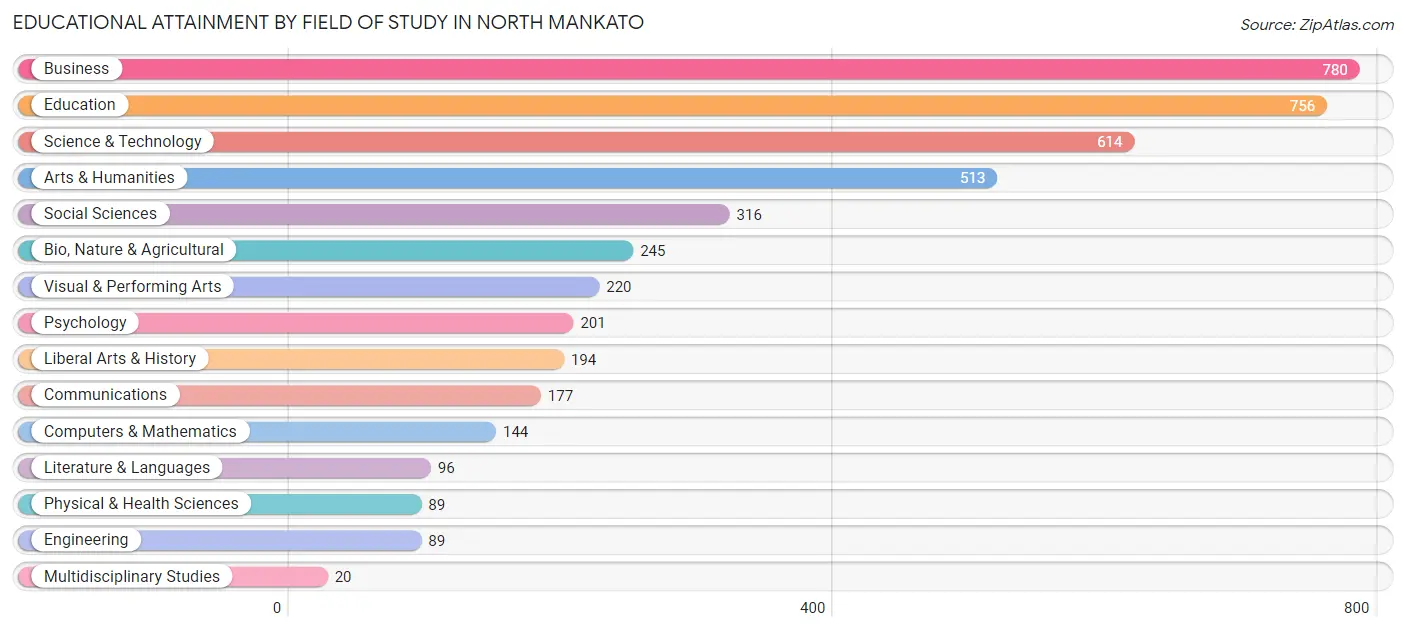
| Field of Study | # Graduates | % Graduates |
| Computers & Mathematics | 144 | 3.2% |
| Bio, Nature & Agricultural | 245 | 5.5% |
| Physical & Health Sciences | 89 | 2.0% |
| Psychology | 201 | 4.5% |
| Social Sciences | 316 | 7.1% |
| Engineering | 89 | 2.0% |
| Multidisciplinary Studies | 20 | 0.4% |
| Science & Technology | 614 | 13.8% |
| Business | 780 | 17.5% |
| Education | 756 | 17.0% |
| Literature & Languages | 96 | 2.2% |
| Liberal Arts & History | 194 | 4.4% |
| Visual & Performing Arts | 220 | 4.9% |
| Communications | 177 | 4.0% |
| Arts & Humanities | 513 | 11.5% |
| Total | 4,454 | 100.0% |
Transportation & Commute in North Mankato
Vehicle Availability by Sex in North Mankato
The most prevalent vehicle ownership categories in North Mankato are males with 2 vehicles (1,682, accounting for 44.8%) and females with 2 vehicles (1,723, making up 44.5%).
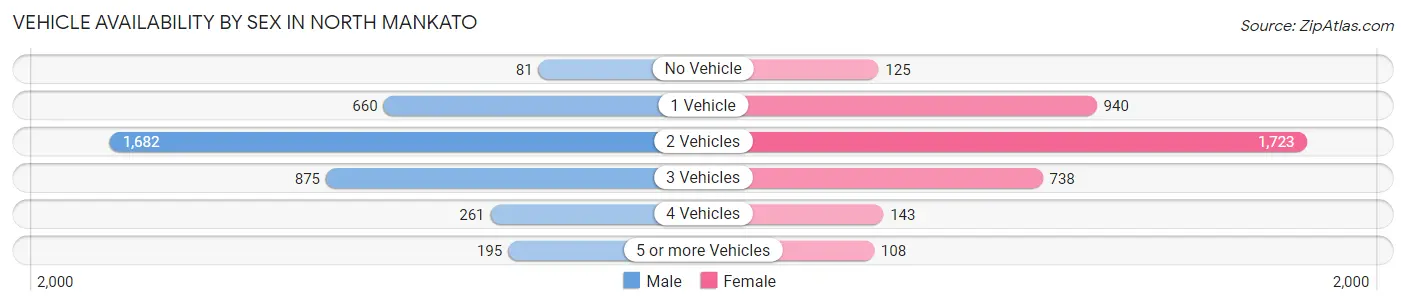
| Vehicles Available | Male | Female |
| No Vehicle | 81 (2.2%) | 125 (3.3%) |
| 1 Vehicle | 660 (17.6%) | 940 (24.9%) |
| 2 Vehicles | 1,682 (44.8%) | 1,723 (45.6%) |
| 3 Vehicles | 875 (23.3%) | 738 (19.5%) |
| 4 Vehicles | 261 (7.0%) | 143 (3.8%) |
| 5 or more Vehicles | 195 (5.2%) | 108 (2.9%) |
| Total | 3,754 (100.0%) | 3,777 (100.0%) |
Commute Time in North Mankato
The most frequently occuring commute durations in North Mankato are 10 to 14 minutes (2,265 commuters, 32.8%), 5 to 9 minutes (1,518 commuters, 22.0%), and 15 to 19 minutes (1,180 commuters, 17.1%).
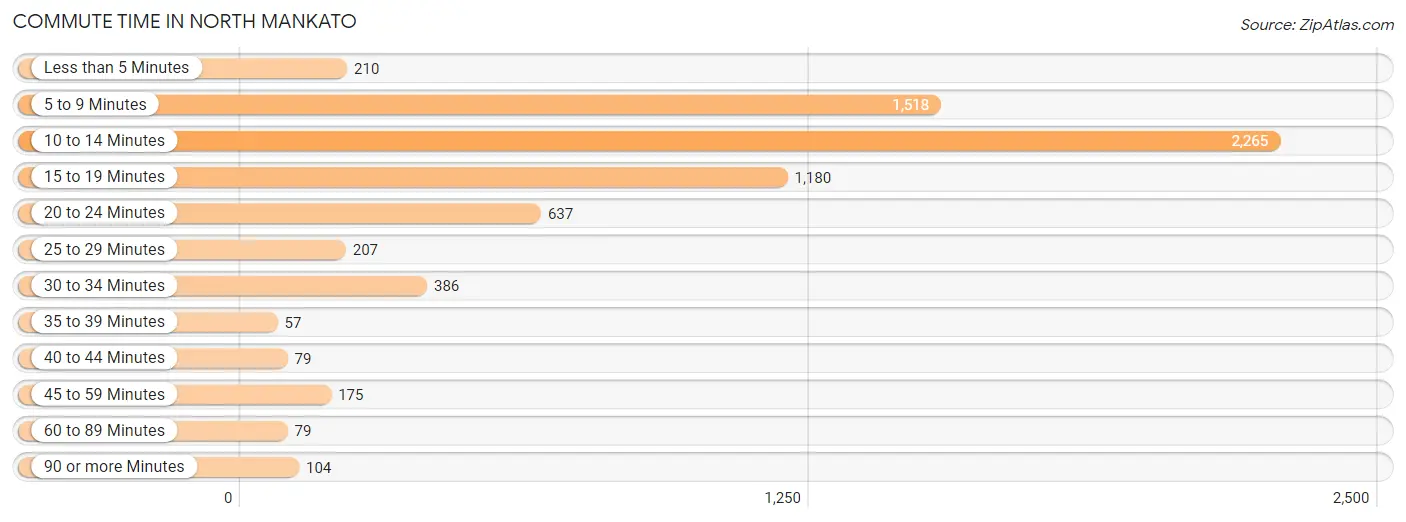
| Commute Time | # Commuters | % Commuters |
| Less than 5 Minutes | 210 | 3.0% |
| 5 to 9 Minutes | 1,518 | 22.0% |
| 10 to 14 Minutes | 2,265 | 32.8% |
| 15 to 19 Minutes | 1,180 | 17.1% |
| 20 to 24 Minutes | 637 | 9.2% |
| 25 to 29 Minutes | 207 | 3.0% |
| 30 to 34 Minutes | 386 | 5.6% |
| 35 to 39 Minutes | 57 | 0.8% |
| 40 to 44 Minutes | 79 | 1.1% |
| 45 to 59 Minutes | 175 | 2.5% |
| 60 to 89 Minutes | 79 | 1.1% |
| 90 or more Minutes | 104 | 1.5% |
Commute Time by Sex in North Mankato
The most common commute times in North Mankato are 10 to 14 minutes (1,057 commuters, 29.7%) for males and 10 to 14 minutes (1,208 commuters, 36.2%) for females.
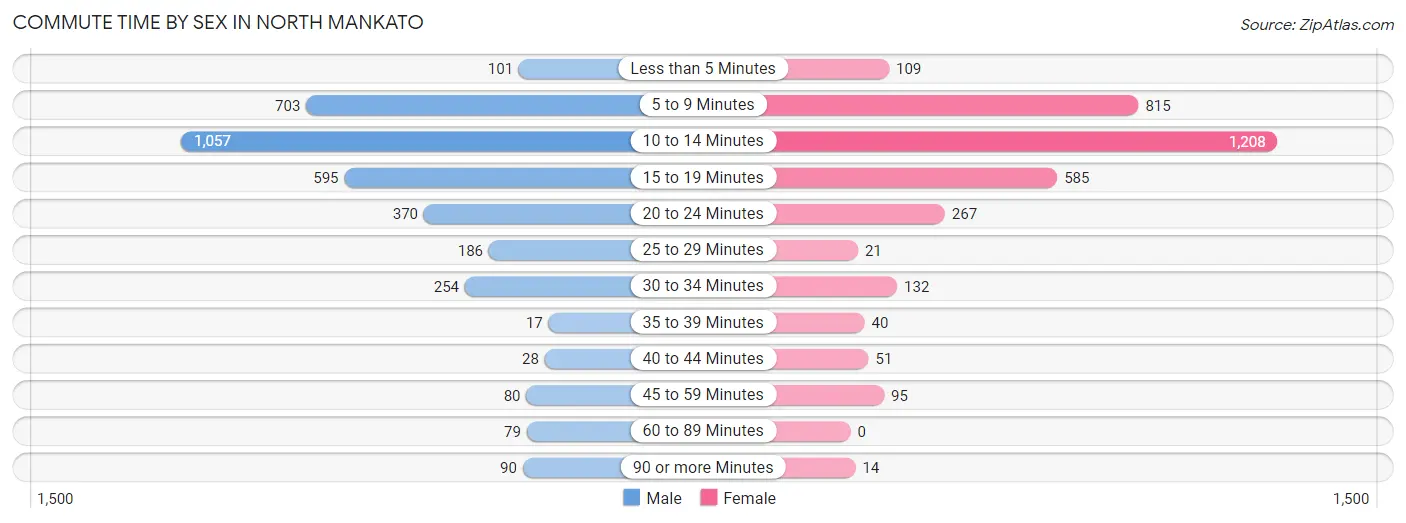
| Commute Time | Male | Female |
| Less than 5 Minutes | 101 (2.8%) | 109 (3.3%) |
| 5 to 9 Minutes | 703 (19.8%) | 815 (24.4%) |
| 10 to 14 Minutes | 1,057 (29.7%) | 1,208 (36.2%) |
| 15 to 19 Minutes | 595 (16.7%) | 585 (17.5%) |
| 20 to 24 Minutes | 370 (10.4%) | 267 (8.0%) |
| 25 to 29 Minutes | 186 (5.2%) | 21 (0.6%) |
| 30 to 34 Minutes | 254 (7.1%) | 132 (4.0%) |
| 35 to 39 Minutes | 17 (0.5%) | 40 (1.2%) |
| 40 to 44 Minutes | 28 (0.8%) | 51 (1.5%) |
| 45 to 59 Minutes | 80 (2.2%) | 95 (2.9%) |
| 60 to 89 Minutes | 79 (2.2%) | 0 (0.0%) |
| 90 or more Minutes | 90 (2.5%) | 14 (0.4%) |
Time of Departure to Work by Sex in North Mankato
The most frequent times of departure to work in North Mankato are 7:30 AM to 7:59 AM (686, 19.3%) for males and 7:30 AM to 7:59 AM (849, 25.4%) for females.
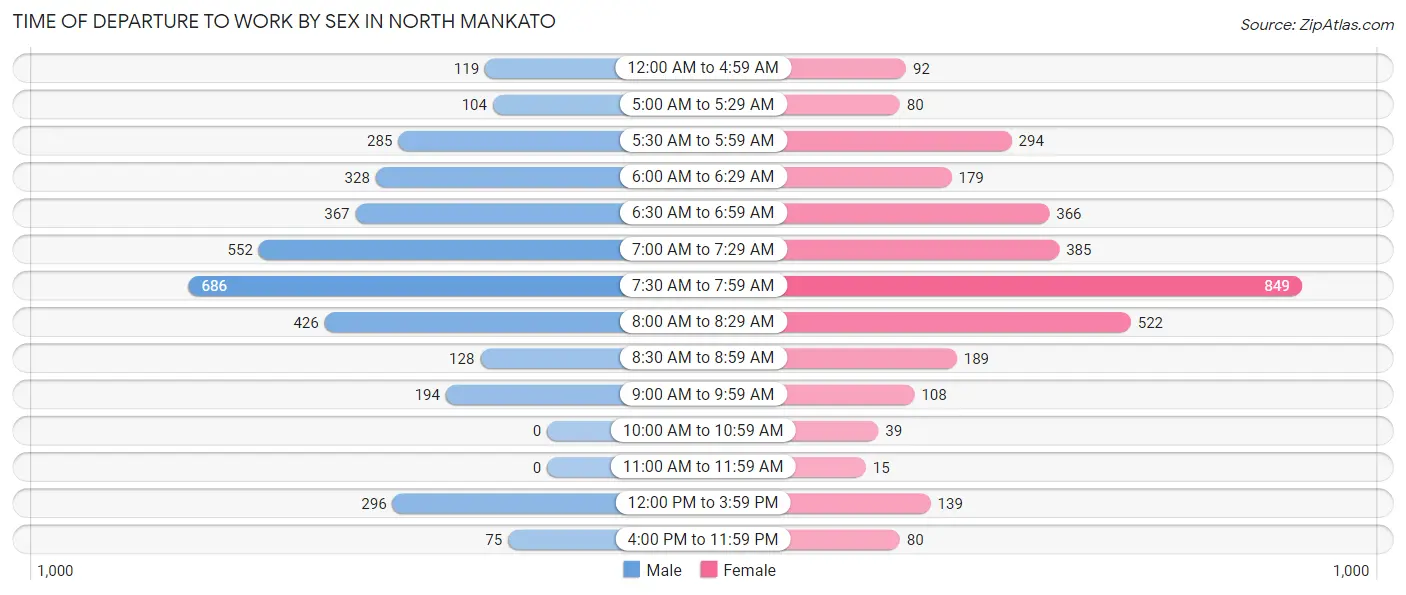
| Time of Departure | Male | Female |
| 12:00 AM to 4:59 AM | 119 (3.3%) | 92 (2.8%) |
| 5:00 AM to 5:29 AM | 104 (2.9%) | 80 (2.4%) |
| 5:30 AM to 5:59 AM | 285 (8.0%) | 294 (8.8%) |
| 6:00 AM to 6:29 AM | 328 (9.2%) | 179 (5.4%) |
| 6:30 AM to 6:59 AM | 367 (10.3%) | 366 (11.0%) |
| 7:00 AM to 7:29 AM | 552 (15.5%) | 385 (11.5%) |
| 7:30 AM to 7:59 AM | 686 (19.3%) | 849 (25.4%) |
| 8:00 AM to 8:29 AM | 426 (12.0%) | 522 (15.6%) |
| 8:30 AM to 8:59 AM | 128 (3.6%) | 189 (5.7%) |
| 9:00 AM to 9:59 AM | 194 (5.4%) | 108 (3.2%) |
| 10:00 AM to 10:59 AM | 0 (0.0%) | 39 (1.2%) |
| 11:00 AM to 11:59 AM | 0 (0.0%) | 15 (0.4%) |
| 12:00 PM to 3:59 PM | 296 (8.3%) | 139 (4.2%) |
| 4:00 PM to 11:59 PM | 75 (2.1%) | 80 (2.4%) |
| Total | 3,560 (100.0%) | 3,337 (100.0%) |
Housing Occupancy in North Mankato
Occupancy by Ownership in North Mankato
Of the total 5,923 dwellings in North Mankato, owner-occupied units account for 4,433 (74.8%), while renter-occupied units make up 1,490 (25.2%).
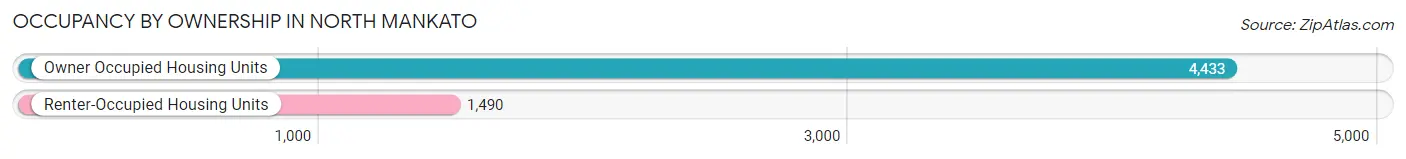
| Occupancy | # Housing Units | % Housing Units |
| Owner Occupied Housing Units | 4,433 | 74.8% |
| Renter-Occupied Housing Units | 1,490 | 25.2% |
| Total Occupied Housing Units | 5,923 | 100.0% |
Occupancy by Household Size in North Mankato
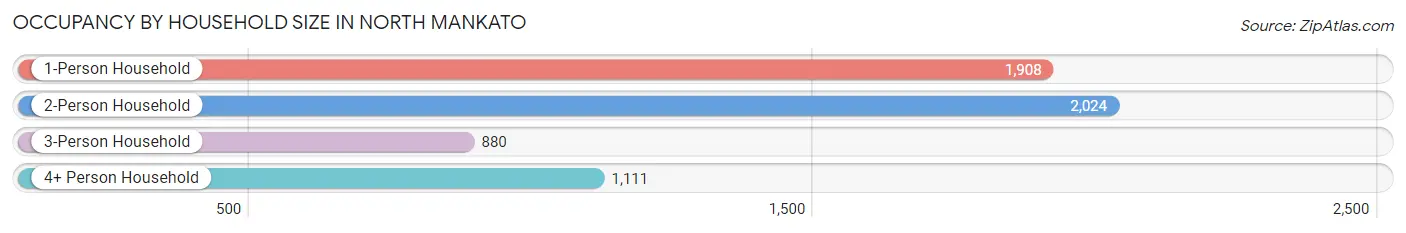
| Household Size | # Housing Units | % Housing Units |
| 1-Person Household | 1,908 | 32.2% |
| 2-Person Household | 2,024 | 34.2% |
| 3-Person Household | 880 | 14.9% |
| 4+ Person Household | 1,111 | 18.8% |
| Total Housing Units | 5,923 | 100.0% |
Occupancy by Ownership by Household Size in North Mankato
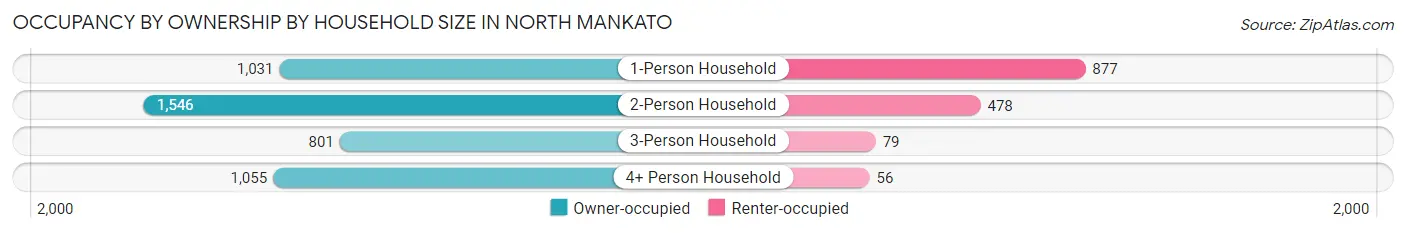
| Household Size | Owner-occupied | Renter-occupied |
| 1-Person Household | 1,031 (54.0%) | 877 (46.0%) |
| 2-Person Household | 1,546 (76.4%) | 478 (23.6%) |
| 3-Person Household | 801 (91.0%) | 79 (9.0%) |
| 4+ Person Household | 1,055 (95.0%) | 56 (5.0%) |
| Total Housing Units | 4,433 (74.8%) | 1,490 (25.2%) |
Occupancy by Educational Attainment in North Mankato
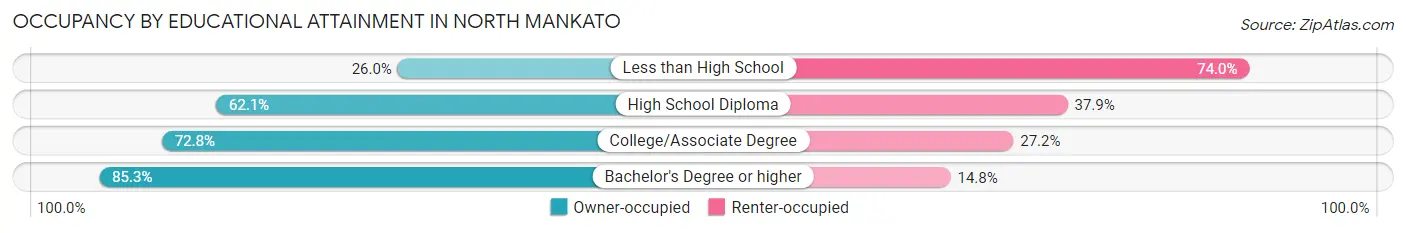
| Household Size | Owner-occupied | Renter-occupied |
| Less than High School | 38 (26.0%) | 108 (74.0%) |
| High School Diploma | 818 (62.1%) | 500 (37.9%) |
| College/Associate Degree | 1,312 (72.8%) | 490 (27.2%) |
| Bachelor's Degree or higher | 2,265 (85.3%) | 392 (14.7%) |
Occupancy by Age of Householder in North Mankato
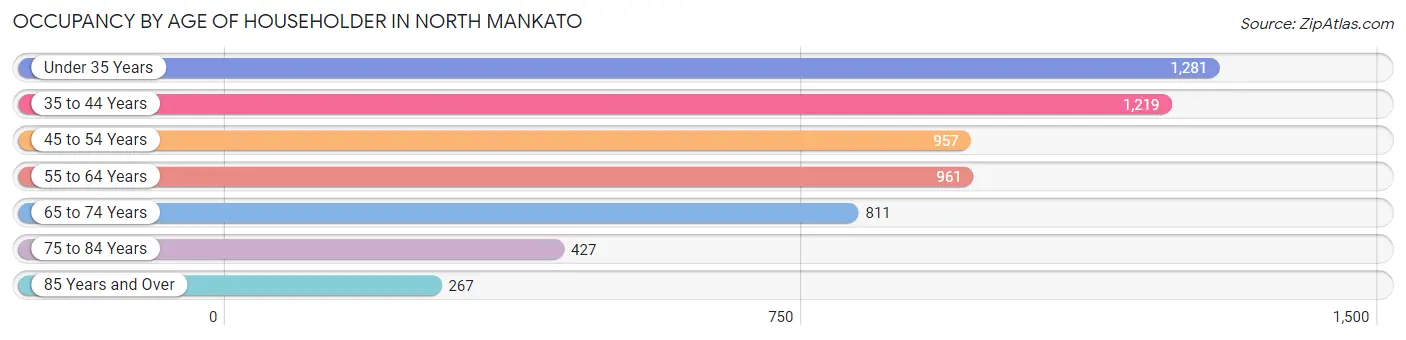
| Age Bracket | # Households | % Households |
| Under 35 Years | 1,281 | 21.6% |
| 35 to 44 Years | 1,219 | 20.6% |
| 45 to 54 Years | 957 | 16.2% |
| 55 to 64 Years | 961 | 16.2% |
| 65 to 74 Years | 811 | 13.7% |
| 75 to 84 Years | 427 | 7.2% |
| 85 Years and Over | 267 | 4.5% |
| Total | 5,923 | 100.0% |
Housing Finances in North Mankato
Median Income by Occupancy in North Mankato
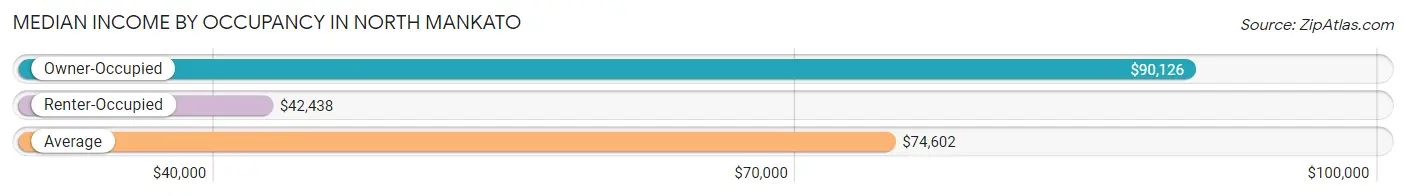
| Occupancy Type | # Households | Median Income |
| Owner-Occupied | 4,433 (74.8%) | $90,126 |
| Renter-Occupied | 1,490 (25.2%) | $42,438 |
| Average | 5,923 (100.0%) | $74,602 |
Occupancy by Householder Income Bracket in North Mankato
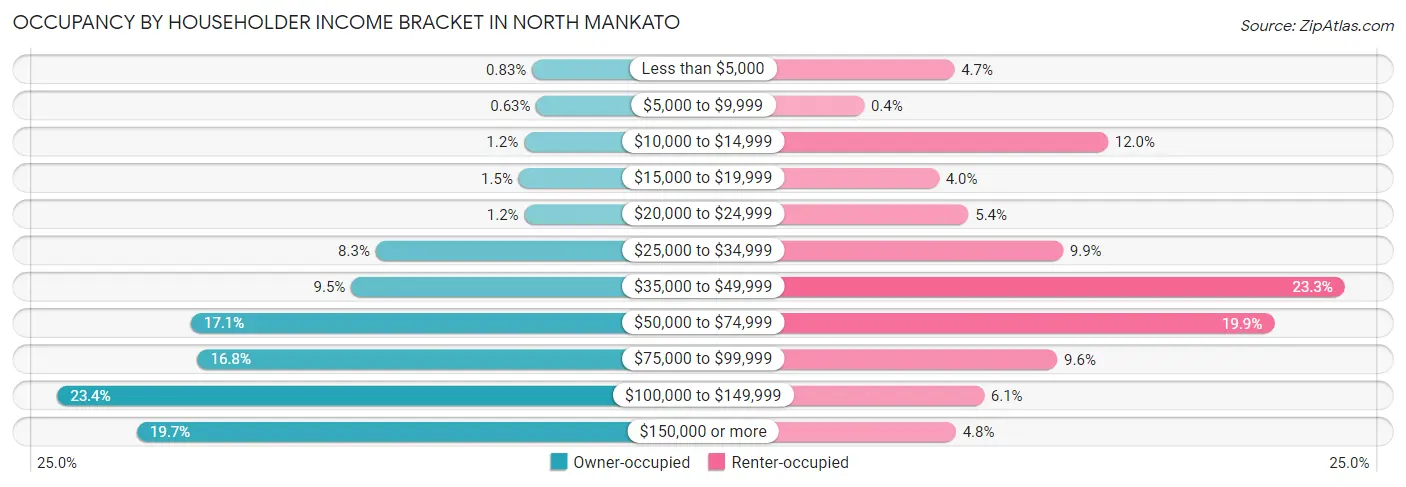
| Income Bracket | Owner-occupied | Renter-occupied |
| Less than $5,000 | 37 (0.8%) | 70 (4.7%) |
| $5,000 to $9,999 | 28 (0.6%) | 6 (0.4%) |
| $10,000 to $14,999 | 54 (1.2%) | 179 (12.0%) |
| $15,000 to $19,999 | 65 (1.5%) | 59 (4.0%) |
| $20,000 to $24,999 | 53 (1.2%) | 80 (5.4%) |
| $25,000 to $34,999 | 367 (8.3%) | 147 (9.9%) |
| $35,000 to $49,999 | 419 (9.5%) | 347 (23.3%) |
| $50,000 to $74,999 | 757 (17.1%) | 297 (19.9%) |
| $75,000 to $99,999 | 743 (16.8%) | 143 (9.6%) |
| $100,000 to $149,999 | 1,039 (23.4%) | 91 (6.1%) |
| $150,000 or more | 871 (19.7%) | 71 (4.8%) |
| Total | 4,433 (100.0%) | 1,490 (100.0%) |
Monthly Housing Cost Tiers in North Mankato
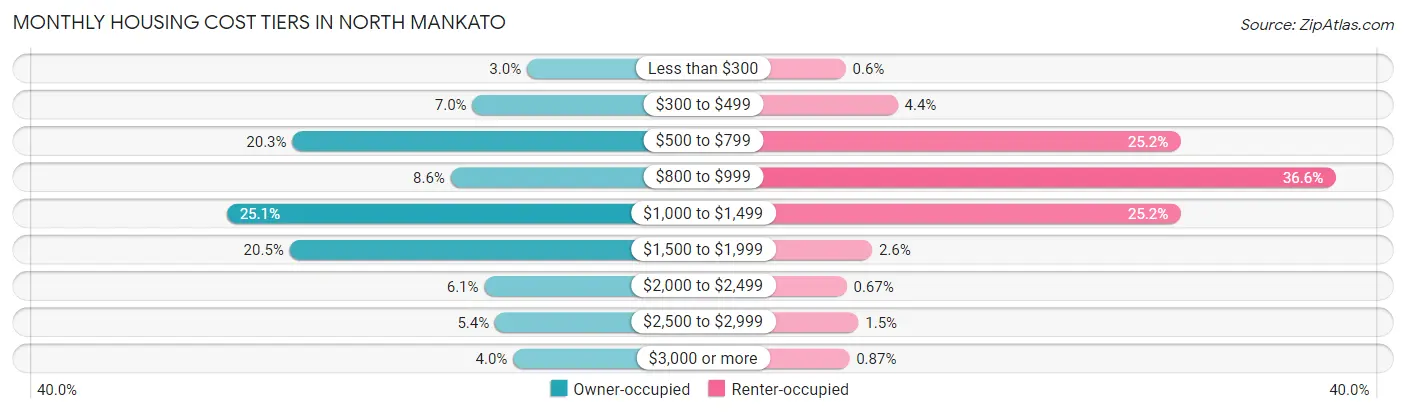
| Monthly Cost | Owner-occupied | Renter-occupied |
| Less than $300 | 133 (3.0%) | 9 (0.6%) |
| $300 to $499 | 311 (7.0%) | 66 (4.4%) |
| $500 to $799 | 899 (20.3%) | 376 (25.2%) |
| $800 to $999 | 382 (8.6%) | 546 (36.6%) |
| $1,000 to $1,499 | 1,113 (25.1%) | 376 (25.2%) |
| $1,500 to $1,999 | 908 (20.5%) | 38 (2.5%) |
| $2,000 to $2,499 | 272 (6.1%) | 10 (0.7%) |
| $2,500 to $2,999 | 237 (5.3%) | 23 (1.5%) |
| $3,000 or more | 178 (4.0%) | 13 (0.9%) |
| Total | 4,433 (100.0%) | 1,490 (100.0%) |
Physical Housing Characteristics in North Mankato
Housing Structures in North Mankato
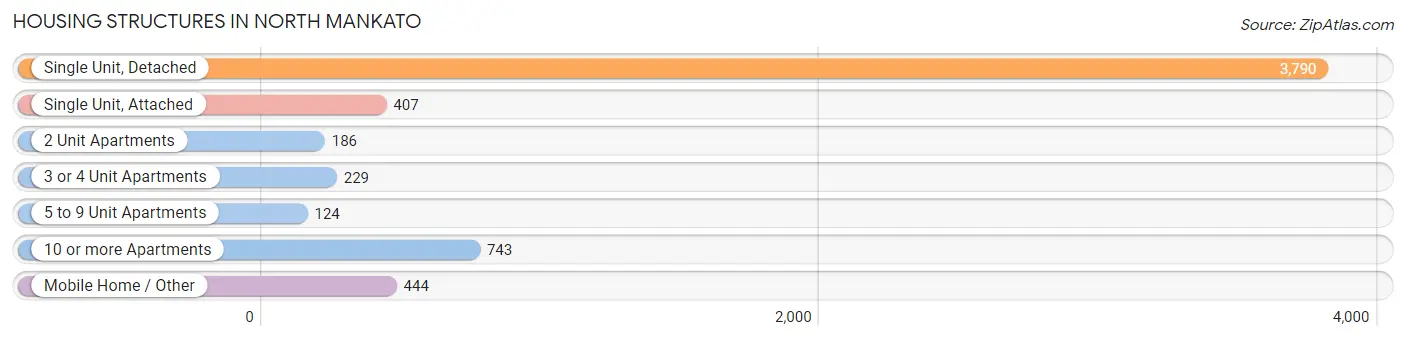
| Structure Type | # Housing Units | % Housing Units |
| Single Unit, Detached | 3,790 | 64.0% |
| Single Unit, Attached | 407 | 6.9% |
| 2 Unit Apartments | 186 | 3.1% |
| 3 or 4 Unit Apartments | 229 | 3.9% |
| 5 to 9 Unit Apartments | 124 | 2.1% |
| 10 or more Apartments | 743 | 12.5% |
| Mobile Home / Other | 444 | 7.5% |
| Total | 5,923 | 100.0% |
Housing Structures by Occupancy in North Mankato
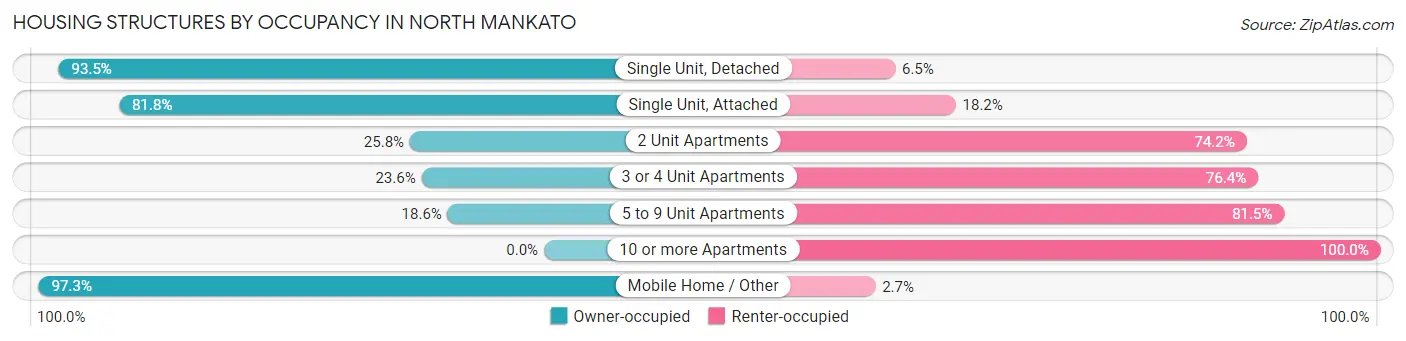
| Structure Type | Owner-occupied | Renter-occupied |
| Single Unit, Detached | 3,543 (93.5%) | 247 (6.5%) |
| Single Unit, Attached | 333 (81.8%) | 74 (18.2%) |
| 2 Unit Apartments | 48 (25.8%) | 138 (74.2%) |
| 3 or 4 Unit Apartments | 54 (23.6%) | 175 (76.4%) |
| 5 to 9 Unit Apartments | 23 (18.5%) | 101 (81.5%) |
| 10 or more Apartments | 0 (0.0%) | 743 (100.0%) |
| Mobile Home / Other | 432 (97.3%) | 12 (2.7%) |
| Total | 4,433 (74.8%) | 1,490 (25.2%) |
Housing Structures by Number of Rooms in North Mankato
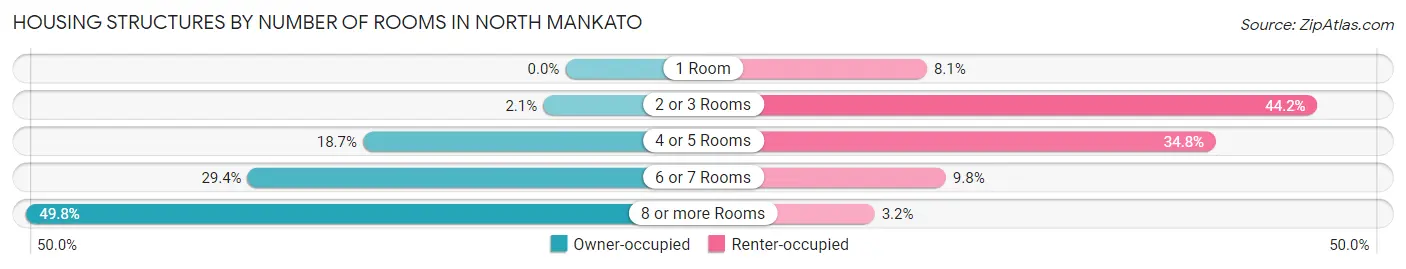
| Number of Rooms | Owner-occupied | Renter-occupied |
| 1 Room | 0 (0.0%) | 120 (8.1%) |
| 2 or 3 Rooms | 91 (2.1%) | 658 (44.2%) |
| 4 or 5 Rooms | 830 (18.7%) | 518 (34.8%) |
| 6 or 7 Rooms | 1,303 (29.4%) | 146 (9.8%) |
| 8 or more Rooms | 2,209 (49.8%) | 48 (3.2%) |
| Total | 4,433 (100.0%) | 1,490 (100.0%) |
Housing Structure by Heating Type in North Mankato
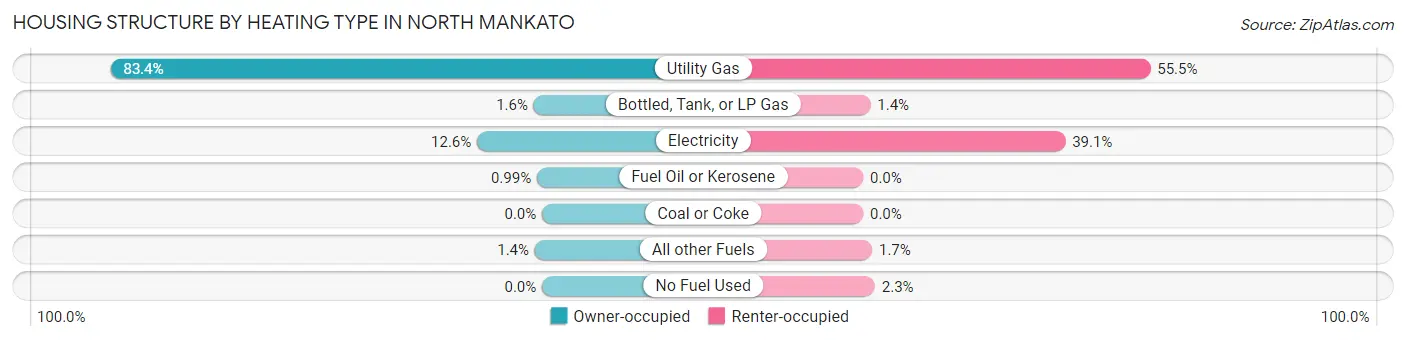
| Heating Type | Owner-occupied | Renter-occupied |
| Utility Gas | 3,699 (83.4%) | 827 (55.5%) |
| Bottled, Tank, or LP Gas | 71 (1.6%) | 21 (1.4%) |
| Electricity | 557 (12.6%) | 582 (39.1%) |
| Fuel Oil or Kerosene | 44 (1.0%) | 0 (0.0%) |
| Coal or Coke | 0 (0.0%) | 0 (0.0%) |
| All other Fuels | 62 (1.4%) | 26 (1.7%) |
| No Fuel Used | 0 (0.0%) | 34 (2.3%) |
| Total | 4,433 (100.0%) | 1,490 (100.0%) |
Household Vehicle Usage in North Mankato
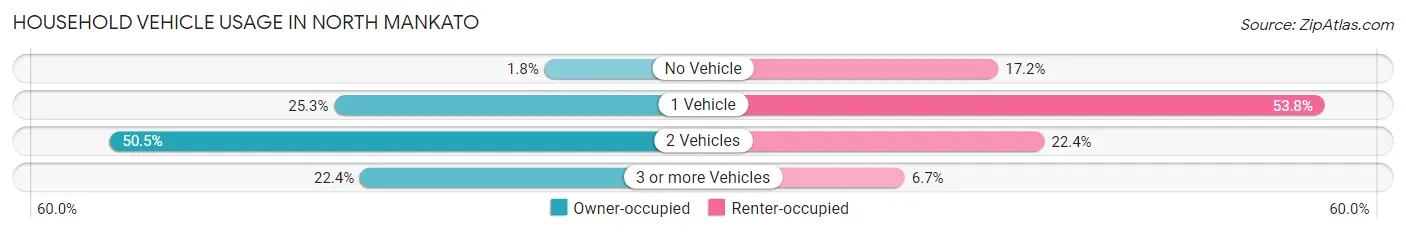
| Vehicles per Household | Owner-occupied | Renter-occupied |
| No Vehicle | 78 (1.8%) | 256 (17.2%) |
| 1 Vehicle | 1,122 (25.3%) | 801 (53.8%) |
| 2 Vehicles | 2,239 (50.5%) | 333 (22.4%) |
| 3 or more Vehicles | 994 (22.4%) | 100 (6.7%) |
| Total | 4,433 (100.0%) | 1,490 (100.0%) |
Real Estate & Mortgages in North Mankato
Real Estate and Mortgage Overview in North Mankato
| Characteristic | Without Mortgage | With Mortgage |
| Housing Units | 1,567 | 2,866 |
| Median Property Value | $223,700 | $240,800 |
| Median Household Income | $76,759 | $651 |
| Monthly Housing Costs | $621 | $168 |
| Real Estate Taxes | $2,578 | $94 |
Property Value by Mortgage Status in North Mankato
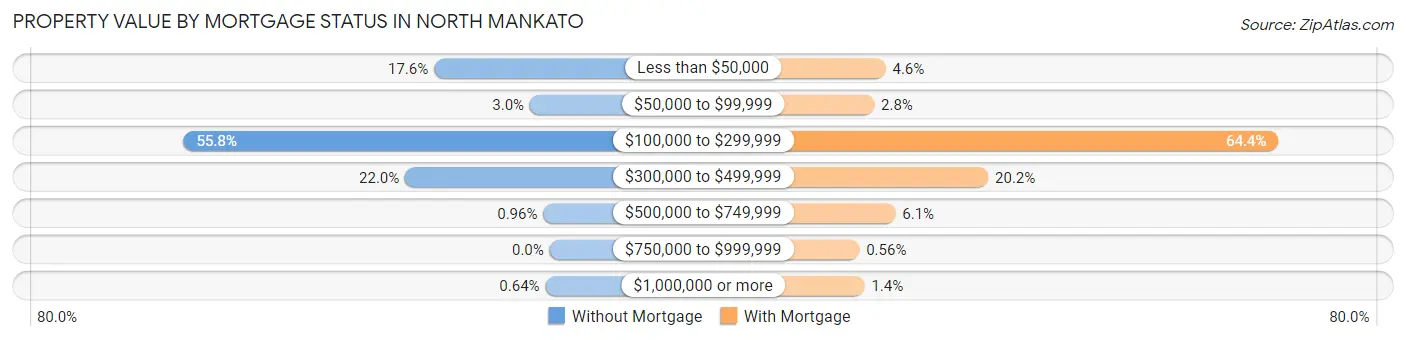
| Property Value | Without Mortgage | With Mortgage |
| Less than $50,000 | 276 (17.6%) | 131 (4.6%) |
| $50,000 to $99,999 | 47 (3.0%) | 81 (2.8%) |
| $100,000 to $299,999 | 874 (55.8%) | 1,846 (64.4%) |
| $300,000 to $499,999 | 345 (22.0%) | 579 (20.2%) |
| $500,000 to $749,999 | 15 (1.0%) | 174 (6.1%) |
| $750,000 to $999,999 | 0 (0.0%) | 16 (0.6%) |
| $1,000,000 or more | 10 (0.6%) | 39 (1.4%) |
| Total | 1,567 (100.0%) | 2,866 (100.0%) |
Household Income by Mortgage Status in North Mankato
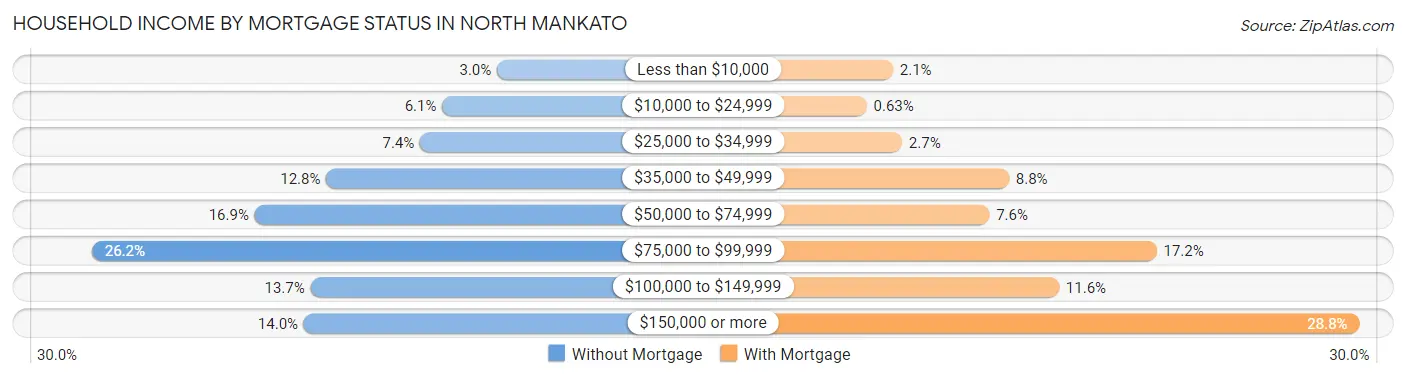
| Household Income | Without Mortgage | With Mortgage |
| Less than $10,000 | 47 (3.0%) | 61 (2.1%) |
| $10,000 to $24,999 | 96 (6.1%) | 18 (0.6%) |
| $25,000 to $34,999 | 116 (7.4%) | 76 (2.6%) |
| $35,000 to $49,999 | 200 (12.8%) | 251 (8.8%) |
| $50,000 to $74,999 | 264 (16.9%) | 219 (7.6%) |
| $75,000 to $99,999 | 410 (26.2%) | 493 (17.2%) |
| $100,000 to $149,999 | 214 (13.7%) | 333 (11.6%) |
| $150,000 or more | 220 (14.0%) | 825 (28.8%) |
| Total | 1,567 (100.0%) | 2,866 (100.0%) |
Property Value to Household Income Ratio in North Mankato
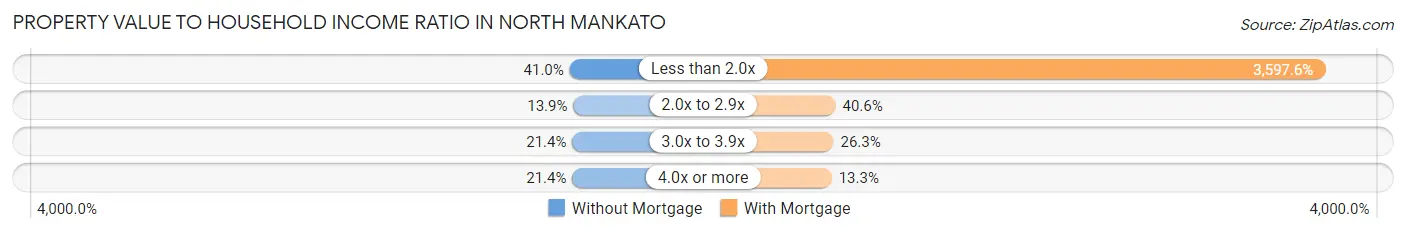
| Value-to-Income Ratio | Without Mortgage | With Mortgage |
| Less than 2.0x | 642 (41.0%) | 103,106 (3,597.6%) |
| 2.0x to 2.9x | 217 (13.9%) | 1,163 (40.6%) |
| 3.0x to 3.9x | 336 (21.4%) | 754 (26.3%) |
| 4.0x or more | 335 (21.4%) | 382 (13.3%) |
| Total | 1,567 (100.0%) | 2,866 (100.0%) |
Real Estate Taxes by Mortgage Status in North Mankato
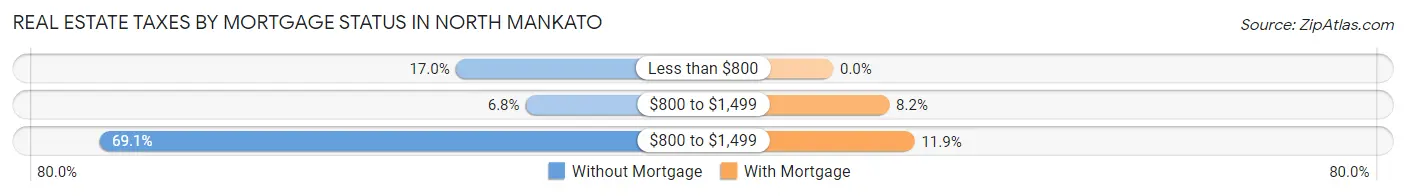
| Property Taxes | Without Mortgage | With Mortgage |
| Less than $800 | 267 (17.0%) | 0 (0.0%) |
| $800 to $1,499 | 107 (6.8%) | 235 (8.2%) |
| $800 to $1,499 | 1,083 (69.1%) | 341 (11.9%) |
| Total | 1,567 (100.0%) | 2,866 (100.0%) |
Health & Disability in North Mankato
Health Insurance Coverage by Age in North Mankato
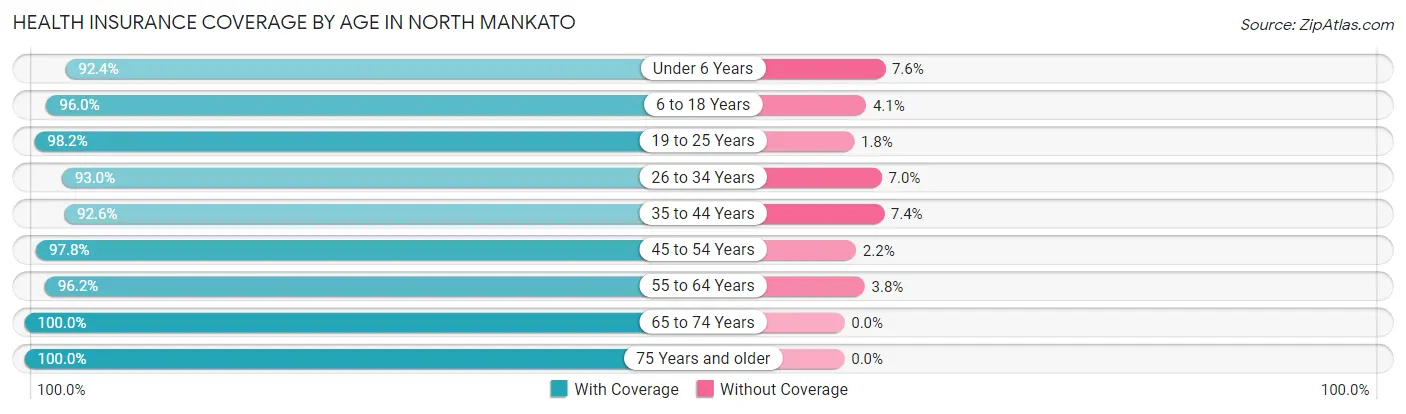
| Age Bracket | With Coverage | Without Coverage |
| Under 6 Years | 1,071 (92.4%) | 88 (7.6%) |
| 6 to 18 Years | 2,439 (96.0%) | 103 (4.1%) |
| 19 to 25 Years | 1,238 (98.2%) | 23 (1.8%) |
| 26 to 34 Years | 1,417 (93.0%) | 106 (7.0%) |
| 35 to 44 Years | 1,995 (92.6%) | 159 (7.4%) |
| 45 to 54 Years | 1,673 (97.8%) | 37 (2.2%) |
| 55 to 64 Years | 1,472 (96.2%) | 58 (3.8%) |
| 65 to 74 Years | 1,195 (100.0%) | 0 (0.0%) |
| 75 Years and older | 1,090 (100.0%) | 0 (0.0%) |
| Total | 13,590 (96.0%) | 574 (4.1%) |
Health Insurance Coverage by Citizenship Status in North Mankato
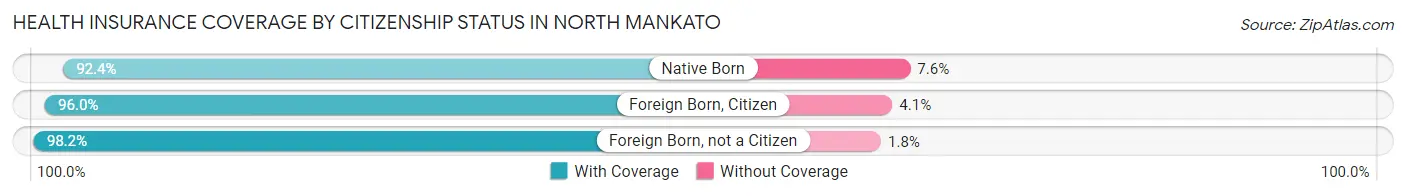
| Citizenship Status | With Coverage | Without Coverage |
| Native Born | 1,071 (92.4%) | 88 (7.6%) |
| Foreign Born, Citizen | 2,439 (96.0%) | 103 (4.1%) |
| Foreign Born, not a Citizen | 1,238 (98.2%) | 23 (1.8%) |
Health Insurance Coverage by Household Income in North Mankato
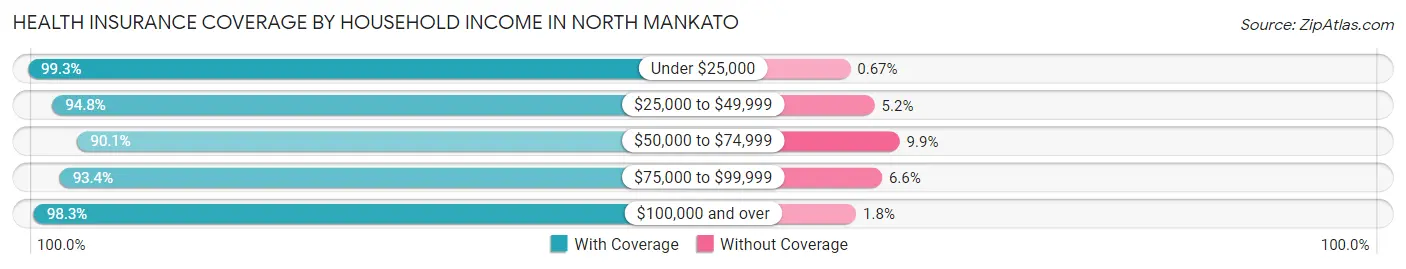
| Household Income | With Coverage | Without Coverage |
| Under $25,000 | 1,039 (99.3%) | 7 (0.7%) |
| $25,000 to $49,999 | 1,926 (94.8%) | 106 (5.2%) |
| $50,000 to $74,999 | 1,856 (90.1%) | 204 (9.9%) |
| $75,000 to $99,999 | 1,928 (93.4%) | 136 (6.6%) |
| $100,000 and over | 6,775 (98.3%) | 121 (1.8%) |
Public vs Private Health Insurance Coverage by Age in North Mankato
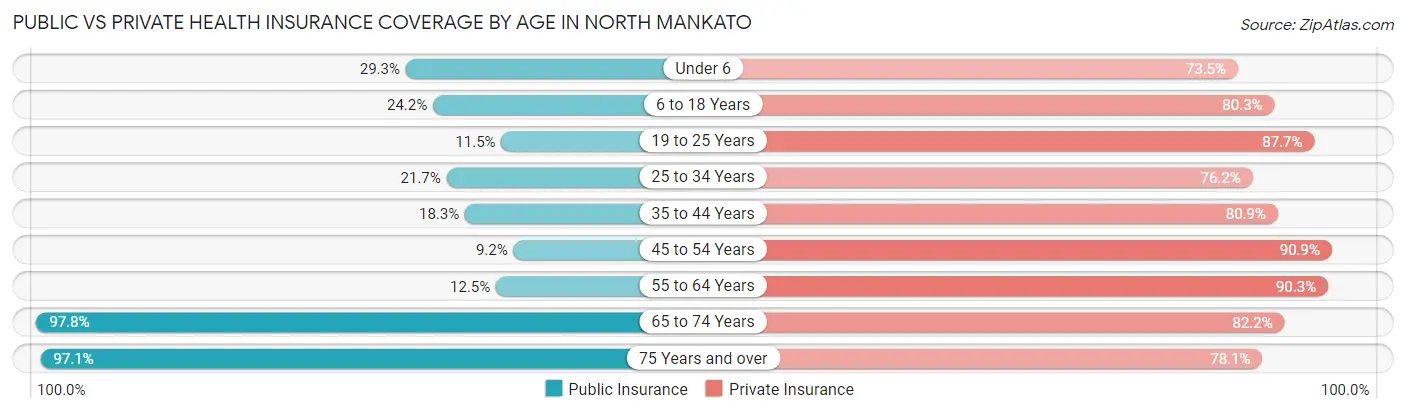
| Age Bracket | Public Insurance | Private Insurance |
| Under 6 | 339 (29.2%) | 852 (73.5%) |
| 6 to 18 Years | 615 (24.2%) | 2,041 (80.3%) |
| 19 to 25 Years | 145 (11.5%) | 1,106 (87.7%) |
| 25 to 34 Years | 330 (21.7%) | 1,161 (76.2%) |
| 35 to 44 Years | 393 (18.2%) | 1,743 (80.9%) |
| 45 to 54 Years | 158 (9.2%) | 1,555 (90.9%) |
| 55 to 64 Years | 191 (12.5%) | 1,381 (90.3%) |
| 65 to 74 Years | 1,169 (97.8%) | 982 (82.2%) |
| 75 Years and over | 1,058 (97.1%) | 851 (78.1%) |
| Total | 4,398 (31.0%) | 11,672 (82.4%) |
Disability Status by Sex by Age in North Mankato
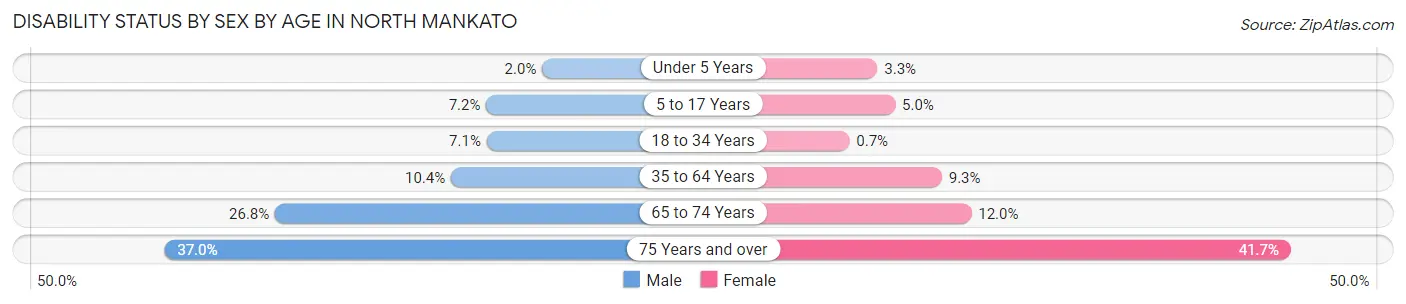
| Age Bracket | Male | Female |
| Under 5 Years | 8 (2.0%) | 18 (3.3%) |
| 5 to 17 Years | 99 (7.1%) | 63 (5.0%) |
| 18 to 34 Years | 93 (7.1%) | 11 (0.7%) |
| 35 to 64 Years | 287 (10.4%) | 245 (9.3%) |
| 65 to 74 Years | 126 (26.8%) | 87 (12.0%) |
| 75 Years and over | 177 (37.0%) | 255 (41.7%) |
Disability Class by Sex by Age in North Mankato
Disability Class: Hearing Difficulty
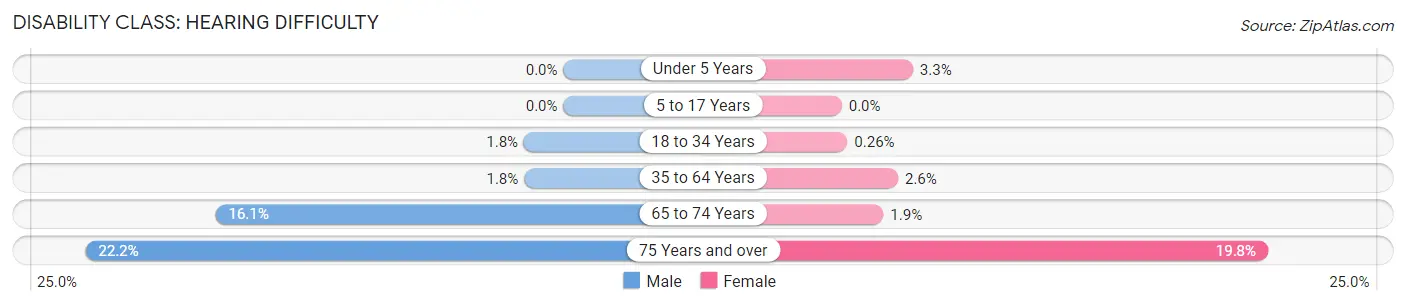
| Age Bracket | Male | Female |
| Under 5 Years | 0 (0.0%) | 18 (3.3%) |
| 5 to 17 Years | 0 (0.0%) | 0 (0.0%) |
| 18 to 34 Years | 24 (1.8%) | 4 (0.3%) |
| 35 to 64 Years | 50 (1.8%) | 69 (2.6%) |
| 65 to 74 Years | 76 (16.1%) | 14 (1.9%) |
| 75 Years and over | 106 (22.2%) | 121 (19.8%) |
Disability Class: Vision Difficulty
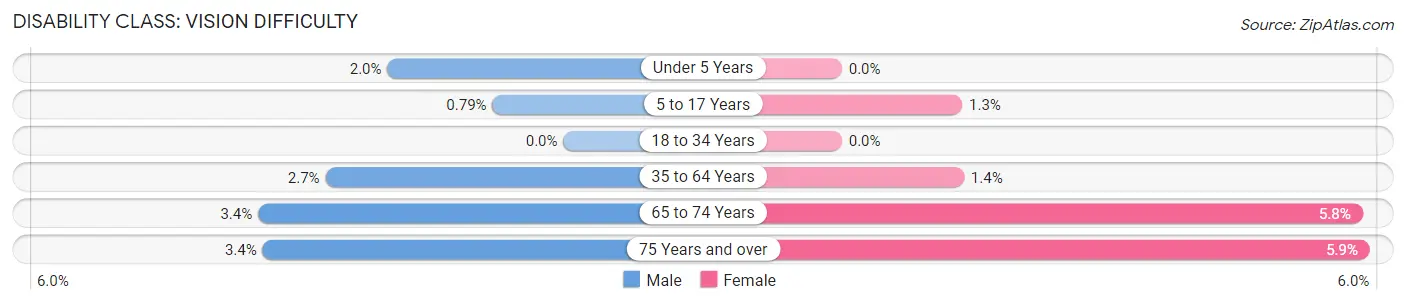
| Age Bracket | Male | Female |
| Under 5 Years | 8 (2.0%) | 0 (0.0%) |
| 5 to 17 Years | 11 (0.8%) | 17 (1.3%) |
| 18 to 34 Years | 0 (0.0%) | 0 (0.0%) |
| 35 to 64 Years | 73 (2.6%) | 36 (1.4%) |
| 65 to 74 Years | 16 (3.4%) | 42 (5.8%) |
| 75 Years and over | 16 (3.4%) | 36 (5.9%) |
Disability Class: Cognitive Difficulty
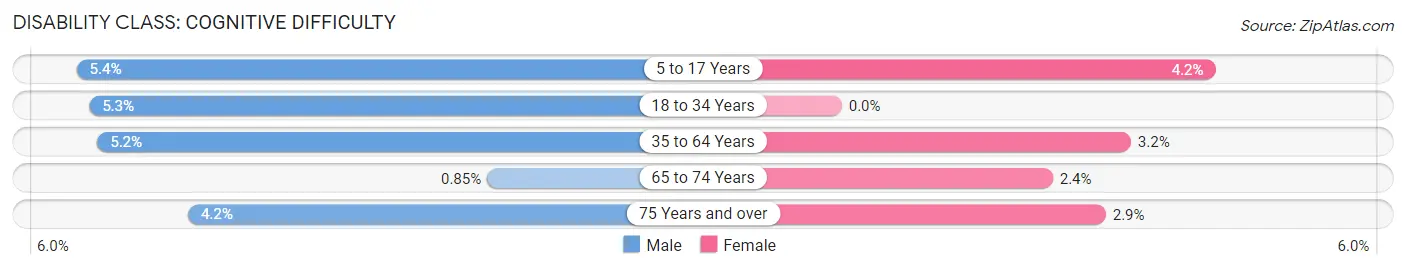
| Age Bracket | Male | Female |
| 5 to 17 Years | 75 (5.4%) | 53 (4.2%) |
| 18 to 34 Years | 69 (5.3%) | 0 (0.0%) |
| 35 to 64 Years | 143 (5.2%) | 85 (3.2%) |
| 65 to 74 Years | 4 (0.9%) | 17 (2.4%) |
| 75 Years and over | 20 (4.2%) | 18 (2.9%) |
Disability Class: Ambulatory Difficulty
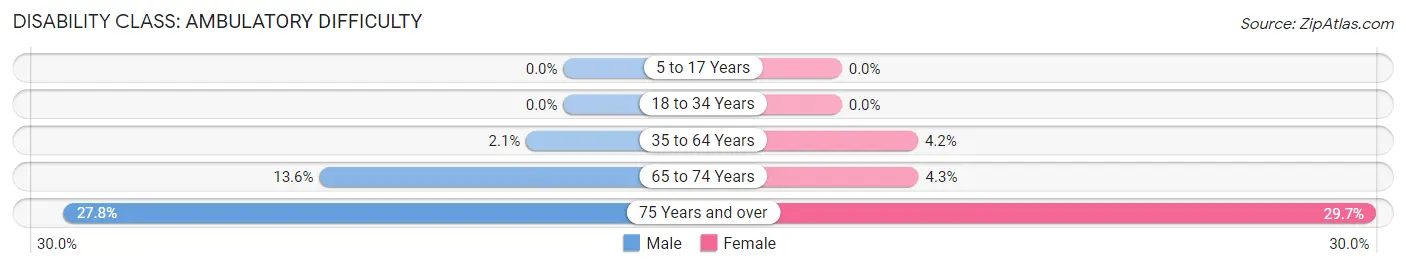
| Age Bracket | Male | Female |
| 5 to 17 Years | 0 (0.0%) | 0 (0.0%) |
| 18 to 34 Years | 0 (0.0%) | 0 (0.0%) |
| 35 to 64 Years | 57 (2.1%) | 112 (4.2%) |
| 65 to 74 Years | 64 (13.6%) | 31 (4.3%) |
| 75 Years and over | 133 (27.8%) | 182 (29.7%) |
Disability Class: Self-Care Difficulty
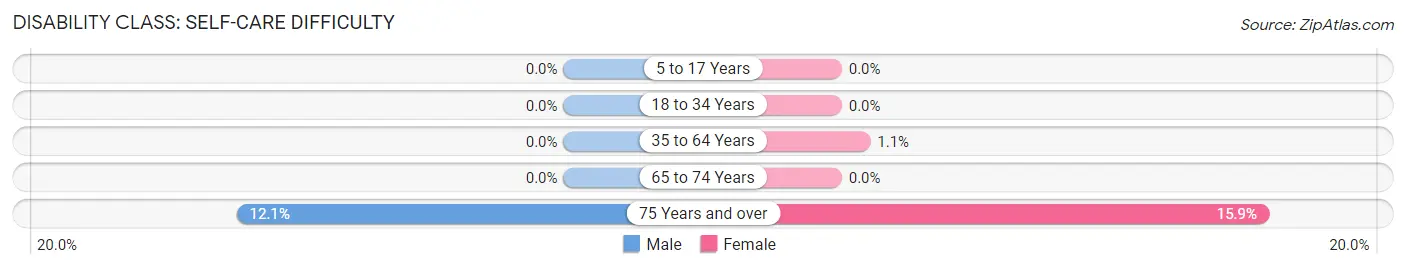
| Age Bracket | Male | Female |
| 5 to 17 Years | 0 (0.0%) | 0 (0.0%) |
| 18 to 34 Years | 0 (0.0%) | 0 (0.0%) |
| 35 to 64 Years | 0 (0.0%) | 28 (1.1%) |
| 65 to 74 Years | 0 (0.0%) | 0 (0.0%) |
| 75 Years and over | 58 (12.1%) | 97 (15.9%) |
Technology Access in North Mankato
Computing Device Access in North Mankato
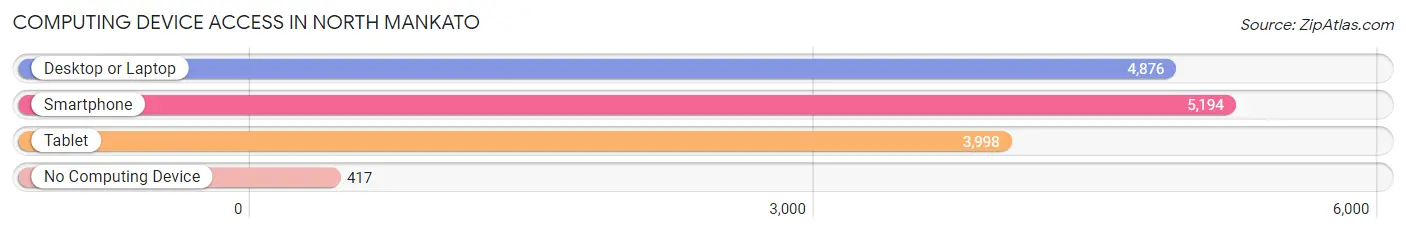
| Device Type | # Households | % Households |
| Desktop or Laptop | 4,876 | 82.3% |
| Smartphone | 5,194 | 87.7% |
| Tablet | 3,998 | 67.5% |
| No Computing Device | 417 | 7.0% |
| Total | 5,923 | 100.0% |
Internet Access in North Mankato
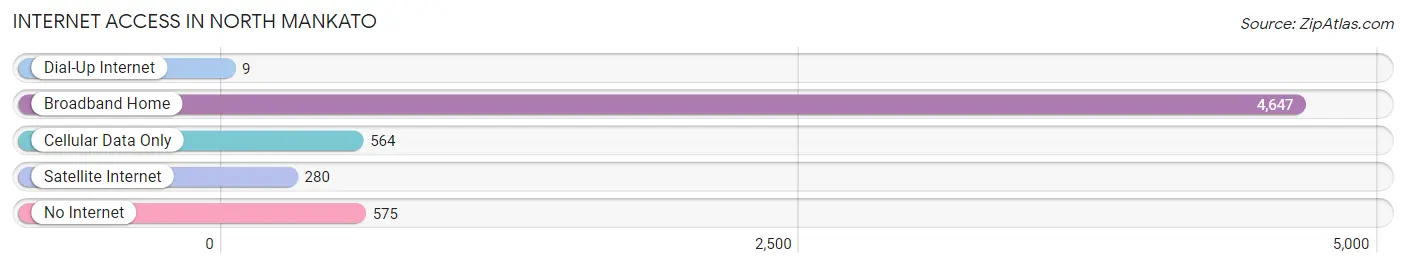
| Internet Type | # Households | % Households |
| Dial-Up Internet | 9 | 0.2% |
| Broadband Home | 4,647 | 78.5% |
| Cellular Data Only | 564 | 9.5% |
| Satellite Internet | 280 | 4.7% |
| No Internet | 575 | 9.7% |
| Total | 5,923 | 100.0% |
North Mankato Summary
Mankato is a city located in the south-central region of Minnesota, United States. It is the county seat of Blue Earth County and the principal city of the Mankato-North Mankato metropolitan area, which covers all of Blue Earth and Nicollet counties. The population of Mankato was 41,720 at the 2010 census, making it the fifth largest city in Minnesota outside of the Minneapolis-St. Paul metropolitan area.
History
Mankato was founded in 1852 by German and Swiss immigrants who were attracted to the area by its fertile soil and abundant natural resources. The city was originally named Mahkato, which is a Dakota Sioux word meaning “blue earth”. The city was renamed Mankato in 1858, after the nearby Mankato River.
Mankato quickly grew into a thriving agricultural and commercial center, and by the late 19th century, it was the largest city in southern Minnesota. The city was also a major transportation hub, with the Minnesota River providing access to the Mississippi River and the railroads connecting Mankato to the rest of the state.
In the early 20th century, Mankato was a major center for the production of agricultural machinery and equipment. The city was also home to several large manufacturing plants, including the Mankato Iron Works, which produced farm implements, and the Mankato Brewing Company, which produced beer.
Geography
Mankato is located in south-central Minnesota, approximately 80 miles southwest of Minneapolis. The city is situated on the Minnesota River, which flows southward from its source in Big Stone Lake in western Minnesota. The city is surrounded by rolling hills and farmland, and is located in the Minnesota River Valley.
The city has a total area of 24.2 square miles, of which 23.7 square miles is land and 0.5 square miles is water. The city is located at an elevation of 1,072 feet above sea level.
Economy
Mankato’s economy is largely based on agriculture, manufacturing, and education. The city is home to several large employers, including Minnesota State University, Mankato, Mayo Clinic Health System, and 3M.
Agriculture is a major part of the local economy, with the surrounding area producing corn, soybeans, and other crops. The city is also home to several large manufacturing plants, including the Mankato Iron Works, which produces farm implements, and the Mankato Brewing Company, which produces beer.
Education is also a major part of the local economy, with Minnesota State University, Mankato being the largest employer in the city. The university has an enrollment of over 15,000 students and offers over 200 degree programs.
Demographics
As of the 2010 census, the population of Mankato was 41,720. The racial makeup of the city was 87.2% White, 5.3% African American, 0.7% Native American, 2.3% Asian, 0.1% Pacific Islander, 1.7% from other races, and 2.9% from two or more races. Hispanic or Latino of any race were 4.7% of the population.
The median income for a household in the city was $45,837, and the median income for a family was $58,945. The per capita income for the city was $22,945. About 8.2% of families and 13.2% of the population were below the poverty line, including 16.2% of those under age 18 and 8.2% of those age 65 or over.
Common Questions
What is Per Capita Income in North Mankato?
Per Capita income in North Mankato is $47,580.
What is the Median Family Income in North Mankato?
Median Family Income in North Mankato is $96,667.
What is the Median Household income in North Mankato?
Median Household Income in North Mankato is $74,602.
What is Income or Wage Gap in North Mankato?
Income or Wage Gap in North Mankato is 15.7%.
Women in North Mankato earn 84.3 cents for every dollar earned by a man.
What is Inequality or Gini Index in North Mankato?
Inequality or Gini Index in North Mankato is 0.49.
What is the Total Population of North Mankato?
Total Population of North Mankato is 14,238.
What is the Total Male Population of North Mankato?
Total Male Population of North Mankato is 6,846.
What is the Total Female Population of North Mankato?
Total Female Population of North Mankato is 7,392.
What is the Ratio of Males per 100 Females in North Mankato?
There are 92.61 Males per 100 Females in North Mankato.
What is the Ratio of Females per 100 Males in North Mankato?
There are 107.98 Females per 100 Males in North Mankato.
What is the Median Population Age in North Mankato?
Median Population Age in North Mankato is 37.4 Years.
What is the Average Family Size in North Mankato
Average Family Size in North Mankato is 3.0 People.
What is the Average Household Size in North Mankato
Average Household Size in North Mankato is 2.4 People.
How Large is the Labor Force in North Mankato?
There are 7,892 People in the Labor Forcein in North Mankato.
What is the Percentage of People in the Labor Force in North Mankato?
72.3% of People are in the Labor Force in North Mankato.
What is the Unemployment Rate in North Mankato?
Unemployment Rate in North Mankato is 2.0%.