St Joseph, MN Map & Demographics
St Joseph Map
St Joseph Overview
$29,347
PER CAPITA INCOME
$87,083
AVG FAMILY INCOME
$74,318
AVG HOUSEHOLD INCOME
55.6%
WAGE / INCOME GAP [ % ]
44.4¢/ $1
WAGE / INCOME GAP [ $ ]
0.42
INEQUALITY / GINI INDEX
7,066
TOTAL POPULATION
3,095
MALE POPULATION
3,971
FEMALE POPULATION
77.94
MALES / 100 FEMALES
128.30
FEMALES / 100 MALES
25.9
MEDIAN AGE
3.1
AVG FAMILY SIZE
2.5
AVG HOUSEHOLD SIZE
4,397
LABOR FORCE [ PEOPLE ]
75.7%
PERCENT IN LABOR FORCE
2.7%
UNEMPLOYMENT RATE
Income in St Joseph
Income Overview in St Joseph
Per Capita Income in St Joseph is $29,347, while median incomes of families and households are $87,083 and $74,318 respectively.
| Characteristic | Number | Measure |
| Per Capita Income | 7,066 | $29,347 |
| Median Family Income | 1,252 | $87,083 |
| Mean Family Income | 1,252 | $101,590 |
| Median Household Income | 2,176 | $74,318 |
| Mean Household Income | 2,176 | $89,887 |
| Income Deficit | 1,252 | $0 |
| Wage / Income Gap (%) | 7,066 | 55.63% |
| Wage / Income Gap ($) | 7,066 | 44.37¢ per $1 |
| Gini / Inequality Index | 7,066 | 0.42 |
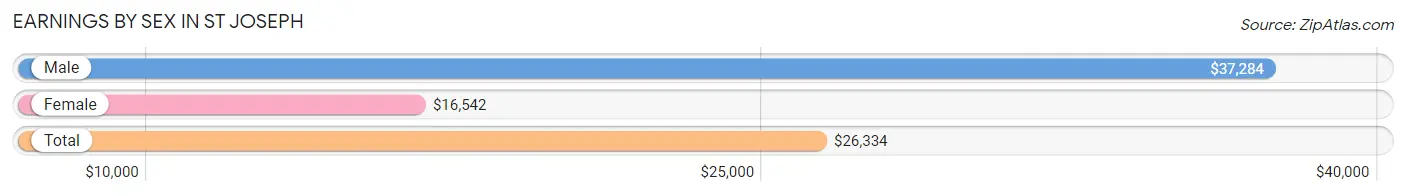
Earnings by Sex in St Joseph
Average Earnings in St Joseph are $26,334, $37,284 for men and $16,542 for women, a difference of 55.6%.
| Sex | Number | Average Earnings |
| Male | 2,108 (43.9%) | $37,284 |
| Female | 2,693 (56.1%) | $16,542 |
| Total | 4,801 (100.0%) | $26,334 |
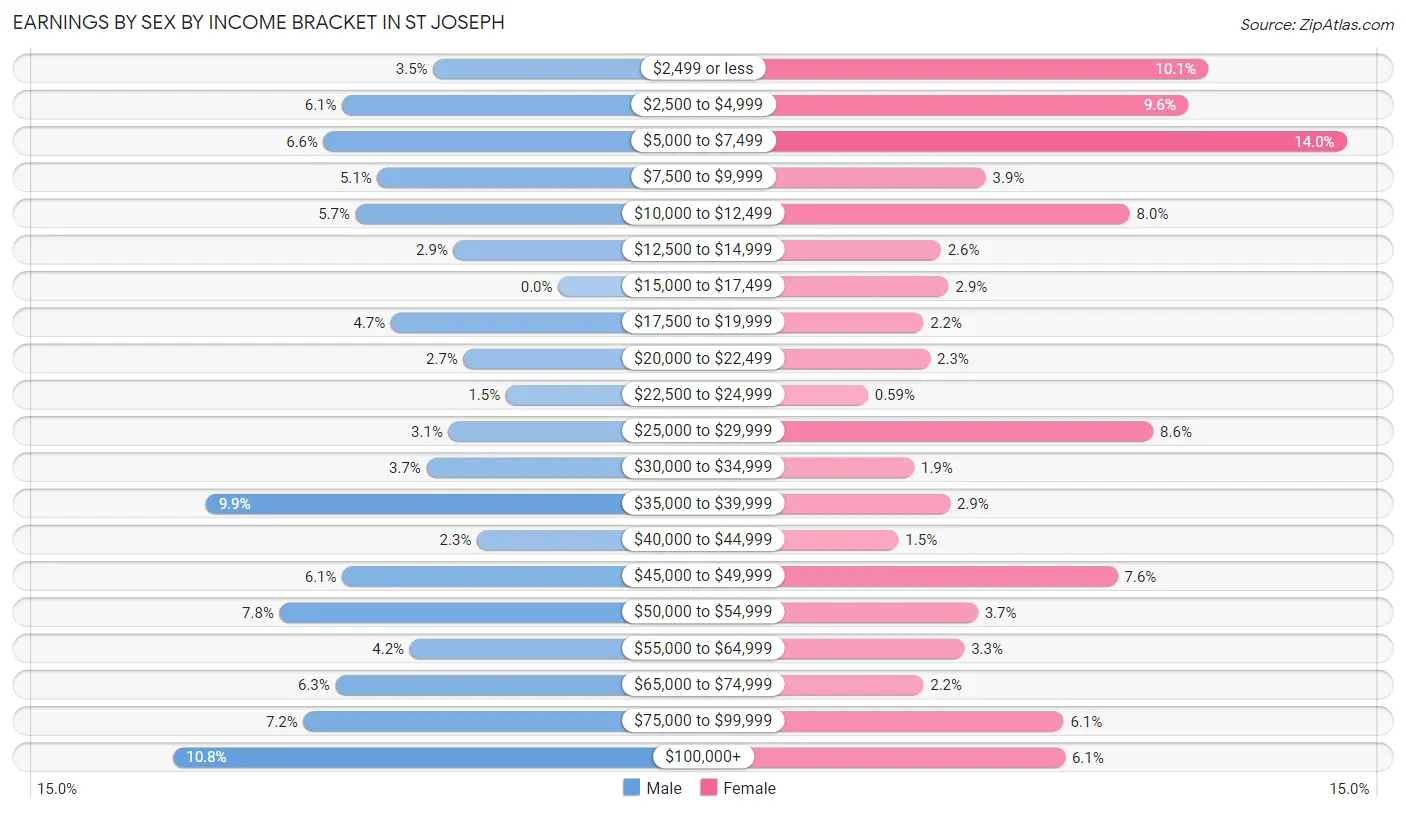
Earnings by Sex by Income Bracket in St Joseph
The most common earnings brackets in St Joseph are $100,000+ for men (228 | 10.8%) and $5,000 to $7,499 for women (378 | 14.0%).
| Income | Male | Female |
| $2,499 or less | 74 (3.5%) | 273 (10.1%) |
| $2,500 to $4,999 | 128 (6.1%) | 258 (9.6%) |
| $5,000 to $7,499 | 139 (6.6%) | 378 (14.0%) |
| $7,500 to $9,999 | 107 (5.1%) | 105 (3.9%) |
| $10,000 to $12,499 | 120 (5.7%) | 214 (8.0%) |
| $12,500 to $14,999 | 62 (2.9%) | 71 (2.6%) |
| $15,000 to $17,499 | 0 (0.0%) | 77 (2.9%) |
| $17,500 to $19,999 | 99 (4.7%) | 58 (2.1%) |
| $20,000 to $22,499 | 56 (2.7%) | 63 (2.3%) |
| $22,500 to $24,999 | 31 (1.5%) | 16 (0.6%) |
| $25,000 to $29,999 | 65 (3.1%) | 232 (8.6%) |
| $30,000 to $34,999 | 78 (3.7%) | 51 (1.9%) |
| $35,000 to $39,999 | 209 (9.9%) | 78 (2.9%) |
| $40,000 to $44,999 | 48 (2.3%) | 39 (1.5%) |
| $45,000 to $49,999 | 128 (6.1%) | 205 (7.6%) |
| $50,000 to $54,999 | 165 (7.8%) | 99 (3.7%) |
| $55,000 to $64,999 | 88 (4.2%) | 89 (3.3%) |
| $65,000 to $74,999 | 132 (6.3%) | 58 (2.1%) |
| $75,000 to $99,999 | 151 (7.2%) | 164 (6.1%) |
| $100,000+ | 228 (10.8%) | 165 (6.1%) |
| Total | 2,108 (100.0%) | 2,693 (100.0%) |
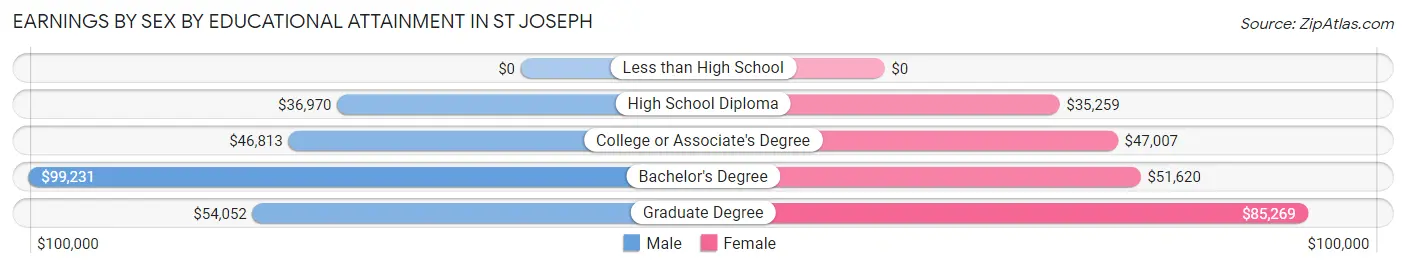
Earnings by Sex by Educational Attainment in St Joseph
Average earnings in St Joseph are $50,232 for men and $48,209 for women, a difference of 4.0%. Men with an educational attainment of bachelor's degree enjoy the highest average annual earnings of $99,231, while those with high school diploma education earn the least with $36,970. Women with an educational attainment of graduate degree earn the most with the average annual earnings of $85,269, while those with high school diploma education have the smallest earnings of $35,259.
| Educational Attainment | Male Income | Female Income |
| Less than High School | - | - |
| High School Diploma | $36,970 | $35,259 |
| College or Associate's Degree | $46,813 | $47,007 |
| Bachelor's Degree | $99,231 | $51,620 |
| Graduate Degree | $54,052 | $85,269 |
| Total | $50,232 | $48,209 |
Family Income in St Joseph
Family Income Brackets in St Joseph
According to the St Joseph family income data, there are 245 families falling into the $75,000 to $99,999 income range, which is the most common income bracket and makes up 19.6% of all families.
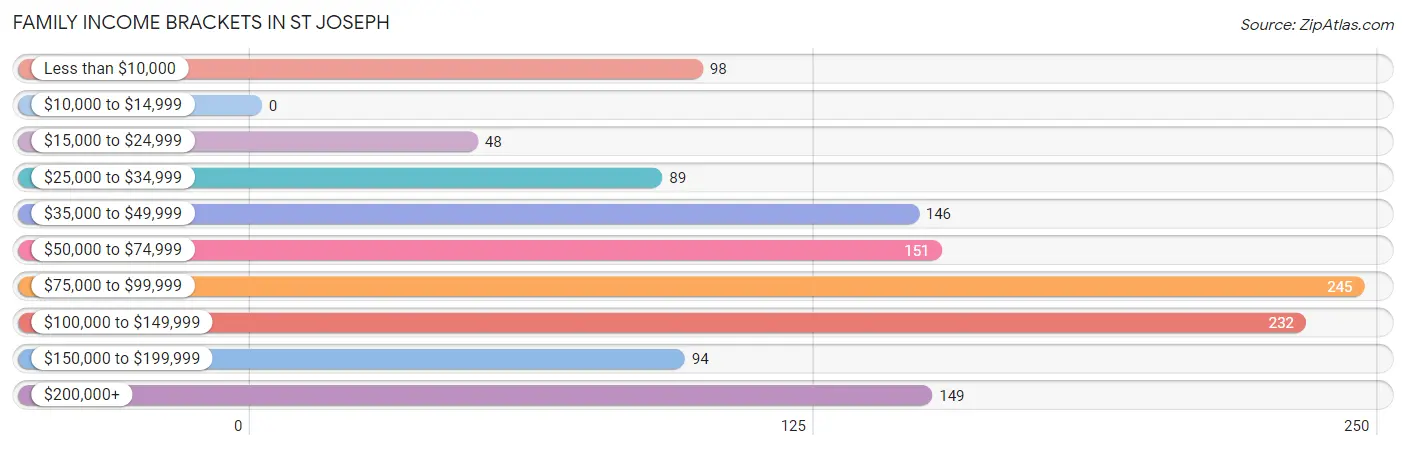
| Income Bracket | # Families | % Families |
| Less than $10,000 | 98 | 7.8% |
| $10,000 to $14,999 | 0 | 0.0% |
| $15,000 to $24,999 | 48 | 3.8% |
| $25,000 to $34,999 | 89 | 7.1% |
| $35,000 to $49,999 | 146 | 11.7% |
| $50,000 to $74,999 | 151 | 12.1% |
| $75,000 to $99,999 | 245 | 19.6% |
| $100,000 to $149,999 | 232 | 18.5% |
| $150,000 to $199,999 | 94 | 7.5% |
| $200,000+ | 149 | 11.9% |
Family Income by Famaliy Size in St Joseph
5-person families (106 | 8.5%) account for the highest median family income in St Joseph with $151,522 per family, while 2-person families (572 | 45.7%) have the highest median income of $37,720 per family member.
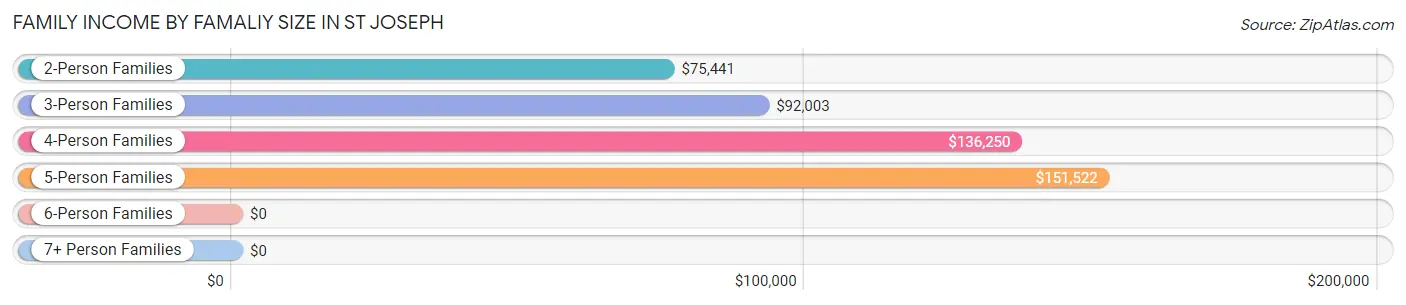
| Income Bracket | # Families | Median Income |
| 2-Person Families | 572 (45.7%) | $75,441 |
| 3-Person Families | 341 (27.2%) | $92,003 |
| 4-Person Families | 124 (9.9%) | $136,250 |
| 5-Person Families | 106 (8.5%) | $151,522 |
| 6-Person Families | 63 (5.0%) | $0 |
| 7+ Person Families | 46 (3.7%) | $0 |
| Total | 1,252 (100.0%) | $87,083 |
Family Income by Number of Earners in St Joseph
The median family income in St Joseph is $87,083, with families comprising 3+ earners (147) having the highest median family income of $250,001, while families with 1 earner (391) have the lowest median family income of $35,071, accounting for 11.7% and 31.2% of families, respectively.
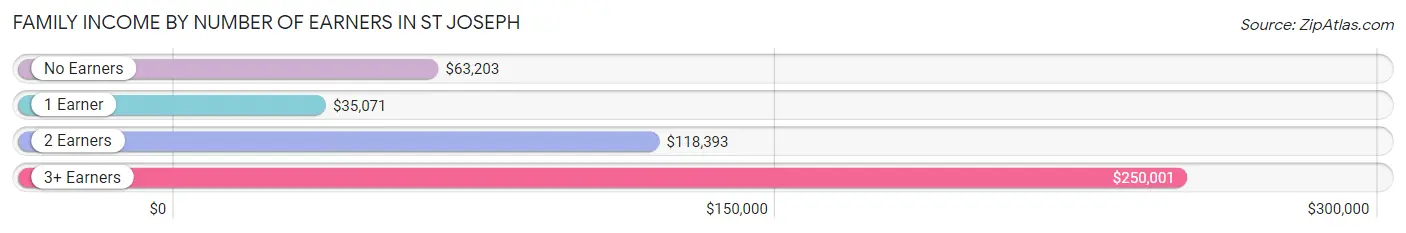
| Number of Earners | # Families | Median Income |
| No Earners | 127 (10.1%) | $63,203 |
| 1 Earner | 391 (31.2%) | $35,071 |
| 2 Earners | 587 (46.9%) | $118,393 |
| 3+ Earners | 147 (11.7%) | $250,001 |
| Total | 1,252 (100.0%) | $87,083 |
Household Income in St Joseph
Household Income Brackets in St Joseph
With 433 households falling in the category, the $100,000 to $149,999 income range is the most frequent in St Joseph, accounting for 19.9% of all households. In contrast, only 37 households (1.7%) fall into the $10,000 to $14,999 income bracket, making it the least populous group.
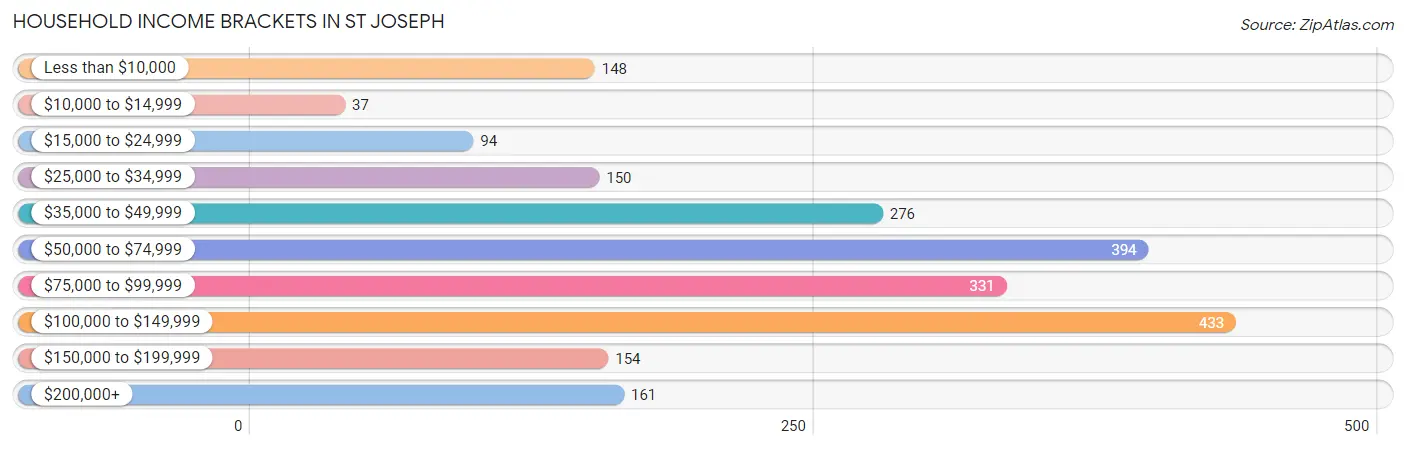
| Income Bracket | # Households | % Households |
| Less than $10,000 | 148 | 6.8% |
| $10,000 to $14,999 | 37 | 1.7% |
| $15,000 to $24,999 | 94 | 4.3% |
| $25,000 to $34,999 | 150 | 6.9% |
| $35,000 to $49,999 | 276 | 12.7% |
| $50,000 to $74,999 | 394 | 18.1% |
| $75,000 to $99,999 | 331 | 15.2% |
| $100,000 to $149,999 | 433 | 19.9% |
| $150,000 to $199,999 | 154 | 7.1% |
| $200,000+ | 161 | 7.4% |
Household Income by Householder Age in St Joseph
The median household income in St Joseph is $74,318, with the highest median household income of $92,458 found in the 45 to 64 years age bracket for the primary householder. A total of 751 households (34.5%) fall into this category. Meanwhile, the 65+ years age bracket for the primary householder has the lowest median household income of $41,691, with 338 households (15.5%) in this group.
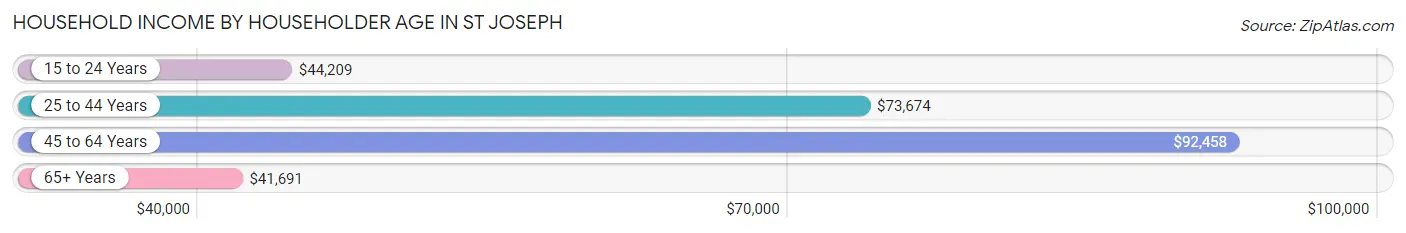
| Income Bracket | # Households | Median Income |
| 15 to 24 Years | 236 (10.8%) | $44,209 |
| 25 to 44 Years | 851 (39.1%) | $73,674 |
| 45 to 64 Years | 751 (34.5%) | $92,458 |
| 65+ Years | 338 (15.5%) | $41,691 |
| Total | 2,176 (100.0%) | $74,318 |
Poverty in St Joseph
Income Below Poverty by Sex and Age in St Joseph
With 25.6% poverty level for males and 22.2% for females among the residents of St Joseph, under 5 year old males and 6 to 11 year old females are the most vulnerable to poverty, with 145 males (61.7%) and 157 females (63.6%) in their respective age groups living below the poverty level.
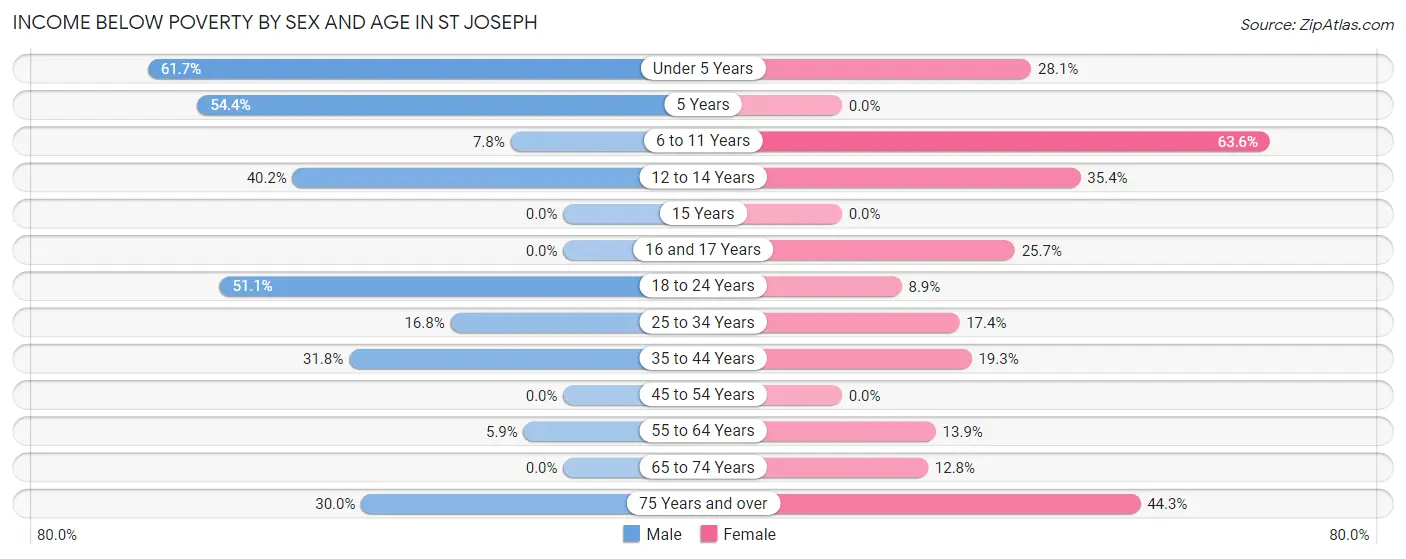
| Age Bracket | Male | Female |
| Under 5 Years | 145 (61.7%) | 27 (28.1%) |
| 5 Years | 50 (54.3%) | 0 (0.0%) |
| 6 to 11 Years | 20 (7.8%) | 157 (63.6%) |
| 12 to 14 Years | 43 (40.2%) | 62 (35.4%) |
| 15 Years | 0 (0.0%) | 0 (0.0%) |
| 16 and 17 Years | 0 (0.0%) | 19 (25.7%) |
| 18 to 24 Years | 288 (51.1%) | 18 (8.9%) |
| 25 to 34 Years | 87 (16.8%) | 75 (17.4%) |
| 35 to 44 Years | 112 (31.8%) | 52 (19.3%) |
| 45 to 54 Years | 0 (0.0%) | 0 (0.0%) |
| 55 to 64 Years | 16 (5.9%) | 52 (13.9%) |
| 65 to 74 Years | 0 (0.0%) | 23 (12.8%) |
| 75 Years and over | 24 (30.0%) | 109 (44.3%) |
| Total | 785 (25.6%) | 594 (22.2%) |
Income Above Poverty by Sex and Age in St Joseph
According to the poverty statistics in St Joseph, males aged 16 and 17 years and females aged 5 years are the age groups that are most secure financially, with 100.0% of males and 100.0% of females in these age groups living above the poverty line.

| Age Bracket | Male | Female |
| Under 5 Years | 90 (38.3%) | 69 (71.9%) |
| 5 Years | 42 (45.7%) | 50 (100.0%) |
| 6 to 11 Years | 235 (92.2%) | 90 (36.4%) |
| 12 to 14 Years | 64 (59.8%) | 113 (64.6%) |
| 15 Years | 0 (0.0%) | 0 (0.0%) |
| 16 and 17 Years | 38 (100.0%) | 55 (74.3%) |
| 18 to 24 Years | 276 (48.9%) | 185 (91.1%) |
| 25 to 34 Years | 432 (83.2%) | 355 (82.6%) |
| 35 to 44 Years | 240 (68.2%) | 218 (80.7%) |
| 45 to 54 Years | 386 (100.0%) | 338 (100.0%) |
| 55 to 64 Years | 255 (94.1%) | 321 (86.1%) |
| 65 to 74 Years | 168 (100.0%) | 157 (87.2%) |
| 75 Years and over | 56 (70.0%) | 137 (55.7%) |
| Total | 2,282 (74.4%) | 2,088 (77.8%) |
Income Below Poverty Among Married-Couple Families in St Joseph
The poverty statistics for married-couple families in St Joseph show that 9.3% or 74 of the total 797 families live below the poverty line. Families with 3 or 4 children have the highest poverty rate of 50.4%, comprising of 58 families. On the other hand, families with 1 or 2 children have the lowest poverty rate of 0.0%, which includes 0 families.
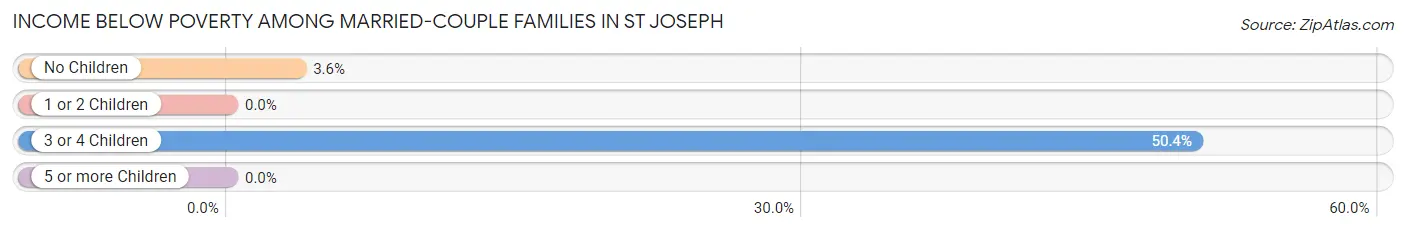
| Children | Above Poverty | Below Poverty |
| No Children | 433 (96.4%) | 16 (3.6%) |
| 1 or 2 Children | 230 (100.0%) | 0 (0.0%) |
| 3 or 4 Children | 57 (49.6%) | 58 (50.4%) |
| 5 or more Children | 3 (100.0%) | 0 (0.0%) |
| Total | 723 (90.7%) | 74 (9.3%) |
Income Below Poverty Among Single-Parent Households in St Joseph
According to the poverty data in St Joseph, 9.1% or 20 single-father households and 18.3% or 43 single-mother households are living below the poverty line. Among single-father households, those with 1 or 2 children have the highest poverty rate, with 20 households (15.1%) experiencing poverty. Likewise, among single-mother households, those with 5 or more children have the highest poverty rate, with 43 households (84.3%) falling below the poverty line.
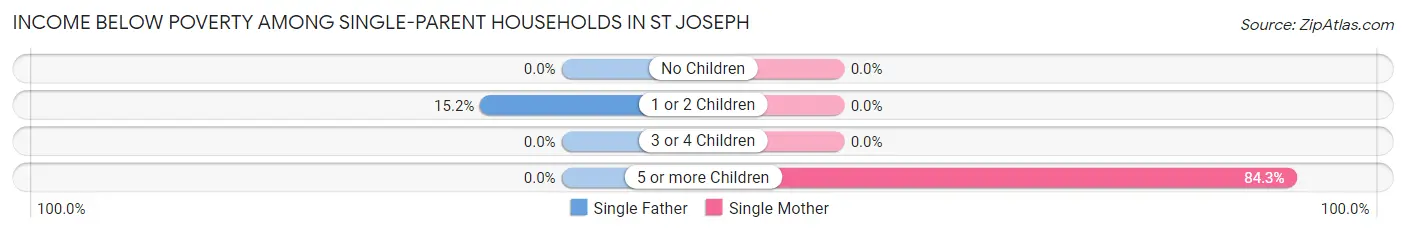
| Children | Single Father | Single Mother |
| No Children | 0 (0.0%) | 0 (0.0%) |
| 1 or 2 Children | 20 (15.1%) | 0 (0.0%) |
| 3 or 4 Children | 0 (0.0%) | 0 (0.0%) |
| 5 or more Children | 0 (0.0%) | 43 (84.3%) |
| Total | 20 (9.1%) | 43 (18.3%) |
Income Below Poverty Among Married-Couple vs Single-Parent Households in St Joseph
The poverty data for St Joseph shows that 74 of the married-couple family households (9.3%) and 63 of the single-parent households (13.9%) are living below the poverty level. Within the married-couple family households, those with 3 or 4 children have the highest poverty rate, with 58 households (50.4%) falling below the poverty line. Among the single-parent households, those with 5 or more children have the highest poverty rate, with 43 household (84.3%) living below poverty.
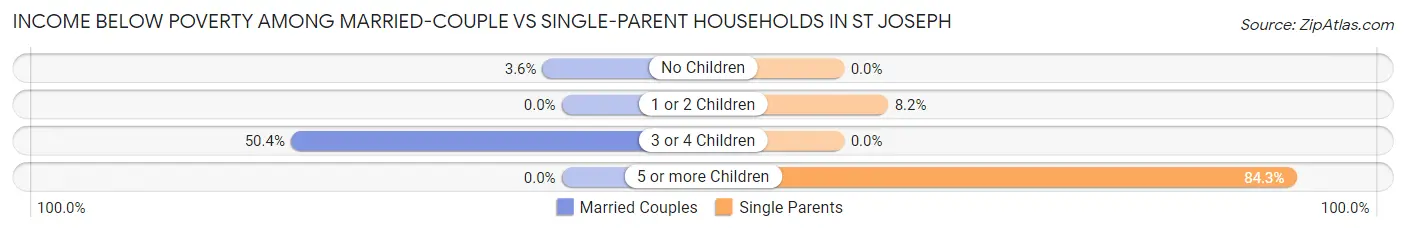
| Children | Married-Couple Families | Single-Parent Households |
| No Children | 16 (3.6%) | 0 (0.0%) |
| 1 or 2 Children | 0 (0.0%) | 20 (8.2%) |
| 3 or 4 Children | 58 (50.4%) | 0 (0.0%) |
| 5 or more Children | 0 (0.0%) | 43 (84.3%) |
| Total | 74 (9.3%) | 63 (13.9%) |
Race in St Joseph
The most populous races in St Joseph are White / Caucasian (6,054 | 85.7%), Black / African American (623 | 8.8%), and Two or more Races (248 | 3.5%).
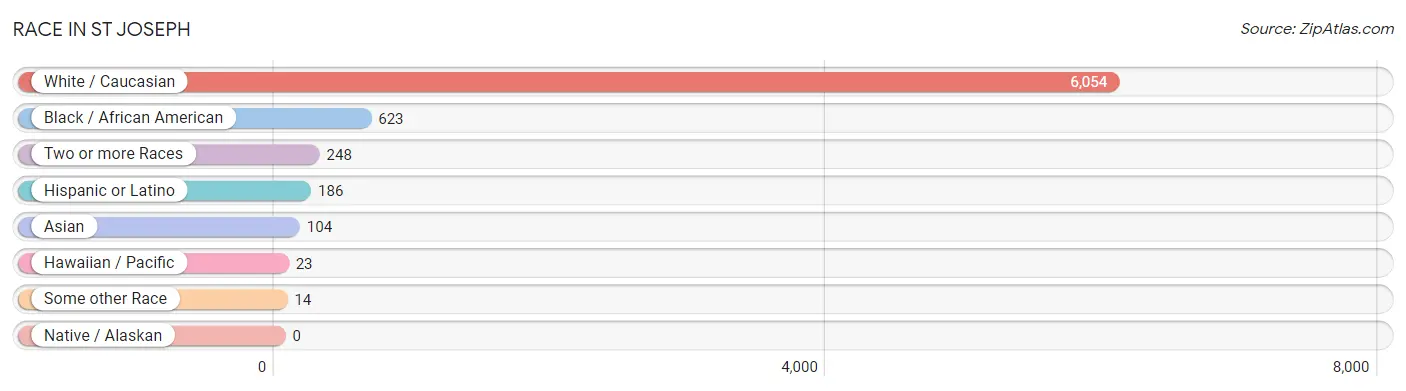
| Race | # Population | % Population |
| Asian | 104 | 1.5% |
| Black / African American | 623 | 8.8% |
| Hawaiian / Pacific | 23 | 0.3% |
| Hispanic or Latino | 186 | 2.6% |
| Native / Alaskan | 0 | 0.0% |
| White / Caucasian | 6,054 | 85.7% |
| Two or more Races | 248 | 3.5% |
| Some other Race | 14 | 0.2% |
| Total | 7,066 | 100.0% |
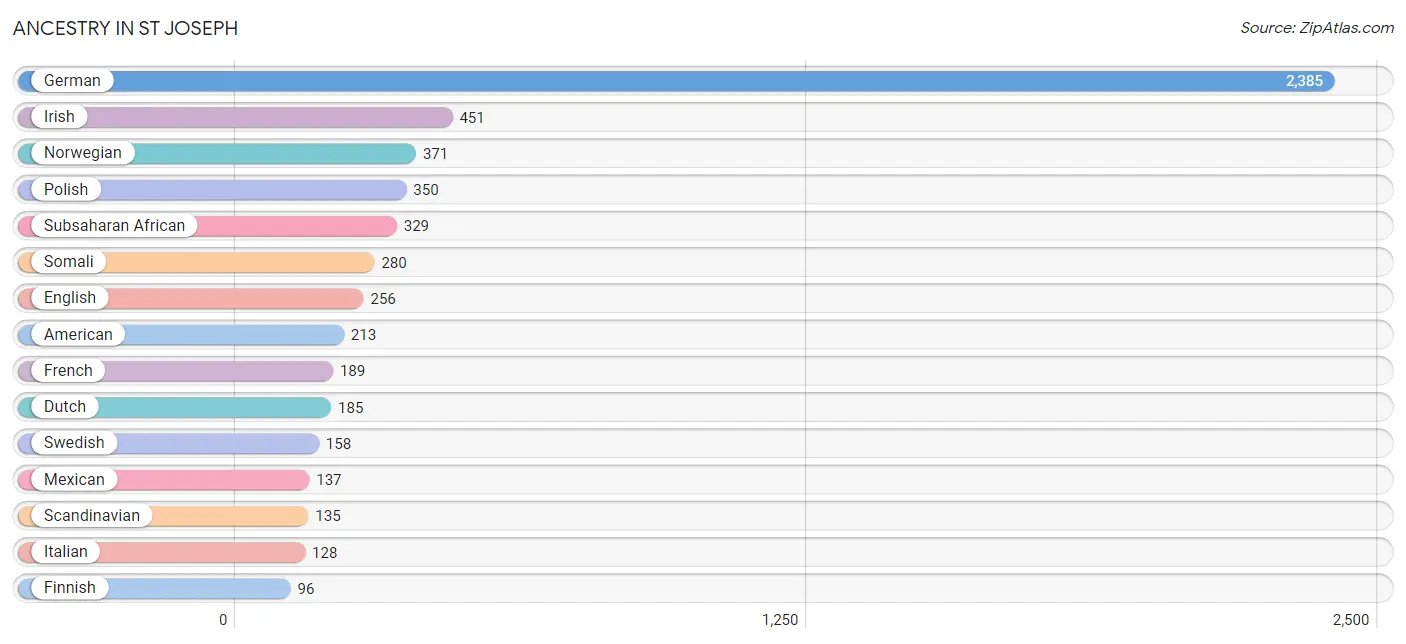
Ancestry in St Joseph
The most populous ancestries reported in St Joseph are German (2,385 | 33.8%), Irish (451 | 6.4%), Norwegian (371 | 5.2%), Polish (350 | 5.0%), and Subsaharan African (329 | 4.7%), together accounting for 55.0% of all St Joseph residents.
| Ancestry | # Population | % Population |
| African | 2 | 0.0% |
| American | 213 | 3.0% |
| Austrian | 15 | 0.2% |
| Bahamian | 9 | 0.1% |
| Bangladeshi | 9 | 0.1% |
| Belgian | 24 | 0.3% |
| Bhutanese | 11 | 0.2% |
| British | 2 | 0.0% |
| Canadian | 11 | 0.2% |
| Central American | 7 | 0.1% |
| Chippewa | 53 | 0.7% |
| Colombian | 5 | 0.1% |
| Cuban | 22 | 0.3% |
| Czech | 90 | 1.3% |
| Danish | 75 | 1.1% |
| Dutch | 185 | 2.6% |
| English | 256 | 3.6% |
| Ethiopian | 9 | 0.1% |
| European | 50 | 0.7% |
| Finnish | 96 | 1.4% |
| French | 189 | 2.7% |
| French American Indian | 2 | 0.0% |
| French Canadian | 26 | 0.4% |
| German | 2,385 | 33.8% |
| Greek | 22 | 0.3% |
| Guatemalan | 3 | 0.0% |
| Indian (Asian) | 62 | 0.9% |
| Irish | 451 | 6.4% |
| Italian | 128 | 1.8% |
| Kenyan | 20 | 0.3% |
| Korean | 6 | 0.1% |
| Luxembourger | 9 | 0.1% |
| Mexican | 137 | 1.9% |
| Mexican American Indian | 6 | 0.1% |
| Nigerian | 18 | 0.3% |
| Norwegian | 371 | 5.2% |
| Peruvian | 4 | 0.1% |
| Polish | 350 | 5.0% |
| Puerto Rican | 2 | 0.0% |
| Russian | 24 | 0.3% |
| Salvadoran | 4 | 0.1% |
| Samoan | 23 | 0.3% |
| Scandinavian | 135 | 1.9% |
| Scotch-Irish | 57 | 0.8% |
| Scottish | 29 | 0.4% |
| Slovene | 19 | 0.3% |
| Somali | 280 | 4.0% |
| South American | 9 | 0.1% |
| Sri Lankan | 36 | 0.5% |
| Subsaharan African | 329 | 4.7% |
| Swedish | 158 | 2.2% |
| Thai | 6 | 0.1% |
| Ukrainian | 55 | 0.8% |
| Welsh | 8 | 0.1% |
| West Indian | 6 | 0.1% |
| Yugoslavian | 12 | 0.2% | View All 56 Rows |
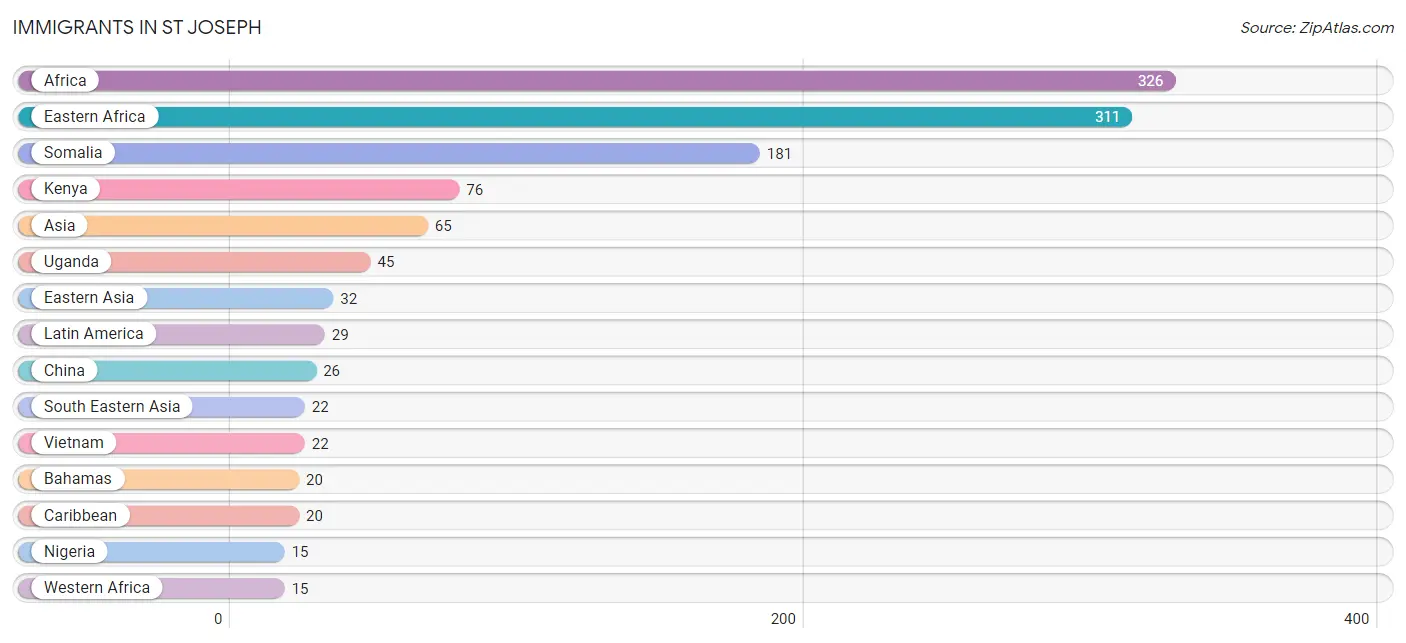
Immigrants in St Joseph
The most numerous immigrant groups reported in St Joseph came from Africa (326 | 4.6%), Eastern Africa (311 | 4.4%), Somalia (181 | 2.6%), Kenya (76 | 1.1%), and Asia (65 | 0.9%), together accounting for 13.6% of all St Joseph residents.
| Immigration Origin | # Population | % Population |
| Africa | 326 | 4.6% |
| Asia | 65 | 0.9% |
| Bahamas | 20 | 0.3% |
| Caribbean | 20 | 0.3% |
| Central America | 9 | 0.1% |
| China | 26 | 0.4% |
| Eastern Africa | 311 | 4.4% |
| Eastern Asia | 32 | 0.4% |
| Ethiopia | 9 | 0.1% |
| India | 11 | 0.2% |
| Japan | 6 | 0.1% |
| Kenya | 76 | 1.1% |
| Latin America | 29 | 0.4% |
| Mexico | 9 | 0.1% |
| Nigeria | 15 | 0.2% |
| Somalia | 181 | 2.6% |
| South Central Asia | 11 | 0.2% |
| South Eastern Asia | 22 | 0.3% |
| Uganda | 45 | 0.6% |
| Vietnam | 22 | 0.3% |
| Western Africa | 15 | 0.2% | View All 21 Rows |
Sex and Age in St Joseph
Sex and Age in St Joseph
The most populous age groups in St Joseph are 20 to 24 Years (542 | 17.5%) for men and 20 to 24 Years (932 | 23.5%) for women.
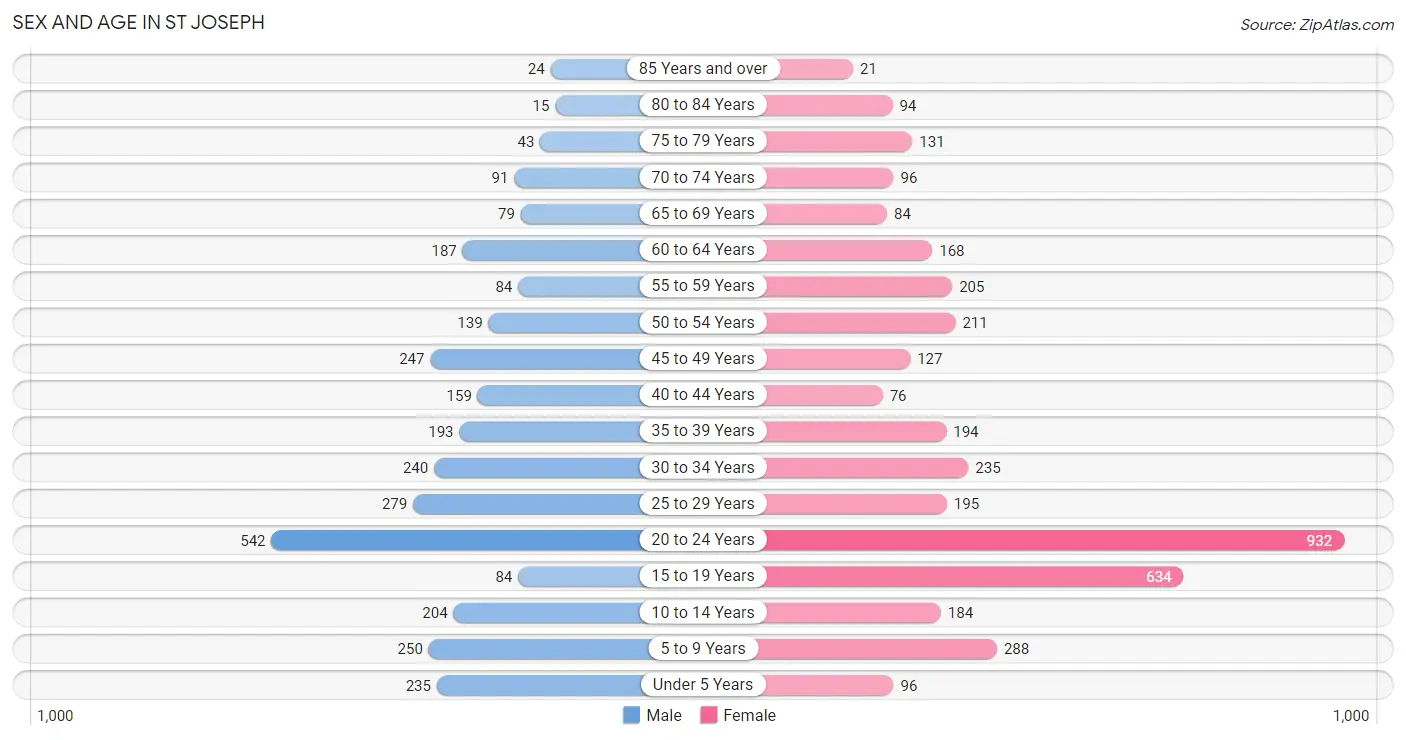
| Age Bracket | Male | Female |
| Under 5 Years | 235 (7.6%) | 96 (2.4%) |
| 5 to 9 Years | 250 (8.1%) | 288 (7.2%) |
| 10 to 14 Years | 204 (6.6%) | 184 (4.6%) |
| 15 to 19 Years | 84 (2.7%) | 634 (16.0%) |
| 20 to 24 Years | 542 (17.5%) | 932 (23.5%) |
| 25 to 29 Years | 279 (9.0%) | 195 (4.9%) |
| 30 to 34 Years | 240 (7.7%) | 235 (5.9%) |
| 35 to 39 Years | 193 (6.2%) | 194 (4.9%) |
| 40 to 44 Years | 159 (5.1%) | 76 (1.9%) |
| 45 to 49 Years | 247 (8.0%) | 127 (3.2%) |
| 50 to 54 Years | 139 (4.5%) | 211 (5.3%) |
| 55 to 59 Years | 84 (2.7%) | 205 (5.2%) |
| 60 to 64 Years | 187 (6.0%) | 168 (4.2%) |
| 65 to 69 Years | 79 (2.5%) | 84 (2.1%) |
| 70 to 74 Years | 91 (2.9%) | 96 (2.4%) |
| 75 to 79 Years | 43 (1.4%) | 131 (3.3%) |
| 80 to 84 Years | 15 (0.5%) | 94 (2.4%) |
| 85 Years and over | 24 (0.8%) | 21 (0.5%) |
| Total | 3,095 (100.0%) | 3,971 (100.0%) |
Families and Households in St Joseph
Median Family Size in St Joseph
The median family size in St Joseph is 3.10 persons per family, with single female/mother families (235 | 18.8%) accounting for the largest median family size of 3.51 persons per family. On the other hand, single male/father families (220 | 17.6%) represent the smallest median family size with 2.61 persons per family.
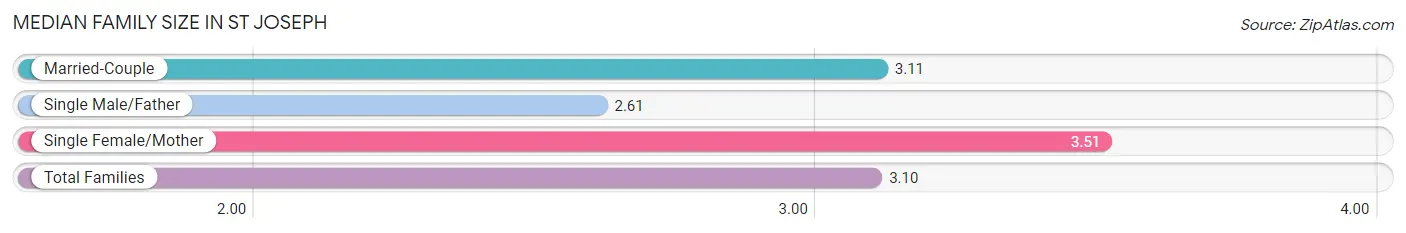
| Family Type | # Families | Family Size |
| Married-Couple | 797 (63.7%) | 3.11 |
| Single Male/Father | 220 (17.6%) | 2.61 |
| Single Female/Mother | 235 (18.8%) | 3.51 |
| Total Families | 1,252 (100.0%) | 3.10 |
Median Household Size in St Joseph
The median household size in St Joseph is 2.53 persons per household, with single female/mother households (235 | 10.8%) accounting for the largest median household size of 3.67 persons per household. non-family households (924 | 42.5%) represent the smallest median household size with 1.51 persons per household.
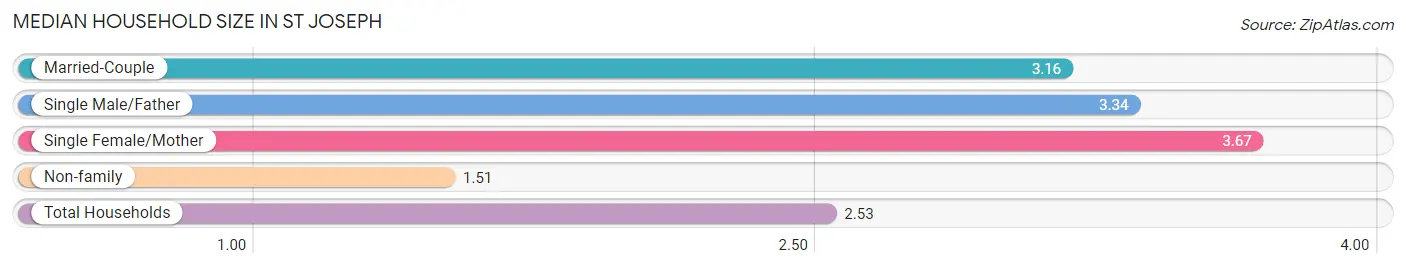
| Household Type | # Households | Household Size |
| Married-Couple | 797 (36.6%) | 3.16 |
| Single Male/Father | 220 (10.1%) | 3.34 |
| Single Female/Mother | 235 (10.8%) | 3.67 |
| Non-family | 924 (42.5%) | 1.51 |
| Total Households | 2,176 (100.0%) | 2.53 |
Household Size by Marriage Status in St Joseph
Out of a total of 2,176 households in St Joseph, 1,252 (57.5%) are family households, while 924 (42.5%) are nonfamily households. The most numerous type of family households are 2-person households, comprising 478, and the most common type of nonfamily households are 1-person households, comprising 575.
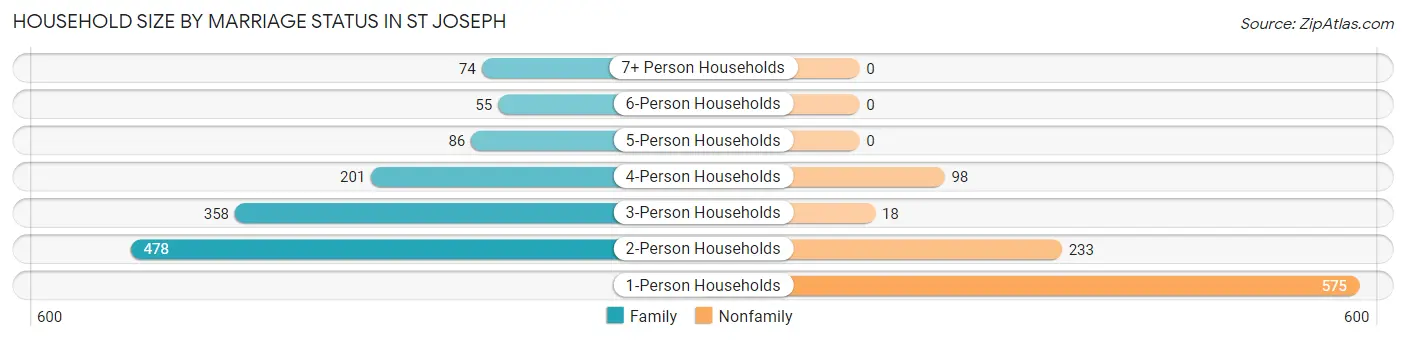
| Household Size | Family Households | Nonfamily Households |
| 1-Person Households | - | 575 (26.4%) |
| 2-Person Households | 478 (22.0%) | 233 (10.7%) |
| 3-Person Households | 358 (16.5%) | 18 (0.8%) |
| 4-Person Households | 201 (9.2%) | 98 (4.5%) |
| 5-Person Households | 86 (4.0%) | 0 (0.0%) |
| 6-Person Households | 55 (2.5%) | 0 (0.0%) |
| 7+ Person Households | 74 (3.4%) | 0 (0.0%) |
| Total | 1,252 (57.5%) | 924 (42.5%) |
Female Fertility in St Joseph
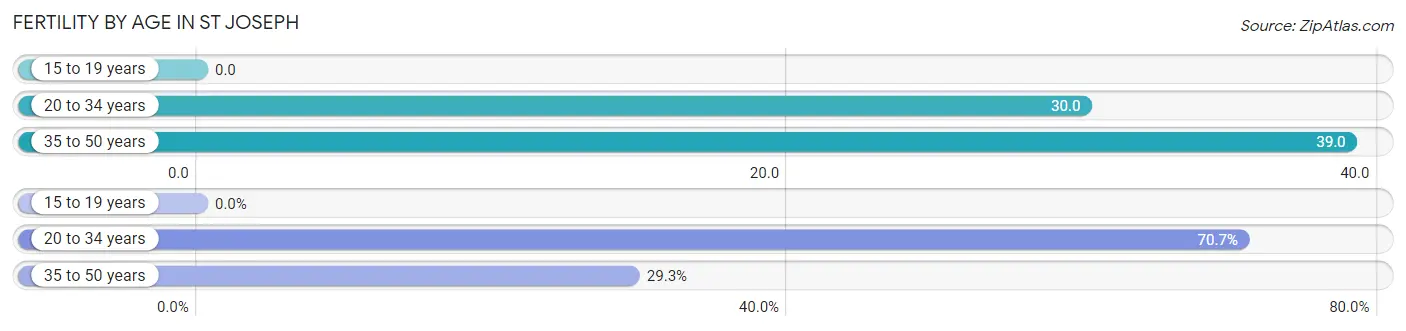
Fertility by Age in St Joseph
Average fertility rate in St Joseph is 24.0 births per 1,000 women. Women in the age bracket of 35 to 50 years have the highest fertility rate with 39.0 births per 1,000 women. Women in the age bracket of 20 to 34 years acount for 70.7% of all women with births.
| Age Bracket | Women with Births | Births / 1,000 Women |
| 15 to 19 years | 0 (0.0%) | 0.0 |
| 20 to 34 years | 41 (70.7%) | 30.0 |
| 35 to 50 years | 17 (29.3%) | 39.0 |
| Total | 58 (100.0%) | 24.0 |
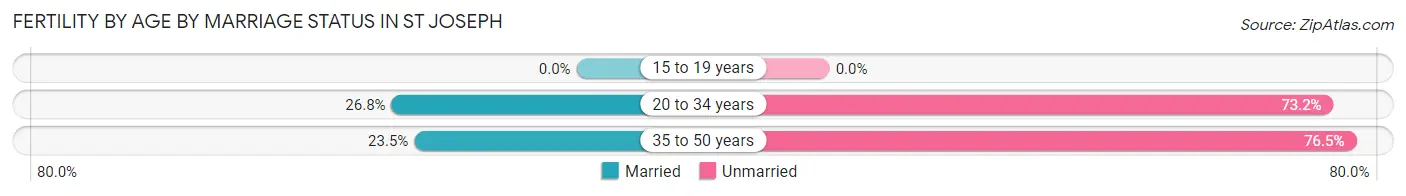
Fertility by Age by Marriage Status in St Joseph
25.9% of women with births (58) in St Joseph are married. The highest percentage of unmarried women with births falls into 35 to 50 years age bracket with 76.5% of them unmarried at the time of birth, while the lowest percentage of unmarried women with births belong to 20 to 34 years age bracket with 73.2% of them unmarried.
| Age Bracket | Married | Unmarried |
| 15 to 19 years | 0 (0.0%) | 0 (0.0%) |
| 20 to 34 years | 11 (26.8%) | 30 (73.2%) |
| 35 to 50 years | 4 (23.5%) | 13 (76.5%) |
| Total | 15 (25.9%) | 43 (74.1%) |
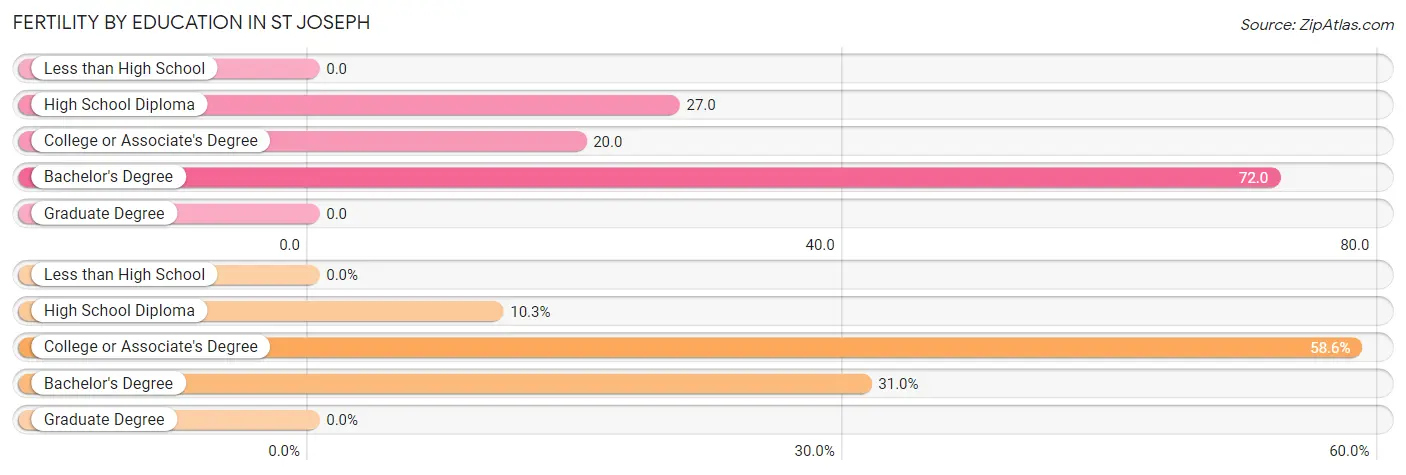
Fertility by Education in St Joseph
| Educational Attainment | Women with Births | Births / 1,000 Women |
| Less than High School | 0 (0.0%) | 0.0 |
| High School Diploma | 6 (10.3%) | 27.0 |
| College or Associate's Degree | 34 (58.6%) | 20.0 |
| Bachelor's Degree | 18 (31.0%) | 72.0 |
| Graduate Degree | 0 (0.0%) | 0.0 |
| Total | 58 (100.0%) | 24.0 |
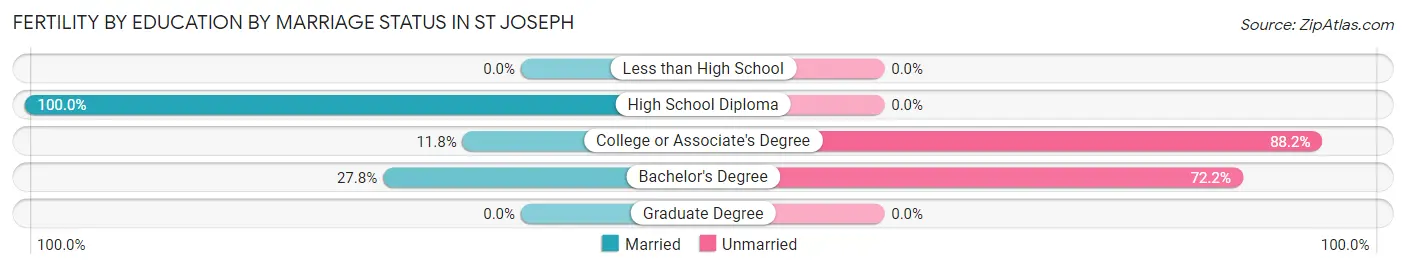
Fertility by Education by Marriage Status in St Joseph
74.1% of women with births in St Joseph are unmarried. Women with the educational attainment of high school diploma are most likely to be married with 100.0% of them married at childbirth, while women with the educational attainment of college or associate's degree are least likely to be married with 88.2% of them unmarried at childbirth.
| Educational Attainment | Married | Unmarried |
| Less than High School | 0 (0.0%) | 0 (0.0%) |
| High School Diploma | 6 (100.0%) | 0 (0.0%) |
| College or Associate's Degree | 4 (11.8%) | 30 (88.2%) |
| Bachelor's Degree | 5 (27.8%) | 13 (72.2%) |
| Graduate Degree | 0 (0.0%) | 0 (0.0%) |
| Total | 15 (25.9%) | 43 (74.1%) |
Employment Characteristics in St Joseph
Employment by Class of Employer in St Joseph
Among the 4,084 employed individuals in St Joseph, private company employees (2,274 | 55.7%), not-for-profit organizations (1,057 | 25.9%), and local government employees (315 | 7.7%) make up the most common classes of employment.
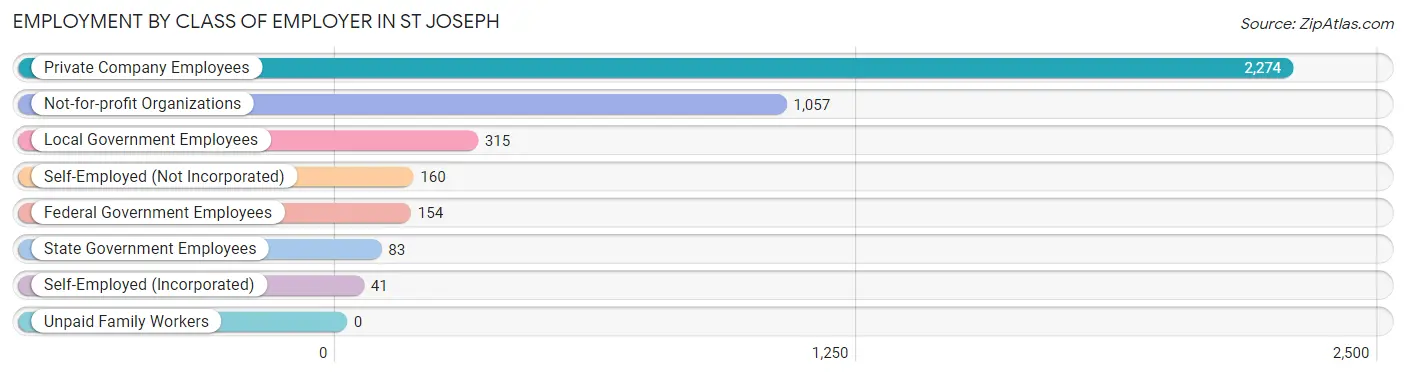
| Employer Class | # Employees | % Employees |
| Private Company Employees | 2,274 | 55.7% |
| Self-Employed (Incorporated) | 41 | 1.0% |
| Self-Employed (Not Incorporated) | 160 | 3.9% |
| Not-for-profit Organizations | 1,057 | 25.9% |
| Local Government Employees | 315 | 7.7% |
| State Government Employees | 83 | 2.0% |
| Federal Government Employees | 154 | 3.8% |
| Unpaid Family Workers | 0 | 0.0% |
| Total | 4,084 | 100.0% |
Employment Status by Age in St Joseph
According to the labor force statistics for St Joseph, out of the total population over 16 years of age (5,809), 75.7% or 4,397 individuals are in the labor force, with 2.7% or 119 of them unemployed. The age group with the highest labor force participation rate is 45 to 54 years, with 99.4% or 720 individuals in the labor force. Within the labor force, the 16 to 19 years age range has the highest percentage of unemployed individuals, with 11.7% or 55 of them being unemployed.
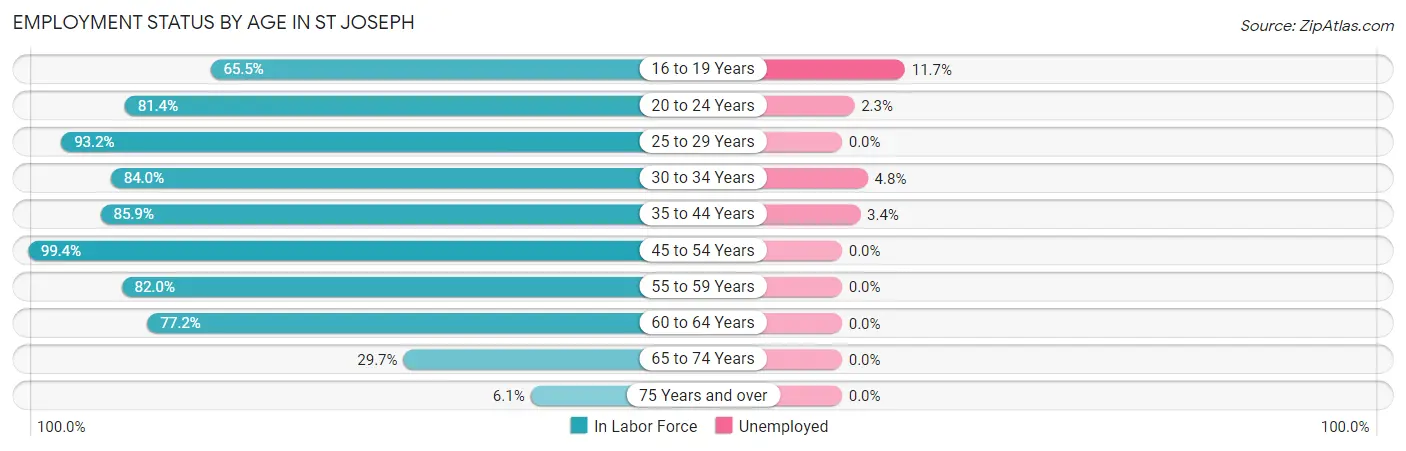
| Age Bracket | In Labor Force | Unemployed |
| 16 to 19 Years | 470 (65.5%) | 55 (11.7%) |
| 20 to 24 Years | 1,200 (81.4%) | 28 (2.3%) |
| 25 to 29 Years | 442 (93.2%) | 0 (0.0%) |
| 30 to 34 Years | 399 (84.0%) | 19 (4.8%) |
| 35 to 44 Years | 534 (85.9%) | 18 (3.4%) |
| 45 to 54 Years | 720 (99.4%) | 0 (0.0%) |
| 55 to 59 Years | 237 (82.0%) | 0 (0.0%) |
| 60 to 64 Years | 274 (77.2%) | 0 (0.0%) |
| 65 to 74 Years | 104 (29.7%) | 0 (0.0%) |
| 75 Years and over | 20 (6.1%) | 0 (0.0%) |
| Total | 4,397 (75.7%) | 119 (2.7%) |
Employment Status by Educational Attainment in St Joseph
According to labor force statistics for St Joseph, 88.7% of individuals (2,607) out of the total population between 25 and 64 years of age (2,939) are in the labor force, with 1.4% or 36 of them being unemployed. The group with the highest labor force participation rate are those with the educational attainment of bachelor's degree or higher, with 97.1% or 930 individuals in the labor force. Within the labor force, individuals with high school diploma education have the highest percentage of unemployment, with 3.4% or 11 of them being unemployed.
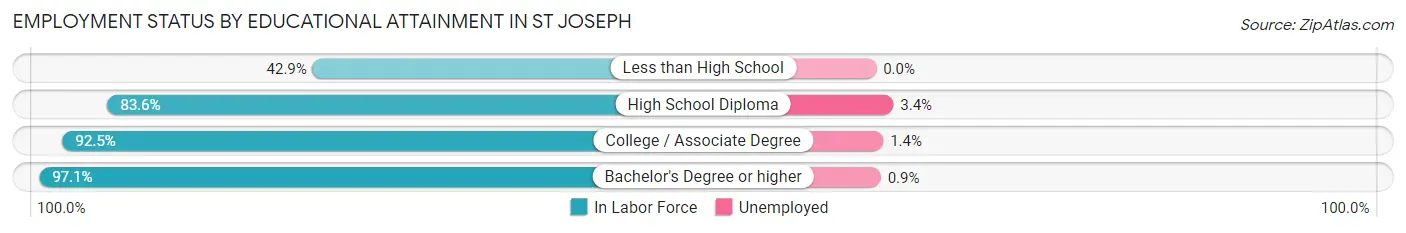
| Educational Attainment | In Labor Force | Unemployed |
| Less than High School | 106 (42.9%) | 0 (0.0%) |
| High School Diploma | 321 (83.6%) | 13 (3.4%) |
| College / Associate Degree | 1,249 (92.5%) | 19 (1.4%) |
| Bachelor's Degree or higher | 930 (97.1%) | 9 (0.9%) |
| Total | 2,607 (88.7%) | 41 (1.4%) |
Employment Occupations by Sex in St Joseph
Management, Business, Science and Arts Occupations
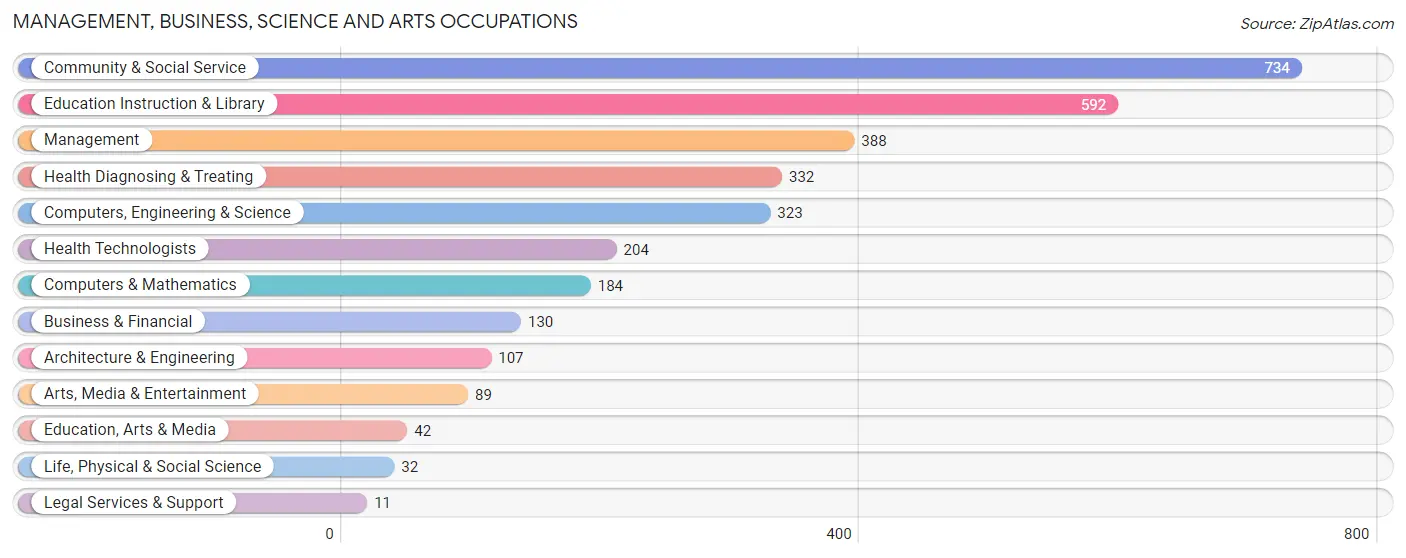
The most common Management, Business, Science and Arts occupations in St Joseph are Community & Social Service (734 | 17.2%), Education Instruction & Library (592 | 13.8%), Management (388 | 9.1%), Health Diagnosing & Treating (332 | 7.8%), and Computers, Engineering & Science (323 | 7.5%).
Management, Business, Science and Arts Occupations by Sex
Within the Management, Business, Science and Arts occupations in St Joseph, the most male-oriented occupations are Architecture & Engineering (100.0%), Computers, Engineering & Science (77.7%), and Computers & Mathematics (68.5%), while the most female-oriented occupations are Legal Services & Support (100.0%), Business & Financial (96.9%), and Health Diagnosing & Treating (86.8%).
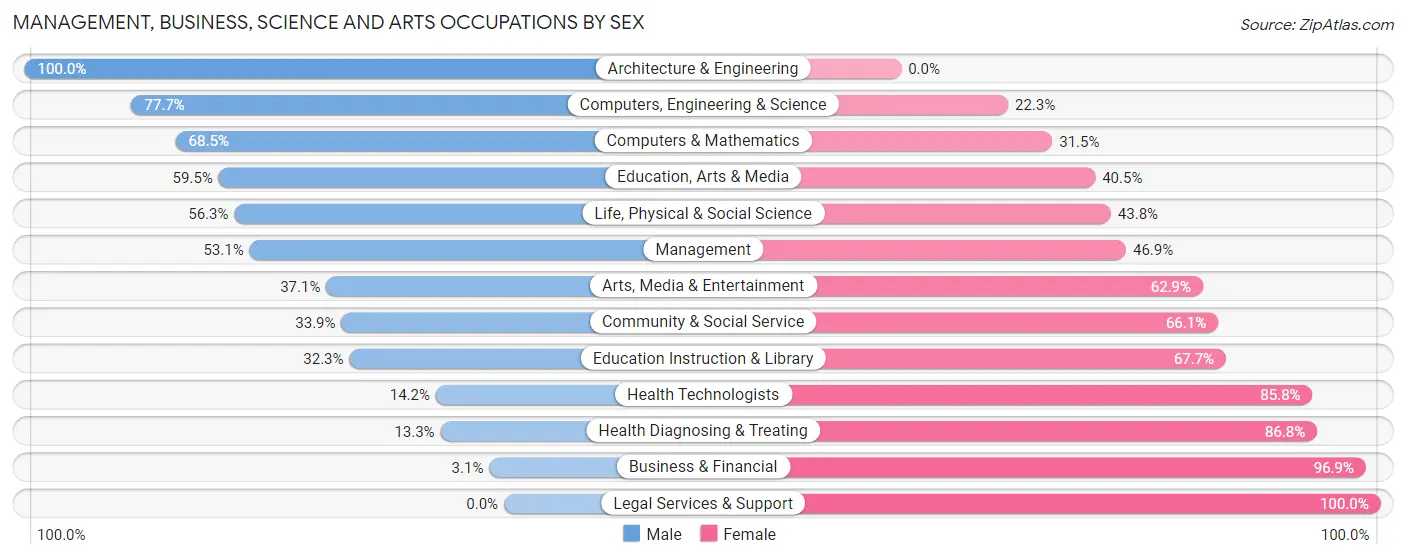
| Occupation | Male | Female |
| Management | 206 (53.1%) | 182 (46.9%) |
| Business & Financial | 4 (3.1%) | 126 (96.9%) |
| Computers, Engineering & Science | 251 (77.7%) | 72 (22.3%) |
| Computers & Mathematics | 126 (68.5%) | 58 (31.5%) |
| Architecture & Engineering | 107 (100.0%) | 0 (0.0%) |
| Life, Physical & Social Science | 18 (56.2%) | 14 (43.8%) |
| Community & Social Service | 249 (33.9%) | 485 (66.1%) |
| Education, Arts & Media | 25 (59.5%) | 17 (40.5%) |
| Legal Services & Support | 0 (0.0%) | 11 (100.0%) |
| Education Instruction & Library | 191 (32.3%) | 401 (67.7%) |
| Arts, Media & Entertainment | 33 (37.1%) | 56 (62.9%) |
| Health Diagnosing & Treating | 44 (13.3%) | 288 (86.8%) |
| Health Technologists | 29 (14.2%) | 175 (85.8%) |
| Total (Category) | 754 (39.5%) | 1,153 (60.5%) |
| Total (Overall) | 1,927 (45.0%) | 2,354 (55.0%) |
Services Occupations
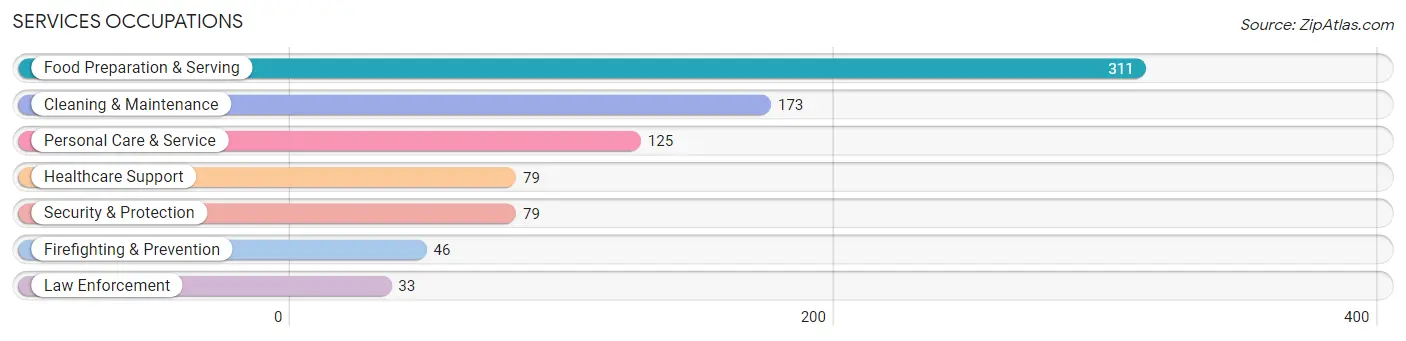
The most common Services occupations in St Joseph are Food Preparation & Serving (311 | 7.3%), Cleaning & Maintenance (173 | 4.0%), Personal Care & Service (125 | 2.9%), Healthcare Support (79 | 1.8%), and Security & Protection (79 | 1.8%).
Services Occupations by Sex
Within the Services occupations in St Joseph, the most male-oriented occupations are Law Enforcement (100.0%), Security & Protection (88.6%), and Firefighting & Prevention (80.4%), while the most female-oriented occupations are Healthcare Support (100.0%), Personal Care & Service (100.0%), and Food Preparation & Serving (64.9%).
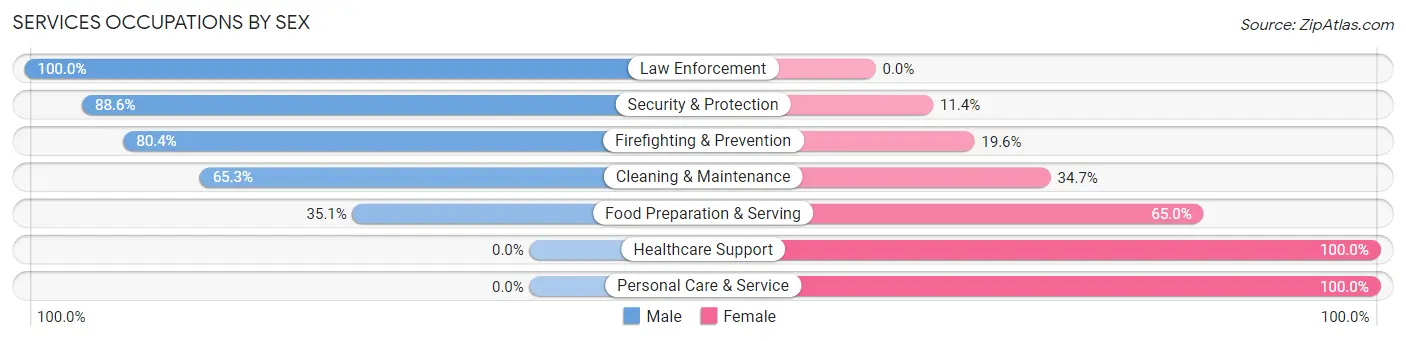
| Occupation | Male | Female |
| Healthcare Support | 0 (0.0%) | 79 (100.0%) |
| Security & Protection | 70 (88.6%) | 9 (11.4%) |
| Firefighting & Prevention | 37 (80.4%) | 9 (19.6%) |
| Law Enforcement | 33 (100.0%) | 0 (0.0%) |
| Food Preparation & Serving | 109 (35.0%) | 202 (64.9%) |
| Cleaning & Maintenance | 113 (65.3%) | 60 (34.7%) |
| Personal Care & Service | 0 (0.0%) | 125 (100.0%) |
| Total (Category) | 292 (38.1%) | 475 (61.9%) |
| Total (Overall) | 1,927 (45.0%) | 2,354 (55.0%) |
Sales and Office Occupations
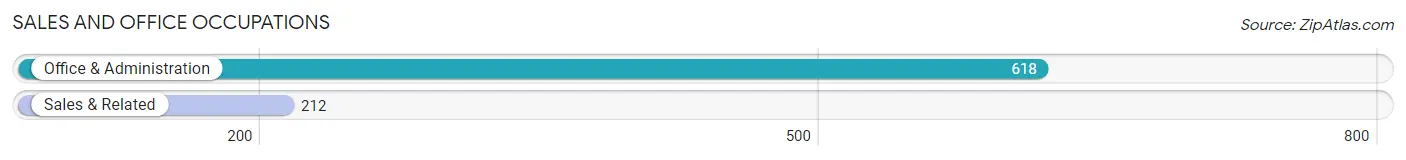
The most common Sales and Office occupations in St Joseph are Office & Administration (618 | 14.4%), and Sales & Related (212 | 5.0%).
Sales and Office Occupations by Sex
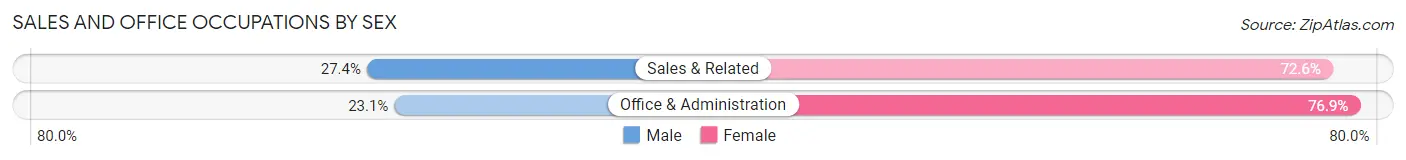
| Occupation | Male | Female |
| Sales & Related | 58 (27.4%) | 154 (72.6%) |
| Office & Administration | 143 (23.1%) | 475 (76.9%) |
| Total (Category) | 201 (24.2%) | 629 (75.8%) |
| Total (Overall) | 1,927 (45.0%) | 2,354 (55.0%) |
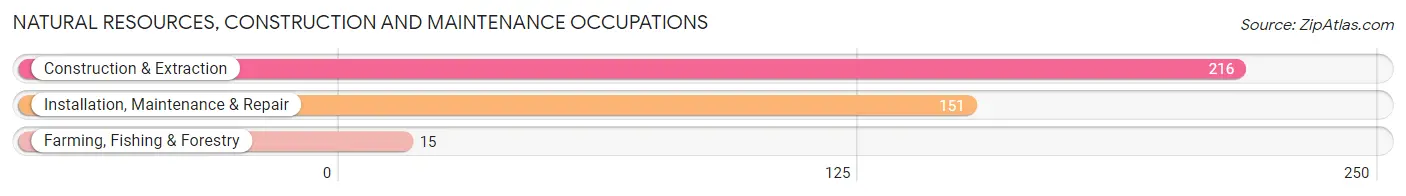
Natural Resources, Construction and Maintenance Occupations
The most common Natural Resources, Construction and Maintenance occupations in St Joseph are Construction & Extraction (216 | 5.1%), Installation, Maintenance & Repair (151 | 3.5%), and Farming, Fishing & Forestry (15 | 0.4%).
Natural Resources, Construction and Maintenance Occupations by Sex
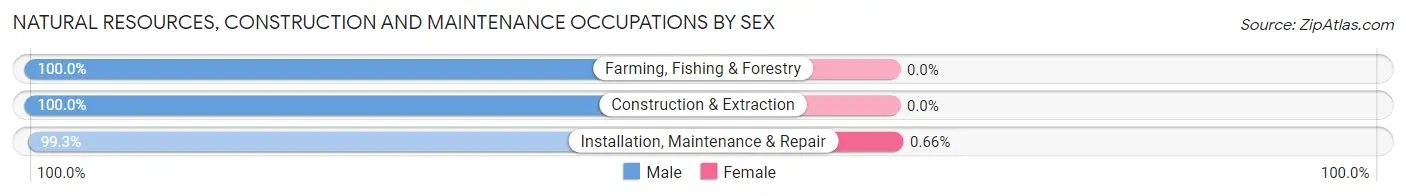
| Occupation | Male | Female |
| Farming, Fishing & Forestry | 15 (100.0%) | 0 (0.0%) |
| Construction & Extraction | 216 (100.0%) | 0 (0.0%) |
| Installation, Maintenance & Repair | 150 (99.3%) | 1 (0.7%) |
| Total (Category) | 381 (99.7%) | 1 (0.3%) |
| Total (Overall) | 1,927 (45.0%) | 2,354 (55.0%) |
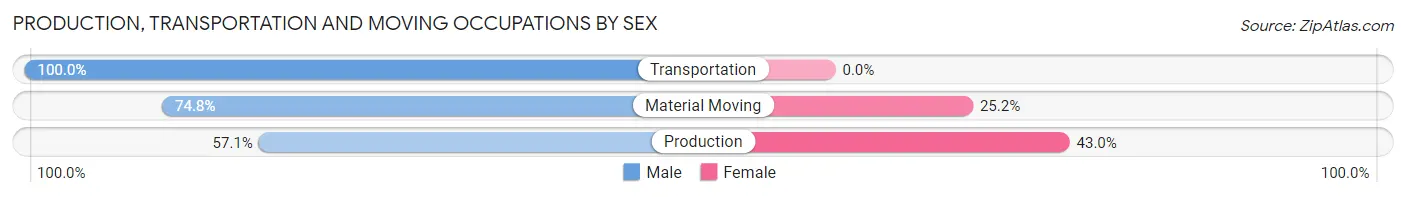
Production, Transportation and Moving Occupations
The most common Production, Transportation and Moving occupations in St Joseph are Production (156 | 3.6%), Transportation (124 | 2.9%), and Material Moving (115 | 2.7%).
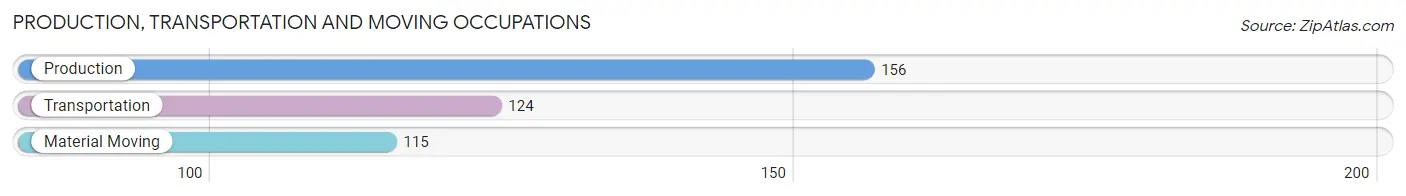
Production, Transportation and Moving Occupations by Sex
| Occupation | Male | Female |
| Production | 89 (57.1%) | 67 (42.9%) |
| Transportation | 124 (100.0%) | 0 (0.0%) |
| Material Moving | 86 (74.8%) | 29 (25.2%) |
| Total (Category) | 299 (75.7%) | 96 (24.3%) |
| Total (Overall) | 1,927 (45.0%) | 2,354 (55.0%) |
Employment Industries by Sex in St Joseph
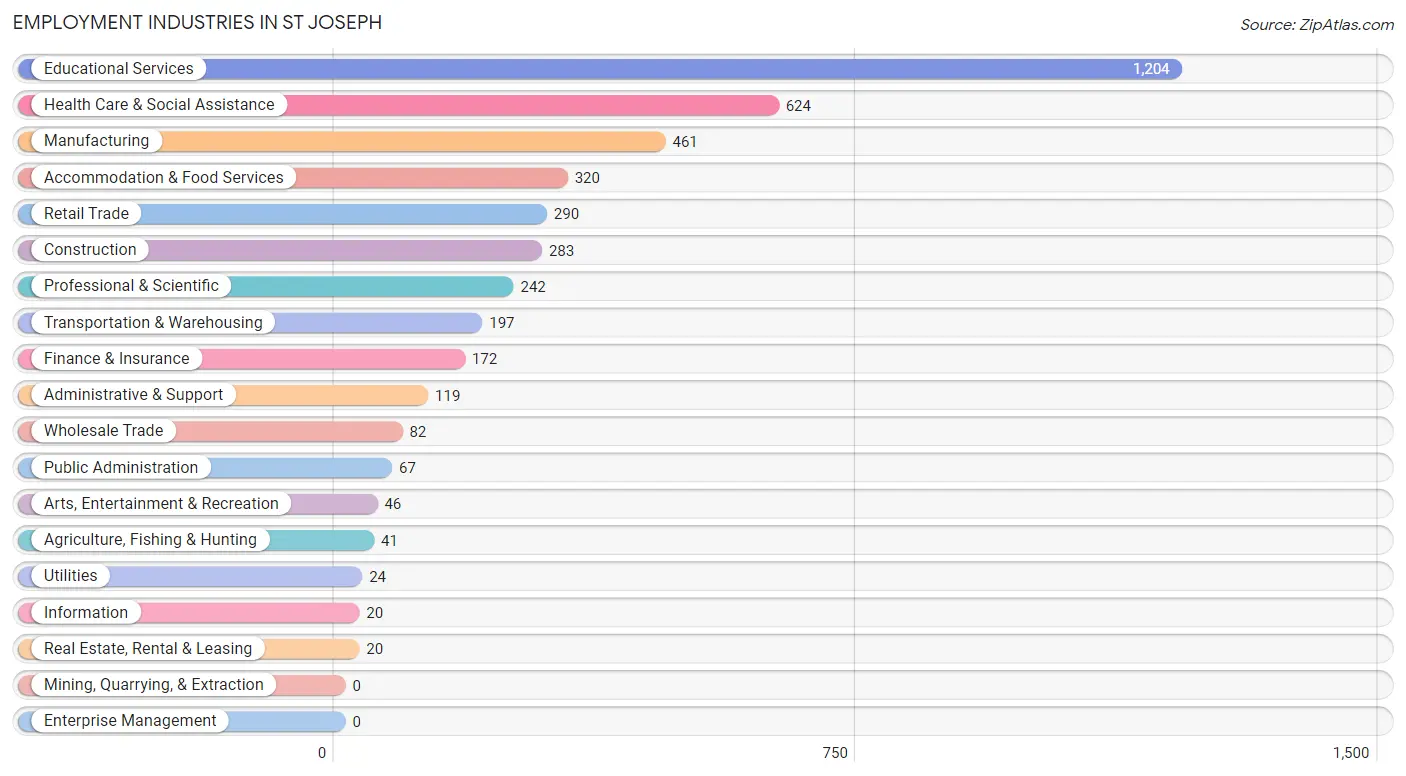
Employment Industries in St Joseph
The major employment industries in St Joseph include Educational Services (1,204 | 28.1%), Health Care & Social Assistance (624 | 14.6%), Manufacturing (461 | 10.8%), Accommodation & Food Services (320 | 7.5%), and Retail Trade (290 | 6.8%).
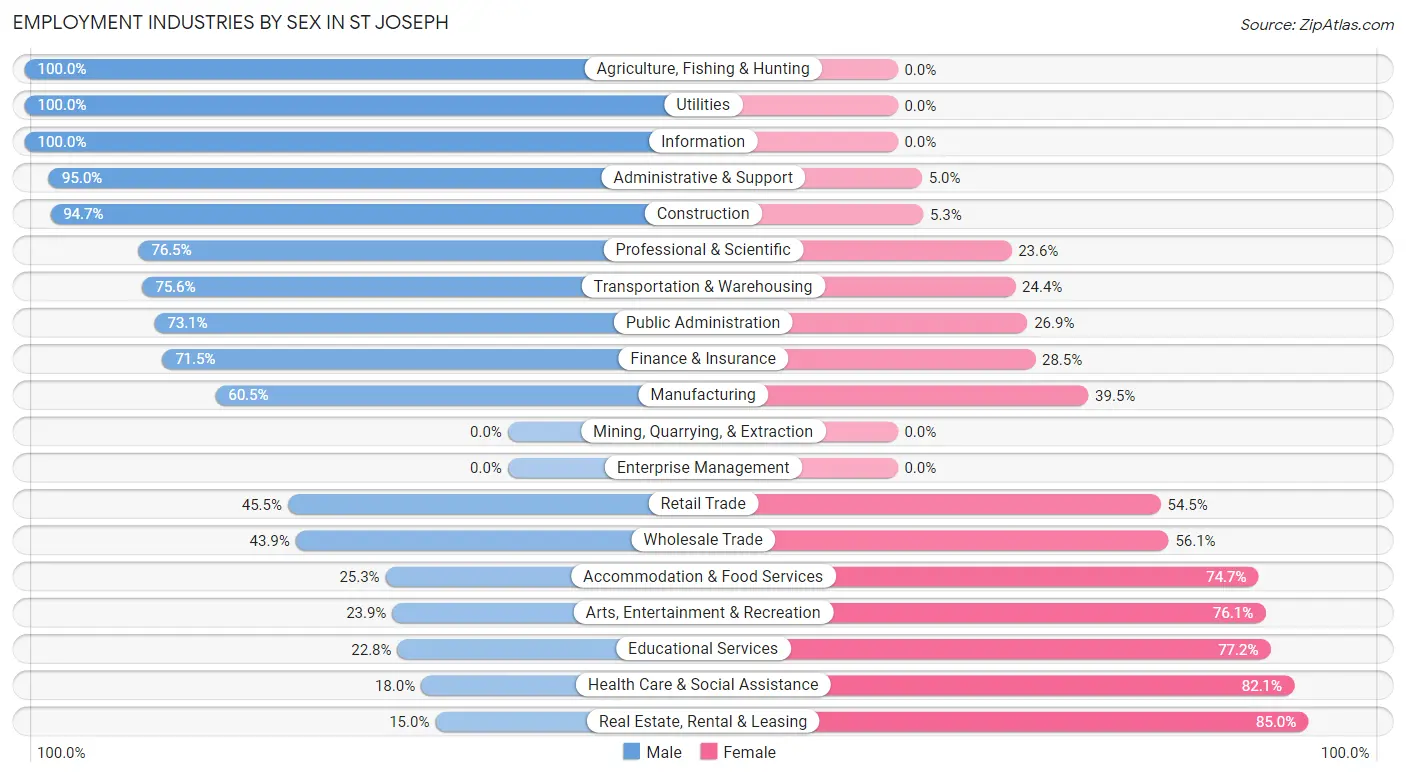
Employment Industries by Sex in St Joseph
The St Joseph industries that see more men than women are Agriculture, Fishing & Hunting (100.0%), Utilities (100.0%), and Information (100.0%), whereas the industries that tend to have a higher number of women are Real Estate, Rental & Leasing (85.0%), Health Care & Social Assistance (82.1%), and Educational Services (77.2%).
| Industry | Male | Female |
| Agriculture, Fishing & Hunting | 41 (100.0%) | 0 (0.0%) |
| Mining, Quarrying, & Extraction | 0 (0.0%) | 0 (0.0%) |
| Construction | 268 (94.7%) | 15 (5.3%) |
| Manufacturing | 279 (60.5%) | 182 (39.5%) |
| Wholesale Trade | 36 (43.9%) | 46 (56.1%) |
| Retail Trade | 132 (45.5%) | 158 (54.5%) |
| Transportation & Warehousing | 149 (75.6%) | 48 (24.4%) |
| Utilities | 24 (100.0%) | 0 (0.0%) |
| Information | 20 (100.0%) | 0 (0.0%) |
| Finance & Insurance | 123 (71.5%) | 49 (28.5%) |
| Real Estate, Rental & Leasing | 3 (15.0%) | 17 (85.0%) |
| Professional & Scientific | 185 (76.4%) | 57 (23.5%) |
| Enterprise Management | 0 (0.0%) | 0 (0.0%) |
| Administrative & Support | 113 (95.0%) | 6 (5.0%) |
| Educational Services | 275 (22.8%) | 929 (77.2%) |
| Health Care & Social Assistance | 112 (17.9%) | 512 (82.1%) |
| Arts, Entertainment & Recreation | 11 (23.9%) | 35 (76.1%) |
| Accommodation & Food Services | 81 (25.3%) | 239 (74.7%) |
| Public Administration | 49 (73.1%) | 18 (26.9%) |
| Total | 1,927 (45.0%) | 2,354 (55.0%) |
Education in St Joseph
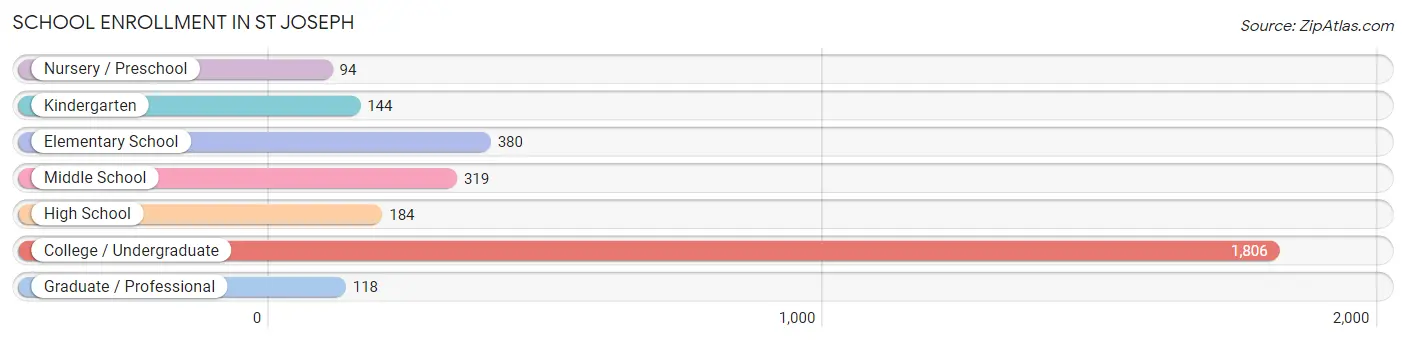
School Enrollment in St Joseph
The most common levels of schooling among the 3,045 students in St Joseph are college / undergraduate (1,806 | 59.3%), elementary school (380 | 12.5%), and middle school (319 | 10.5%).
| School Level | # Students | % Students |
| Nursery / Preschool | 94 | 3.1% |
| Kindergarten | 144 | 4.7% |
| Elementary School | 380 | 12.5% |
| Middle School | 319 | 10.5% |
| High School | 184 | 6.0% |
| College / Undergraduate | 1,806 | 59.3% |
| Graduate / Professional | 118 | 3.9% |
| Total | 3,045 | 100.0% |
School Enrollment by Age by Funding Source in St Joseph
Out of a total of 3,045 students who are enrolled in schools in St Joseph, 1,699 (55.8%) attend a private institution, while the remaining 1,346 (44.2%) are enrolled in public schools. The age group of 20 to 24 year olds has the highest likelihood of being enrolled in private schools, with 1,131 (88.9% in the age bracket) enrolled. Conversely, the age group of 10 to 14 year olds has the lowest likelihood of being enrolled in a private school, with 340 (96.1% in the age bracket) attending a public institution.
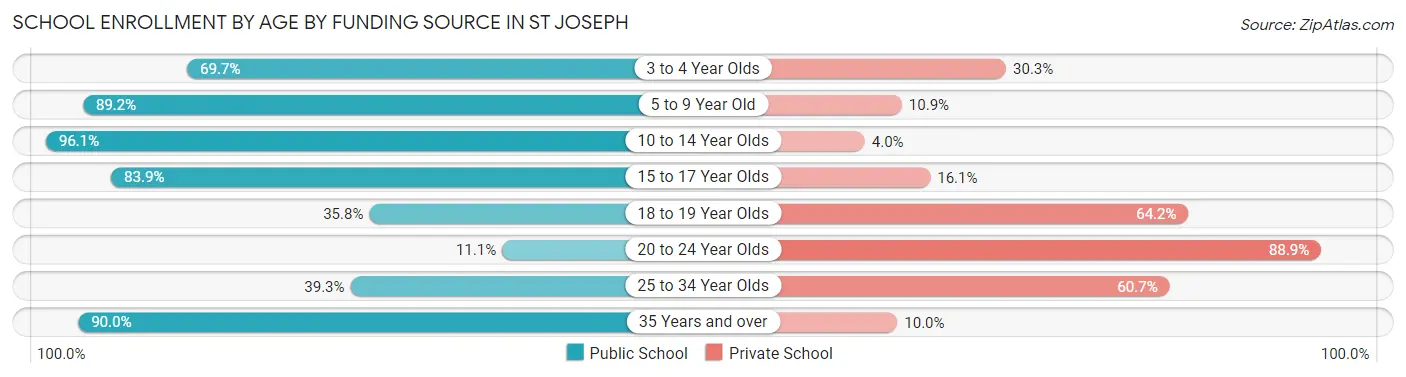
| Age Bracket | Public School | Private School |
| 3 to 4 Year Olds | 53 (69.7%) | 23 (30.3%) |
| 5 to 9 Year Old | 452 (89.1%) | 55 (10.8%) |
| 10 to 14 Year Olds | 340 (96.1%) | 14 (4.0%) |
| 15 to 17 Year Olds | 78 (83.9%) | 15 (16.1%) |
| 18 to 19 Year Olds | 217 (35.8%) | 389 (64.2%) |
| 20 to 24 Year Olds | 141 (11.1%) | 1,131 (88.9%) |
| 25 to 34 Year Olds | 46 (39.3%) | 71 (60.7%) |
| 35 Years and over | 18 (90.0%) | 2 (10.0%) |
| Total | 1,346 (44.2%) | 1,699 (55.8%) |
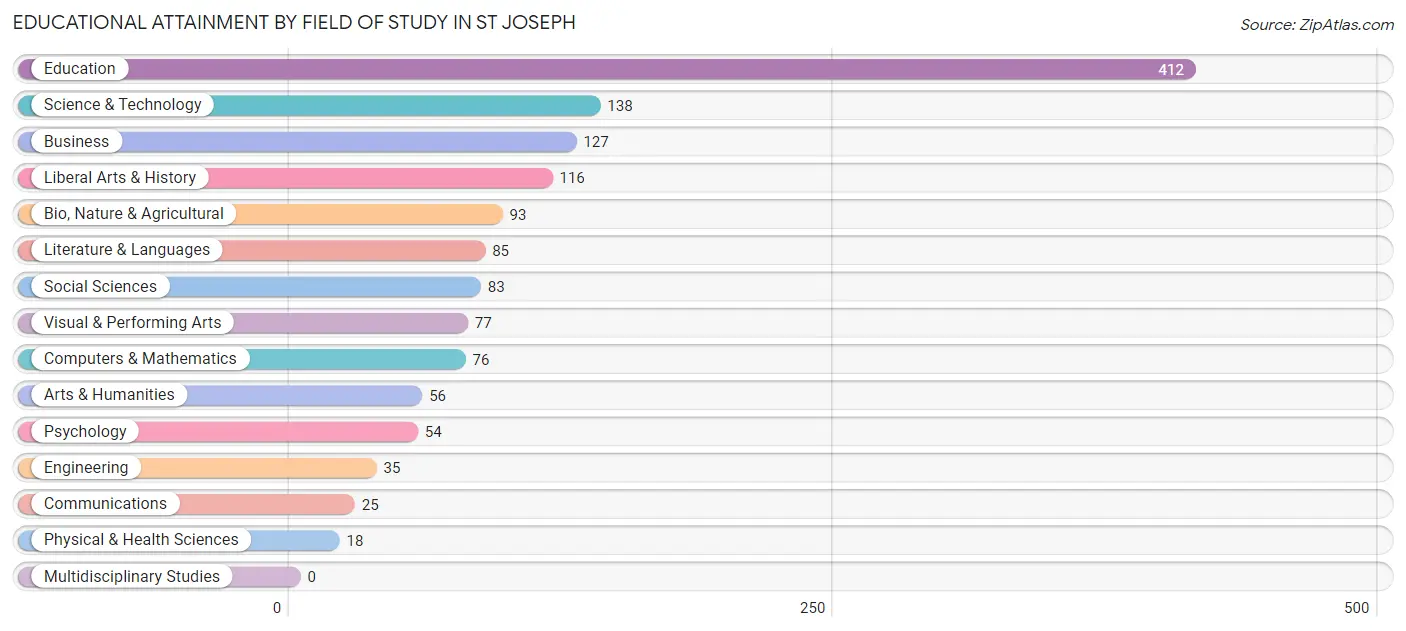
Educational Attainment by Field of Study in St Joseph
Education (412 | 29.5%), science & technology (138 | 9.9%), business (127 | 9.1%), liberal arts & history (116 | 8.3%), and bio, nature & agricultural (93 | 6.7%) are the most common fields of study among 1,395 individuals in St Joseph who have obtained a bachelor's degree or higher.
| Field of Study | # Graduates | % Graduates |
| Computers & Mathematics | 76 | 5.4% |
| Bio, Nature & Agricultural | 93 | 6.7% |
| Physical & Health Sciences | 18 | 1.3% |
| Psychology | 54 | 3.9% |
| Social Sciences | 83 | 5.9% |
| Engineering | 35 | 2.5% |
| Multidisciplinary Studies | 0 | 0.0% |
| Science & Technology | 138 | 9.9% |
| Business | 127 | 9.1% |
| Education | 412 | 29.5% |
| Literature & Languages | 85 | 6.1% |
| Liberal Arts & History | 116 | 8.3% |
| Visual & Performing Arts | 77 | 5.5% |
| Communications | 25 | 1.8% |
| Arts & Humanities | 56 | 4.0% |
| Total | 1,395 | 100.0% |
Transportation & Commute in St Joseph
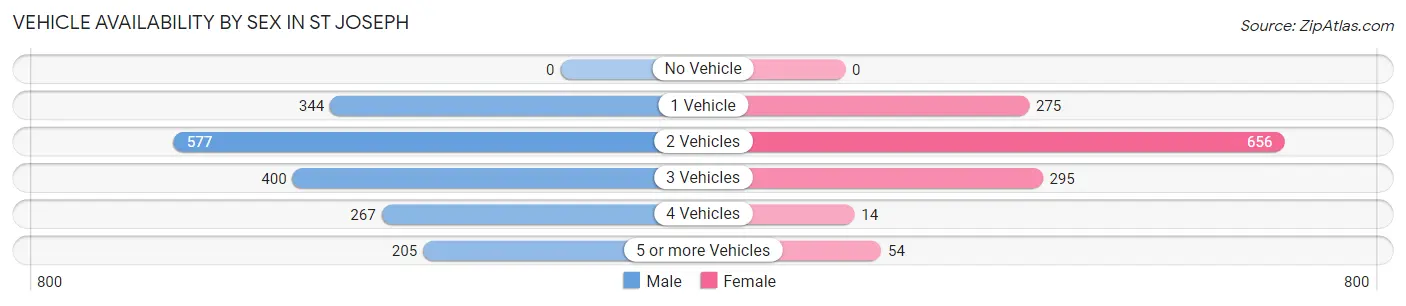
Vehicle Availability by Sex in St Joseph
The most prevalent vehicle ownership categories in St Joseph are males with 2 vehicles (577, accounting for 32.2%) and females with 2 vehicles (656, making up 44.6%).
| Vehicles Available | Male | Female |
| No Vehicle | 0 (0.0%) | 0 (0.0%) |
| 1 Vehicle | 344 (19.2%) | 275 (21.2%) |
| 2 Vehicles | 577 (32.2%) | 656 (50.7%) |
| 3 Vehicles | 400 (22.3%) | 295 (22.8%) |
| 4 Vehicles | 267 (14.9%) | 14 (1.1%) |
| 5 or more Vehicles | 205 (11.4%) | 54 (4.2%) |
| Total | 1,793 (100.0%) | 1,294 (100.0%) |
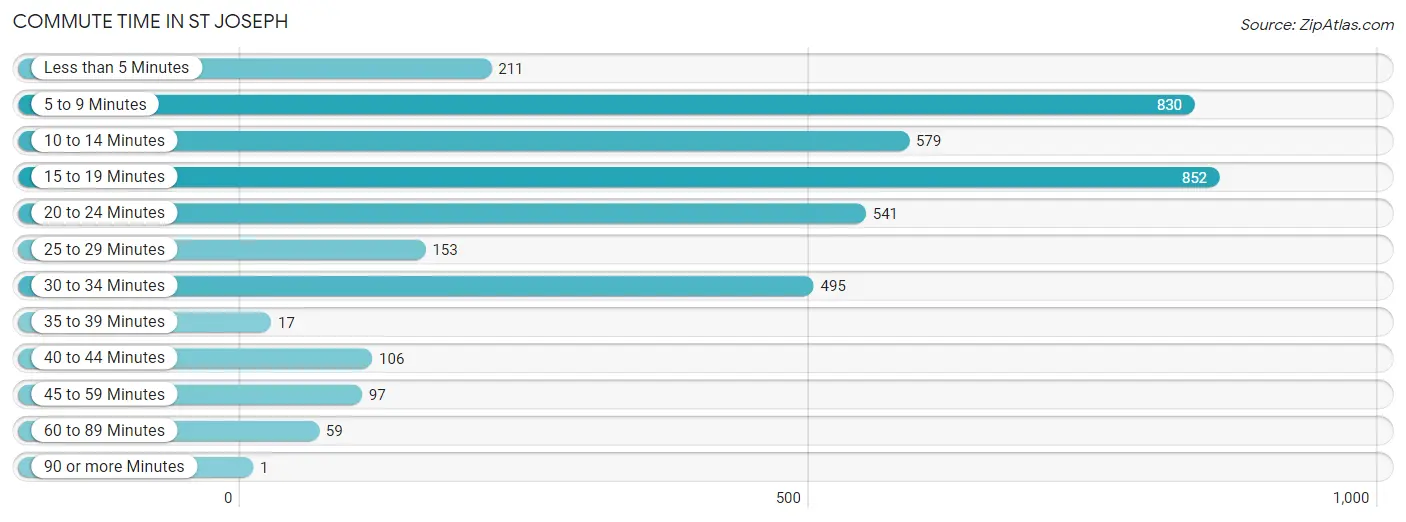
Commute Time in St Joseph
The most frequently occuring commute durations in St Joseph are 15 to 19 minutes (852 commuters, 21.6%), 5 to 9 minutes (830 commuters, 21.1%), and 10 to 14 minutes (579 commuters, 14.7%).
| Commute Time | # Commuters | % Commuters |
| Less than 5 Minutes | 211 | 5.3% |
| 5 to 9 Minutes | 830 | 21.1% |
| 10 to 14 Minutes | 579 | 14.7% |
| 15 to 19 Minutes | 852 | 21.6% |
| 20 to 24 Minutes | 541 | 13.7% |
| 25 to 29 Minutes | 153 | 3.9% |
| 30 to 34 Minutes | 495 | 12.6% |
| 35 to 39 Minutes | 17 | 0.4% |
| 40 to 44 Minutes | 106 | 2.7% |
| 45 to 59 Minutes | 97 | 2.5% |
| 60 to 89 Minutes | 59 | 1.5% |
| 90 or more Minutes | 1 | 0.0% |
Commute Time by Sex in St Joseph
The most common commute times in St Joseph are 5 to 9 minutes (352 commuters, 19.5%) for males and 15 to 19 minutes (502 commuters, 23.5%) for females.
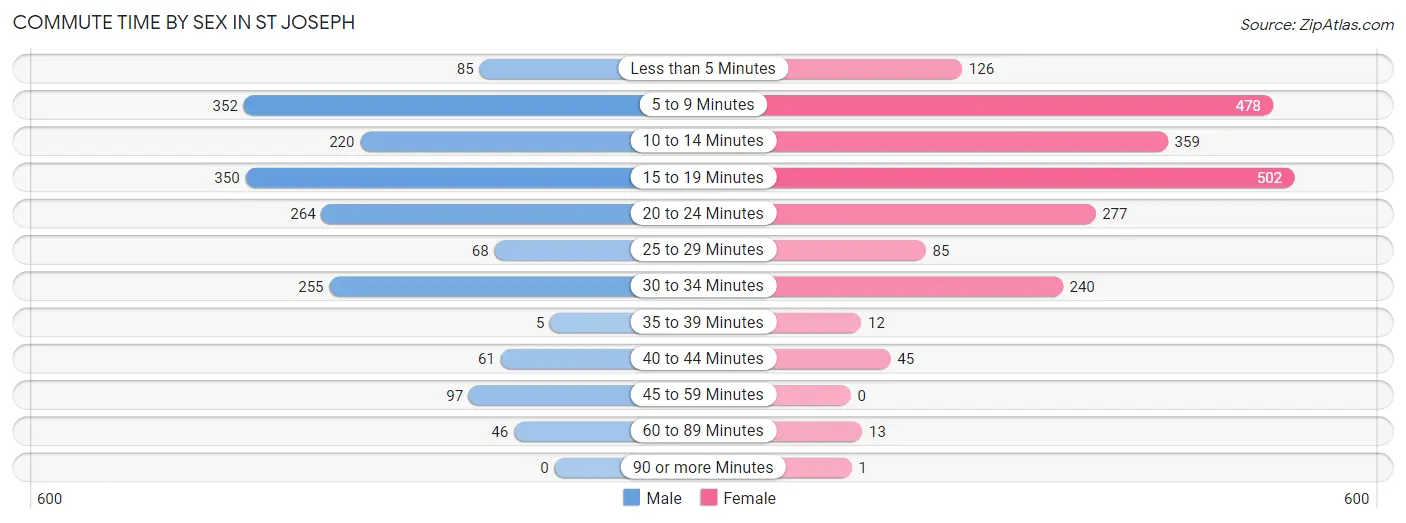
| Commute Time | Male | Female |
| Less than 5 Minutes | 85 (4.7%) | 126 (5.9%) |
| 5 to 9 Minutes | 352 (19.5%) | 478 (22.4%) |
| 10 to 14 Minutes | 220 (12.2%) | 359 (16.8%) |
| 15 to 19 Minutes | 350 (19.4%) | 502 (23.5%) |
| 20 to 24 Minutes | 264 (14.6%) | 277 (13.0%) |
| 25 to 29 Minutes | 68 (3.8%) | 85 (4.0%) |
| 30 to 34 Minutes | 255 (14.1%) | 240 (11.2%) |
| 35 to 39 Minutes | 5 (0.3%) | 12 (0.6%) |
| 40 to 44 Minutes | 61 (3.4%) | 45 (2.1%) |
| 45 to 59 Minutes | 97 (5.4%) | 0 (0.0%) |
| 60 to 89 Minutes | 46 (2.5%) | 13 (0.6%) |
| 90 or more Minutes | 0 (0.0%) | 1 (0.1%) |
Time of Departure to Work by Sex in St Joseph
The most frequent times of departure to work in St Joseph are 7:30 AM to 7:59 AM (320, 17.7%) for males and 12:00 PM to 3:59 PM (313, 14.6%) for females.
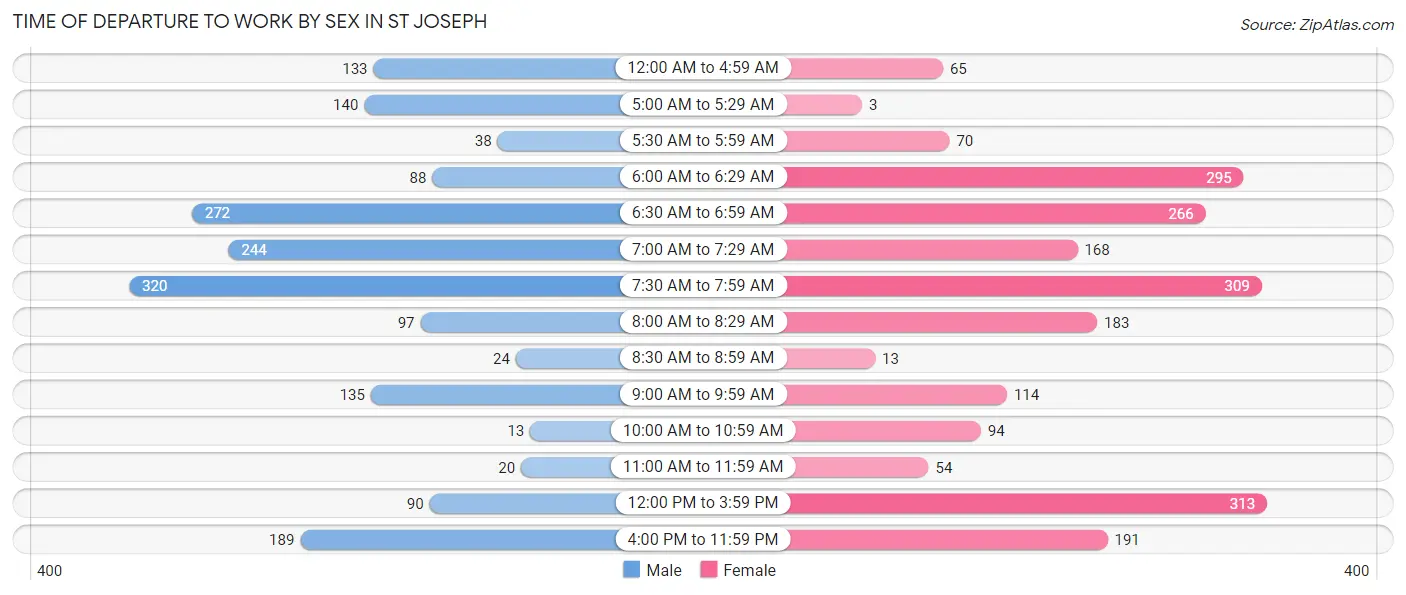
| Time of Departure | Male | Female |
| 12:00 AM to 4:59 AM | 133 (7.4%) | 65 (3.0%) |
| 5:00 AM to 5:29 AM | 140 (7.8%) | 3 (0.1%) |
| 5:30 AM to 5:59 AM | 38 (2.1%) | 70 (3.3%) |
| 6:00 AM to 6:29 AM | 88 (4.9%) | 295 (13.8%) |
| 6:30 AM to 6:59 AM | 272 (15.1%) | 266 (12.4%) |
| 7:00 AM to 7:29 AM | 244 (13.5%) | 168 (7.9%) |
| 7:30 AM to 7:59 AM | 320 (17.7%) | 309 (14.4%) |
| 8:00 AM to 8:29 AM | 97 (5.4%) | 183 (8.6%) |
| 8:30 AM to 8:59 AM | 24 (1.3%) | 13 (0.6%) |
| 9:00 AM to 9:59 AM | 135 (7.5%) | 114 (5.3%) |
| 10:00 AM to 10:59 AM | 13 (0.7%) | 94 (4.4%) |
| 11:00 AM to 11:59 AM | 20 (1.1%) | 54 (2.5%) |
| 12:00 PM to 3:59 PM | 90 (5.0%) | 313 (14.6%) |
| 4:00 PM to 11:59 PM | 189 (10.5%) | 191 (8.9%) |
| Total | 1,803 (100.0%) | 2,138 (100.0%) |
Housing Occupancy in St Joseph
Occupancy by Ownership in St Joseph
Of the total 2,176 dwellings in St Joseph, owner-occupied units account for 1,480 (68.0%), while renter-occupied units make up 696 (32.0%).
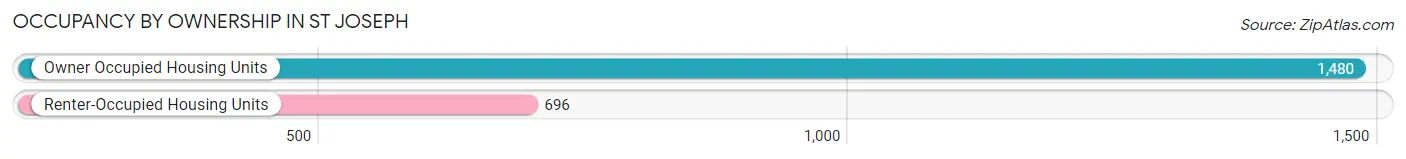
| Occupancy | # Housing Units | % Housing Units |
| Owner Occupied Housing Units | 1,480 | 68.0% |
| Renter-Occupied Housing Units | 696 | 32.0% |
| Total Occupied Housing Units | 2,176 | 100.0% |
Occupancy by Household Size in St Joseph
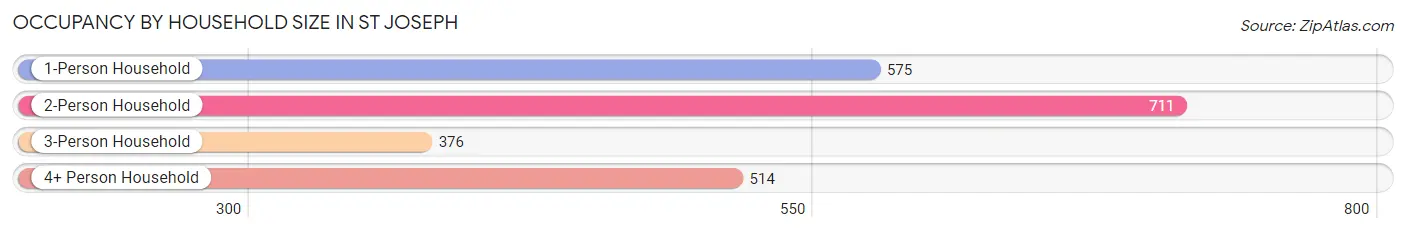
| Household Size | # Housing Units | % Housing Units |
| 1-Person Household | 575 | 26.4% |
| 2-Person Household | 711 | 32.7% |
| 3-Person Household | 376 | 17.3% |
| 4+ Person Household | 514 | 23.6% |
| Total Housing Units | 2,176 | 100.0% |
Occupancy by Ownership by Household Size in St Joseph
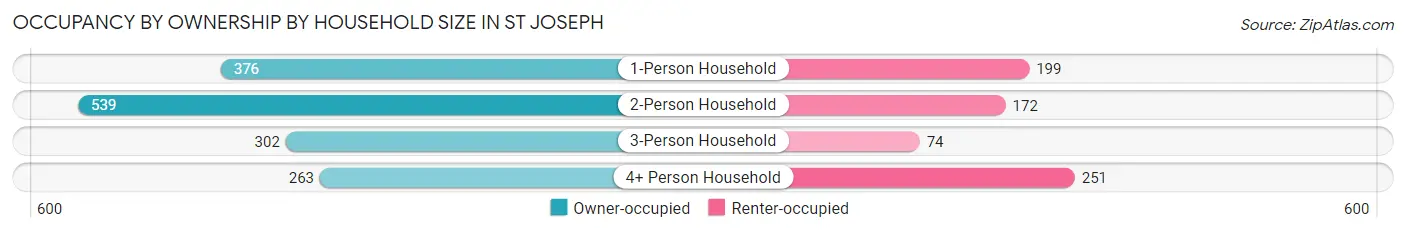
| Household Size | Owner-occupied | Renter-occupied |
| 1-Person Household | 376 (65.4%) | 199 (34.6%) |
| 2-Person Household | 539 (75.8%) | 172 (24.2%) |
| 3-Person Household | 302 (80.3%) | 74 (19.7%) |
| 4+ Person Household | 263 (51.2%) | 251 (48.8%) |
| Total Housing Units | 1,480 (68.0%) | 696 (32.0%) |
Occupancy by Educational Attainment in St Joseph
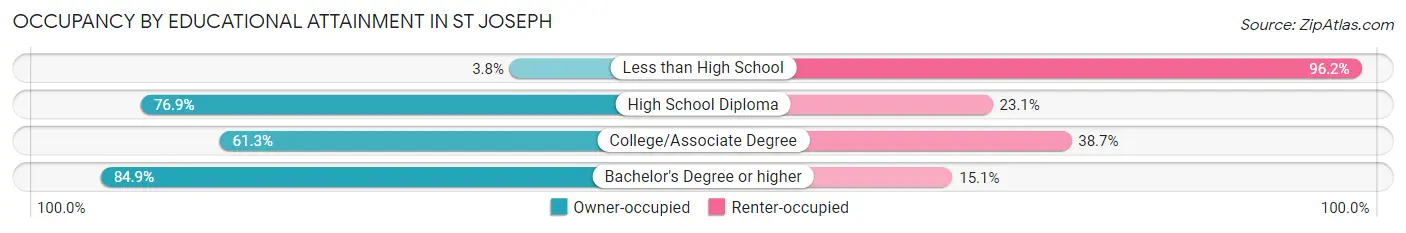
| Household Size | Owner-occupied | Renter-occupied |
| Less than High School | 4 (3.8%) | 101 (96.2%) |
| High School Diploma | 200 (76.9%) | 60 (23.1%) |
| College/Associate Degree | 680 (61.3%) | 429 (38.7%) |
| Bachelor's Degree or higher | 596 (84.9%) | 106 (15.1%) |
Occupancy by Age of Householder in St Joseph
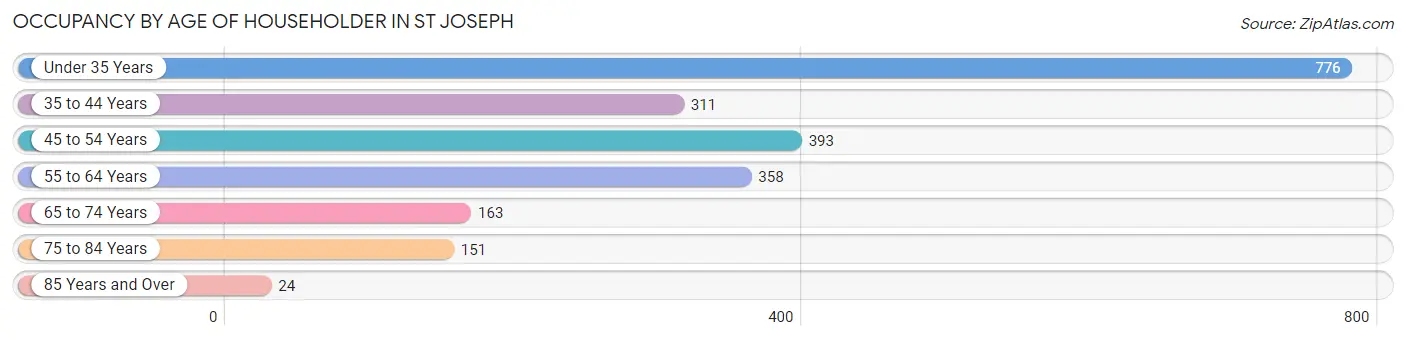
| Age Bracket | # Households | % Households |
| Under 35 Years | 776 | 35.7% |
| 35 to 44 Years | 311 | 14.3% |
| 45 to 54 Years | 393 | 18.1% |
| 55 to 64 Years | 358 | 16.5% |
| 65 to 74 Years | 163 | 7.5% |
| 75 to 84 Years | 151 | 6.9% |
| 85 Years and Over | 24 | 1.1% |
| Total | 2,176 | 100.0% |
Housing Finances in St Joseph
Median Income by Occupancy in St Joseph
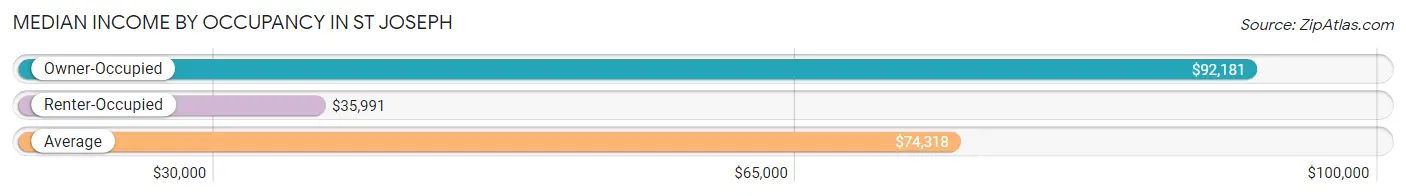
| Occupancy Type | # Households | Median Income |
| Owner-Occupied | 1,480 (68.0%) | $92,181 |
| Renter-Occupied | 696 (32.0%) | $35,991 |
| Average | 2,176 (100.0%) | $74,318 |
Occupancy by Householder Income Bracket in St Joseph
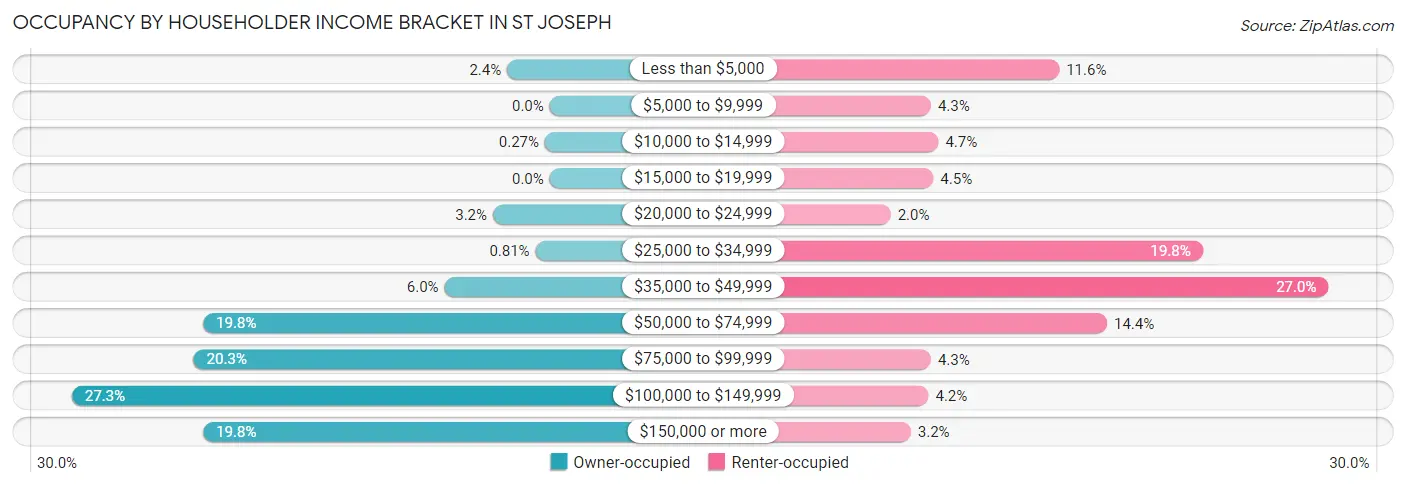
| Income Bracket | Owner-occupied | Renter-occupied |
| Less than $5,000 | 36 (2.4%) | 81 (11.6%) |
| $5,000 to $9,999 | 0 (0.0%) | 30 (4.3%) |
| $10,000 to $14,999 | 4 (0.3%) | 33 (4.7%) |
| $15,000 to $19,999 | 0 (0.0%) | 31 (4.4%) |
| $20,000 to $24,999 | 48 (3.2%) | 14 (2.0%) |
| $25,000 to $34,999 | 12 (0.8%) | 138 (19.8%) |
| $35,000 to $49,999 | 89 (6.0%) | 188 (27.0%) |
| $50,000 to $74,999 | 293 (19.8%) | 100 (14.4%) |
| $75,000 to $99,999 | 301 (20.3%) | 30 (4.3%) |
| $100,000 to $149,999 | 404 (27.3%) | 29 (4.2%) |
| $150,000 or more | 293 (19.8%) | 22 (3.2%) |
| Total | 1,480 (100.0%) | 696 (100.0%) |
Monthly Housing Cost Tiers in St Joseph
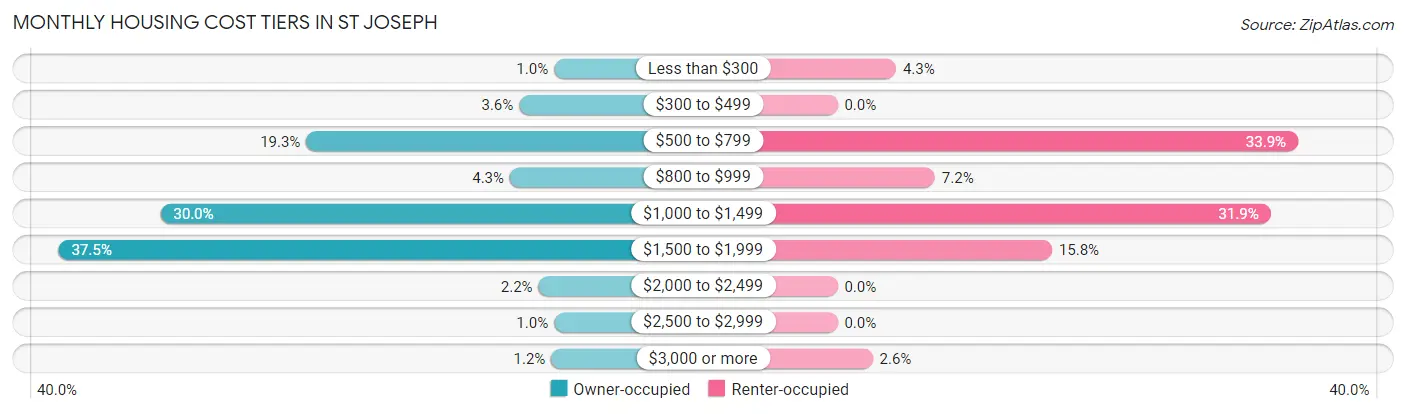
| Monthly Cost | Owner-occupied | Renter-occupied |
| Less than $300 | 15 (1.0%) | 30 (4.3%) |
| $300 to $499 | 53 (3.6%) | 0 (0.0%) |
| $500 to $799 | 285 (19.3%) | 236 (33.9%) |
| $800 to $999 | 63 (4.3%) | 50 (7.2%) |
| $1,000 to $1,499 | 444 (30.0%) | 222 (31.9%) |
| $1,500 to $1,999 | 555 (37.5%) | 110 (15.8%) |
| $2,000 to $2,499 | 32 (2.2%) | 0 (0.0%) |
| $2,500 to $2,999 | 15 (1.0%) | 0 (0.0%) |
| $3,000 or more | 18 (1.2%) | 18 (2.6%) |
| Total | 1,480 (100.0%) | 696 (100.0%) |
Physical Housing Characteristics in St Joseph
Housing Structures in St Joseph
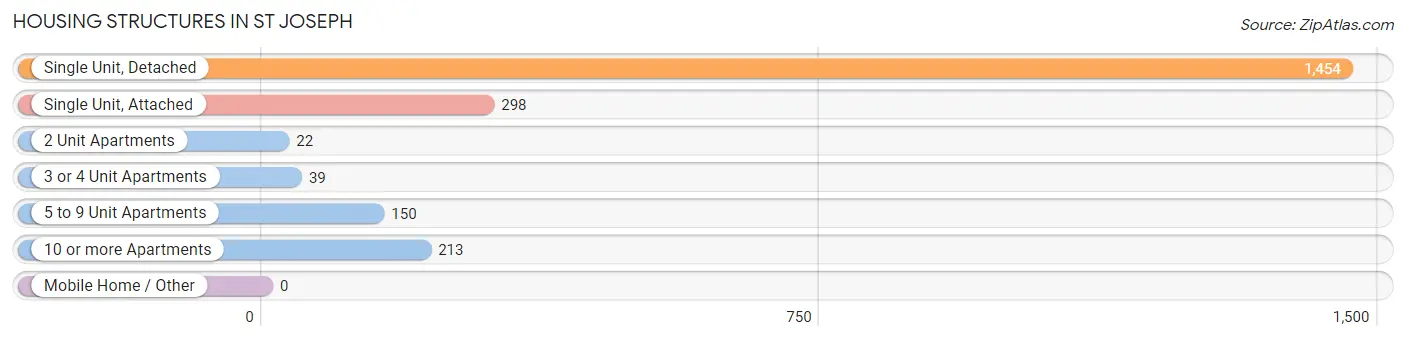
| Structure Type | # Housing Units | % Housing Units |
| Single Unit, Detached | 1,454 | 66.8% |
| Single Unit, Attached | 298 | 13.7% |
| 2 Unit Apartments | 22 | 1.0% |
| 3 or 4 Unit Apartments | 39 | 1.8% |
| 5 to 9 Unit Apartments | 150 | 6.9% |
| 10 or more Apartments | 213 | 9.8% |
| Mobile Home / Other | 0 | 0.0% |
| Total | 2,176 | 100.0% |
Housing Structures by Occupancy in St Joseph
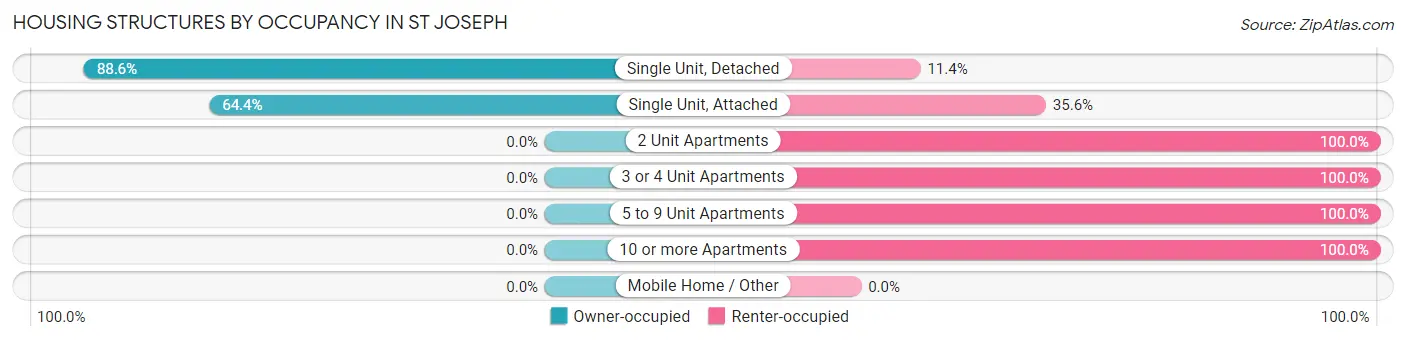
| Structure Type | Owner-occupied | Renter-occupied |
| Single Unit, Detached | 1,288 (88.6%) | 166 (11.4%) |
| Single Unit, Attached | 192 (64.4%) | 106 (35.6%) |
| 2 Unit Apartments | 0 (0.0%) | 22 (100.0%) |
| 3 or 4 Unit Apartments | 0 (0.0%) | 39 (100.0%) |
| 5 to 9 Unit Apartments | 0 (0.0%) | 150 (100.0%) |
| 10 or more Apartments | 0 (0.0%) | 213 (100.0%) |
| Mobile Home / Other | 0 (0.0%) | 0 (0.0%) |
| Total | 1,480 (68.0%) | 696 (32.0%) |
Housing Structures by Number of Rooms in St Joseph
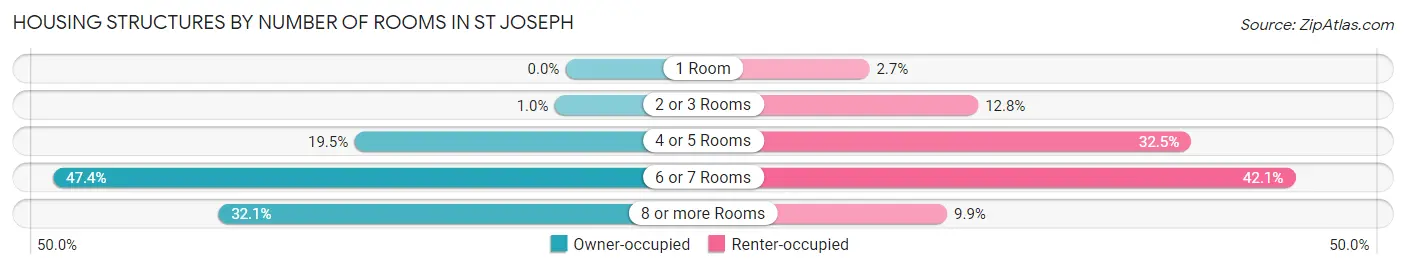
| Number of Rooms | Owner-occupied | Renter-occupied |
| 1 Room | 0 (0.0%) | 19 (2.7%) |
| 2 or 3 Rooms | 15 (1.0%) | 89 (12.8%) |
| 4 or 5 Rooms | 289 (19.5%) | 226 (32.5%) |
| 6 or 7 Rooms | 701 (47.4%) | 293 (42.1%) |
| 8 or more Rooms | 475 (32.1%) | 69 (9.9%) |
| Total | 1,480 (100.0%) | 696 (100.0%) |
Housing Structure by Heating Type in St Joseph
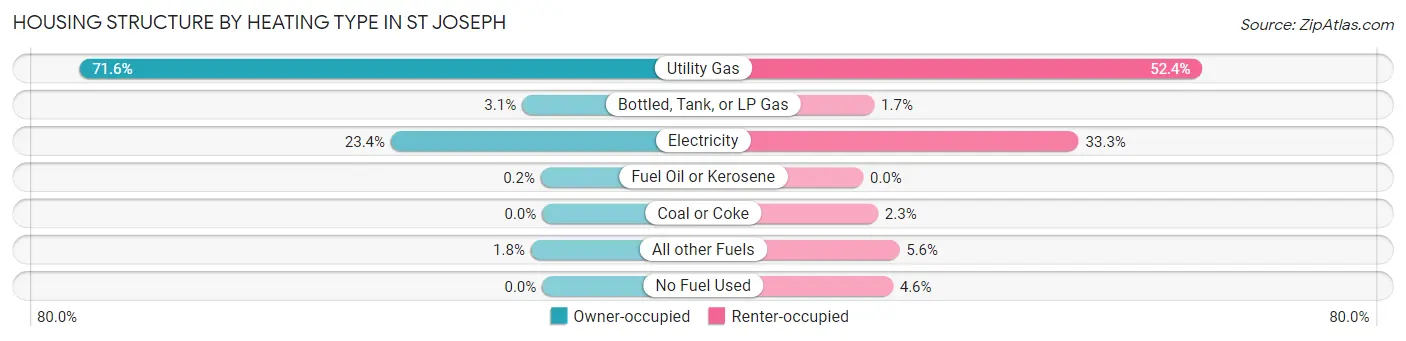
| Heating Type | Owner-occupied | Renter-occupied |
| Utility Gas | 1,059 (71.6%) | 365 (52.4%) |
| Bottled, Tank, or LP Gas | 46 (3.1%) | 12 (1.7%) |
| Electricity | 346 (23.4%) | 232 (33.3%) |
| Fuel Oil or Kerosene | 3 (0.2%) | 0 (0.0%) |
| Coal or Coke | 0 (0.0%) | 16 (2.3%) |
| All other Fuels | 26 (1.8%) | 39 (5.6%) |
| No Fuel Used | 0 (0.0%) | 32 (4.6%) |
| Total | 1,480 (100.0%) | 696 (100.0%) |
Household Vehicle Usage in St Joseph
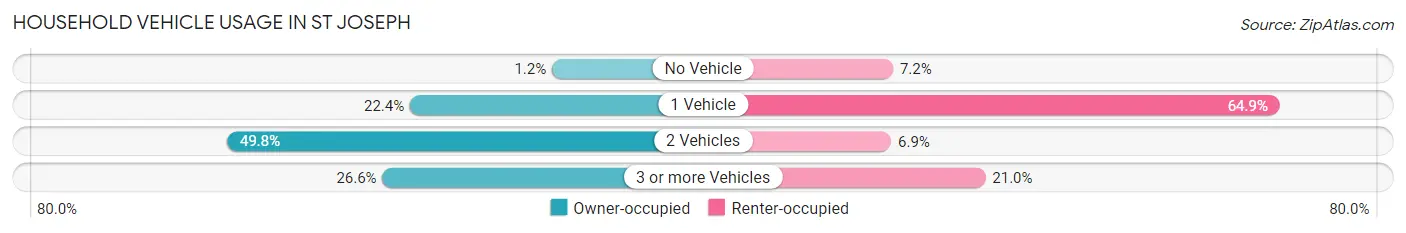
| Vehicles per Household | Owner-occupied | Renter-occupied |
| No Vehicle | 18 (1.2%) | 50 (7.2%) |
| 1 Vehicle | 332 (22.4%) | 452 (64.9%) |
| 2 Vehicles | 737 (49.8%) | 48 (6.9%) |
| 3 or more Vehicles | 393 (26.6%) | 146 (21.0%) |
| Total | 1,480 (100.0%) | 696 (100.0%) |
Real Estate & Mortgages in St Joseph
Real Estate and Mortgage Overview in St Joseph
| Characteristic | Without Mortgage | With Mortgage |
| Housing Units | 363 | 1,117 |
| Median Property Value | $251,600 | $226,400 |
| Median Household Income | $67,731 | $273 |
| Monthly Housing Costs | $577 | $18 |
| Real Estate Taxes | $2,530 | $24 |
Property Value by Mortgage Status in St Joseph
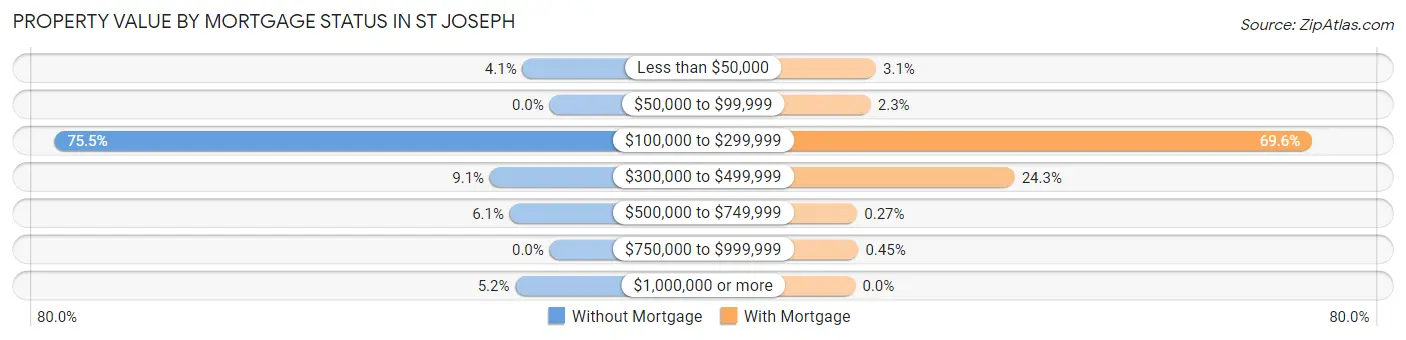
| Property Value | Without Mortgage | With Mortgage |
| Less than $50,000 | 15 (4.1%) | 35 (3.1%) |
| $50,000 to $99,999 | 0 (0.0%) | 26 (2.3%) |
| $100,000 to $299,999 | 274 (75.5%) | 777 (69.6%) |
| $300,000 to $499,999 | 33 (9.1%) | 271 (24.3%) |
| $500,000 to $749,999 | 22 (6.1%) | 3 (0.3%) |
| $750,000 to $999,999 | 0 (0.0%) | 5 (0.4%) |
| $1,000,000 or more | 19 (5.2%) | 0 (0.0%) |
| Total | 363 (100.0%) | 1,117 (100.0%) |
Household Income by Mortgage Status in St Joseph
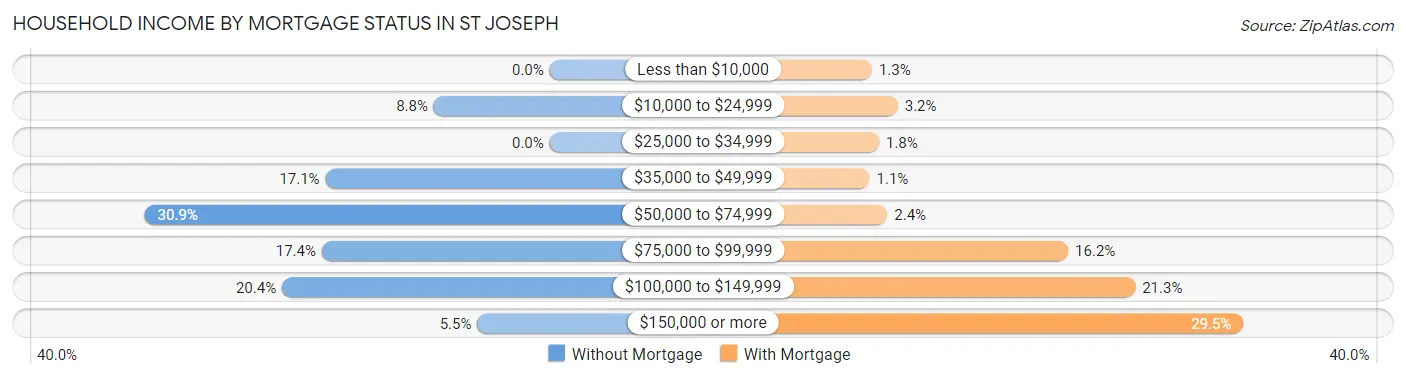
| Household Income | Without Mortgage | With Mortgage |
| Less than $10,000 | 0 (0.0%) | 14 (1.3%) |
| $10,000 to $24,999 | 32 (8.8%) | 36 (3.2%) |
| $25,000 to $34,999 | 0 (0.0%) | 20 (1.8%) |
| $35,000 to $49,999 | 62 (17.1%) | 12 (1.1%) |
| $50,000 to $74,999 | 112 (30.8%) | 27 (2.4%) |
| $75,000 to $99,999 | 63 (17.4%) | 181 (16.2%) |
| $100,000 to $149,999 | 74 (20.4%) | 238 (21.3%) |
| $150,000 or more | 20 (5.5%) | 330 (29.5%) |
| Total | 363 (100.0%) | 1,117 (100.0%) |
Property Value to Household Income Ratio in St Joseph
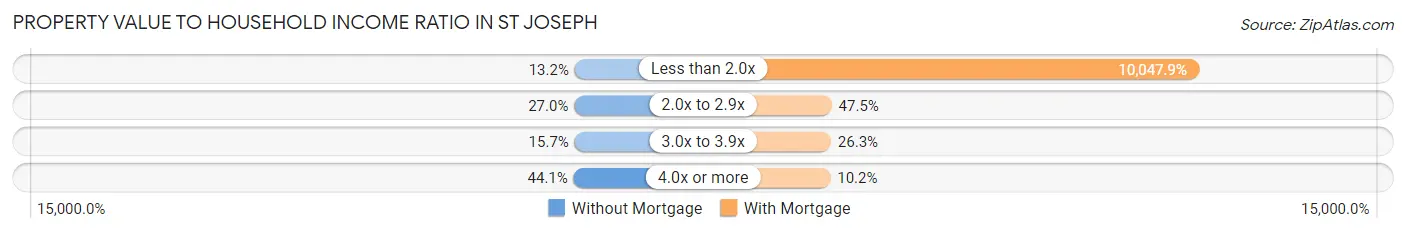
| Value-to-Income Ratio | Without Mortgage | With Mortgage |
| Less than 2.0x | 48 (13.2%) | 112,235 (10,047.9%) |
| 2.0x to 2.9x | 98 (27.0%) | 531 (47.5%) |
| 3.0x to 3.9x | 57 (15.7%) | 294 (26.3%) |
| 4.0x or more | 160 (44.1%) | 114 (10.2%) |
| Total | 363 (100.0%) | 1,117 (100.0%) |
Real Estate Taxes by Mortgage Status in St Joseph
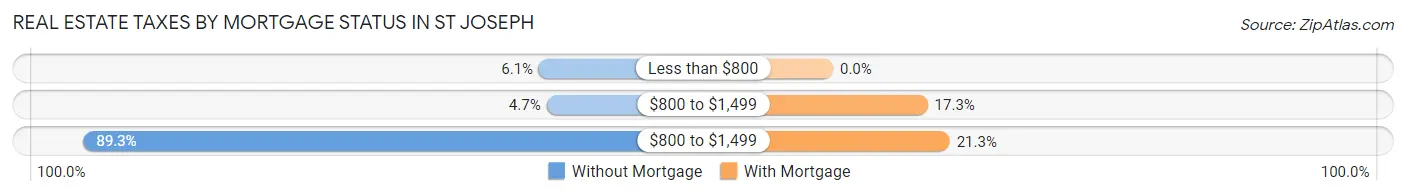
| Property Taxes | Without Mortgage | With Mortgage |
| Less than $800 | 22 (6.1%) | 0 (0.0%) |
| $800 to $1,499 | 17 (4.7%) | 193 (17.3%) |
| $800 to $1,499 | 324 (89.3%) | 238 (21.3%) |
| Total | 363 (100.0%) | 1,117 (100.0%) |
Health & Disability in St Joseph
Health Insurance Coverage by Age in St Joseph
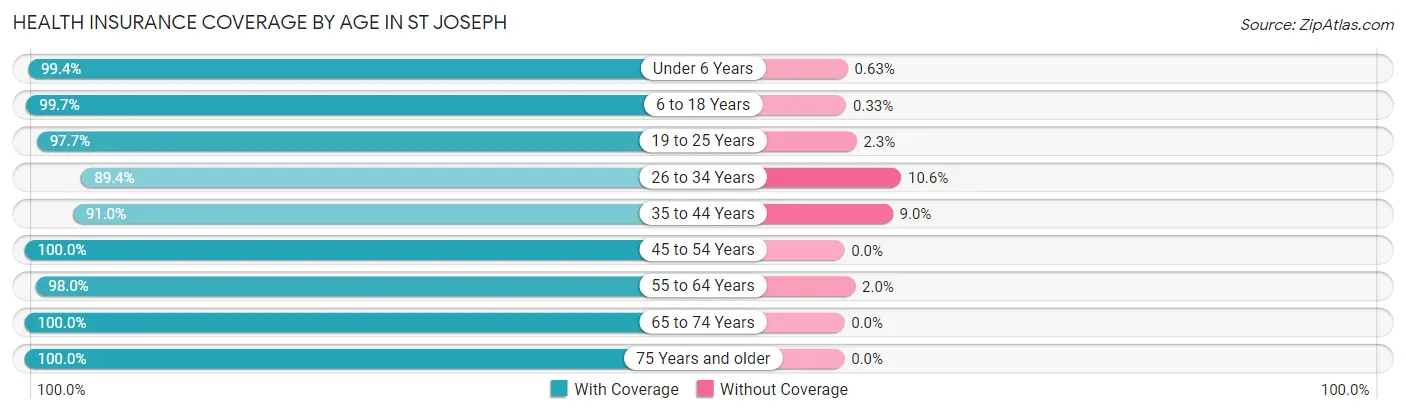
| Age Bracket | With Coverage | Without Coverage |
| Under 6 Years | 470 (99.4%) | 3 (0.6%) |
| 6 to 18 Years | 1,211 (99.7%) | 4 (0.3%) |
| 19 to 25 Years | 1,809 (97.7%) | 42 (2.3%) |
| 26 to 34 Years | 768 (89.4%) | 91 (10.6%) |
| 35 to 44 Years | 566 (91.0%) | 56 (9.0%) |
| 45 to 54 Years | 724 (100.0%) | 0 (0.0%) |
| 55 to 64 Years | 631 (98.0%) | 13 (2.0%) |
| 65 to 74 Years | 348 (100.0%) | 0 (0.0%) |
| 75 Years and older | 326 (100.0%) | 0 (0.0%) |
| Total | 6,853 (97.0%) | 209 (3.0%) |
Health Insurance Coverage by Citizenship Status in St Joseph
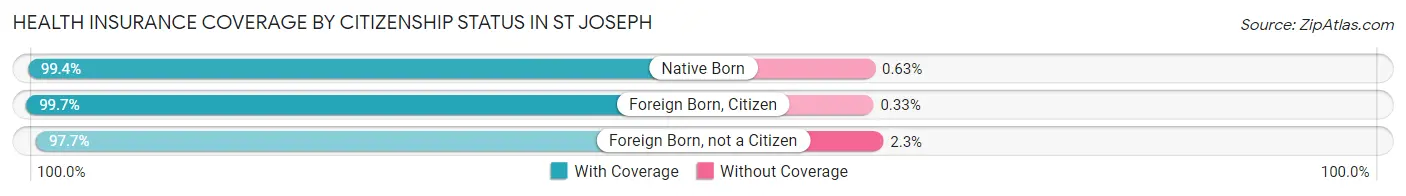
| Citizenship Status | With Coverage | Without Coverage |
| Native Born | 470 (99.4%) | 3 (0.6%) |
| Foreign Born, Citizen | 1,211 (99.7%) | 4 (0.3%) |
| Foreign Born, not a Citizen | 1,809 (97.7%) | 42 (2.3%) |
Health Insurance Coverage by Household Income in St Joseph
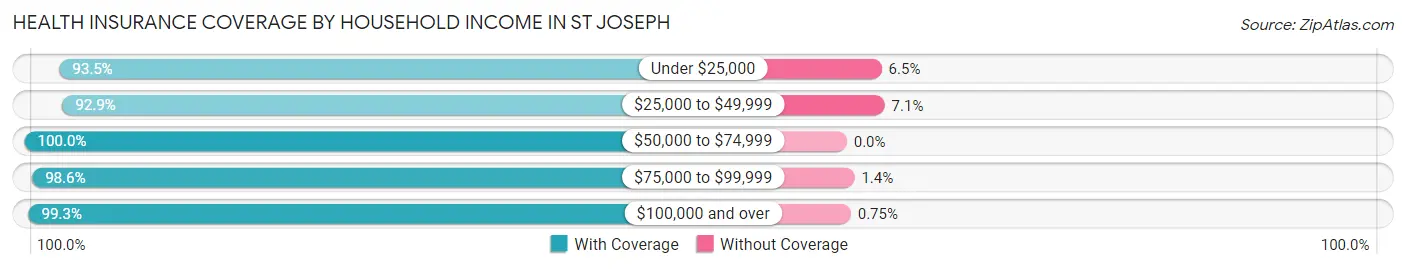
| Household Income | With Coverage | Without Coverage |
| Under $25,000 | 802 (93.5%) | 56 (6.5%) |
| $25,000 to $49,999 | 1,036 (92.9%) | 79 (7.1%) |
| $50,000 to $74,999 | 643 (100.0%) | 0 (0.0%) |
| $75,000 to $99,999 | 753 (98.6%) | 11 (1.4%) |
| $100,000 and over | 2,114 (99.3%) | 16 (0.7%) |
Public vs Private Health Insurance Coverage by Age in St Joseph
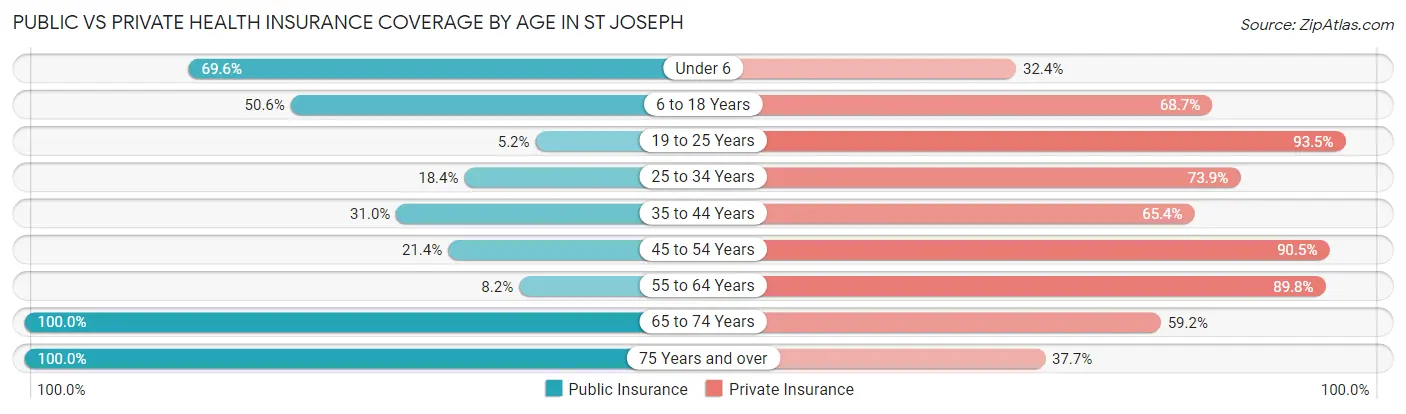
| Age Bracket | Public Insurance | Private Insurance |
| Under 6 | 329 (69.6%) | 153 (32.4%) |
| 6 to 18 Years | 615 (50.6%) | 835 (68.7%) |
| 19 to 25 Years | 96 (5.2%) | 1,730 (93.5%) |
| 25 to 34 Years | 158 (18.4%) | 635 (73.9%) |
| 35 to 44 Years | 193 (31.0%) | 407 (65.4%) |
| 45 to 54 Years | 155 (21.4%) | 655 (90.5%) |
| 55 to 64 Years | 53 (8.2%) | 578 (89.7%) |
| 65 to 74 Years | 348 (100.0%) | 206 (59.2%) |
| 75 Years and over | 326 (100.0%) | 123 (37.7%) |
| Total | 2,273 (32.2%) | 5,322 (75.4%) |
Disability Status by Sex by Age in St Joseph
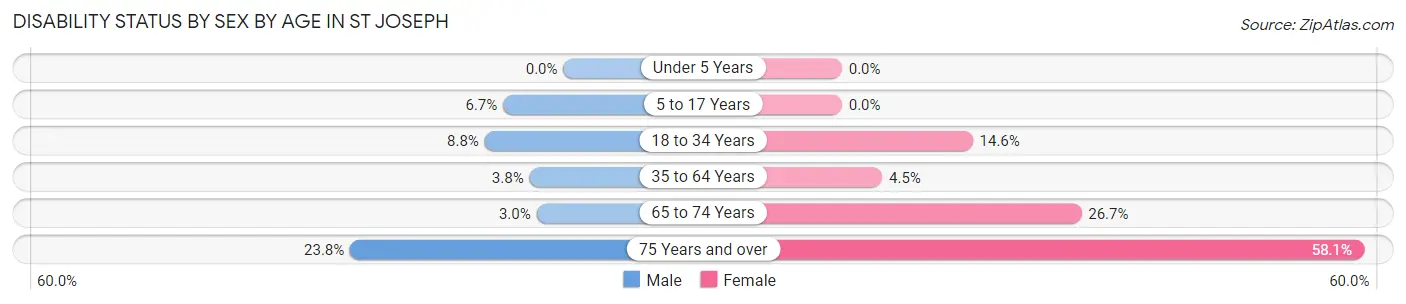
| Age Bracket | Male | Female |
| Under 5 Years | 0 (0.0%) | 0 (0.0%) |
| 5 to 17 Years | 33 (6.7%) | 0 (0.0%) |
| 18 to 34 Years | 97 (8.8%) | 280 (14.6%) |
| 35 to 64 Years | 38 (3.8%) | 44 (4.5%) |
| 65 to 74 Years | 5 (3.0%) | 48 (26.7%) |
| 75 Years and over | 19 (23.7%) | 143 (58.1%) |
Disability Class by Sex by Age in St Joseph
Disability Class: Hearing Difficulty
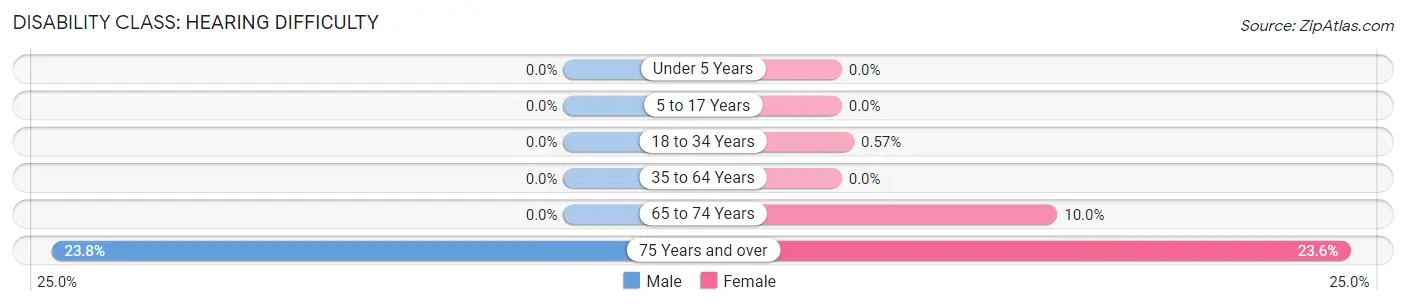
| Age Bracket | Male | Female |
| Under 5 Years | 0 (0.0%) | 0 (0.0%) |
| 5 to 17 Years | 0 (0.0%) | 0 (0.0%) |
| 18 to 34 Years | 0 (0.0%) | 11 (0.6%) |
| 35 to 64 Years | 0 (0.0%) | 0 (0.0%) |
| 65 to 74 Years | 0 (0.0%) | 18 (10.0%) |
| 75 Years and over | 19 (23.7%) | 58 (23.6%) |
Disability Class: Vision Difficulty
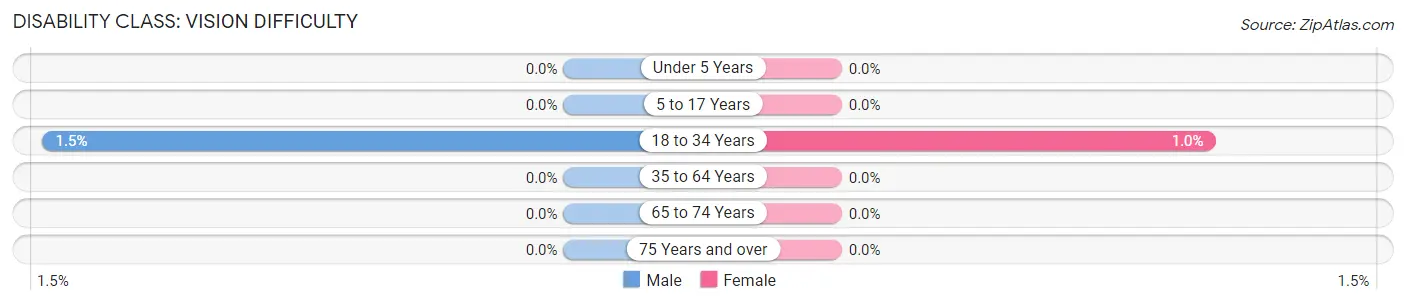
| Age Bracket | Male | Female |
| Under 5 Years | 0 (0.0%) | 0 (0.0%) |
| 5 to 17 Years | 0 (0.0%) | 0 (0.0%) |
| 18 to 34 Years | 16 (1.5%) | 20 (1.0%) |
| 35 to 64 Years | 0 (0.0%) | 0 (0.0%) |
| 65 to 74 Years | 0 (0.0%) | 0 (0.0%) |
| 75 Years and over | 0 (0.0%) | 0 (0.0%) |
Disability Class: Cognitive Difficulty
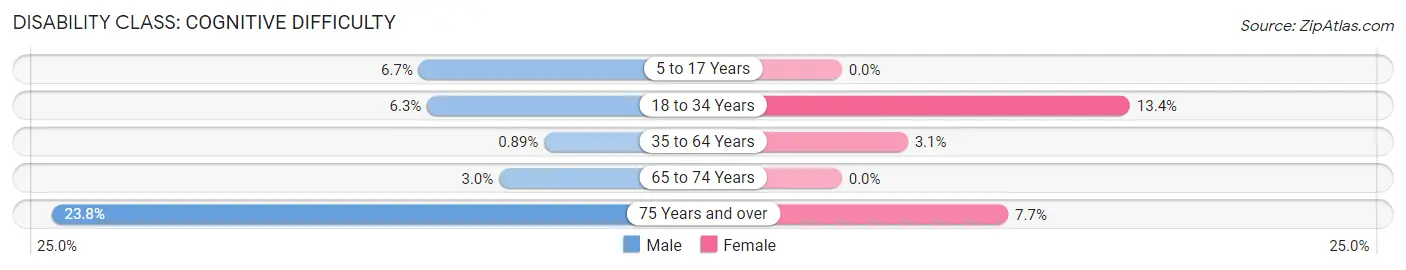
| Age Bracket | Male | Female |
| 5 to 17 Years | 33 (6.7%) | 0 (0.0%) |
| 18 to 34 Years | 70 (6.3%) | 257 (13.4%) |
| 35 to 64 Years | 9 (0.9%) | 30 (3.1%) |
| 65 to 74 Years | 5 (3.0%) | 0 (0.0%) |
| 75 Years and over | 19 (23.7%) | 19 (7.7%) |
Disability Class: Ambulatory Difficulty
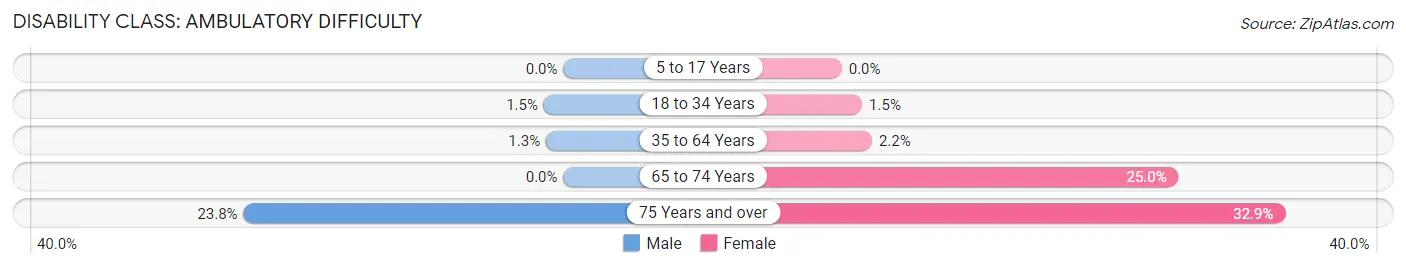
| Age Bracket | Male | Female |
| 5 to 17 Years | 0 (0.0%) | 0 (0.0%) |
| 18 to 34 Years | 16 (1.5%) | 29 (1.5%) |
| 35 to 64 Years | 13 (1.3%) | 22 (2.2%) |
| 65 to 74 Years | 0 (0.0%) | 45 (25.0%) |
| 75 Years and over | 19 (23.7%) | 81 (32.9%) |
Disability Class: Self-Care Difficulty
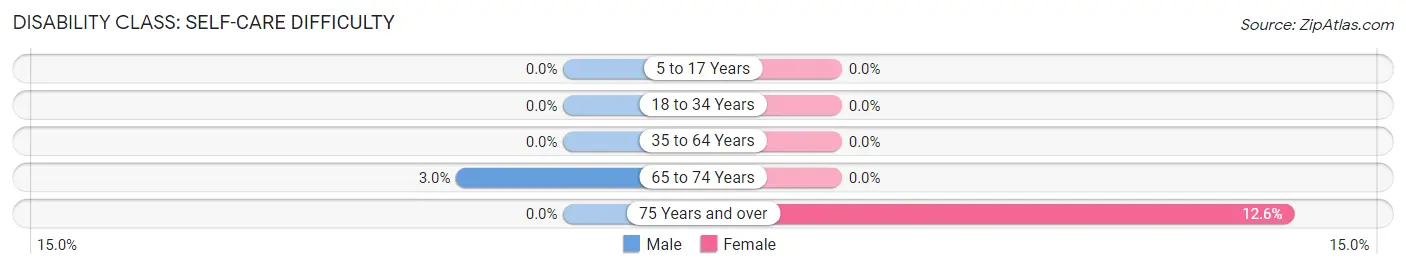
| Age Bracket | Male | Female |
| 5 to 17 Years | 0 (0.0%) | 0 (0.0%) |
| 18 to 34 Years | 0 (0.0%) | 0 (0.0%) |
| 35 to 64 Years | 0 (0.0%) | 0 (0.0%) |
| 65 to 74 Years | 5 (3.0%) | 0 (0.0%) |
| 75 Years and over | 0 (0.0%) | 31 (12.6%) |
Technology Access in St Joseph
Computing Device Access in St Joseph
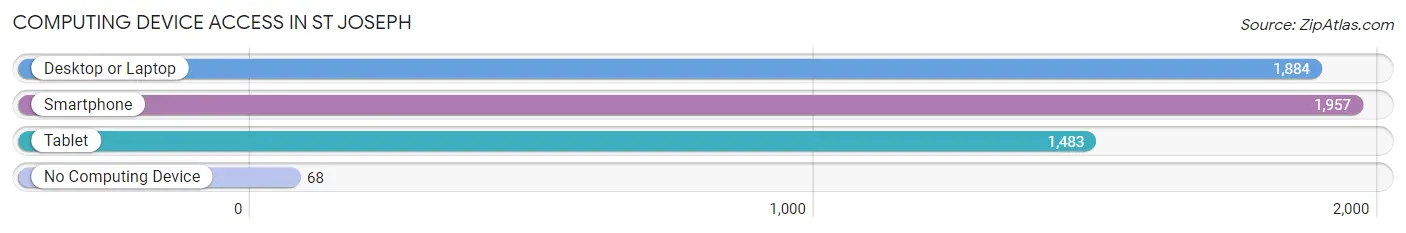
| Device Type | # Households | % Households |
| Desktop or Laptop | 1,884 | 86.6% |
| Smartphone | 1,957 | 89.9% |
| Tablet | 1,483 | 68.1% |
| No Computing Device | 68 | 3.1% |
| Total | 2,176 | 100.0% |
Internet Access in St Joseph
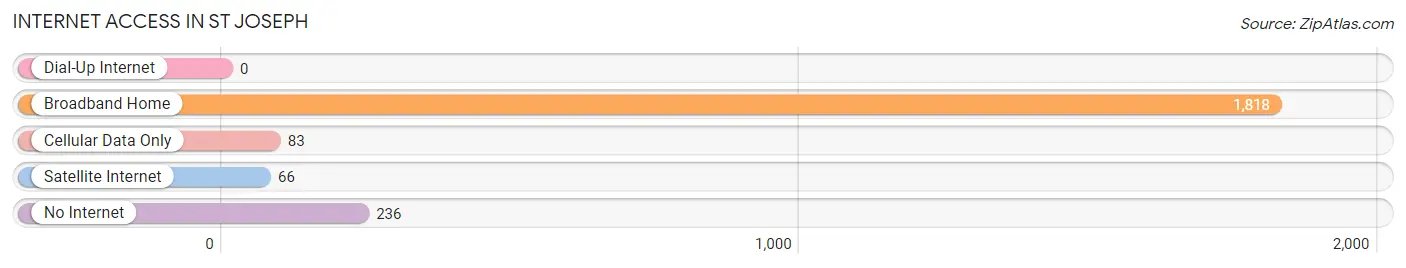
| Internet Type | # Households | % Households |
| Dial-Up Internet | 0 | 0.0% |
| Broadband Home | 1,818 | 83.6% |
| Cellular Data Only | 83 | 3.8% |
| Satellite Internet | 66 | 3.0% |
| No Internet | 236 | 10.8% |
| Total | 2,176 | 100.0% |
St Joseph Summary
St. Joseph, Minnesota is a small city located in Stearns County, Minnesota, United States. It is situated on the banks of the Mississippi River, approximately 25 miles northwest of St. Cloud. The city has a population of 6,845 as of the 2010 census.
History
St. Joseph was founded in 1856 by Father Francis Xavier Pierz, a German-born Catholic priest. He named the city after the patron saint of his home country, St. Joseph. The city was originally a farming community, but it soon became a center for the lumber industry. The city was incorporated in 1872.
In the late 19th century, St. Joseph was a major hub for the railroad industry. The city was home to several railroads, including the St. Paul and Pacific Railroad, the St. Paul, Minneapolis and Manitoba Railway, and the Great Northern Railway.
Geography
St. Joseph is located in Stearns County, Minnesota, United States. It is situated on the banks of the Mississippi River, approximately 25 miles northwest of St. Cloud. The city has a total area of 4.2 square miles, all of which is land.
Economy
St. Joseph’s economy is largely based on agriculture and manufacturing. The city is home to several large companies, including the St. Joseph’s Medical Center, the St. Joseph’s Regional Health Center, and the St. Joseph’s College of Nursing. The city is also home to several small businesses, including restaurants, retail stores, and professional services.
Demographics
As of the 2010 census, St. Joseph had a population of 6,845. The racial makeup of the city was 95.2% White, 0.7% African American, 0.3% Native American, 0.7% Asian, 0.1% Pacific Islander, 1.3% from other races, and 1.7% from two or more races. Hispanic or Latino of any race were 3.2% of the population.
The median income for a household in St. Joseph was $45,938, and the median income for a family was $54,938. The per capita income for the city was $21,945. About 6.2% of families and 8.2% of the population were below the poverty line, including 10.2% of those under age 18 and 8.2% of those age 65 or over.
St. Joseph is a small city with a rich history and a diverse population. The city is home to several large companies and small businesses, and it is a major hub for the railroad industry. The city has a strong agricultural and manufacturing base, and it is a great place to live and work.
Common Questions
What is Per Capita Income in St Joseph?
Per Capita income in St Joseph is $29,347.
What is the Median Family Income in St Joseph?
Median Family Income in St Joseph is $87,083.
What is the Median Household income in St Joseph?
Median Household Income in St Joseph is $74,318.
What is Income or Wage Gap in St Joseph?
Income or Wage Gap in St Joseph is 55.6%.
Women in St Joseph earn 44.4 cents for every dollar earned by a man.
What is Inequality or Gini Index in St Joseph?
Inequality or Gini Index in St Joseph is 0.42.
What is the Total Population of St Joseph?
Total Population of St Joseph is 7,066.
What is the Total Male Population of St Joseph?
Total Male Population of St Joseph is 3,095.
What is the Total Female Population of St Joseph?
Total Female Population of St Joseph is 3,971.
What is the Ratio of Males per 100 Females in St Joseph?
There are 77.94 Males per 100 Females in St Joseph.
What is the Ratio of Females per 100 Males in St Joseph?
There are 128.30 Females per 100 Males in St Joseph.
What is the Median Population Age in St Joseph?
Median Population Age in St Joseph is 25.9 Years.
What is the Average Family Size in St Joseph
Average Family Size in St Joseph is 3.1 People.
What is the Average Household Size in St Joseph
Average Household Size in St Joseph is 2.5 People.
How Large is the Labor Force in St Joseph?
There are 4,397 People in the Labor Forcein in St Joseph.
What is the Percentage of People in the Labor Force in St Joseph?
75.7% of People are in the Labor Force in St Joseph.
What is the Unemployment Rate in St Joseph?
Unemployment Rate in St Joseph is 2.7%.