Pelican Rapids, MN Map & Demographics
Pelican Rapids Map
Pelican Rapids Overview
$22,124
PER CAPITA INCOME
$65,556
AVG FAMILY INCOME
$56,477
AVG HOUSEHOLD INCOME
55.4%
WAGE / INCOME GAP [ % ]
44.6¢/ $1
WAGE / INCOME GAP [ $ ]
0.44
INEQUALITY / GINI INDEX
2,589
TOTAL POPULATION
1,265
MALE POPULATION
1,324
FEMALE POPULATION
95.54
MALES / 100 FEMALES
104.66
FEMALES / 100 MALES
36.3
MEDIAN AGE
3.4
AVG FAMILY SIZE
2.7
AVG HOUSEHOLD SIZE
1,047
LABOR FORCE [ PEOPLE ]
58.7%
PERCENT IN LABOR FORCE
2.8%
UNEMPLOYMENT RATE
Pelican Rapids Zip Codes
Pelican Rapids Area Codes
Income in Pelican Rapids
Income Overview in Pelican Rapids
Per Capita Income in Pelican Rapids is $22,124, while median incomes of families and households are $65,556 and $56,477 respectively.
| Characteristic | Number | Measure |
| Per Capita Income | 2,589 | $22,124 |
| Median Family Income | 622 | $65,556 |
| Mean Family Income | 622 | $73,135 |
| Median Household Income | 941 | $56,477 |
| Mean Household Income | 941 | $59,953 |
| Income Deficit | 622 | $0 |
| Wage / Income Gap (%) | 2,589 | 55.40% |
| Wage / Income Gap ($) | 2,589 | 44.60¢ per $1 |
| Gini / Inequality Index | 2,589 | 0.44 |
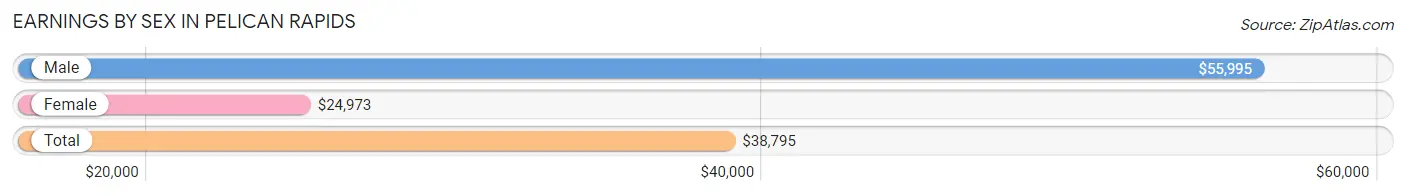
Earnings by Sex in Pelican Rapids
Average Earnings in Pelican Rapids are $38,795, $55,995 for men and $24,973 for women, a difference of 55.4%.
| Sex | Number | Average Earnings |
| Male | 615 (54.2%) | $55,995 |
| Female | 520 (45.8%) | $24,973 |
| Total | 1,135 (100.0%) | $38,795 |
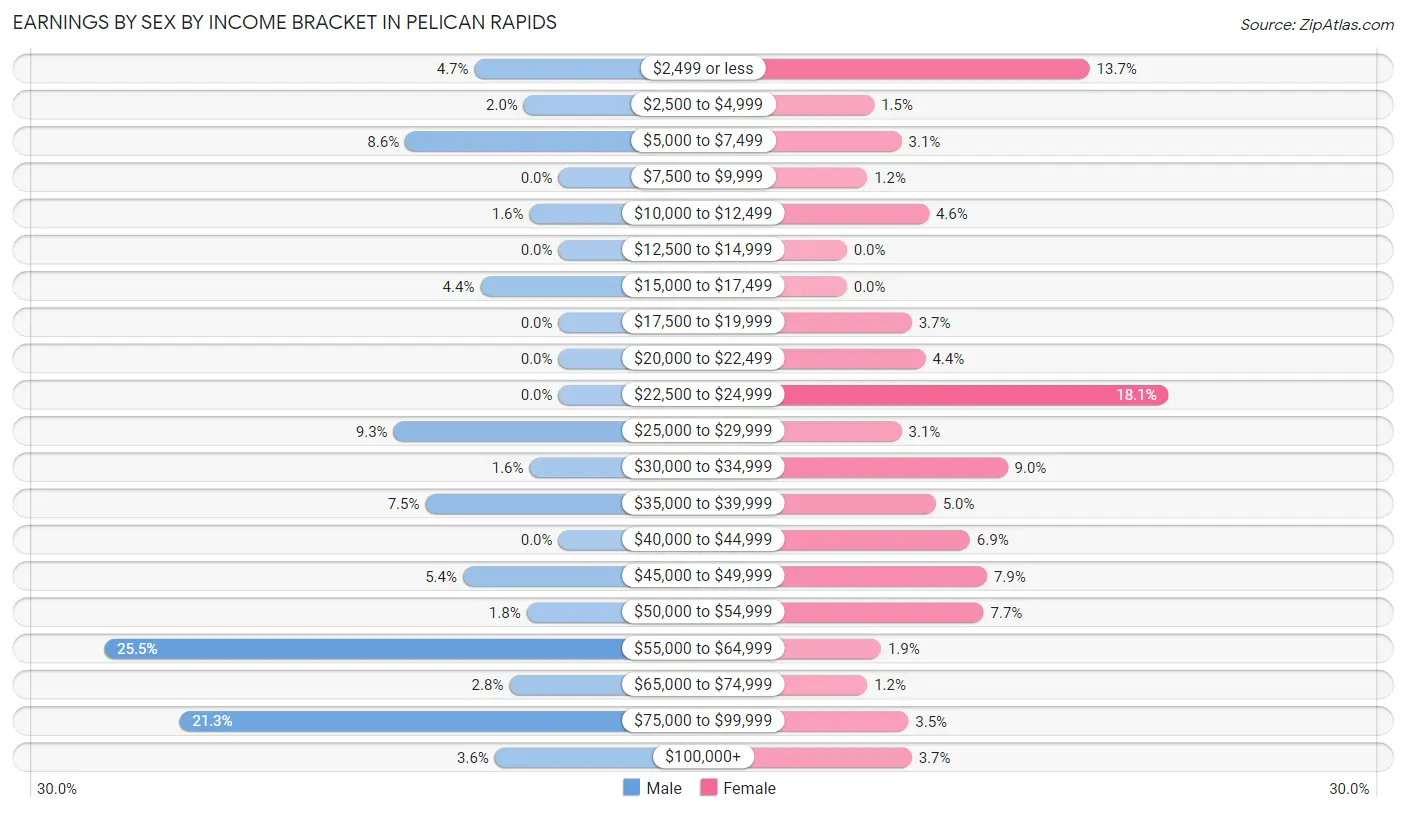
Earnings by Sex by Income Bracket in Pelican Rapids
The most common earnings brackets in Pelican Rapids are $55,000 to $64,999 for men (157 | 25.5%) and $22,500 to $24,999 for women (94 | 18.1%).
| Income | Male | Female |
| $2,499 or less | 29 (4.7%) | 71 (13.7%) |
| $2,500 to $4,999 | 12 (1.9%) | 8 (1.5%) |
| $5,000 to $7,499 | 53 (8.6%) | 16 (3.1%) |
| $7,500 to $9,999 | 0 (0.0%) | 6 (1.1%) |
| $10,000 to $12,499 | 10 (1.6%) | 24 (4.6%) |
| $12,500 to $14,999 | 0 (0.0%) | 0 (0.0%) |
| $15,000 to $17,499 | 27 (4.4%) | 0 (0.0%) |
| $17,500 to $19,999 | 0 (0.0%) | 19 (3.6%) |
| $20,000 to $22,499 | 0 (0.0%) | 23 (4.4%) |
| $22,500 to $24,999 | 0 (0.0%) | 94 (18.1%) |
| $25,000 to $29,999 | 57 (9.3%) | 16 (3.1%) |
| $30,000 to $34,999 | 10 (1.6%) | 47 (9.0%) |
| $35,000 to $39,999 | 46 (7.5%) | 26 (5.0%) |
| $40,000 to $44,999 | 0 (0.0%) | 36 (6.9%) |
| $45,000 to $49,999 | 33 (5.4%) | 41 (7.9%) |
| $50,000 to $54,999 | 11 (1.8%) | 40 (7.7%) |
| $55,000 to $64,999 | 157 (25.5%) | 10 (1.9%) |
| $65,000 to $74,999 | 17 (2.8%) | 6 (1.1%) |
| $75,000 to $99,999 | 131 (21.3%) | 18 (3.5%) |
| $100,000+ | 22 (3.6%) | 19 (3.6%) |
| Total | 615 (100.0%) | 520 (100.0%) |
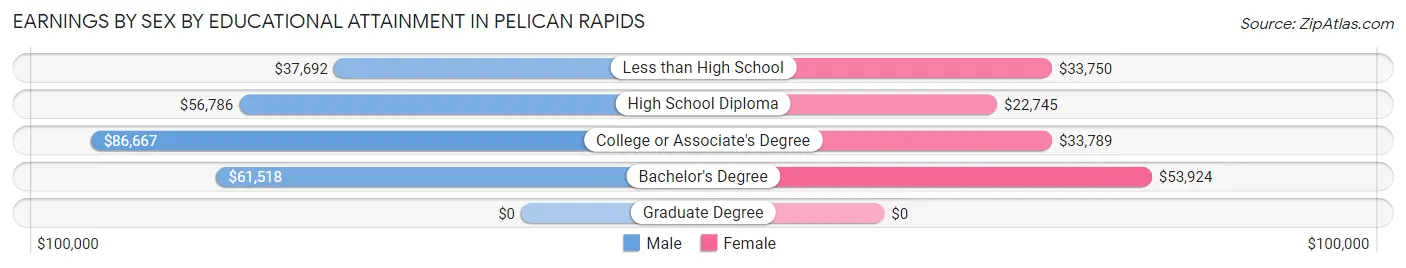
Earnings by Sex by Educational Attainment in Pelican Rapids
Average earnings in Pelican Rapids are $56,633 for men and $32,625 for women, a difference of 42.4%. Men with an educational attainment of college or associate's degree enjoy the highest average annual earnings of $86,667, while those with less than high school education earn the least with $37,692. Women with an educational attainment of bachelor's degree earn the most with the average annual earnings of $53,924, while those with high school diploma education have the smallest earnings of $22,745.
| Educational Attainment | Male Income | Female Income |
| Less than High School | $37,692 | $33,750 |
| High School Diploma | $56,786 | $22,745 |
| College or Associate's Degree | $86,667 | $33,789 |
| Bachelor's Degree | $61,518 | $53,924 |
| Graduate Degree | - | - |
| Total | $56,633 | $32,625 |
Family Income in Pelican Rapids
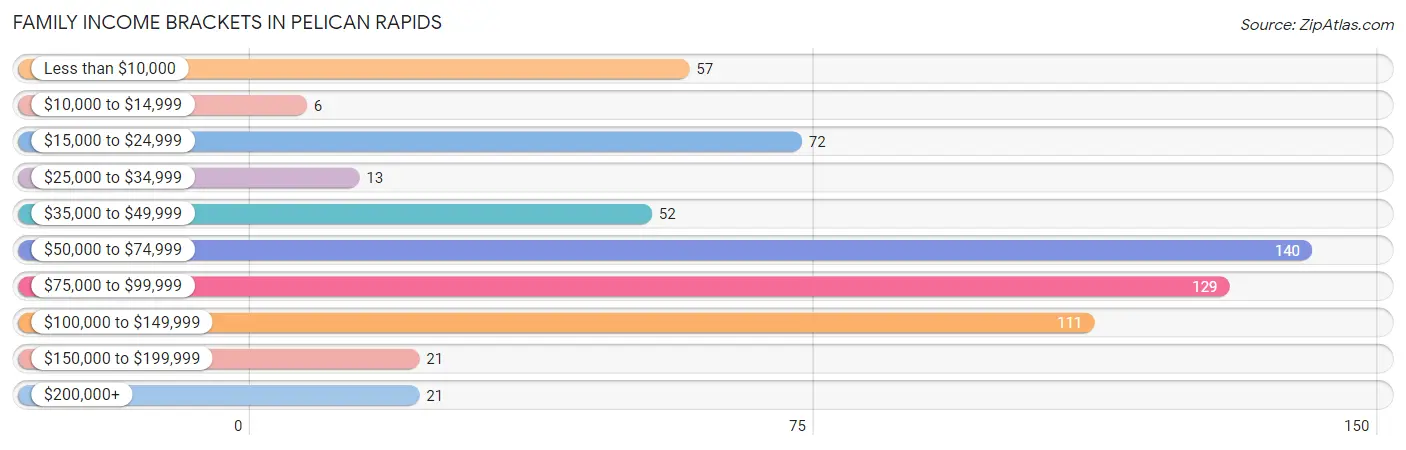
Family Income Brackets in Pelican Rapids
According to the Pelican Rapids family income data, there are 140 families falling into the $50,000 to $74,999 income range, which is the most common income bracket and makes up 22.5% of all families. Conversely, the $10,000 to $14,999 income bracket is the least frequent group with only 6 families (1.0%) belonging to this category.
| Income Bracket | # Families | % Families |
| Less than $10,000 | 57 | 9.2% |
| $10,000 to $14,999 | 6 | 1.0% |
| $15,000 to $24,999 | 72 | 11.6% |
| $25,000 to $34,999 | 13 | 2.1% |
| $35,000 to $49,999 | 52 | 8.4% |
| $50,000 to $74,999 | 140 | 22.5% |
| $75,000 to $99,999 | 129 | 20.7% |
| $100,000 to $149,999 | 111 | 17.8% |
| $150,000 to $199,999 | 21 | 3.4% |
| $200,000+ | 21 | 3.4% |
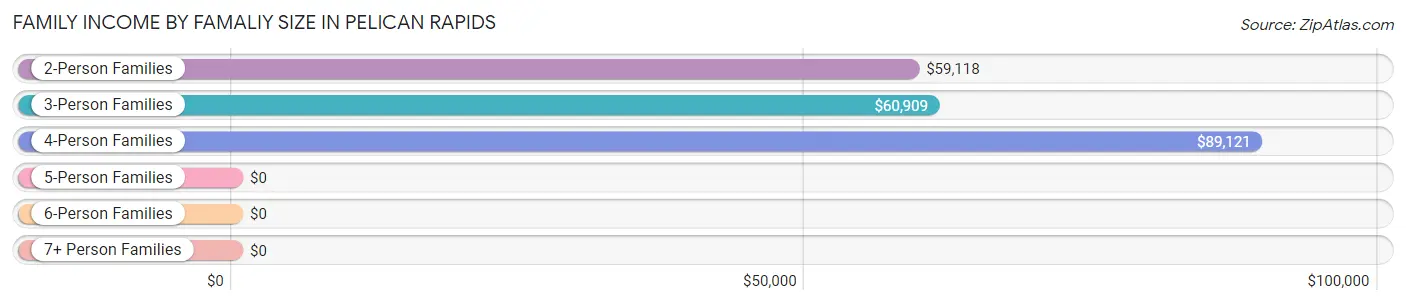
Family Income by Famaliy Size in Pelican Rapids
4-person families (123 | 19.8%) account for the highest median family income in Pelican Rapids with $89,121 per family, while 2-person families (212 | 34.1%) have the highest median income of $29,559 per family member.
| Income Bracket | # Families | Median Income |
| 2-Person Families | 212 (34.1%) | $59,118 |
| 3-Person Families | 142 (22.8%) | $60,909 |
| 4-Person Families | 123 (19.8%) | $89,121 |
| 5-Person Families | 33 (5.3%) | $0 |
| 6-Person Families | 9 (1.5%) | $0 |
| 7+ Person Families | 103 (16.6%) | $0 |
| Total | 622 (100.0%) | $65,556 |
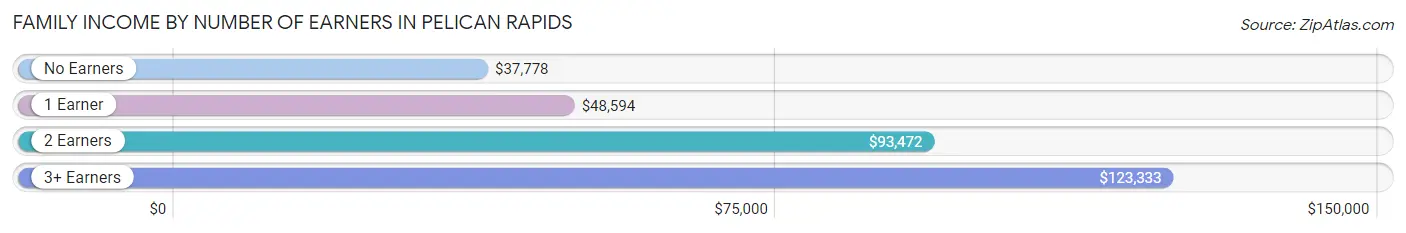
Family Income by Number of Earners in Pelican Rapids
The median family income in Pelican Rapids is $65,556, with families comprising 3+ earners (84) having the highest median family income of $123,333, while families with no earners (60) have the lowest median family income of $37,778, accounting for 13.5% and 9.7% of families, respectively.
| Number of Earners | # Families | Median Income |
| No Earners | 60 (9.7%) | $37,778 |
| 1 Earner | 277 (44.5%) | $48,594 |
| 2 Earners | 201 (32.3%) | $93,472 |
| 3+ Earners | 84 (13.5%) | $123,333 |
| Total | 622 (100.0%) | $65,556 |
Household Income in Pelican Rapids
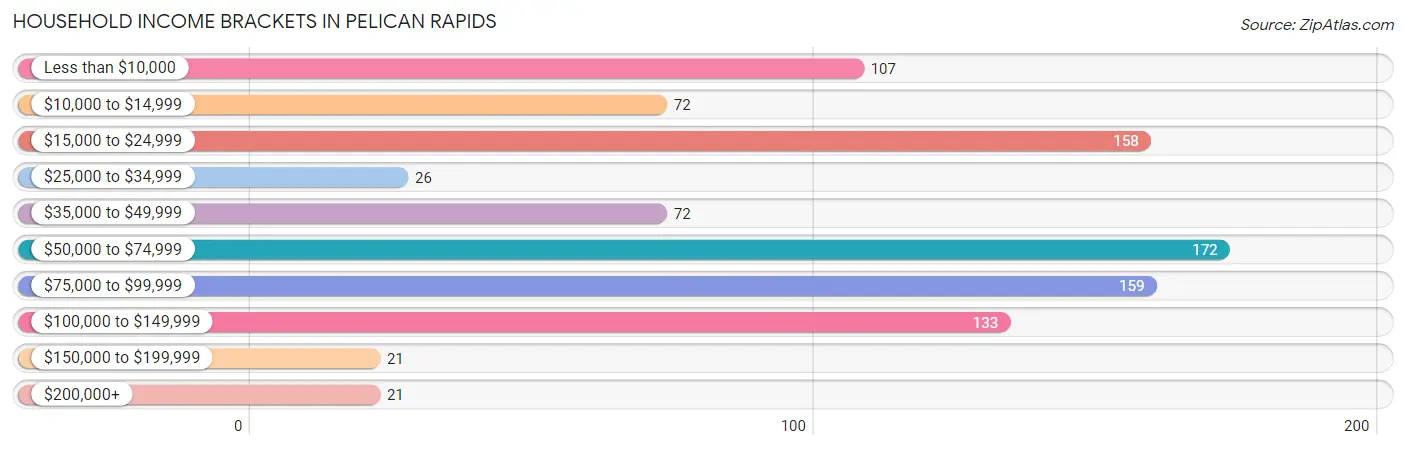
Household Income Brackets in Pelican Rapids
With 172 households falling in the category, the $50,000 to $74,999 income range is the most frequent in Pelican Rapids, accounting for 18.3% of all households. In contrast, only 21 households (2.2%) fall into the $150,000 to $199,999 income bracket, making it the least populous group.
| Income Bracket | # Households | % Households |
| Less than $10,000 | 107 | 11.4% |
| $10,000 to $14,999 | 72 | 7.7% |
| $15,000 to $24,999 | 158 | 16.8% |
| $25,000 to $34,999 | 26 | 2.8% |
| $35,000 to $49,999 | 72 | 7.7% |
| $50,000 to $74,999 | 172 | 18.3% |
| $75,000 to $99,999 | 159 | 16.9% |
| $100,000 to $149,999 | 133 | 14.1% |
| $150,000 to $199,999 | 21 | 2.2% |
| $200,000+ | 21 | 2.2% |
Household Income by Householder Age in Pelican Rapids
The median household income in Pelican Rapids is $56,477, with the highest median household income of $85,347 found in the 25 to 44 years age bracket for the primary householder. A total of 361 households (38.4%) fall into this category. Meanwhile, the 15 to 24 years age bracket for the primary householder has the lowest median household income of $0, with 45 households (4.8%) in this group.
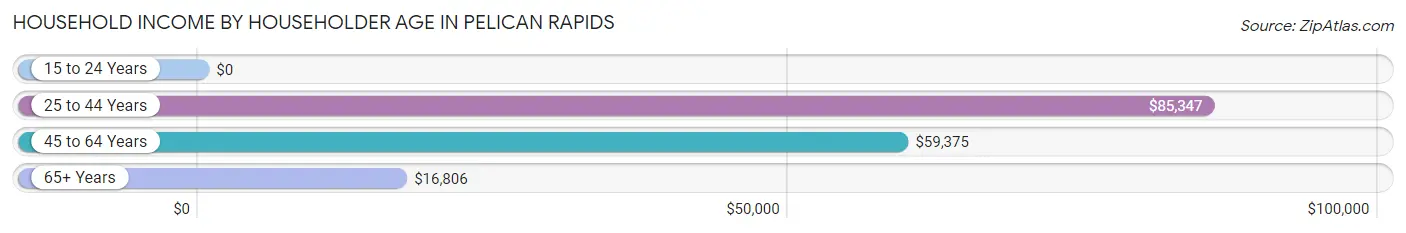
| Income Bracket | # Households | Median Income |
| 15 to 24 Years | 45 (4.8%) | $0 |
| 25 to 44 Years | 361 (38.4%) | $85,347 |
| 45 to 64 Years | 295 (31.4%) | $59,375 |
| 65+ Years | 240 (25.5%) | $16,806 |
| Total | 941 (100.0%) | $56,477 |
Poverty in Pelican Rapids
Income Below Poverty by Sex and Age in Pelican Rapids
With 15.9% poverty level for males and 36.2% for females among the residents of Pelican Rapids, 12 to 14 year old males and 12 to 14 year old females are the most vulnerable to poverty, with 62 males (78.5%) and 56 females (75.7%) in their respective age groups living below the poverty level.
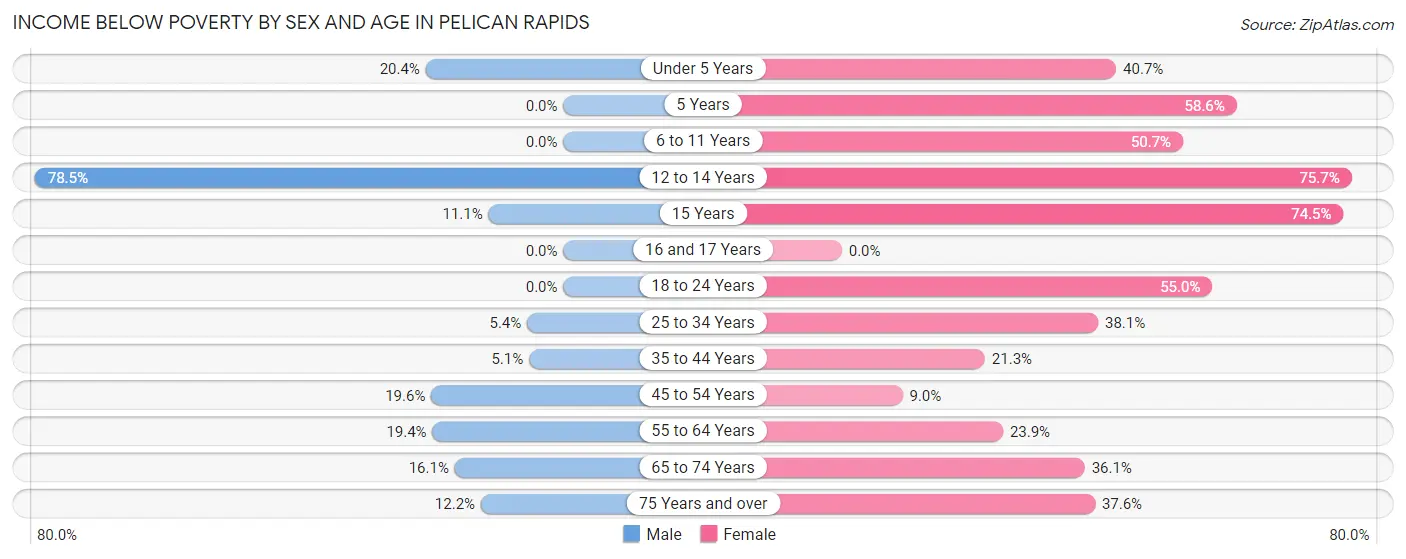
| Age Bracket | Male | Female |
| Under 5 Years | 37 (20.4%) | 44 (40.7%) |
| 5 Years | 0 (0.0%) | 51 (58.6%) |
| 6 to 11 Years | 0 (0.0%) | 39 (50.6%) |
| 12 to 14 Years | 62 (78.5%) | 56 (75.7%) |
| 15 Years | 5 (11.1%) | 35 (74.5%) |
| 16 and 17 Years | 0 (0.0%) | 0 (0.0%) |
| 18 to 24 Years | 0 (0.0%) | 33 (55.0%) |
| 25 to 34 Years | 5 (5.4%) | 43 (38.1%) |
| 35 to 44 Years | 11 (5.1%) | 51 (21.2%) |
| 45 to 54 Years | 31 (19.6%) | 12 (9.0%) |
| 55 to 64 Years | 21 (19.4%) | 28 (23.9%) |
| 65 to 74 Years | 15 (16.1%) | 22 (36.1%) |
| 75 Years and over | 6 (12.2%) | 53 (37.6%) |
| Total | 193 (15.9%) | 467 (36.2%) |
Income Above Poverty by Sex and Age in Pelican Rapids
According to the poverty statistics in Pelican Rapids, males aged 5 years and females aged 16 and 17 years are the age groups that are most secure financially, with 100.0% of males and 100.0% of females in these age groups living above the poverty line.
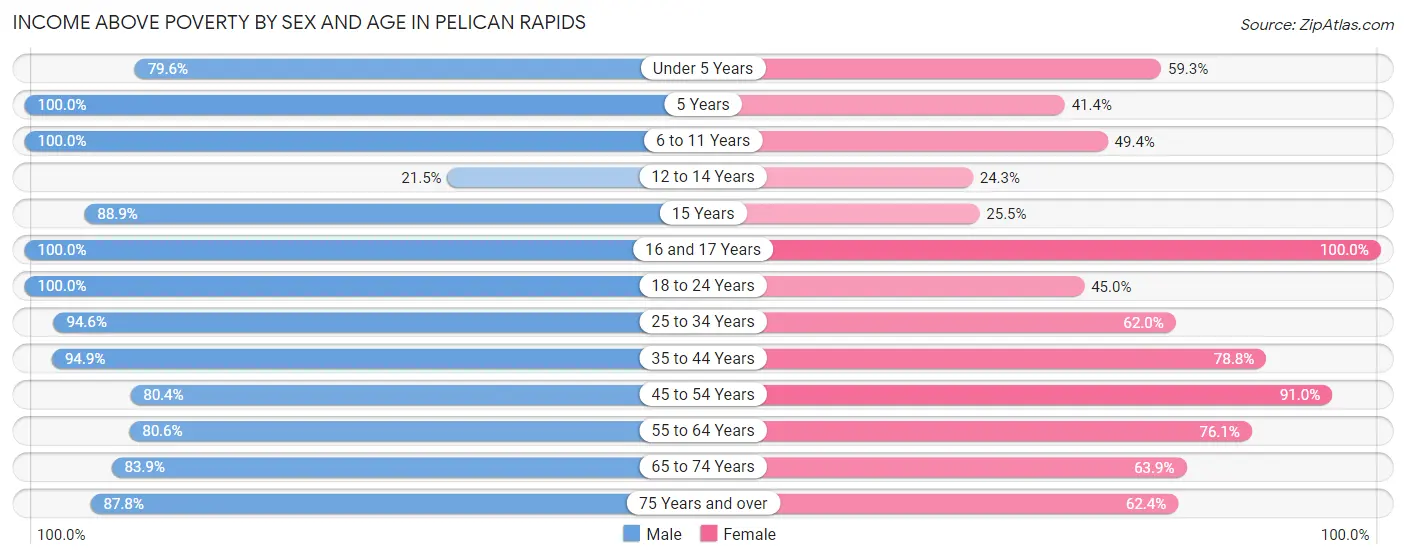
| Age Bracket | Male | Female |
| Under 5 Years | 144 (79.6%) | 64 (59.3%) |
| 5 Years | 12 (100.0%) | 36 (41.4%) |
| 6 to 11 Years | 59 (100.0%) | 38 (49.3%) |
| 12 to 14 Years | 17 (21.5%) | 18 (24.3%) |
| 15 Years | 40 (88.9%) | 12 (25.5%) |
| 16 and 17 Years | 14 (100.0%) | 31 (100.0%) |
| 18 to 24 Years | 106 (100.0%) | 27 (45.0%) |
| 25 to 34 Years | 88 (94.6%) | 70 (62.0%) |
| 35 to 44 Years | 205 (94.9%) | 189 (78.7%) |
| 45 to 54 Years | 127 (80.4%) | 121 (91.0%) |
| 55 to 64 Years | 87 (80.6%) | 89 (76.1%) |
| 65 to 74 Years | 78 (83.9%) | 39 (63.9%) |
| 75 Years and over | 43 (87.8%) | 88 (62.4%) |
| Total | 1,020 (84.1%) | 822 (63.8%) |
Income Below Poverty Among Married-Couple Families in Pelican Rapids
The poverty statistics for married-couple families in Pelican Rapids show that 7.4% or 35 of the total 472 families live below the poverty line. Families with 1 or 2 children have the highest poverty rate of 8.7%, comprising of 21 families. On the other hand, families with 3 or 4 children have the lowest poverty rate of 0.0%, which includes 0 families.
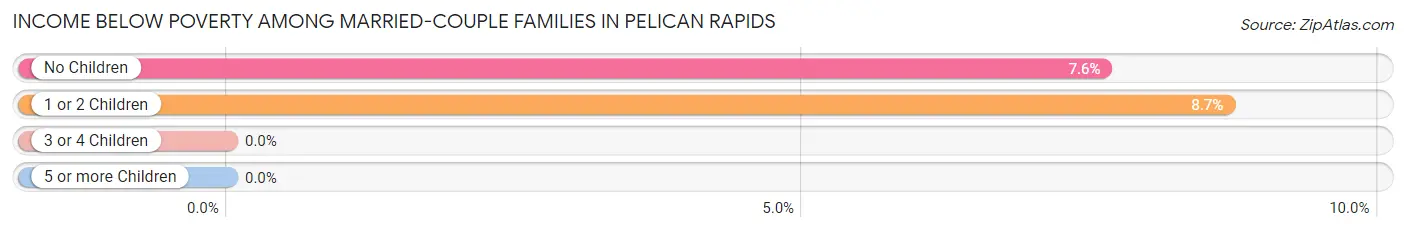
| Children | Above Poverty | Below Poverty |
| No Children | 170 (92.4%) | 14 (7.6%) |
| 1 or 2 Children | 221 (91.3%) | 21 (8.7%) |
| 3 or 4 Children | 27 (100.0%) | 0 (0.0%) |
| 5 or more Children | 19 (100.0%) | 0 (0.0%) |
| Total | 437 (92.6%) | 35 (7.4%) |
Income Below Poverty Among Single-Parent Households in Pelican Rapids
According to the poverty data in Pelican Rapids, 28.6% or 6 single-father households and 72.9% or 94 single-mother households are living below the poverty line. Among single-father households, those with no children have the highest poverty rate, with 6 households (100.0%) experiencing poverty. Likewise, among single-mother households, those with 5 or more children have the highest poverty rate, with 51 households (100.0%) falling below the poverty line.
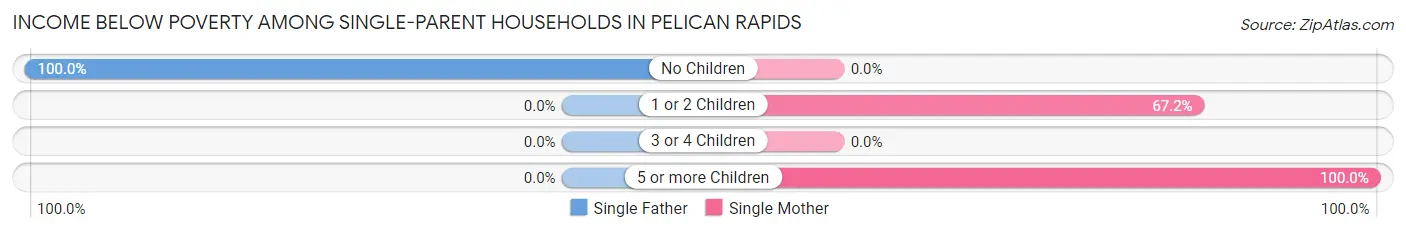
| Children | Single Father | Single Mother |
| No Children | 6 (100.0%) | 0 (0.0%) |
| 1 or 2 Children | 0 (0.0%) | 43 (67.2%) |
| 3 or 4 Children | 0 (0.0%) | 0 (0.0%) |
| 5 or more Children | 0 (0.0%) | 51 (100.0%) |
| Total | 6 (28.6%) | 94 (72.9%) |
Income Below Poverty Among Married-Couple vs Single-Parent Households in Pelican Rapids
The poverty data for Pelican Rapids shows that 35 of the married-couple family households (7.4%) and 100 of the single-parent households (66.7%) are living below the poverty level. Within the married-couple family households, those with 1 or 2 children have the highest poverty rate, with 21 households (8.7%) falling below the poverty line. Among the single-parent households, those with 5 or more children have the highest poverty rate, with 51 household (100.0%) living below poverty.
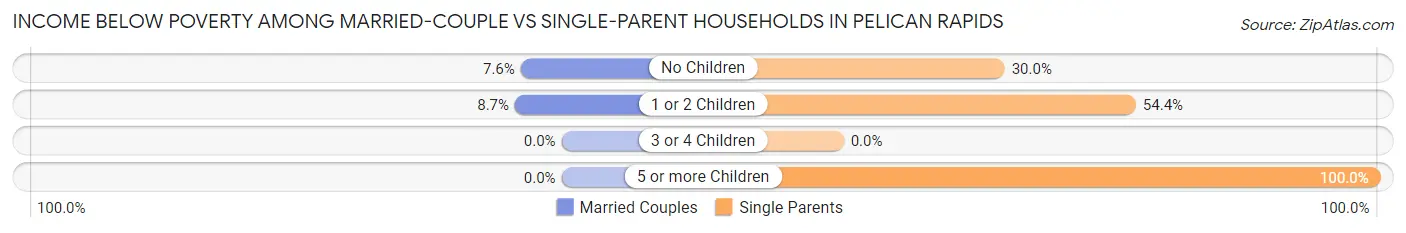
| Children | Married-Couple Families | Single-Parent Households |
| No Children | 14 (7.6%) | 6 (30.0%) |
| 1 or 2 Children | 21 (8.7%) | 43 (54.4%) |
| 3 or 4 Children | 0 (0.0%) | 0 (0.0%) |
| 5 or more Children | 0 (0.0%) | 51 (100.0%) |
| Total | 35 (7.4%) | 100 (66.7%) |
Race in Pelican Rapids
The most populous races in Pelican Rapids are White / Caucasian (1,845 | 71.3%), Hispanic or Latino (937 | 36.2%), and Some other Race (406 | 15.7%).
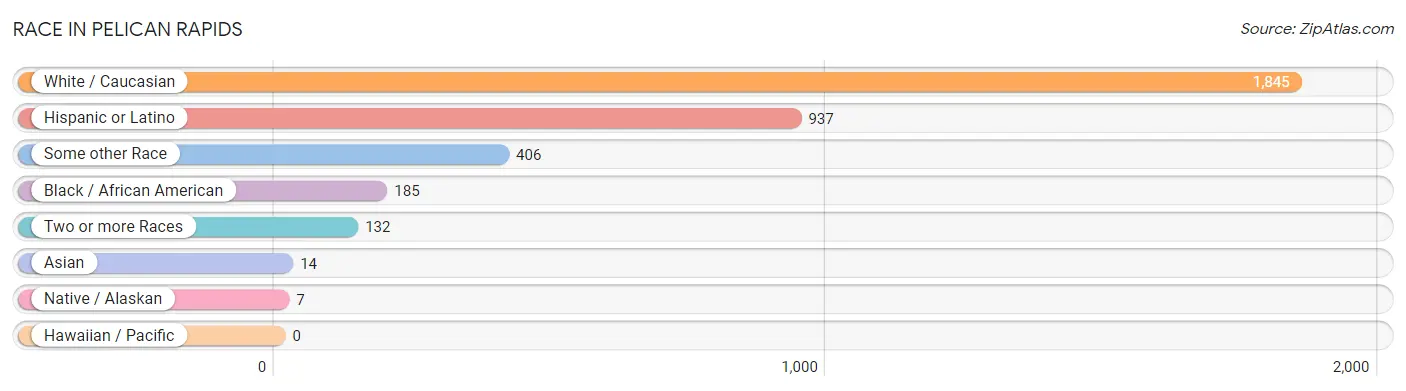
| Race | # Population | % Population |
| Asian | 14 | 0.5% |
| Black / African American | 185 | 7.1% |
| Hawaiian / Pacific | 0 | 0.0% |
| Hispanic or Latino | 937 | 36.2% |
| Native / Alaskan | 7 | 0.3% |
| White / Caucasian | 1,845 | 71.3% |
| Two or more Races | 132 | 5.1% |
| Some other Race | 406 | 15.7% |
| Total | 2,589 | 100.0% |
Ancestry in Pelican Rapids
The most populous ancestries reported in Pelican Rapids are Mexican (855 | 33.0%), Norwegian (558 | 21.5%), German (471 | 18.2%), Irish (257 | 9.9%), and Somali (188 | 7.3%), together accounting for 89.9% of all Pelican Rapids residents.
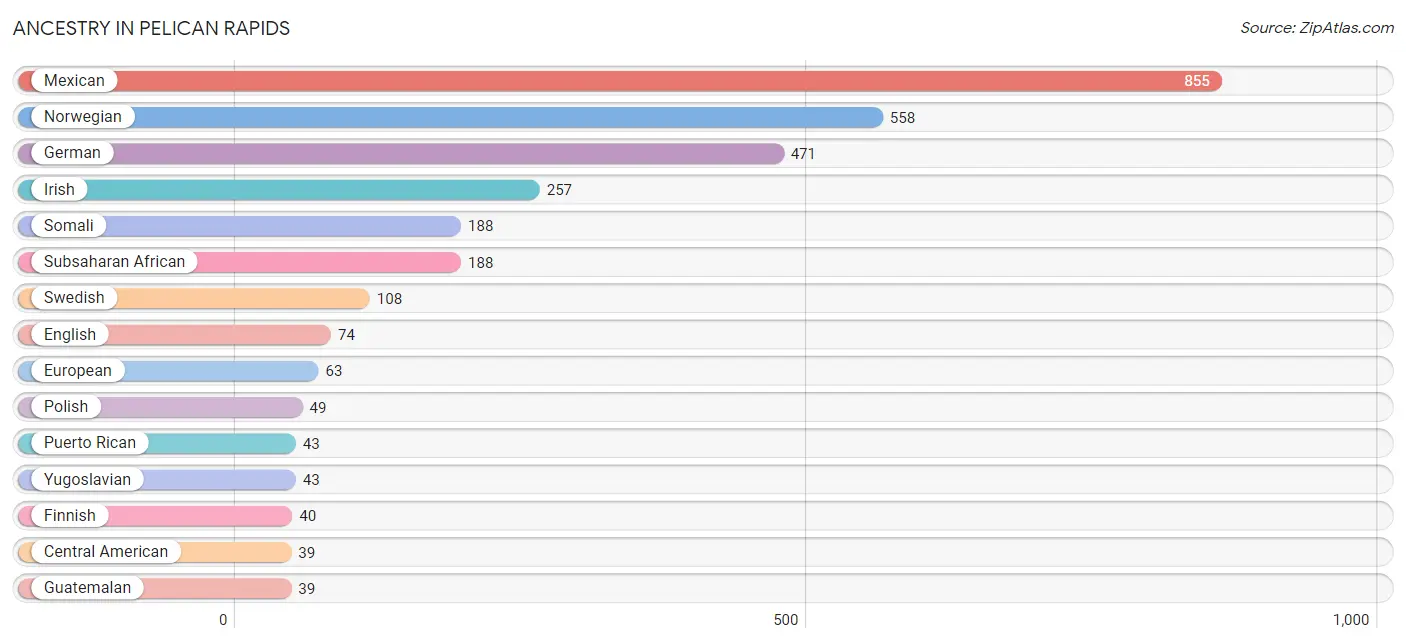
| Ancestry | # Population | % Population |
| American | 29 | 1.1% |
| British | 6 | 0.2% |
| Central American | 39 | 1.5% |
| Central American Indian | 14 | 0.5% |
| Chippewa | 32 | 1.2% |
| Danish | 7 | 0.3% |
| Dutch | 3 | 0.1% |
| English | 74 | 2.9% |
| European | 63 | 2.4% |
| Finnish | 40 | 1.5% |
| French | 25 | 1.0% |
| French Canadian | 5 | 0.2% |
| German | 471 | 18.2% |
| Guatemalan | 39 | 1.5% |
| Hungarian | 5 | 0.2% |
| Irish | 257 | 9.9% |
| Italian | 37 | 1.4% |
| Japanese | 14 | 0.5% |
| Korean | 8 | 0.3% |
| Mexican | 855 | 33.0% |
| Norwegian | 558 | 21.5% |
| Polish | 49 | 1.9% |
| Portuguese | 14 | 0.5% |
| Puerto Rican | 43 | 1.7% |
| Scandinavian | 32 | 1.2% |
| Scottish | 11 | 0.4% |
| Somali | 188 | 7.3% |
| Subsaharan African | 188 | 7.3% |
| Swedish | 108 | 4.2% |
| Yugoslavian | 43 | 1.7% | View All 30 Rows |
Immigrants in Pelican Rapids
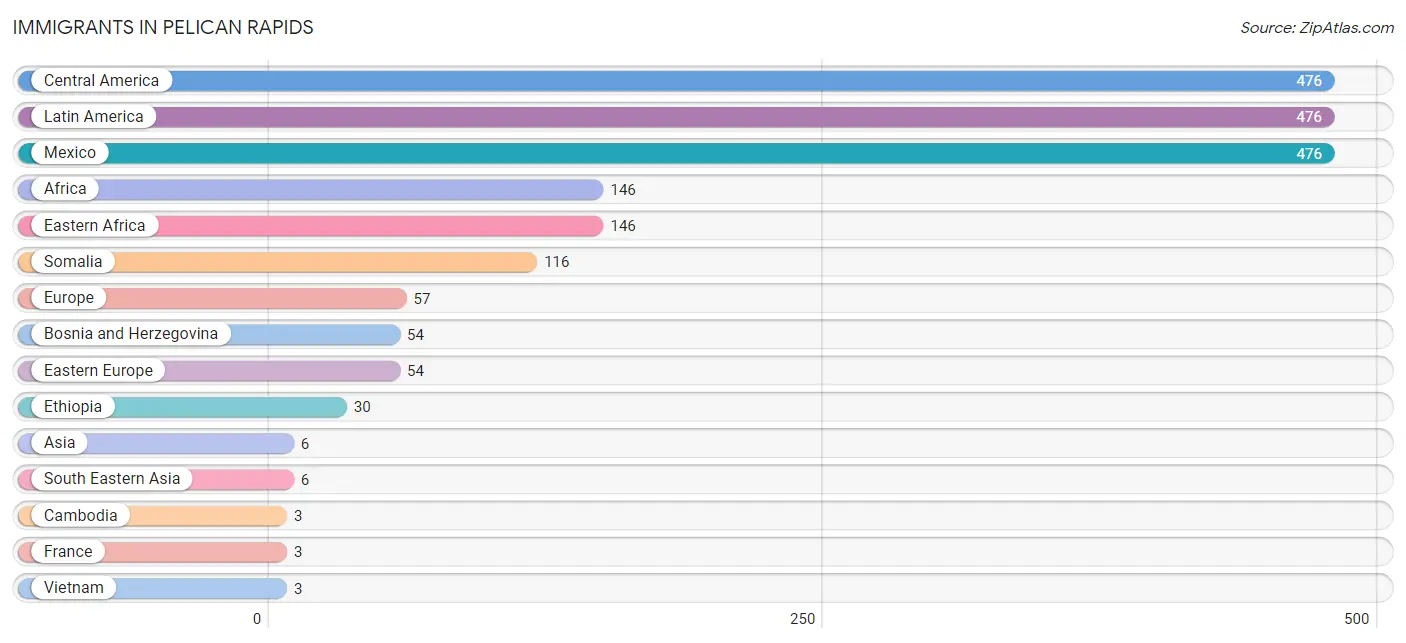
The most numerous immigrant groups reported in Pelican Rapids came from Central America (476 | 18.4%), Latin America (476 | 18.4%), Mexico (476 | 18.4%), Africa (146 | 5.6%), and Eastern Africa (146 | 5.6%), together accounting for 66.5% of all Pelican Rapids residents.
| Immigration Origin | # Population | % Population |
| Africa | 146 | 5.6% |
| Asia | 6 | 0.2% |
| Bosnia and Herzegovina | 54 | 2.1% |
| Cambodia | 3 | 0.1% |
| Central America | 476 | 18.4% |
| Eastern Africa | 146 | 5.6% |
| Eastern Europe | 54 | 2.1% |
| Ethiopia | 30 | 1.2% |
| Europe | 57 | 2.2% |
| France | 3 | 0.1% |
| Latin America | 476 | 18.4% |
| Mexico | 476 | 18.4% |
| Somalia | 116 | 4.5% |
| South Eastern Asia | 6 | 0.2% |
| Vietnam | 3 | 0.1% |
| Western Europe | 3 | 0.1% | View All 16 Rows |
Sex and Age in Pelican Rapids
Sex and Age in Pelican Rapids
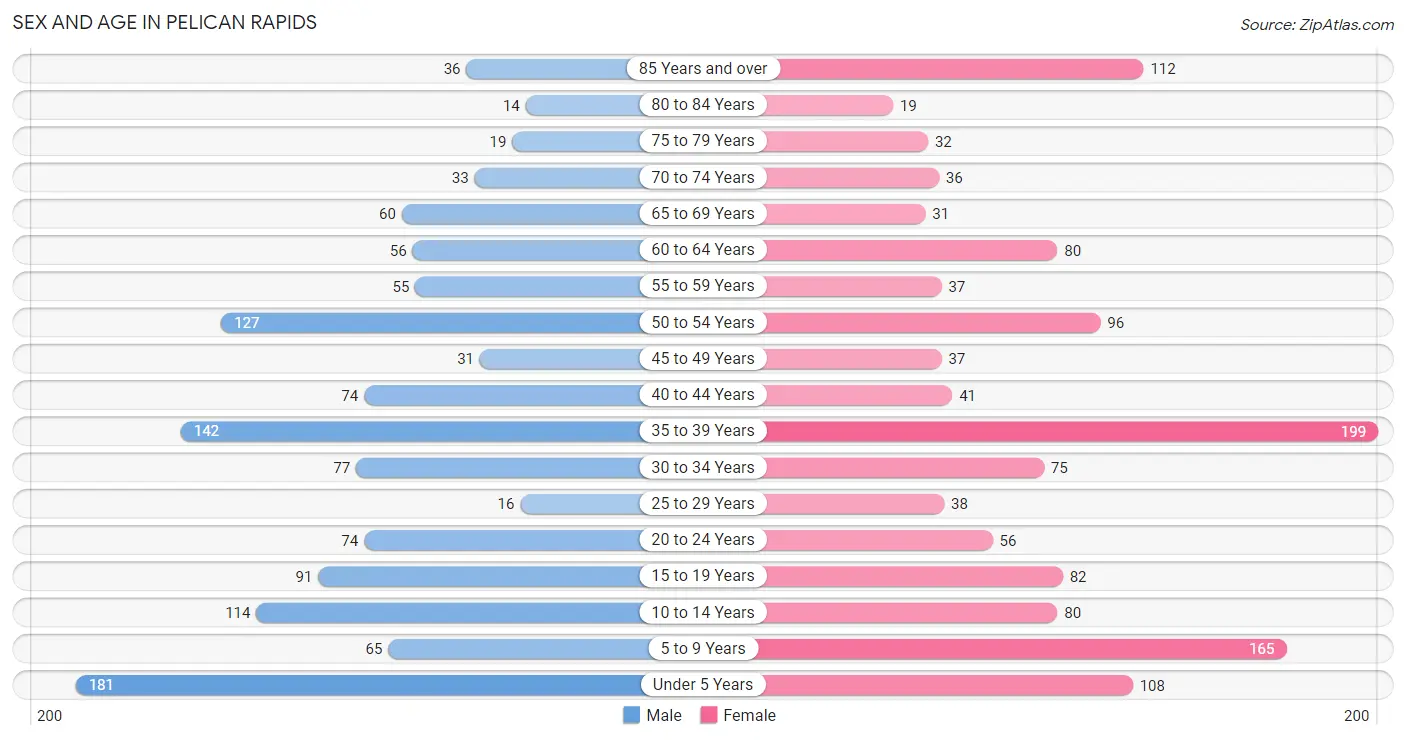
The most populous age groups in Pelican Rapids are Under 5 Years (181 | 14.3%) for men and 35 to 39 Years (199 | 15.0%) for women.
| Age Bracket | Male | Female |
| Under 5 Years | 181 (14.3%) | 108 (8.2%) |
| 5 to 9 Years | 65 (5.1%) | 165 (12.5%) |
| 10 to 14 Years | 114 (9.0%) | 80 (6.0%) |
| 15 to 19 Years | 91 (7.2%) | 82 (6.2%) |
| 20 to 24 Years | 74 (5.9%) | 56 (4.2%) |
| 25 to 29 Years | 16 (1.3%) | 38 (2.9%) |
| 30 to 34 Years | 77 (6.1%) | 75 (5.7%) |
| 35 to 39 Years | 142 (11.2%) | 199 (15.0%) |
| 40 to 44 Years | 74 (5.9%) | 41 (3.1%) |
| 45 to 49 Years | 31 (2.5%) | 37 (2.8%) |
| 50 to 54 Years | 127 (10.0%) | 96 (7.2%) |
| 55 to 59 Years | 55 (4.3%) | 37 (2.8%) |
| 60 to 64 Years | 56 (4.4%) | 80 (6.0%) |
| 65 to 69 Years | 60 (4.7%) | 31 (2.3%) |
| 70 to 74 Years | 33 (2.6%) | 36 (2.7%) |
| 75 to 79 Years | 19 (1.5%) | 32 (2.4%) |
| 80 to 84 Years | 14 (1.1%) | 19 (1.4%) |
| 85 Years and over | 36 (2.9%) | 112 (8.5%) |
| Total | 1,265 (100.0%) | 1,324 (100.0%) |
Families and Households in Pelican Rapids
Median Family Size in Pelican Rapids
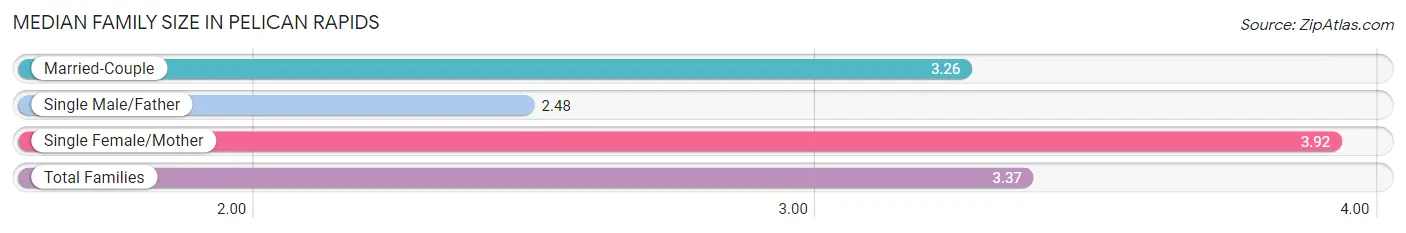
The median family size in Pelican Rapids is 3.37 persons per family, with single female/mother families (129 | 20.7%) accounting for the largest median family size of 3.92 persons per family. On the other hand, single male/father families (21 | 3.4%) represent the smallest median family size with 2.48 persons per family.
| Family Type | # Families | Family Size |
| Married-Couple | 472 (75.9%) | 3.26 |
| Single Male/Father | 21 (3.4%) | 2.48 |
| Single Female/Mother | 129 (20.7%) | 3.92 |
| Total Families | 622 (100.0%) | 3.37 |
Median Household Size in Pelican Rapids
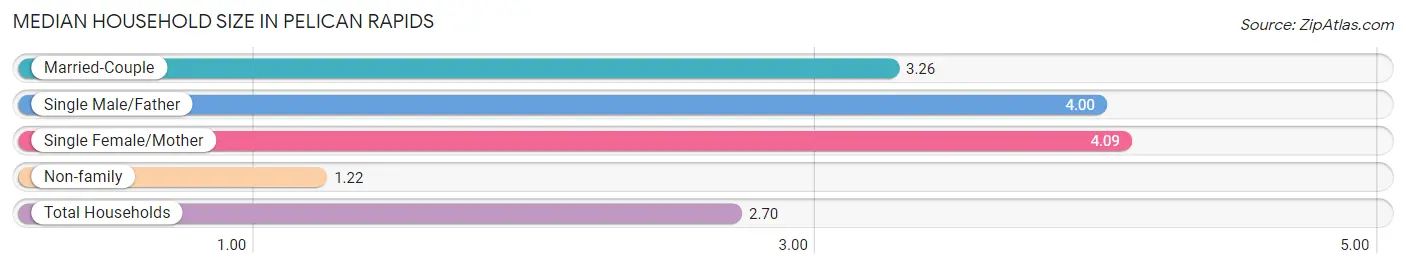
The median household size in Pelican Rapids is 2.70 persons per household, with single female/mother households (129 | 13.7%) accounting for the largest median household size of 4.09 persons per household. non-family households (319 | 33.9%) represent the smallest median household size with 1.22 persons per household.
| Household Type | # Households | Household Size |
| Married-Couple | 472 (50.2%) | 3.26 |
| Single Male/Father | 21 (2.2%) | 4.00 |
| Single Female/Mother | 129 (13.7%) | 4.09 |
| Non-family | 319 (33.9%) | 1.22 |
| Total Households | 941 (100.0%) | 2.70 |
Household Size by Marriage Status in Pelican Rapids
Out of a total of 941 households in Pelican Rapids, 622 (66.1%) are family households, while 319 (33.9%) are nonfamily households. The most numerous type of family households are 2-person households, comprising 201, and the most common type of nonfamily households are 1-person households, comprising 246.
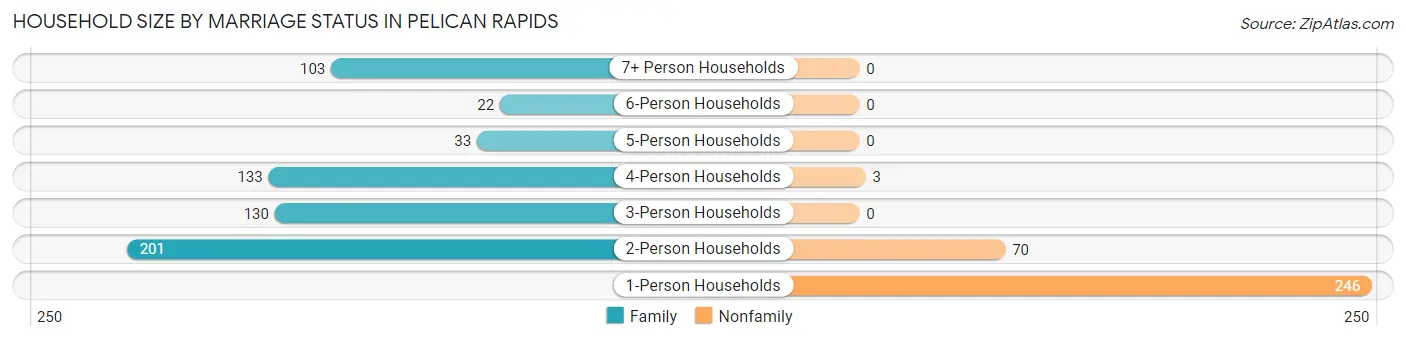
| Household Size | Family Households | Nonfamily Households |
| 1-Person Households | - | 246 (26.1%) |
| 2-Person Households | 201 (21.4%) | 70 (7.4%) |
| 3-Person Households | 130 (13.8%) | 0 (0.0%) |
| 4-Person Households | 133 (14.1%) | 3 (0.3%) |
| 5-Person Households | 33 (3.5%) | 0 (0.0%) |
| 6-Person Households | 22 (2.3%) | 0 (0.0%) |
| 7+ Person Households | 103 (11.0%) | 0 (0.0%) |
| Total | 622 (66.1%) | 319 (33.9%) |
Female Fertility in Pelican Rapids
Fertility by Age in Pelican Rapids
Average fertility rate in Pelican Rapids is 133.0 births per 1,000 women. Women in the age bracket of 20 to 34 years have the highest fertility rate with 254.0 births per 1,000 women. Women in the age bracket of 20 to 34 years acount for 60.6% of all women with births.
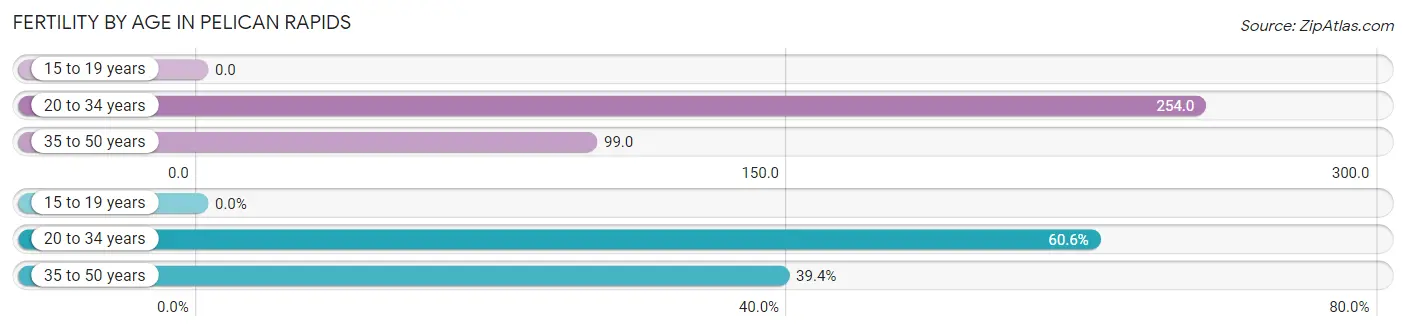
| Age Bracket | Women with Births | Births / 1,000 Women |
| 15 to 19 years | 0 (0.0%) | 0.0 |
| 20 to 34 years | 43 (60.6%) | 254.0 |
| 35 to 50 years | 28 (39.4%) | 99.0 |
| Total | 71 (100.0%) | 133.0 |
Fertility by Age by Marriage Status in Pelican Rapids
39.4% of women with births (71) in Pelican Rapids are married. The highest percentage of unmarried women with births falls into 20 to 34 years age bracket with 100.0% of them unmarried at the time of birth, while the lowest percentage of unmarried women with births belong to 35 to 50 years age bracket with 0.0% of them unmarried.
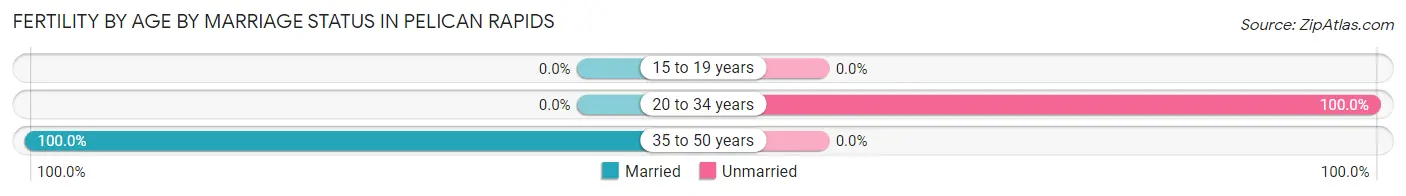
| Age Bracket | Married | Unmarried |
| 15 to 19 years | 0 (0.0%) | 0 (0.0%) |
| 20 to 34 years | 0 (0.0%) | 43 (100.0%) |
| 35 to 50 years | 28 (100.0%) | 0 (0.0%) |
| Total | 28 (39.4%) | 43 (60.6%) |
Fertility by Education in Pelican Rapids
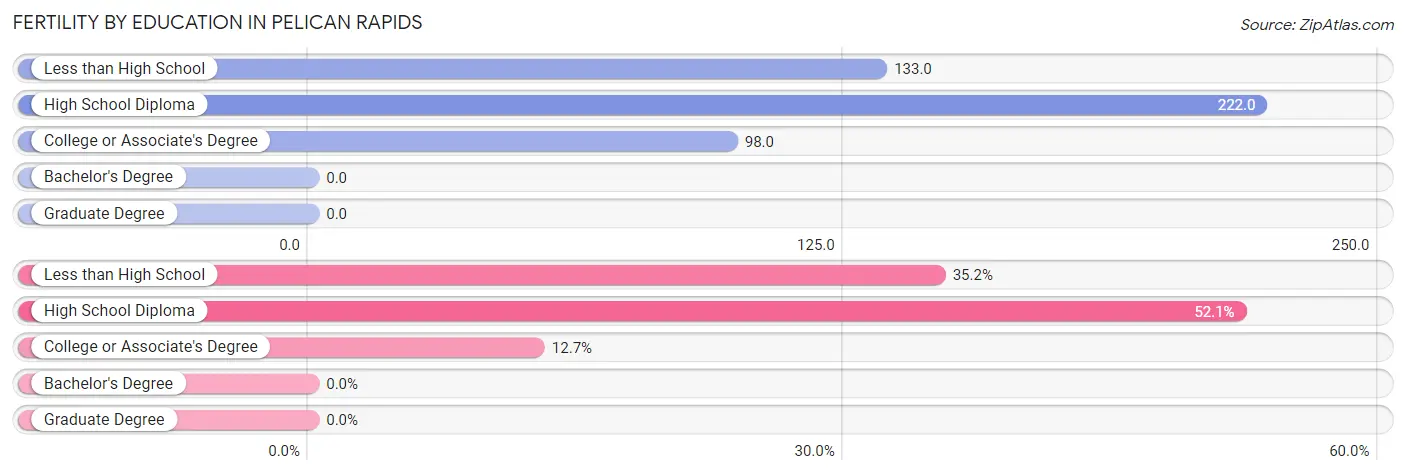
| Educational Attainment | Women with Births | Births / 1,000 Women |
| Less than High School | 25 (35.2%) | 133.0 |
| High School Diploma | 37 (52.1%) | 222.0 |
| College or Associate's Degree | 9 (12.7%) | 98.0 |
| Bachelor's Degree | 0 (0.0%) | 0.0 |
| Graduate Degree | 0 (0.0%) | 0.0 |
| Total | 71 (100.0%) | 133.0 |
Fertility by Education by Marriage Status in Pelican Rapids
60.6% of women with births in Pelican Rapids are unmarried. Women with the educational attainment of college or associate's degree are most likely to be married with 100.0% of them married at childbirth, while women with the educational attainment of high school diploma are least likely to be married with 81.1% of them unmarried at childbirth.
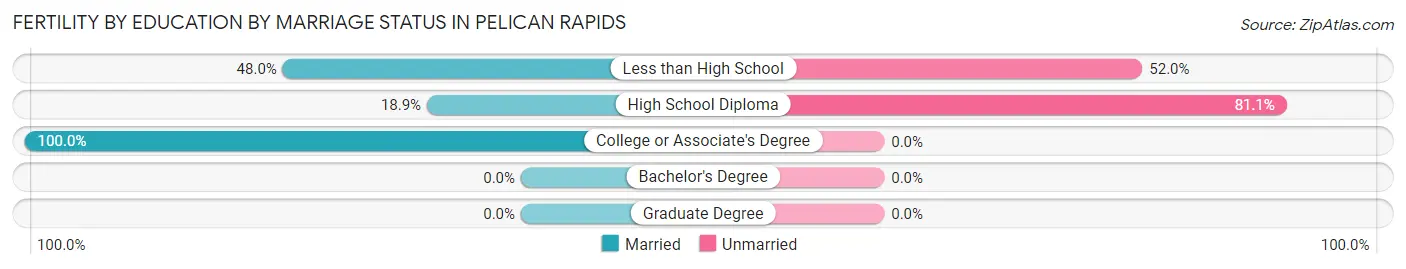
| Educational Attainment | Married | Unmarried |
| Less than High School | 12 (48.0%) | 13 (52.0%) |
| High School Diploma | 7 (18.9%) | 30 (81.1%) |
| College or Associate's Degree | 9 (100.0%) | 0 (0.0%) |
| Bachelor's Degree | 0 (0.0%) | 0 (0.0%) |
| Graduate Degree | 0 (0.0%) | 0 (0.0%) |
| Total | 28 (39.4%) | 43 (60.6%) |
Employment Characteristics in Pelican Rapids
Employment by Class of Employer in Pelican Rapids
Among the 1,013 employed individuals in Pelican Rapids, private company employees (812 | 80.2%), local government employees (53 | 5.2%), and self-employed (incorporated) (49 | 4.8%) make up the most common classes of employment.
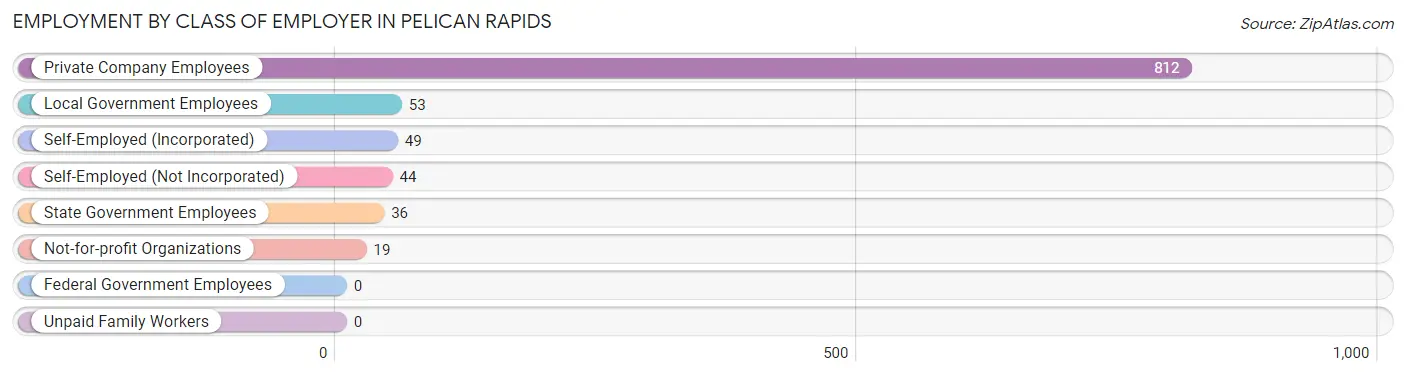
| Employer Class | # Employees | % Employees |
| Private Company Employees | 812 | 80.2% |
| Self-Employed (Incorporated) | 49 | 4.8% |
| Self-Employed (Not Incorporated) | 44 | 4.3% |
| Not-for-profit Organizations | 19 | 1.9% |
| Local Government Employees | 53 | 5.2% |
| State Government Employees | 36 | 3.5% |
| Federal Government Employees | 0 | 0.0% |
| Unpaid Family Workers | 0 | 0.0% |
| Total | 1,013 | 100.0% |
Employment Status by Age in Pelican Rapids
According to the labor force statistics for Pelican Rapids, out of the total population over 16 years of age (1,784), 58.7% or 1,047 individuals are in the labor force, with 2.8% or 29 of them unemployed. The age group with the highest labor force participation rate is 60 to 64 years, with 79.4% or 108 individuals in the labor force. Within the labor force, the 20 to 24 years age range has the highest percentage of unemployed individuals, with 30.5% or 29 of them being unemployed.
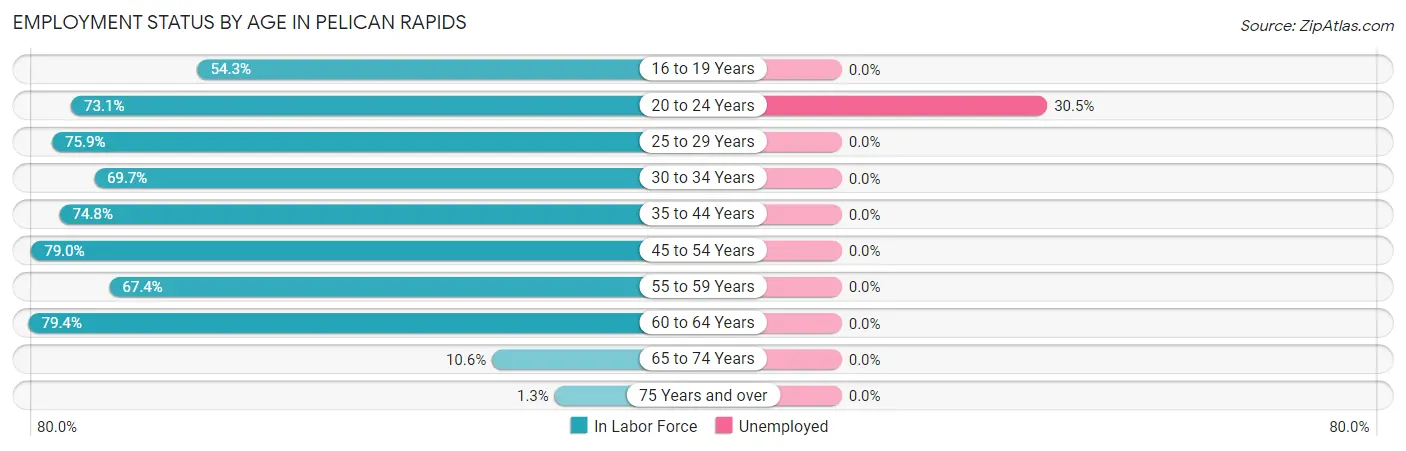
| Age Bracket | In Labor Force | Unemployed |
| 16 to 19 Years | 44 (54.3%) | 0 (0.0%) |
| 20 to 24 Years | 95 (73.1%) | 29 (30.5%) |
| 25 to 29 Years | 41 (75.9%) | 0 (0.0%) |
| 30 to 34 Years | 106 (69.7%) | 0 (0.0%) |
| 35 to 44 Years | 341 (74.8%) | 0 (0.0%) |
| 45 to 54 Years | 230 (79.0%) | 0 (0.0%) |
| 55 to 59 Years | 62 (67.4%) | 0 (0.0%) |
| 60 to 64 Years | 108 (79.4%) | 0 (0.0%) |
| 65 to 74 Years | 17 (10.6%) | 0 (0.0%) |
| 75 Years and over | 3 (1.3%) | 0 (0.0%) |
| Total | 1,047 (58.7%) | 29 (2.8%) |
Employment Status by Educational Attainment in Pelican Rapids
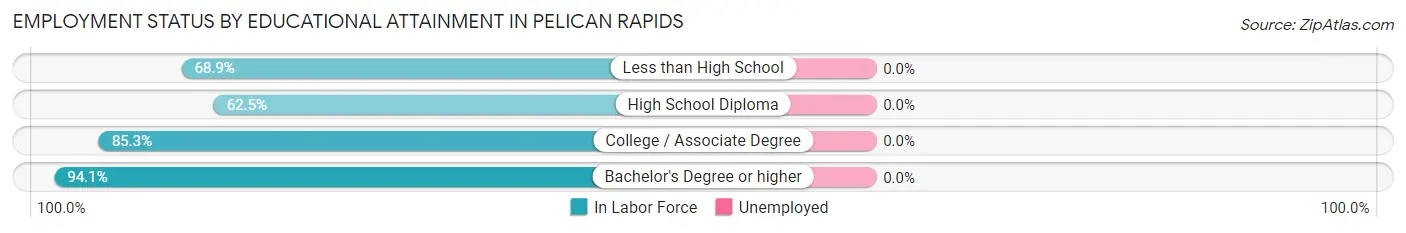
| Educational Attainment | In Labor Force | Unemployed |
| Less than High School | 255 (68.9%) | 0 (0.0%) |
| High School Diploma | 210 (62.5%) | 0 (0.0%) |
| College / Associate Degree | 232 (85.3%) | 0 (0.0%) |
| Bachelor's Degree or higher | 191 (94.1%) | 0 (0.0%) |
| Total | 888 (75.2%) | 0 (0.0%) |
Employment Occupations by Sex in Pelican Rapids
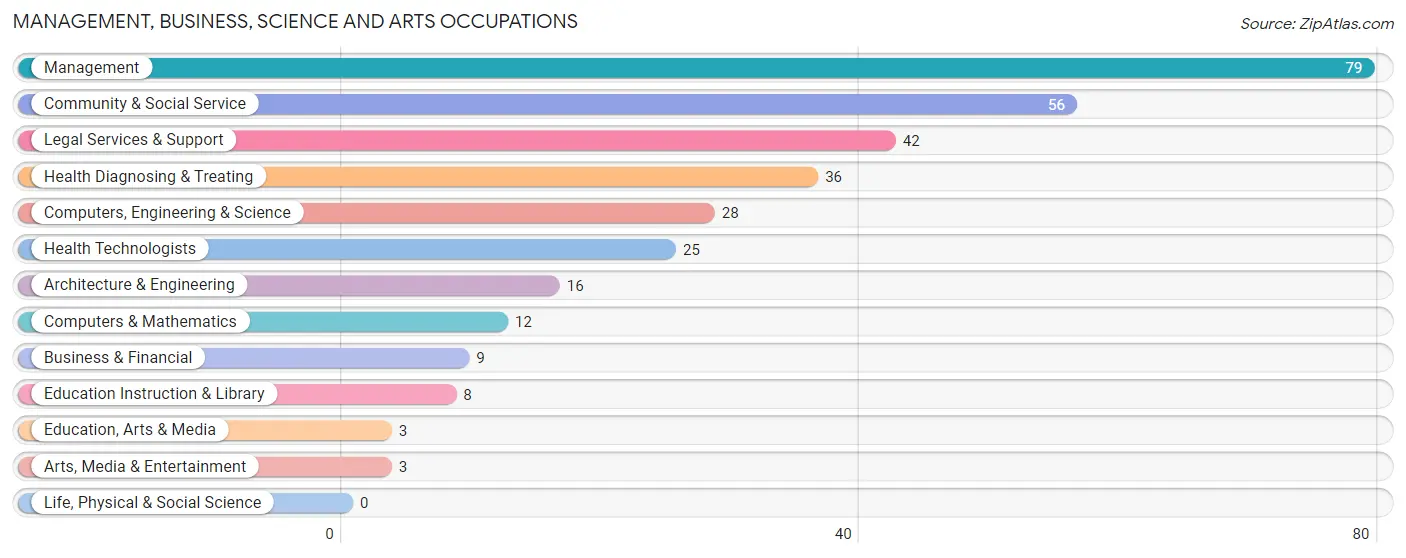
Management, Business, Science and Arts Occupations
The most common Management, Business, Science and Arts occupations in Pelican Rapids are Management (79 | 7.8%), Community & Social Service (56 | 5.5%), Legal Services & Support (42 | 4.1%), Health Diagnosing & Treating (36 | 3.5%), and Computers, Engineering & Science (28 | 2.8%).
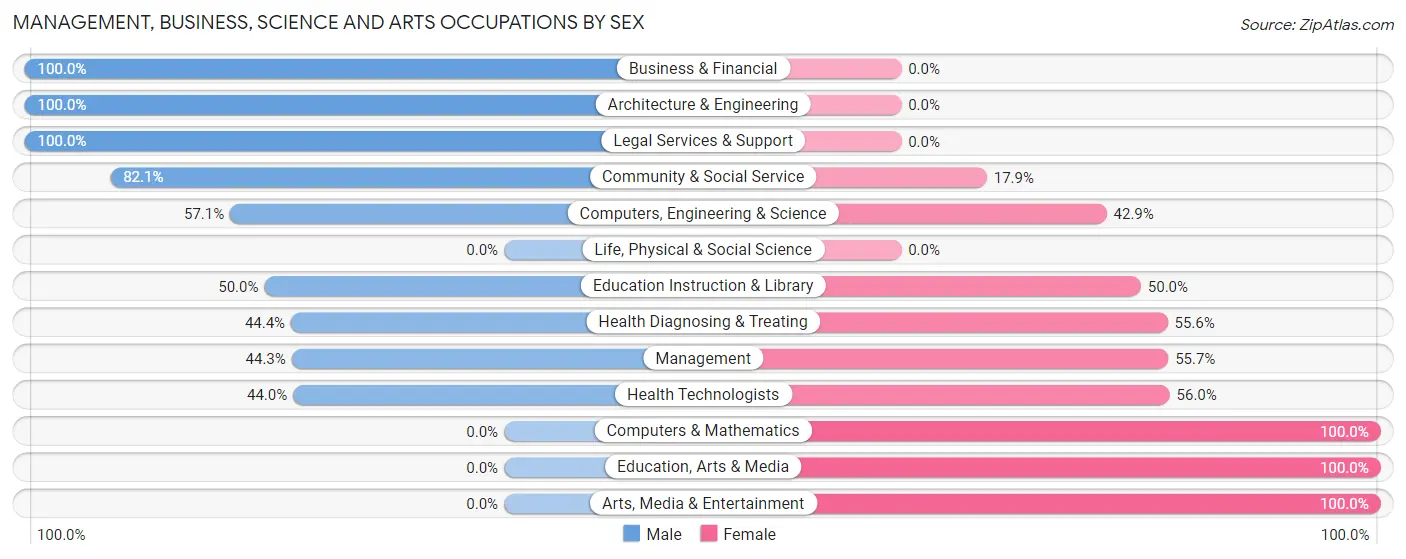
Management, Business, Science and Arts Occupations by Sex
Within the Management, Business, Science and Arts occupations in Pelican Rapids, the most male-oriented occupations are Business & Financial (100.0%), Architecture & Engineering (100.0%), and Legal Services & Support (100.0%), while the most female-oriented occupations are Computers & Mathematics (100.0%), Education, Arts & Media (100.0%), and Arts, Media & Entertainment (100.0%).
| Occupation | Male | Female |
| Management | 35 (44.3%) | 44 (55.7%) |
| Business & Financial | 9 (100.0%) | 0 (0.0%) |
| Computers, Engineering & Science | 16 (57.1%) | 12 (42.9%) |
| Computers & Mathematics | 0 (0.0%) | 12 (100.0%) |
| Architecture & Engineering | 16 (100.0%) | 0 (0.0%) |
| Life, Physical & Social Science | 0 (0.0%) | 0 (0.0%) |
| Community & Social Service | 46 (82.1%) | 10 (17.9%) |
| Education, Arts & Media | 0 (0.0%) | 3 (100.0%) |
| Legal Services & Support | 42 (100.0%) | 0 (0.0%) |
| Education Instruction & Library | 4 (50.0%) | 4 (50.0%) |
| Arts, Media & Entertainment | 0 (0.0%) | 3 (100.0%) |
| Health Diagnosing & Treating | 16 (44.4%) | 20 (55.6%) |
| Health Technologists | 11 (44.0%) | 14 (56.0%) |
| Total (Category) | 122 (58.7%) | 86 (41.3%) |
| Total (Overall) | 554 (54.4%) | 464 (45.6%) |
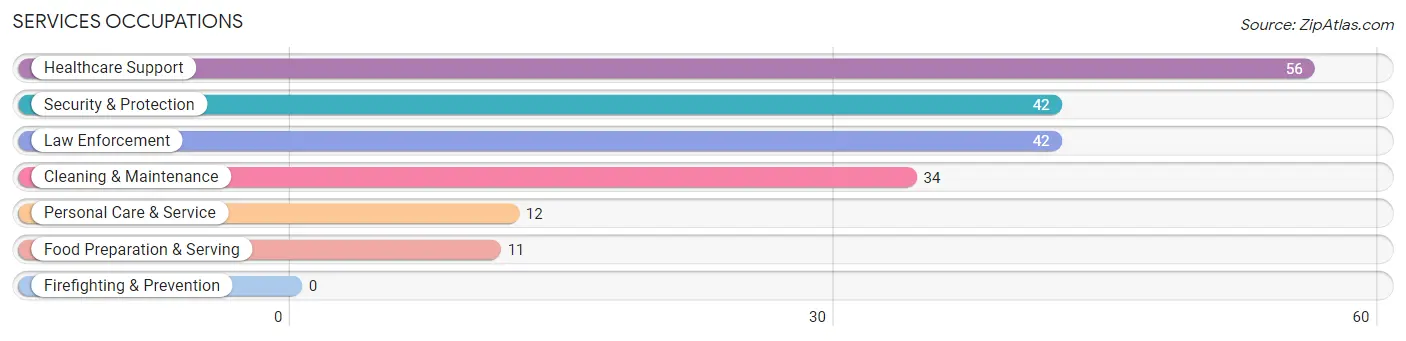
Services Occupations
The most common Services occupations in Pelican Rapids are Healthcare Support (56 | 5.5%), Security & Protection (42 | 4.1%), Law Enforcement (42 | 4.1%), Cleaning & Maintenance (34 | 3.3%), and Personal Care & Service (12 | 1.2%).
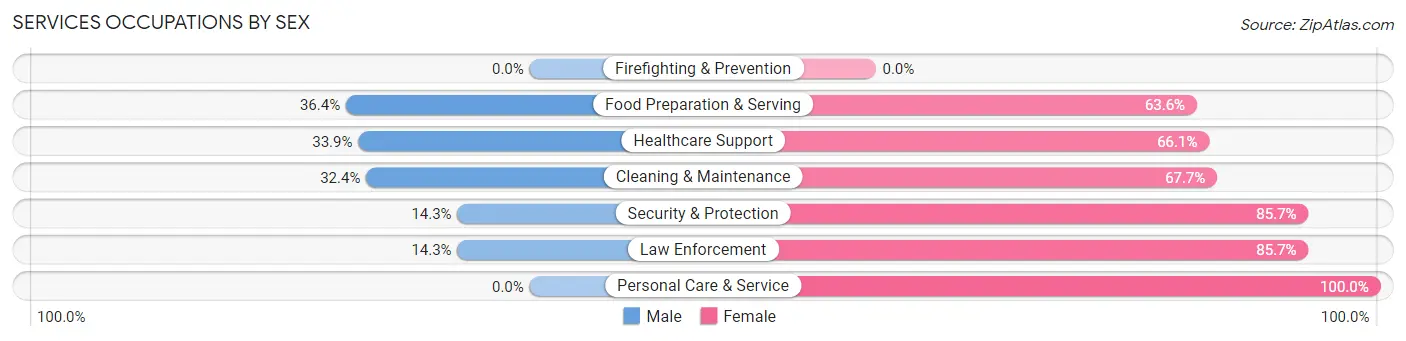
Services Occupations by Sex
Within the Services occupations in Pelican Rapids, the most male-oriented occupations are Food Preparation & Serving (36.4%), Healthcare Support (33.9%), and Cleaning & Maintenance (32.4%), while the most female-oriented occupations are Personal Care & Service (100.0%), Security & Protection (85.7%), and Law Enforcement (85.7%).
| Occupation | Male | Female |
| Healthcare Support | 19 (33.9%) | 37 (66.1%) |
| Security & Protection | 6 (14.3%) | 36 (85.7%) |
| Firefighting & Prevention | 0 (0.0%) | 0 (0.0%) |
| Law Enforcement | 6 (14.3%) | 36 (85.7%) |
| Food Preparation & Serving | 4 (36.4%) | 7 (63.6%) |
| Cleaning & Maintenance | 11 (32.4%) | 23 (67.6%) |
| Personal Care & Service | 0 (0.0%) | 12 (100.0%) |
| Total (Category) | 40 (25.8%) | 115 (74.2%) |
| Total (Overall) | 554 (54.4%) | 464 (45.6%) |
Sales and Office Occupations
The most common Sales and Office occupations in Pelican Rapids are Sales & Related (55 | 5.4%), and Office & Administration (26 | 2.5%).
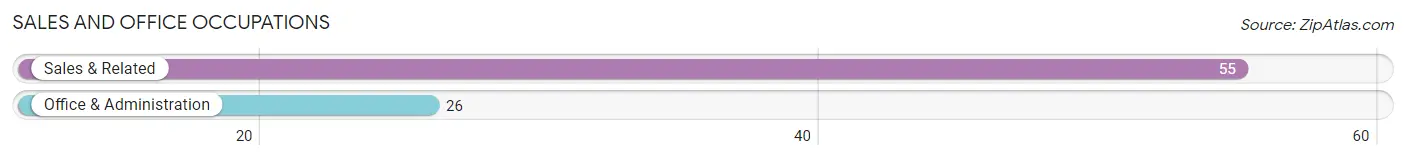
Sales and Office Occupations by Sex
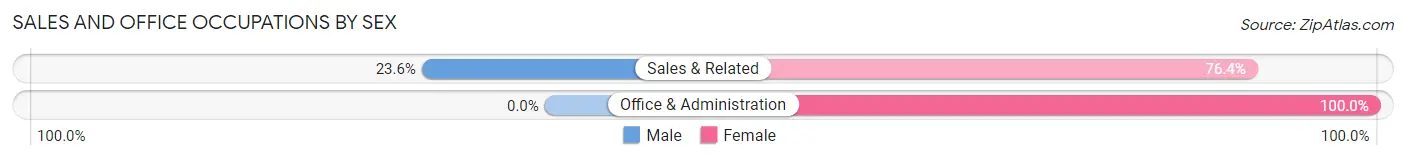
| Occupation | Male | Female |
| Sales & Related | 13 (23.6%) | 42 (76.4%) |
| Office & Administration | 0 (0.0%) | 26 (100.0%) |
| Total (Category) | 13 (16.1%) | 68 (84.0%) |
| Total (Overall) | 554 (54.4%) | 464 (45.6%) |
Natural Resources, Construction and Maintenance Occupations
The most common Natural Resources, Construction and Maintenance occupations in Pelican Rapids are Construction & Extraction (38 | 3.7%), and Installation, Maintenance & Repair (33 | 3.2%).
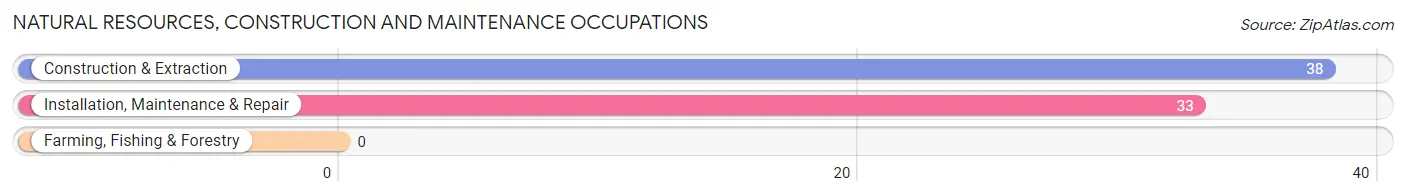
Natural Resources, Construction and Maintenance Occupations by Sex
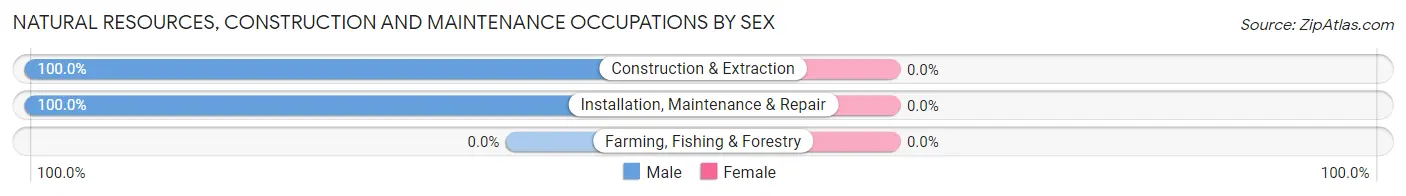
| Occupation | Male | Female |
| Farming, Fishing & Forestry | 0 (0.0%) | 0 (0.0%) |
| Construction & Extraction | 38 (100.0%) | 0 (0.0%) |
| Installation, Maintenance & Repair | 33 (100.0%) | 0 (0.0%) |
| Total (Category) | 71 (100.0%) | 0 (0.0%) |
| Total (Overall) | 554 (54.4%) | 464 (45.6%) |
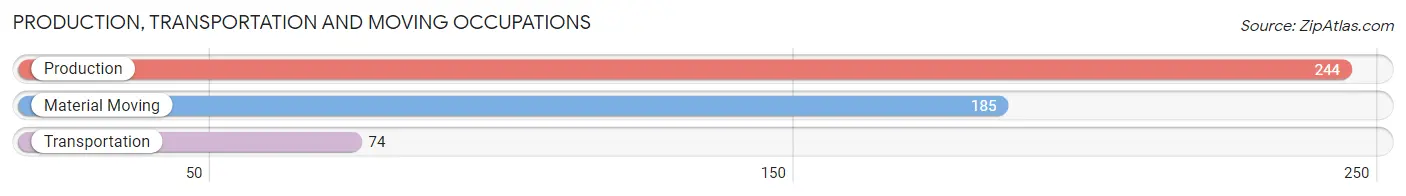
Production, Transportation and Moving Occupations
The most common Production, Transportation and Moving occupations in Pelican Rapids are Production (244 | 24.0%), Material Moving (185 | 18.2%), and Transportation (74 | 7.3%).
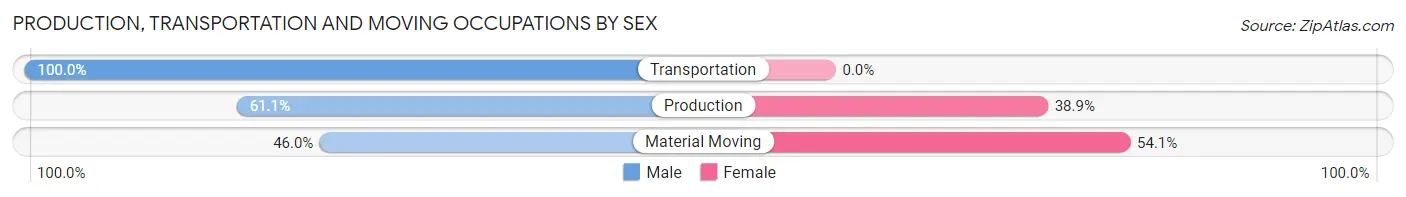
Production, Transportation and Moving Occupations by Sex
| Occupation | Male | Female |
| Production | 149 (61.1%) | 95 (38.9%) |
| Transportation | 74 (100.0%) | 0 (0.0%) |
| Material Moving | 85 (46.0%) | 100 (54.0%) |
| Total (Category) | 308 (61.2%) | 195 (38.8%) |
| Total (Overall) | 554 (54.4%) | 464 (45.6%) |
Employment Industries by Sex in Pelican Rapids
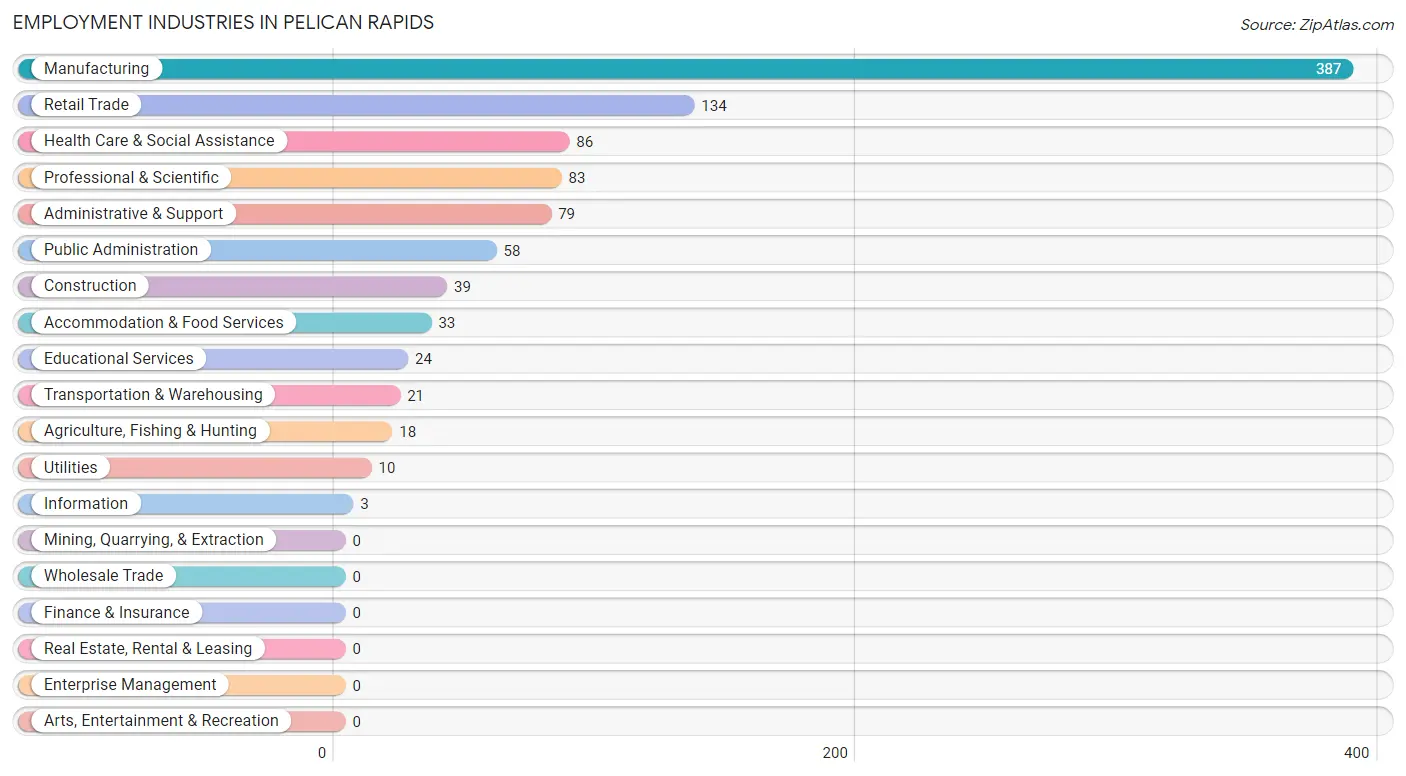
Employment Industries in Pelican Rapids
The major employment industries in Pelican Rapids include Manufacturing (387 | 38.0%), Retail Trade (134 | 13.2%), Health Care & Social Assistance (86 | 8.5%), Professional & Scientific (83 | 8.2%), and Administrative & Support (79 | 7.8%).
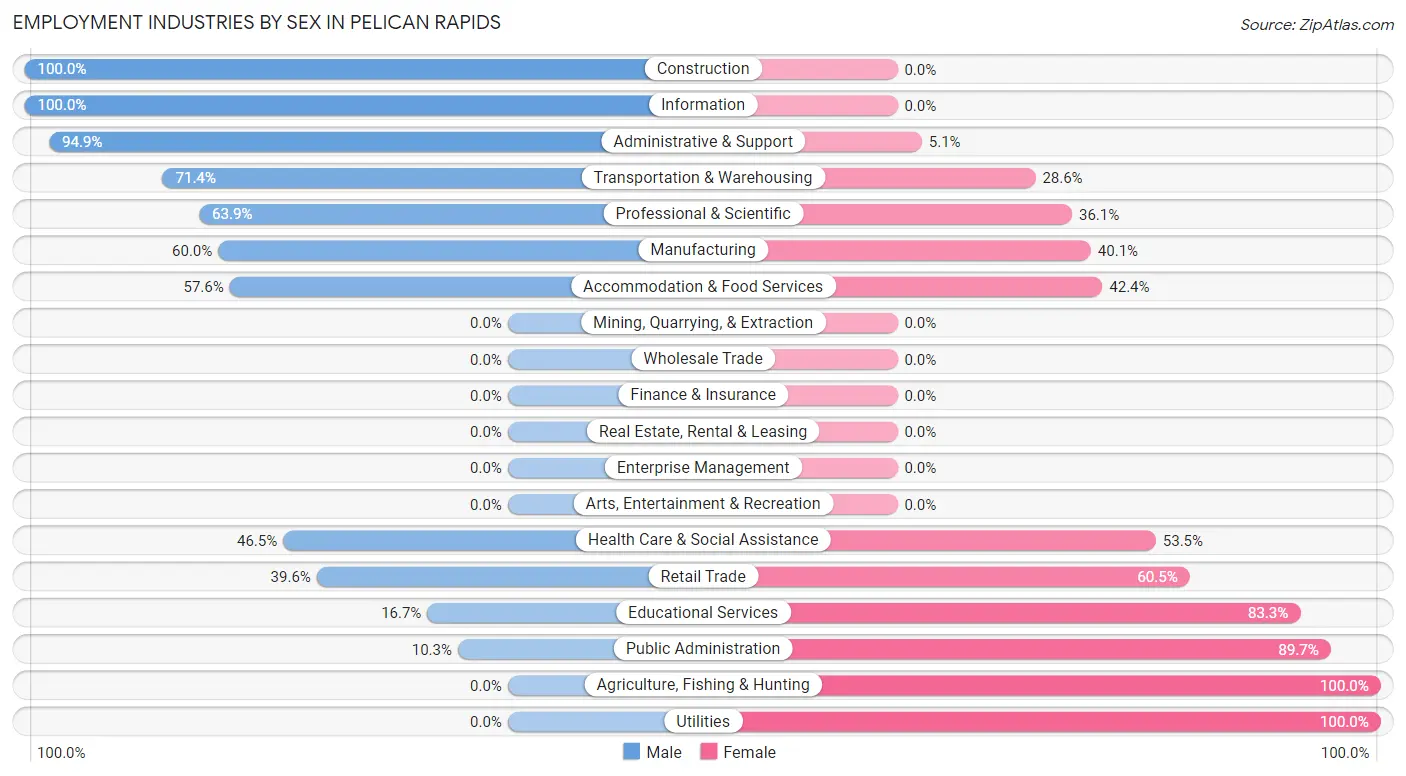
Employment Industries by Sex in Pelican Rapids
The Pelican Rapids industries that see more men than women are Construction (100.0%), Information (100.0%), and Administrative & Support (94.9%), whereas the industries that tend to have a higher number of women are Agriculture, Fishing & Hunting (100.0%), Utilities (100.0%), and Public Administration (89.7%).
| Industry | Male | Female |
| Agriculture, Fishing & Hunting | 0 (0.0%) | 18 (100.0%) |
| Mining, Quarrying, & Extraction | 0 (0.0%) | 0 (0.0%) |
| Construction | 39 (100.0%) | 0 (0.0%) |
| Manufacturing | 232 (60.0%) | 155 (40.1%) |
| Wholesale Trade | 0 (0.0%) | 0 (0.0%) |
| Retail Trade | 53 (39.6%) | 81 (60.5%) |
| Transportation & Warehousing | 15 (71.4%) | 6 (28.6%) |
| Utilities | 0 (0.0%) | 10 (100.0%) |
| Information | 3 (100.0%) | 0 (0.0%) |
| Finance & Insurance | 0 (0.0%) | 0 (0.0%) |
| Real Estate, Rental & Leasing | 0 (0.0%) | 0 (0.0%) |
| Professional & Scientific | 53 (63.9%) | 30 (36.1%) |
| Enterprise Management | 0 (0.0%) | 0 (0.0%) |
| Administrative & Support | 75 (94.9%) | 4 (5.1%) |
| Educational Services | 4 (16.7%) | 20 (83.3%) |
| Health Care & Social Assistance | 40 (46.5%) | 46 (53.5%) |
| Arts, Entertainment & Recreation | 0 (0.0%) | 0 (0.0%) |
| Accommodation & Food Services | 19 (57.6%) | 14 (42.4%) |
| Public Administration | 6 (10.3%) | 52 (89.7%) |
| Total | 554 (54.4%) | 464 (45.6%) |
Education in Pelican Rapids
School Enrollment in Pelican Rapids
The most common levels of schooling among the 623 students in Pelican Rapids are high school (187 | 30.0%), middle school (133 | 21.3%), and elementary school (117 | 18.8%).
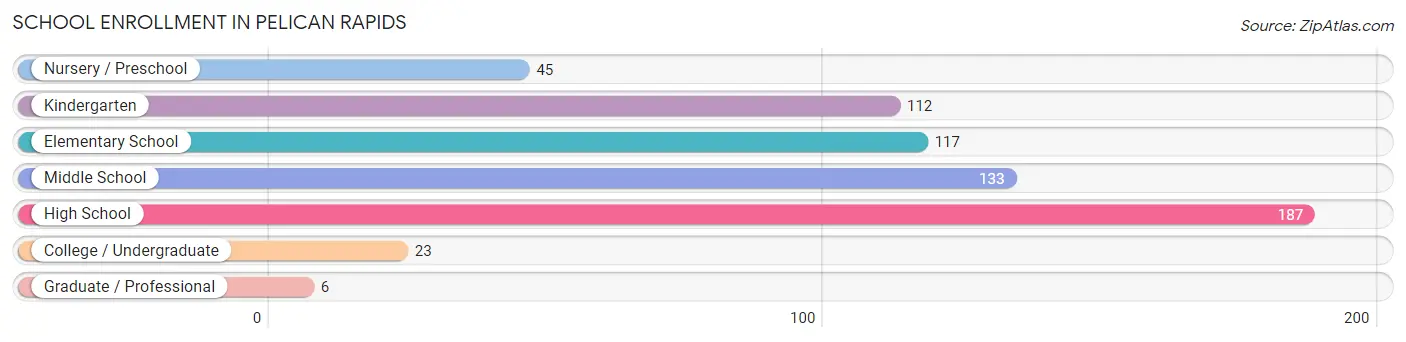
| School Level | # Students | % Students |
| Nursery / Preschool | 45 | 7.2% |
| Kindergarten | 112 | 18.0% |
| Elementary School | 117 | 18.8% |
| Middle School | 133 | 21.3% |
| High School | 187 | 30.0% |
| College / Undergraduate | 23 | 3.7% |
| Graduate / Professional | 6 | 1.0% |
| Total | 623 | 100.0% |
School Enrollment by Age by Funding Source in Pelican Rapids
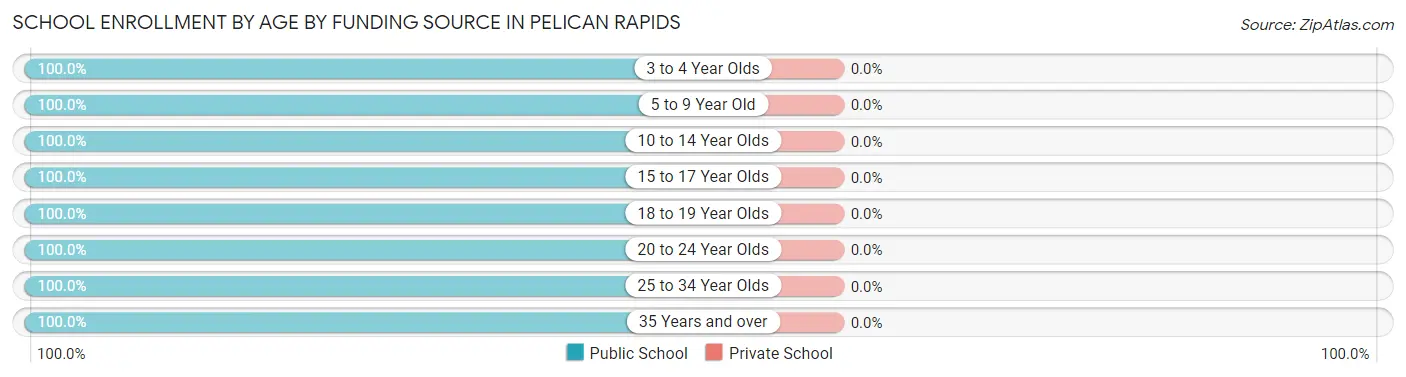
| Age Bracket | Public School | Private School |
| 3 to 4 Year Olds | 38 (100.0%) | 0 (0.0%) |
| 5 to 9 Year Old | 230 (100.0%) | 0 (0.0%) |
| 10 to 14 Year Olds | 132 (100.0%) | 0 (0.0%) |
| 15 to 17 Year Olds | 137 (100.0%) | 0 (0.0%) |
| 18 to 19 Year Olds | 28 (100.0%) | 0 (0.0%) |
| 20 to 24 Year Olds | 45 (100.0%) | 0 (0.0%) |
| 25 to 34 Year Olds | 7 (100.0%) | 0 (0.0%) |
| 35 Years and over | 6 (100.0%) | 0 (0.0%) |
| Total | 623 (100.0%) | 0 (0.0%) |
Educational Attainment by Field of Study in Pelican Rapids
Social sciences (45 | 18.5%), business (45 | 18.5%), arts & humanities (42 | 17.3%), bio, nature & agricultural (31 | 12.8%), and science & technology (29 | 11.9%) are the most common fields of study among 243 individuals in Pelican Rapids who have obtained a bachelor's degree or higher.
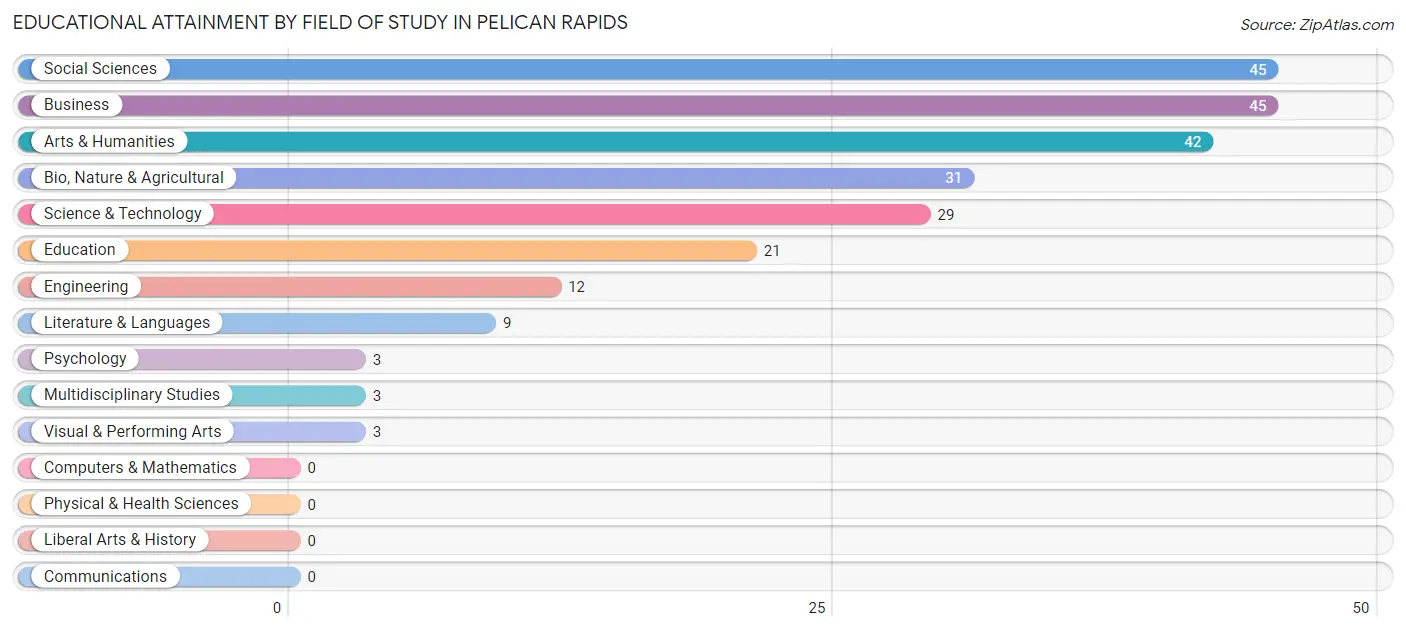
| Field of Study | # Graduates | % Graduates |
| Computers & Mathematics | 0 | 0.0% |
| Bio, Nature & Agricultural | 31 | 12.8% |
| Physical & Health Sciences | 0 | 0.0% |
| Psychology | 3 | 1.2% |
| Social Sciences | 45 | 18.5% |
| Engineering | 12 | 4.9% |
| Multidisciplinary Studies | 3 | 1.2% |
| Science & Technology | 29 | 11.9% |
| Business | 45 | 18.5% |
| Education | 21 | 8.6% |
| Literature & Languages | 9 | 3.7% |
| Liberal Arts & History | 0 | 0.0% |
| Visual & Performing Arts | 3 | 1.2% |
| Communications | 0 | 0.0% |
| Arts & Humanities | 42 | 17.3% |
| Total | 243 | 100.0% |
Transportation & Commute in Pelican Rapids
Vehicle Availability by Sex in Pelican Rapids
The most prevalent vehicle ownership categories in Pelican Rapids are males with 2 vehicles (249, accounting for 45.4%) and females with 2 vehicles (194, making up 53.7%).
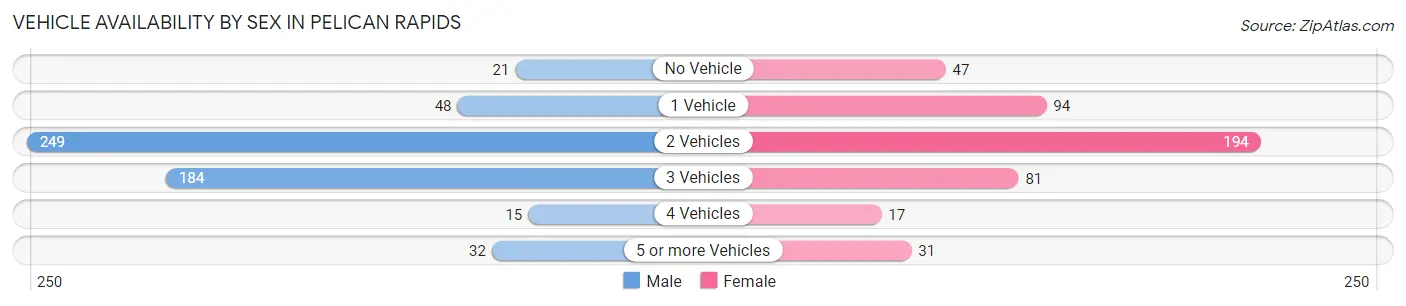
| Vehicles Available | Male | Female |
| No Vehicle | 21 (3.8%) | 47 (10.1%) |
| 1 Vehicle | 48 (8.7%) | 94 (20.3%) |
| 2 Vehicles | 249 (45.4%) | 194 (41.8%) |
| 3 Vehicles | 184 (33.5%) | 81 (17.5%) |
| 4 Vehicles | 15 (2.7%) | 17 (3.7%) |
| 5 or more Vehicles | 32 (5.8%) | 31 (6.7%) |
| Total | 549 (100.0%) | 464 (100.0%) |
Commute Time in Pelican Rapids
The most frequently occuring commute durations in Pelican Rapids are 5 to 9 minutes (332 commuters, 34.8%), 10 to 14 minutes (155 commuters, 16.3%), and 60 to 89 minutes (148 commuters, 15.5%).
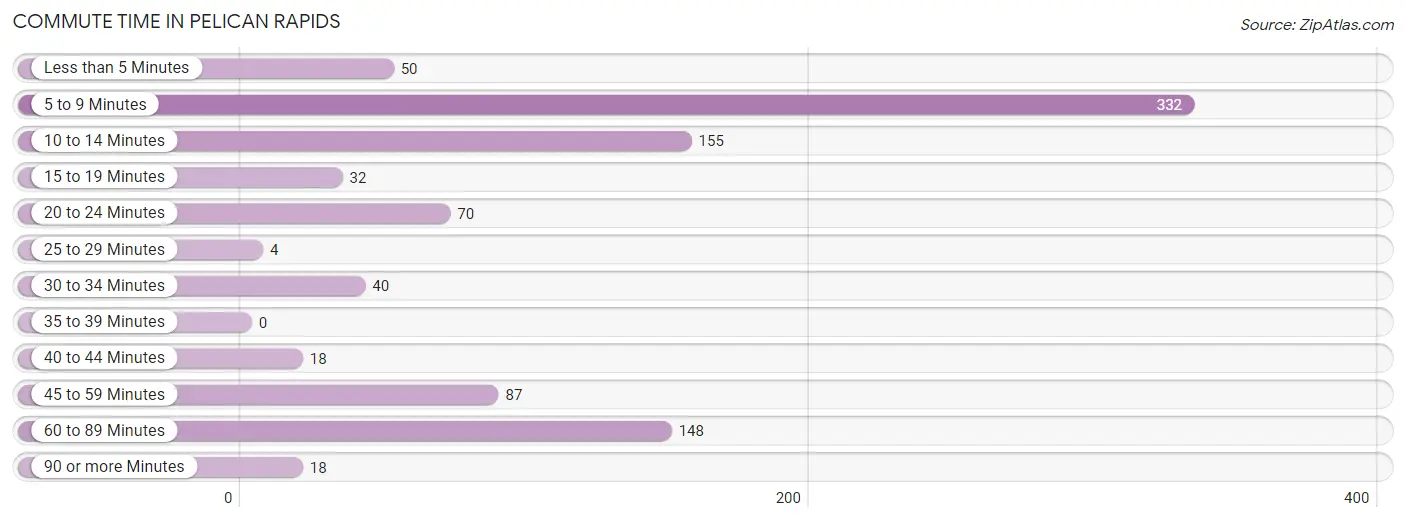
| Commute Time | # Commuters | % Commuters |
| Less than 5 Minutes | 50 | 5.2% |
| 5 to 9 Minutes | 332 | 34.8% |
| 10 to 14 Minutes | 155 | 16.3% |
| 15 to 19 Minutes | 32 | 3.4% |
| 20 to 24 Minutes | 70 | 7.3% |
| 25 to 29 Minutes | 4 | 0.4% |
| 30 to 34 Minutes | 40 | 4.2% |
| 35 to 39 Minutes | 0 | 0.0% |
| 40 to 44 Minutes | 18 | 1.9% |
| 45 to 59 Minutes | 87 | 9.1% |
| 60 to 89 Minutes | 148 | 15.5% |
| 90 or more Minutes | 18 | 1.9% |
Commute Time by Sex in Pelican Rapids
The most common commute times in Pelican Rapids are 5 to 9 minutes (147 commuters, 27.1%) for males and 5 to 9 minutes (185 commuters, 45.0%) for females.
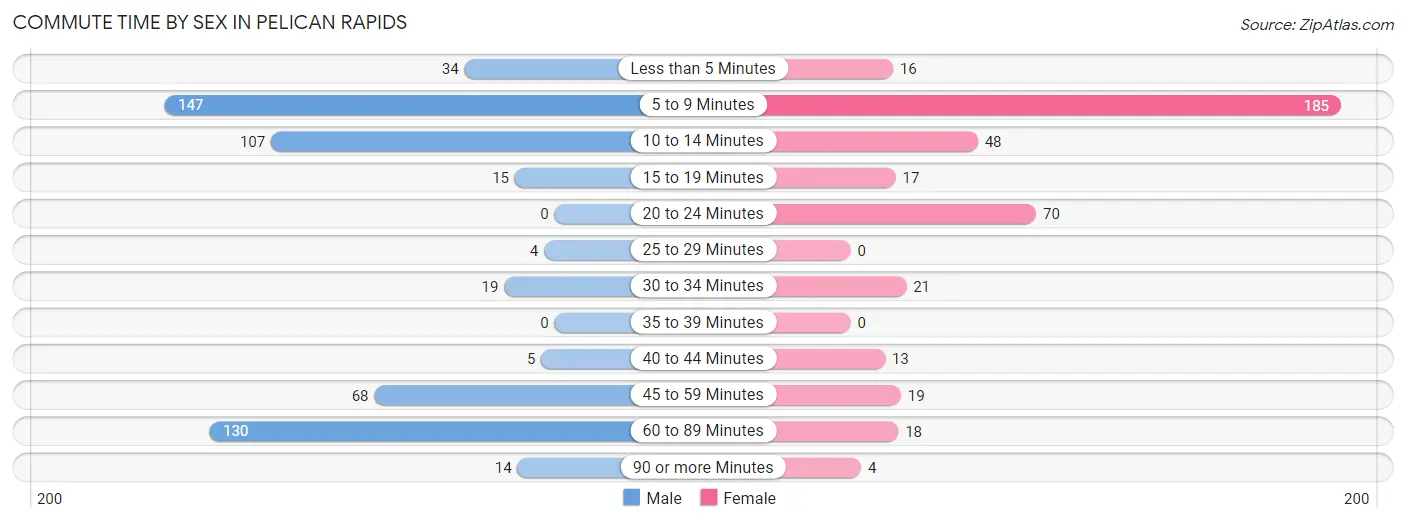
| Commute Time | Male | Female |
| Less than 5 Minutes | 34 (6.3%) | 16 (3.9%) |
| 5 to 9 Minutes | 147 (27.1%) | 185 (45.0%) |
| 10 to 14 Minutes | 107 (19.7%) | 48 (11.7%) |
| 15 to 19 Minutes | 15 (2.8%) | 17 (4.1%) |
| 20 to 24 Minutes | 0 (0.0%) | 70 (17.0%) |
| 25 to 29 Minutes | 4 (0.7%) | 0 (0.0%) |
| 30 to 34 Minutes | 19 (3.5%) | 21 (5.1%) |
| 35 to 39 Minutes | 0 (0.0%) | 0 (0.0%) |
| 40 to 44 Minutes | 5 (0.9%) | 13 (3.2%) |
| 45 to 59 Minutes | 68 (12.5%) | 19 (4.6%) |
| 60 to 89 Minutes | 130 (23.9%) | 18 (4.4%) |
| 90 or more Minutes | 14 (2.6%) | 4 (1.0%) |
Time of Departure to Work by Sex in Pelican Rapids
The most frequent times of departure to work in Pelican Rapids are 5:00 AM to 5:29 AM (143, 26.3%) for males and 6:00 AM to 6:29 AM (71, 17.3%) for females.
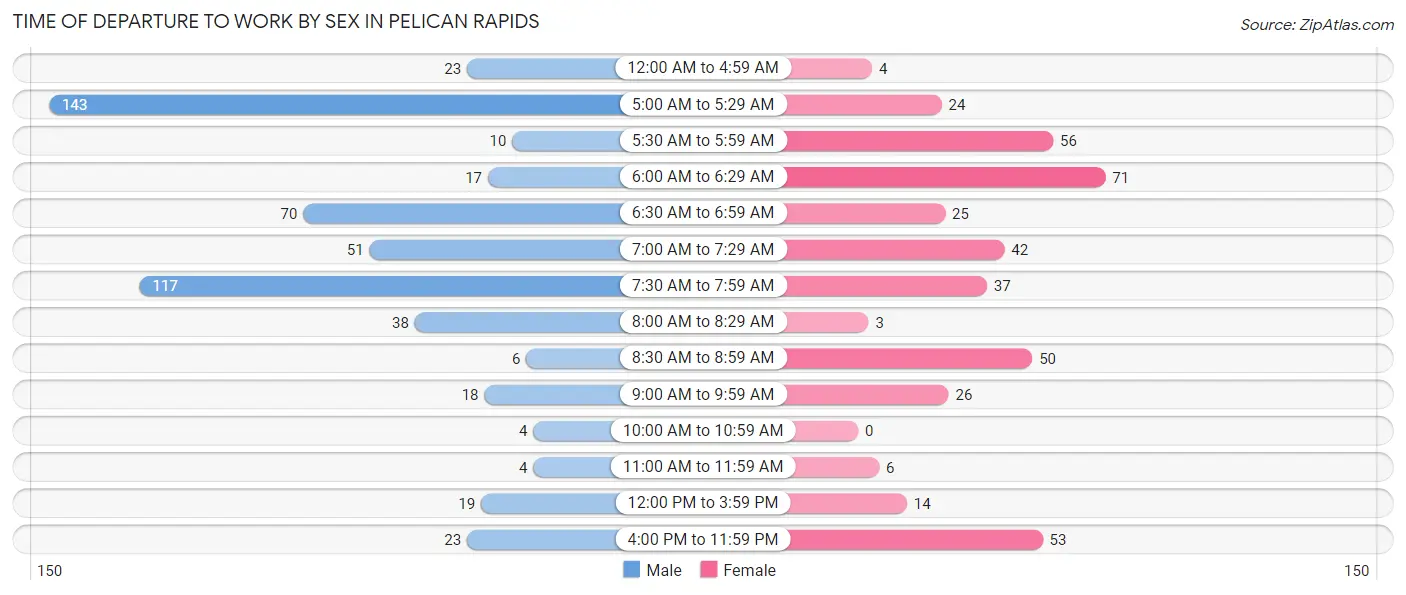
| Time of Departure | Male | Female |
| 12:00 AM to 4:59 AM | 23 (4.2%) | 4 (1.0%) |
| 5:00 AM to 5:29 AM | 143 (26.3%) | 24 (5.8%) |
| 5:30 AM to 5:59 AM | 10 (1.8%) | 56 (13.6%) |
| 6:00 AM to 6:29 AM | 17 (3.1%) | 71 (17.3%) |
| 6:30 AM to 6:59 AM | 70 (12.9%) | 25 (6.1%) |
| 7:00 AM to 7:29 AM | 51 (9.4%) | 42 (10.2%) |
| 7:30 AM to 7:59 AM | 117 (21.5%) | 37 (9.0%) |
| 8:00 AM to 8:29 AM | 38 (7.0%) | 3 (0.7%) |
| 8:30 AM to 8:59 AM | 6 (1.1%) | 50 (12.2%) |
| 9:00 AM to 9:59 AM | 18 (3.3%) | 26 (6.3%) |
| 10:00 AM to 10:59 AM | 4 (0.7%) | 0 (0.0%) |
| 11:00 AM to 11:59 AM | 4 (0.7%) | 6 (1.5%) |
| 12:00 PM to 3:59 PM | 19 (3.5%) | 14 (3.4%) |
| 4:00 PM to 11:59 PM | 23 (4.2%) | 53 (12.9%) |
| Total | 543 (100.0%) | 411 (100.0%) |
Housing Occupancy in Pelican Rapids
Occupancy by Ownership in Pelican Rapids
Of the total 941 dwellings in Pelican Rapids, owner-occupied units account for 623 (66.2%), while renter-occupied units make up 318 (33.8%).
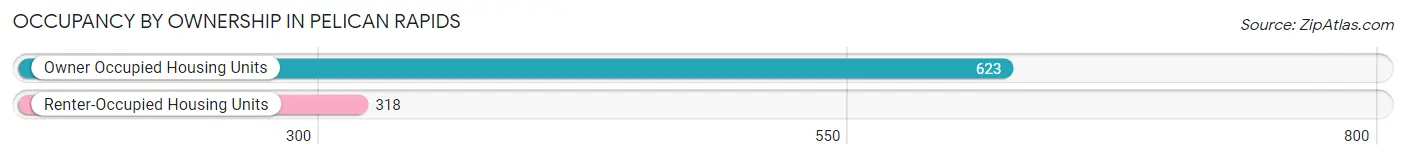
| Occupancy | # Housing Units | % Housing Units |
| Owner Occupied Housing Units | 623 | 66.2% |
| Renter-Occupied Housing Units | 318 | 33.8% |
| Total Occupied Housing Units | 941 | 100.0% |
Occupancy by Household Size in Pelican Rapids
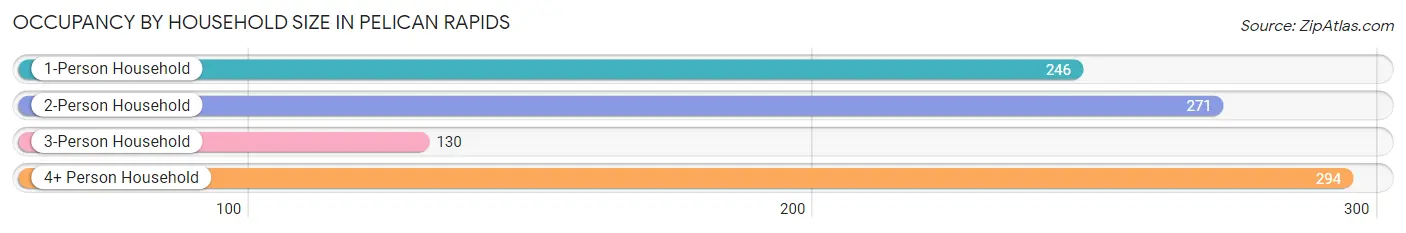
| Household Size | # Housing Units | % Housing Units |
| 1-Person Household | 246 | 26.1% |
| 2-Person Household | 271 | 28.8% |
| 3-Person Household | 130 | 13.8% |
| 4+ Person Household | 294 | 31.2% |
| Total Housing Units | 941 | 100.0% |
Occupancy by Ownership by Household Size in Pelican Rapids
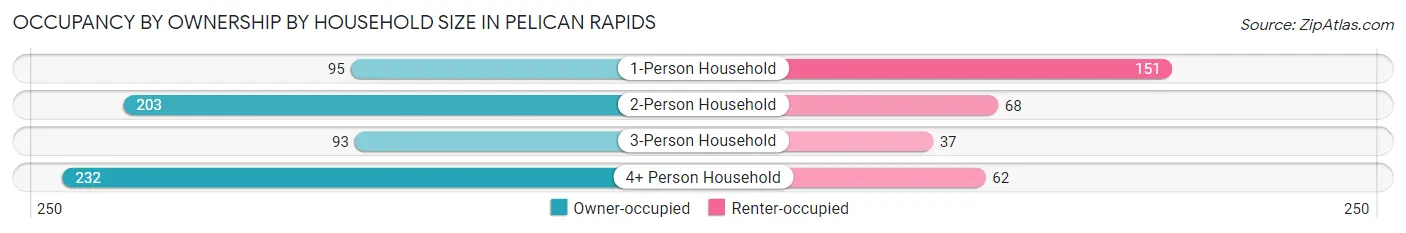
| Household Size | Owner-occupied | Renter-occupied |
| 1-Person Household | 95 (38.6%) | 151 (61.4%) |
| 2-Person Household | 203 (74.9%) | 68 (25.1%) |
| 3-Person Household | 93 (71.5%) | 37 (28.5%) |
| 4+ Person Household | 232 (78.9%) | 62 (21.1%) |
| Total Housing Units | 623 (66.2%) | 318 (33.8%) |
Occupancy by Educational Attainment in Pelican Rapids
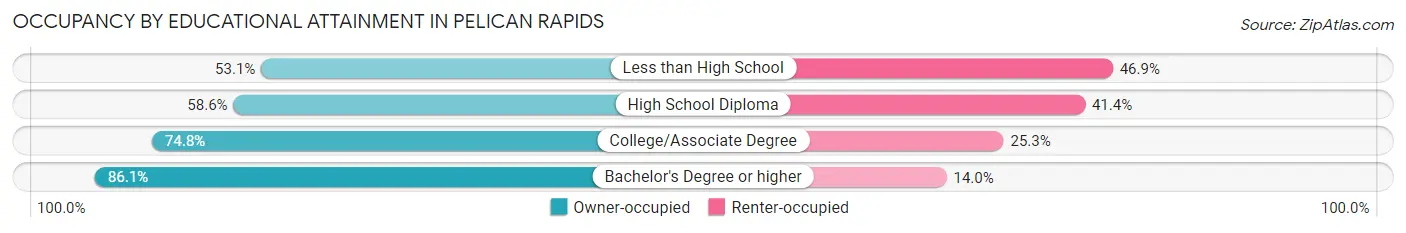
| Household Size | Owner-occupied | Renter-occupied |
| Less than High School | 120 (53.1%) | 106 (46.9%) |
| High School Diploma | 167 (58.6%) | 118 (41.4%) |
| College/Associate Degree | 225 (74.8%) | 76 (25.3%) |
| Bachelor's Degree or higher | 111 (86.1%) | 18 (14.0%) |
Occupancy by Age of Householder in Pelican Rapids
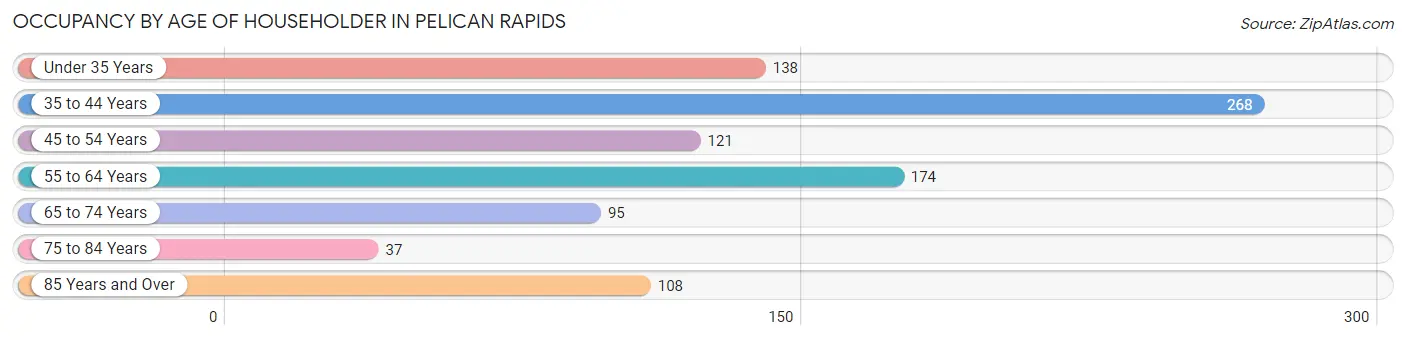
| Age Bracket | # Households | % Households |
| Under 35 Years | 138 | 14.7% |
| 35 to 44 Years | 268 | 28.5% |
| 45 to 54 Years | 121 | 12.9% |
| 55 to 64 Years | 174 | 18.5% |
| 65 to 74 Years | 95 | 10.1% |
| 75 to 84 Years | 37 | 3.9% |
| 85 Years and Over | 108 | 11.5% |
| Total | 941 | 100.0% |
Housing Finances in Pelican Rapids
Median Income by Occupancy in Pelican Rapids
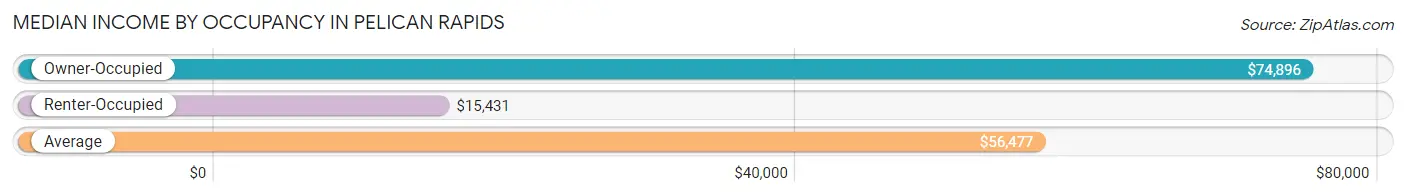
| Occupancy Type | # Households | Median Income |
| Owner-Occupied | 623 (66.2%) | $74,896 |
| Renter-Occupied | 318 (33.8%) | $15,431 |
| Average | 941 (100.0%) | $56,477 |
Occupancy by Householder Income Bracket in Pelican Rapids
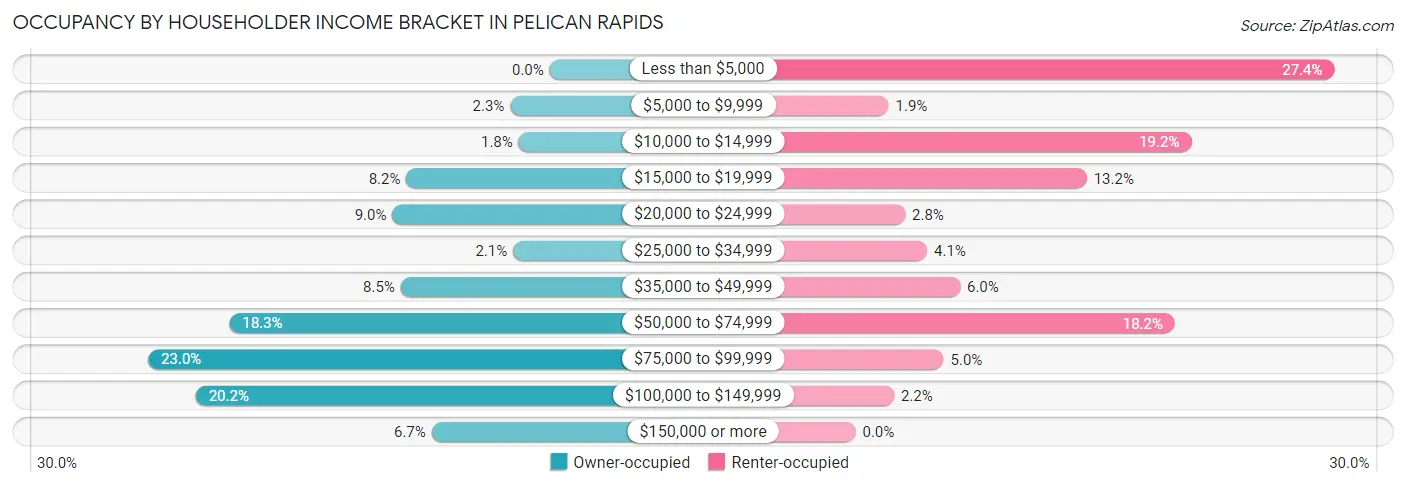
| Income Bracket | Owner-occupied | Renter-occupied |
| Less than $5,000 | 0 (0.0%) | 87 (27.4%) |
| $5,000 to $9,999 | 14 (2.2%) | 6 (1.9%) |
| $10,000 to $14,999 | 11 (1.8%) | 61 (19.2%) |
| $15,000 to $19,999 | 51 (8.2%) | 42 (13.2%) |
| $20,000 to $24,999 | 56 (9.0%) | 9 (2.8%) |
| $25,000 to $34,999 | 13 (2.1%) | 13 (4.1%) |
| $35,000 to $49,999 | 53 (8.5%) | 19 (6.0%) |
| $50,000 to $74,999 | 114 (18.3%) | 58 (18.2%) |
| $75,000 to $99,999 | 143 (23.0%) | 16 (5.0%) |
| $100,000 to $149,999 | 126 (20.2%) | 7 (2.2%) |
| $150,000 or more | 42 (6.7%) | 0 (0.0%) |
| Total | 623 (100.0%) | 318 (100.0%) |
Monthly Housing Cost Tiers in Pelican Rapids
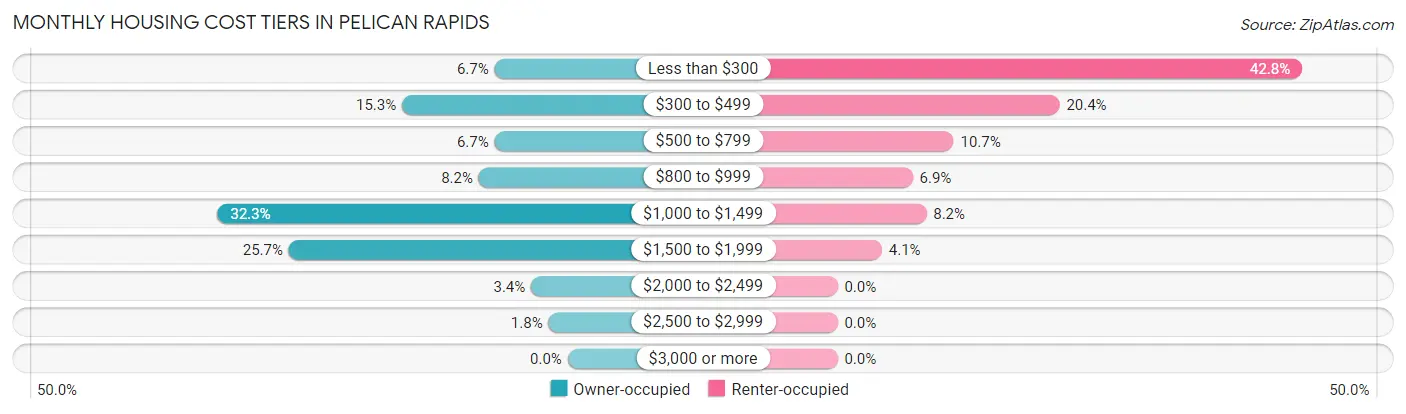
| Monthly Cost | Owner-occupied | Renter-occupied |
| Less than $300 | 42 (6.7%) | 136 (42.8%) |
| $300 to $499 | 95 (15.2%) | 65 (20.4%) |
| $500 to $799 | 42 (6.7%) | 34 (10.7%) |
| $800 to $999 | 51 (8.2%) | 22 (6.9%) |
| $1,000 to $1,499 | 201 (32.3%) | 26 (8.2%) |
| $1,500 to $1,999 | 160 (25.7%) | 13 (4.1%) |
| $2,000 to $2,499 | 21 (3.4%) | 0 (0.0%) |
| $2,500 to $2,999 | 11 (1.8%) | 0 (0.0%) |
| $3,000 or more | 0 (0.0%) | 0 (0.0%) |
| Total | 623 (100.0%) | 318 (100.0%) |
Physical Housing Characteristics in Pelican Rapids
Housing Structures in Pelican Rapids
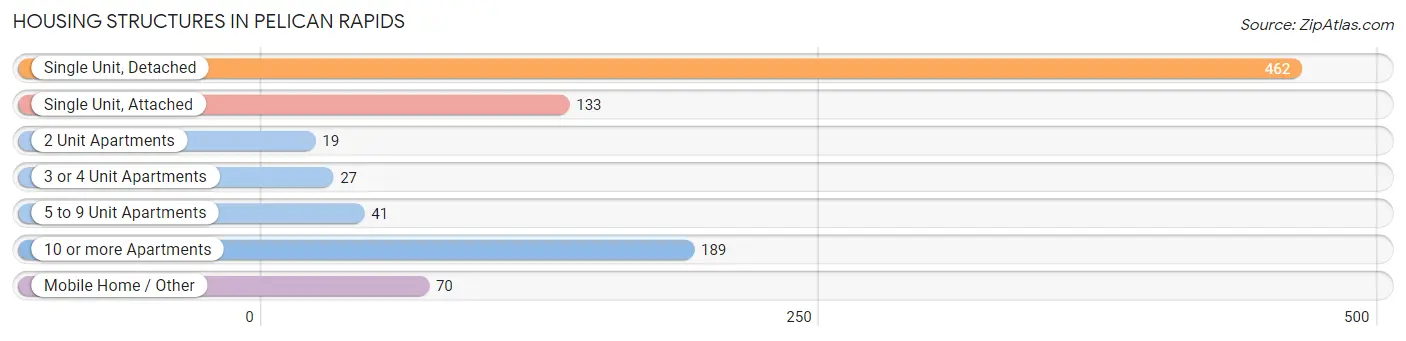
| Structure Type | # Housing Units | % Housing Units |
| Single Unit, Detached | 462 | 49.1% |
| Single Unit, Attached | 133 | 14.1% |
| 2 Unit Apartments | 19 | 2.0% |
| 3 or 4 Unit Apartments | 27 | 2.9% |
| 5 to 9 Unit Apartments | 41 | 4.4% |
| 10 or more Apartments | 189 | 20.1% |
| Mobile Home / Other | 70 | 7.4% |
| Total | 941 | 100.0% |
Housing Structures by Occupancy in Pelican Rapids
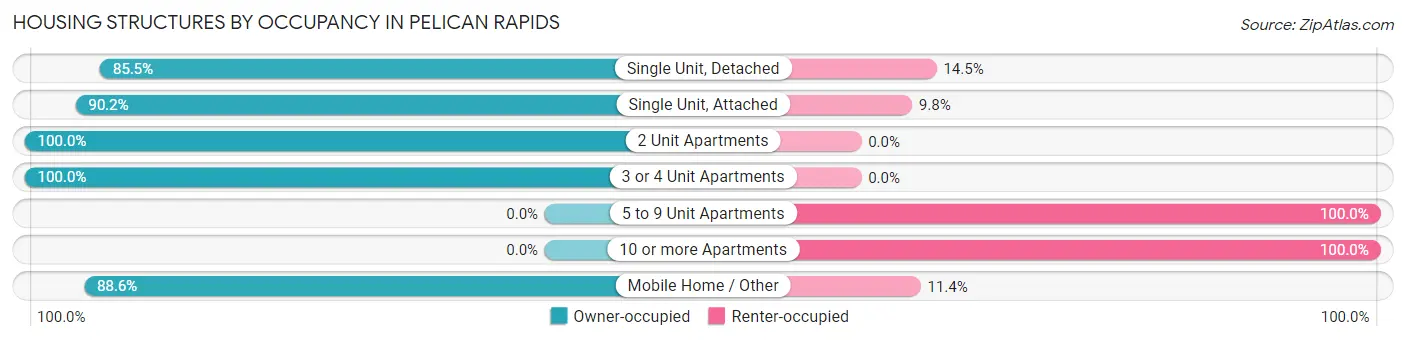
| Structure Type | Owner-occupied | Renter-occupied |
| Single Unit, Detached | 395 (85.5%) | 67 (14.5%) |
| Single Unit, Attached | 120 (90.2%) | 13 (9.8%) |
| 2 Unit Apartments | 19 (100.0%) | 0 (0.0%) |
| 3 or 4 Unit Apartments | 27 (100.0%) | 0 (0.0%) |
| 5 to 9 Unit Apartments | 0 (0.0%) | 41 (100.0%) |
| 10 or more Apartments | 0 (0.0%) | 189 (100.0%) |
| Mobile Home / Other | 62 (88.6%) | 8 (11.4%) |
| Total | 623 (66.2%) | 318 (33.8%) |
Housing Structures by Number of Rooms in Pelican Rapids
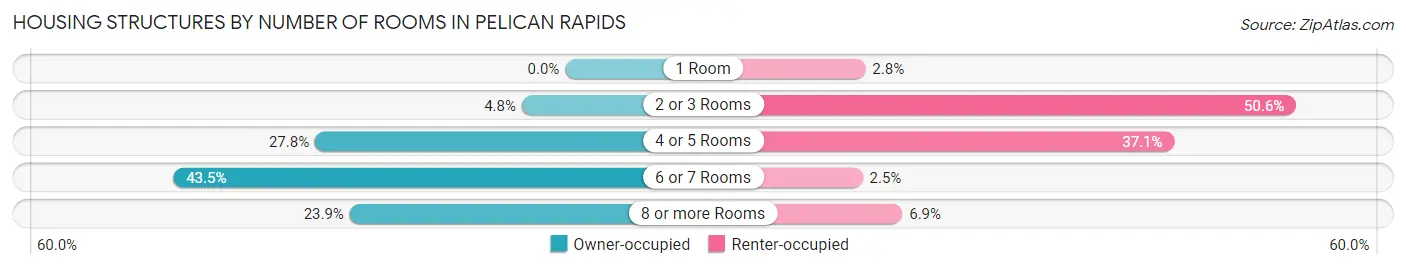
| Number of Rooms | Owner-occupied | Renter-occupied |
| 1 Room | 0 (0.0%) | 9 (2.8%) |
| 2 or 3 Rooms | 30 (4.8%) | 161 (50.6%) |
| 4 or 5 Rooms | 173 (27.8%) | 118 (37.1%) |
| 6 or 7 Rooms | 271 (43.5%) | 8 (2.5%) |
| 8 or more Rooms | 149 (23.9%) | 22 (6.9%) |
| Total | 623 (100.0%) | 318 (100.0%) |
Housing Structure by Heating Type in Pelican Rapids
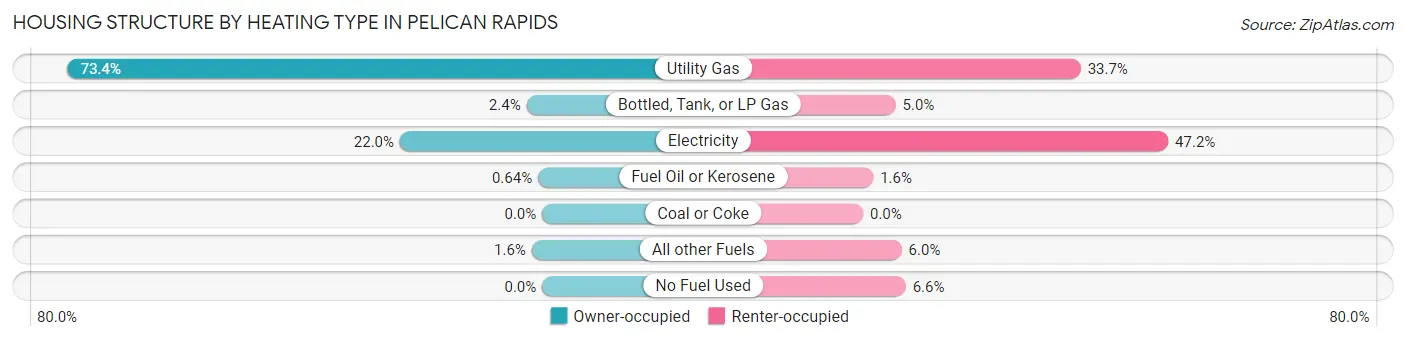
| Heating Type | Owner-occupied | Renter-occupied |
| Utility Gas | 457 (73.4%) | 107 (33.7%) |
| Bottled, Tank, or LP Gas | 15 (2.4%) | 16 (5.0%) |
| Electricity | 137 (22.0%) | 150 (47.2%) |
| Fuel Oil or Kerosene | 4 (0.6%) | 5 (1.6%) |
| Coal or Coke | 0 (0.0%) | 0 (0.0%) |
| All other Fuels | 10 (1.6%) | 19 (6.0%) |
| No Fuel Used | 0 (0.0%) | 21 (6.6%) |
| Total | 623 (100.0%) | 318 (100.0%) |
Household Vehicle Usage in Pelican Rapids
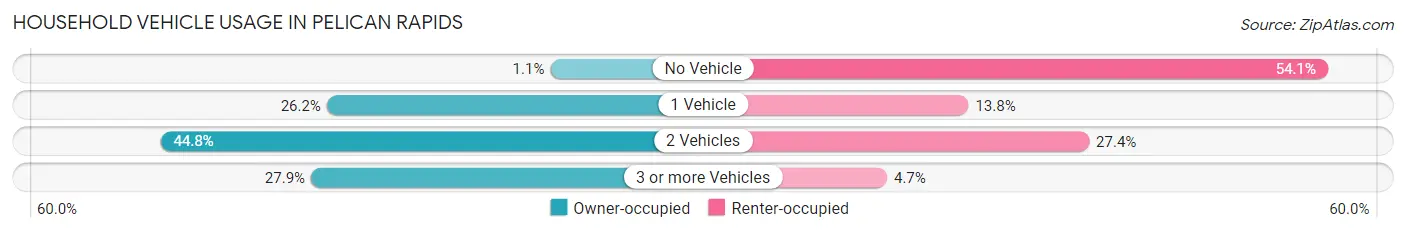
| Vehicles per Household | Owner-occupied | Renter-occupied |
| No Vehicle | 7 (1.1%) | 172 (54.1%) |
| 1 Vehicle | 163 (26.2%) | 44 (13.8%) |
| 2 Vehicles | 279 (44.8%) | 87 (27.4%) |
| 3 or more Vehicles | 174 (27.9%) | 15 (4.7%) |
| Total | 623 (100.0%) | 318 (100.0%) |
Real Estate & Mortgages in Pelican Rapids
Real Estate and Mortgage Overview in Pelican Rapids
| Characteristic | Without Mortgage | With Mortgage |
| Housing Units | 178 | 445 |
| Median Property Value | $135,200 | $188,900 |
| Median Household Income | $57,794 | $36 |
| Monthly Housing Costs | $344 | $0 |
| Real Estate Taxes | $953 | $3 |
Property Value by Mortgage Status in Pelican Rapids
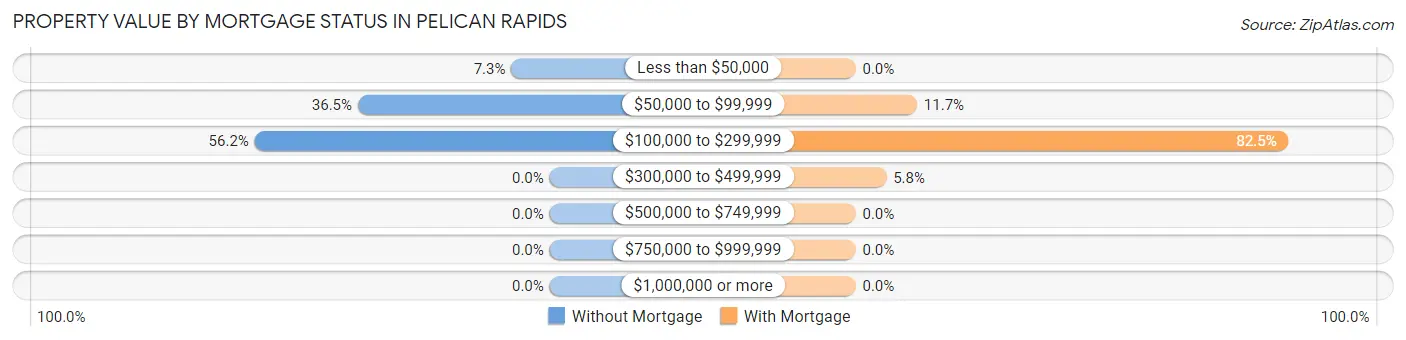
| Property Value | Without Mortgage | With Mortgage |
| Less than $50,000 | 13 (7.3%) | 0 (0.0%) |
| $50,000 to $99,999 | 65 (36.5%) | 52 (11.7%) |
| $100,000 to $299,999 | 100 (56.2%) | 367 (82.5%) |
| $300,000 to $499,999 | 0 (0.0%) | 26 (5.8%) |
| $500,000 to $749,999 | 0 (0.0%) | 0 (0.0%) |
| $750,000 to $999,999 | 0 (0.0%) | 0 (0.0%) |
| $1,000,000 or more | 0 (0.0%) | 0 (0.0%) |
| Total | 178 (100.0%) | 445 (100.0%) |
Household Income by Mortgage Status in Pelican Rapids
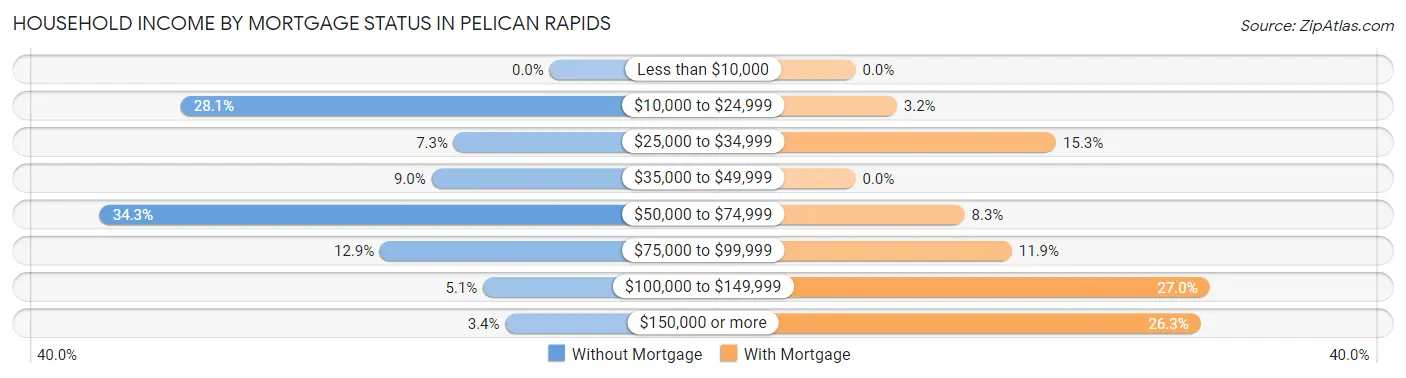
| Household Income | Without Mortgage | With Mortgage |
| Less than $10,000 | 0 (0.0%) | 0 (0.0%) |
| $10,000 to $24,999 | 50 (28.1%) | 14 (3.2%) |
| $25,000 to $34,999 | 13 (7.3%) | 68 (15.3%) |
| $35,000 to $49,999 | 16 (9.0%) | 0 (0.0%) |
| $50,000 to $74,999 | 61 (34.3%) | 37 (8.3%) |
| $75,000 to $99,999 | 23 (12.9%) | 53 (11.9%) |
| $100,000 to $149,999 | 9 (5.1%) | 120 (27.0%) |
| $150,000 or more | 6 (3.4%) | 117 (26.3%) |
| Total | 178 (100.0%) | 445 (100.0%) |
Property Value to Household Income Ratio in Pelican Rapids
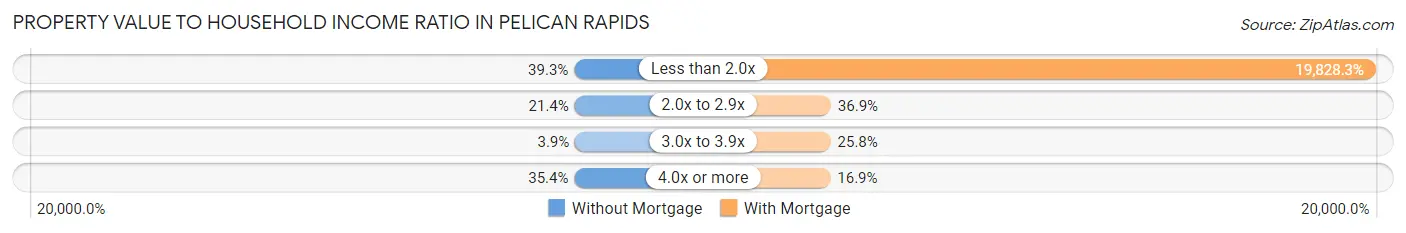
| Value-to-Income Ratio | Without Mortgage | With Mortgage |
| Less than 2.0x | 70 (39.3%) | 88,236 (19,828.3%) |
| 2.0x to 2.9x | 38 (21.3%) | 164 (36.8%) |
| 3.0x to 3.9x | 7 (3.9%) | 115 (25.8%) |
| 4.0x or more | 63 (35.4%) | 75 (16.9%) |
| Total | 178 (100.0%) | 445 (100.0%) |
Real Estate Taxes by Mortgage Status in Pelican Rapids
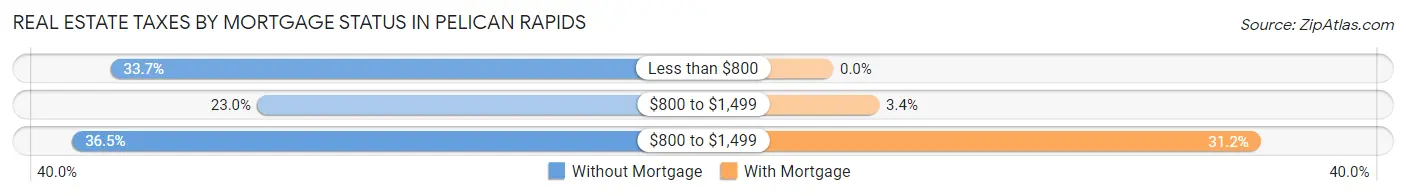
| Property Taxes | Without Mortgage | With Mortgage |
| Less than $800 | 60 (33.7%) | 0 (0.0%) |
| $800 to $1,499 | 41 (23.0%) | 15 (3.4%) |
| $800 to $1,499 | 65 (36.5%) | 139 (31.2%) |
| Total | 178 (100.0%) | 445 (100.0%) |
Health & Disability in Pelican Rapids
Health Insurance Coverage by Age in Pelican Rapids
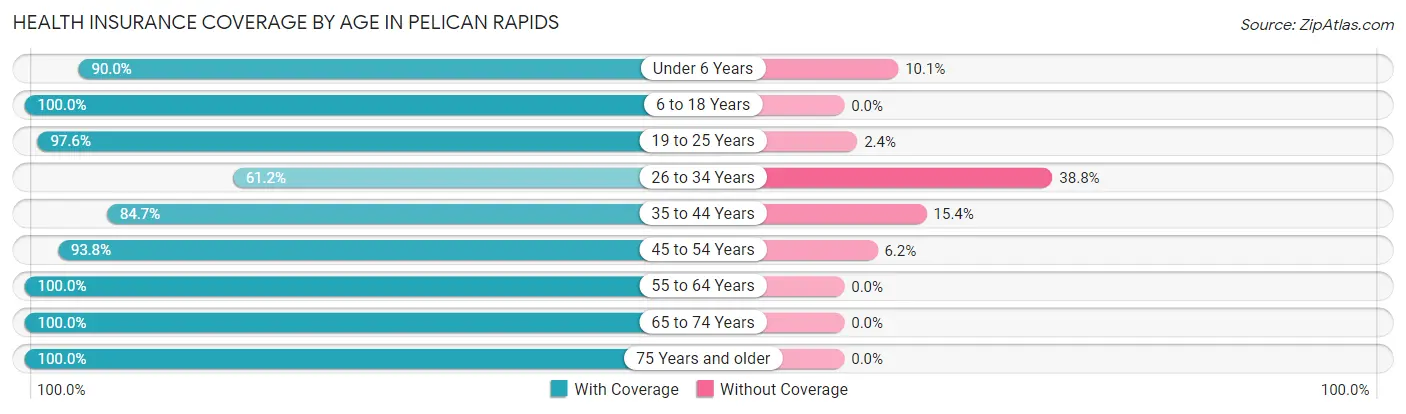
| Age Bracket | With Coverage | Without Coverage |
| Under 6 Years | 349 (89.9%) | 39 (10.1%) |
| 6 to 18 Years | 467 (100.0%) | 0 (0.0%) |
| 19 to 25 Years | 162 (97.6%) | 4 (2.4%) |
| 26 to 34 Years | 123 (61.2%) | 78 (38.8%) |
| 35 to 44 Years | 386 (84.7%) | 70 (15.3%) |
| 45 to 54 Years | 273 (93.8%) | 18 (6.2%) |
| 55 to 64 Years | 225 (100.0%) | 0 (0.0%) |
| 65 to 74 Years | 154 (100.0%) | 0 (0.0%) |
| 75 Years and older | 190 (100.0%) | 0 (0.0%) |
| Total | 2,329 (91.8%) | 209 (8.2%) |
Health Insurance Coverage by Citizenship Status in Pelican Rapids
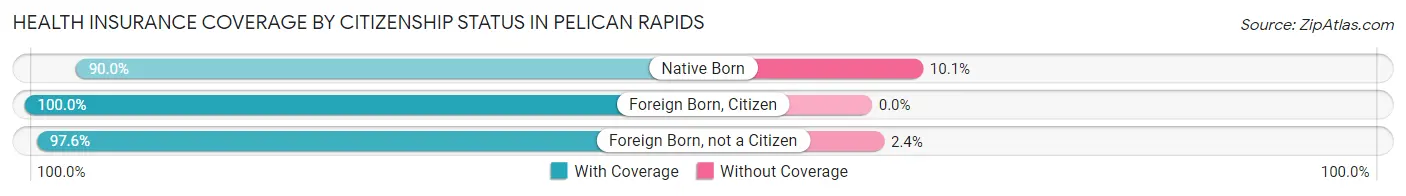
| Citizenship Status | With Coverage | Without Coverage |
| Native Born | 349 (89.9%) | 39 (10.1%) |
| Foreign Born, Citizen | 467 (100.0%) | 0 (0.0%) |
| Foreign Born, not a Citizen | 162 (97.6%) | 4 (2.4%) |
Health Insurance Coverage by Household Income in Pelican Rapids
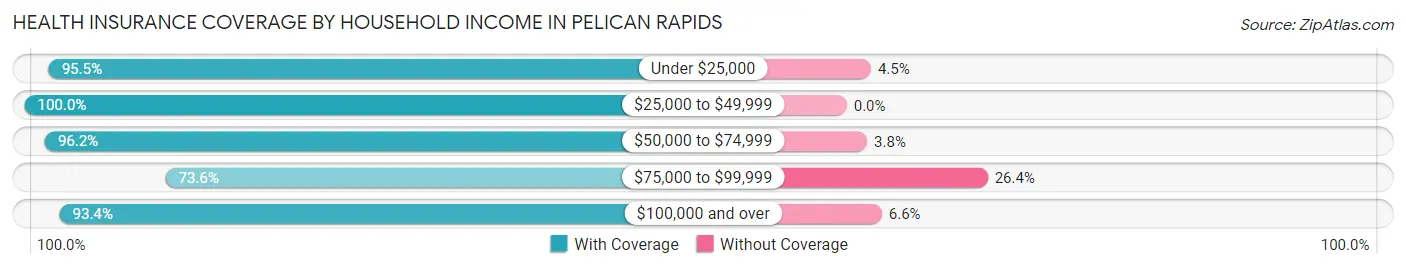
| Household Income | With Coverage | Without Coverage |
| Under $25,000 | 696 (95.5%) | 33 (4.5%) |
| $25,000 to $49,999 | 203 (100.0%) | 0 (0.0%) |
| $50,000 to $74,999 | 504 (96.2%) | 20 (3.8%) |
| $75,000 to $99,999 | 315 (73.6%) | 113 (26.4%) |
| $100,000 and over | 611 (93.4%) | 43 (6.6%) |
Public vs Private Health Insurance Coverage by Age in Pelican Rapids
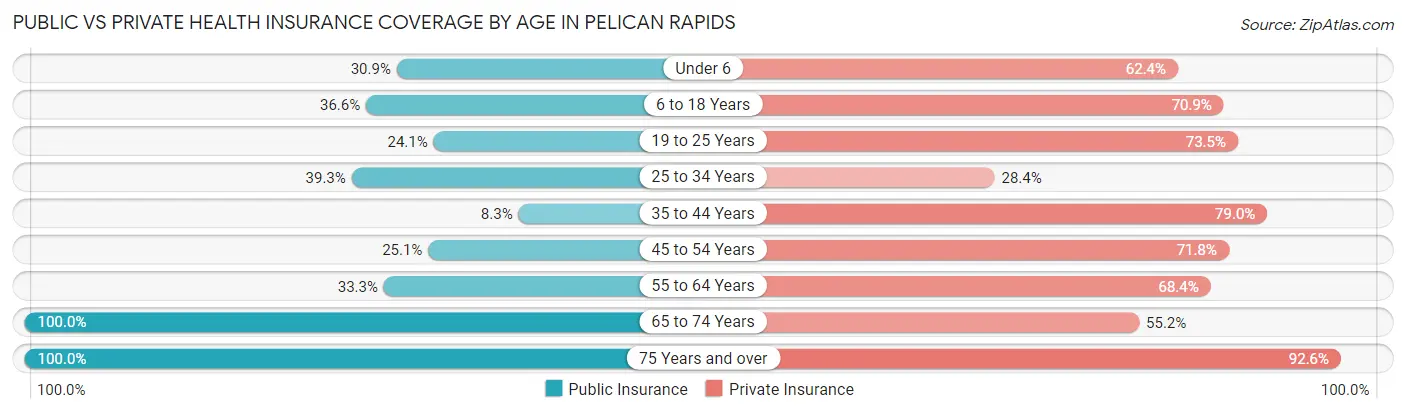
| Age Bracket | Public Insurance | Private Insurance |
| Under 6 | 120 (30.9%) | 242 (62.4%) |
| 6 to 18 Years | 171 (36.6%) | 331 (70.9%) |
| 19 to 25 Years | 40 (24.1%) | 122 (73.5%) |
| 25 to 34 Years | 79 (39.3%) | 57 (28.4%) |
| 35 to 44 Years | 38 (8.3%) | 360 (78.9%) |
| 45 to 54 Years | 73 (25.1%) | 209 (71.8%) |
| 55 to 64 Years | 75 (33.3%) | 154 (68.4%) |
| 65 to 74 Years | 154 (100.0%) | 85 (55.2%) |
| 75 Years and over | 190 (100.0%) | 176 (92.6%) |
| Total | 940 (37.0%) | 1,736 (68.4%) |
Disability Status by Sex by Age in Pelican Rapids
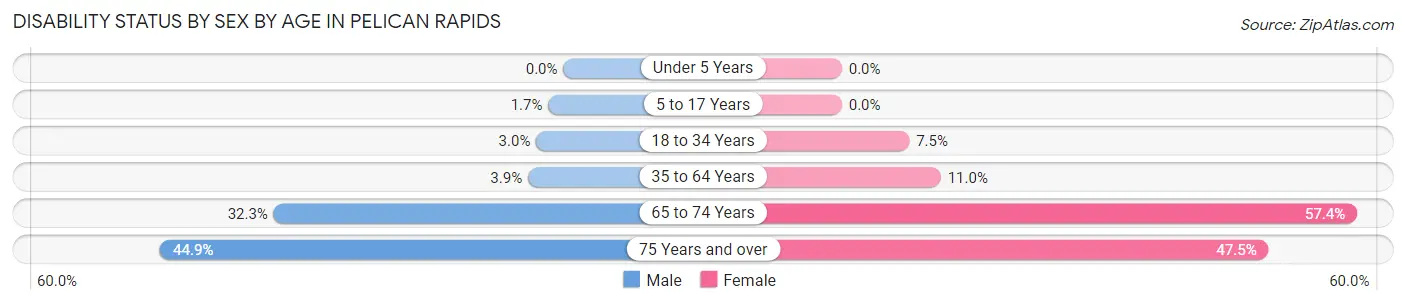
| Age Bracket | Male | Female |
| Under 5 Years | 0 (0.0%) | 0 (0.0%) |
| 5 to 17 Years | 4 (1.7%) | 0 (0.0%) |
| 18 to 34 Years | 6 (3.0%) | 13 (7.5%) |
| 35 to 64 Years | 19 (3.9%) | 54 (11.0%) |
| 65 to 74 Years | 30 (32.3%) | 35 (57.4%) |
| 75 Years and over | 22 (44.9%) | 67 (47.5%) |
Disability Class by Sex by Age in Pelican Rapids
Disability Class: Hearing Difficulty
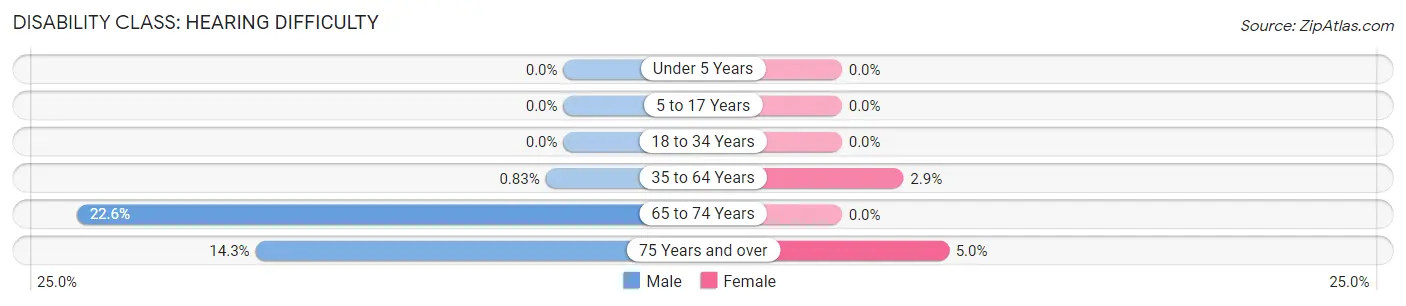
| Age Bracket | Male | Female |
| Under 5 Years | 0 (0.0%) | 0 (0.0%) |
| 5 to 17 Years | 0 (0.0%) | 0 (0.0%) |
| 18 to 34 Years | 0 (0.0%) | 0 (0.0%) |
| 35 to 64 Years | 4 (0.8%) | 14 (2.9%) |
| 65 to 74 Years | 21 (22.6%) | 0 (0.0%) |
| 75 Years and over | 7 (14.3%) | 7 (5.0%) |
Disability Class: Vision Difficulty
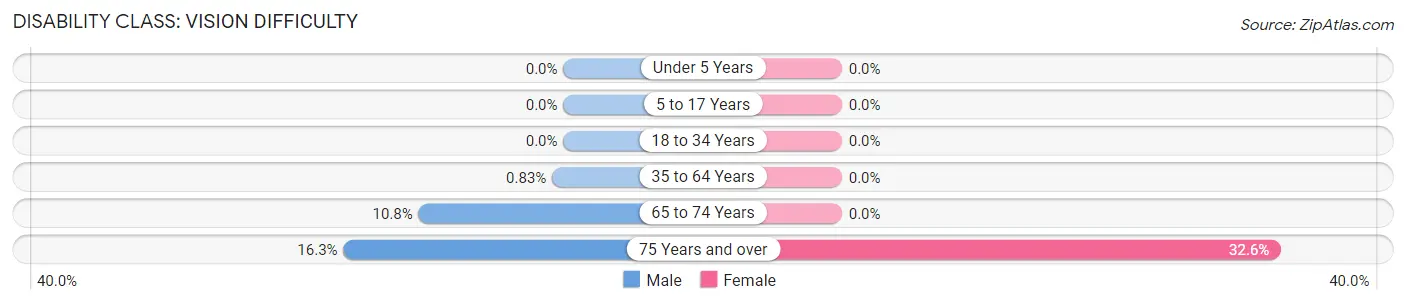
| Age Bracket | Male | Female |
| Under 5 Years | 0 (0.0%) | 0 (0.0%) |
| 5 to 17 Years | 0 (0.0%) | 0 (0.0%) |
| 18 to 34 Years | 0 (0.0%) | 0 (0.0%) |
| 35 to 64 Years | 4 (0.8%) | 0 (0.0%) |
| 65 to 74 Years | 10 (10.7%) | 0 (0.0%) |
| 75 Years and over | 8 (16.3%) | 46 (32.6%) |
Disability Class: Cognitive Difficulty
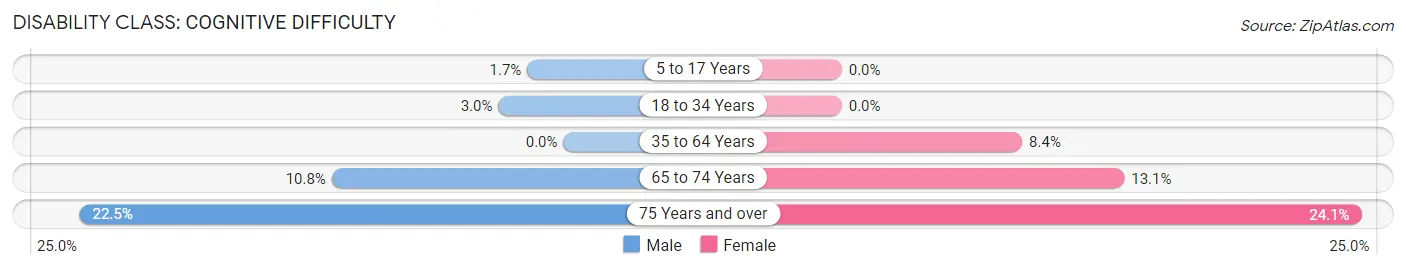
| Age Bracket | Male | Female |
| 5 to 17 Years | 4 (1.7%) | 0 (0.0%) |
| 18 to 34 Years | 6 (3.0%) | 0 (0.0%) |
| 35 to 64 Years | 0 (0.0%) | 41 (8.4%) |
| 65 to 74 Years | 10 (10.7%) | 8 (13.1%) |
| 75 Years and over | 11 (22.5%) | 34 (24.1%) |
Disability Class: Ambulatory Difficulty
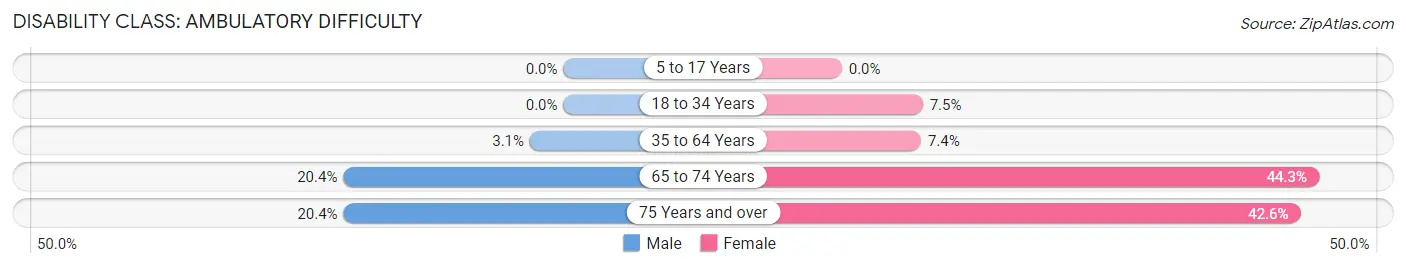
| Age Bracket | Male | Female |
| 5 to 17 Years | 0 (0.0%) | 0 (0.0%) |
| 18 to 34 Years | 0 (0.0%) | 13 (7.5%) |
| 35 to 64 Years | 15 (3.1%) | 36 (7.3%) |
| 65 to 74 Years | 19 (20.4%) | 27 (44.3%) |
| 75 Years and over | 10 (20.4%) | 60 (42.5%) |
Disability Class: Self-Care Difficulty
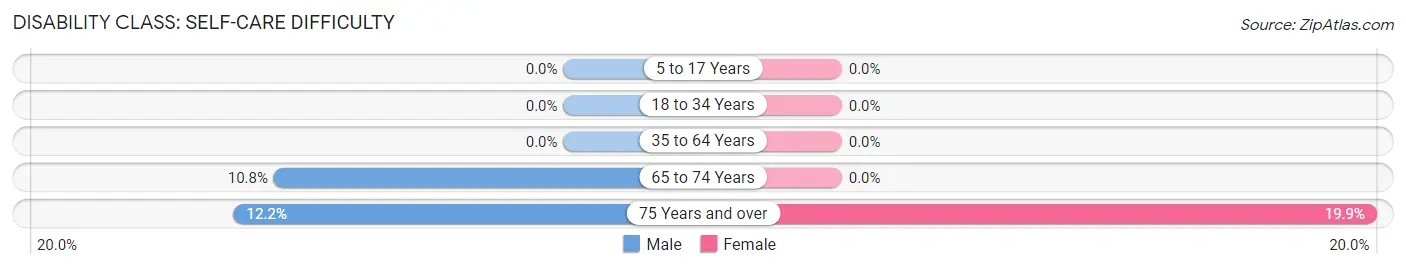
| Age Bracket | Male | Female |
| 5 to 17 Years | 0 (0.0%) | 0 (0.0%) |
| 18 to 34 Years | 0 (0.0%) | 0 (0.0%) |
| 35 to 64 Years | 0 (0.0%) | 0 (0.0%) |
| 65 to 74 Years | 10 (10.7%) | 0 (0.0%) |
| 75 Years and over | 6 (12.2%) | 28 (19.9%) |
Technology Access in Pelican Rapids
Computing Device Access in Pelican Rapids
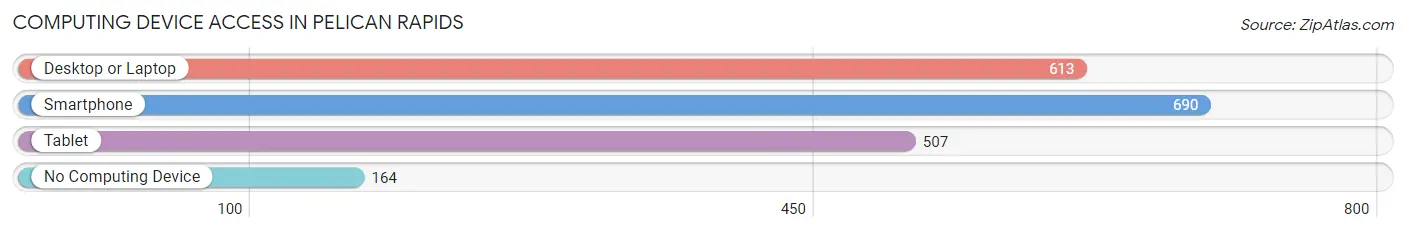
| Device Type | # Households | % Households |
| Desktop or Laptop | 613 | 65.1% |
| Smartphone | 690 | 73.3% |
| Tablet | 507 | 53.9% |
| No Computing Device | 164 | 17.4% |
| Total | 941 | 100.0% |
Internet Access in Pelican Rapids
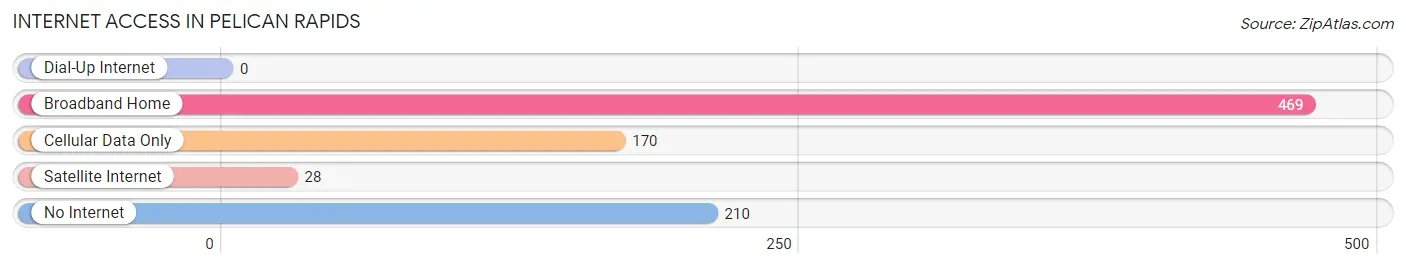
| Internet Type | # Households | % Households |
| Dial-Up Internet | 0 | 0.0% |
| Broadband Home | 469 | 49.8% |
| Cellular Data Only | 170 | 18.1% |
| Satellite Internet | 28 | 3.0% |
| No Internet | 210 | 22.3% |
| Total | 941 | 100.0% |
Pelican Rapids Summary
Pelican Rapids is a small city located in Otter Tail County, Minnesota, United States. It is situated on the western shore of Pelican Lake, a large glacial lake in the area. The city is located about 30 miles east of the city of Fargo, North Dakota, and about 90 miles northwest of Minneapolis. The population of Pelican Rapids was 2,464 at the 2010 census.
History
The area around Pelican Rapids was first settled in the late 1800s by Scandinavian immigrants. The city was officially incorporated in 1881. The city was named after the nearby Pelican Rapids, which were formed by the glacial Lake Agassiz.
The city was an important trading center for the surrounding area, and it was also a popular tourist destination. The city was home to several resorts, including the Pelican Rapids Hotel, which was built in 1883.
Geography
Pelican Rapids is located at 46°45'N, 95°50'W (46.75, -95.83). According to the United States Census Bureau, the city has a total area of 2.2 square miles (5.7 km2), all of it land.
The city is located on the western shore of Pelican Lake, a large glacial lake in the area. The lake is fed by the Otter Tail River, which flows through the city.
Economy
The economy of Pelican Rapids is largely based on tourism and agriculture. The city is home to several resorts, including the Pelican Rapids Hotel, which was built in 1883. The city is also home to several agricultural businesses, including dairy farms, grain elevators, and feed mills.
Demographics
As of the census of 2010, there were 2,464 people, 1,039 households, and 645 families residing in the city. The population density was 1,097.2 people per square mile (423.2/km2). There were 1,097 housing units at an average density of 486.2 per square mile (187.7/km2). The racial makeup of the city was 97.2% White, 0.3% African American, 0.3% Native American, 0.4% Asian, 0.1% Pacific Islander, 0.7% from other races, and 0.9% from two or more races. Hispanic or Latino of any race were 1.7% of the population.
There were 1,039 households, out of which 28.2% had children under the age of 18 living with them, 48.2% were married couples living together, 10.2% had a female householder with no husband present, and 37.2% were non-families. 32.2% of all households were made up of individuals, and 16.2% had someone living alone who was 65 years of age or older. The average household size was 2.31 and the average family size was 2.93.
In the city, the population was spread out, with 24.2% under the age of 18, 7.2% from 18 to 24, 24.7% from 25 to 44, 22.7% from 45 to 64, and 21.2% who were 65 years of age or older. The median age was 40 years. For every 100 females, there were 91.2 males. For every 100 females age 18 and over, there were 88.2 males.
The median income for a household in the city was $35,938, and the median income for a family was $45,000. Males had a median income of $31,250 versus $21,250 for females. The per capita income for the city was $18,845. About 8.2% of families and 11.2% of the population were below the poverty line, including 15.2% of those under age 18 and 8.2% of those age 65 or over.
Common Questions
What is Per Capita Income in Pelican Rapids?
Per Capita income in Pelican Rapids is $22,124.
What is the Median Family Income in Pelican Rapids?
Median Family Income in Pelican Rapids is $65,556.
What is the Median Household income in Pelican Rapids?
Median Household Income in Pelican Rapids is $56,477.
What is Income or Wage Gap in Pelican Rapids?
Income or Wage Gap in Pelican Rapids is 55.4%.
Women in Pelican Rapids earn 44.6 cents for every dollar earned by a man.
What is Inequality or Gini Index in Pelican Rapids?
Inequality or Gini Index in Pelican Rapids is 0.44.
What is the Total Population of Pelican Rapids?
Total Population of Pelican Rapids is 2,589.
What is the Total Male Population of Pelican Rapids?
Total Male Population of Pelican Rapids is 1,265.
What is the Total Female Population of Pelican Rapids?
Total Female Population of Pelican Rapids is 1,324.
What is the Ratio of Males per 100 Females in Pelican Rapids?
There are 95.54 Males per 100 Females in Pelican Rapids.
What is the Ratio of Females per 100 Males in Pelican Rapids?
There are 104.66 Females per 100 Males in Pelican Rapids.
What is the Median Population Age in Pelican Rapids?
Median Population Age in Pelican Rapids is 36.3 Years.
What is the Average Family Size in Pelican Rapids
Average Family Size in Pelican Rapids is 3.4 People.
What is the Average Household Size in Pelican Rapids
Average Household Size in Pelican Rapids is 2.7 People.
How Large is the Labor Force in Pelican Rapids?
There are 1,047 People in the Labor Forcein in Pelican Rapids.
What is the Percentage of People in the Labor Force in Pelican Rapids?
58.7% of People are in the Labor Force in Pelican Rapids.
What is the Unemployment Rate in Pelican Rapids?
Unemployment Rate in Pelican Rapids is 2.8%.