Carolina, WV Map & Demographics
Carolina Map
Carolina Overview
$14,191
PER CAPITA INCOME
0.33
INEQUALITY / GINI INDEX
237
TOTAL POPULATION
110
MALE POPULATION
127
FEMALE POPULATION
86.61
MALES / 100 FEMALES
115.45
FEMALES / 100 MALES
32.9
MEDIAN AGE
3.1
AVG FAMILY SIZE
2.4
AVG HOUSEHOLD SIZE
82
LABOR FORCE [ PEOPLE ]
43.9%
PERCENT IN LABOR FORCE
30.5%
UNEMPLOYMENT RATE
Carolina Zip Codes
Carolina Area Codes
Income in Carolina
Income Overview in Carolina
| Characteristic | Number | Measure |
| Per Capita Income | 237 | $14,191 |
| Median Family Income | 67 | $0 |
| Mean Family Income | 67 | $34,122 |
| Median Household Income | 97 | $0 |
| Mean Household Income | 97 | $30,462 |
| Income Deficit | 67 | $0 |
| Wage / Income Gap (%) | 237 | 0.00% |
| Wage / Income Gap ($) | 237 | 100.00¢ per $1 |
| Gini / Inequality Index | 237 | 0.33 |
Earnings by Sex in Carolina
| Sex | Number | Average Earnings |
| Male | 37 (45.1%) | $0 |
| Female | 45 (54.9%) | $0 |
| Total | 82 (100.0%) | $0 |
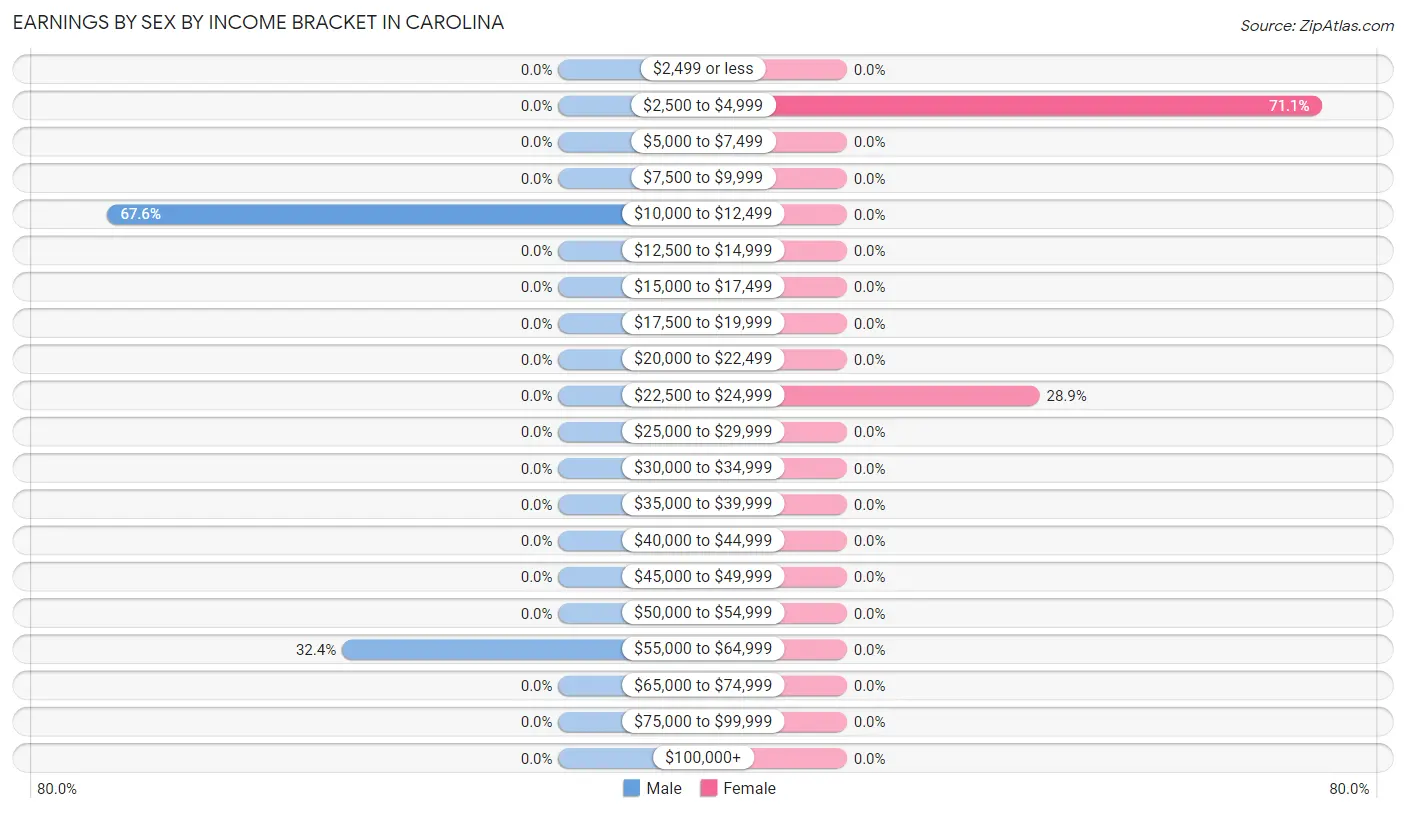
Earnings by Sex by Income Bracket in Carolina
The most common earnings brackets in Carolina are $10,000 to $12,499 for men (25 | 67.6%) and $2,500 to $4,999 for women (32 | 71.1%).
| Income | Male | Female |
| $2,499 or less | 0 (0.0%) | 0 (0.0%) |
| $2,500 to $4,999 | 0 (0.0%) | 32 (71.1%) |
| $5,000 to $7,499 | 0 (0.0%) | 0 (0.0%) |
| $7,500 to $9,999 | 0 (0.0%) | 0 (0.0%) |
| $10,000 to $12,499 | 25 (67.6%) | 0 (0.0%) |
| $12,500 to $14,999 | 0 (0.0%) | 0 (0.0%) |
| $15,000 to $17,499 | 0 (0.0%) | 0 (0.0%) |
| $17,500 to $19,999 | 0 (0.0%) | 0 (0.0%) |
| $20,000 to $22,499 | 0 (0.0%) | 0 (0.0%) |
| $22,500 to $24,999 | 0 (0.0%) | 13 (28.9%) |
| $25,000 to $29,999 | 0 (0.0%) | 0 (0.0%) |
| $30,000 to $34,999 | 0 (0.0%) | 0 (0.0%) |
| $35,000 to $39,999 | 0 (0.0%) | 0 (0.0%) |
| $40,000 to $44,999 | 0 (0.0%) | 0 (0.0%) |
| $45,000 to $49,999 | 0 (0.0%) | 0 (0.0%) |
| $50,000 to $54,999 | 0 (0.0%) | 0 (0.0%) |
| $55,000 to $64,999 | 12 (32.4%) | 0 (0.0%) |
| $65,000 to $74,999 | 0 (0.0%) | 0 (0.0%) |
| $75,000 to $99,999 | 0 (0.0%) | 0 (0.0%) |
| $100,000+ | 0 (0.0%) | 0 (0.0%) |
| Total | 37 (100.0%) | 45 (100.0%) |
Earnings by Sex by Educational Attainment in Carolina
| Educational Attainment | Male Income | Female Income |
| Less than High School | - | - |
| High School Diploma | - | - |
| College or Associate's Degree | - | - |
| Bachelor's Degree | - | - |
| Graduate Degree | - | - |
| Total | - | - |
Family Income in Carolina
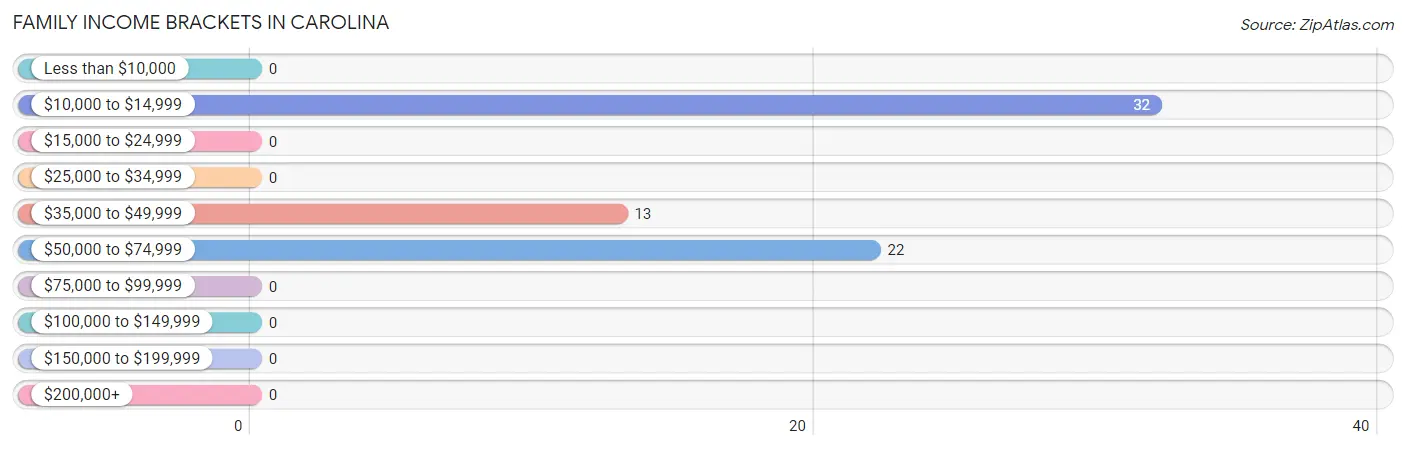
Family Income Brackets in Carolina
According to the Carolina family income data, there are 32 families falling into the $10,000 to $14,999 income range, which is the most common income bracket and makes up 47.8% of all families.
| Income Bracket | # Families | % Families |
| Less than $10,000 | 0 | 0.0% |
| $10,000 to $14,999 | 32 | 47.8% |
| $15,000 to $24,999 | 0 | 0.0% |
| $25,000 to $34,999 | 0 | 0.0% |
| $35,000 to $49,999 | 13 | 19.4% |
| $50,000 to $74,999 | 22 | 32.8% |
| $75,000 to $99,999 | 0 | 0.0% |
| $100,000 to $149,999 | 0 | 0.0% |
| $150,000 to $199,999 | 0 | 0.0% |
| $200,000+ | 0 | 0.0% |
Family Income by Famaliy Size in Carolina
| Income Bracket | # Families | Median Income |
| 2-Person Families | 25 (37.3%) | $0 |
| 3-Person Families | 32 (47.8%) | $0 |
| 4-Person Families | 0 (0.0%) | $0 |
| 5-Person Families | 10 (14.9%) | $0 |
| 6-Person Families | 0 (0.0%) | $0 |
| 7+ Person Families | 0 (0.0%) | $0 |
| Total | 67 (100.0%) | $0 |
Family Income by Number of Earners in Carolina
| Number of Earners | # Families | Median Income |
| No Earners | 12 (17.9%) | $0 |
| 1 Earner | 42 (62.7%) | $0 |
| 2 Earners | 13 (19.4%) | $0 |
| 3+ Earners | 0 (0.0%) | $0 |
| Total | 67 (100.0%) | $0 |
Household Income in Carolina
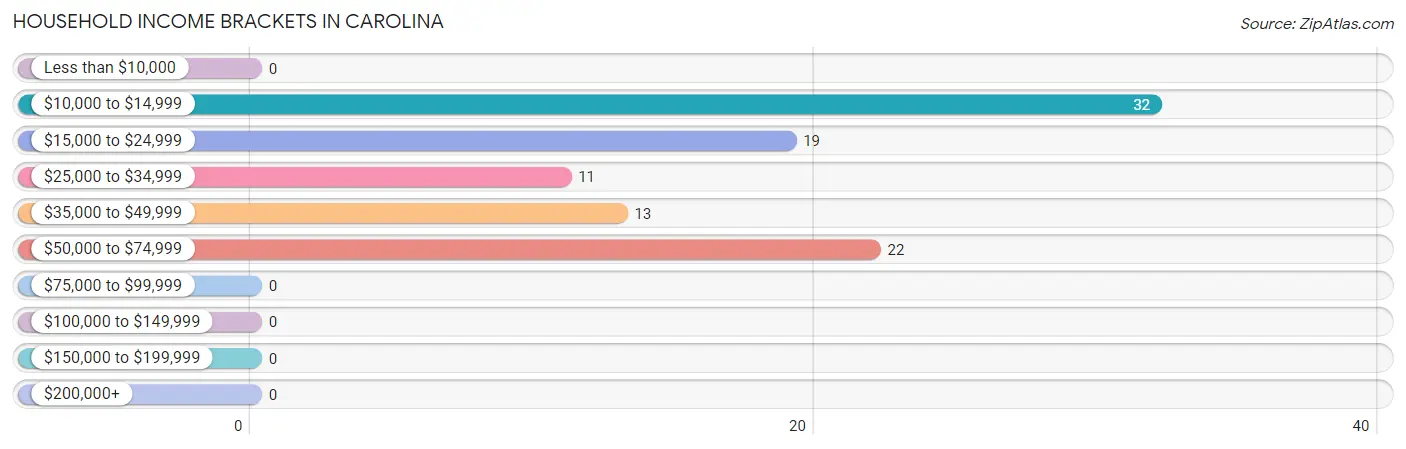
Household Income Brackets in Carolina
With 32 households falling in the category, the $10,000 to $14,999 income range is the most frequent in Carolina, accounting for 33.0% of all households.
| Income Bracket | # Households | % Households |
| Less than $10,000 | 0 | 0.0% |
| $10,000 to $14,999 | 32 | 33.0% |
| $15,000 to $24,999 | 19 | 19.6% |
| $25,000 to $34,999 | 11 | 11.3% |
| $35,000 to $49,999 | 13 | 13.4% |
| $50,000 to $74,999 | 22 | 22.7% |
| $75,000 to $99,999 | 0 | 0.0% |
| $100,000 to $149,999 | 0 | 0.0% |
| $150,000 to $199,999 | 0 | 0.0% |
| $200,000+ | 0 | 0.0% |
Household Income by Householder Age in Carolina
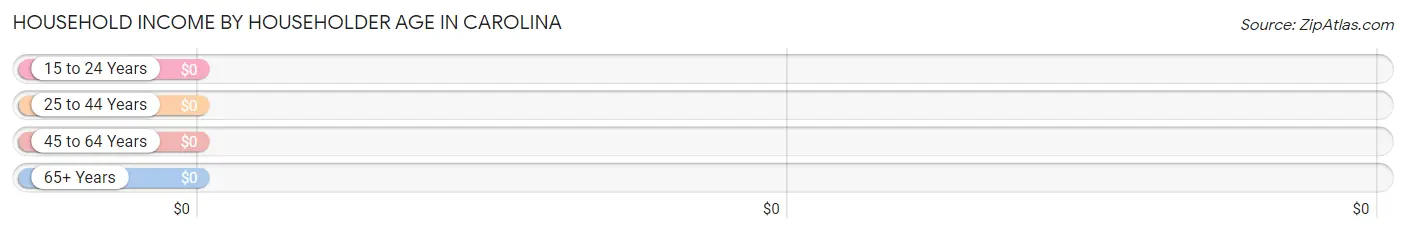
| Income Bracket | # Households | Median Income |
| 15 to 24 Years | 0 (0.0%) | $0 |
| 25 to 44 Years | 42 (43.3%) | $0 |
| 45 to 64 Years | 13 (13.4%) | $0 |
| 65+ Years | 42 (43.3%) | $0 |
| Total | 97 (100.0%) | $0 |
Poverty in Carolina
Income Below Poverty by Sex and Age in Carolina
With 36.4% poverty level for males and 40.9% for females among the residents of Carolina, 18 to 24 year old males and 25 to 34 year old females are the most vulnerable to poverty, with 40 males (100.0%) and 32 females (76.2%) in their respective age groups living below the poverty level.
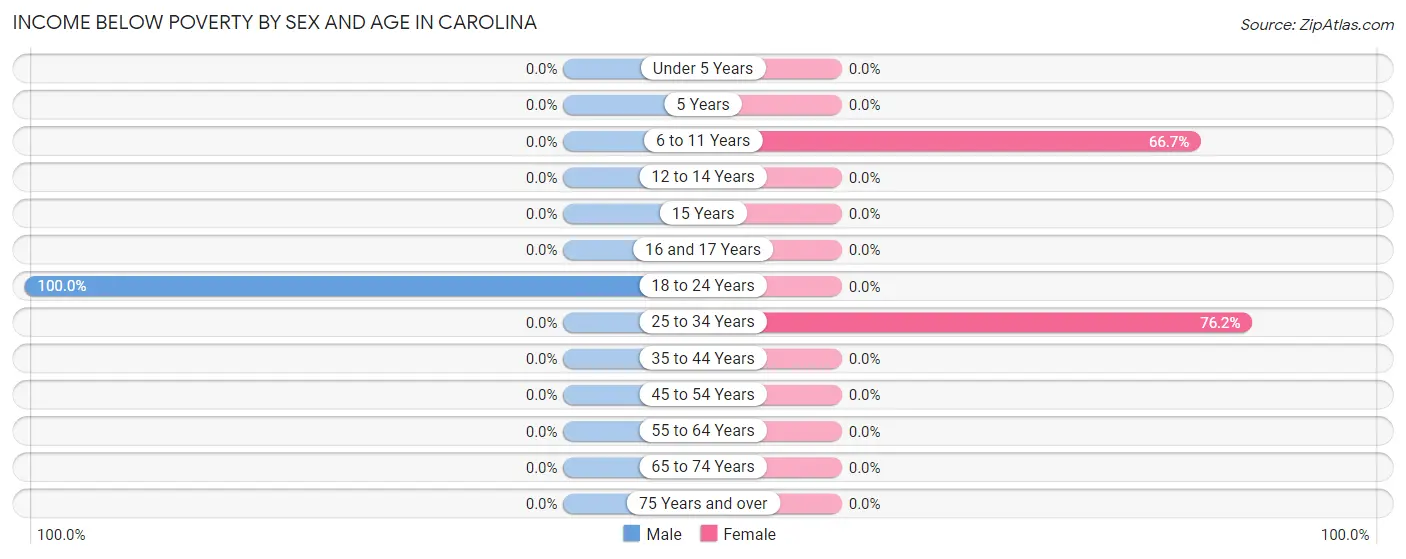
| Age Bracket | Male | Female |
| Under 5 Years | 0 (0.0%) | 0 (0.0%) |
| 5 Years | 0 (0.0%) | 0 (0.0%) |
| 6 to 11 Years | 0 (0.0%) | 20 (66.7%) |
| 12 to 14 Years | 0 (0.0%) | 0 (0.0%) |
| 15 Years | 0 (0.0%) | 0 (0.0%) |
| 16 and 17 Years | 0 (0.0%) | 0 (0.0%) |
| 18 to 24 Years | 40 (100.0%) | 0 (0.0%) |
| 25 to 34 Years | 0 (0.0%) | 32 (76.2%) |
| 35 to 44 Years | 0 (0.0%) | 0 (0.0%) |
| 45 to 54 Years | 0 (0.0%) | 0 (0.0%) |
| 55 to 64 Years | 0 (0.0%) | 0 (0.0%) |
| 65 to 74 Years | 0 (0.0%) | 0 (0.0%) |
| 75 Years and over | 0 (0.0%) | 0 (0.0%) |
| Total | 40 (36.4%) | 52 (40.9%) |
Income Above Poverty by Sex and Age in Carolina
According to the poverty statistics in Carolina, males aged under 5 years and females aged 45 to 54 years are the age groups that are most secure financially, with 100.0% of males and 100.0% of females in these age groups living above the poverty line.
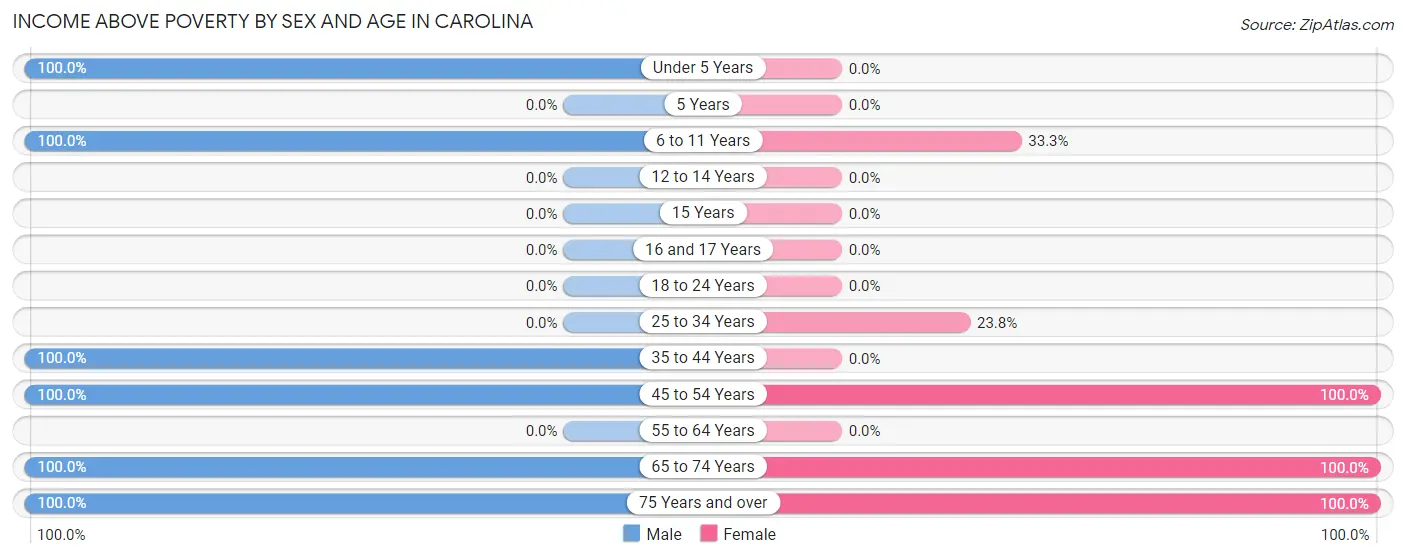
| Age Bracket | Male | Female |
| Under 5 Years | 9 (100.0%) | 0 (0.0%) |
| 5 Years | 0 (0.0%) | 0 (0.0%) |
| 6 to 11 Years | 11 (100.0%) | 10 (33.3%) |
| 12 to 14 Years | 0 (0.0%) | 0 (0.0%) |
| 15 Years | 0 (0.0%) | 0 (0.0%) |
| 16 and 17 Years | 0 (0.0%) | 0 (0.0%) |
| 18 to 24 Years | 0 (0.0%) | 0 (0.0%) |
| 25 to 34 Years | 0 (0.0%) | 10 (23.8%) |
| 35 to 44 Years | 12 (100.0%) | 0 (0.0%) |
| 45 to 54 Years | 25 (100.0%) | 13 (100.0%) |
| 55 to 64 Years | 0 (0.0%) | 0 (0.0%) |
| 65 to 74 Years | 4 (100.0%) | 33 (100.0%) |
| 75 Years and over | 9 (100.0%) | 9 (100.0%) |
| Total | 70 (63.6%) | 75 (59.1%) |
Income Below Poverty Among Married-Couple Families in Carolina
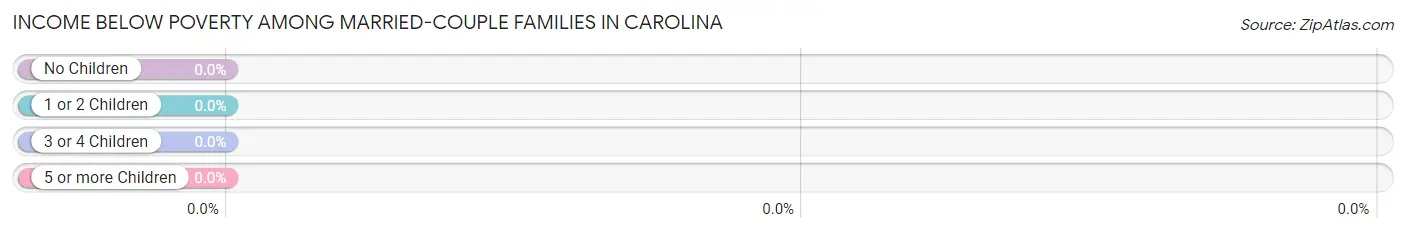
| Children | Above Poverty | Below Poverty |
| No Children | 25 (100.0%) | 0 (0.0%) |
| 1 or 2 Children | 0 (0.0%) | 0 (0.0%) |
| 3 or 4 Children | 10 (100.0%) | 0 (0.0%) |
| 5 or more Children | 0 (0.0%) | 0 (0.0%) |
| Total | 35 (100.0%) | 0 (0.0%) |
Income Below Poverty Among Single-Parent Households in Carolina
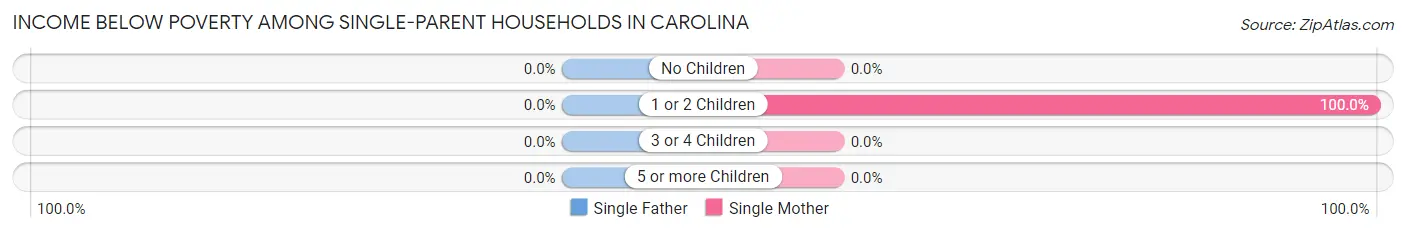
| Children | Single Father | Single Mother |
| No Children | 0 (0.0%) | 0 (0.0%) |
| 1 or 2 Children | 0 (0.0%) | 32 (100.0%) |
| 3 or 4 Children | 0 (0.0%) | 0 (0.0%) |
| 5 or more Children | 0 (0.0%) | 0 (0.0%) |
| Total | 0 (0.0%) | 32 (100.0%) |
Income Below Poverty Among Married-Couple vs Single-Parent Households in Carolina
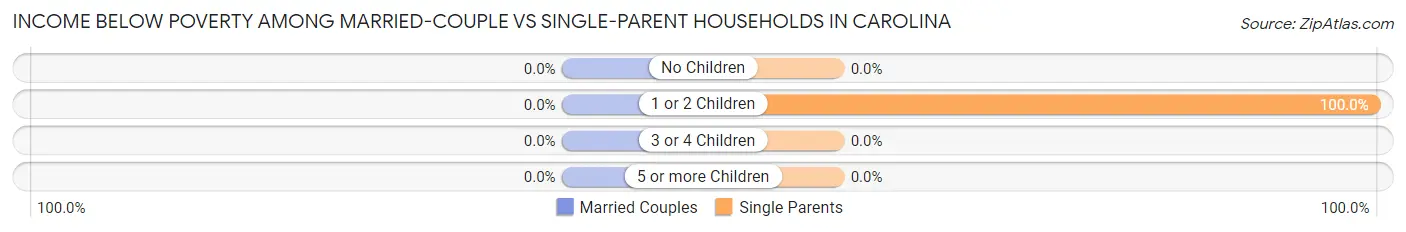
| Children | Married-Couple Families | Single-Parent Households |
| No Children | 0 (0.0%) | 0 (0.0%) |
| 1 or 2 Children | 0 (0.0%) | 32 (100.0%) |
| 3 or 4 Children | 0 (0.0%) | 0 (0.0%) |
| 5 or more Children | 0 (0.0%) | 0 (0.0%) |
| Total | 0 (0.0%) | 32 (100.0%) |
Race in Carolina
The most populous races in Carolina are White / Caucasian (179 | 75.5%), Black / African American (25 | 10.5%), and Two or more Races (20 | 8.4%).
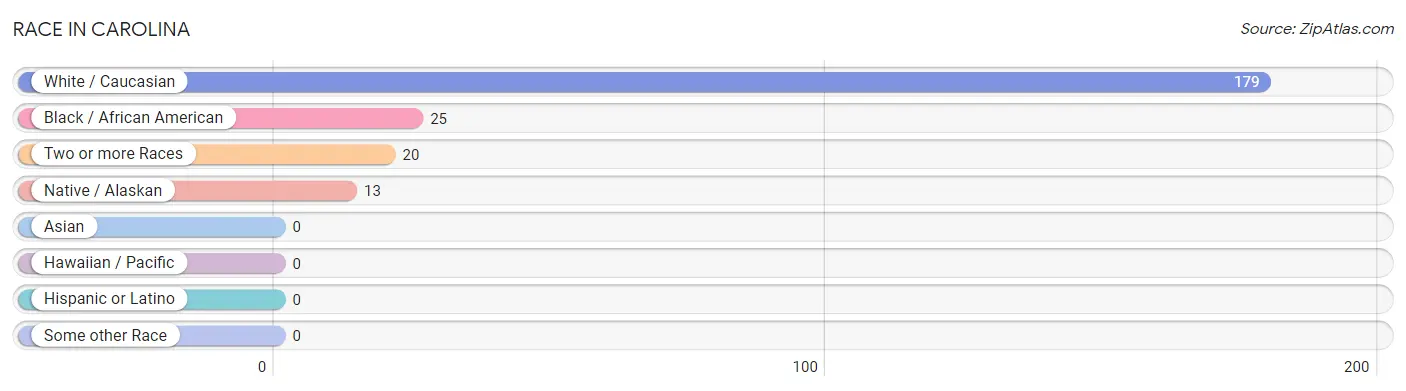
| Race | # Population | % Population |
| Asian | 0 | 0.0% |
| Black / African American | 25 | 10.5% |
| Hawaiian / Pacific | 0 | 0.0% |
| Hispanic or Latino | 0 | 0.0% |
| Native / Alaskan | 13 | 5.5% |
| White / Caucasian | 179 | 75.5% |
| Two or more Races | 20 | 8.4% |
| Some other Race | 0 | 0.0% |
| Total | 237 | 100.0% |
Ancestry in Carolina
The most populous ancestries reported in Carolina are English (49 | 20.7%), Italian (30 | 12.7%), Irish (14 | 5.9%), Yaqui (13 | 5.5%), and Austrian (12 | 5.1%), together accounting for 49.8% of all Carolina residents.
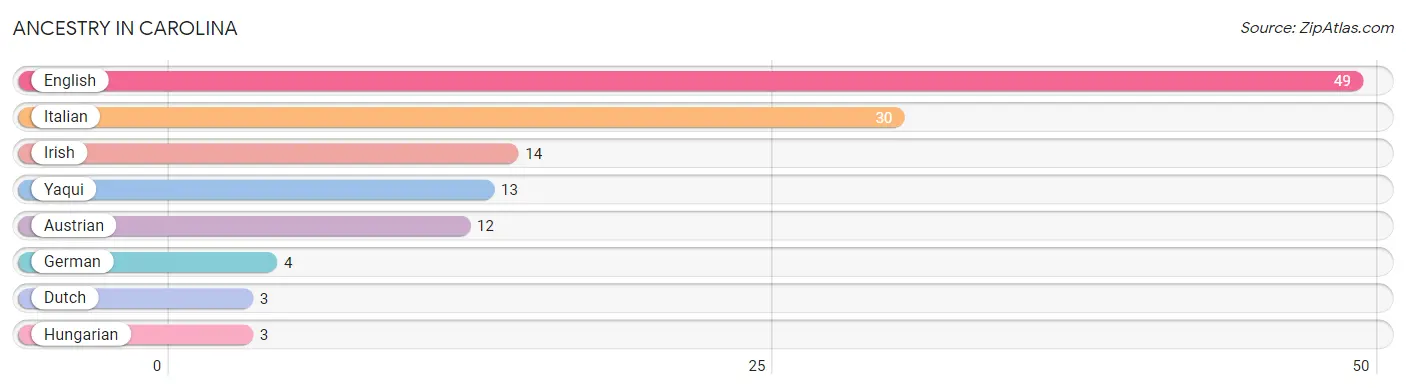
| Ancestry | # Population | % Population |
| Austrian | 12 | 5.1% |
| Dutch | 3 | 1.3% |
| English | 49 | 20.7% |
| German | 4 | 1.7% |
| Hungarian | 3 | 1.3% |
| Irish | 14 | 5.9% |
| Italian | 30 | 12.7% |
| Yaqui | 13 | 5.5% | View All 8 Rows |
Immigrants in Carolina

| Immigration Origin | # Population | % Population | View All 0 Rows |
Sex and Age in Carolina
Sex and Age in Carolina
The most populous age groups in Carolina are 20 to 24 Years (40 | 36.4%) for men and 30 to 34 Years (42 | 33.1%) for women.
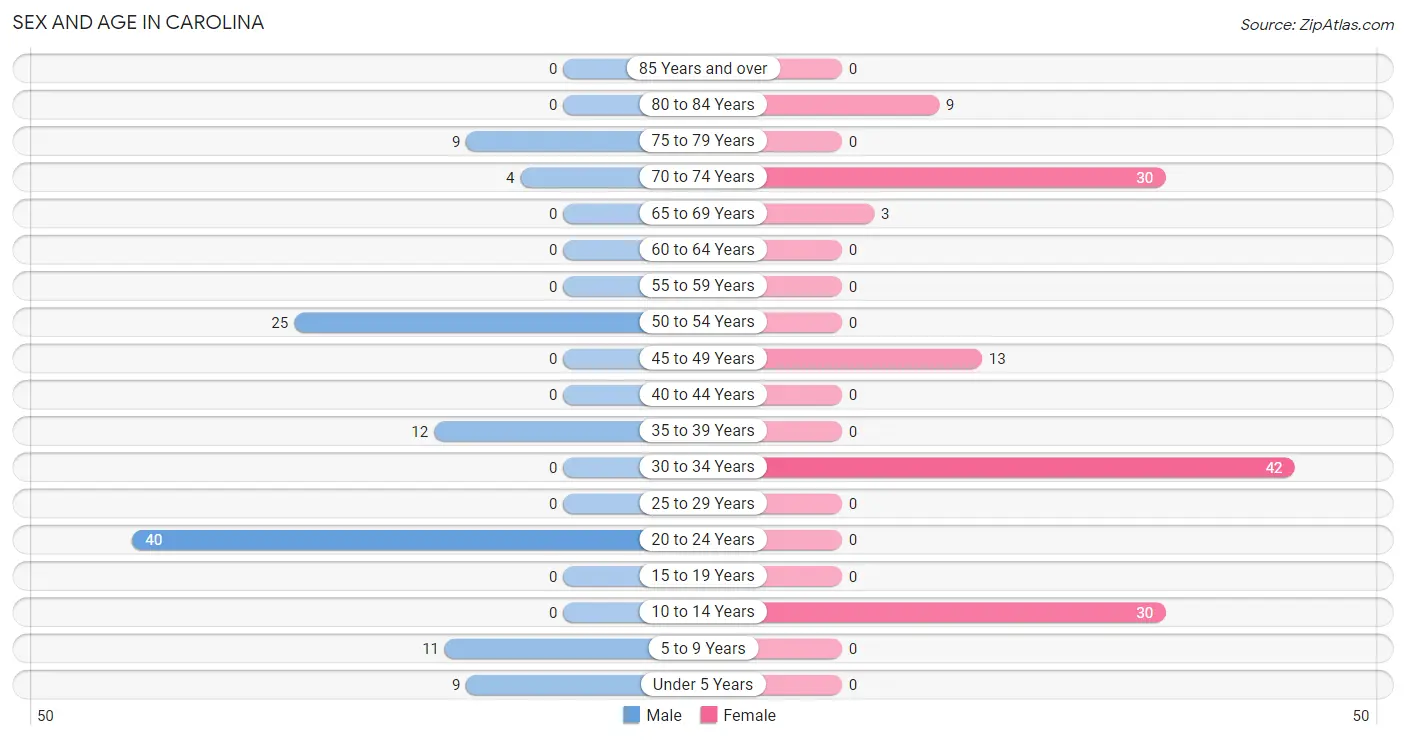
| Age Bracket | Male | Female |
| Under 5 Years | 9 (8.2%) | 0 (0.0%) |
| 5 to 9 Years | 11 (10.0%) | 0 (0.0%) |
| 10 to 14 Years | 0 (0.0%) | 30 (23.6%) |
| 15 to 19 Years | 0 (0.0%) | 0 (0.0%) |
| 20 to 24 Years | 40 (36.4%) | 0 (0.0%) |
| 25 to 29 Years | 0 (0.0%) | 0 (0.0%) |
| 30 to 34 Years | 0 (0.0%) | 42 (33.1%) |
| 35 to 39 Years | 12 (10.9%) | 0 (0.0%) |
| 40 to 44 Years | 0 (0.0%) | 0 (0.0%) |
| 45 to 49 Years | 0 (0.0%) | 13 (10.2%) |
| 50 to 54 Years | 25 (22.7%) | 0 (0.0%) |
| 55 to 59 Years | 0 (0.0%) | 0 (0.0%) |
| 60 to 64 Years | 0 (0.0%) | 0 (0.0%) |
| 65 to 69 Years | 0 (0.0%) | 3 (2.4%) |
| 70 to 74 Years | 4 (3.6%) | 30 (23.6%) |
| 75 to 79 Years | 9 (8.2%) | 0 (0.0%) |
| 80 to 84 Years | 0 (0.0%) | 9 (7.1%) |
| 85 Years and over | 0 (0.0%) | 0 (0.0%) |
| Total | 110 (100.0%) | 127 (100.0%) |
Families and Households in Carolina
Median Family Size in Carolina
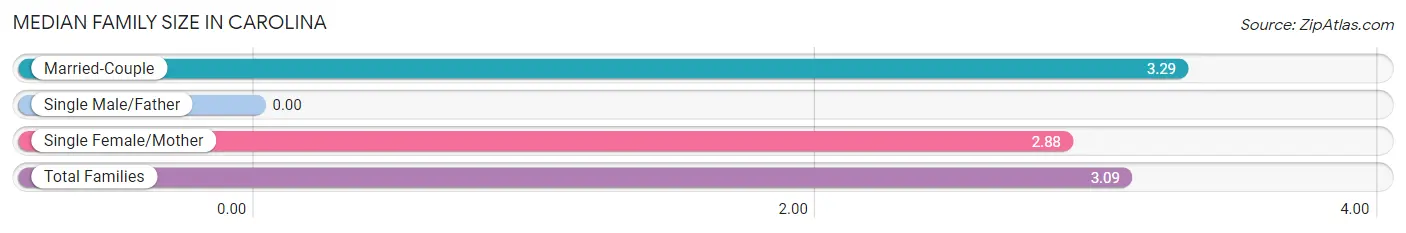
| Family Type | # Families | Family Size |
| Married-Couple | 35 (52.2%) | 3.29 |
| Single Male/Father | 0 (0.0%) | - |
| Single Female/Mother | 32 (47.8%) | 2.88 |
| Total Families | 67 (100.0%) | 3.09 |
Median Household Size in Carolina
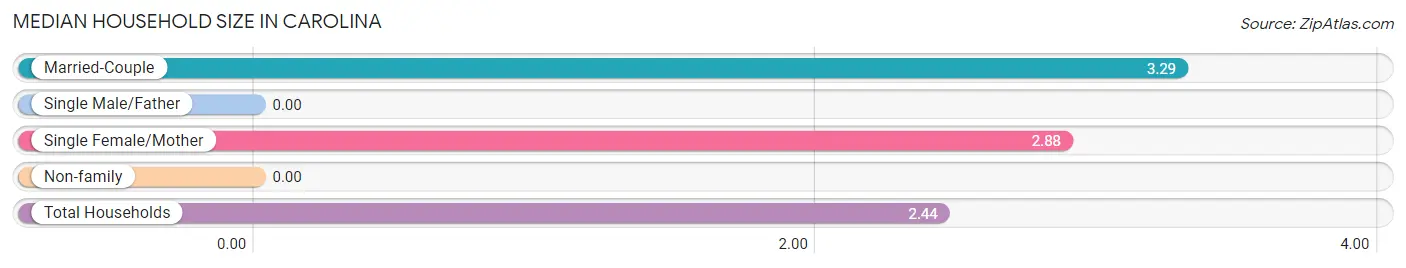
| Household Type | # Households | Household Size |
| Married-Couple | 35 (36.1%) | 3.29 |
| Single Male/Father | 0 (0.0%) | - |
| Single Female/Mother | 32 (33.0%) | 2.88 |
| Non-family | 30 (30.9%) | - |
| Total Households | 97 (100.0%) | 2.44 |
Household Size by Marriage Status in Carolina
Out of a total of 97 households in Carolina, 67 (69.1%) are family households, while 30 (30.9%) are nonfamily households. The most numerous type of family households are 3-person households, comprising 32, and the most common type of nonfamily households are 1-person households, comprising 30.
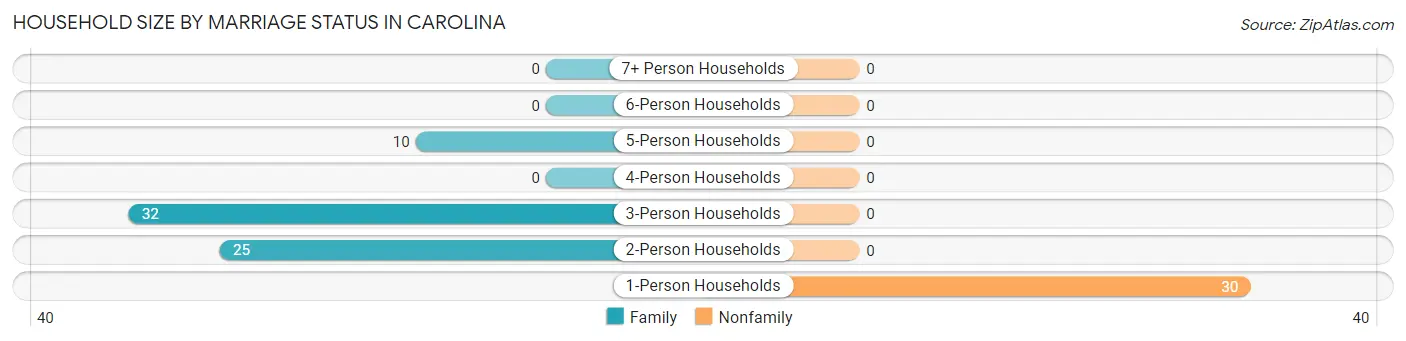
| Household Size | Family Households | Nonfamily Households |
| 1-Person Households | - | 30 (30.9%) |
| 2-Person Households | 25 (25.8%) | 0 (0.0%) |
| 3-Person Households | 32 (33.0%) | 0 (0.0%) |
| 4-Person Households | 0 (0.0%) | 0 (0.0%) |
| 5-Person Households | 10 (10.3%) | 0 (0.0%) |
| 6-Person Households | 0 (0.0%) | 0 (0.0%) |
| 7+ Person Households | 0 (0.0%) | 0 (0.0%) |
| Total | 67 (69.1%) | 30 (30.9%) |
Female Fertility in Carolina
Fertility by Age in Carolina
| Age Bracket | Women with Births | Births / 1,000 Women |
| 15 to 19 years | 0 (0.0%) | 0.0 |
| 20 to 34 years | 0 (0.0%) | 0.0 |
| 35 to 50 years | 0 (0.0%) | 0.0 |
| Total | 0 (0.0%) | 0.0 |
Fertility by Age by Marriage Status in Carolina
| Age Bracket | Married | Unmarried |
| 15 to 19 years | 0 (0.0%) | 0 (0.0%) |
| 20 to 34 years | 0 (0.0%) | 0 (0.0%) |
| 35 to 50 years | 0 (0.0%) | 0 (0.0%) |
| Total | 0 (0.0%) | 0 (0.0%) |
Fertility by Education in Carolina
| Educational Attainment | Women with Births | Births / 1,000 Women |
| Less than High School | 0 (0.0%) | 0.0 |
| High School Diploma | 0 (0.0%) | 0.0 |
| College or Associate's Degree | 0 (0.0%) | 0.0 |
| Bachelor's Degree | 0 (0.0%) | 0.0 |
| Graduate Degree | 0 (0.0%) | 0.0 |
| Total | 0 (0.0%) | 0.0 |
Fertility by Education by Marriage Status in Carolina
| Educational Attainment | Married | Unmarried |
| Less than High School | 0 (0.0%) | 0 (0.0%) |
| High School Diploma | 0 (0.0%) | 0 (0.0%) |
| College or Associate's Degree | 0 (0.0%) | 0 (0.0%) |
| Bachelor's Degree | 0 (0.0%) | 0 (0.0%) |
| Graduate Degree | 0 (0.0%) | 0 (0.0%) |
| Total | 0 (0.0%) | 0 (0.0%) |
Employment Characteristics in Carolina
Employment by Class of Employer in Carolina
Among the 57 employed individuals in Carolina, , and private company employees (57 | 100.0%) make up the most common classes of employment.
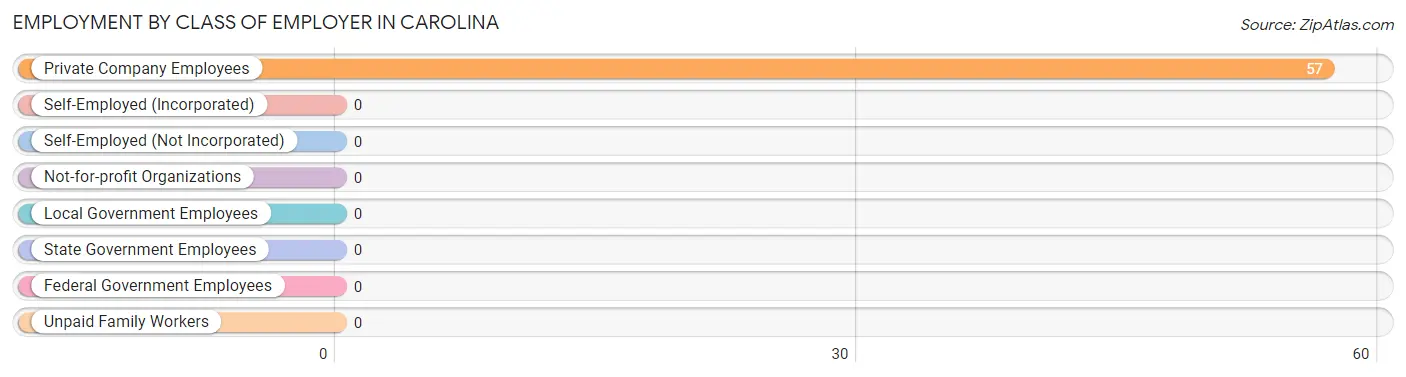
| Employer Class | # Employees | % Employees |
| Private Company Employees | 57 | 100.0% |
| Self-Employed (Incorporated) | 0 | 0.0% |
| Self-Employed (Not Incorporated) | 0 | 0.0% |
| Not-for-profit Organizations | 0 | 0.0% |
| Local Government Employees | 0 | 0.0% |
| State Government Employees | 0 | 0.0% |
| Federal Government Employees | 0 | 0.0% |
| Unpaid Family Workers | 0 | 0.0% |
| Total | 57 | 100.0% |
Employment Status by Age in Carolina
According to the labor force statistics for Carolina, out of the total population over 16 years of age (187), 43.9% or 82 individuals are in the labor force, with 30.5% or 25 of them unemployed. The age group with the highest labor force participation rate is 35 to 44 years, with 100.0% or 12 individuals in the labor force. Within the labor force, the 45 to 54 years age range has the highest percentage of unemployed individuals, with 65.8% or 25 of them being unemployed.
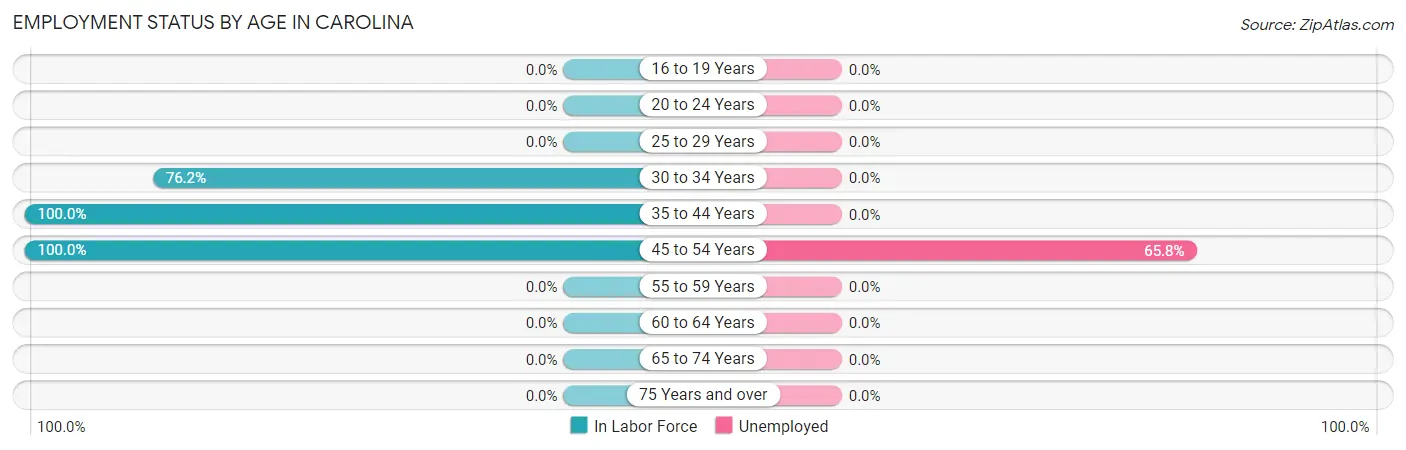
| Age Bracket | In Labor Force | Unemployed |
| 16 to 19 Years | 0 (0.0%) | 0 (0.0%) |
| 20 to 24 Years | 0 (0.0%) | 0 (0.0%) |
| 25 to 29 Years | 0 (0.0%) | 0 (0.0%) |
| 30 to 34 Years | 32 (76.2%) | 0 (0.0%) |
| 35 to 44 Years | 12 (100.0%) | 0 (0.0%) |
| 45 to 54 Years | 38 (100.0%) | 25 (65.8%) |
| 55 to 59 Years | 0 (0.0%) | 0 (0.0%) |
| 60 to 64 Years | 0 (0.0%) | 0 (0.0%) |
| 65 to 74 Years | 0 (0.0%) | 0 (0.0%) |
| 75 Years and over | 0 (0.0%) | 0 (0.0%) |
| Total | 82 (43.9%) | 25 (30.5%) |
Employment Status by Educational Attainment in Carolina
According to labor force statistics for Carolina, 89.1% of individuals (82) out of the total population between 25 and 64 years of age (92) are in the labor force, with 30.5% or 25 of them being unemployed. The group with the highest labor force participation rate are those with the educational attainment of college / associate degree, with 100.0% or 44 individuals in the labor force. Within the labor force, individuals with high school diploma education have the highest percentage of unemployment, with 65.8% or 25 of them being unemployed.
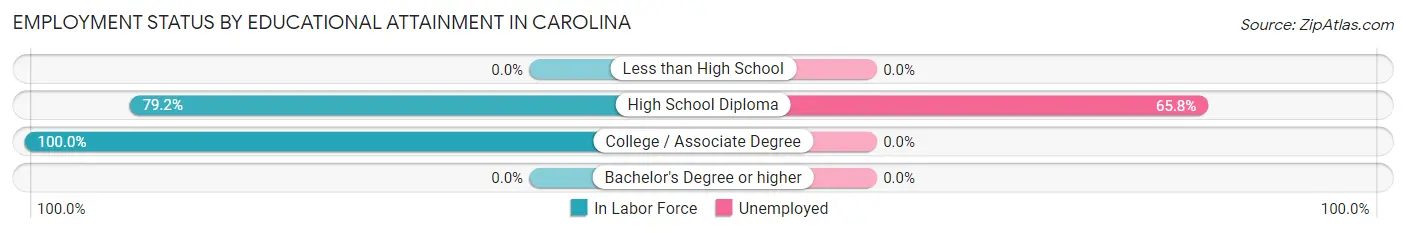
| Educational Attainment | In Labor Force | Unemployed |
| Less than High School | 0 (0.0%) | 0 (0.0%) |
| High School Diploma | 38 (79.2%) | 32 (65.8%) |
| College / Associate Degree | 44 (100.0%) | 0 (0.0%) |
| Bachelor's Degree or higher | 0 (0.0%) | 0 (0.0%) |
| Total | 82 (89.1%) | 28 (30.5%) |
Employment Occupations by Sex in Carolina
Management, Business, Science and Arts Occupations
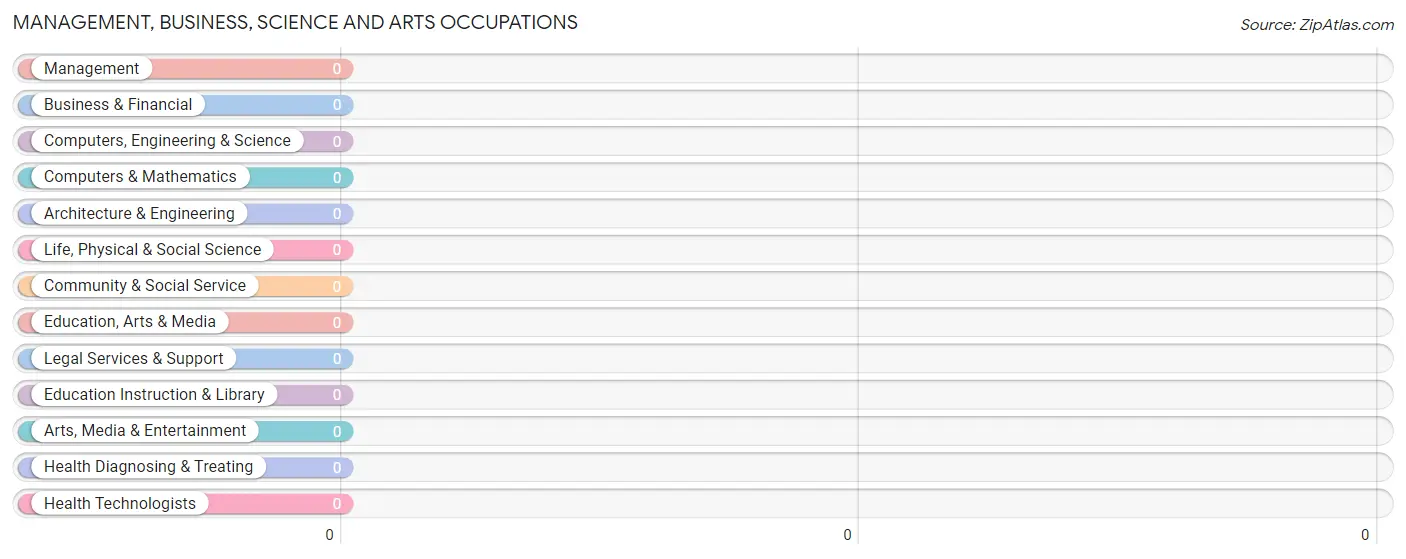
Management, Business, Science and Arts Occupations by Sex
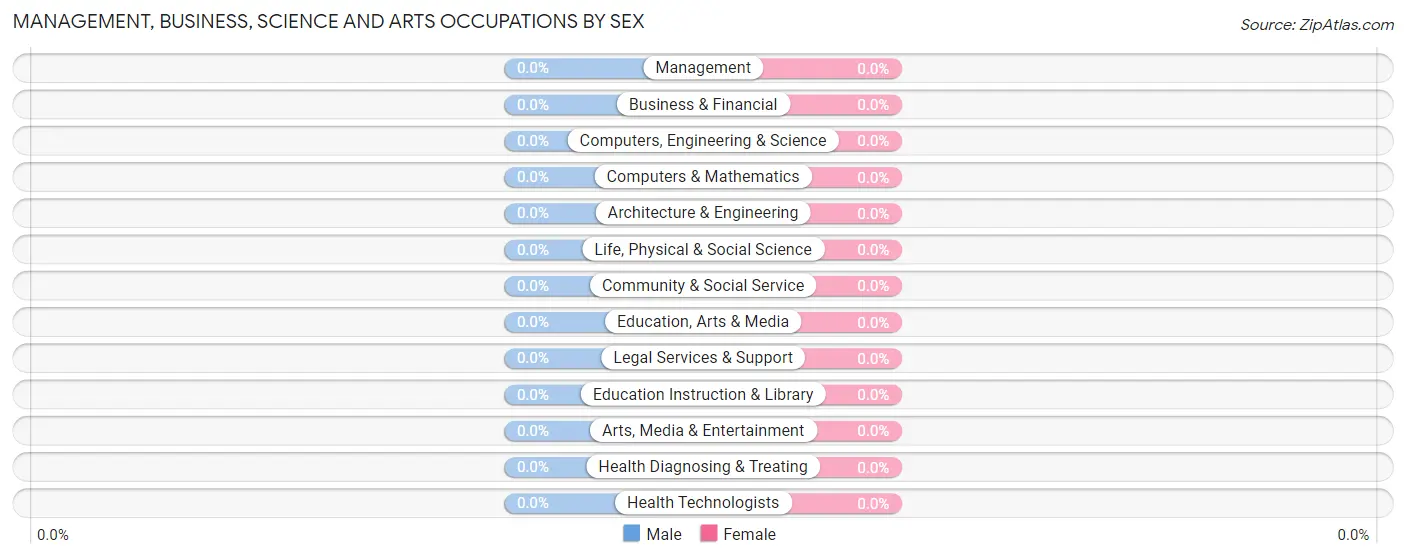
| Occupation | Male | Female |
| Management | 0 (0.0%) | 0 (0.0%) |
| Business & Financial | 0 (0.0%) | 0 (0.0%) |
| Computers, Engineering & Science | 0 (0.0%) | 0 (0.0%) |
| Computers & Mathematics | 0 (0.0%) | 0 (0.0%) |
| Architecture & Engineering | 0 (0.0%) | 0 (0.0%) |
| Life, Physical & Social Science | 0 (0.0%) | 0 (0.0%) |
| Community & Social Service | 0 (0.0%) | 0 (0.0%) |
| Education, Arts & Media | 0 (0.0%) | 0 (0.0%) |
| Legal Services & Support | 0 (0.0%) | 0 (0.0%) |
| Education Instruction & Library | 0 (0.0%) | 0 (0.0%) |
| Arts, Media & Entertainment | 0 (0.0%) | 0 (0.0%) |
| Health Diagnosing & Treating | 0 (0.0%) | 0 (0.0%) |
| Health Technologists | 0 (0.0%) | 0 (0.0%) |
| Total (Category) | 0 (0.0%) | 0 (0.0%) |
| Total (Overall) | 12 (21.0%) | 45 (78.9%) |
Services Occupations
The most common Services occupations in Carolina are , and Food Preparation & Serving (32 | 56.1%).
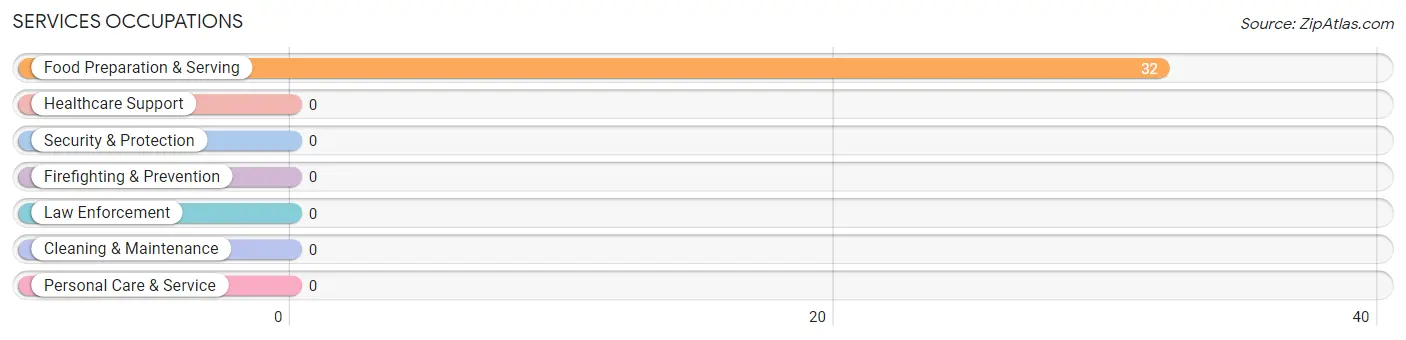
Services Occupations by Sex
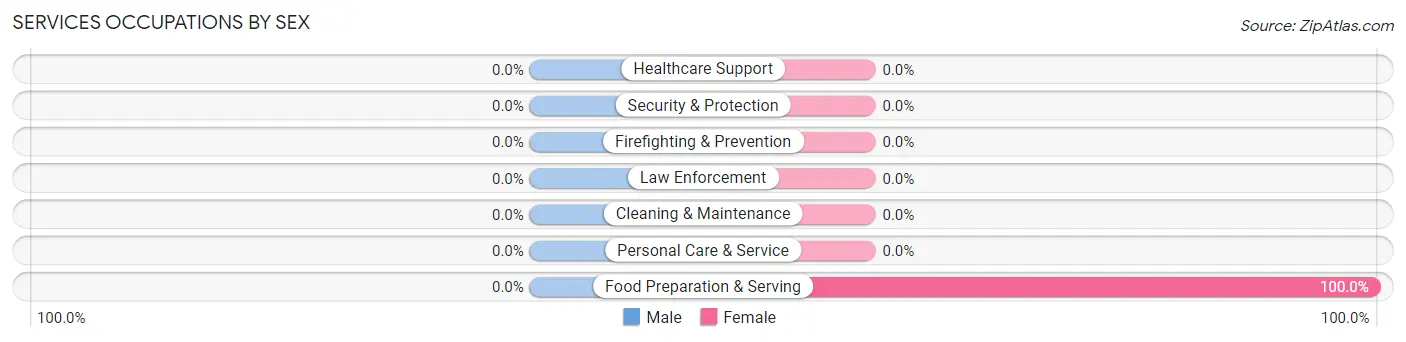
| Occupation | Male | Female |
| Healthcare Support | 0 (0.0%) | 0 (0.0%) |
| Security & Protection | 0 (0.0%) | 0 (0.0%) |
| Firefighting & Prevention | 0 (0.0%) | 0 (0.0%) |
| Law Enforcement | 0 (0.0%) | 0 (0.0%) |
| Food Preparation & Serving | 0 (0.0%) | 32 (100.0%) |
| Cleaning & Maintenance | 0 (0.0%) | 0 (0.0%) |
| Personal Care & Service | 0 (0.0%) | 0 (0.0%) |
| Total (Category) | 0 (0.0%) | 32 (100.0%) |
| Total (Overall) | 12 (21.0%) | 45 (78.9%) |
Sales and Office Occupations
The most common Sales and Office occupations in Carolina are , and Sales & Related (13 | 22.8%).
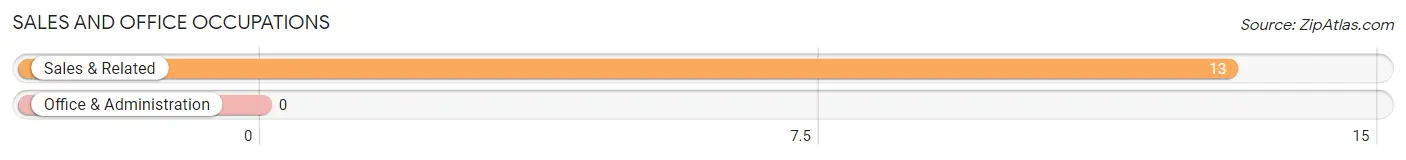
Sales and Office Occupations by Sex
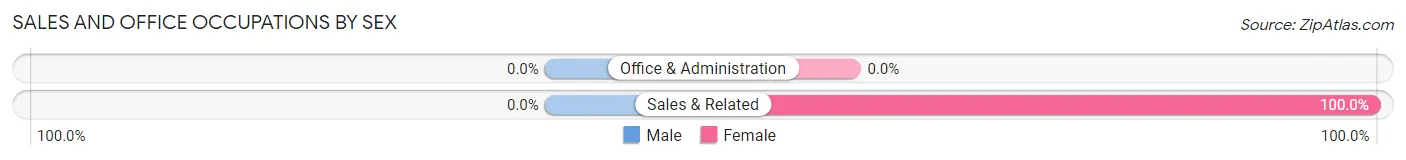
| Occupation | Male | Female |
| Sales & Related | 0 (0.0%) | 13 (100.0%) |
| Office & Administration | 0 (0.0%) | 0 (0.0%) |
| Total (Category) | 0 (0.0%) | 13 (100.0%) |
| Total (Overall) | 12 (21.0%) | 45 (78.9%) |
Natural Resources, Construction and Maintenance Occupations
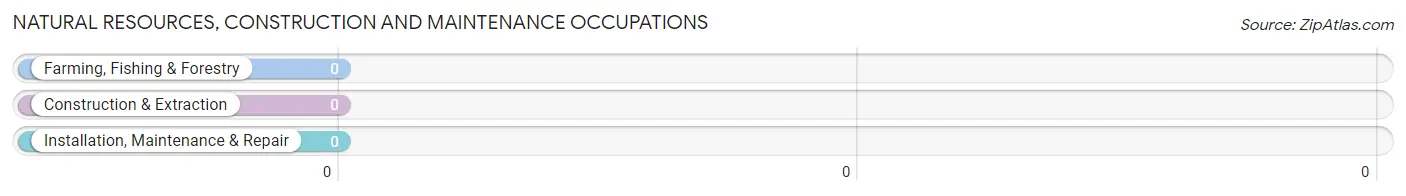
Natural Resources, Construction and Maintenance Occupations by Sex
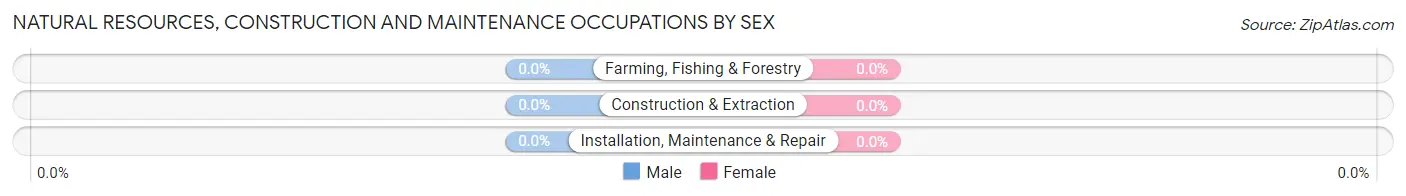
| Occupation | Male | Female |
| Farming, Fishing & Forestry | 0 (0.0%) | 0 (0.0%) |
| Construction & Extraction | 0 (0.0%) | 0 (0.0%) |
| Installation, Maintenance & Repair | 0 (0.0%) | 0 (0.0%) |
| Total (Category) | 0 (0.0%) | 0 (0.0%) |
| Total (Overall) | 12 (21.0%) | 45 (78.9%) |
Production, Transportation and Moving Occupations
The most common Production, Transportation and Moving occupations in Carolina are , and Production (12 | 21.0%).
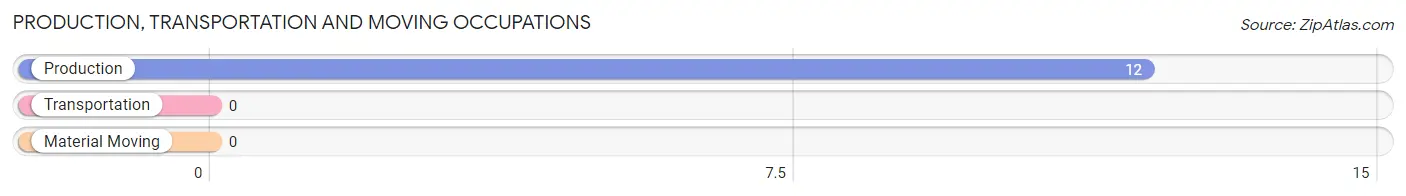
Production, Transportation and Moving Occupations by Sex
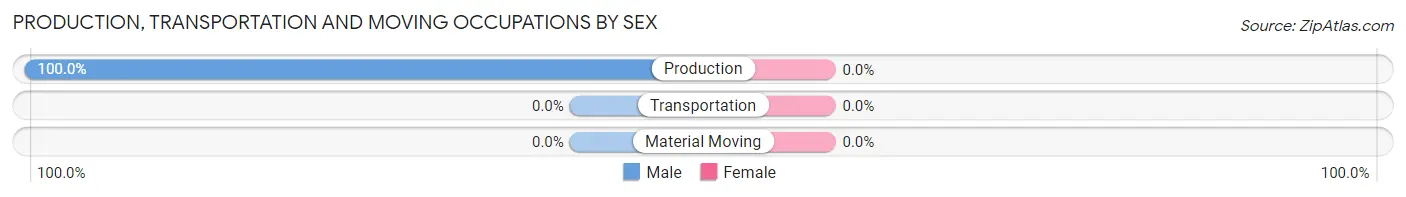
| Occupation | Male | Female |
| Production | 12 (100.0%) | 0 (0.0%) |
| Transportation | 0 (0.0%) | 0 (0.0%) |
| Material Moving | 0 (0.0%) | 0 (0.0%) |
| Total (Category) | 12 (100.0%) | 0 (0.0%) |
| Total (Overall) | 12 (21.0%) | 45 (78.9%) |
Employment Industries by Sex in Carolina
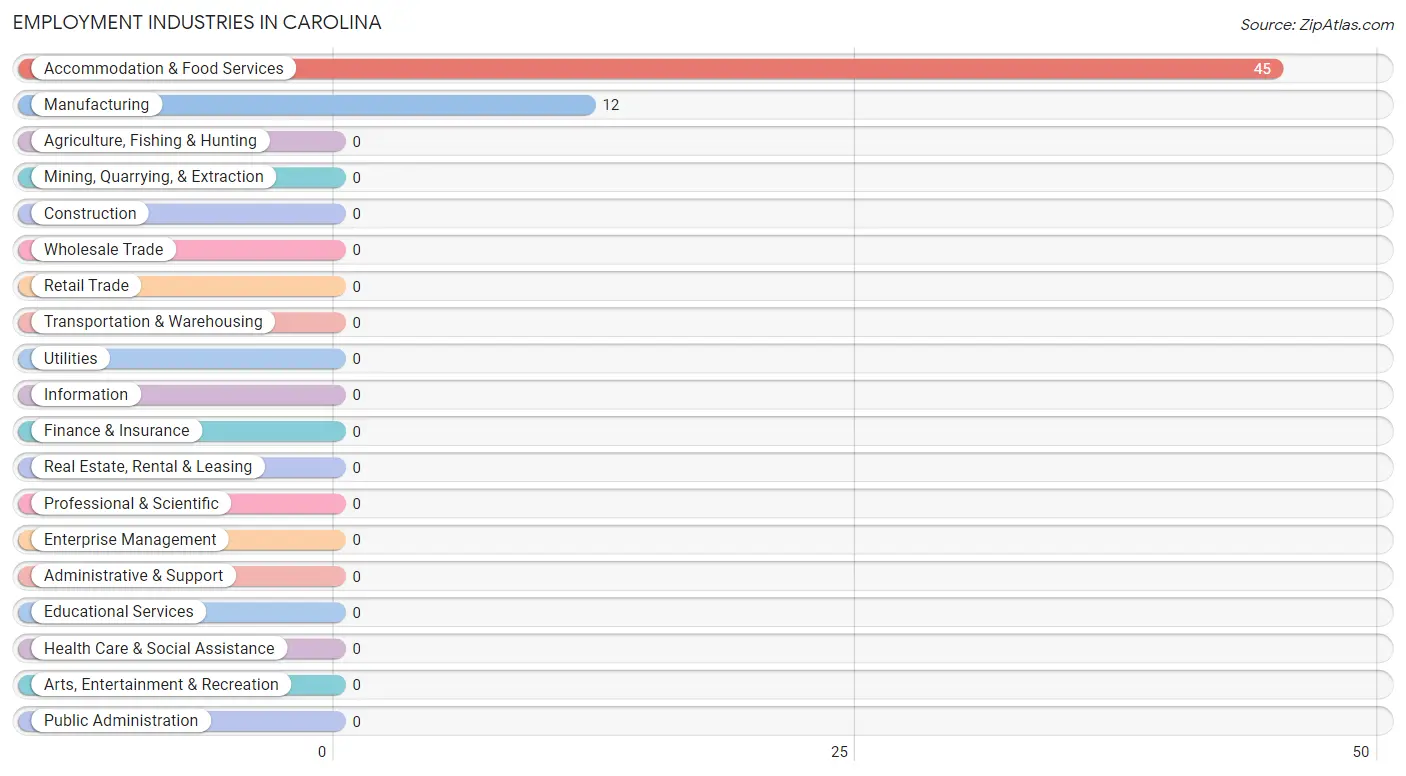
Employment Industries in Carolina
The major employment industries in Carolina include Accommodation & Food Services (45 | 78.9%), and Manufacturing (12 | 21.0%).
Employment Industries by Sex in Carolina
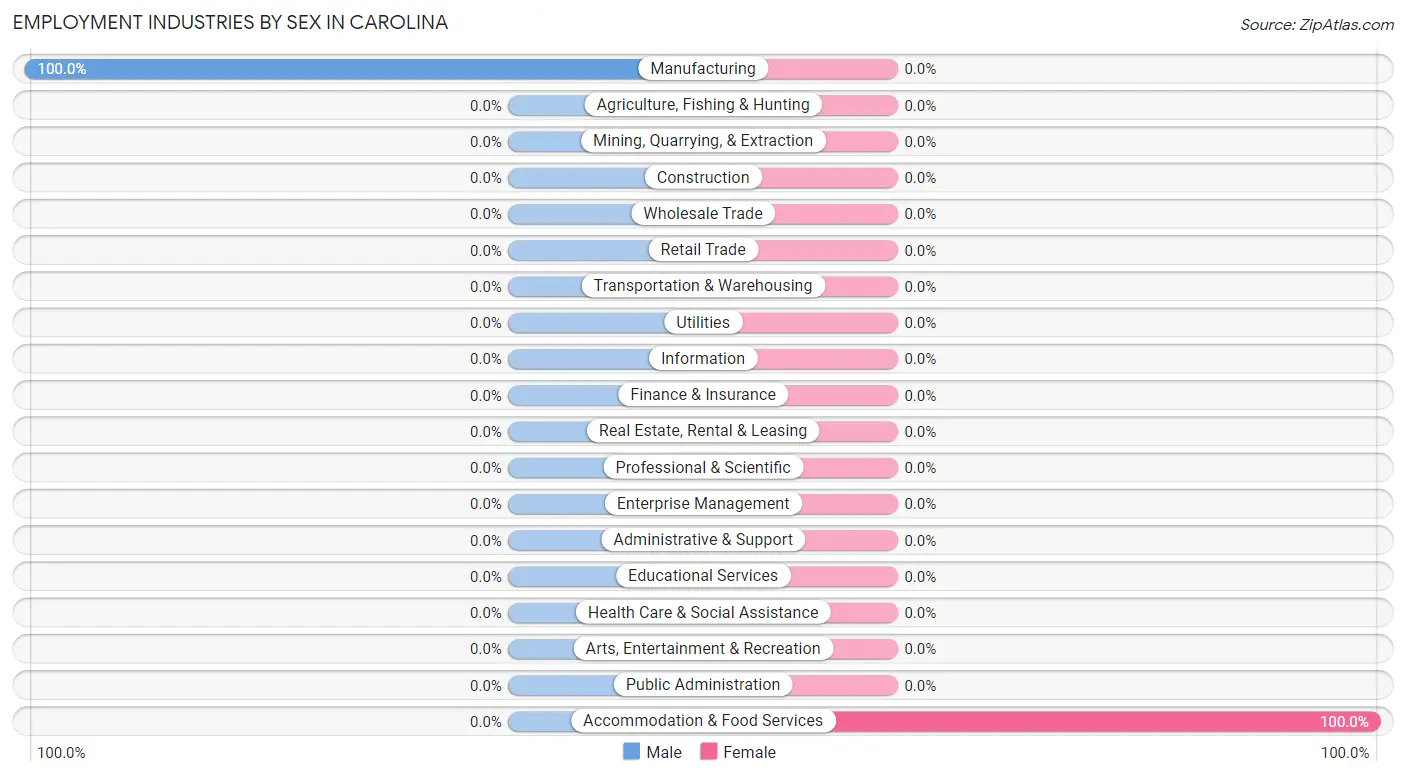
| Industry | Male | Female |
| Agriculture, Fishing & Hunting | 0 (0.0%) | 0 (0.0%) |
| Mining, Quarrying, & Extraction | 0 (0.0%) | 0 (0.0%) |
| Construction | 0 (0.0%) | 0 (0.0%) |
| Manufacturing | 12 (100.0%) | 0 (0.0%) |
| Wholesale Trade | 0 (0.0%) | 0 (0.0%) |
| Retail Trade | 0 (0.0%) | 0 (0.0%) |
| Transportation & Warehousing | 0 (0.0%) | 0 (0.0%) |
| Utilities | 0 (0.0%) | 0 (0.0%) |
| Information | 0 (0.0%) | 0 (0.0%) |
| Finance & Insurance | 0 (0.0%) | 0 (0.0%) |
| Real Estate, Rental & Leasing | 0 (0.0%) | 0 (0.0%) |
| Professional & Scientific | 0 (0.0%) | 0 (0.0%) |
| Enterprise Management | 0 (0.0%) | 0 (0.0%) |
| Administrative & Support | 0 (0.0%) | 0 (0.0%) |
| Educational Services | 0 (0.0%) | 0 (0.0%) |
| Health Care & Social Assistance | 0 (0.0%) | 0 (0.0%) |
| Arts, Entertainment & Recreation | 0 (0.0%) | 0 (0.0%) |
| Accommodation & Food Services | 0 (0.0%) | 45 (100.0%) |
| Public Administration | 0 (0.0%) | 0 (0.0%) |
| Total | 12 (21.0%) | 45 (78.9%) |
Education in Carolina
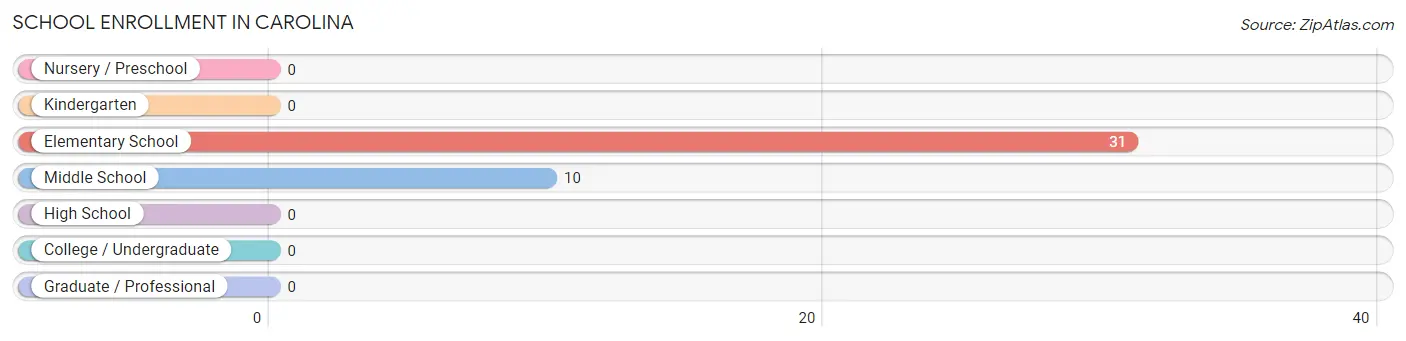
School Enrollment in Carolina
The most common levels of schooling among the 41 students in Carolina are elementary school (31 | 75.6%), and middle school (10 | 24.4%).
| School Level | # Students | % Students |
| Nursery / Preschool | 0 | 0.0% |
| Kindergarten | 0 | 0.0% |
| Elementary School | 31 | 75.6% |
| Middle School | 10 | 24.4% |
| High School | 0 | 0.0% |
| College / Undergraduate | 0 | 0.0% |
| Graduate / Professional | 0 | 0.0% |
| Total | 41 | 100.0% |
School Enrollment by Age by Funding Source in Carolina
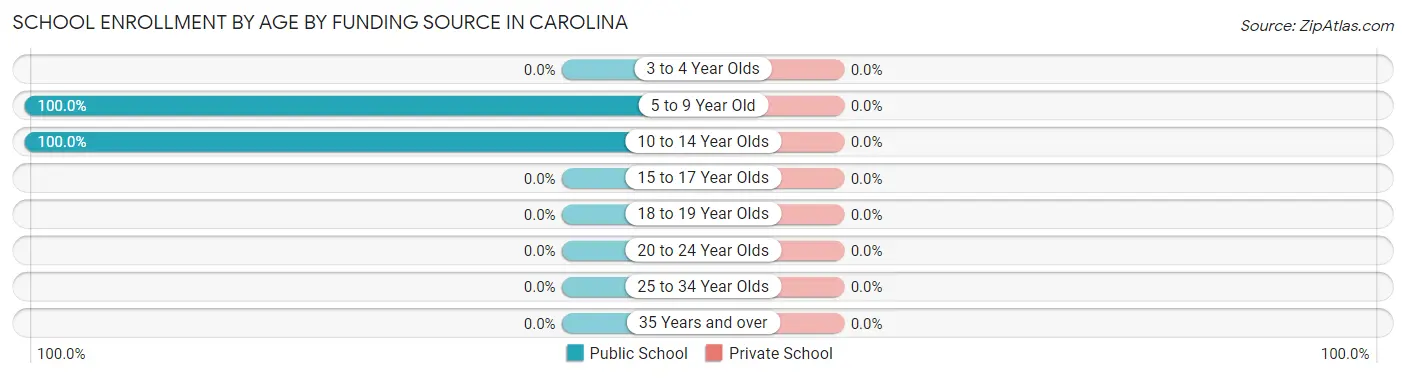
| Age Bracket | Public School | Private School |
| 3 to 4 Year Olds | 0 (0.0%) | 0 (0.0%) |
| 5 to 9 Year Old | 11 (100.0%) | 0 (0.0%) |
| 10 to 14 Year Olds | 30 (100.0%) | 0 (0.0%) |
| 15 to 17 Year Olds | 0 (0.0%) | 0 (0.0%) |
| 18 to 19 Year Olds | 0 (0.0%) | 0 (0.0%) |
| 20 to 24 Year Olds | 0 (0.0%) | 0 (0.0%) |
| 25 to 34 Year Olds | 0 (0.0%) | 0 (0.0%) |
| 35 Years and over | 0 (0.0%) | 0 (0.0%) |
| Total | 41 (100.0%) | 0 (0.0%) |
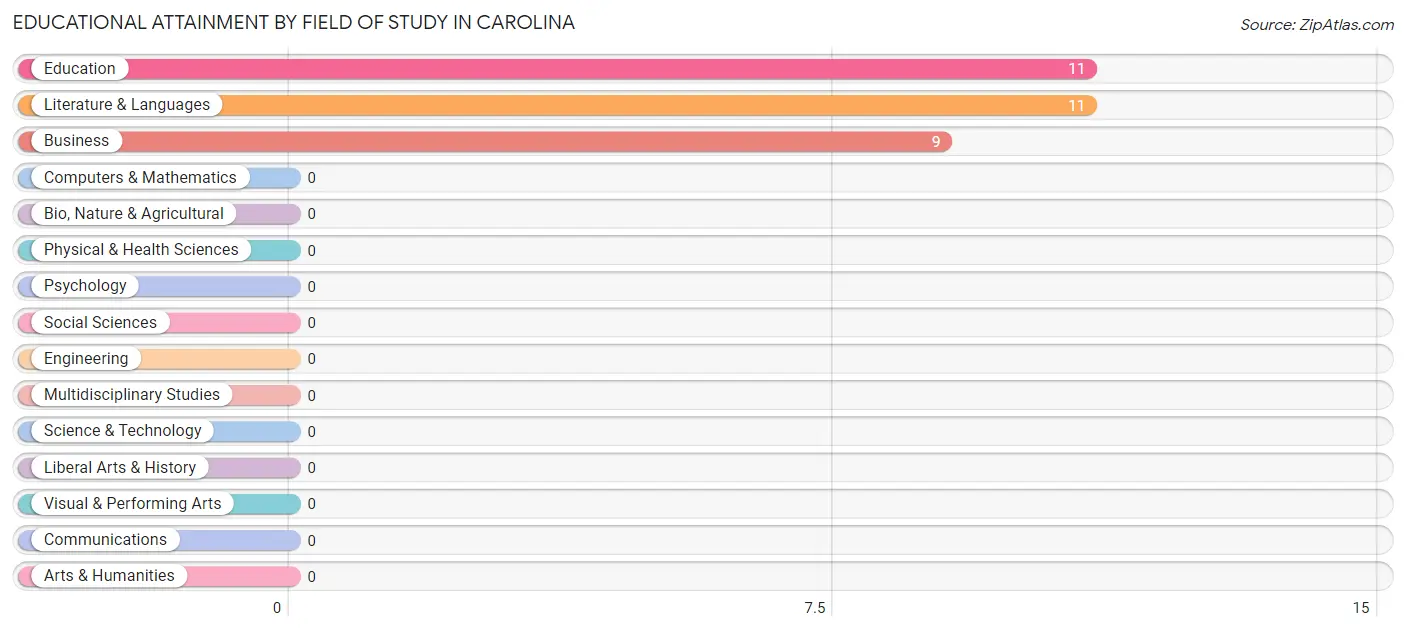
Educational Attainment by Field of Study in Carolina
Education (11 | 35.5%), literature & languages (11 | 35.5%), and business (9 | 29.0%) are the most common fields of study among 31 individuals in Carolina who have obtained a bachelor's degree or higher.
| Field of Study | # Graduates | % Graduates |
| Computers & Mathematics | 0 | 0.0% |
| Bio, Nature & Agricultural | 0 | 0.0% |
| Physical & Health Sciences | 0 | 0.0% |
| Psychology | 0 | 0.0% |
| Social Sciences | 0 | 0.0% |
| Engineering | 0 | 0.0% |
| Multidisciplinary Studies | 0 | 0.0% |
| Science & Technology | 0 | 0.0% |
| Business | 9 | 29.0% |
| Education | 11 | 35.5% |
| Literature & Languages | 11 | 35.5% |
| Liberal Arts & History | 0 | 0.0% |
| Visual & Performing Arts | 0 | 0.0% |
| Communications | 0 | 0.0% |
| Arts & Humanities | 0 | 0.0% |
| Total | 31 | 100.0% |
Transportation & Commute in Carolina
Vehicle Availability by Sex in Carolina
The most prevalent vehicle ownership categories in Carolina are males with 3 vehicles (12, accounting for 100.0%) and females with 3 vehicles (0, making up 26.7%).
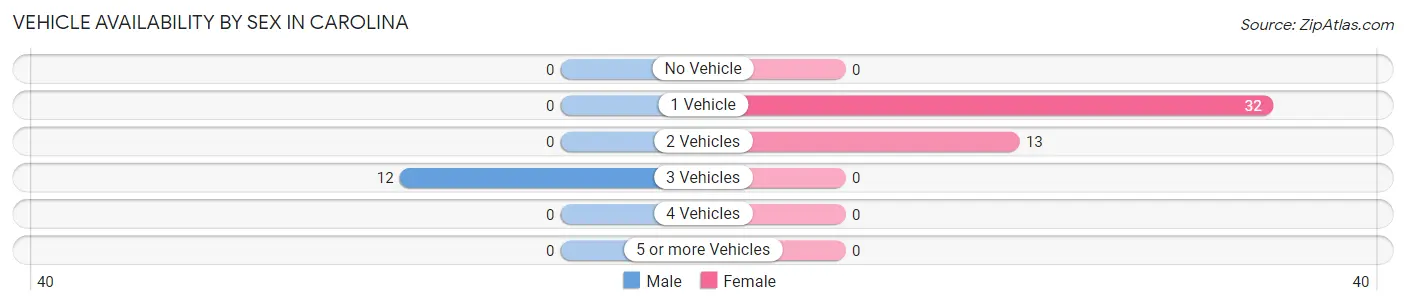
| Vehicles Available | Male | Female |
| No Vehicle | 0 (0.0%) | 0 (0.0%) |
| 1 Vehicle | 0 (0.0%) | 32 (71.1%) |
| 2 Vehicles | 0 (0.0%) | 13 (28.9%) |
| 3 Vehicles | 12 (100.0%) | 0 (0.0%) |
| 4 Vehicles | 0 (0.0%) | 0 (0.0%) |
| 5 or more Vehicles | 0 (0.0%) | 0 (0.0%) |
| Total | 12 (100.0%) | 45 (100.0%) |
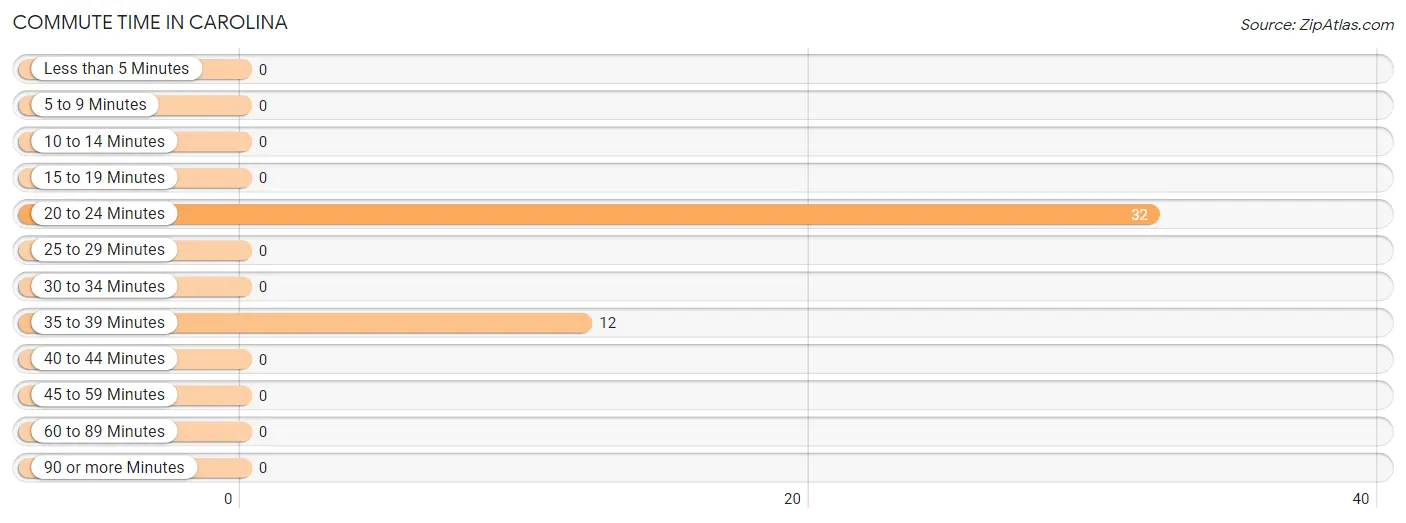
Commute Time in Carolina
The most frequently occuring commute durations in Carolina are 20 to 24 minutes (32 commuters, 72.7%), 35 to 39 minutes (12 commuters, 27.3%), and less than 5 minutes (0 commuters, 0.0%).
| Commute Time | # Commuters | % Commuters |
| Less than 5 Minutes | 0 | 0.0% |
| 5 to 9 Minutes | 0 | 0.0% |
| 10 to 14 Minutes | 0 | 0.0% |
| 15 to 19 Minutes | 0 | 0.0% |
| 20 to 24 Minutes | 32 | 72.7% |
| 25 to 29 Minutes | 0 | 0.0% |
| 30 to 34 Minutes | 0 | 0.0% |
| 35 to 39 Minutes | 12 | 27.3% |
| 40 to 44 Minutes | 0 | 0.0% |
| 45 to 59 Minutes | 0 | 0.0% |
| 60 to 89 Minutes | 0 | 0.0% |
| 90 or more Minutes | 0 | 0.0% |
Commute Time by Sex in Carolina
The most common commute times in Carolina are 35 to 39 minutes (12 commuters, 100.0%) for males and 20 to 24 minutes (32 commuters, 100.0%) for females.
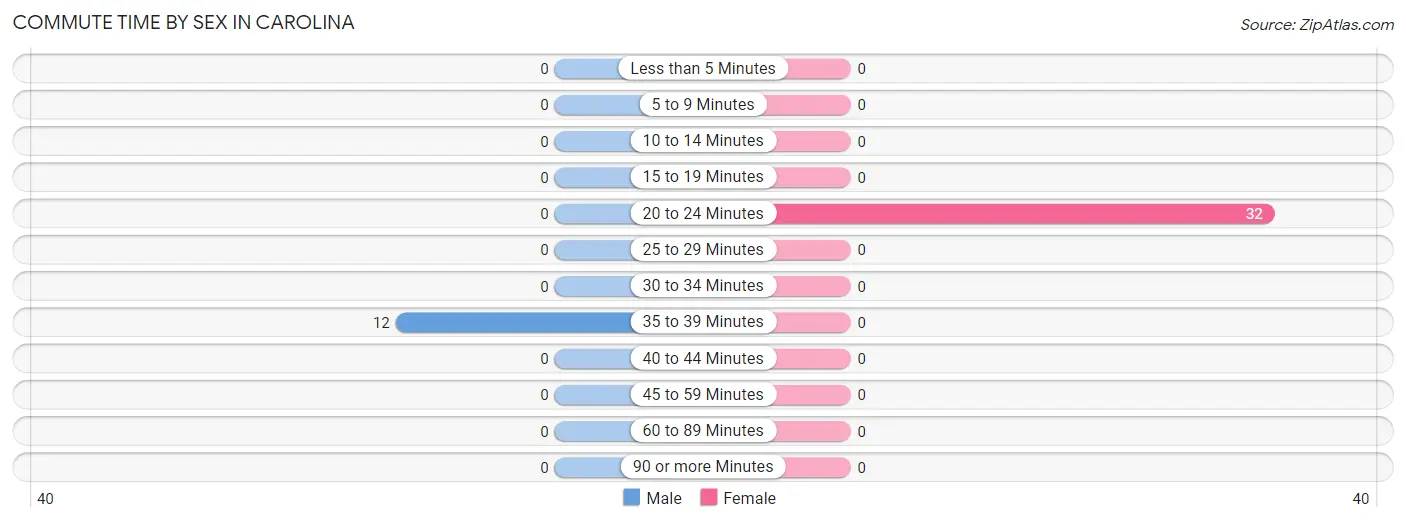
| Commute Time | Male | Female |
| Less than 5 Minutes | 0 (0.0%) | 0 (0.0%) |
| 5 to 9 Minutes | 0 (0.0%) | 0 (0.0%) |
| 10 to 14 Minutes | 0 (0.0%) | 0 (0.0%) |
| 15 to 19 Minutes | 0 (0.0%) | 0 (0.0%) |
| 20 to 24 Minutes | 0 (0.0%) | 32 (100.0%) |
| 25 to 29 Minutes | 0 (0.0%) | 0 (0.0%) |
| 30 to 34 Minutes | 0 (0.0%) | 0 (0.0%) |
| 35 to 39 Minutes | 12 (100.0%) | 0 (0.0%) |
| 40 to 44 Minutes | 0 (0.0%) | 0 (0.0%) |
| 45 to 59 Minutes | 0 (0.0%) | 0 (0.0%) |
| 60 to 89 Minutes | 0 (0.0%) | 0 (0.0%) |
| 90 or more Minutes | 0 (0.0%) | 0 (0.0%) |
Time of Departure to Work by Sex in Carolina
The most frequent times of departure to work in Carolina are 6:00 AM to 6:29 AM (12, 100.0%) for males and 12:00 PM to 3:59 PM (32, 100.0%) for females.
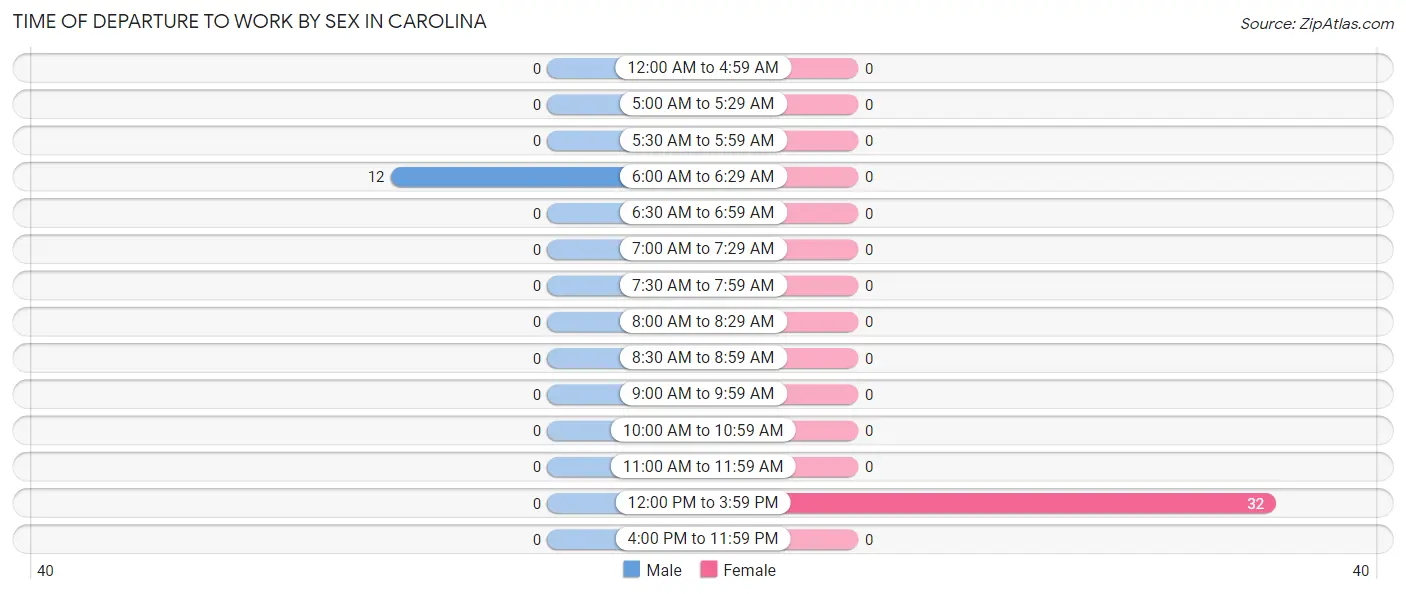
| Time of Departure | Male | Female |
| 12:00 AM to 4:59 AM | 0 (0.0%) | 0 (0.0%) |
| 5:00 AM to 5:29 AM | 0 (0.0%) | 0 (0.0%) |
| 5:30 AM to 5:59 AM | 0 (0.0%) | 0 (0.0%) |
| 6:00 AM to 6:29 AM | 12 (100.0%) | 0 (0.0%) |
| 6:30 AM to 6:59 AM | 0 (0.0%) | 0 (0.0%) |
| 7:00 AM to 7:29 AM | 0 (0.0%) | 0 (0.0%) |
| 7:30 AM to 7:59 AM | 0 (0.0%) | 0 (0.0%) |
| 8:00 AM to 8:29 AM | 0 (0.0%) | 0 (0.0%) |
| 8:30 AM to 8:59 AM | 0 (0.0%) | 0 (0.0%) |
| 9:00 AM to 9:59 AM | 0 (0.0%) | 0 (0.0%) |
| 10:00 AM to 10:59 AM | 0 (0.0%) | 0 (0.0%) |
| 11:00 AM to 11:59 AM | 0 (0.0%) | 0 (0.0%) |
| 12:00 PM to 3:59 PM | 0 (0.0%) | 32 (100.0%) |
| 4:00 PM to 11:59 PM | 0 (0.0%) | 0 (0.0%) |
| Total | 12 (100.0%) | 32 (100.0%) |
Housing Occupancy in Carolina
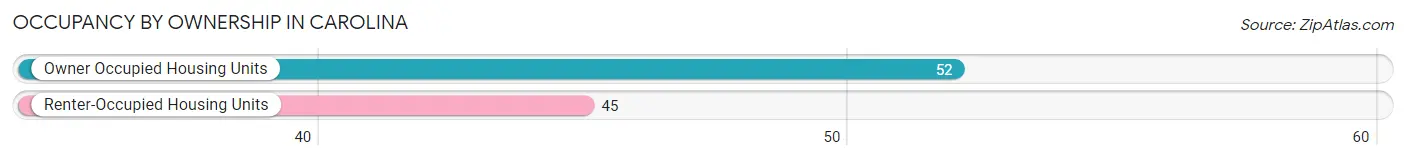
Occupancy by Ownership in Carolina
Of the total 97 dwellings in Carolina, owner-occupied units account for 52 (53.6%), while renter-occupied units make up 45 (46.4%).
| Occupancy | # Housing Units | % Housing Units |
| Owner Occupied Housing Units | 52 | 53.6% |
| Renter-Occupied Housing Units | 45 | 46.4% |
| Total Occupied Housing Units | 97 | 100.0% |
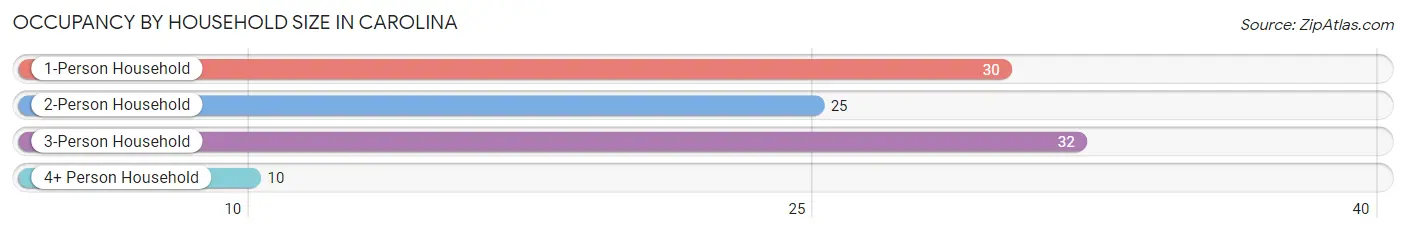
Occupancy by Household Size in Carolina
| Household Size | # Housing Units | % Housing Units |
| 1-Person Household | 30 | 30.9% |
| 2-Person Household | 25 | 25.8% |
| 3-Person Household | 32 | 33.0% |
| 4+ Person Household | 10 | 10.3% |
| Total Housing Units | 97 | 100.0% |
Occupancy by Ownership by Household Size in Carolina
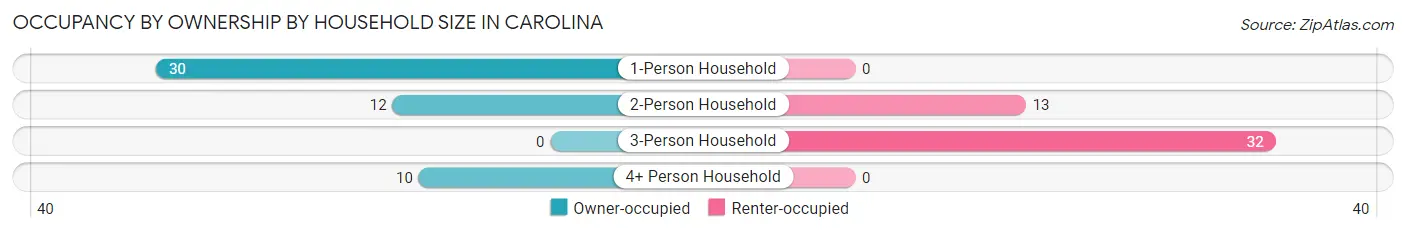
| Household Size | Owner-occupied | Renter-occupied |
| 1-Person Household | 30 (100.0%) | 0 (0.0%) |
| 2-Person Household | 12 (48.0%) | 13 (52.0%) |
| 3-Person Household | 0 (0.0%) | 32 (100.0%) |
| 4+ Person Household | 10 (100.0%) | 0 (0.0%) |
| Total Housing Units | 52 (53.6%) | 45 (46.4%) |
Occupancy by Educational Attainment in Carolina
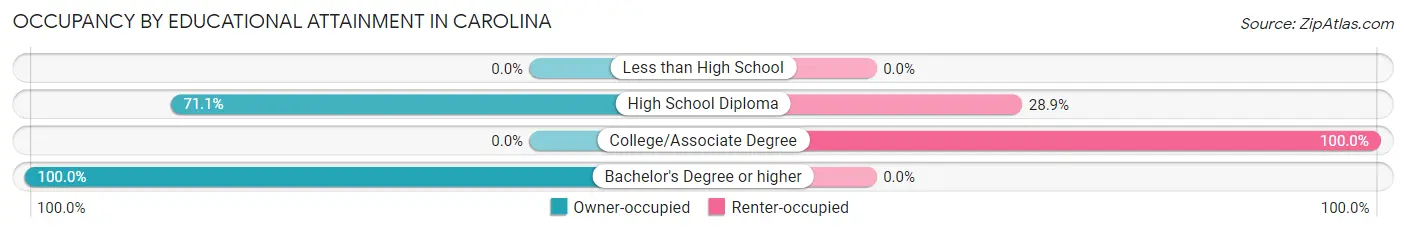
| Household Size | Owner-occupied | Renter-occupied |
| Less than High School | 0 (0.0%) | 0 (0.0%) |
| High School Diploma | 32 (71.1%) | 13 (28.9%) |
| College/Associate Degree | 0 (0.0%) | 32 (100.0%) |
| Bachelor's Degree or higher | 20 (100.0%) | 0 (0.0%) |
Occupancy by Age of Householder in Carolina
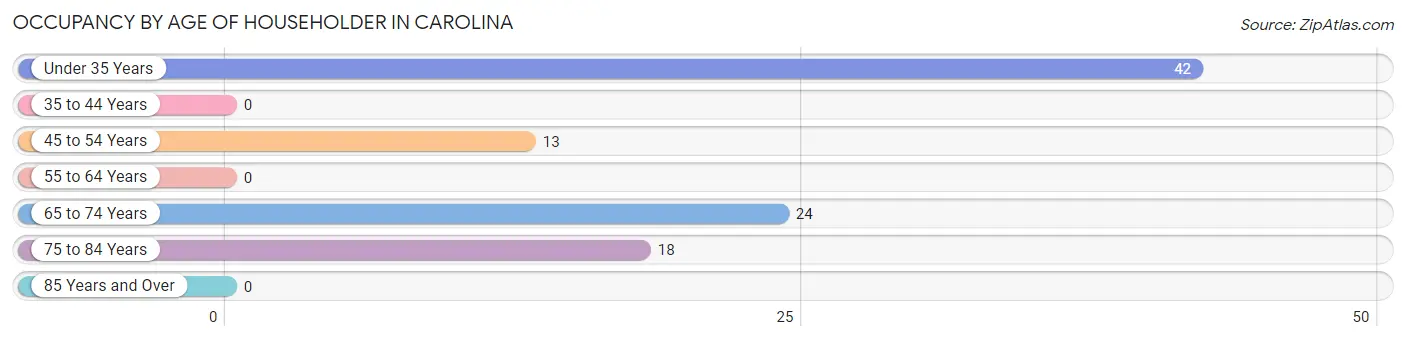
| Age Bracket | # Households | % Households |
| Under 35 Years | 42 | 43.3% |
| 35 to 44 Years | 0 | 0.0% |
| 45 to 54 Years | 13 | 13.4% |
| 55 to 64 Years | 0 | 0.0% |
| 65 to 74 Years | 24 | 24.7% |
| 75 to 84 Years | 18 | 18.6% |
| 85 Years and Over | 0 | 0.0% |
| Total | 97 | 100.0% |
Housing Finances in Carolina
Median Income by Occupancy in Carolina
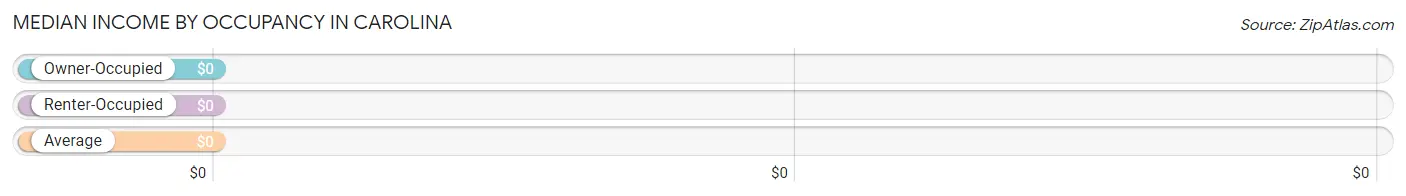
| Occupancy Type | # Households | Median Income |
| Owner-Occupied | 52 (53.6%) | $0 |
| Renter-Occupied | 45 (46.4%) | $0 |
| Average | 97 (100.0%) | $0 |
Occupancy by Householder Income Bracket in Carolina
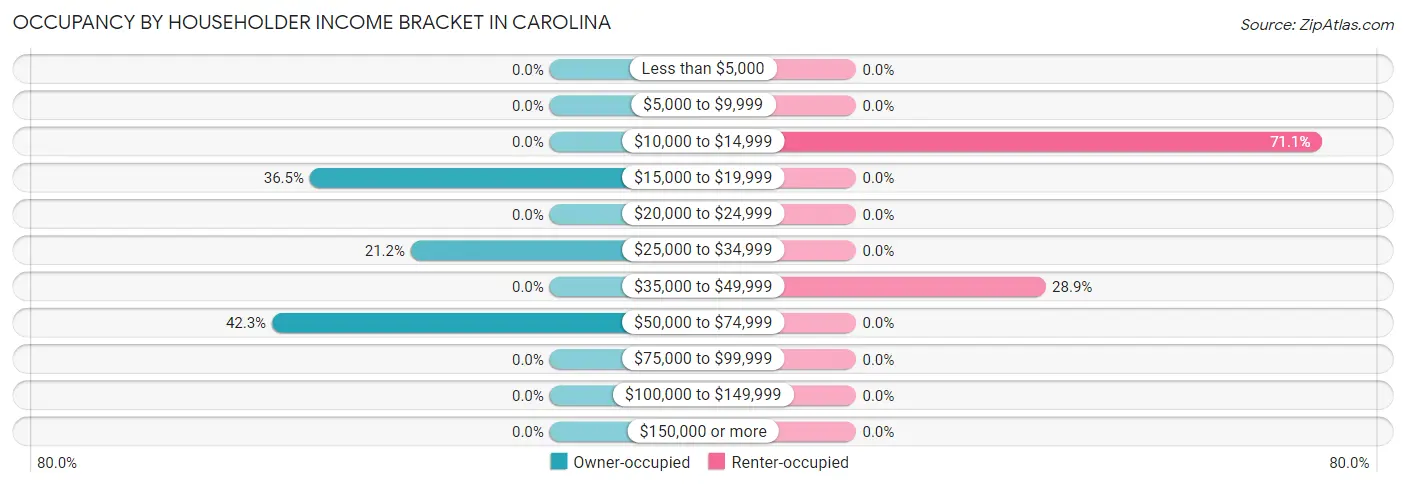
| Income Bracket | Owner-occupied | Renter-occupied |
| Less than $5,000 | 0 (0.0%) | 0 (0.0%) |
| $5,000 to $9,999 | 0 (0.0%) | 0 (0.0%) |
| $10,000 to $14,999 | 0 (0.0%) | 32 (71.1%) |
| $15,000 to $19,999 | 19 (36.5%) | 0 (0.0%) |
| $20,000 to $24,999 | 0 (0.0%) | 0 (0.0%) |
| $25,000 to $34,999 | 11 (21.1%) | 0 (0.0%) |
| $35,000 to $49,999 | 0 (0.0%) | 13 (28.9%) |
| $50,000 to $74,999 | 22 (42.3%) | 0 (0.0%) |
| $75,000 to $99,999 | 0 (0.0%) | 0 (0.0%) |
| $100,000 to $149,999 | 0 (0.0%) | 0 (0.0%) |
| $150,000 or more | 0 (0.0%) | 0 (0.0%) |
| Total | 52 (100.0%) | 45 (100.0%) |
Monthly Housing Cost Tiers in Carolina
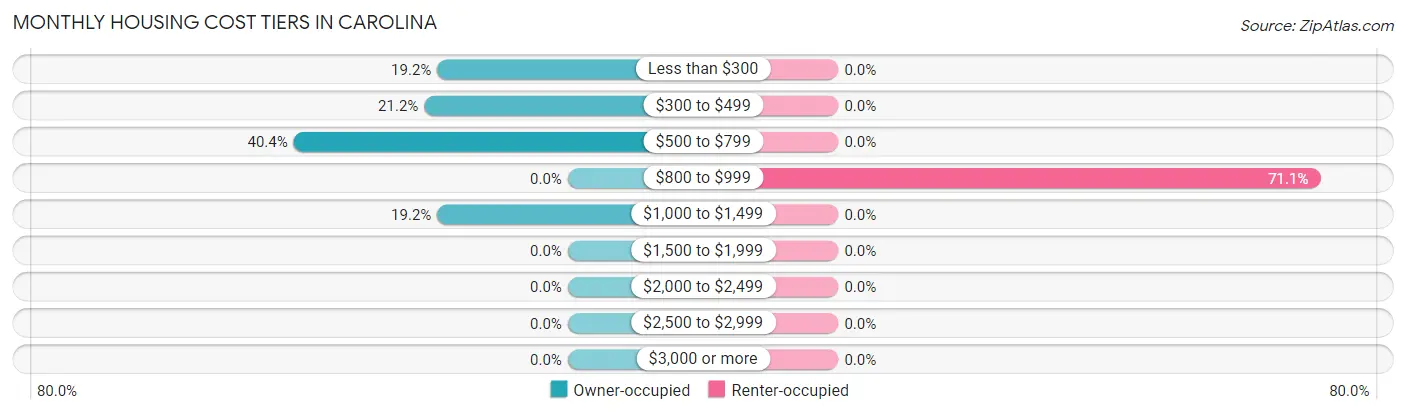
| Monthly Cost | Owner-occupied | Renter-occupied |
| Less than $300 | 10 (19.2%) | 0 (0.0%) |
| $300 to $499 | 11 (21.1%) | 0 (0.0%) |
| $500 to $799 | 21 (40.4%) | 0 (0.0%) |
| $800 to $999 | 0 (0.0%) | 32 (71.1%) |
| $1,000 to $1,499 | 10 (19.2%) | 0 (0.0%) |
| $1,500 to $1,999 | 0 (0.0%) | 0 (0.0%) |
| $2,000 to $2,499 | 0 (0.0%) | 0 (0.0%) |
| $2,500 to $2,999 | 0 (0.0%) | 0 (0.0%) |
| $3,000 or more | 0 (0.0%) | 0 (0.0%) |
| Total | 52 (100.0%) | 45 (100.0%) |
Physical Housing Characteristics in Carolina
Housing Structures in Carolina
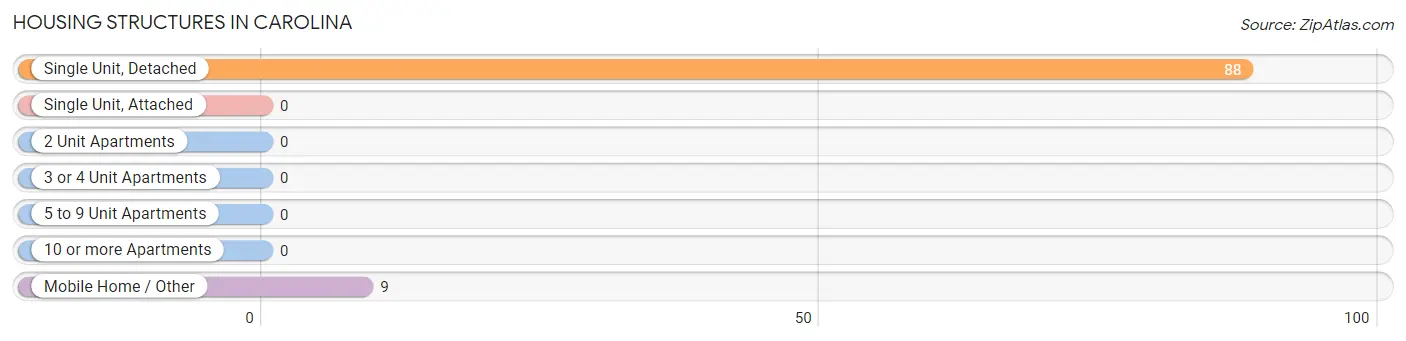
| Structure Type | # Housing Units | % Housing Units |
| Single Unit, Detached | 88 | 90.7% |
| Single Unit, Attached | 0 | 0.0% |
| 2 Unit Apartments | 0 | 0.0% |
| 3 or 4 Unit Apartments | 0 | 0.0% |
| 5 to 9 Unit Apartments | 0 | 0.0% |
| 10 or more Apartments | 0 | 0.0% |
| Mobile Home / Other | 9 | 9.3% |
| Total | 97 | 100.0% |
Housing Structures by Occupancy in Carolina
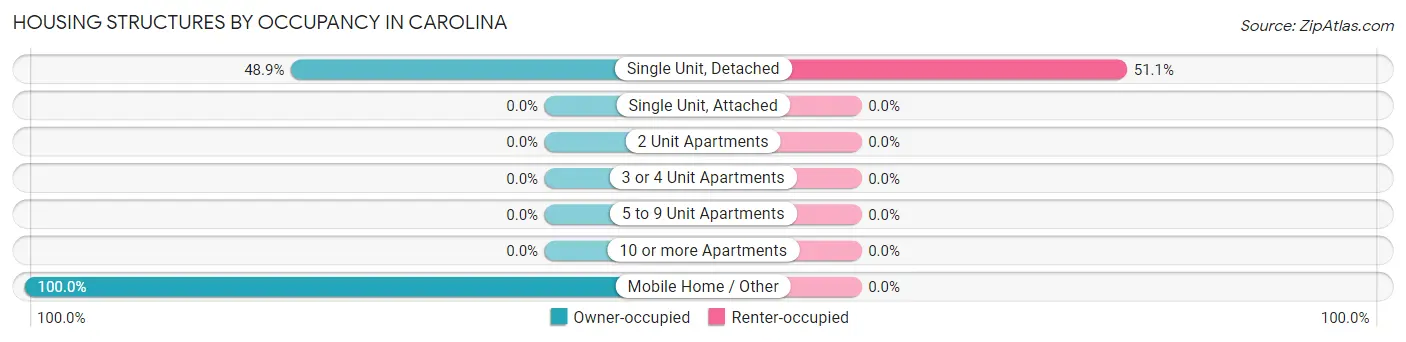
| Structure Type | Owner-occupied | Renter-occupied |
| Single Unit, Detached | 43 (48.9%) | 45 (51.1%) |
| Single Unit, Attached | 0 (0.0%) | 0 (0.0%) |
| 2 Unit Apartments | 0 (0.0%) | 0 (0.0%) |
| 3 or 4 Unit Apartments | 0 (0.0%) | 0 (0.0%) |
| 5 to 9 Unit Apartments | 0 (0.0%) | 0 (0.0%) |
| 10 or more Apartments | 0 (0.0%) | 0 (0.0%) |
| Mobile Home / Other | 9 (100.0%) | 0 (0.0%) |
| Total | 52 (53.6%) | 45 (46.4%) |
Housing Structures by Number of Rooms in Carolina
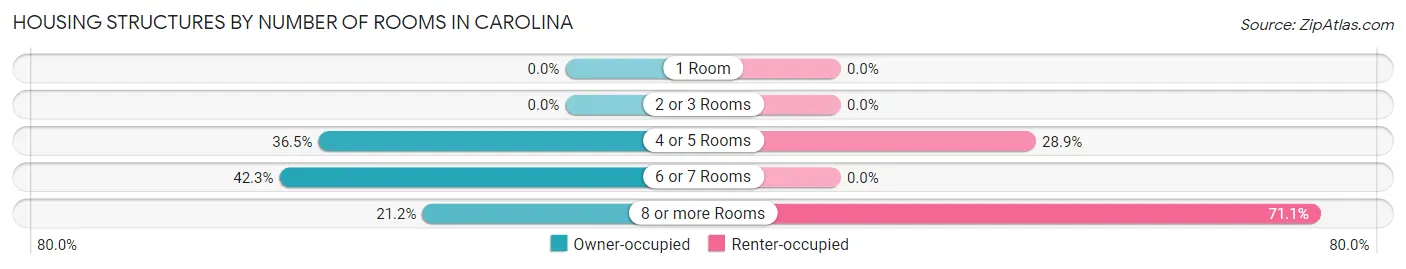
| Number of Rooms | Owner-occupied | Renter-occupied |
| 1 Room | 0 (0.0%) | 0 (0.0%) |
| 2 or 3 Rooms | 0 (0.0%) | 0 (0.0%) |
| 4 or 5 Rooms | 19 (36.5%) | 13 (28.9%) |
| 6 or 7 Rooms | 22 (42.3%) | 0 (0.0%) |
| 8 or more Rooms | 11 (21.1%) | 32 (71.1%) |
| Total | 52 (100.0%) | 45 (100.0%) |
Housing Structure by Heating Type in Carolina
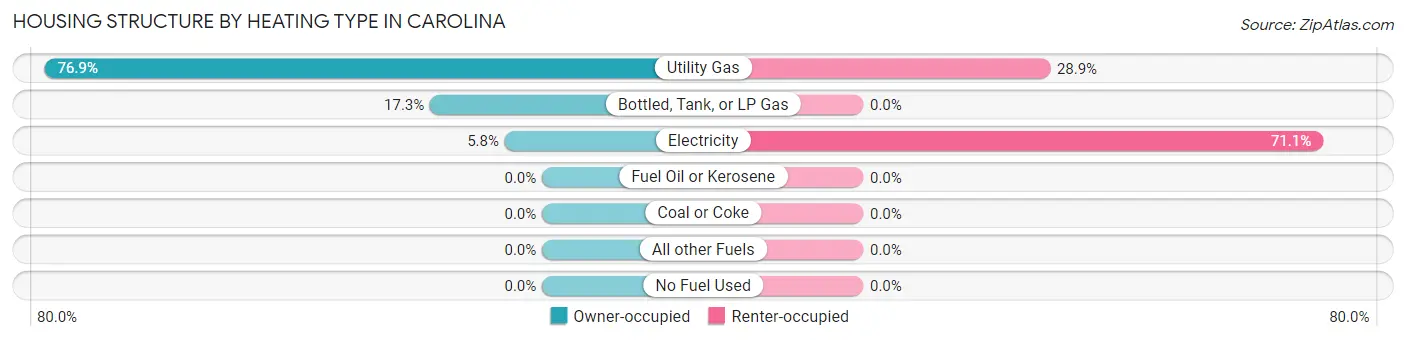
| Heating Type | Owner-occupied | Renter-occupied |
| Utility Gas | 40 (76.9%) | 13 (28.9%) |
| Bottled, Tank, or LP Gas | 9 (17.3%) | 0 (0.0%) |
| Electricity | 3 (5.8%) | 32 (71.1%) |
| Fuel Oil or Kerosene | 0 (0.0%) | 0 (0.0%) |
| Coal or Coke | 0 (0.0%) | 0 (0.0%) |
| All other Fuels | 0 (0.0%) | 0 (0.0%) |
| No Fuel Used | 0 (0.0%) | 0 (0.0%) |
| Total | 52 (100.0%) | 45 (100.0%) |
Household Vehicle Usage in Carolina
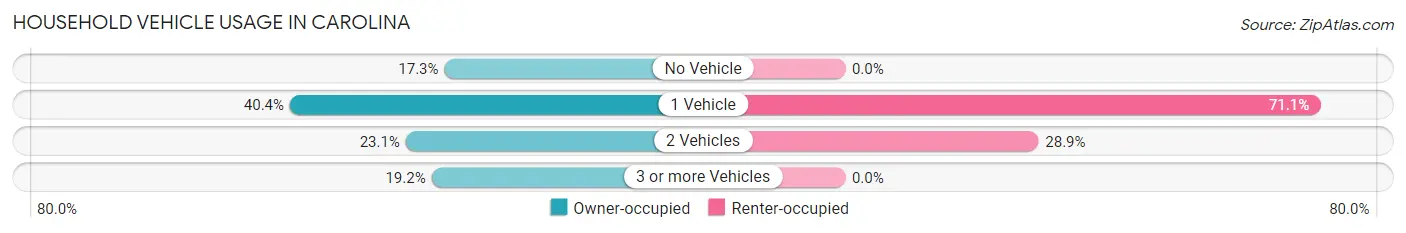
| Vehicles per Household | Owner-occupied | Renter-occupied |
| No Vehicle | 9 (17.3%) | 0 (0.0%) |
| 1 Vehicle | 21 (40.4%) | 32 (71.1%) |
| 2 Vehicles | 12 (23.1%) | 13 (28.9%) |
| 3 or more Vehicles | 10 (19.2%) | 0 (0.0%) |
| Total | 52 (100.0%) | 45 (100.0%) |
Real Estate & Mortgages in Carolina
Real Estate and Mortgage Overview in Carolina
| Characteristic | Without Mortgage | With Mortgage |
| Housing Units | 42 | 10 |
| Median Property Value | - | - |
| Median Household Income | - | - |
| Monthly Housing Costs | $550 | $0 |
| Real Estate Taxes | - | - |
Property Value by Mortgage Status in Carolina
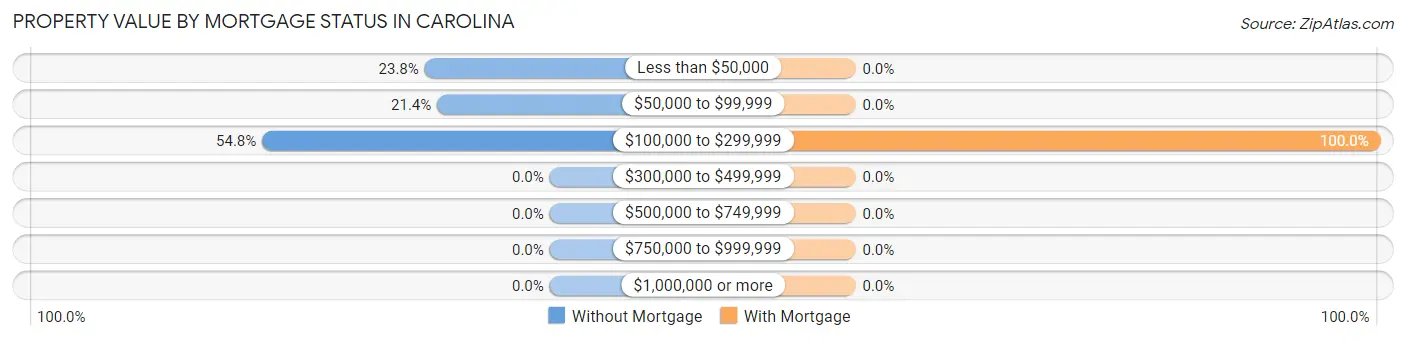
| Property Value | Without Mortgage | With Mortgage |
| Less than $50,000 | 10 (23.8%) | 0 (0.0%) |
| $50,000 to $99,999 | 9 (21.4%) | 0 (0.0%) |
| $100,000 to $299,999 | 23 (54.8%) | 10 (100.0%) |
| $300,000 to $499,999 | 0 (0.0%) | 0 (0.0%) |
| $500,000 to $749,999 | 0 (0.0%) | 0 (0.0%) |
| $750,000 to $999,999 | 0 (0.0%) | 0 (0.0%) |
| $1,000,000 or more | 0 (0.0%) | 0 (0.0%) |
| Total | 42 (100.0%) | 10 (100.0%) |
Household Income by Mortgage Status in Carolina
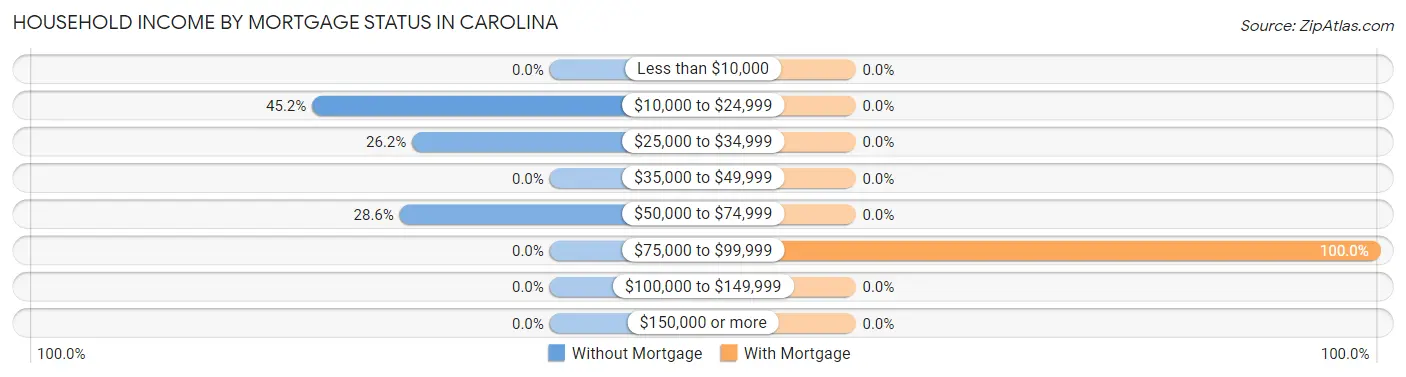
| Household Income | Without Mortgage | With Mortgage |
| Less than $10,000 | 0 (0.0%) | 0 (0.0%) |
| $10,000 to $24,999 | 19 (45.2%) | 0 (0.0%) |
| $25,000 to $34,999 | 11 (26.2%) | 0 (0.0%) |
| $35,000 to $49,999 | 0 (0.0%) | 0 (0.0%) |
| $50,000 to $74,999 | 12 (28.6%) | 0 (0.0%) |
| $75,000 to $99,999 | 0 (0.0%) | 10 (100.0%) |
| $100,000 to $149,999 | 0 (0.0%) | 0 (0.0%) |
| $150,000 or more | 0 (0.0%) | 0 (0.0%) |
| Total | 42 (100.0%) | 10 (100.0%) |
Property Value to Household Income Ratio in Carolina
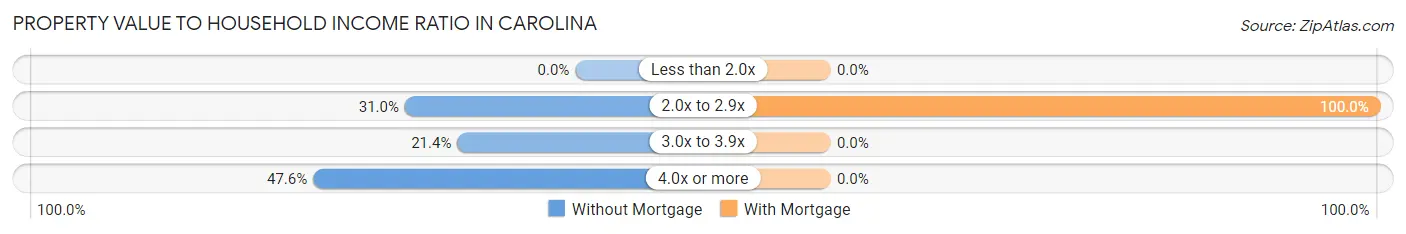
| Value-to-Income Ratio | Without Mortgage | With Mortgage |
| Less than 2.0x | 0 (0.0%) | 0 (0.0%) |
| 2.0x to 2.9x | 13 (30.9%) | 10 (100.0%) |
| 3.0x to 3.9x | 9 (21.4%) | 0 (0.0%) |
| 4.0x or more | 20 (47.6%) | 0 (0.0%) |
| Total | 42 (100.0%) | 10 (100.0%) |
Real Estate Taxes by Mortgage Status in Carolina
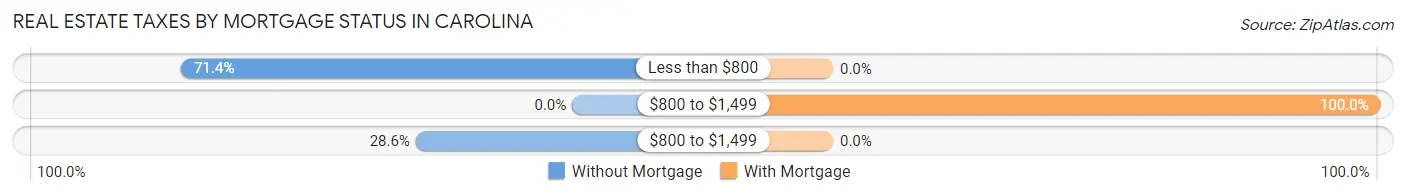
| Property Taxes | Without Mortgage | With Mortgage |
| Less than $800 | 30 (71.4%) | 0 (0.0%) |
| $800 to $1,499 | 0 (0.0%) | 10 (100.0%) |
| $800 to $1,499 | 12 (28.6%) | 0 (0.0%) |
| Total | 42 (100.0%) | 10 (100.0%) |
Health & Disability in Carolina
Health Insurance Coverage by Age in Carolina
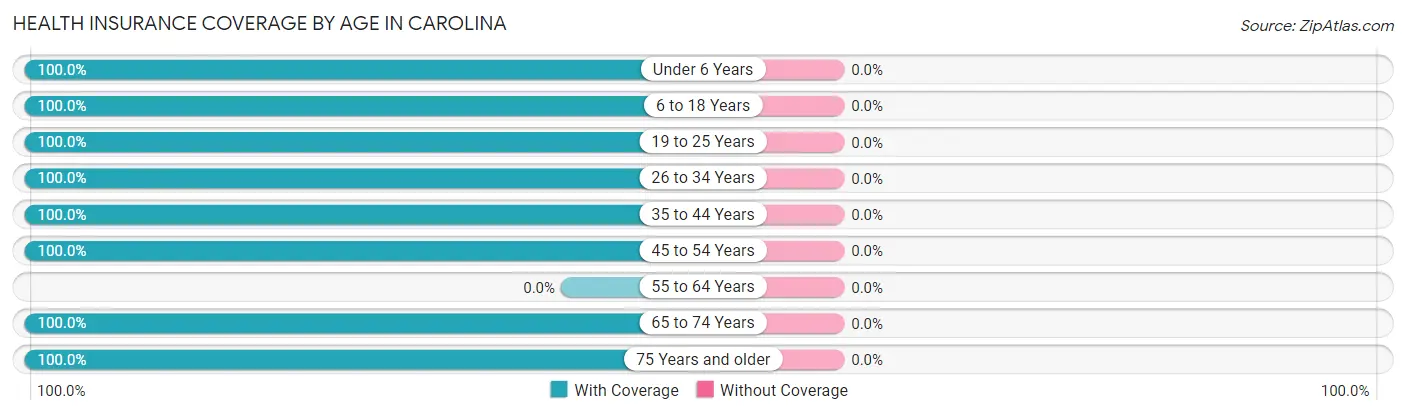
| Age Bracket | With Coverage | Without Coverage |
| Under 6 Years | 9 (100.0%) | 0 (0.0%) |
| 6 to 18 Years | 41 (100.0%) | 0 (0.0%) |
| 19 to 25 Years | 40 (100.0%) | 0 (0.0%) |
| 26 to 34 Years | 42 (100.0%) | 0 (0.0%) |
| 35 to 44 Years | 12 (100.0%) | 0 (0.0%) |
| 45 to 54 Years | 38 (100.0%) | 0 (0.0%) |
| 55 to 64 Years | 0 (0.0%) | 0 (0.0%) |
| 65 to 74 Years | 37 (100.0%) | 0 (0.0%) |
| 75 Years and older | 18 (100.0%) | 0 (0.0%) |
| Total | 237 (100.0%) | 0 (0.0%) |
Health Insurance Coverage by Citizenship Status in Carolina
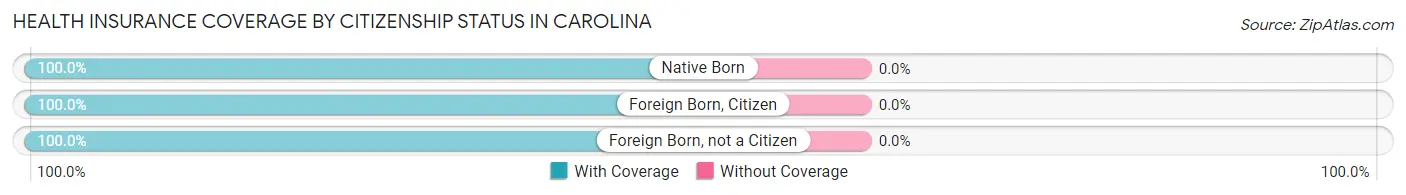
| Citizenship Status | With Coverage | Without Coverage |
| Native Born | 9 (100.0%) | 0 (0.0%) |
| Foreign Born, Citizen | 41 (100.0%) | 0 (0.0%) |
| Foreign Born, not a Citizen | 40 (100.0%) | 0 (0.0%) |
Health Insurance Coverage by Household Income in Carolina
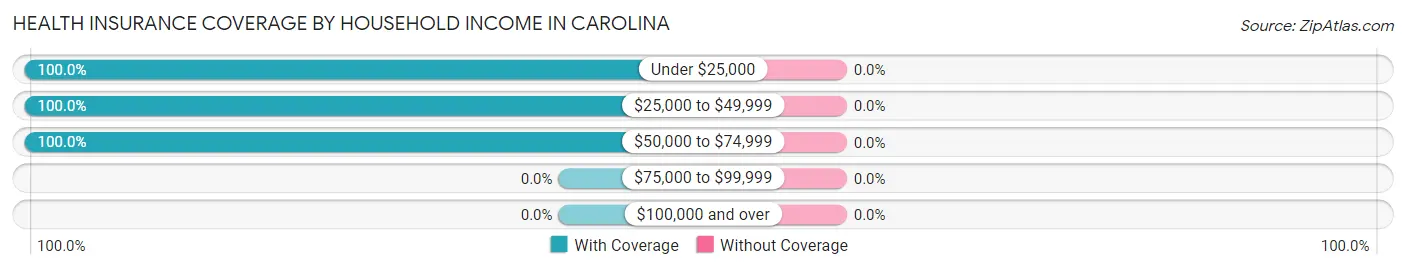
| Household Income | With Coverage | Without Coverage |
| Under $25,000 | 111 (100.0%) | 0 (0.0%) |
| $25,000 to $49,999 | 49 (100.0%) | 0 (0.0%) |
| $50,000 to $74,999 | 77 (100.0%) | 0 (0.0%) |
| $75,000 to $99,999 | 0 (0.0%) | 0 (0.0%) |
| $100,000 and over | 0 (0.0%) | 0 (0.0%) |
Public vs Private Health Insurance Coverage by Age in Carolina
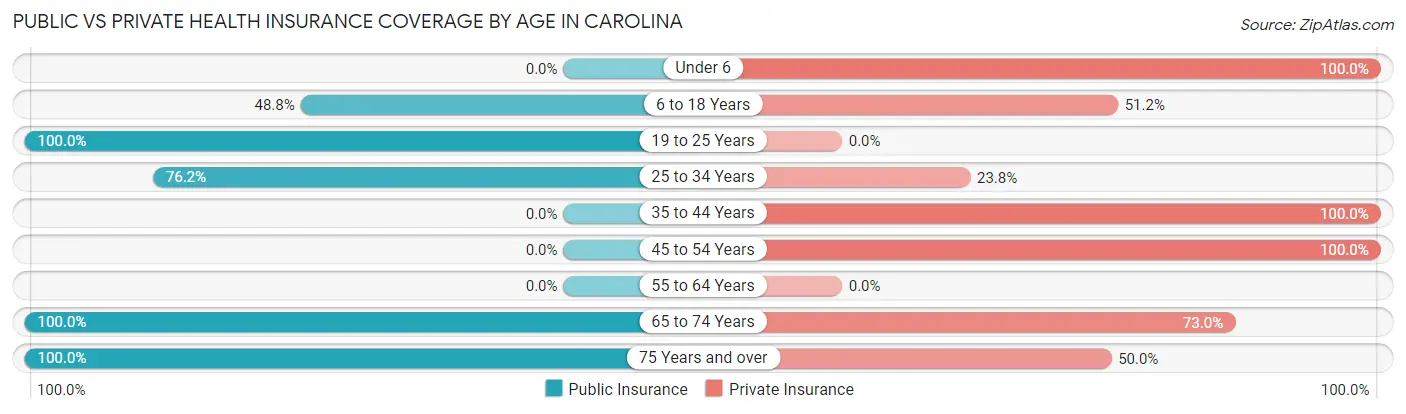
| Age Bracket | Public Insurance | Private Insurance |
| Under 6 | 0 (0.0%) | 9 (100.0%) |
| 6 to 18 Years | 20 (48.8%) | 21 (51.2%) |
| 19 to 25 Years | 40 (100.0%) | 0 (0.0%) |
| 25 to 34 Years | 32 (76.2%) | 10 (23.8%) |
| 35 to 44 Years | 0 (0.0%) | 12 (100.0%) |
| 45 to 54 Years | 0 (0.0%) | 38 (100.0%) |
| 55 to 64 Years | 0 (0.0%) | 0 (0.0%) |
| 65 to 74 Years | 37 (100.0%) | 27 (73.0%) |
| 75 Years and over | 18 (100.0%) | 9 (50.0%) |
| Total | 147 (62.0%) | 126 (53.2%) |
Disability Status by Sex by Age in Carolina
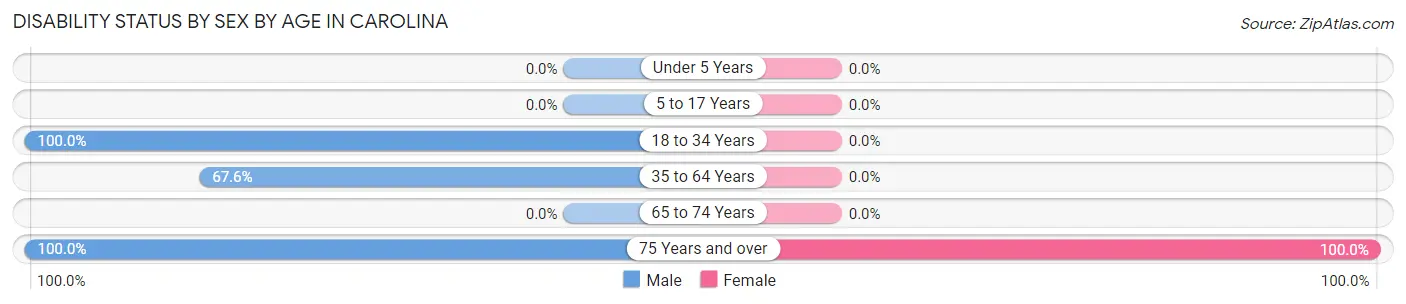
| Age Bracket | Male | Female |
| Under 5 Years | 0 (0.0%) | 0 (0.0%) |
| 5 to 17 Years | 0 (0.0%) | 0 (0.0%) |
| 18 to 34 Years | 40 (100.0%) | 0 (0.0%) |
| 35 to 64 Years | 25 (67.6%) | 0 (0.0%) |
| 65 to 74 Years | 0 (0.0%) | 0 (0.0%) |
| 75 Years and over | 9 (100.0%) | 9 (100.0%) |
Disability Class by Sex by Age in Carolina
Disability Class: Hearing Difficulty
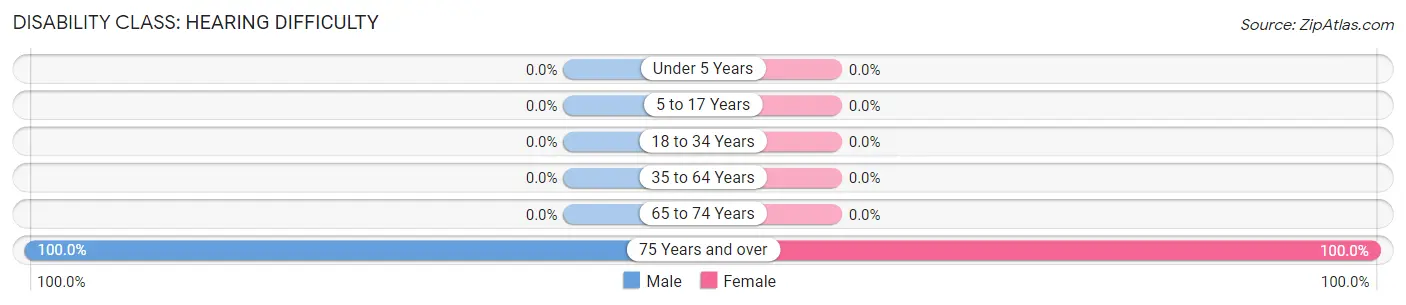
| Age Bracket | Male | Female |
| Under 5 Years | 0 (0.0%) | 0 (0.0%) |
| 5 to 17 Years | 0 (0.0%) | 0 (0.0%) |
| 18 to 34 Years | 0 (0.0%) | 0 (0.0%) |
| 35 to 64 Years | 0 (0.0%) | 0 (0.0%) |
| 65 to 74 Years | 0 (0.0%) | 0 (0.0%) |
| 75 Years and over | 9 (100.0%) | 9 (100.0%) |
Disability Class: Vision Difficulty
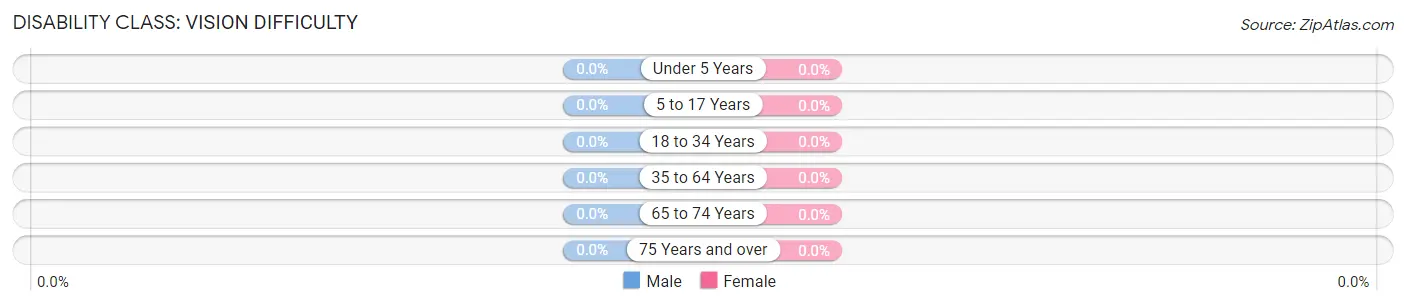
| Age Bracket | Male | Female |
| Under 5 Years | 0 (0.0%) | 0 (0.0%) |
| 5 to 17 Years | 0 (0.0%) | 0 (0.0%) |
| 18 to 34 Years | 0 (0.0%) | 0 (0.0%) |
| 35 to 64 Years | 0 (0.0%) | 0 (0.0%) |
| 65 to 74 Years | 0 (0.0%) | 0 (0.0%) |
| 75 Years and over | 0 (0.0%) | 0 (0.0%) |
Disability Class: Cognitive Difficulty
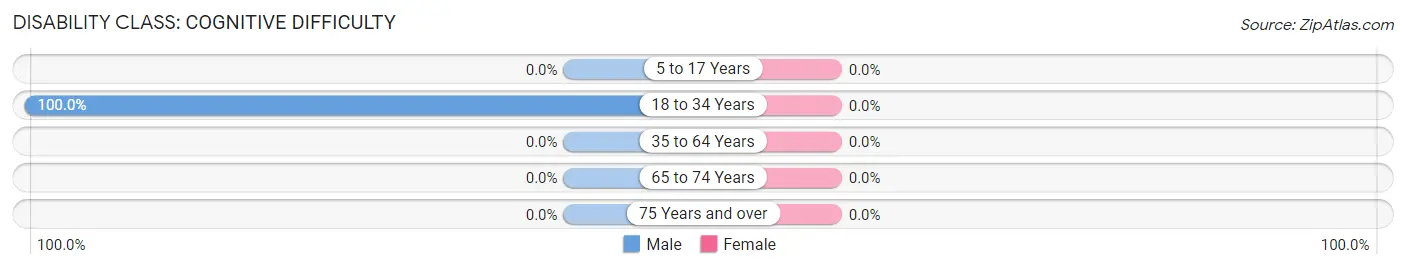
| Age Bracket | Male | Female |
| 5 to 17 Years | 0 (0.0%) | 0 (0.0%) |
| 18 to 34 Years | 40 (100.0%) | 0 (0.0%) |
| 35 to 64 Years | 0 (0.0%) | 0 (0.0%) |
| 65 to 74 Years | 0 (0.0%) | 0 (0.0%) |
| 75 Years and over | 0 (0.0%) | 0 (0.0%) |
Disability Class: Ambulatory Difficulty
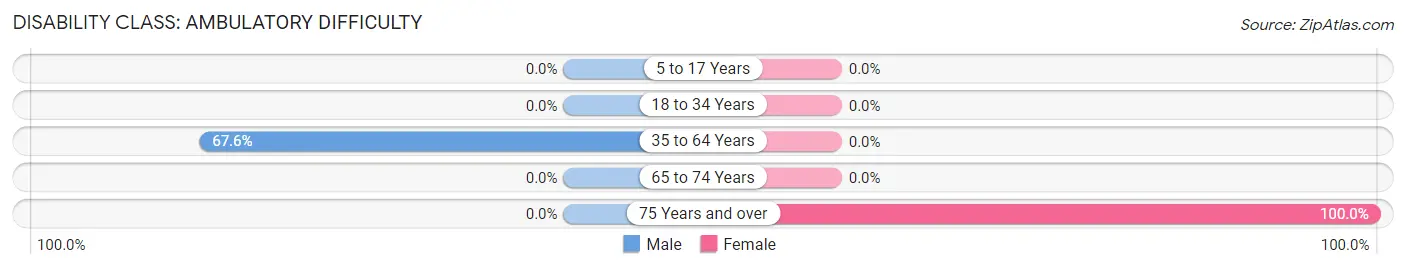
| Age Bracket | Male | Female |
| 5 to 17 Years | 0 (0.0%) | 0 (0.0%) |
| 18 to 34 Years | 0 (0.0%) | 0 (0.0%) |
| 35 to 64 Years | 25 (67.6%) | 0 (0.0%) |
| 65 to 74 Years | 0 (0.0%) | 0 (0.0%) |
| 75 Years and over | 0 (0.0%) | 9 (100.0%) |
Disability Class: Self-Care Difficulty
| Age Bracket | Male | Female |
| 5 to 17 Years | 0 (0.0%) | 0 (0.0%) |
| 18 to 34 Years | 0 (0.0%) | 0 (0.0%) |
| 35 to 64 Years | 0 (0.0%) | 0 (0.0%) |
| 65 to 74 Years | 0 (0.0%) | 0 (0.0%) |
| 75 Years and over | 0 (0.0%) | 0 (0.0%) |
Technology Access in Carolina
Computing Device Access in Carolina
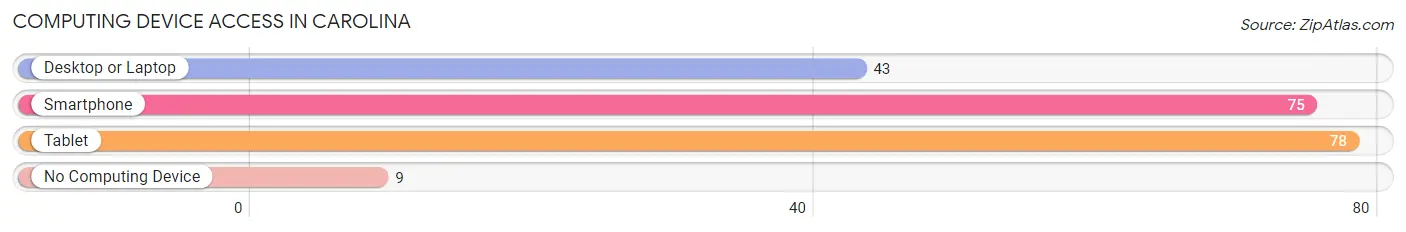
| Device Type | # Households | % Households |
| Desktop or Laptop | 43 | 44.3% |
| Smartphone | 75 | 77.3% |
| Tablet | 78 | 80.4% |
| No Computing Device | 9 | 9.3% |
| Total | 97 | 100.0% |
Internet Access in Carolina
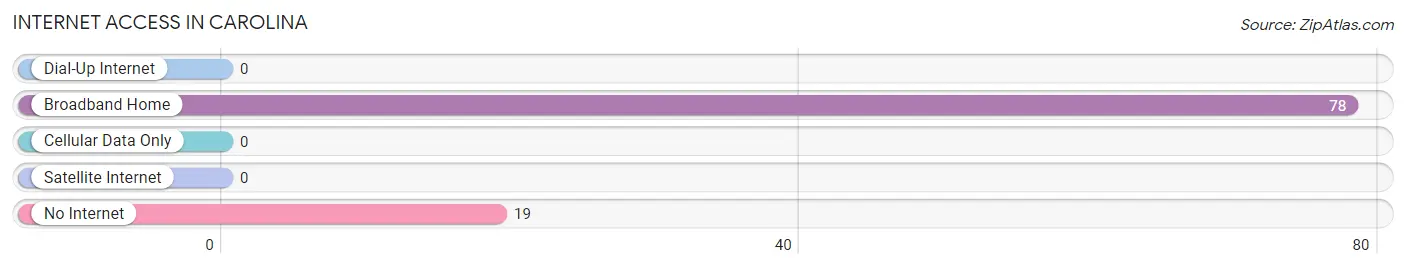
| Internet Type | # Households | % Households |
| Dial-Up Internet | 0 | 0.0% |
| Broadband Home | 78 | 80.4% |
| Cellular Data Only | 0 | 0.0% |
| Satellite Internet | 0 | 0.0% |
| No Internet | 19 | 19.6% |
| Total | 97 | 100.0% |
Carolina Summary
Carolina, West Virginia is a small town located in the Appalachian Mountains of West Virginia. It is situated in the northern part of the state, near the border of Virginia and Maryland. The town is home to a population of just over 1,000 people, and is part of the larger Preston County.
History
Carolina was first settled in the late 1700s by a group of settlers from Pennsylvania. The town was originally known as “Carolina Settlement” and was located near the present-day town of Kingwood. The town was officially incorporated in 1832 and was named after the state of Carolina, which was the original name of West Virginia.
The town was an important stop on the Baltimore and Ohio Railroad, which ran through the area in the late 1800s. The railroad brought economic growth to the area, and the town soon became a hub for the coal and timber industries. The town also had a thriving agricultural industry, and was home to several mills and factories.
Geography
Carolina is located in the northern part of West Virginia, near the border of Virginia and Maryland. The town is situated in the Appalachian Mountains, and is surrounded by rolling hills and forests. The town is located at an elevation of 1,890 feet, and is part of the larger Preston County.
The town is located near several major highways, including Interstate 79 and US Route 50. The nearest major cities are Morgantown, West Virginia and Cumberland, Maryland.
Economy
The economy of Carolina is largely based on the coal and timber industries. The town is home to several coal mines, and the timber industry is also an important part of the local economy. The town is also home to several small businesses, including restaurants, shops, and other services.
The town is also home to several educational institutions, including a community college and a technical school. The town is also home to a small airport, which serves the local area.
Demographics
As of the 2010 census, the population of Carolina was 1,072. The town is predominantly white, with a small African American population. The median household income in the town is $35,000, and the median home value is $90,000. The town has a poverty rate of 17.3%, which is higher than the national average.
Conclusion
Carolina, West Virginia is a small town located in the Appalachian Mountains of West Virginia. It is home to a population of just over 1,000 people, and is part of the larger Preston County. The town is largely based on the coal and timber industries, and is home to several small businesses. The town is predominantly white, with a small African American population. The median household income in the town is $35,000, and the median home value is $90,000. The town has a poverty rate of 17.3%, which is higher than the national average.
Common Questions
What is Per Capita Income in Carolina?
Per Capita income in Carolina is $14,191.
What is Inequality or Gini Index in Carolina?
Inequality or Gini Index in Carolina is 0.33.
What is the Total Population of Carolina?
Total Population of Carolina is 237.
What is the Total Male Population of Carolina?
Total Male Population of Carolina is 110.
What is the Total Female Population of Carolina?
Total Female Population of Carolina is 127.
What is the Ratio of Males per 100 Females in Carolina?
There are 86.61 Males per 100 Females in Carolina.
What is the Ratio of Females per 100 Males in Carolina?
There are 115.45 Females per 100 Males in Carolina.
What is the Median Population Age in Carolina?
Median Population Age in Carolina is 32.9 Years.
What is the Average Family Size in Carolina
Average Family Size in Carolina is 3.1 People.
What is the Average Household Size in Carolina
Average Household Size in Carolina is 2.4 People.
How Large is the Labor Force in Carolina?
There are 82 People in the Labor Forcein in Carolina.
What is the Percentage of People in the Labor Force in Carolina?
43.9% of People are in the Labor Force in Carolina.
What is the Unemployment Rate in Carolina?
Unemployment Rate in Carolina is 30.5%.