Nobleton, FL Map & Demographics
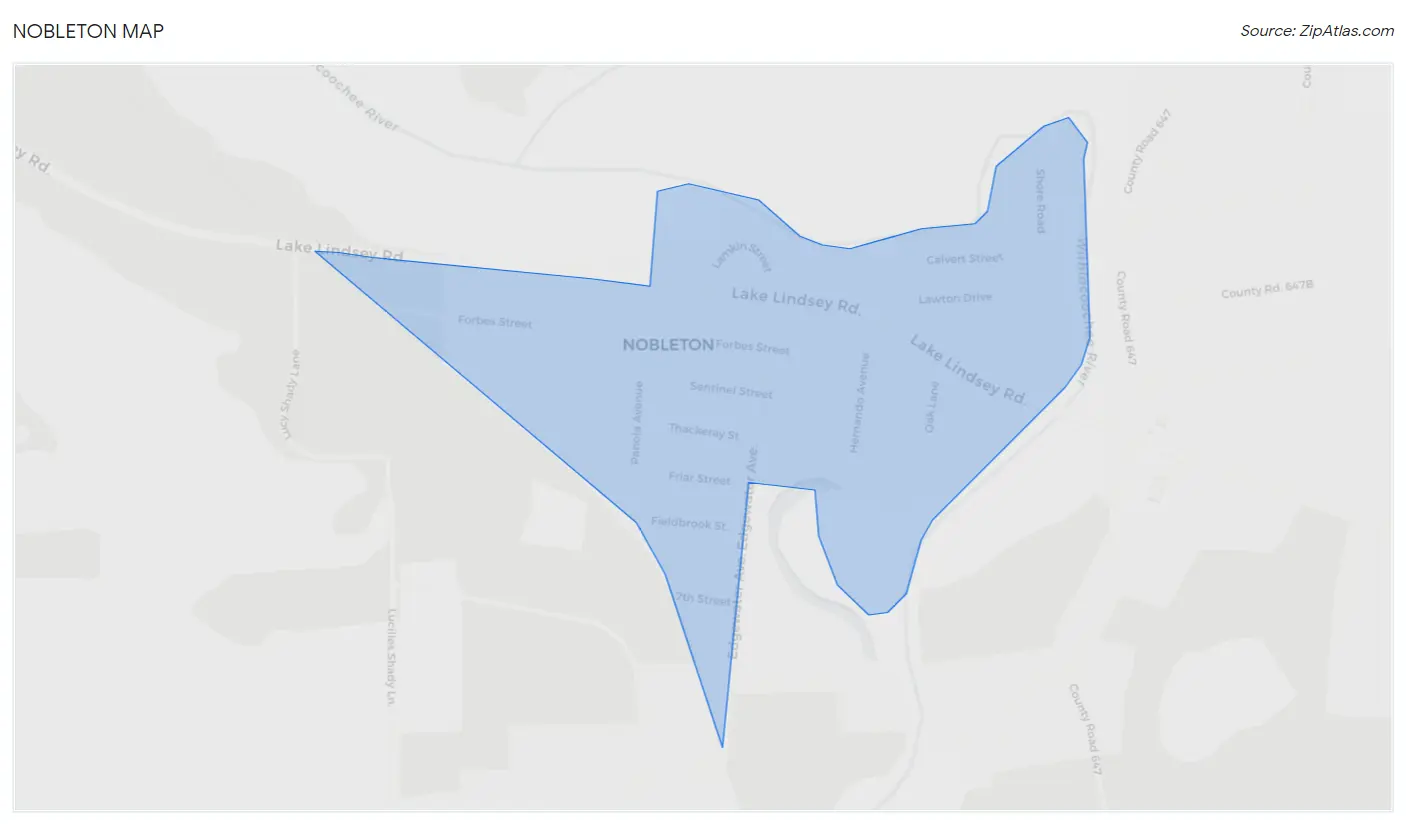
Nobleton Map
Nobleton Overview
$23,993
PER CAPITA INCOME
$35,469
AVG FAMILY INCOME
$29,132
AVG HOUSEHOLD INCOME
0.56
INEQUALITY / GINI INDEX
250
TOTAL POPULATION
61
MALE POPULATION
189
FEMALE POPULATION
32.28
MALES / 100 FEMALES
309.84
FEMALES / 100 MALES
50.5
MEDIAN AGE
2.1
AVG FAMILY SIZE
1.6
AVG HOUSEHOLD SIZE
88
LABOR FORCE [ PEOPLE ]
40.7%
PERCENT IN LABOR FORCE
59.1%
UNEMPLOYMENT RATE
Nobleton Zip Codes
Nobleton Area Codes
Income in Nobleton
Income Overview in Nobleton
Per Capita Income in Nobleton is $23,993, while median incomes of families and households are $35,469 and $29,132 respectively.
| Characteristic | Number | Measure |
| Per Capita Income | 250 | $23,993 |
| Median Family Income | 84 | $35,469 |
| Mean Family Income | 84 | $52,494 |
| Median Household Income | 153 | $29,132 |
| Mean Household Income | 153 | $33,595 |
| Income Deficit | 84 | $0 |
| Wage / Income Gap (%) | 250 | 0.00% |
| Wage / Income Gap ($) | 250 | 100.00¢ per $1 |
| Gini / Inequality Index | 250 | 0.56 |
Earnings by Sex in Nobleton
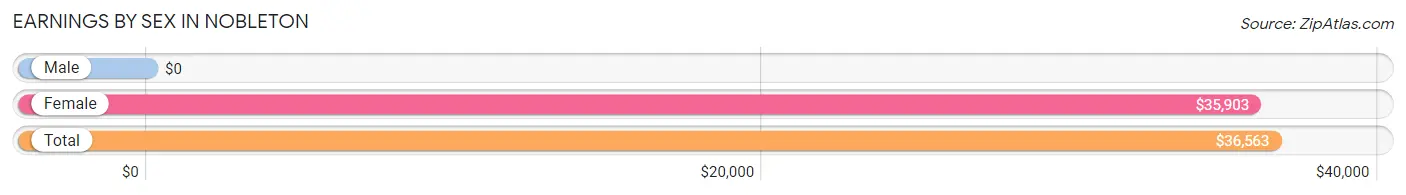
| Sex | Number | Average Earnings |
| Male | 19 (16.2%) | $0 |
| Female | 98 (83.8%) | $35,903 |
| Total | 117 (100.0%) | $36,563 |
Earnings by Sex by Income Bracket in Nobleton
The most common earnings brackets in Nobleton are $55,000 to $64,999 for men (19 | 100.0%) and $25,000 to $29,999 for women (36 | 36.7%).
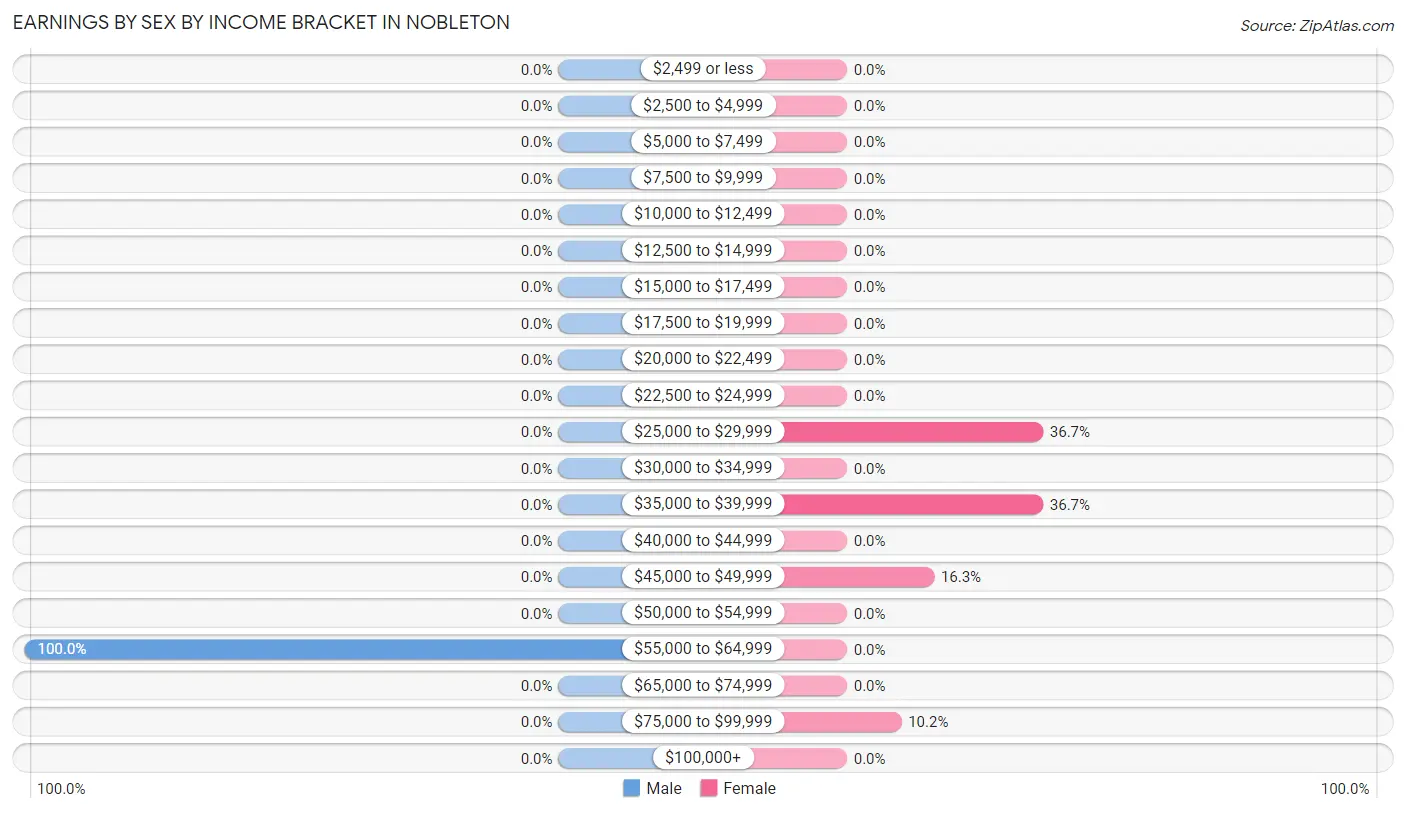
| Income | Male | Female |
| $2,499 or less | 0 (0.0%) | 0 (0.0%) |
| $2,500 to $4,999 | 0 (0.0%) | 0 (0.0%) |
| $5,000 to $7,499 | 0 (0.0%) | 0 (0.0%) |
| $7,500 to $9,999 | 0 (0.0%) | 0 (0.0%) |
| $10,000 to $12,499 | 0 (0.0%) | 0 (0.0%) |
| $12,500 to $14,999 | 0 (0.0%) | 0 (0.0%) |
| $15,000 to $17,499 | 0 (0.0%) | 0 (0.0%) |
| $17,500 to $19,999 | 0 (0.0%) | 0 (0.0%) |
| $20,000 to $22,499 | 0 (0.0%) | 0 (0.0%) |
| $22,500 to $24,999 | 0 (0.0%) | 0 (0.0%) |
| $25,000 to $29,999 | 0 (0.0%) | 36 (36.7%) |
| $30,000 to $34,999 | 0 (0.0%) | 0 (0.0%) |
| $35,000 to $39,999 | 0 (0.0%) | 36 (36.7%) |
| $40,000 to $44,999 | 0 (0.0%) | 0 (0.0%) |
| $45,000 to $49,999 | 0 (0.0%) | 16 (16.3%) |
| $50,000 to $54,999 | 0 (0.0%) | 0 (0.0%) |
| $55,000 to $64,999 | 19 (100.0%) | 0 (0.0%) |
| $65,000 to $74,999 | 0 (0.0%) | 0 (0.0%) |
| $75,000 to $99,999 | 0 (0.0%) | 10 (10.2%) |
| $100,000+ | 0 (0.0%) | 0 (0.0%) |
| Total | 19 (100.0%) | 98 (100.0%) |
Earnings by Sex by Educational Attainment in Nobleton
| Educational Attainment | Male Income | Female Income |
| Less than High School | - | - |
| High School Diploma | - | - |
| College or Associate's Degree | - | - |
| Bachelor's Degree | - | - |
| Graduate Degree | - | - |
| Total | - | - |
Family Income in Nobleton
Family Income Brackets in Nobleton
According to the Nobleton family income data, there are 36 families falling into the $25,000 to $34,999 income range, which is the most common income bracket and makes up 42.9% of all families.
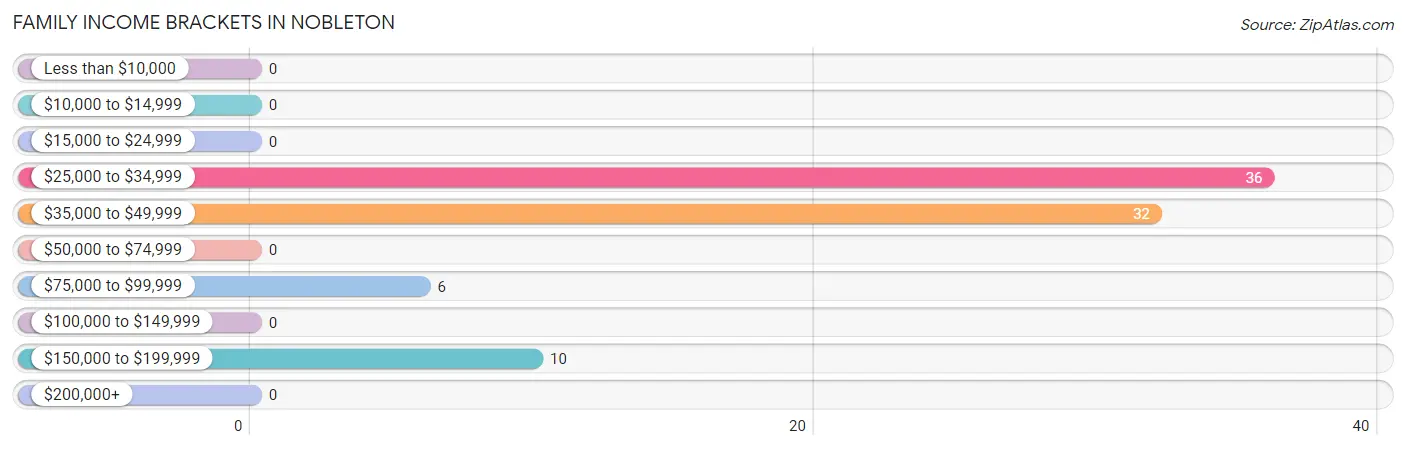
| Income Bracket | # Families | % Families |
| Less than $10,000 | 0 | 0.0% |
| $10,000 to $14,999 | 0 | 0.0% |
| $15,000 to $24,999 | 0 | 0.0% |
| $25,000 to $34,999 | 36 | 42.9% |
| $35,000 to $49,999 | 32 | 38.1% |
| $50,000 to $74,999 | 0 | 0.0% |
| $75,000 to $99,999 | 6 | 7.1% |
| $100,000 to $149,999 | 0 | 0.0% |
| $150,000 to $199,999 | 10 | 11.9% |
| $200,000+ | 0 | 0.0% |
Family Income by Famaliy Size in Nobleton
2-person families (84 | 100.0%) account for the highest median family income in Nobleton with $35,469 per family, while 2-person families (84 | 100.0%) have the highest median income of $17,734 per family member.
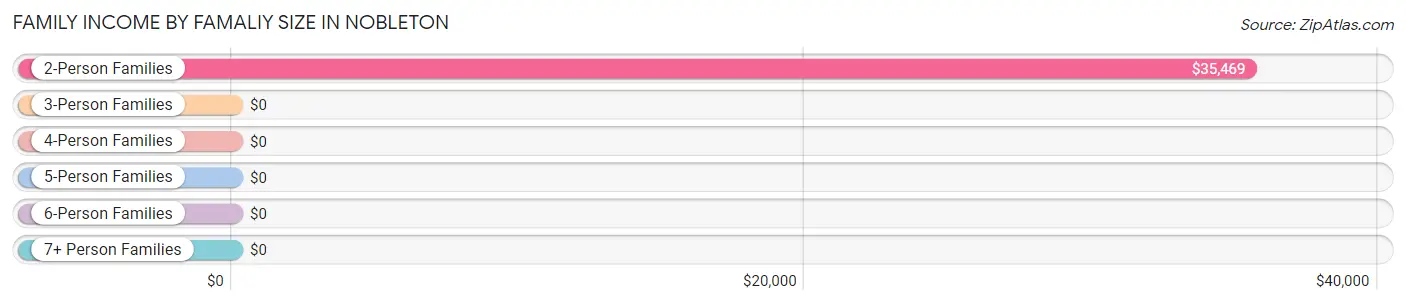
| Income Bracket | # Families | Median Income |
| 2-Person Families | 84 (100.0%) | $35,469 |
| 3-Person Families | 0 (0.0%) | $0 |
| 4-Person Families | 0 (0.0%) | $0 |
| 5-Person Families | 0 (0.0%) | $0 |
| 6-Person Families | 0 (0.0%) | $0 |
| 7+ Person Families | 0 (0.0%) | $0 |
| Total | 84 (100.0%) | $35,469 |
Family Income by Number of Earners in Nobleton
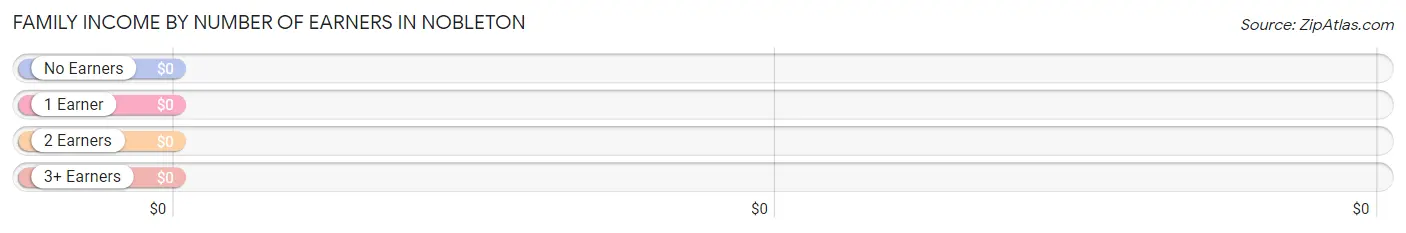
| Number of Earners | # Families | Median Income |
| No Earners | 6 (7.1%) | $0 |
| 1 Earner | 68 (80.9%) | $0 |
| 2 Earners | 10 (11.9%) | $0 |
| 3+ Earners | 0 (0.0%) | $0 |
| Total | 84 (100.0%) | $35,469 |
Household Income in Nobleton
Household Income Brackets in Nobleton
With 53 households falling in the category, the less than $10,000 income range is the most frequent in Nobleton, accounting for 34.6% of all households.
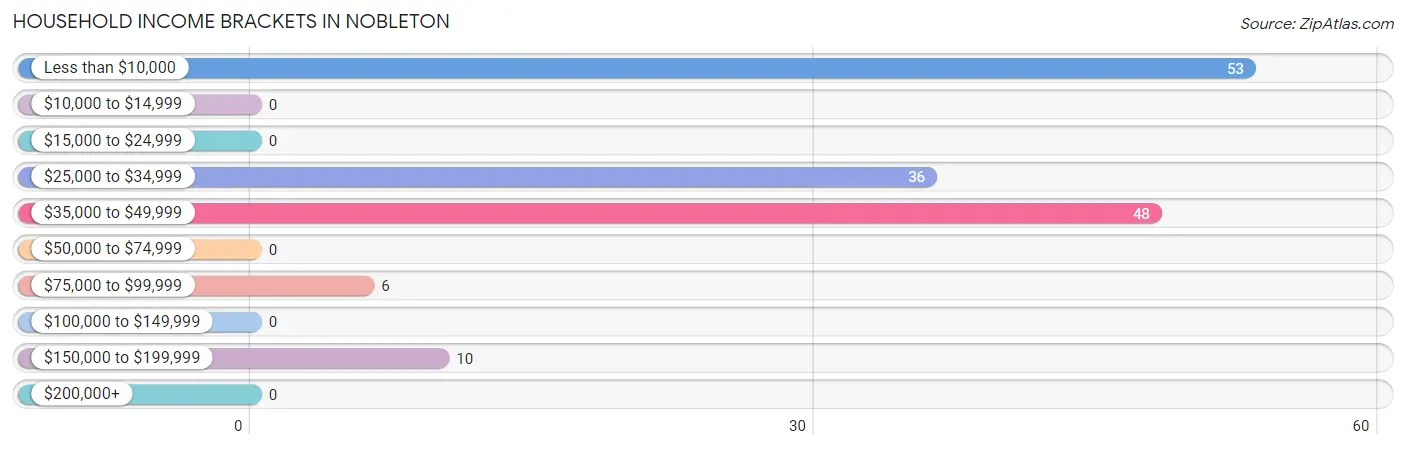
| Income Bracket | # Households | % Households |
| Less than $10,000 | 53 | 34.6% |
| $10,000 to $14,999 | 0 | 0.0% |
| $15,000 to $24,999 | 0 | 0.0% |
| $25,000 to $34,999 | 36 | 23.5% |
| $35,000 to $49,999 | 48 | 31.4% |
| $50,000 to $74,999 | 0 | 0.0% |
| $75,000 to $99,999 | 6 | 3.9% |
| $100,000 to $149,999 | 0 | 0.0% |
| $150,000 to $199,999 | 10 | 6.5% |
| $200,000+ | 0 | 0.0% |
Household Income by Householder Age in Nobleton
The median household income in Nobleton is $29,132, with the highest median household income of $2,499 found in the 45 to 64 years age bracket for the primary householder. A total of 69 households (45.1%) fall into this category.
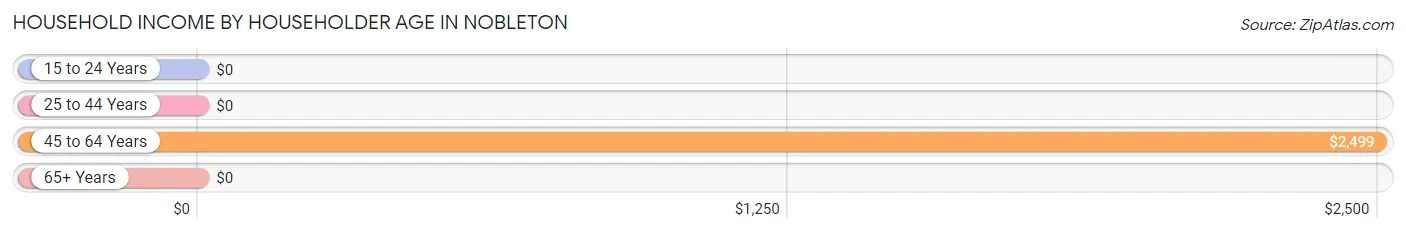
| Income Bracket | # Households | Median Income |
| 15 to 24 Years | 0 (0.0%) | $0 |
| 25 to 44 Years | 36 (23.5%) | $0 |
| 45 to 64 Years | 69 (45.1%) | $2,499 |
| 65+ Years | 48 (31.4%) | $0 |
| Total | 153 (100.0%) | $29,132 |
Poverty in Nobleton
Income Below Poverty by Sex and Age in Nobleton
With 55.7% poverty level for males and 10.1% for females among the residents of Nobleton, 55 to 64 year old males and 45 to 54 year old females are the most vulnerable to poverty, with 34 males (100.0%) and 19 females (100.0%) in their respective age groups living below the poverty level.
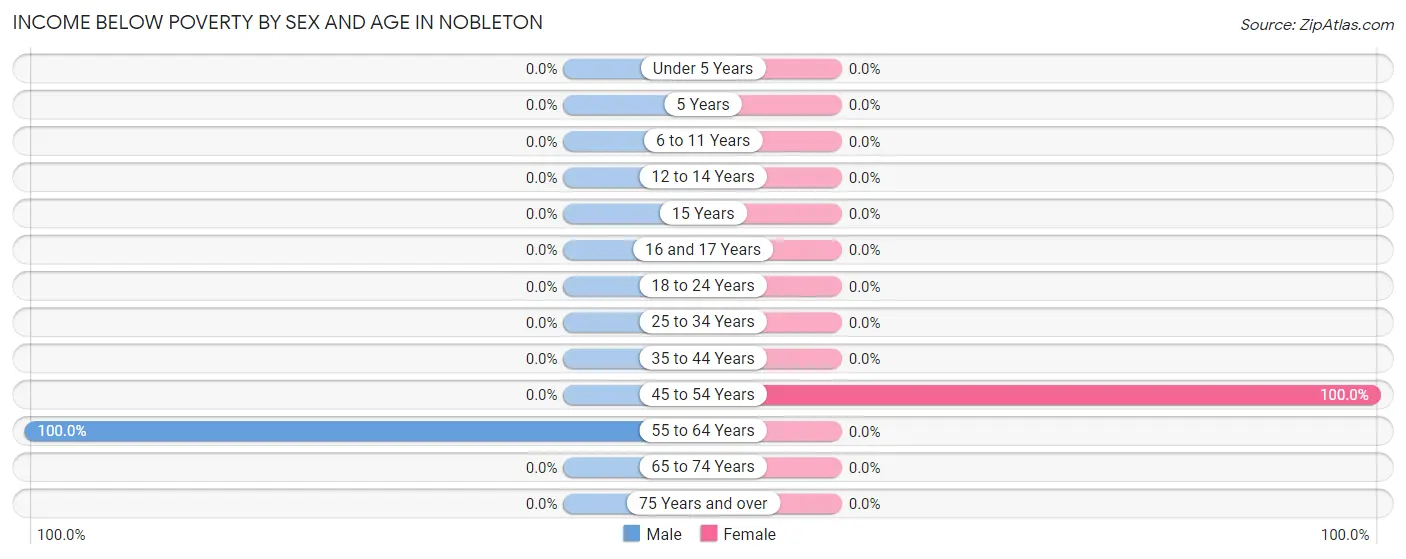
| Age Bracket | Male | Female |
| Under 5 Years | 0 (0.0%) | 0 (0.0%) |
| 5 Years | 0 (0.0%) | 0 (0.0%) |
| 6 to 11 Years | 0 (0.0%) | 0 (0.0%) |
| 12 to 14 Years | 0 (0.0%) | 0 (0.0%) |
| 15 Years | 0 (0.0%) | 0 (0.0%) |
| 16 and 17 Years | 0 (0.0%) | 0 (0.0%) |
| 18 to 24 Years | 0 (0.0%) | 0 (0.0%) |
| 25 to 34 Years | 0 (0.0%) | 0 (0.0%) |
| 35 to 44 Years | 0 (0.0%) | 0 (0.0%) |
| 45 to 54 Years | 0 (0.0%) | 19 (100.0%) |
| 55 to 64 Years | 34 (100.0%) | 0 (0.0%) |
| 65 to 74 Years | 0 (0.0%) | 0 (0.0%) |
| 75 Years and over | 0 (0.0%) | 0 (0.0%) |
| Total | 34 (55.7%) | 19 (10.1%) |
Income Above Poverty by Sex and Age in Nobleton
According to the poverty statistics in Nobleton, males aged 45 to 54 years and females aged 6 to 11 years are the age groups that are most secure financially, with 100.0% of males and 100.0% of females in these age groups living above the poverty line.
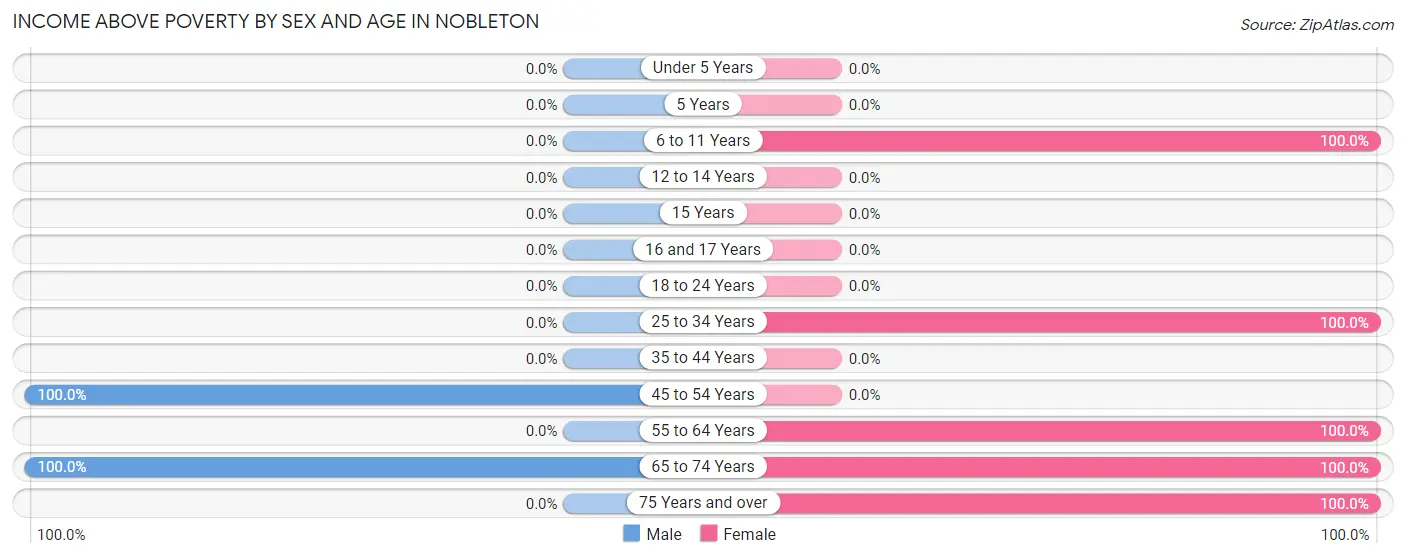
| Age Bracket | Male | Female |
| Under 5 Years | 0 (0.0%) | 0 (0.0%) |
| 5 Years | 0 (0.0%) | 0 (0.0%) |
| 6 to 11 Years | 0 (0.0%) | 34 (100.0%) |
| 12 to 14 Years | 0 (0.0%) | 0 (0.0%) |
| 15 Years | 0 (0.0%) | 0 (0.0%) |
| 16 and 17 Years | 0 (0.0%) | 0 (0.0%) |
| 18 to 24 Years | 0 (0.0%) | 0 (0.0%) |
| 25 to 34 Years | 0 (0.0%) | 72 (100.0%) |
| 35 to 44 Years | 0 (0.0%) | 0 (0.0%) |
| 45 to 54 Years | 8 (100.0%) | 0 (0.0%) |
| 55 to 64 Years | 0 (0.0%) | 16 (100.0%) |
| 65 to 74 Years | 19 (100.0%) | 38 (100.0%) |
| 75 Years and over | 0 (0.0%) | 10 (100.0%) |
| Total | 27 (44.3%) | 170 (89.9%) |
Income Below Poverty Among Married-Couple Families in Nobleton
| Children | Above Poverty | Below Poverty |
| No Children | 16 (100.0%) | 0 (0.0%) |
| 1 or 2 Children | 0 (0.0%) | 0 (0.0%) |
| 3 or 4 Children | 0 (0.0%) | 0 (0.0%) |
| 5 or more Children | 0 (0.0%) | 0 (0.0%) |
| Total | 16 (100.0%) | 0 (0.0%) |
Income Below Poverty Among Single-Parent Households in Nobleton
| Children | Single Father | Single Mother |
| No Children | 0 (0.0%) | 0 (0.0%) |
| 1 or 2 Children | 0 (0.0%) | 0 (0.0%) |
| 3 or 4 Children | 0 (0.0%) | 0 (0.0%) |
| 5 or more Children | 0 (0.0%) | 0 (0.0%) |
| Total | 0 (0.0%) | 0 (0.0%) |
Income Below Poverty Among Married-Couple vs Single-Parent Households in Nobleton
| Children | Married-Couple Families | Single-Parent Households |
| No Children | 0 (0.0%) | 0 (0.0%) |
| 1 or 2 Children | 0 (0.0%) | 0 (0.0%) |
| 3 or 4 Children | 0 (0.0%) | 0 (0.0%) |
| 5 or more Children | 0 (0.0%) | 0 (0.0%) |
| Total | 0 (0.0%) | 0 (0.0%) |
Race in Nobleton
The most populous races in Nobleton are White / Caucasian (216 | 86.4%), Two or more Races (34 | 13.6%), and Hispanic or Latino (19 | 7.6%).
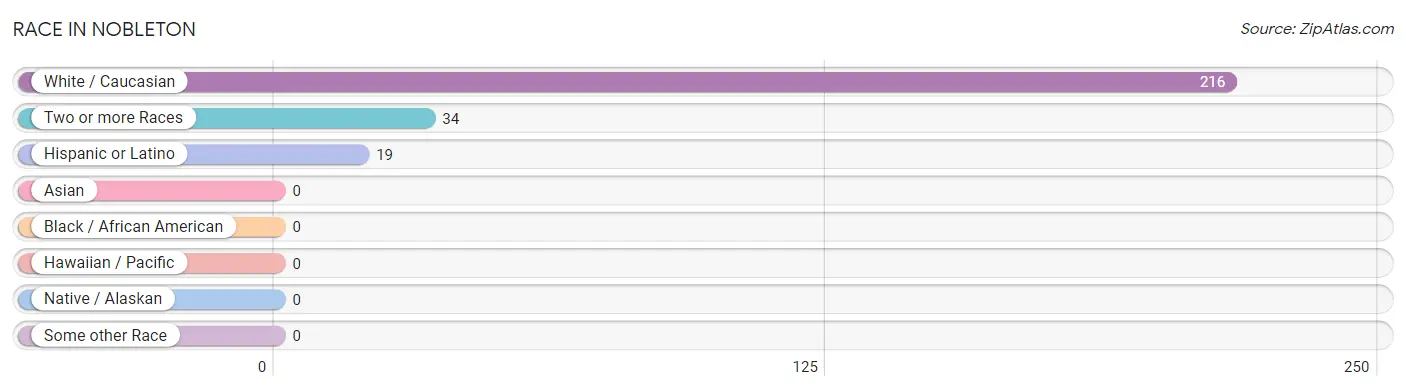
| Race | # Population | % Population |
| Asian | 0 | 0.0% |
| Black / African American | 0 | 0.0% |
| Hawaiian / Pacific | 0 | 0.0% |
| Hispanic or Latino | 19 | 7.6% |
| Native / Alaskan | 0 | 0.0% |
| White / Caucasian | 216 | 86.4% |
| Two or more Races | 34 | 13.6% |
| Some other Race | 0 | 0.0% |
| Total | 250 | 100.0% |
Ancestry in Nobleton
The most populous ancestries reported in Nobleton are American (138 | 55.2%), German (68 | 27.2%), Irish (22 | 8.8%), Polish (19 | 7.6%), and Puerto Rican (19 | 7.6%), together accounting for 106.4% of all Nobleton residents.
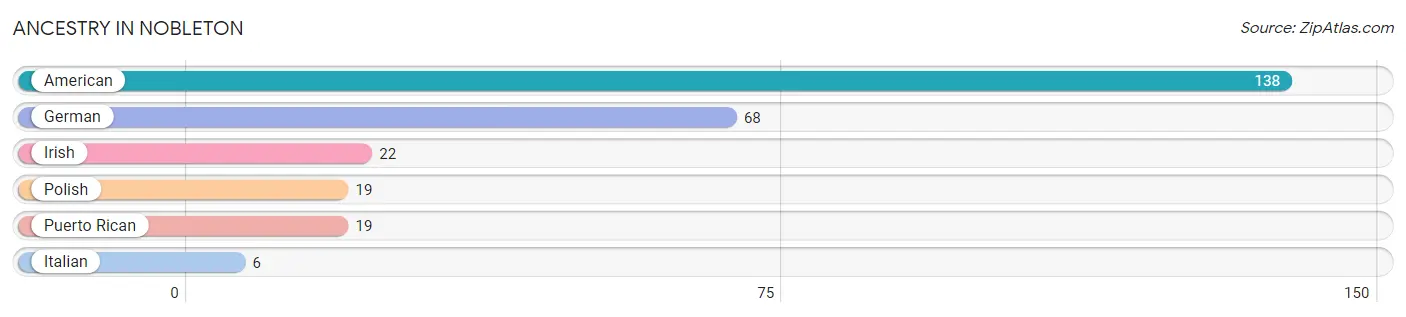
| Ancestry | # Population | % Population |
| American | 138 | 55.2% |
| German | 68 | 27.2% |
| Irish | 22 | 8.8% |
| Italian | 6 | 2.4% |
| Polish | 19 | 7.6% |
| Puerto Rican | 19 | 7.6% | View All 6 Rows |
Immigrants in Nobleton
The most numerous immigrant groups reported in Nobleton came from Central America (19 | 7.6%), Latin America (19 | 7.6%), and Mexico (19 | 7.6%), together accounting for 22.8% of all Nobleton residents.
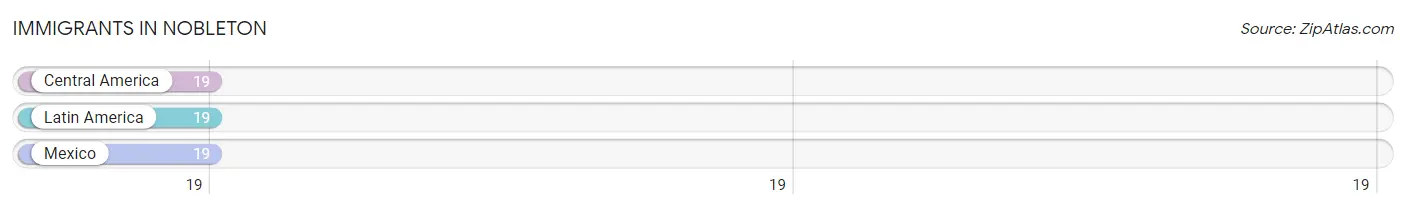
| Immigration Origin | # Population | % Population |
| Central America | 19 | 7.6% |
| Latin America | 19 | 7.6% |
| Mexico | 19 | 7.6% | View All 3 Rows |
Sex and Age in Nobleton
Sex and Age in Nobleton
The most populous age groups in Nobleton are 55 to 59 Years (34 | 55.7%) for men and 70 to 74 Years (38 | 20.1%) for women.
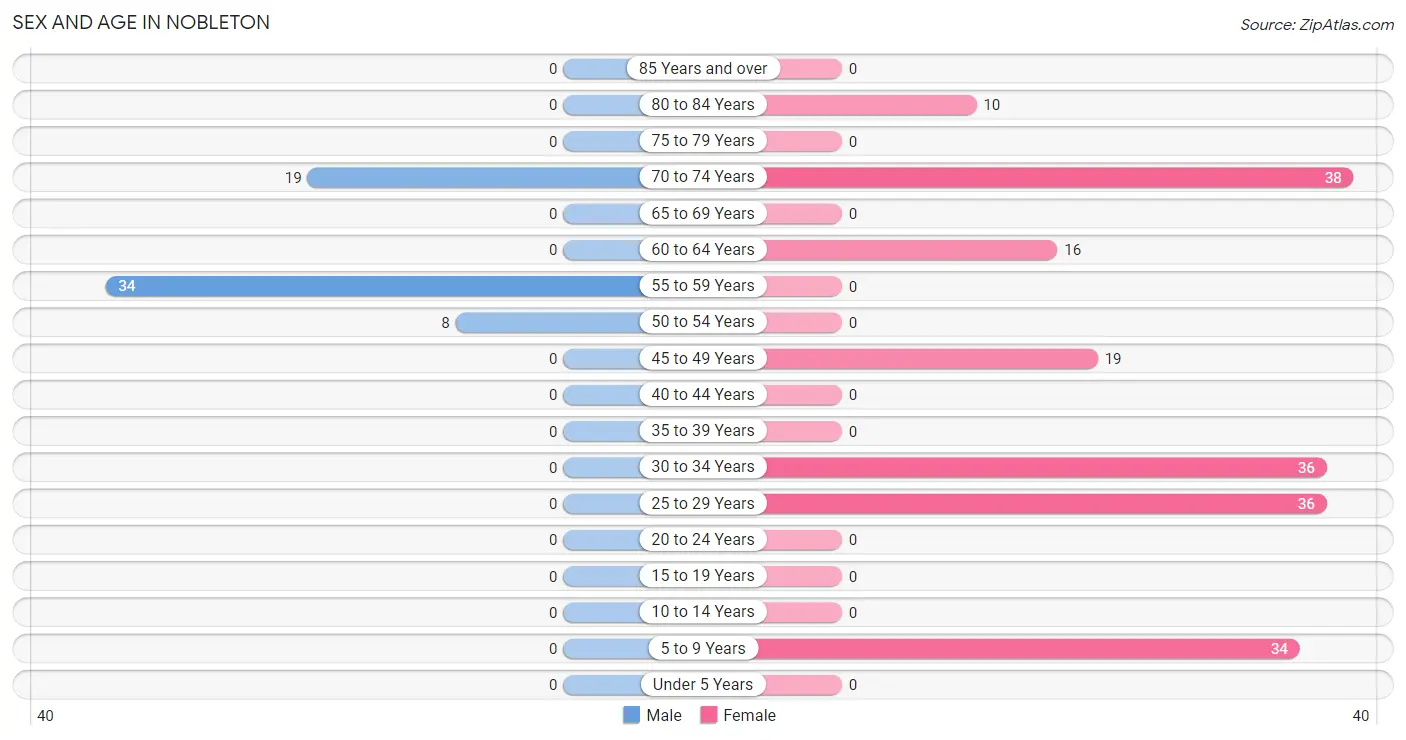
| Age Bracket | Male | Female |
| Under 5 Years | 0 (0.0%) | 0 (0.0%) |
| 5 to 9 Years | 0 (0.0%) | 34 (18.0%) |
| 10 to 14 Years | 0 (0.0%) | 0 (0.0%) |
| 15 to 19 Years | 0 (0.0%) | 0 (0.0%) |
| 20 to 24 Years | 0 (0.0%) | 0 (0.0%) |
| 25 to 29 Years | 0 (0.0%) | 36 (19.1%) |
| 30 to 34 Years | 0 (0.0%) | 36 (19.1%) |
| 35 to 39 Years | 0 (0.0%) | 0 (0.0%) |
| 40 to 44 Years | 0 (0.0%) | 0 (0.0%) |
| 45 to 49 Years | 0 (0.0%) | 19 (10.1%) |
| 50 to 54 Years | 8 (13.1%) | 0 (0.0%) |
| 55 to 59 Years | 34 (55.7%) | 0 (0.0%) |
| 60 to 64 Years | 0 (0.0%) | 16 (8.5%) |
| 65 to 69 Years | 0 (0.0%) | 0 (0.0%) |
| 70 to 74 Years | 19 (31.1%) | 38 (20.1%) |
| 75 to 79 Years | 0 (0.0%) | 0 (0.0%) |
| 80 to 84 Years | 0 (0.0%) | 10 (5.3%) |
| 85 Years and over | 0 (0.0%) | 0 (0.0%) |
| Total | 61 (100.0%) | 189 (100.0%) |
Families and Households in Nobleton
Median Family Size in Nobleton
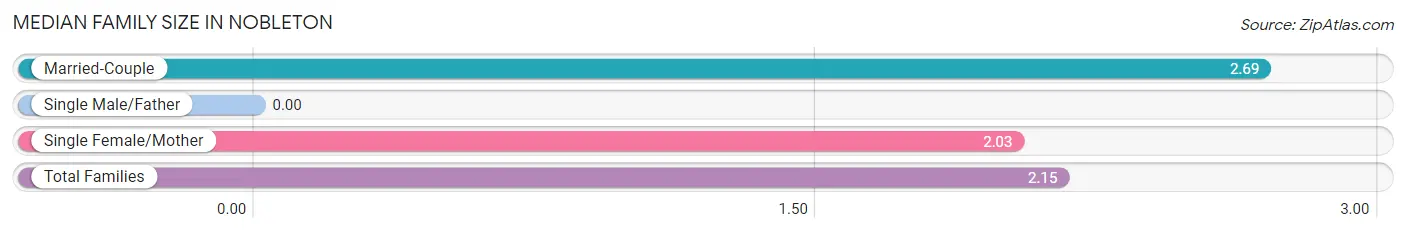
| Family Type | # Families | Family Size |
| Married-Couple | 16 (19.1%) | 2.69 |
| Single Male/Father | 0 (0.0%) | - |
| Single Female/Mother | 68 (80.9%) | 2.03 |
| Total Families | 84 (100.0%) | 2.15 |
Median Household Size in Nobleton
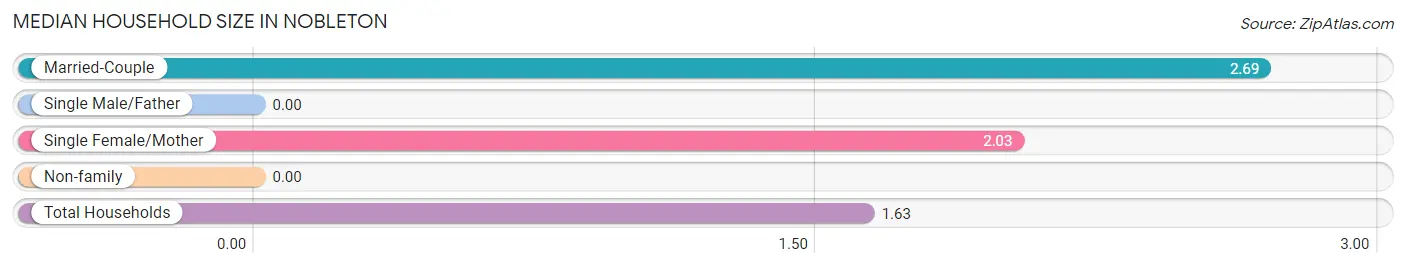
| Household Type | # Households | Household Size |
| Married-Couple | 16 (10.5%) | 2.69 |
| Single Male/Father | 0 (0.0%) | - |
| Single Female/Mother | 68 (44.4%) | 2.03 |
| Non-family | 69 (45.1%) | - |
| Total Households | 153 (100.0%) | 1.63 |
Household Size by Marriage Status in Nobleton
Out of a total of 153 households in Nobleton, 84 (54.9%) are family households, while 69 (45.1%) are nonfamily households. The most numerous type of family households are 2-person households, comprising 84, and the most common type of nonfamily households are 1-person households, comprising 69.
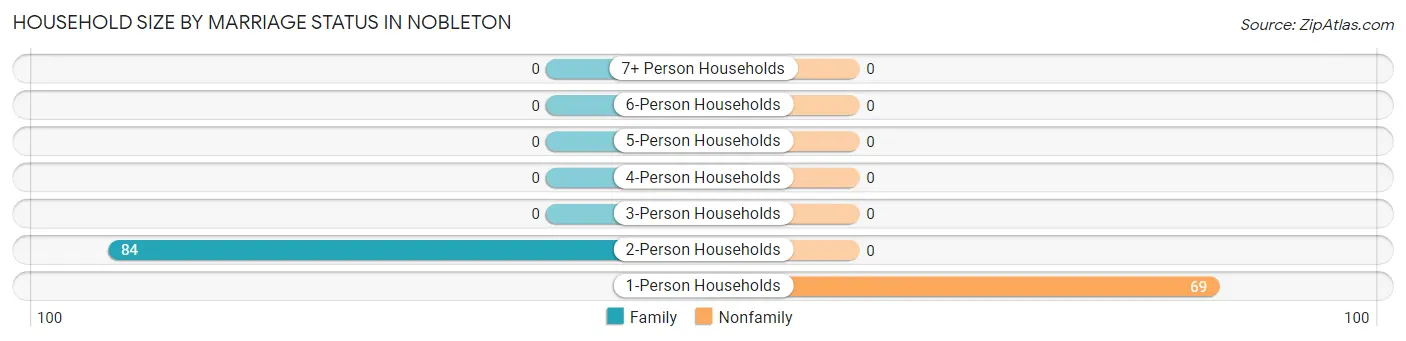
| Household Size | Family Households | Nonfamily Households |
| 1-Person Households | - | 69 (45.1%) |
| 2-Person Households | 84 (54.9%) | 0 (0.0%) |
| 3-Person Households | 0 (0.0%) | 0 (0.0%) |
| 4-Person Households | 0 (0.0%) | 0 (0.0%) |
| 5-Person Households | 0 (0.0%) | 0 (0.0%) |
| 6-Person Households | 0 (0.0%) | 0 (0.0%) |
| 7+ Person Households | 0 (0.0%) | 0 (0.0%) |
| Total | 84 (54.9%) | 69 (45.1%) |
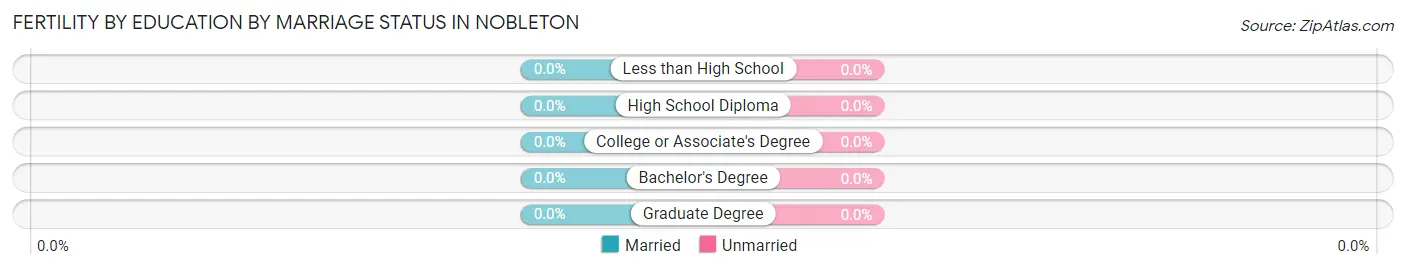
Female Fertility in Nobleton
Fertility by Age in Nobleton
| Age Bracket | Women with Births | Births / 1,000 Women |
| 15 to 19 years | 0 (0.0%) | 0.0 |
| 20 to 34 years | 0 (0.0%) | 0.0 |
| 35 to 50 years | 0 (0.0%) | 0.0 |
| Total | 0 (0.0%) | 0.0 |
Fertility by Age by Marriage Status in Nobleton
| Age Bracket | Married | Unmarried |
| 15 to 19 years | 0 (0.0%) | 0 (0.0%) |
| 20 to 34 years | 0 (0.0%) | 0 (0.0%) |
| 35 to 50 years | 0 (0.0%) | 0 (0.0%) |
| Total | 0 (0.0%) | 0 (0.0%) |
Fertility by Education in Nobleton
| Educational Attainment | Women with Births | Births / 1,000 Women |
| Less than High School | 0 (0.0%) | 0.0 |
| High School Diploma | 0 (0.0%) | 0.0 |
| College or Associate's Degree | 0 (0.0%) | 0.0 |
| Bachelor's Degree | 0 (0.0%) | 0.0 |
| Graduate Degree | 0 (0.0%) | 0.0 |
| Total | 0 (0.0%) | 0.0 |
Fertility by Education by Marriage Status in Nobleton
| Educational Attainment | Married | Unmarried |
| Less than High School | 0 (0.0%) | 0 (0.0%) |
| High School Diploma | 0 (0.0%) | 0 (0.0%) |
| College or Associate's Degree | 0 (0.0%) | 0 (0.0%) |
| Bachelor's Degree | 0 (0.0%) | 0 (0.0%) |
| Graduate Degree | 0 (0.0%) | 0 (0.0%) |
| Total | 0 (0.0%) | 0 (0.0%) |
Employment Characteristics in Nobleton
Employment by Class of Employer in Nobleton
Among the 36 employed individuals in Nobleton, , and private company employees (36 | 100.0%) make up the most common classes of employment.
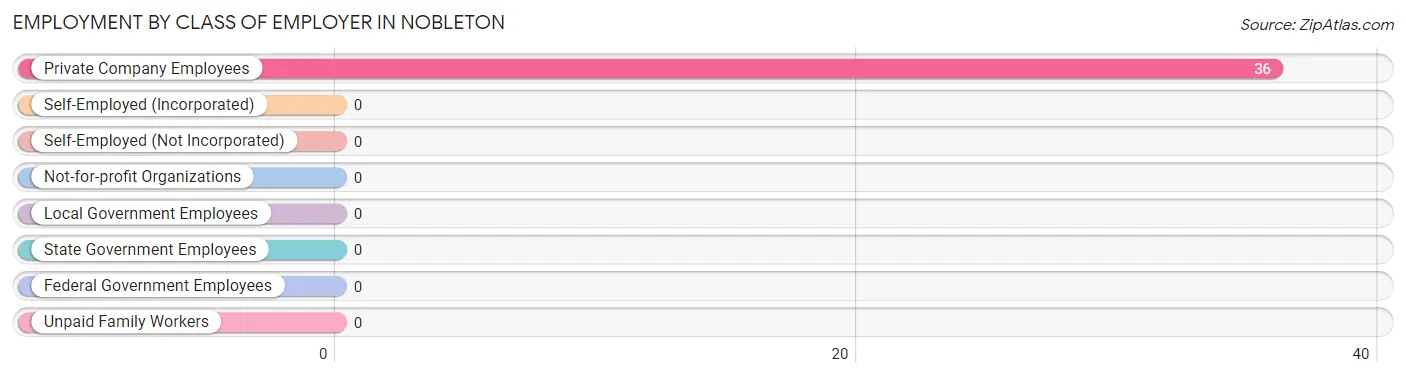
| Employer Class | # Employees | % Employees |
| Private Company Employees | 36 | 100.0% |
| Self-Employed (Incorporated) | 0 | 0.0% |
| Self-Employed (Not Incorporated) | 0 | 0.0% |
| Not-for-profit Organizations | 0 | 0.0% |
| Local Government Employees | 0 | 0.0% |
| State Government Employees | 0 | 0.0% |
| Federal Government Employees | 0 | 0.0% |
| Unpaid Family Workers | 0 | 0.0% |
| Total | 36 | 100.0% |
Employment Status by Age in Nobleton
According to the labor force statistics for Nobleton, out of the total population over 16 years of age (216), 40.7% or 88 individuals are in the labor force, with 59.1% or 52 of them unemployed. The age group with the highest labor force participation rate is 25 to 29 years, with 100.0% or 36 individuals in the labor force. Within the labor force, the 25 to 29 years age range has the highest percentage of unemployed individuals, with 100.0% or 36 of them being unemployed.
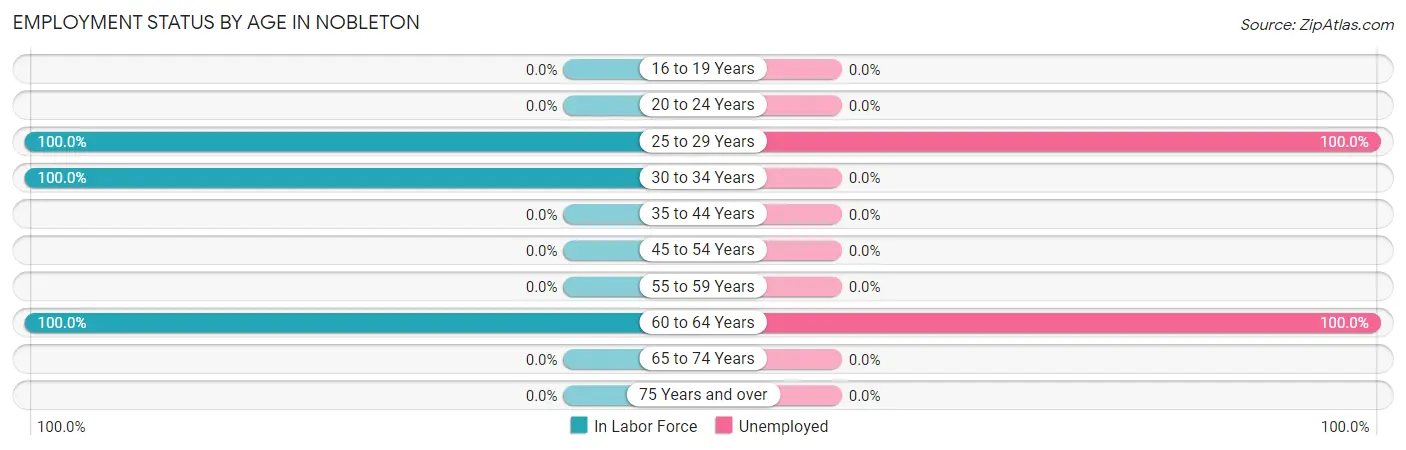
| Age Bracket | In Labor Force | Unemployed |
| 16 to 19 Years | 0 (0.0%) | 0 (0.0%) |
| 20 to 24 Years | 0 (0.0%) | 0 (0.0%) |
| 25 to 29 Years | 36 (100.0%) | 36 (100.0%) |
| 30 to 34 Years | 36 (100.0%) | 0 (0.0%) |
| 35 to 44 Years | 0 (0.0%) | 0 (0.0%) |
| 45 to 54 Years | 0 (0.0%) | 0 (0.0%) |
| 55 to 59 Years | 0 (0.0%) | 0 (0.0%) |
| 60 to 64 Years | 16 (100.0%) | 16 (100.0%) |
| 65 to 74 Years | 0 (0.0%) | 0 (0.0%) |
| 75 Years and over | 0 (0.0%) | 0 (0.0%) |
| Total | 88 (40.7%) | 52 (59.1%) |
Employment Status by Educational Attainment in Nobleton
According to labor force statistics for Nobleton, 59.1% of individuals (88) out of the total population between 25 and 64 years of age (149) are in the labor force, with 59.1% or 52 of them being unemployed. The group with the highest labor force participation rate are those with the educational attainment of less than high school, with 100.0% or 36 individuals in the labor force. Within the labor force, individuals with high school diploma education have the highest percentage of unemployment, with 100.0% or 36 of them being unemployed.
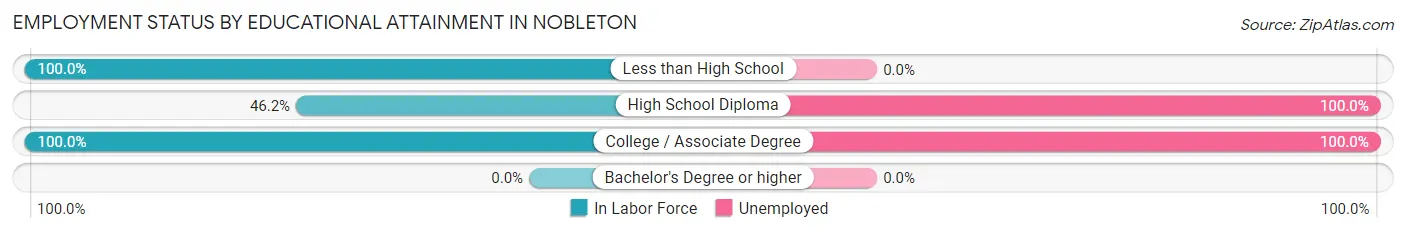
| Educational Attainment | In Labor Force | Unemployed |
| Less than High School | 36 (100.0%) | 0 (0.0%) |
| High School Diploma | 36 (46.2%) | 78 (100.0%) |
| College / Associate Degree | 16 (100.0%) | 16 (100.0%) |
| Bachelor's Degree or higher | 0 (0.0%) | 0 (0.0%) |
| Total | 88 (59.1%) | 88 (59.1%) |
Employment Occupations by Sex in Nobleton
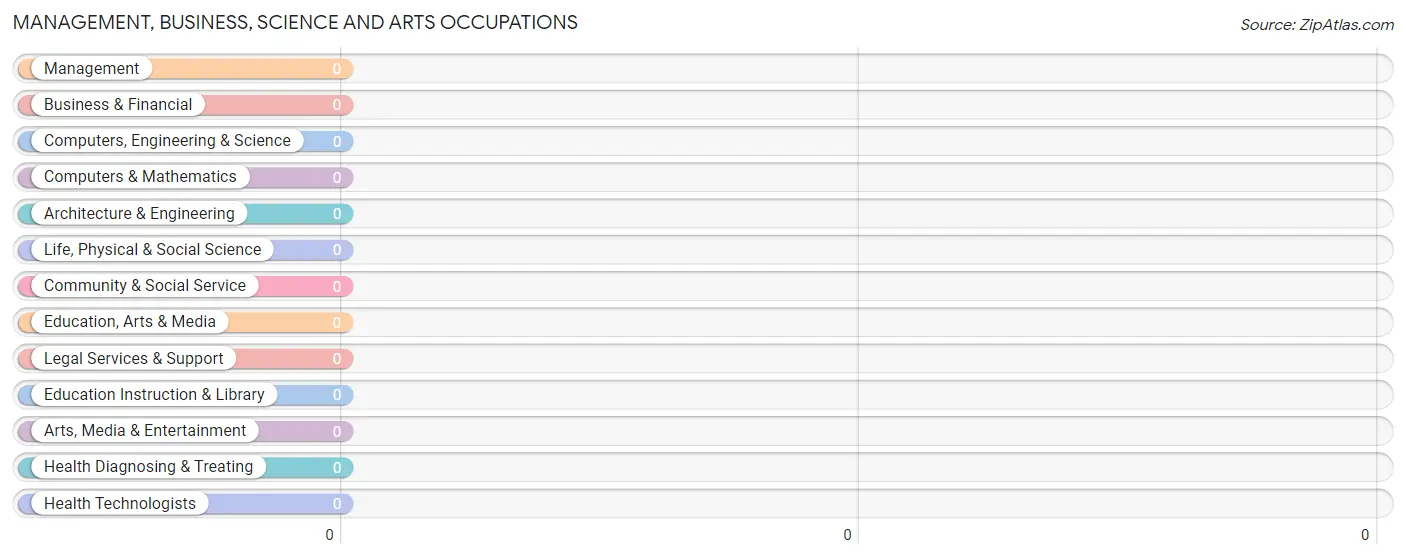
Management, Business, Science and Arts Occupations
Management, Business, Science and Arts Occupations by Sex
| Occupation | Male | Female |
| Management | 0 (0.0%) | 0 (0.0%) |
| Business & Financial | 0 (0.0%) | 0 (0.0%) |
| Computers, Engineering & Science | 0 (0.0%) | 0 (0.0%) |
| Computers & Mathematics | 0 (0.0%) | 0 (0.0%) |
| Architecture & Engineering | 0 (0.0%) | 0 (0.0%) |
| Life, Physical & Social Science | 0 (0.0%) | 0 (0.0%) |
| Community & Social Service | 0 (0.0%) | 0 (0.0%) |
| Education, Arts & Media | 0 (0.0%) | 0 (0.0%) |
| Legal Services & Support | 0 (0.0%) | 0 (0.0%) |
| Education Instruction & Library | 0 (0.0%) | 0 (0.0%) |
| Arts, Media & Entertainment | 0 (0.0%) | 0 (0.0%) |
| Health Diagnosing & Treating | 0 (0.0%) | 0 (0.0%) |
| Health Technologists | 0 (0.0%) | 0 (0.0%) |
| Total (Category) | 0 (0.0%) | 0 (0.0%) |
| Total (Overall) | 0 (0.0%) | 36 (100.0%) |
Services Occupations
The most common Services occupations in Nobleton are , and Food Preparation & Serving (36 | 100.0%).
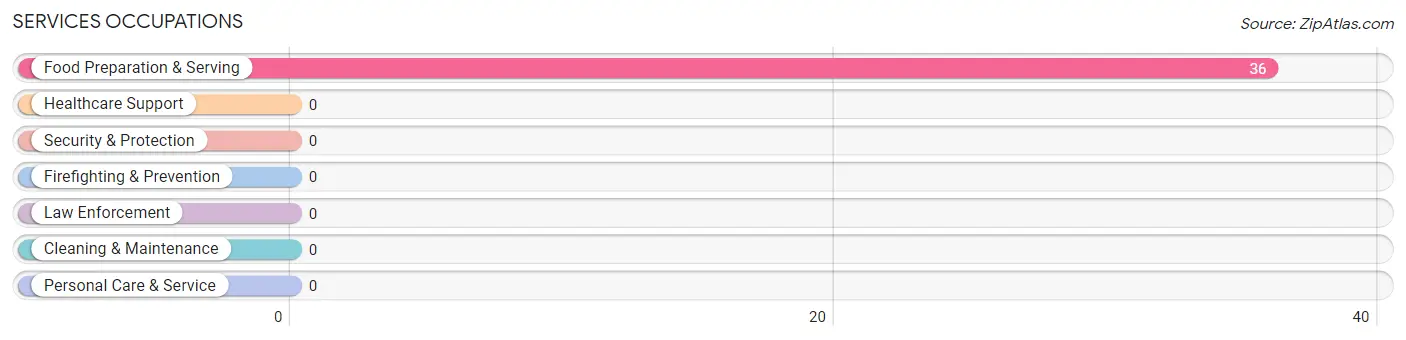
Services Occupations by Sex
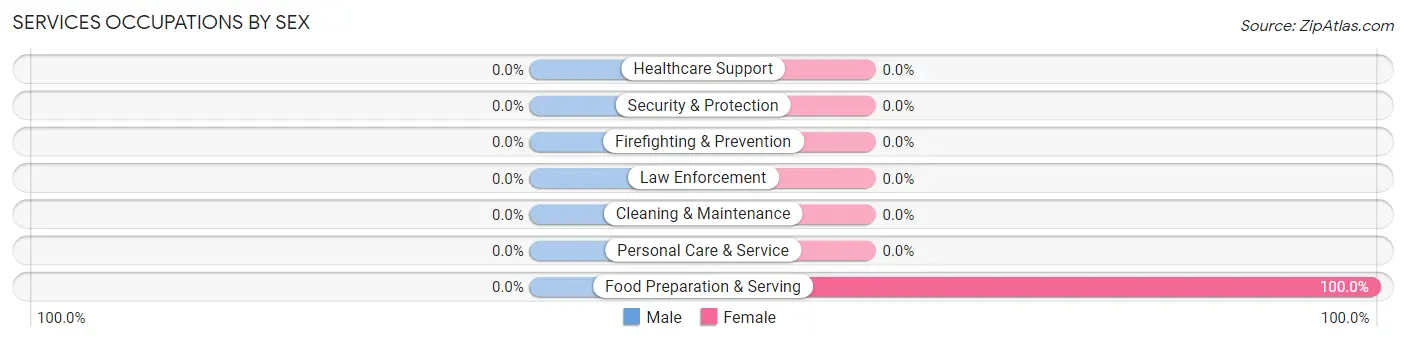
| Occupation | Male | Female |
| Healthcare Support | 0 (0.0%) | 0 (0.0%) |
| Security & Protection | 0 (0.0%) | 0 (0.0%) |
| Firefighting & Prevention | 0 (0.0%) | 0 (0.0%) |
| Law Enforcement | 0 (0.0%) | 0 (0.0%) |
| Food Preparation & Serving | 0 (0.0%) | 36 (100.0%) |
| Cleaning & Maintenance | 0 (0.0%) | 0 (0.0%) |
| Personal Care & Service | 0 (0.0%) | 0 (0.0%) |
| Total (Category) | 0 (0.0%) | 36 (100.0%) |
| Total (Overall) | 0 (0.0%) | 36 (100.0%) |
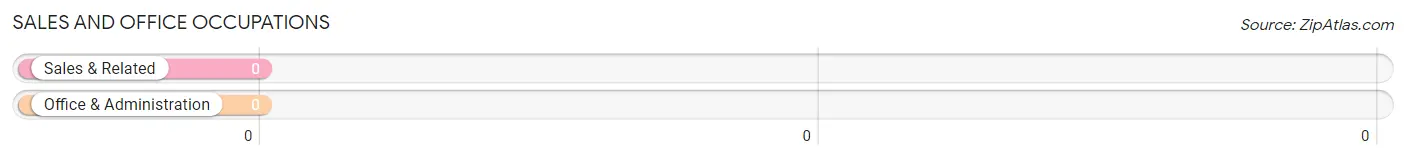
Sales and Office Occupations
Sales and Office Occupations by Sex
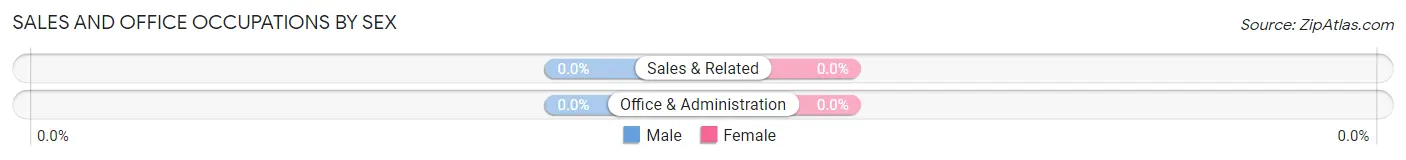
| Occupation | Male | Female |
| Sales & Related | 0 (0.0%) | 0 (0.0%) |
| Office & Administration | 0 (0.0%) | 0 (0.0%) |
| Total (Category) | 0 (0.0%) | 0 (0.0%) |
| Total (Overall) | 0 (0.0%) | 36 (100.0%) |
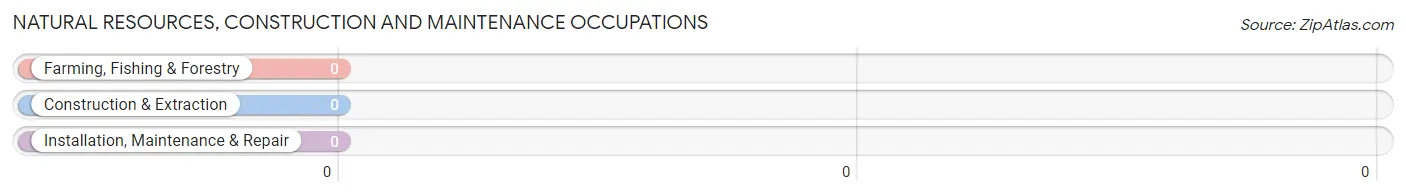
Natural Resources, Construction and Maintenance Occupations
Natural Resources, Construction and Maintenance Occupations by Sex
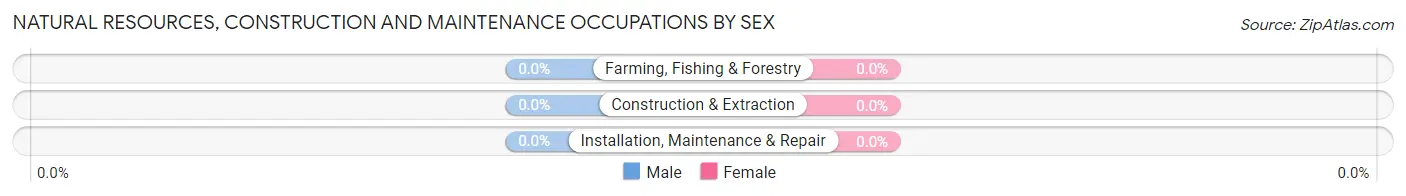
| Occupation | Male | Female |
| Farming, Fishing & Forestry | 0 (0.0%) | 0 (0.0%) |
| Construction & Extraction | 0 (0.0%) | 0 (0.0%) |
| Installation, Maintenance & Repair | 0 (0.0%) | 0 (0.0%) |
| Total (Category) | 0 (0.0%) | 0 (0.0%) |
| Total (Overall) | 0 (0.0%) | 36 (100.0%) |
Production, Transportation and Moving Occupations
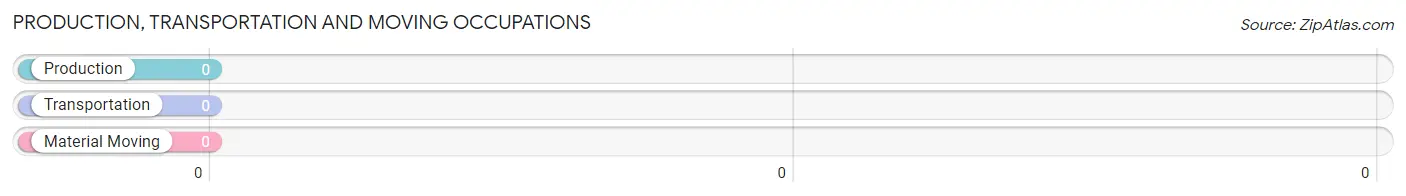
Production, Transportation and Moving Occupations by Sex
| Occupation | Male | Female |
| Production | 0 (0.0%) | 0 (0.0%) |
| Transportation | 0 (0.0%) | 0 (0.0%) |
| Material Moving | 0 (0.0%) | 0 (0.0%) |
| Total (Category) | 0 (0.0%) | 0 (0.0%) |
| Total (Overall) | 0 (0.0%) | 36 (100.0%) |
Employment Industries by Sex in Nobleton
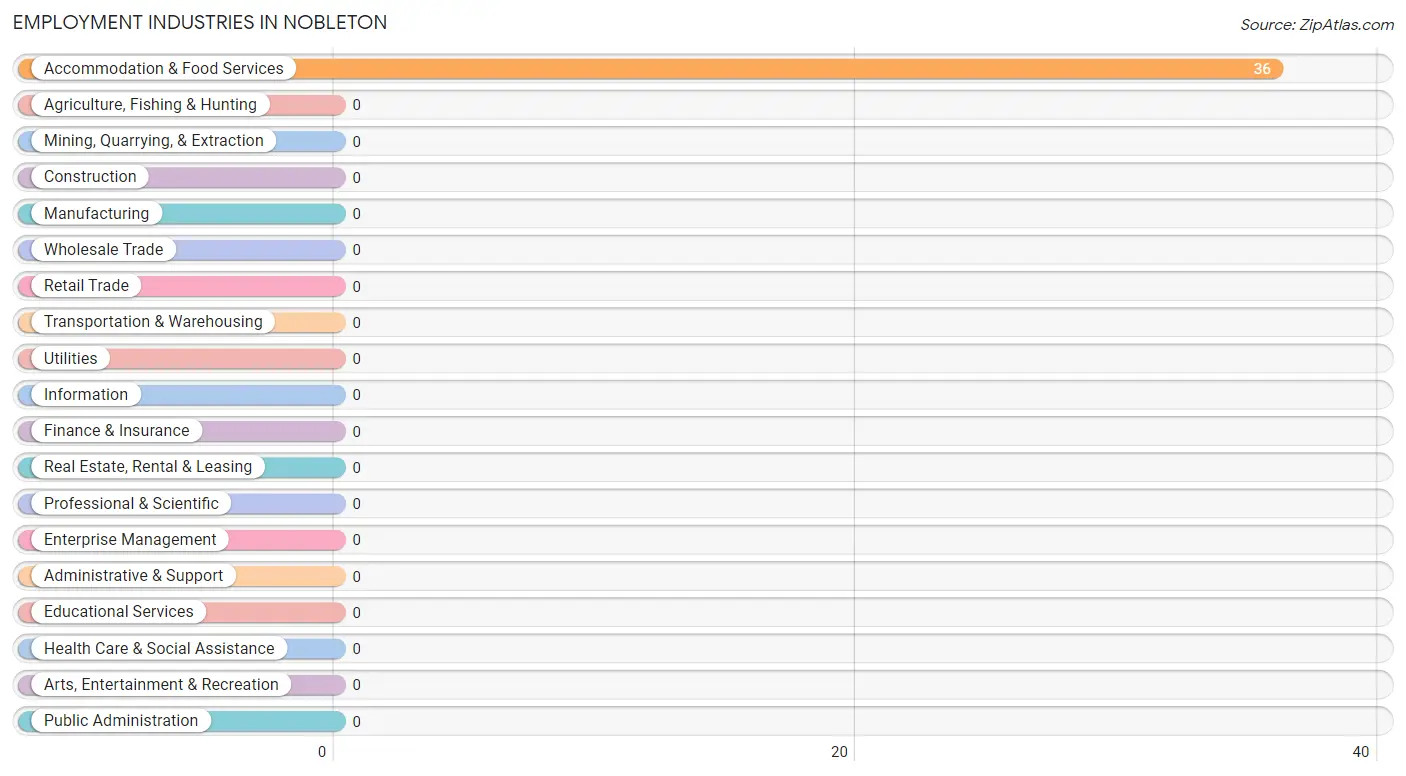
Employment Industries in Nobleton
The major employment industries in Nobleton include , and Accommodation & Food Services (36 | 100.0%).
Employment Industries by Sex in Nobleton
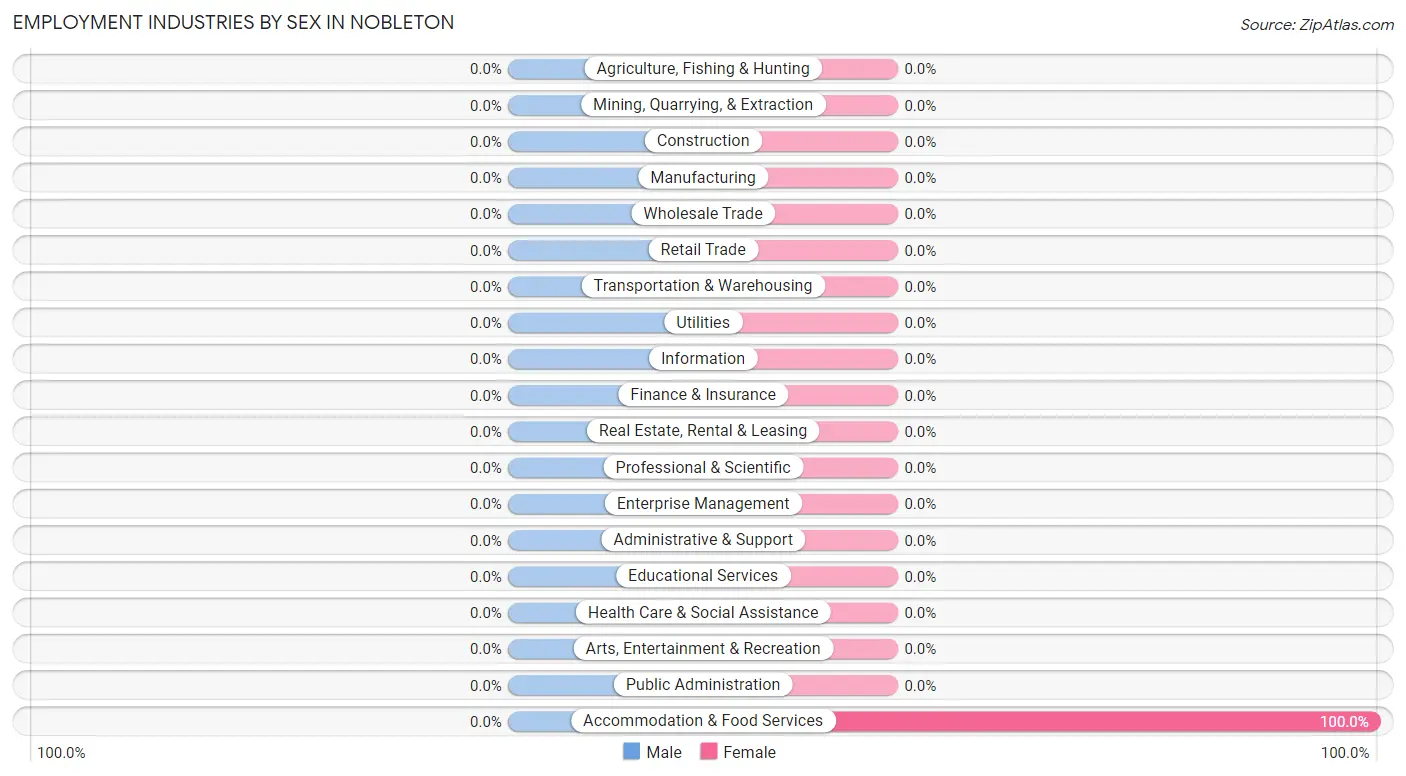
| Industry | Male | Female |
| Agriculture, Fishing & Hunting | 0 (0.0%) | 0 (0.0%) |
| Mining, Quarrying, & Extraction | 0 (0.0%) | 0 (0.0%) |
| Construction | 0 (0.0%) | 0 (0.0%) |
| Manufacturing | 0 (0.0%) | 0 (0.0%) |
| Wholesale Trade | 0 (0.0%) | 0 (0.0%) |
| Retail Trade | 0 (0.0%) | 0 (0.0%) |
| Transportation & Warehousing | 0 (0.0%) | 0 (0.0%) |
| Utilities | 0 (0.0%) | 0 (0.0%) |
| Information | 0 (0.0%) | 0 (0.0%) |
| Finance & Insurance | 0 (0.0%) | 0 (0.0%) |
| Real Estate, Rental & Leasing | 0 (0.0%) | 0 (0.0%) |
| Professional & Scientific | 0 (0.0%) | 0 (0.0%) |
| Enterprise Management | 0 (0.0%) | 0 (0.0%) |
| Administrative & Support | 0 (0.0%) | 0 (0.0%) |
| Educational Services | 0 (0.0%) | 0 (0.0%) |
| Health Care & Social Assistance | 0 (0.0%) | 0 (0.0%) |
| Arts, Entertainment & Recreation | 0 (0.0%) | 0 (0.0%) |
| Accommodation & Food Services | 0 (0.0%) | 36 (100.0%) |
| Public Administration | 0 (0.0%) | 0 (0.0%) |
| Total | 0 (0.0%) | 36 (100.0%) |
Education in Nobleton
School Enrollment in Nobleton
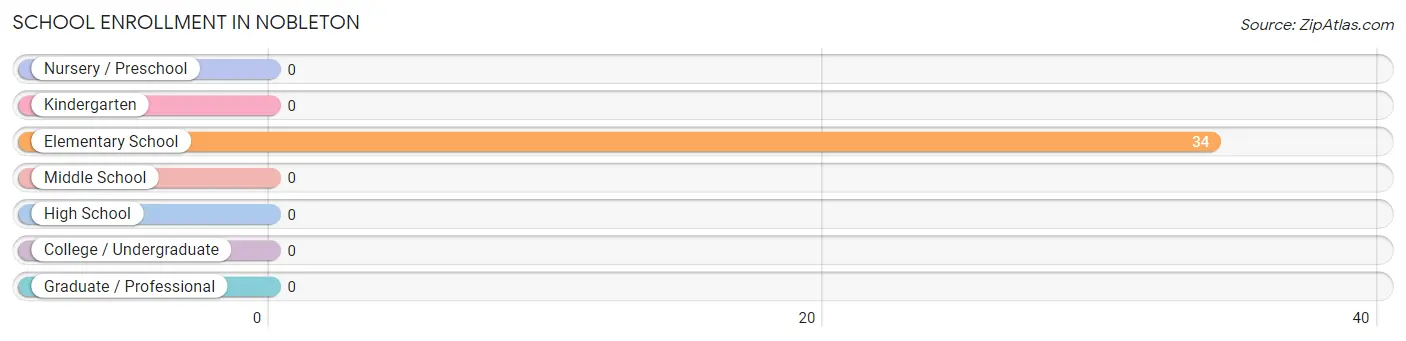
| School Level | # Students | % Students |
| Nursery / Preschool | 0 | 0.0% |
| Kindergarten | 0 | 0.0% |
| Elementary School | 34 | 100.0% |
| Middle School | 0 | 0.0% |
| High School | 0 | 0.0% |
| College / Undergraduate | 0 | 0.0% |
| Graduate / Professional | 0 | 0.0% |
| Total | 34 | 100.0% |
School Enrollment by Age by Funding Source in Nobleton
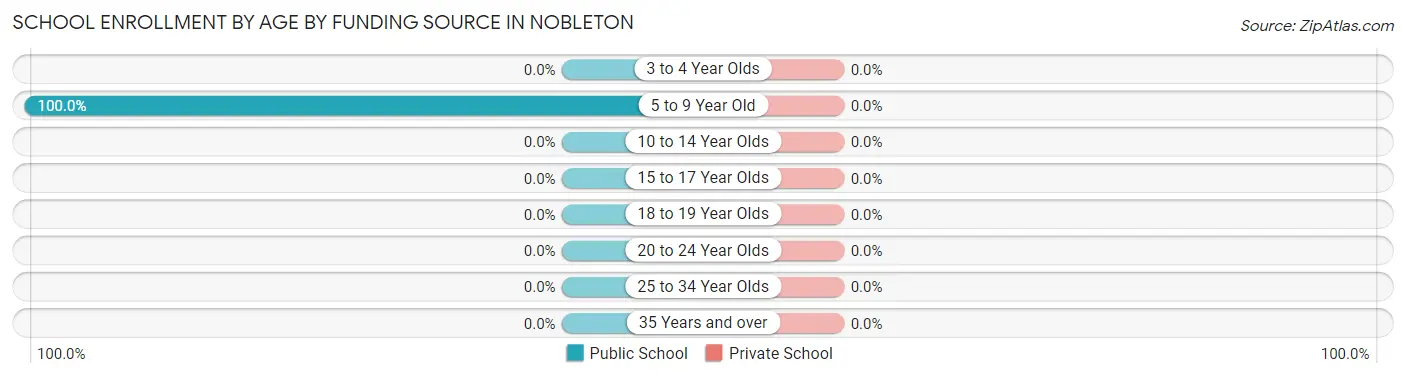
| Age Bracket | Public School | Private School |
| 3 to 4 Year Olds | 0 (0.0%) | 0 (0.0%) |
| 5 to 9 Year Old | 34 (100.0%) | 0 (0.0%) |
| 10 to 14 Year Olds | 0 (0.0%) | 0 (0.0%) |
| 15 to 17 Year Olds | 0 (0.0%) | 0 (0.0%) |
| 18 to 19 Year Olds | 0 (0.0%) | 0 (0.0%) |
| 20 to 24 Year Olds | 0 (0.0%) | 0 (0.0%) |
| 25 to 34 Year Olds | 0 (0.0%) | 0 (0.0%) |
| 35 Years and over | 0 (0.0%) | 0 (0.0%) |
| Total | 34 (100.0%) | 0 (0.0%) |
Educational Attainment by Field of Study in Nobleton
, and business (19 | 100.0%) are the most common fields of study among 19 individuals in Nobleton who have obtained a bachelor's degree or higher.
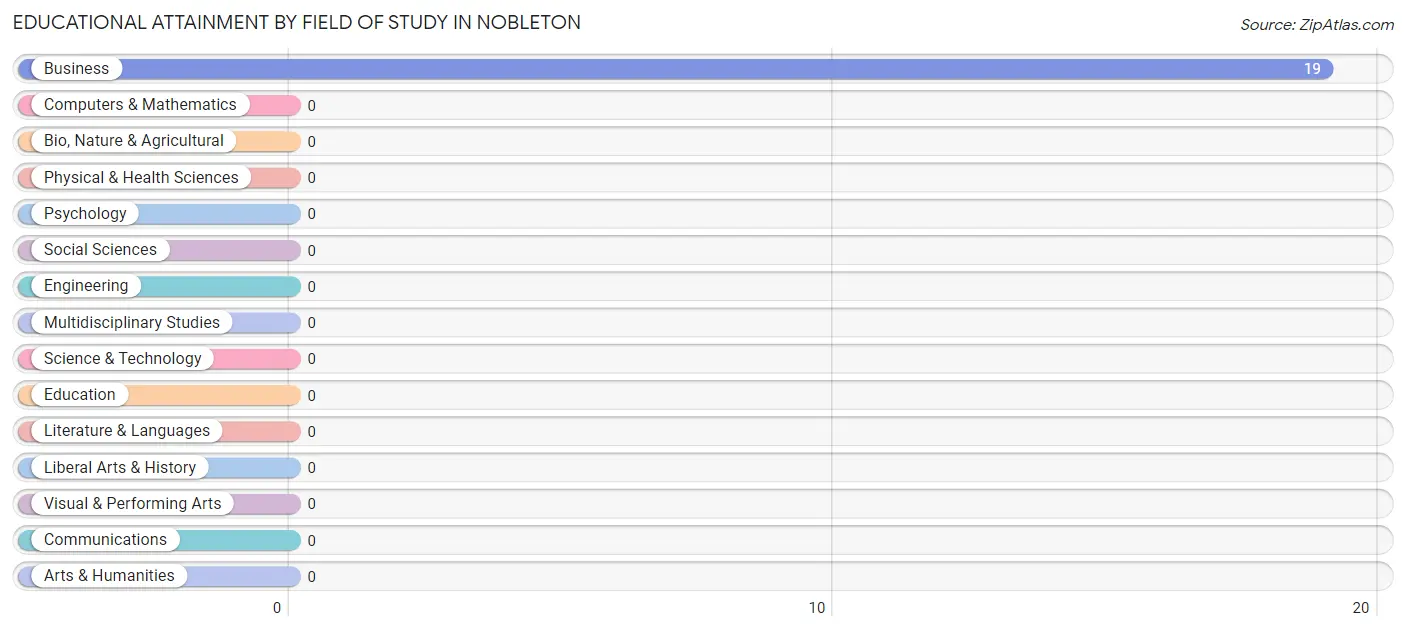
| Field of Study | # Graduates | % Graduates |
| Computers & Mathematics | 0 | 0.0% |
| Bio, Nature & Agricultural | 0 | 0.0% |
| Physical & Health Sciences | 0 | 0.0% |
| Psychology | 0 | 0.0% |
| Social Sciences | 0 | 0.0% |
| Engineering | 0 | 0.0% |
| Multidisciplinary Studies | 0 | 0.0% |
| Science & Technology | 0 | 0.0% |
| Business | 19 | 100.0% |
| Education | 0 | 0.0% |
| Literature & Languages | 0 | 0.0% |
| Liberal Arts & History | 0 | 0.0% |
| Visual & Performing Arts | 0 | 0.0% |
| Communications | 0 | 0.0% |
| Arts & Humanities | 0 | 0.0% |
| Total | 19 | 100.0% |
Transportation & Commute in Nobleton
Vehicle Availability by Sex in Nobleton
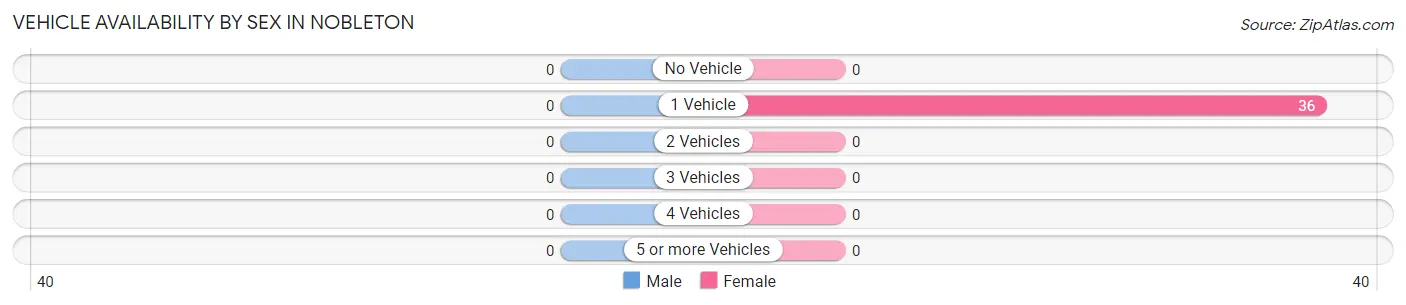
| Vehicles Available | Male | Female |
| No Vehicle | 0 (0.0%) | 0 (0.0%) |
| 1 Vehicle | 0 (0.0%) | 36 (100.0%) |
| 2 Vehicles | 0 (0.0%) | 0 (0.0%) |
| 3 Vehicles | 0 (0.0%) | 0 (0.0%) |
| 4 Vehicles | 0 (0.0%) | 0 (0.0%) |
| 5 or more Vehicles | 0 (0.0%) | 0 (0.0%) |
| Total | 0 (0.0%) | 36 (100.0%) |
Commute Time in Nobleton
The most frequently occuring commute durations in Nobleton are 45 to 59 minutes (36 commuters, 100.0%), less than 5 minutes (0 commuters, 0.0%), and 5 to 9 minutes (0 commuters, 0.0%).
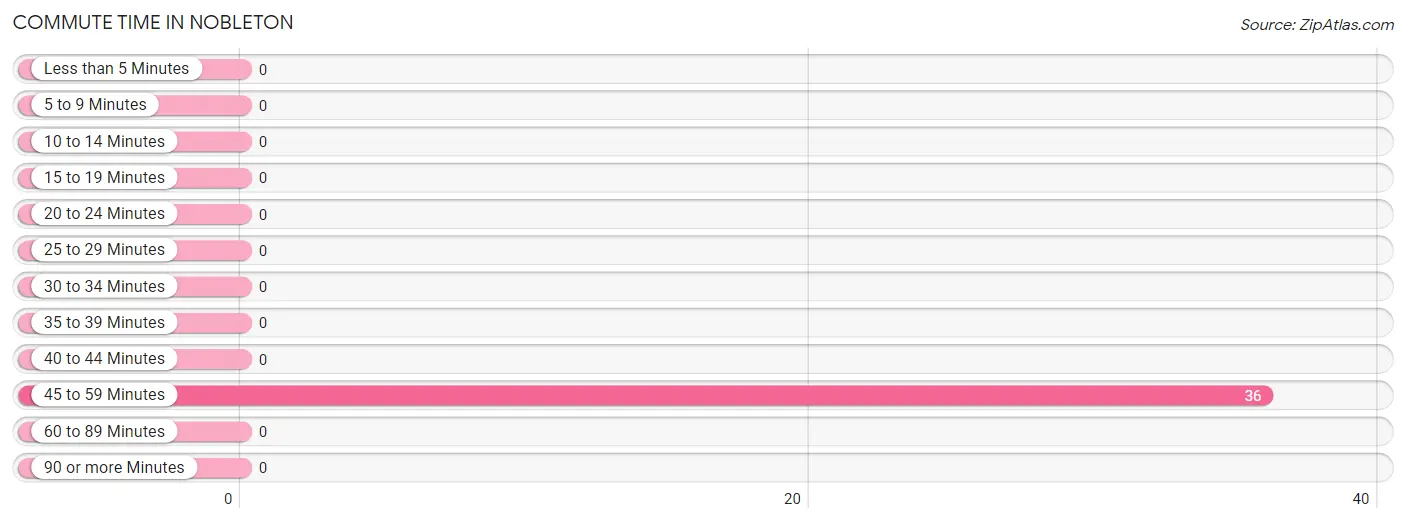
| Commute Time | # Commuters | % Commuters |
| Less than 5 Minutes | 0 | 0.0% |
| 5 to 9 Minutes | 0 | 0.0% |
| 10 to 14 Minutes | 0 | 0.0% |
| 15 to 19 Minutes | 0 | 0.0% |
| 20 to 24 Minutes | 0 | 0.0% |
| 25 to 29 Minutes | 0 | 0.0% |
| 30 to 34 Minutes | 0 | 0.0% |
| 35 to 39 Minutes | 0 | 0.0% |
| 40 to 44 Minutes | 0 | 0.0% |
| 45 to 59 Minutes | 36 | 100.0% |
| 60 to 89 Minutes | 0 | 0.0% |
| 90 or more Minutes | 0 | 0.0% |
Commute Time by Sex in Nobleton
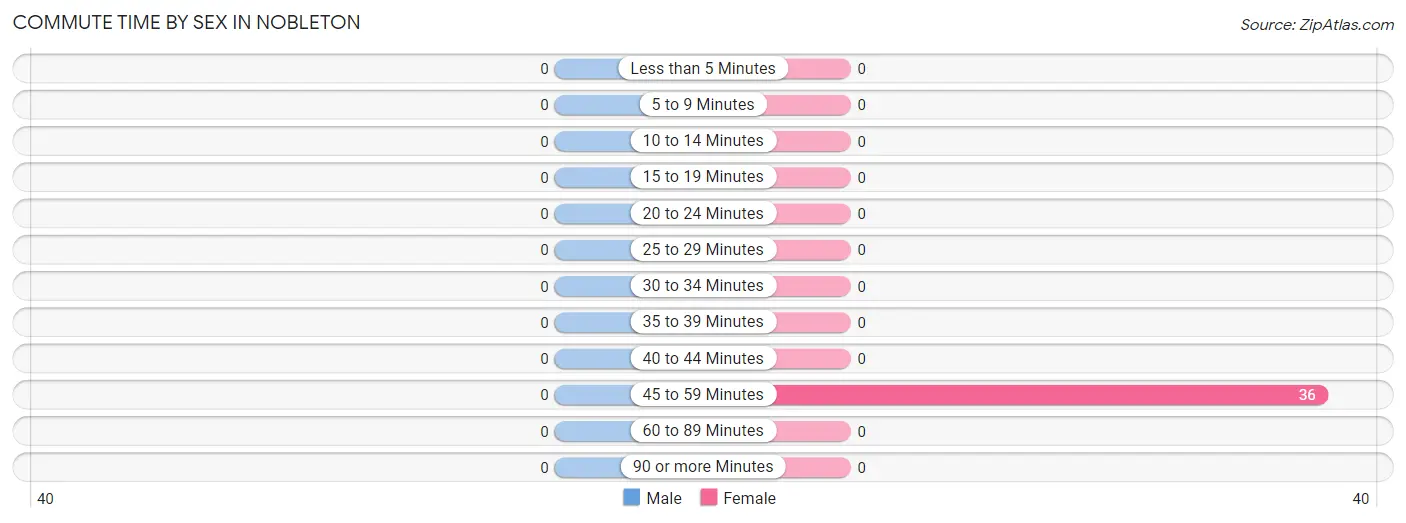
| Commute Time | Male | Female |
| Less than 5 Minutes | 0 (0.0%) | 0 (0.0%) |
| 5 to 9 Minutes | 0 (0.0%) | 0 (0.0%) |
| 10 to 14 Minutes | 0 (0.0%) | 0 (0.0%) |
| 15 to 19 Minutes | 0 (0.0%) | 0 (0.0%) |
| 20 to 24 Minutes | 0 (0.0%) | 0 (0.0%) |
| 25 to 29 Minutes | 0 (0.0%) | 0 (0.0%) |
| 30 to 34 Minutes | 0 (0.0%) | 0 (0.0%) |
| 35 to 39 Minutes | 0 (0.0%) | 0 (0.0%) |
| 40 to 44 Minutes | 0 (0.0%) | 0 (0.0%) |
| 45 to 59 Minutes | 0 (0.0%) | 36 (100.0%) |
| 60 to 89 Minutes | 0 (0.0%) | 0 (0.0%) |
| 90 or more Minutes | 0 (0.0%) | 0 (0.0%) |
Time of Departure to Work by Sex in Nobleton
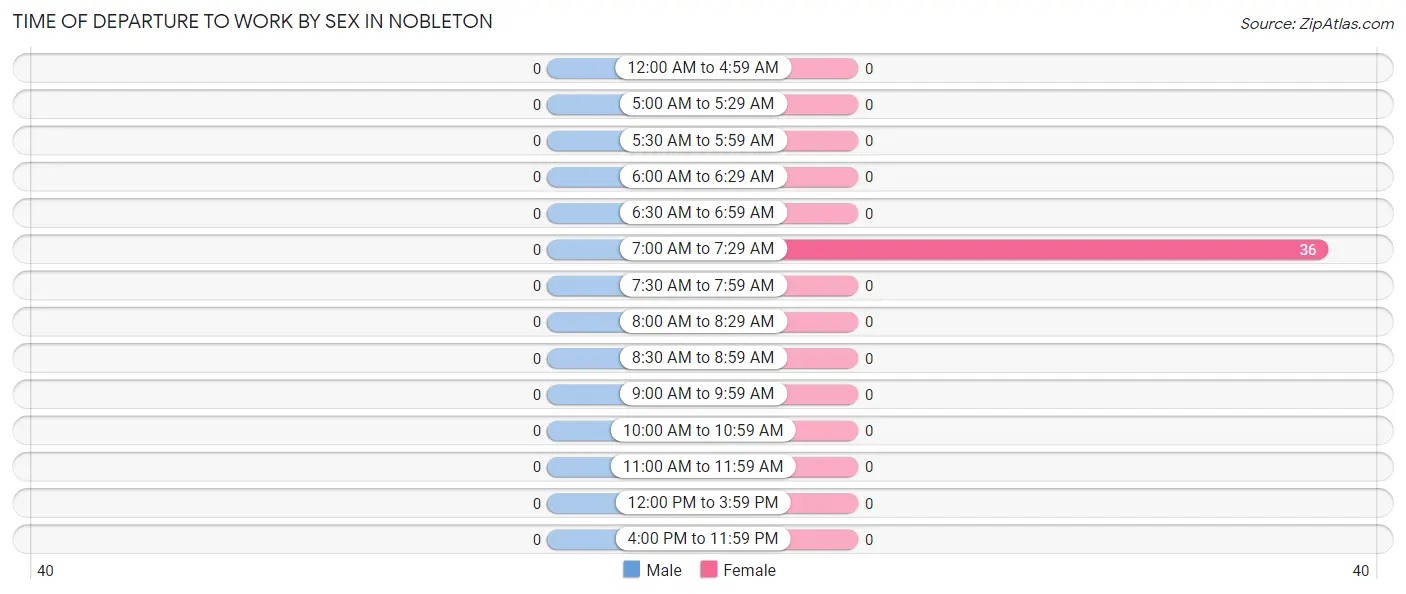
| Time of Departure | Male | Female |
| 12:00 AM to 4:59 AM | 0 (0.0%) | 0 (0.0%) |
| 5:00 AM to 5:29 AM | 0 (0.0%) | 0 (0.0%) |
| 5:30 AM to 5:59 AM | 0 (0.0%) | 0 (0.0%) |
| 6:00 AM to 6:29 AM | 0 (0.0%) | 0 (0.0%) |
| 6:30 AM to 6:59 AM | 0 (0.0%) | 0 (0.0%) |
| 7:00 AM to 7:29 AM | 0 (0.0%) | 36 (100.0%) |
| 7:30 AM to 7:59 AM | 0 (0.0%) | 0 (0.0%) |
| 8:00 AM to 8:29 AM | 0 (0.0%) | 0 (0.0%) |
| 8:30 AM to 8:59 AM | 0 (0.0%) | 0 (0.0%) |
| 9:00 AM to 9:59 AM | 0 (0.0%) | 0 (0.0%) |
| 10:00 AM to 10:59 AM | 0 (0.0%) | 0 (0.0%) |
| 11:00 AM to 11:59 AM | 0 (0.0%) | 0 (0.0%) |
| 12:00 PM to 3:59 PM | 0 (0.0%) | 0 (0.0%) |
| 4:00 PM to 11:59 PM | 0 (0.0%) | 0 (0.0%) |
| Total | 0 (0.0%) | 36 (100.0%) |
Housing Occupancy in Nobleton
Occupancy by Ownership in Nobleton
Of the total 153 dwellings in Nobleton, owner-occupied units account for 83 (54.2%), while renter-occupied units make up 70 (45.8%).
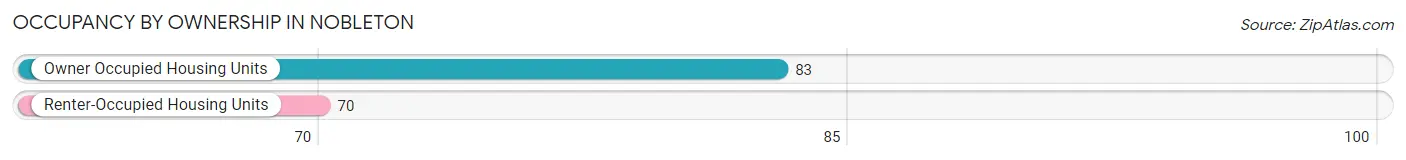
| Occupancy | # Housing Units | % Housing Units |
| Owner Occupied Housing Units | 83 | 54.2% |
| Renter-Occupied Housing Units | 70 | 45.8% |
| Total Occupied Housing Units | 153 | 100.0% |
Occupancy by Household Size in Nobleton
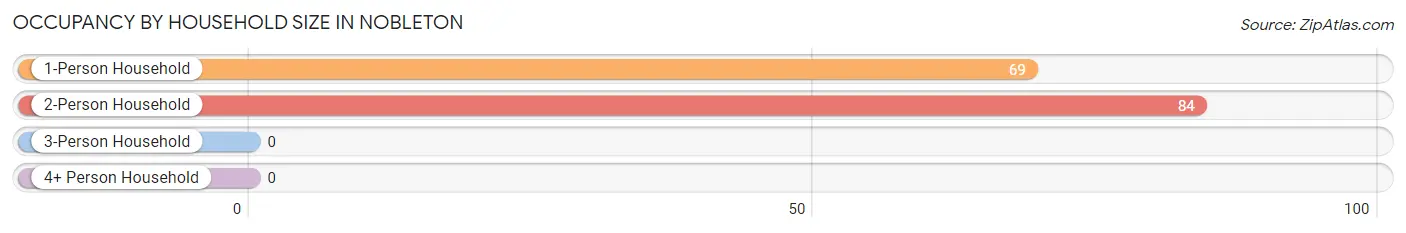
| Household Size | # Housing Units | % Housing Units |
| 1-Person Household | 69 | 45.1% |
| 2-Person Household | 84 | 54.9% |
| 3-Person Household | 0 | 0.0% |
| 4+ Person Household | 0 | 0.0% |
| Total Housing Units | 153 | 100.0% |
Occupancy by Ownership by Household Size in Nobleton
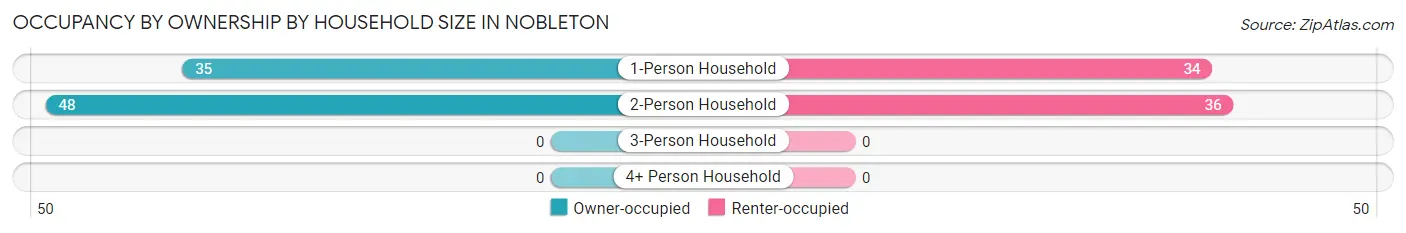
| Household Size | Owner-occupied | Renter-occupied |
| 1-Person Household | 35 (50.7%) | 34 (49.3%) |
| 2-Person Household | 48 (57.1%) | 36 (42.9%) |
| 3-Person Household | 0 (0.0%) | 0 (0.0%) |
| 4+ Person Household | 0 (0.0%) | 0 (0.0%) |
| Total Housing Units | 83 (54.2%) | 70 (45.8%) |
Occupancy by Educational Attainment in Nobleton
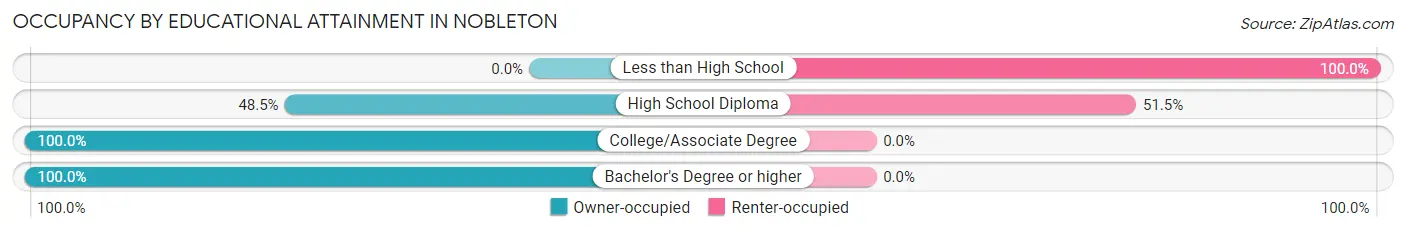
| Household Size | Owner-occupied | Renter-occupied |
| Less than High School | 0 (0.0%) | 36 (100.0%) |
| High School Diploma | 32 (48.5%) | 34 (51.5%) |
| College/Associate Degree | 32 (100.0%) | 0 (0.0%) |
| Bachelor's Degree or higher | 19 (100.0%) | 0 (0.0%) |
Occupancy by Age of Householder in Nobleton
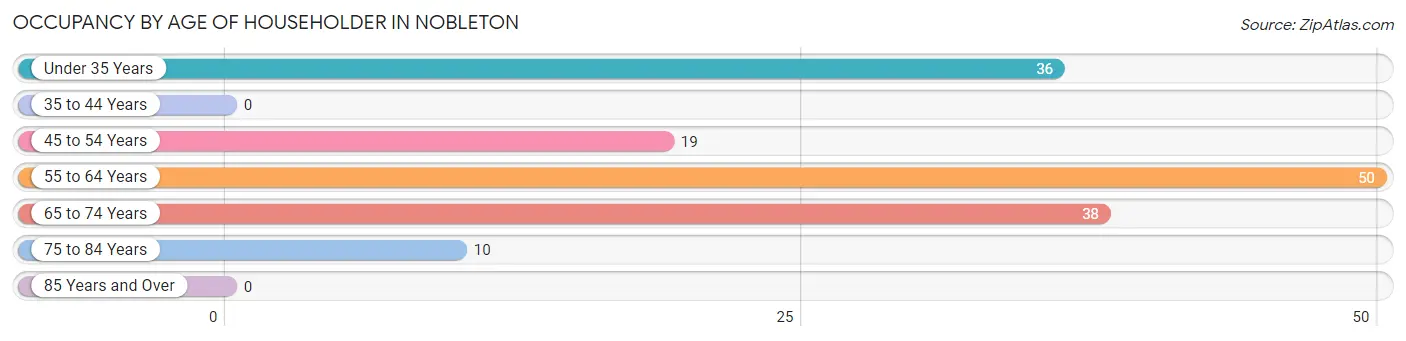
| Age Bracket | # Households | % Households |
| Under 35 Years | 36 | 23.5% |
| 35 to 44 Years | 0 | 0.0% |
| 45 to 54 Years | 19 | 12.4% |
| 55 to 64 Years | 50 | 32.7% |
| 65 to 74 Years | 38 | 24.8% |
| 75 to 84 Years | 10 | 6.5% |
| 85 Years and Over | 0 | 0.0% |
| Total | 153 | 100.0% |
Housing Finances in Nobleton
Median Income by Occupancy in Nobleton
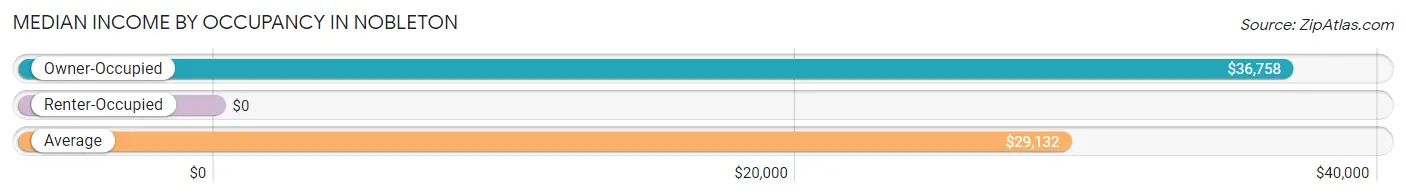
| Occupancy Type | # Households | Median Income |
| Owner-Occupied | 83 (54.2%) | $36,758 |
| Renter-Occupied | 70 (45.8%) | $0 |
| Average | 153 (100.0%) | $29,132 |
Occupancy by Householder Income Bracket in Nobleton
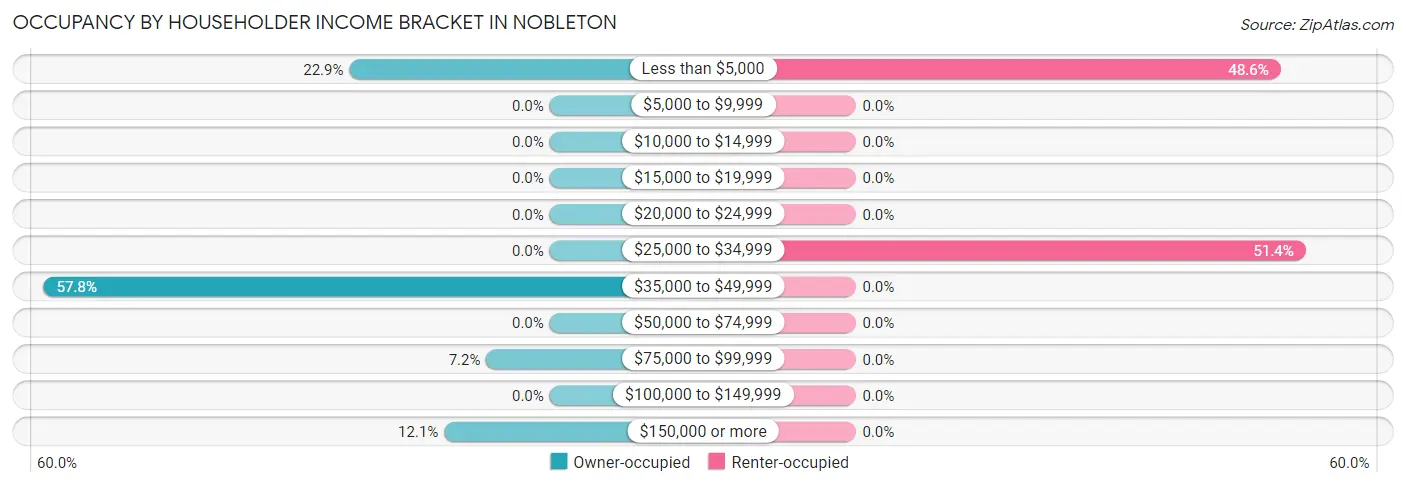
| Income Bracket | Owner-occupied | Renter-occupied |
| Less than $5,000 | 19 (22.9%) | 34 (48.6%) |
| $5,000 to $9,999 | 0 (0.0%) | 0 (0.0%) |
| $10,000 to $14,999 | 0 (0.0%) | 0 (0.0%) |
| $15,000 to $19,999 | 0 (0.0%) | 0 (0.0%) |
| $20,000 to $24,999 | 0 (0.0%) | 0 (0.0%) |
| $25,000 to $34,999 | 0 (0.0%) | 36 (51.4%) |
| $35,000 to $49,999 | 48 (57.8%) | 0 (0.0%) |
| $50,000 to $74,999 | 0 (0.0%) | 0 (0.0%) |
| $75,000 to $99,999 | 6 (7.2%) | 0 (0.0%) |
| $100,000 to $149,999 | 0 (0.0%) | 0 (0.0%) |
| $150,000 or more | 10 (12.0%) | 0 (0.0%) |
| Total | 83 (100.0%) | 70 (100.0%) |
Monthly Housing Cost Tiers in Nobleton
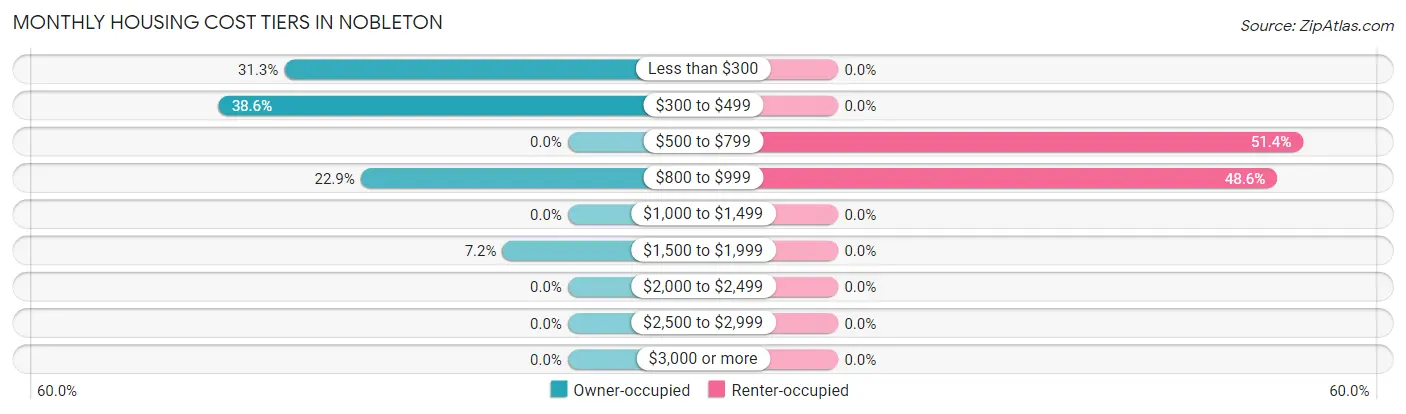
| Monthly Cost | Owner-occupied | Renter-occupied |
| Less than $300 | 26 (31.3%) | 0 (0.0%) |
| $300 to $499 | 32 (38.6%) | 0 (0.0%) |
| $500 to $799 | 0 (0.0%) | 36 (51.4%) |
| $800 to $999 | 19 (22.9%) | 34 (48.6%) |
| $1,000 to $1,499 | 0 (0.0%) | 0 (0.0%) |
| $1,500 to $1,999 | 6 (7.2%) | 0 (0.0%) |
| $2,000 to $2,499 | 0 (0.0%) | 0 (0.0%) |
| $2,500 to $2,999 | 0 (0.0%) | 0 (0.0%) |
| $3,000 or more | 0 (0.0%) | 0 (0.0%) |
| Total | 83 (100.0%) | 70 (100.0%) |
Physical Housing Characteristics in Nobleton
Housing Structures in Nobleton
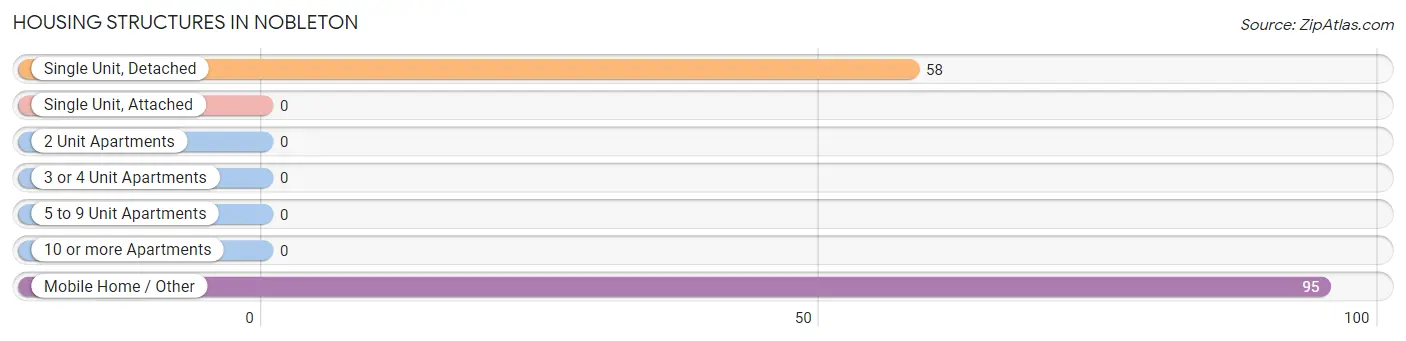
| Structure Type | # Housing Units | % Housing Units |
| Single Unit, Detached | 58 | 37.9% |
| Single Unit, Attached | 0 | 0.0% |
| 2 Unit Apartments | 0 | 0.0% |
| 3 or 4 Unit Apartments | 0 | 0.0% |
| 5 to 9 Unit Apartments | 0 | 0.0% |
| 10 or more Apartments | 0 | 0.0% |
| Mobile Home / Other | 95 | 62.1% |
| Total | 153 | 100.0% |
Housing Structures by Occupancy in Nobleton
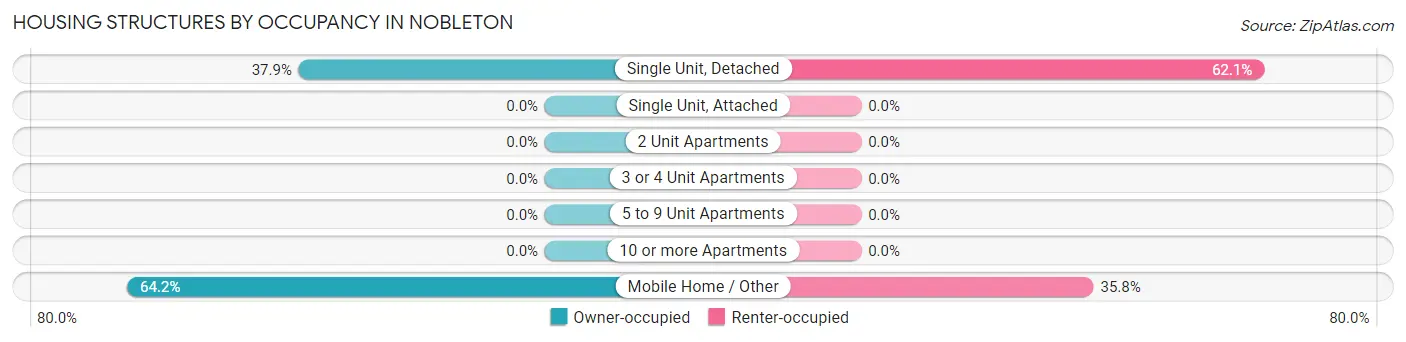
| Structure Type | Owner-occupied | Renter-occupied |
| Single Unit, Detached | 22 (37.9%) | 36 (62.1%) |
| Single Unit, Attached | 0 (0.0%) | 0 (0.0%) |
| 2 Unit Apartments | 0 (0.0%) | 0 (0.0%) |
| 3 or 4 Unit Apartments | 0 (0.0%) | 0 (0.0%) |
| 5 to 9 Unit Apartments | 0 (0.0%) | 0 (0.0%) |
| 10 or more Apartments | 0 (0.0%) | 0 (0.0%) |
| Mobile Home / Other | 61 (64.2%) | 34 (35.8%) |
| Total | 83 (54.2%) | 70 (45.8%) |
Housing Structures by Number of Rooms in Nobleton
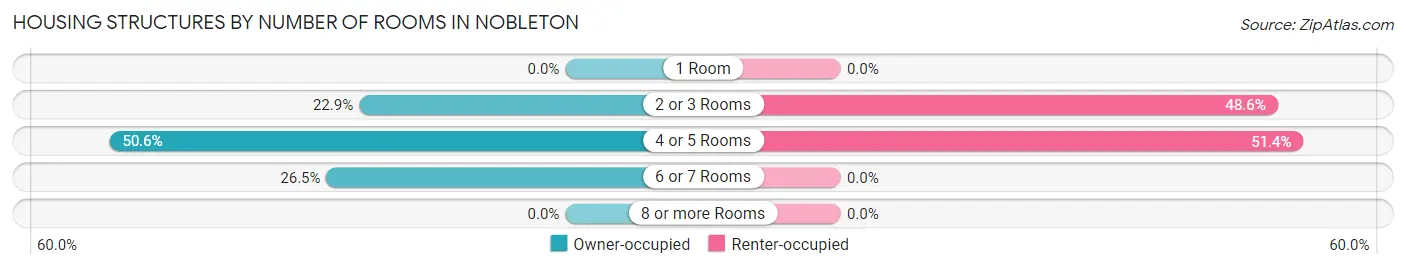
| Number of Rooms | Owner-occupied | Renter-occupied |
| 1 Room | 0 (0.0%) | 0 (0.0%) |
| 2 or 3 Rooms | 19 (22.9%) | 34 (48.6%) |
| 4 or 5 Rooms | 42 (50.6%) | 36 (51.4%) |
| 6 or 7 Rooms | 22 (26.5%) | 0 (0.0%) |
| 8 or more Rooms | 0 (0.0%) | 0 (0.0%) |
| Total | 83 (100.0%) | 70 (100.0%) |
Housing Structure by Heating Type in Nobleton
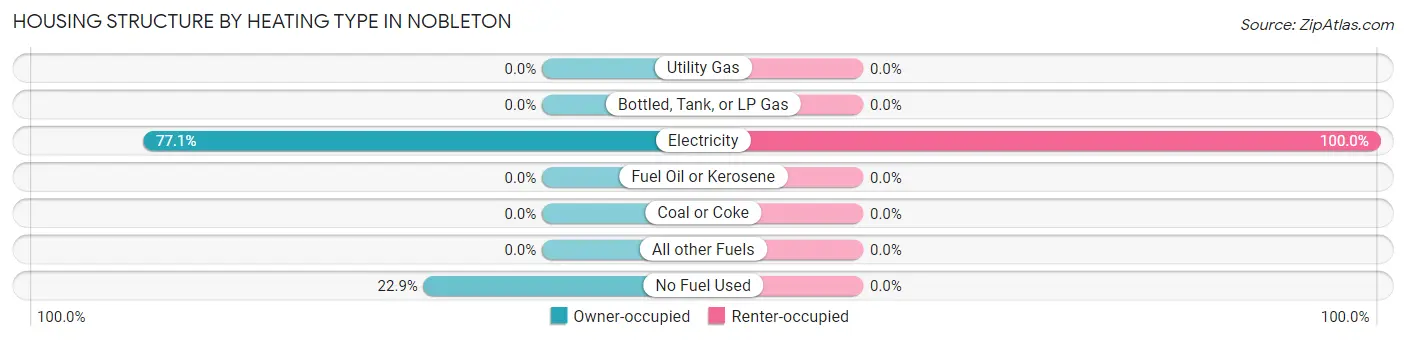
| Heating Type | Owner-occupied | Renter-occupied |
| Utility Gas | 0 (0.0%) | 0 (0.0%) |
| Bottled, Tank, or LP Gas | 0 (0.0%) | 0 (0.0%) |
| Electricity | 64 (77.1%) | 70 (100.0%) |
| Fuel Oil or Kerosene | 0 (0.0%) | 0 (0.0%) |
| Coal or Coke | 0 (0.0%) | 0 (0.0%) |
| All other Fuels | 0 (0.0%) | 0 (0.0%) |
| No Fuel Used | 19 (22.9%) | 0 (0.0%) |
| Total | 83 (100.0%) | 70 (100.0%) |
Household Vehicle Usage in Nobleton
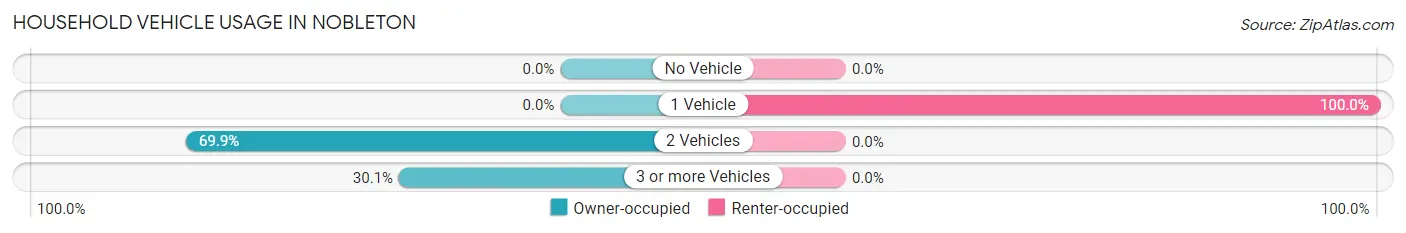
| Vehicles per Household | Owner-occupied | Renter-occupied |
| No Vehicle | 0 (0.0%) | 0 (0.0%) |
| 1 Vehicle | 0 (0.0%) | 70 (100.0%) |
| 2 Vehicles | 58 (69.9%) | 0 (0.0%) |
| 3 or more Vehicles | 25 (30.1%) | 0 (0.0%) |
| Total | 83 (100.0%) | 70 (100.0%) |
Real Estate & Mortgages in Nobleton
Real Estate and Mortgage Overview in Nobleton
| Characteristic | Without Mortgage | With Mortgage |
| Housing Units | 58 | 25 |
| Median Property Value | $185,200 | $0 |
| Median Household Income | - | - |
| Monthly Housing Costs | $355 | $0 |
| Real Estate Taxes | - | - |
Property Value by Mortgage Status in Nobleton
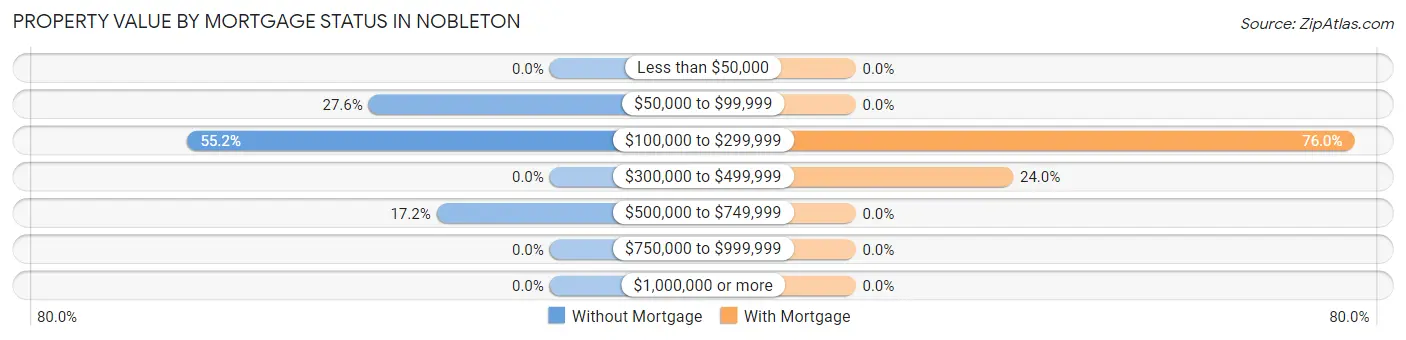
| Property Value | Without Mortgage | With Mortgage |
| Less than $50,000 | 0 (0.0%) | 0 (0.0%) |
| $50,000 to $99,999 | 16 (27.6%) | 0 (0.0%) |
| $100,000 to $299,999 | 32 (55.2%) | 19 (76.0%) |
| $300,000 to $499,999 | 0 (0.0%) | 6 (24.0%) |
| $500,000 to $749,999 | 10 (17.2%) | 0 (0.0%) |
| $750,000 to $999,999 | 0 (0.0%) | 0 (0.0%) |
| $1,000,000 or more | 0 (0.0%) | 0 (0.0%) |
| Total | 58 (100.0%) | 25 (100.0%) |
Household Income by Mortgage Status in Nobleton
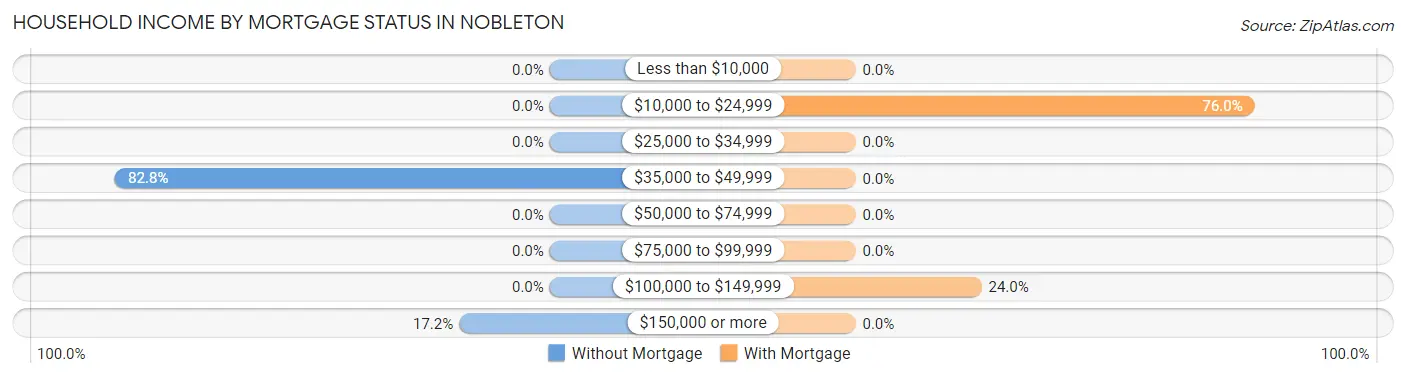
| Household Income | Without Mortgage | With Mortgage |
| Less than $10,000 | 0 (0.0%) | 0 (0.0%) |
| $10,000 to $24,999 | 0 (0.0%) | 19 (76.0%) |
| $25,000 to $34,999 | 0 (0.0%) | 0 (0.0%) |
| $35,000 to $49,999 | 48 (82.8%) | 0 (0.0%) |
| $50,000 to $74,999 | 0 (0.0%) | 0 (0.0%) |
| $75,000 to $99,999 | 0 (0.0%) | 0 (0.0%) |
| $100,000 to $149,999 | 0 (0.0%) | 6 (24.0%) |
| $150,000 or more | 10 (17.2%) | 0 (0.0%) |
| Total | 58 (100.0%) | 25 (100.0%) |
Property Value to Household Income Ratio in Nobleton
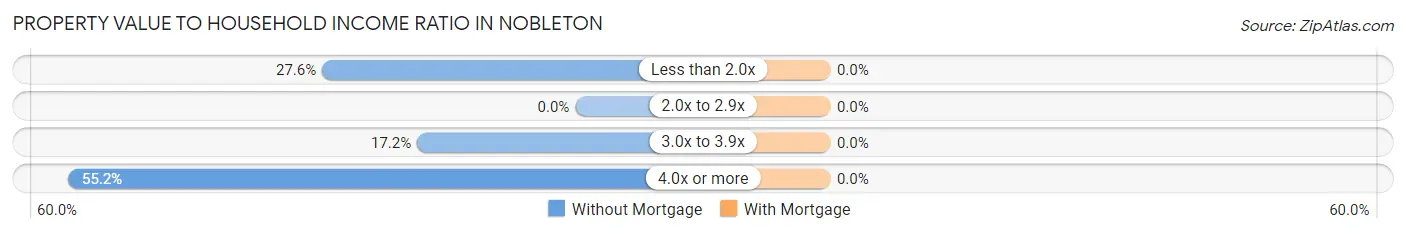
| Value-to-Income Ratio | Without Mortgage | With Mortgage |
| Less than 2.0x | 16 (27.6%) | 0 (0.0%) |
| 2.0x to 2.9x | 0 (0.0%) | 0 (0.0%) |
| 3.0x to 3.9x | 10 (17.2%) | 0 (0.0%) |
| 4.0x or more | 32 (55.2%) | 0 (0.0%) |
| Total | 58 (100.0%) | 25 (100.0%) |
Real Estate Taxes by Mortgage Status in Nobleton
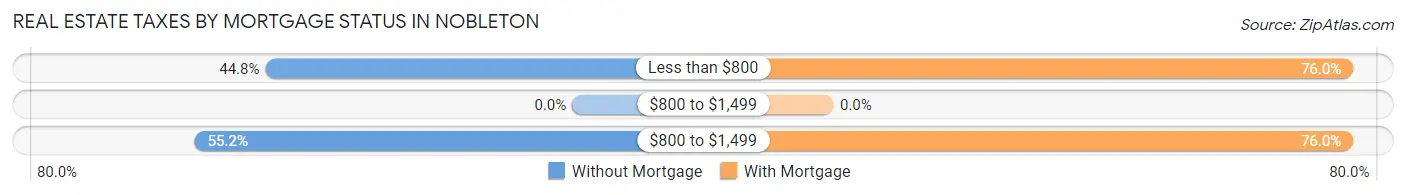
| Property Taxes | Without Mortgage | With Mortgage |
| Less than $800 | 26 (44.8%) | 19 (76.0%) |
| $800 to $1,499 | 0 (0.0%) | 0 (0.0%) |
| $800 to $1,499 | 32 (55.2%) | 19 (76.0%) |
| Total | 58 (100.0%) | 25 (100.0%) |
Health & Disability in Nobleton
Health Insurance Coverage by Age in Nobleton
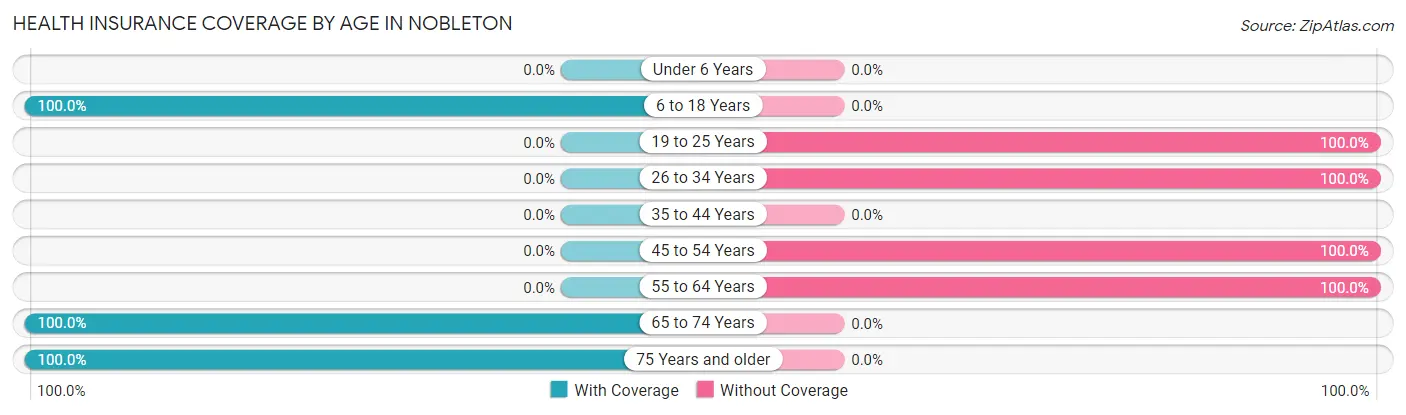
| Age Bracket | With Coverage | Without Coverage |
| Under 6 Years | 0 (0.0%) | 0 (0.0%) |
| 6 to 18 Years | 34 (100.0%) | 0 (0.0%) |
| 19 to 25 Years | 0 (0.0%) | 36 (100.0%) |
| 26 to 34 Years | 0 (0.0%) | 36 (100.0%) |
| 35 to 44 Years | 0 (0.0%) | 0 (0.0%) |
| 45 to 54 Years | 0 (0.0%) | 27 (100.0%) |
| 55 to 64 Years | 0 (0.0%) | 50 (100.0%) |
| 65 to 74 Years | 57 (100.0%) | 0 (0.0%) |
| 75 Years and older | 10 (100.0%) | 0 (0.0%) |
| Total | 101 (40.4%) | 149 (59.6%) |
Health Insurance Coverage by Citizenship Status in Nobleton
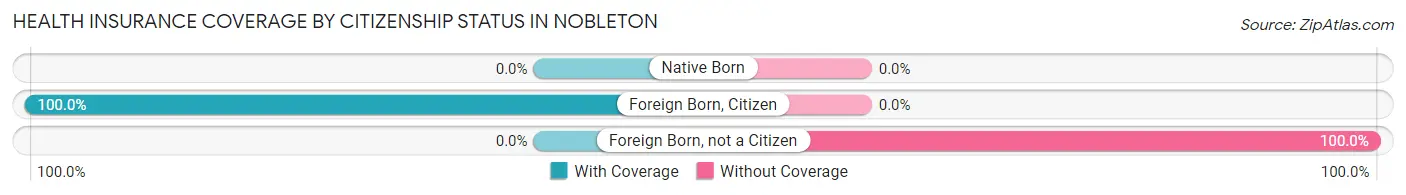
| Citizenship Status | With Coverage | Without Coverage |
| Native Born | 0 (0.0%) | 0 (0.0%) |
| Foreign Born, Citizen | 34 (100.0%) | 0 (0.0%) |
| Foreign Born, not a Citizen | 0 (0.0%) | 36 (100.0%) |
Health Insurance Coverage by Household Income in Nobleton
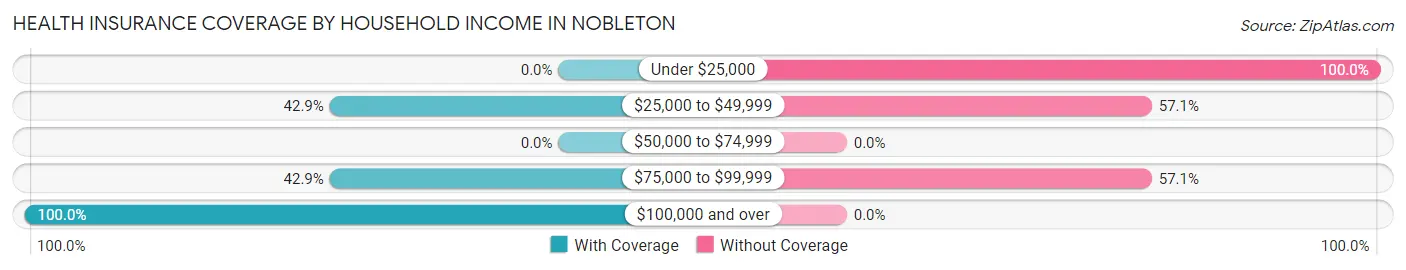
| Household Income | With Coverage | Without Coverage |
| Under $25,000 | 0 (0.0%) | 53 (100.0%) |
| $25,000 to $49,999 | 66 (42.9%) | 88 (57.1%) |
| $50,000 to $74,999 | 0 (0.0%) | 0 (0.0%) |
| $75,000 to $99,999 | 6 (42.9%) | 8 (57.1%) |
| $100,000 and over | 29 (100.0%) | 0 (0.0%) |
Public vs Private Health Insurance Coverage by Age in Nobleton
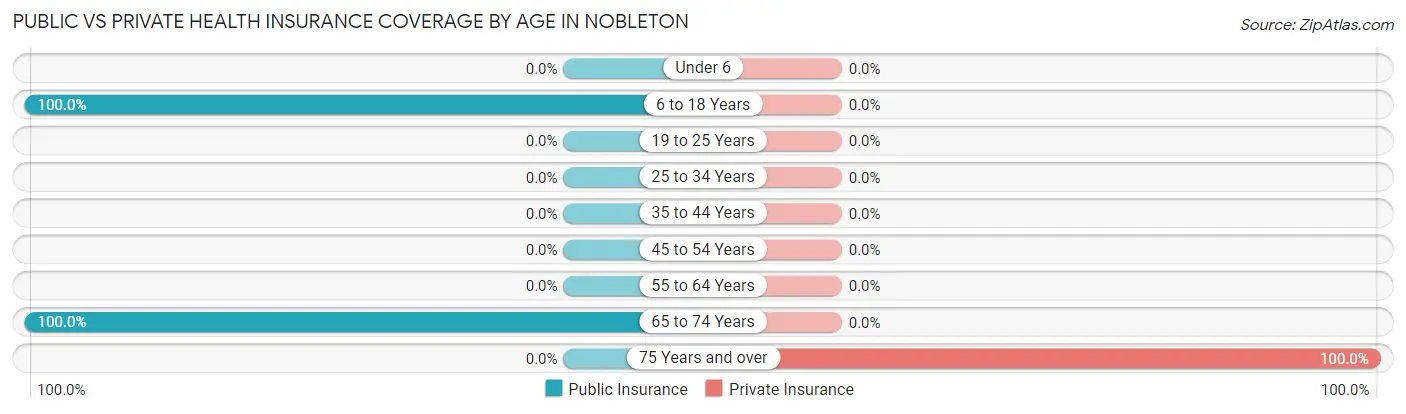
| Age Bracket | Public Insurance | Private Insurance |
| Under 6 | 0 (0.0%) | 0 (0.0%) |
| 6 to 18 Years | 34 (100.0%) | 0 (0.0%) |
| 19 to 25 Years | 0 (0.0%) | 0 (0.0%) |
| 25 to 34 Years | 0 (0.0%) | 0 (0.0%) |
| 35 to 44 Years | 0 (0.0%) | 0 (0.0%) |
| 45 to 54 Years | 0 (0.0%) | 0 (0.0%) |
| 55 to 64 Years | 0 (0.0%) | 0 (0.0%) |
| 65 to 74 Years | 57 (100.0%) | 0 (0.0%) |
| 75 Years and over | 0 (0.0%) | 10 (100.0%) |
| Total | 91 (36.4%) | 10 (4.0%) |
Disability Status by Sex by Age in Nobleton
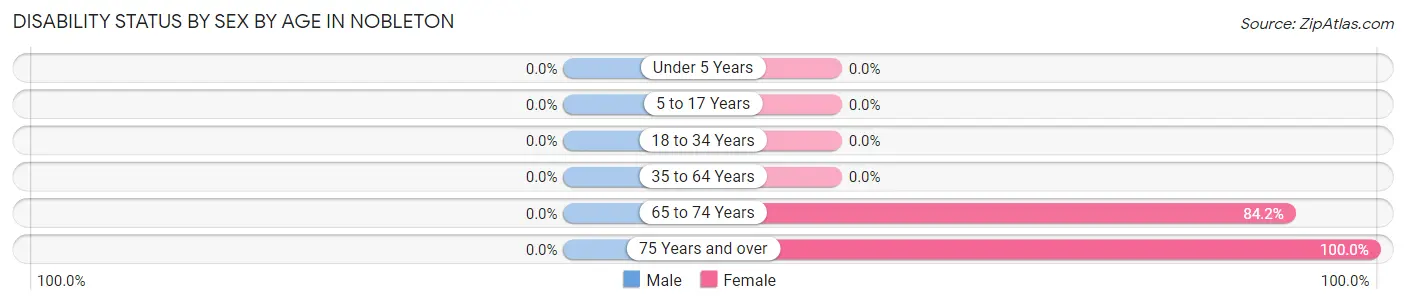
| Age Bracket | Male | Female |
| Under 5 Years | 0 (0.0%) | 0 (0.0%) |
| 5 to 17 Years | 0 (0.0%) | 0 (0.0%) |
| 18 to 34 Years | 0 (0.0%) | 0 (0.0%) |
| 35 to 64 Years | 0 (0.0%) | 0 (0.0%) |
| 65 to 74 Years | 0 (0.0%) | 32 (84.2%) |
| 75 Years and over | 0 (0.0%) | 10 (100.0%) |
Disability Class by Sex by Age in Nobleton
Disability Class: Hearing Difficulty
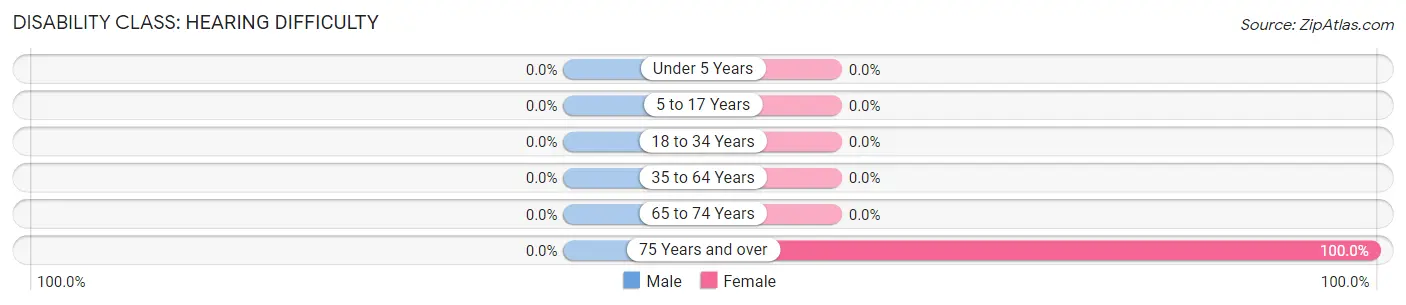
| Age Bracket | Male | Female |
| Under 5 Years | 0 (0.0%) | 0 (0.0%) |
| 5 to 17 Years | 0 (0.0%) | 0 (0.0%) |
| 18 to 34 Years | 0 (0.0%) | 0 (0.0%) |
| 35 to 64 Years | 0 (0.0%) | 0 (0.0%) |
| 65 to 74 Years | 0 (0.0%) | 0 (0.0%) |
| 75 Years and over | 0 (0.0%) | 10 (100.0%) |
Disability Class: Vision Difficulty
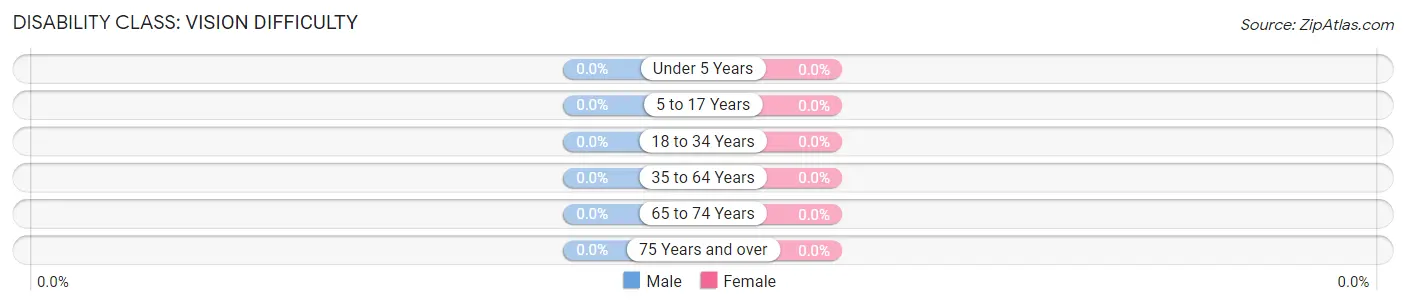
| Age Bracket | Male | Female |
| Under 5 Years | 0 (0.0%) | 0 (0.0%) |
| 5 to 17 Years | 0 (0.0%) | 0 (0.0%) |
| 18 to 34 Years | 0 (0.0%) | 0 (0.0%) |
| 35 to 64 Years | 0 (0.0%) | 0 (0.0%) |
| 65 to 74 Years | 0 (0.0%) | 0 (0.0%) |
| 75 Years and over | 0 (0.0%) | 0 (0.0%) |
Disability Class: Cognitive Difficulty
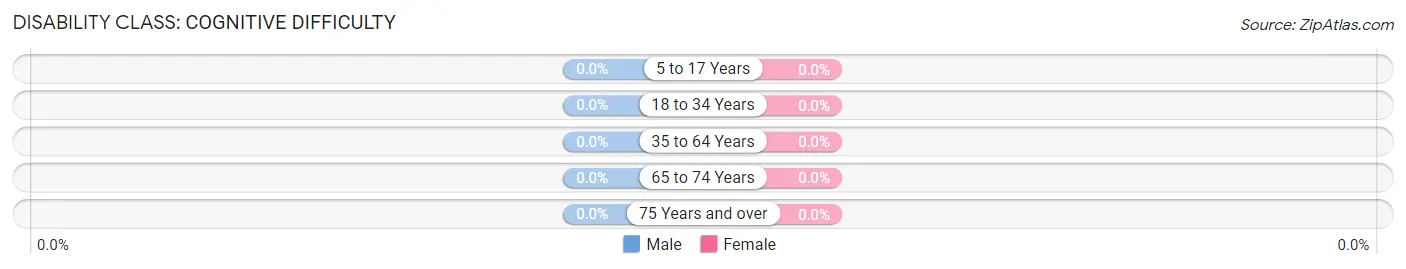
| Age Bracket | Male | Female |
| 5 to 17 Years | 0 (0.0%) | 0 (0.0%) |
| 18 to 34 Years | 0 (0.0%) | 0 (0.0%) |
| 35 to 64 Years | 0 (0.0%) | 0 (0.0%) |
| 65 to 74 Years | 0 (0.0%) | 0 (0.0%) |
| 75 Years and over | 0 (0.0%) | 0 (0.0%) |
Disability Class: Ambulatory Difficulty
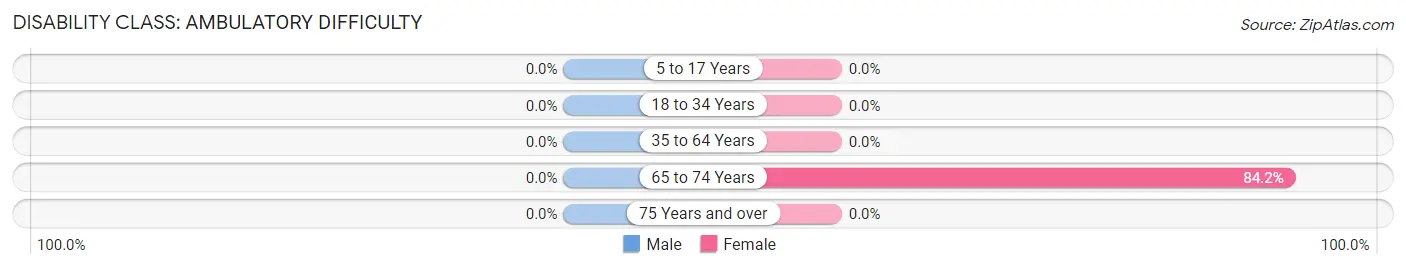
| Age Bracket | Male | Female |
| 5 to 17 Years | 0 (0.0%) | 0 (0.0%) |
| 18 to 34 Years | 0 (0.0%) | 0 (0.0%) |
| 35 to 64 Years | 0 (0.0%) | 0 (0.0%) |
| 65 to 74 Years | 0 (0.0%) | 32 (84.2%) |
| 75 Years and over | 0 (0.0%) | 0 (0.0%) |
Disability Class: Self-Care Difficulty
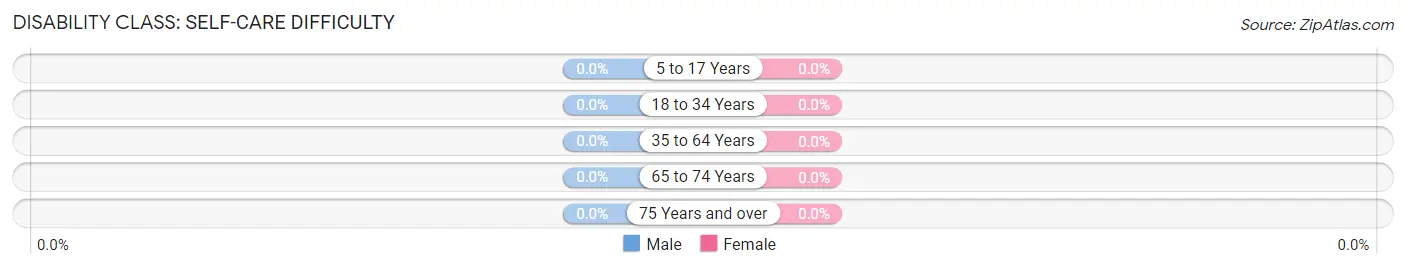
| Age Bracket | Male | Female |
| 5 to 17 Years | 0 (0.0%) | 0 (0.0%) |
| 18 to 34 Years | 0 (0.0%) | 0 (0.0%) |
| 35 to 64 Years | 0 (0.0%) | 0 (0.0%) |
| 65 to 74 Years | 0 (0.0%) | 0 (0.0%) |
| 75 Years and over | 0 (0.0%) | 0 (0.0%) |
Technology Access in Nobleton
Computing Device Access in Nobleton
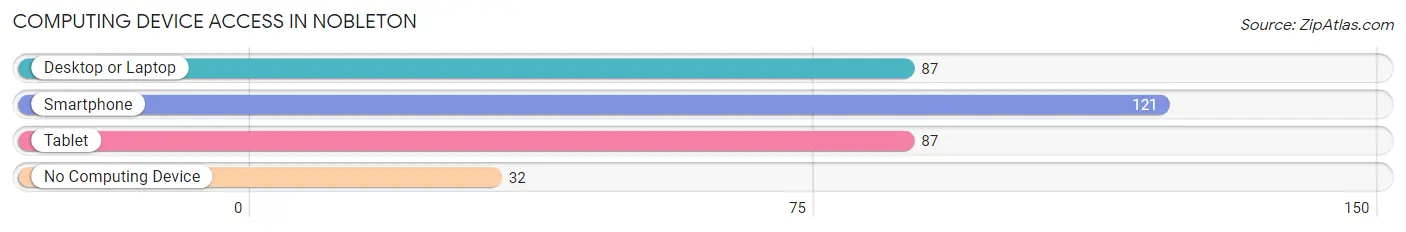
| Device Type | # Households | % Households |
| Desktop or Laptop | 87 | 56.9% |
| Smartphone | 121 | 79.1% |
| Tablet | 87 | 56.9% |
| No Computing Device | 32 | 20.9% |
| Total | 153 | 100.0% |
Internet Access in Nobleton
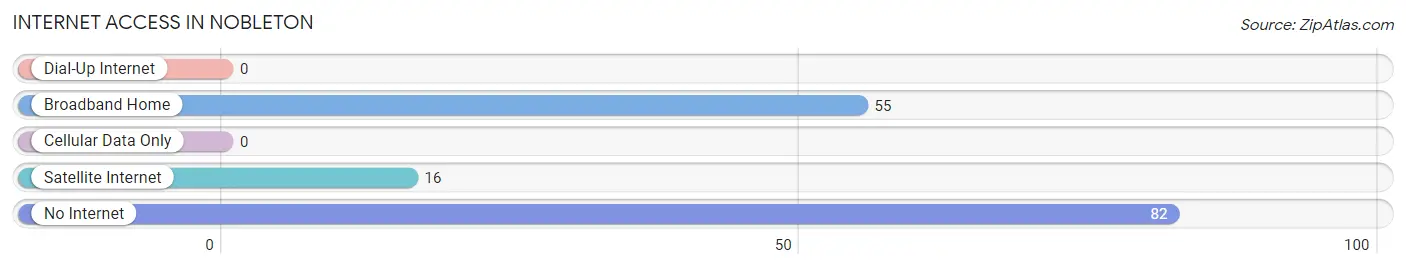
| Internet Type | # Households | % Households |
| Dial-Up Internet | 0 | 0.0% |
| Broadband Home | 55 | 35.9% |
| Cellular Data Only | 0 | 0.0% |
| Satellite Internet | 16 | 10.5% |
| No Internet | 82 | 53.6% |
| Total | 153 | 100.0% |
Nobleton Summary
Nobleton, Florida is a small town located in Hernando County, Florida. It is situated on the western side of the county, approximately 25 miles north of Tampa. The town has a population of approximately 1,000 people and is part of the Tampa-St. Petersburg-Clearwater Metropolitan Statistical Area.
History
Nobleton was founded in 1883 by William Nobles, a former Confederate soldier. He purchased the land from the state of Florida and began to develop the area. The town was originally called Noblesville, but the name was changed to Nobleton in 1887. The town was incorporated in 1891 and was the first incorporated town in Hernando County.
The town was originally a farming community, with citrus and vegetables being the main crops. In the early 1900s, the town began to grow and develop, with the construction of a railroad line and the opening of a post office. The town also had a hotel, a general store, and a sawmill.
Geography
Nobleton is located in the western part of Hernando County, approximately 25 miles north of Tampa. The town is situated on the Withlacoochee River, which is a tributary of the Gulf of Mexico. The town is surrounded by rolling hills and is home to several lakes, including Lake Lindsey, Lake Lindsey Park, and Lake Nobleton.
The town has a humid subtropical climate, with hot, humid summers and mild winters. The average temperature in the summer is around 90°F, while the average temperature in the winter is around 60°F.
Economy
The economy of Nobleton is largely based on agriculture and tourism. The town is home to several farms, which produce citrus, vegetables, and other crops. The town is also home to several tourist attractions, including the Withlacoochee River State Park, which offers camping, fishing, and other outdoor activities.
The town is also home to several businesses, including restaurants, retail stores, and service providers. The town is also home to several manufacturing companies, which produce a variety of products, including furniture, clothing, and electronics.
Demographics
As of the 2010 census, the population of Nobleton was 1,000 people. The town is predominantly white, with approximately 90% of the population being white. The town also has a small Hispanic population, with approximately 5% of the population being Hispanic. The median household income in the town is approximately $45,000, and the median home value is approximately $150,000.
Conclusion
Nobleton, Florida is a small town located in Hernando County, Florida. It is situated on the western side of the county, approximately 25 miles north of Tampa. The town has a population of approximately 1,000 people and is part of the Tampa-St. Petersburg-Clearwater Metropolitan Statistical Area. The town was founded in 1883 and was originally a farming community. Today, the economy of Nobleton is largely based on agriculture and tourism. The town is predominantly white, with approximately 90% of the population being white. The median household income in the town is approximately $45,000, and the median home value is approximately $150,000.
Common Questions
What is Per Capita Income in Nobleton?
Per Capita income in Nobleton is $23,993.
What is the Median Family Income in Nobleton?
Median Family Income in Nobleton is $35,469.
What is the Median Household income in Nobleton?
Median Household Income in Nobleton is $29,132.
What is Inequality or Gini Index in Nobleton?
Inequality or Gini Index in Nobleton is 0.56.
What is the Total Population of Nobleton?
Total Population of Nobleton is 250.
What is the Total Male Population of Nobleton?
Total Male Population of Nobleton is 61.
What is the Total Female Population of Nobleton?
Total Female Population of Nobleton is 189.
What is the Ratio of Males per 100 Females in Nobleton?
There are 32.28 Males per 100 Females in Nobleton.
What is the Ratio of Females per 100 Males in Nobleton?
There are 309.84 Females per 100 Males in Nobleton.
What is the Median Population Age in Nobleton?
Median Population Age in Nobleton is 50.5 Years.
What is the Average Family Size in Nobleton
Average Family Size in Nobleton is 2.1 People.
What is the Average Household Size in Nobleton
Average Household Size in Nobleton is 1.6 People.
How Large is the Labor Force in Nobleton?
There are 88 People in the Labor Forcein in Nobleton.
What is the Percentage of People in the Labor Force in Nobleton?
40.7% of People are in the Labor Force in Nobleton.
What is the Unemployment Rate in Nobleton?
Unemployment Rate in Nobleton is 59.1%.