Winchester Bay, OR Map & Demographics
Winchester Bay Map
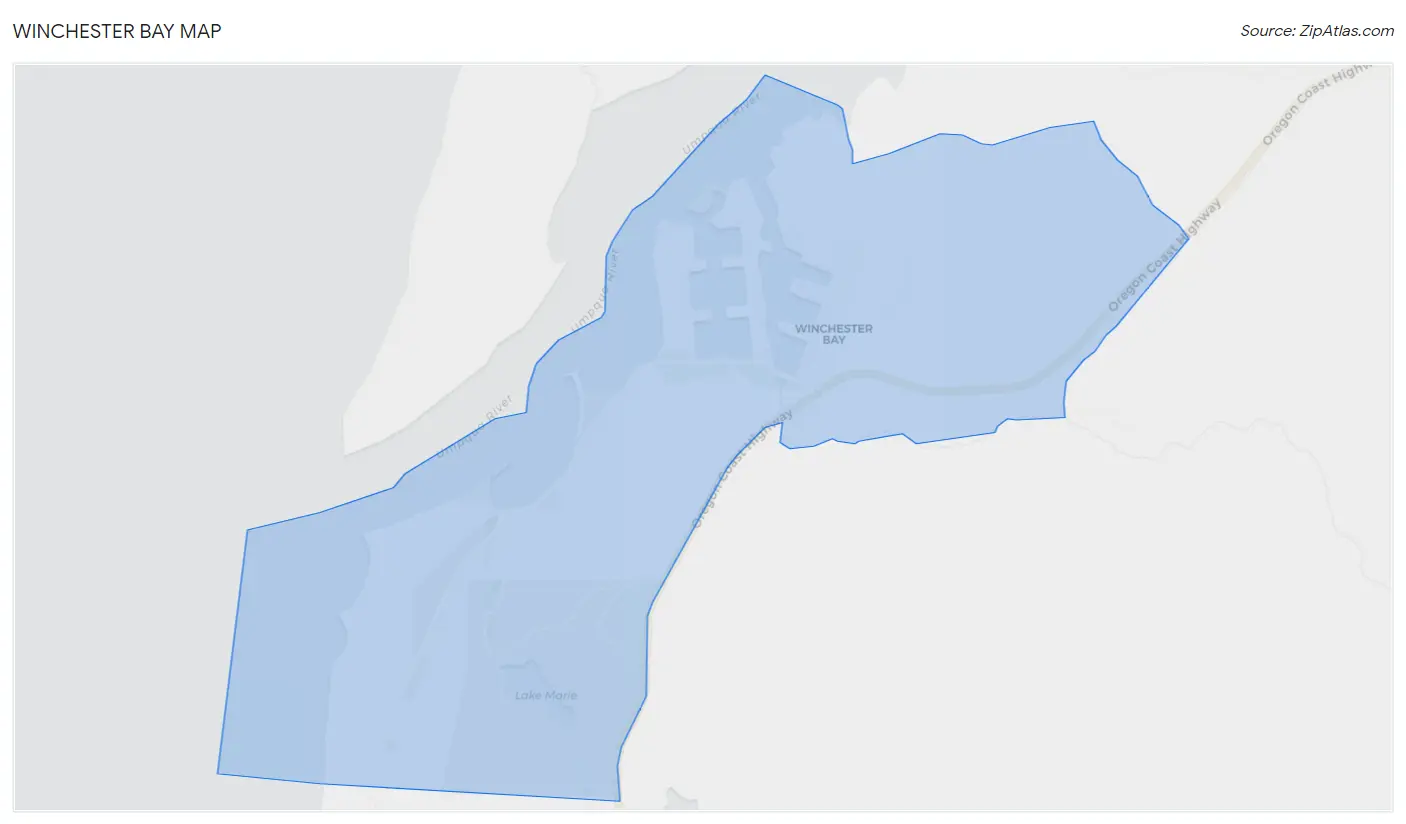
Winchester Bay Overview
$27,671
PER CAPITA INCOME
$45,833
AVG FAMILY INCOME
$50,515
AVG HOUSEHOLD INCOME
0.19
INEQUALITY / GINI INDEX
237
TOTAL POPULATION
87
MALE POPULATION
150
FEMALE POPULATION
58.00
MALES / 100 FEMALES
172.41
FEMALES / 100 MALES
59.3
MEDIAN AGE
2.0
AVG FAMILY SIZE
1.8
AVG HOUSEHOLD SIZE
77
LABOR FORCE [ PEOPLE ]
32.5%
PERCENT IN LABOR FORCE
50.0%
UNEMPLOYMENT RATE
Winchester Bay Area Codes
Income in Winchester Bay
Income Overview in Winchester Bay
Per Capita Income in Winchester Bay is $27,671, while median incomes of families and households are $45,833 and $50,515 respectively.
| Characteristic | Number | Measure |
| Per Capita Income | 237 | $27,671 |
| Median Family Income | 64 | $45,833 |
| Mean Family Income | 64 | $55,373 |
| Median Household Income | 122 | $50,515 |
| Mean Household Income | 122 | $51,101 |
| Income Deficit | 64 | $0 |
| Wage / Income Gap (%) | 237 | 0.00% |
| Wage / Income Gap ($) | 237 | 100.00¢ per $1 |
| Gini / Inequality Index | 237 | 0.19 |
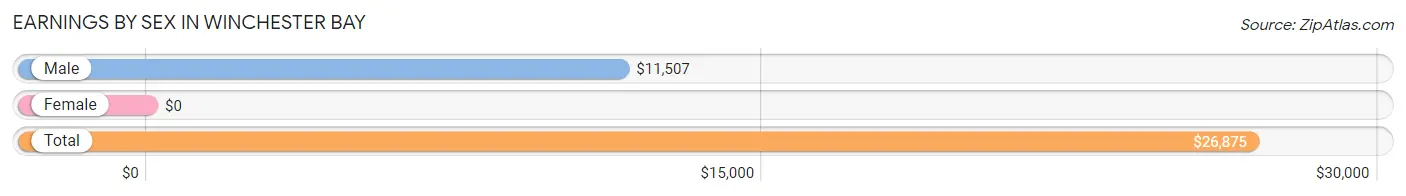
Earnings by Sex in Winchester Bay
| Sex | Number | Average Earnings |
| Male | 43 (55.8%) | $11,507 |
| Female | 34 (44.2%) | $0 |
| Total | 77 (100.0%) | $26,875 |
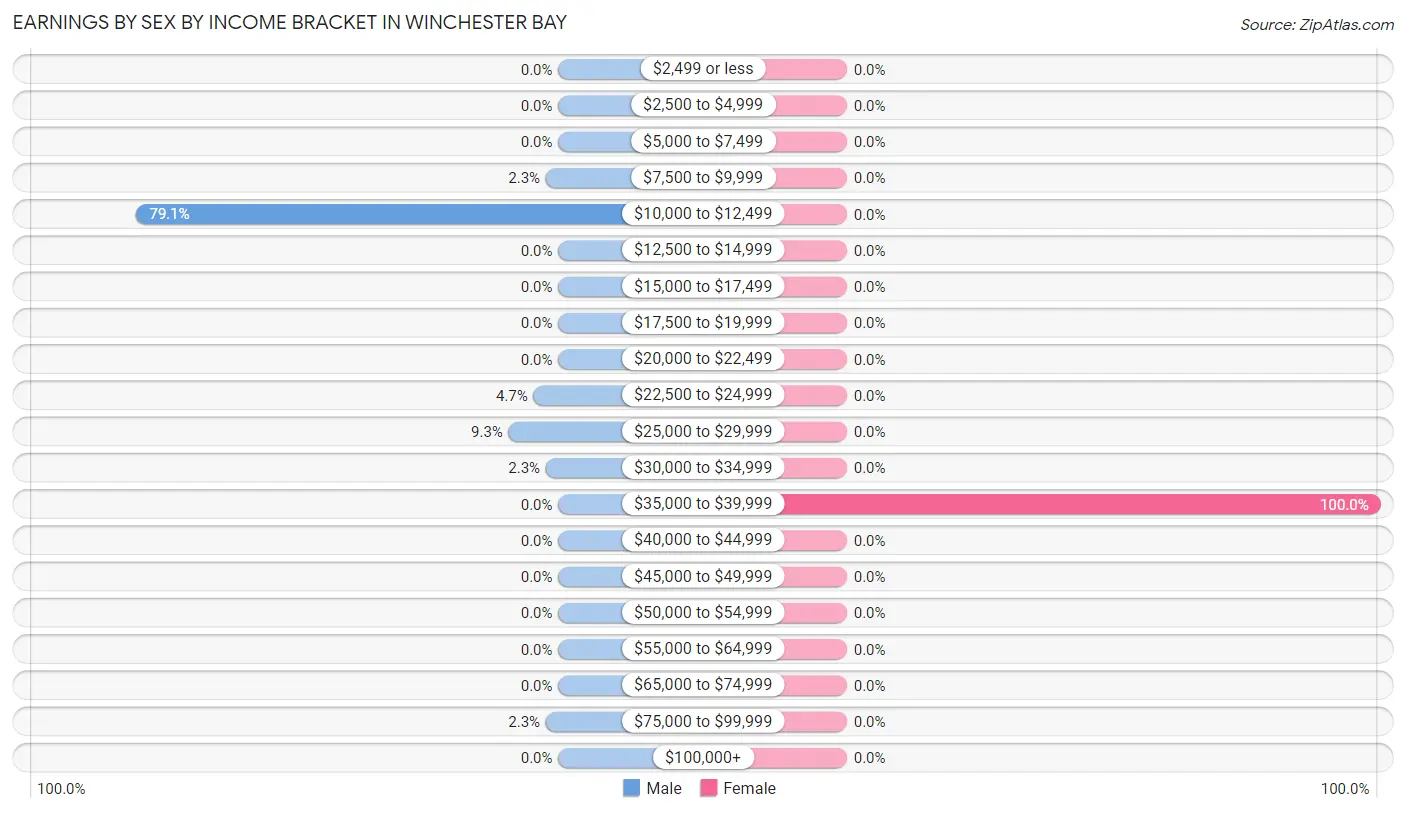
Earnings by Sex by Income Bracket in Winchester Bay
The most common earnings brackets in Winchester Bay are $10,000 to $12,499 for men (34 | 79.1%) and $35,000 to $39,999 for women (34 | 100.0%).
| Income | Male | Female |
| $2,499 or less | 0 (0.0%) | 0 (0.0%) |
| $2,500 to $4,999 | 0 (0.0%) | 0 (0.0%) |
| $5,000 to $7,499 | 0 (0.0%) | 0 (0.0%) |
| $7,500 to $9,999 | 1 (2.3%) | 0 (0.0%) |
| $10,000 to $12,499 | 34 (79.1%) | 0 (0.0%) |
| $12,500 to $14,999 | 0 (0.0%) | 0 (0.0%) |
| $15,000 to $17,499 | 0 (0.0%) | 0 (0.0%) |
| $17,500 to $19,999 | 0 (0.0%) | 0 (0.0%) |
| $20,000 to $22,499 | 0 (0.0%) | 0 (0.0%) |
| $22,500 to $24,999 | 2 (4.6%) | 0 (0.0%) |
| $25,000 to $29,999 | 4 (9.3%) | 0 (0.0%) |
| $30,000 to $34,999 | 1 (2.3%) | 0 (0.0%) |
| $35,000 to $39,999 | 0 (0.0%) | 34 (100.0%) |
| $40,000 to $44,999 | 0 (0.0%) | 0 (0.0%) |
| $45,000 to $49,999 | 0 (0.0%) | 0 (0.0%) |
| $50,000 to $54,999 | 0 (0.0%) | 0 (0.0%) |
| $55,000 to $64,999 | 0 (0.0%) | 0 (0.0%) |
| $65,000 to $74,999 | 0 (0.0%) | 0 (0.0%) |
| $75,000 to $99,999 | 1 (2.3%) | 0 (0.0%) |
| $100,000+ | 0 (0.0%) | 0 (0.0%) |
| Total | 43 (100.0%) | 34 (100.0%) |
Earnings by Sex by Educational Attainment in Winchester Bay
| Educational Attainment | Male Income | Female Income |
| Less than High School | - | - |
| High School Diploma | - | - |
| College or Associate's Degree | - | - |
| Bachelor's Degree | - | - |
| Graduate Degree | - | - |
| Total | - | - |
Family Income in Winchester Bay
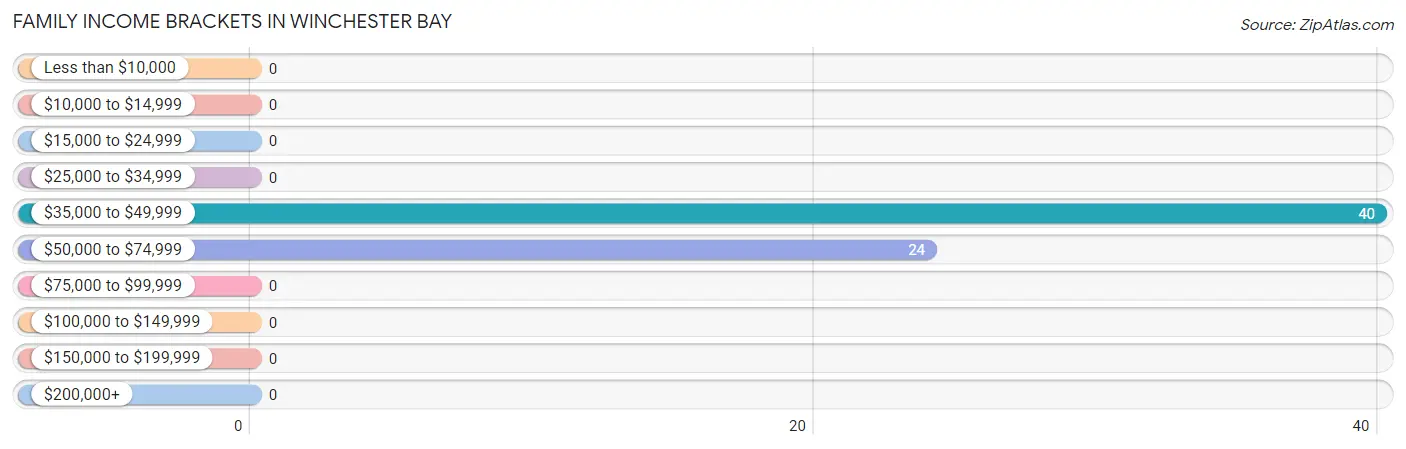
Family Income Brackets in Winchester Bay
According to the Winchester Bay family income data, there are 40 families falling into the $35,000 to $49,999 income range, which is the most common income bracket and makes up 62.5% of all families.
| Income Bracket | # Families | % Families |
| Less than $10,000 | 0 | 0.0% |
| $10,000 to $14,999 | 0 | 0.0% |
| $15,000 to $24,999 | 0 | 0.0% |
| $25,000 to $34,999 | 0 | 0.0% |
| $35,000 to $49,999 | 40 | 62.5% |
| $50,000 to $74,999 | 24 | 37.5% |
| $75,000 to $99,999 | 0 | 0.0% |
| $100,000 to $149,999 | 0 | 0.0% |
| $150,000 to $199,999 | 0 | 0.0% |
| $200,000+ | 0 | 0.0% |
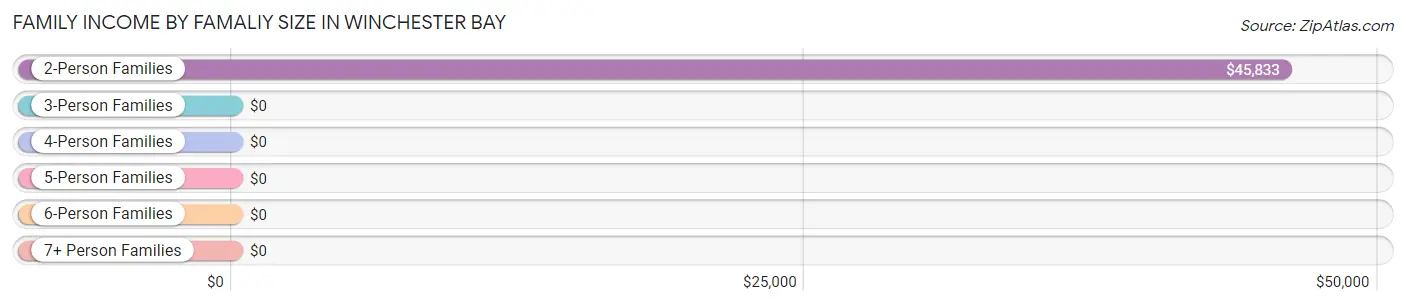
Family Income by Famaliy Size in Winchester Bay
2-person families (64 | 100.0%) account for the highest median family income in Winchester Bay with $45,833 per family, while 2-person families (64 | 100.0%) have the highest median income of $22,916 per family member.
| Income Bracket | # Families | Median Income |
| 2-Person Families | 64 (100.0%) | $45,833 |
| 3-Person Families | 0 (0.0%) | $0 |
| 4-Person Families | 0 (0.0%) | $0 |
| 5-Person Families | 0 (0.0%) | $0 |
| 6-Person Families | 0 (0.0%) | $0 |
| 7+ Person Families | 0 (0.0%) | $0 |
| Total | 64 (100.0%) | $45,833 |
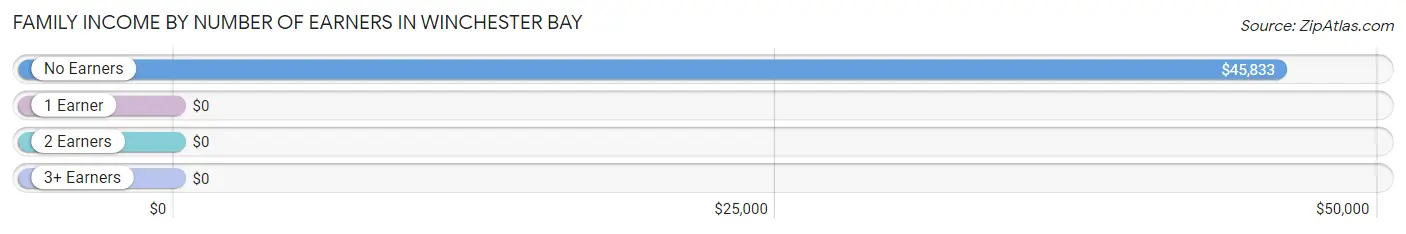
Family Income by Number of Earners in Winchester Bay
| Number of Earners | # Families | Median Income |
| No Earners | 64 (100.0%) | $45,833 |
| 1 Earner | 0 (0.0%) | $0 |
| 2 Earners | 0 (0.0%) | $0 |
| 3+ Earners | 0 (0.0%) | $0 |
| Total | 64 (100.0%) | $45,833 |
Household Income in Winchester Bay
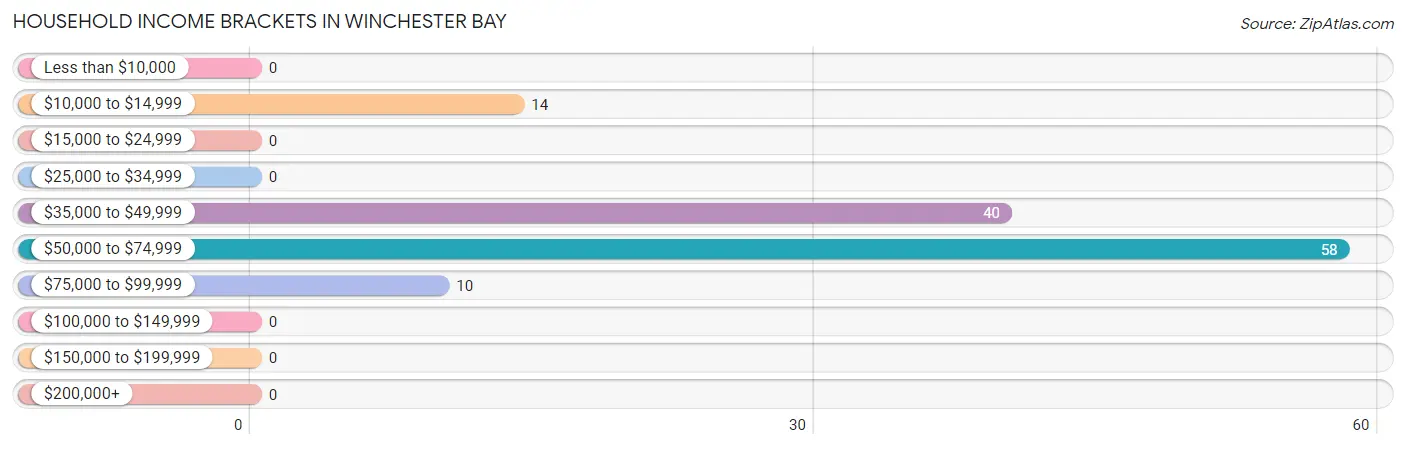
Household Income Brackets in Winchester Bay
With 58 households falling in the category, the $50,000 to $74,999 income range is the most frequent in Winchester Bay, accounting for 47.5% of all households.
| Income Bracket | # Households | % Households |
| Less than $10,000 | 0 | 0.0% |
| $10,000 to $14,999 | 14 | 11.5% |
| $15,000 to $24,999 | 0 | 0.0% |
| $25,000 to $34,999 | 0 | 0.0% |
| $35,000 to $49,999 | 40 | 32.8% |
| $50,000 to $74,999 | 58 | 47.5% |
| $75,000 to $99,999 | 10 | 8.2% |
| $100,000 to $149,999 | 0 | 0.0% |
| $150,000 to $199,999 | 0 | 0.0% |
| $200,000+ | 0 | 0.0% |
Household Income by Householder Age in Winchester Bay
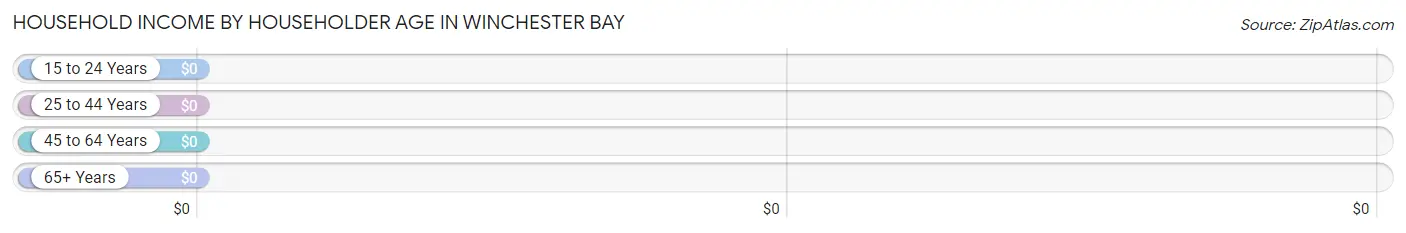
| Income Bracket | # Households | Median Income |
| 15 to 24 Years | 0 (0.0%) | $0 |
| 25 to 44 Years | 0 (0.0%) | $0 |
| 45 to 64 Years | 48 (39.3%) | $0 |
| 65+ Years | 74 (60.7%) | $0 |
| Total | 122 (100.0%) | $50,515 |
Poverty in Winchester Bay
Income Below Poverty by Sex and Age in Winchester Bay
With 43.6% poverty level for males and 13.3% for females among the residents of Winchester Bay, 45 to 54 year old males and 18 to 24 year old females are the most vulnerable to poverty, with 34 males (100.0%) and 3 females (100.0%) in their respective age groups living below the poverty level.
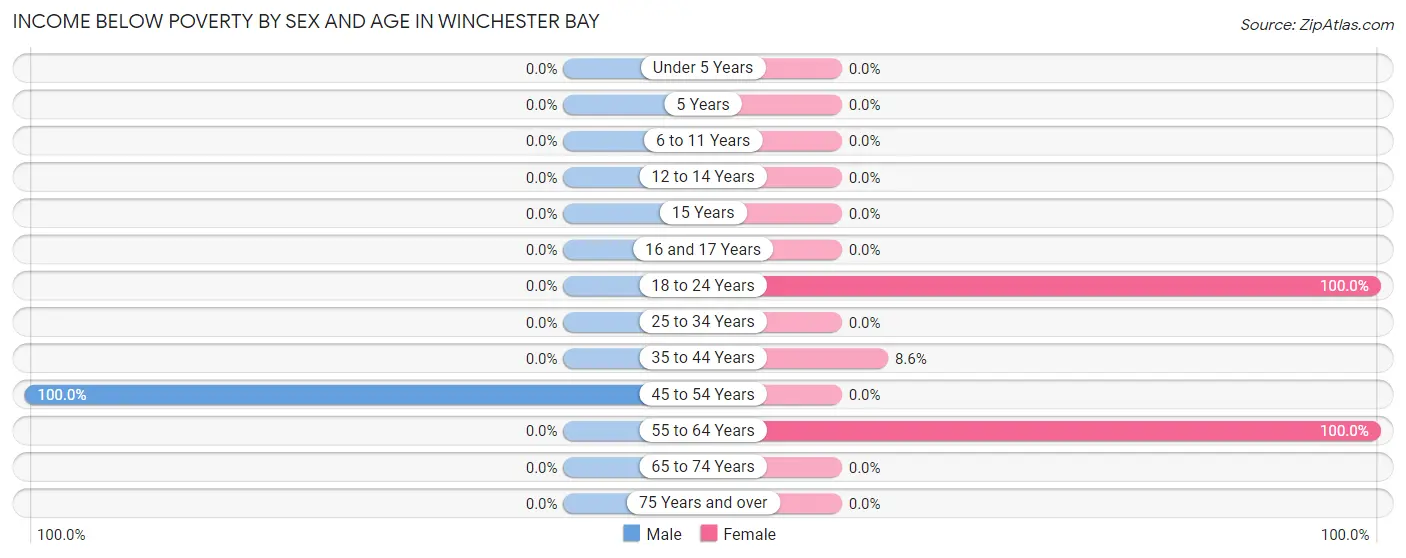
| Age Bracket | Male | Female |
| Under 5 Years | 0 (0.0%) | 0 (0.0%) |
| 5 Years | 0 (0.0%) | 0 (0.0%) |
| 6 to 11 Years | 0 (0.0%) | 0 (0.0%) |
| 12 to 14 Years | 0 (0.0%) | 0 (0.0%) |
| 15 Years | 0 (0.0%) | 0 (0.0%) |
| 16 and 17 Years | 0 (0.0%) | 0 (0.0%) |
| 18 to 24 Years | 0 (0.0%) | 3 (100.0%) |
| 25 to 34 Years | 0 (0.0%) | 0 (0.0%) |
| 35 to 44 Years | 0 (0.0%) | 3 (8.6%) |
| 45 to 54 Years | 34 (100.0%) | 0 (0.0%) |
| 55 to 64 Years | 0 (0.0%) | 14 (100.0%) |
| 65 to 74 Years | 0 (0.0%) | 0 (0.0%) |
| 75 Years and over | 0 (0.0%) | 0 (0.0%) |
| Total | 34 (43.6%) | 20 (13.3%) |
Income Above Poverty by Sex and Age in Winchester Bay
According to the poverty statistics in Winchester Bay, males aged 65 to 74 years and females aged 45 to 54 years are the age groups that are most secure financially, with 100.0% of males and 100.0% of females in these age groups living above the poverty line.
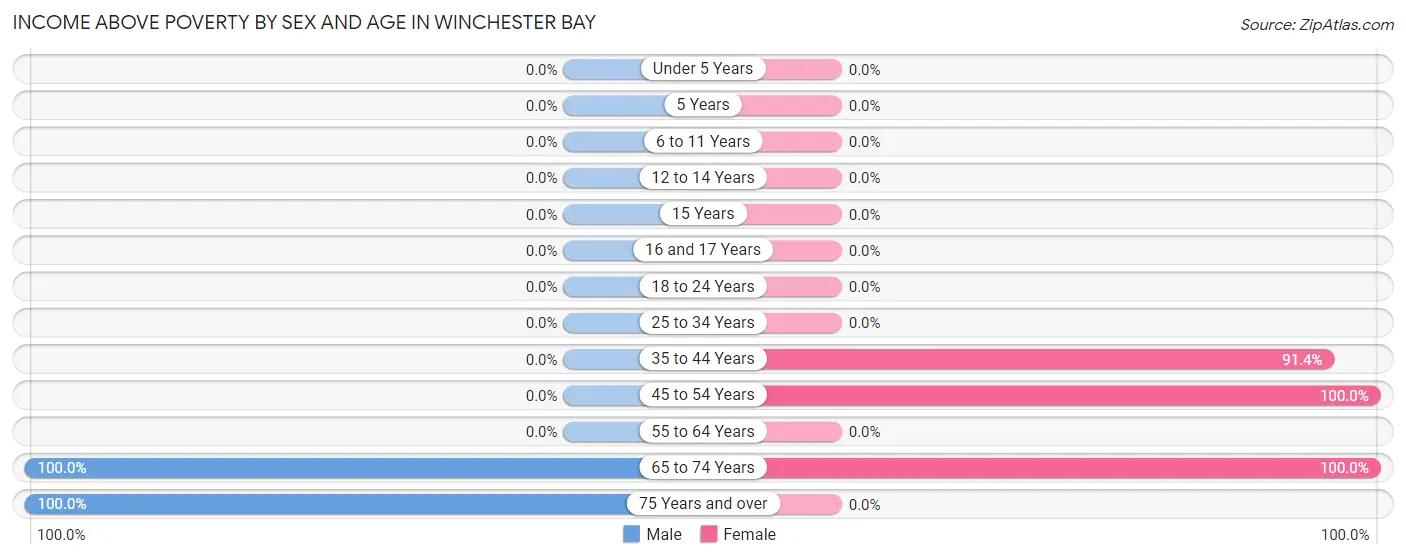
| Age Bracket | Male | Female |
| Under 5 Years | 0 (0.0%) | 0 (0.0%) |
| 5 Years | 0 (0.0%) | 0 (0.0%) |
| 6 to 11 Years | 0 (0.0%) | 0 (0.0%) |
| 12 to 14 Years | 0 (0.0%) | 0 (0.0%) |
| 15 Years | 0 (0.0%) | 0 (0.0%) |
| 16 and 17 Years | 0 (0.0%) | 0 (0.0%) |
| 18 to 24 Years | 0 (0.0%) | 0 (0.0%) |
| 25 to 34 Years | 0 (0.0%) | 0 (0.0%) |
| 35 to 44 Years | 0 (0.0%) | 32 (91.4%) |
| 45 to 54 Years | 0 (0.0%) | 34 (100.0%) |
| 55 to 64 Years | 0 (0.0%) | 0 (0.0%) |
| 65 to 74 Years | 34 (100.0%) | 64 (100.0%) |
| 75 Years and over | 10 (100.0%) | 0 (0.0%) |
| Total | 44 (56.4%) | 130 (86.7%) |
Income Below Poverty Among Married-Couple Families in Winchester Bay
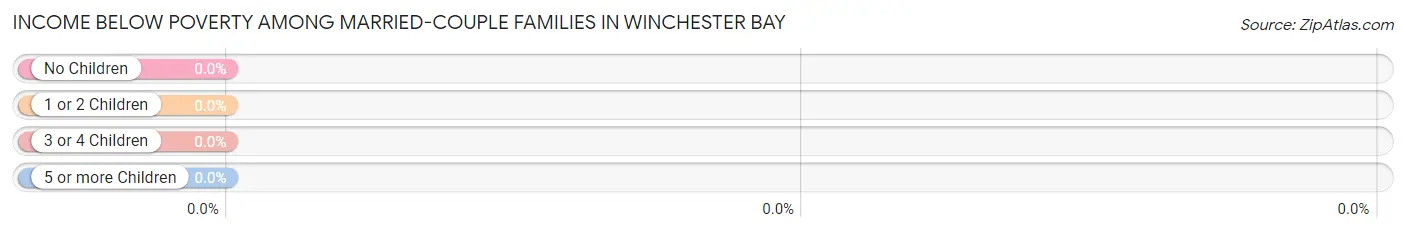
| Children | Above Poverty | Below Poverty |
| No Children | 36 (100.0%) | 0 (0.0%) |
| 1 or 2 Children | 0 (0.0%) | 0 (0.0%) |
| 3 or 4 Children | 0 (0.0%) | 0 (0.0%) |
| 5 or more Children | 0 (0.0%) | 0 (0.0%) |
| Total | 36 (100.0%) | 0 (0.0%) |
Income Below Poverty Among Single-Parent Households in Winchester Bay
| Children | Single Father | Single Mother |
| No Children | 0 (0.0%) | 0 (0.0%) |
| 1 or 2 Children | 0 (0.0%) | 0 (0.0%) |
| 3 or 4 Children | 0 (0.0%) | 0 (0.0%) |
| 5 or more Children | 0 (0.0%) | 0 (0.0%) |
| Total | 0 (0.0%) | 0 (0.0%) |
Income Below Poverty Among Married-Couple vs Single-Parent Households in Winchester Bay
| Children | Married-Couple Families | Single-Parent Households |
| No Children | 0 (0.0%) | 0 (0.0%) |
| 1 or 2 Children | 0 (0.0%) | 0 (0.0%) |
| 3 or 4 Children | 0 (0.0%) | 0 (0.0%) |
| 5 or more Children | 0 (0.0%) | 0 (0.0%) |
| Total | 0 (0.0%) | 0 (0.0%) |
Race in Winchester Bay
The most populous races in Winchester Bay are White / Caucasian (208 | 87.8%), Native / Alaskan (26 | 11.0%), and Two or more Races (2 | 0.8%).
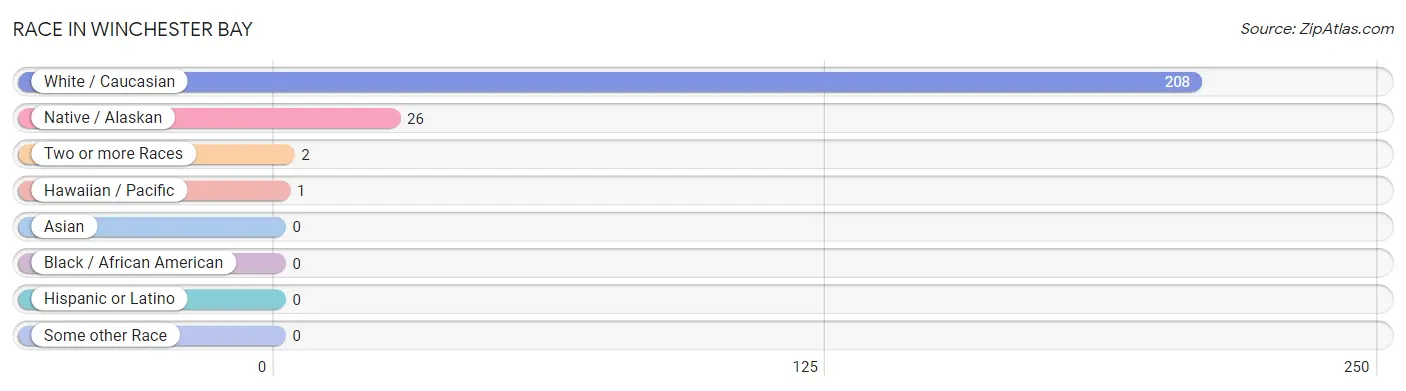
| Race | # Population | % Population |
| Asian | 0 | 0.0% |
| Black / African American | 0 | 0.0% |
| Hawaiian / Pacific | 1 | 0.4% |
| Hispanic or Latino | 0 | 0.0% |
| Native / Alaskan | 26 | 11.0% |
| White / Caucasian | 208 | 87.8% |
| Two or more Races | 2 | 0.8% |
| Some other Race | 0 | 0.0% |
| Total | 237 | 100.0% |
Ancestry in Winchester Bay
The most populous ancestries reported in Winchester Bay are German (88 | 37.1%), Scotch-Irish (62 | 26.2%), Irish (36 | 15.2%), Polish (35 | 14.8%), and Portuguese (24 | 10.1%), together accounting for 103.4% of all Winchester Bay residents.
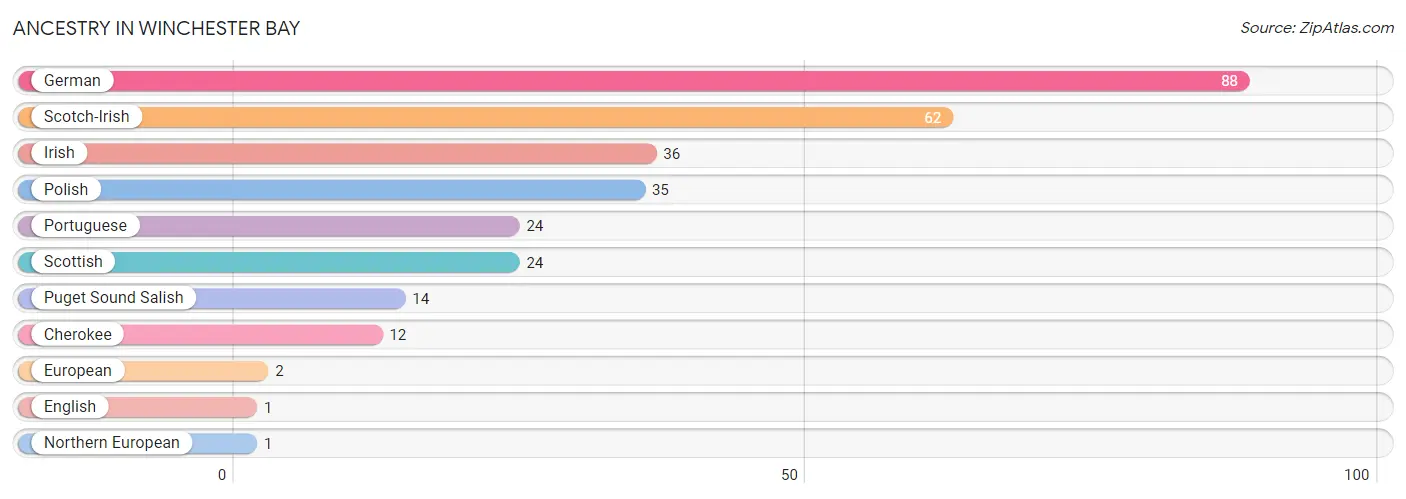
| Ancestry | # Population | % Population |
| Cherokee | 12 | 5.1% |
| English | 1 | 0.4% |
| European | 2 | 0.8% |
| German | 88 | 37.1% |
| Irish | 36 | 15.2% |
| Northern European | 1 | 0.4% |
| Polish | 35 | 14.8% |
| Portuguese | 24 | 10.1% |
| Puget Sound Salish | 14 | 5.9% |
| Scotch-Irish | 62 | 26.2% |
| Scottish | 24 | 10.1% | View All 11 Rows |
Immigrants in Winchester Bay

| Immigration Origin | # Population | % Population | View All 0 Rows |
Sex and Age in Winchester Bay
Sex and Age in Winchester Bay
The most populous age groups in Winchester Bay are 50 to 54 Years (34 | 39.1%) for men and 70 to 74 Years (40 | 26.7%) for women.
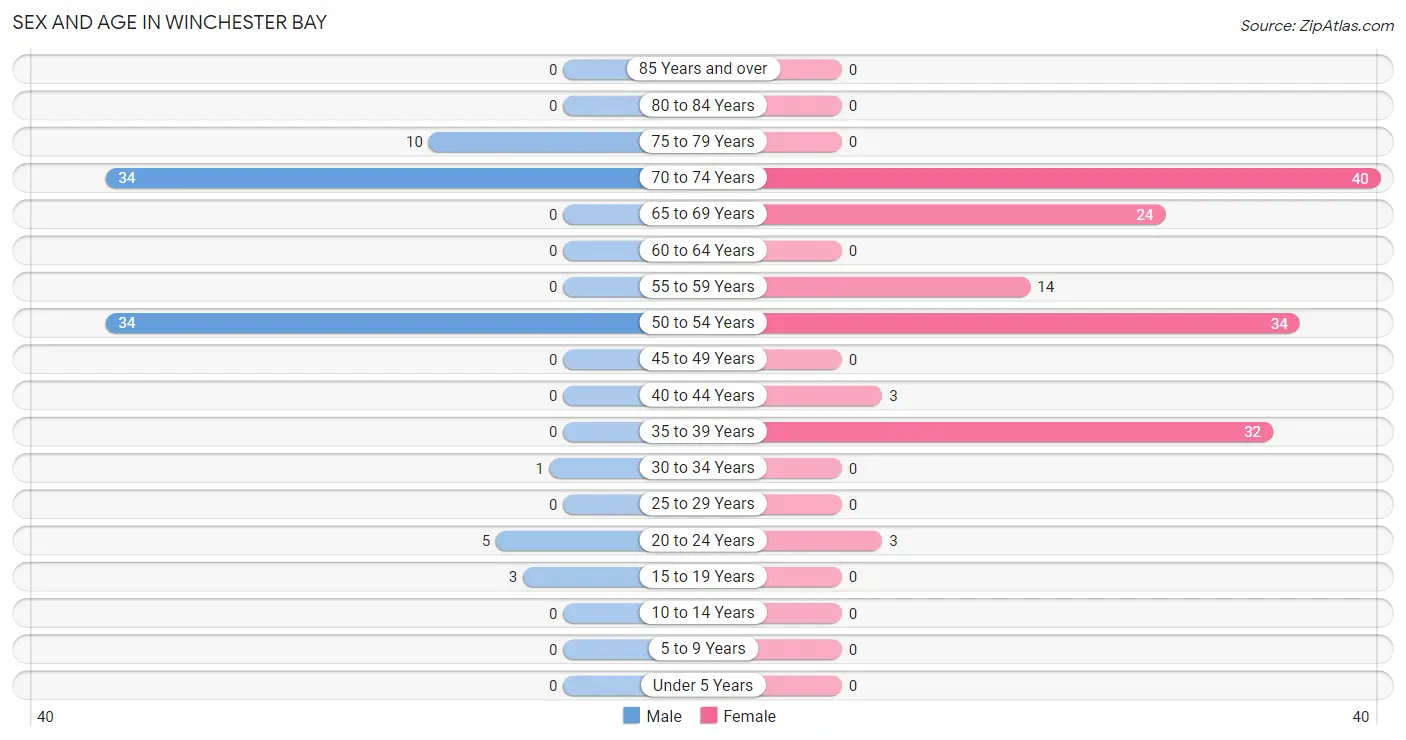
| Age Bracket | Male | Female |
| Under 5 Years | 0 (0.0%) | 0 (0.0%) |
| 5 to 9 Years | 0 (0.0%) | 0 (0.0%) |
| 10 to 14 Years | 0 (0.0%) | 0 (0.0%) |
| 15 to 19 Years | 3 (3.5%) | 0 (0.0%) |
| 20 to 24 Years | 5 (5.8%) | 3 (2.0%) |
| 25 to 29 Years | 0 (0.0%) | 0 (0.0%) |
| 30 to 34 Years | 1 (1.1%) | 0 (0.0%) |
| 35 to 39 Years | 0 (0.0%) | 32 (21.3%) |
| 40 to 44 Years | 0 (0.0%) | 3 (2.0%) |
| 45 to 49 Years | 0 (0.0%) | 0 (0.0%) |
| 50 to 54 Years | 34 (39.1%) | 34 (22.7%) |
| 55 to 59 Years | 0 (0.0%) | 14 (9.3%) |
| 60 to 64 Years | 0 (0.0%) | 0 (0.0%) |
| 65 to 69 Years | 0 (0.0%) | 24 (16.0%) |
| 70 to 74 Years | 34 (39.1%) | 40 (26.7%) |
| 75 to 79 Years | 10 (11.5%) | 0 (0.0%) |
| 80 to 84 Years | 0 (0.0%) | 0 (0.0%) |
| 85 Years and over | 0 (0.0%) | 0 (0.0%) |
| Total | 87 (100.0%) | 150 (100.0%) |
Families and Households in Winchester Bay
Median Family Size in Winchester Bay
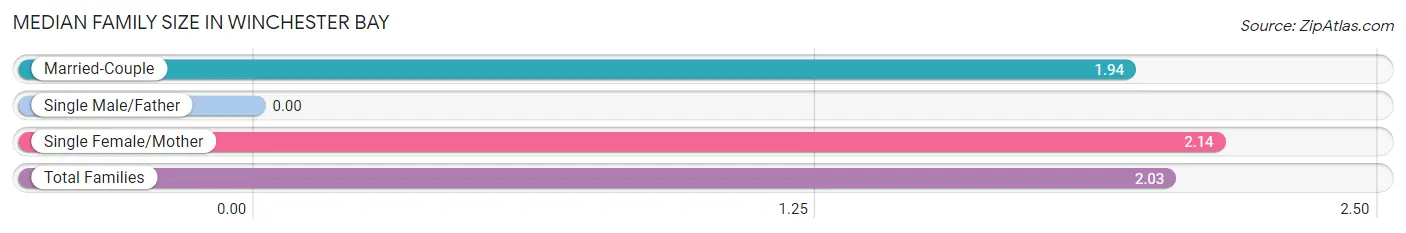
| Family Type | # Families | Family Size |
| Married-Couple | 36 (56.2%) | 1.94 |
| Single Male/Father | 0 (0.0%) | - |
| Single Female/Mother | 28 (43.8%) | 2.14 |
| Total Families | 64 (100.0%) | 2.03 |
Median Household Size in Winchester Bay
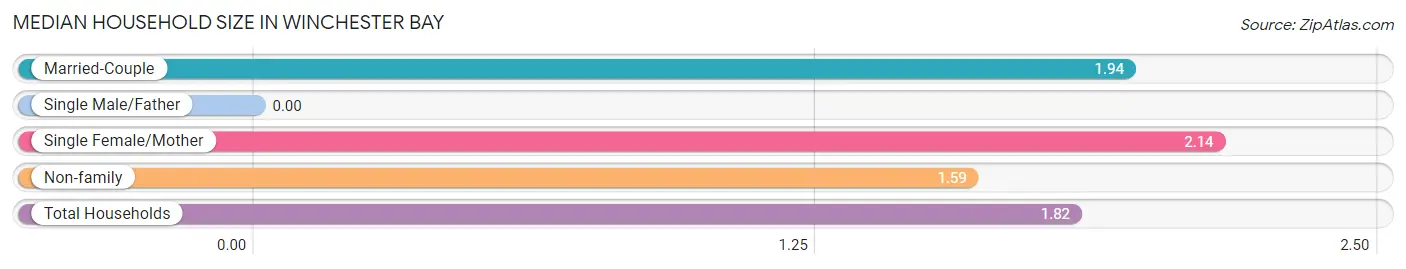
| Household Type | # Households | Household Size |
| Married-Couple | 36 (29.5%) | 1.94 |
| Single Male/Father | 0 (0.0%) | - |
| Single Female/Mother | 28 (23.0%) | 2.14 |
| Non-family | 58 (47.5%) | 1.59 |
| Total Households | 122 (100.0%) | 1.82 |
Household Size by Marriage Status in Winchester Bay
Out of a total of 122 households in Winchester Bay, 64 (52.5%) are family households, while 58 (47.5%) are nonfamily households. The most numerous type of family households are 2-person households, comprising 64, and the most common type of nonfamily households are 2-person households, comprising 34.
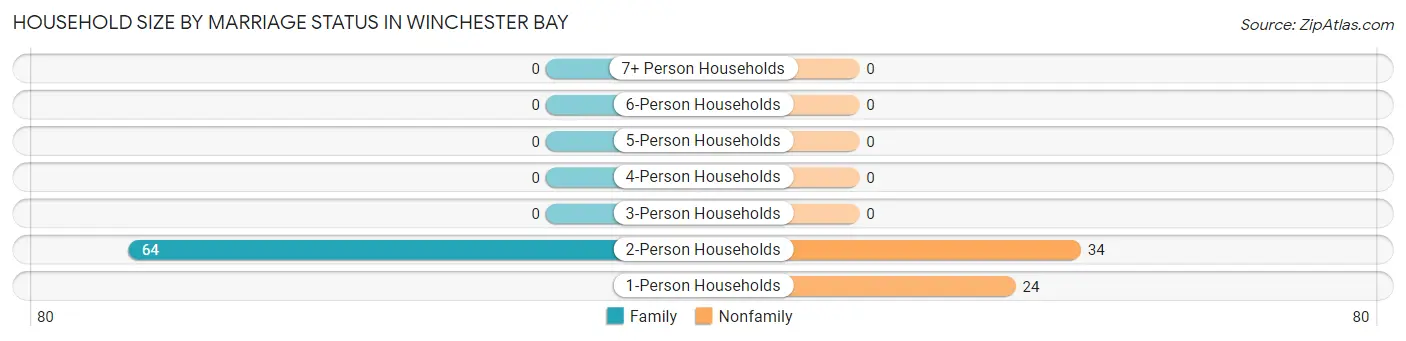
| Household Size | Family Households | Nonfamily Households |
| 1-Person Households | - | 24 (19.7%) |
| 2-Person Households | 64 (52.5%) | 34 (27.9%) |
| 3-Person Households | 0 (0.0%) | 0 (0.0%) |
| 4-Person Households | 0 (0.0%) | 0 (0.0%) |
| 5-Person Households | 0 (0.0%) | 0 (0.0%) |
| 6-Person Households | 0 (0.0%) | 0 (0.0%) |
| 7+ Person Households | 0 (0.0%) | 0 (0.0%) |
| Total | 64 (52.5%) | 58 (47.5%) |
Female Fertility in Winchester Bay
Fertility by Age in Winchester Bay
| Age Bracket | Women with Births | Births / 1,000 Women |
| 15 to 19 years | 0 (0.0%) | 0.0 |
| 20 to 34 years | 0 (0.0%) | 0.0 |
| 35 to 50 years | 0 (0.0%) | 0.0 |
| Total | 0 (0.0%) | 0.0 |
Fertility by Age by Marriage Status in Winchester Bay
| Age Bracket | Married | Unmarried |
| 15 to 19 years | 0 (0.0%) | 0 (0.0%) |
| 20 to 34 years | 0 (0.0%) | 0 (0.0%) |
| 35 to 50 years | 0 (0.0%) | 0 (0.0%) |
| Total | 0 (0.0%) | 0 (0.0%) |
Fertility by Education in Winchester Bay
| Educational Attainment | Women with Births | Births / 1,000 Women |
| Less than High School | 0 (0.0%) | 0.0 |
| High School Diploma | 0 (0.0%) | 0.0 |
| College or Associate's Degree | 0 (0.0%) | 0.0 |
| Bachelor's Degree | 0 (0.0%) | 0.0 |
| Graduate Degree | 0 (0.0%) | 0.0 |
| Total | 0 (0.0%) | 0.0 |
Fertility by Education by Marriage Status in Winchester Bay
| Educational Attainment | Married | Unmarried |
| Less than High School | 0 (0.0%) | 0 (0.0%) |
| High School Diploma | 0 (0.0%) | 0 (0.0%) |
| College or Associate's Degree | 0 (0.0%) | 0 (0.0%) |
| Bachelor's Degree | 0 (0.0%) | 0 (0.0%) |
| Graduate Degree | 0 (0.0%) | 0 (0.0%) |
| Total | 0 (0.0%) | 0 (0.0%) |
Employment Characteristics in Winchester Bay
Employment by Class of Employer in Winchester Bay
Among the 43 employed individuals in Winchester Bay, local government employees (34 | 79.1%), and federal government employees (9 | 20.9%) make up the most common classes of employment.
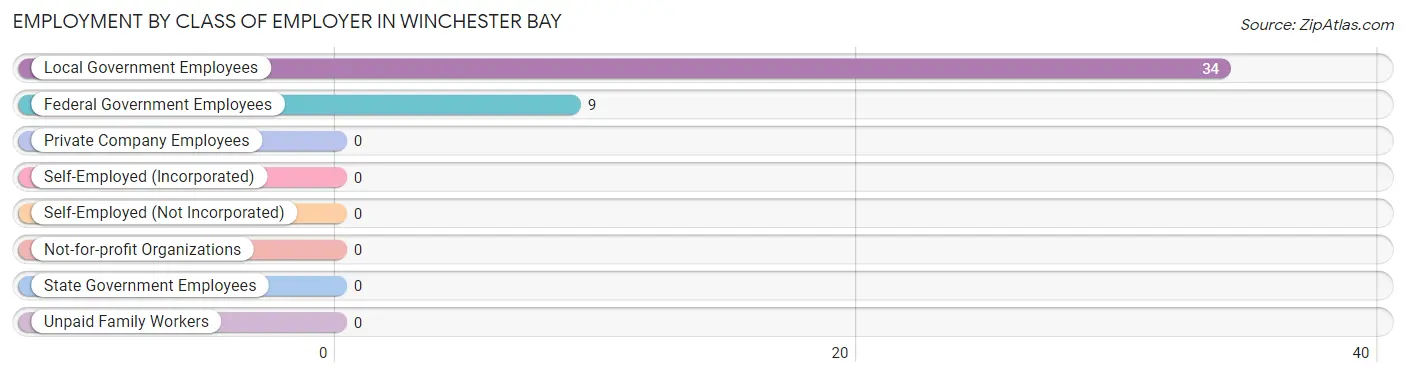
| Employer Class | # Employees | % Employees |
| Private Company Employees | 0 | 0.0% |
| Self-Employed (Incorporated) | 0 | 0.0% |
| Self-Employed (Not Incorporated) | 0 | 0.0% |
| Not-for-profit Organizations | 0 | 0.0% |
| Local Government Employees | 34 | 79.1% |
| State Government Employees | 0 | 0.0% |
| Federal Government Employees | 9 | 20.9% |
| Unpaid Family Workers | 0 | 0.0% |
| Total | 43 | 100.0% |
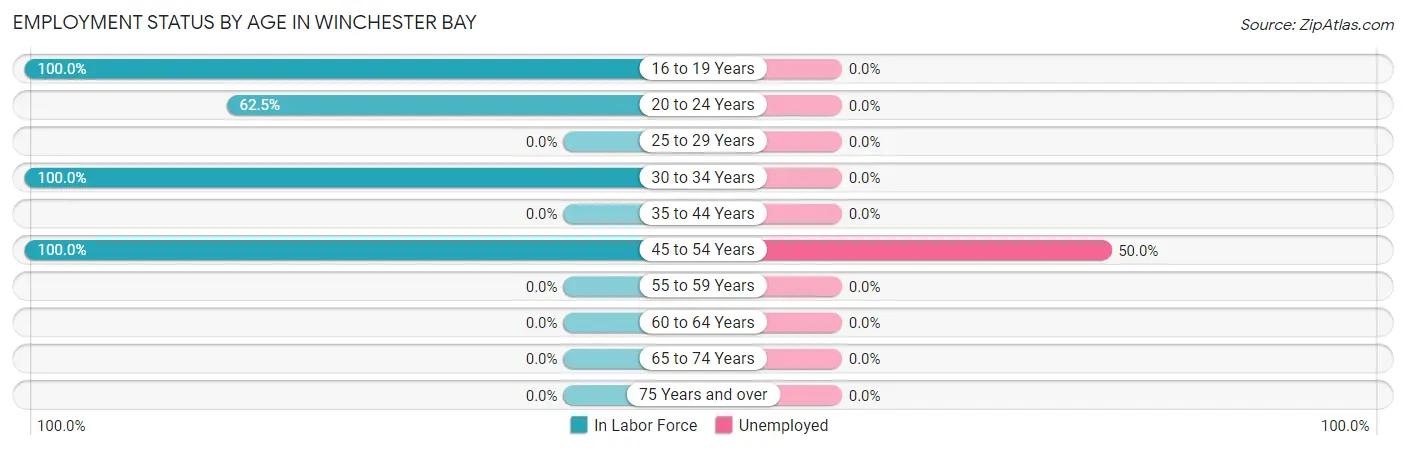
Employment Status by Age in Winchester Bay
According to the labor force statistics for Winchester Bay, out of the total population over 16 years of age (237), 32.5% or 77 individuals are in the labor force, with 50.0% or 38 of them unemployed. The age group with the highest labor force participation rate is 16 to 19 years, with 100.0% or 3 individuals in the labor force. Within the labor force, the 45 to 54 years age range has the highest percentage of unemployed individuals, with 50.0% or 34 of them being unemployed.
| Age Bracket | In Labor Force | Unemployed |
| 16 to 19 Years | 3 (100.0%) | 0 (0.0%) |
| 20 to 24 Years | 5 (62.5%) | 0 (0.0%) |
| 25 to 29 Years | 0 (0.0%) | 0 (0.0%) |
| 30 to 34 Years | 1 (100.0%) | 0 (0.0%) |
| 35 to 44 Years | 0 (0.0%) | 0 (0.0%) |
| 45 to 54 Years | 68 (100.0%) | 34 (50.0%) |
| 55 to 59 Years | 0 (0.0%) | 0 (0.0%) |
| 60 to 64 Years | 0 (0.0%) | 0 (0.0%) |
| 65 to 74 Years | 0 (0.0%) | 0 (0.0%) |
| 75 Years and over | 0 (0.0%) | 0 (0.0%) |
| Total | 77 (32.5%) | 38 (50.0%) |
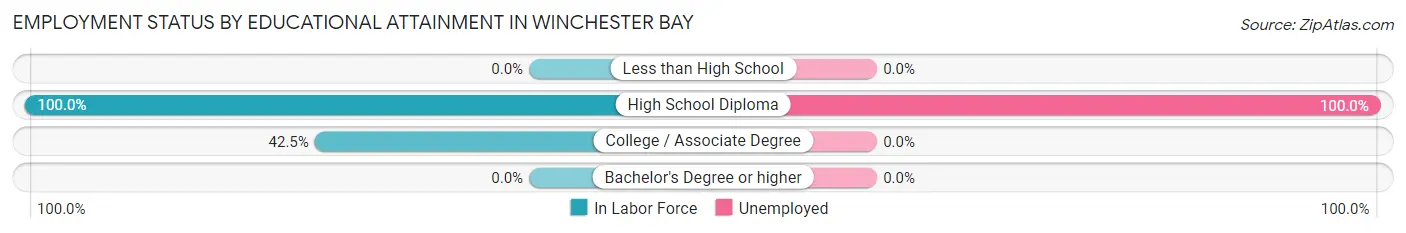
Employment Status by Educational Attainment in Winchester Bay
According to labor force statistics for Winchester Bay, 58.5% of individuals (69) out of the total population between 25 and 64 years of age (118) are in the labor force, with 50.0% or 34 of them being unemployed. The group with the highest labor force participation rate are those with the educational attainment of high school diploma, with 100.0% or 35 individuals in the labor force. Within the labor force, individuals with high school diploma education have the highest percentage of unemployment, with 100.0% or 35 of them being unemployed.
| Educational Attainment | In Labor Force | Unemployed |
| Less than High School | 0 (0.0%) | 0 (0.0%) |
| High School Diploma | 35 (100.0%) | 35 (100.0%) |
| College / Associate Degree | 34 (42.5%) | 0 (0.0%) |
| Bachelor's Degree or higher | 0 (0.0%) | 0 (0.0%) |
| Total | 69 (58.5%) | 59 (50.0%) |
Employment Occupations by Sex in Winchester Bay
Management, Business, Science and Arts Occupations
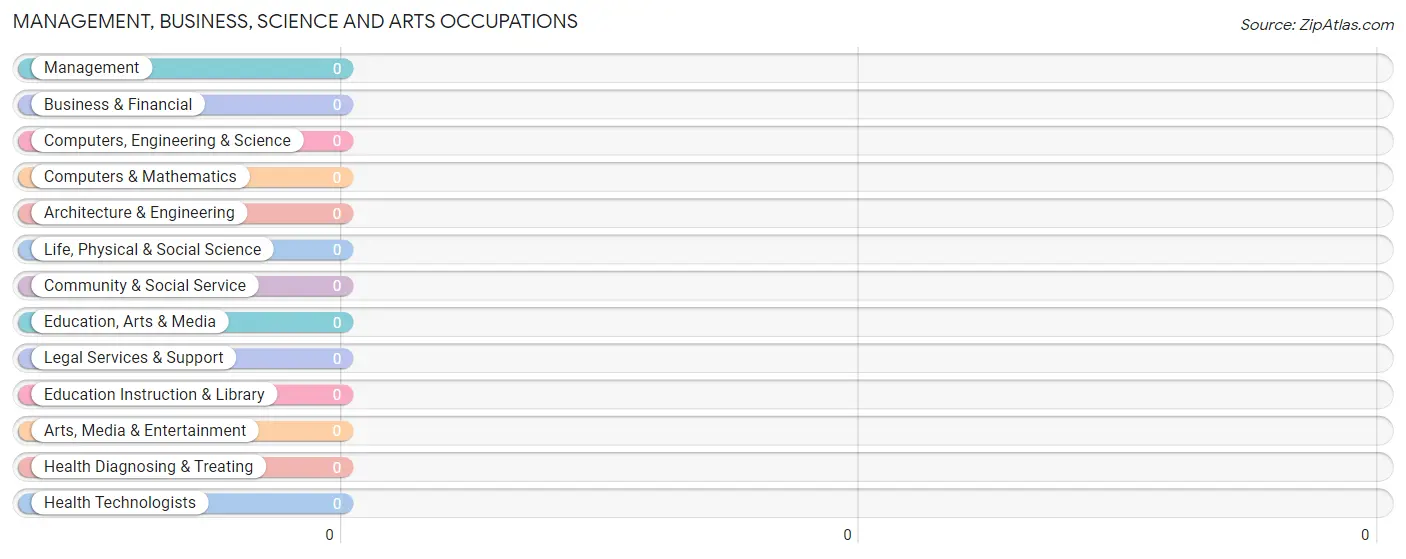
Management, Business, Science and Arts Occupations by Sex
| Occupation | Male | Female |
| Management | 0 (0.0%) | 0 (0.0%) |
| Business & Financial | 0 (0.0%) | 0 (0.0%) |
| Computers, Engineering & Science | 0 (0.0%) | 0 (0.0%) |
| Computers & Mathematics | 0 (0.0%) | 0 (0.0%) |
| Architecture & Engineering | 0 (0.0%) | 0 (0.0%) |
| Life, Physical & Social Science | 0 (0.0%) | 0 (0.0%) |
| Community & Social Service | 0 (0.0%) | 0 (0.0%) |
| Education, Arts & Media | 0 (0.0%) | 0 (0.0%) |
| Legal Services & Support | 0 (0.0%) | 0 (0.0%) |
| Education Instruction & Library | 0 (0.0%) | 0 (0.0%) |
| Arts, Media & Entertainment | 0 (0.0%) | 0 (0.0%) |
| Health Diagnosing & Treating | 0 (0.0%) | 0 (0.0%) |
| Health Technologists | 0 (0.0%) | 0 (0.0%) |
| Total (Category) | 0 (0.0%) | 0 (0.0%) |
| Total (Overall) | 0 (0.0%) | 34 (100.0%) |
Services Occupations
The most common Services occupations in Winchester Bay are , and Food Preparation & Serving (34 | 100.0%).
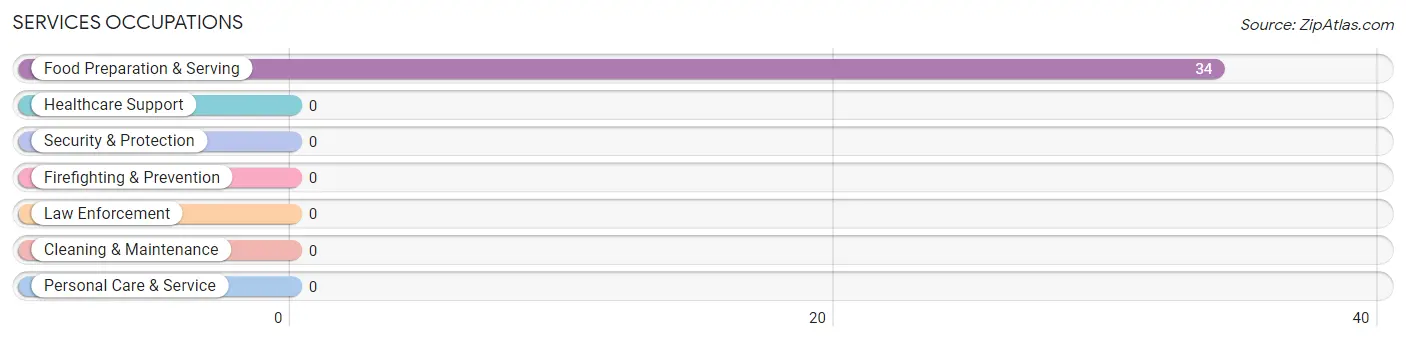
Services Occupations by Sex
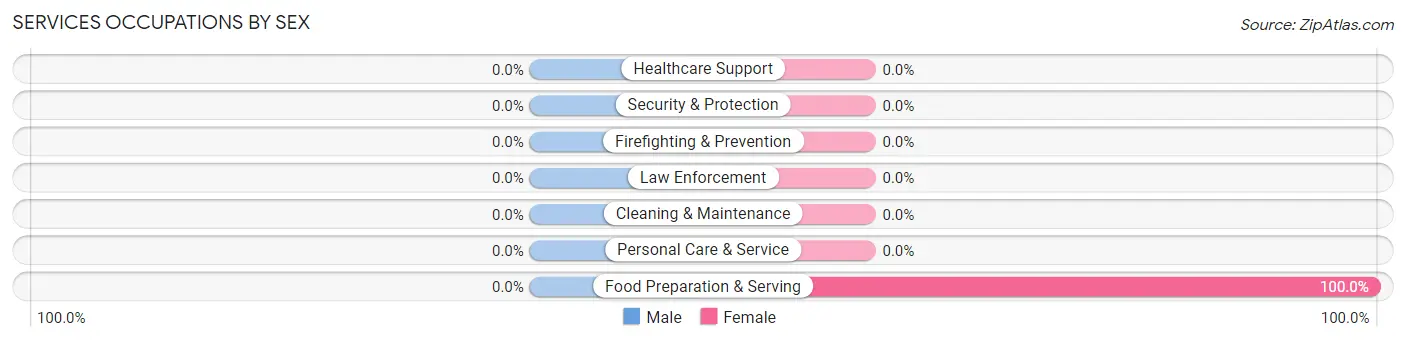
| Occupation | Male | Female |
| Healthcare Support | 0 (0.0%) | 0 (0.0%) |
| Security & Protection | 0 (0.0%) | 0 (0.0%) |
| Firefighting & Prevention | 0 (0.0%) | 0 (0.0%) |
| Law Enforcement | 0 (0.0%) | 0 (0.0%) |
| Food Preparation & Serving | 0 (0.0%) | 34 (100.0%) |
| Cleaning & Maintenance | 0 (0.0%) | 0 (0.0%) |
| Personal Care & Service | 0 (0.0%) | 0 (0.0%) |
| Total (Category) | 0 (0.0%) | 34 (100.0%) |
| Total (Overall) | 0 (0.0%) | 34 (100.0%) |
Sales and Office Occupations
Sales and Office Occupations by Sex
| Occupation | Male | Female |
| Sales & Related | 0 (0.0%) | 0 (0.0%) |
| Office & Administration | 0 (0.0%) | 0 (0.0%) |
| Total (Category) | 0 (0.0%) | 0 (0.0%) |
| Total (Overall) | 0 (0.0%) | 34 (100.0%) |
Natural Resources, Construction and Maintenance Occupations
Natural Resources, Construction and Maintenance Occupations by Sex
| Occupation | Male | Female |
| Farming, Fishing & Forestry | 0 (0.0%) | 0 (0.0%) |
| Construction & Extraction | 0 (0.0%) | 0 (0.0%) |
| Installation, Maintenance & Repair | 0 (0.0%) | 0 (0.0%) |
| Total (Category) | 0 (0.0%) | 0 (0.0%) |
| Total (Overall) | 0 (0.0%) | 34 (100.0%) |
Production, Transportation and Moving Occupations
Production, Transportation and Moving Occupations by Sex
| Occupation | Male | Female |
| Production | 0 (0.0%) | 0 (0.0%) |
| Transportation | 0 (0.0%) | 0 (0.0%) |
| Material Moving | 0 (0.0%) | 0 (0.0%) |
| Total (Category) | 0 (0.0%) | 0 (0.0%) |
| Total (Overall) | 0 (0.0%) | 34 (100.0%) |
Employment Industries by Sex in Winchester Bay
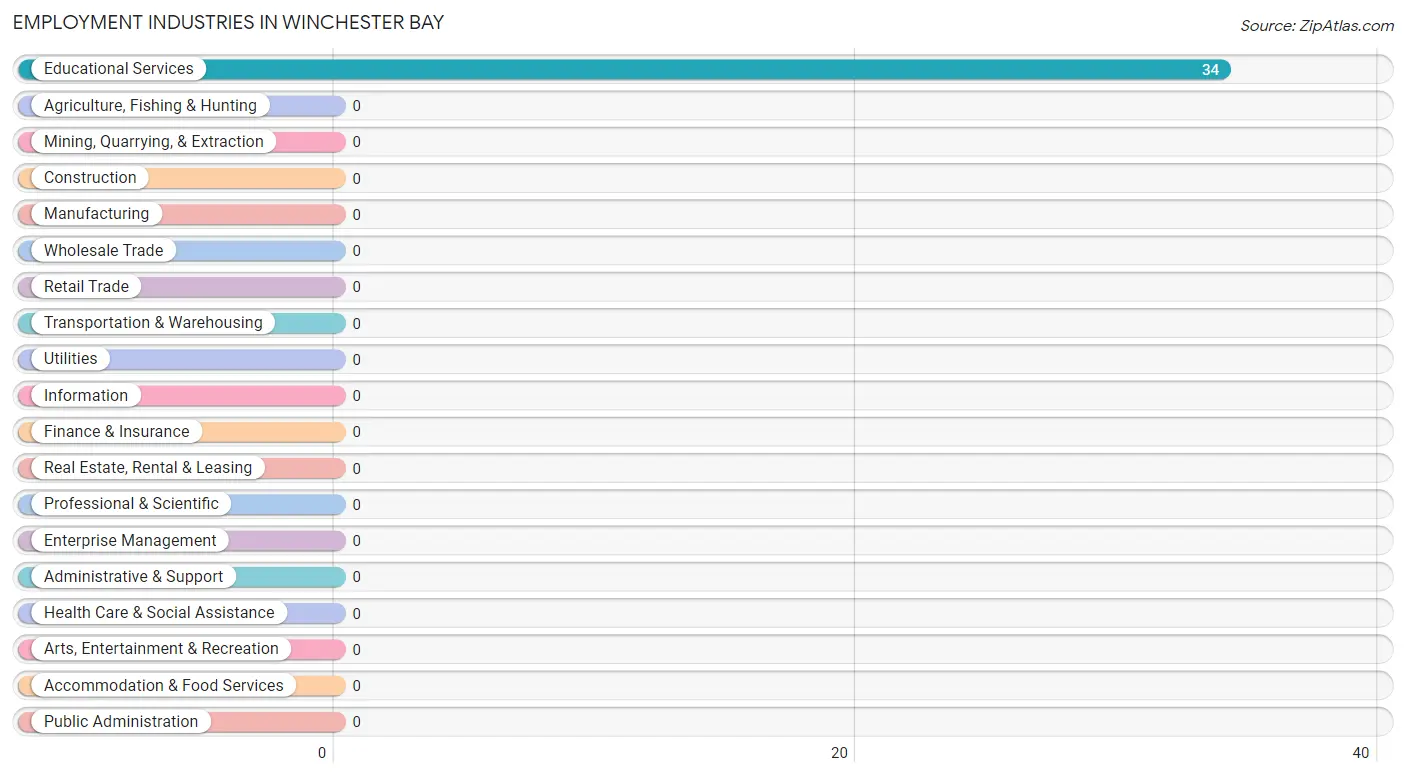
Employment Industries in Winchester Bay
The major employment industries in Winchester Bay include , and Educational Services (34 | 100.0%).
Employment Industries by Sex in Winchester Bay
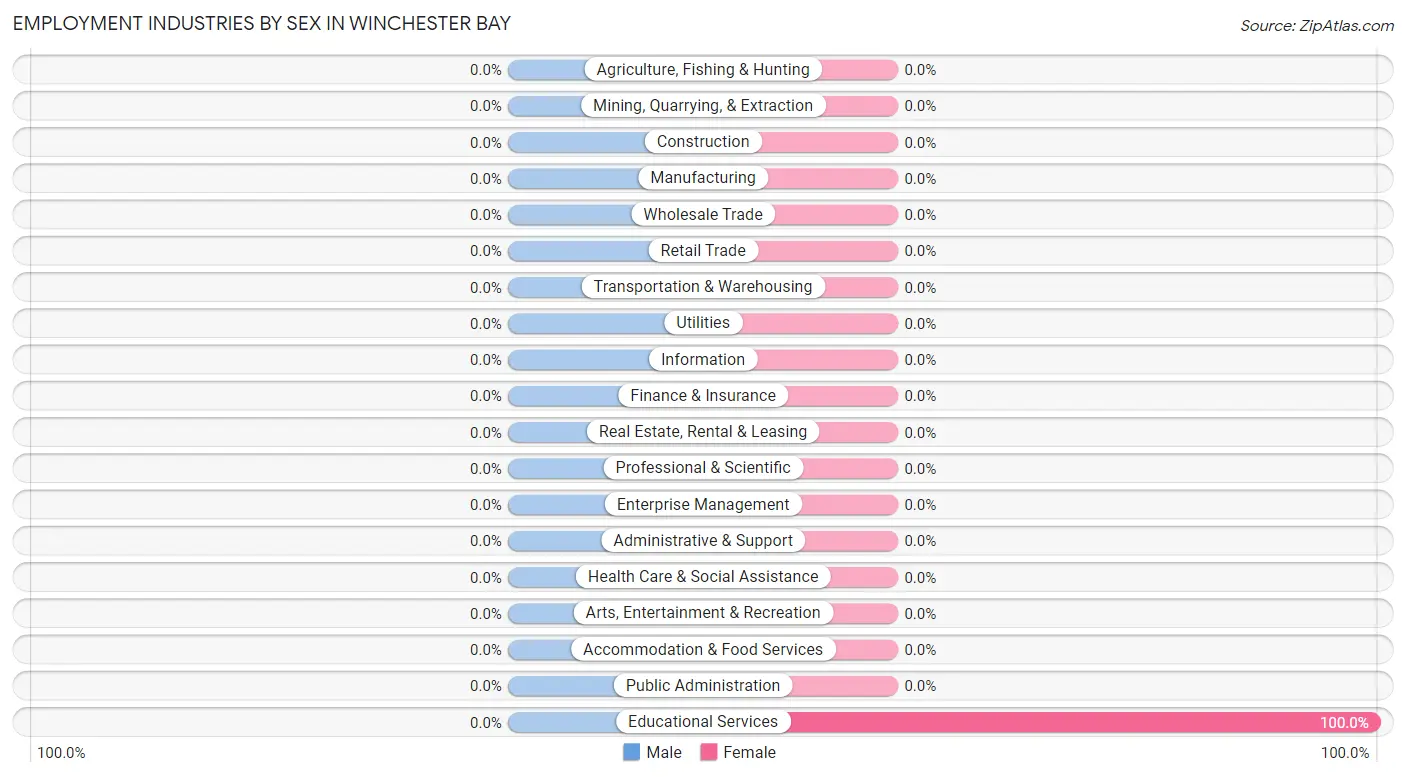
| Industry | Male | Female |
| Agriculture, Fishing & Hunting | 0 (0.0%) | 0 (0.0%) |
| Mining, Quarrying, & Extraction | 0 (0.0%) | 0 (0.0%) |
| Construction | 0 (0.0%) | 0 (0.0%) |
| Manufacturing | 0 (0.0%) | 0 (0.0%) |
| Wholesale Trade | 0 (0.0%) | 0 (0.0%) |
| Retail Trade | 0 (0.0%) | 0 (0.0%) |
| Transportation & Warehousing | 0 (0.0%) | 0 (0.0%) |
| Utilities | 0 (0.0%) | 0 (0.0%) |
| Information | 0 (0.0%) | 0 (0.0%) |
| Finance & Insurance | 0 (0.0%) | 0 (0.0%) |
| Real Estate, Rental & Leasing | 0 (0.0%) | 0 (0.0%) |
| Professional & Scientific | 0 (0.0%) | 0 (0.0%) |
| Enterprise Management | 0 (0.0%) | 0 (0.0%) |
| Administrative & Support | 0 (0.0%) | 0 (0.0%) |
| Educational Services | 0 (0.0%) | 34 (100.0%) |
| Health Care & Social Assistance | 0 (0.0%) | 0 (0.0%) |
| Arts, Entertainment & Recreation | 0 (0.0%) | 0 (0.0%) |
| Accommodation & Food Services | 0 (0.0%) | 0 (0.0%) |
| Public Administration | 0 (0.0%) | 0 (0.0%) |
| Total | 0 (0.0%) | 34 (100.0%) |
Education in Winchester Bay
School Enrollment in Winchester Bay
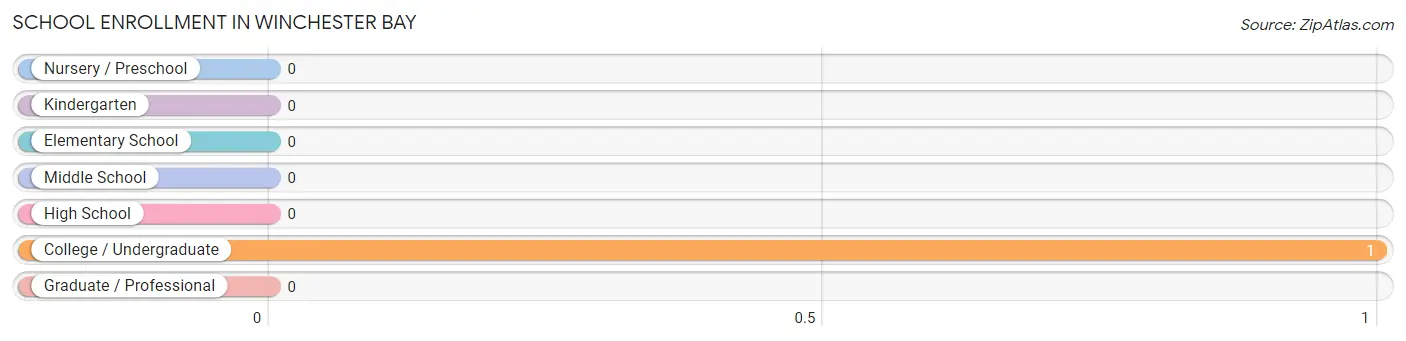
| School Level | # Students | % Students |
| Nursery / Preschool | 0 | 0.0% |
| Kindergarten | 0 | 0.0% |
| Elementary School | 0 | 0.0% |
| Middle School | 0 | 0.0% |
| High School | 0 | 0.0% |
| College / Undergraduate | 1 | 100.0% |
| Graduate / Professional | 0 | 0.0% |
| Total | 1 | 100.0% |
School Enrollment by Age by Funding Source in Winchester Bay
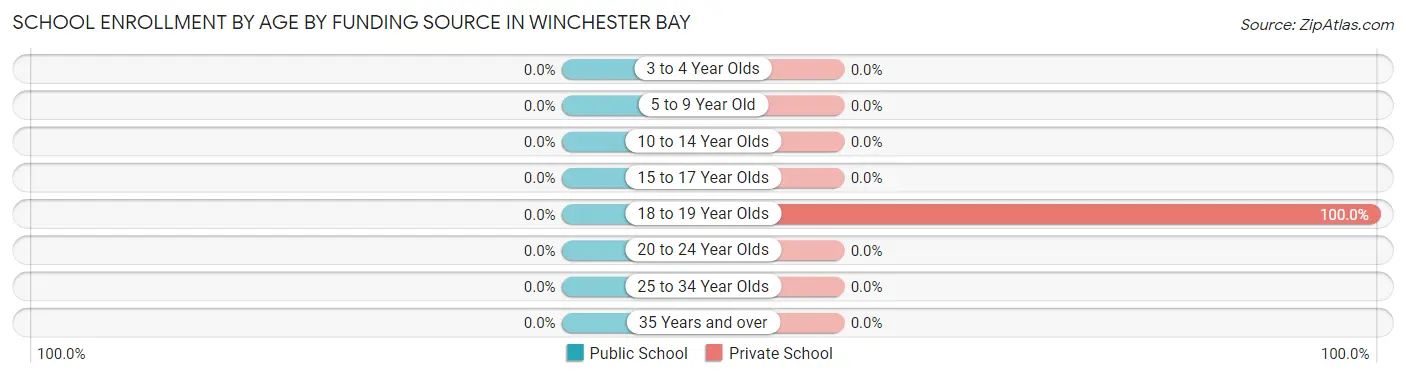
| Age Bracket | Public School | Private School |
| 3 to 4 Year Olds | 0 (0.0%) | 0 (0.0%) |
| 5 to 9 Year Old | 0 (0.0%) | 0 (0.0%) |
| 10 to 14 Year Olds | 0 (0.0%) | 0 (0.0%) |
| 15 to 17 Year Olds | 0 (0.0%) | 0 (0.0%) |
| 18 to 19 Year Olds | 0 (0.0%) | 1 (100.0%) |
| 20 to 24 Year Olds | 0 (0.0%) | 0 (0.0%) |
| 25 to 34 Year Olds | 0 (0.0%) | 0 (0.0%) |
| 35 Years and over | 0 (0.0%) | 0 (0.0%) |
| Total | 0 (0.0%) | 1 (100.0%) |
Educational Attainment by Field of Study in Winchester Bay
Social sciences (10 | 76.9%), and psychology (3 | 23.1%) are the most common fields of study among 13 individuals in Winchester Bay who have obtained a bachelor's degree or higher.
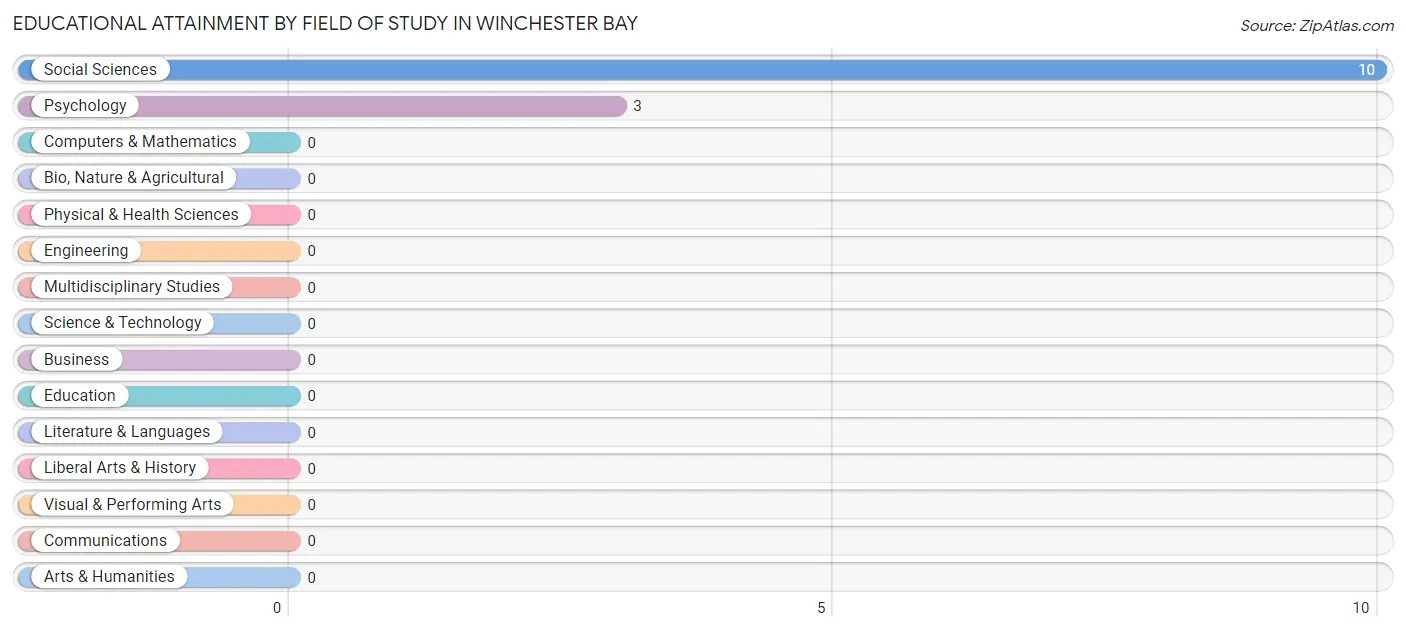
| Field of Study | # Graduates | % Graduates |
| Computers & Mathematics | 0 | 0.0% |
| Bio, Nature & Agricultural | 0 | 0.0% |
| Physical & Health Sciences | 0 | 0.0% |
| Psychology | 3 | 23.1% |
| Social Sciences | 10 | 76.9% |
| Engineering | 0 | 0.0% |
| Multidisciplinary Studies | 0 | 0.0% |
| Science & Technology | 0 | 0.0% |
| Business | 0 | 0.0% |
| Education | 0 | 0.0% |
| Literature & Languages | 0 | 0.0% |
| Liberal Arts & History | 0 | 0.0% |
| Visual & Performing Arts | 0 | 0.0% |
| Communications | 0 | 0.0% |
| Arts & Humanities | 0 | 0.0% |
| Total | 13 | 100.0% |
Transportation & Commute in Winchester Bay
Vehicle Availability by Sex in Winchester Bay
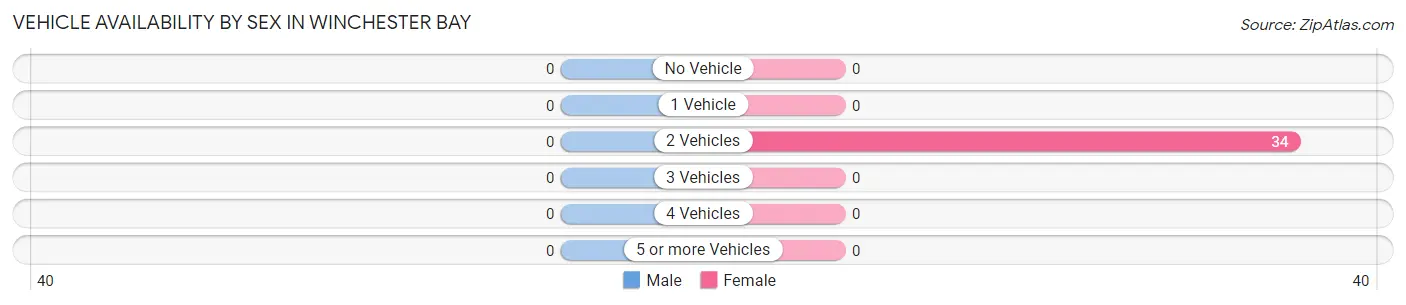
| Vehicles Available | Male | Female |
| No Vehicle | 0 (0.0%) | 0 (0.0%) |
| 1 Vehicle | 0 (0.0%) | 0 (0.0%) |
| 2 Vehicles | 0 (0.0%) | 34 (100.0%) |
| 3 Vehicles | 0 (0.0%) | 0 (0.0%) |
| 4 Vehicles | 0 (0.0%) | 0 (0.0%) |
| 5 or more Vehicles | 0 (0.0%) | 0 (0.0%) |
| Total | 0 (0.0%) | 34 (100.0%) |
Commute Time in Winchester Bay
The most frequently occuring commute durations in Winchester Bay are 10 to 14 minutes (36 commuters, 83.7%), 5 to 9 minutes (6 commuters, 14.0%), and less than 5 minutes (1 commuters, 2.3%).
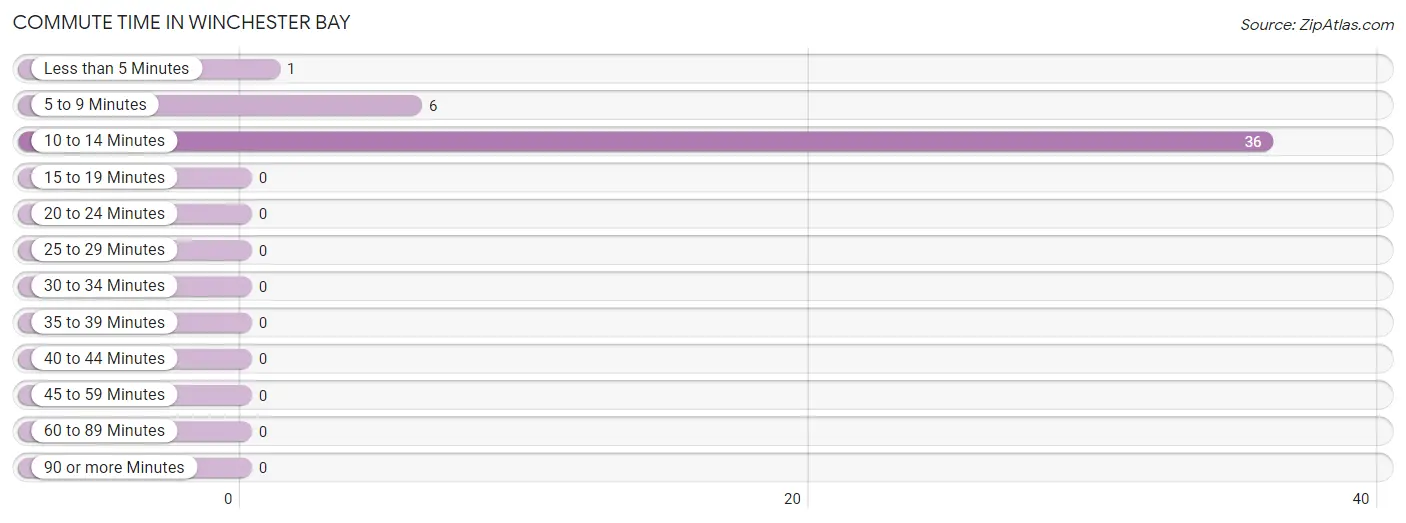
| Commute Time | # Commuters | % Commuters |
| Less than 5 Minutes | 1 | 2.3% |
| 5 to 9 Minutes | 6 | 14.0% |
| 10 to 14 Minutes | 36 | 83.7% |
| 15 to 19 Minutes | 0 | 0.0% |
| 20 to 24 Minutes | 0 | 0.0% |
| 25 to 29 Minutes | 0 | 0.0% |
| 30 to 34 Minutes | 0 | 0.0% |
| 35 to 39 Minutes | 0 | 0.0% |
| 40 to 44 Minutes | 0 | 0.0% |
| 45 to 59 Minutes | 0 | 0.0% |
| 60 to 89 Minutes | 0 | 0.0% |
| 90 or more Minutes | 0 | 0.0% |
Commute Time by Sex in Winchester Bay
The most common commute times in Winchester Bay are 5 to 9 minutes (6 commuters, 66.7%) for males and 10 to 14 minutes (34 commuters, 100.0%) for females.
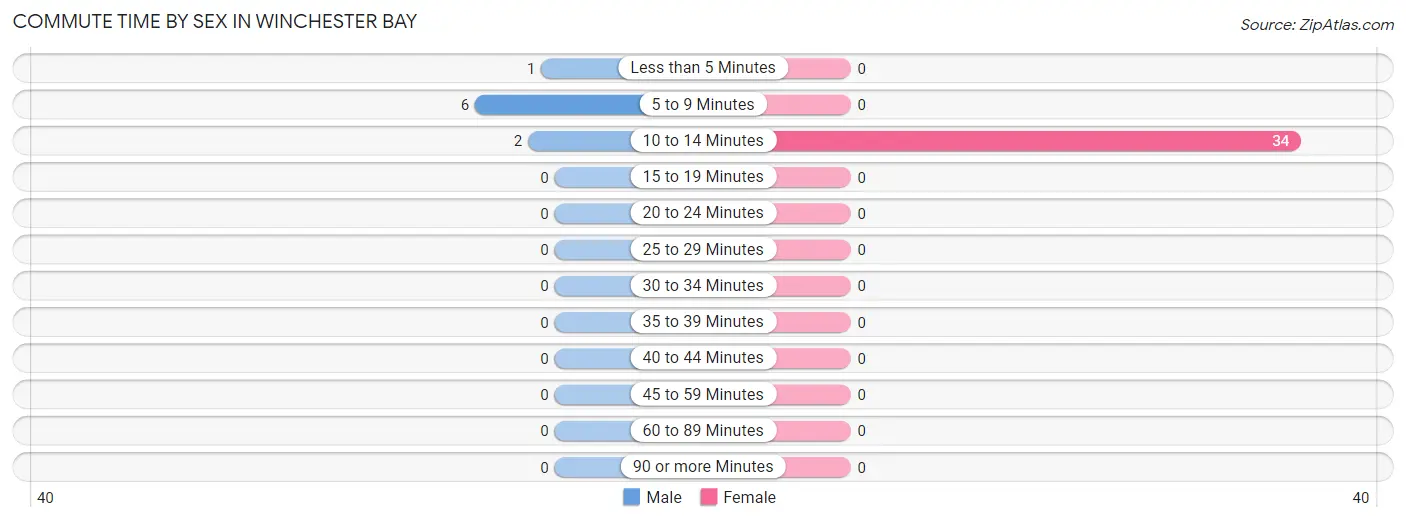
| Commute Time | Male | Female |
| Less than 5 Minutes | 1 (11.1%) | 0 (0.0%) |
| 5 to 9 Minutes | 6 (66.7%) | 0 (0.0%) |
| 10 to 14 Minutes | 2 (22.2%) | 34 (100.0%) |
| 15 to 19 Minutes | 0 (0.0%) | 0 (0.0%) |
| 20 to 24 Minutes | 0 (0.0%) | 0 (0.0%) |
| 25 to 29 Minutes | 0 (0.0%) | 0 (0.0%) |
| 30 to 34 Minutes | 0 (0.0%) | 0 (0.0%) |
| 35 to 39 Minutes | 0 (0.0%) | 0 (0.0%) |
| 40 to 44 Minutes | 0 (0.0%) | 0 (0.0%) |
| 45 to 59 Minutes | 0 (0.0%) | 0 (0.0%) |
| 60 to 89 Minutes | 0 (0.0%) | 0 (0.0%) |
| 90 or more Minutes | 0 (0.0%) | 0 (0.0%) |
Time of Departure to Work by Sex in Winchester Bay
The most frequent times of departure to work in Winchester Bay are 6:30 AM to 6:59 AM (3, 33.3%) for males and 12:00 AM to 4:59 AM (34, 100.0%) for females.
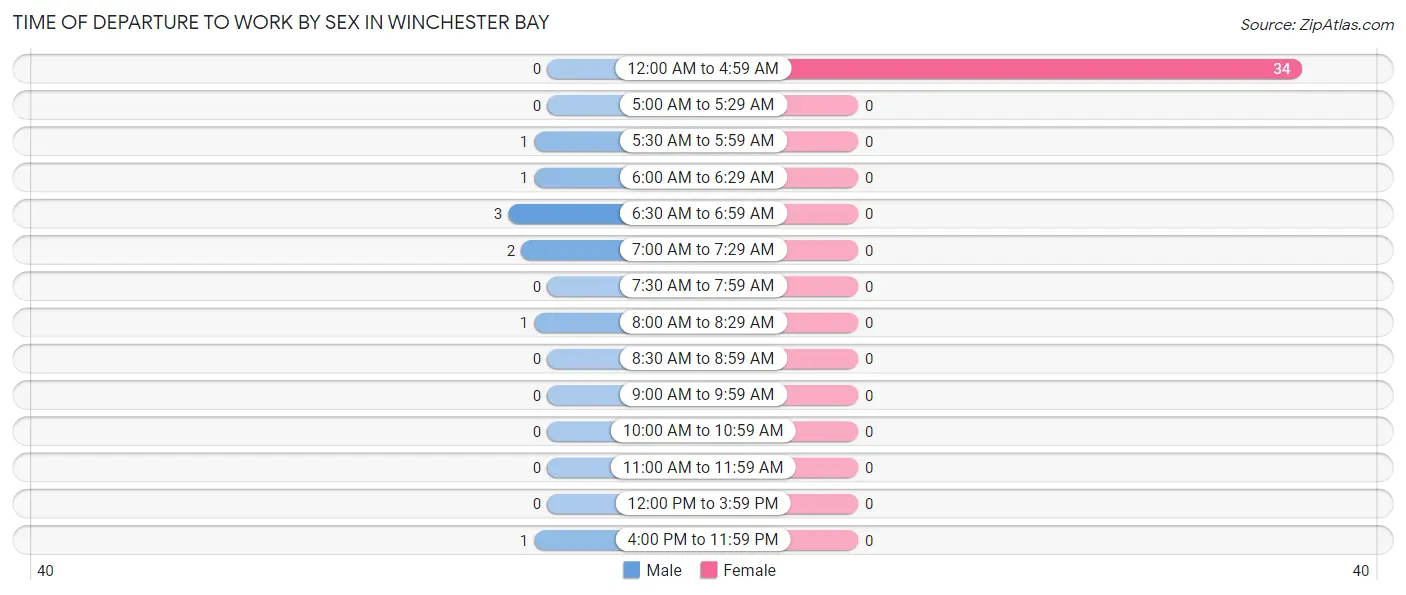
| Time of Departure | Male | Female |
| 12:00 AM to 4:59 AM | 0 (0.0%) | 34 (100.0%) |
| 5:00 AM to 5:29 AM | 0 (0.0%) | 0 (0.0%) |
| 5:30 AM to 5:59 AM | 1 (11.1%) | 0 (0.0%) |
| 6:00 AM to 6:29 AM | 1 (11.1%) | 0 (0.0%) |
| 6:30 AM to 6:59 AM | 3 (33.3%) | 0 (0.0%) |
| 7:00 AM to 7:29 AM | 2 (22.2%) | 0 (0.0%) |
| 7:30 AM to 7:59 AM | 0 (0.0%) | 0 (0.0%) |
| 8:00 AM to 8:29 AM | 1 (11.1%) | 0 (0.0%) |
| 8:30 AM to 8:59 AM | 0 (0.0%) | 0 (0.0%) |
| 9:00 AM to 9:59 AM | 0 (0.0%) | 0 (0.0%) |
| 10:00 AM to 10:59 AM | 0 (0.0%) | 0 (0.0%) |
| 11:00 AM to 11:59 AM | 0 (0.0%) | 0 (0.0%) |
| 12:00 PM to 3:59 PM | 0 (0.0%) | 0 (0.0%) |
| 4:00 PM to 11:59 PM | 1 (11.1%) | 0 (0.0%) |
| Total | 9 (100.0%) | 34 (100.0%) |
Housing Occupancy in Winchester Bay
Occupancy by Ownership in Winchester Bay
Of the total 122 dwellings in Winchester Bay, owner-occupied units account for 122 (100.0%), while renter-occupied units make up 0 (0.0%).
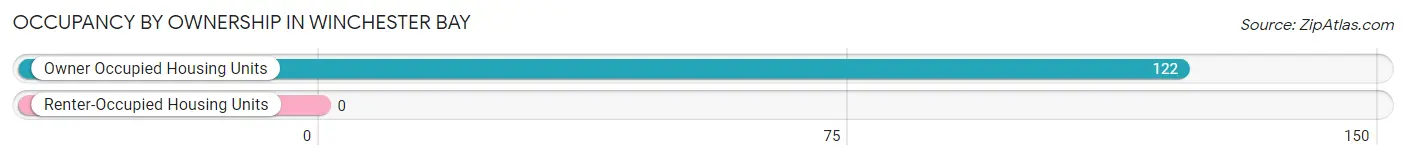
| Occupancy | # Housing Units | % Housing Units |
| Owner Occupied Housing Units | 122 | 100.0% |
| Renter-Occupied Housing Units | 0 | 0.0% |
| Total Occupied Housing Units | 122 | 100.0% |
Occupancy by Household Size in Winchester Bay
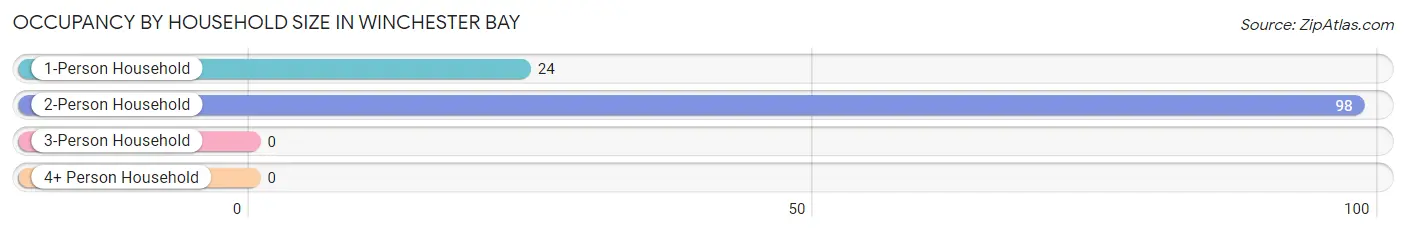
| Household Size | # Housing Units | % Housing Units |
| 1-Person Household | 24 | 19.7% |
| 2-Person Household | 98 | 80.3% |
| 3-Person Household | 0 | 0.0% |
| 4+ Person Household | 0 | 0.0% |
| Total Housing Units | 122 | 100.0% |
Occupancy by Ownership by Household Size in Winchester Bay
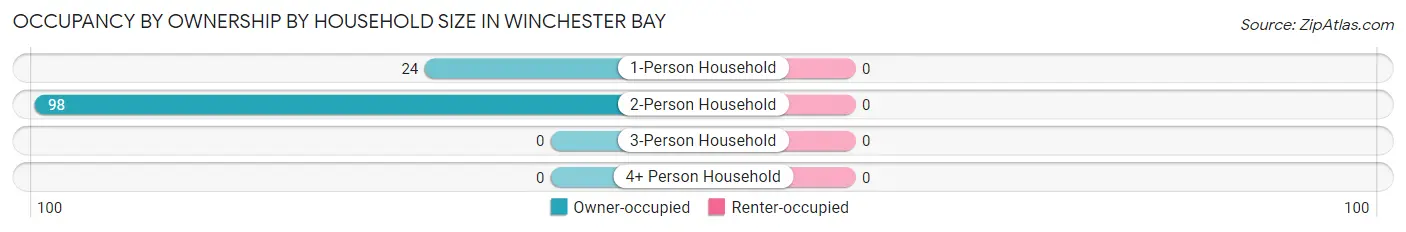
| Household Size | Owner-occupied | Renter-occupied |
| 1-Person Household | 24 (100.0%) | 0 (0.0%) |
| 2-Person Household | 98 (100.0%) | 0 (0.0%) |
| 3-Person Household | 0 (0.0%) | 0 (0.0%) |
| 4+ Person Household | 0 (0.0%) | 0 (0.0%) |
| Total Housing Units | 122 (100.0%) | 0 (0.0%) |
Occupancy by Educational Attainment in Winchester Bay
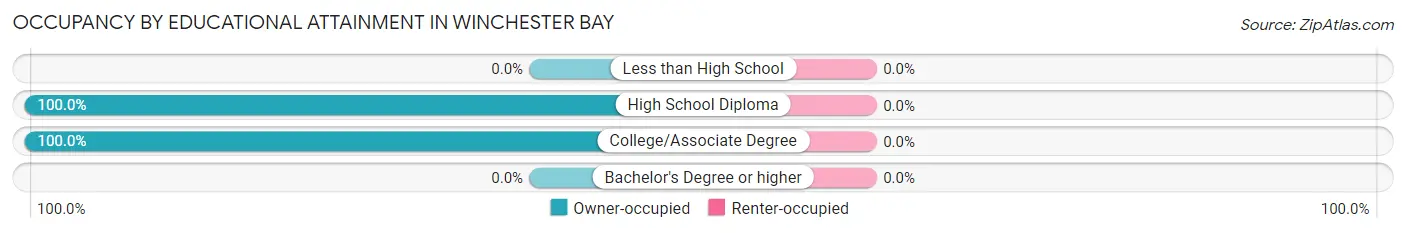
| Household Size | Owner-occupied | Renter-occupied |
| Less than High School | 0 (0.0%) | 0 (0.0%) |
| High School Diploma | 28 (100.0%) | 0 (0.0%) |
| College/Associate Degree | 94 (100.0%) | 0 (0.0%) |
| Bachelor's Degree or higher | 0 (0.0%) | 0 (0.0%) |
Occupancy by Age of Householder in Winchester Bay
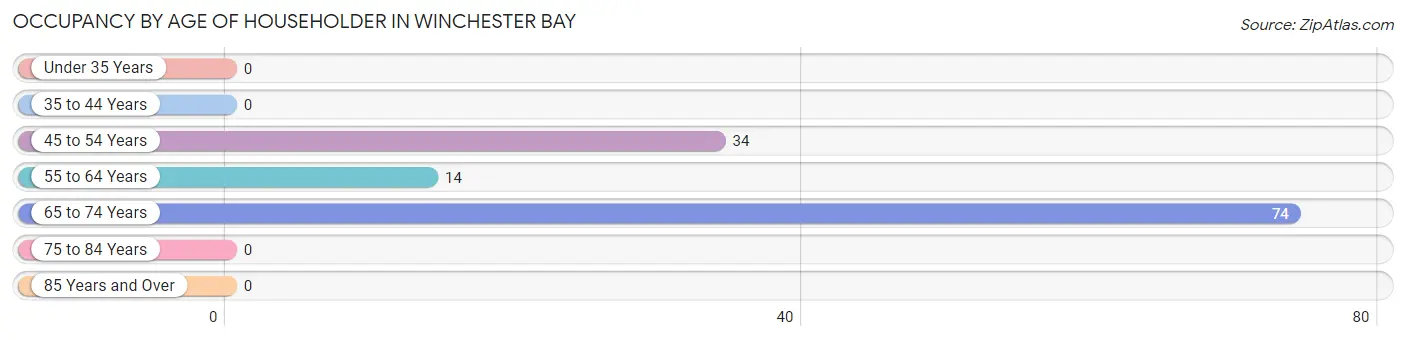
| Age Bracket | # Households | % Households |
| Under 35 Years | 0 | 0.0% |
| 35 to 44 Years | 0 | 0.0% |
| 45 to 54 Years | 34 | 27.9% |
| 55 to 64 Years | 14 | 11.5% |
| 65 to 74 Years | 74 | 60.7% |
| 75 to 84 Years | 0 | 0.0% |
| 85 Years and Over | 0 | 0.0% |
| Total | 122 | 100.0% |
Housing Finances in Winchester Bay
Median Income by Occupancy in Winchester Bay
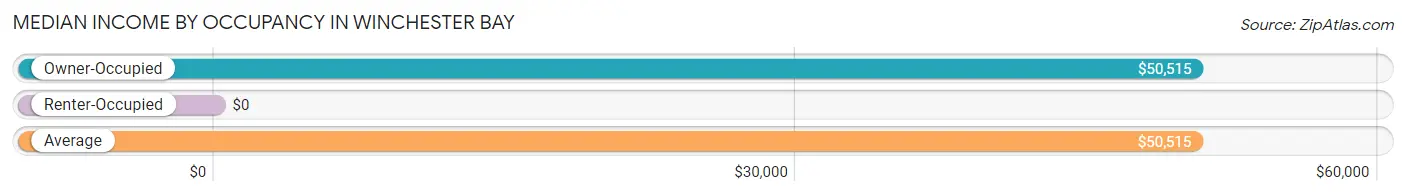
| Occupancy Type | # Households | Median Income |
| Owner-Occupied | 122 (100.0%) | $50,515 |
| Renter-Occupied | 0 (0.0%) | $0 |
| Average | 122 (100.0%) | $50,515 |
Occupancy by Householder Income Bracket in Winchester Bay
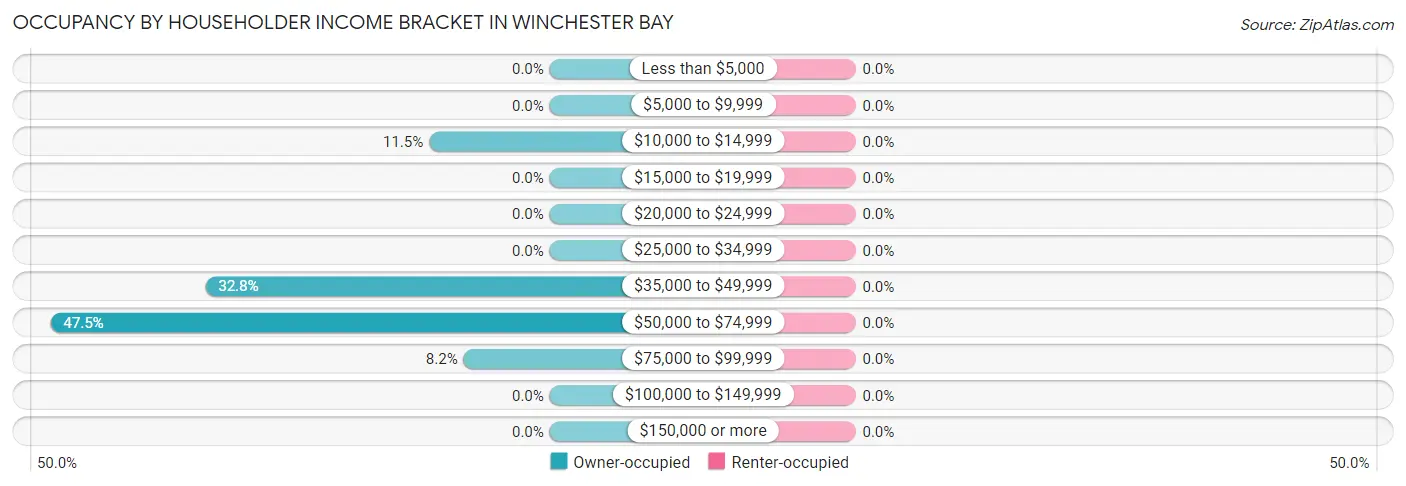
| Income Bracket | Owner-occupied | Renter-occupied |
| Less than $5,000 | 0 (0.0%) | 0 (0.0%) |
| $5,000 to $9,999 | 0 (0.0%) | 0 (0.0%) |
| $10,000 to $14,999 | 14 (11.5%) | 0 (0.0%) |
| $15,000 to $19,999 | 0 (0.0%) | 0 (0.0%) |
| $20,000 to $24,999 | 0 (0.0%) | 0 (0.0%) |
| $25,000 to $34,999 | 0 (0.0%) | 0 (0.0%) |
| $35,000 to $49,999 | 40 (32.8%) | 0 (0.0%) |
| $50,000 to $74,999 | 58 (47.5%) | 0 (0.0%) |
| $75,000 to $99,999 | 10 (8.2%) | 0 (0.0%) |
| $100,000 to $149,999 | 0 (0.0%) | 0 (0.0%) |
| $150,000 or more | 0 (0.0%) | 0 (0.0%) |
| Total | 122 (100.0%) | 0 (0.0%) |
Monthly Housing Cost Tiers in Winchester Bay
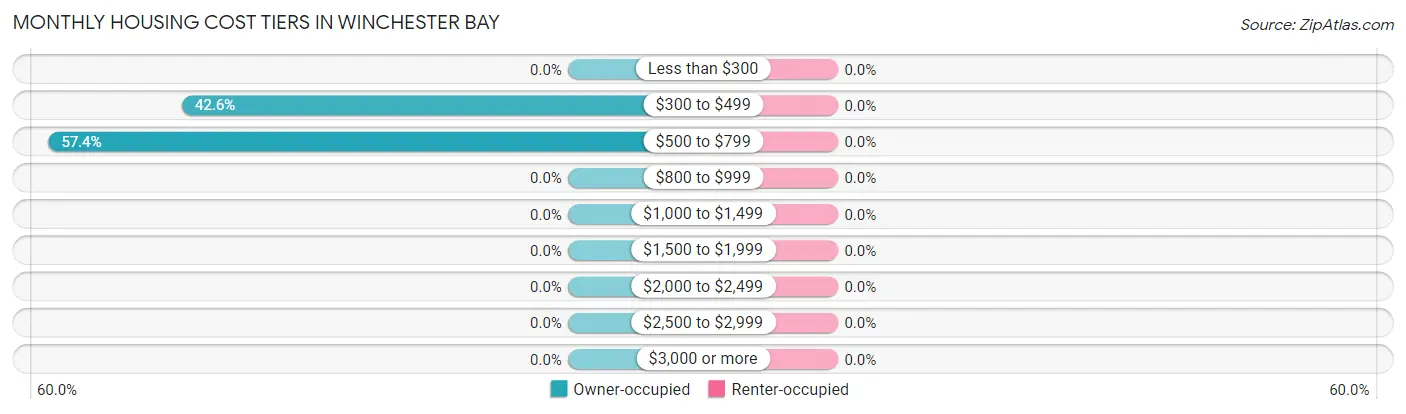
| Monthly Cost | Owner-occupied | Renter-occupied |
| Less than $300 | 0 (0.0%) | 0 (0.0%) |
| $300 to $499 | 52 (42.6%) | 0 (0.0%) |
| $500 to $799 | 70 (57.4%) | 0 (0.0%) |
| $800 to $999 | 0 (0.0%) | 0 (0.0%) |
| $1,000 to $1,499 | 0 (0.0%) | 0 (0.0%) |
| $1,500 to $1,999 | 0 (0.0%) | 0 (0.0%) |
| $2,000 to $2,499 | 0 (0.0%) | 0 (0.0%) |
| $2,500 to $2,999 | 0 (0.0%) | 0 (0.0%) |
| $3,000 or more | 0 (0.0%) | 0 (0.0%) |
| Total | 122 (100.0%) | 0 (0.0%) |
Physical Housing Characteristics in Winchester Bay
Housing Structures in Winchester Bay
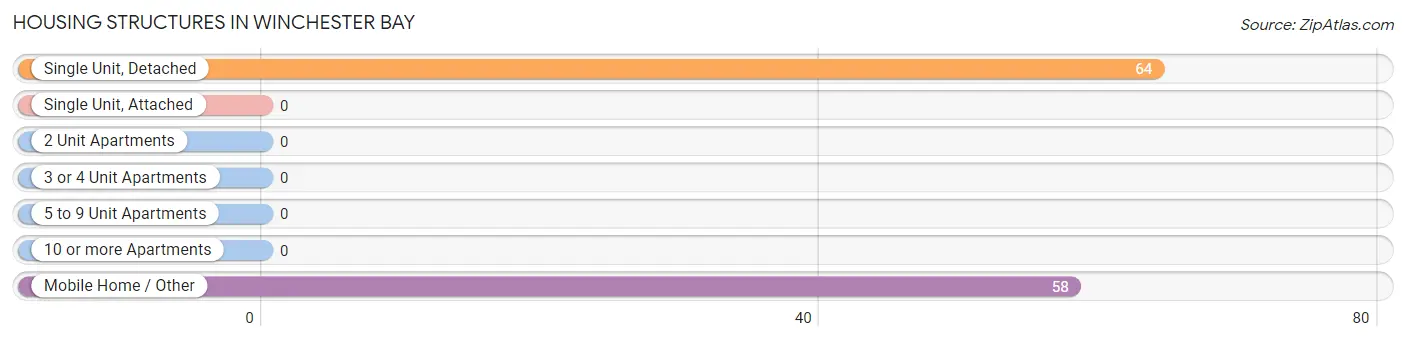
| Structure Type | # Housing Units | % Housing Units |
| Single Unit, Detached | 64 | 52.5% |
| Single Unit, Attached | 0 | 0.0% |
| 2 Unit Apartments | 0 | 0.0% |
| 3 or 4 Unit Apartments | 0 | 0.0% |
| 5 to 9 Unit Apartments | 0 | 0.0% |
| 10 or more Apartments | 0 | 0.0% |
| Mobile Home / Other | 58 | 47.5% |
| Total | 122 | 100.0% |
Housing Structures by Occupancy in Winchester Bay
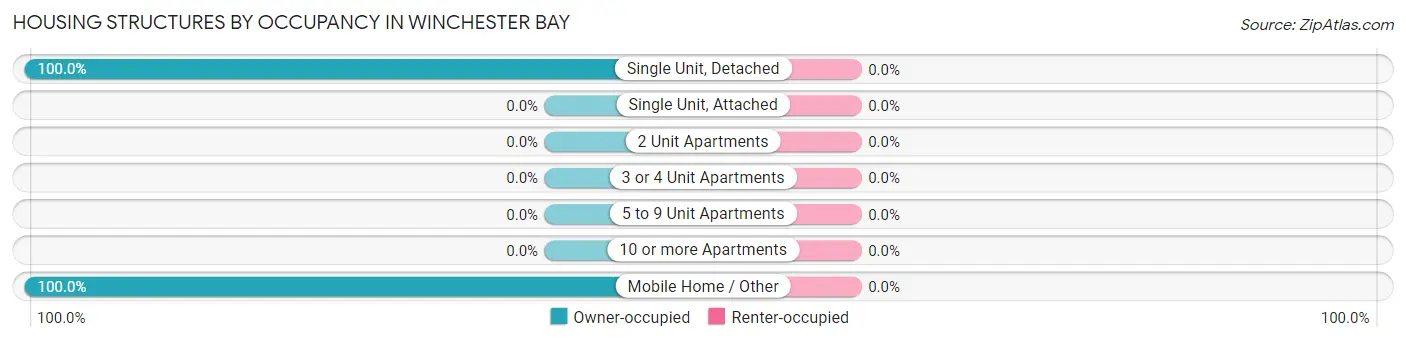
| Structure Type | Owner-occupied | Renter-occupied |
| Single Unit, Detached | 64 (100.0%) | 0 (0.0%) |
| Single Unit, Attached | 0 (0.0%) | 0 (0.0%) |
| 2 Unit Apartments | 0 (0.0%) | 0 (0.0%) |
| 3 or 4 Unit Apartments | 0 (0.0%) | 0 (0.0%) |
| 5 to 9 Unit Apartments | 0 (0.0%) | 0 (0.0%) |
| 10 or more Apartments | 0 (0.0%) | 0 (0.0%) |
| Mobile Home / Other | 58 (100.0%) | 0 (0.0%) |
| Total | 122 (100.0%) | 0 (0.0%) |
Housing Structures by Number of Rooms in Winchester Bay
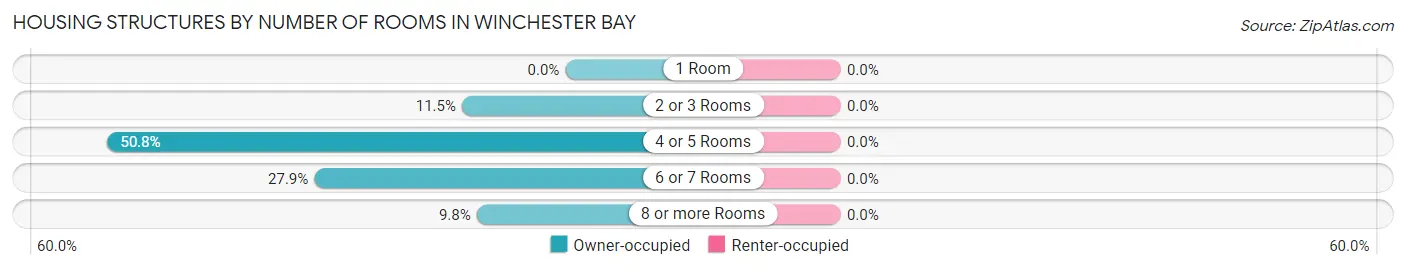
| Number of Rooms | Owner-occupied | Renter-occupied |
| 1 Room | 0 (0.0%) | 0 (0.0%) |
| 2 or 3 Rooms | 14 (11.5%) | 0 (0.0%) |
| 4 or 5 Rooms | 62 (50.8%) | 0 (0.0%) |
| 6 or 7 Rooms | 34 (27.9%) | 0 (0.0%) |
| 8 or more Rooms | 12 (9.8%) | 0 (0.0%) |
| Total | 122 (100.0%) | 0 (0.0%) |
Housing Structure by Heating Type in Winchester Bay
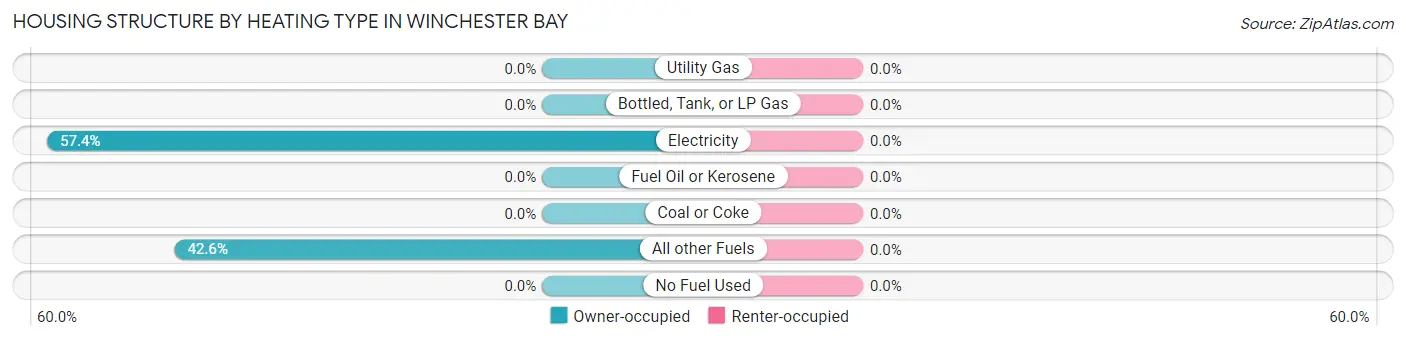
| Heating Type | Owner-occupied | Renter-occupied |
| Utility Gas | 0 (0.0%) | 0 (0.0%) |
| Bottled, Tank, or LP Gas | 0 (0.0%) | 0 (0.0%) |
| Electricity | 70 (57.4%) | 0 (0.0%) |
| Fuel Oil or Kerosene | 0 (0.0%) | 0 (0.0%) |
| Coal or Coke | 0 (0.0%) | 0 (0.0%) |
| All other Fuels | 52 (42.6%) | 0 (0.0%) |
| No Fuel Used | 0 (0.0%) | 0 (0.0%) |
| Total | 122 (100.0%) | 0 (0.0%) |
Household Vehicle Usage in Winchester Bay
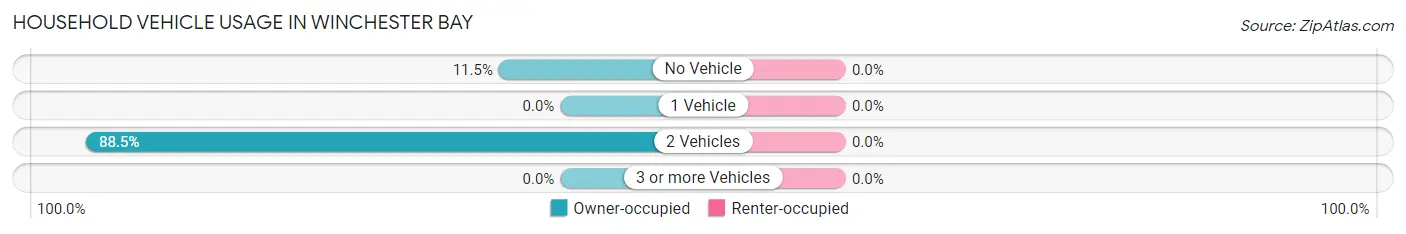
| Vehicles per Household | Owner-occupied | Renter-occupied |
| No Vehicle | 14 (11.5%) | 0 (0.0%) |
| 1 Vehicle | 0 (0.0%) | 0 (0.0%) |
| 2 Vehicles | 108 (88.5%) | 0 (0.0%) |
| 3 or more Vehicles | 0 (0.0%) | 0 (0.0%) |
| Total | 122 (100.0%) | 0 (0.0%) |
Real Estate & Mortgages in Winchester Bay
Real Estate and Mortgage Overview in Winchester Bay
| Characteristic | Without Mortgage | With Mortgage |
| Housing Units | 122 | 0 |
| Median Property Value | - | - |
| Median Household Income | $50,515 | $0 |
| Monthly Housing Costs | $538 | $0 |
| Real Estate Taxes | $1,857 | $0 |
Property Value by Mortgage Status in Winchester Bay
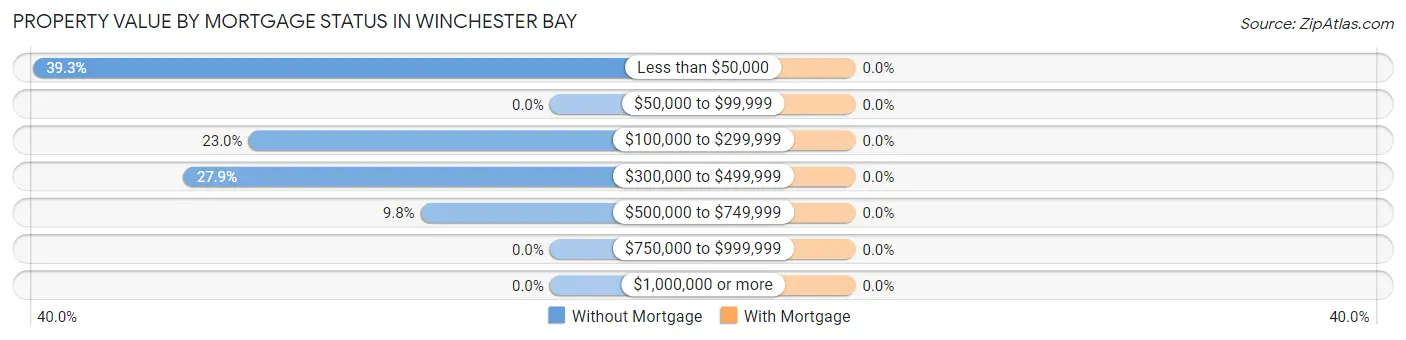
| Property Value | Without Mortgage | With Mortgage |
| Less than $50,000 | 48 (39.3%) | 0 (0.0%) |
| $50,000 to $99,999 | 0 (0.0%) | 0 (0.0%) |
| $100,000 to $299,999 | 28 (23.0%) | 0 (0.0%) |
| $300,000 to $499,999 | 34 (27.9%) | 0 (0.0%) |
| $500,000 to $749,999 | 12 (9.8%) | 0 (0.0%) |
| $750,000 to $999,999 | 0 (0.0%) | 0 (0.0%) |
| $1,000,000 or more | 0 (0.0%) | 0 (0.0%) |
| Total | 122 (100.0%) | 0 (0.0%) |
Household Income by Mortgage Status in Winchester Bay
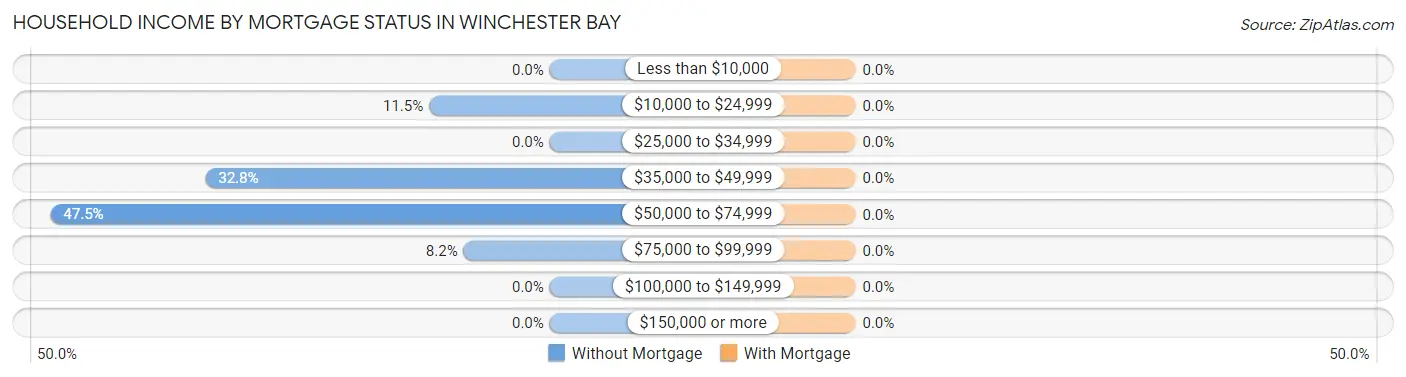
| Household Income | Without Mortgage | With Mortgage |
| Less than $10,000 | 0 (0.0%) | 0 (0.0%) |
| $10,000 to $24,999 | 14 (11.5%) | 0 (0.0%) |
| $25,000 to $34,999 | 0 (0.0%) | 0 (0.0%) |
| $35,000 to $49,999 | 40 (32.8%) | 0 (0.0%) |
| $50,000 to $74,999 | 58 (47.5%) | 0 (0.0%) |
| $75,000 to $99,999 | 10 (8.2%) | 0 (0.0%) |
| $100,000 to $149,999 | 0 (0.0%) | 0 (0.0%) |
| $150,000 or more | 0 (0.0%) | 0 (0.0%) |
| Total | 122 (100.0%) | 0 (0.0%) |
Property Value to Household Income Ratio in Winchester Bay
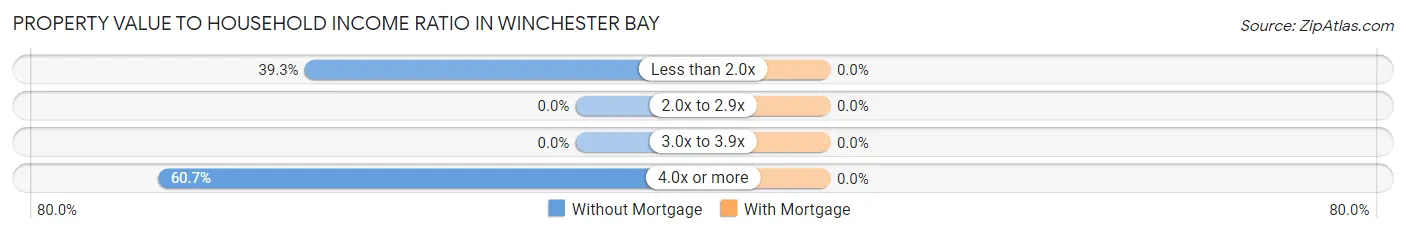
| Value-to-Income Ratio | Without Mortgage | With Mortgage |
| Less than 2.0x | 48 (39.3%) | 0 (0.0%) |
| 2.0x to 2.9x | 0 (0.0%) | 0 (0.0%) |
| 3.0x to 3.9x | 0 (0.0%) | 0 (0.0%) |
| 4.0x or more | 74 (60.7%) | 0 (0.0%) |
| Total | 122 (100.0%) | 0 (0.0%) |
Real Estate Taxes by Mortgage Status in Winchester Bay
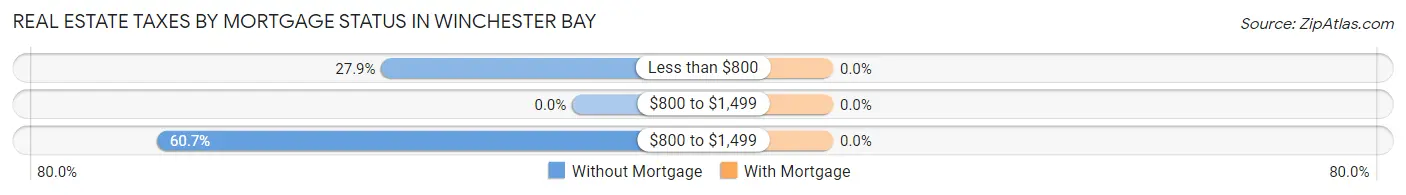
| Property Taxes | Without Mortgage | With Mortgage |
| Less than $800 | 34 (27.9%) | 0 (0.0%) |
| $800 to $1,499 | 0 (0.0%) | 0 (0.0%) |
| $800 to $1,499 | 74 (60.7%) | 0 (0.0%) |
| Total | 122 (100.0%) | 0 (0.0%) |
Health & Disability in Winchester Bay
Health Insurance Coverage by Age in Winchester Bay
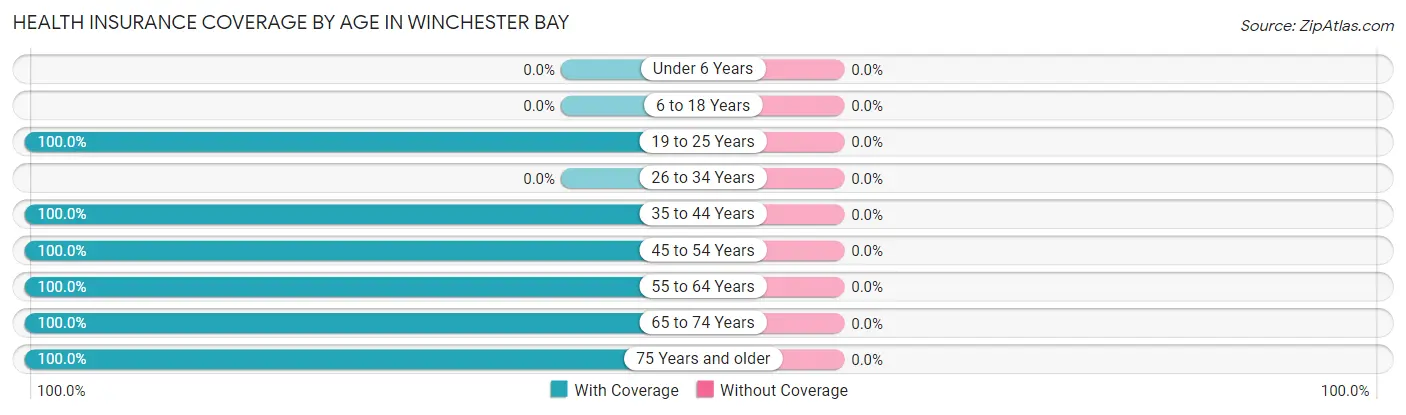
| Age Bracket | With Coverage | Without Coverage |
| Under 6 Years | 0 (0.0%) | 0 (0.0%) |
| 6 to 18 Years | 0 (0.0%) | 0 (0.0%) |
| 19 to 25 Years | 3 (100.0%) | 0 (0.0%) |
| 26 to 34 Years | 0 (0.0%) | 0 (0.0%) |
| 35 to 44 Years | 35 (100.0%) | 0 (0.0%) |
| 45 to 54 Years | 68 (100.0%) | 0 (0.0%) |
| 55 to 64 Years | 14 (100.0%) | 0 (0.0%) |
| 65 to 74 Years | 98 (100.0%) | 0 (0.0%) |
| 75 Years and older | 10 (100.0%) | 0 (0.0%) |
| Total | 228 (100.0%) | 0 (0.0%) |
Health Insurance Coverage by Citizenship Status in Winchester Bay
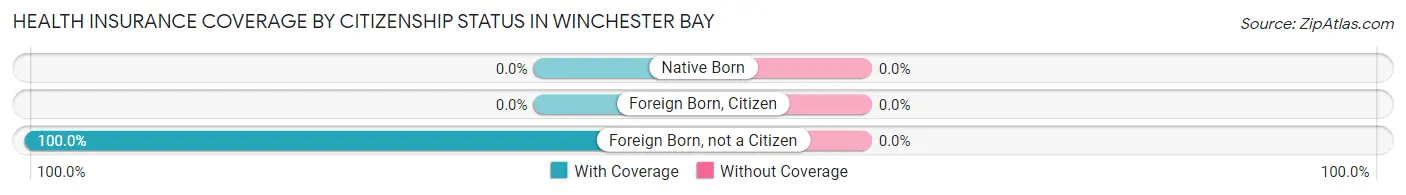
| Citizenship Status | With Coverage | Without Coverage |
| Native Born | 0 (0.0%) | 0 (0.0%) |
| Foreign Born, Citizen | 0 (0.0%) | 0 (0.0%) |
| Foreign Born, not a Citizen | 3 (100.0%) | 0 (0.0%) |
Health Insurance Coverage by Household Income in Winchester Bay
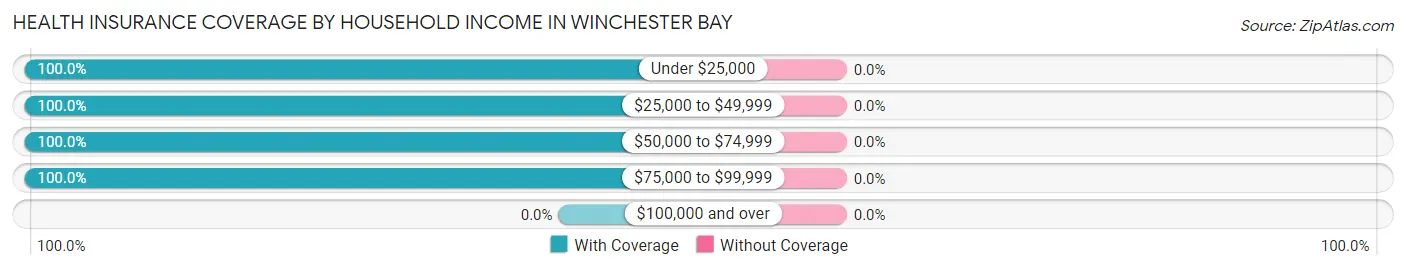
| Household Income | With Coverage | Without Coverage |
| Under $25,000 | 14 (100.0%) | 0 (0.0%) |
| $25,000 to $49,999 | 82 (100.0%) | 0 (0.0%) |
| $50,000 to $74,999 | 116 (100.0%) | 0 (0.0%) |
| $75,000 to $99,999 | 10 (100.0%) | 0 (0.0%) |
| $100,000 and over | 0 (0.0%) | 0 (0.0%) |
Public vs Private Health Insurance Coverage by Age in Winchester Bay
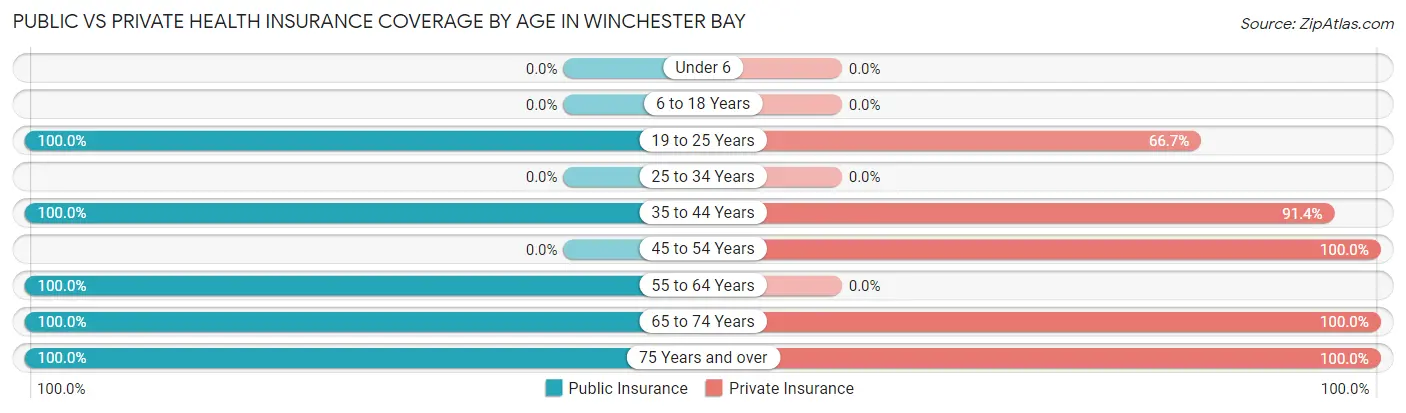
| Age Bracket | Public Insurance | Private Insurance |
| Under 6 | 0 (0.0%) | 0 (0.0%) |
| 6 to 18 Years | 0 (0.0%) | 0 (0.0%) |
| 19 to 25 Years | 3 (100.0%) | 2 (66.7%) |
| 25 to 34 Years | 0 (0.0%) | 0 (0.0%) |
| 35 to 44 Years | 35 (100.0%) | 32 (91.4%) |
| 45 to 54 Years | 0 (0.0%) | 68 (100.0%) |
| 55 to 64 Years | 14 (100.0%) | 0 (0.0%) |
| 65 to 74 Years | 98 (100.0%) | 98 (100.0%) |
| 75 Years and over | 10 (100.0%) | 10 (100.0%) |
| Total | 160 (70.2%) | 210 (92.1%) |
Disability Status by Sex by Age in Winchester Bay
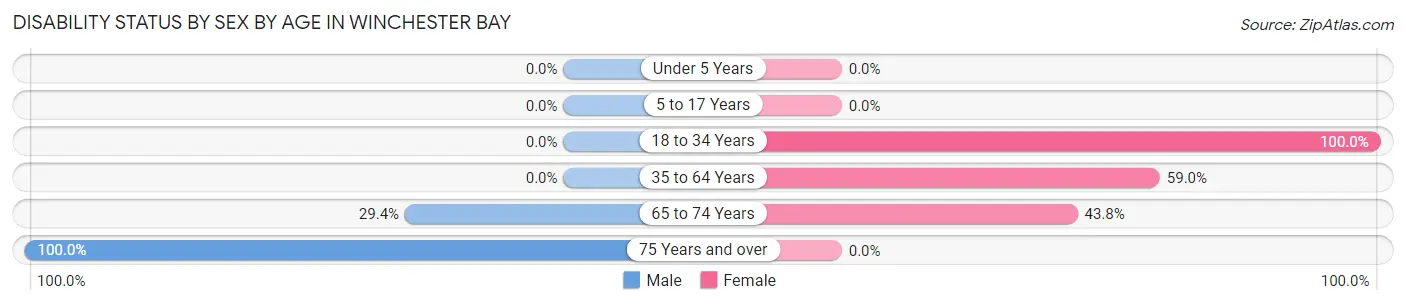
| Age Bracket | Male | Female |
| Under 5 Years | 0 (0.0%) | 0 (0.0%) |
| 5 to 17 Years | 0 (0.0%) | 0 (0.0%) |
| 18 to 34 Years | 0 (0.0%) | 3 (100.0%) |
| 35 to 64 Years | 0 (0.0%) | 49 (59.0%) |
| 65 to 74 Years | 10 (29.4%) | 28 (43.8%) |
| 75 Years and over | 10 (100.0%) | 0 (0.0%) |
Disability Class by Sex by Age in Winchester Bay
Disability Class: Hearing Difficulty
| Age Bracket | Male | Female |
| Under 5 Years | 0 (0.0%) | 0 (0.0%) |
| 5 to 17 Years | 0 (0.0%) | 0 (0.0%) |
| 18 to 34 Years | 0 (0.0%) | 0 (0.0%) |
| 35 to 64 Years | 0 (0.0%) | 0 (0.0%) |
| 65 to 74 Years | 0 (0.0%) | 0 (0.0%) |
| 75 Years and over | 0 (0.0%) | 0 (0.0%) |
Disability Class: Vision Difficulty
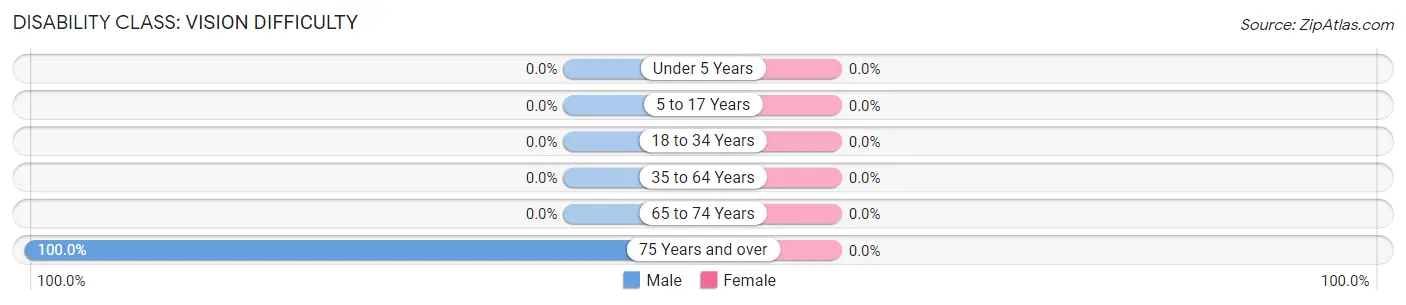
| Age Bracket | Male | Female |
| Under 5 Years | 0 (0.0%) | 0 (0.0%) |
| 5 to 17 Years | 0 (0.0%) | 0 (0.0%) |
| 18 to 34 Years | 0 (0.0%) | 0 (0.0%) |
| 35 to 64 Years | 0 (0.0%) | 0 (0.0%) |
| 65 to 74 Years | 0 (0.0%) | 0 (0.0%) |
| 75 Years and over | 10 (100.0%) | 0 (0.0%) |
Disability Class: Cognitive Difficulty
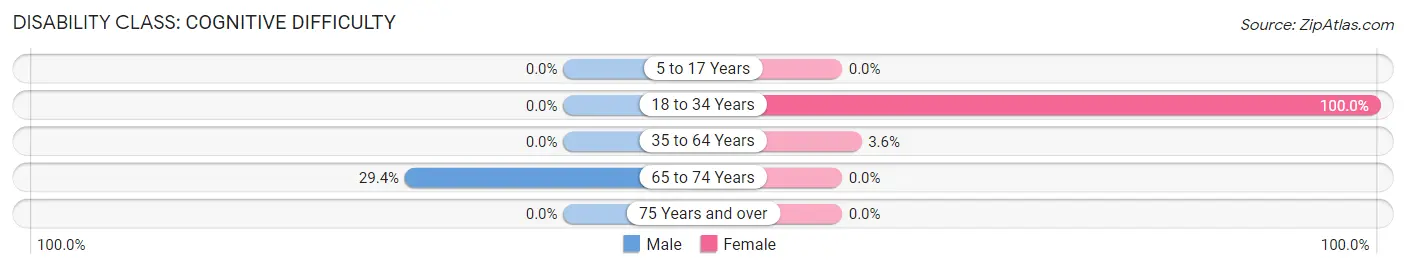
| Age Bracket | Male | Female |
| 5 to 17 Years | 0 (0.0%) | 0 (0.0%) |
| 18 to 34 Years | 0 (0.0%) | 3 (100.0%) |
| 35 to 64 Years | 0 (0.0%) | 3 (3.6%) |
| 65 to 74 Years | 10 (29.4%) | 0 (0.0%) |
| 75 Years and over | 0 (0.0%) | 0 (0.0%) |
Disability Class: Ambulatory Difficulty
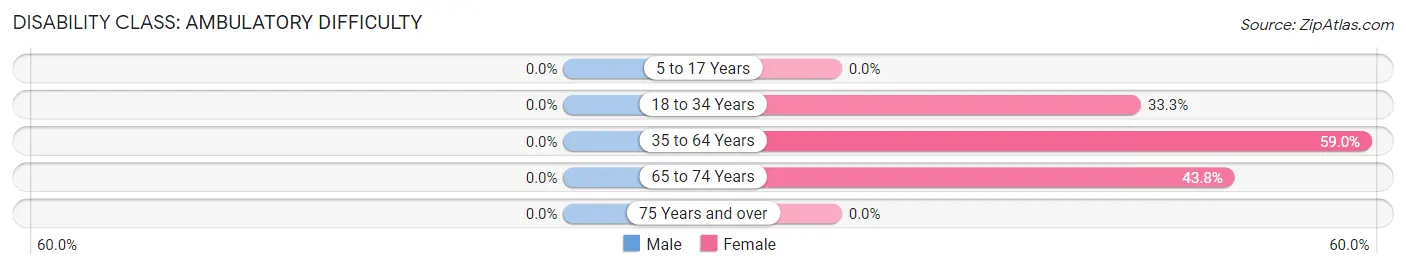
| Age Bracket | Male | Female |
| 5 to 17 Years | 0 (0.0%) | 0 (0.0%) |
| 18 to 34 Years | 0 (0.0%) | 1 (33.3%) |
| 35 to 64 Years | 0 (0.0%) | 49 (59.0%) |
| 65 to 74 Years | 0 (0.0%) | 28 (43.8%) |
| 75 Years and over | 0 (0.0%) | 0 (0.0%) |
Disability Class: Self-Care Difficulty
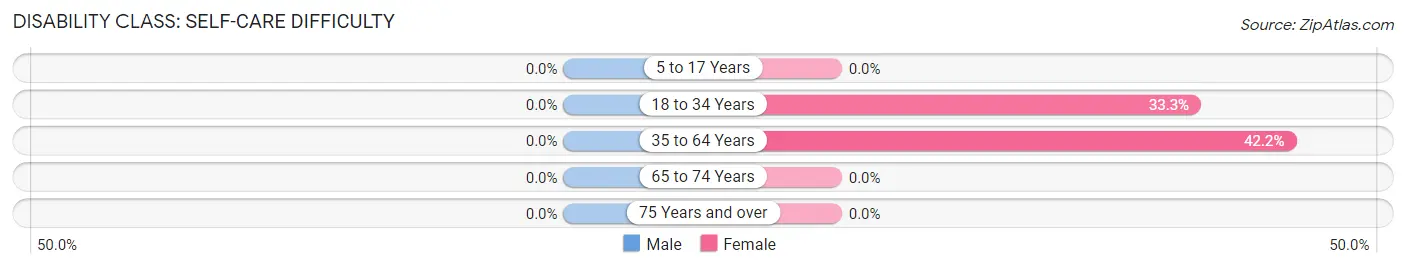
| Age Bracket | Male | Female |
| 5 to 17 Years | 0 (0.0%) | 0 (0.0%) |
| 18 to 34 Years | 0 (0.0%) | 1 (33.3%) |
| 35 to 64 Years | 0 (0.0%) | 35 (42.2%) |
| 65 to 74 Years | 0 (0.0%) | 0 (0.0%) |
| 75 Years and over | 0 (0.0%) | 0 (0.0%) |
Technology Access in Winchester Bay
Computing Device Access in Winchester Bay
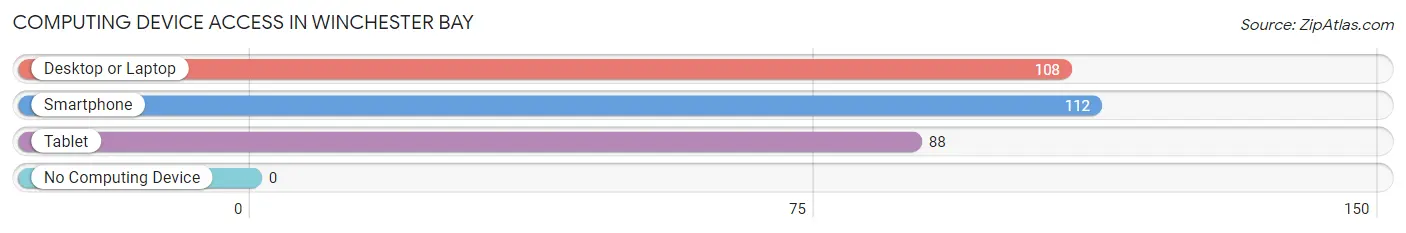
| Device Type | # Households | % Households |
| Desktop or Laptop | 108 | 88.5% |
| Smartphone | 112 | 91.8% |
| Tablet | 88 | 72.1% |
| No Computing Device | 0 | 0.0% |
| Total | 122 | 100.0% |
Internet Access in Winchester Bay
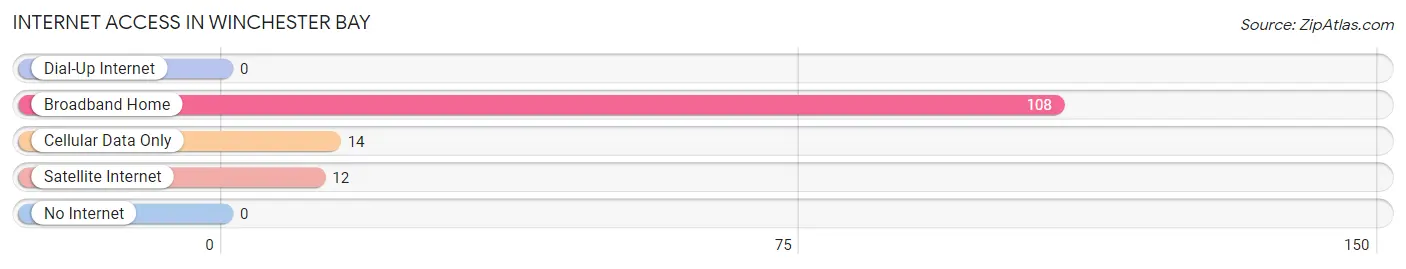
| Internet Type | # Households | % Households |
| Dial-Up Internet | 0 | 0.0% |
| Broadband Home | 108 | 88.5% |
| Cellular Data Only | 14 | 11.5% |
| Satellite Internet | 12 | 9.8% |
| No Internet | 0 | 0.0% |
| Total | 122 | 100.0% |
Winchester Bay Summary
Winchester Bay, Oregon is a small coastal community located in the Umpqua River estuary in Douglas County, Oregon. It is situated on the south side of the Umpqua River, approximately 10 miles south of Reedsport and 25 miles north of Coos Bay. The town is a popular destination for fishing, crabbing, and other recreational activities.
History
The area now known as Winchester Bay was first inhabited by the Coos, Lower Umpqua, and Siuslaw Native American tribes. The first European settlers arrived in the area in the late 1800s, and the town was officially established in 1891. The town was named after the Winchester family, who were among the first settlers in the area.
The town was initially a fishing and logging community, and the local economy was largely dependent on the timber industry. In the early 1900s, the town began to develop as a tourist destination, and the Winchester Bay Marina was built in the 1930s. The marina is still in operation today and is a popular destination for fishing, crabbing, and other recreational activities.
Geography
Winchester Bay is located in the Umpqua River estuary in Douglas County, Oregon. The town is situated on the south side of the Umpqua River, approximately 10 miles south of Reedsport and 25 miles north of Coos Bay. The town is surrounded by the Umpqua National Forest and is close to the Oregon Dunes National Recreation Area.
The climate in Winchester Bay is mild and temperate, with average temperatures ranging from the mid-30s in the winter to the mid-70s in the summer. The area receives an average of 40 inches of precipitation per year, with most of the precipitation occurring in the winter months.
Economy
The economy of Winchester Bay is largely dependent on tourism and recreation. The town is a popular destination for fishing, crabbing, and other recreational activities, and the Winchester Bay Marina is a major attraction. The town is also home to several restaurants, shops, and lodging establishments.
The town is also home to several commercial fishing operations, and the local economy is supported by the timber industry. The Umpqua National Forest is a major source of timber for the local economy, and the area is also home to several logging companies.
Demographics
As of the 2010 census, the population of Winchester Bay was 1,072. The population is predominantly white (94.3%), with small percentages of Native American (2.2%), Asian (1.2%), and African American (0.7%) residents. The median household income in the town is $37,500, and the median age is 44.
Conclusion
Winchester Bay, Oregon is a small coastal community located in the Umpqua River estuary in Douglas County, Oregon. The town was first inhabited by Native American tribes and was officially established in 1891. The town is a popular destination for fishing, crabbing, and other recreational activities, and the local economy is largely dependent on tourism and recreation. The population of Winchester Bay is predominantly white, with small percentages of Native American, Asian, and African American residents.
Common Questions
What is Per Capita Income in Winchester Bay?
Per Capita income in Winchester Bay is $27,671.
What is the Median Family Income in Winchester Bay?
Median Family Income in Winchester Bay is $45,833.
What is the Median Household income in Winchester Bay?
Median Household Income in Winchester Bay is $50,515.
What is Inequality or Gini Index in Winchester Bay?
Inequality or Gini Index in Winchester Bay is 0.19.
What is the Total Population of Winchester Bay?
Total Population of Winchester Bay is 237.
What is the Total Male Population of Winchester Bay?
Total Male Population of Winchester Bay is 87.
What is the Total Female Population of Winchester Bay?
Total Female Population of Winchester Bay is 150.
What is the Ratio of Males per 100 Females in Winchester Bay?
There are 58.00 Males per 100 Females in Winchester Bay.
What is the Ratio of Females per 100 Males in Winchester Bay?
There are 172.41 Females per 100 Males in Winchester Bay.
What is the Median Population Age in Winchester Bay?
Median Population Age in Winchester Bay is 59.3 Years.
What is the Average Family Size in Winchester Bay
Average Family Size in Winchester Bay is 2.0 People.
What is the Average Household Size in Winchester Bay
Average Household Size in Winchester Bay is 1.8 People.
How Large is the Labor Force in Winchester Bay?
There are 77 People in the Labor Forcein in Winchester Bay.
What is the Percentage of People in the Labor Force in Winchester Bay?
32.5% of People are in the Labor Force in Winchester Bay.
What is the Unemployment Rate in Winchester Bay?
Unemployment Rate in Winchester Bay is 50.0%.