Evergreen, MO Map & Demographics
Evergreen Map
Evergreen Overview
$16,751
PER CAPITA INCOME
$43,828
AVG FAMILY INCOME
$43,984
AVG HOUSEHOLD INCOME
0.15
INEQUALITY / GINI INDEX
95
TOTAL POPULATION
17
MALE POPULATION
78
FEMALE POPULATION
21.79
MALES / 100 FEMALES
458.82
FEMALES / 100 MALES
33.5
MEDIAN AGE
2.7
AVG FAMILY SIZE
3.3
AVG HOUSEHOLD SIZE
27
LABOR FORCE [ PEOPLE ]
35.5%
PERCENT IN LABOR FORCE
Income in Evergreen
Income Overview in Evergreen
Per Capita Income in Evergreen is $16,751, while median incomes of families and households are $43,828 and $43,984 respectively.
| Characteristic | Number | Measure |
| Per Capita Income | 95 | $16,751 |
| Median Family Income | 27 | $43,828 |
| Mean Family Income | 27 | $46,037 |
| Median Household Income | 29 | $43,984 |
| Mean Household Income | 29 | $47,969 |
| Income Deficit | 27 | $0 |
| Wage / Income Gap (%) | 95 | 0.00% |
| Wage / Income Gap ($) | 95 | 100.00¢ per $1 |
| Gini / Inequality Index | 95 | 0.15 |
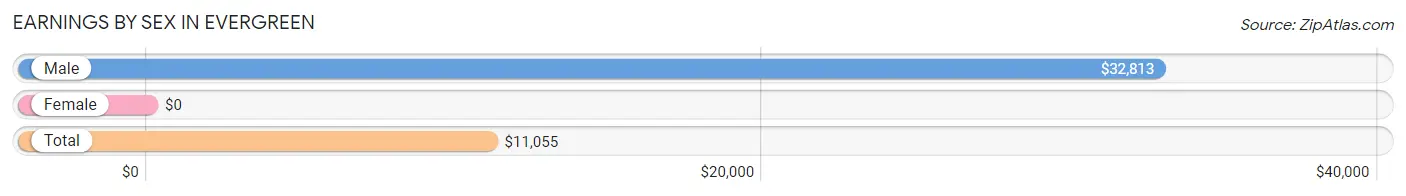
Earnings by Sex in Evergreen
| Sex | Number | Average Earnings |
| Male | 11 (18.6%) | $32,813 |
| Female | 48 (81.4%) | $0 |
| Total | 59 (100.0%) | $11,055 |
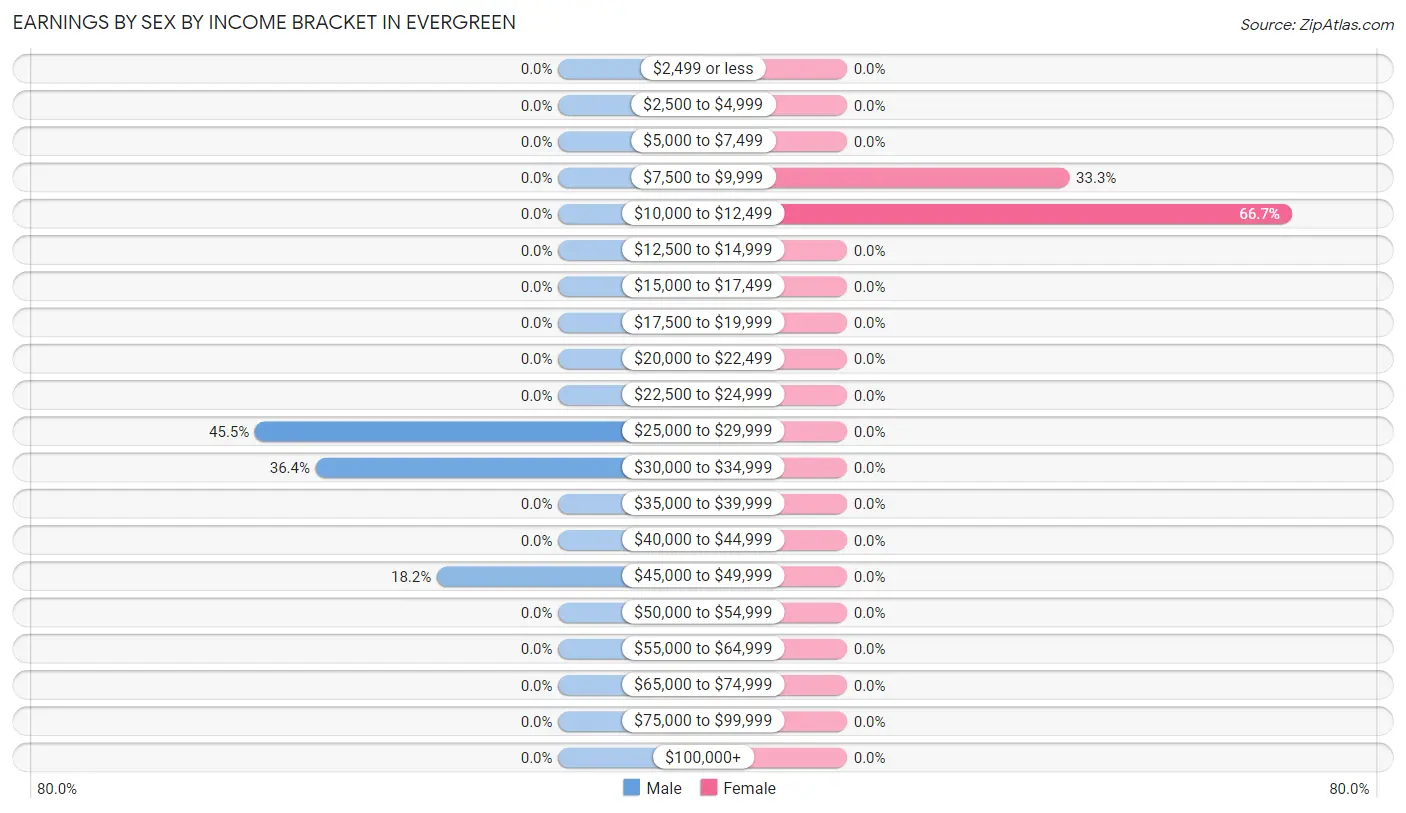
Earnings by Sex by Income Bracket in Evergreen
The most common earnings brackets in Evergreen are $25,000 to $29,999 for men (5 | 45.5%) and $10,000 to $12,499 for women (32 | 66.7%).
| Income | Male | Female |
| $2,499 or less | 0 (0.0%) | 0 (0.0%) |
| $2,500 to $4,999 | 0 (0.0%) | 0 (0.0%) |
| $5,000 to $7,499 | 0 (0.0%) | 0 (0.0%) |
| $7,500 to $9,999 | 0 (0.0%) | 16 (33.3%) |
| $10,000 to $12,499 | 0 (0.0%) | 32 (66.7%) |
| $12,500 to $14,999 | 0 (0.0%) | 0 (0.0%) |
| $15,000 to $17,499 | 0 (0.0%) | 0 (0.0%) |
| $17,500 to $19,999 | 0 (0.0%) | 0 (0.0%) |
| $20,000 to $22,499 | 0 (0.0%) | 0 (0.0%) |
| $22,500 to $24,999 | 0 (0.0%) | 0 (0.0%) |
| $25,000 to $29,999 | 5 (45.5%) | 0 (0.0%) |
| $30,000 to $34,999 | 4 (36.4%) | 0 (0.0%) |
| $35,000 to $39,999 | 0 (0.0%) | 0 (0.0%) |
| $40,000 to $44,999 | 0 (0.0%) | 0 (0.0%) |
| $45,000 to $49,999 | 2 (18.2%) | 0 (0.0%) |
| $50,000 to $54,999 | 0 (0.0%) | 0 (0.0%) |
| $55,000 to $64,999 | 0 (0.0%) | 0 (0.0%) |
| $65,000 to $74,999 | 0 (0.0%) | 0 (0.0%) |
| $75,000 to $99,999 | 0 (0.0%) | 0 (0.0%) |
| $100,000+ | 0 (0.0%) | 0 (0.0%) |
| Total | 11 (100.0%) | 48 (100.0%) |
Earnings by Sex by Educational Attainment in Evergreen
| Educational Attainment | Male Income | Female Income |
| Less than High School | - | - |
| High School Diploma | - | - |
| College or Associate's Degree | - | - |
| Bachelor's Degree | - | - |
| Graduate Degree | - | - |
| Total | - | - |
Family Income in Evergreen
Family Income Brackets in Evergreen
According to the Evergreen family income data, there are 18 families falling into the $35,000 to $49,999 income range, which is the most common income bracket and makes up 66.7% of all families.
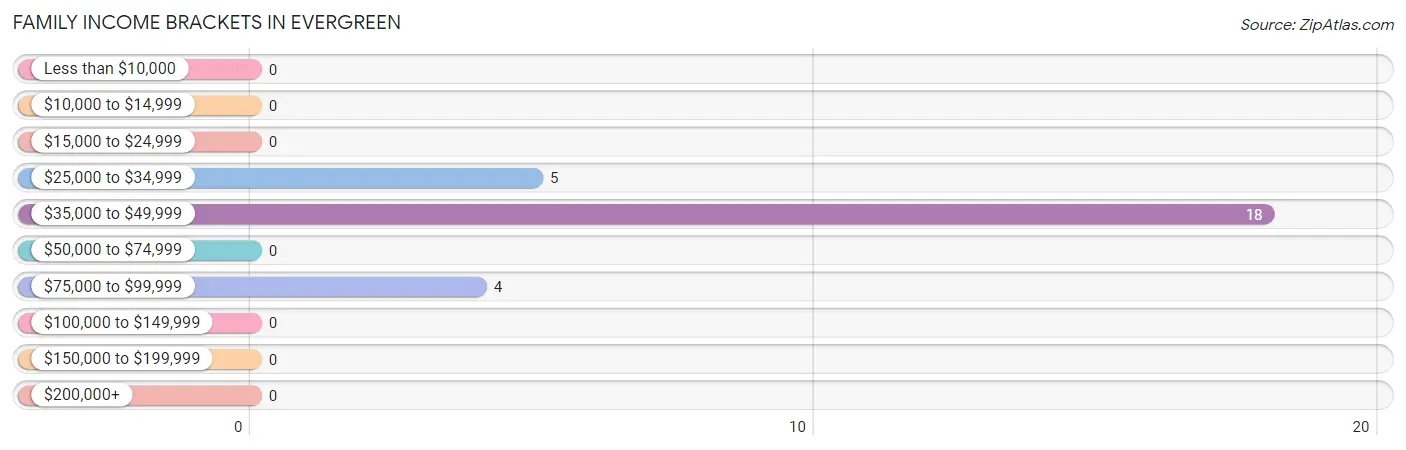
| Income Bracket | # Families | % Families |
| Less than $10,000 | 0 | 0.0% |
| $10,000 to $14,999 | 0 | 0.0% |
| $15,000 to $24,999 | 0 | 0.0% |
| $25,000 to $34,999 | 5 | 18.5% |
| $35,000 to $49,999 | 18 | 66.7% |
| $50,000 to $74,999 | 0 | 0.0% |
| $75,000 to $99,999 | 4 | 14.8% |
| $100,000 to $149,999 | 0 | 0.0% |
| $150,000 to $199,999 | 0 | 0.0% |
| $200,000+ | 0 | 0.0% |
Family Income by Famaliy Size in Evergreen
2-person families (23 | 85.2%) account for the highest median family income in Evergreen with $43,516 per family, while 2-person families (23 | 85.2%) have the highest median income of $21,758 per family member.
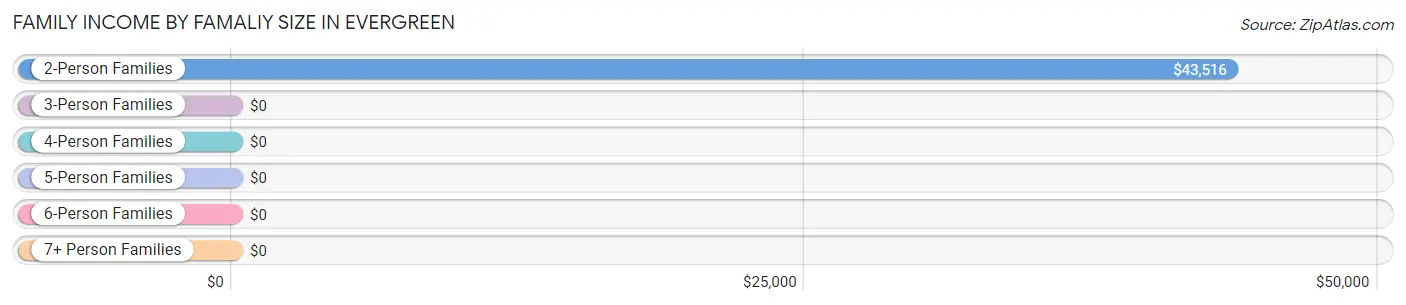
| Income Bracket | # Families | Median Income |
| 2-Person Families | 23 (85.2%) | $43,516 |
| 3-Person Families | 0 (0.0%) | $0 |
| 4-Person Families | 4 (14.8%) | $0 |
| 5-Person Families | 0 (0.0%) | $0 |
| 6-Person Families | 0 (0.0%) | $0 |
| 7+ Person Families | 0 (0.0%) | $0 |
| Total | 27 (100.0%) | $43,828 |
Family Income by Number of Earners in Evergreen
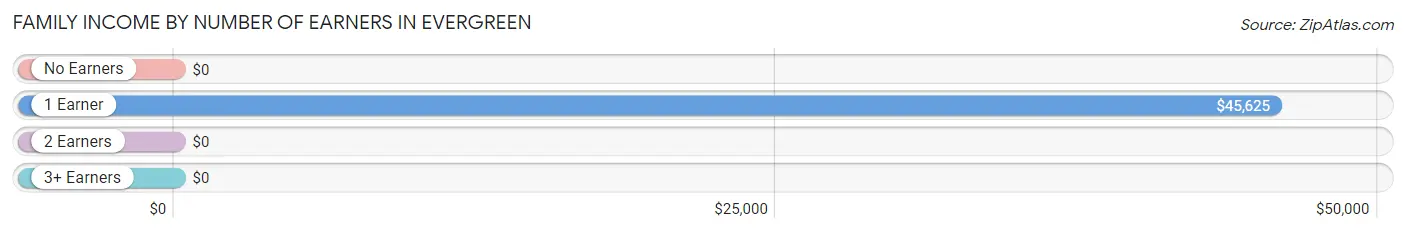
| Number of Earners | # Families | Median Income |
| No Earners | 0 (0.0%) | $0 |
| 1 Earner | 11 (40.7%) | $45,625 |
| 2 Earners | 16 (59.3%) | $0 |
| 3+ Earners | 0 (0.0%) | $0 |
| Total | 27 (100.0%) | $43,828 |
Household Income in Evergreen
Household Income Brackets in Evergreen
With 18 households falling in the category, the $35,000 to $49,999 income range is the most frequent in Evergreen, accounting for 62.1% of all households.
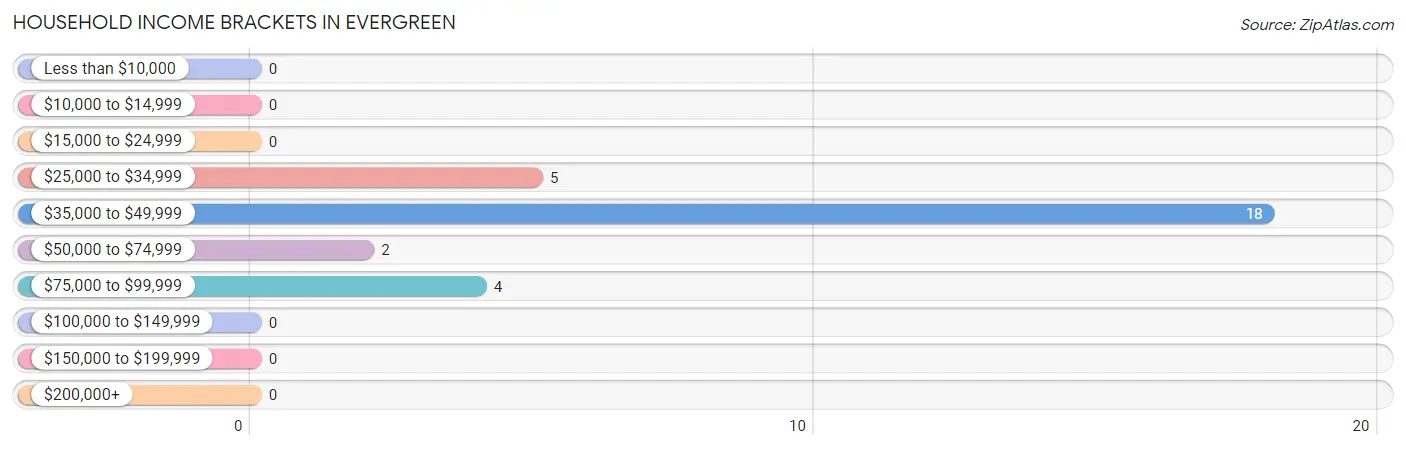
| Income Bracket | # Households | % Households |
| Less than $10,000 | 0 | 0.0% |
| $10,000 to $14,999 | 0 | 0.0% |
| $15,000 to $24,999 | 0 | 0.0% |
| $25,000 to $34,999 | 5 | 17.2% |
| $35,000 to $49,999 | 18 | 62.1% |
| $50,000 to $74,999 | 2 | 6.9% |
| $75,000 to $99,999 | 4 | 13.8% |
| $100,000 to $149,999 | 0 | 0.0% |
| $150,000 to $199,999 | 0 | 0.0% |
| $200,000+ | 0 | 0.0% |
Household Income by Householder Age in Evergreen
The median household income in Evergreen is $43,984, with the highest median household income of $44,219 found in the 65+ years age bracket for the primary householder. A total of 22 households (75.9%) fall into this category. Meanwhile, the 15 to 24 years age bracket for the primary householder has the lowest median household income of $0, with 5 households (17.2%) in this group.
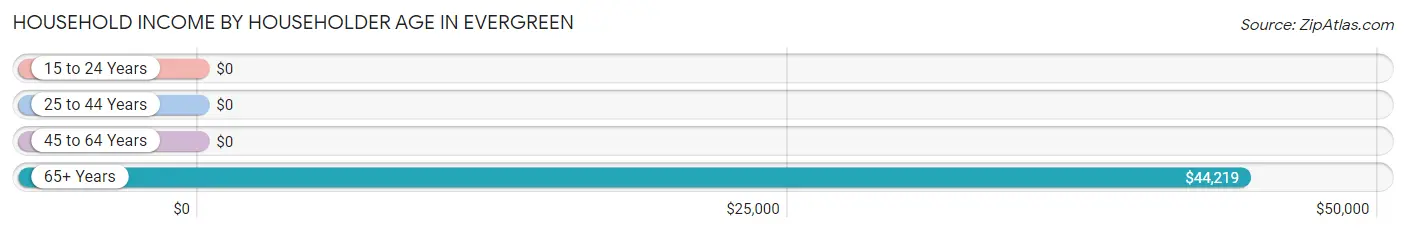
| Income Bracket | # Households | Median Income |
| 15 to 24 Years | 5 (17.2%) | $0 |
| 25 to 44 Years | 0 (0.0%) | $0 |
| 45 to 64 Years | 2 (6.9%) | $0 |
| 65+ Years | 22 (75.9%) | $44,219 |
| Total | 29 (100.0%) | $43,984 |
Poverty in Evergreen
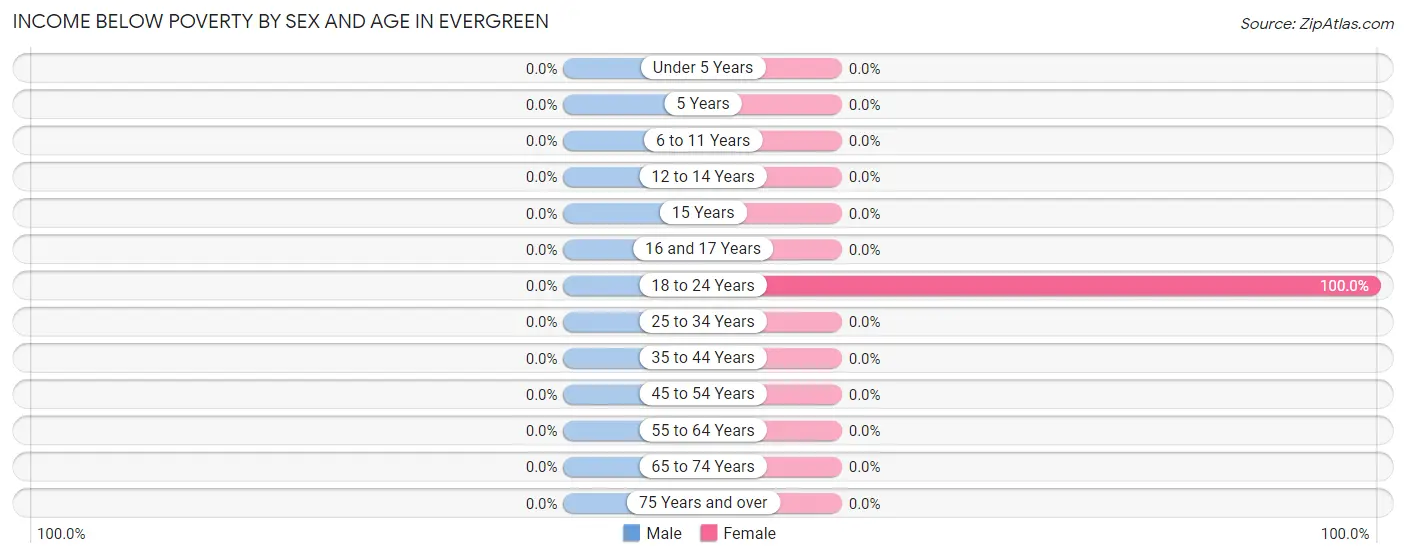
Income Below Poverty by Sex and Age in Evergreen
| Age Bracket | Male | Female |
| Under 5 Years | 0 (0.0%) | 0 (0.0%) |
| 5 Years | 0 (0.0%) | 0 (0.0%) |
| 6 to 11 Years | 0 (0.0%) | 0 (0.0%) |
| 12 to 14 Years | 0 (0.0%) | 0 (0.0%) |
| 15 Years | 0 (0.0%) | 0 (0.0%) |
| 16 and 17 Years | 0 (0.0%) | 0 (0.0%) |
| 18 to 24 Years | 0 (0.0%) | 5 (100.0%) |
| 25 to 34 Years | 0 (0.0%) | 0 (0.0%) |
| 35 to 44 Years | 0 (0.0%) | 0 (0.0%) |
| 45 to 54 Years | 0 (0.0%) | 0 (0.0%) |
| 55 to 64 Years | 0 (0.0%) | 0 (0.0%) |
| 65 to 74 Years | 0 (0.0%) | 0 (0.0%) |
| 75 Years and over | 0 (0.0%) | 0 (0.0%) |
| Total | 0 (0.0%) | 5 (7.7%) |
Income Above Poverty by Sex and Age in Evergreen
According to the poverty statistics in Evergreen, males aged 15 years and females aged under 5 years are the age groups that are most secure financially, with 100.0% of males and 100.0% of females in these age groups living above the poverty line.
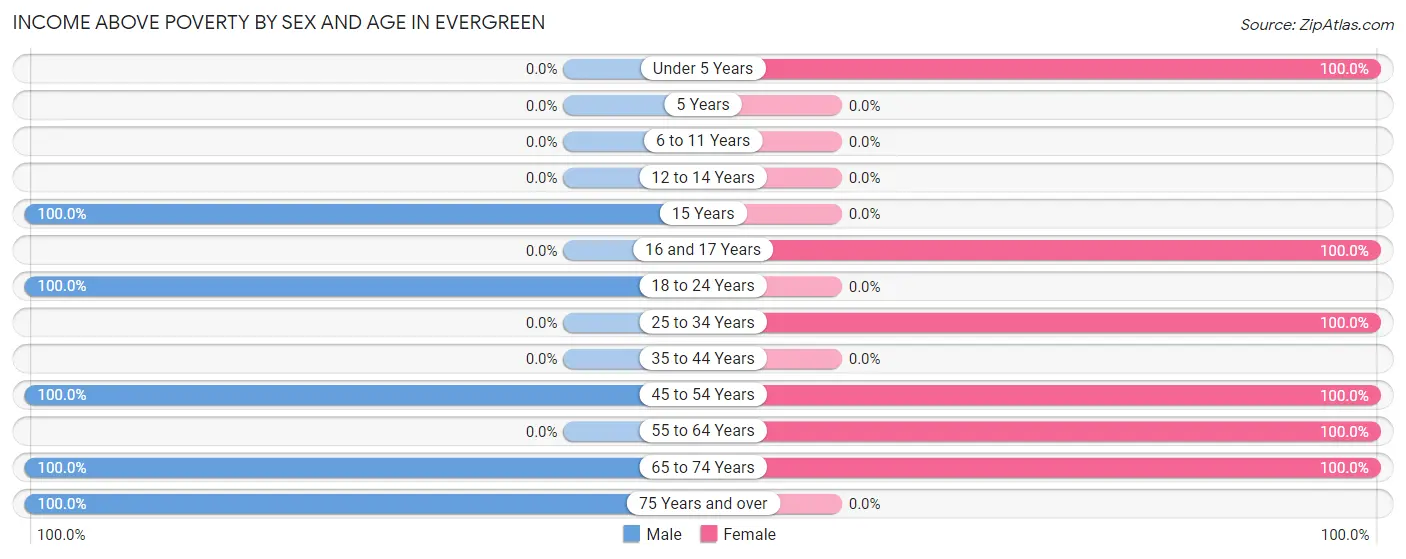
| Age Bracket | Male | Female |
| Under 5 Years | 0 (0.0%) | 3 (100.0%) |
| 5 Years | 0 (0.0%) | 0 (0.0%) |
| 6 to 11 Years | 0 (0.0%) | 0 (0.0%) |
| 12 to 14 Years | 0 (0.0%) | 0 (0.0%) |
| 15 Years | 3 (100.0%) | 0 (0.0%) |
| 16 and 17 Years | 0 (0.0%) | 4 (100.0%) |
| 18 to 24 Years | 5 (100.0%) | 0 (0.0%) |
| 25 to 34 Years | 0 (0.0%) | 32 (100.0%) |
| 35 to 44 Years | 0 (0.0%) | 0 (0.0%) |
| 45 to 54 Years | 2 (100.0%) | 2 (100.0%) |
| 55 to 64 Years | 0 (0.0%) | 3 (100.0%) |
| 65 to 74 Years | 6 (100.0%) | 16 (100.0%) |
| 75 Years and over | 1 (100.0%) | 0 (0.0%) |
| Total | 17 (100.0%) | 60 (92.3%) |
Income Below Poverty Among Married-Couple Families in Evergreen
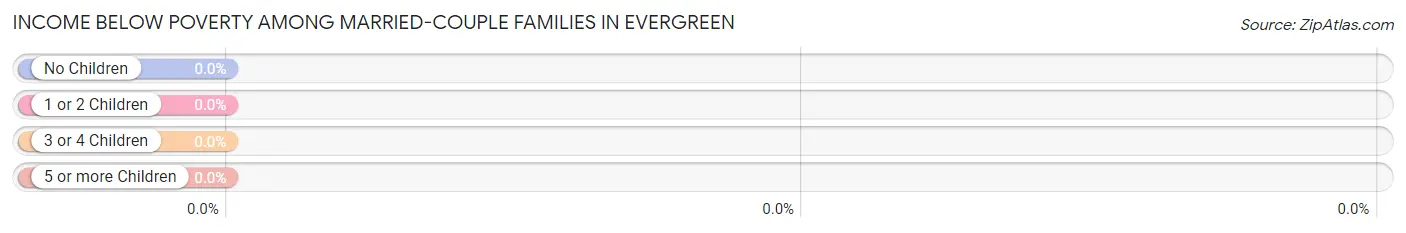
| Children | Above Poverty | Below Poverty |
| No Children | 2 (100.0%) | 0 (0.0%) |
| 1 or 2 Children | 4 (100.0%) | 0 (0.0%) |
| 3 or 4 Children | 0 (0.0%) | 0 (0.0%) |
| 5 or more Children | 0 (0.0%) | 0 (0.0%) |
| Total | 6 (100.0%) | 0 (0.0%) |
Income Below Poverty Among Single-Parent Households in Evergreen
| Children | Single Father | Single Mother |
| No Children | 0 (0.0%) | 0 (0.0%) |
| 1 or 2 Children | 0 (0.0%) | 0 (0.0%) |
| 3 or 4 Children | 0 (0.0%) | 0 (0.0%) |
| 5 or more Children | 0 (0.0%) | 0 (0.0%) |
| Total | 0 (0.0%) | 0 (0.0%) |
Income Below Poverty Among Married-Couple vs Single-Parent Households in Evergreen
| Children | Married-Couple Families | Single-Parent Households |
| No Children | 0 (0.0%) | 0 (0.0%) |
| 1 or 2 Children | 0 (0.0%) | 0 (0.0%) |
| 3 or 4 Children | 0 (0.0%) | 0 (0.0%) |
| 5 or more Children | 0 (0.0%) | 0 (0.0%) |
| Total | 0 (0.0%) | 0 (0.0%) |
Race in Evergreen
The most populous races in Evergreen are White / Caucasian (63 | 66.3%), and Two or more Races (32 | 33.7%).
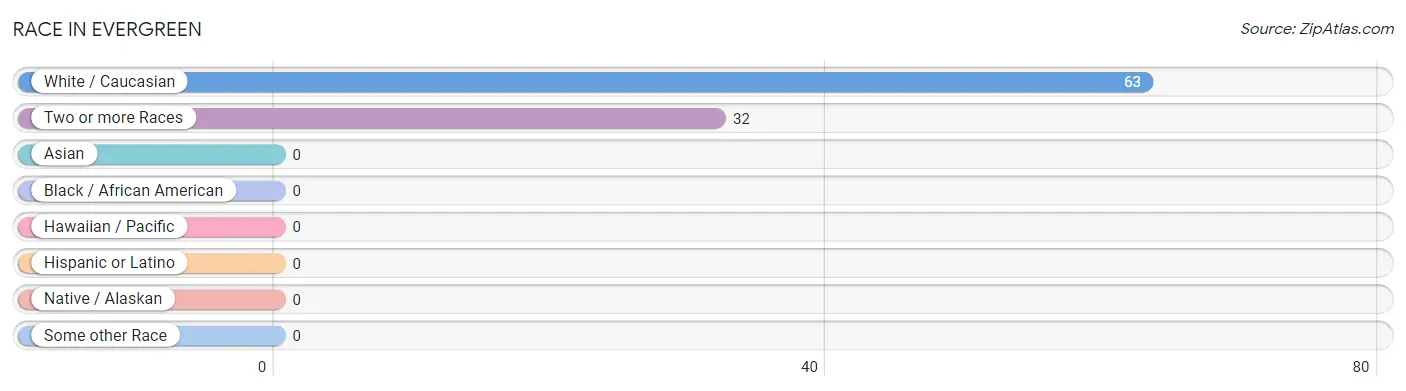
| Race | # Population | % Population |
| Asian | 0 | 0.0% |
| Black / African American | 0 | 0.0% |
| Hawaiian / Pacific | 0 | 0.0% |
| Hispanic or Latino | 0 | 0.0% |
| Native / Alaskan | 0 | 0.0% |
| White / Caucasian | 63 | 66.3% |
| Two or more Races | 32 | 33.7% |
| Some other Race | 0 | 0.0% |
| Total | 95 | 100.0% |
Ancestry in Evergreen
The most populous ancestries reported in Evergreen are Irish (79 | 83.2%), French (61 | 64.2%), German (8 | 8.4%), Italian (5 | 5.3%), and Scandinavian (3 | 3.2%), together accounting for 164.2% of all Evergreen residents.
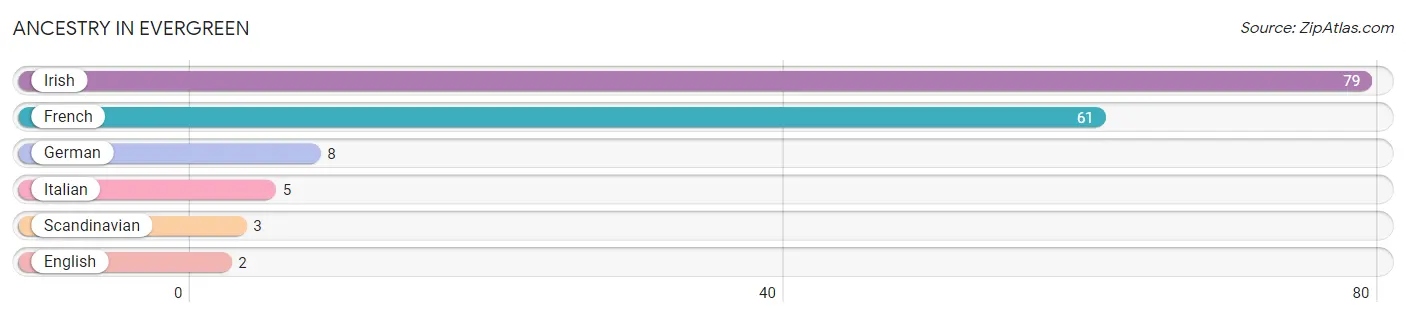
| Ancestry | # Population | % Population |
| English | 2 | 2.1% |
| French | 61 | 64.2% |
| German | 8 | 8.4% |
| Irish | 79 | 83.2% |
| Italian | 5 | 5.3% |
| Scandinavian | 3 | 3.2% | View All 6 Rows |
Immigrants in Evergreen

| Immigration Origin | # Population | % Population | View All 0 Rows |
Sex and Age in Evergreen
Sex and Age in Evergreen
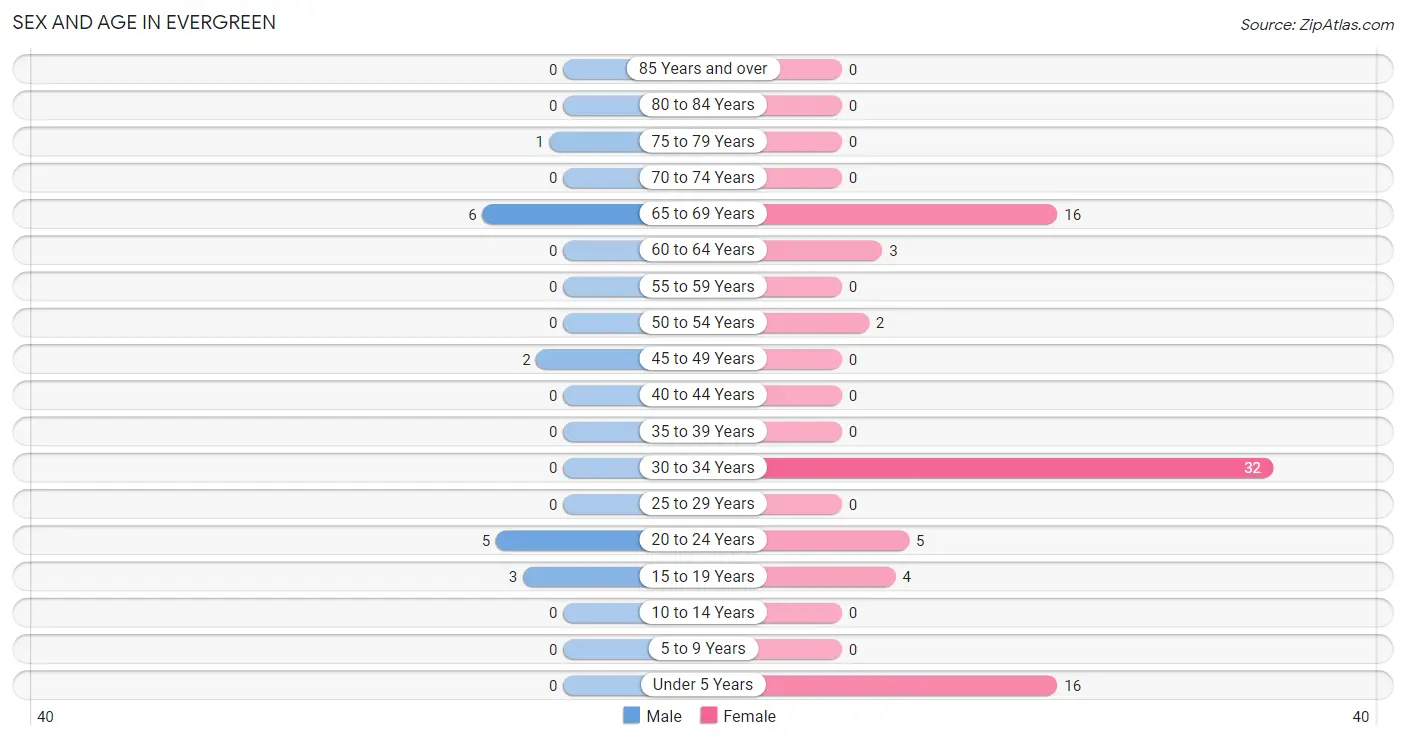
The most populous age groups in Evergreen are 65 to 69 Years (6 | 35.3%) for men and 30 to 34 Years (32 | 41.0%) for women.
| Age Bracket | Male | Female |
| Under 5 Years | 0 (0.0%) | 16 (20.5%) |
| 5 to 9 Years | 0 (0.0%) | 0 (0.0%) |
| 10 to 14 Years | 0 (0.0%) | 0 (0.0%) |
| 15 to 19 Years | 3 (17.6%) | 4 (5.1%) |
| 20 to 24 Years | 5 (29.4%) | 5 (6.4%) |
| 25 to 29 Years | 0 (0.0%) | 0 (0.0%) |
| 30 to 34 Years | 0 (0.0%) | 32 (41.0%) |
| 35 to 39 Years | 0 (0.0%) | 0 (0.0%) |
| 40 to 44 Years | 0 (0.0%) | 0 (0.0%) |
| 45 to 49 Years | 2 (11.8%) | 0 (0.0%) |
| 50 to 54 Years | 0 (0.0%) | 2 (2.6%) |
| 55 to 59 Years | 0 (0.0%) | 0 (0.0%) |
| 60 to 64 Years | 0 (0.0%) | 3 (3.8%) |
| 65 to 69 Years | 6 (35.3%) | 16 (20.5%) |
| 70 to 74 Years | 0 (0.0%) | 0 (0.0%) |
| 75 to 79 Years | 1 (5.9%) | 0 (0.0%) |
| 80 to 84 Years | 0 (0.0%) | 0 (0.0%) |
| 85 Years and over | 0 (0.0%) | 0 (0.0%) |
| Total | 17 (100.0%) | 78 (100.0%) |
Families and Households in Evergreen
Median Family Size in Evergreen
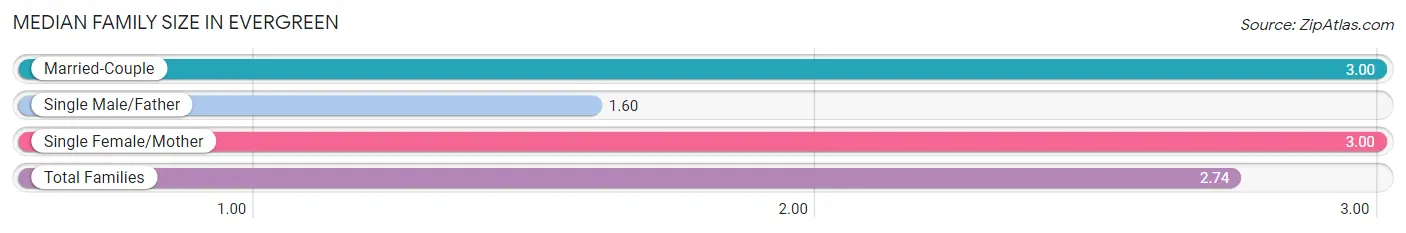
The median family size in Evergreen is 2.74 persons per family, with married-couple families (6 | 22.2%) accounting for the largest median family size of 3 persons per family. On the other hand, single male/father families (5 | 18.5%) represent the smallest median family size with 1.60 persons per family.
| Family Type | # Families | Family Size |
| Married-Couple | 6 (22.2%) | 3.00 |
| Single Male/Father | 5 (18.5%) | 1.60 |
| Single Female/Mother | 16 (59.3%) | 3.00 |
| Total Families | 27 (100.0%) | 2.74 |
Median Household Size in Evergreen
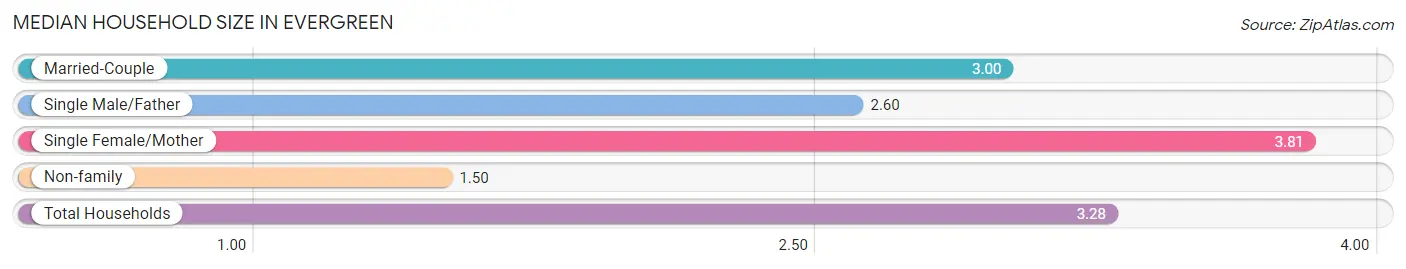
The median household size in Evergreen is 3.28 persons per household, with single female/mother households (16 | 55.2%) accounting for the largest median household size of 3.81 persons per household. non-family households (2 | 6.9%) represent the smallest median household size with 1.50 persons per household.
| Household Type | # Households | Household Size |
| Married-Couple | 6 (20.7%) | 3.00 |
| Single Male/Father | 5 (17.2%) | 2.60 |
| Single Female/Mother | 16 (55.2%) | 3.81 |
| Non-family | 2 (6.9%) | 1.50 |
| Total Households | 29 (100.0%) | 3.28 |
Household Size by Marriage Status in Evergreen
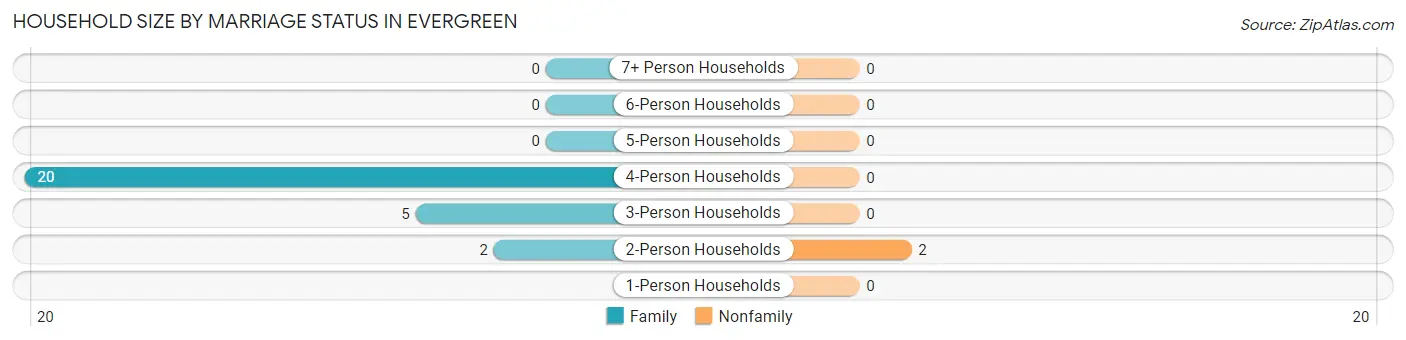
Out of a total of 29 households in Evergreen, 27 (93.1%) are family households, while 2 (6.9%) are nonfamily households. The most numerous type of family households are 4-person households, comprising 20, and the most common type of nonfamily households are 2-person households, comprising 2.
| Household Size | Family Households | Nonfamily Households |
| 1-Person Households | - | 0 (0.0%) |
| 2-Person Households | 2 (6.9%) | 2 (6.9%) |
| 3-Person Households | 5 (17.2%) | 0 (0.0%) |
| 4-Person Households | 20 (69.0%) | 0 (0.0%) |
| 5-Person Households | 0 (0.0%) | 0 (0.0%) |
| 6-Person Households | 0 (0.0%) | 0 (0.0%) |
| 7+ Person Households | 0 (0.0%) | 0 (0.0%) |
| Total | 27 (93.1%) | 2 (6.9%) |
Female Fertility in Evergreen
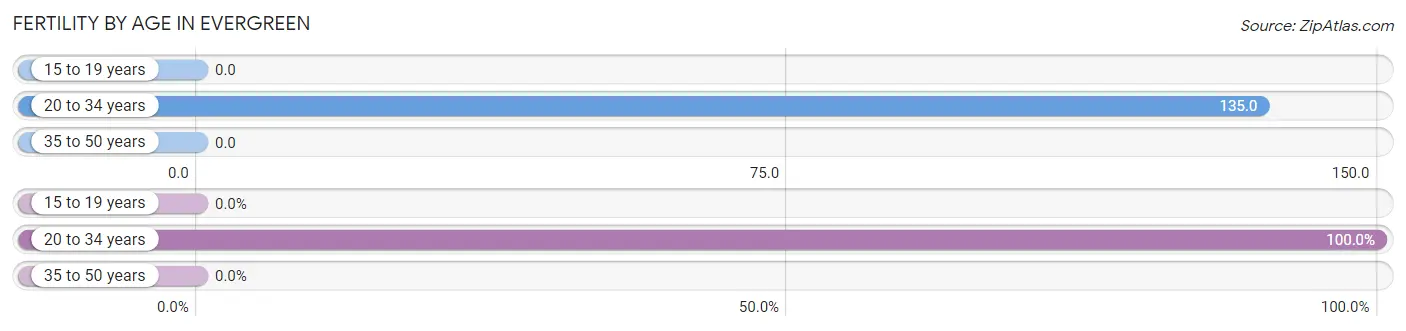
Fertility by Age in Evergreen
Average fertility rate in Evergreen is 122.0 births per 1,000 women. Women in the age bracket of 20 to 34 years have the highest fertility rate with 135.0 births per 1,000 women. Women in the age bracket of 20 to 34 years acount for 100.0% of all women with births.
| Age Bracket | Women with Births | Births / 1,000 Women |
| 15 to 19 years | 0 (0.0%) | 0.0 |
| 20 to 34 years | 5 (100.0%) | 135.0 |
| 35 to 50 years | 0 (0.0%) | 0.0 |
| Total | 5 (100.0%) | 122.0 |
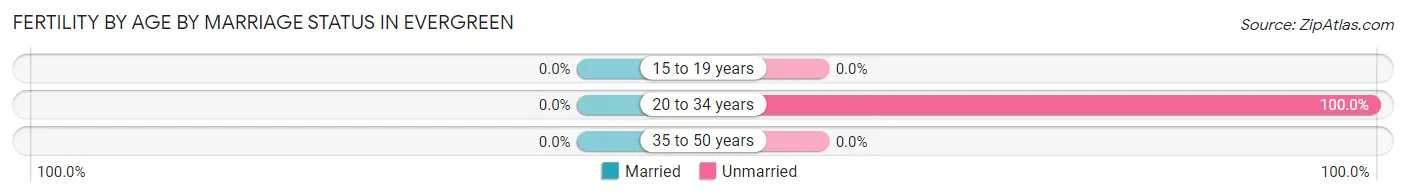
Fertility by Age by Marriage Status in Evergreen
| Age Bracket | Married | Unmarried |
| 15 to 19 years | 0 (0.0%) | 0 (0.0%) |
| 20 to 34 years | 0 (0.0%) | 5 (100.0%) |
| 35 to 50 years | 0 (0.0%) | 0 (0.0%) |
| Total | 0 (0.0%) | 5 (100.0%) |
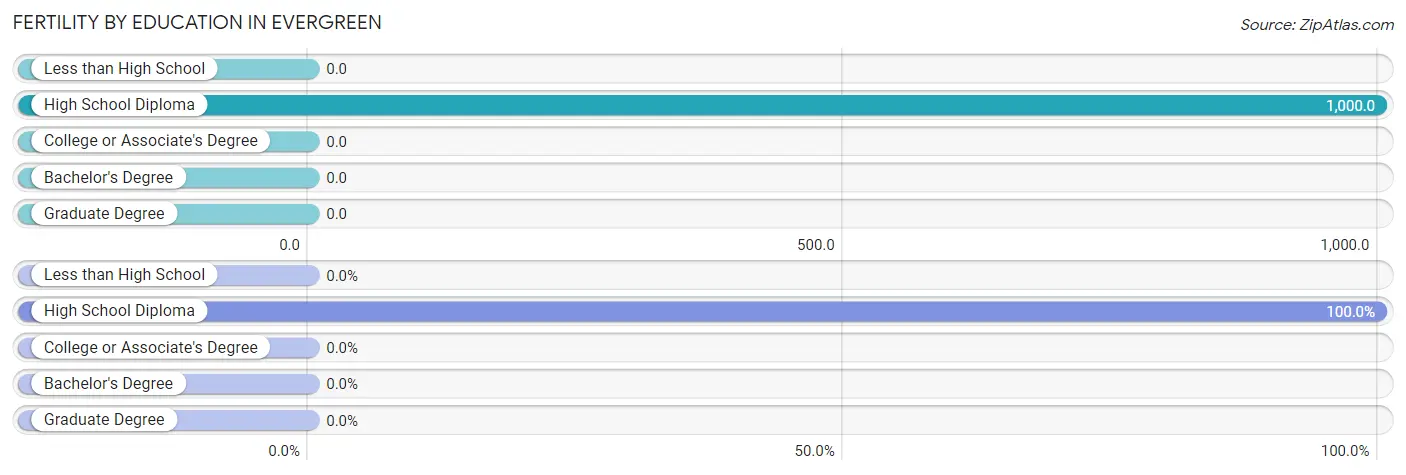
Fertility by Education in Evergreen
| Educational Attainment | Women with Births | Births / 1,000 Women |
| Less than High School | 0 (0.0%) | 0.0 |
| High School Diploma | 5 (100.0%) | 1,000.0 |
| College or Associate's Degree | 0 (0.0%) | 0.0 |
| Bachelor's Degree | 0 (0.0%) | 0.0 |
| Graduate Degree | 0 (0.0%) | 0.0 |
| Total | 5 (100.0%) | 122.0 |
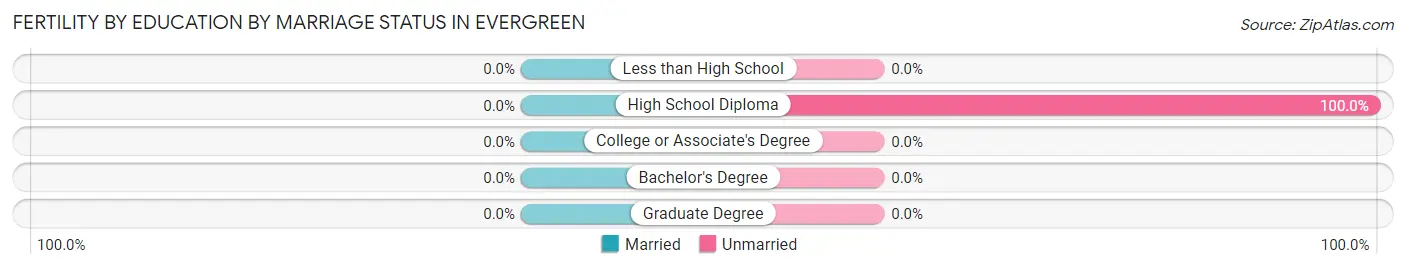
Fertility by Education by Marriage Status in Evergreen
| Educational Attainment | Married | Unmarried |
| Less than High School | 0 (0.0%) | 0 (0.0%) |
| High School Diploma | 0 (0.0%) | 5 (100.0%) |
| College or Associate's Degree | 0 (0.0%) | 0 (0.0%) |
| Bachelor's Degree | 0 (0.0%) | 0 (0.0%) |
| Graduate Degree | 0 (0.0%) | 0 (0.0%) |
| Total | 0 (0.0%) | 5 (100.0%) |
Employment Characteristics in Evergreen
Employment by Class of Employer in Evergreen
Among the 27 employed individuals in Evergreen, , and private company employees (27 | 100.0%) make up the most common classes of employment.
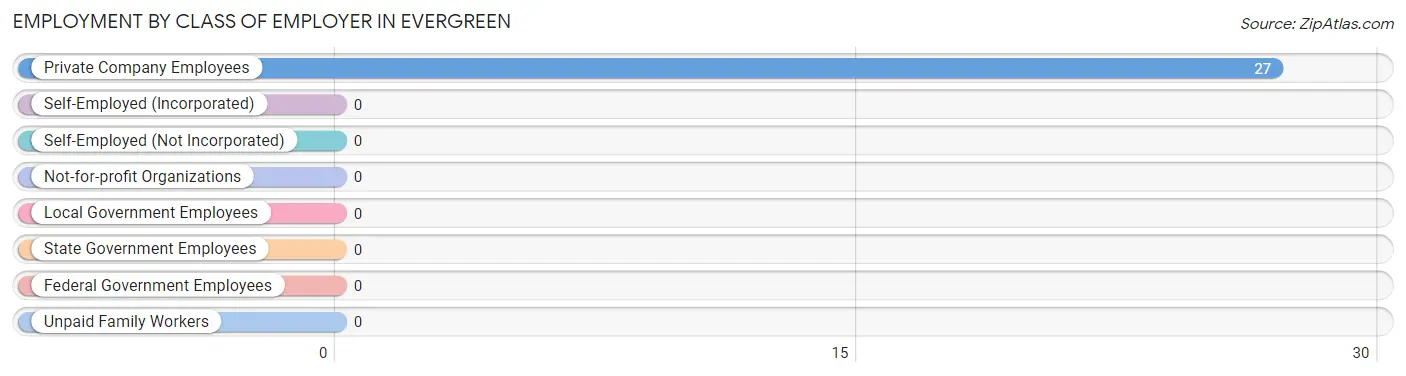
| Employer Class | # Employees | % Employees |
| Private Company Employees | 27 | 100.0% |
| Self-Employed (Incorporated) | 0 | 0.0% |
| Self-Employed (Not Incorporated) | 0 | 0.0% |
| Not-for-profit Organizations | 0 | 0.0% |
| Local Government Employees | 0 | 0.0% |
| State Government Employees | 0 | 0.0% |
| Federal Government Employees | 0 | 0.0% |
| Unpaid Family Workers | 0 | 0.0% |
| Total | 27 | 100.0% |
Employment Status by Age in Evergreen
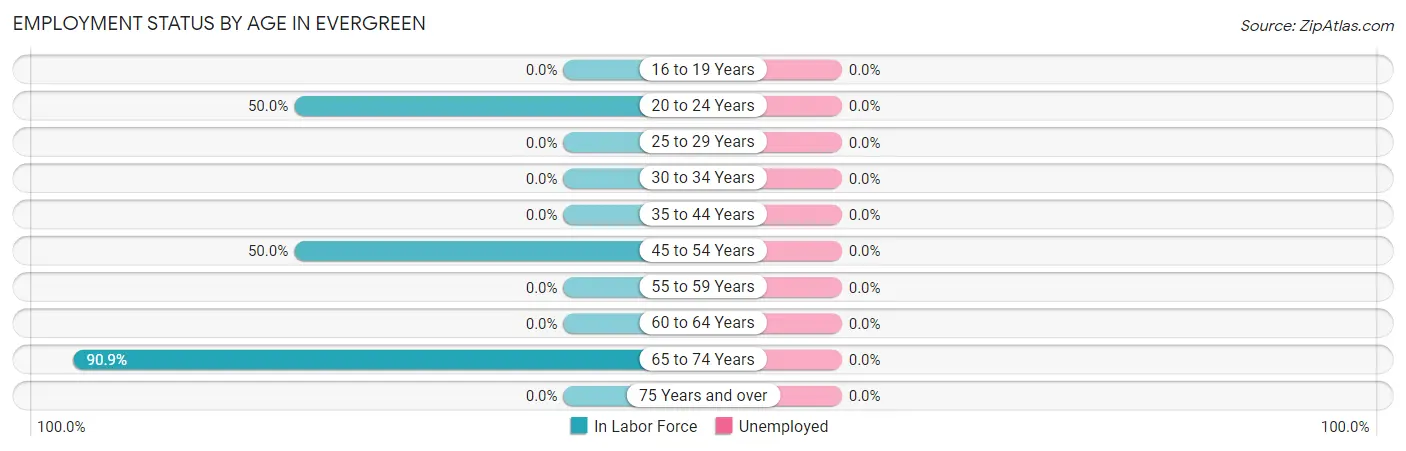
| Age Bracket | In Labor Force | Unemployed |
| 16 to 19 Years | 0 (0.0%) | 0 (0.0%) |
| 20 to 24 Years | 5 (50.0%) | 0 (0.0%) |
| 25 to 29 Years | 0 (0.0%) | 0 (0.0%) |
| 30 to 34 Years | 0 (0.0%) | 0 (0.0%) |
| 35 to 44 Years | 0 (0.0%) | 0 (0.0%) |
| 45 to 54 Years | 2 (50.0%) | 0 (0.0%) |
| 55 to 59 Years | 0 (0.0%) | 0 (0.0%) |
| 60 to 64 Years | 0 (0.0%) | 0 (0.0%) |
| 65 to 74 Years | 20 (90.9%) | 0 (0.0%) |
| 75 Years and over | 0 (0.0%) | 0 (0.0%) |
| Total | 27 (35.5%) | 0 (0.0%) |
Employment Status by Educational Attainment in Evergreen
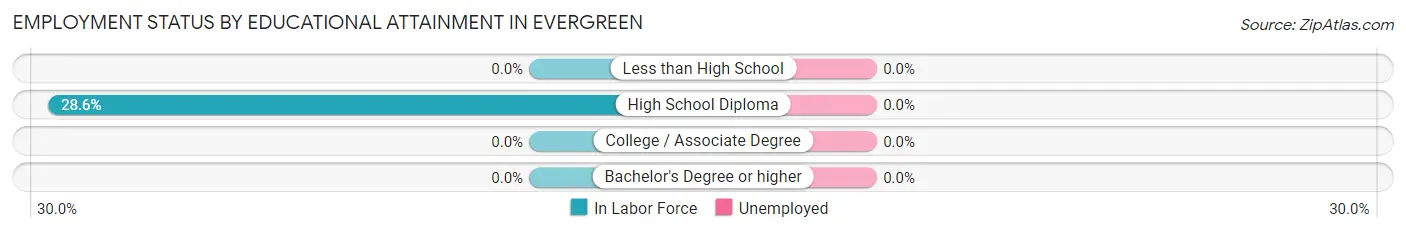
| Educational Attainment | In Labor Force | Unemployed |
| Less than High School | 0 (0.0%) | 0 (0.0%) |
| High School Diploma | 2 (28.6%) | 0 (0.0%) |
| College / Associate Degree | 0 (0.0%) | 0 (0.0%) |
| Bachelor's Degree or higher | 0 (0.0%) | 0 (0.0%) |
| Total | 2 (5.1%) | 0 (0.0%) |
Employment Occupations by Sex in Evergreen
Management, Business, Science and Arts Occupations
The most common Management, Business, Science and Arts occupations in Evergreen are , and Management (2 | 7.4%).
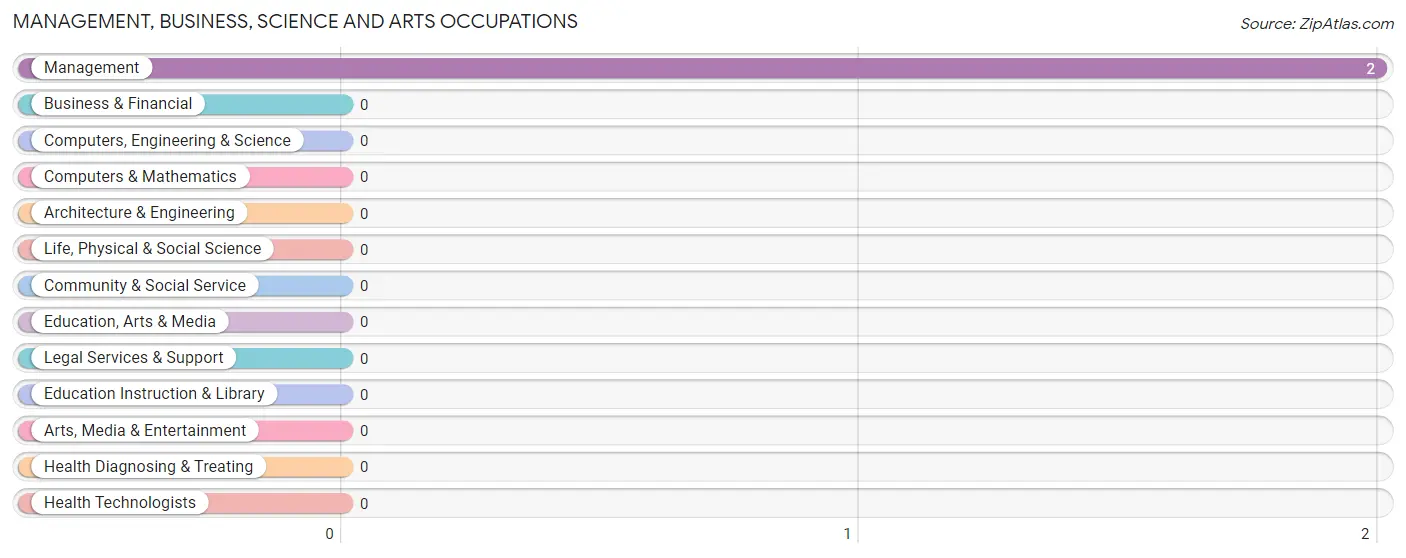
Management, Business, Science and Arts Occupations by Sex
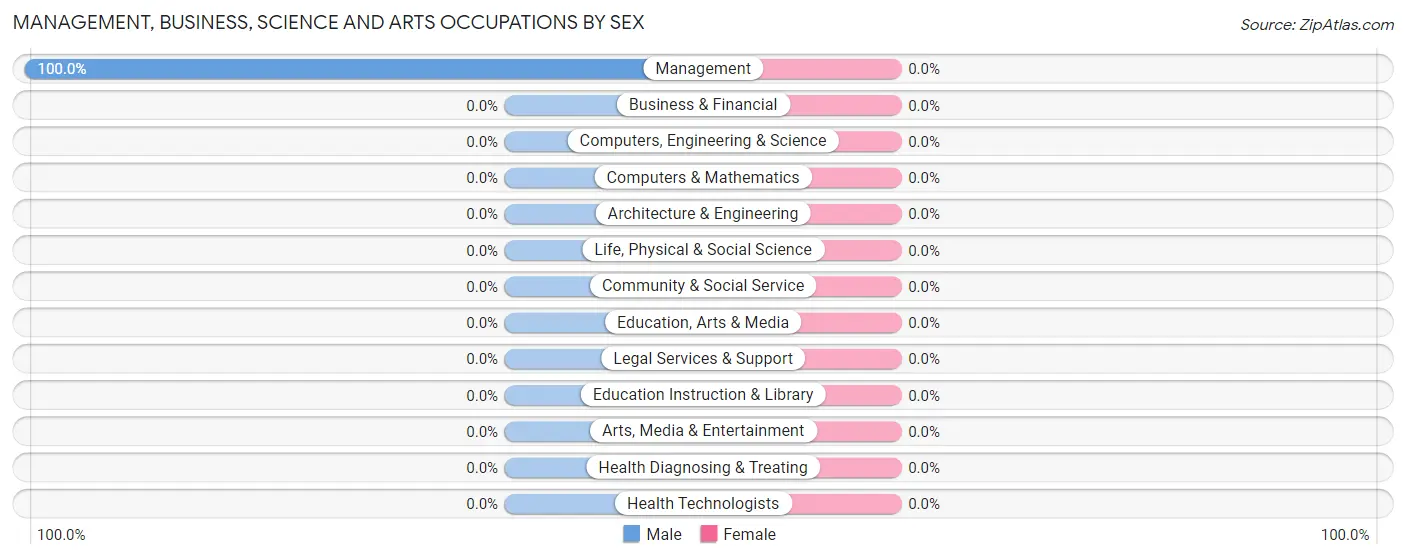
| Occupation | Male | Female |
| Management | 2 (100.0%) | 0 (0.0%) |
| Business & Financial | 0 (0.0%) | 0 (0.0%) |
| Computers, Engineering & Science | 0 (0.0%) | 0 (0.0%) |
| Computers & Mathematics | 0 (0.0%) | 0 (0.0%) |
| Architecture & Engineering | 0 (0.0%) | 0 (0.0%) |
| Life, Physical & Social Science | 0 (0.0%) | 0 (0.0%) |
| Community & Social Service | 0 (0.0%) | 0 (0.0%) |
| Education, Arts & Media | 0 (0.0%) | 0 (0.0%) |
| Legal Services & Support | 0 (0.0%) | 0 (0.0%) |
| Education Instruction & Library | 0 (0.0%) | 0 (0.0%) |
| Arts, Media & Entertainment | 0 (0.0%) | 0 (0.0%) |
| Health Diagnosing & Treating | 0 (0.0%) | 0 (0.0%) |
| Health Technologists | 0 (0.0%) | 0 (0.0%) |
| Total (Category) | 2 (100.0%) | 0 (0.0%) |
| Total (Overall) | 11 (40.7%) | 16 (59.3%) |
Services Occupations
The most common Services occupations in Evergreen are , and Food Preparation & Serving (16 | 59.3%).
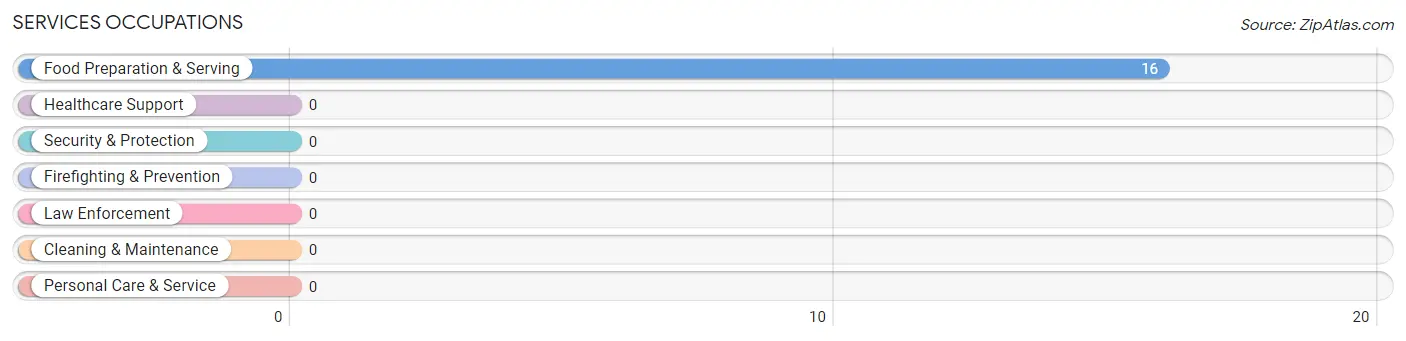
Services Occupations by Sex
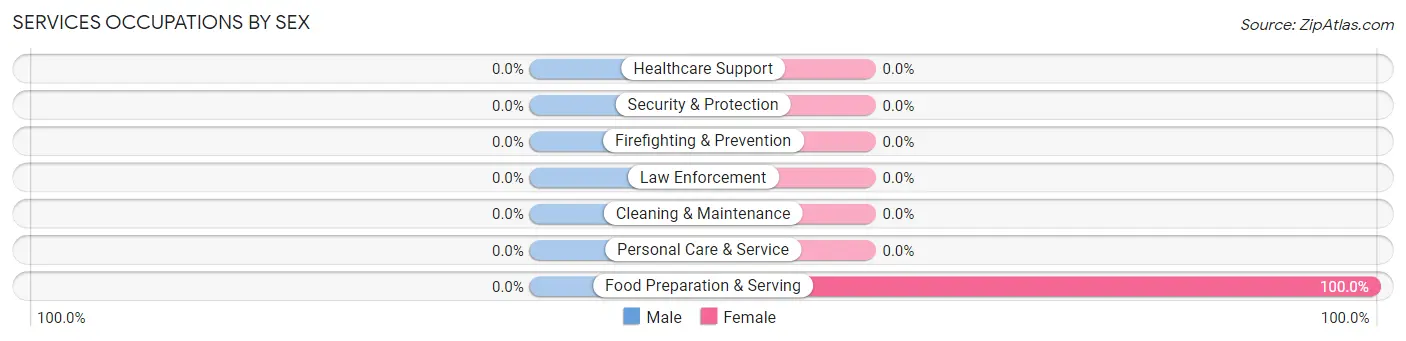
| Occupation | Male | Female |
| Healthcare Support | 0 (0.0%) | 0 (0.0%) |
| Security & Protection | 0 (0.0%) | 0 (0.0%) |
| Firefighting & Prevention | 0 (0.0%) | 0 (0.0%) |
| Law Enforcement | 0 (0.0%) | 0 (0.0%) |
| Food Preparation & Serving | 0 (0.0%) | 16 (100.0%) |
| Cleaning & Maintenance | 0 (0.0%) | 0 (0.0%) |
| Personal Care & Service | 0 (0.0%) | 0 (0.0%) |
| Total (Category) | 0 (0.0%) | 16 (100.0%) |
| Total (Overall) | 11 (40.7%) | 16 (59.3%) |
Sales and Office Occupations
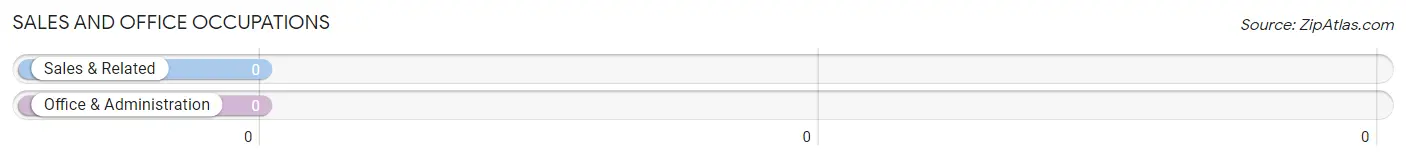
Sales and Office Occupations by Sex
| Occupation | Male | Female |
| Sales & Related | 0 (0.0%) | 0 (0.0%) |
| Office & Administration | 0 (0.0%) | 0 (0.0%) |
| Total (Category) | 0 (0.0%) | 0 (0.0%) |
| Total (Overall) | 11 (40.7%) | 16 (59.3%) |
Natural Resources, Construction and Maintenance Occupations
The most common Natural Resources, Construction and Maintenance occupations in Evergreen are , and Farming, Fishing & Forestry (4 | 14.8%).
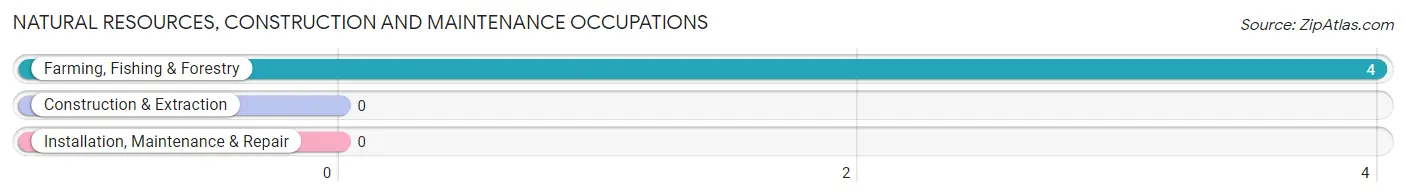
Natural Resources, Construction and Maintenance Occupations by Sex
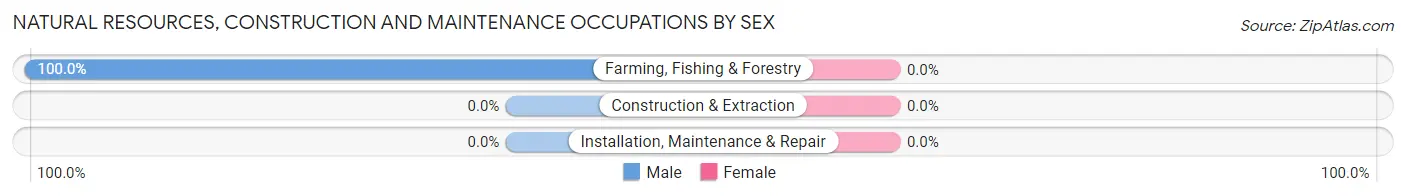
| Occupation | Male | Female |
| Farming, Fishing & Forestry | 4 (100.0%) | 0 (0.0%) |
| Construction & Extraction | 0 (0.0%) | 0 (0.0%) |
| Installation, Maintenance & Repair | 0 (0.0%) | 0 (0.0%) |
| Total (Category) | 4 (100.0%) | 0 (0.0%) |
| Total (Overall) | 11 (40.7%) | 16 (59.3%) |
Production, Transportation and Moving Occupations
The most common Production, Transportation and Moving occupations in Evergreen are , and Material Moving (5 | 18.5%).
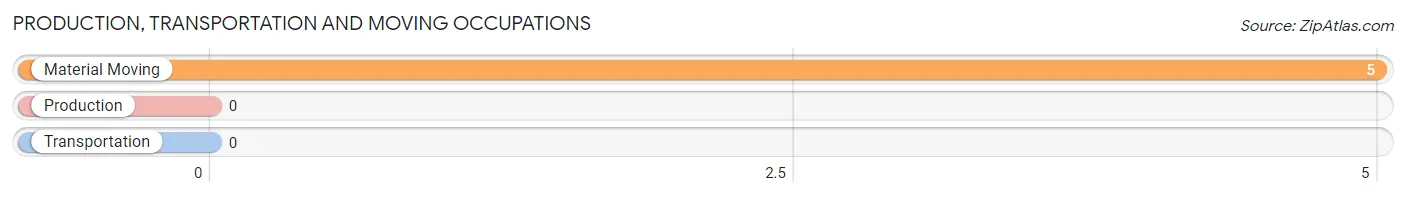
Production, Transportation and Moving Occupations by Sex
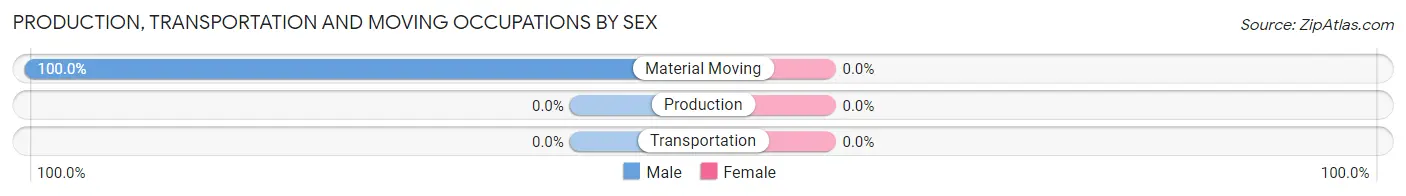
| Occupation | Male | Female |
| Production | 0 (0.0%) | 0 (0.0%) |
| Transportation | 0 (0.0%) | 0 (0.0%) |
| Material Moving | 5 (100.0%) | 0 (0.0%) |
| Total (Category) | 5 (100.0%) | 0 (0.0%) |
| Total (Overall) | 11 (40.7%) | 16 (59.3%) |
Employment Industries by Sex in Evergreen
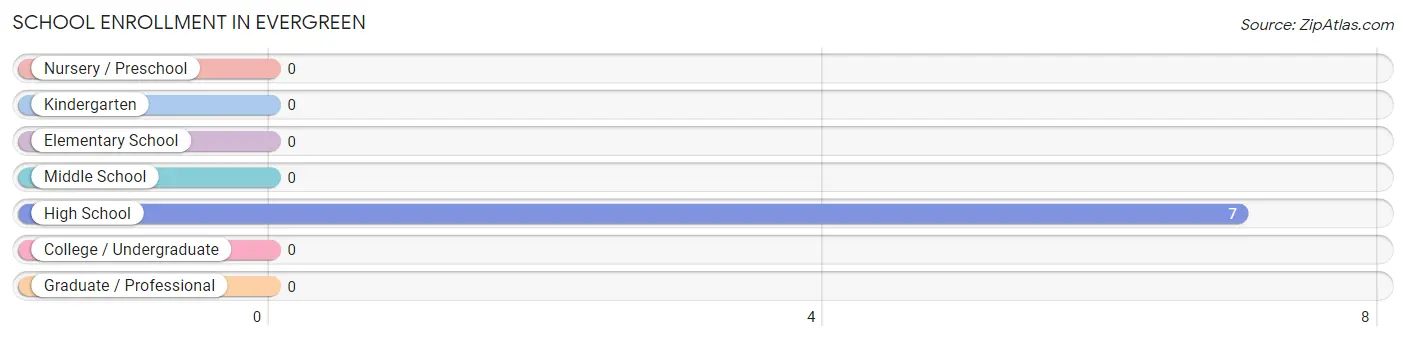
Employment Industries in Evergreen
The major employment industries in Evergreen include Accommodation & Food Services (16 | 59.3%), Agriculture, Fishing & Hunting (6 | 22.2%), and Wholesale Trade (5 | 18.5%).
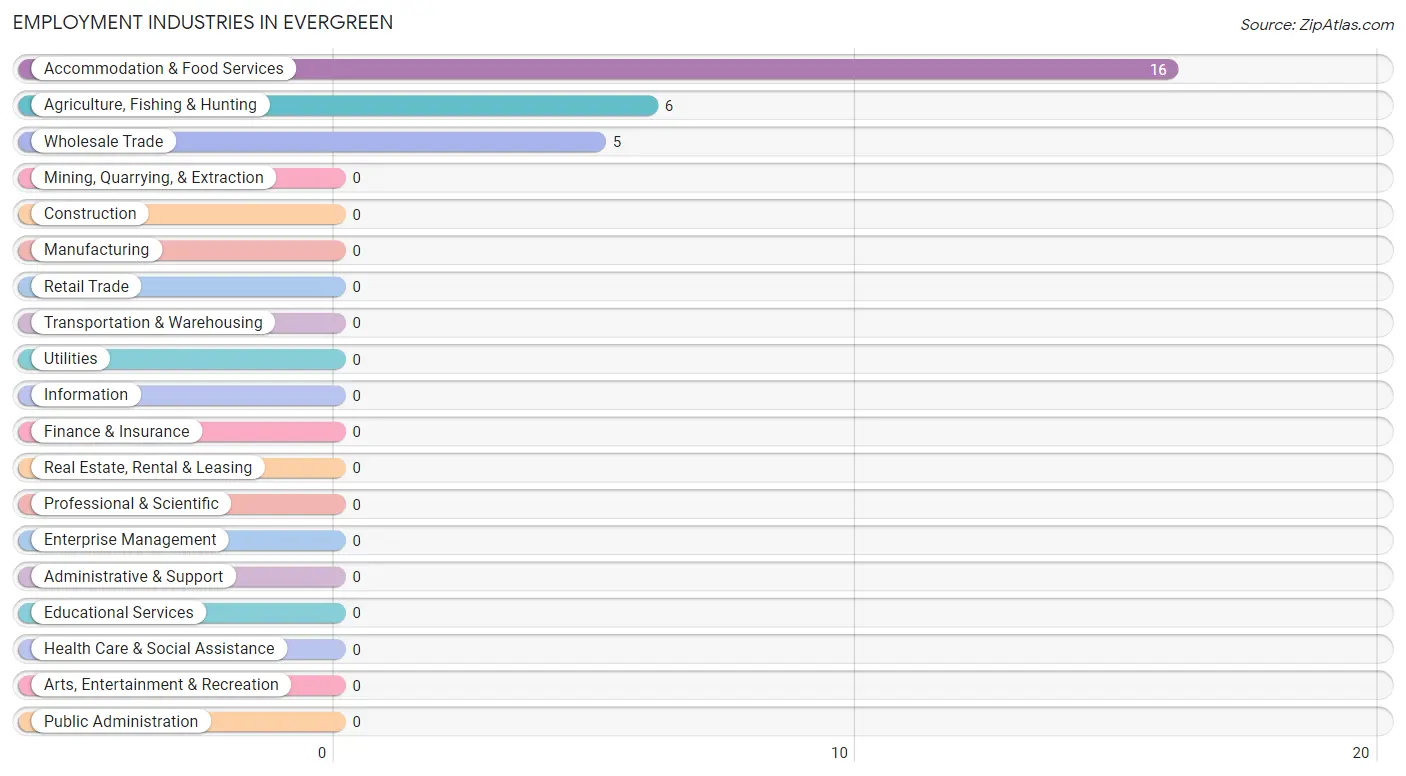
Employment Industries by Sex in Evergreen
| Industry | Male | Female |
| Agriculture, Fishing & Hunting | 6 (100.0%) | 0 (0.0%) |
| Mining, Quarrying, & Extraction | 0 (0.0%) | 0 (0.0%) |
| Construction | 0 (0.0%) | 0 (0.0%) |
| Manufacturing | 0 (0.0%) | 0 (0.0%) |
| Wholesale Trade | 5 (100.0%) | 0 (0.0%) |
| Retail Trade | 0 (0.0%) | 0 (0.0%) |
| Transportation & Warehousing | 0 (0.0%) | 0 (0.0%) |
| Utilities | 0 (0.0%) | 0 (0.0%) |
| Information | 0 (0.0%) | 0 (0.0%) |
| Finance & Insurance | 0 (0.0%) | 0 (0.0%) |
| Real Estate, Rental & Leasing | 0 (0.0%) | 0 (0.0%) |
| Professional & Scientific | 0 (0.0%) | 0 (0.0%) |
| Enterprise Management | 0 (0.0%) | 0 (0.0%) |
| Administrative & Support | 0 (0.0%) | 0 (0.0%) |
| Educational Services | 0 (0.0%) | 0 (0.0%) |
| Health Care & Social Assistance | 0 (0.0%) | 0 (0.0%) |
| Arts, Entertainment & Recreation | 0 (0.0%) | 0 (0.0%) |
| Accommodation & Food Services | 0 (0.0%) | 16 (100.0%) |
| Public Administration | 0 (0.0%) | 0 (0.0%) |
| Total | 11 (40.7%) | 16 (59.3%) |
Education in Evergreen
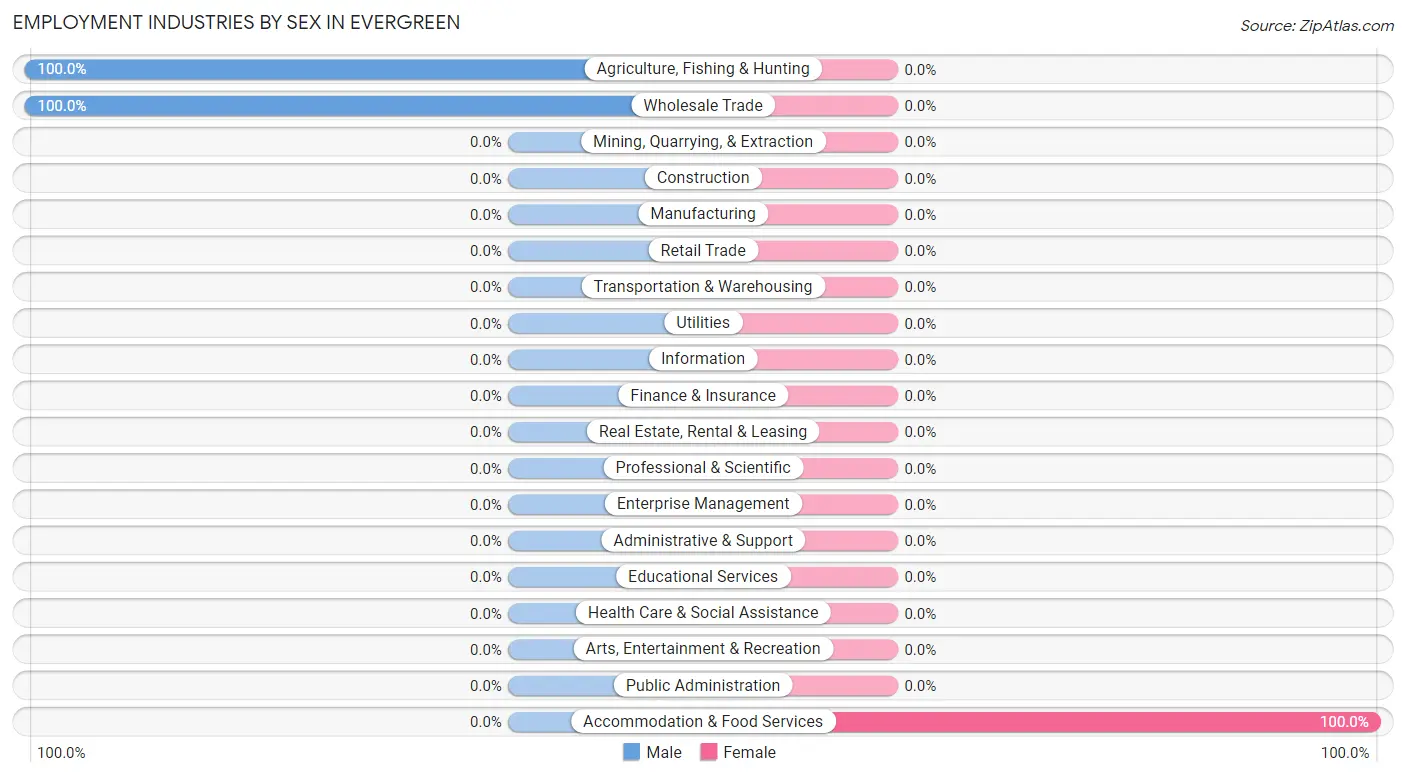
School Enrollment in Evergreen
| School Level | # Students | % Students |
| Nursery / Preschool | 0 | 0.0% |
| Kindergarten | 0 | 0.0% |
| Elementary School | 0 | 0.0% |
| Middle School | 0 | 0.0% |
| High School | 7 | 100.0% |
| College / Undergraduate | 0 | 0.0% |
| Graduate / Professional | 0 | 0.0% |
| Total | 7 | 100.0% |
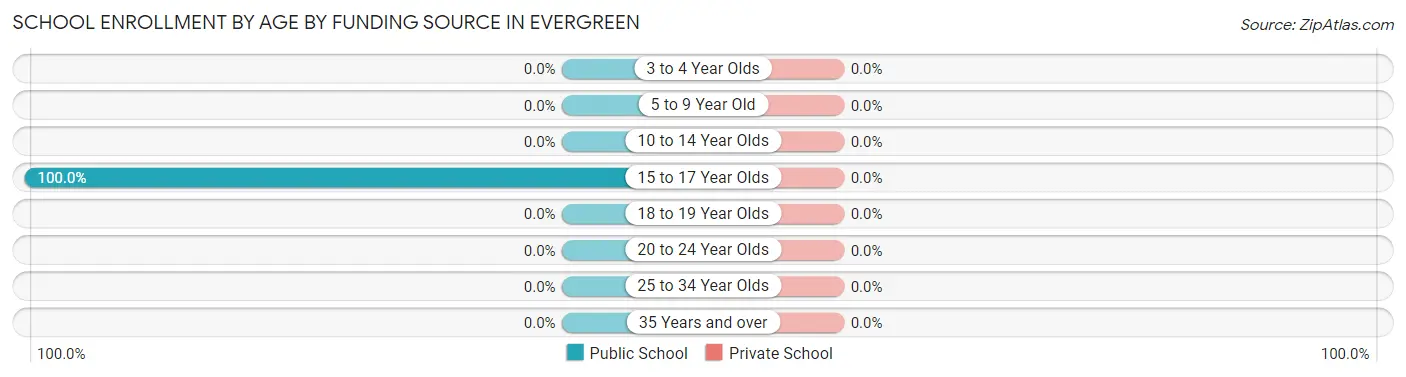
School Enrollment by Age by Funding Source in Evergreen
| Age Bracket | Public School | Private School |
| 3 to 4 Year Olds | 0 (0.0%) | 0 (0.0%) |
| 5 to 9 Year Old | 0 (0.0%) | 0 (0.0%) |
| 10 to 14 Year Olds | 0 (0.0%) | 0 (0.0%) |
| 15 to 17 Year Olds | 7 (100.0%) | 0 (0.0%) |
| 18 to 19 Year Olds | 0 (0.0%) | 0 (0.0%) |
| 20 to 24 Year Olds | 0 (0.0%) | 0 (0.0%) |
| 25 to 34 Year Olds | 0 (0.0%) | 0 (0.0%) |
| 35 Years and over | 0 (0.0%) | 0 (0.0%) |
| Total | 7 (100.0%) | 0 (0.0%) |
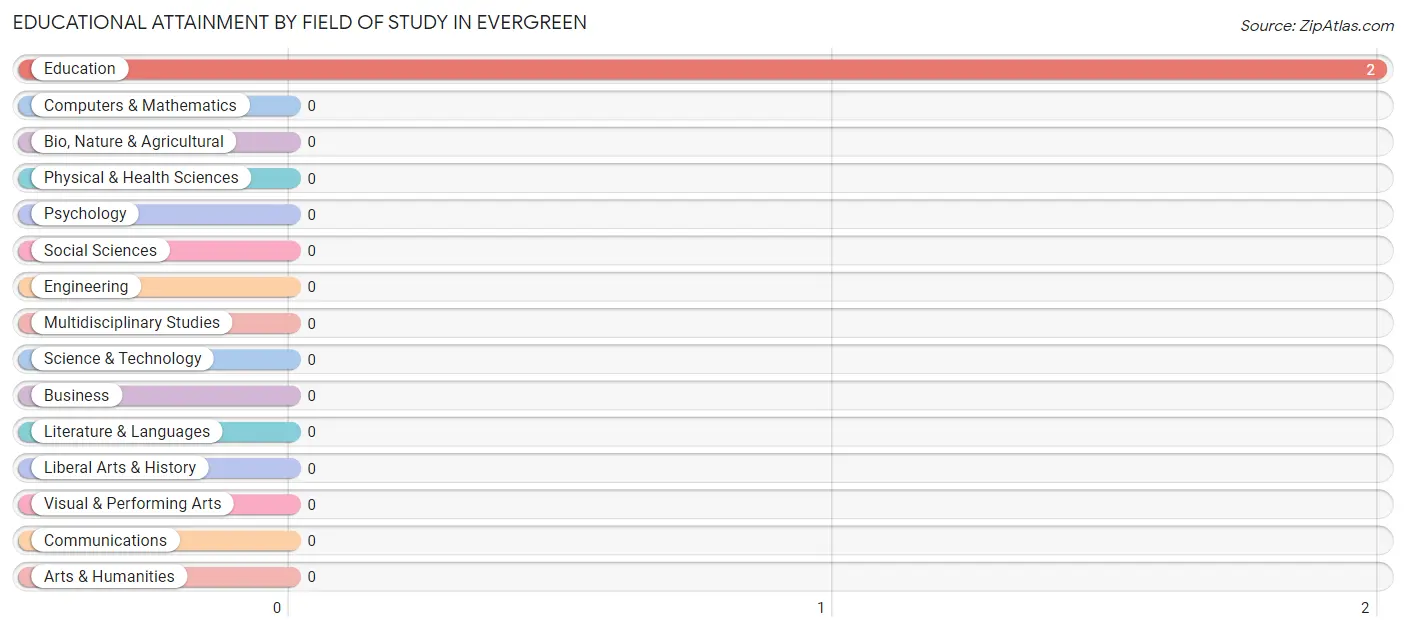
Educational Attainment by Field of Study in Evergreen
, and education (2 | 100.0%) are the most common fields of study among 2 individuals in Evergreen who have obtained a bachelor's degree or higher.
| Field of Study | # Graduates | % Graduates |
| Computers & Mathematics | 0 | 0.0% |
| Bio, Nature & Agricultural | 0 | 0.0% |
| Physical & Health Sciences | 0 | 0.0% |
| Psychology | 0 | 0.0% |
| Social Sciences | 0 | 0.0% |
| Engineering | 0 | 0.0% |
| Multidisciplinary Studies | 0 | 0.0% |
| Science & Technology | 0 | 0.0% |
| Business | 0 | 0.0% |
| Education | 2 | 100.0% |
| Literature & Languages | 0 | 0.0% |
| Liberal Arts & History | 0 | 0.0% |
| Visual & Performing Arts | 0 | 0.0% |
| Communications | 0 | 0.0% |
| Arts & Humanities | 0 | 0.0% |
| Total | 2 | 100.0% |
Transportation & Commute in Evergreen
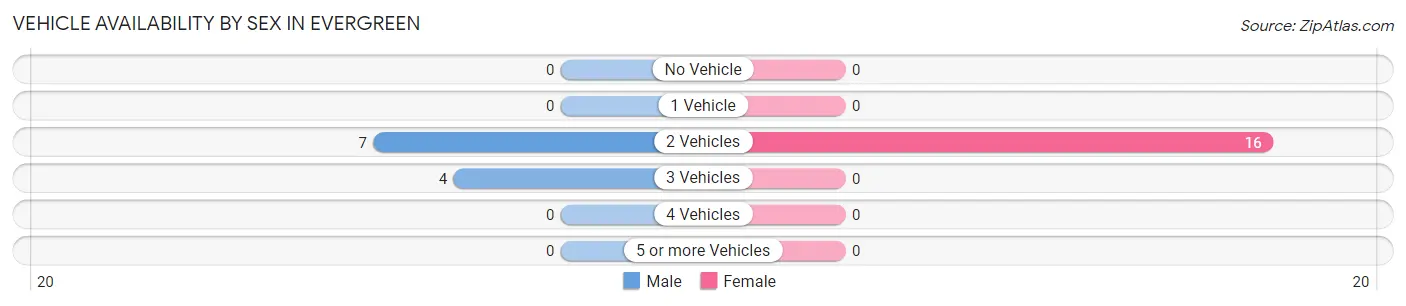
Vehicle Availability by Sex in Evergreen
The most prevalent vehicle ownership categories in Evergreen are males with 2 vehicles (7, accounting for 63.6%) and females with 2 vehicles (16, making up 43.8%).
| Vehicles Available | Male | Female |
| No Vehicle | 0 (0.0%) | 0 (0.0%) |
| 1 Vehicle | 0 (0.0%) | 0 (0.0%) |
| 2 Vehicles | 7 (63.6%) | 16 (100.0%) |
| 3 Vehicles | 4 (36.4%) | 0 (0.0%) |
| 4 Vehicles | 0 (0.0%) | 0 (0.0%) |
| 5 or more Vehicles | 0 (0.0%) | 0 (0.0%) |
| Total | 11 (100.0%) | 16 (100.0%) |
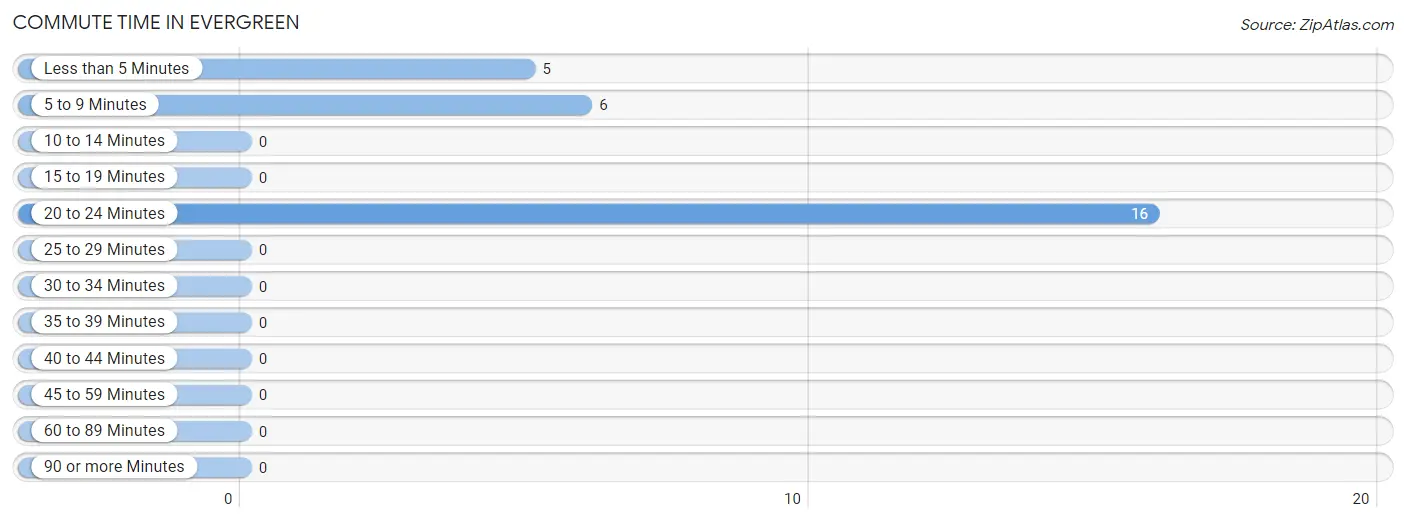
Commute Time in Evergreen
The most frequently occuring commute durations in Evergreen are 20 to 24 minutes (16 commuters, 59.3%), 5 to 9 minutes (6 commuters, 22.2%), and less than 5 minutes (5 commuters, 18.5%).
| Commute Time | # Commuters | % Commuters |
| Less than 5 Minutes | 5 | 18.5% |
| 5 to 9 Minutes | 6 | 22.2% |
| 10 to 14 Minutes | 0 | 0.0% |
| 15 to 19 Minutes | 0 | 0.0% |
| 20 to 24 Minutes | 16 | 59.3% |
| 25 to 29 Minutes | 0 | 0.0% |
| 30 to 34 Minutes | 0 | 0.0% |
| 35 to 39 Minutes | 0 | 0.0% |
| 40 to 44 Minutes | 0 | 0.0% |
| 45 to 59 Minutes | 0 | 0.0% |
| 60 to 89 Minutes | 0 | 0.0% |
| 90 or more Minutes | 0 | 0.0% |
Commute Time by Sex in Evergreen
The most common commute times in Evergreen are 5 to 9 minutes (6 commuters, 54.5%) for males and 20 to 24 minutes (16 commuters, 100.0%) for females.
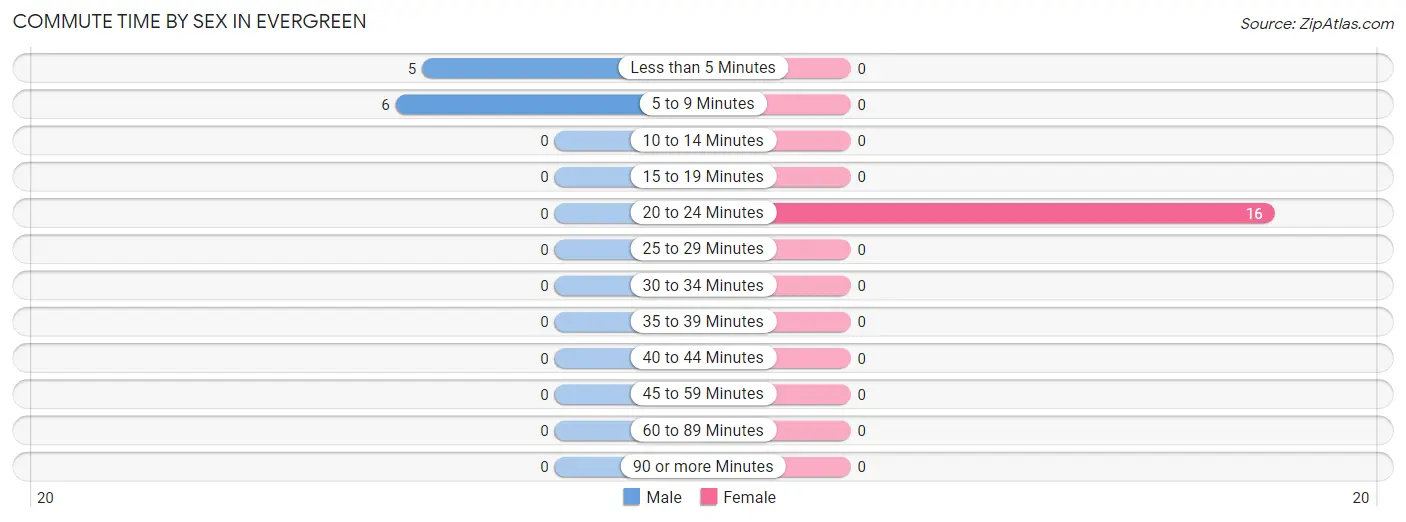
| Commute Time | Male | Female |
| Less than 5 Minutes | 5 (45.5%) | 0 (0.0%) |
| 5 to 9 Minutes | 6 (54.5%) | 0 (0.0%) |
| 10 to 14 Minutes | 0 (0.0%) | 0 (0.0%) |
| 15 to 19 Minutes | 0 (0.0%) | 0 (0.0%) |
| 20 to 24 Minutes | 0 (0.0%) | 16 (100.0%) |
| 25 to 29 Minutes | 0 (0.0%) | 0 (0.0%) |
| 30 to 34 Minutes | 0 (0.0%) | 0 (0.0%) |
| 35 to 39 Minutes | 0 (0.0%) | 0 (0.0%) |
| 40 to 44 Minutes | 0 (0.0%) | 0 (0.0%) |
| 45 to 59 Minutes | 0 (0.0%) | 0 (0.0%) |
| 60 to 89 Minutes | 0 (0.0%) | 0 (0.0%) |
| 90 or more Minutes | 0 (0.0%) | 0 (0.0%) |
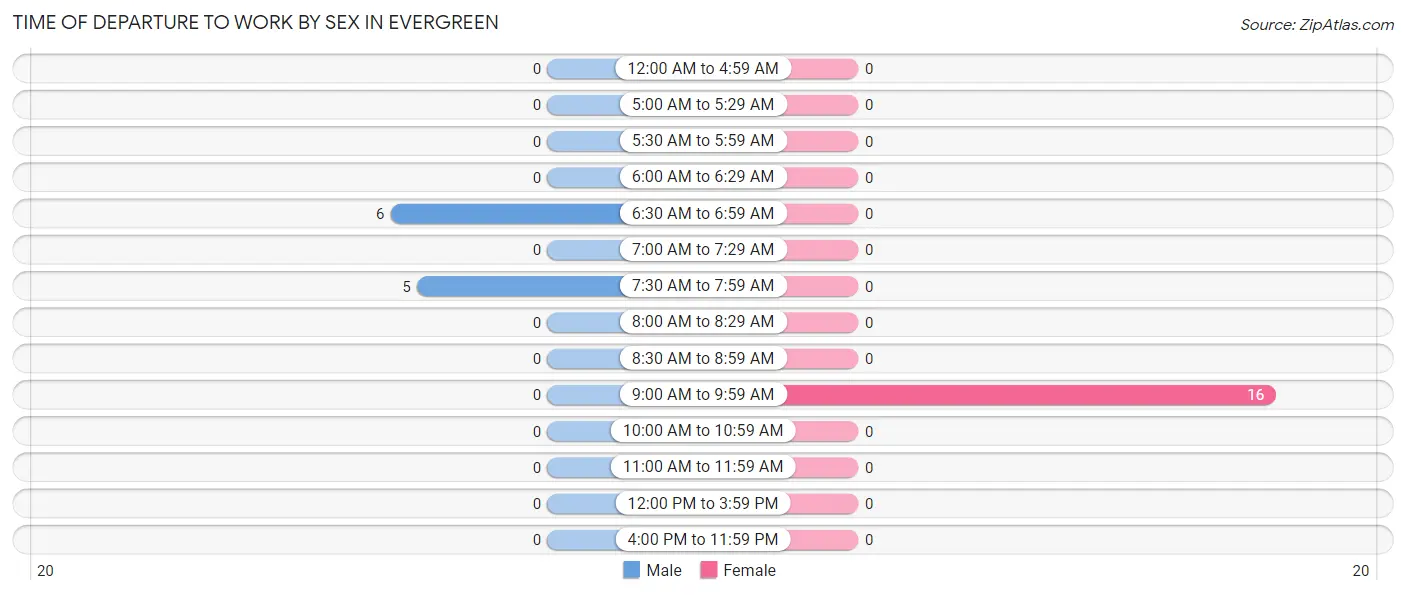
Time of Departure to Work by Sex in Evergreen
The most frequent times of departure to work in Evergreen are 6:30 AM to 6:59 AM (6, 54.5%) for males and 9:00 AM to 9:59 AM (16, 100.0%) for females.
| Time of Departure | Male | Female |
| 12:00 AM to 4:59 AM | 0 (0.0%) | 0 (0.0%) |
| 5:00 AM to 5:29 AM | 0 (0.0%) | 0 (0.0%) |
| 5:30 AM to 5:59 AM | 0 (0.0%) | 0 (0.0%) |
| 6:00 AM to 6:29 AM | 0 (0.0%) | 0 (0.0%) |
| 6:30 AM to 6:59 AM | 6 (54.5%) | 0 (0.0%) |
| 7:00 AM to 7:29 AM | 0 (0.0%) | 0 (0.0%) |
| 7:30 AM to 7:59 AM | 5 (45.5%) | 0 (0.0%) |
| 8:00 AM to 8:29 AM | 0 (0.0%) | 0 (0.0%) |
| 8:30 AM to 8:59 AM | 0 (0.0%) | 0 (0.0%) |
| 9:00 AM to 9:59 AM | 0 (0.0%) | 16 (100.0%) |
| 10:00 AM to 10:59 AM | 0 (0.0%) | 0 (0.0%) |
| 11:00 AM to 11:59 AM | 0 (0.0%) | 0 (0.0%) |
| 12:00 PM to 3:59 PM | 0 (0.0%) | 0 (0.0%) |
| 4:00 PM to 11:59 PM | 0 (0.0%) | 0 (0.0%) |
| Total | 11 (100.0%) | 16 (100.0%) |
Housing Occupancy in Evergreen
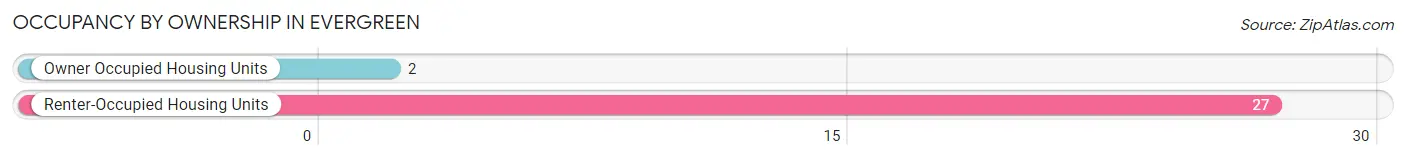
Occupancy by Ownership in Evergreen
Of the total 29 dwellings in Evergreen, owner-occupied units account for 2 (6.9%), while renter-occupied units make up 27 (93.1%).
| Occupancy | # Housing Units | % Housing Units |
| Owner Occupied Housing Units | 2 | 6.9% |
| Renter-Occupied Housing Units | 27 | 93.1% |
| Total Occupied Housing Units | 29 | 100.0% |
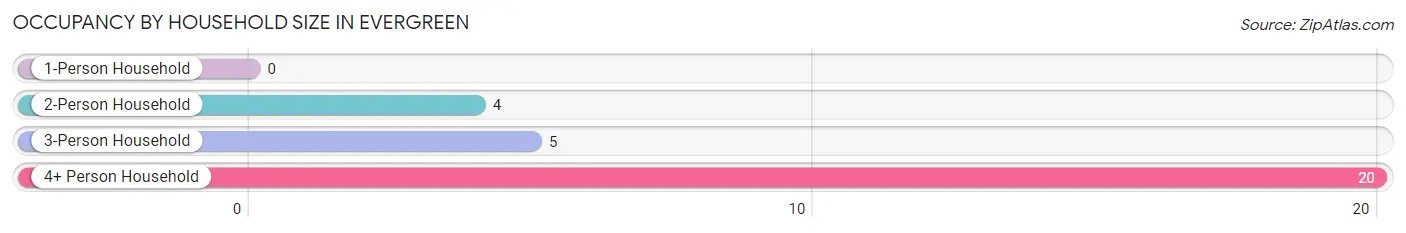
Occupancy by Household Size in Evergreen
| Household Size | # Housing Units | % Housing Units |
| 1-Person Household | 0 | 0.0% |
| 2-Person Household | 4 | 13.8% |
| 3-Person Household | 5 | 17.2% |
| 4+ Person Household | 20 | 69.0% |
| Total Housing Units | 29 | 100.0% |
Occupancy by Ownership by Household Size in Evergreen
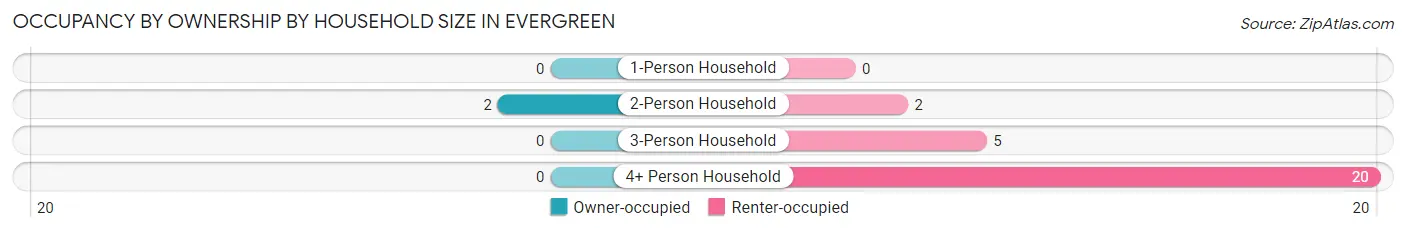
| Household Size | Owner-occupied | Renter-occupied |
| 1-Person Household | 0 (0.0%) | 0 (0.0%) |
| 2-Person Household | 2 (50.0%) | 2 (50.0%) |
| 3-Person Household | 0 (0.0%) | 5 (100.0%) |
| 4+ Person Household | 0 (0.0%) | 20 (100.0%) |
| Total Housing Units | 2 (6.9%) | 27 (93.1%) |
Occupancy by Educational Attainment in Evergreen
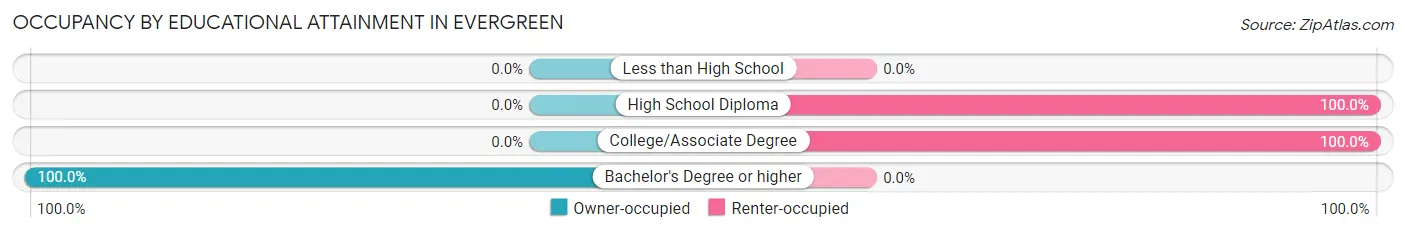
| Household Size | Owner-occupied | Renter-occupied |
| Less than High School | 0 (0.0%) | 0 (0.0%) |
| High School Diploma | 0 (0.0%) | 18 (100.0%) |
| College/Associate Degree | 0 (0.0%) | 9 (100.0%) |
| Bachelor's Degree or higher | 2 (100.0%) | 0 (0.0%) |
Occupancy by Age of Householder in Evergreen
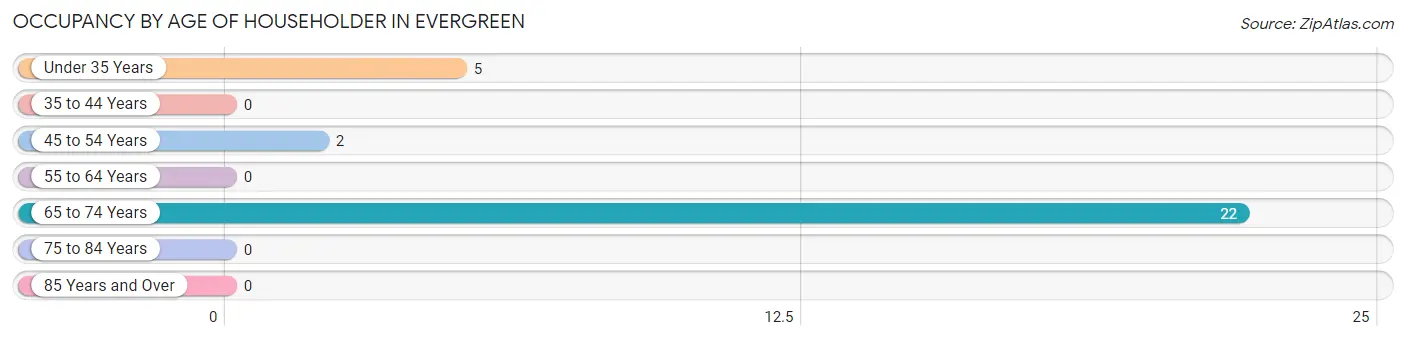
| Age Bracket | # Households | % Households |
| Under 35 Years | 5 | 17.2% |
| 35 to 44 Years | 0 | 0.0% |
| 45 to 54 Years | 2 | 6.9% |
| 55 to 64 Years | 0 | 0.0% |
| 65 to 74 Years | 22 | 75.9% |
| 75 to 84 Years | 0 | 0.0% |
| 85 Years and Over | 0 | 0.0% |
| Total | 29 | 100.0% |
Housing Finances in Evergreen
Median Income by Occupancy in Evergreen
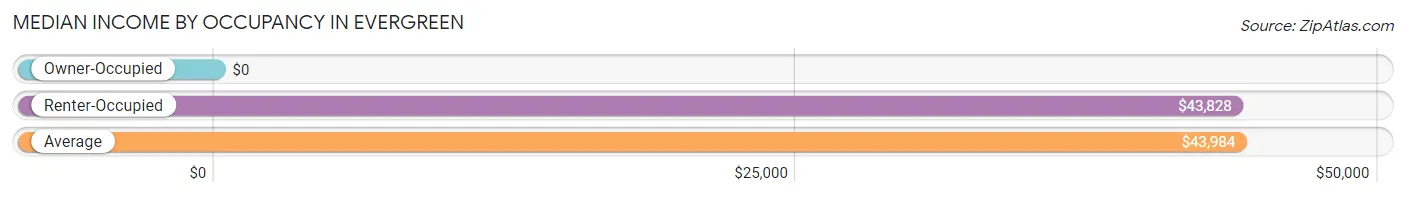
| Occupancy Type | # Households | Median Income |
| Owner-Occupied | 2 (6.9%) | $0 |
| Renter-Occupied | 27 (93.1%) | $43,828 |
| Average | 29 (100.0%) | $43,984 |
Occupancy by Householder Income Bracket in Evergreen
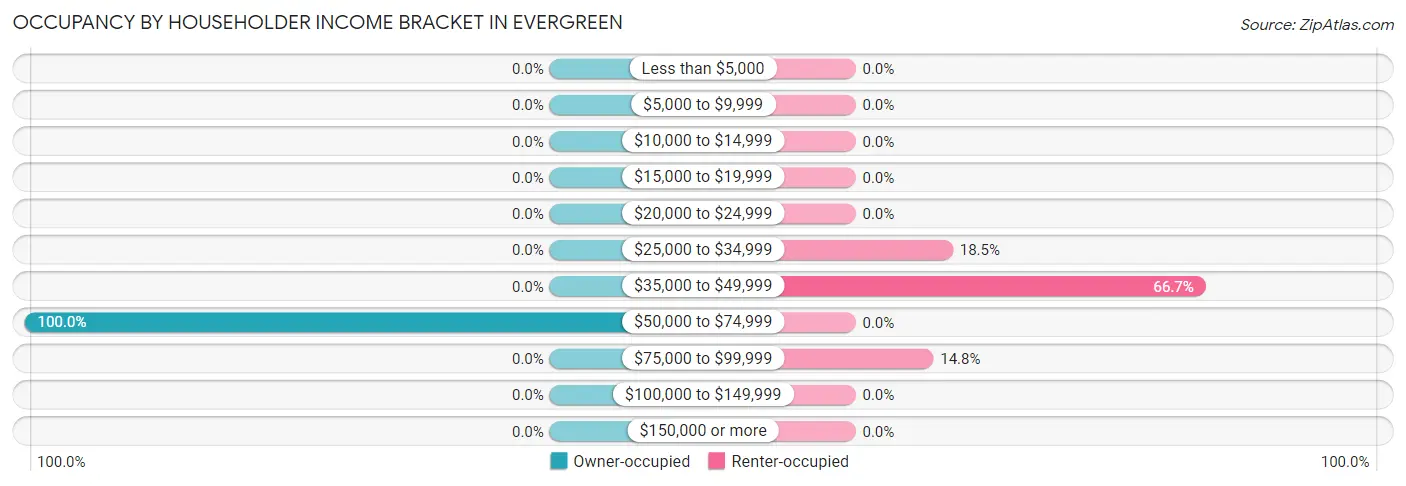
| Income Bracket | Owner-occupied | Renter-occupied |
| Less than $5,000 | 0 (0.0%) | 0 (0.0%) |
| $5,000 to $9,999 | 0 (0.0%) | 0 (0.0%) |
| $10,000 to $14,999 | 0 (0.0%) | 0 (0.0%) |
| $15,000 to $19,999 | 0 (0.0%) | 0 (0.0%) |
| $20,000 to $24,999 | 0 (0.0%) | 0 (0.0%) |
| $25,000 to $34,999 | 0 (0.0%) | 5 (18.5%) |
| $35,000 to $49,999 | 0 (0.0%) | 18 (66.7%) |
| $50,000 to $74,999 | 2 (100.0%) | 0 (0.0%) |
| $75,000 to $99,999 | 0 (0.0%) | 4 (14.8%) |
| $100,000 to $149,999 | 0 (0.0%) | 0 (0.0%) |
| $150,000 or more | 0 (0.0%) | 0 (0.0%) |
| Total | 2 (100.0%) | 27 (100.0%) |
Monthly Housing Cost Tiers in Evergreen
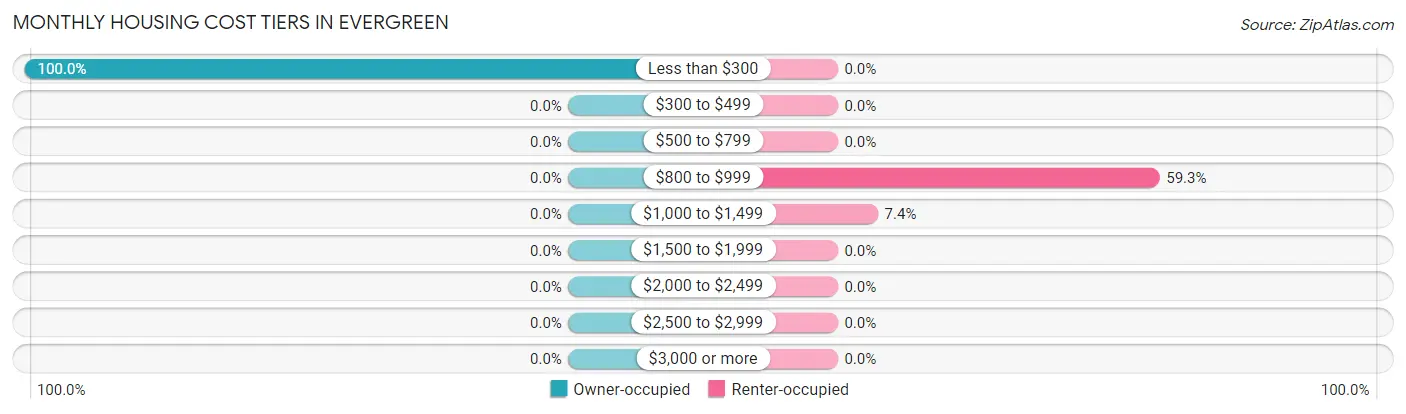
| Monthly Cost | Owner-occupied | Renter-occupied |
| Less than $300 | 2 (100.0%) | 0 (0.0%) |
| $300 to $499 | 0 (0.0%) | 0 (0.0%) |
| $500 to $799 | 0 (0.0%) | 0 (0.0%) |
| $800 to $999 | 0 (0.0%) | 16 (59.3%) |
| $1,000 to $1,499 | 0 (0.0%) | 2 (7.4%) |
| $1,500 to $1,999 | 0 (0.0%) | 0 (0.0%) |
| $2,000 to $2,499 | 0 (0.0%) | 0 (0.0%) |
| $2,500 to $2,999 | 0 (0.0%) | 0 (0.0%) |
| $3,000 or more | 0 (0.0%) | 0 (0.0%) |
| Total | 2 (100.0%) | 27 (100.0%) |
Physical Housing Characteristics in Evergreen
Housing Structures in Evergreen
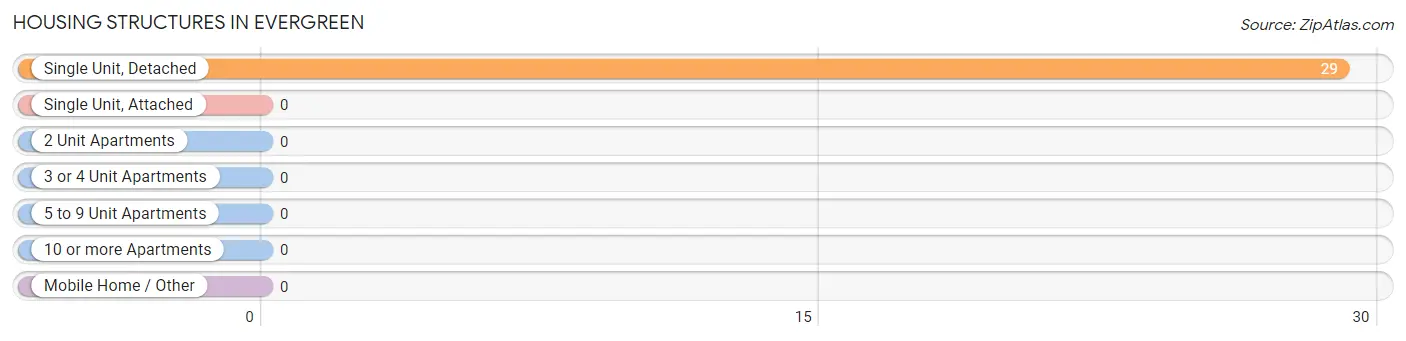
| Structure Type | # Housing Units | % Housing Units |
| Single Unit, Detached | 29 | 100.0% |
| Single Unit, Attached | 0 | 0.0% |
| 2 Unit Apartments | 0 | 0.0% |
| 3 or 4 Unit Apartments | 0 | 0.0% |
| 5 to 9 Unit Apartments | 0 | 0.0% |
| 10 or more Apartments | 0 | 0.0% |
| Mobile Home / Other | 0 | 0.0% |
| Total | 29 | 100.0% |
Housing Structures by Occupancy in Evergreen
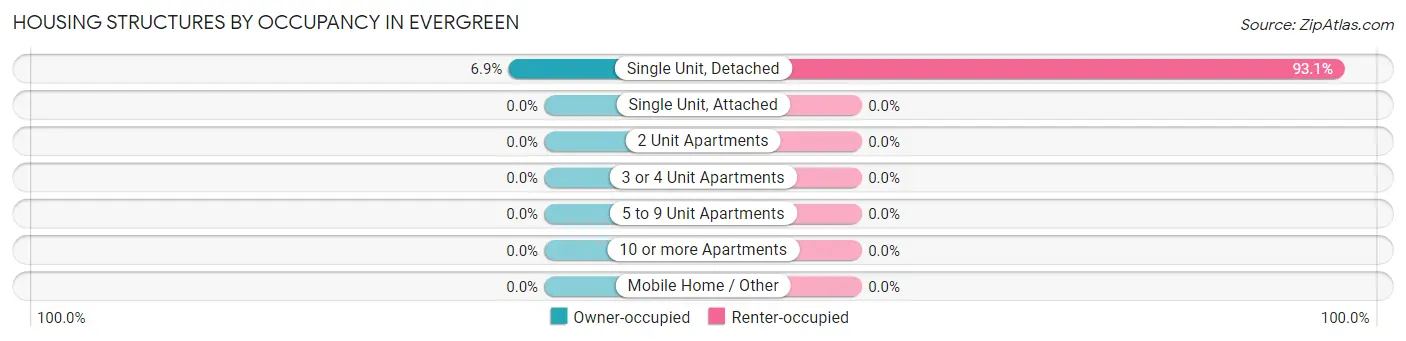
| Structure Type | Owner-occupied | Renter-occupied |
| Single Unit, Detached | 2 (6.9%) | 27 (93.1%) |
| Single Unit, Attached | 0 (0.0%) | 0 (0.0%) |
| 2 Unit Apartments | 0 (0.0%) | 0 (0.0%) |
| 3 or 4 Unit Apartments | 0 (0.0%) | 0 (0.0%) |
| 5 to 9 Unit Apartments | 0 (0.0%) | 0 (0.0%) |
| 10 or more Apartments | 0 (0.0%) | 0 (0.0%) |
| Mobile Home / Other | 0 (0.0%) | 0 (0.0%) |
| Total | 2 (6.9%) | 27 (93.1%) |
Housing Structures by Number of Rooms in Evergreen
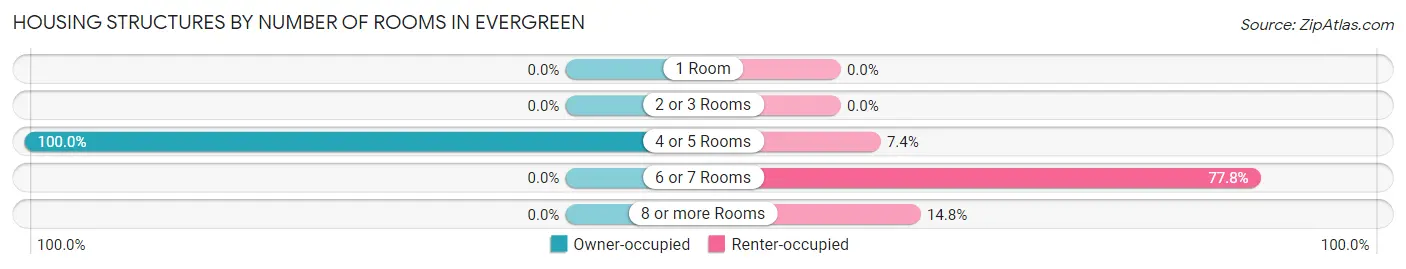
| Number of Rooms | Owner-occupied | Renter-occupied |
| 1 Room | 0 (0.0%) | 0 (0.0%) |
| 2 or 3 Rooms | 0 (0.0%) | 0 (0.0%) |
| 4 or 5 Rooms | 2 (100.0%) | 2 (7.4%) |
| 6 or 7 Rooms | 0 (0.0%) | 21 (77.8%) |
| 8 or more Rooms | 0 (0.0%) | 4 (14.8%) |
| Total | 2 (100.0%) | 27 (100.0%) |
Housing Structure by Heating Type in Evergreen
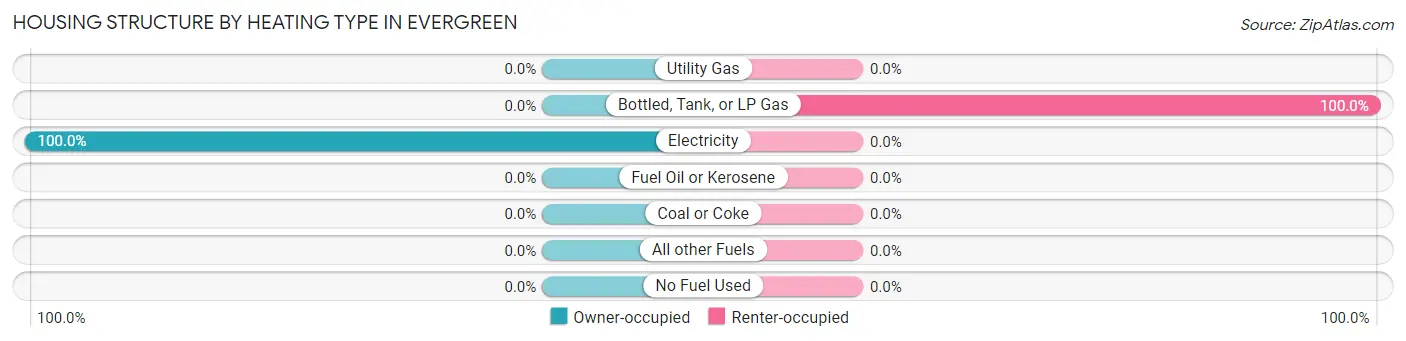
| Heating Type | Owner-occupied | Renter-occupied |
| Utility Gas | 0 (0.0%) | 0 (0.0%) |
| Bottled, Tank, or LP Gas | 0 (0.0%) | 27 (100.0%) |
| Electricity | 2 (100.0%) | 0 (0.0%) |
| Fuel Oil or Kerosene | 0 (0.0%) | 0 (0.0%) |
| Coal or Coke | 0 (0.0%) | 0 (0.0%) |
| All other Fuels | 0 (0.0%) | 0 (0.0%) |
| No Fuel Used | 0 (0.0%) | 0 (0.0%) |
| Total | 2 (100.0%) | 27 (100.0%) |
Household Vehicle Usage in Evergreen
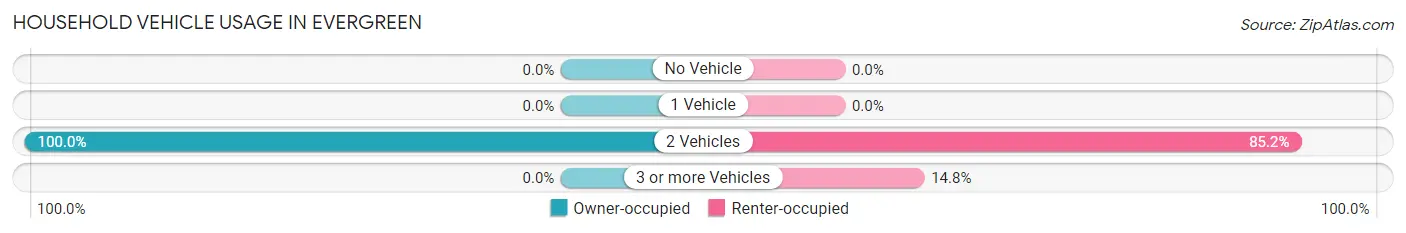
| Vehicles per Household | Owner-occupied | Renter-occupied |
| No Vehicle | 0 (0.0%) | 0 (0.0%) |
| 1 Vehicle | 0 (0.0%) | 0 (0.0%) |
| 2 Vehicles | 2 (100.0%) | 23 (85.2%) |
| 3 or more Vehicles | 0 (0.0%) | 4 (14.8%) |
| Total | 2 (100.0%) | 27 (100.0%) |
Real Estate & Mortgages in Evergreen
Real Estate and Mortgage Overview in Evergreen
| Characteristic | Without Mortgage | With Mortgage |
| Housing Units | 2 | 0 |
| Median Property Value | - | - |
| Median Household Income | - | - |
| Monthly Housing Costs | - | - |
| Real Estate Taxes | - | - |
Property Value by Mortgage Status in Evergreen
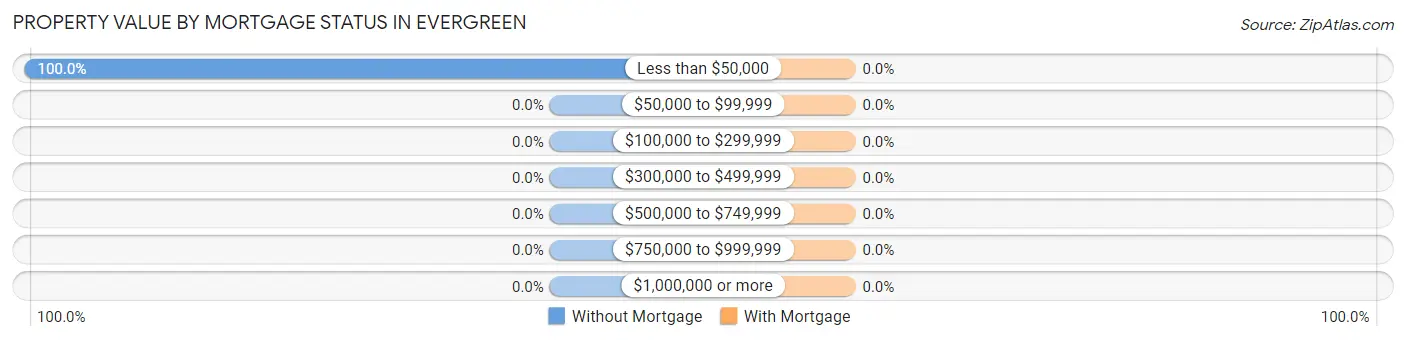
| Property Value | Without Mortgage | With Mortgage |
| Less than $50,000 | 2 (100.0%) | 0 (0.0%) |
| $50,000 to $99,999 | 0 (0.0%) | 0 (0.0%) |
| $100,000 to $299,999 | 0 (0.0%) | 0 (0.0%) |
| $300,000 to $499,999 | 0 (0.0%) | 0 (0.0%) |
| $500,000 to $749,999 | 0 (0.0%) | 0 (0.0%) |
| $750,000 to $999,999 | 0 (0.0%) | 0 (0.0%) |
| $1,000,000 or more | 0 (0.0%) | 0 (0.0%) |
| Total | 2 (100.0%) | 0 (0.0%) |
Household Income by Mortgage Status in Evergreen
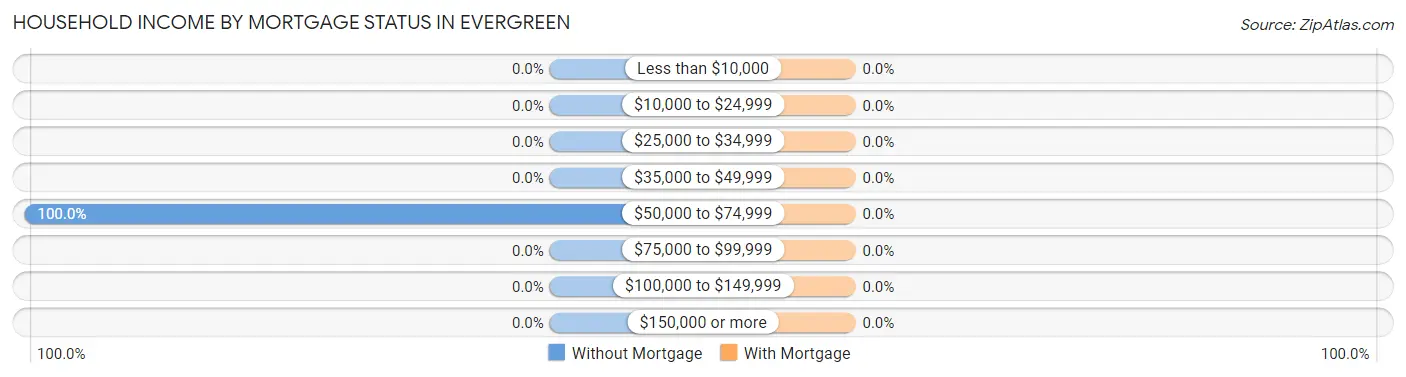
| Household Income | Without Mortgage | With Mortgage |
| Less than $10,000 | 0 (0.0%) | 0 (0.0%) |
| $10,000 to $24,999 | 0 (0.0%) | 0 (0.0%) |
| $25,000 to $34,999 | 0 (0.0%) | 0 (0.0%) |
| $35,000 to $49,999 | 0 (0.0%) | 0 (0.0%) |
| $50,000 to $74,999 | 2 (100.0%) | 0 (0.0%) |
| $75,000 to $99,999 | 0 (0.0%) | 0 (0.0%) |
| $100,000 to $149,999 | 0 (0.0%) | 0 (0.0%) |
| $150,000 or more | 0 (0.0%) | 0 (0.0%) |
| Total | 2 (100.0%) | 0 (0.0%) |
Property Value to Household Income Ratio in Evergreen
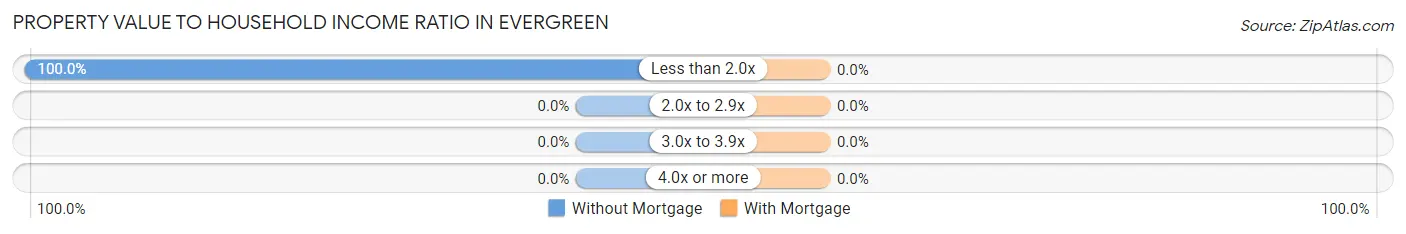
| Value-to-Income Ratio | Without Mortgage | With Mortgage |
| Less than 2.0x | 2 (100.0%) | 0 (0.0%) |
| 2.0x to 2.9x | 0 (0.0%) | 0 (0.0%) |
| 3.0x to 3.9x | 0 (0.0%) | 0 (0.0%) |
| 4.0x or more | 0 (0.0%) | 0 (0.0%) |
| Total | 2 (100.0%) | 0 (0.0%) |
Real Estate Taxes by Mortgage Status in Evergreen
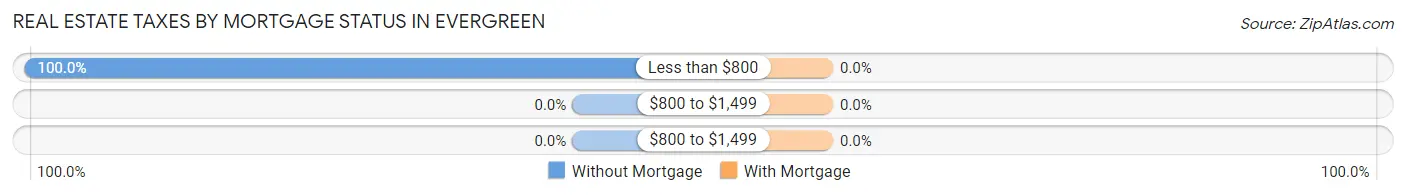
| Property Taxes | Without Mortgage | With Mortgage |
| Less than $800 | 2 (100.0%) | 0 (0.0%) |
| $800 to $1,499 | 0 (0.0%) | 0 (0.0%) |
| $800 to $1,499 | 0 (0.0%) | 0 (0.0%) |
| Total | 2 (100.0%) | 0 (0.0%) |
Health & Disability in Evergreen
Health Insurance Coverage by Age in Evergreen
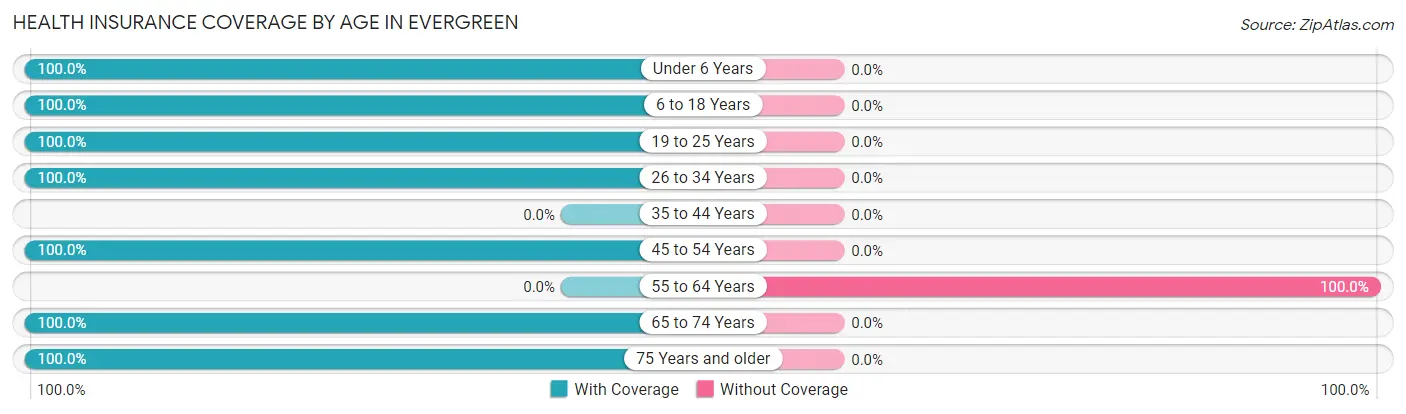
| Age Bracket | With Coverage | Without Coverage |
| Under 6 Years | 16 (100.0%) | 0 (0.0%) |
| 6 to 18 Years | 7 (100.0%) | 0 (0.0%) |
| 19 to 25 Years | 10 (100.0%) | 0 (0.0%) |
| 26 to 34 Years | 32 (100.0%) | 0 (0.0%) |
| 35 to 44 Years | 0 (0.0%) | 0 (0.0%) |
| 45 to 54 Years | 4 (100.0%) | 0 (0.0%) |
| 55 to 64 Years | 0 (0.0%) | 3 (100.0%) |
| 65 to 74 Years | 22 (100.0%) | 0 (0.0%) |
| 75 Years and older | 1 (100.0%) | 0 (0.0%) |
| Total | 92 (96.8%) | 3 (3.2%) |
Health Insurance Coverage by Citizenship Status in Evergreen
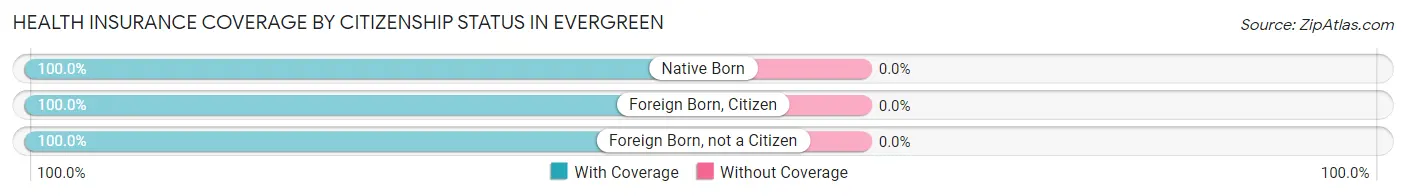
| Citizenship Status | With Coverage | Without Coverage |
| Native Born | 16 (100.0%) | 0 (0.0%) |
| Foreign Born, Citizen | 7 (100.0%) | 0 (0.0%) |
| Foreign Born, not a Citizen | 10 (100.0%) | 0 (0.0%) |
Health Insurance Coverage by Household Income in Evergreen
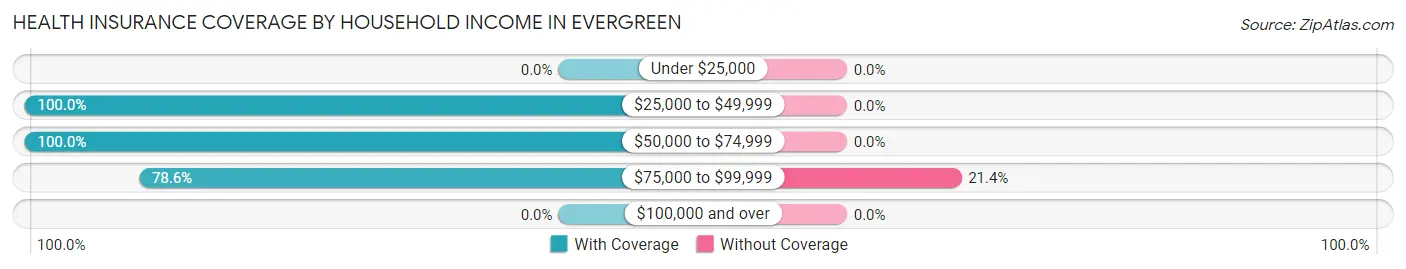
| Household Income | With Coverage | Without Coverage |
| Under $25,000 | 0 (0.0%) | 0 (0.0%) |
| $25,000 to $49,999 | 78 (100.0%) | 0 (0.0%) |
| $50,000 to $74,999 | 3 (100.0%) | 0 (0.0%) |
| $75,000 to $99,999 | 11 (78.6%) | 3 (21.4%) |
| $100,000 and over | 0 (0.0%) | 0 (0.0%) |
Public vs Private Health Insurance Coverage by Age in Evergreen
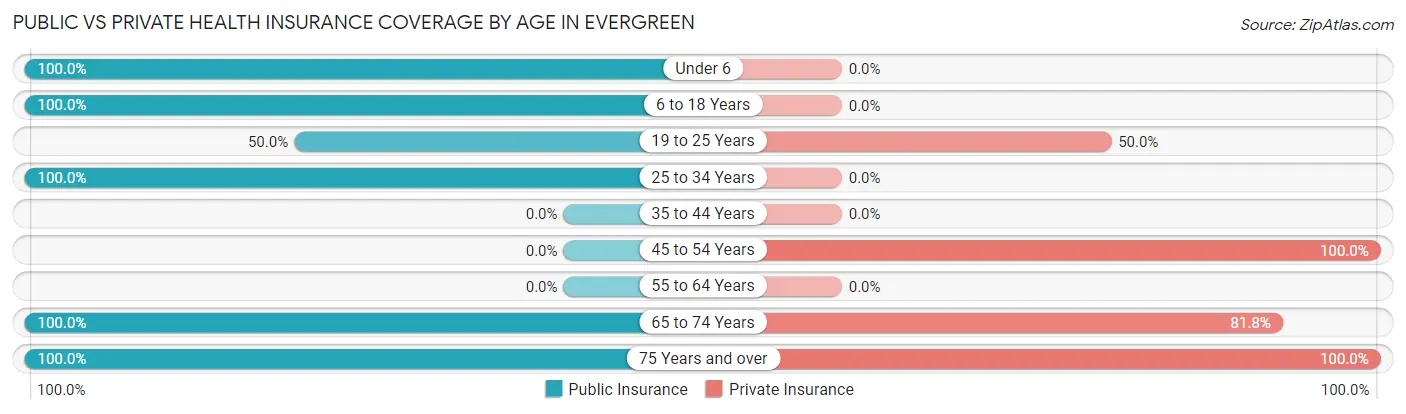
| Age Bracket | Public Insurance | Private Insurance |
| Under 6 | 16 (100.0%) | 0 (0.0%) |
| 6 to 18 Years | 7 (100.0%) | 0 (0.0%) |
| 19 to 25 Years | 5 (50.0%) | 5 (50.0%) |
| 25 to 34 Years | 32 (100.0%) | 0 (0.0%) |
| 35 to 44 Years | 0 (0.0%) | 0 (0.0%) |
| 45 to 54 Years | 0 (0.0%) | 4 (100.0%) |
| 55 to 64 Years | 0 (0.0%) | 0 (0.0%) |
| 65 to 74 Years | 22 (100.0%) | 18 (81.8%) |
| 75 Years and over | 1 (100.0%) | 1 (100.0%) |
| Total | 83 (87.4%) | 28 (29.5%) |
Disability Status by Sex by Age in Evergreen
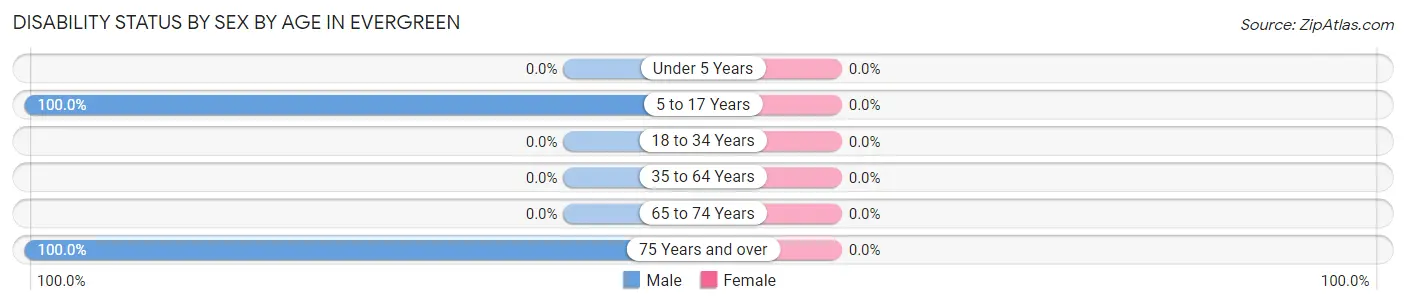
| Age Bracket | Male | Female |
| Under 5 Years | 0 (0.0%) | 0 (0.0%) |
| 5 to 17 Years | 3 (100.0%) | 0 (0.0%) |
| 18 to 34 Years | 0 (0.0%) | 0 (0.0%) |
| 35 to 64 Years | 0 (0.0%) | 0 (0.0%) |
| 65 to 74 Years | 0 (0.0%) | 0 (0.0%) |
| 75 Years and over | 1 (100.0%) | 0 (0.0%) |
Disability Class by Sex by Age in Evergreen
Disability Class: Hearing Difficulty
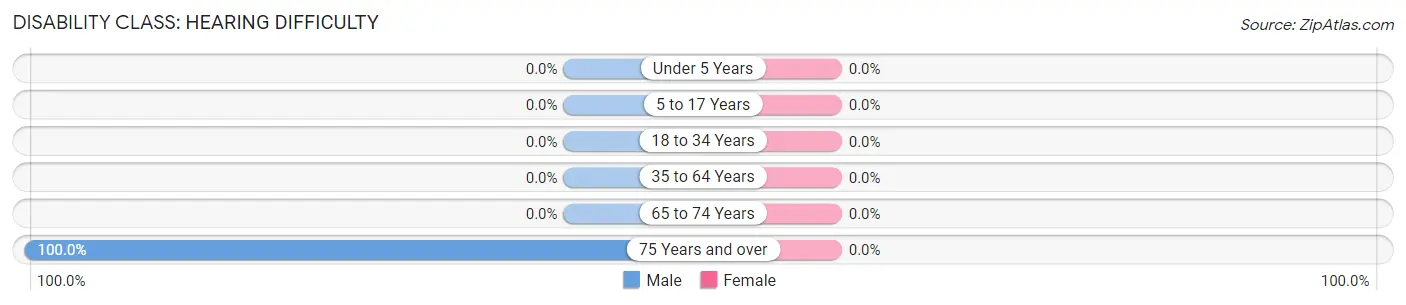
| Age Bracket | Male | Female |
| Under 5 Years | 0 (0.0%) | 0 (0.0%) |
| 5 to 17 Years | 0 (0.0%) | 0 (0.0%) |
| 18 to 34 Years | 0 (0.0%) | 0 (0.0%) |
| 35 to 64 Years | 0 (0.0%) | 0 (0.0%) |
| 65 to 74 Years | 0 (0.0%) | 0 (0.0%) |
| 75 Years and over | 1 (100.0%) | 0 (0.0%) |
Disability Class: Vision Difficulty
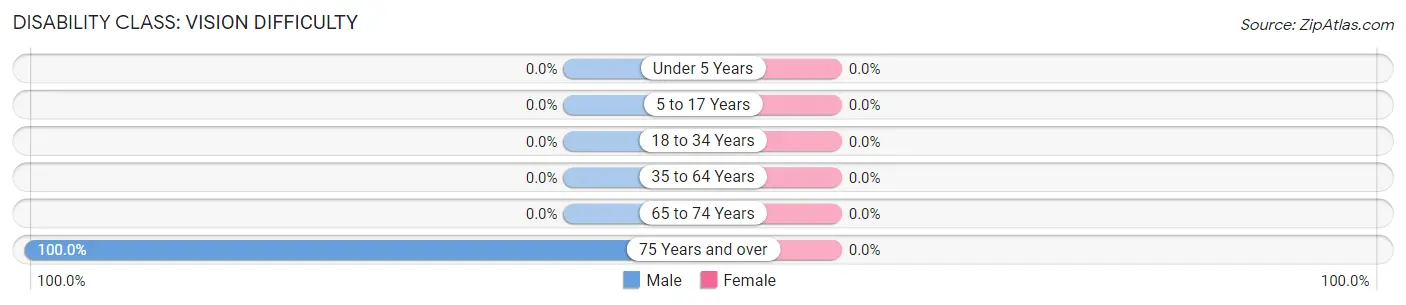
| Age Bracket | Male | Female |
| Under 5 Years | 0 (0.0%) | 0 (0.0%) |
| 5 to 17 Years | 0 (0.0%) | 0 (0.0%) |
| 18 to 34 Years | 0 (0.0%) | 0 (0.0%) |
| 35 to 64 Years | 0 (0.0%) | 0 (0.0%) |
| 65 to 74 Years | 0 (0.0%) | 0 (0.0%) |
| 75 Years and over | 1 (100.0%) | 0 (0.0%) |
Disability Class: Cognitive Difficulty
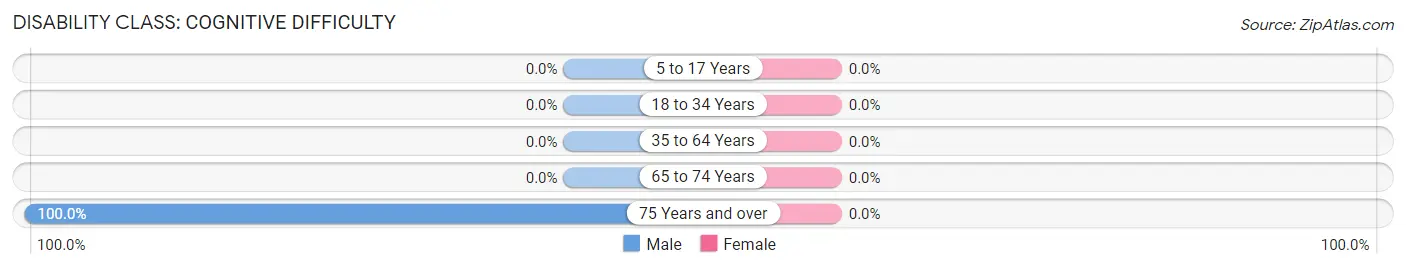
| Age Bracket | Male | Female |
| 5 to 17 Years | 0 (0.0%) | 0 (0.0%) |
| 18 to 34 Years | 0 (0.0%) | 0 (0.0%) |
| 35 to 64 Years | 0 (0.0%) | 0 (0.0%) |
| 65 to 74 Years | 0 (0.0%) | 0 (0.0%) |
| 75 Years and over | 1 (100.0%) | 0 (0.0%) |
Disability Class: Ambulatory Difficulty
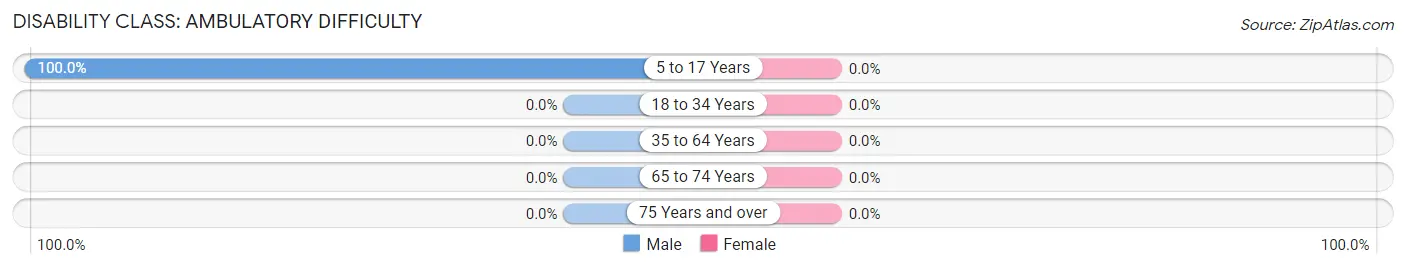
| Age Bracket | Male | Female |
| 5 to 17 Years | 3 (100.0%) | 0 (0.0%) |
| 18 to 34 Years | 0 (0.0%) | 0 (0.0%) |
| 35 to 64 Years | 0 (0.0%) | 0 (0.0%) |
| 65 to 74 Years | 0 (0.0%) | 0 (0.0%) |
| 75 Years and over | 0 (0.0%) | 0 (0.0%) |
Disability Class: Self-Care Difficulty
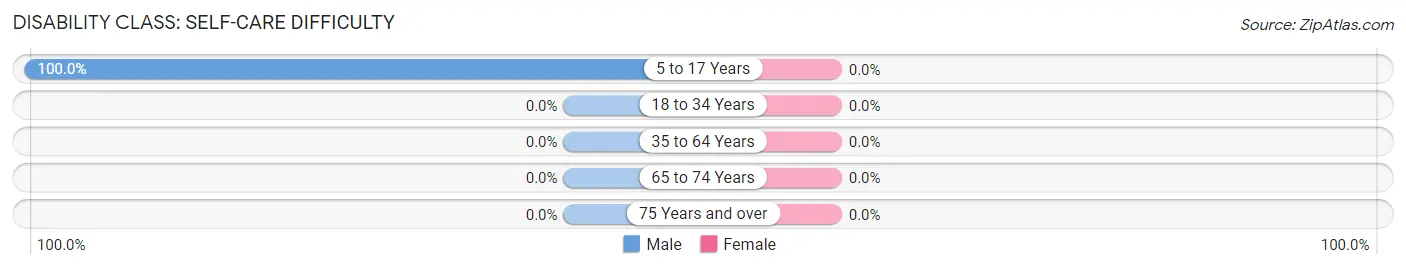
| Age Bracket | Male | Female |
| 5 to 17 Years | 3 (100.0%) | 0 (0.0%) |
| 18 to 34 Years | 0 (0.0%) | 0 (0.0%) |
| 35 to 64 Years | 0 (0.0%) | 0 (0.0%) |
| 65 to 74 Years | 0 (0.0%) | 0 (0.0%) |
| 75 Years and over | 0 (0.0%) | 0 (0.0%) |
Technology Access in Evergreen
Computing Device Access in Evergreen
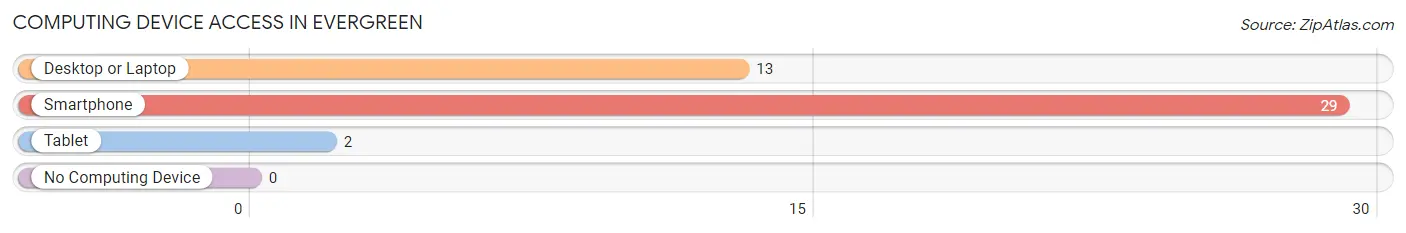
| Device Type | # Households | % Households |
| Desktop or Laptop | 13 | 44.8% |
| Smartphone | 29 | 100.0% |
| Tablet | 2 | 6.9% |
| No Computing Device | 0 | 0.0% |
| Total | 29 | 100.0% |
Internet Access in Evergreen
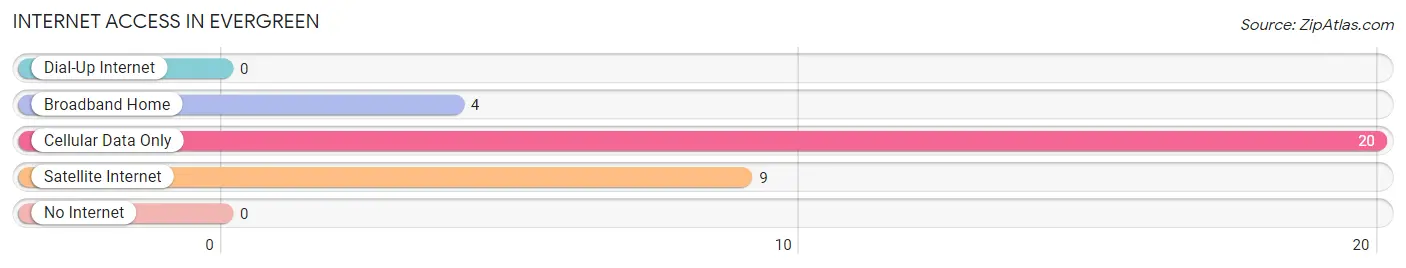
| Internet Type | # Households | % Households |
| Dial-Up Internet | 0 | 0.0% |
| Broadband Home | 4 | 13.8% |
| Cellular Data Only | 20 | 69.0% |
| Satellite Internet | 9 | 31.0% |
| No Internet | 0 | 0.0% |
| Total | 29 | 100.0% |
Evergreen Summary
History
The small town of Evergreen, Missouri is located in the southeastern corner of the state, just a few miles from the Mississippi River. The town was founded in 1837 by a group of settlers from Kentucky and Tennessee who were looking for a new home. The town was named after the evergreen trees that grew in the area.
The town grew slowly but steadily over the years, and by the early 1900s it had become a thriving agricultural community. The town was home to several small businesses, including a general store, a blacksmith shop, and a sawmill. The town also had a school, a post office, and a church.
In the 1920s, the town began to experience a period of growth and prosperity. The population increased from just over 500 in 1920 to nearly 1,000 by 1930. During this time, the town was home to several businesses, including a bank, a movie theater, and a hotel.
The Great Depression hit Evergreen hard, and the population declined to just over 500 by 1940. The town was able to recover, however, and by 1950 the population had grown to nearly 1,200.
The town continued to grow throughout the 1950s and 1960s, and by 1970 the population had reached nearly 1,500. During this time, the town was home to several businesses, including a grocery store, a hardware store, and a restaurant.
In the late 1970s and early 1980s, the town experienced a period of decline. The population decreased to just over 1,000 by 1980, and many of the businesses in town closed.
In the late 1980s and early 1990s, the town began to experience a period of revitalization. Several new businesses opened, and the population increased to nearly 1,400 by 2000.
Geography
Evergreen is located in the southeastern corner of Missouri, just a few miles from the Mississippi River. The town is situated in a rural area, surrounded by rolling hills and farmland. The town is located about 25 miles from the nearest major city, Cape Girardeau.
The climate in Evergreen is mild and humid, with hot summers and cold winters. The average annual temperature is around 60 degrees Fahrenheit. The town receives an average of 40 inches of precipitation per year.
Economy
The economy of Evergreen is largely based on agriculture. The town is home to several farms, which produce a variety of crops, including corn, soybeans, and wheat. The town is also home to several small businesses, including a grocery store, a hardware store, and a restaurant.
The town is also home to several manufacturing companies, which produce a variety of products, including furniture, clothing, and automotive parts. The town is also home to several service-based businesses, including a bank, a movie theater, and a hotel.
Demographics
As of the 2010 census, the population of Evergreen was 1,521. The town is predominantly white, with a small African American population. The median household income is around $35,000, and the median home value is around $90,000. The town has a high school graduation rate of around 80%.
Common Questions
What is Per Capita Income in Evergreen?
Per Capita income in Evergreen is $16,751.
What is the Median Family Income in Evergreen?
Median Family Income in Evergreen is $43,828.
What is the Median Household income in Evergreen?
Median Household Income in Evergreen is $43,984.
What is Inequality or Gini Index in Evergreen?
Inequality or Gini Index in Evergreen is 0.15.
What is the Total Population of Evergreen?
Total Population of Evergreen is 95.
What is the Total Male Population of Evergreen?
Total Male Population of Evergreen is 17.
What is the Total Female Population of Evergreen?
Total Female Population of Evergreen is 78.
What is the Ratio of Males per 100 Females in Evergreen?
There are 21.79 Males per 100 Females in Evergreen.
What is the Ratio of Females per 100 Males in Evergreen?
There are 458.82 Females per 100 Males in Evergreen.
What is the Median Population Age in Evergreen?
Median Population Age in Evergreen is 33.5 Years.
What is the Average Family Size in Evergreen
Average Family Size in Evergreen is 2.7 People.
What is the Average Household Size in Evergreen
Average Household Size in Evergreen is 3.3 People.
How Large is the Labor Force in Evergreen?
There are 27 People in the Labor Forcein in Evergreen.
What is the Percentage of People in the Labor Force in Evergreen?
35.5% of People are in the Labor Force in Evergreen.