Zip Codes with the Highest Percentage of Population Employed in Food Preparation & Serving in the United States
RELATED REPORTS & OPTIONS
Food Preparation & Serving
United States
Compare Zip Codes
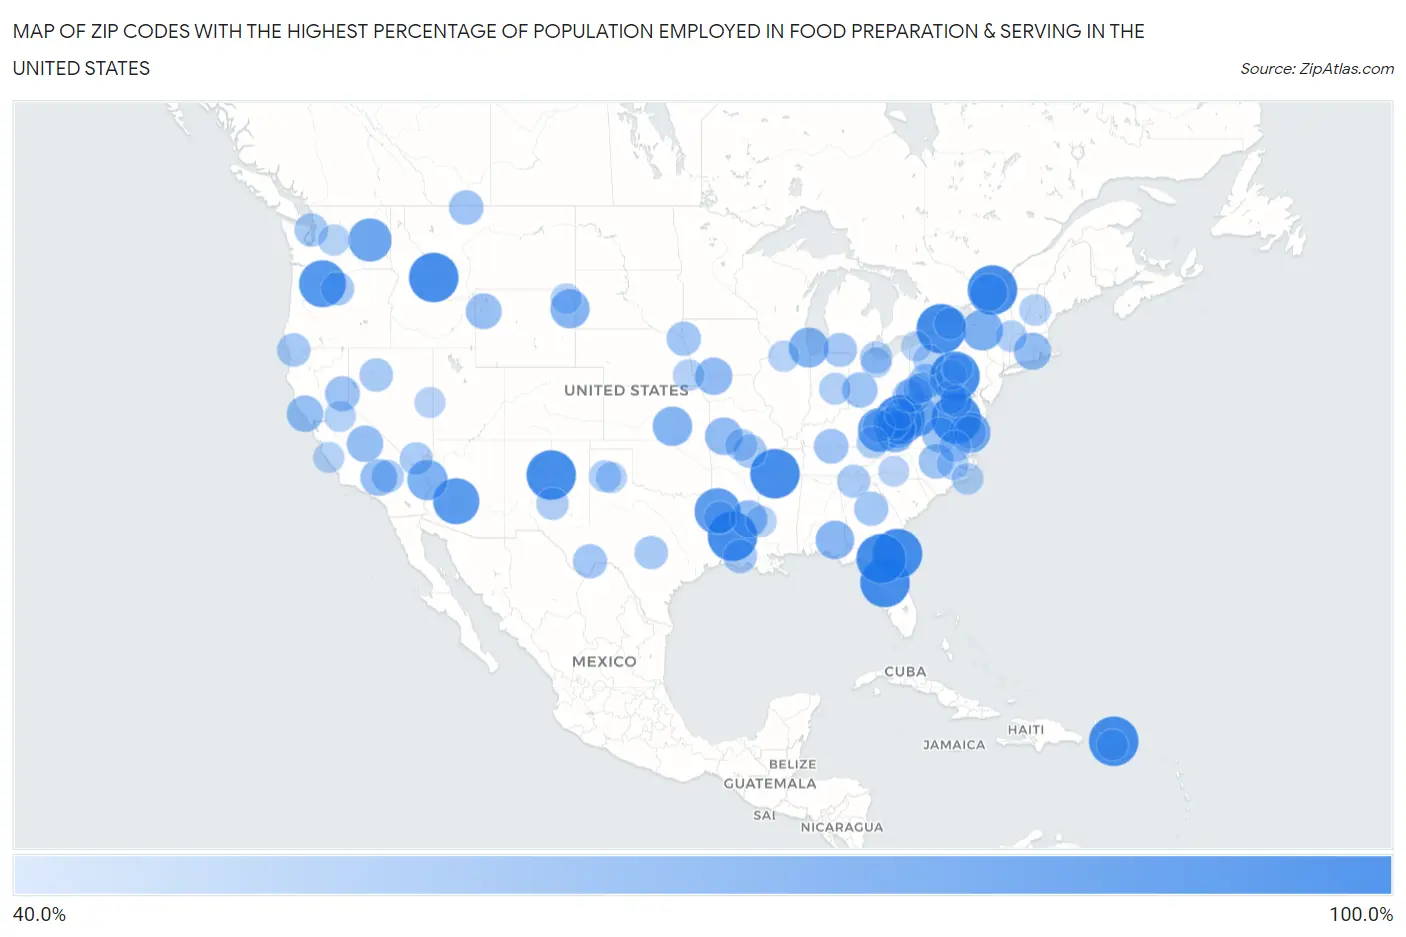
Map of Zip Codes with the Highest Percentage of Population Employed in Food Preparation & Serving in the United States
40.0%
100.0%
Zip Codes with the Highest Percentage of Population Employed in Food Preparation & Serving in the United States
| Zip Code | % Employed | vs State | vs National | |
| 1. | 00960 | 100.0% | 5.7%(+94.3)#1 | 5.3%(+94.7)#1 |
| 2. | 34661 | 100.0% | 6.1%(+93.9)#1 | 5.3%(+94.7)#2 |
| 3. | 25057 | 100.0% | 5.7%(+94.3)#1 | 5.3%(+94.7)#3 |
| 4. | 32228 | 100.0% | 6.1%(+93.9)#2 | 5.3%(+94.7)#4 |
| 5. | 71455 | 100.0% | 6.0%(+94.0)#1 | 5.3%(+94.7)#5 |
| 6. | 14056 | 100.0% | 4.8%(+95.2)#1 | 5.3%(+94.7)#6 |
| 7. | 22538 | 100.0% | 4.8%(+95.2)#1 | 5.3%(+94.7)#7 |
| 8. | 13683 | 100.0% | 4.8%(+95.2)#2 | 5.3%(+94.7)#8 |
| 9. | 32061 | 100.0% | 6.1%(+93.9)#3 | 5.3%(+94.7)#9 |
| 10. | 38132 | 100.0% | 5.4%(+94.6)#1 | 5.3%(+94.7)#10 |
| 11. | 83463 | 100.0% | 5.7%(+94.3)#1 | 5.3%(+94.7)#11 |
| 12. | 17056 | 100.0% | 5.0%(+95.0)#1 | 5.3%(+94.7)#12 |
| 13. | 87070 | 100.0% | 5.8%(+94.2)#1 | 5.3%(+94.7)#13 |
| 14. | 97028 | 91.5% | 5.9%(+85.6)#1 | 5.3%(+86.2)#14 |
| 15. | 85309 | 89.5% | 5.7%(+83.8)#1 | 5.3%(+84.2)#15 |
| 16. | 75565 | 88.6% | 5.4%(+83.2)#1 | 5.3%(+83.3)#16 |
| 17. | 41663 | 82.9% | 5.1%(+77.8)#1 | 5.3%(+77.6)#17 |
| 18. | 26209 | 80.8% | 5.7%(+75.1)#2 | 5.3%(+75.5)#18 |
| 19. | 99144 | 80.0% | 5.1%(+74.9)#1 | 5.3%(+74.7)#19 |
| 20. | 23045 | 73.1% | 4.8%(+68.3)#2 | 5.3%(+67.8)#20 |
| 21. | 13455 | 72.7% | 4.8%(+67.9)#3 | 5.3%(+67.4)#21 |
| 22. | 86436 | 71.3% | 5.7%(+65.6)#2 | 5.3%(+66.0)#22 |
| 23. | 60208 | 69.4% | 5.0%(+64.4)#1 | 5.3%(+64.2)#23 |
| 24. | 24853 | 68.4% | 5.7%(+62.8)#3 | 5.3%(+63.1)#24 |
| 25. | 67055 | 68.3% | 5.2%(+63.1)#1 | 5.3%(+63.0)#25 |
| 26. | 82723 | 67.3% | 5.9%(+61.5)#1 | 5.3%(+62.1)#26 |
| 27. | 36313 | 65.6% | 5.2%(+60.4)#1 | 5.3%(+60.3)#27 |
| 28. | 13678 | 62.7% | 4.8%(+57.9)#4 | 5.3%(+57.4)#28 |
| 29. | 65664 | 62.5% | 5.2%(+57.3)#1 | 5.3%(+57.2)#29 |
| 30. | 64420 | 61.5% | 5.2%(+56.3)#2 | 5.3%(+56.3)#30 |
| 31. | 06263 | 61.2% | 4.7%(+56.5)#1 | 5.3%(+55.9)#31 |
| 32. | 71279 | 61.0% | 6.0%(+55.0)#2 | 5.3%(+55.7)#32 |
| 33. | 93524 | 60.0% | 5.4%(+54.6)#1 | 5.3%(+54.7)#33 |
| 34. | 95486 | 59.3% | 5.4%(+53.9)#2 | 5.3%(+54.0)#34 |
| 35. | 93628 | 59.0% | 5.4%(+53.6)#3 | 5.3%(+53.7)#35 |
| 36. | 25826 | 58.8% | 5.7%(+53.2)#4 | 5.3%(+53.5)#36 |
| 37. | 25942 | 57.7% | 5.7%(+52.0)#5 | 5.3%(+52.4)#37 |
| 38. | 83013 | 57.1% | 5.9%(+51.2)#2 | 5.3%(+51.8)#38 |
| 39. | 26563 | 56.1% | 5.7%(+50.5)#6 | 5.3%(+50.9)#39 |
| 40. | 23909 | 55.3% | 4.8%(+50.5)#3 | 5.3%(+50.0)#40 |
| 41. | 45435 | 55.2% | 5.6%(+49.6)#1 | 5.3%(+49.9)#41 |
| 42. | 96126 | 55.0% | 5.4%(+49.6)#4 | 5.3%(+49.7)#42 |
| 43. | 27695 | 54.6% | 5.3%(+49.3)#1 | 5.3%(+49.3)#43 |
| 44. | 42153 | 53.5% | 5.1%(+48.4)#2 | 5.3%(+48.2)#44 |
| 45. | 59484 | 53.3% | 6.7%(+46.6)#1 | 5.3%(+48.0)#45 |
| 46. | 15638 | 53.2% | 5.0%(+48.2)#2 | 5.3%(+47.9)#46 |
| 47. | 25646 | 52.5% | 5.7%(+46.9)#7 | 5.3%(+47.2)#47 |
| 48. | 51101 | 52.4% | 5.1%(+47.3)#1 | 5.3%(+47.1)#48 |
| 49. | 79842 | 52.0% | 5.4%(+46.7)#2 | 5.3%(+46.7)#49 |
| 50. | 31034 | 52.0% | 5.1%(+46.9)#1 | 5.3%(+46.7)#50 |
| 51. | 25849 | 51.5% | 5.7%(+45.9)#8 | 5.3%(+46.3)#51 |
| 52. | 49075 | 51.5% | 5.7%(+45.8)#1 | 5.3%(+46.2)#52 |
| 53. | 70531 | 51.1% | 6.0%(+45.0)#3 | 5.3%(+45.8)#53 |
| 54. | 72520 | 50.0% | 5.4%(+44.6)#1 | 5.3%(+44.7)#54 |
| 55. | 95543 | 50.0% | 5.4%(+44.6)#5 | 5.3%(+44.7)#55 |
| 56. | 25093 | 50.0% | 5.7%(+44.3)#9 | 5.3%(+44.7)#56 |
| 57. | 89418 | 50.0% | 8.6%(+41.4)#1 | 5.3%(+44.7)#57 |
| 58. | 78675 | 50.0% | 5.4%(+44.6)#3 | 5.3%(+44.7)#58 |
| 59. | 98364 | 50.0% | 5.1%(+44.9)#2 | 5.3%(+44.7)#59 |
| 60. | 97057 | 50.0% | 5.9%(+44.1)#2 | 5.3%(+44.7)#60 |
| 61. | 21715 | 50.0% | 4.4%(+45.6)#1 | 5.3%(+44.7)#61 |
| 62. | 30539 | 48.5% | 5.1%(+43.3)#2 | 5.3%(+43.2)#62 |
| 63. | 26339 | 48.4% | 5.7%(+42.7)#10 | 5.3%(+43.1)#63 |
| 64. | 89054 | 48.3% | 8.6%(+39.6)#2 | 5.3%(+43.0)#64 |
| 65. | 23119 | 47.6% | 4.8%(+42.8)#4 | 5.3%(+42.3)#65 |
| 66. | 92347 | 47.3% | 5.4%(+41.9)#6 | 5.3%(+42.0)#66 |
| 67. | 88355 | 46.8% | 5.8%(+41.0)#2 | 5.3%(+41.5)#67 |
| 68. | 65618 | 46.5% | 5.2%(+41.3)#3 | 5.3%(+41.2)#68 |
| 69. | 43433 | 46.5% | 5.6%(+40.9)#2 | 5.3%(+41.2)#69 |
| 70. | 71009 | 46.2% | 6.0%(+40.1)#4 | 5.3%(+40.9)#70 |
| 71. | 41204 | 45.9% | 5.1%(+40.8)#3 | 5.3%(+40.6)#71 |
| 72. | 79016 | 45.4% | 5.4%(+40.1)#4 | 5.3%(+40.1)#72 |
| 73. | 20899 | 45.2% | 4.4%(+40.8)#2 | 5.3%(+39.9)#73 |
| 74. | 40847 | 45.2% | 5.1%(+40.1)#4 | 5.3%(+39.9)#74 |
| 75. | 14515 | 45.0% | 4.8%(+40.1)#5 | 5.3%(+39.7)#75 |
| 76. | 46154 | 44.7% | 5.3%(+39.4)#1 | 5.3%(+39.5)#76 |
| 77. | 27827 | 44.5% | 5.3%(+39.3)#2 | 5.3%(+39.3)#77 |
| 78. | 12040 | 44.4% | 4.8%(+39.6)#6 | 5.3%(+39.2)#78 |
| 79. | 28589 | 44.4% | 5.3%(+39.2)#3 | 5.3%(+39.2)#79 |
| 80. | 23844 | 44.3% | 4.8%(+39.5)#5 | 5.3%(+39.0)#80 |
| 81. | 68382 | 44.1% | 5.1%(+39.0)#1 | 5.3%(+38.8)#81 |
| 82. | 03293 | 43.8% | 5.2%(+38.6)#1 | 5.3%(+38.5)#82 |
| 83. | 95232 | 43.5% | 5.4%(+38.1)#7 | 5.3%(+38.2)#83 |
| 84. | 00786 | 43.5% | 5.7%(+37.8)#2 | 5.3%(+38.2)#84 |
| 85. | 98940 | 43.2% | 5.1%(+38.1)#3 | 5.3%(+37.9)#85 |
| 86. | 15454 | 43.1% | 5.0%(+38.0)#3 | 5.3%(+37.8)#86 |
| 87. | 16217 | 42.9% | 5.0%(+37.8)#4 | 5.3%(+37.6)#87 |
| 88. | 61374 | 42.9% | 5.0%(+37.8)#2 | 5.3%(+37.6)#88 |
| 89. | 79094 | 42.9% | 5.4%(+37.5)#5 | 5.3%(+37.6)#89 |
| 90. | 93928 | 42.6% | 5.4%(+37.3)#8 | 5.3%(+37.4)#90 |
| 91. | 71233 | 42.3% | 6.0%(+36.2)#5 | 5.3%(+37.0)#91 |
| 92. | 89311 | 42.2% | 8.6%(+33.5)#3 | 5.3%(+36.9)#92 |
| 93. | 82714 | 42.1% | 5.9%(+36.2)#3 | 5.3%(+36.8)#93 |
| 94. | 28017 | 41.9% | 5.3%(+36.6)#4 | 5.3%(+36.6)#94 |
| 95. | 17029 | 41.4% | 5.0%(+36.3)#5 | 5.3%(+36.1)#95 |
| 96. | 25030 | 41.0% | 5.7%(+35.3)#11 | 5.3%(+35.7)#96 |
| 97. | 17880 | 40.9% | 5.0%(+35.9)#6 | 5.3%(+35.6)#97 |
| 98. | 44828 | 40.9% | 5.6%(+35.3)#3 | 5.3%(+35.6)#98 |
| 99. | 15465 | 40.7% | 5.0%(+35.7)#7 | 5.3%(+35.5)#99 |
| 100. | 16546 | 40.5% | 5.0%(+35.5)#8 | 5.3%(+35.2)#100 |
Common Questions
What are the Top 10 Zip Codes with the Highest Percentage of Population Employed in Food Preparation & Serving in the United States?
Top 10 Zip Codes with the Highest Percentage of Population Employed in Food Preparation & Serving in the United States are:
What zip code has the Highest Percentage of Population Employed in Food Preparation & Serving in the United States?
00960 has the Highest Percentage of Population Employed in Food Preparation & Serving in the United States with 100.0%.
What is the Percentage of Population Employed in Food Preparation & Serving in the United States?
Percentage of Population Employed in Food Preparation & Serving in the United States is 5.3%.