Jump River, WI Map & Demographics
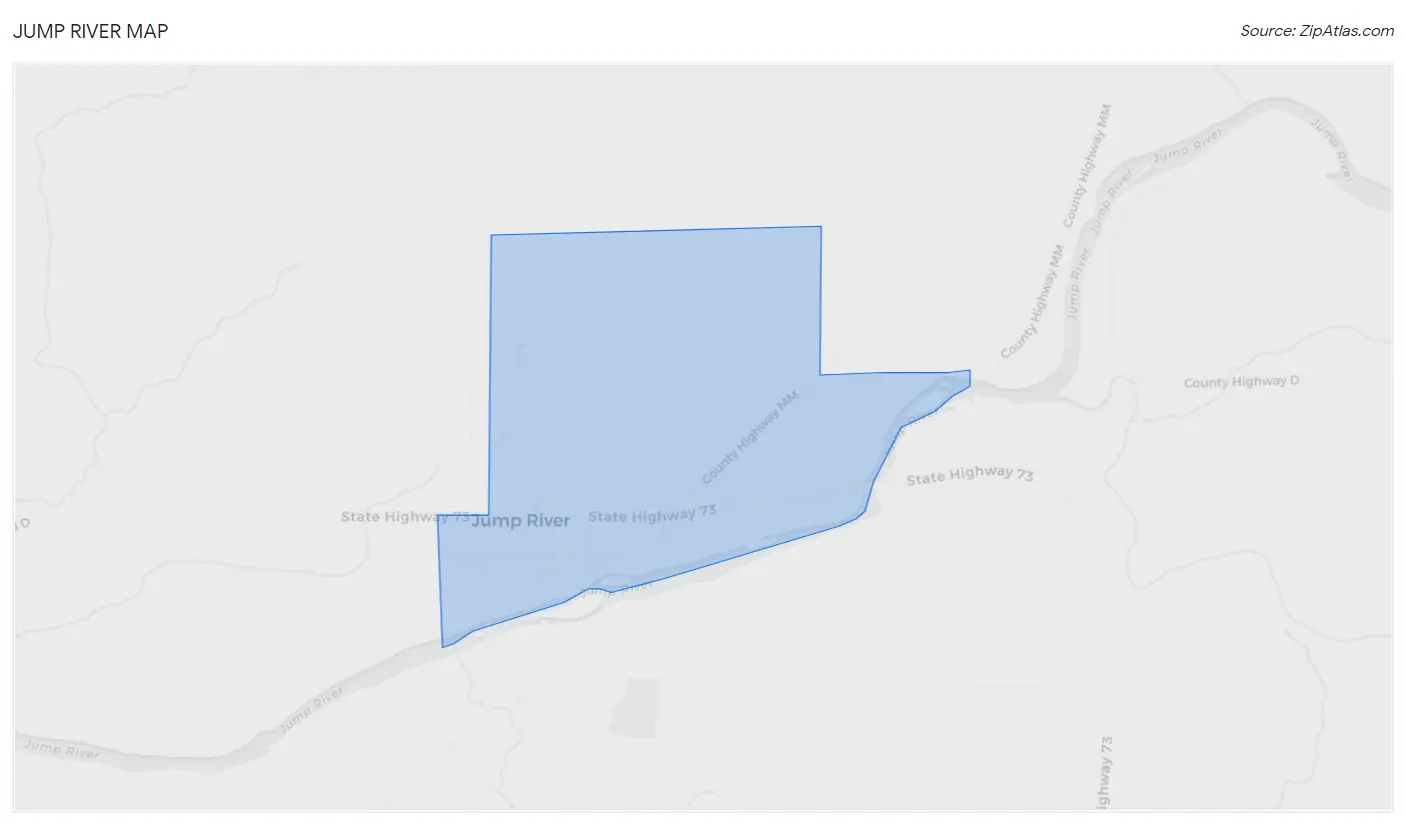
Jump River Map
Jump River Overview
$104,725
PER CAPITA INCOME
0.73
INEQUALITY / GINI INDEX
55
TOTAL POPULATION
14
MALE POPULATION
41
FEMALE POPULATION
34.15
MALES / 100 FEMALES
292.86
FEMALES / 100 MALES
54.4
MEDIAN AGE
3.2
AVG FAMILY SIZE
2.1
AVG HOUSEHOLD SIZE
8
LABOR FORCE [ PEOPLE ]
17.4%
PERCENT IN LABOR FORCE
12.5%
UNEMPLOYMENT RATE
Jump River Area Codes
Income in Jump River
Income Overview in Jump River
| Characteristic | Number | Measure |
| Per Capita Income | 55 | $104,725 |
| Median Family Income | 12 | $0 |
| Mean Family Income | 12 | $365,217 |
| Median Household Income | 26 | $0 |
| Mean Household Income | 26 | $179,996 |
| Income Deficit | 12 | $0 |
| Wage / Income Gap (%) | 55 | 0.00% |
| Wage / Income Gap ($) | 55 | 100.00¢ per $1 |
| Gini / Inequality Index | 55 | 0.73 |
Earnings by Sex in Jump River
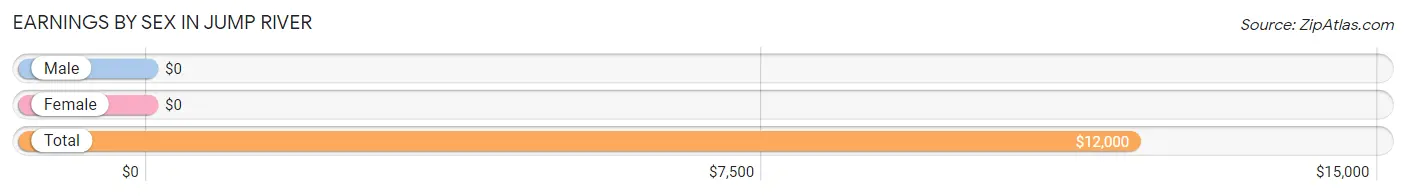
| Sex | Number | Average Earnings |
| Male | 4 (33.3%) | $0 |
| Female | 8 (66.7%) | $0 |
| Total | 12 (100.0%) | $12,000 |
Earnings by Sex by Income Bracket in Jump River
The most common earnings brackets in Jump River are $2,499 or less for men (1 | 25.0%) and $10,000 to $12,499 for women (4 | 50.0%).
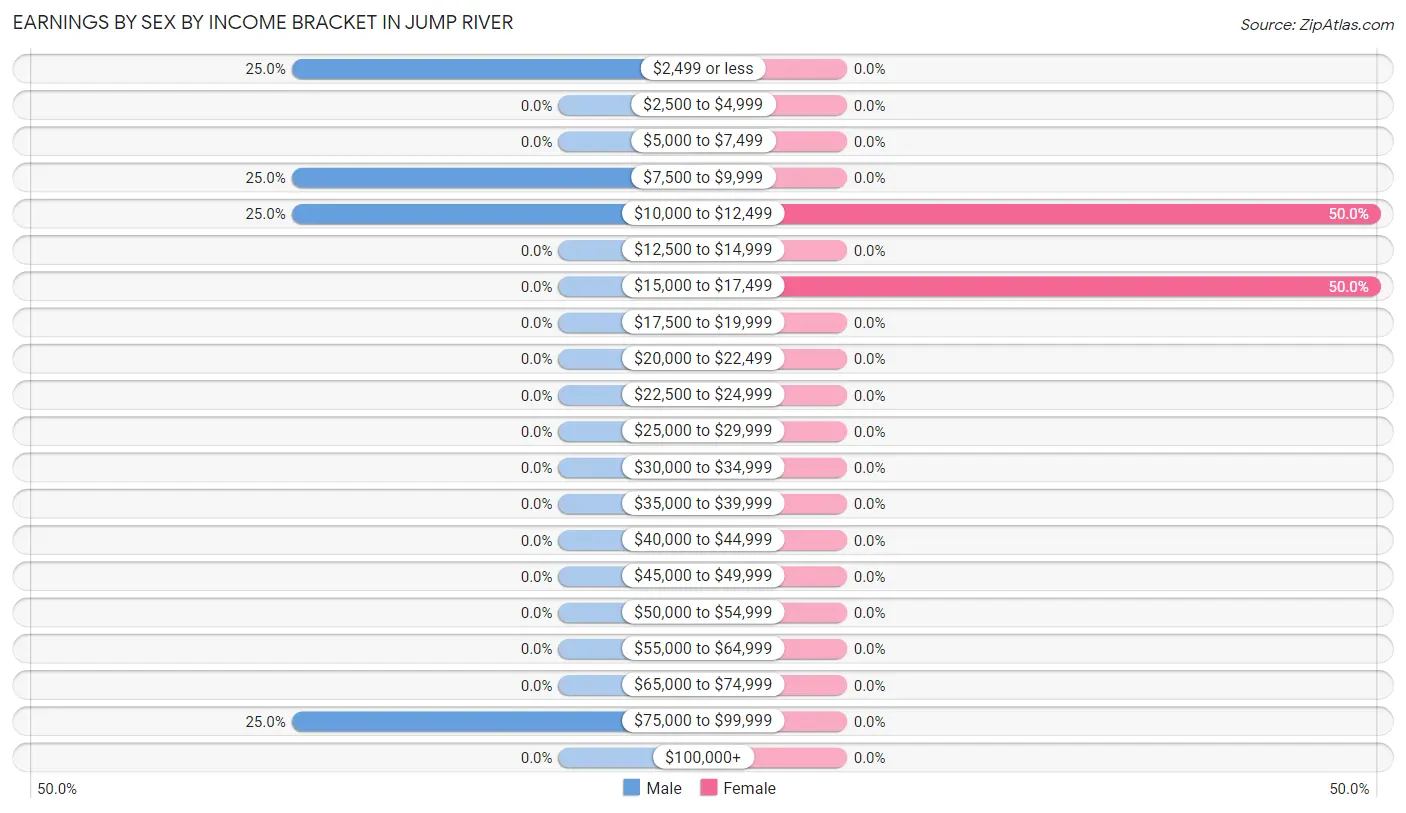
| Income | Male | Female |
| $2,499 or less | 1 (25.0%) | 0 (0.0%) |
| $2,500 to $4,999 | 0 (0.0%) | 0 (0.0%) |
| $5,000 to $7,499 | 0 (0.0%) | 0 (0.0%) |
| $7,500 to $9,999 | 1 (25.0%) | 0 (0.0%) |
| $10,000 to $12,499 | 1 (25.0%) | 4 (50.0%) |
| $12,500 to $14,999 | 0 (0.0%) | 0 (0.0%) |
| $15,000 to $17,499 | 0 (0.0%) | 4 (50.0%) |
| $17,500 to $19,999 | 0 (0.0%) | 0 (0.0%) |
| $20,000 to $22,499 | 0 (0.0%) | 0 (0.0%) |
| $22,500 to $24,999 | 0 (0.0%) | 0 (0.0%) |
| $25,000 to $29,999 | 0 (0.0%) | 0 (0.0%) |
| $30,000 to $34,999 | 0 (0.0%) | 0 (0.0%) |
| $35,000 to $39,999 | 0 (0.0%) | 0 (0.0%) |
| $40,000 to $44,999 | 0 (0.0%) | 0 (0.0%) |
| $45,000 to $49,999 | 0 (0.0%) | 0 (0.0%) |
| $50,000 to $54,999 | 0 (0.0%) | 0 (0.0%) |
| $55,000 to $64,999 | 0 (0.0%) | 0 (0.0%) |
| $65,000 to $74,999 | 0 (0.0%) | 0 (0.0%) |
| $75,000 to $99,999 | 1 (25.0%) | 0 (0.0%) |
| $100,000+ | 0 (0.0%) | 0 (0.0%) |
| Total | 4 (100.0%) | 8 (100.0%) |
Earnings by Sex by Educational Attainment in Jump River
| Educational Attainment | Male Income | Female Income |
| Less than High School | - | - |
| High School Diploma | - | - |
| College or Associate's Degree | - | - |
| Bachelor's Degree | - | - |
| Graduate Degree | - | - |
| Total | - | - |
Family Income in Jump River
Family Income Brackets in Jump River
According to the Jump River family income data, there are 6 families falling into the $35,000 to $49,999 income range, which is the most common income bracket and makes up 50.0% of all families.
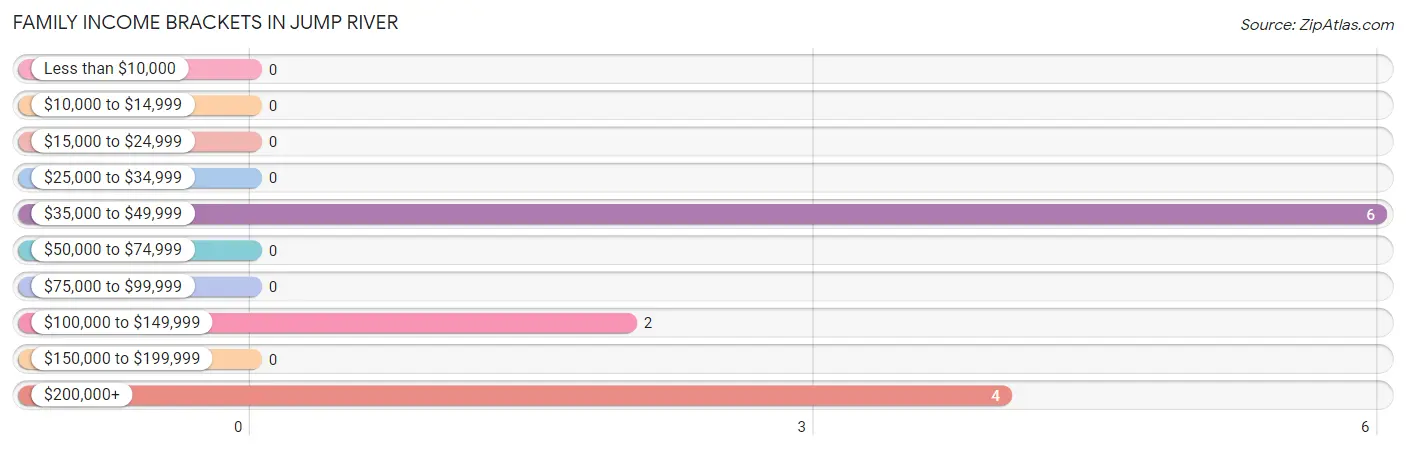
| Income Bracket | # Families | % Families |
| Less than $10,000 | 0 | 0.0% |
| $10,000 to $14,999 | 0 | 0.0% |
| $15,000 to $24,999 | 0 | 0.0% |
| $25,000 to $34,999 | 0 | 0.0% |
| $35,000 to $49,999 | 6 | 50.0% |
| $50,000 to $74,999 | 0 | 0.0% |
| $75,000 to $99,999 | 0 | 0.0% |
| $100,000 to $149,999 | 2 | 16.7% |
| $150,000 to $199,999 | 0 | 0.0% |
| $200,000+ | 4 | 33.3% |
Family Income by Famaliy Size in Jump River
| Income Bracket | # Families | Median Income |
| 2-Person Families | 8 (66.7%) | $0 |
| 3-Person Families | 0 (0.0%) | $0 |
| 4-Person Families | 4 (33.3%) | $0 |
| 5-Person Families | 0 (0.0%) | $0 |
| 6-Person Families | 0 (0.0%) | $0 |
| 7+ Person Families | 0 (0.0%) | $0 |
| Total | 12 (100.0%) | $0 |
Family Income by Number of Earners in Jump River
| Number of Earners | # Families | Median Income |
| No Earners | 4 (33.3%) | $0 |
| 1 Earner | 8 (66.7%) | $0 |
| 2 Earners | 0 (0.0%) | $0 |
| 3+ Earners | 0 (0.0%) | $0 |
| Total | 12 (100.0%) | $0 |
Household Income in Jump River
Household Income Brackets in Jump River
With 12 households falling in the category, the $10,000 to $14,999 income range is the most frequent in Jump River, accounting for 46.2% of all households.
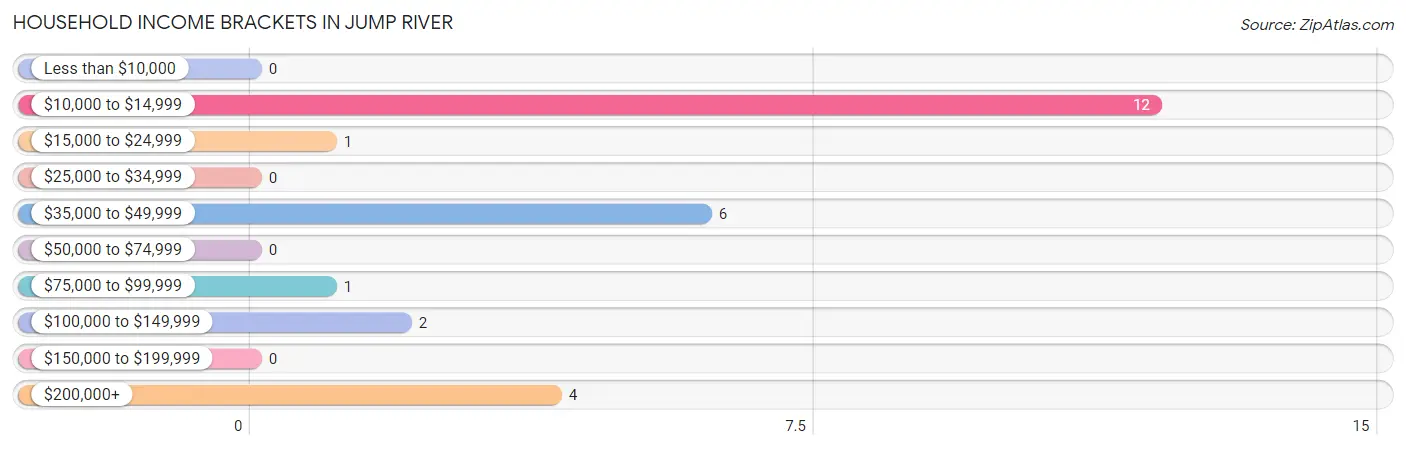
| Income Bracket | # Households | % Households |
| Less than $10,000 | 0 | 0.0% |
| $10,000 to $14,999 | 12 | 46.2% |
| $15,000 to $24,999 | 1 | 3.8% |
| $25,000 to $34,999 | 0 | 0.0% |
| $35,000 to $49,999 | 6 | 23.1% |
| $50,000 to $74,999 | 0 | 0.0% |
| $75,000 to $99,999 | 1 | 3.8% |
| $100,000 to $149,999 | 2 | 7.7% |
| $150,000 to $199,999 | 0 | 0.0% |
| $200,000+ | 4 | 15.4% |
Household Income by Householder Age in Jump River
The median household income in Jump River is $0, with the highest median household income of $48,750 found in the 25 to 44 years age bracket for the primary householder. A total of 6 households (23.1%) fall into this category.
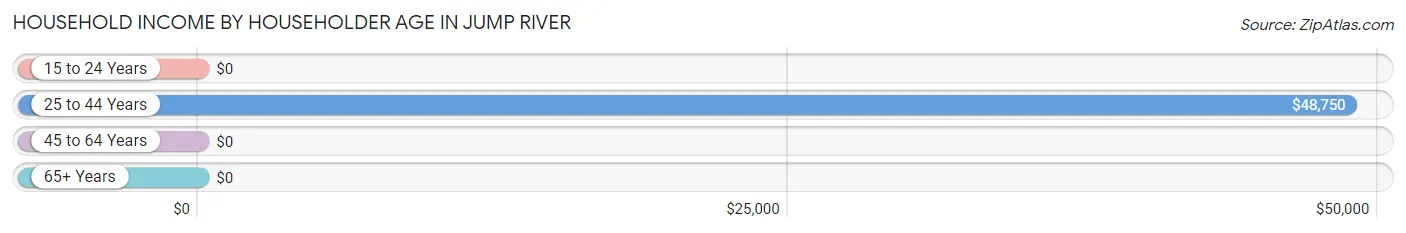
| Income Bracket | # Households | Median Income |
| 15 to 24 Years | 0 (0.0%) | $0 |
| 25 to 44 Years | 6 (23.1%) | $48,750 |
| 45 to 64 Years | 6 (23.1%) | $0 |
| 65+ Years | 14 (53.8%) | $0 |
| Total | 26 (100.0%) | $0 |
Poverty in Jump River
Income Below Poverty by Sex and Age in Jump River
With 21.4% poverty level for males and 31.7% for females among the residents of Jump River, 18 to 24 year old males and 75 year old and over females are the most vulnerable to poverty, with 1 males (100.0%) and 12 females (100.0%) in their respective age groups living below the poverty level.
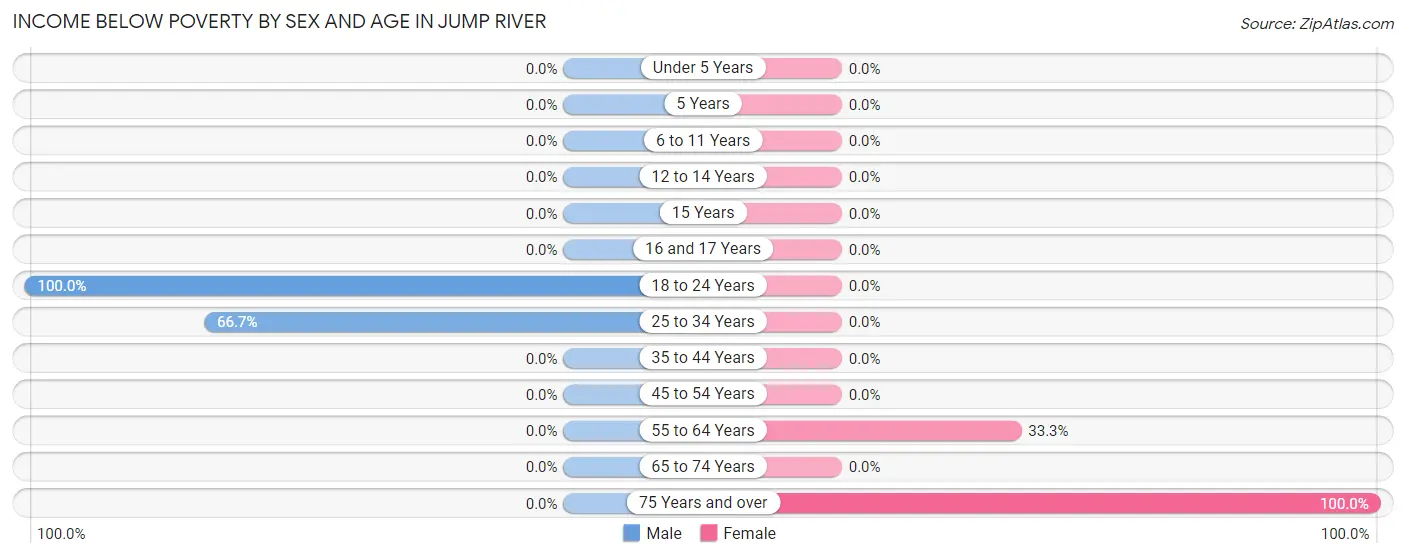
| Age Bracket | Male | Female |
| Under 5 Years | 0 (0.0%) | 0 (0.0%) |
| 5 Years | 0 (0.0%) | 0 (0.0%) |
| 6 to 11 Years | 0 (0.0%) | 0 (0.0%) |
| 12 to 14 Years | 0 (0.0%) | 0 (0.0%) |
| 15 Years | 0 (0.0%) | 0 (0.0%) |
| 16 and 17 Years | 0 (0.0%) | 0 (0.0%) |
| 18 to 24 Years | 1 (100.0%) | 0 (0.0%) |
| 25 to 34 Years | 2 (66.7%) | 0 (0.0%) |
| 35 to 44 Years | 0 (0.0%) | 0 (0.0%) |
| 45 to 54 Years | 0 (0.0%) | 0 (0.0%) |
| 55 to 64 Years | 0 (0.0%) | 1 (33.3%) |
| 65 to 74 Years | 0 (0.0%) | 0 (0.0%) |
| 75 Years and over | 0 (0.0%) | 12 (100.0%) |
| Total | 3 (21.4%) | 13 (31.7%) |
Income Above Poverty by Sex and Age in Jump River
According to the poverty statistics in Jump River, males aged 45 to 54 years and females aged 5 years are the age groups that are most secure financially, with 100.0% of males and 100.0% of females in these age groups living above the poverty line.
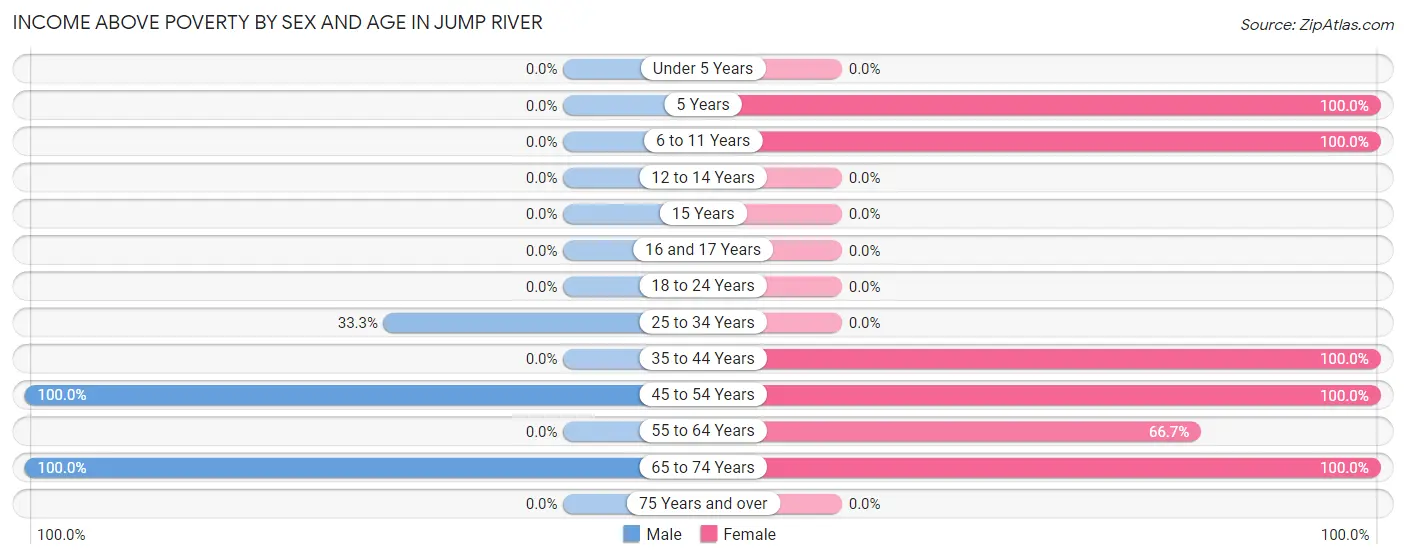
| Age Bracket | Male | Female |
| Under 5 Years | 0 (0.0%) | 0 (0.0%) |
| 5 Years | 0 (0.0%) | 5 (100.0%) |
| 6 to 11 Years | 0 (0.0%) | 4 (100.0%) |
| 12 to 14 Years | 0 (0.0%) | 0 (0.0%) |
| 15 Years | 0 (0.0%) | 0 (0.0%) |
| 16 and 17 Years | 0 (0.0%) | 0 (0.0%) |
| 18 to 24 Years | 0 (0.0%) | 0 (0.0%) |
| 25 to 34 Years | 1 (33.3%) | 0 (0.0%) |
| 35 to 44 Years | 0 (0.0%) | 4 (100.0%) |
| 45 to 54 Years | 9 (100.0%) | 4 (100.0%) |
| 55 to 64 Years | 0 (0.0%) | 2 (66.7%) |
| 65 to 74 Years | 1 (100.0%) | 9 (100.0%) |
| 75 Years and over | 0 (0.0%) | 0 (0.0%) |
| Total | 11 (78.6%) | 28 (68.3%) |
Income Below Poverty Among Married-Couple Families in Jump River
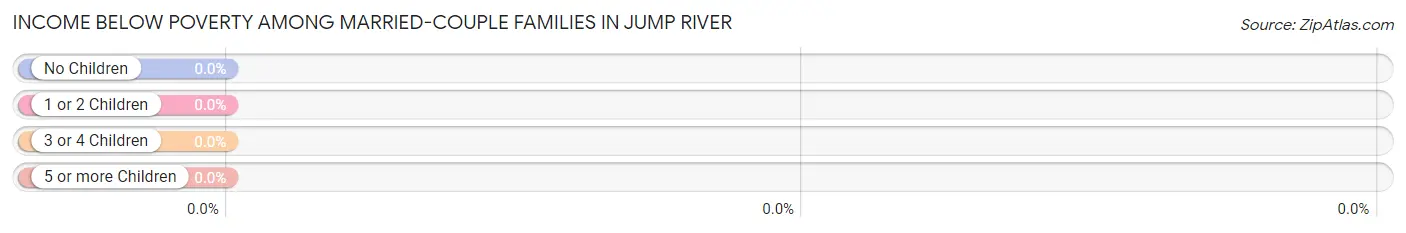
| Children | Above Poverty | Below Poverty |
| No Children | 6 (100.0%) | 0 (0.0%) |
| 1 or 2 Children | 0 (0.0%) | 0 (0.0%) |
| 3 or 4 Children | 0 (0.0%) | 0 (0.0%) |
| 5 or more Children | 0 (0.0%) | 0 (0.0%) |
| Total | 6 (100.0%) | 0 (0.0%) |
Income Below Poverty Among Single-Parent Households in Jump River
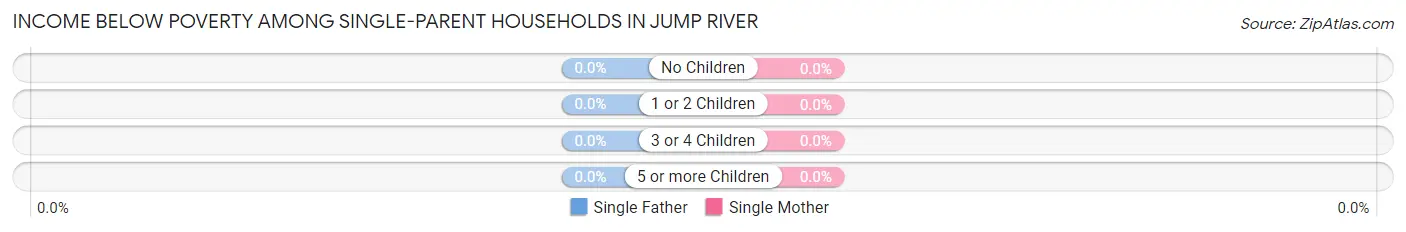
| Children | Single Father | Single Mother |
| No Children | 0 (0.0%) | 0 (0.0%) |
| 1 or 2 Children | 0 (0.0%) | 0 (0.0%) |
| 3 or 4 Children | 0 (0.0%) | 0 (0.0%) |
| 5 or more Children | 0 (0.0%) | 0 (0.0%) |
| Total | 0 (0.0%) | 0 (0.0%) |
Income Below Poverty Among Married-Couple vs Single-Parent Households in Jump River
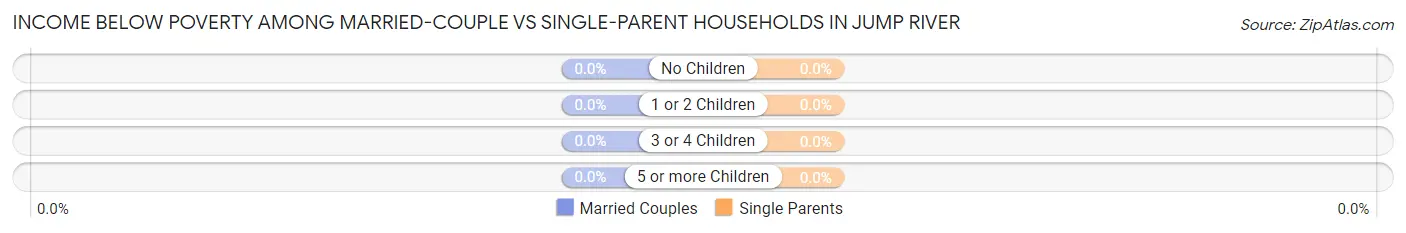
| Children | Married-Couple Families | Single-Parent Households |
| No Children | 0 (0.0%) | 0 (0.0%) |
| 1 or 2 Children | 0 (0.0%) | 0 (0.0%) |
| 3 or 4 Children | 0 (0.0%) | 0 (0.0%) |
| 5 or more Children | 0 (0.0%) | 0 (0.0%) |
| Total | 0 (0.0%) | 0 (0.0%) |
Race in Jump River
The most populous races in Jump River are White / Caucasian (53 | 96.4%), Hispanic or Latino (3 | 5.4%), and Two or more Races (2 | 3.6%).
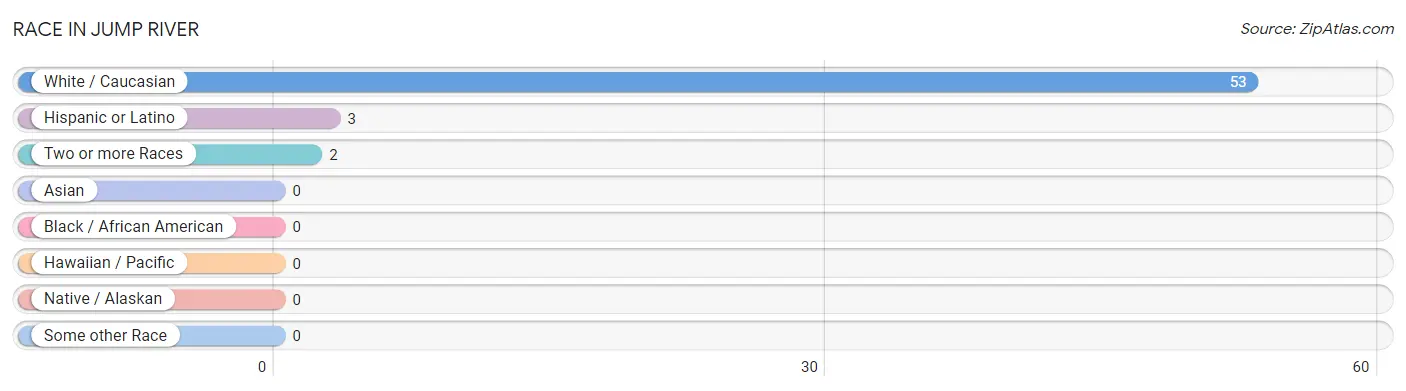
| Race | # Population | % Population |
| Asian | 0 | 0.0% |
| Black / African American | 0 | 0.0% |
| Hawaiian / Pacific | 0 | 0.0% |
| Hispanic or Latino | 3 | 5.4% |
| Native / Alaskan | 0 | 0.0% |
| White / Caucasian | 53 | 96.4% |
| Two or more Races | 2 | 3.6% |
| Some other Race | 0 | 0.0% |
| Total | 55 | 100.0% |
Ancestry in Jump River
The most populous ancestries reported in Jump River are German (36 | 65.4%), Polish (22 | 40.0%), Norwegian (16 | 29.1%), Irish (12 | 21.8%), and Mexican (3 | 5.4%), together accounting for 161.8% of all Jump River residents.
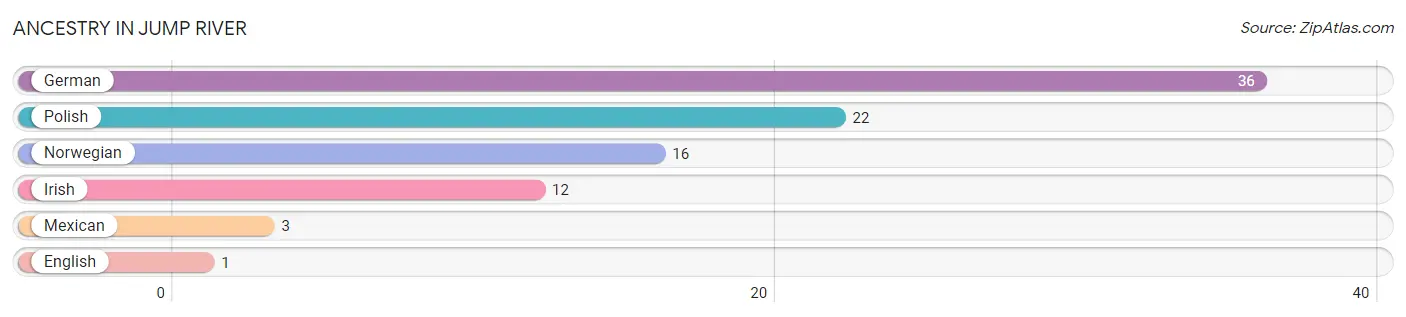
| Ancestry | # Population | % Population |
| English | 1 | 1.8% |
| German | 36 | 65.4% |
| Irish | 12 | 21.8% |
| Mexican | 3 | 5.4% |
| Norwegian | 16 | 29.1% |
| Polish | 22 | 40.0% | View All 6 Rows |
Immigrants in Jump River

| Immigration Origin | # Population | % Population | View All 0 Rows |
Sex and Age in Jump River
Sex and Age in Jump River
The most populous age groups in Jump River are 50 to 54 Years (9 | 64.3%) for men and 85 Years and over (12 | 29.3%) for women.
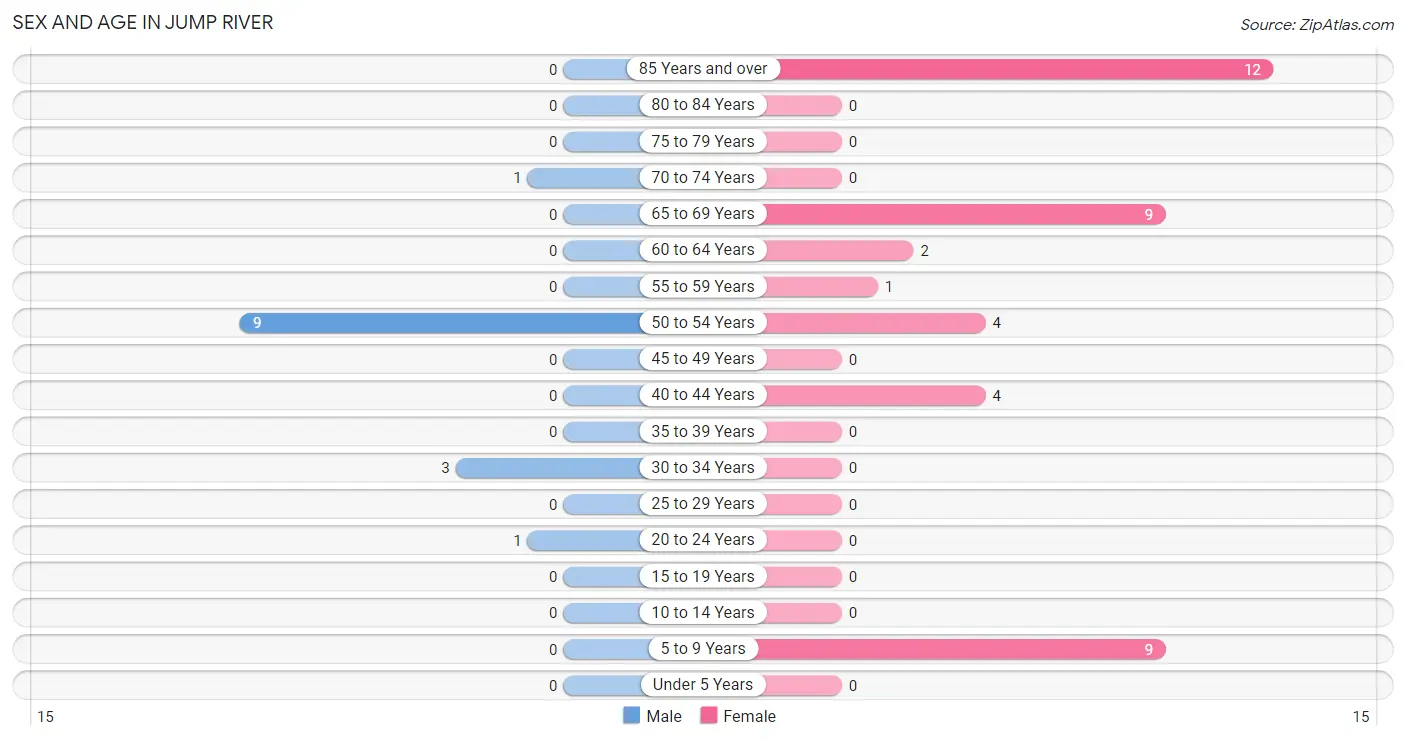
| Age Bracket | Male | Female |
| Under 5 Years | 0 (0.0%) | 0 (0.0%) |
| 5 to 9 Years | 0 (0.0%) | 9 (22.0%) |
| 10 to 14 Years | 0 (0.0%) | 0 (0.0%) |
| 15 to 19 Years | 0 (0.0%) | 0 (0.0%) |
| 20 to 24 Years | 1 (7.1%) | 0 (0.0%) |
| 25 to 29 Years | 0 (0.0%) | 0 (0.0%) |
| 30 to 34 Years | 3 (21.4%) | 0 (0.0%) |
| 35 to 39 Years | 0 (0.0%) | 0 (0.0%) |
| 40 to 44 Years | 0 (0.0%) | 4 (9.8%) |
| 45 to 49 Years | 0 (0.0%) | 0 (0.0%) |
| 50 to 54 Years | 9 (64.3%) | 4 (9.8%) |
| 55 to 59 Years | 0 (0.0%) | 1 (2.4%) |
| 60 to 64 Years | 0 (0.0%) | 2 (4.9%) |
| 65 to 69 Years | 0 (0.0%) | 9 (22.0%) |
| 70 to 74 Years | 1 (7.1%) | 0 (0.0%) |
| 75 to 79 Years | 0 (0.0%) | 0 (0.0%) |
| 80 to 84 Years | 0 (0.0%) | 0 (0.0%) |
| 85 Years and over | 0 (0.0%) | 12 (29.3%) |
| Total | 14 (100.0%) | 41 (100.0%) |
Families and Households in Jump River
Median Family Size in Jump River
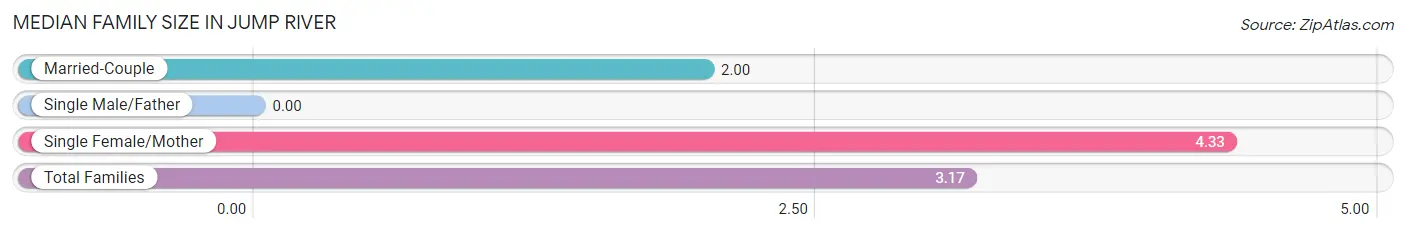
| Family Type | # Families | Family Size |
| Married-Couple | 6 (50.0%) | 2.00 |
| Single Male/Father | 0 (0.0%) | - |
| Single Female/Mother | 6 (50.0%) | 4.33 |
| Total Families | 12 (100.0%) | 3.17 |
Median Household Size in Jump River
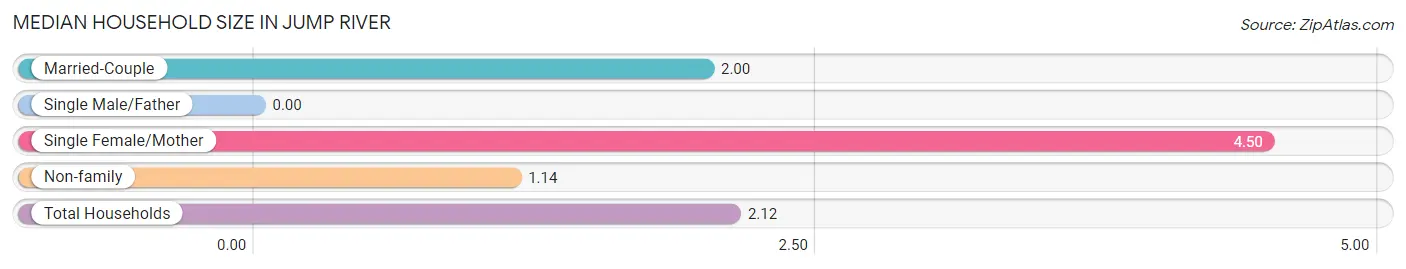
| Household Type | # Households | Household Size |
| Married-Couple | 6 (23.1%) | 2.00 |
| Single Male/Father | 0 (0.0%) | - |
| Single Female/Mother | 6 (23.1%) | 4.50 |
| Non-family | 14 (53.8%) | 1.14 |
| Total Households | 26 (100.0%) | 2.12 |
Household Size by Marriage Status in Jump River
Out of a total of 26 households in Jump River, 12 (46.2%) are family households, while 14 (53.8%) are nonfamily households. The most numerous type of family households are 2-person households, comprising 6, and the most common type of nonfamily households are 1-person households, comprising 13.
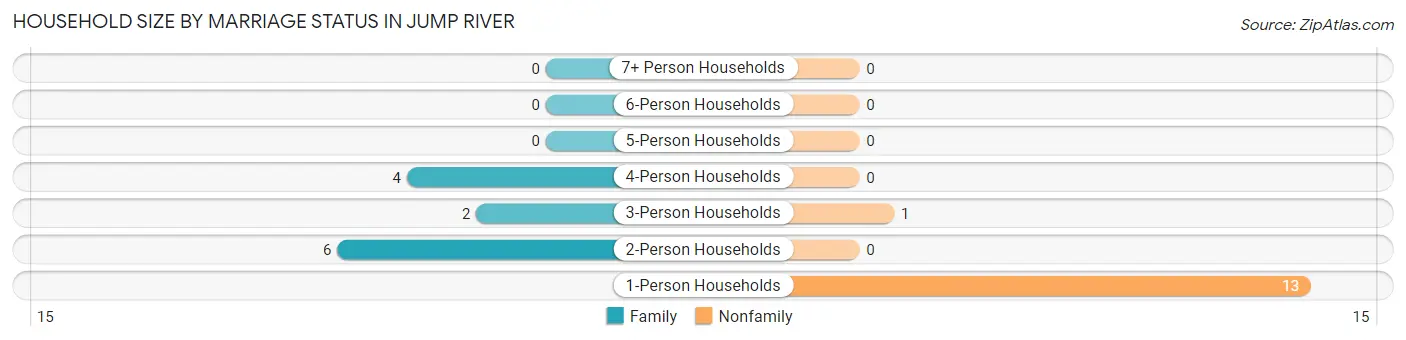
| Household Size | Family Households | Nonfamily Households |
| 1-Person Households | - | 13 (50.0%) |
| 2-Person Households | 6 (23.1%) | 0 (0.0%) |
| 3-Person Households | 2 (7.7%) | 1 (3.8%) |
| 4-Person Households | 4 (15.4%) | 0 (0.0%) |
| 5-Person Households | 0 (0.0%) | 0 (0.0%) |
| 6-Person Households | 0 (0.0%) | 0 (0.0%) |
| 7+ Person Households | 0 (0.0%) | 0 (0.0%) |
| Total | 12 (46.2%) | 14 (53.8%) |
Female Fertility in Jump River
Fertility by Age in Jump River
| Age Bracket | Women with Births | Births / 1,000 Women |
| 15 to 19 years | 0 (0.0%) | 0.0 |
| 20 to 34 years | 0 (0.0%) | 0.0 |
| 35 to 50 years | 0 (0.0%) | 0.0 |
| Total | 0 (0.0%) | 0.0 |
Fertility by Age by Marriage Status in Jump River
| Age Bracket | Married | Unmarried |
| 15 to 19 years | 0 (0.0%) | 0 (0.0%) |
| 20 to 34 years | 0 (0.0%) | 0 (0.0%) |
| 35 to 50 years | 0 (0.0%) | 0 (0.0%) |
| Total | 0 (0.0%) | 0 (0.0%) |
Fertility by Education in Jump River
| Educational Attainment | Women with Births | Births / 1,000 Women |
| Less than High School | 0 (0.0%) | 0.0 |
| High School Diploma | 0 (0.0%) | 0.0 |
| College or Associate's Degree | 0 (0.0%) | 0.0 |
| Bachelor's Degree | 0 (0.0%) | 0.0 |
| Graduate Degree | 0 (0.0%) | 0.0 |
| Total | 0 (0.0%) | 0.0 |
Fertility by Education by Marriage Status in Jump River
| Educational Attainment | Married | Unmarried |
| Less than High School | 0 (0.0%) | 0 (0.0%) |
| High School Diploma | 0 (0.0%) | 0 (0.0%) |
| College or Associate's Degree | 0 (0.0%) | 0 (0.0%) |
| Bachelor's Degree | 0 (0.0%) | 0 (0.0%) |
| Graduate Degree | 0 (0.0%) | 0 (0.0%) |
| Total | 0 (0.0%) | 0 (0.0%) |
Employment Characteristics in Jump River
Employment by Class of Employer in Jump River
Among the 7 employed individuals in Jump River, self-employed (not incorporated) (4 | 57.1%), and private company employees (3 | 42.9%) make up the most common classes of employment.
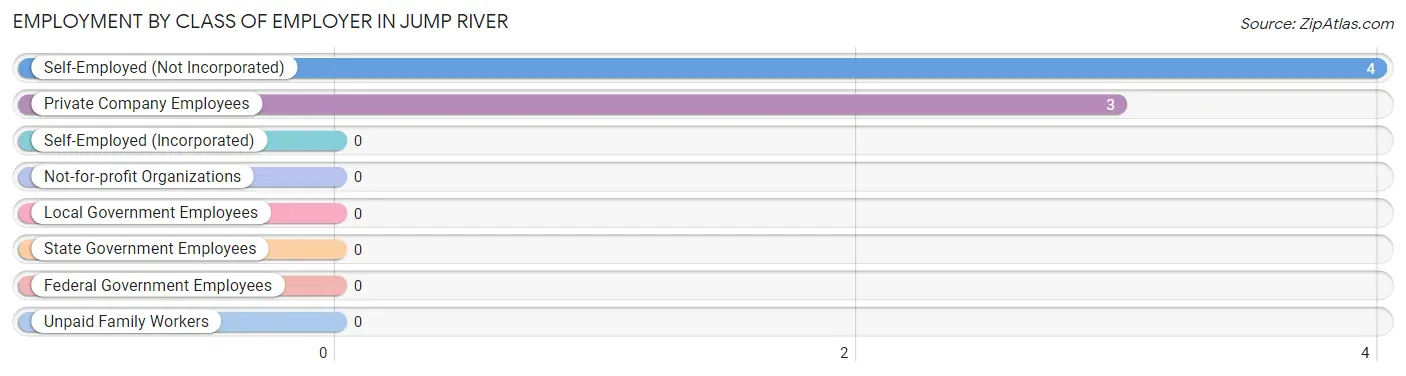
| Employer Class | # Employees | % Employees |
| Private Company Employees | 3 | 42.9% |
| Self-Employed (Incorporated) | 0 | 0.0% |
| Self-Employed (Not Incorporated) | 4 | 57.1% |
| Not-for-profit Organizations | 0 | 0.0% |
| Local Government Employees | 0 | 0.0% |
| State Government Employees | 0 | 0.0% |
| Federal Government Employees | 0 | 0.0% |
| Unpaid Family Workers | 0 | 0.0% |
| Total | 7 | 100.0% |
Employment Status by Age in Jump River
According to the labor force statistics for Jump River, out of the total population over 16 years of age (46), 17.4% or 8 individuals are in the labor force, with 12.5% or 1 of them unemployed. The age group with the highest labor force participation rate is 20 to 24 years, with 100.0% or 1 individuals in the labor force. Within the labor force, the 30 to 34 years age range has the highest percentage of unemployed individuals, with 33.3% or 1 of them being unemployed.
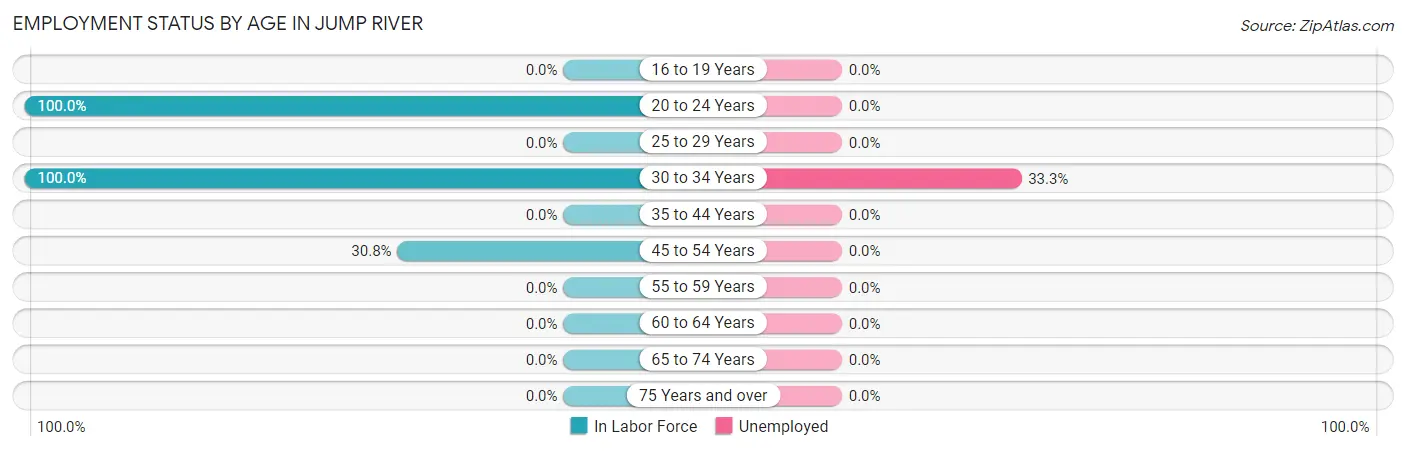
| Age Bracket | In Labor Force | Unemployed |
| 16 to 19 Years | 0 (0.0%) | 0 (0.0%) |
| 20 to 24 Years | 1 (100.0%) | 0 (0.0%) |
| 25 to 29 Years | 0 (0.0%) | 0 (0.0%) |
| 30 to 34 Years | 3 (100.0%) | 1 (33.3%) |
| 35 to 44 Years | 0 (0.0%) | 0 (0.0%) |
| 45 to 54 Years | 4 (30.8%) | 0 (0.0%) |
| 55 to 59 Years | 0 (0.0%) | 0 (0.0%) |
| 60 to 64 Years | 0 (0.0%) | 0 (0.0%) |
| 65 to 74 Years | 0 (0.0%) | 0 (0.0%) |
| 75 Years and over | 0 (0.0%) | 0 (0.0%) |
| Total | 8 (17.4%) | 1 (12.5%) |
Employment Status by Educational Attainment in Jump River
According to labor force statistics for Jump River, 30.4% of individuals (7) out of the total population between 25 and 64 years of age (23) are in the labor force, with 14.3% or 1 of them being unemployed. The group with the highest labor force participation rate are those with the educational attainment of high school diploma, with 75.0% or 6 individuals in the labor force. Within the labor force, individuals with high school diploma education have the highest percentage of unemployment, with 16.7% or 1 of them being unemployed.
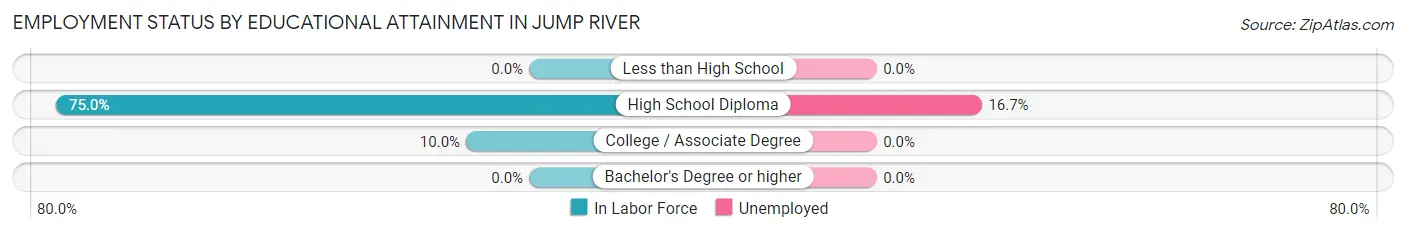
| Educational Attainment | In Labor Force | Unemployed |
| Less than High School | 0 (0.0%) | 0 (0.0%) |
| High School Diploma | 6 (75.0%) | 1 (16.7%) |
| College / Associate Degree | 1 (10.0%) | 0 (0.0%) |
| Bachelor's Degree or higher | 0 (0.0%) | 0 (0.0%) |
| Total | 7 (30.4%) | 3 (14.3%) |
Employment Occupations by Sex in Jump River
Management, Business, Science and Arts Occupations
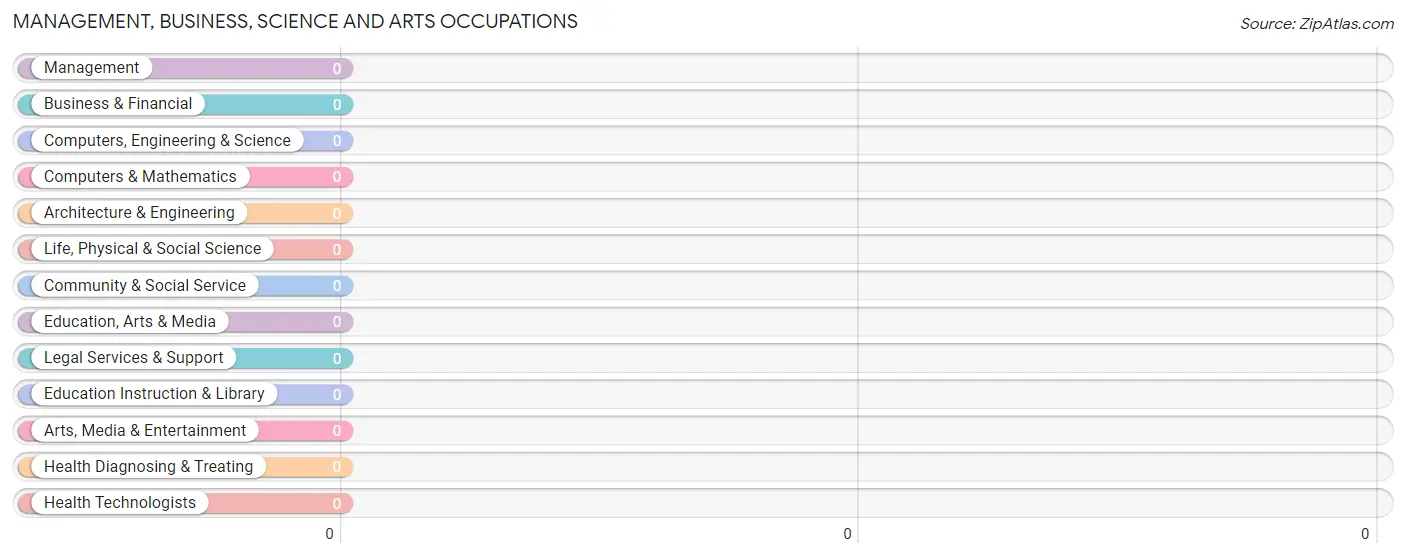
Management, Business, Science and Arts Occupations by Sex
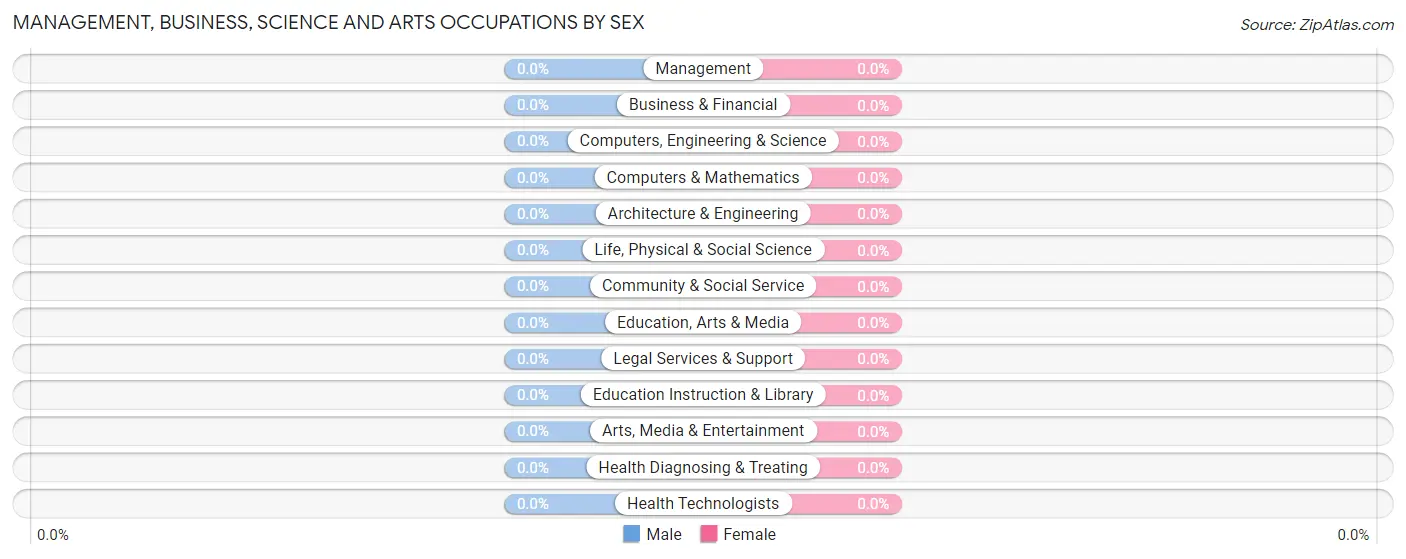
| Occupation | Male | Female |
| Management | 0 (0.0%) | 0 (0.0%) |
| Business & Financial | 0 (0.0%) | 0 (0.0%) |
| Computers, Engineering & Science | 0 (0.0%) | 0 (0.0%) |
| Computers & Mathematics | 0 (0.0%) | 0 (0.0%) |
| Architecture & Engineering | 0 (0.0%) | 0 (0.0%) |
| Life, Physical & Social Science | 0 (0.0%) | 0 (0.0%) |
| Community & Social Service | 0 (0.0%) | 0 (0.0%) |
| Education, Arts & Media | 0 (0.0%) | 0 (0.0%) |
| Legal Services & Support | 0 (0.0%) | 0 (0.0%) |
| Education Instruction & Library | 0 (0.0%) | 0 (0.0%) |
| Arts, Media & Entertainment | 0 (0.0%) | 0 (0.0%) |
| Health Diagnosing & Treating | 0 (0.0%) | 0 (0.0%) |
| Health Technologists | 0 (0.0%) | 0 (0.0%) |
| Total (Category) | 0 (0.0%) | 0 (0.0%) |
| Total (Overall) | 3 (42.9%) | 4 (57.1%) |
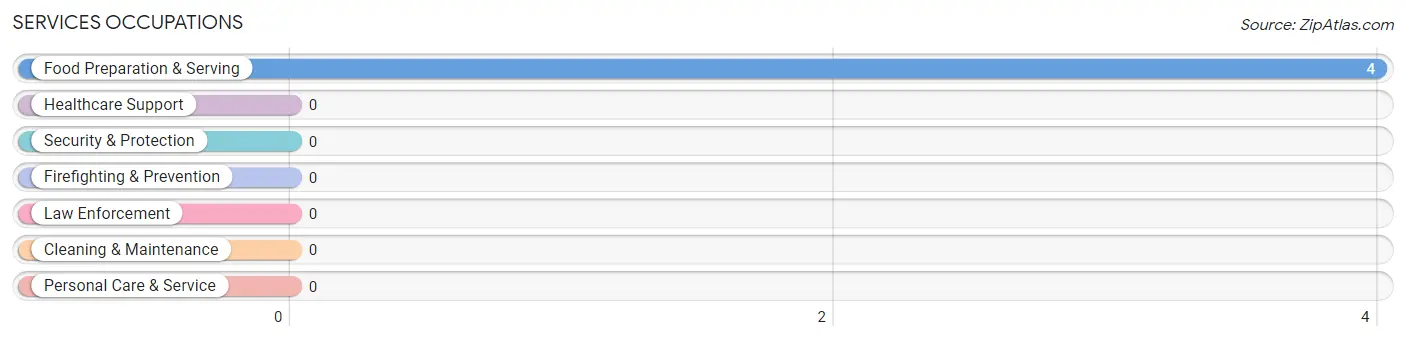
Services Occupations
The most common Services occupations in Jump River are , and Food Preparation & Serving (4 | 57.1%).
Services Occupations by Sex
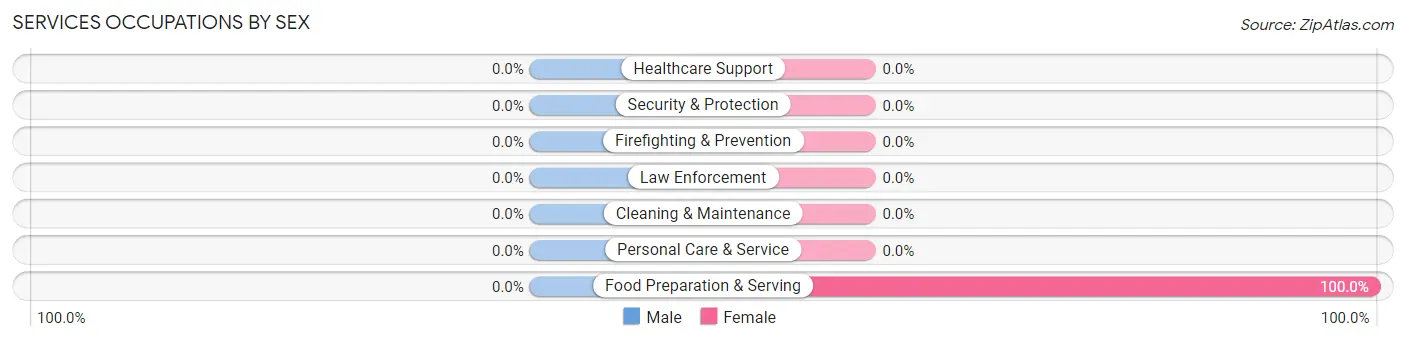
| Occupation | Male | Female |
| Healthcare Support | 0 (0.0%) | 0 (0.0%) |
| Security & Protection | 0 (0.0%) | 0 (0.0%) |
| Firefighting & Prevention | 0 (0.0%) | 0 (0.0%) |
| Law Enforcement | 0 (0.0%) | 0 (0.0%) |
| Food Preparation & Serving | 0 (0.0%) | 4 (100.0%) |
| Cleaning & Maintenance | 0 (0.0%) | 0 (0.0%) |
| Personal Care & Service | 0 (0.0%) | 0 (0.0%) |
| Total (Category) | 0 (0.0%) | 4 (100.0%) |
| Total (Overall) | 3 (42.9%) | 4 (57.1%) |
Sales and Office Occupations
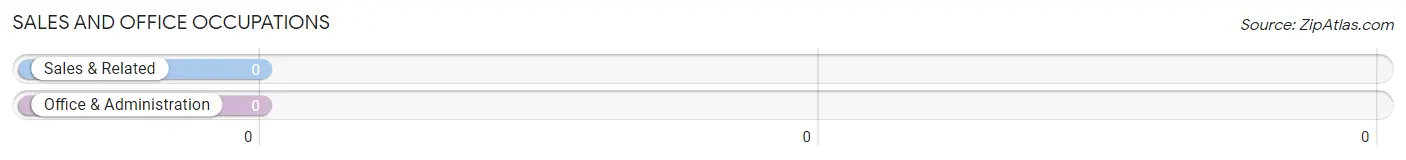
Sales and Office Occupations by Sex
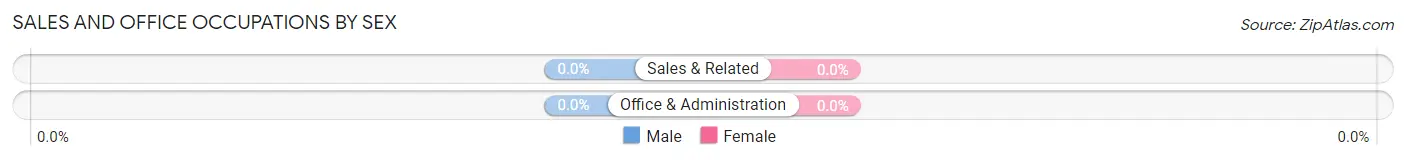
| Occupation | Male | Female |
| Sales & Related | 0 (0.0%) | 0 (0.0%) |
| Office & Administration | 0 (0.0%) | 0 (0.0%) |
| Total (Category) | 0 (0.0%) | 0 (0.0%) |
| Total (Overall) | 3 (42.9%) | 4 (57.1%) |
Natural Resources, Construction and Maintenance Occupations
The most common Natural Resources, Construction and Maintenance occupations in Jump River are , and Construction & Extraction (2 | 28.6%).
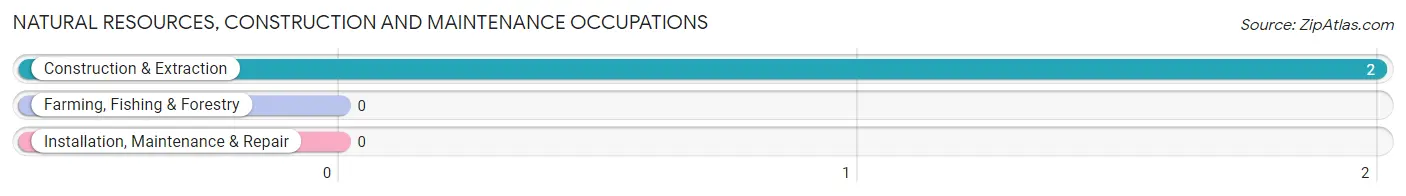
Natural Resources, Construction and Maintenance Occupations by Sex
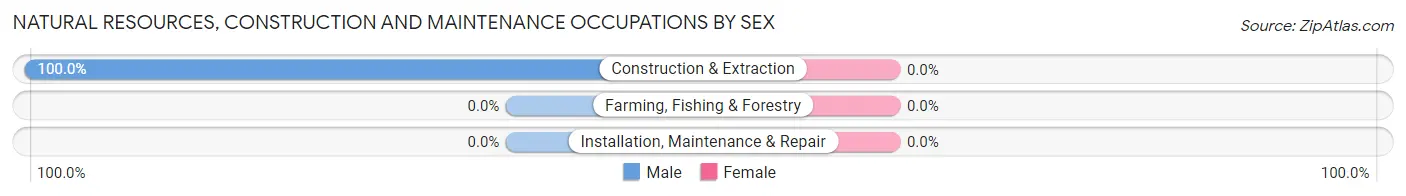
| Occupation | Male | Female |
| Farming, Fishing & Forestry | 0 (0.0%) | 0 (0.0%) |
| Construction & Extraction | 2 (100.0%) | 0 (0.0%) |
| Installation, Maintenance & Repair | 0 (0.0%) | 0 (0.0%) |
| Total (Category) | 2 (100.0%) | 0 (0.0%) |
| Total (Overall) | 3 (42.9%) | 4 (57.1%) |
Production, Transportation and Moving Occupations
The most common Production, Transportation and Moving occupations in Jump River are , and Transportation (1 | 14.3%).
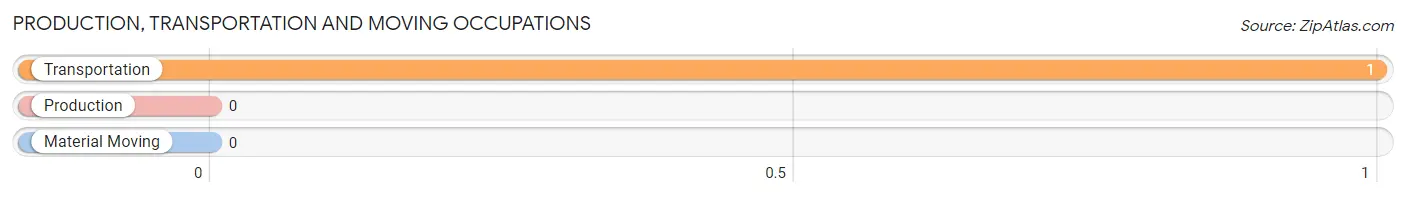
Production, Transportation and Moving Occupations by Sex
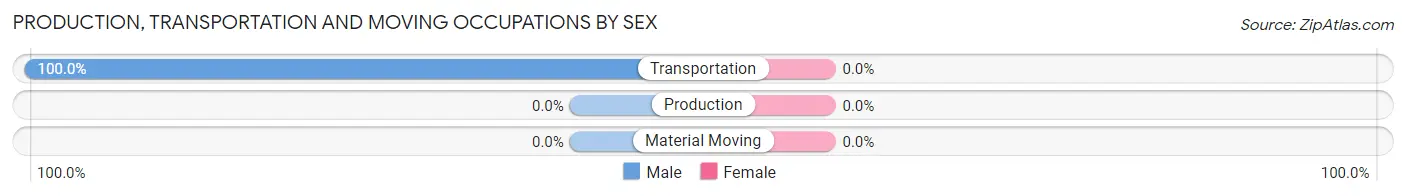
| Occupation | Male | Female |
| Production | 0 (0.0%) | 0 (0.0%) |
| Transportation | 1 (100.0%) | 0 (0.0%) |
| Material Moving | 0 (0.0%) | 0 (0.0%) |
| Total (Category) | 1 (100.0%) | 0 (0.0%) |
| Total (Overall) | 3 (42.9%) | 4 (57.1%) |
Employment Industries by Sex in Jump River
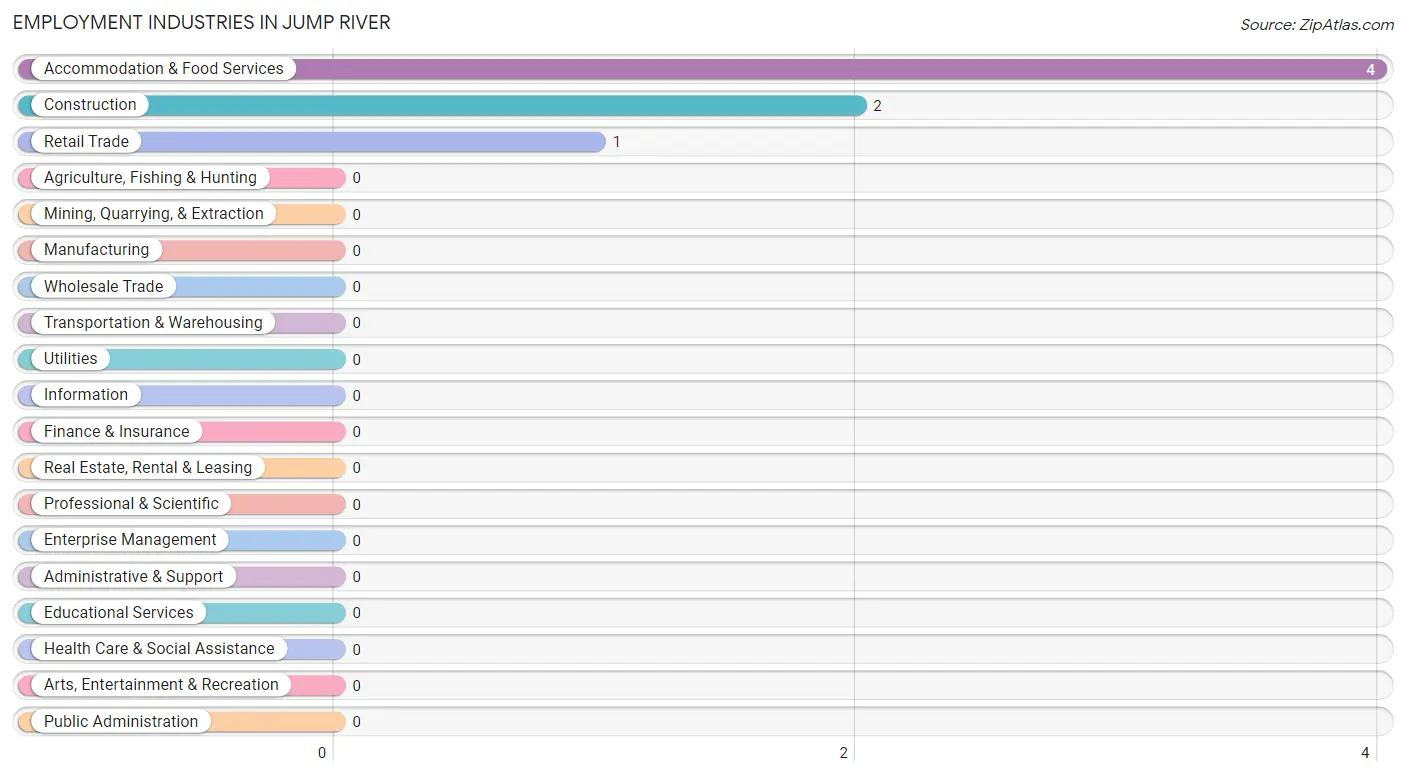
Employment Industries in Jump River
The major employment industries in Jump River include Accommodation & Food Services (4 | 57.1%), Construction (2 | 28.6%), and Retail Trade (1 | 14.3%).
Employment Industries by Sex in Jump River
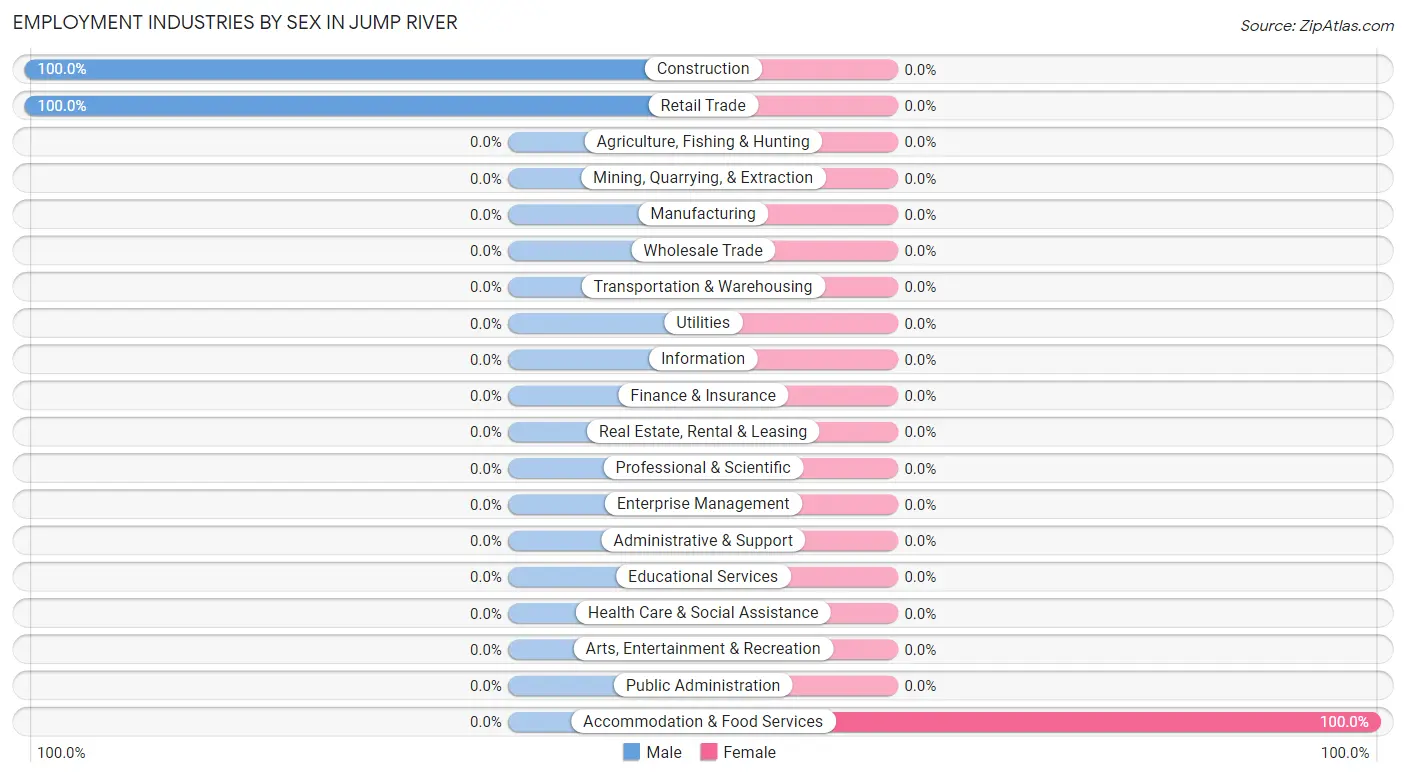
| Industry | Male | Female |
| Agriculture, Fishing & Hunting | 0 (0.0%) | 0 (0.0%) |
| Mining, Quarrying, & Extraction | 0 (0.0%) | 0 (0.0%) |
| Construction | 2 (100.0%) | 0 (0.0%) |
| Manufacturing | 0 (0.0%) | 0 (0.0%) |
| Wholesale Trade | 0 (0.0%) | 0 (0.0%) |
| Retail Trade | 1 (100.0%) | 0 (0.0%) |
| Transportation & Warehousing | 0 (0.0%) | 0 (0.0%) |
| Utilities | 0 (0.0%) | 0 (0.0%) |
| Information | 0 (0.0%) | 0 (0.0%) |
| Finance & Insurance | 0 (0.0%) | 0 (0.0%) |
| Real Estate, Rental & Leasing | 0 (0.0%) | 0 (0.0%) |
| Professional & Scientific | 0 (0.0%) | 0 (0.0%) |
| Enterprise Management | 0 (0.0%) | 0 (0.0%) |
| Administrative & Support | 0 (0.0%) | 0 (0.0%) |
| Educational Services | 0 (0.0%) | 0 (0.0%) |
| Health Care & Social Assistance | 0 (0.0%) | 0 (0.0%) |
| Arts, Entertainment & Recreation | 0 (0.0%) | 0 (0.0%) |
| Accommodation & Food Services | 0 (0.0%) | 4 (100.0%) |
| Public Administration | 0 (0.0%) | 0 (0.0%) |
| Total | 3 (42.9%) | 4 (57.1%) |
Education in Jump River
School Enrollment in Jump River
The most common levels of schooling among the 9 students in Jump River are nursery / preschool (5 | 55.6%), and elementary school (4 | 44.4%).
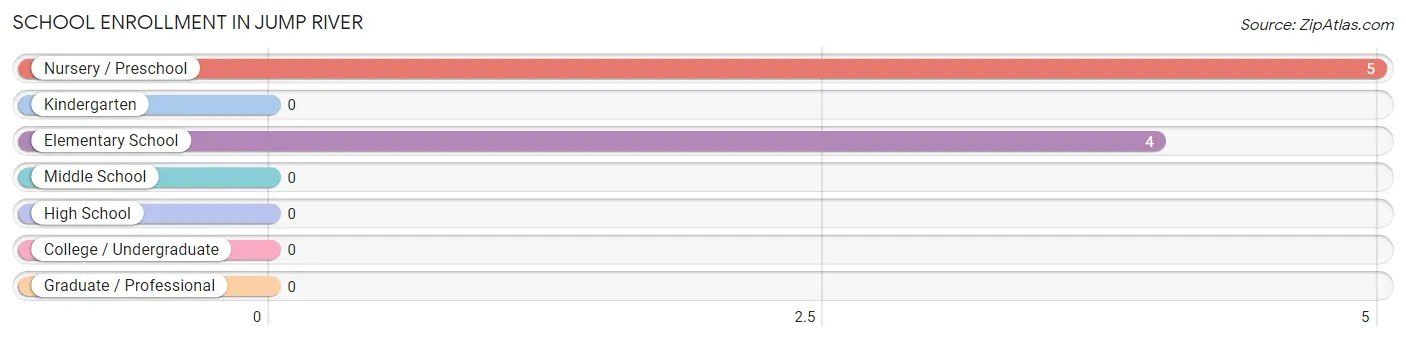
| School Level | # Students | % Students |
| Nursery / Preschool | 5 | 55.6% |
| Kindergarten | 0 | 0.0% |
| Elementary School | 4 | 44.4% |
| Middle School | 0 | 0.0% |
| High School | 0 | 0.0% |
| College / Undergraduate | 0 | 0.0% |
| Graduate / Professional | 0 | 0.0% |
| Total | 9 | 100.0% |
School Enrollment by Age by Funding Source in Jump River
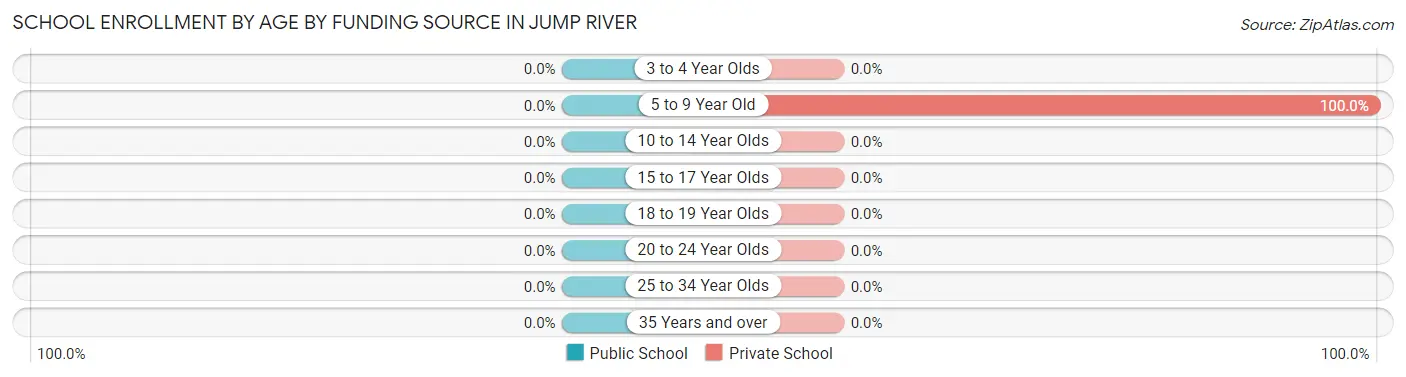
| Age Bracket | Public School | Private School |
| 3 to 4 Year Olds | 0 (0.0%) | 0 (0.0%) |
| 5 to 9 Year Old | 0 (0.0%) | 9 (100.0%) |
| 10 to 14 Year Olds | 0 (0.0%) | 0 (0.0%) |
| 15 to 17 Year Olds | 0 (0.0%) | 0 (0.0%) |
| 18 to 19 Year Olds | 0 (0.0%) | 0 (0.0%) |
| 20 to 24 Year Olds | 0 (0.0%) | 0 (0.0%) |
| 25 to 34 Year Olds | 0 (0.0%) | 0 (0.0%) |
| 35 Years and over | 0 (0.0%) | 0 (0.0%) |
| Total | 0 (0.0%) | 9 (100.0%) |
Educational Attainment by Field of Study in Jump River
, and education (1 | 100.0%) are the most common fields of study among 1 individuals in Jump River who have obtained a bachelor's degree or higher.
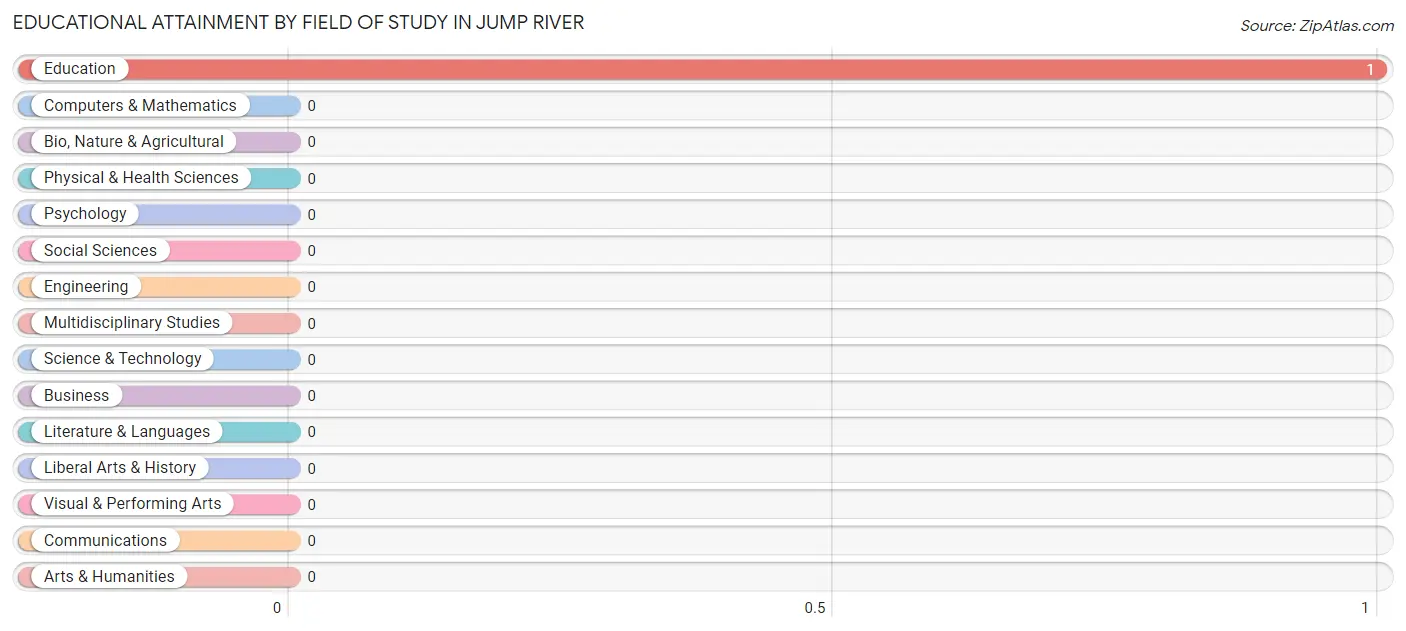
| Field of Study | # Graduates | % Graduates |
| Computers & Mathematics | 0 | 0.0% |
| Bio, Nature & Agricultural | 0 | 0.0% |
| Physical & Health Sciences | 0 | 0.0% |
| Psychology | 0 | 0.0% |
| Social Sciences | 0 | 0.0% |
| Engineering | 0 | 0.0% |
| Multidisciplinary Studies | 0 | 0.0% |
| Science & Technology | 0 | 0.0% |
| Business | 0 | 0.0% |
| Education | 1 | 100.0% |
| Literature & Languages | 0 | 0.0% |
| Liberal Arts & History | 0 | 0.0% |
| Visual & Performing Arts | 0 | 0.0% |
| Communications | 0 | 0.0% |
| Arts & Humanities | 0 | 0.0% |
| Total | 1 | 100.0% |
Transportation & Commute in Jump River
Vehicle Availability by Sex in Jump River
The most prevalent vehicle ownership categories in Jump River are males with 2 vehicles (2, accounting for 66.7%) and females with 2 vehicles (0, making up 50.0%).
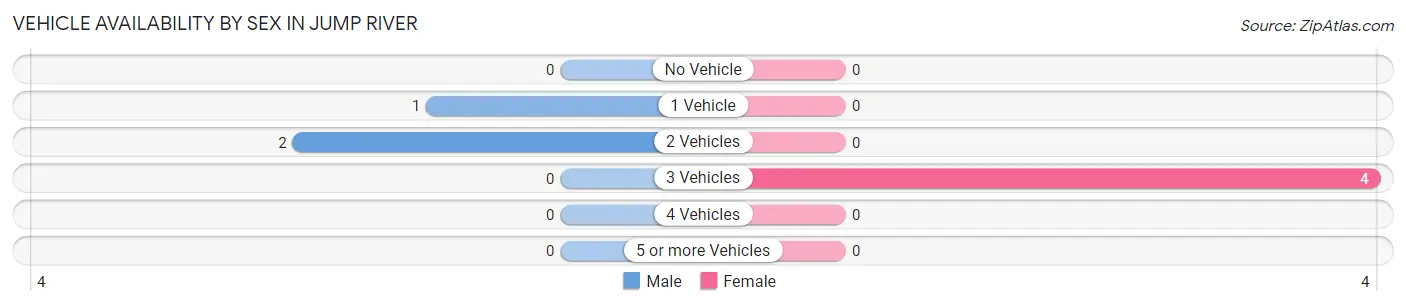
| Vehicles Available | Male | Female |
| No Vehicle | 0 (0.0%) | 0 (0.0%) |
| 1 Vehicle | 1 (33.3%) | 0 (0.0%) |
| 2 Vehicles | 2 (66.7%) | 0 (0.0%) |
| 3 Vehicles | 0 (0.0%) | 4 (100.0%) |
| 4 Vehicles | 0 (0.0%) | 0 (0.0%) |
| 5 or more Vehicles | 0 (0.0%) | 0 (0.0%) |
| Total | 3 (100.0%) | 4 (100.0%) |
Commute Time in Jump River
The most frequently occuring commute durations in Jump River are 5 to 9 minutes (4 commuters, 57.1%), 20 to 24 minutes (2 commuters, 28.6%), and 30 to 34 minutes (1 commuters, 14.3%).
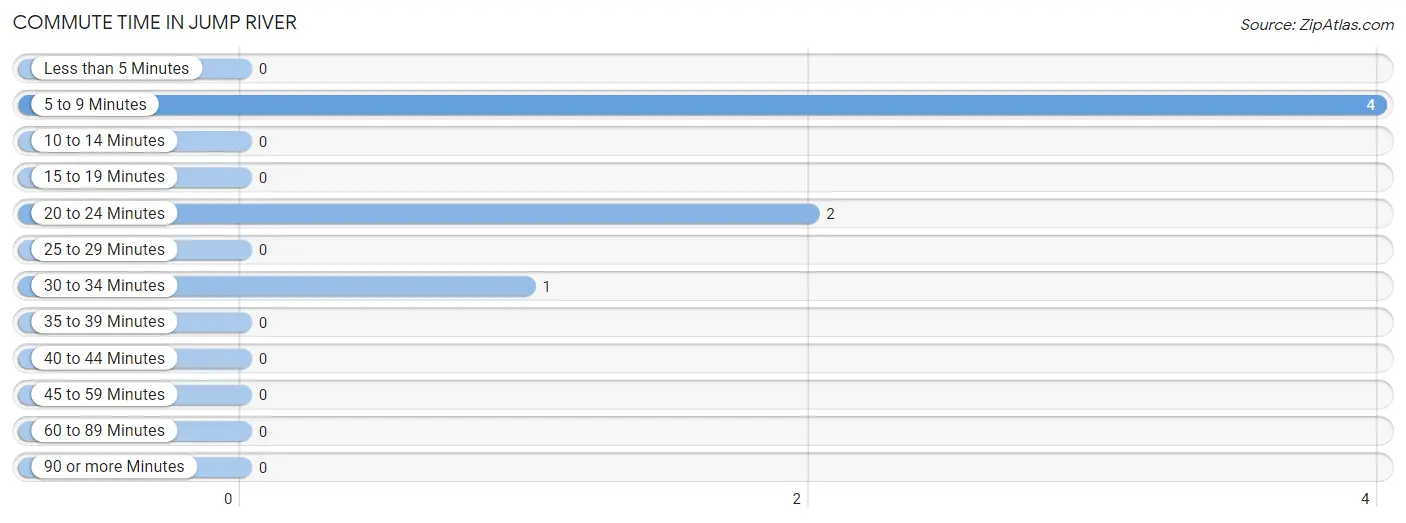
| Commute Time | # Commuters | % Commuters |
| Less than 5 Minutes | 0 | 0.0% |
| 5 to 9 Minutes | 4 | 57.1% |
| 10 to 14 Minutes | 0 | 0.0% |
| 15 to 19 Minutes | 0 | 0.0% |
| 20 to 24 Minutes | 2 | 28.6% |
| 25 to 29 Minutes | 0 | 0.0% |
| 30 to 34 Minutes | 1 | 14.3% |
| 35 to 39 Minutes | 0 | 0.0% |
| 40 to 44 Minutes | 0 | 0.0% |
| 45 to 59 Minutes | 0 | 0.0% |
| 60 to 89 Minutes | 0 | 0.0% |
| 90 or more Minutes | 0 | 0.0% |
Commute Time by Sex in Jump River
The most common commute times in Jump River are 20 to 24 minutes (2 commuters, 66.7%) for males and 5 to 9 minutes (4 commuters, 100.0%) for females.
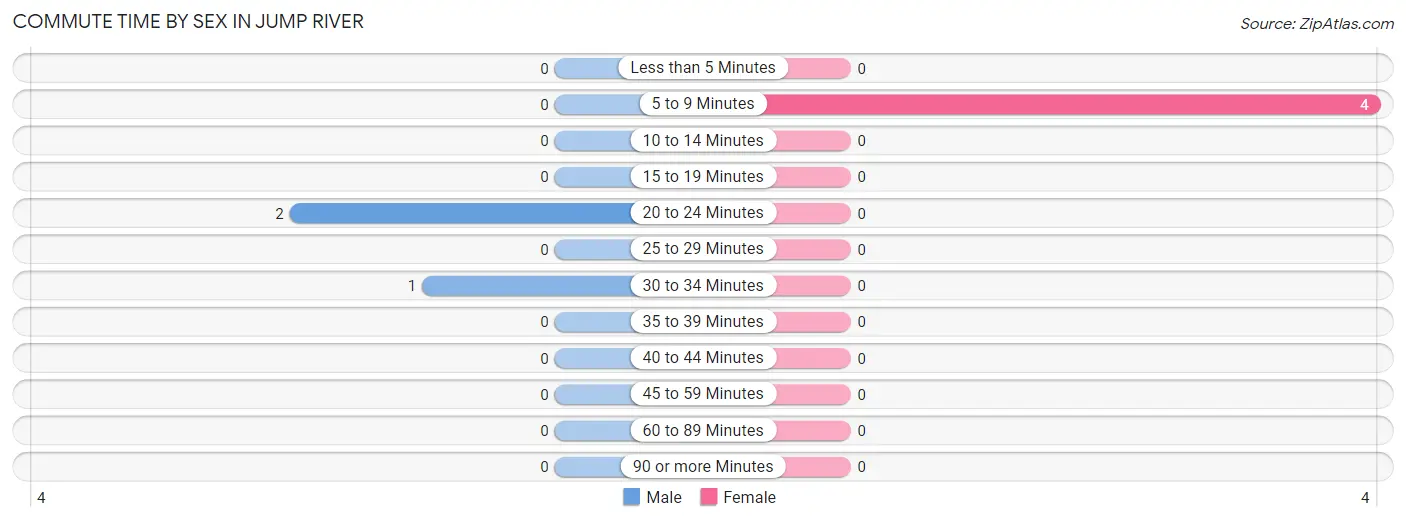
| Commute Time | Male | Female |
| Less than 5 Minutes | 0 (0.0%) | 0 (0.0%) |
| 5 to 9 Minutes | 0 (0.0%) | 4 (100.0%) |
| 10 to 14 Minutes | 0 (0.0%) | 0 (0.0%) |
| 15 to 19 Minutes | 0 (0.0%) | 0 (0.0%) |
| 20 to 24 Minutes | 2 (66.7%) | 0 (0.0%) |
| 25 to 29 Minutes | 0 (0.0%) | 0 (0.0%) |
| 30 to 34 Minutes | 1 (33.3%) | 0 (0.0%) |
| 35 to 39 Minutes | 0 (0.0%) | 0 (0.0%) |
| 40 to 44 Minutes | 0 (0.0%) | 0 (0.0%) |
| 45 to 59 Minutes | 0 (0.0%) | 0 (0.0%) |
| 60 to 89 Minutes | 0 (0.0%) | 0 (0.0%) |
| 90 or more Minutes | 0 (0.0%) | 0 (0.0%) |
Time of Departure to Work by Sex in Jump River
The most frequent times of departure to work in Jump River are 5:00 AM to 5:29 AM (1, 33.3%) for males and 7:00 AM to 7:29 AM (4, 100.0%) for females.
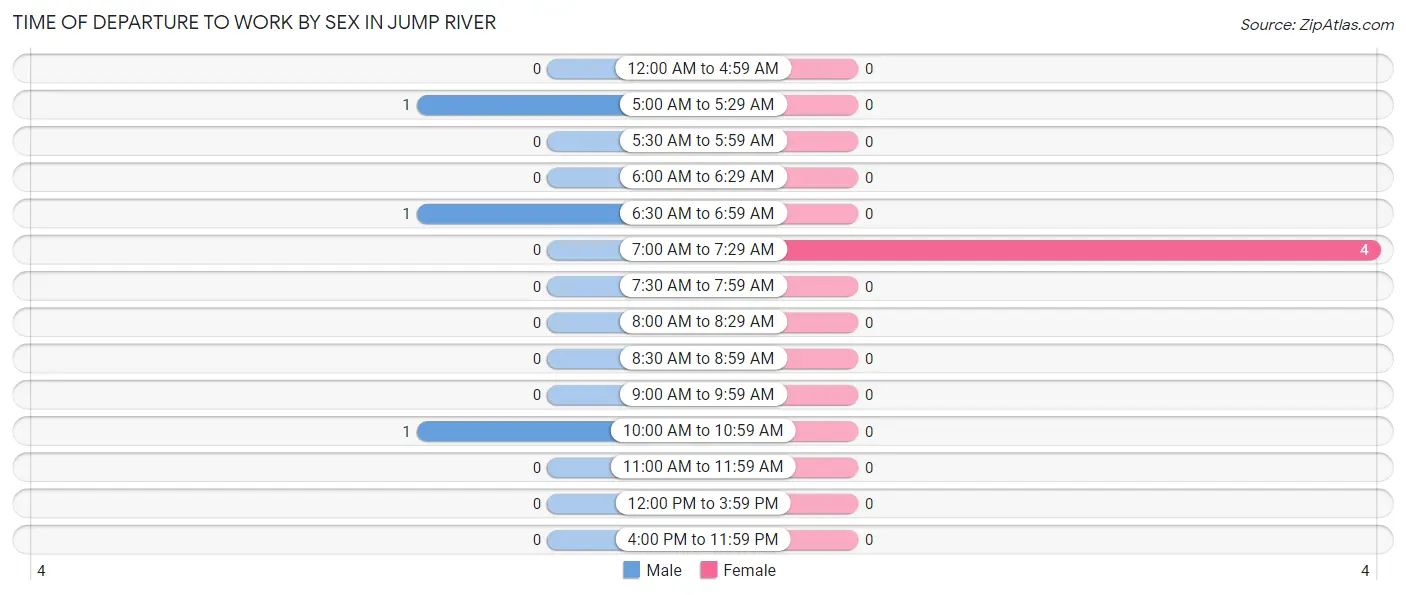
| Time of Departure | Male | Female |
| 12:00 AM to 4:59 AM | 0 (0.0%) | 0 (0.0%) |
| 5:00 AM to 5:29 AM | 1 (33.3%) | 0 (0.0%) |
| 5:30 AM to 5:59 AM | 0 (0.0%) | 0 (0.0%) |
| 6:00 AM to 6:29 AM | 0 (0.0%) | 0 (0.0%) |
| 6:30 AM to 6:59 AM | 1 (33.3%) | 0 (0.0%) |
| 7:00 AM to 7:29 AM | 0 (0.0%) | 4 (100.0%) |
| 7:30 AM to 7:59 AM | 0 (0.0%) | 0 (0.0%) |
| 8:00 AM to 8:29 AM | 0 (0.0%) | 0 (0.0%) |
| 8:30 AM to 8:59 AM | 0 (0.0%) | 0 (0.0%) |
| 9:00 AM to 9:59 AM | 0 (0.0%) | 0 (0.0%) |
| 10:00 AM to 10:59 AM | 1 (33.3%) | 0 (0.0%) |
| 11:00 AM to 11:59 AM | 0 (0.0%) | 0 (0.0%) |
| 12:00 PM to 3:59 PM | 0 (0.0%) | 0 (0.0%) |
| 4:00 PM to 11:59 PM | 0 (0.0%) | 0 (0.0%) |
| Total | 3 (100.0%) | 4 (100.0%) |
Housing Occupancy in Jump River
Occupancy by Ownership in Jump River
Of the total 26 dwellings in Jump River, owner-occupied units account for 25 (96.2%), while renter-occupied units make up 1 (3.8%).
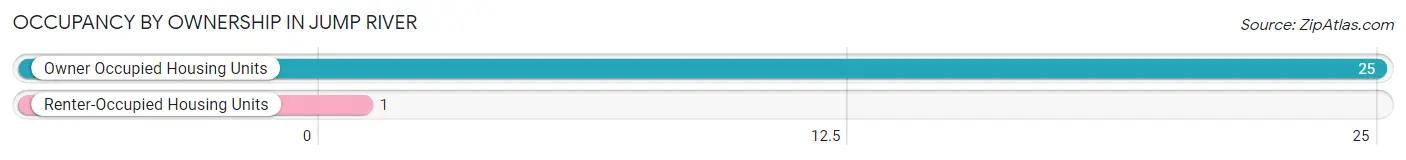
| Occupancy | # Housing Units | % Housing Units |
| Owner Occupied Housing Units | 25 | 96.2% |
| Renter-Occupied Housing Units | 1 | 3.8% |
| Total Occupied Housing Units | 26 | 100.0% |
Occupancy by Household Size in Jump River
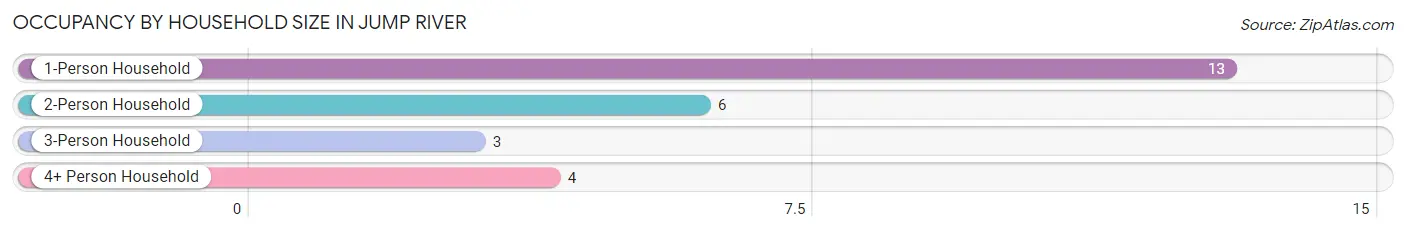
| Household Size | # Housing Units | % Housing Units |
| 1-Person Household | 13 | 50.0% |
| 2-Person Household | 6 | 23.1% |
| 3-Person Household | 3 | 11.5% |
| 4+ Person Household | 4 | 15.4% |
| Total Housing Units | 26 | 100.0% |
Occupancy by Ownership by Household Size in Jump River
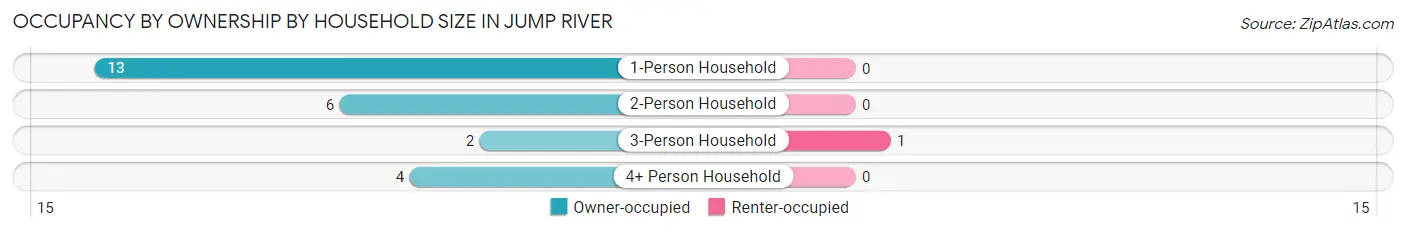
| Household Size | Owner-occupied | Renter-occupied |
| 1-Person Household | 13 (100.0%) | 0 (0.0%) |
| 2-Person Household | 6 (100.0%) | 0 (0.0%) |
| 3-Person Household | 2 (66.7%) | 1 (33.3%) |
| 4+ Person Household | 4 (100.0%) | 0 (0.0%) |
| Total Housing Units | 25 (96.2%) | 1 (3.8%) |
Occupancy by Educational Attainment in Jump River
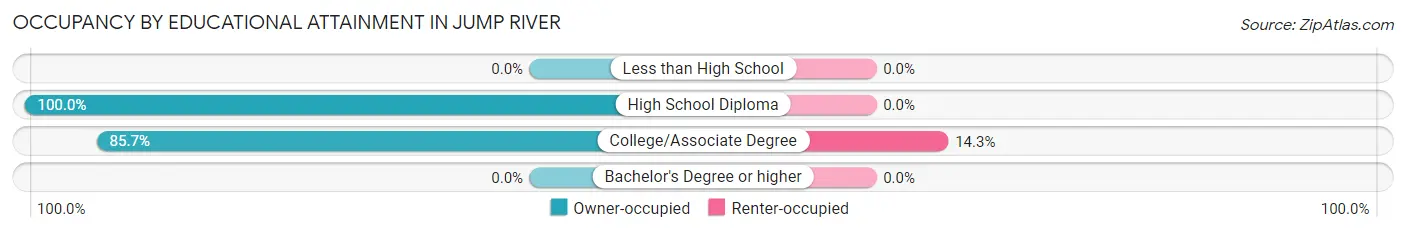
| Household Size | Owner-occupied | Renter-occupied |
| Less than High School | 0 (0.0%) | 0 (0.0%) |
| High School Diploma | 19 (100.0%) | 0 (0.0%) |
| College/Associate Degree | 6 (85.7%) | 1 (14.3%) |
| Bachelor's Degree or higher | 0 (0.0%) | 0 (0.0%) |
Occupancy by Age of Householder in Jump River
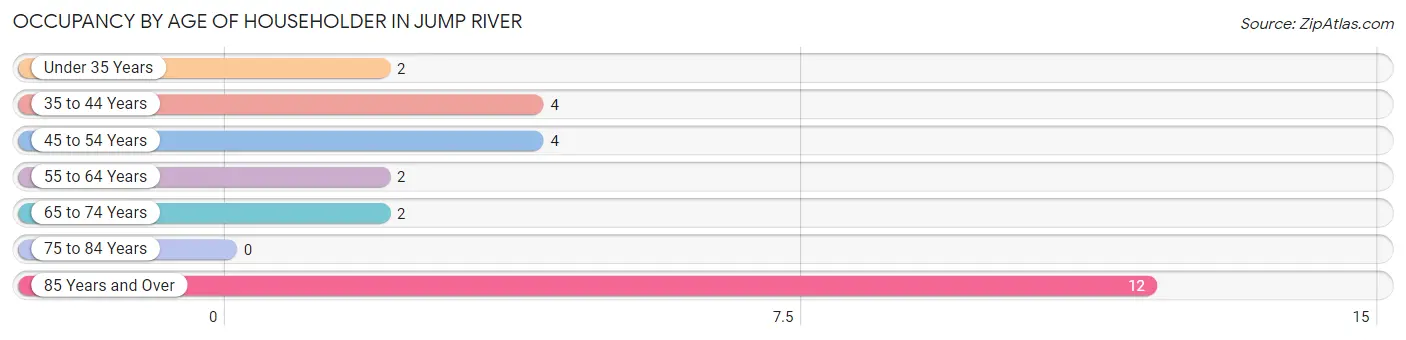
| Age Bracket | # Households | % Households |
| Under 35 Years | 2 | 7.7% |
| 35 to 44 Years | 4 | 15.4% |
| 45 to 54 Years | 4 | 15.4% |
| 55 to 64 Years | 2 | 7.7% |
| 65 to 74 Years | 2 | 7.7% |
| 75 to 84 Years | 0 | 0.0% |
| 85 Years and Over | 12 | 46.2% |
| Total | 26 | 100.0% |
Housing Finances in Jump River
Median Income by Occupancy in Jump River
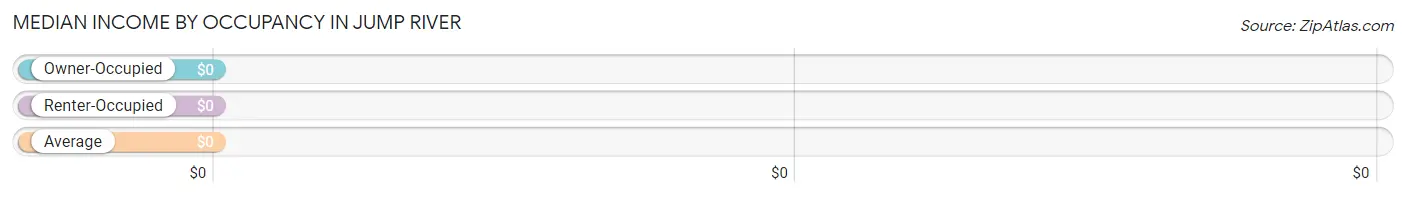
| Occupancy Type | # Households | Median Income |
| Owner-Occupied | 25 (96.2%) | $0 |
| Renter-Occupied | 1 (3.8%) | $0 |
| Average | 26 (100.0%) | $0 |
Occupancy by Householder Income Bracket in Jump River
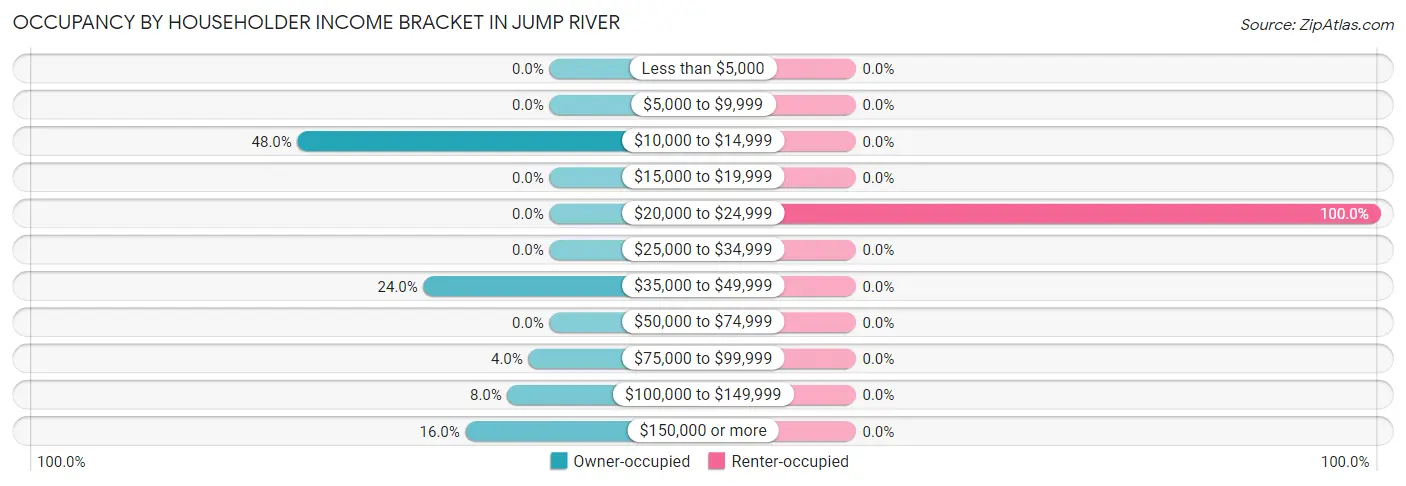
| Income Bracket | Owner-occupied | Renter-occupied |
| Less than $5,000 | 0 (0.0%) | 0 (0.0%) |
| $5,000 to $9,999 | 0 (0.0%) | 0 (0.0%) |
| $10,000 to $14,999 | 12 (48.0%) | 0 (0.0%) |
| $15,000 to $19,999 | 0 (0.0%) | 0 (0.0%) |
| $20,000 to $24,999 | 0 (0.0%) | 1 (100.0%) |
| $25,000 to $34,999 | 0 (0.0%) | 0 (0.0%) |
| $35,000 to $49,999 | 6 (24.0%) | 0 (0.0%) |
| $50,000 to $74,999 | 0 (0.0%) | 0 (0.0%) |
| $75,000 to $99,999 | 1 (4.0%) | 0 (0.0%) |
| $100,000 to $149,999 | 2 (8.0%) | 0 (0.0%) |
| $150,000 or more | 4 (16.0%) | 0 (0.0%) |
| Total | 25 (100.0%) | 1 (100.0%) |
Monthly Housing Cost Tiers in Jump River
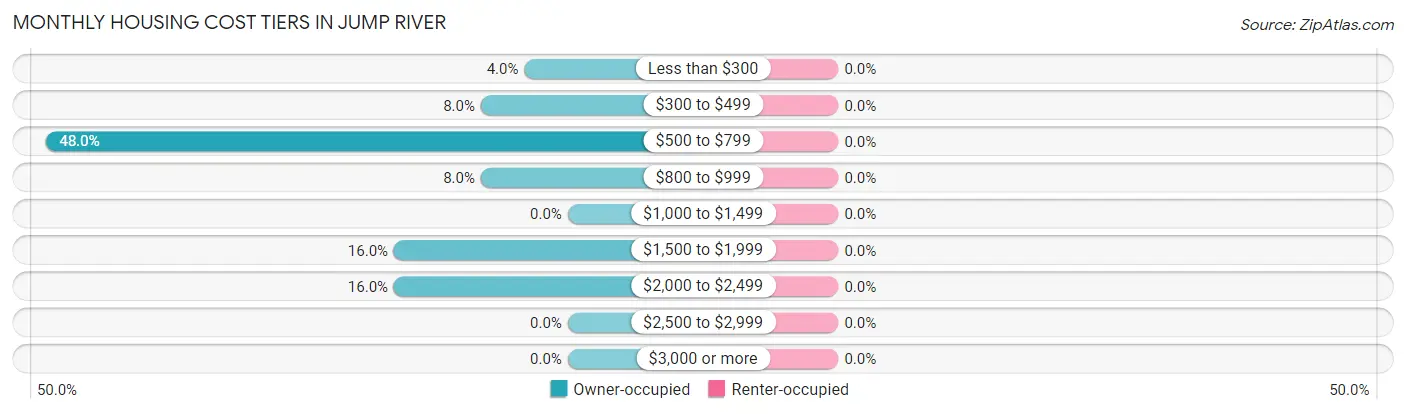
| Monthly Cost | Owner-occupied | Renter-occupied |
| Less than $300 | 1 (4.0%) | 0 (0.0%) |
| $300 to $499 | 2 (8.0%) | 0 (0.0%) |
| $500 to $799 | 12 (48.0%) | 0 (0.0%) |
| $800 to $999 | 2 (8.0%) | 0 (0.0%) |
| $1,000 to $1,499 | 0 (0.0%) | 0 (0.0%) |
| $1,500 to $1,999 | 4 (16.0%) | 0 (0.0%) |
| $2,000 to $2,499 | 4 (16.0%) | 0 (0.0%) |
| $2,500 to $2,999 | 0 (0.0%) | 0 (0.0%) |
| $3,000 or more | 0 (0.0%) | 0 (0.0%) |
| Total | 25 (100.0%) | 1 (100.0%) |
Physical Housing Characteristics in Jump River
Housing Structures in Jump River
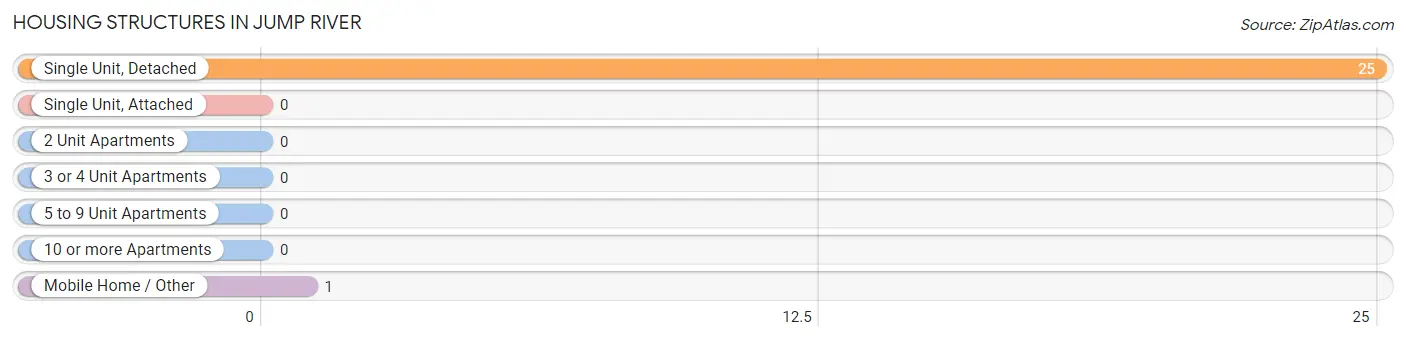
| Structure Type | # Housing Units | % Housing Units |
| Single Unit, Detached | 25 | 96.2% |
| Single Unit, Attached | 0 | 0.0% |
| 2 Unit Apartments | 0 | 0.0% |
| 3 or 4 Unit Apartments | 0 | 0.0% |
| 5 to 9 Unit Apartments | 0 | 0.0% |
| 10 or more Apartments | 0 | 0.0% |
| Mobile Home / Other | 1 | 3.8% |
| Total | 26 | 100.0% |
Housing Structures by Occupancy in Jump River
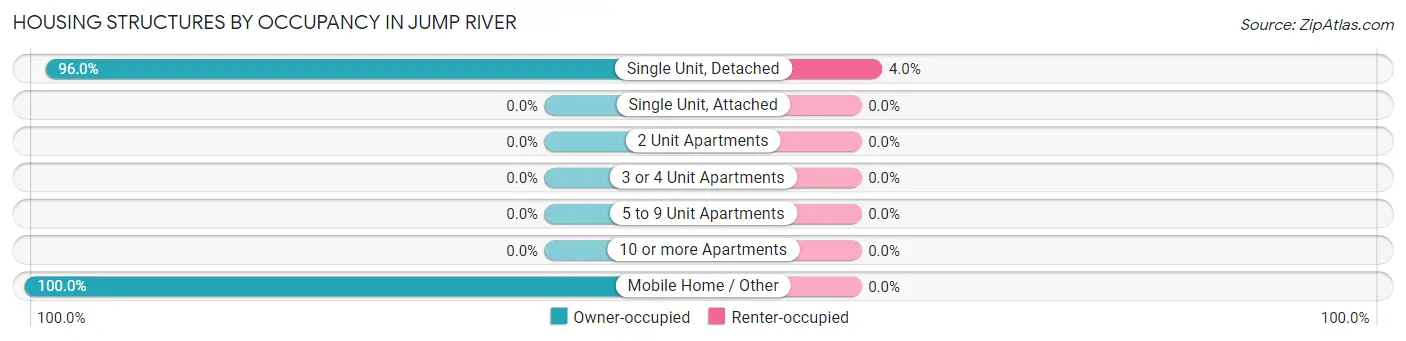
| Structure Type | Owner-occupied | Renter-occupied |
| Single Unit, Detached | 24 (96.0%) | 1 (4.0%) |
| Single Unit, Attached | 0 (0.0%) | 0 (0.0%) |
| 2 Unit Apartments | 0 (0.0%) | 0 (0.0%) |
| 3 or 4 Unit Apartments | 0 (0.0%) | 0 (0.0%) |
| 5 to 9 Unit Apartments | 0 (0.0%) | 0 (0.0%) |
| 10 or more Apartments | 0 (0.0%) | 0 (0.0%) |
| Mobile Home / Other | 1 (100.0%) | 0 (0.0%) |
| Total | 25 (96.2%) | 1 (3.8%) |
Housing Structures by Number of Rooms in Jump River
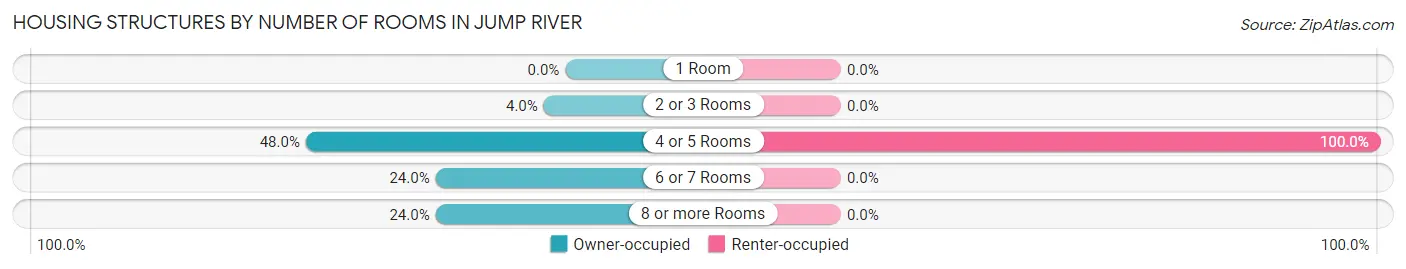
| Number of Rooms | Owner-occupied | Renter-occupied |
| 1 Room | 0 (0.0%) | 0 (0.0%) |
| 2 or 3 Rooms | 1 (4.0%) | 0 (0.0%) |
| 4 or 5 Rooms | 12 (48.0%) | 1 (100.0%) |
| 6 or 7 Rooms | 6 (24.0%) | 0 (0.0%) |
| 8 or more Rooms | 6 (24.0%) | 0 (0.0%) |
| Total | 25 (100.0%) | 1 (100.0%) |
Housing Structure by Heating Type in Jump River
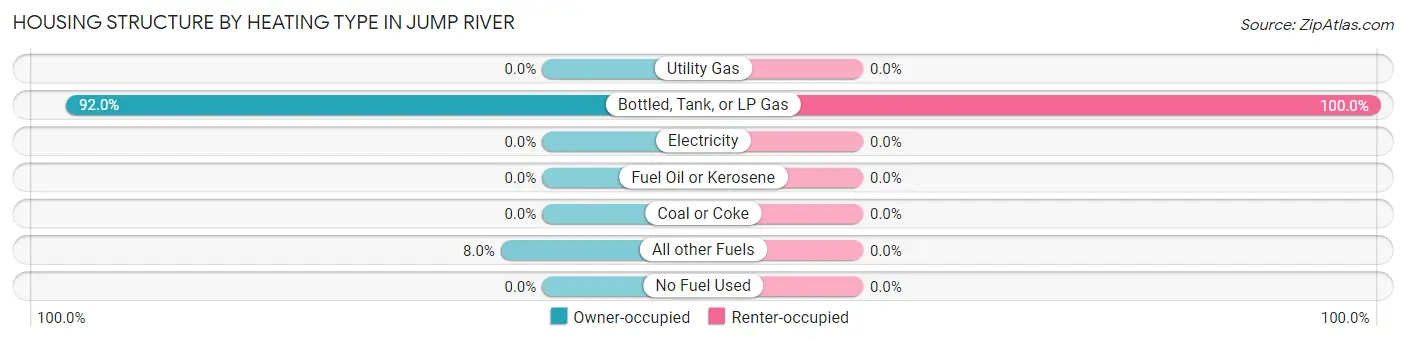
| Heating Type | Owner-occupied | Renter-occupied |
| Utility Gas | 0 (0.0%) | 0 (0.0%) |
| Bottled, Tank, or LP Gas | 23 (92.0%) | 1 (100.0%) |
| Electricity | 0 (0.0%) | 0 (0.0%) |
| Fuel Oil or Kerosene | 0 (0.0%) | 0 (0.0%) |
| Coal or Coke | 0 (0.0%) | 0 (0.0%) |
| All other Fuels | 2 (8.0%) | 0 (0.0%) |
| No Fuel Used | 0 (0.0%) | 0 (0.0%) |
| Total | 25 (100.0%) | 1 (100.0%) |
Household Vehicle Usage in Jump River
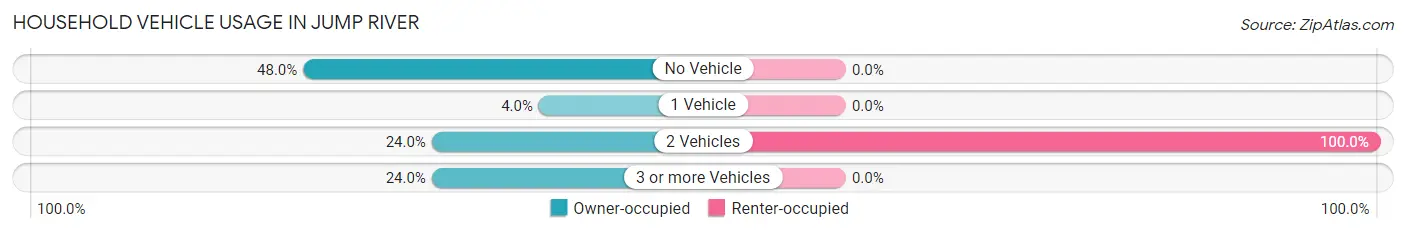
| Vehicles per Household | Owner-occupied | Renter-occupied |
| No Vehicle | 12 (48.0%) | 0 (0.0%) |
| 1 Vehicle | 1 (4.0%) | 0 (0.0%) |
| 2 Vehicles | 6 (24.0%) | 1 (100.0%) |
| 3 or more Vehicles | 6 (24.0%) | 0 (0.0%) |
| Total | 25 (100.0%) | 1 (100.0%) |
Real Estate & Mortgages in Jump River
Real Estate and Mortgage Overview in Jump River
| Characteristic | Without Mortgage | With Mortgage |
| Housing Units | 15 | 10 |
| Median Property Value | $95,400 | $0 |
| Median Household Income | $14,063 | $4 |
| Monthly Housing Costs | $538 | $0 |
| Real Estate Taxes | $893 | $0 |
Property Value by Mortgage Status in Jump River
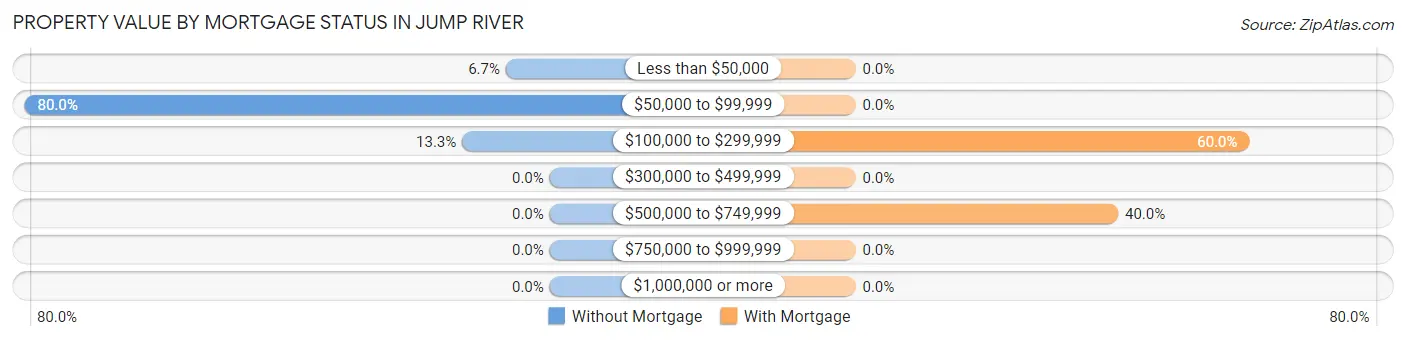
| Property Value | Without Mortgage | With Mortgage |
| Less than $50,000 | 1 (6.7%) | 0 (0.0%) |
| $50,000 to $99,999 | 12 (80.0%) | 0 (0.0%) |
| $100,000 to $299,999 | 2 (13.3%) | 6 (60.0%) |
| $300,000 to $499,999 | 0 (0.0%) | 0 (0.0%) |
| $500,000 to $749,999 | 0 (0.0%) | 4 (40.0%) |
| $750,000 to $999,999 | 0 (0.0%) | 0 (0.0%) |
| $1,000,000 or more | 0 (0.0%) | 0 (0.0%) |
| Total | 15 (100.0%) | 10 (100.0%) |
Household Income by Mortgage Status in Jump River
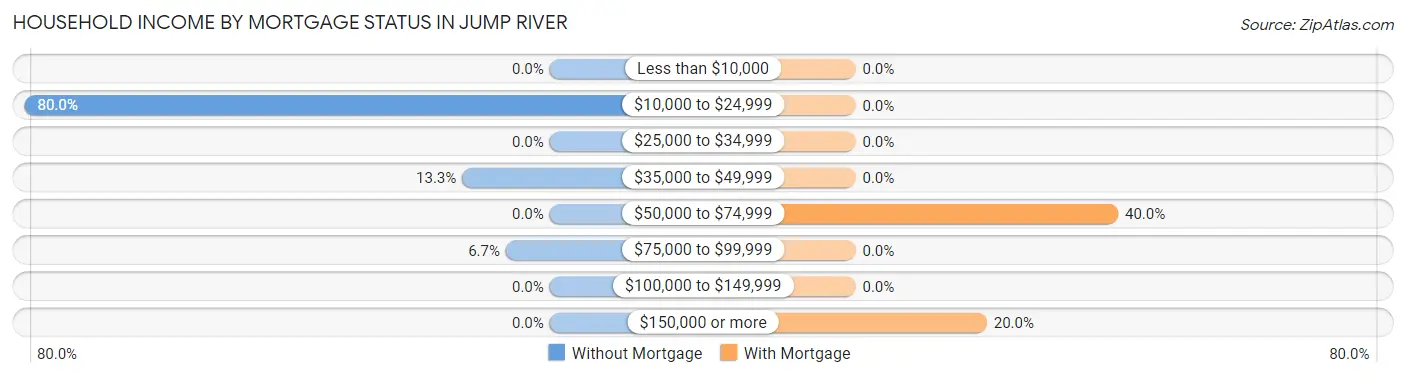
| Household Income | Without Mortgage | With Mortgage |
| Less than $10,000 | 0 (0.0%) | 0 (0.0%) |
| $10,000 to $24,999 | 12 (80.0%) | 0 (0.0%) |
| $25,000 to $34,999 | 0 (0.0%) | 0 (0.0%) |
| $35,000 to $49,999 | 2 (13.3%) | 0 (0.0%) |
| $50,000 to $74,999 | 0 (0.0%) | 4 (40.0%) |
| $75,000 to $99,999 | 1 (6.7%) | 0 (0.0%) |
| $100,000 to $149,999 | 0 (0.0%) | 0 (0.0%) |
| $150,000 or more | 0 (0.0%) | 2 (20.0%) |
| Total | 15 (100.0%) | 10 (100.0%) |
Property Value to Household Income Ratio in Jump River
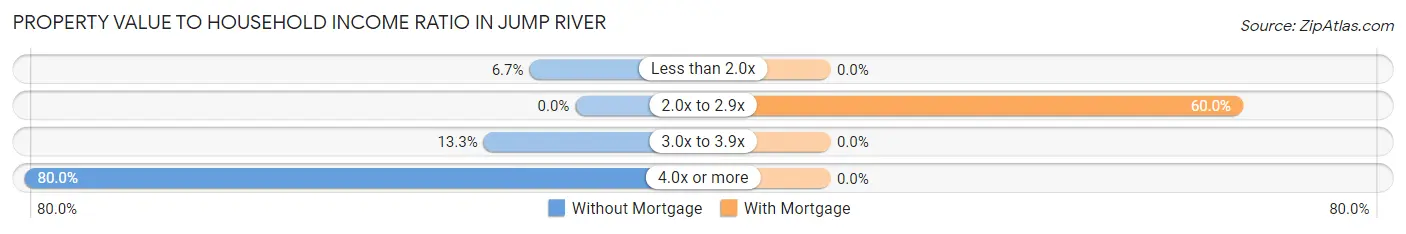
| Value-to-Income Ratio | Without Mortgage | With Mortgage |
| Less than 2.0x | 1 (6.7%) | 0 (0.0%) |
| 2.0x to 2.9x | 0 (0.0%) | 6 (60.0%) |
| 3.0x to 3.9x | 2 (13.3%) | 0 (0.0%) |
| 4.0x or more | 12 (80.0%) | 0 (0.0%) |
| Total | 15 (100.0%) | 10 (100.0%) |
Real Estate Taxes by Mortgage Status in Jump River
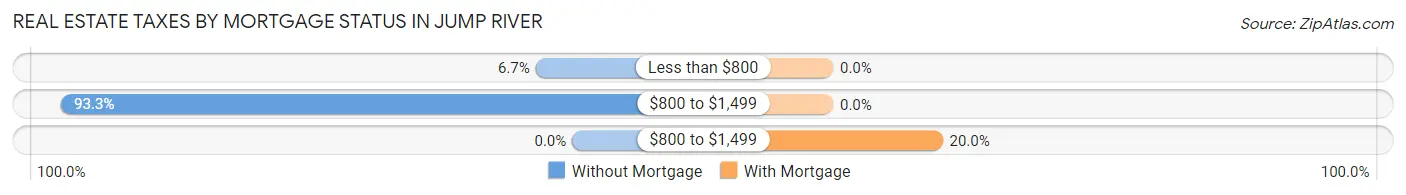
| Property Taxes | Without Mortgage | With Mortgage |
| Less than $800 | 1 (6.7%) | 0 (0.0%) |
| $800 to $1,499 | 14 (93.3%) | 0 (0.0%) |
| $800 to $1,499 | 0 (0.0%) | 2 (20.0%) |
| Total | 15 (100.0%) | 10 (100.0%) |
Health & Disability in Jump River
Health Insurance Coverage by Age in Jump River
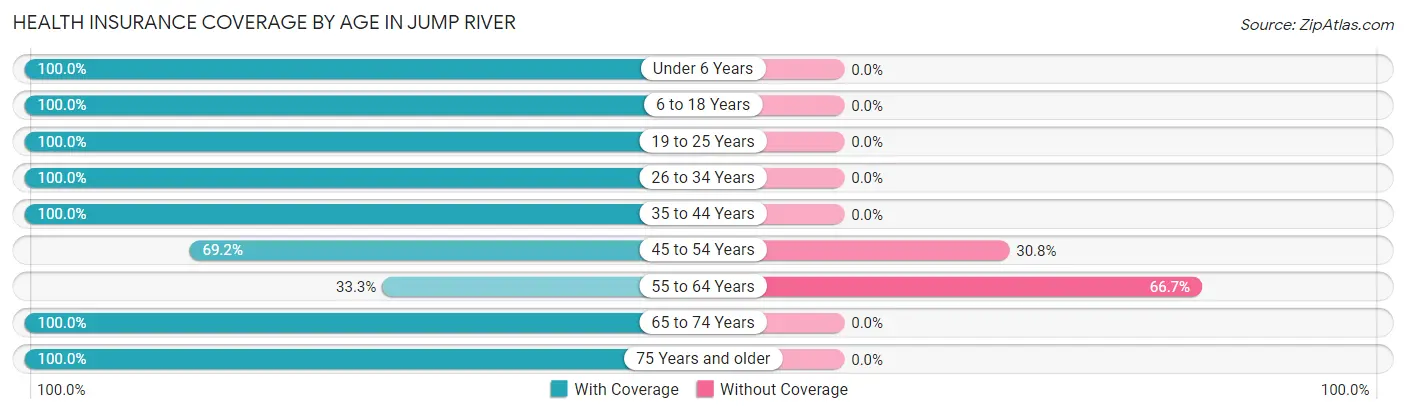
| Age Bracket | With Coverage | Without Coverage |
| Under 6 Years | 5 (100.0%) | 0 (0.0%) |
| 6 to 18 Years | 4 (100.0%) | 0 (0.0%) |
| 19 to 25 Years | 1 (100.0%) | 0 (0.0%) |
| 26 to 34 Years | 3 (100.0%) | 0 (0.0%) |
| 35 to 44 Years | 4 (100.0%) | 0 (0.0%) |
| 45 to 54 Years | 9 (69.2%) | 4 (30.8%) |
| 55 to 64 Years | 1 (33.3%) | 2 (66.7%) |
| 65 to 74 Years | 10 (100.0%) | 0 (0.0%) |
| 75 Years and older | 12 (100.0%) | 0 (0.0%) |
| Total | 49 (89.1%) | 6 (10.9%) |
Health Insurance Coverage by Citizenship Status in Jump River
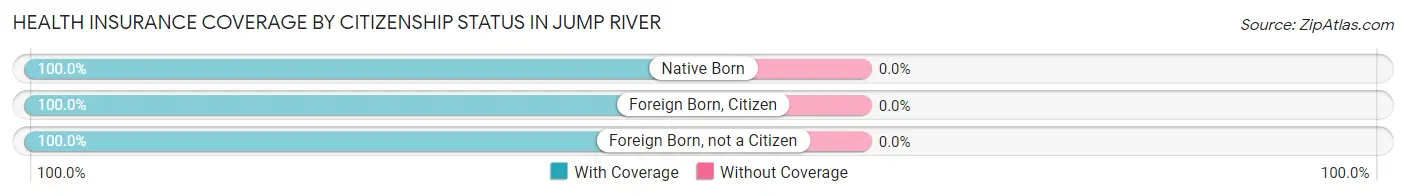
| Citizenship Status | With Coverage | Without Coverage |
| Native Born | 5 (100.0%) | 0 (0.0%) |
| Foreign Born, Citizen | 4 (100.0%) | 0 (0.0%) |
| Foreign Born, not a Citizen | 1 (100.0%) | 0 (0.0%) |
Health Insurance Coverage by Household Income in Jump River
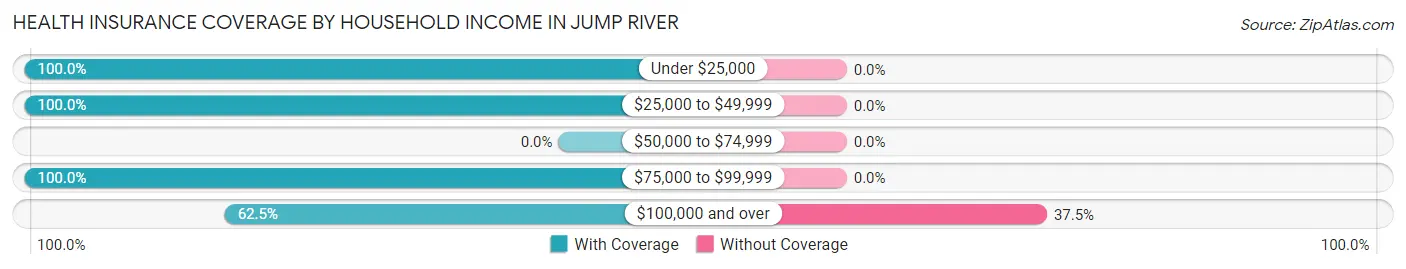
| Household Income | With Coverage | Without Coverage |
| Under $25,000 | 15 (100.0%) | 0 (0.0%) |
| $25,000 to $49,999 | 23 (100.0%) | 0 (0.0%) |
| $50,000 to $74,999 | 0 (0.0%) | 0 (0.0%) |
| $75,000 to $99,999 | 1 (100.0%) | 0 (0.0%) |
| $100,000 and over | 10 (62.5%) | 6 (37.5%) |
Public vs Private Health Insurance Coverage by Age in Jump River
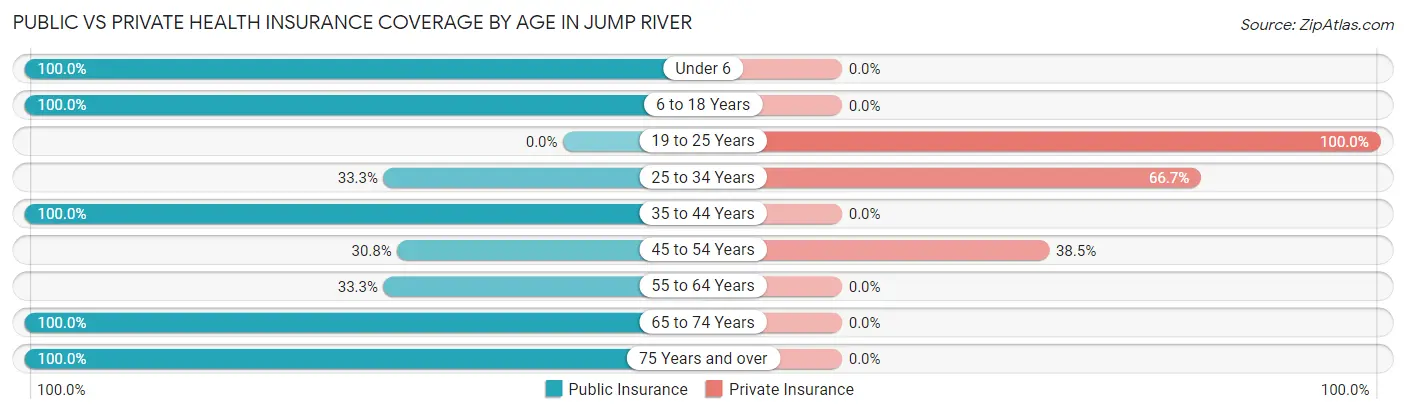
| Age Bracket | Public Insurance | Private Insurance |
| Under 6 | 5 (100.0%) | 0 (0.0%) |
| 6 to 18 Years | 4 (100.0%) | 0 (0.0%) |
| 19 to 25 Years | 0 (0.0%) | 1 (100.0%) |
| 25 to 34 Years | 1 (33.3%) | 2 (66.7%) |
| 35 to 44 Years | 4 (100.0%) | 0 (0.0%) |
| 45 to 54 Years | 4 (30.8%) | 5 (38.5%) |
| 55 to 64 Years | 1 (33.3%) | 0 (0.0%) |
| 65 to 74 Years | 10 (100.0%) | 0 (0.0%) |
| 75 Years and over | 12 (100.0%) | 0 (0.0%) |
| Total | 41 (74.6%) | 8 (14.5%) |
Disability Status by Sex by Age in Jump River
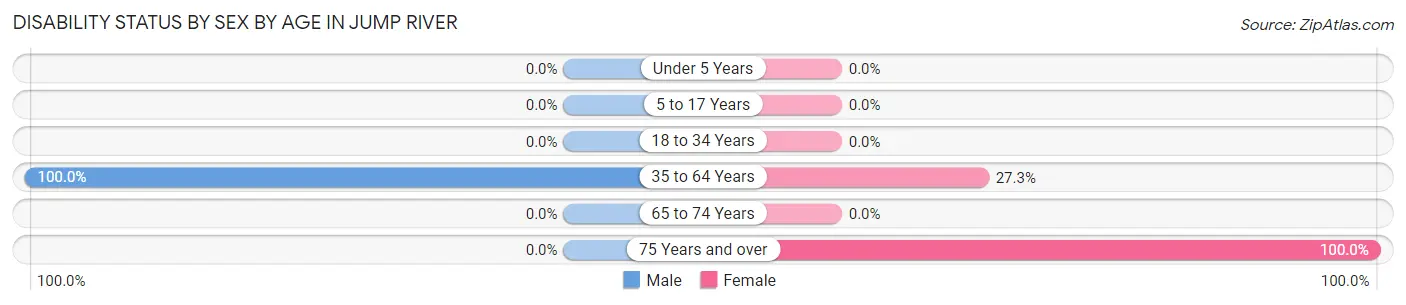
| Age Bracket | Male | Female |
| Under 5 Years | 0 (0.0%) | 0 (0.0%) |
| 5 to 17 Years | 0 (0.0%) | 0 (0.0%) |
| 18 to 34 Years | 0 (0.0%) | 0 (0.0%) |
| 35 to 64 Years | 9 (100.0%) | 3 (27.3%) |
| 65 to 74 Years | 0 (0.0%) | 0 (0.0%) |
| 75 Years and over | 0 (0.0%) | 12 (100.0%) |
Disability Class by Sex by Age in Jump River
Disability Class: Hearing Difficulty
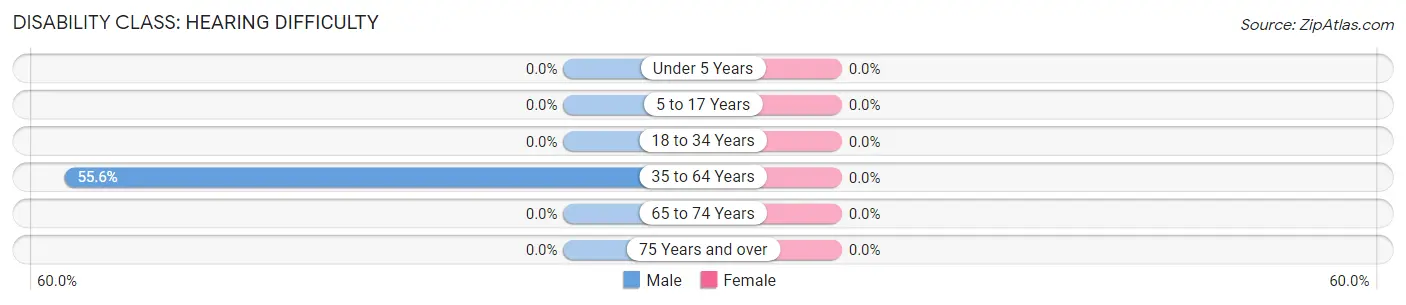
| Age Bracket | Male | Female |
| Under 5 Years | 0 (0.0%) | 0 (0.0%) |
| 5 to 17 Years | 0 (0.0%) | 0 (0.0%) |
| 18 to 34 Years | 0 (0.0%) | 0 (0.0%) |
| 35 to 64 Years | 5 (55.6%) | 0 (0.0%) |
| 65 to 74 Years | 0 (0.0%) | 0 (0.0%) |
| 75 Years and over | 0 (0.0%) | 0 (0.0%) |
Disability Class: Vision Difficulty
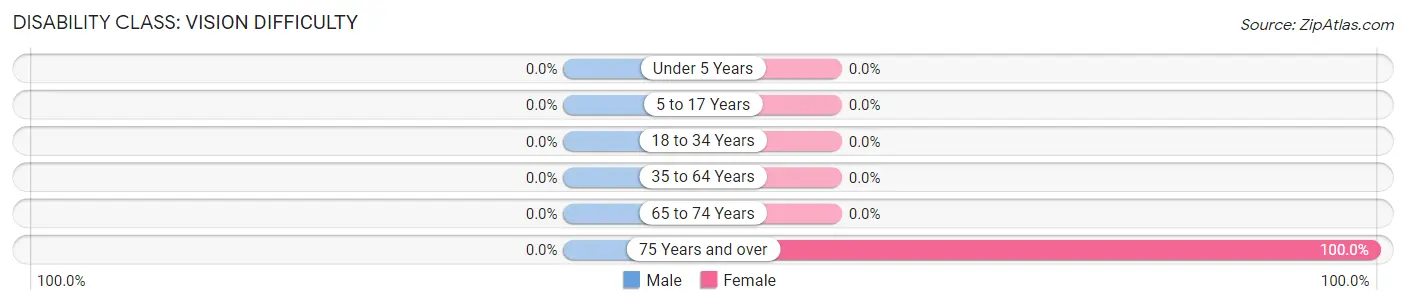
| Age Bracket | Male | Female |
| Under 5 Years | 0 (0.0%) | 0 (0.0%) |
| 5 to 17 Years | 0 (0.0%) | 0 (0.0%) |
| 18 to 34 Years | 0 (0.0%) | 0 (0.0%) |
| 35 to 64 Years | 0 (0.0%) | 0 (0.0%) |
| 65 to 74 Years | 0 (0.0%) | 0 (0.0%) |
| 75 Years and over | 0 (0.0%) | 12 (100.0%) |
Disability Class: Cognitive Difficulty
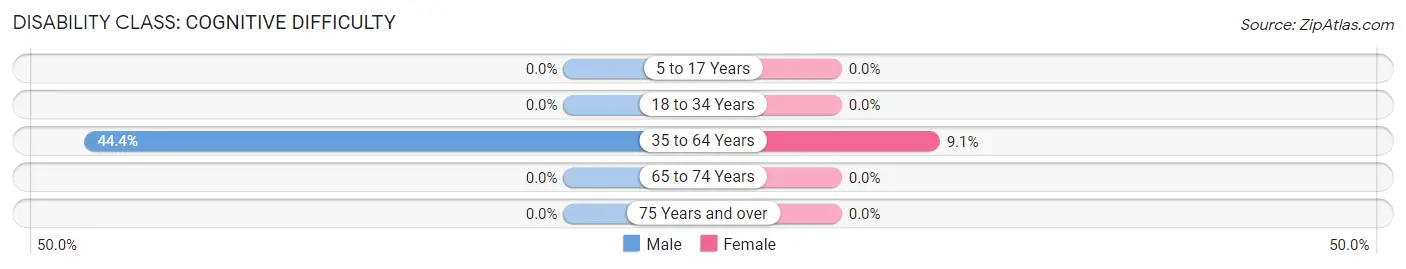
| Age Bracket | Male | Female |
| 5 to 17 Years | 0 (0.0%) | 0 (0.0%) |
| 18 to 34 Years | 0 (0.0%) | 0 (0.0%) |
| 35 to 64 Years | 4 (44.4%) | 1 (9.1%) |
| 65 to 74 Years | 0 (0.0%) | 0 (0.0%) |
| 75 Years and over | 0 (0.0%) | 0 (0.0%) |
Disability Class: Ambulatory Difficulty
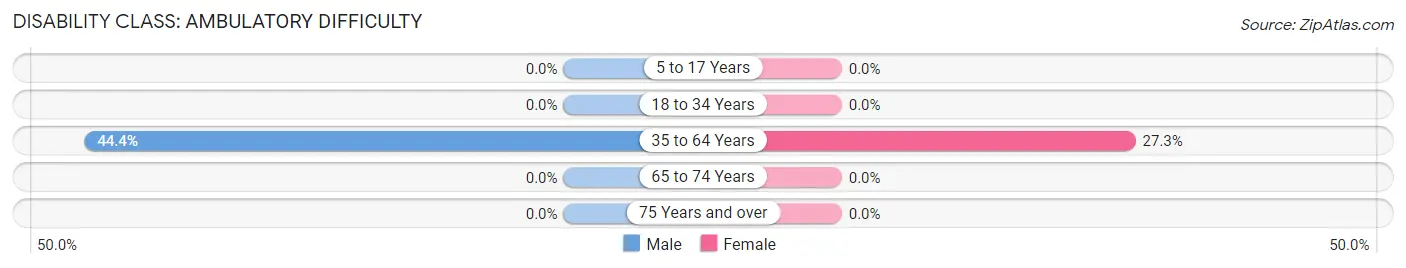
| Age Bracket | Male | Female |
| 5 to 17 Years | 0 (0.0%) | 0 (0.0%) |
| 18 to 34 Years | 0 (0.0%) | 0 (0.0%) |
| 35 to 64 Years | 4 (44.4%) | 3 (27.3%) |
| 65 to 74 Years | 0 (0.0%) | 0 (0.0%) |
| 75 Years and over | 0 (0.0%) | 0 (0.0%) |
Disability Class: Self-Care Difficulty
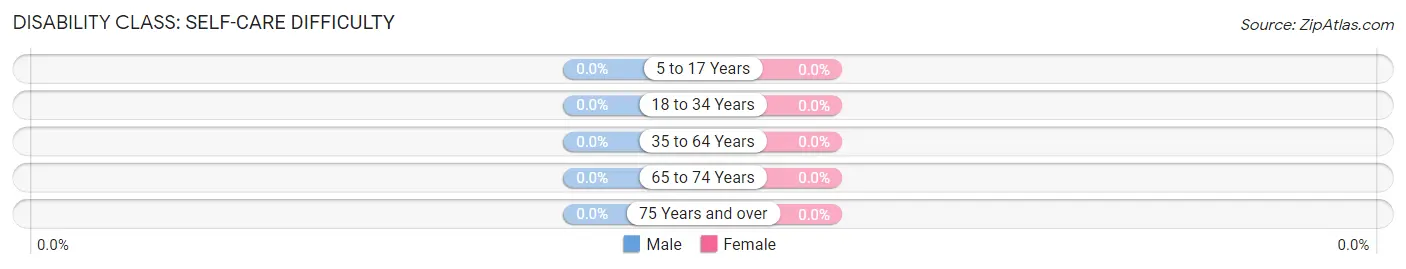
| Age Bracket | Male | Female |
| 5 to 17 Years | 0 (0.0%) | 0 (0.0%) |
| 18 to 34 Years | 0 (0.0%) | 0 (0.0%) |
| 35 to 64 Years | 0 (0.0%) | 0 (0.0%) |
| 65 to 74 Years | 0 (0.0%) | 0 (0.0%) |
| 75 Years and over | 0 (0.0%) | 0 (0.0%) |
Technology Access in Jump River
Computing Device Access in Jump River
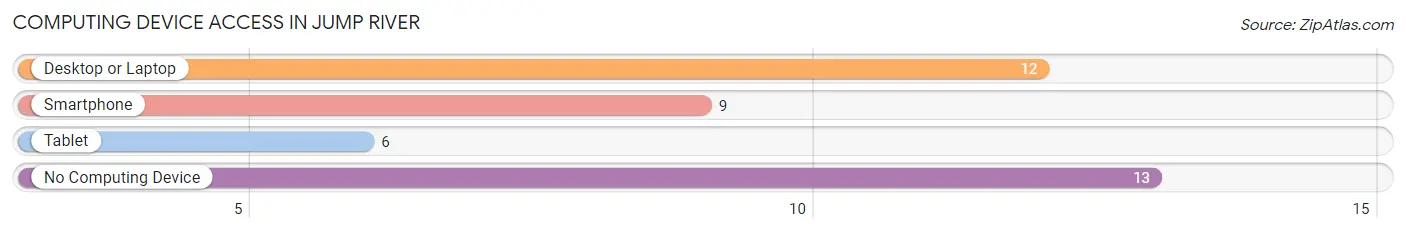
| Device Type | # Households | % Households |
| Desktop or Laptop | 12 | 46.2% |
| Smartphone | 9 | 34.6% |
| Tablet | 6 | 23.1% |
| No Computing Device | 13 | 50.0% |
| Total | 26 | 100.0% |
Internet Access in Jump River
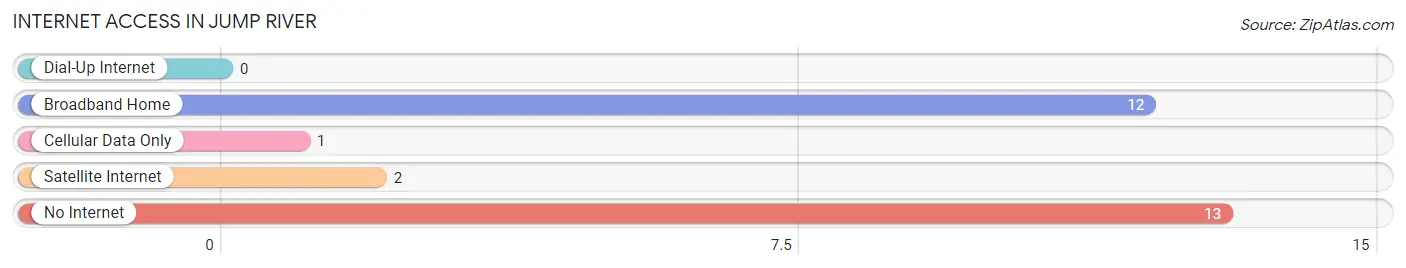
| Internet Type | # Households | % Households |
| Dial-Up Internet | 0 | 0.0% |
| Broadband Home | 12 | 46.2% |
| Cellular Data Only | 1 | 3.8% |
| Satellite Internet | 2 | 7.7% |
| No Internet | 13 | 50.0% |
| Total | 26 | 100.0% |
Jump River Summary
River, Wisconsin is a small town located in the northwest corner of the state, in the county of Burnett. It is situated on the Jump River, a tributary of the Chippewa River. The town was founded in 1856 and has a population of approximately 500 people.
Geography
Jump River is located in the northwest corner of Wisconsin, in Burnett County. It is situated on the Jump River, a tributary of the Chippewa River. The town is surrounded by rolling hills and forests, and is located in the heart of the Chippewa National Forest. The town is located approximately 30 miles from the city of Eau Claire, and is accessible by car or bus.
History
Jump River was founded in 1856 by a group of settlers from New York. The town was named after the Jump River, which was named after a Native American chief who lived in the area. The settlers built a sawmill and a gristmill, and the town quickly grew. In the late 1800s, the town was a major logging center, and the lumber industry was the main source of income for the town.
In the early 1900s, the town began to decline as the logging industry moved away. The town was revitalized in the 1950s when a new paper mill was built. The paper mill provided jobs for many of the town’s residents, and the town began to grow again.
Economy
The economy of Jump River is largely based on the paper mill, which is the town’s largest employer. The mill produces paper products for the local and regional markets. The town also has a few small businesses, including a grocery store, a hardware store, and a few restaurants.
Demographics
As of the 2010 census, the population of Jump River was 498 people. The town is predominantly white, with a small percentage of African Americans, Hispanics, and Native Americans. The median household income is $37,500, and the median home value is $117,000.
Conclusion
Jump River, Wisconsin is a small town located in the northwest corner of the state, in the county of Burnett. It is situated on the Jump River, a tributary of the Chippewa River. The town was founded in 1856 and has a population of approximately 500 people. The economy of Jump River is largely based on the paper mill, which is the town’s largest employer. The town is predominantly white, with a small percentage of African Americans, Hispanics, and Native Americans. The median household income is $37,500, and the median home value is $117,000.
Common Questions
What is Per Capita Income in Jump River?
Per Capita income in Jump River is $104,725.
What is Inequality or Gini Index in Jump River?
Inequality or Gini Index in Jump River is 0.73.
What is the Total Population of Jump River?
Total Population of Jump River is 55.
What is the Total Male Population of Jump River?
Total Male Population of Jump River is 14.
What is the Total Female Population of Jump River?
Total Female Population of Jump River is 41.
What is the Ratio of Males per 100 Females in Jump River?
There are 34.15 Males per 100 Females in Jump River.
What is the Ratio of Females per 100 Males in Jump River?
There are 292.86 Females per 100 Males in Jump River.
What is the Median Population Age in Jump River?
Median Population Age in Jump River is 54.4 Years.
What is the Average Family Size in Jump River
Average Family Size in Jump River is 3.2 People.
What is the Average Household Size in Jump River
Average Household Size in Jump River is 2.1 People.
How Large is the Labor Force in Jump River?
There are 8 People in the Labor Forcein in Jump River.
What is the Percentage of People in the Labor Force in Jump River?
17.4% of People are in the Labor Force in Jump River.
What is the Unemployment Rate in Jump River?
Unemployment Rate in Jump River is 12.5%.