Box, OK Map & Demographics
Box Map
Box Overview
$15,278
PER CAPITA INCOME
$39,904
AVG FAMILY INCOME
$36,250
AVG HOUSEHOLD INCOME
0.25
INEQUALITY / GINI INDEX
139
TOTAL POPULATION
63
MALE POPULATION
76
FEMALE POPULATION
82.89
MALES / 100 FEMALES
120.63
FEMALES / 100 MALES
69.1
MEDIAN AGE
3.0
AVG FAMILY SIZE
2.2
AVG HOUSEHOLD SIZE
27
LABOR FORCE [ PEOPLE ]
22.7%
PERCENT IN LABOR FORCE
Income in Box
Income Overview in Box
Per Capita Income in Box is $15,278, while median incomes of families and households are $39,904 and $36,250 respectively.
| Characteristic | Number | Measure |
| Per Capita Income | 139 | $15,278 |
| Median Family Income | 37 | $39,904 |
| Mean Family Income | 37 | $41,635 |
| Median Household Income | 64 | $36,250 |
| Mean Household Income | 64 | $34,675 |
| Income Deficit | 37 | $0 |
| Wage / Income Gap (%) | 139 | 0.00% |
| Wage / Income Gap ($) | 139 | 100.00¢ per $1 |
| Gini / Inequality Index | 139 | 0.25 |
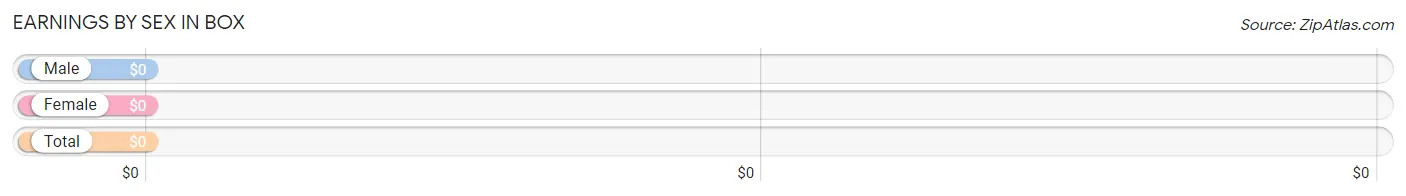
Earnings by Sex in Box
| Sex | Number | Average Earnings |
| Male | 0 (0.0%) | $0 |
| Female | 27 (100.0%) | $0 |
| Total | 27 (100.0%) | $0 |
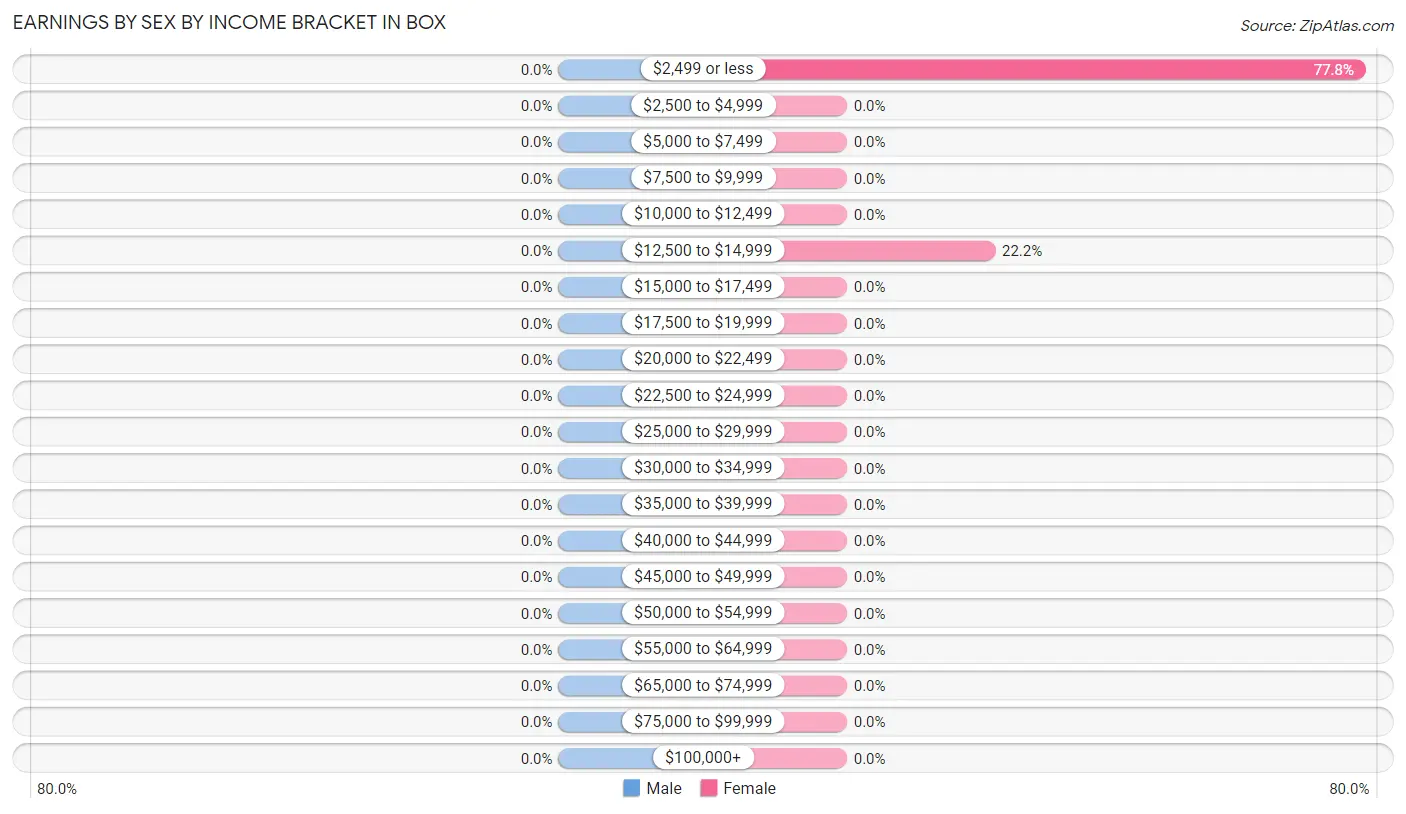
Earnings by Sex by Income Bracket in Box
| Income | Male | Female |
| $2,499 or less | 0 (0.0%) | 21 (77.8%) |
| $2,500 to $4,999 | 0 (0.0%) | 0 (0.0%) |
| $5,000 to $7,499 | 0 (0.0%) | 0 (0.0%) |
| $7,500 to $9,999 | 0 (0.0%) | 0 (0.0%) |
| $10,000 to $12,499 | 0 (0.0%) | 0 (0.0%) |
| $12,500 to $14,999 | 0 (0.0%) | 6 (22.2%) |
| $15,000 to $17,499 | 0 (0.0%) | 0 (0.0%) |
| $17,500 to $19,999 | 0 (0.0%) | 0 (0.0%) |
| $20,000 to $22,499 | 0 (0.0%) | 0 (0.0%) |
| $22,500 to $24,999 | 0 (0.0%) | 0 (0.0%) |
| $25,000 to $29,999 | 0 (0.0%) | 0 (0.0%) |
| $30,000 to $34,999 | 0 (0.0%) | 0 (0.0%) |
| $35,000 to $39,999 | 0 (0.0%) | 0 (0.0%) |
| $40,000 to $44,999 | 0 (0.0%) | 0 (0.0%) |
| $45,000 to $49,999 | 0 (0.0%) | 0 (0.0%) |
| $50,000 to $54,999 | 0 (0.0%) | 0 (0.0%) |
| $55,000 to $64,999 | 0 (0.0%) | 0 (0.0%) |
| $65,000 to $74,999 | 0 (0.0%) | 0 (0.0%) |
| $75,000 to $99,999 | 0 (0.0%) | 0 (0.0%) |
| $100,000+ | 0 (0.0%) | 0 (0.0%) |
| Total | 0 (0.0%) | 27 (100.0%) |
Earnings by Sex by Educational Attainment in Box
| Educational Attainment | Male Income | Female Income |
| Less than High School | - | - |
| High School Diploma | - | - |
| College or Associate's Degree | - | - |
| Bachelor's Degree | - | - |
| Graduate Degree | - | - |
| Total | - | - |
Family Income in Box
Family Income Brackets in Box
According to the Box family income data, there are 18 families falling into the $50,000 to $74,999 income range, which is the most common income bracket and makes up 48.6% of all families.
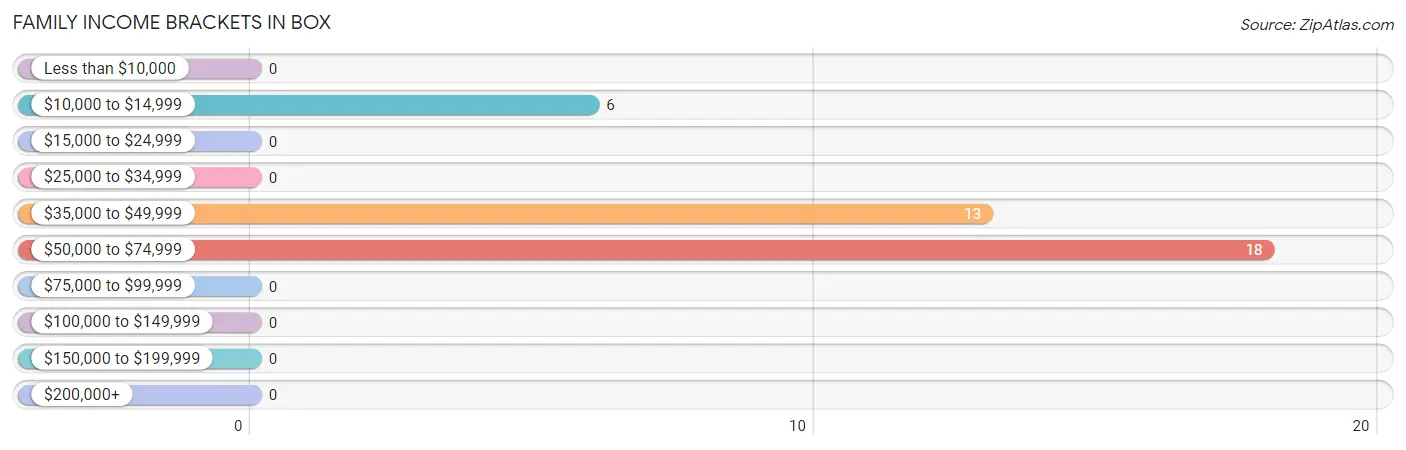
| Income Bracket | # Families | % Families |
| Less than $10,000 | 0 | 0.0% |
| $10,000 to $14,999 | 6 | 16.2% |
| $15,000 to $24,999 | 0 | 0.0% |
| $25,000 to $34,999 | 0 | 0.0% |
| $35,000 to $49,999 | 13 | 35.1% |
| $50,000 to $74,999 | 18 | 48.6% |
| $75,000 to $99,999 | 0 | 0.0% |
| $100,000 to $149,999 | 0 | 0.0% |
| $150,000 to $199,999 | 0 | 0.0% |
| $200,000+ | 0 | 0.0% |
Family Income by Famaliy Size in Box
| Income Bracket | # Families | Median Income |
| 2-Person Families | 13 (35.1%) | $0 |
| 3-Person Families | 6 (16.2%) | $0 |
| 4-Person Families | 18 (48.6%) | $0 |
| 5-Person Families | 0 (0.0%) | $0 |
| 6-Person Families | 0 (0.0%) | $0 |
| 7+ Person Families | 0 (0.0%) | $0 |
| Total | 37 (100.0%) | $39,904 |
Family Income by Number of Earners in Box
| Number of Earners | # Families | Median Income |
| No Earners | 13 (35.1%) | $0 |
| 1 Earner | 24 (64.9%) | $0 |
| 2 Earners | 0 (0.0%) | $0 |
| 3+ Earners | 0 (0.0%) | $0 |
| Total | 37 (100.0%) | $39,904 |
Household Income in Box
Household Income Brackets in Box
With 19 households falling in the category, the $50,000 to $74,999 income range is the most frequent in Box, accounting for 29.7% of all households.
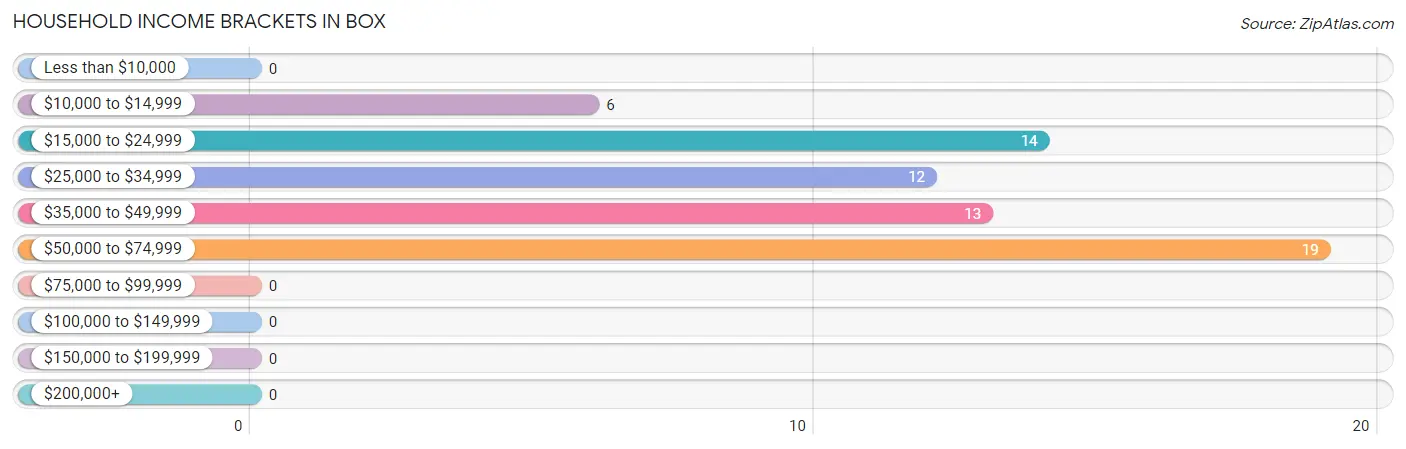
| Income Bracket | # Households | % Households |
| Less than $10,000 | 0 | 0.0% |
| $10,000 to $14,999 | 6 | 9.4% |
| $15,000 to $24,999 | 14 | 21.9% |
| $25,000 to $34,999 | 12 | 18.8% |
| $35,000 to $49,999 | 13 | 20.3% |
| $50,000 to $74,999 | 19 | 29.7% |
| $75,000 to $99,999 | 0 | 0.0% |
| $100,000 to $149,999 | 0 | 0.0% |
| $150,000 to $199,999 | 0 | 0.0% |
| $200,000+ | 0 | 0.0% |
Household Income by Householder Age in Box
The median household income in Box is $36,250, with the highest median household income of $38,077 found in the 65+ years age bracket for the primary householder. A total of 58 households (90.6%) fall into this category.
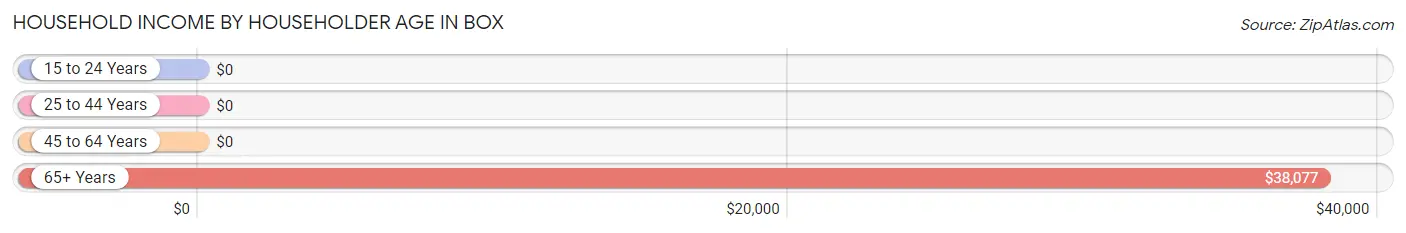
| Income Bracket | # Households | Median Income |
| 15 to 24 Years | 0 (0.0%) | $0 |
| 25 to 44 Years | 6 (9.4%) | $0 |
| 45 to 64 Years | 0 (0.0%) | $0 |
| 65+ Years | 58 (90.6%) | $38,077 |
| Total | 64 (100.0%) | $36,250 |
Poverty in Box
Income Below Poverty by Sex and Age in Box
With 3.2% poverty level for males and 11.8% for females among the residents of Box, 6 to 11 year old males and 6 to 11 year old females are the most vulnerable to poverty, with 2 males (100.0%) and 3 females (100.0%) in their respective age groups living below the poverty level.
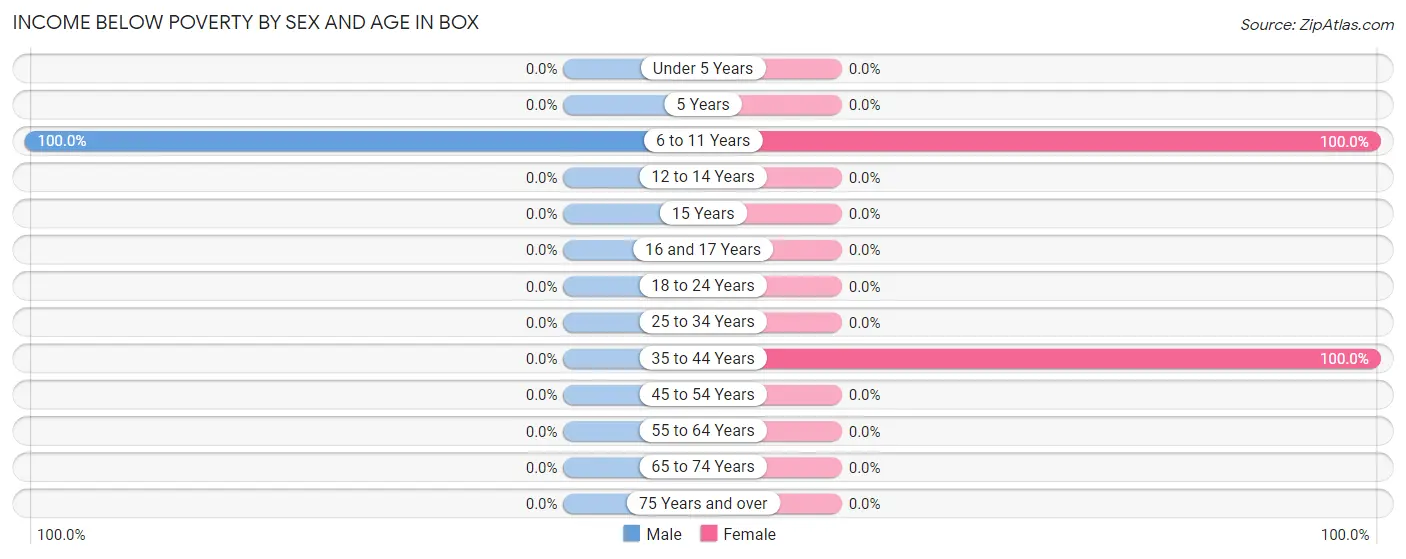
| Age Bracket | Male | Female |
| Under 5 Years | 0 (0.0%) | 0 (0.0%) |
| 5 Years | 0 (0.0%) | 0 (0.0%) |
| 6 to 11 Years | 2 (100.0%) | 3 (100.0%) |
| 12 to 14 Years | 0 (0.0%) | 0 (0.0%) |
| 15 Years | 0 (0.0%) | 0 (0.0%) |
| 16 and 17 Years | 0 (0.0%) | 0 (0.0%) |
| 18 to 24 Years | 0 (0.0%) | 0 (0.0%) |
| 25 to 34 Years | 0 (0.0%) | 0 (0.0%) |
| 35 to 44 Years | 0 (0.0%) | 6 (100.0%) |
| 45 to 54 Years | 0 (0.0%) | 0 (0.0%) |
| 55 to 64 Years | 0 (0.0%) | 0 (0.0%) |
| 65 to 74 Years | 0 (0.0%) | 0 (0.0%) |
| 75 Years and over | 0 (0.0%) | 0 (0.0%) |
| Total | 2 (3.2%) | 9 (11.8%) |
Income Above Poverty by Sex and Age in Box
According to the poverty statistics in Box, males aged 12 to 14 years and females aged 18 to 24 years are the age groups that are most secure financially, with 100.0% of males and 100.0% of females in these age groups living above the poverty line.
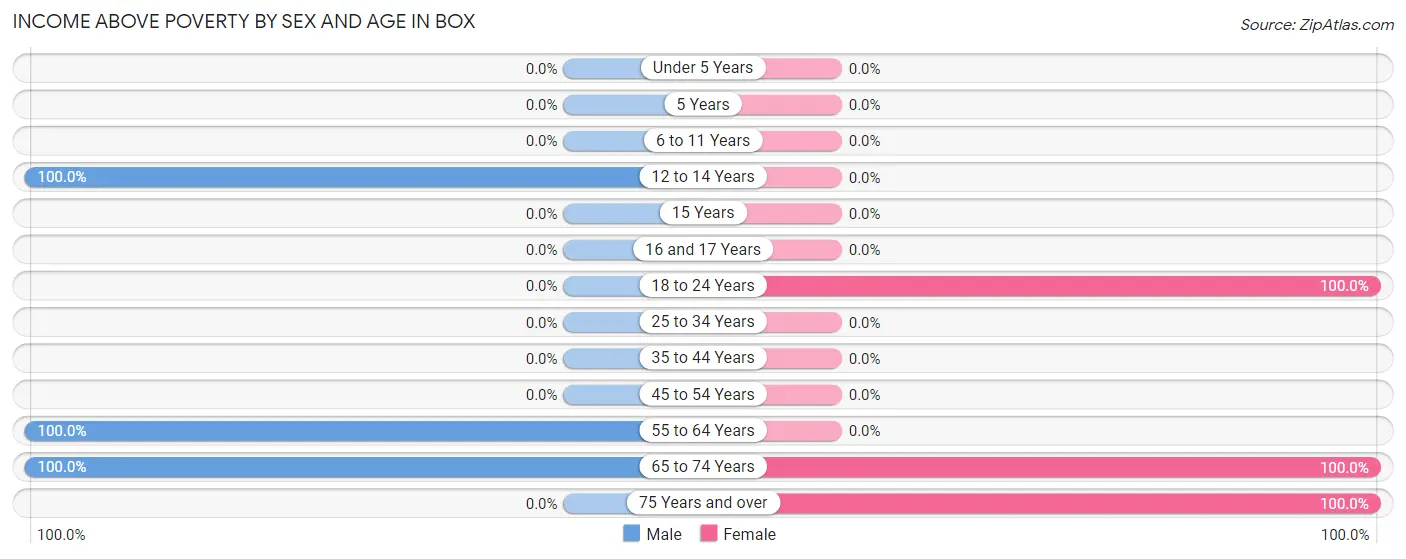
| Age Bracket | Male | Female |
| Under 5 Years | 0 (0.0%) | 0 (0.0%) |
| 5 Years | 0 (0.0%) | 0 (0.0%) |
| 6 to 11 Years | 0 (0.0%) | 0 (0.0%) |
| 12 to 14 Years | 15 (100.0%) | 0 (0.0%) |
| 15 Years | 0 (0.0%) | 0 (0.0%) |
| 16 and 17 Years | 0 (0.0%) | 0 (0.0%) |
| 18 to 24 Years | 0 (0.0%) | 21 (100.0%) |
| 25 to 34 Years | 0 (0.0%) | 0 (0.0%) |
| 35 to 44 Years | 0 (0.0%) | 0 (0.0%) |
| 45 to 54 Years | 0 (0.0%) | 0 (0.0%) |
| 55 to 64 Years | 21 (100.0%) | 0 (0.0%) |
| 65 to 74 Years | 25 (100.0%) | 18 (100.0%) |
| 75 Years and over | 0 (0.0%) | 28 (100.0%) |
| Total | 61 (96.8%) | 67 (88.2%) |
Income Below Poverty Among Married-Couple Families in Box
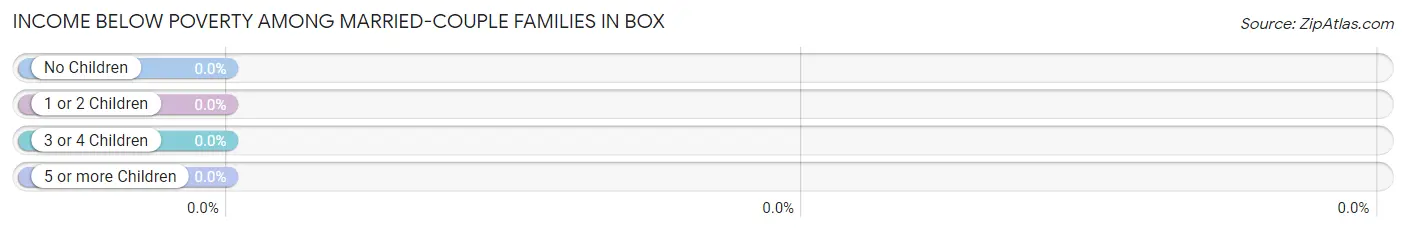
| Children | Above Poverty | Below Poverty |
| No Children | 0 (0.0%) | 0 (0.0%) |
| 1 or 2 Children | 18 (100.0%) | 0 (0.0%) |
| 3 or 4 Children | 0 (0.0%) | 0 (0.0%) |
| 5 or more Children | 0 (0.0%) | 0 (0.0%) |
| Total | 18 (100.0%) | 0 (0.0%) |
Income Below Poverty Among Single-Parent Households in Box
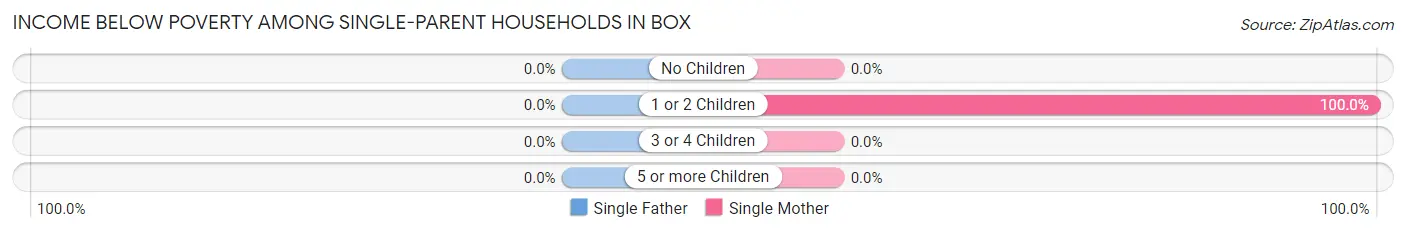
| Children | Single Father | Single Mother |
| No Children | 0 (0.0%) | 0 (0.0%) |
| 1 or 2 Children | 0 (0.0%) | 6 (100.0%) |
| 3 or 4 Children | 0 (0.0%) | 0 (0.0%) |
| 5 or more Children | 0 (0.0%) | 0 (0.0%) |
| Total | 0 (0.0%) | 6 (31.6%) |
Income Below Poverty Among Married-Couple vs Single-Parent Households in Box
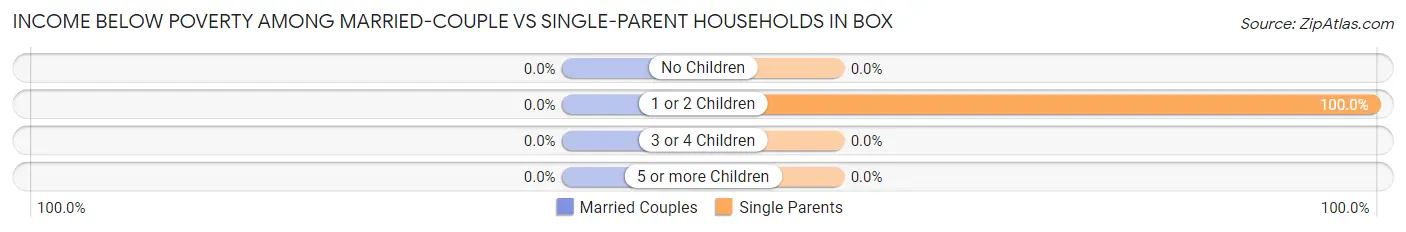
| Children | Married-Couple Families | Single-Parent Households |
| No Children | 0 (0.0%) | 0 (0.0%) |
| 1 or 2 Children | 0 (0.0%) | 6 (100.0%) |
| 3 or 4 Children | 0 (0.0%) | 0 (0.0%) |
| 5 or more Children | 0 (0.0%) | 0 (0.0%) |
| Total | 0 (0.0%) | 6 (31.6%) |
Race in Box
The most populous races in Box are White / Caucasian (64 | 46.0%), Native / Alaskan (61 | 43.9%), and Two or more Races (14 | 10.1%).
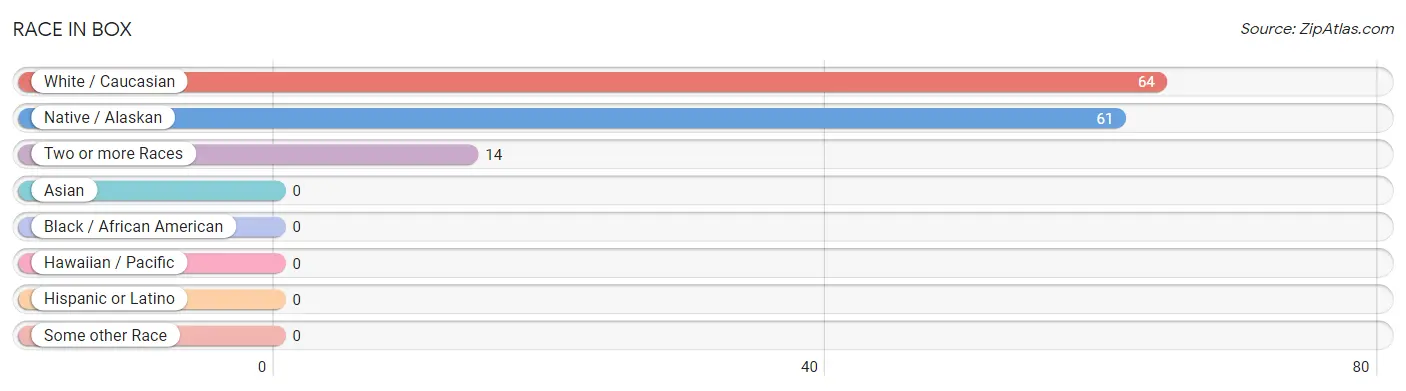
| Race | # Population | % Population |
| Asian | 0 | 0.0% |
| Black / African American | 0 | 0.0% |
| Hawaiian / Pacific | 0 | 0.0% |
| Hispanic or Latino | 0 | 0.0% |
| Native / Alaskan | 61 | 43.9% |
| White / Caucasian | 64 | 46.0% |
| Two or more Races | 14 | 10.1% |
| Some other Race | 0 | 0.0% |
| Total | 139 | 100.0% |
Ancestry in Box
The most populous ancestries reported in Box are Cherokee (61 | 43.9%), English (21 | 15.1%), Choctaw (14 | 10.1%), and American (12 | 8.6%), together accounting for 77.7% of all Box residents.
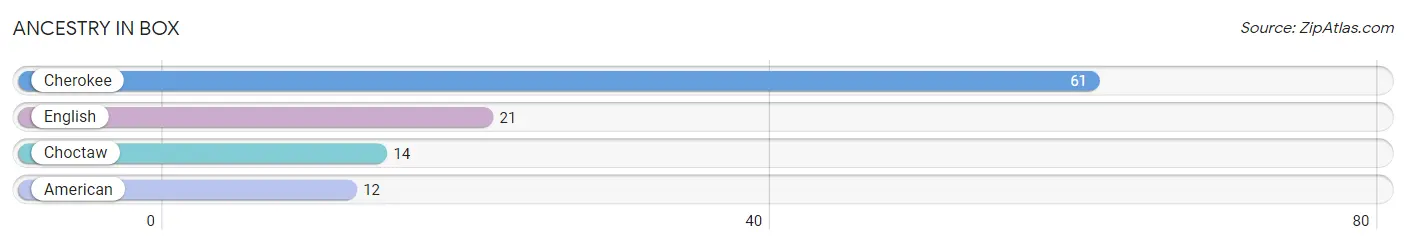
| Ancestry | # Population | % Population |
| American | 12 | 8.6% |
| Cherokee | 61 | 43.9% |
| Choctaw | 14 | 10.1% |
| English | 21 | 15.1% | View All 4 Rows |
Immigrants in Box

| Immigration Origin | # Population | % Population | View All 0 Rows |
Sex and Age in Box
Sex and Age in Box
The most populous age groups in Box are 55 to 59 Years (21 | 33.3%) for men and 75 to 79 Years (27 | 35.5%) for women.
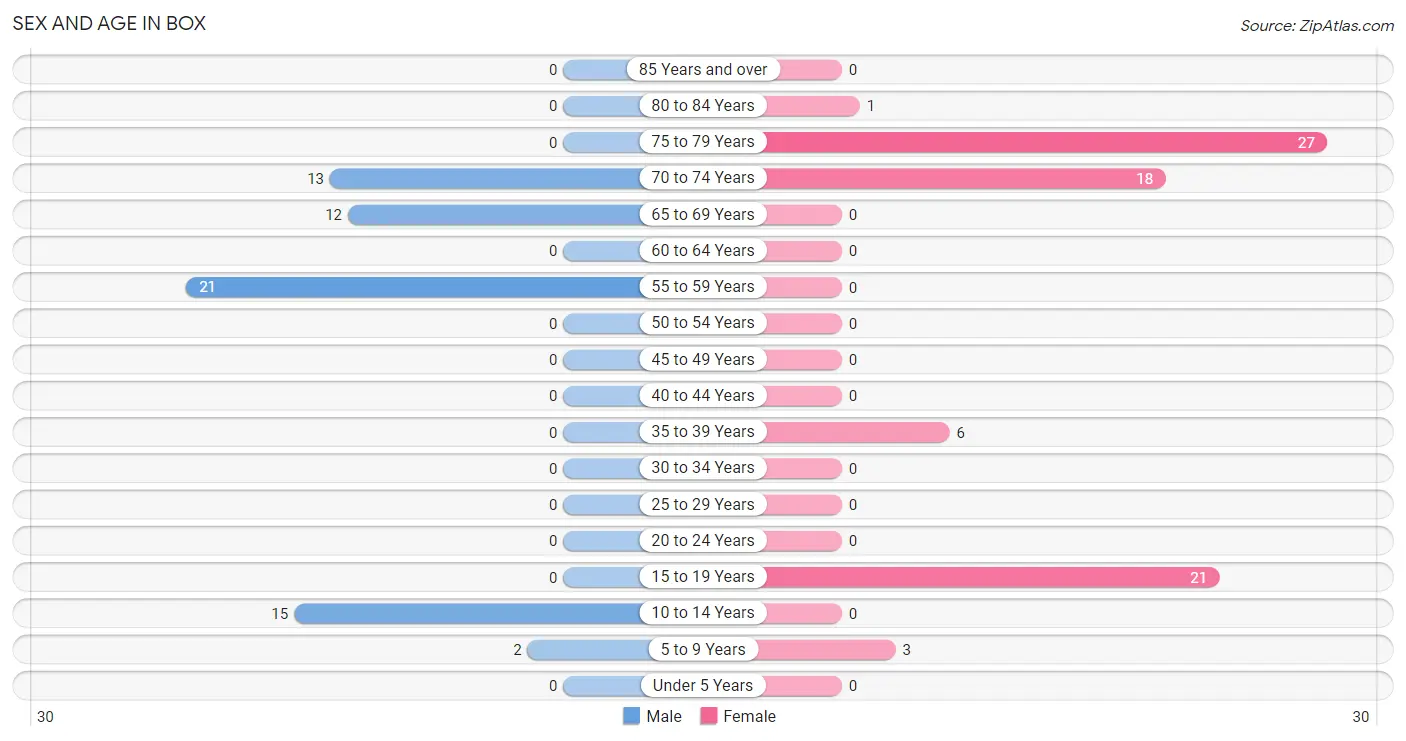
| Age Bracket | Male | Female |
| Under 5 Years | 0 (0.0%) | 0 (0.0%) |
| 5 to 9 Years | 2 (3.2%) | 3 (4.0%) |
| 10 to 14 Years | 15 (23.8%) | 0 (0.0%) |
| 15 to 19 Years | 0 (0.0%) | 21 (27.6%) |
| 20 to 24 Years | 0 (0.0%) | 0 (0.0%) |
| 25 to 29 Years | 0 (0.0%) | 0 (0.0%) |
| 30 to 34 Years | 0 (0.0%) | 0 (0.0%) |
| 35 to 39 Years | 0 (0.0%) | 6 (7.9%) |
| 40 to 44 Years | 0 (0.0%) | 0 (0.0%) |
| 45 to 49 Years | 0 (0.0%) | 0 (0.0%) |
| 50 to 54 Years | 0 (0.0%) | 0 (0.0%) |
| 55 to 59 Years | 21 (33.3%) | 0 (0.0%) |
| 60 to 64 Years | 0 (0.0%) | 0 (0.0%) |
| 65 to 69 Years | 12 (19.1%) | 0 (0.0%) |
| 70 to 74 Years | 13 (20.6%) | 18 (23.7%) |
| 75 to 79 Years | 0 (0.0%) | 27 (35.5%) |
| 80 to 84 Years | 0 (0.0%) | 1 (1.3%) |
| 85 Years and over | 0 (0.0%) | 0 (0.0%) |
| Total | 63 (100.0%) | 76 (100.0%) |
Families and Households in Box
Median Family Size in Box
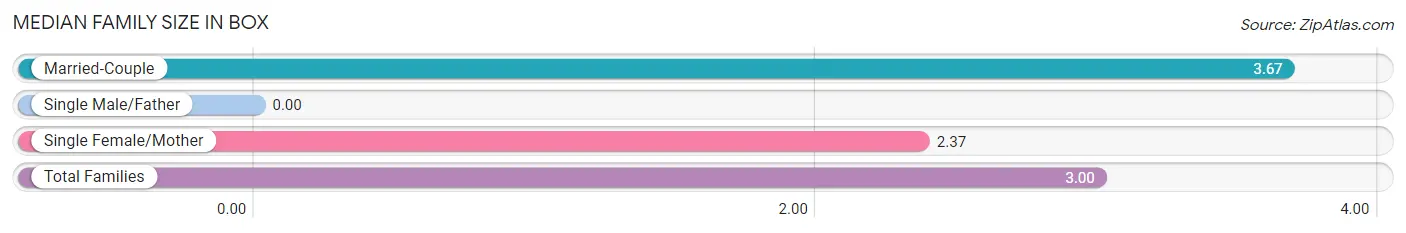
| Family Type | # Families | Family Size |
| Married-Couple | 18 (48.6%) | 3.67 |
| Single Male/Father | 0 (0.0%) | - |
| Single Female/Mother | 19 (51.3%) | 2.37 |
| Total Families | 37 (100.0%) | 3.00 |
Median Household Size in Box
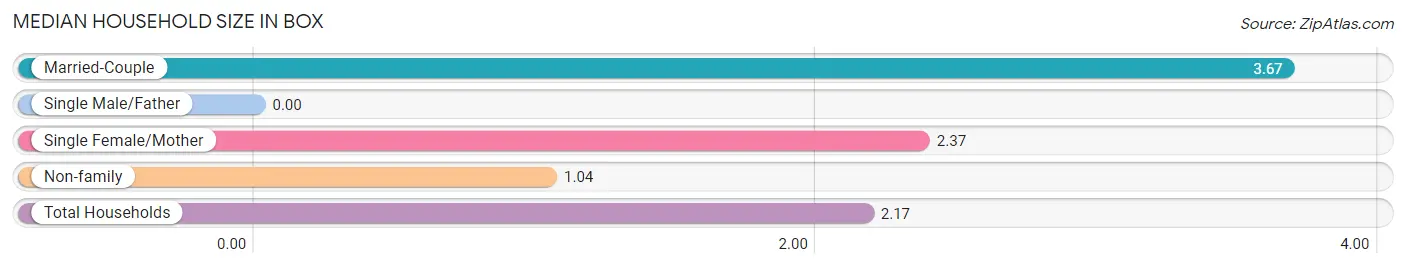
| Household Type | # Households | Household Size |
| Married-Couple | 18 (28.1%) | 3.67 |
| Single Male/Father | 0 (0.0%) | - |
| Single Female/Mother | 19 (29.7%) | 2.37 |
| Non-family | 27 (42.2%) | 1.04 |
| Total Households | 64 (100.0%) | 2.17 |
Household Size by Marriage Status in Box
Out of a total of 64 households in Box, 37 (57.8%) are family households, while 27 (42.2%) are nonfamily households. The most numerous type of family households are 4-person households, comprising 18, and the most common type of nonfamily households are 1-person households, comprising 26.
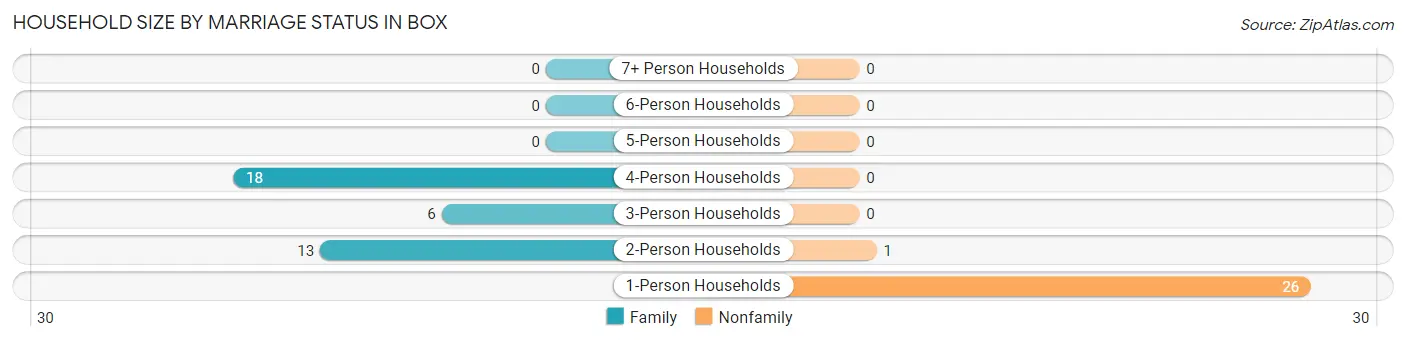
| Household Size | Family Households | Nonfamily Households |
| 1-Person Households | - | 26 (40.6%) |
| 2-Person Households | 13 (20.3%) | 1 (1.6%) |
| 3-Person Households | 6 (9.4%) | 0 (0.0%) |
| 4-Person Households | 18 (28.1%) | 0 (0.0%) |
| 5-Person Households | 0 (0.0%) | 0 (0.0%) |
| 6-Person Households | 0 (0.0%) | 0 (0.0%) |
| 7+ Person Households | 0 (0.0%) | 0 (0.0%) |
| Total | 37 (57.8%) | 27 (42.2%) |
Female Fertility in Box
Fertility by Age in Box
| Age Bracket | Women with Births | Births / 1,000 Women |
| 15 to 19 years | 0 (0.0%) | 0.0 |
| 20 to 34 years | 0 (0.0%) | 0.0 |
| 35 to 50 years | 0 (0.0%) | 0.0 |
| Total | 0 (0.0%) | 0.0 |
Fertility by Age by Marriage Status in Box
| Age Bracket | Married | Unmarried |
| 15 to 19 years | 0 (0.0%) | 0 (0.0%) |
| 20 to 34 years | 0 (0.0%) | 0 (0.0%) |
| 35 to 50 years | 0 (0.0%) | 0 (0.0%) |
| Total | 0 (0.0%) | 0 (0.0%) |
Fertility by Education in Box
| Educational Attainment | Women with Births | Births / 1,000 Women |
| Less than High School | 0 (0.0%) | 0.0 |
| High School Diploma | 0 (0.0%) | 0.0 |
| College or Associate's Degree | 0 (0.0%) | 0.0 |
| Bachelor's Degree | 0 (0.0%) | 0.0 |
| Graduate Degree | 0 (0.0%) | 0.0 |
| Total | 0 (0.0%) | 0.0 |
Fertility by Education by Marriage Status in Box
| Educational Attainment | Married | Unmarried |
| Less than High School | 0 (0.0%) | 0 (0.0%) |
| High School Diploma | 0 (0.0%) | 0 (0.0%) |
| College or Associate's Degree | 0 (0.0%) | 0 (0.0%) |
| Bachelor's Degree | 0 (0.0%) | 0 (0.0%) |
| Graduate Degree | 0 (0.0%) | 0 (0.0%) |
| Total | 0 (0.0%) | 0 (0.0%) |
Employment Characteristics in Box
Employment by Class of Employer in Box
Among the 27 employed individuals in Box, private company employees (21 | 77.8%), and local government employees (6 | 22.2%) make up the most common classes of employment.
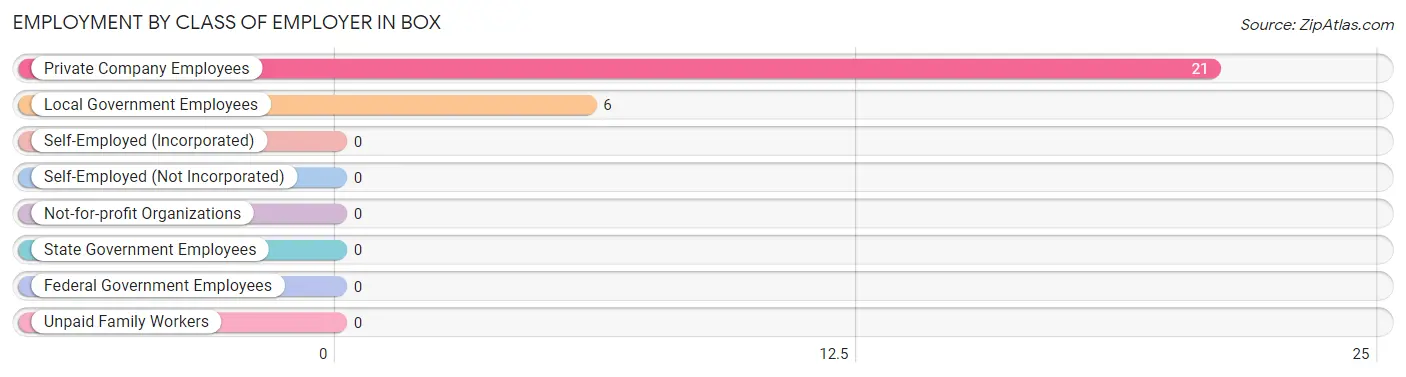
| Employer Class | # Employees | % Employees |
| Private Company Employees | 21 | 77.8% |
| Self-Employed (Incorporated) | 0 | 0.0% |
| Self-Employed (Not Incorporated) | 0 | 0.0% |
| Not-for-profit Organizations | 0 | 0.0% |
| Local Government Employees | 6 | 22.2% |
| State Government Employees | 0 | 0.0% |
| Federal Government Employees | 0 | 0.0% |
| Unpaid Family Workers | 0 | 0.0% |
| Total | 27 | 100.0% |
Employment Status by Age in Box
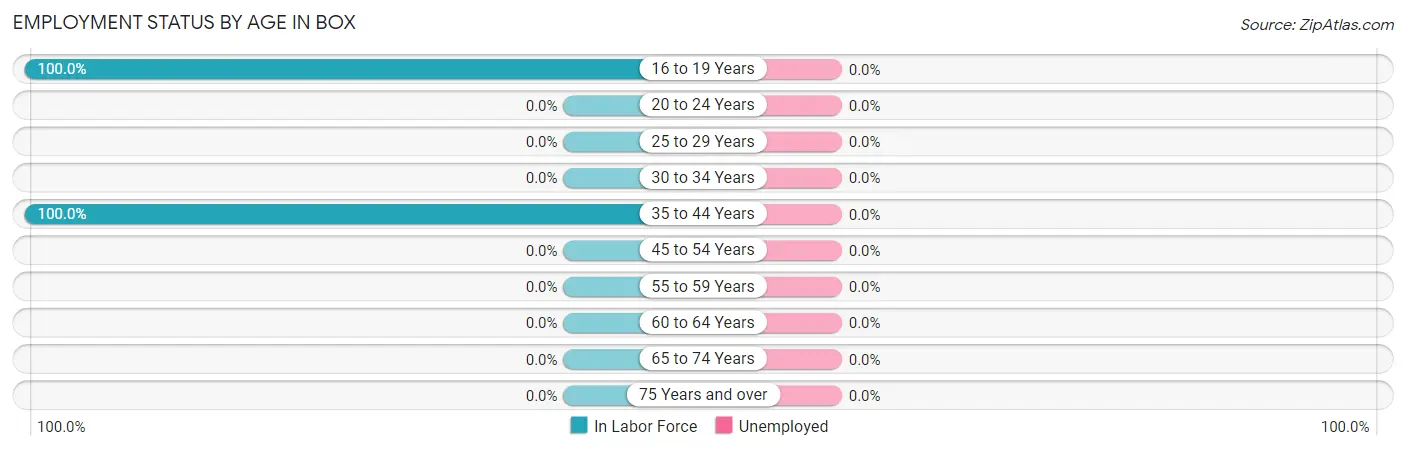
| Age Bracket | In Labor Force | Unemployed |
| 16 to 19 Years | 21 (100.0%) | 0 (0.0%) |
| 20 to 24 Years | 0 (0.0%) | 0 (0.0%) |
| 25 to 29 Years | 0 (0.0%) | 0 (0.0%) |
| 30 to 34 Years | 0 (0.0%) | 0 (0.0%) |
| 35 to 44 Years | 6 (100.0%) | 0 (0.0%) |
| 45 to 54 Years | 0 (0.0%) | 0 (0.0%) |
| 55 to 59 Years | 0 (0.0%) | 0 (0.0%) |
| 60 to 64 Years | 0 (0.0%) | 0 (0.0%) |
| 65 to 74 Years | 0 (0.0%) | 0 (0.0%) |
| 75 Years and over | 0 (0.0%) | 0 (0.0%) |
| Total | 27 (22.7%) | 0 (0.0%) |
Employment Status by Educational Attainment in Box
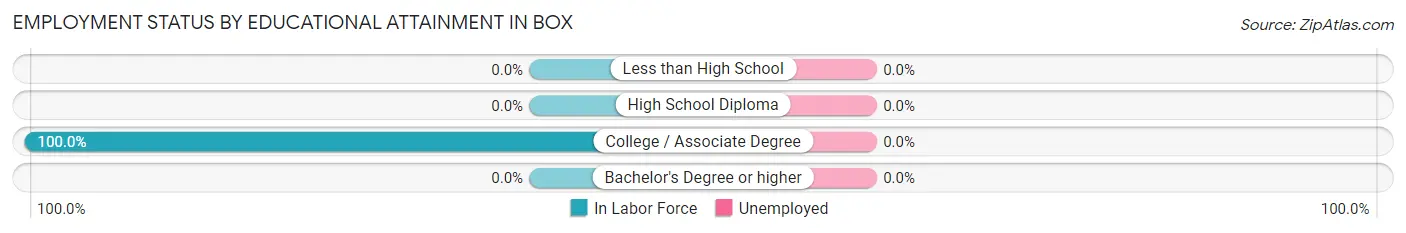
| Educational Attainment | In Labor Force | Unemployed |
| Less than High School | 0 (0.0%) | 0 (0.0%) |
| High School Diploma | 0 (0.0%) | 0 (0.0%) |
| College / Associate Degree | 6 (100.0%) | 0 (0.0%) |
| Bachelor's Degree or higher | 0 (0.0%) | 0 (0.0%) |
| Total | 6 (22.2%) | 0 (0.0%) |
Employment Occupations by Sex in Box
Management, Business, Science and Arts Occupations
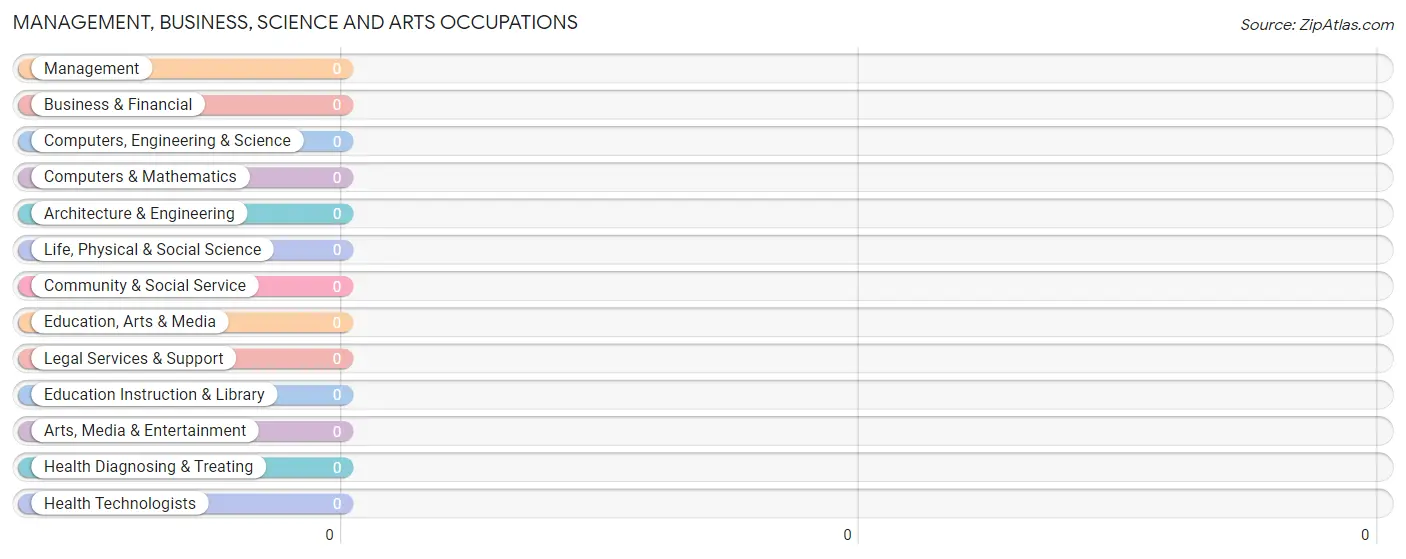
Management, Business, Science and Arts Occupations by Sex
| Occupation | Male | Female |
| Management | 0 (0.0%) | 0 (0.0%) |
| Business & Financial | 0 (0.0%) | 0 (0.0%) |
| Computers, Engineering & Science | 0 (0.0%) | 0 (0.0%) |
| Computers & Mathematics | 0 (0.0%) | 0 (0.0%) |
| Architecture & Engineering | 0 (0.0%) | 0 (0.0%) |
| Life, Physical & Social Science | 0 (0.0%) | 0 (0.0%) |
| Community & Social Service | 0 (0.0%) | 0 (0.0%) |
| Education, Arts & Media | 0 (0.0%) | 0 (0.0%) |
| Legal Services & Support | 0 (0.0%) | 0 (0.0%) |
| Education Instruction & Library | 0 (0.0%) | 0 (0.0%) |
| Arts, Media & Entertainment | 0 (0.0%) | 0 (0.0%) |
| Health Diagnosing & Treating | 0 (0.0%) | 0 (0.0%) |
| Health Technologists | 0 (0.0%) | 0 (0.0%) |
| Total (Category) | 0 (0.0%) | 0 (0.0%) |
| Total (Overall) | 0 (0.0%) | 27 (100.0%) |
Services Occupations
The most common Services occupations in Box are , and Food Preparation & Serving (21 | 77.8%).
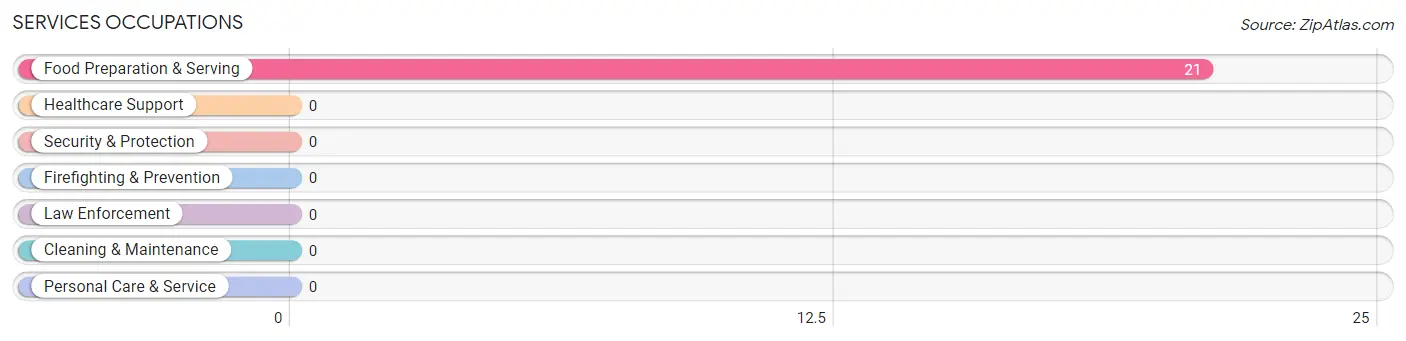
Services Occupations by Sex
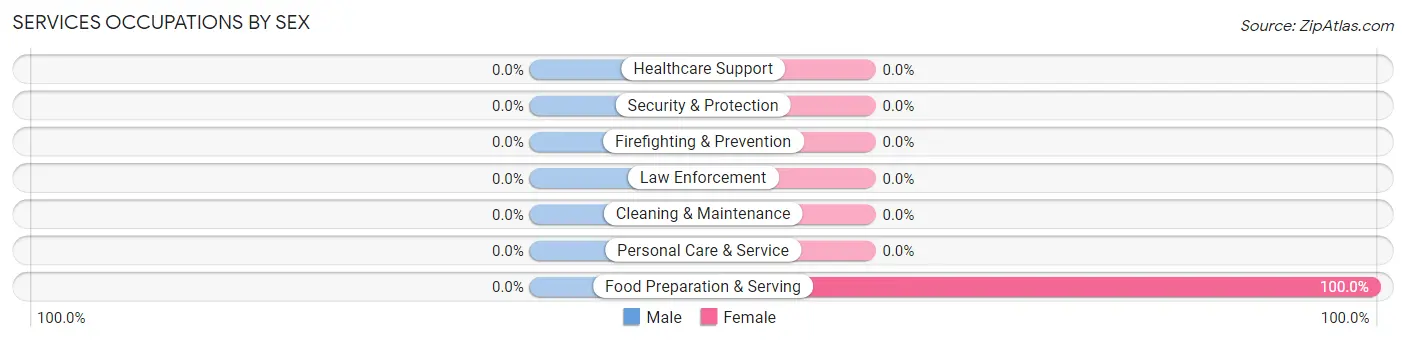
| Occupation | Male | Female |
| Healthcare Support | 0 (0.0%) | 0 (0.0%) |
| Security & Protection | 0 (0.0%) | 0 (0.0%) |
| Firefighting & Prevention | 0 (0.0%) | 0 (0.0%) |
| Law Enforcement | 0 (0.0%) | 0 (0.0%) |
| Food Preparation & Serving | 0 (0.0%) | 21 (100.0%) |
| Cleaning & Maintenance | 0 (0.0%) | 0 (0.0%) |
| Personal Care & Service | 0 (0.0%) | 0 (0.0%) |
| Total (Category) | 0 (0.0%) | 21 (100.0%) |
| Total (Overall) | 0 (0.0%) | 27 (100.0%) |
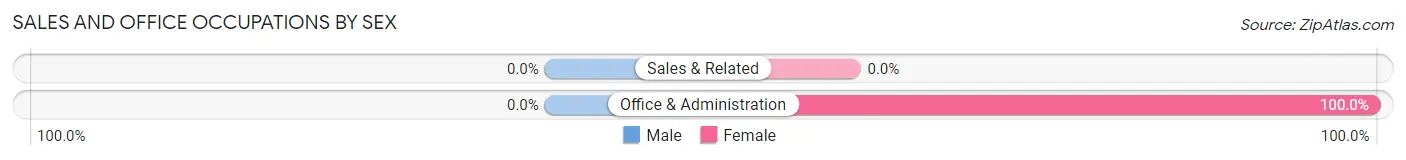
Sales and Office Occupations
The most common Sales and Office occupations in Box are , and Office & Administration (6 | 22.2%).
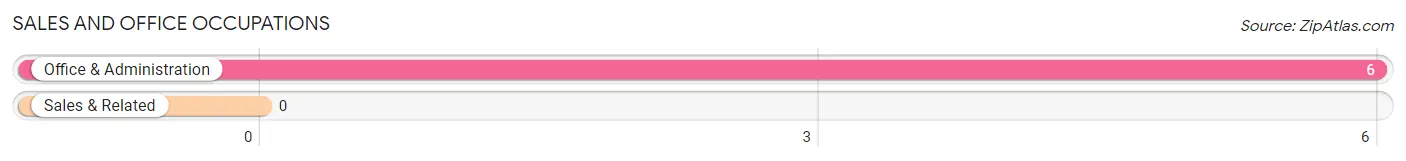
Sales and Office Occupations by Sex
| Occupation | Male | Female |
| Sales & Related | 0 (0.0%) | 0 (0.0%) |
| Office & Administration | 0 (0.0%) | 6 (100.0%) |
| Total (Category) | 0 (0.0%) | 6 (100.0%) |
| Total (Overall) | 0 (0.0%) | 27 (100.0%) |
Natural Resources, Construction and Maintenance Occupations
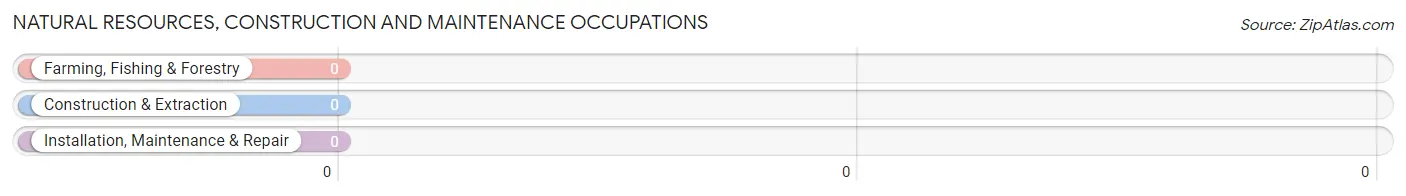
Natural Resources, Construction and Maintenance Occupations by Sex
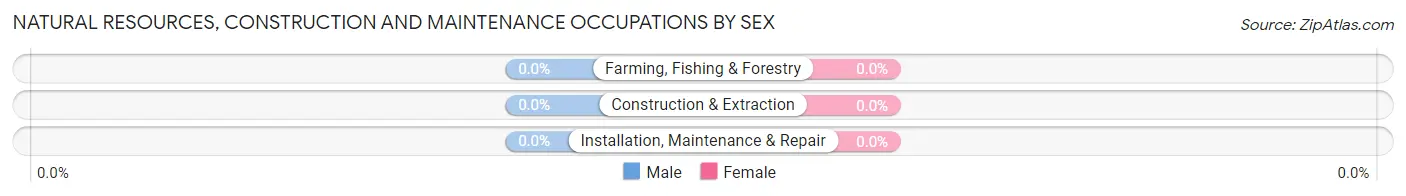
| Occupation | Male | Female |
| Farming, Fishing & Forestry | 0 (0.0%) | 0 (0.0%) |
| Construction & Extraction | 0 (0.0%) | 0 (0.0%) |
| Installation, Maintenance & Repair | 0 (0.0%) | 0 (0.0%) |
| Total (Category) | 0 (0.0%) | 0 (0.0%) |
| Total (Overall) | 0 (0.0%) | 27 (100.0%) |
Production, Transportation and Moving Occupations
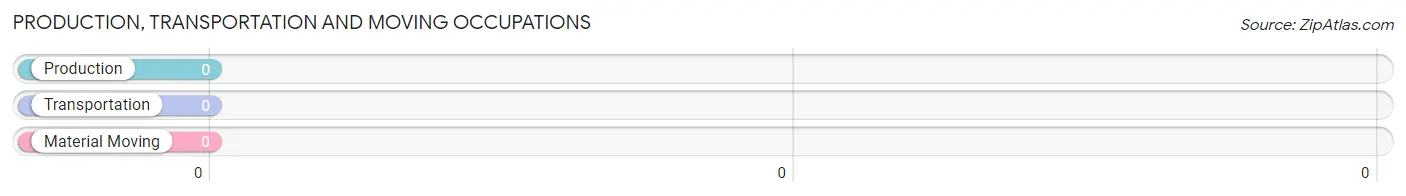
Production, Transportation and Moving Occupations by Sex
| Occupation | Male | Female |
| Production | 0 (0.0%) | 0 (0.0%) |
| Transportation | 0 (0.0%) | 0 (0.0%) |
| Material Moving | 0 (0.0%) | 0 (0.0%) |
| Total (Category) | 0 (0.0%) | 0 (0.0%) |
| Total (Overall) | 0 (0.0%) | 27 (100.0%) |
Employment Industries by Sex in Box
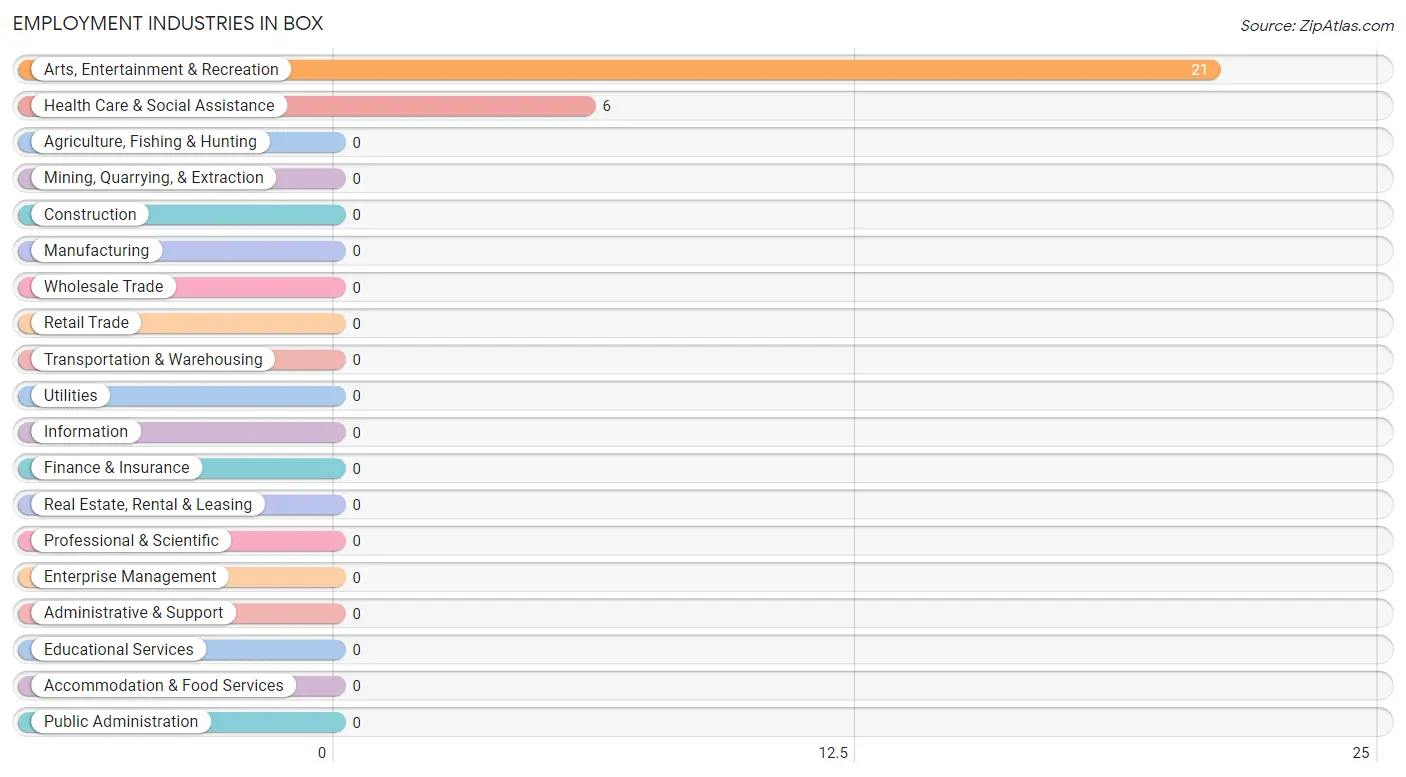
Employment Industries in Box
The major employment industries in Box include Arts, Entertainment & Recreation (21 | 77.8%), and Health Care & Social Assistance (6 | 22.2%).
Employment Industries by Sex in Box
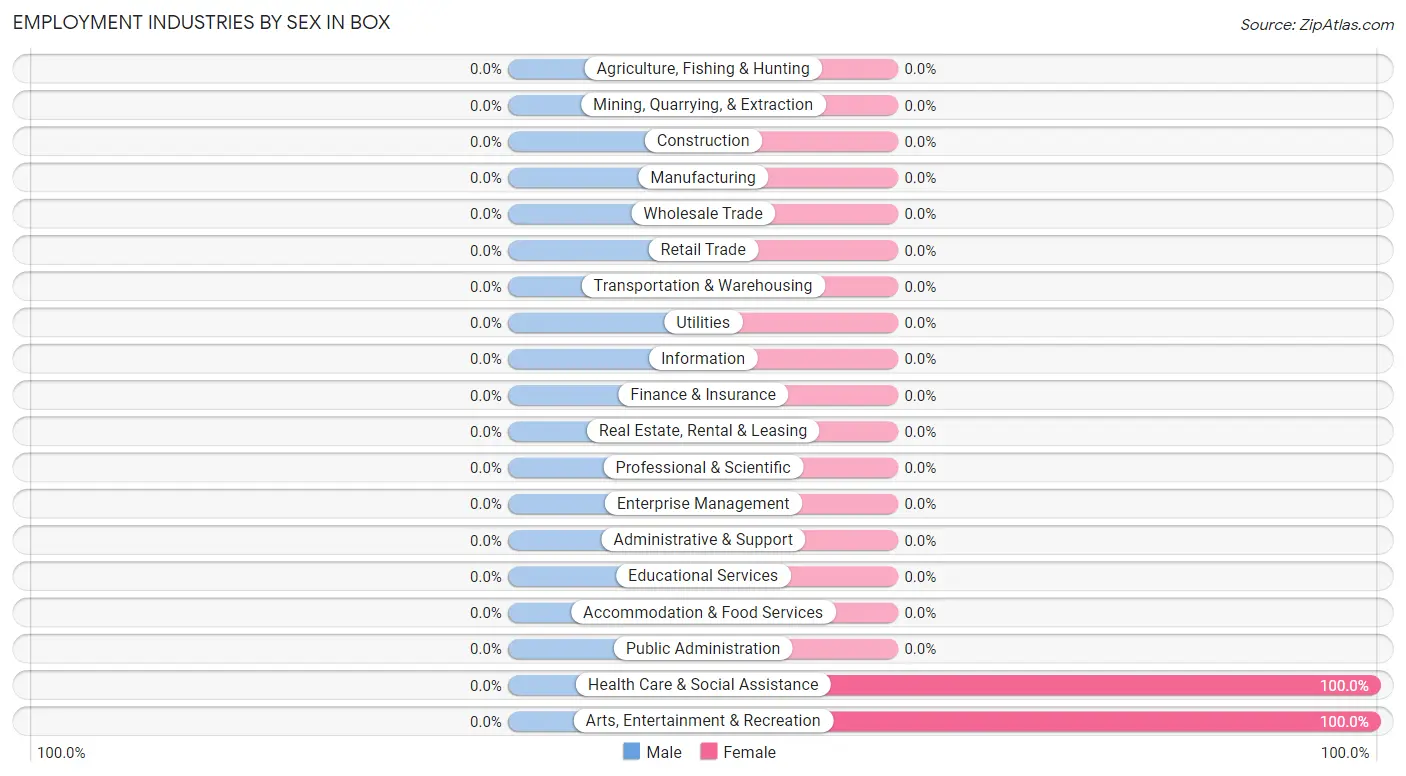
| Industry | Male | Female |
| Agriculture, Fishing & Hunting | 0 (0.0%) | 0 (0.0%) |
| Mining, Quarrying, & Extraction | 0 (0.0%) | 0 (0.0%) |
| Construction | 0 (0.0%) | 0 (0.0%) |
| Manufacturing | 0 (0.0%) | 0 (0.0%) |
| Wholesale Trade | 0 (0.0%) | 0 (0.0%) |
| Retail Trade | 0 (0.0%) | 0 (0.0%) |
| Transportation & Warehousing | 0 (0.0%) | 0 (0.0%) |
| Utilities | 0 (0.0%) | 0 (0.0%) |
| Information | 0 (0.0%) | 0 (0.0%) |
| Finance & Insurance | 0 (0.0%) | 0 (0.0%) |
| Real Estate, Rental & Leasing | 0 (0.0%) | 0 (0.0%) |
| Professional & Scientific | 0 (0.0%) | 0 (0.0%) |
| Enterprise Management | 0 (0.0%) | 0 (0.0%) |
| Administrative & Support | 0 (0.0%) | 0 (0.0%) |
| Educational Services | 0 (0.0%) | 0 (0.0%) |
| Health Care & Social Assistance | 0 (0.0%) | 6 (100.0%) |
| Arts, Entertainment & Recreation | 0 (0.0%) | 21 (100.0%) |
| Accommodation & Food Services | 0 (0.0%) | 0 (0.0%) |
| Public Administration | 0 (0.0%) | 0 (0.0%) |
| Total | 0 (0.0%) | 27 (100.0%) |
Education in Box
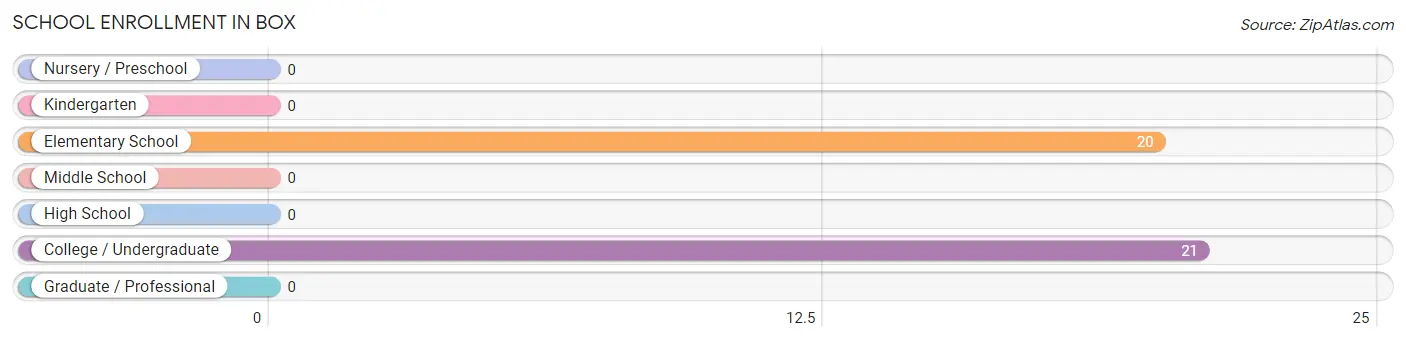
School Enrollment in Box
The most common levels of schooling among the 41 students in Box are college / undergraduate (21 | 51.2%), and elementary school (20 | 48.8%).
| School Level | # Students | % Students |
| Nursery / Preschool | 0 | 0.0% |
| Kindergarten | 0 | 0.0% |
| Elementary School | 20 | 48.8% |
| Middle School | 0 | 0.0% |
| High School | 0 | 0.0% |
| College / Undergraduate | 21 | 51.2% |
| Graduate / Professional | 0 | 0.0% |
| Total | 41 | 100.0% |
School Enrollment by Age by Funding Source in Box
Out of a total of 41 students who are enrolled in schools in Box, 15 (36.6%) attend a private institution, while the remaining 26 (63.4%) are enrolled in public schools. The age group of 10 to 14 year olds has the highest likelihood of being enrolled in private schools, with 15 (100.0% in the age bracket) enrolled. Conversely, the age group of 5 to 9 year old has the lowest likelihood of being enrolled in a private school, with 5 (100.0% in the age bracket) attending a public institution.
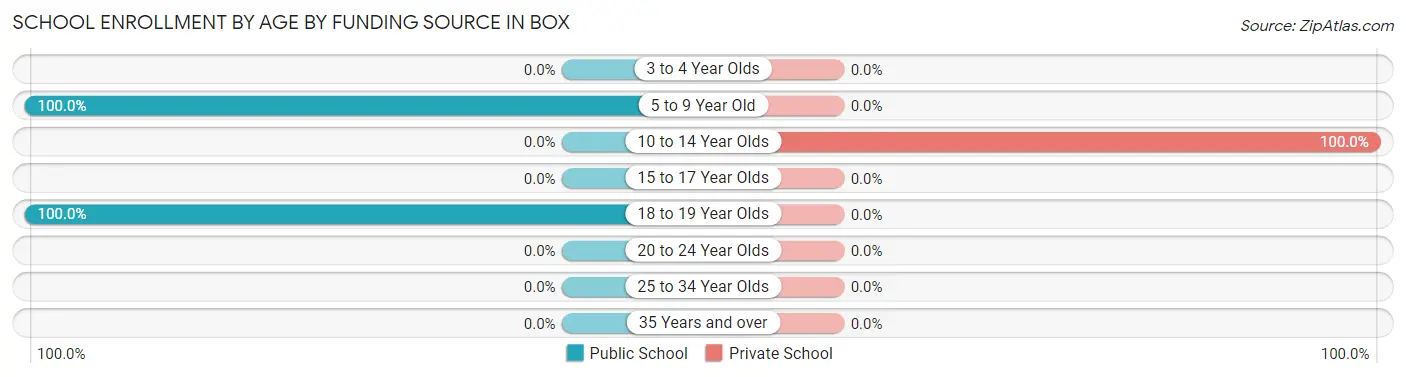
| Age Bracket | Public School | Private School |
| 3 to 4 Year Olds | 0 (0.0%) | 0 (0.0%) |
| 5 to 9 Year Old | 5 (100.0%) | 0 (0.0%) |
| 10 to 14 Year Olds | 0 (0.0%) | 15 (100.0%) |
| 15 to 17 Year Olds | 0 (0.0%) | 0 (0.0%) |
| 18 to 19 Year Olds | 21 (100.0%) | 0 (0.0%) |
| 20 to 24 Year Olds | 0 (0.0%) | 0 (0.0%) |
| 25 to 34 Year Olds | 0 (0.0%) | 0 (0.0%) |
| 35 Years and over | 0 (0.0%) | 0 (0.0%) |
| Total | 26 (63.4%) | 15 (36.6%) |
Educational Attainment by Field of Study in Box
, and education (19 | 100.0%) are the most common fields of study among 19 individuals in Box who have obtained a bachelor's degree or higher.
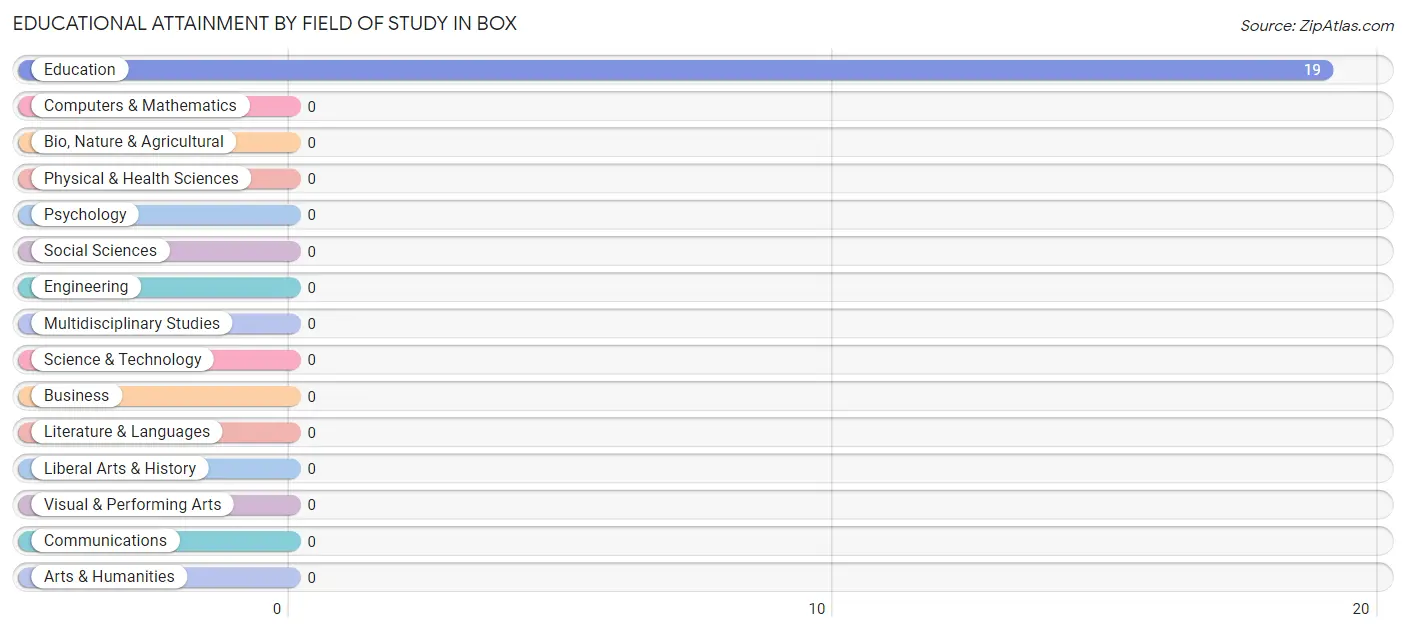
| Field of Study | # Graduates | % Graduates |
| Computers & Mathematics | 0 | 0.0% |
| Bio, Nature & Agricultural | 0 | 0.0% |
| Physical & Health Sciences | 0 | 0.0% |
| Psychology | 0 | 0.0% |
| Social Sciences | 0 | 0.0% |
| Engineering | 0 | 0.0% |
| Multidisciplinary Studies | 0 | 0.0% |
| Science & Technology | 0 | 0.0% |
| Business | 0 | 0.0% |
| Education | 19 | 100.0% |
| Literature & Languages | 0 | 0.0% |
| Liberal Arts & History | 0 | 0.0% |
| Visual & Performing Arts | 0 | 0.0% |
| Communications | 0 | 0.0% |
| Arts & Humanities | 0 | 0.0% |
| Total | 19 | 100.0% |
Transportation & Commute in Box
Vehicle Availability by Sex in Box
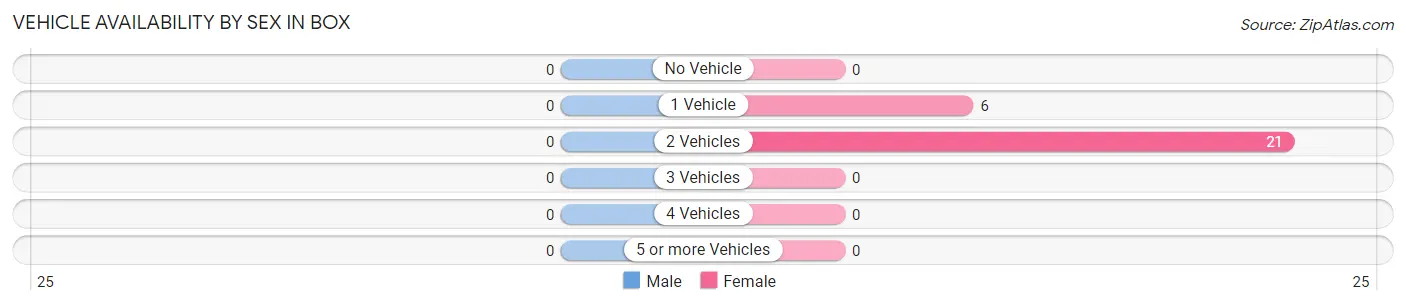
| Vehicles Available | Male | Female |
| No Vehicle | 0 (0.0%) | 0 (0.0%) |
| 1 Vehicle | 0 (0.0%) | 6 (22.2%) |
| 2 Vehicles | 0 (0.0%) | 21 (77.8%) |
| 3 Vehicles | 0 (0.0%) | 0 (0.0%) |
| 4 Vehicles | 0 (0.0%) | 0 (0.0%) |
| 5 or more Vehicles | 0 (0.0%) | 0 (0.0%) |
| Total | 0 (0.0%) | 27 (100.0%) |
Commute Time in Box
The most frequently occuring commute durations in Box are 60 to 89 minutes (21 commuters, 77.8%), 45 to 59 minutes (6 commuters, 22.2%), and less than 5 minutes (0 commuters, 0.0%).
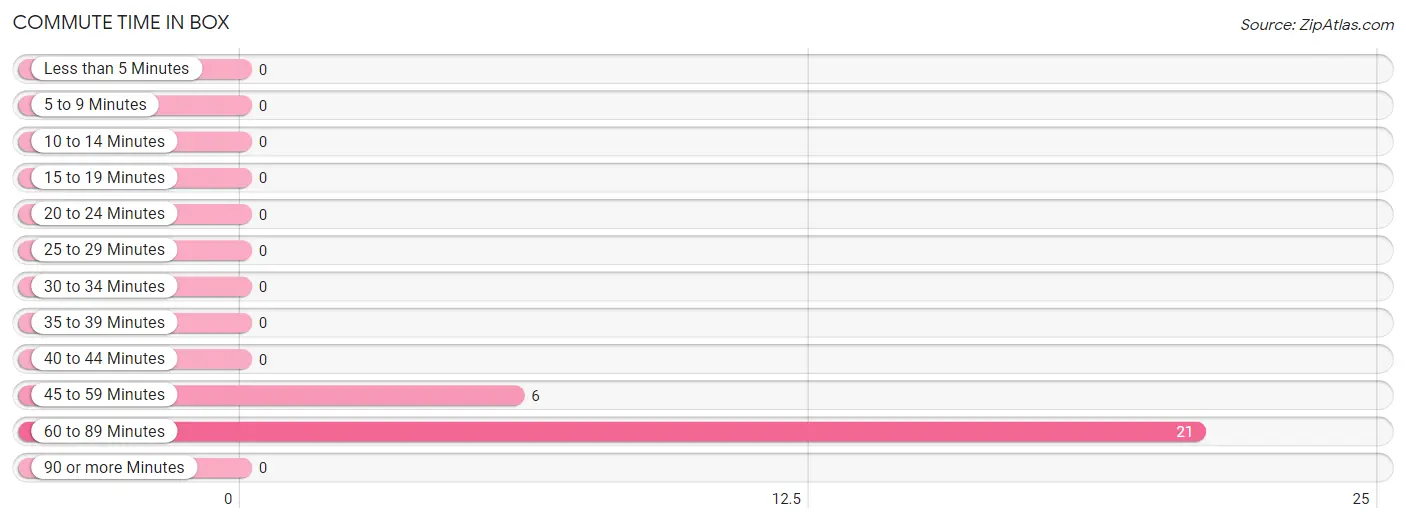
| Commute Time | # Commuters | % Commuters |
| Less than 5 Minutes | 0 | 0.0% |
| 5 to 9 Minutes | 0 | 0.0% |
| 10 to 14 Minutes | 0 | 0.0% |
| 15 to 19 Minutes | 0 | 0.0% |
| 20 to 24 Minutes | 0 | 0.0% |
| 25 to 29 Minutes | 0 | 0.0% |
| 30 to 34 Minutes | 0 | 0.0% |
| 35 to 39 Minutes | 0 | 0.0% |
| 40 to 44 Minutes | 0 | 0.0% |
| 45 to 59 Minutes | 6 | 22.2% |
| 60 to 89 Minutes | 21 | 77.8% |
| 90 or more Minutes | 0 | 0.0% |
Commute Time by Sex in Box
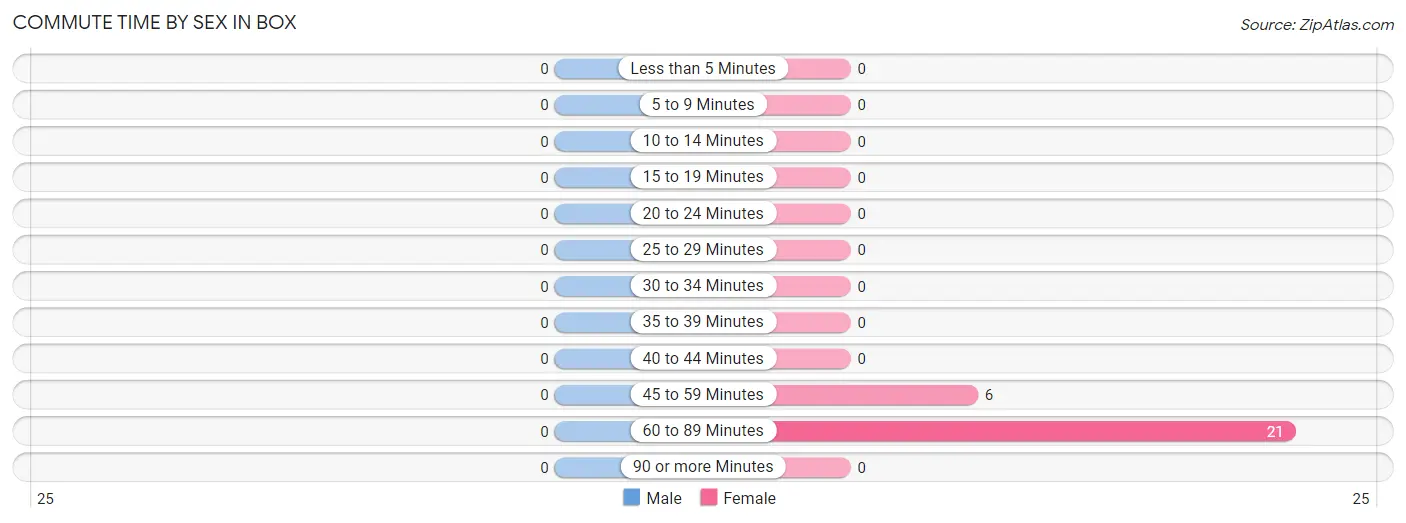
| Commute Time | Male | Female |
| Less than 5 Minutes | 0 (0.0%) | 0 (0.0%) |
| 5 to 9 Minutes | 0 (0.0%) | 0 (0.0%) |
| 10 to 14 Minutes | 0 (0.0%) | 0 (0.0%) |
| 15 to 19 Minutes | 0 (0.0%) | 0 (0.0%) |
| 20 to 24 Minutes | 0 (0.0%) | 0 (0.0%) |
| 25 to 29 Minutes | 0 (0.0%) | 0 (0.0%) |
| 30 to 34 Minutes | 0 (0.0%) | 0 (0.0%) |
| 35 to 39 Minutes | 0 (0.0%) | 0 (0.0%) |
| 40 to 44 Minutes | 0 (0.0%) | 0 (0.0%) |
| 45 to 59 Minutes | 0 (0.0%) | 6 (22.2%) |
| 60 to 89 Minutes | 0 (0.0%) | 21 (77.8%) |
| 90 or more Minutes | 0 (0.0%) | 0 (0.0%) |
Time of Departure to Work by Sex in Box
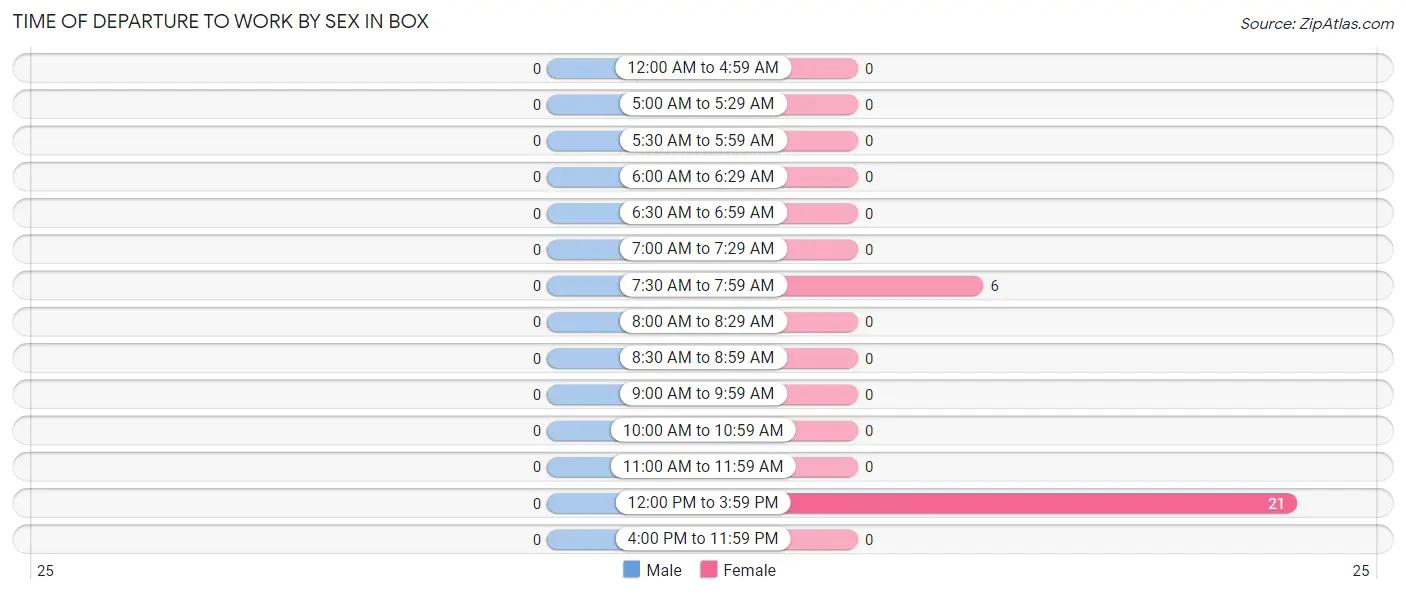
| Time of Departure | Male | Female |
| 12:00 AM to 4:59 AM | 0 (0.0%) | 0 (0.0%) |
| 5:00 AM to 5:29 AM | 0 (0.0%) | 0 (0.0%) |
| 5:30 AM to 5:59 AM | 0 (0.0%) | 0 (0.0%) |
| 6:00 AM to 6:29 AM | 0 (0.0%) | 0 (0.0%) |
| 6:30 AM to 6:59 AM | 0 (0.0%) | 0 (0.0%) |
| 7:00 AM to 7:29 AM | 0 (0.0%) | 0 (0.0%) |
| 7:30 AM to 7:59 AM | 0 (0.0%) | 6 (22.2%) |
| 8:00 AM to 8:29 AM | 0 (0.0%) | 0 (0.0%) |
| 8:30 AM to 8:59 AM | 0 (0.0%) | 0 (0.0%) |
| 9:00 AM to 9:59 AM | 0 (0.0%) | 0 (0.0%) |
| 10:00 AM to 10:59 AM | 0 (0.0%) | 0 (0.0%) |
| 11:00 AM to 11:59 AM | 0 (0.0%) | 0 (0.0%) |
| 12:00 PM to 3:59 PM | 0 (0.0%) | 21 (77.8%) |
| 4:00 PM to 11:59 PM | 0 (0.0%) | 0 (0.0%) |
| Total | 0 (0.0%) | 27 (100.0%) |
Housing Occupancy in Box
Occupancy by Ownership in Box
Of the total 64 dwellings in Box, owner-occupied units account for 50 (78.1%), while renter-occupied units make up 14 (21.9%).
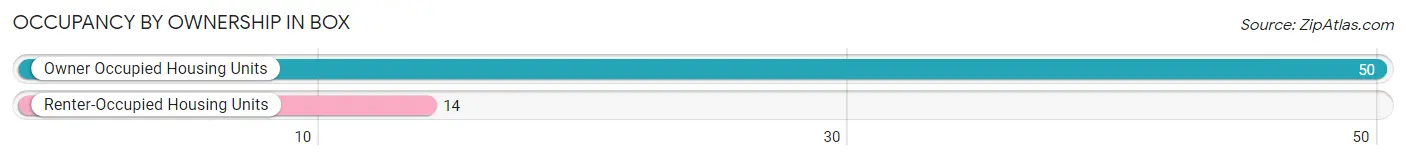
| Occupancy | # Housing Units | % Housing Units |
| Owner Occupied Housing Units | 50 | 78.1% |
| Renter-Occupied Housing Units | 14 | 21.9% |
| Total Occupied Housing Units | 64 | 100.0% |
Occupancy by Household Size in Box
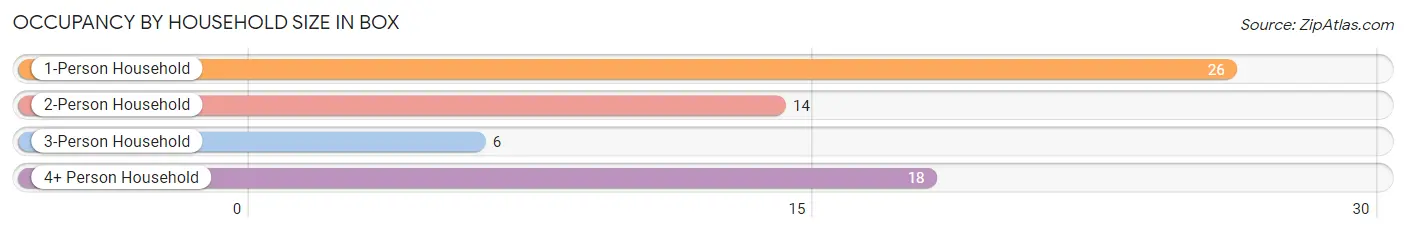
| Household Size | # Housing Units | % Housing Units |
| 1-Person Household | 26 | 40.6% |
| 2-Person Household | 14 | 21.9% |
| 3-Person Household | 6 | 9.4% |
| 4+ Person Household | 18 | 28.1% |
| Total Housing Units | 64 | 100.0% |
Occupancy by Ownership by Household Size in Box
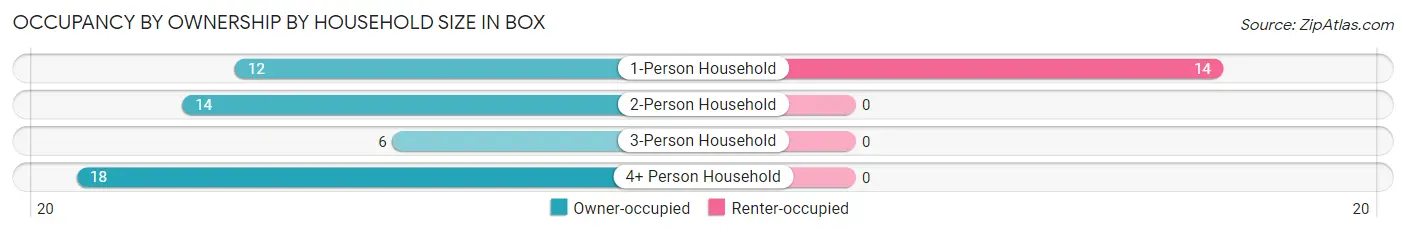
| Household Size | Owner-occupied | Renter-occupied |
| 1-Person Household | 12 (46.2%) | 14 (53.8%) |
| 2-Person Household | 14 (100.0%) | 0 (0.0%) |
| 3-Person Household | 6 (100.0%) | 0 (0.0%) |
| 4+ Person Household | 18 (100.0%) | 0 (0.0%) |
| Total Housing Units | 50 (78.1%) | 14 (21.9%) |
Occupancy by Educational Attainment in Box
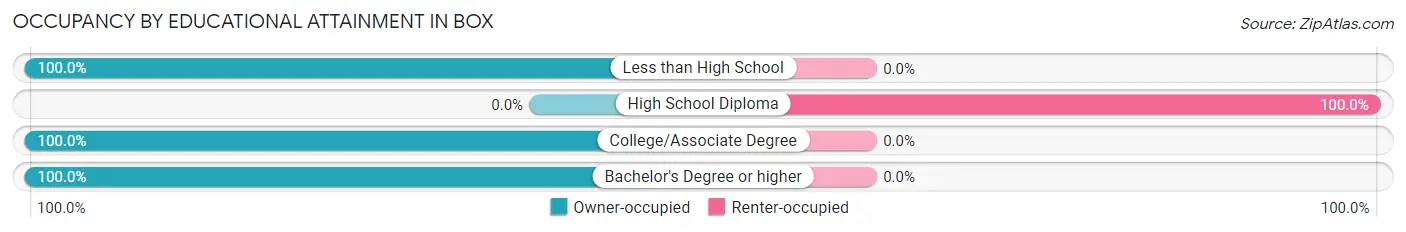
| Household Size | Owner-occupied | Renter-occupied |
| Less than High School | 13 (100.0%) | 0 (0.0%) |
| High School Diploma | 0 (0.0%) | 14 (100.0%) |
| College/Associate Degree | 18 (100.0%) | 0 (0.0%) |
| Bachelor's Degree or higher | 19 (100.0%) | 0 (0.0%) |
Occupancy by Age of Householder in Box
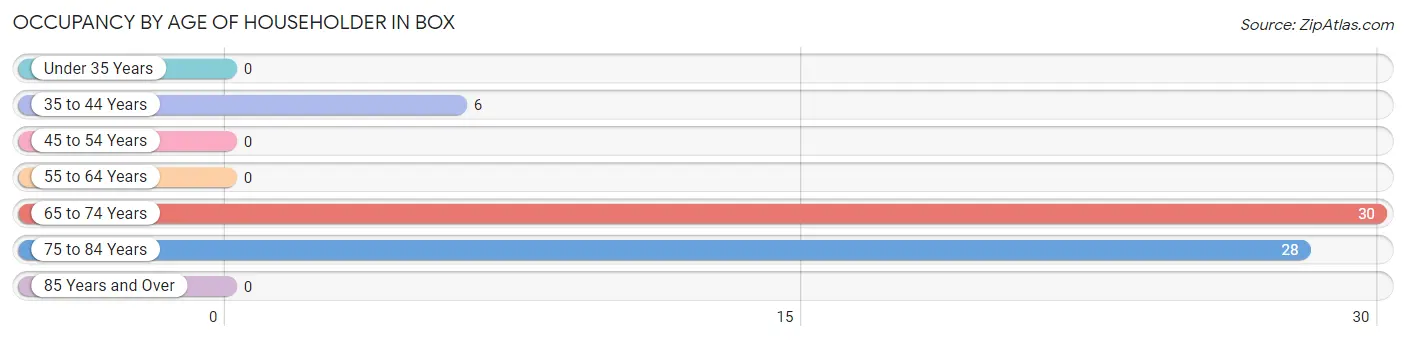
| Age Bracket | # Households | % Households |
| Under 35 Years | 0 | 0.0% |
| 35 to 44 Years | 6 | 9.4% |
| 45 to 54 Years | 0 | 0.0% |
| 55 to 64 Years | 0 | 0.0% |
| 65 to 74 Years | 30 | 46.9% |
| 75 to 84 Years | 28 | 43.8% |
| 85 Years and Over | 0 | 0.0% |
| Total | 64 | 100.0% |
Housing Finances in Box
Median Income by Occupancy in Box
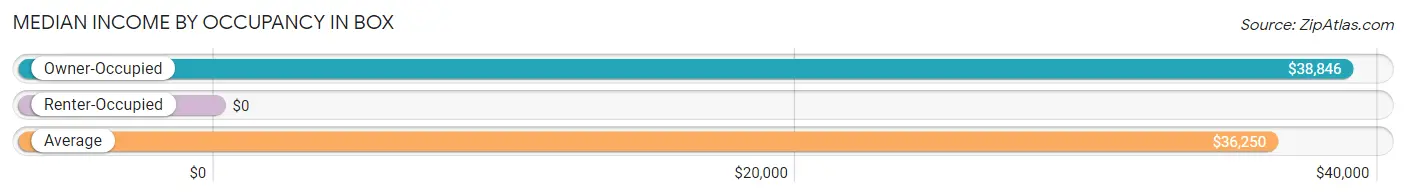
| Occupancy Type | # Households | Median Income |
| Owner-Occupied | 50 (78.1%) | $38,846 |
| Renter-Occupied | 14 (21.9%) | $0 |
| Average | 64 (100.0%) | $36,250 |
Occupancy by Householder Income Bracket in Box
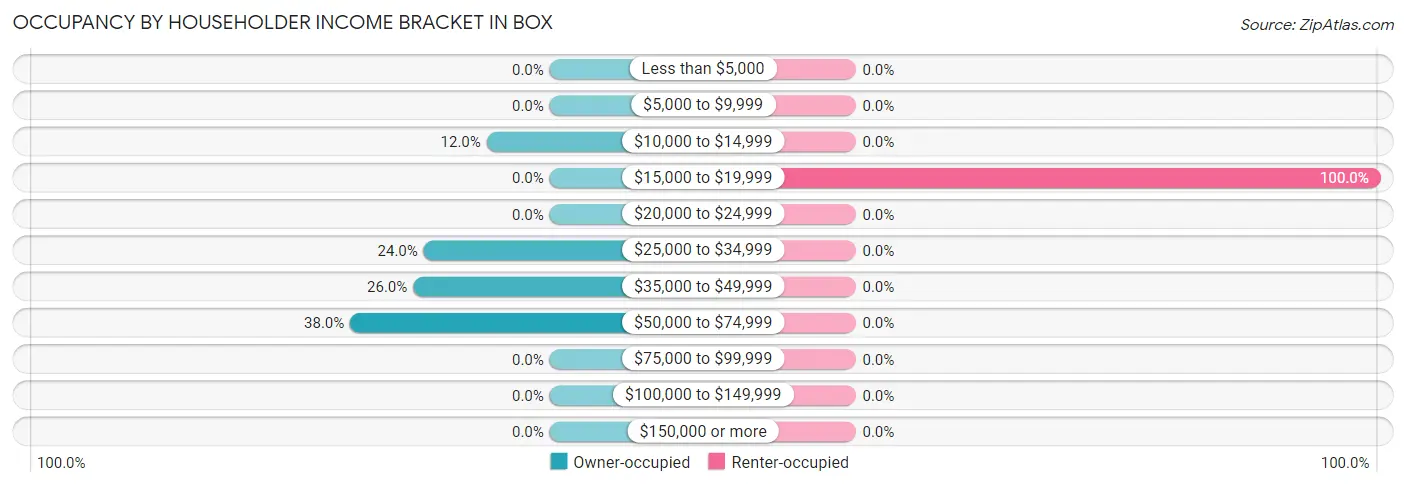
| Income Bracket | Owner-occupied | Renter-occupied |
| Less than $5,000 | 0 (0.0%) | 0 (0.0%) |
| $5,000 to $9,999 | 0 (0.0%) | 0 (0.0%) |
| $10,000 to $14,999 | 6 (12.0%) | 0 (0.0%) |
| $15,000 to $19,999 | 0 (0.0%) | 14 (100.0%) |
| $20,000 to $24,999 | 0 (0.0%) | 0 (0.0%) |
| $25,000 to $34,999 | 12 (24.0%) | 0 (0.0%) |
| $35,000 to $49,999 | 13 (26.0%) | 0 (0.0%) |
| $50,000 to $74,999 | 19 (38.0%) | 0 (0.0%) |
| $75,000 to $99,999 | 0 (0.0%) | 0 (0.0%) |
| $100,000 to $149,999 | 0 (0.0%) | 0 (0.0%) |
| $150,000 or more | 0 (0.0%) | 0 (0.0%) |
| Total | 50 (100.0%) | 14 (100.0%) |
Monthly Housing Cost Tiers in Box
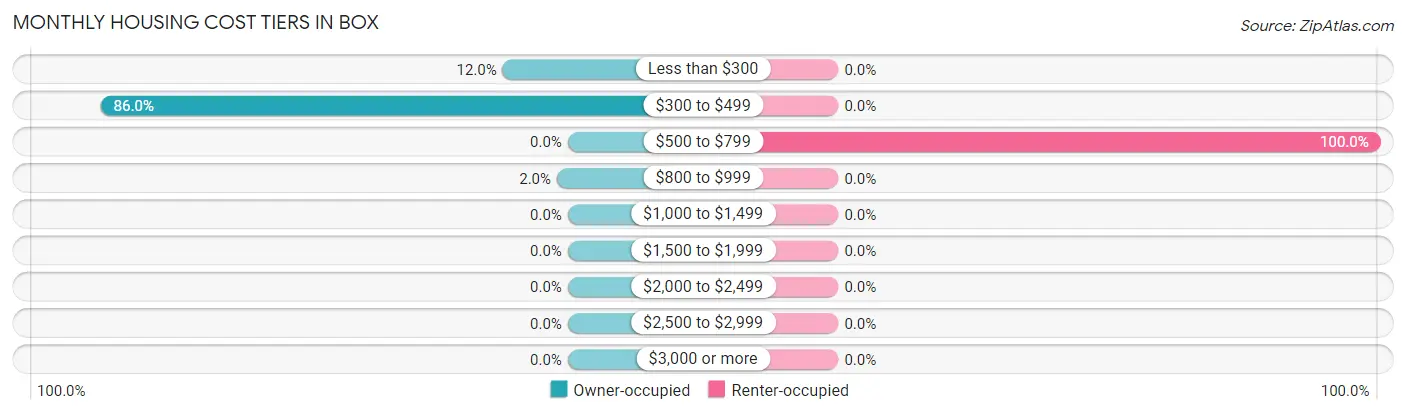
| Monthly Cost | Owner-occupied | Renter-occupied |
| Less than $300 | 6 (12.0%) | 0 (0.0%) |
| $300 to $499 | 43 (86.0%) | 0 (0.0%) |
| $500 to $799 | 0 (0.0%) | 14 (100.0%) |
| $800 to $999 | 1 (2.0%) | 0 (0.0%) |
| $1,000 to $1,499 | 0 (0.0%) | 0 (0.0%) |
| $1,500 to $1,999 | 0 (0.0%) | 0 (0.0%) |
| $2,000 to $2,499 | 0 (0.0%) | 0 (0.0%) |
| $2,500 to $2,999 | 0 (0.0%) | 0 (0.0%) |
| $3,000 or more | 0 (0.0%) | 0 (0.0%) |
| Total | 50 (100.0%) | 14 (100.0%) |
Physical Housing Characteristics in Box
Housing Structures in Box
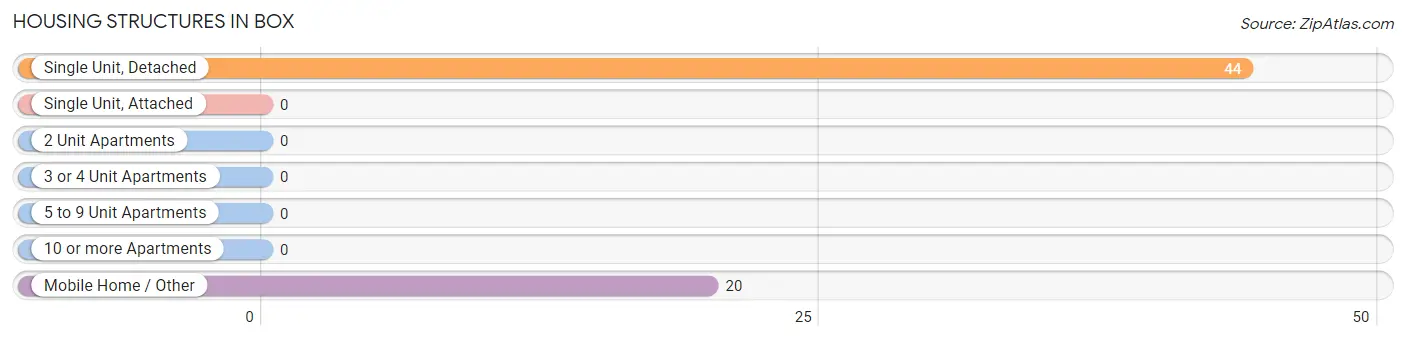
| Structure Type | # Housing Units | % Housing Units |
| Single Unit, Detached | 44 | 68.8% |
| Single Unit, Attached | 0 | 0.0% |
| 2 Unit Apartments | 0 | 0.0% |
| 3 or 4 Unit Apartments | 0 | 0.0% |
| 5 to 9 Unit Apartments | 0 | 0.0% |
| 10 or more Apartments | 0 | 0.0% |
| Mobile Home / Other | 20 | 31.2% |
| Total | 64 | 100.0% |
Housing Structures by Occupancy in Box
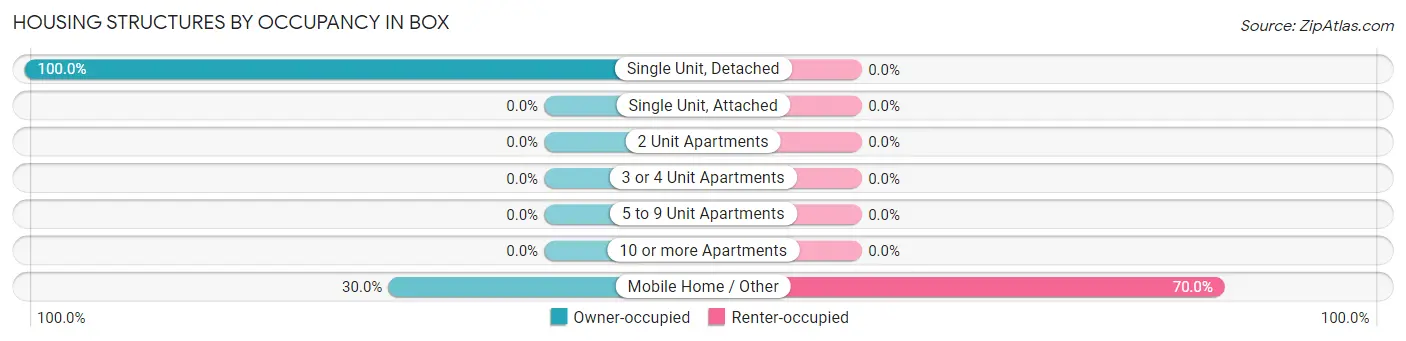
| Structure Type | Owner-occupied | Renter-occupied |
| Single Unit, Detached | 44 (100.0%) | 0 (0.0%) |
| Single Unit, Attached | 0 (0.0%) | 0 (0.0%) |
| 2 Unit Apartments | 0 (0.0%) | 0 (0.0%) |
| 3 or 4 Unit Apartments | 0 (0.0%) | 0 (0.0%) |
| 5 to 9 Unit Apartments | 0 (0.0%) | 0 (0.0%) |
| 10 or more Apartments | 0 (0.0%) | 0 (0.0%) |
| Mobile Home / Other | 6 (30.0%) | 14 (70.0%) |
| Total | 50 (78.1%) | 14 (21.9%) |
Housing Structures by Number of Rooms in Box
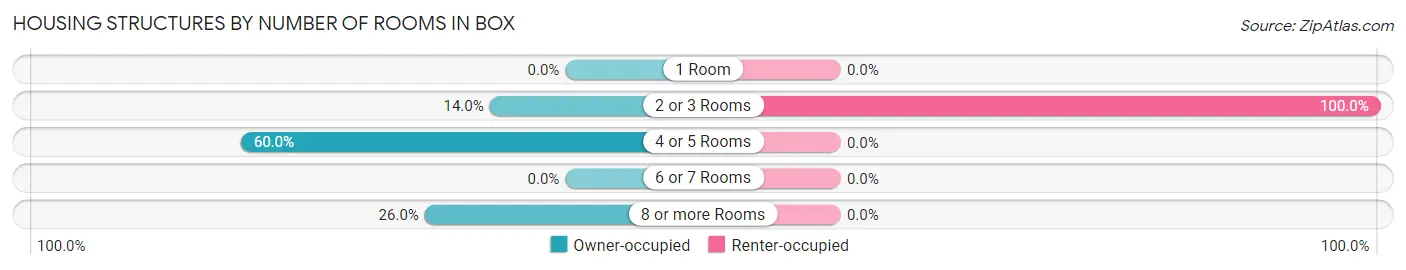
| Number of Rooms | Owner-occupied | Renter-occupied |
| 1 Room | 0 (0.0%) | 0 (0.0%) |
| 2 or 3 Rooms | 7 (14.0%) | 14 (100.0%) |
| 4 or 5 Rooms | 30 (60.0%) | 0 (0.0%) |
| 6 or 7 Rooms | 0 (0.0%) | 0 (0.0%) |
| 8 or more Rooms | 13 (26.0%) | 0 (0.0%) |
| Total | 50 (100.0%) | 14 (100.0%) |
Housing Structure by Heating Type in Box
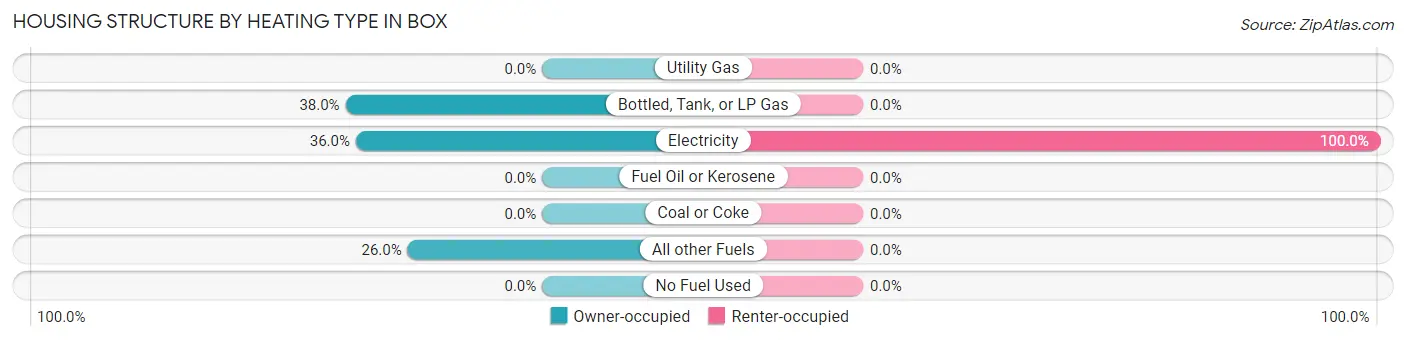
| Heating Type | Owner-occupied | Renter-occupied |
| Utility Gas | 0 (0.0%) | 0 (0.0%) |
| Bottled, Tank, or LP Gas | 19 (38.0%) | 0 (0.0%) |
| Electricity | 18 (36.0%) | 14 (100.0%) |
| Fuel Oil or Kerosene | 0 (0.0%) | 0 (0.0%) |
| Coal or Coke | 0 (0.0%) | 0 (0.0%) |
| All other Fuels | 13 (26.0%) | 0 (0.0%) |
| No Fuel Used | 0 (0.0%) | 0 (0.0%) |
| Total | 50 (100.0%) | 14 (100.0%) |
Household Vehicle Usage in Box
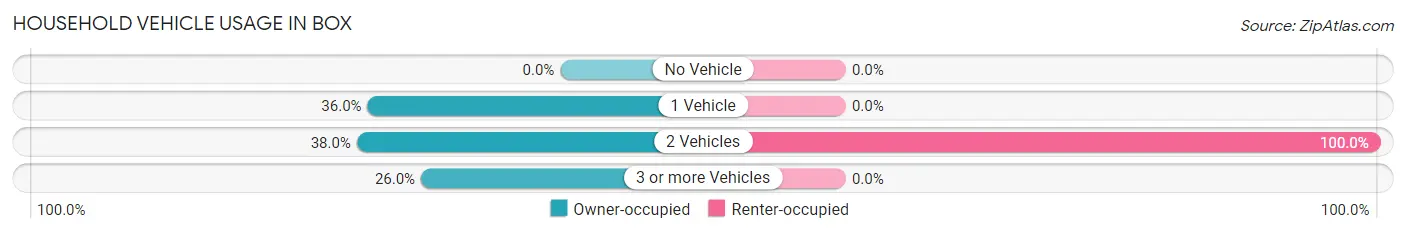
| Vehicles per Household | Owner-occupied | Renter-occupied |
| No Vehicle | 0 (0.0%) | 0 (0.0%) |
| 1 Vehicle | 18 (36.0%) | 0 (0.0%) |
| 2 Vehicles | 19 (38.0%) | 14 (100.0%) |
| 3 or more Vehicles | 13 (26.0%) | 0 (0.0%) |
| Total | 50 (100.0%) | 14 (100.0%) |
Real Estate & Mortgages in Box
Real Estate and Mortgage Overview in Box
| Characteristic | Without Mortgage | With Mortgage |
| Housing Units | 49 | 1 |
| Median Property Value | - | - |
| Median Household Income | $38,750 | $0 |
| Monthly Housing Costs | $418 | $0 |
| Real Estate Taxes | - | - |
Property Value by Mortgage Status in Box
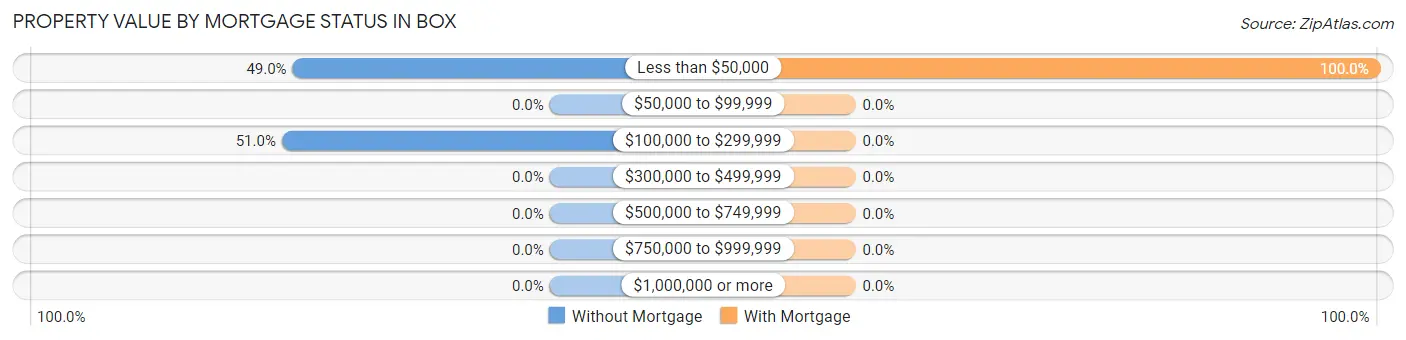
| Property Value | Without Mortgage | With Mortgage |
| Less than $50,000 | 24 (49.0%) | 1 (100.0%) |
| $50,000 to $99,999 | 0 (0.0%) | 0 (0.0%) |
| $100,000 to $299,999 | 25 (51.0%) | 0 (0.0%) |
| $300,000 to $499,999 | 0 (0.0%) | 0 (0.0%) |
| $500,000 to $749,999 | 0 (0.0%) | 0 (0.0%) |
| $750,000 to $999,999 | 0 (0.0%) | 0 (0.0%) |
| $1,000,000 or more | 0 (0.0%) | 0 (0.0%) |
| Total | 49 (100.0%) | 1 (100.0%) |
Household Income by Mortgage Status in Box
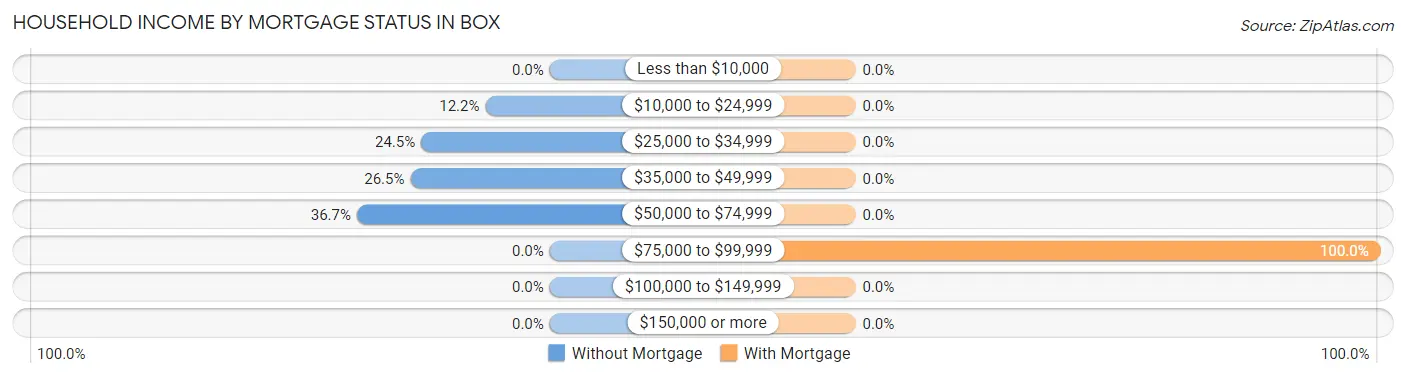
| Household Income | Without Mortgage | With Mortgage |
| Less than $10,000 | 0 (0.0%) | 0 (0.0%) |
| $10,000 to $24,999 | 6 (12.2%) | 0 (0.0%) |
| $25,000 to $34,999 | 12 (24.5%) | 0 (0.0%) |
| $35,000 to $49,999 | 13 (26.5%) | 0 (0.0%) |
| $50,000 to $74,999 | 18 (36.7%) | 0 (0.0%) |
| $75,000 to $99,999 | 0 (0.0%) | 1 (100.0%) |
| $100,000 to $149,999 | 0 (0.0%) | 0 (0.0%) |
| $150,000 or more | 0 (0.0%) | 0 (0.0%) |
| Total | 49 (100.0%) | 1 (100.0%) |
Property Value to Household Income Ratio in Box
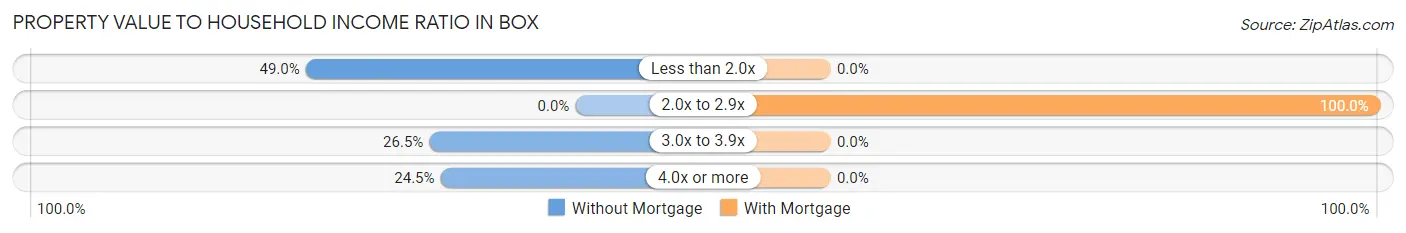
| Value-to-Income Ratio | Without Mortgage | With Mortgage |
| Less than 2.0x | 24 (49.0%) | 0 (0.0%) |
| 2.0x to 2.9x | 0 (0.0%) | 1 (100.0%) |
| 3.0x to 3.9x | 13 (26.5%) | 0 (0.0%) |
| 4.0x or more | 12 (24.5%) | 0 (0.0%) |
| Total | 49 (100.0%) | 1 (100.0%) |
Real Estate Taxes by Mortgage Status in Box
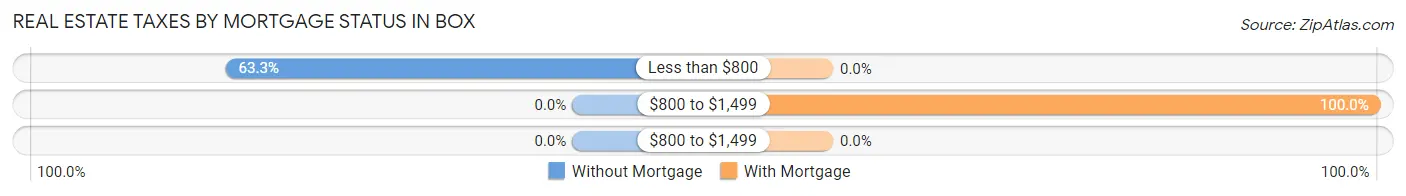
| Property Taxes | Without Mortgage | With Mortgage |
| Less than $800 | 31 (63.3%) | 0 (0.0%) |
| $800 to $1,499 | 0 (0.0%) | 1 (100.0%) |
| $800 to $1,499 | 0 (0.0%) | 0 (0.0%) |
| Total | 49 (100.0%) | 1 (100.0%) |
Health & Disability in Box
Health Insurance Coverage by Age in Box
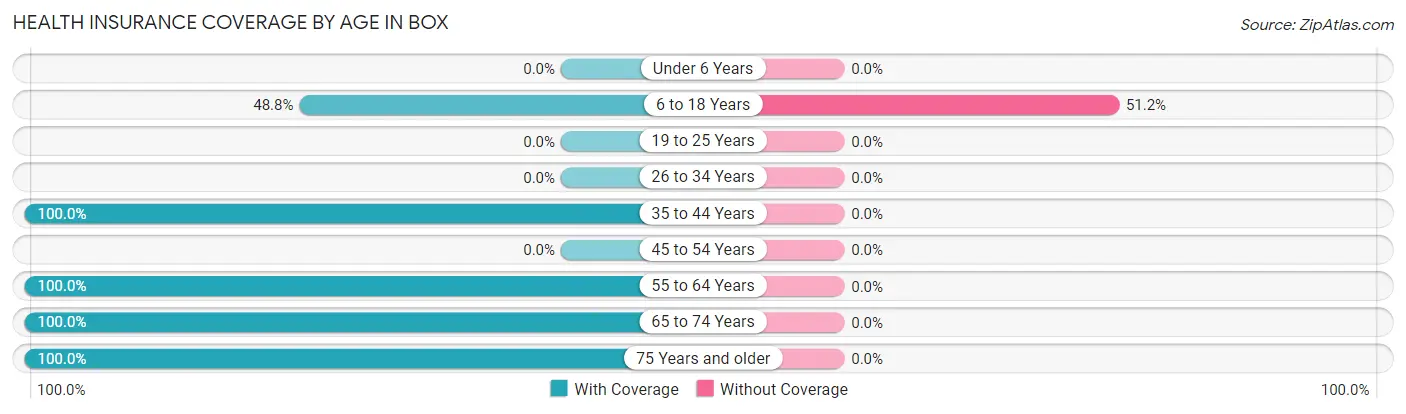
| Age Bracket | With Coverage | Without Coverage |
| Under 6 Years | 0 (0.0%) | 0 (0.0%) |
| 6 to 18 Years | 20 (48.8%) | 21 (51.2%) |
| 19 to 25 Years | 0 (0.0%) | 0 (0.0%) |
| 26 to 34 Years | 0 (0.0%) | 0 (0.0%) |
| 35 to 44 Years | 6 (100.0%) | 0 (0.0%) |
| 45 to 54 Years | 0 (0.0%) | 0 (0.0%) |
| 55 to 64 Years | 21 (100.0%) | 0 (0.0%) |
| 65 to 74 Years | 43 (100.0%) | 0 (0.0%) |
| 75 Years and older | 28 (100.0%) | 0 (0.0%) |
| Total | 118 (84.9%) | 21 (15.1%) |
Health Insurance Coverage by Citizenship Status in Box
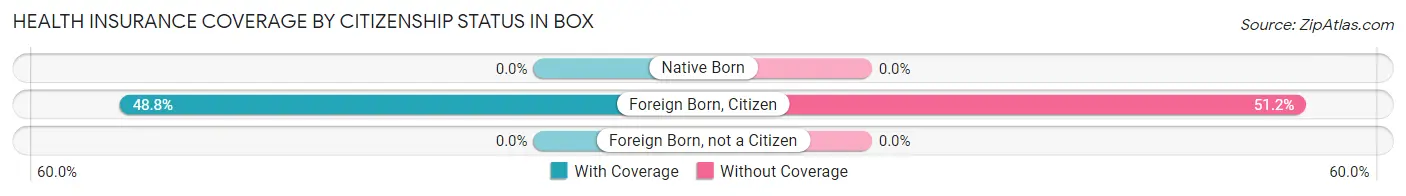
| Citizenship Status | With Coverage | Without Coverage |
| Native Born | 0 (0.0%) | 0 (0.0%) |
| Foreign Born, Citizen | 20 (48.8%) | 21 (51.2%) |
| Foreign Born, not a Citizen | 0 (0.0%) | 0 (0.0%) |
Health Insurance Coverage by Household Income in Box
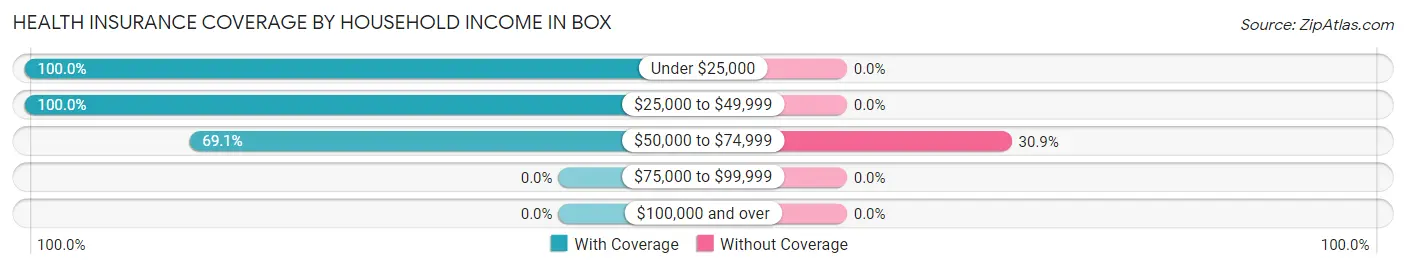
| Household Income | With Coverage | Without Coverage |
| Under $25,000 | 25 (100.0%) | 0 (0.0%) |
| $25,000 to $49,999 | 46 (100.0%) | 0 (0.0%) |
| $50,000 to $74,999 | 47 (69.1%) | 21 (30.9%) |
| $75,000 to $99,999 | 0 (0.0%) | 0 (0.0%) |
| $100,000 and over | 0 (0.0%) | 0 (0.0%) |
Public vs Private Health Insurance Coverage by Age in Box
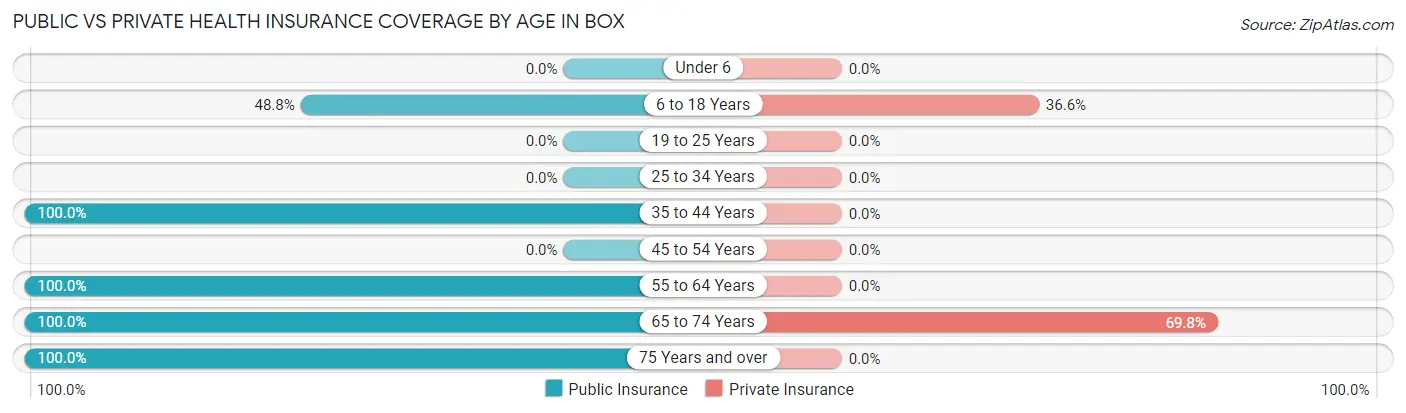
| Age Bracket | Public Insurance | Private Insurance |
| Under 6 | 0 (0.0%) | 0 (0.0%) |
| 6 to 18 Years | 20 (48.8%) | 15 (36.6%) |
| 19 to 25 Years | 0 (0.0%) | 0 (0.0%) |
| 25 to 34 Years | 0 (0.0%) | 0 (0.0%) |
| 35 to 44 Years | 6 (100.0%) | 0 (0.0%) |
| 45 to 54 Years | 0 (0.0%) | 0 (0.0%) |
| 55 to 64 Years | 21 (100.0%) | 0 (0.0%) |
| 65 to 74 Years | 43 (100.0%) | 30 (69.8%) |
| 75 Years and over | 28 (100.0%) | 0 (0.0%) |
| Total | 118 (84.9%) | 45 (32.4%) |
Disability Status by Sex by Age in Box
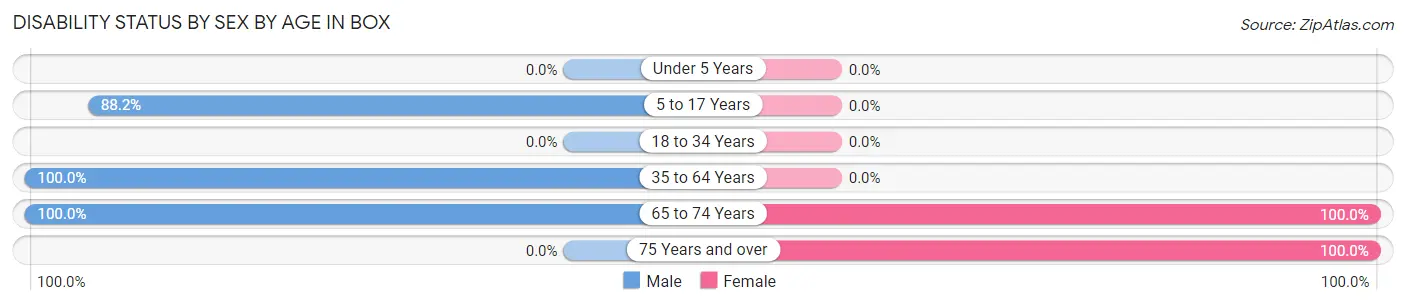
| Age Bracket | Male | Female |
| Under 5 Years | 0 (0.0%) | 0 (0.0%) |
| 5 to 17 Years | 15 (88.2%) | 0 (0.0%) |
| 18 to 34 Years | 0 (0.0%) | 0 (0.0%) |
| 35 to 64 Years | 21 (100.0%) | 0 (0.0%) |
| 65 to 74 Years | 25 (100.0%) | 18 (100.0%) |
| 75 Years and over | 0 (0.0%) | 28 (100.0%) |
Disability Class by Sex by Age in Box
Disability Class: Hearing Difficulty
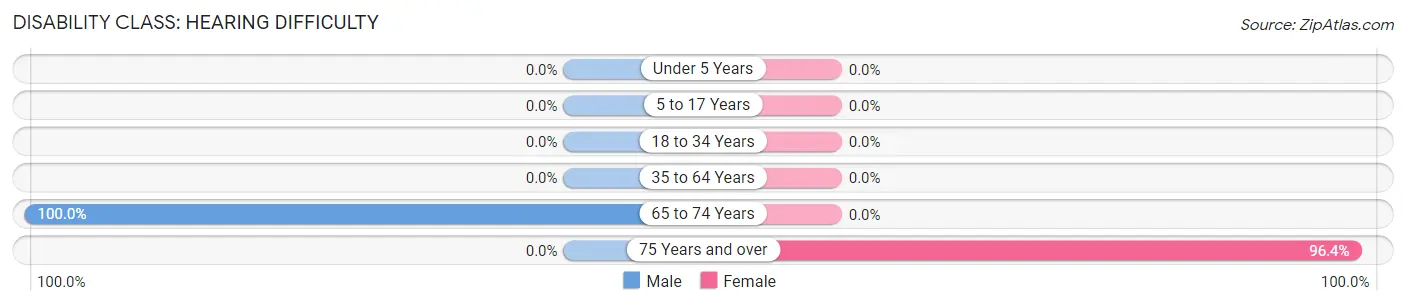
| Age Bracket | Male | Female |
| Under 5 Years | 0 (0.0%) | 0 (0.0%) |
| 5 to 17 Years | 0 (0.0%) | 0 (0.0%) |
| 18 to 34 Years | 0 (0.0%) | 0 (0.0%) |
| 35 to 64 Years | 0 (0.0%) | 0 (0.0%) |
| 65 to 74 Years | 25 (100.0%) | 0 (0.0%) |
| 75 Years and over | 0 (0.0%) | 27 (96.4%) |
Disability Class: Vision Difficulty
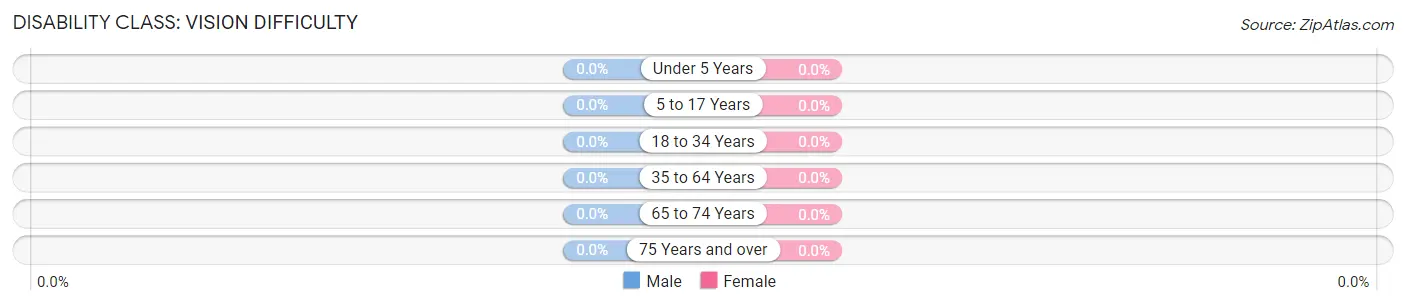
| Age Bracket | Male | Female |
| Under 5 Years | 0 (0.0%) | 0 (0.0%) |
| 5 to 17 Years | 0 (0.0%) | 0 (0.0%) |
| 18 to 34 Years | 0 (0.0%) | 0 (0.0%) |
| 35 to 64 Years | 0 (0.0%) | 0 (0.0%) |
| 65 to 74 Years | 0 (0.0%) | 0 (0.0%) |
| 75 Years and over | 0 (0.0%) | 0 (0.0%) |
Disability Class: Cognitive Difficulty
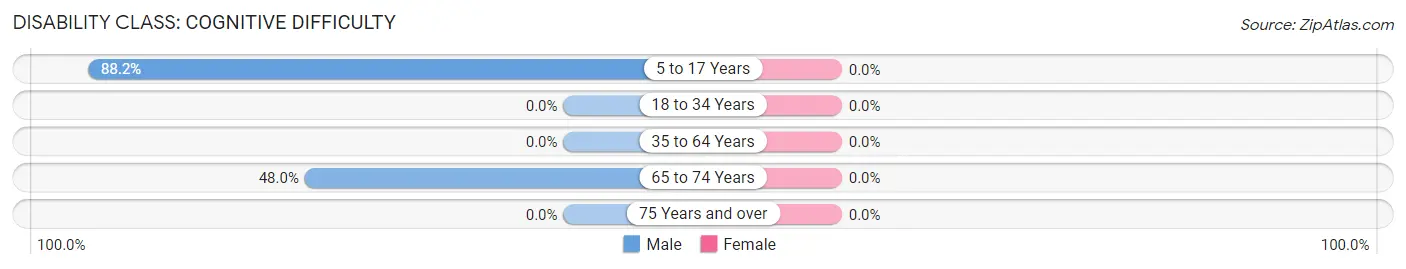
| Age Bracket | Male | Female |
| 5 to 17 Years | 15 (88.2%) | 0 (0.0%) |
| 18 to 34 Years | 0 (0.0%) | 0 (0.0%) |
| 35 to 64 Years | 0 (0.0%) | 0 (0.0%) |
| 65 to 74 Years | 12 (48.0%) | 0 (0.0%) |
| 75 Years and over | 0 (0.0%) | 0 (0.0%) |
Disability Class: Ambulatory Difficulty
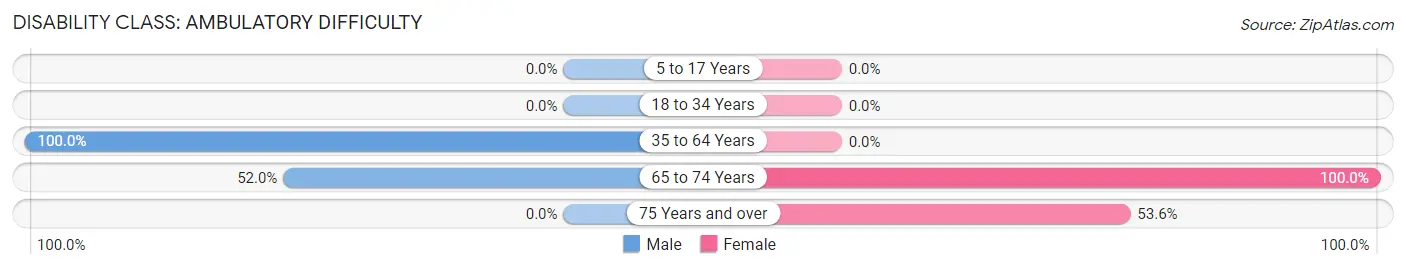
| Age Bracket | Male | Female |
| 5 to 17 Years | 0 (0.0%) | 0 (0.0%) |
| 18 to 34 Years | 0 (0.0%) | 0 (0.0%) |
| 35 to 64 Years | 21 (100.0%) | 0 (0.0%) |
| 65 to 74 Years | 13 (52.0%) | 18 (100.0%) |
| 75 Years and over | 0 (0.0%) | 15 (53.6%) |
Disability Class: Self-Care Difficulty
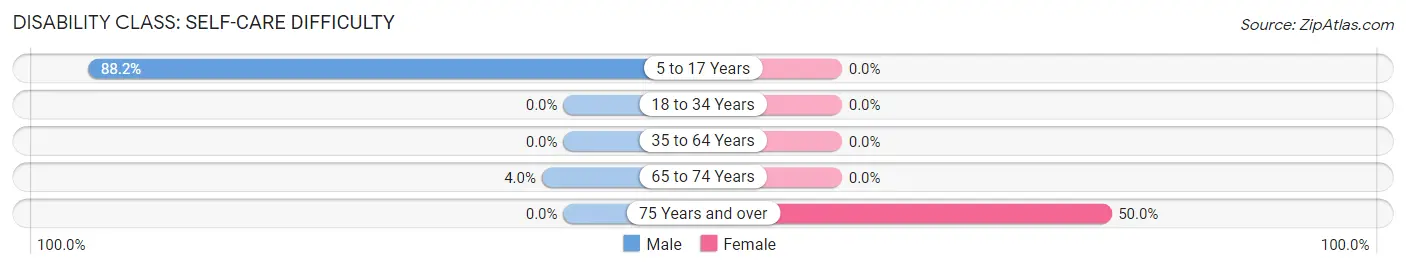
| Age Bracket | Male | Female |
| 5 to 17 Years | 15 (88.2%) | 0 (0.0%) |
| 18 to 34 Years | 0 (0.0%) | 0 (0.0%) |
| 35 to 64 Years | 0 (0.0%) | 0 (0.0%) |
| 65 to 74 Years | 1 (4.0%) | 0 (0.0%) |
| 75 Years and over | 0 (0.0%) | 14 (50.0%) |
Technology Access in Box
Computing Device Access in Box
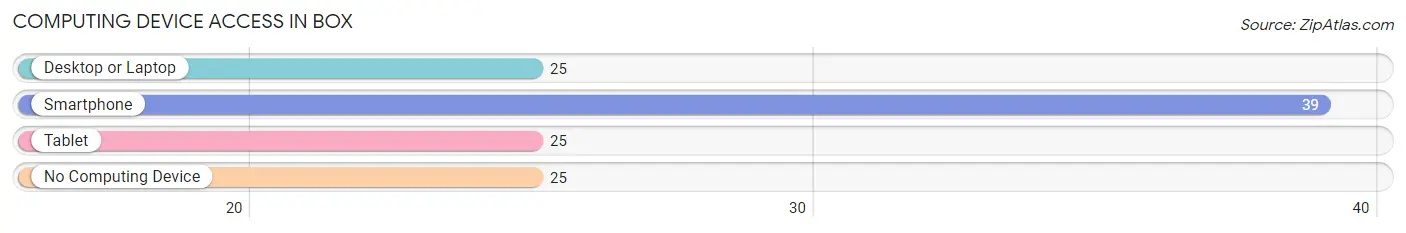
| Device Type | # Households | % Households |
| Desktop or Laptop | 25 | 39.1% |
| Smartphone | 39 | 60.9% |
| Tablet | 25 | 39.1% |
| No Computing Device | 25 | 39.1% |
| Total | 64 | 100.0% |
Internet Access in Box
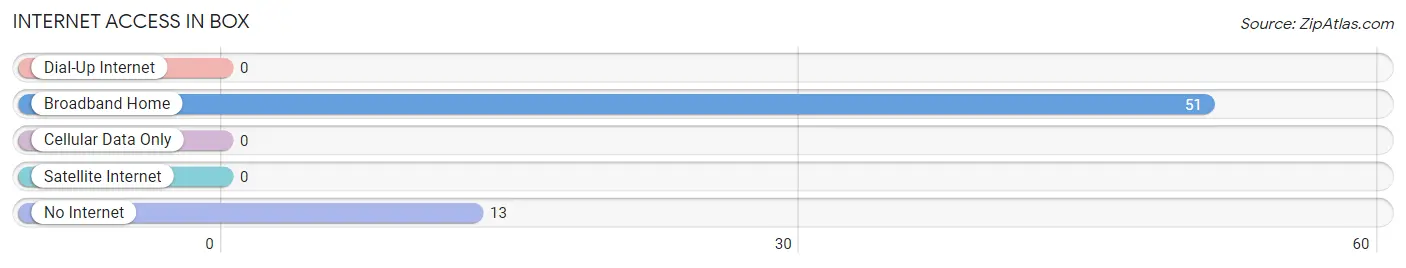
| Internet Type | # Households | % Households |
| Dial-Up Internet | 0 | 0.0% |
| Broadband Home | 51 | 79.7% |
| Cellular Data Only | 0 | 0.0% |
| Satellite Internet | 0 | 0.0% |
| No Internet | 13 | 20.3% |
| Total | 64 | 100.0% |
Box Summary
History
The history of the United States of America is a long and complex one, stretching back to the earliest days of the nation’s founding. The United States was founded in 1776, when the Declaration of Independence was signed. This document declared the nation’s independence from Great Britain, and set the stage for the formation of the United States of America.
The early years of the nation were marked by the Revolutionary War, which lasted from 1775 to 1783. This war was fought between the American colonists and the British forces, and resulted in the United States gaining its independence. After the war, the nation was divided into 13 states, and the Articles of Confederation were adopted in 1781. This document established the first government of the United States, and was replaced by the Constitution in 1789.
The Constitution established the federal government of the United States, and set forth the framework for the nation’s government. It also established the three branches of government: the executive, legislative, and judicial branches. The Constitution also established the Bill of Rights, which guarantees certain rights to citizens of the United States.
The early years of the nation were marked by the growth of the nation’s economy and population. The Industrial Revolution began in the United States in the late 1700s, and this period saw the growth of factories and the development of new technologies. This period also saw the growth of the nation’s population, as immigrants from Europe and other parts of the world began to arrive in the United States.
The 19th century saw the nation expand westward, as settlers moved into the newly acquired territories. This period also saw the growth of the nation’s economy, as the nation began to industrialize and develop new technologies. The Civil War was fought from 1861 to 1865, and this conflict resulted in the abolition of slavery in the United States.
The 20th century saw the nation become a world power, as it became involved in two world wars and the Cold War. The nation also experienced a period of economic growth, as the nation’s economy became increasingly industrialized. The nation also experienced a period of civil rights reform, as the nation began to recognize the rights of all citizens.
Geography
The United States of America is a large and diverse nation, stretching from the Atlantic Ocean to the Pacific Ocean. The nation is divided into 50 states, and the District of Columbia, which is the nation’s capital. The nation is bordered by Canada to the north and Mexico to the south.
The United States is divided into four distinct regions: the Northeast, the Midwest, the South, and the West. The Northeast is the most densely populated region of the nation, and is home to some of the nation’s largest cities, such as New York City and Boston. The Midwest is home to the nation’s agricultural heartland, and is home to some of the nation’s largest cities, such as Chicago and Detroit. The South is home to some of the nation’s most iconic cities, such as Atlanta and New Orleans. The West is home to some of the nation’s most iconic landscapes, such as the Grand Canyon and the Rocky Mountains.
The United States is home to a wide variety of climates, ranging from tropical climates in the south to arctic climates in the north. The nation is also home to a wide variety of natural resources, including oil, natural gas, coal, and timber.
Economy
The economy of the United States is one of the largest and most powerful in the world. The nation’s economy is based on a capitalist system, and is driven by the private sector. The nation’s economy is highly diversified, and includes industries such as manufacturing, finance, technology, and services.
The United States is the world’s largest economy, and is the world’s largest exporter of goods and services. The nation’s economy is highly dependent on international trade, and the nation is a major importer of goods and services from other countries. The nation’s economy is also highly dependent on the global economy, and the nation’s economic performance is often affected by global economic conditions.
The nation’s economy is highly regulated, and the government plays an important role in the nation’s economic performance. The government sets economic policies, such as taxation and monetary policy, and provides economic assistance to businesses and individuals. The government also provides social services, such as health care and education, to citizens of the United States.
Demographics
The United States is a highly diverse nation, and is home to people from all over the world. The nation’s population is estimated to be over 330 million people, and the nation is home to people from all racial and ethnic backgrounds. The nation’s population is also highly diverse in terms of religion, with the majority of the population identifying as Christian.
The nation’s population is also highly diverse in terms of language, with English being the most commonly spoken language. Other languages spoken in the United States include Spanish, Chinese, and French.
The nation’s population is also highly diverse in terms of age, with the majority of the population being between the ages of 18 and 44. The nation’s population is also highly diverse in terms of income, with the majority of the population earning an annual income of less than $50,000.
Common Questions
What is Per Capita Income in Box?
Per Capita income in Box is $15,278.
What is the Median Family Income in Box?
Median Family Income in Box is $39,904.
What is the Median Household income in Box?
Median Household Income in Box is $36,250.
What is Inequality or Gini Index in Box?
Inequality or Gini Index in Box is 0.25.
What is the Total Population of Box?
Total Population of Box is 139.
What is the Total Male Population of Box?
Total Male Population of Box is 63.
What is the Total Female Population of Box?
Total Female Population of Box is 76.
What is the Ratio of Males per 100 Females in Box?
There are 82.89 Males per 100 Females in Box.
What is the Ratio of Females per 100 Males in Box?
There are 120.63 Females per 100 Males in Box.
What is the Median Population Age in Box?
Median Population Age in Box is 69.1 Years.
What is the Average Family Size in Box
Average Family Size in Box is 3.0 People.
What is the Average Household Size in Box
Average Household Size in Box is 2.2 People.
How Large is the Labor Force in Box?
There are 27 People in the Labor Forcein in Box.
What is the Percentage of People in the Labor Force in Box?
22.7% of People are in the Labor Force in Box.