Smithville, OK Map & Demographics
Smithville Map
Smithville Overview
$27,207
PER CAPITA INCOME
$31,447
AVG HOUSEHOLD INCOME
0.27
INEQUALITY / GINI INDEX
97
TOTAL POPULATION
24
MALE POPULATION
73
FEMALE POPULATION
32.88
MALES / 100 FEMALES
304.17
FEMALES / 100 MALES
28.5
MEDIAN AGE
2.8
AVG FAMILY SIZE
1.5
AVG HOUSEHOLD SIZE
52
LABOR FORCE [ PEOPLE ]
59.8%
PERCENT IN LABOR FORCE
Smithville Zip Codes
Income in Smithville
Income Overview in Smithville
| Characteristic | Number | Measure |
| Per Capita Income | 97 | $27,207 |
| Median Family Income | 13 | $0 |
| Mean Family Income | 13 | $75,662 |
| Median Household Income | 66 | $31,447 |
| Mean Household Income | 66 | $40,730 |
| Income Deficit | 13 | $0 |
| Wage / Income Gap (%) | 97 | 0.00% |
| Wage / Income Gap ($) | 97 | 100.00¢ per $1 |
| Gini / Inequality Index | 97 | 0.27 |
Earnings by Sex in Smithville
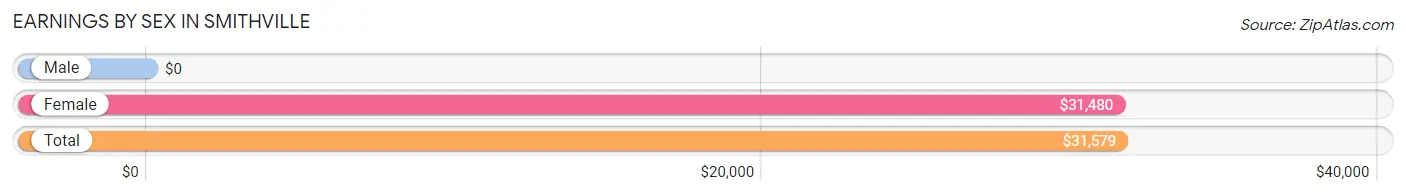
| Sex | Number | Average Earnings |
| Male | 3 (5.8%) | $0 |
| Female | 49 (94.2%) | $31,480 |
| Total | 52 (100.0%) | $31,579 |
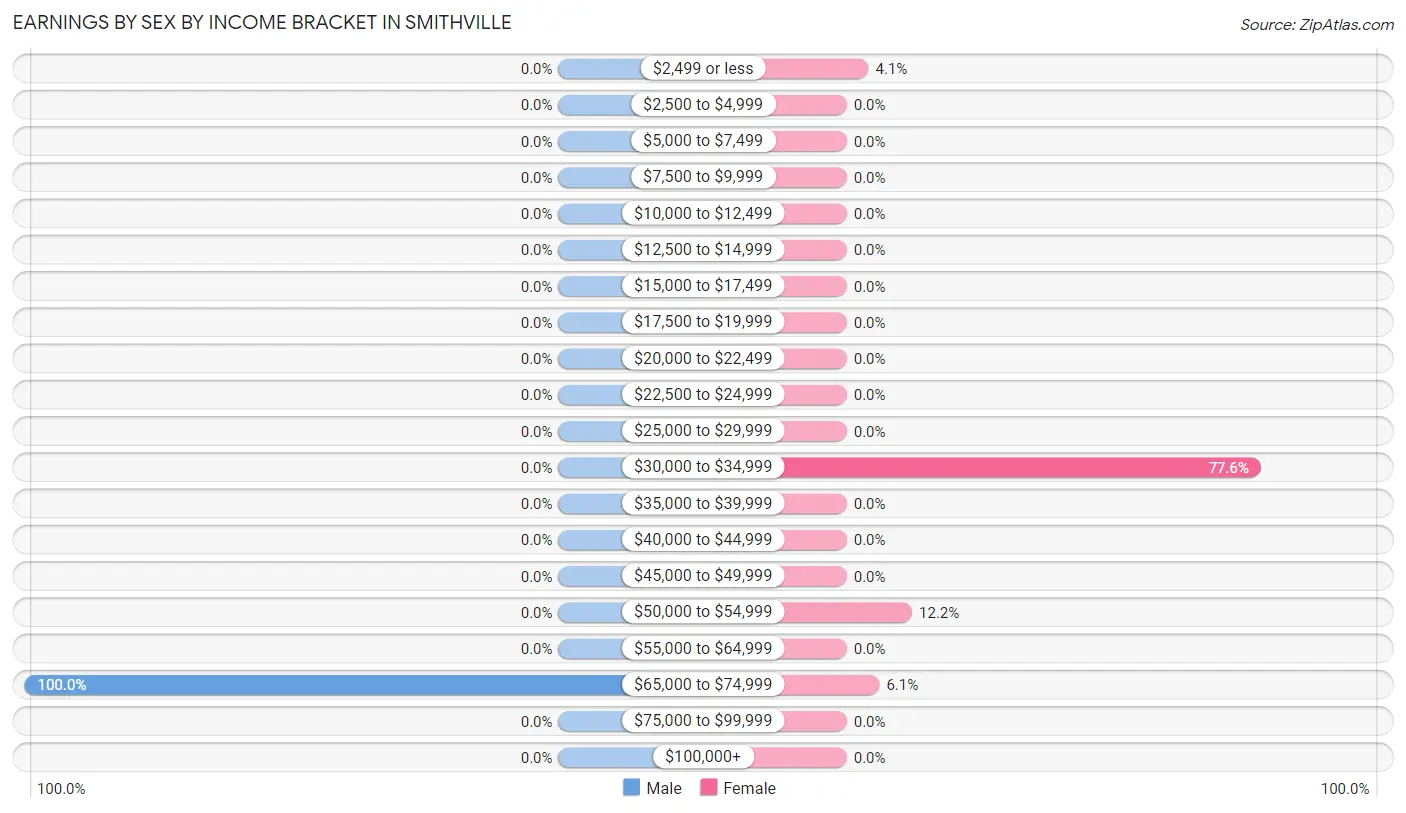
Earnings by Sex by Income Bracket in Smithville
The most common earnings brackets in Smithville are $65,000 to $74,999 for men (3 | 100.0%) and $30,000 to $34,999 for women (38 | 77.5%).
| Income | Male | Female |
| $2,499 or less | 0 (0.0%) | 2 (4.1%) |
| $2,500 to $4,999 | 0 (0.0%) | 0 (0.0%) |
| $5,000 to $7,499 | 0 (0.0%) | 0 (0.0%) |
| $7,500 to $9,999 | 0 (0.0%) | 0 (0.0%) |
| $10,000 to $12,499 | 0 (0.0%) | 0 (0.0%) |
| $12,500 to $14,999 | 0 (0.0%) | 0 (0.0%) |
| $15,000 to $17,499 | 0 (0.0%) | 0 (0.0%) |
| $17,500 to $19,999 | 0 (0.0%) | 0 (0.0%) |
| $20,000 to $22,499 | 0 (0.0%) | 0 (0.0%) |
| $22,500 to $24,999 | 0 (0.0%) | 0 (0.0%) |
| $25,000 to $29,999 | 0 (0.0%) | 0 (0.0%) |
| $30,000 to $34,999 | 0 (0.0%) | 38 (77.5%) |
| $35,000 to $39,999 | 0 (0.0%) | 0 (0.0%) |
| $40,000 to $44,999 | 0 (0.0%) | 0 (0.0%) |
| $45,000 to $49,999 | 0 (0.0%) | 0 (0.0%) |
| $50,000 to $54,999 | 0 (0.0%) | 6 (12.2%) |
| $55,000 to $64,999 | 0 (0.0%) | 0 (0.0%) |
| $65,000 to $74,999 | 3 (100.0%) | 3 (6.1%) |
| $75,000 to $99,999 | 0 (0.0%) | 0 (0.0%) |
| $100,000+ | 0 (0.0%) | 0 (0.0%) |
| Total | 3 (100.0%) | 49 (100.0%) |
Earnings by Sex by Educational Attainment in Smithville
| Educational Attainment | Male Income | Female Income |
| Less than High School | - | - |
| High School Diploma | - | - |
| College or Associate's Degree | - | - |
| Bachelor's Degree | - | - |
| Graduate Degree | - | - |
| Total | - | - |
Family Income in Smithville
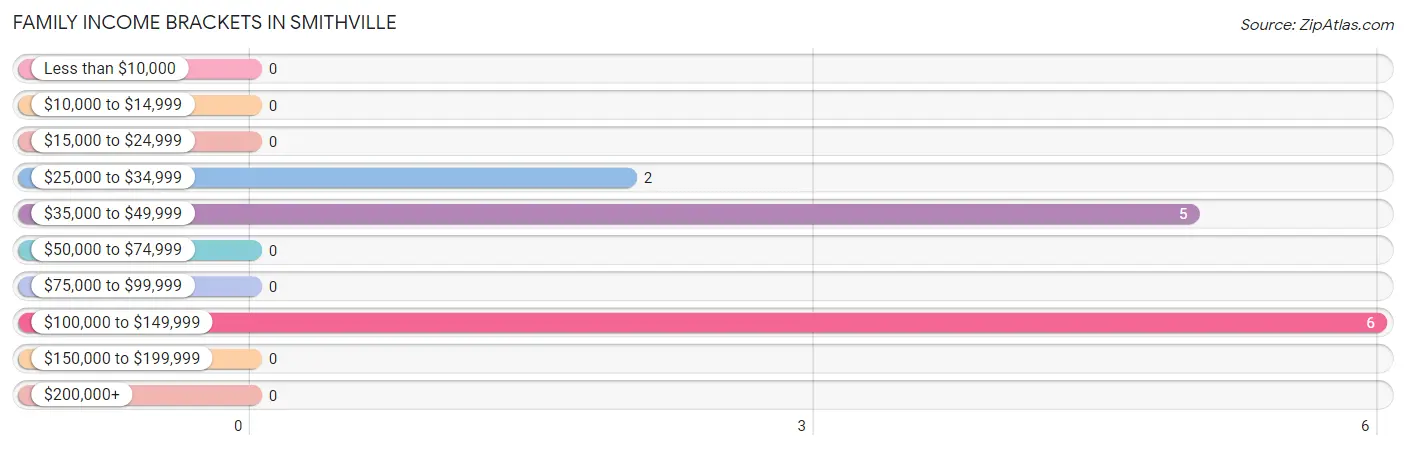
Family Income Brackets in Smithville
According to the Smithville family income data, there are 6 families falling into the $100,000 to $149,999 income range, which is the most common income bracket and makes up 46.2% of all families.
| Income Bracket | # Families | % Families |
| Less than $10,000 | 0 | 0.0% |
| $10,000 to $14,999 | 0 | 0.0% |
| $15,000 to $24,999 | 0 | 0.0% |
| $25,000 to $34,999 | 2 | 15.4% |
| $35,000 to $49,999 | 5 | 38.5% |
| $50,000 to $74,999 | 0 | 0.0% |
| $75,000 to $99,999 | 0 | 0.0% |
| $100,000 to $149,999 | 6 | 46.2% |
| $150,000 to $199,999 | 0 | 0.0% |
| $200,000+ | 0 | 0.0% |
Family Income by Famaliy Size in Smithville
| Income Bracket | # Families | Median Income |
| 2-Person Families | 6 (46.2%) | $0 |
| 3-Person Families | 5 (38.5%) | $0 |
| 4-Person Families | 2 (15.4%) | $0 |
| 5-Person Families | 0 (0.0%) | $0 |
| 6-Person Families | 0 (0.0%) | $0 |
| 7+ Person Families | 0 (0.0%) | $0 |
| Total | 13 (100.0%) | $0 |
Family Income by Number of Earners in Smithville
| Number of Earners | # Families | Median Income |
| No Earners | 8 (61.5%) | $0 |
| 1 Earner | 2 (15.4%) | $0 |
| 2 Earners | 3 (23.1%) | $0 |
| 3+ Earners | 0 (0.0%) | $0 |
| Total | 13 (100.0%) | $0 |
Household Income in Smithville
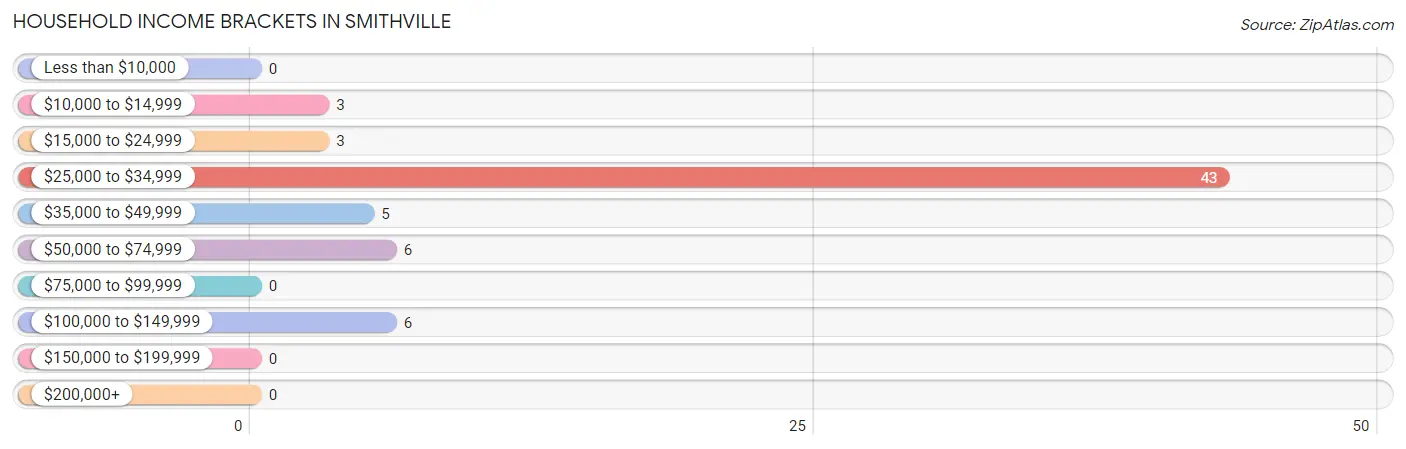
Household Income Brackets in Smithville
With 43 households falling in the category, the $25,000 to $34,999 income range is the most frequent in Smithville, accounting for 65.1% of all households.
| Income Bracket | # Households | % Households |
| Less than $10,000 | 0 | 0.0% |
| $10,000 to $14,999 | 3 | 4.5% |
| $15,000 to $24,999 | 3 | 4.5% |
| $25,000 to $34,999 | 43 | 65.2% |
| $35,000 to $49,999 | 5 | 7.6% |
| $50,000 to $74,999 | 6 | 9.1% |
| $75,000 to $99,999 | 0 | 0.0% |
| $100,000 to $149,999 | 6 | 9.1% |
| $150,000 to $199,999 | 0 | 0.0% |
| $200,000+ | 0 | 0.0% |
Household Income by Householder Age in Smithville
The median household income in Smithville is $31,447, with the highest median household income of $31,382 found in the 25 to 44 years age bracket for the primary householder. A total of 46 households (69.7%) fall into this category.
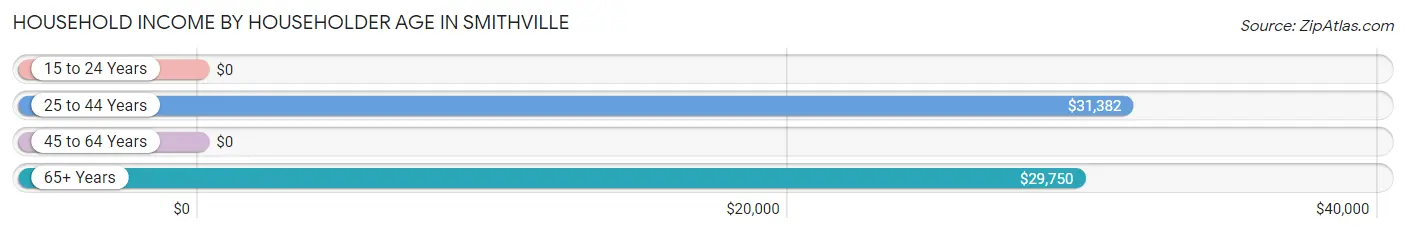
| Income Bracket | # Households | Median Income |
| 15 to 24 Years | 0 (0.0%) | $0 |
| 25 to 44 Years | 46 (69.7%) | $31,382 |
| 45 to 64 Years | 3 (4.5%) | $0 |
| 65+ Years | 17 (25.8%) | $29,750 |
| Total | 66 (100.0%) | $31,447 |
Poverty in Smithville
Income Below Poverty by Sex and Age in Smithville
With 54.2% poverty level for males and 13.7% for females among the residents of Smithville, 6 to 11 year old males and 12 to 14 year old females are the most vulnerable to poverty, with 4 males (100.0%) and 3 females (100.0%) in their respective age groups living below the poverty level.
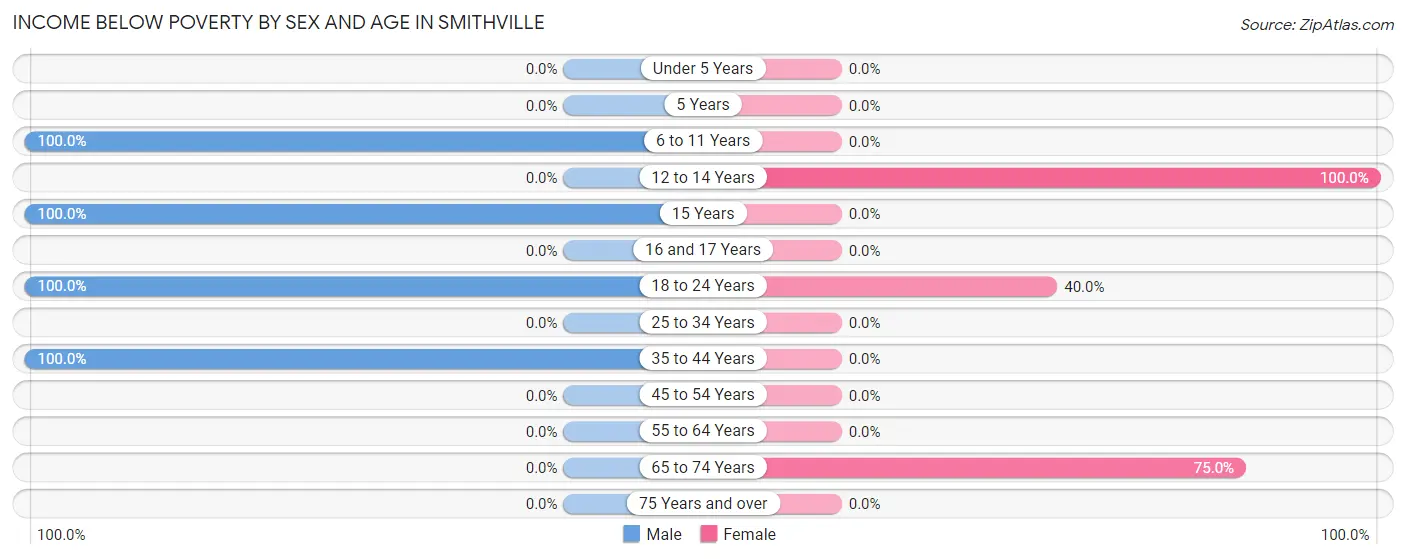
| Age Bracket | Male | Female |
| Under 5 Years | 0 (0.0%) | 0 (0.0%) |
| 5 Years | 0 (0.0%) | 0 (0.0%) |
| 6 to 11 Years | 4 (100.0%) | 0 (0.0%) |
| 12 to 14 Years | 0 (0.0%) | 3 (100.0%) |
| 15 Years | 3 (100.0%) | 0 (0.0%) |
| 16 and 17 Years | 0 (0.0%) | 0 (0.0%) |
| 18 to 24 Years | 4 (100.0%) | 4 (40.0%) |
| 25 to 34 Years | 0 (0.0%) | 0 (0.0%) |
| 35 to 44 Years | 2 (100.0%) | 0 (0.0%) |
| 45 to 54 Years | 0 (0.0%) | 0 (0.0%) |
| 55 to 64 Years | 0 (0.0%) | 0 (0.0%) |
| 65 to 74 Years | 0 (0.0%) | 3 (75.0%) |
| 75 Years and over | 0 (0.0%) | 0 (0.0%) |
| Total | 13 (54.2%) | 10 (13.7%) |
Income Above Poverty by Sex and Age in Smithville
According to the poverty statistics in Smithville, males aged 45 to 54 years and females aged 25 to 34 years are the age groups that are most secure financially, with 100.0% of males and 100.0% of females in these age groups living above the poverty line.
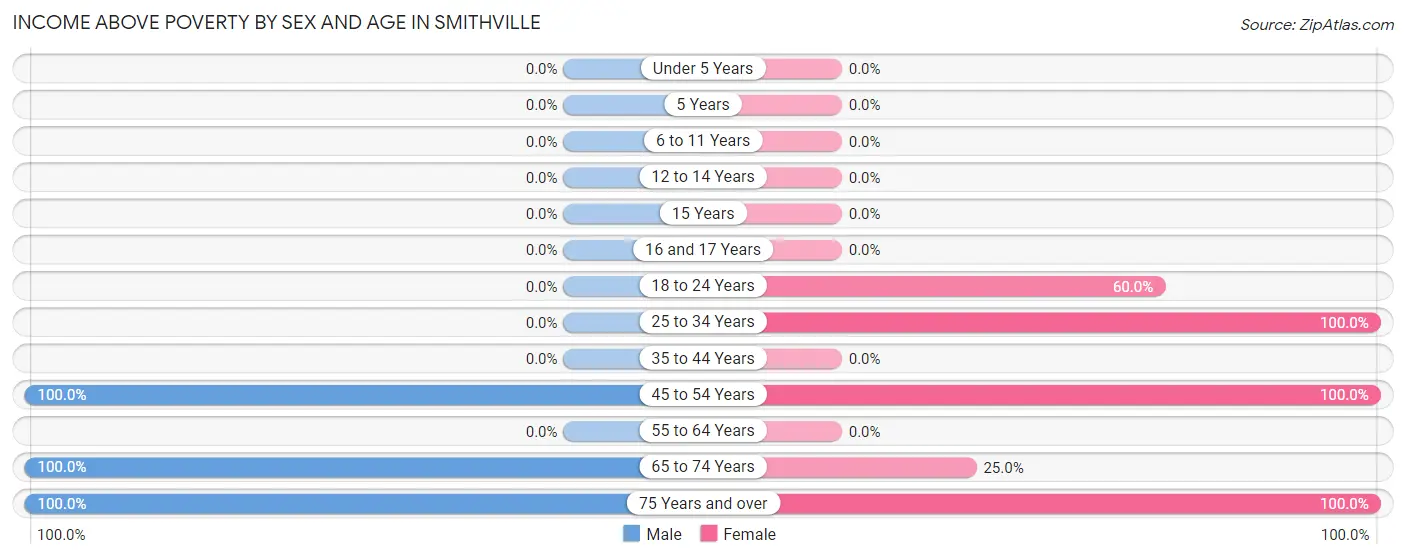
| Age Bracket | Male | Female |
| Under 5 Years | 0 (0.0%) | 0 (0.0%) |
| 5 Years | 0 (0.0%) | 0 (0.0%) |
| 6 to 11 Years | 0 (0.0%) | 0 (0.0%) |
| 12 to 14 Years | 0 (0.0%) | 0 (0.0%) |
| 15 Years | 0 (0.0%) | 0 (0.0%) |
| 16 and 17 Years | 0 (0.0%) | 0 (0.0%) |
| 18 to 24 Years | 0 (0.0%) | 6 (60.0%) |
| 25 to 34 Years | 0 (0.0%) | 44 (100.0%) |
| 35 to 44 Years | 0 (0.0%) | 0 (0.0%) |
| 45 to 54 Years | 3 (100.0%) | 3 (100.0%) |
| 55 to 64 Years | 0 (0.0%) | 0 (0.0%) |
| 65 to 74 Years | 5 (100.0%) | 1 (25.0%) |
| 75 Years and over | 3 (100.0%) | 9 (100.0%) |
| Total | 11 (45.8%) | 63 (86.3%) |
Income Below Poverty Among Married-Couple Families in Smithville
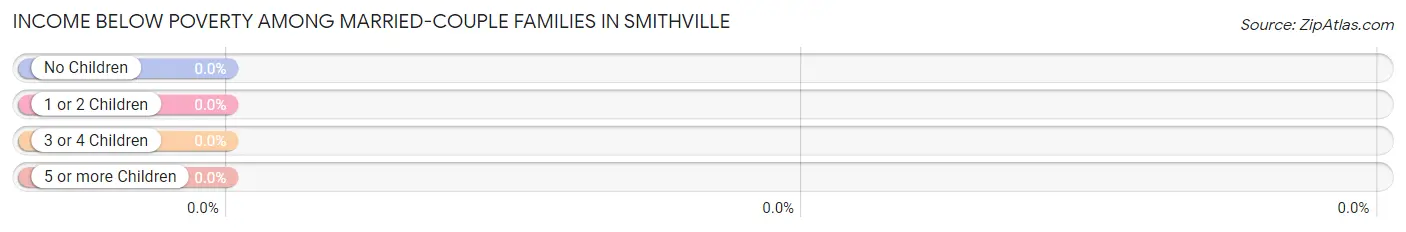
| Children | Above Poverty | Below Poverty |
| No Children | 11 (100.0%) | 0 (0.0%) |
| 1 or 2 Children | 0 (0.0%) | 0 (0.0%) |
| 3 or 4 Children | 0 (0.0%) | 0 (0.0%) |
| 5 or more Children | 0 (0.0%) | 0 (0.0%) |
| Total | 11 (100.0%) | 0 (0.0%) |
Income Below Poverty Among Single-Parent Households in Smithville
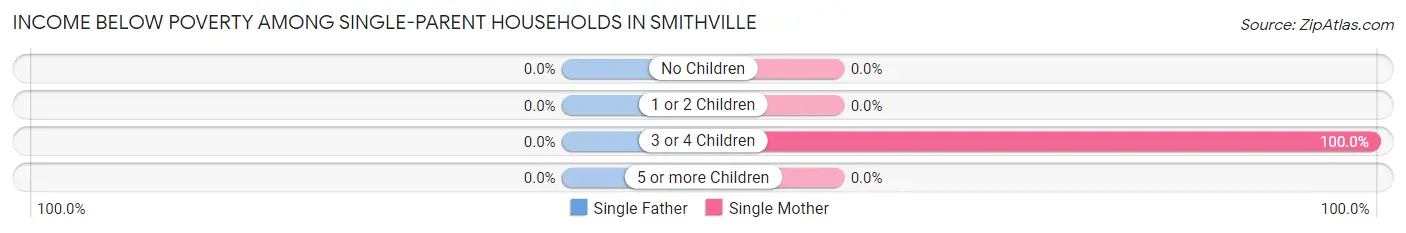
| Children | Single Father | Single Mother |
| No Children | 0 (0.0%) | 0 (0.0%) |
| 1 or 2 Children | 0 (0.0%) | 0 (0.0%) |
| 3 or 4 Children | 0 (0.0%) | 2 (100.0%) |
| 5 or more Children | 0 (0.0%) | 0 (0.0%) |
| Total | 0 (0.0%) | 2 (100.0%) |
Income Below Poverty Among Married-Couple vs Single-Parent Households in Smithville
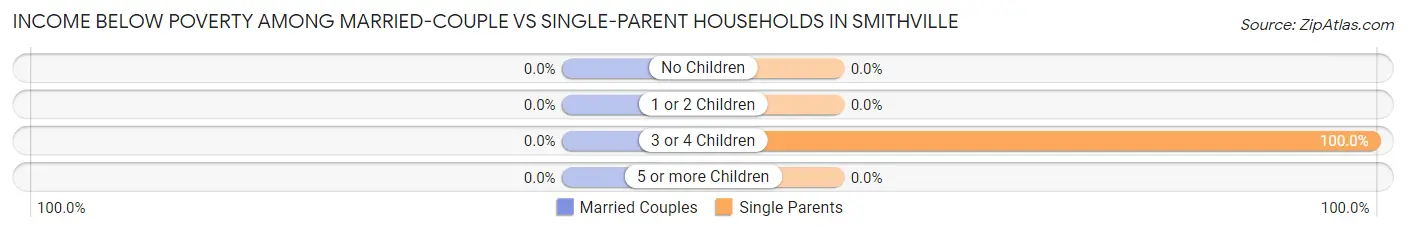
| Children | Married-Couple Families | Single-Parent Households |
| No Children | 0 (0.0%) | 0 (0.0%) |
| 1 or 2 Children | 0 (0.0%) | 0 (0.0%) |
| 3 or 4 Children | 0 (0.0%) | 2 (100.0%) |
| 5 or more Children | 0 (0.0%) | 0 (0.0%) |
| Total | 0 (0.0%) | 2 (100.0%) |
Race in Smithville
The most populous races in Smithville are White / Caucasian (72 | 74.2%), Native / Alaskan (23 | 23.7%), and Two or more Races (2 | 2.1%).
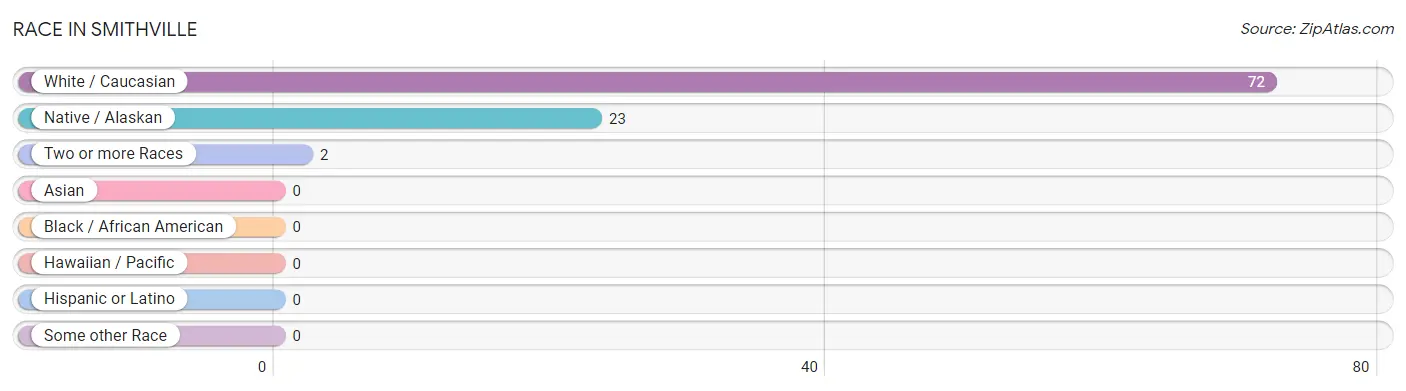
| Race | # Population | % Population |
| Asian | 0 | 0.0% |
| Black / African American | 0 | 0.0% |
| Hawaiian / Pacific | 0 | 0.0% |
| Hispanic or Latino | 0 | 0.0% |
| Native / Alaskan | 23 | 23.7% |
| White / Caucasian | 72 | 74.2% |
| Two or more Races | 2 | 2.1% |
| Some other Race | 0 | 0.0% |
| Total | 97 | 100.0% |
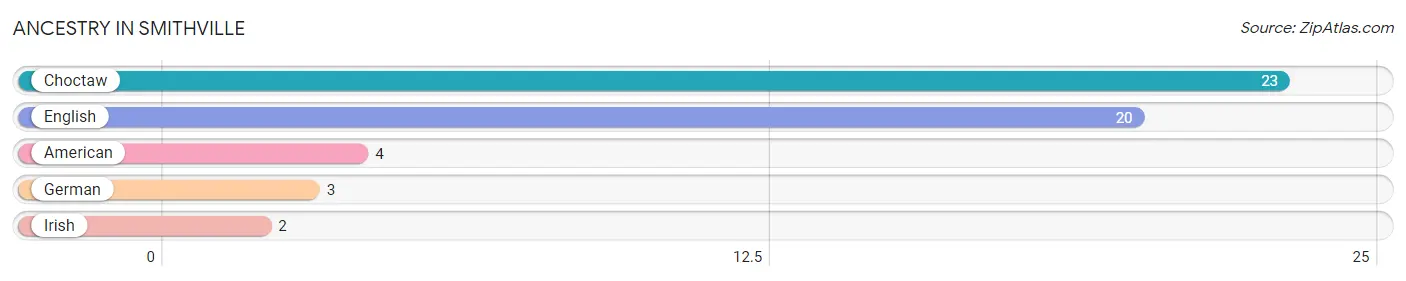
Ancestry in Smithville
The most populous ancestries reported in Smithville are Choctaw (23 | 23.7%), English (20 | 20.6%), American (4 | 4.1%), German (3 | 3.1%), and Irish (2 | 2.1%), together accounting for 53.6% of all Smithville residents.
| Ancestry | # Population | % Population |
| American | 4 | 4.1% |
| Choctaw | 23 | 23.7% |
| English | 20 | 20.6% |
| German | 3 | 3.1% |
| Irish | 2 | 2.1% | View All 5 Rows |
Immigrants in Smithville

| Immigration Origin | # Population | % Population | View All 0 Rows |
Sex and Age in Smithville
Sex and Age in Smithville
The most populous age groups in Smithville are 15 to 19 Years (7 | 29.2%) for men and 25 to 29 Years (44 | 60.3%) for women.
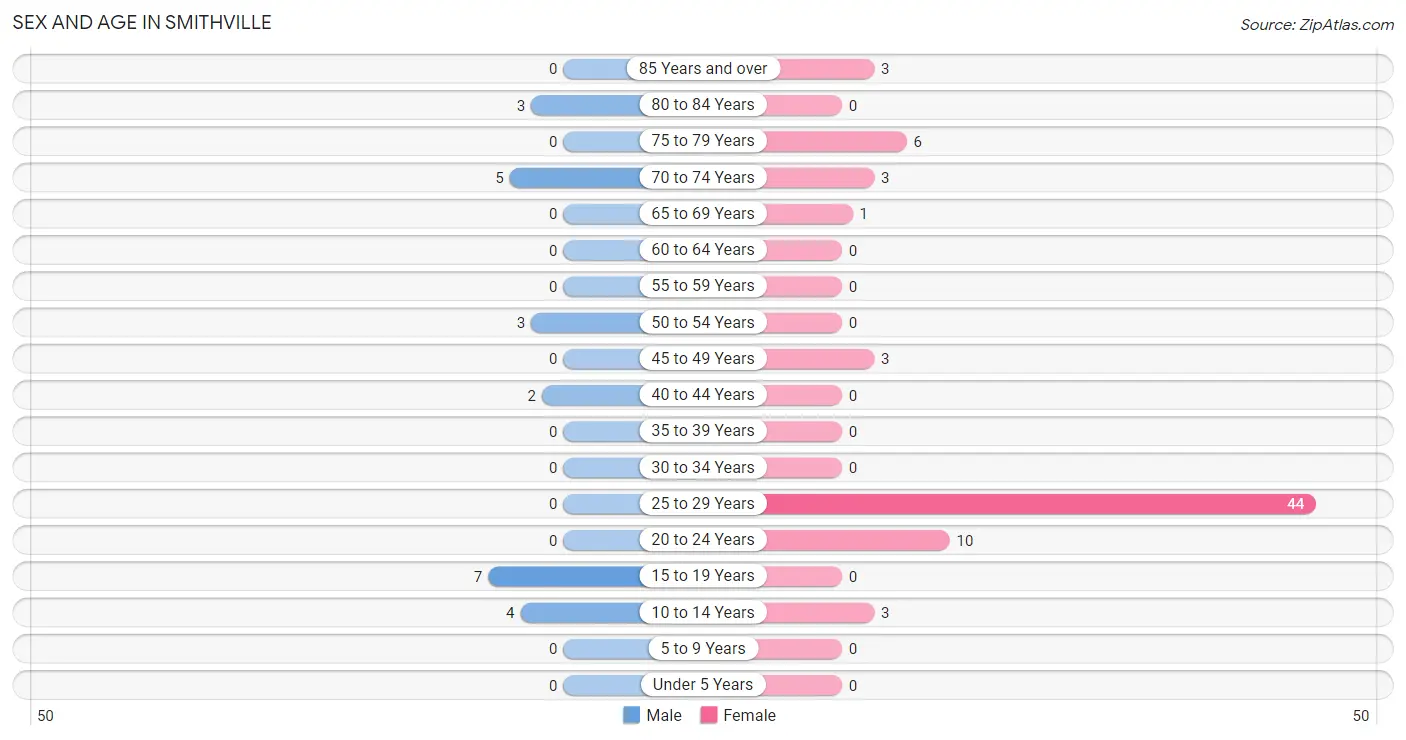
| Age Bracket | Male | Female |
| Under 5 Years | 0 (0.0%) | 0 (0.0%) |
| 5 to 9 Years | 0 (0.0%) | 0 (0.0%) |
| 10 to 14 Years | 4 (16.7%) | 3 (4.1%) |
| 15 to 19 Years | 7 (29.2%) | 0 (0.0%) |
| 20 to 24 Years | 0 (0.0%) | 10 (13.7%) |
| 25 to 29 Years | 0 (0.0%) | 44 (60.3%) |
| 30 to 34 Years | 0 (0.0%) | 0 (0.0%) |
| 35 to 39 Years | 0 (0.0%) | 0 (0.0%) |
| 40 to 44 Years | 2 (8.3%) | 0 (0.0%) |
| 45 to 49 Years | 0 (0.0%) | 3 (4.1%) |
| 50 to 54 Years | 3 (12.5%) | 0 (0.0%) |
| 55 to 59 Years | 0 (0.0%) | 0 (0.0%) |
| 60 to 64 Years | 0 (0.0%) | 0 (0.0%) |
| 65 to 69 Years | 0 (0.0%) | 1 (1.4%) |
| 70 to 74 Years | 5 (20.8%) | 3 (4.1%) |
| 75 to 79 Years | 0 (0.0%) | 6 (8.2%) |
| 80 to 84 Years | 3 (12.5%) | 0 (0.0%) |
| 85 Years and over | 0 (0.0%) | 3 (4.1%) |
| Total | 24 (100.0%) | 73 (100.0%) |
Families and Households in Smithville
Median Family Size in Smithville
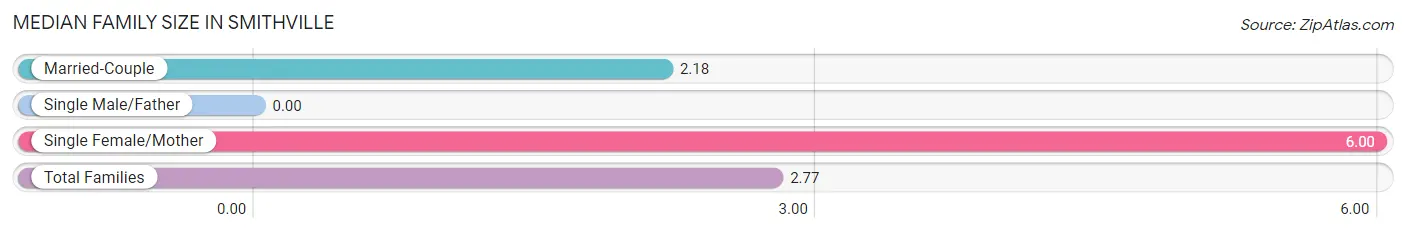
| Family Type | # Families | Family Size |
| Married-Couple | 11 (84.6%) | 2.18 |
| Single Male/Father | 0 (0.0%) | - |
| Single Female/Mother | 2 (15.4%) | 6.00 |
| Total Families | 13 (100.0%) | 2.77 |
Median Household Size in Smithville
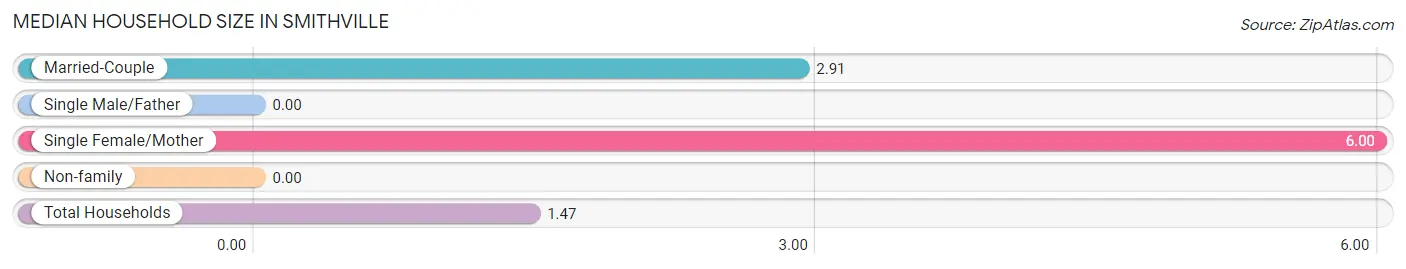
| Household Type | # Households | Household Size |
| Married-Couple | 11 (16.7%) | 2.91 |
| Single Male/Father | 0 (0.0%) | - |
| Single Female/Mother | 2 (3.0%) | 6.00 |
| Non-family | 53 (80.3%) | - |
| Total Households | 66 (100.0%) | 1.47 |
Household Size by Marriage Status in Smithville
Out of a total of 66 households in Smithville, 13 (19.7%) are family households, while 53 (80.3%) are nonfamily households. The most numerous type of family households are 3-person households, comprising 5, and the most common type of nonfamily households are 1-person households, comprising 53.
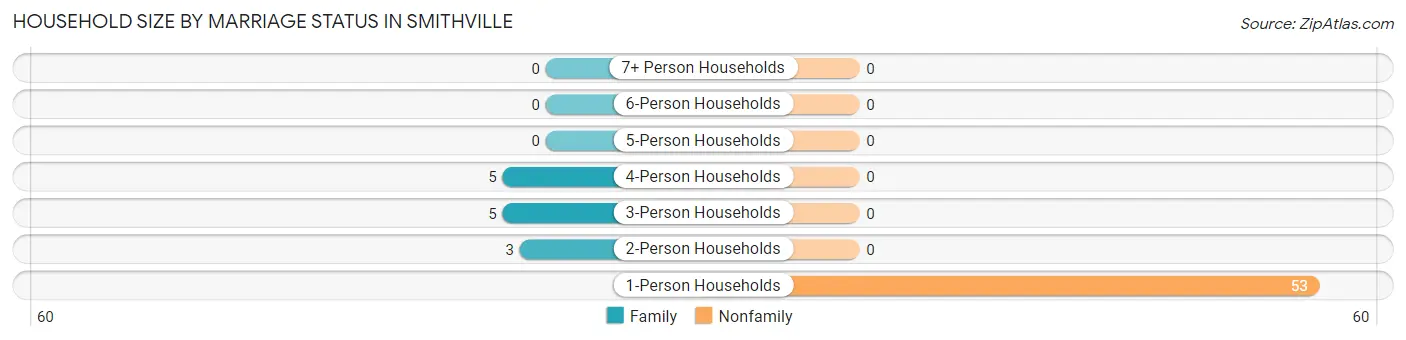
| Household Size | Family Households | Nonfamily Households |
| 1-Person Households | - | 53 (80.3%) |
| 2-Person Households | 3 (4.5%) | 0 (0.0%) |
| 3-Person Households | 5 (7.6%) | 0 (0.0%) |
| 4-Person Households | 5 (7.6%) | 0 (0.0%) |
| 5-Person Households | 0 (0.0%) | 0 (0.0%) |
| 6-Person Households | 0 (0.0%) | 0 (0.0%) |
| 7+ Person Households | 0 (0.0%) | 0 (0.0%) |
| Total | 13 (19.7%) | 53 (80.3%) |
Female Fertility in Smithville
Fertility by Age in Smithville
Average fertility rate in Smithville is 105.0 births per 1,000 women. Women in the age bracket of 20 to 34 years have the highest fertility rate with 111.0 births per 1,000 women. Women in the age bracket of 20 to 34 years acount for 100.0% of all women with births.
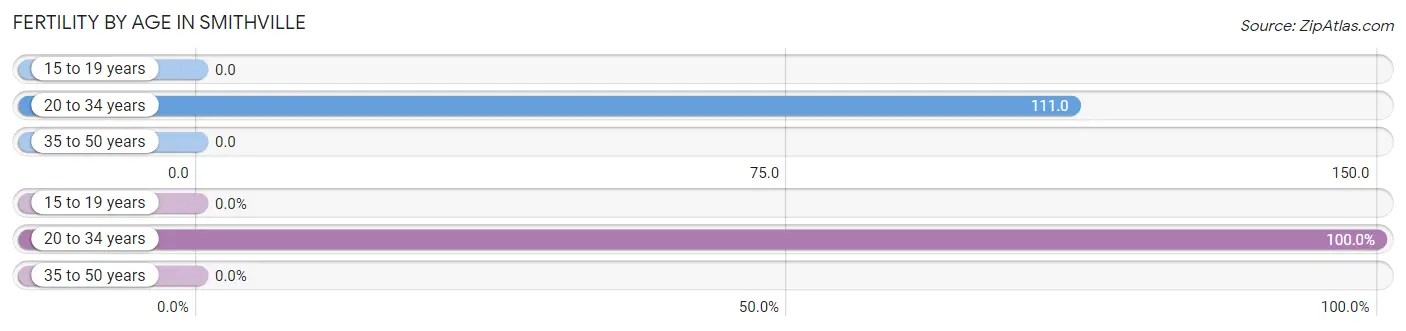
| Age Bracket | Women with Births | Births / 1,000 Women |
| 15 to 19 years | 0 (0.0%) | 0.0 |
| 20 to 34 years | 6 (100.0%) | 111.0 |
| 35 to 50 years | 0 (0.0%) | 0.0 |
| Total | 6 (100.0%) | 105.0 |
Fertility by Age by Marriage Status in Smithville
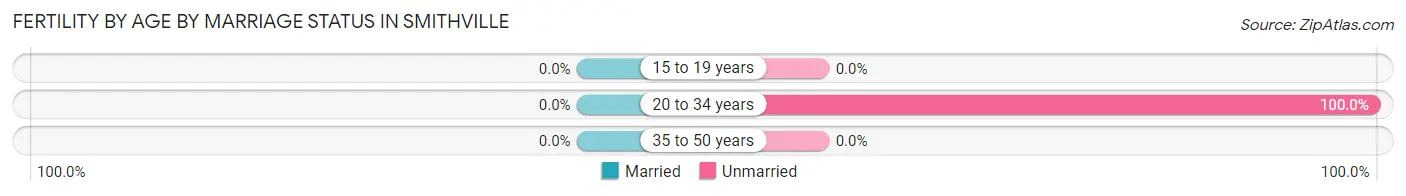
| Age Bracket | Married | Unmarried |
| 15 to 19 years | 0 (0.0%) | 0 (0.0%) |
| 20 to 34 years | 0 (0.0%) | 6 (100.0%) |
| 35 to 50 years | 0 (0.0%) | 0 (0.0%) |
| Total | 0 (0.0%) | 6 (100.0%) |
Fertility by Education in Smithville
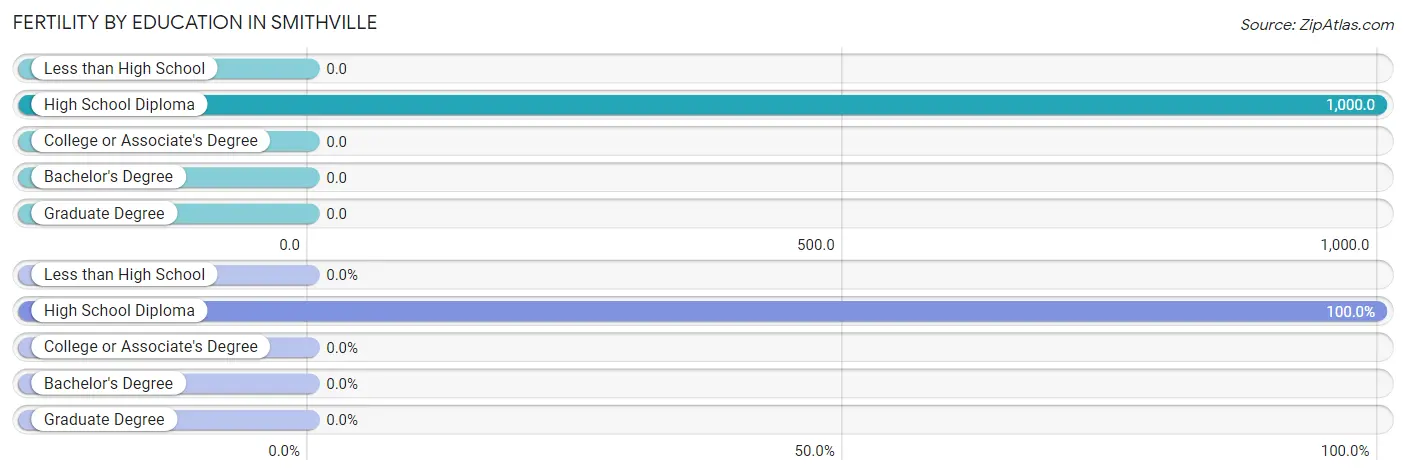
| Educational Attainment | Women with Births | Births / 1,000 Women |
| Less than High School | 0 (0.0%) | 0.0 |
| High School Diploma | 6 (100.0%) | 1,000.0 |
| College or Associate's Degree | 0 (0.0%) | 0.0 |
| Bachelor's Degree | 0 (0.0%) | 0.0 |
| Graduate Degree | 0 (0.0%) | 0.0 |
| Total | 6 (100.0%) | 105.0 |
Fertility by Education by Marriage Status in Smithville
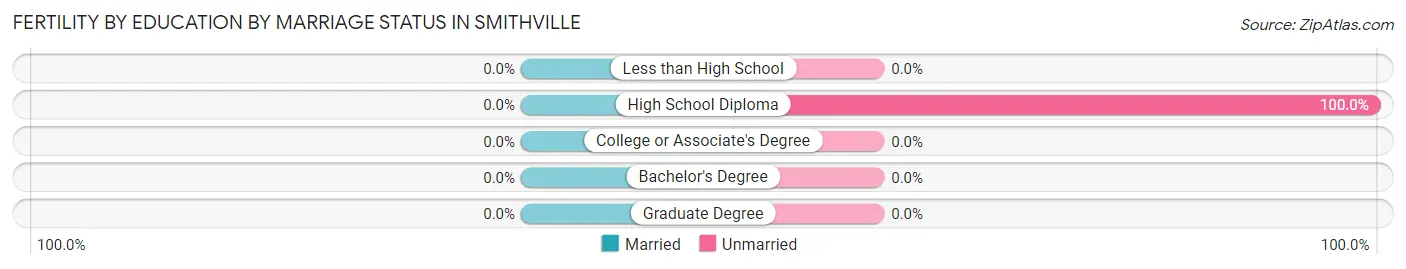
| Educational Attainment | Married | Unmarried |
| Less than High School | 0 (0.0%) | 0 (0.0%) |
| High School Diploma | 0 (0.0%) | 6 (100.0%) |
| College or Associate's Degree | 0 (0.0%) | 0 (0.0%) |
| Bachelor's Degree | 0 (0.0%) | 0 (0.0%) |
| Graduate Degree | 0 (0.0%) | 0 (0.0%) |
| Total | 0 (0.0%) | 6 (100.0%) |
Employment Characteristics in Smithville
Employment by Class of Employer in Smithville
Among the 52 employed individuals in Smithville, self-employed (not incorporated) (40 | 76.9%), local government employees (6 | 11.5%), and state government employees (6 | 11.5%) make up the most common classes of employment.
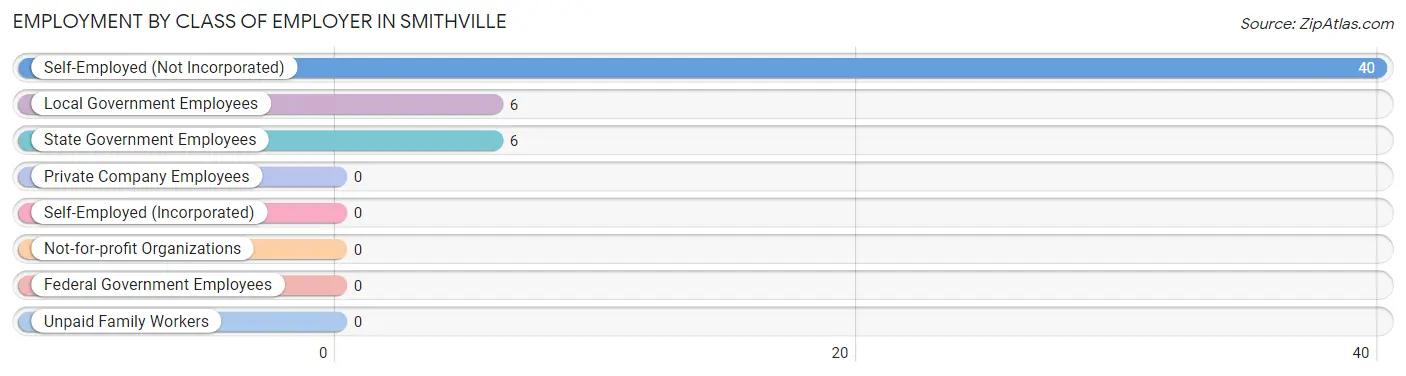
| Employer Class | # Employees | % Employees |
| Private Company Employees | 0 | 0.0% |
| Self-Employed (Incorporated) | 0 | 0.0% |
| Self-Employed (Not Incorporated) | 40 | 76.9% |
| Not-for-profit Organizations | 0 | 0.0% |
| Local Government Employees | 6 | 11.5% |
| State Government Employees | 6 | 11.5% |
| Federal Government Employees | 0 | 0.0% |
| Unpaid Family Workers | 0 | 0.0% |
| Total | 52 | 100.0% |
Employment Status by Age in Smithville
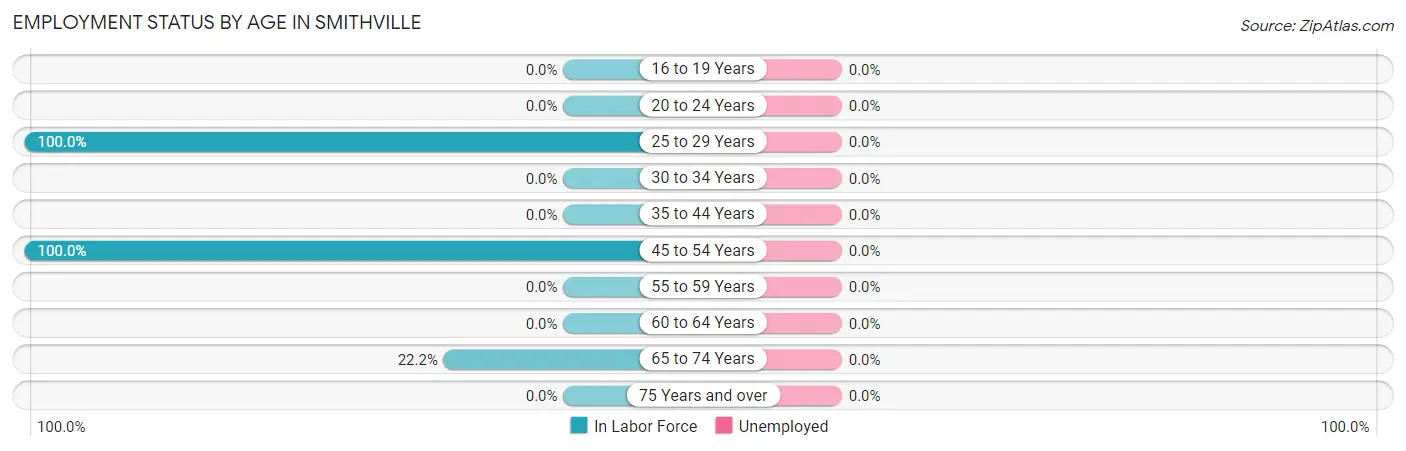
| Age Bracket | In Labor Force | Unemployed |
| 16 to 19 Years | 0 (0.0%) | 0 (0.0%) |
| 20 to 24 Years | 0 (0.0%) | 0 (0.0%) |
| 25 to 29 Years | 44 (100.0%) | 0 (0.0%) |
| 30 to 34 Years | 0 (0.0%) | 0 (0.0%) |
| 35 to 44 Years | 0 (0.0%) | 0 (0.0%) |
| 45 to 54 Years | 6 (100.0%) | 0 (0.0%) |
| 55 to 59 Years | 0 (0.0%) | 0 (0.0%) |
| 60 to 64 Years | 0 (0.0%) | 0 (0.0%) |
| 65 to 74 Years | 2 (22.2%) | 0 (0.0%) |
| 75 Years and over | 0 (0.0%) | 0 (0.0%) |
| Total | 52 (59.8%) | 0 (0.0%) |
Employment Status by Educational Attainment in Smithville
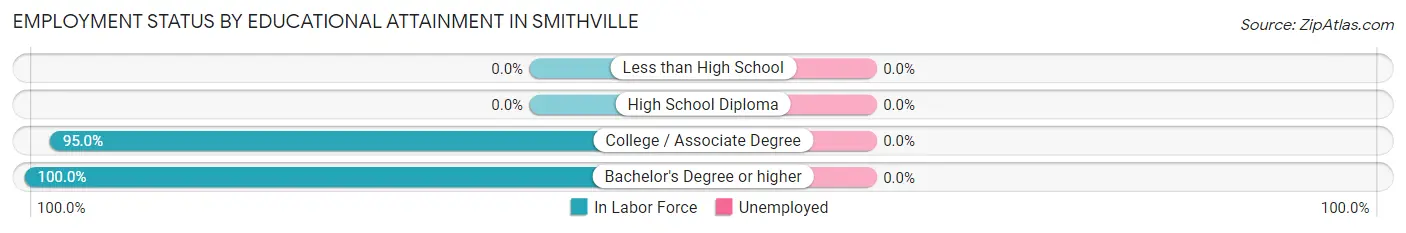
| Educational Attainment | In Labor Force | Unemployed |
| Less than High School | 0 (0.0%) | 0 (0.0%) |
| High School Diploma | 0 (0.0%) | 0 (0.0%) |
| College / Associate Degree | 38 (95.0%) | 0 (0.0%) |
| Bachelor's Degree or higher | 12 (100.0%) | 0 (0.0%) |
| Total | 50 (96.2%) | 0 (0.0%) |
Employment Occupations by Sex in Smithville
Management, Business, Science and Arts Occupations
The most common Management, Business, Science and Arts occupations in Smithville are Community & Social Service (9 | 17.3%), and Education Instruction & Library (9 | 17.3%).
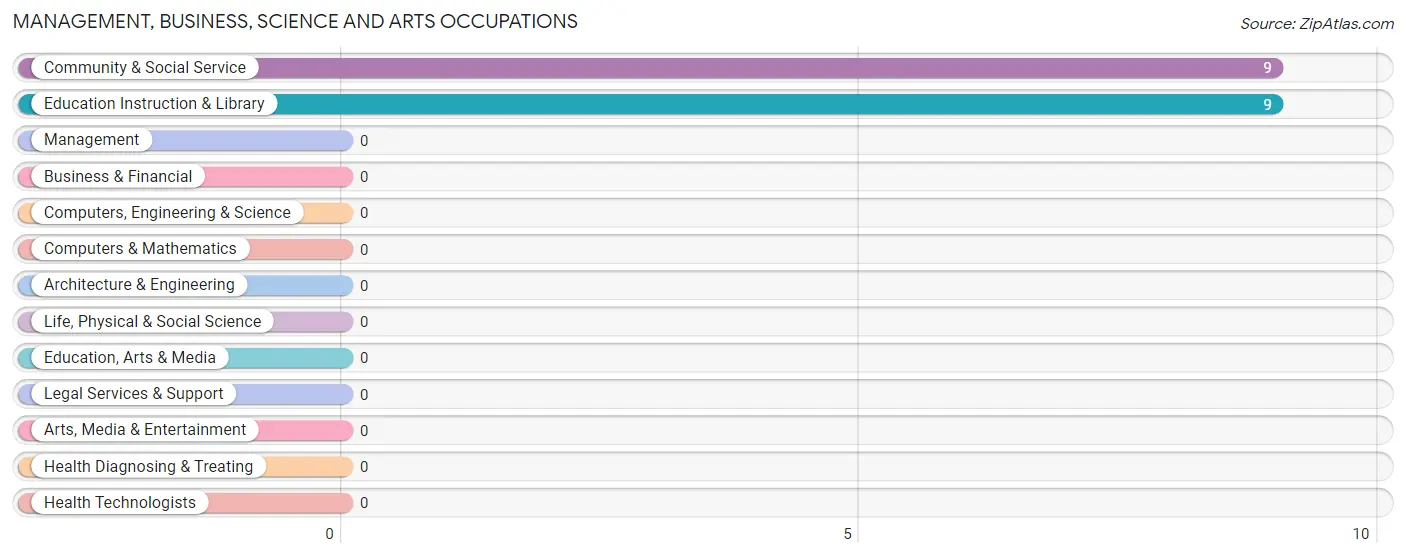
Management, Business, Science and Arts Occupations by Sex
Within the Management, Business, Science and Arts occupations in Smithville, the most male-oriented occupations are Community & Social Service (33.3%), and Education Instruction & Library (33.3%), while the most female-oriented occupations are Community & Social Service (66.7%), and Education Instruction & Library (66.7%).
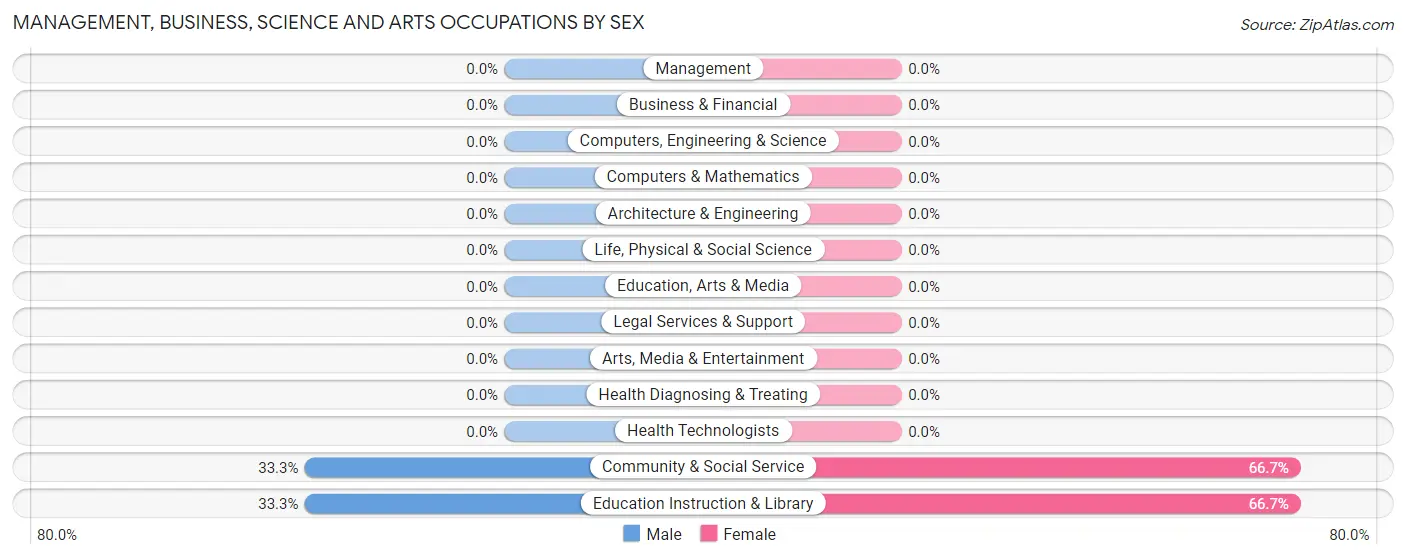
| Occupation | Male | Female |
| Management | 0 (0.0%) | 0 (0.0%) |
| Business & Financial | 0 (0.0%) | 0 (0.0%) |
| Computers, Engineering & Science | 0 (0.0%) | 0 (0.0%) |
| Computers & Mathematics | 0 (0.0%) | 0 (0.0%) |
| Architecture & Engineering | 0 (0.0%) | 0 (0.0%) |
| Life, Physical & Social Science | 0 (0.0%) | 0 (0.0%) |
| Community & Social Service | 3 (33.3%) | 6 (66.7%) |
| Education, Arts & Media | 0 (0.0%) | 0 (0.0%) |
| Legal Services & Support | 0 (0.0%) | 0 (0.0%) |
| Education Instruction & Library | 3 (33.3%) | 6 (66.7%) |
| Arts, Media & Entertainment | 0 (0.0%) | 0 (0.0%) |
| Health Diagnosing & Treating | 0 (0.0%) | 0 (0.0%) |
| Health Technologists | 0 (0.0%) | 0 (0.0%) |
| Total (Category) | 3 (33.3%) | 6 (66.7%) |
| Total (Overall) | 3 (5.8%) | 49 (94.2%) |
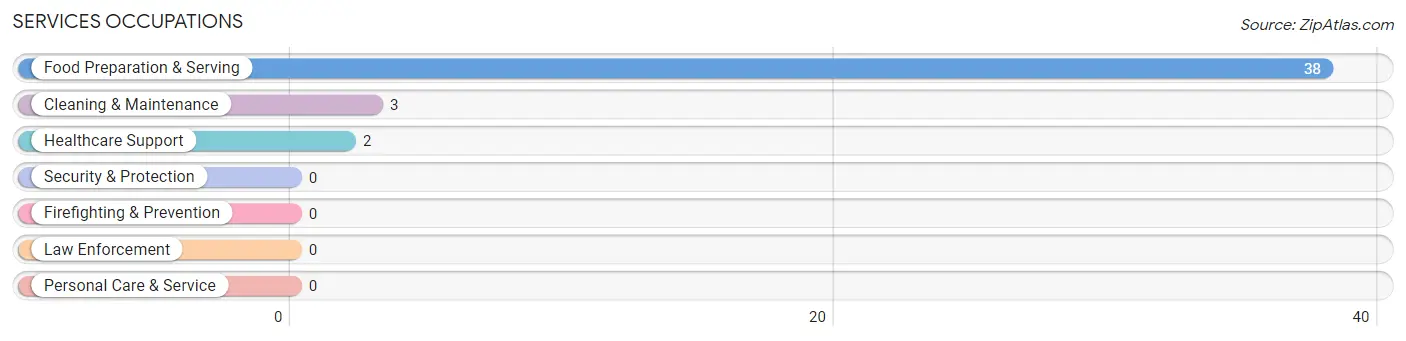
Services Occupations
The most common Services occupations in Smithville are Food Preparation & Serving (38 | 73.1%), Cleaning & Maintenance (3 | 5.8%), and Healthcare Support (2 | 3.8%).
Services Occupations by Sex
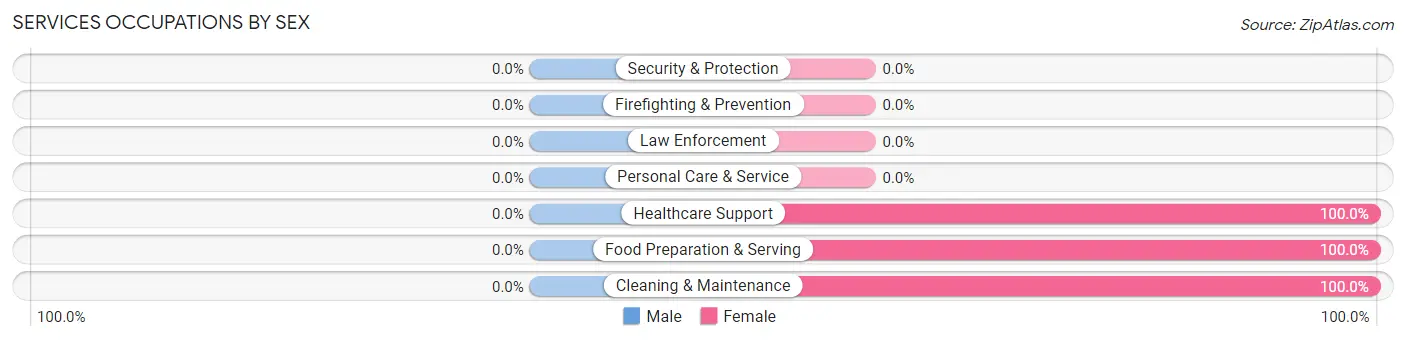
| Occupation | Male | Female |
| Healthcare Support | 0 (0.0%) | 2 (100.0%) |
| Security & Protection | 0 (0.0%) | 0 (0.0%) |
| Firefighting & Prevention | 0 (0.0%) | 0 (0.0%) |
| Law Enforcement | 0 (0.0%) | 0 (0.0%) |
| Food Preparation & Serving | 0 (0.0%) | 38 (100.0%) |
| Cleaning & Maintenance | 0 (0.0%) | 3 (100.0%) |
| Personal Care & Service | 0 (0.0%) | 0 (0.0%) |
| Total (Category) | 0 (0.0%) | 43 (100.0%) |
| Total (Overall) | 3 (5.8%) | 49 (94.2%) |
Sales and Office Occupations
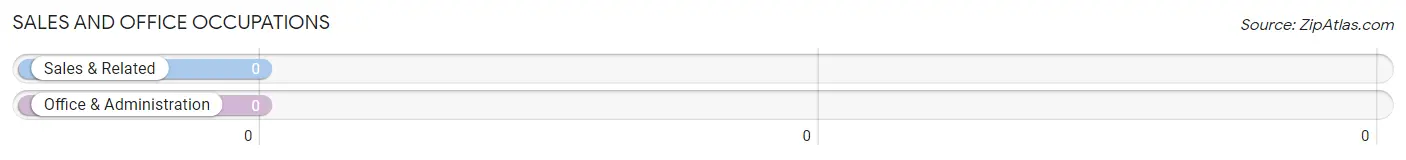
Sales and Office Occupations by Sex
| Occupation | Male | Female |
| Sales & Related | 0 (0.0%) | 0 (0.0%) |
| Office & Administration | 0 (0.0%) | 0 (0.0%) |
| Total (Category) | 0 (0.0%) | 0 (0.0%) |
| Total (Overall) | 3 (5.8%) | 49 (94.2%) |
Natural Resources, Construction and Maintenance Occupations
Natural Resources, Construction and Maintenance Occupations by Sex
| Occupation | Male | Female |
| Farming, Fishing & Forestry | 0 (0.0%) | 0 (0.0%) |
| Construction & Extraction | 0 (0.0%) | 0 (0.0%) |
| Installation, Maintenance & Repair | 0 (0.0%) | 0 (0.0%) |
| Total (Category) | 0 (0.0%) | 0 (0.0%) |
| Total (Overall) | 3 (5.8%) | 49 (94.2%) |
Production, Transportation and Moving Occupations
Production, Transportation and Moving Occupations by Sex
| Occupation | Male | Female |
| Production | 0 (0.0%) | 0 (0.0%) |
| Transportation | 0 (0.0%) | 0 (0.0%) |
| Material Moving | 0 (0.0%) | 0 (0.0%) |
| Total (Category) | 0 (0.0%) | 0 (0.0%) |
| Total (Overall) | 3 (5.8%) | 49 (94.2%) |
Employment Industries by Sex in Smithville
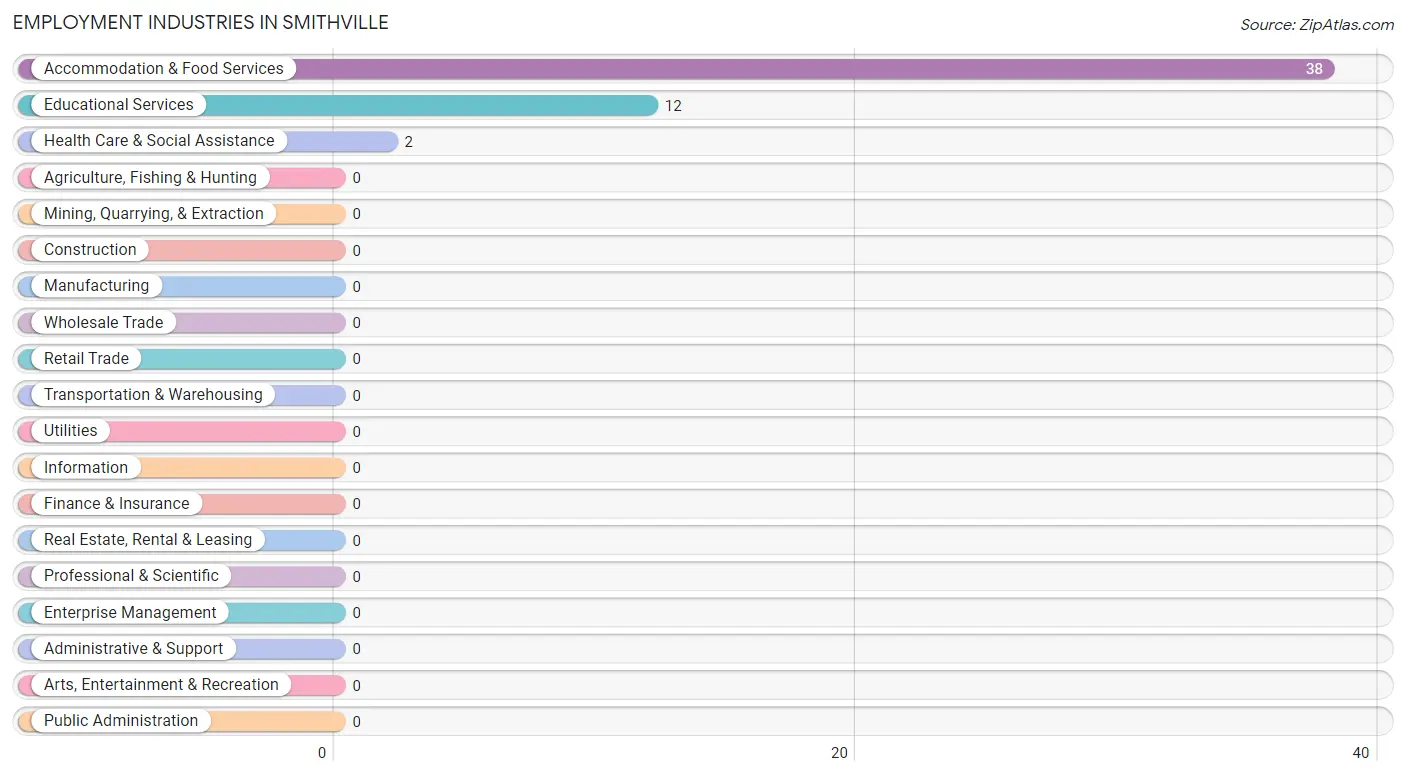
Employment Industries in Smithville
The major employment industries in Smithville include Accommodation & Food Services (38 | 73.1%), Educational Services (12 | 23.1%), and Health Care & Social Assistance (2 | 3.8%).
Employment Industries by Sex in Smithville
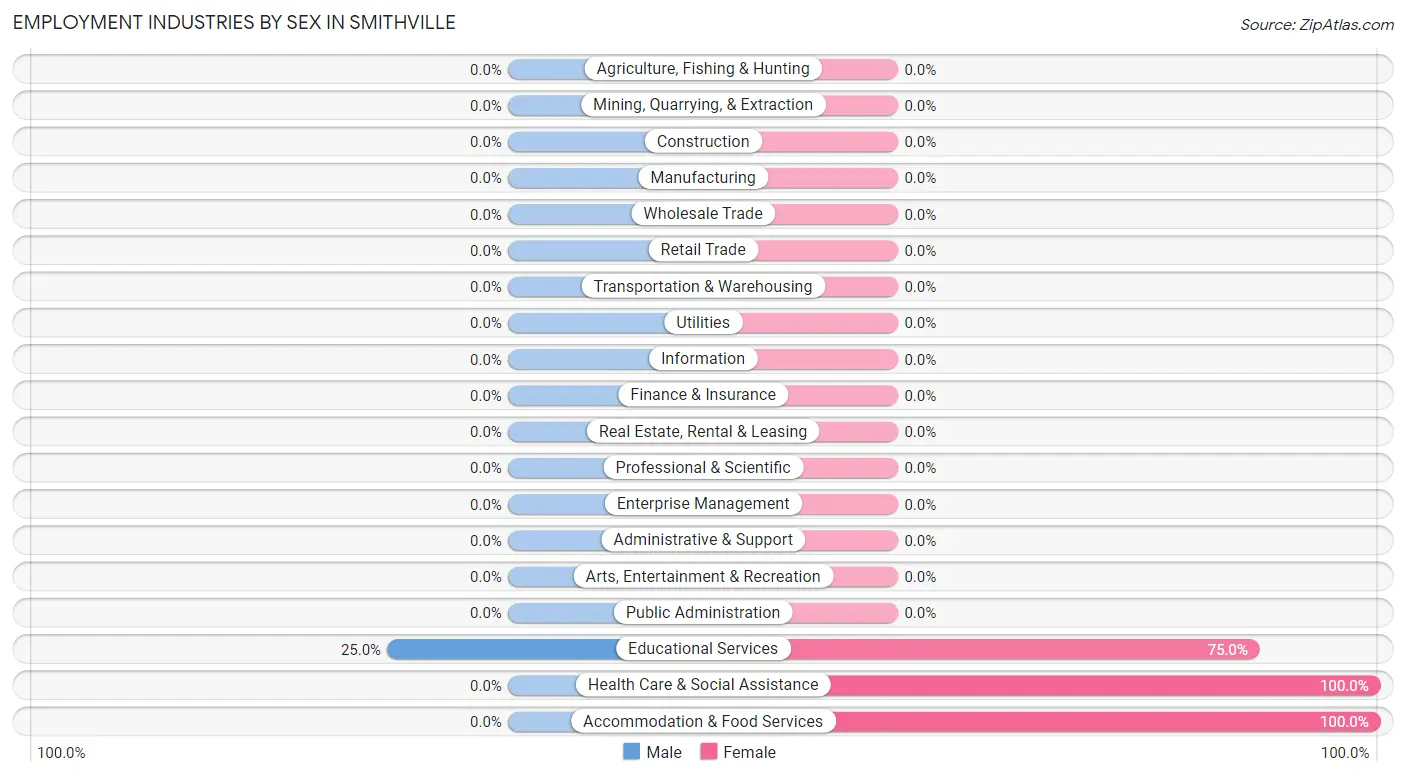
| Industry | Male | Female |
| Agriculture, Fishing & Hunting | 0 (0.0%) | 0 (0.0%) |
| Mining, Quarrying, & Extraction | 0 (0.0%) | 0 (0.0%) |
| Construction | 0 (0.0%) | 0 (0.0%) |
| Manufacturing | 0 (0.0%) | 0 (0.0%) |
| Wholesale Trade | 0 (0.0%) | 0 (0.0%) |
| Retail Trade | 0 (0.0%) | 0 (0.0%) |
| Transportation & Warehousing | 0 (0.0%) | 0 (0.0%) |
| Utilities | 0 (0.0%) | 0 (0.0%) |
| Information | 0 (0.0%) | 0 (0.0%) |
| Finance & Insurance | 0 (0.0%) | 0 (0.0%) |
| Real Estate, Rental & Leasing | 0 (0.0%) | 0 (0.0%) |
| Professional & Scientific | 0 (0.0%) | 0 (0.0%) |
| Enterprise Management | 0 (0.0%) | 0 (0.0%) |
| Administrative & Support | 0 (0.0%) | 0 (0.0%) |
| Educational Services | 3 (25.0%) | 9 (75.0%) |
| Health Care & Social Assistance | 0 (0.0%) | 2 (100.0%) |
| Arts, Entertainment & Recreation | 0 (0.0%) | 0 (0.0%) |
| Accommodation & Food Services | 0 (0.0%) | 38 (100.0%) |
| Public Administration | 0 (0.0%) | 0 (0.0%) |
| Total | 3 (5.8%) | 49 (94.2%) |
Education in Smithville
School Enrollment in Smithville
The most common levels of schooling among the 13 students in Smithville are middle school (7 | 53.8%), high school (3 | 23.1%), and graduate / professional (3 | 23.1%).
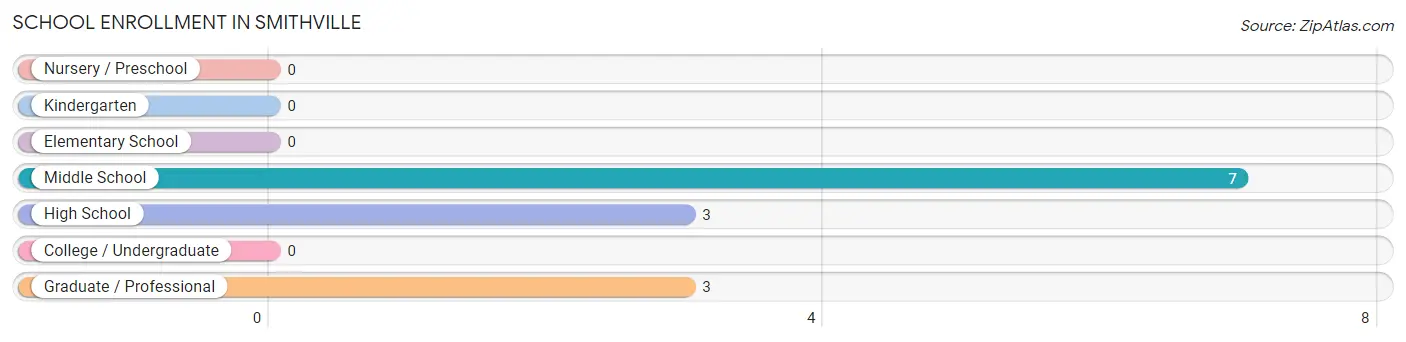
| School Level | # Students | % Students |
| Nursery / Preschool | 0 | 0.0% |
| Kindergarten | 0 | 0.0% |
| Elementary School | 0 | 0.0% |
| Middle School | 7 | 53.8% |
| High School | 3 | 23.1% |
| College / Undergraduate | 0 | 0.0% |
| Graduate / Professional | 3 | 23.1% |
| Total | 13 | 100.0% |
School Enrollment by Age by Funding Source in Smithville
Out of a total of 13 students who are enrolled in schools in Smithville, 3 (23.1%) attend a private institution, while the remaining 10 (76.9%) are enrolled in public schools. The age group of 35 years and over has the highest likelihood of being enrolled in private schools, with 3 (100.0% in the age bracket) enrolled. Conversely, the age group of 10 to 14 year olds has the lowest likelihood of being enrolled in a private school, with 7 (100.0% in the age bracket) attending a public institution.
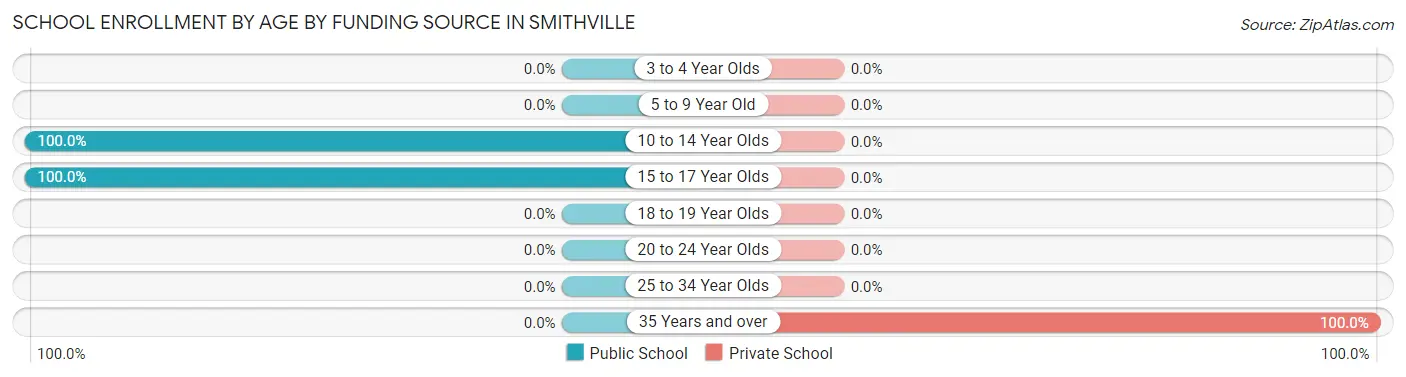
| Age Bracket | Public School | Private School |
| 3 to 4 Year Olds | 0 (0.0%) | 0 (0.0%) |
| 5 to 9 Year Old | 0 (0.0%) | 0 (0.0%) |
| 10 to 14 Year Olds | 7 (100.0%) | 0 (0.0%) |
| 15 to 17 Year Olds | 3 (100.0%) | 0 (0.0%) |
| 18 to 19 Year Olds | 0 (0.0%) | 0 (0.0%) |
| 20 to 24 Year Olds | 0 (0.0%) | 0 (0.0%) |
| 25 to 34 Year Olds | 0 (0.0%) | 0 (0.0%) |
| 35 Years and over | 0 (0.0%) | 3 (100.0%) |
| Total | 10 (76.9%) | 3 (23.1%) |
Educational Attainment by Field of Study in Smithville
Education (9 | 42.9%), arts & humanities (6 | 28.6%), physical & health sciences (3 | 14.3%), and science & technology (3 | 14.3%) are the most common fields of study among 21 individuals in Smithville who have obtained a bachelor's degree or higher.
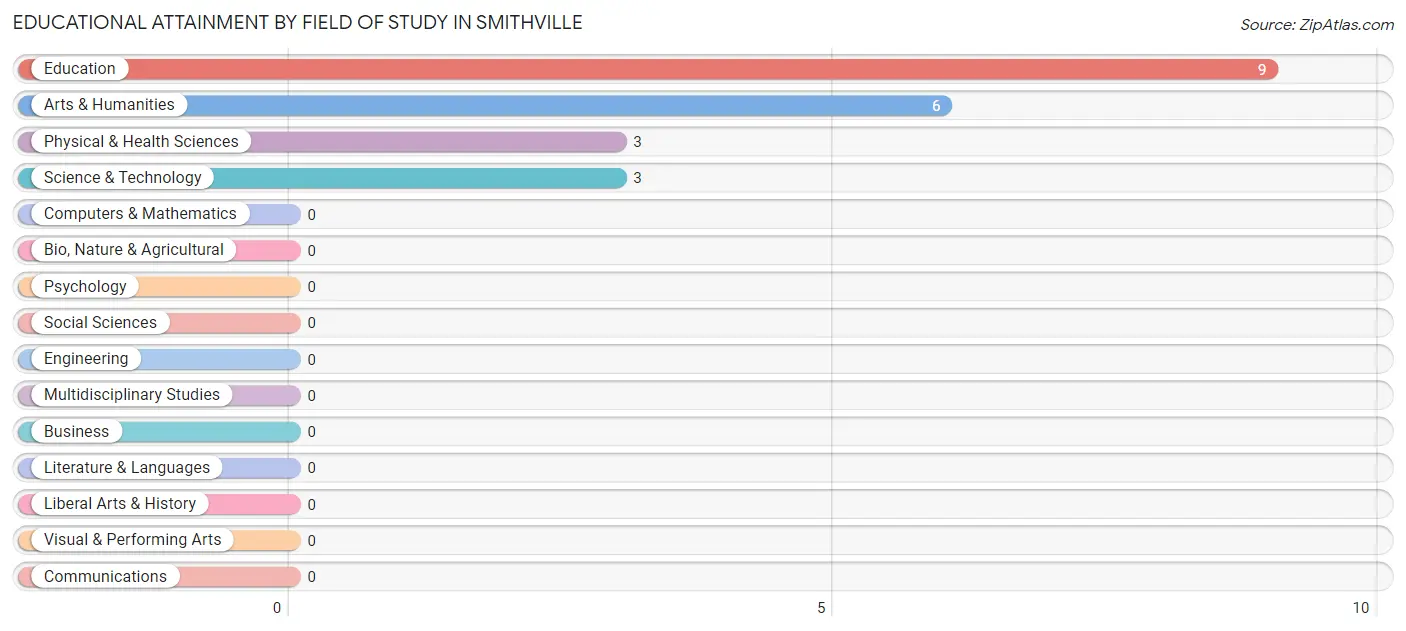
| Field of Study | # Graduates | % Graduates |
| Computers & Mathematics | 0 | 0.0% |
| Bio, Nature & Agricultural | 0 | 0.0% |
| Physical & Health Sciences | 3 | 14.3% |
| Psychology | 0 | 0.0% |
| Social Sciences | 0 | 0.0% |
| Engineering | 0 | 0.0% |
| Multidisciplinary Studies | 0 | 0.0% |
| Science & Technology | 3 | 14.3% |
| Business | 0 | 0.0% |
| Education | 9 | 42.9% |
| Literature & Languages | 0 | 0.0% |
| Liberal Arts & History | 0 | 0.0% |
| Visual & Performing Arts | 0 | 0.0% |
| Communications | 0 | 0.0% |
| Arts & Humanities | 6 | 28.6% |
| Total | 21 | 100.0% |
Transportation & Commute in Smithville
Vehicle Availability by Sex in Smithville
The most prevalent vehicle ownership categories in Smithville are males with 1 vehicle (3, accounting for 100.0%) and females with 1 vehicle (49, making up 6.1%).
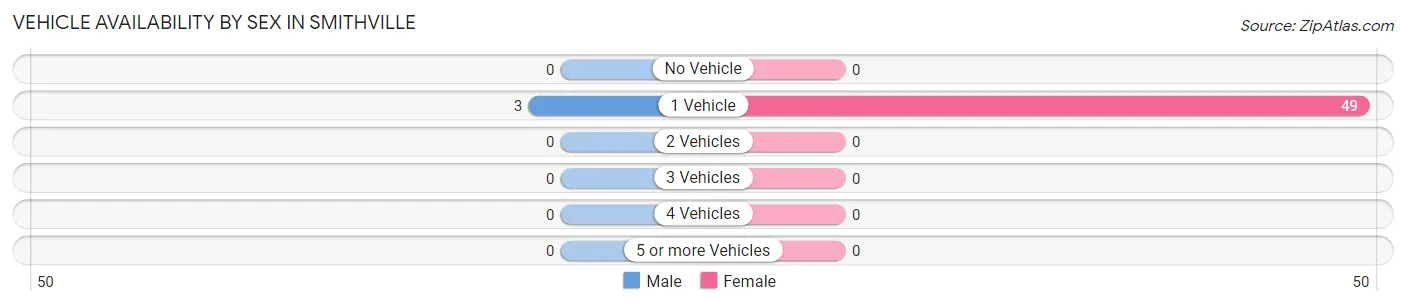
| Vehicles Available | Male | Female |
| No Vehicle | 0 (0.0%) | 0 (0.0%) |
| 1 Vehicle | 3 (100.0%) | 49 (100.0%) |
| 2 Vehicles | 0 (0.0%) | 0 (0.0%) |
| 3 Vehicles | 0 (0.0%) | 0 (0.0%) |
| 4 Vehicles | 0 (0.0%) | 0 (0.0%) |
| 5 or more Vehicles | 0 (0.0%) | 0 (0.0%) |
| Total | 3 (100.0%) | 49 (100.0%) |
Commute Time in Smithville
The most frequently occuring commute durations in Smithville are 60 to 89 minutes (38 commuters, 73.1%), less than 5 minutes (6 commuters, 11.5%), and 30 to 34 minutes (6 commuters, 11.5%).
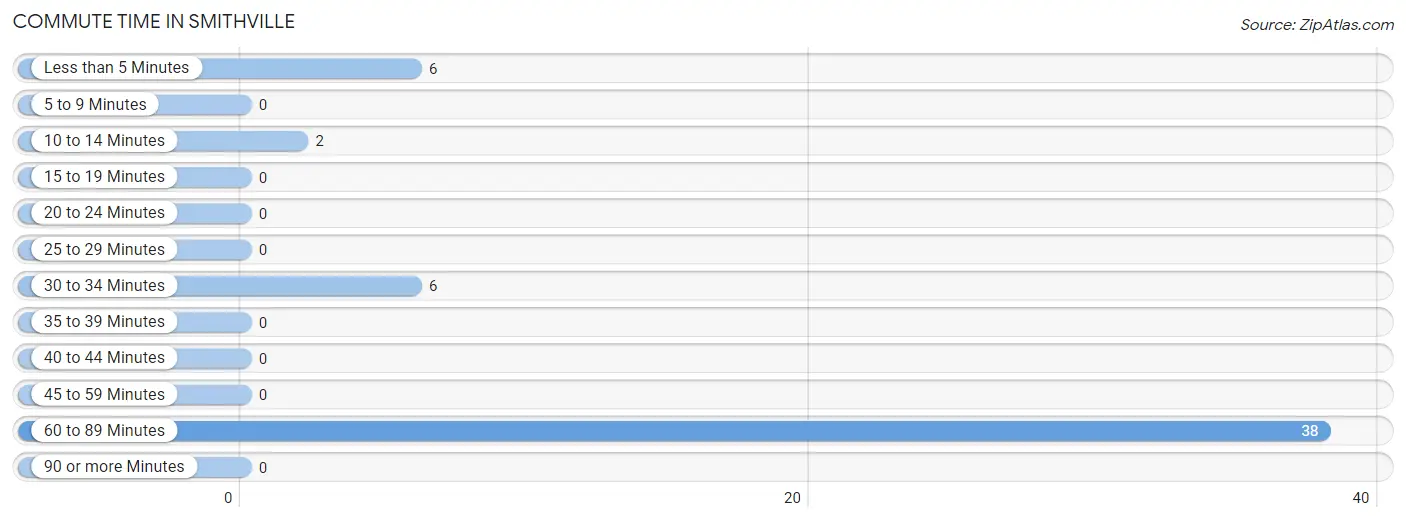
| Commute Time | # Commuters | % Commuters |
| Less than 5 Minutes | 6 | 11.5% |
| 5 to 9 Minutes | 0 | 0.0% |
| 10 to 14 Minutes | 2 | 3.8% |
| 15 to 19 Minutes | 0 | 0.0% |
| 20 to 24 Minutes | 0 | 0.0% |
| 25 to 29 Minutes | 0 | 0.0% |
| 30 to 34 Minutes | 6 | 11.5% |
| 35 to 39 Minutes | 0 | 0.0% |
| 40 to 44 Minutes | 0 | 0.0% |
| 45 to 59 Minutes | 0 | 0.0% |
| 60 to 89 Minutes | 38 | 73.1% |
| 90 or more Minutes | 0 | 0.0% |
Commute Time by Sex in Smithville
The most common commute times in Smithville are 30 to 34 minutes (3 commuters, 100.0%) for males and 60 to 89 minutes (38 commuters, 77.5%) for females.
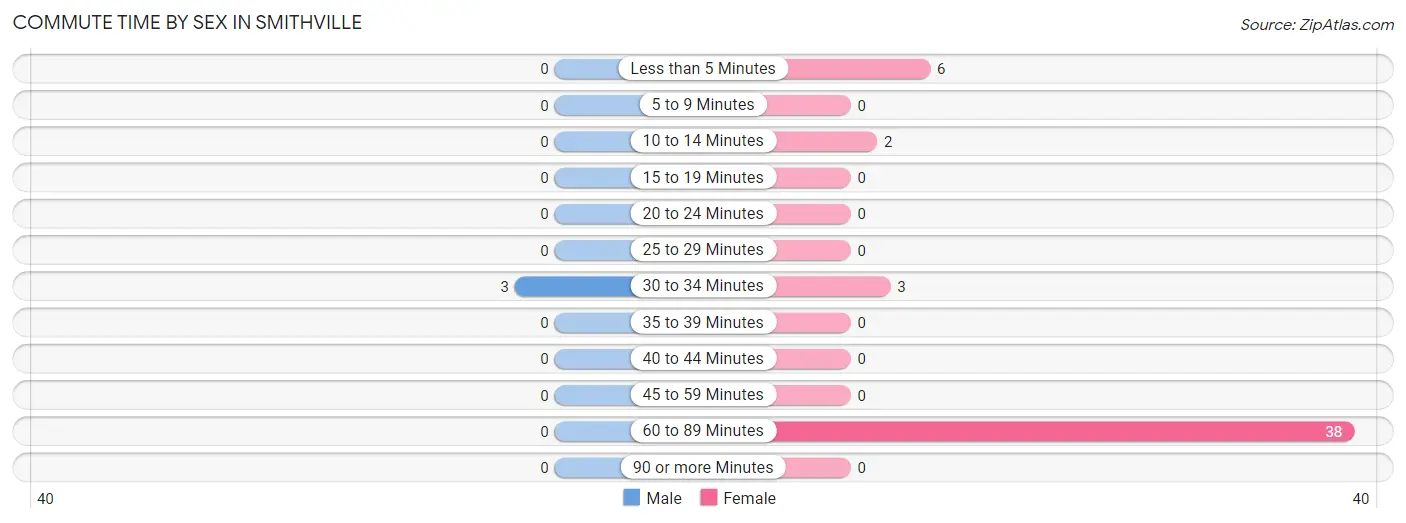
| Commute Time | Male | Female |
| Less than 5 Minutes | 0 (0.0%) | 6 (12.2%) |
| 5 to 9 Minutes | 0 (0.0%) | 0 (0.0%) |
| 10 to 14 Minutes | 0 (0.0%) | 2 (4.1%) |
| 15 to 19 Minutes | 0 (0.0%) | 0 (0.0%) |
| 20 to 24 Minutes | 0 (0.0%) | 0 (0.0%) |
| 25 to 29 Minutes | 0 (0.0%) | 0 (0.0%) |
| 30 to 34 Minutes | 3 (100.0%) | 3 (6.1%) |
| 35 to 39 Minutes | 0 (0.0%) | 0 (0.0%) |
| 40 to 44 Minutes | 0 (0.0%) | 0 (0.0%) |
| 45 to 59 Minutes | 0 (0.0%) | 0 (0.0%) |
| 60 to 89 Minutes | 0 (0.0%) | 38 (77.5%) |
| 90 or more Minutes | 0 (0.0%) | 0 (0.0%) |
Time of Departure to Work by Sex in Smithville
The most frequent times of departure to work in Smithville are 7:00 AM to 7:29 AM (3, 100.0%) for males and 7:30 AM to 7:59 AM (44, 89.8%) for females.
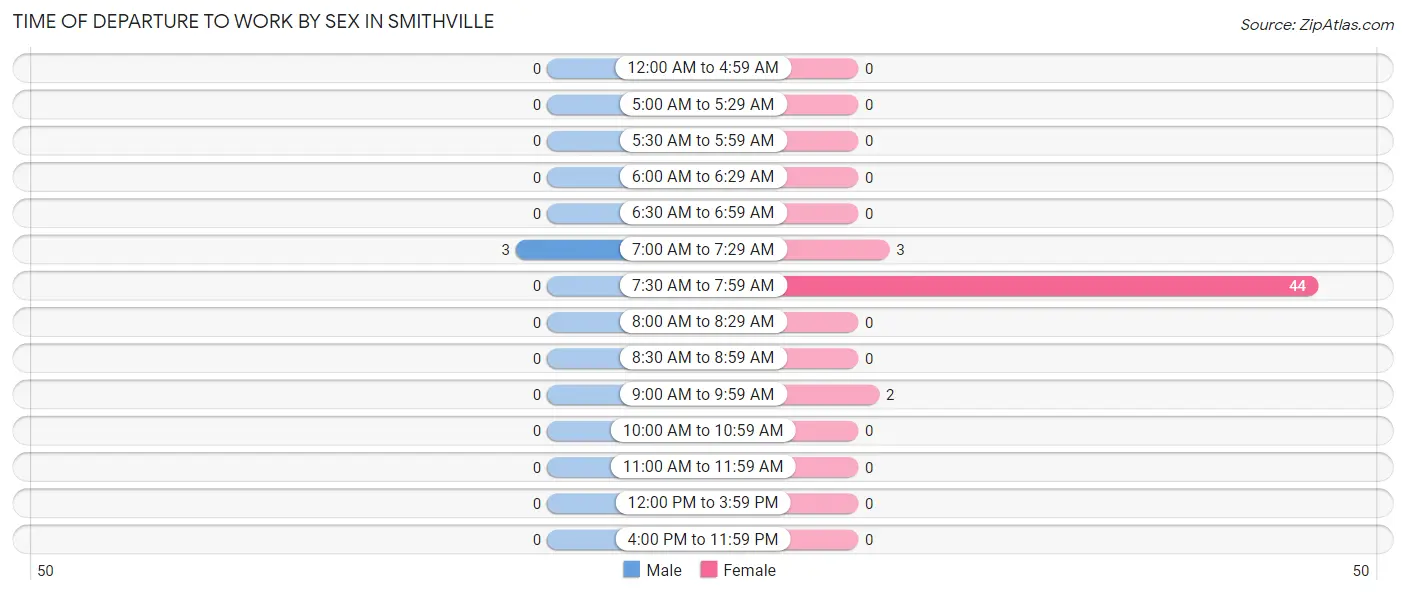
| Time of Departure | Male | Female |
| 12:00 AM to 4:59 AM | 0 (0.0%) | 0 (0.0%) |
| 5:00 AM to 5:29 AM | 0 (0.0%) | 0 (0.0%) |
| 5:30 AM to 5:59 AM | 0 (0.0%) | 0 (0.0%) |
| 6:00 AM to 6:29 AM | 0 (0.0%) | 0 (0.0%) |
| 6:30 AM to 6:59 AM | 0 (0.0%) | 0 (0.0%) |
| 7:00 AM to 7:29 AM | 3 (100.0%) | 3 (6.1%) |
| 7:30 AM to 7:59 AM | 0 (0.0%) | 44 (89.8%) |
| 8:00 AM to 8:29 AM | 0 (0.0%) | 0 (0.0%) |
| 8:30 AM to 8:59 AM | 0 (0.0%) | 0 (0.0%) |
| 9:00 AM to 9:59 AM | 0 (0.0%) | 2 (4.1%) |
| 10:00 AM to 10:59 AM | 0 (0.0%) | 0 (0.0%) |
| 11:00 AM to 11:59 AM | 0 (0.0%) | 0 (0.0%) |
| 12:00 PM to 3:59 PM | 0 (0.0%) | 0 (0.0%) |
| 4:00 PM to 11:59 PM | 0 (0.0%) | 0 (0.0%) |
| Total | 3 (100.0%) | 49 (100.0%) |
Housing Occupancy in Smithville
Occupancy by Ownership in Smithville
Of the total 66 dwellings in Smithville, owner-occupied units account for 52 (78.8%), while renter-occupied units make up 14 (21.2%).
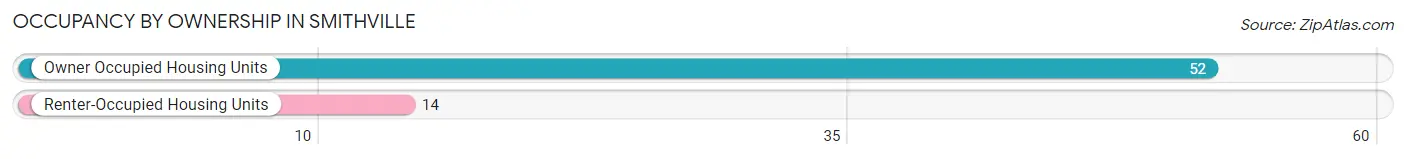
| Occupancy | # Housing Units | % Housing Units |
| Owner Occupied Housing Units | 52 | 78.8% |
| Renter-Occupied Housing Units | 14 | 21.2% |
| Total Occupied Housing Units | 66 | 100.0% |
Occupancy by Household Size in Smithville
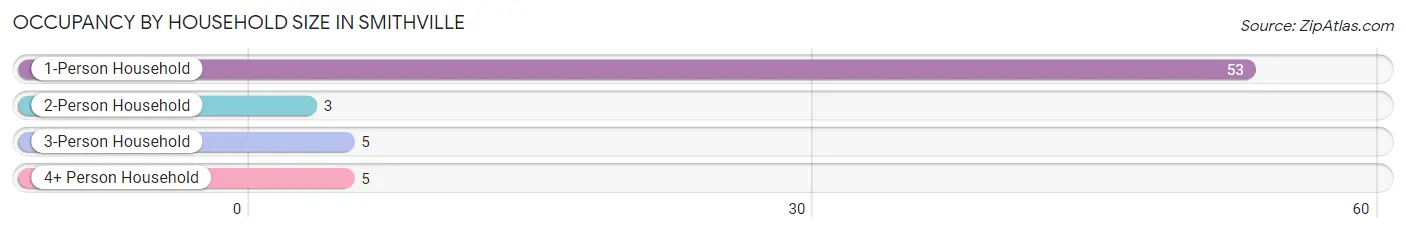
| Household Size | # Housing Units | % Housing Units |
| 1-Person Household | 53 | 80.3% |
| 2-Person Household | 3 | 4.5% |
| 3-Person Household | 5 | 7.6% |
| 4+ Person Household | 5 | 7.6% |
| Total Housing Units | 66 | 100.0% |
Occupancy by Ownership by Household Size in Smithville
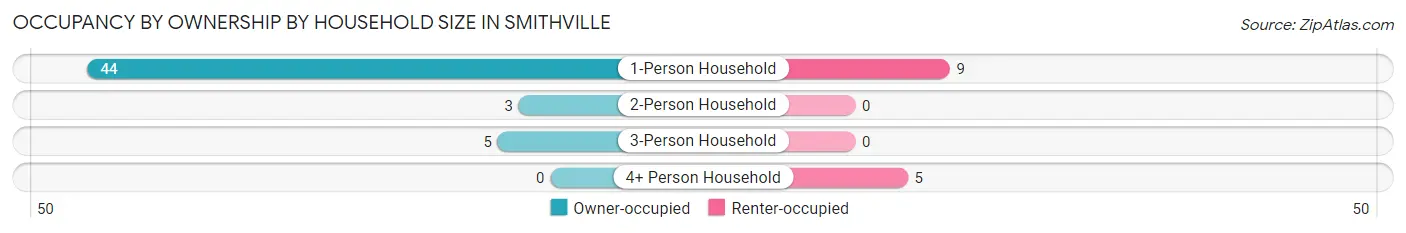
| Household Size | Owner-occupied | Renter-occupied |
| 1-Person Household | 44 (83.0%) | 9 (17.0%) |
| 2-Person Household | 3 (100.0%) | 0 (0.0%) |
| 3-Person Household | 5 (100.0%) | 0 (0.0%) |
| 4+ Person Household | 0 (0.0%) | 5 (100.0%) |
| Total Housing Units | 52 (78.8%) | 14 (21.2%) |
Occupancy by Educational Attainment in Smithville
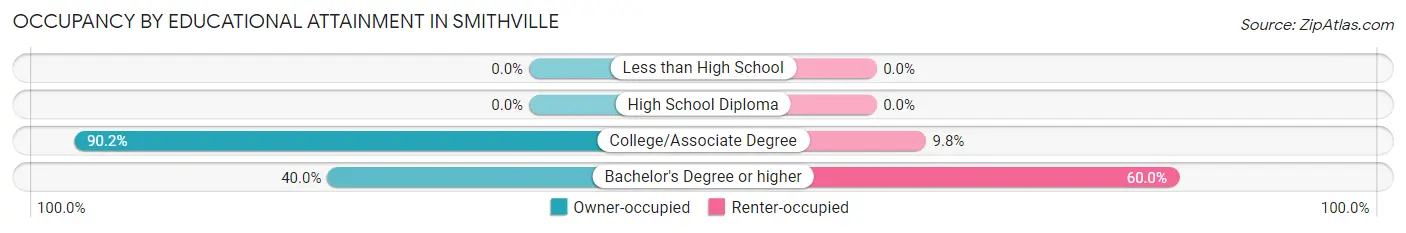
| Household Size | Owner-occupied | Renter-occupied |
| Less than High School | 0 (0.0%) | 0 (0.0%) |
| High School Diploma | 0 (0.0%) | 0 (0.0%) |
| College/Associate Degree | 46 (90.2%) | 5 (9.8%) |
| Bachelor's Degree or higher | 6 (40.0%) | 9 (60.0%) |
Occupancy by Age of Householder in Smithville
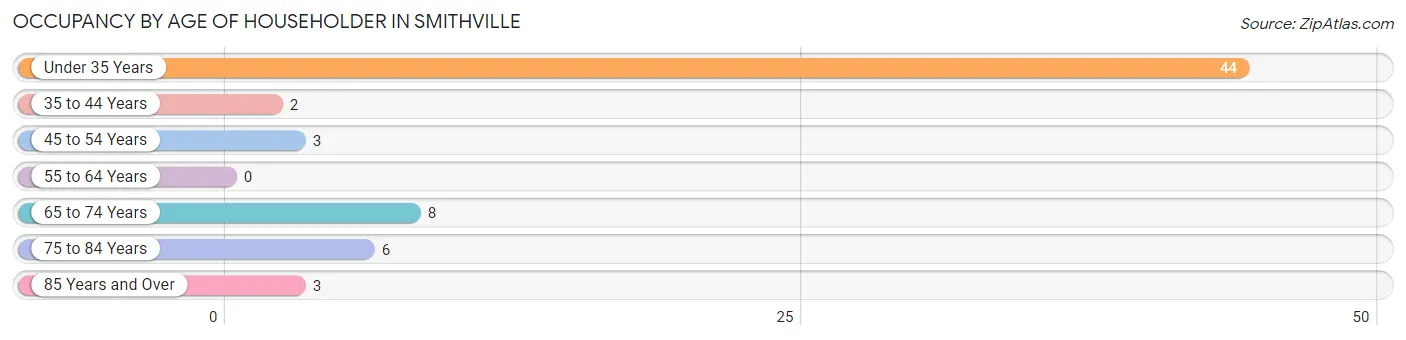
| Age Bracket | # Households | % Households |
| Under 35 Years | 44 | 66.7% |
| 35 to 44 Years | 2 | 3.0% |
| 45 to 54 Years | 3 | 4.5% |
| 55 to 64 Years | 0 | 0.0% |
| 65 to 74 Years | 8 | 12.1% |
| 75 to 84 Years | 6 | 9.1% |
| 85 Years and Over | 3 | 4.5% |
| Total | 66 | 100.0% |
Housing Finances in Smithville
Median Income by Occupancy in Smithville
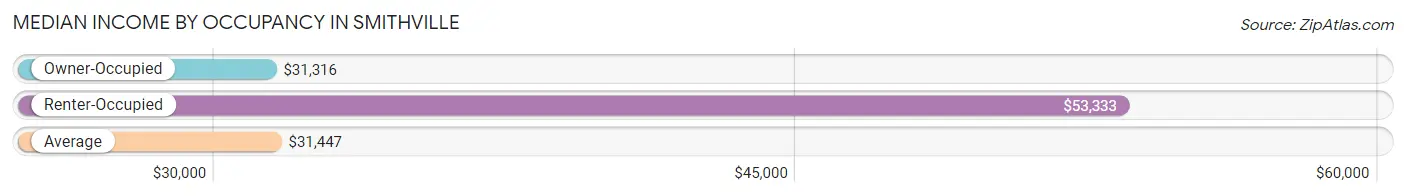
| Occupancy Type | # Households | Median Income |
| Owner-Occupied | 52 (78.8%) | $31,316 |
| Renter-Occupied | 14 (21.2%) | $53,333 |
| Average | 66 (100.0%) | $31,447 |
Occupancy by Householder Income Bracket in Smithville
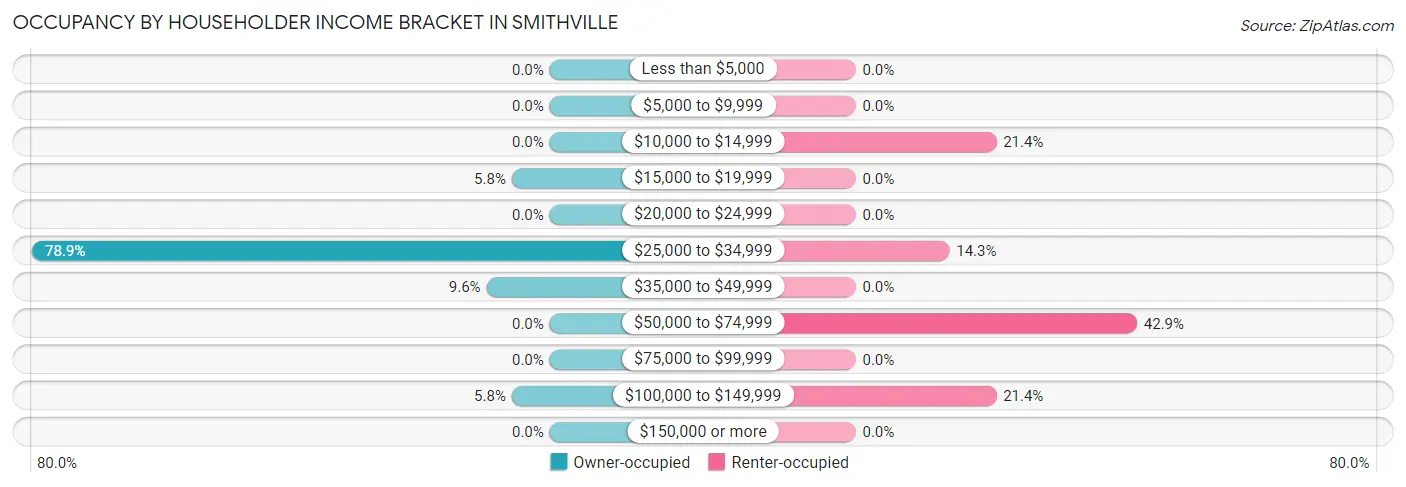
| Income Bracket | Owner-occupied | Renter-occupied |
| Less than $5,000 | 0 (0.0%) | 0 (0.0%) |
| $5,000 to $9,999 | 0 (0.0%) | 0 (0.0%) |
| $10,000 to $14,999 | 0 (0.0%) | 3 (21.4%) |
| $15,000 to $19,999 | 3 (5.8%) | 0 (0.0%) |
| $20,000 to $24,999 | 0 (0.0%) | 0 (0.0%) |
| $25,000 to $34,999 | 41 (78.8%) | 2 (14.3%) |
| $35,000 to $49,999 | 5 (9.6%) | 0 (0.0%) |
| $50,000 to $74,999 | 0 (0.0%) | 6 (42.9%) |
| $75,000 to $99,999 | 0 (0.0%) | 0 (0.0%) |
| $100,000 to $149,999 | 3 (5.8%) | 3 (21.4%) |
| $150,000 or more | 0 (0.0%) | 0 (0.0%) |
| Total | 52 (100.0%) | 14 (100.0%) |
Monthly Housing Cost Tiers in Smithville
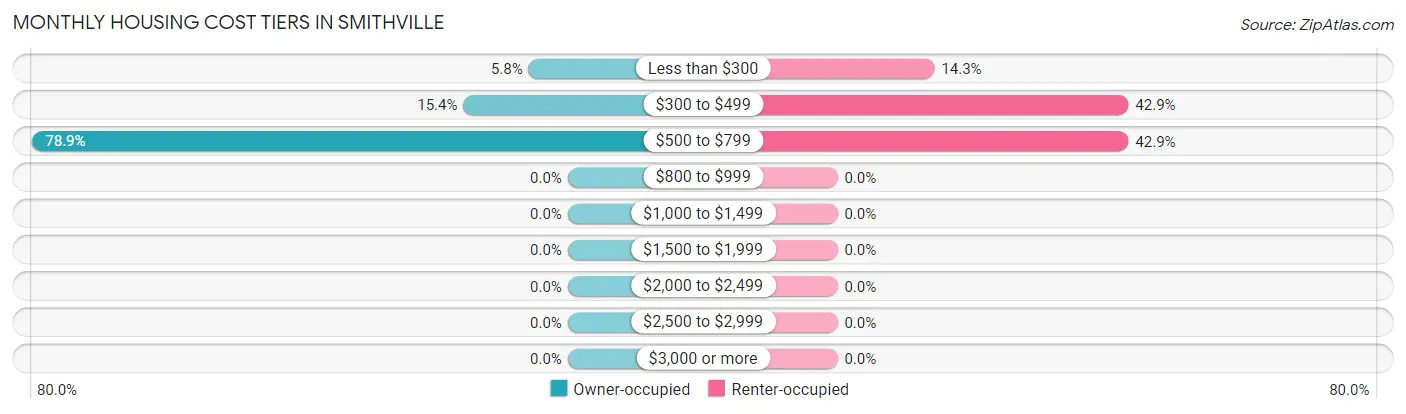
| Monthly Cost | Owner-occupied | Renter-occupied |
| Less than $300 | 3 (5.8%) | 2 (14.3%) |
| $300 to $499 | 8 (15.4%) | 6 (42.9%) |
| $500 to $799 | 41 (78.8%) | 6 (42.9%) |
| $800 to $999 | 0 (0.0%) | 0 (0.0%) |
| $1,000 to $1,499 | 0 (0.0%) | 0 (0.0%) |
| $1,500 to $1,999 | 0 (0.0%) | 0 (0.0%) |
| $2,000 to $2,499 | 0 (0.0%) | 0 (0.0%) |
| $2,500 to $2,999 | 0 (0.0%) | 0 (0.0%) |
| $3,000 or more | 0 (0.0%) | 0 (0.0%) |
| Total | 52 (100.0%) | 14 (100.0%) |
Physical Housing Characteristics in Smithville
Housing Structures in Smithville
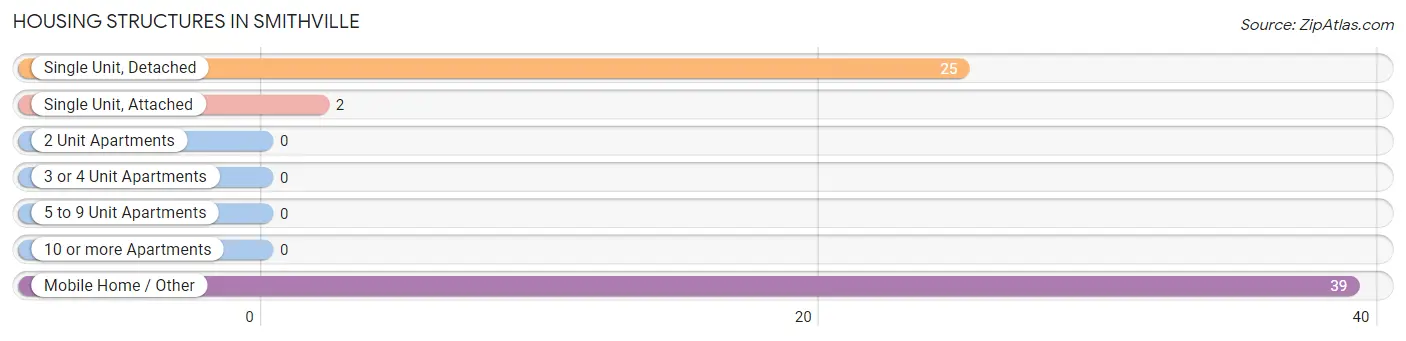
| Structure Type | # Housing Units | % Housing Units |
| Single Unit, Detached | 25 | 37.9% |
| Single Unit, Attached | 2 | 3.0% |
| 2 Unit Apartments | 0 | 0.0% |
| 3 or 4 Unit Apartments | 0 | 0.0% |
| 5 to 9 Unit Apartments | 0 | 0.0% |
| 10 or more Apartments | 0 | 0.0% |
| Mobile Home / Other | 39 | 59.1% |
| Total | 66 | 100.0% |
Housing Structures by Occupancy in Smithville
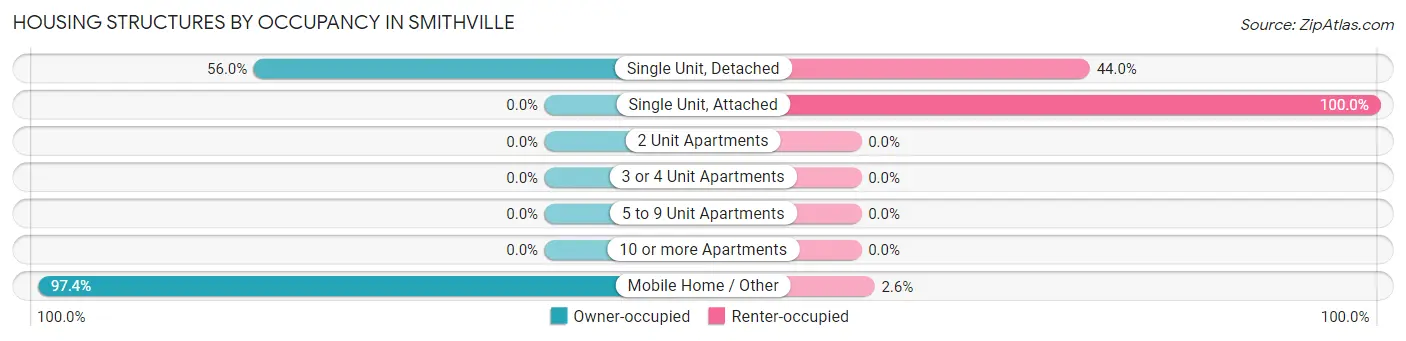
| Structure Type | Owner-occupied | Renter-occupied |
| Single Unit, Detached | 14 (56.0%) | 11 (44.0%) |
| Single Unit, Attached | 0 (0.0%) | 2 (100.0%) |
| 2 Unit Apartments | 0 (0.0%) | 0 (0.0%) |
| 3 or 4 Unit Apartments | 0 (0.0%) | 0 (0.0%) |
| 5 to 9 Unit Apartments | 0 (0.0%) | 0 (0.0%) |
| 10 or more Apartments | 0 (0.0%) | 0 (0.0%) |
| Mobile Home / Other | 38 (97.4%) | 1 (2.6%) |
| Total | 52 (78.8%) | 14 (21.2%) |
Housing Structures by Number of Rooms in Smithville
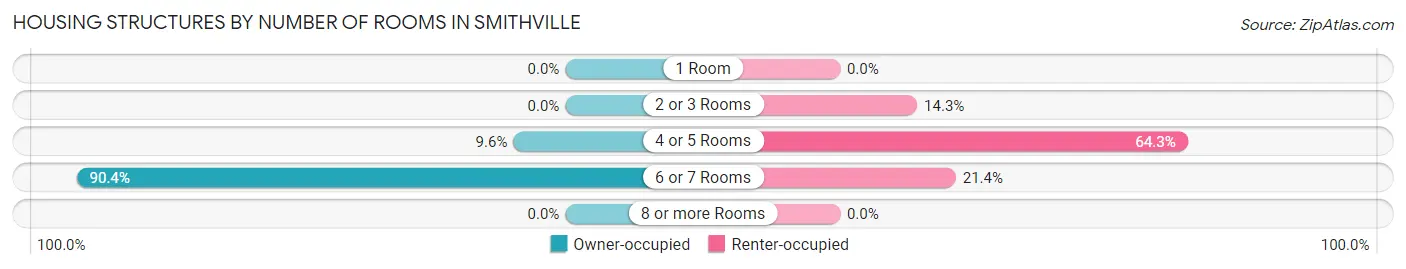
| Number of Rooms | Owner-occupied | Renter-occupied |
| 1 Room | 0 (0.0%) | 0 (0.0%) |
| 2 or 3 Rooms | 0 (0.0%) | 2 (14.3%) |
| 4 or 5 Rooms | 5 (9.6%) | 9 (64.3%) |
| 6 or 7 Rooms | 47 (90.4%) | 3 (21.4%) |
| 8 or more Rooms | 0 (0.0%) | 0 (0.0%) |
| Total | 52 (100.0%) | 14 (100.0%) |
Housing Structure by Heating Type in Smithville
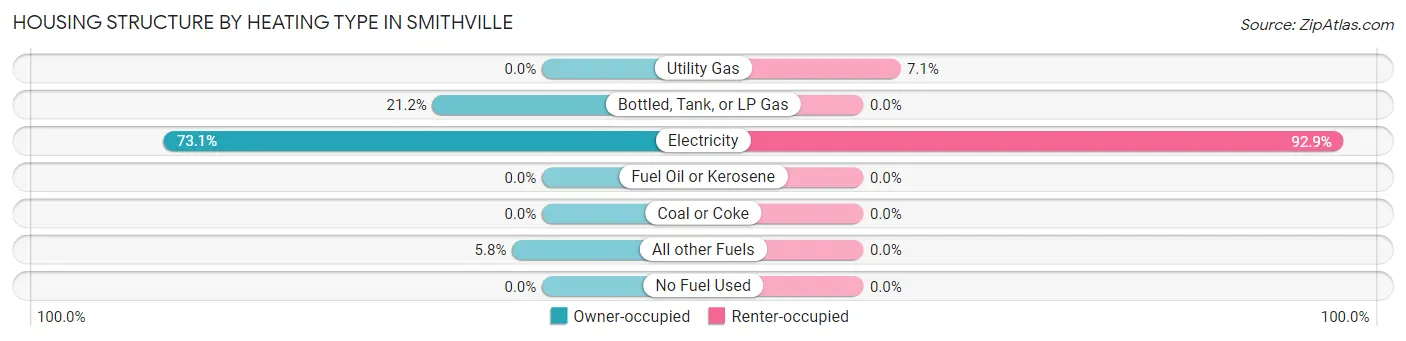
| Heating Type | Owner-occupied | Renter-occupied |
| Utility Gas | 0 (0.0%) | 1 (7.1%) |
| Bottled, Tank, or LP Gas | 11 (21.1%) | 0 (0.0%) |
| Electricity | 38 (73.1%) | 13 (92.9%) |
| Fuel Oil or Kerosene | 0 (0.0%) | 0 (0.0%) |
| Coal or Coke | 0 (0.0%) | 0 (0.0%) |
| All other Fuels | 3 (5.8%) | 0 (0.0%) |
| No Fuel Used | 0 (0.0%) | 0 (0.0%) |
| Total | 52 (100.0%) | 14 (100.0%) |
Household Vehicle Usage in Smithville
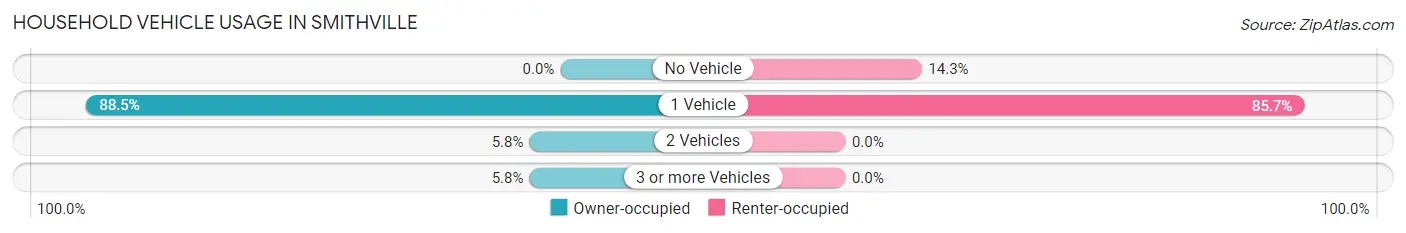
| Vehicles per Household | Owner-occupied | Renter-occupied |
| No Vehicle | 0 (0.0%) | 2 (14.3%) |
| 1 Vehicle | 46 (88.5%) | 12 (85.7%) |
| 2 Vehicles | 3 (5.8%) | 0 (0.0%) |
| 3 or more Vehicles | 3 (5.8%) | 0 (0.0%) |
| Total | 52 (100.0%) | 14 (100.0%) |
Real Estate & Mortgages in Smithville
Real Estate and Mortgage Overview in Smithville
| Characteristic | Without Mortgage | With Mortgage |
| Housing Units | 14 | 38 |
| Median Property Value | - | - |
| Median Household Income | $38,000 | $0 |
| Monthly Housing Costs | $390 | $0 |
| Real Estate Taxes | $500 | $0 |
Property Value by Mortgage Status in Smithville
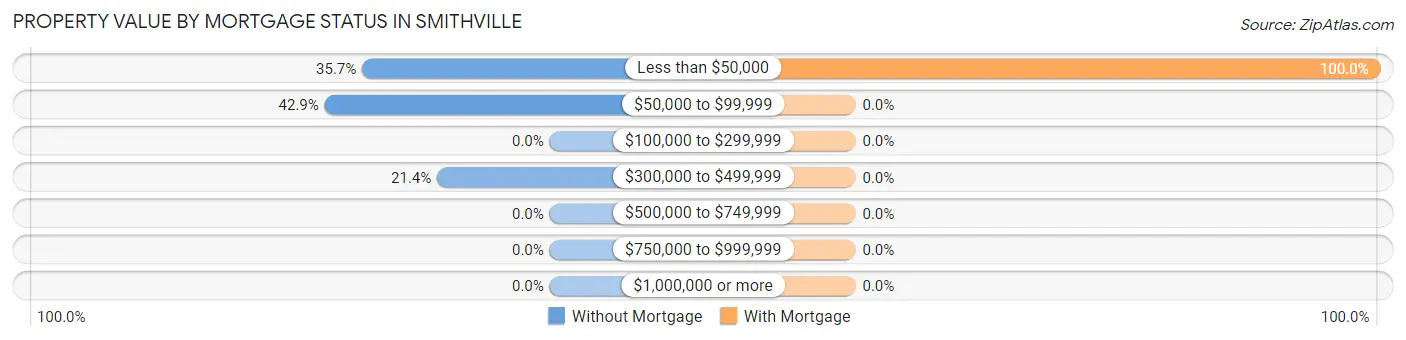
| Property Value | Without Mortgage | With Mortgage |
| Less than $50,000 | 5 (35.7%) | 38 (100.0%) |
| $50,000 to $99,999 | 6 (42.9%) | 0 (0.0%) |
| $100,000 to $299,999 | 0 (0.0%) | 0 (0.0%) |
| $300,000 to $499,999 | 3 (21.4%) | 0 (0.0%) |
| $500,000 to $749,999 | 0 (0.0%) | 0 (0.0%) |
| $750,000 to $999,999 | 0 (0.0%) | 0 (0.0%) |
| $1,000,000 or more | 0 (0.0%) | 0 (0.0%) |
| Total | 14 (100.0%) | 38 (100.0%) |
Household Income by Mortgage Status in Smithville
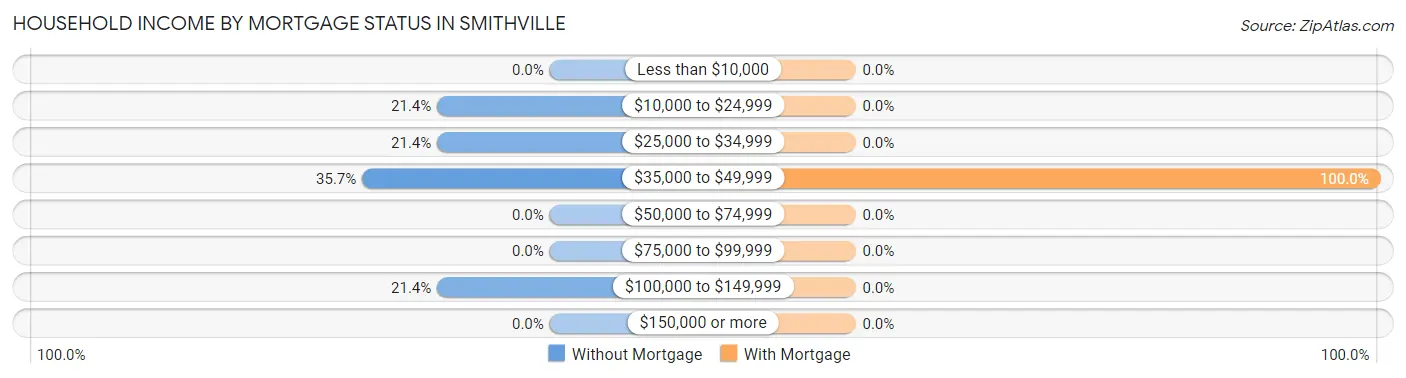
| Household Income | Without Mortgage | With Mortgage |
| Less than $10,000 | 0 (0.0%) | 0 (0.0%) |
| $10,000 to $24,999 | 3 (21.4%) | 0 (0.0%) |
| $25,000 to $34,999 | 3 (21.4%) | 0 (0.0%) |
| $35,000 to $49,999 | 5 (35.7%) | 38 (100.0%) |
| $50,000 to $74,999 | 0 (0.0%) | 0 (0.0%) |
| $75,000 to $99,999 | 0 (0.0%) | 0 (0.0%) |
| $100,000 to $149,999 | 3 (21.4%) | 0 (0.0%) |
| $150,000 or more | 0 (0.0%) | 0 (0.0%) |
| Total | 14 (100.0%) | 38 (100.0%) |
Property Value to Household Income Ratio in Smithville
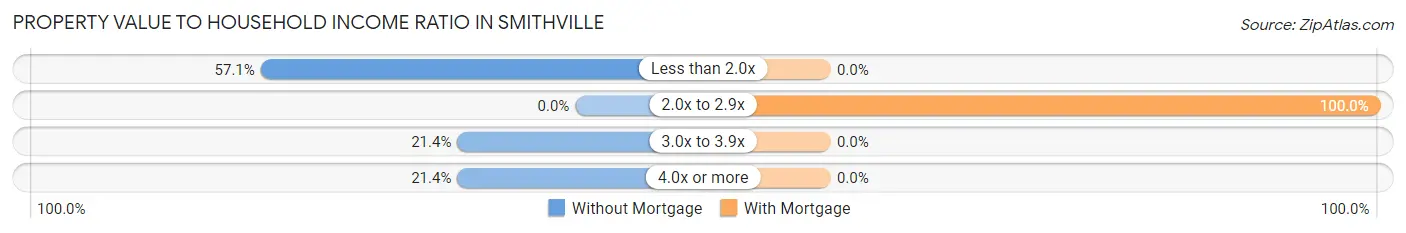
| Value-to-Income Ratio | Without Mortgage | With Mortgage |
| Less than 2.0x | 8 (57.1%) | 0 (0.0%) |
| 2.0x to 2.9x | 0 (0.0%) | 38 (100.0%) |
| 3.0x to 3.9x | 3 (21.4%) | 0 (0.0%) |
| 4.0x or more | 3 (21.4%) | 0 (0.0%) |
| Total | 14 (100.0%) | 38 (100.0%) |
Real Estate Taxes by Mortgage Status in Smithville
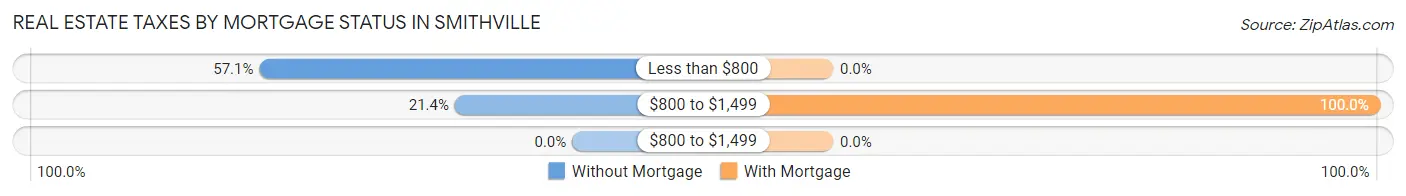
| Property Taxes | Without Mortgage | With Mortgage |
| Less than $800 | 8 (57.1%) | 0 (0.0%) |
| $800 to $1,499 | 3 (21.4%) | 38 (100.0%) |
| $800 to $1,499 | 0 (0.0%) | 0 (0.0%) |
| Total | 14 (100.0%) | 38 (100.0%) |
Health & Disability in Smithville
Health Insurance Coverage by Age in Smithville
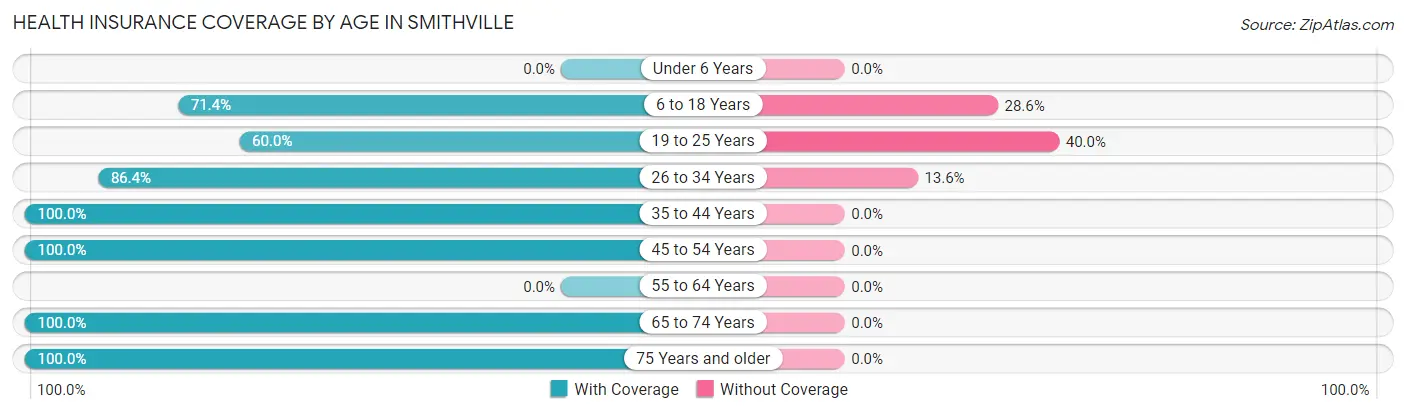
| Age Bracket | With Coverage | Without Coverage |
| Under 6 Years | 0 (0.0%) | 0 (0.0%) |
| 6 to 18 Years | 10 (71.4%) | 4 (28.6%) |
| 19 to 25 Years | 6 (60.0%) | 4 (40.0%) |
| 26 to 34 Years | 38 (86.4%) | 6 (13.6%) |
| 35 to 44 Years | 2 (100.0%) | 0 (0.0%) |
| 45 to 54 Years | 6 (100.0%) | 0 (0.0%) |
| 55 to 64 Years | 0 (0.0%) | 0 (0.0%) |
| 65 to 74 Years | 9 (100.0%) | 0 (0.0%) |
| 75 Years and older | 12 (100.0%) | 0 (0.0%) |
| Total | 83 (85.6%) | 14 (14.4%) |
Health Insurance Coverage by Citizenship Status in Smithville
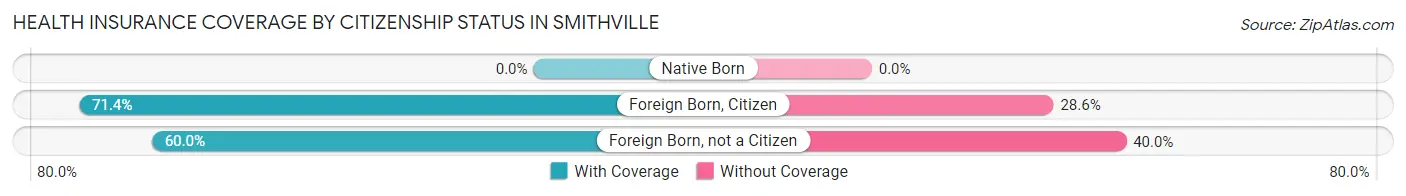
| Citizenship Status | With Coverage | Without Coverage |
| Native Born | 0 (0.0%) | 0 (0.0%) |
| Foreign Born, Citizen | 10 (71.4%) | 4 (28.6%) |
| Foreign Born, not a Citizen | 6 (60.0%) | 4 (40.0%) |
Health Insurance Coverage by Household Income in Smithville
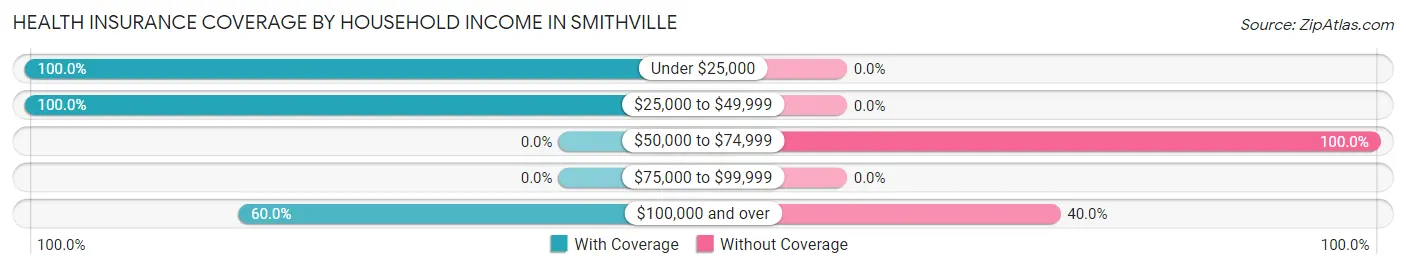
| Household Income | With Coverage | Without Coverage |
| Under $25,000 | 6 (100.0%) | 0 (0.0%) |
| $25,000 to $49,999 | 65 (100.0%) | 0 (0.0%) |
| $50,000 to $74,999 | 0 (0.0%) | 6 (100.0%) |
| $75,000 to $99,999 | 0 (0.0%) | 0 (0.0%) |
| $100,000 and over | 12 (60.0%) | 8 (40.0%) |
Public vs Private Health Insurance Coverage by Age in Smithville
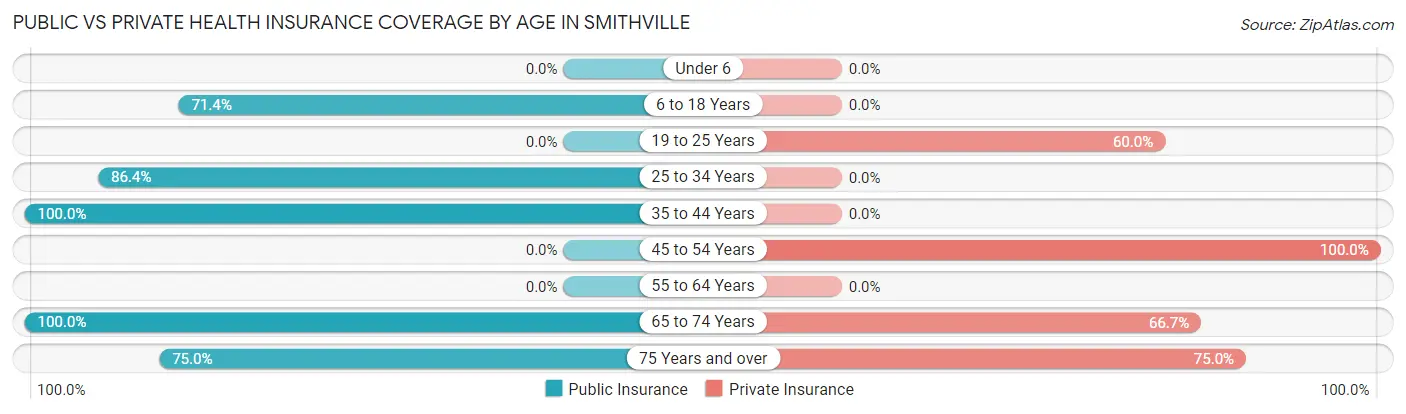
| Age Bracket | Public Insurance | Private Insurance |
| Under 6 | 0 (0.0%) | 0 (0.0%) |
| 6 to 18 Years | 10 (71.4%) | 0 (0.0%) |
| 19 to 25 Years | 0 (0.0%) | 6 (60.0%) |
| 25 to 34 Years | 38 (86.4%) | 0 (0.0%) |
| 35 to 44 Years | 2 (100.0%) | 0 (0.0%) |
| 45 to 54 Years | 0 (0.0%) | 6 (100.0%) |
| 55 to 64 Years | 0 (0.0%) | 0 (0.0%) |
| 65 to 74 Years | 9 (100.0%) | 6 (66.7%) |
| 75 Years and over | 9 (75.0%) | 9 (75.0%) |
| Total | 68 (70.1%) | 27 (27.8%) |
Disability Status by Sex by Age in Smithville
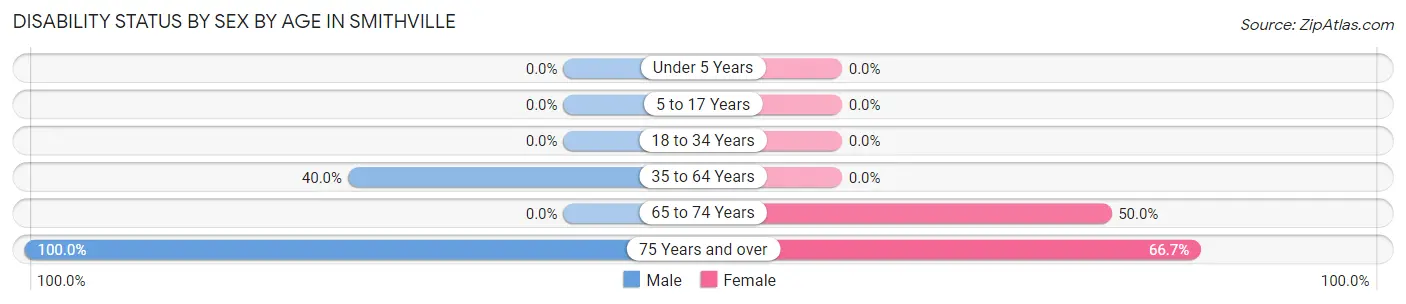
| Age Bracket | Male | Female |
| Under 5 Years | 0 (0.0%) | 0 (0.0%) |
| 5 to 17 Years | 0 (0.0%) | 0 (0.0%) |
| 18 to 34 Years | 0 (0.0%) | 0 (0.0%) |
| 35 to 64 Years | 2 (40.0%) | 0 (0.0%) |
| 65 to 74 Years | 0 (0.0%) | 2 (50.0%) |
| 75 Years and over | 3 (100.0%) | 6 (66.7%) |
Disability Class by Sex by Age in Smithville
Disability Class: Hearing Difficulty
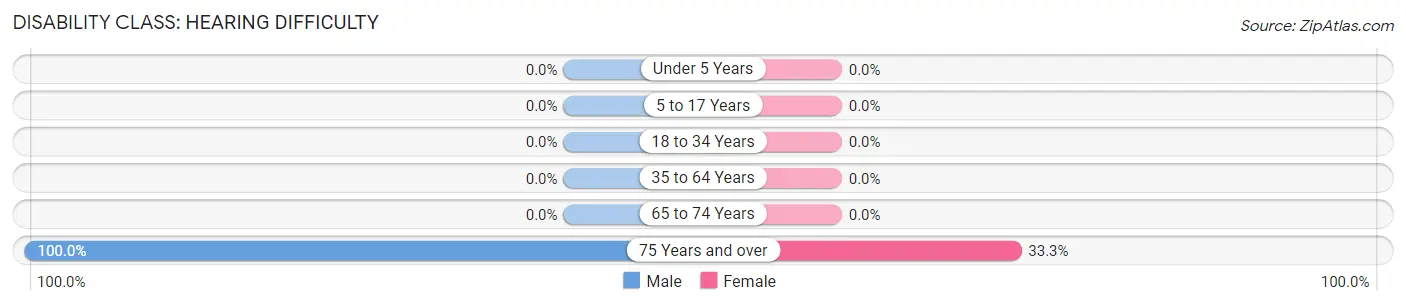
| Age Bracket | Male | Female |
| Under 5 Years | 0 (0.0%) | 0 (0.0%) |
| 5 to 17 Years | 0 (0.0%) | 0 (0.0%) |
| 18 to 34 Years | 0 (0.0%) | 0 (0.0%) |
| 35 to 64 Years | 0 (0.0%) | 0 (0.0%) |
| 65 to 74 Years | 0 (0.0%) | 0 (0.0%) |
| 75 Years and over | 3 (100.0%) | 3 (33.3%) |
Disability Class: Vision Difficulty
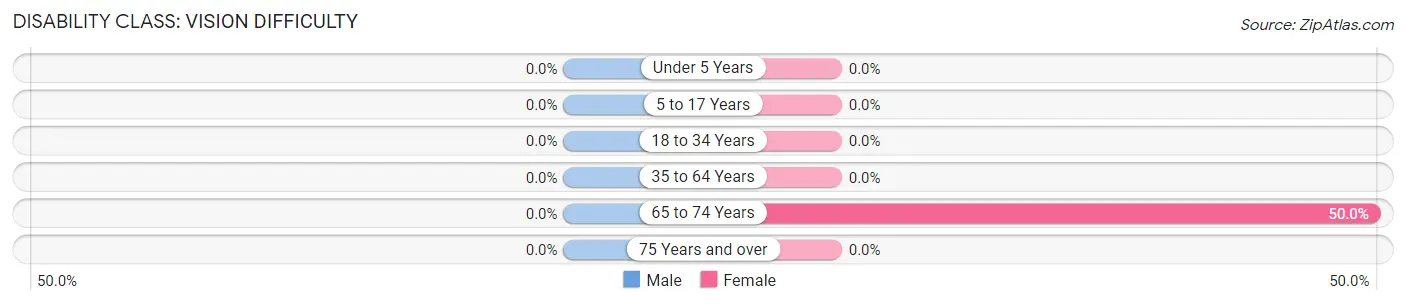
| Age Bracket | Male | Female |
| Under 5 Years | 0 (0.0%) | 0 (0.0%) |
| 5 to 17 Years | 0 (0.0%) | 0 (0.0%) |
| 18 to 34 Years | 0 (0.0%) | 0 (0.0%) |
| 35 to 64 Years | 0 (0.0%) | 0 (0.0%) |
| 65 to 74 Years | 0 (0.0%) | 2 (50.0%) |
| 75 Years and over | 0 (0.0%) | 0 (0.0%) |
Disability Class: Cognitive Difficulty
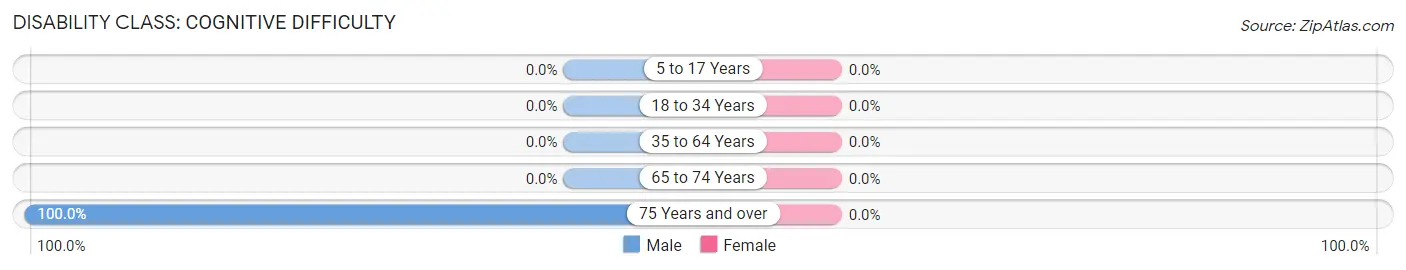
| Age Bracket | Male | Female |
| 5 to 17 Years | 0 (0.0%) | 0 (0.0%) |
| 18 to 34 Years | 0 (0.0%) | 0 (0.0%) |
| 35 to 64 Years | 0 (0.0%) | 0 (0.0%) |
| 65 to 74 Years | 0 (0.0%) | 0 (0.0%) |
| 75 Years and over | 3 (100.0%) | 0 (0.0%) |
Disability Class: Ambulatory Difficulty
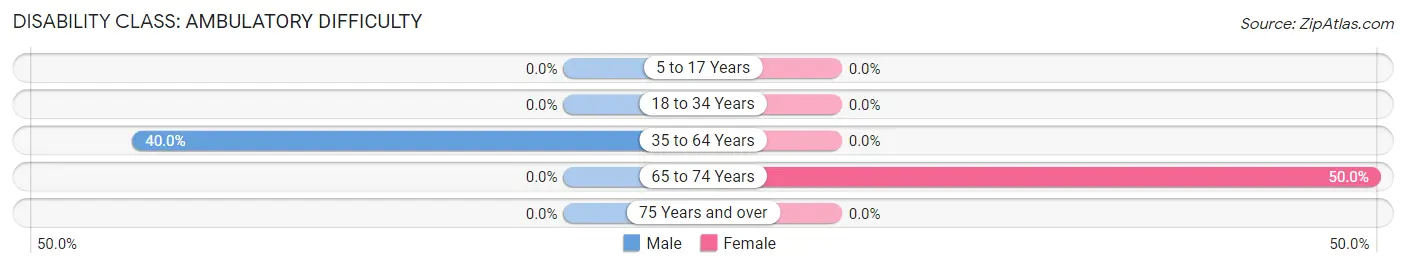
| Age Bracket | Male | Female |
| 5 to 17 Years | 0 (0.0%) | 0 (0.0%) |
| 18 to 34 Years | 0 (0.0%) | 0 (0.0%) |
| 35 to 64 Years | 2 (40.0%) | 0 (0.0%) |
| 65 to 74 Years | 0 (0.0%) | 2 (50.0%) |
| 75 Years and over | 0 (0.0%) | 0 (0.0%) |
Disability Class: Self-Care Difficulty
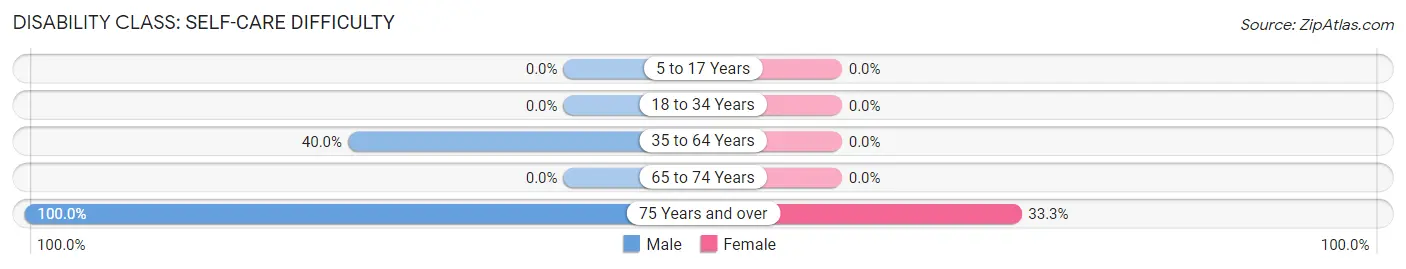
| Age Bracket | Male | Female |
| 5 to 17 Years | 0 (0.0%) | 0 (0.0%) |
| 18 to 34 Years | 0 (0.0%) | 0 (0.0%) |
| 35 to 64 Years | 2 (40.0%) | 0 (0.0%) |
| 65 to 74 Years | 0 (0.0%) | 0 (0.0%) |
| 75 Years and over | 3 (100.0%) | 3 (33.3%) |
Technology Access in Smithville
Computing Device Access in Smithville
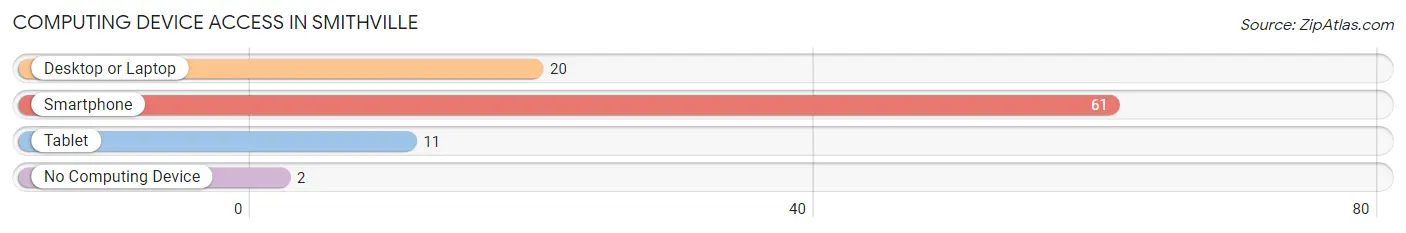
| Device Type | # Households | % Households |
| Desktop or Laptop | 20 | 30.3% |
| Smartphone | 61 | 92.4% |
| Tablet | 11 | 16.7% |
| No Computing Device | 2 | 3.0% |
| Total | 66 | 100.0% |
Internet Access in Smithville
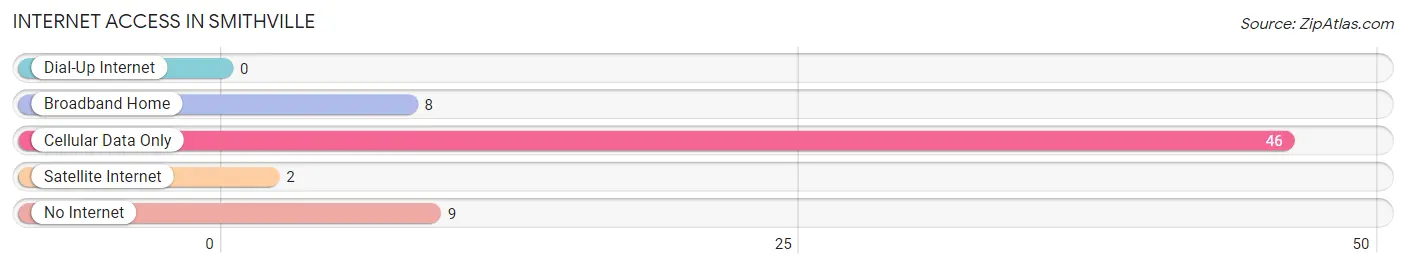
| Internet Type | # Households | % Households |
| Dial-Up Internet | 0 | 0.0% |
| Broadband Home | 8 | 12.1% |
| Cellular Data Only | 46 | 69.7% |
| Satellite Internet | 2 | 3.0% |
| No Internet | 9 | 13.6% |
| Total | 66 | 100.0% |
Smithville Summary
History
The town of Smithville, Oklahoma is located in the southeastern part of the state, in the county of Latimer. It is situated on the banks of the Kiamichi River, and is surrounded by the Ouachita National Forest. The town was founded in 1891 by a group of settlers from Arkansas, led by William Smith. The town was named after Smith, and was originally known as Smith’s Crossing.
The town was initially a farming community, and the settlers grew cotton, corn, and other crops. The town also had a sawmill, which provided lumber for the construction of homes and other buildings. The town was also home to a number of businesses, including a general store, a blacksmith shop, and a hotel.
In the early 1900s, the town began to grow and develop. The railroad arrived in 1906, and the town was incorporated in 1907. The town was also home to a number of churches, including the First Baptist Church, which was founded in 1908.
The town continued to grow and prosper throughout the 20th century. In the 1950s, the town was home to a number of businesses, including a grocery store, a hardware store, and a movie theater. The town also had a number of schools, including Smithville High School, which was founded in 1954.
In the late 20th century, the town began to decline. The railroad closed in the 1970s, and many of the businesses in the town closed as well. The population of the town began to decline, and by the 2000 census, the population was just over 500.
Geography
Smithville is located in the southeastern part of Oklahoma, in Latimer County. It is situated on the banks of the Kiamichi River, and is surrounded by the Ouachita National Forest. The town is located at an elevation of 590 feet above sea level.
The town has a total area of 1.2 square miles, all of which is land. The town is located in a humid subtropical climate zone, and has hot, humid summers and mild winters. The average annual temperature is around 65 degrees Fahrenheit, and the average annual precipitation is around 45 inches.
Economy
The economy of Smithville is largely based on agriculture. The town is home to a number of farms, which grow cotton, corn, soybeans, and other crops. The town also has a number of businesses, including a grocery store, a hardware store, and a movie theater.
The town is also home to a number of manufacturing companies, including a furniture factory and a plastics factory. The town is also home to a number of service-based businesses, including a number of restaurants and a hotel.
Demographics
According to the 2000 census, the population of Smithville was 514. The racial makeup of the town was 97.3% White, 0.6% African American, 0.2% Native American, 0.2% Asian, and 1.7% from other races. The median household income was $25,000, and the median family income was $30,000.
The town is home to a number of churches, including the First Baptist Church, which was founded in 1908. The town is also home to a number of schools, including Smithville High School, which was founded in 1954.
Common Questions
What is Per Capita Income in Smithville?
Per Capita income in Smithville is $27,207.
What is the Median Household income in Smithville?
Median Household Income in Smithville is $31,447.
What is Inequality or Gini Index in Smithville?
Inequality or Gini Index in Smithville is 0.27.
What is the Total Population of Smithville?
Total Population of Smithville is 97.
What is the Total Male Population of Smithville?
Total Male Population of Smithville is 24.
What is the Total Female Population of Smithville?
Total Female Population of Smithville is 73.
What is the Ratio of Males per 100 Females in Smithville?
There are 32.88 Males per 100 Females in Smithville.
What is the Ratio of Females per 100 Males in Smithville?
There are 304.17 Females per 100 Males in Smithville.
What is the Median Population Age in Smithville?
Median Population Age in Smithville is 28.5 Years.
What is the Average Family Size in Smithville
Average Family Size in Smithville is 2.8 People.
What is the Average Household Size in Smithville
Average Household Size in Smithville is 1.5 People.
How Large is the Labor Force in Smithville?
There are 52 People in the Labor Forcein in Smithville.
What is the Percentage of People in the Labor Force in Smithville?
59.8% of People are in the Labor Force in Smithville.