Marathon, TX Map & Demographics
Marathon Map
Marathon Overview
$32,833
PER CAPITA INCOME
$43,824
AVG FAMILY INCOME
$42,843
AVG HOUSEHOLD INCOME
10.0%
WAGE / INCOME GAP [ % ]
90.0¢/ $1
WAGE / INCOME GAP [ $ ]
0.39
INEQUALITY / GINI INDEX
275
TOTAL POPULATION
89
MALE POPULATION
186
FEMALE POPULATION
47.85
MALES / 100 FEMALES
208.99
FEMALES / 100 MALES
51.5
MEDIAN AGE
1.8
AVG FAMILY SIZE
1.6
AVG HOUSEHOLD SIZE
154
LABOR FORCE [ PEOPLE ]
66.4%
PERCENT IN LABOR FORCE
Marathon Zip Codes
Marathon Area Codes
Income in Marathon
Income Overview in Marathon
Per Capita Income in Marathon is $32,833, while median incomes of families and households are $43,824 and $42,843 respectively.
| Characteristic | Number | Measure |
| Per Capita Income | 275 | $32,833 |
| Median Family Income | 134 | $43,824 |
| Mean Family Income | 134 | $62,488 |
| Median Household Income | 174 | $42,843 |
| Mean Household Income | 174 | $52,502 |
| Income Deficit | 134 | $0 |
| Wage / Income Gap (%) | 275 | 10.04% |
| Wage / Income Gap ($) | 275 | 89.96¢ per $1 |
| Gini / Inequality Index | 275 | 0.39 |
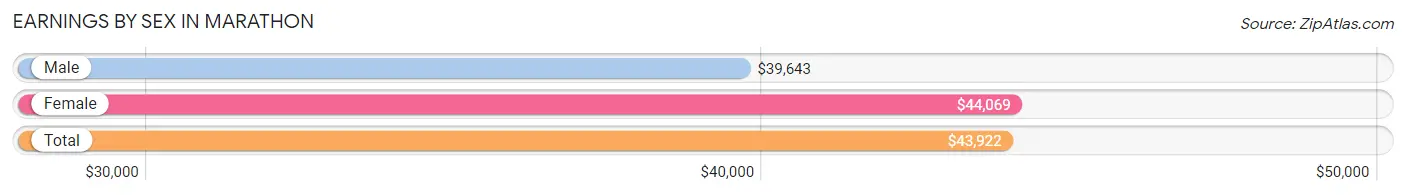
Earnings by Sex in Marathon
Average Earnings in Marathon are $43,922, $39,643 for men and $44,069 for women, a difference of 10.0%.
| Sex | Number | Average Earnings |
| Male | 68 (44.2%) | $39,643 |
| Female | 86 (55.8%) | $44,069 |
| Total | 154 (100.0%) | $43,922 |
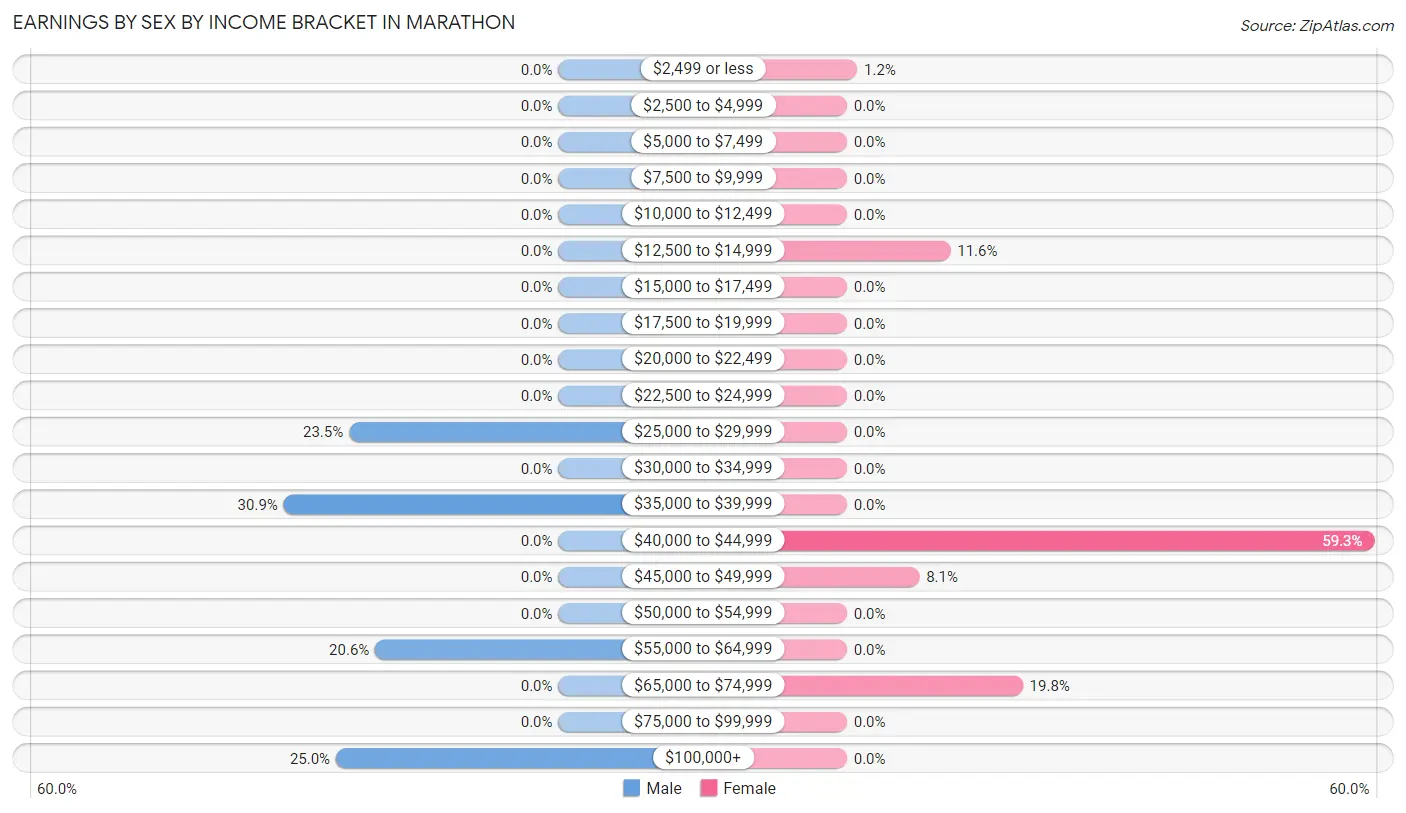
Earnings by Sex by Income Bracket in Marathon
The most common earnings brackets in Marathon are $35,000 to $39,999 for men (21 | 30.9%) and $40,000 to $44,999 for women (51 | 59.3%).
| Income | Male | Female |
| $2,499 or less | 0 (0.0%) | 1 (1.2%) |
| $2,500 to $4,999 | 0 (0.0%) | 0 (0.0%) |
| $5,000 to $7,499 | 0 (0.0%) | 0 (0.0%) |
| $7,500 to $9,999 | 0 (0.0%) | 0 (0.0%) |
| $10,000 to $12,499 | 0 (0.0%) | 0 (0.0%) |
| $12,500 to $14,999 | 0 (0.0%) | 10 (11.6%) |
| $15,000 to $17,499 | 0 (0.0%) | 0 (0.0%) |
| $17,500 to $19,999 | 0 (0.0%) | 0 (0.0%) |
| $20,000 to $22,499 | 0 (0.0%) | 0 (0.0%) |
| $22,500 to $24,999 | 0 (0.0%) | 0 (0.0%) |
| $25,000 to $29,999 | 16 (23.5%) | 0 (0.0%) |
| $30,000 to $34,999 | 0 (0.0%) | 0 (0.0%) |
| $35,000 to $39,999 | 21 (30.9%) | 0 (0.0%) |
| $40,000 to $44,999 | 0 (0.0%) | 51 (59.3%) |
| $45,000 to $49,999 | 0 (0.0%) | 7 (8.1%) |
| $50,000 to $54,999 | 0 (0.0%) | 0 (0.0%) |
| $55,000 to $64,999 | 14 (20.6%) | 0 (0.0%) |
| $65,000 to $74,999 | 0 (0.0%) | 17 (19.8%) |
| $75,000 to $99,999 | 0 (0.0%) | 0 (0.0%) |
| $100,000+ | 17 (25.0%) | 0 (0.0%) |
| Total | 68 (100.0%) | 86 (100.0%) |
Earnings by Sex by Educational Attainment in Marathon
| Educational Attainment | Male Income | Female Income |
| Less than High School | - | - |
| High School Diploma | - | - |
| College or Associate's Degree | - | - |
| Bachelor's Degree | - | - |
| Graduate Degree | - | - |
| Total | - | - |
Family Income in Marathon
Family Income Brackets in Marathon
According to the Marathon family income data, there are 51 families falling into the $35,000 to $49,999 income range, which is the most common income bracket and makes up 38.1% of all families.
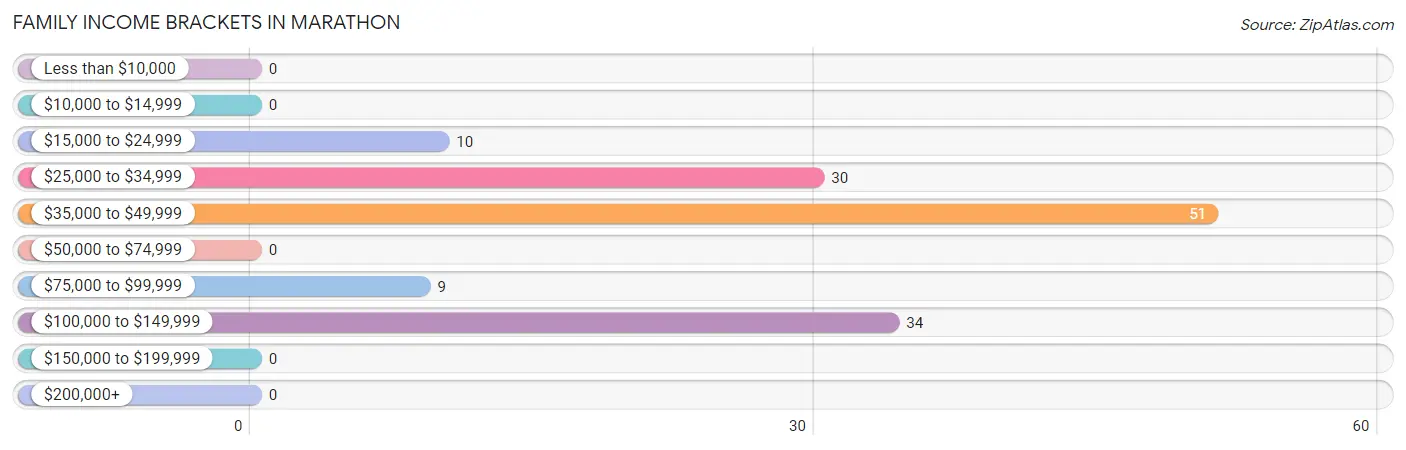
| Income Bracket | # Families | % Families |
| Less than $10,000 | 0 | 0.0% |
| $10,000 to $14,999 | 0 | 0.0% |
| $15,000 to $24,999 | 10 | 7.5% |
| $25,000 to $34,999 | 30 | 22.4% |
| $35,000 to $49,999 | 51 | 38.1% |
| $50,000 to $74,999 | 0 | 0.0% |
| $75,000 to $99,999 | 9 | 6.7% |
| $100,000 to $149,999 | 34 | 25.4% |
| $150,000 to $199,999 | 0 | 0.0% |
| $200,000+ | 0 | 0.0% |
Family Income by Famaliy Size in Marathon
2-person families (117 | 87.3%) account for the highest median family income in Marathon with $43,407 per family, while 2-person families (117 | 87.3%) have the highest median income of $21,704 per family member.
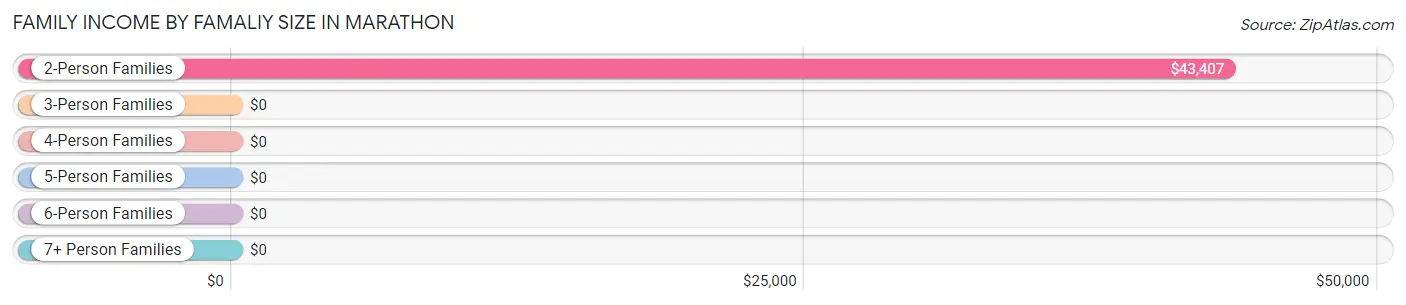
| Income Bracket | # Families | Median Income |
| 2-Person Families | 117 (87.3%) | $43,407 |
| 3-Person Families | 0 (0.0%) | $0 |
| 4-Person Families | 17 (12.7%) | $0 |
| 5-Person Families | 0 (0.0%) | $0 |
| 6-Person Families | 0 (0.0%) | $0 |
| 7+ Person Families | 0 (0.0%) | $0 |
| Total | 134 (100.0%) | $43,824 |
Family Income by Number of Earners in Marathon
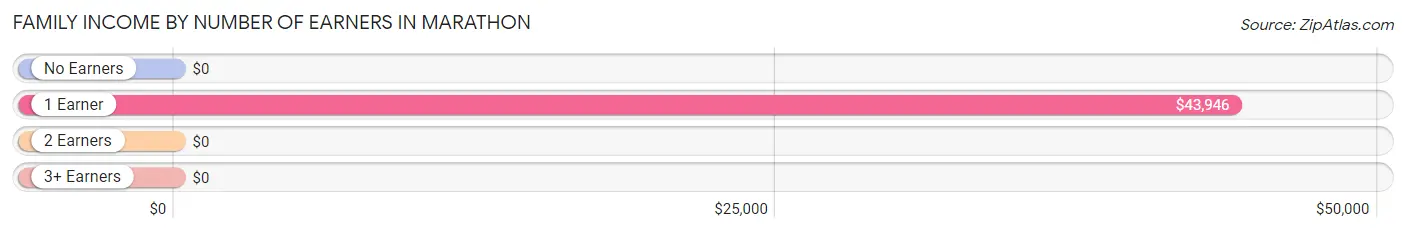
| Number of Earners | # Families | Median Income |
| No Earners | 21 (15.7%) | $0 |
| 1 Earner | 77 (57.5%) | $43,946 |
| 2 Earners | 36 (26.9%) | $0 |
| 3+ Earners | 0 (0.0%) | $0 |
| Total | 134 (100.0%) | $43,824 |
Household Income in Marathon
Household Income Brackets in Marathon
With 63 households falling in the category, the $35,000 to $49,999 income range is the most frequent in Marathon, accounting for 36.2% of all households.
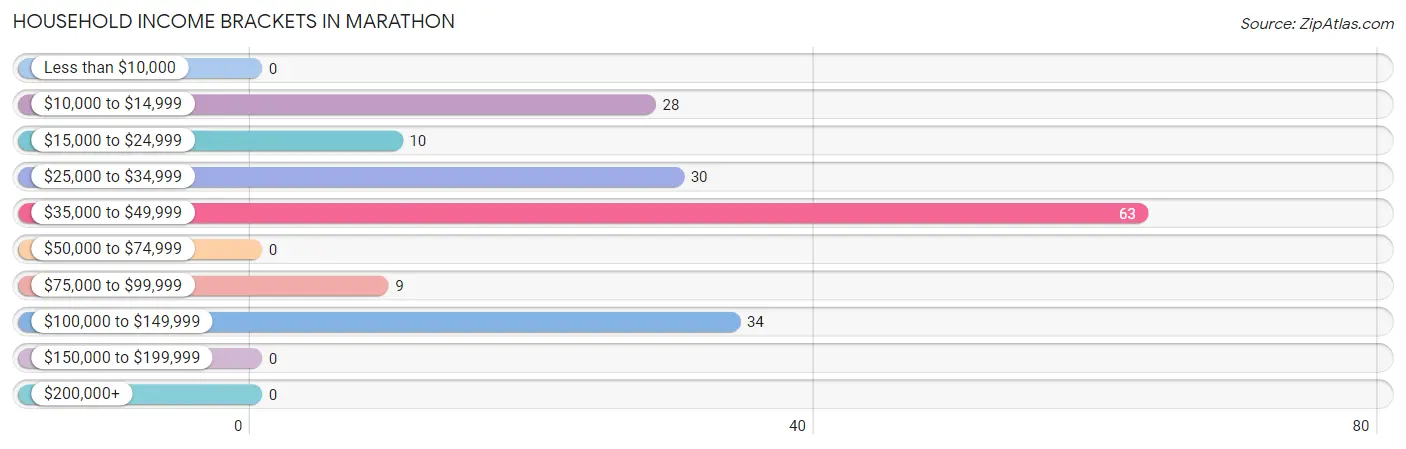
| Income Bracket | # Households | % Households |
| Less than $10,000 | 0 | 0.0% |
| $10,000 to $14,999 | 28 | 16.1% |
| $15,000 to $24,999 | 10 | 5.7% |
| $25,000 to $34,999 | 30 | 17.2% |
| $35,000 to $49,999 | 63 | 36.2% |
| $50,000 to $74,999 | 0 | 0.0% |
| $75,000 to $99,999 | 9 | 5.2% |
| $100,000 to $149,999 | 34 | 19.5% |
| $150,000 to $199,999 | 0 | 0.0% |
| $200,000+ | 0 | 0.0% |
Household Income by Householder Age in Marathon
The median household income in Marathon is $42,843, with the highest median household income of $43,922 found in the 25 to 44 years age bracket for the primary householder. A total of 78 households (44.8%) fall into this category. Meanwhile, the 15 to 24 years age bracket for the primary householder has the lowest median household income of $0, with 12 households (6.9%) in this group.
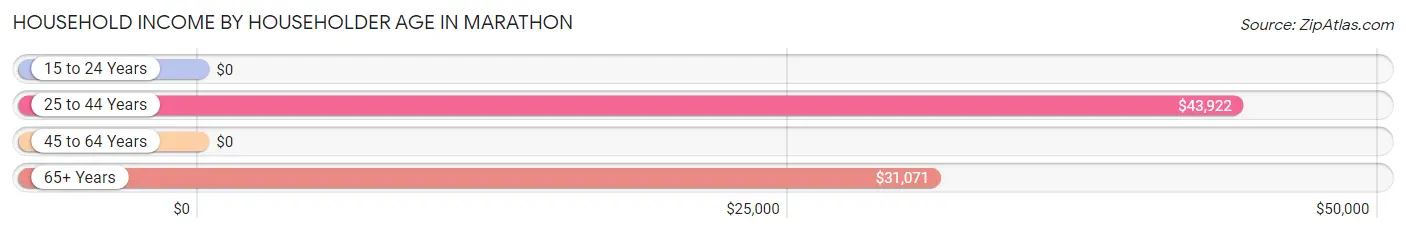
| Income Bracket | # Households | Median Income |
| 15 to 24 Years | 12 (6.9%) | $0 |
| 25 to 44 Years | 78 (44.8%) | $43,922 |
| 45 to 64 Years | 54 (31.0%) | $0 |
| 65+ Years | 30 (17.2%) | $31,071 |
| Total | 174 (100.0%) | $42,843 |
Poverty in Marathon
Income Below Poverty by Sex and Age in Marathon
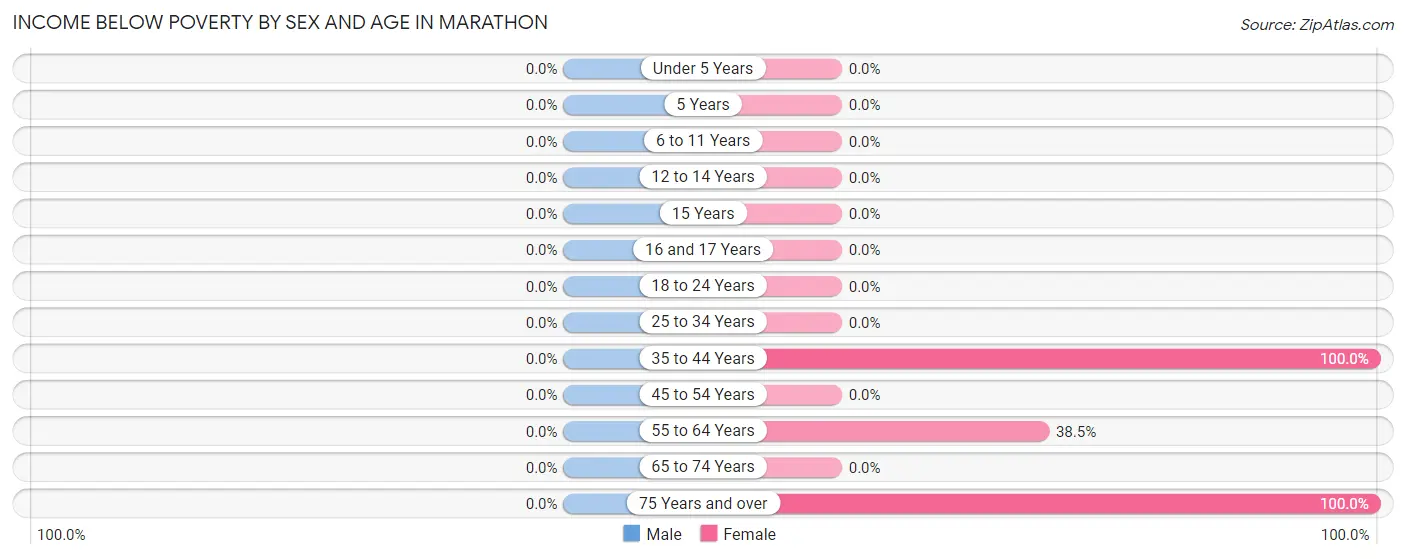
| Age Bracket | Male | Female |
| Under 5 Years | 0 (0.0%) | 0 (0.0%) |
| 5 Years | 0 (0.0%) | 0 (0.0%) |
| 6 to 11 Years | 0 (0.0%) | 0 (0.0%) |
| 12 to 14 Years | 0 (0.0%) | 0 (0.0%) |
| 15 Years | 0 (0.0%) | 0 (0.0%) |
| 16 and 17 Years | 0 (0.0%) | 0 (0.0%) |
| 18 to 24 Years | 0 (0.0%) | 0 (0.0%) |
| 25 to 34 Years | 0 (0.0%) | 0 (0.0%) |
| 35 to 44 Years | 0 (0.0%) | 10 (100.0%) |
| 45 to 54 Years | 0 (0.0%) | 0 (0.0%) |
| 55 to 64 Years | 0 (0.0%) | 20 (38.5%) |
| 65 to 74 Years | 0 (0.0%) | 0 (0.0%) |
| 75 Years and over | 0 (0.0%) | 9 (100.0%) |
| Total | 0 (0.0%) | 39 (21.0%) |
Income Above Poverty by Sex and Age in Marathon
According to the poverty statistics in Marathon, males aged 18 to 24 years and females aged under 5 years are the age groups that are most secure financially, with 100.0% of males and 100.0% of females in these age groups living above the poverty line.
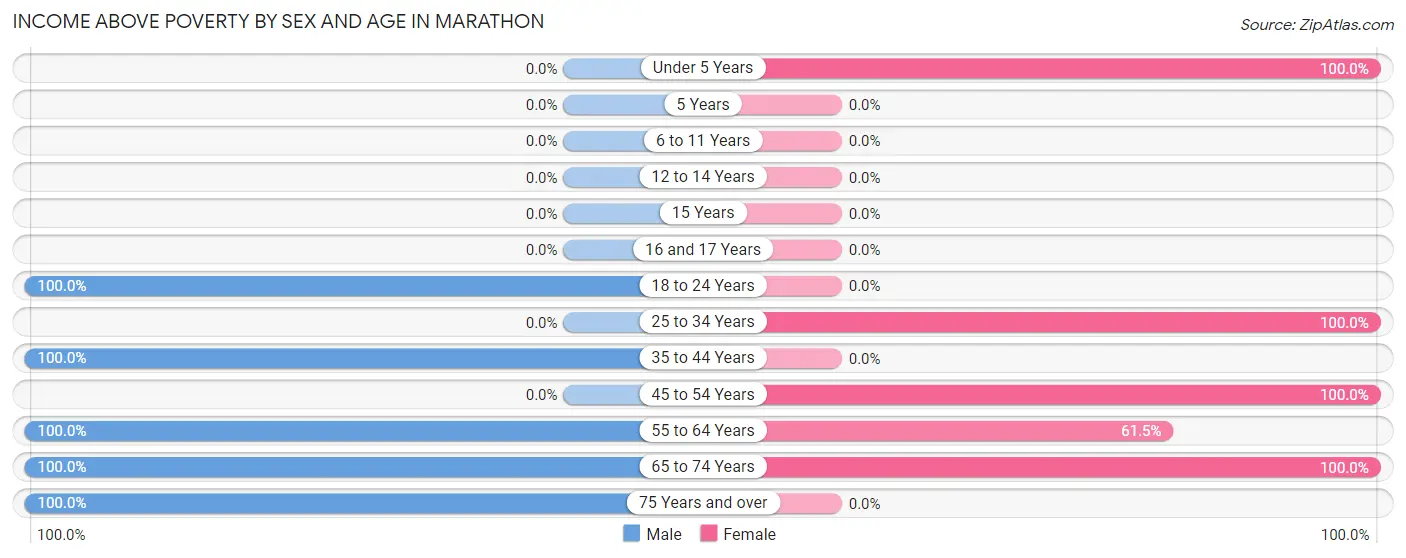
| Age Bracket | Male | Female |
| Under 5 Years | 0 (0.0%) | 43 (100.0%) |
| 5 Years | 0 (0.0%) | 0 (0.0%) |
| 6 to 11 Years | 0 (0.0%) | 0 (0.0%) |
| 12 to 14 Years | 0 (0.0%) | 0 (0.0%) |
| 15 Years | 0 (0.0%) | 0 (0.0%) |
| 16 and 17 Years | 0 (0.0%) | 0 (0.0%) |
| 18 to 24 Years | 12 (100.0%) | 0 (0.0%) |
| 25 to 34 Years | 0 (0.0%) | 52 (100.0%) |
| 35 to 44 Years | 17 (100.0%) | 0 (0.0%) |
| 45 to 54 Years | 0 (0.0%) | 7 (100.0%) |
| 55 to 64 Years | 39 (100.0%) | 32 (61.5%) |
| 65 to 74 Years | 7 (100.0%) | 13 (100.0%) |
| 75 Years and over | 14 (100.0%) | 0 (0.0%) |
| Total | 89 (100.0%) | 147 (79.0%) |
Income Below Poverty Among Married-Couple Families in Marathon
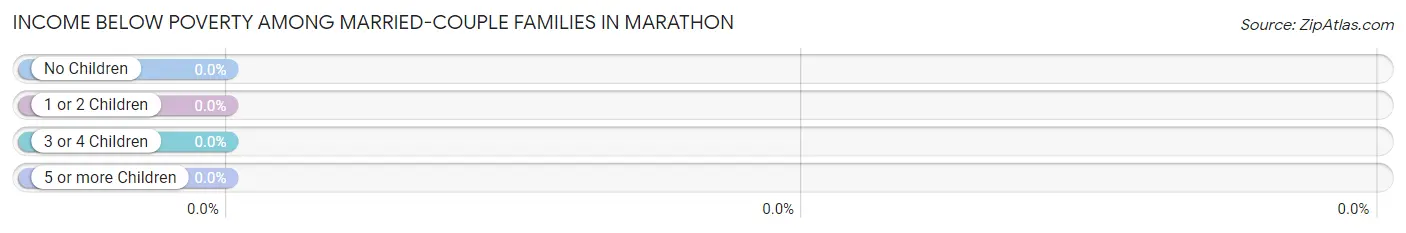
| Children | Above Poverty | Below Poverty |
| No Children | 56 (100.0%) | 0 (0.0%) |
| 1 or 2 Children | 0 (0.0%) | 0 (0.0%) |
| 3 or 4 Children | 0 (0.0%) | 0 (0.0%) |
| 5 or more Children | 0 (0.0%) | 0 (0.0%) |
| Total | 56 (100.0%) | 0 (0.0%) |
Income Below Poverty Among Single-Parent Households in Marathon
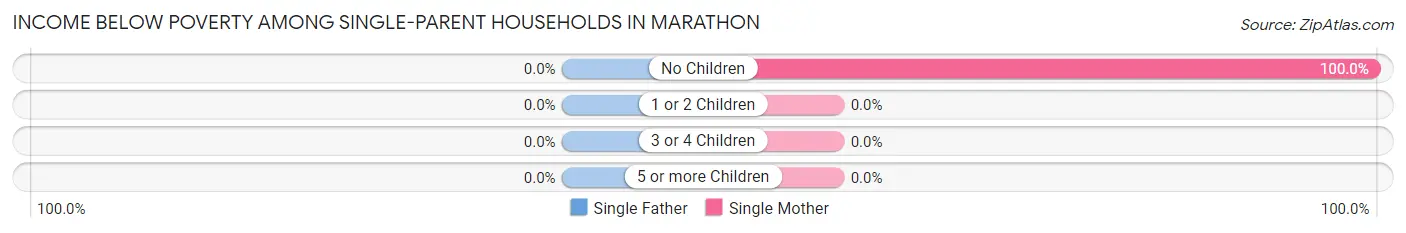
| Children | Single Father | Single Mother |
| No Children | 0 (0.0%) | 10 (100.0%) |
| 1 or 2 Children | 0 (0.0%) | 0 (0.0%) |
| 3 or 4 Children | 0 (0.0%) | 0 (0.0%) |
| 5 or more Children | 0 (0.0%) | 0 (0.0%) |
| Total | 0 (0.0%) | 10 (16.4%) |
Income Below Poverty Among Married-Couple vs Single-Parent Households in Marathon
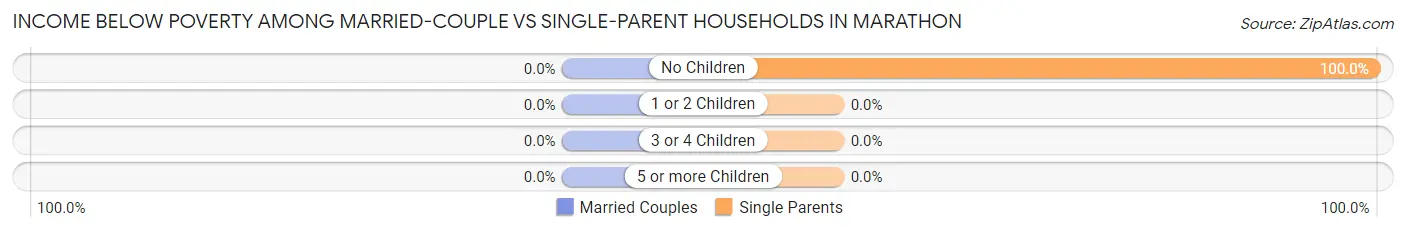
| Children | Married-Couple Families | Single-Parent Households |
| No Children | 0 (0.0%) | 10 (100.0%) |
| 1 or 2 Children | 0 (0.0%) | 0 (0.0%) |
| 3 or 4 Children | 0 (0.0%) | 0 (0.0%) |
| 5 or more Children | 0 (0.0%) | 0 (0.0%) |
| Total | 0 (0.0%) | 10 (12.8%) |
Race in Marathon
The most populous races in Marathon are White / Caucasian (275 | 100.0%), and Hispanic or Latino (121 | 44.0%).
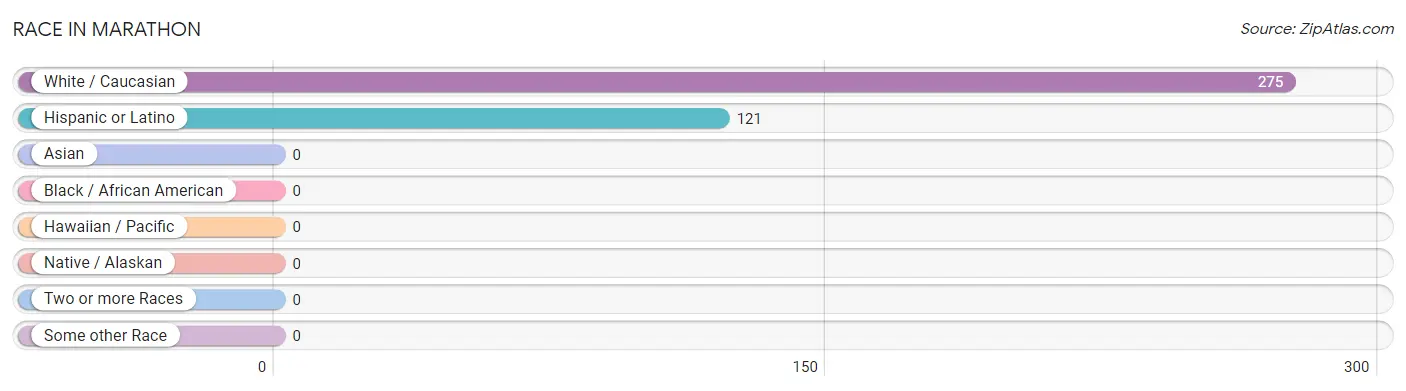
| Race | # Population | % Population |
| Asian | 0 | 0.0% |
| Black / African American | 0 | 0.0% |
| Hawaiian / Pacific | 0 | 0.0% |
| Hispanic or Latino | 121 | 44.0% |
| Native / Alaskan | 0 | 0.0% |
| White / Caucasian | 275 | 100.0% |
| Two or more Races | 0 | 0.0% |
| Some other Race | 0 | 0.0% |
| Total | 275 | 100.0% |
Ancestry in Marathon
The most populous ancestries reported in Marathon are Mexican (121 | 44.0%), Scotch-Irish (51 | 18.5%), German (37 | 13.5%), European (27 | 9.8%), and Swedish (12 | 4.4%), together accounting for 90.2% of all Marathon residents.
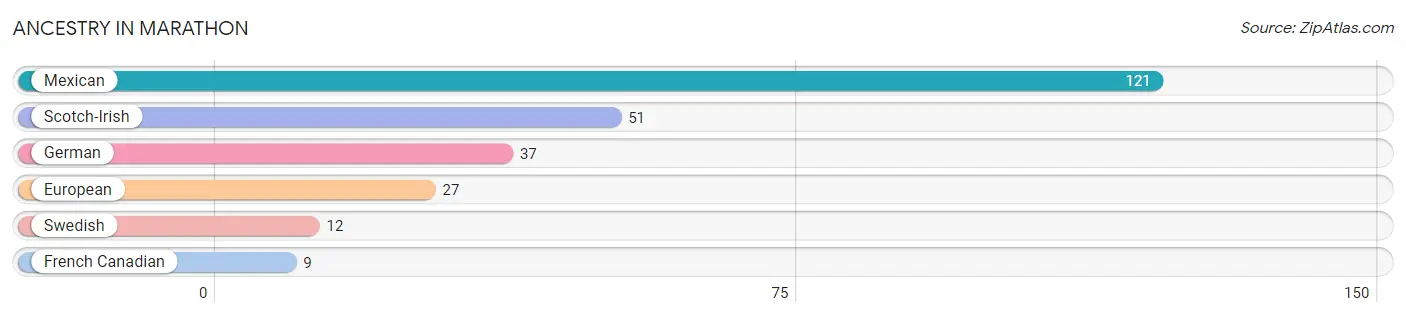
| Ancestry | # Population | % Population |
| European | 27 | 9.8% |
| French Canadian | 9 | 3.3% |
| German | 37 | 13.5% |
| Mexican | 121 | 44.0% |
| Scotch-Irish | 51 | 18.5% |
| Swedish | 12 | 4.4% | View All 6 Rows |
Immigrants in Marathon
The most numerous immigrant groups reported in Marathon came from Europe (1 | 0.4%), Netherlands (1 | 0.4%), and Western Europe (1 | 0.4%), together accounting for 1.1% of all Marathon residents.
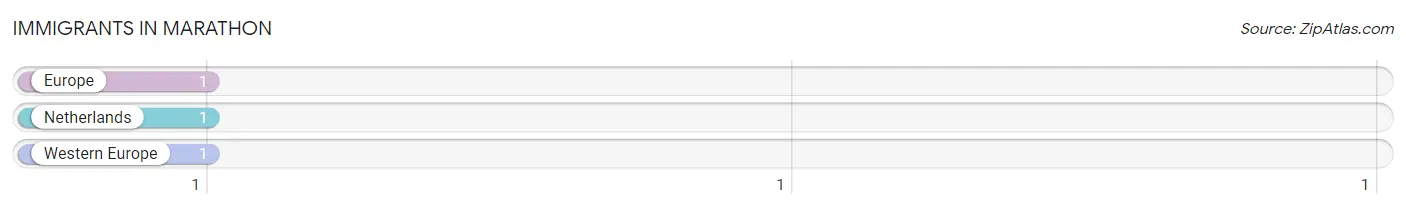
| Immigration Origin | # Population | % Population |
| Europe | 1 | 0.4% |
| Netherlands | 1 | 0.4% |
| Western Europe | 1 | 0.4% | View All 3 Rows |
Sex and Age in Marathon
Sex and Age in Marathon
The most populous age groups in Marathon are 60 to 64 Years (30 | 33.7%) for men and 25 to 29 Years (52 | 28.0%) for women.
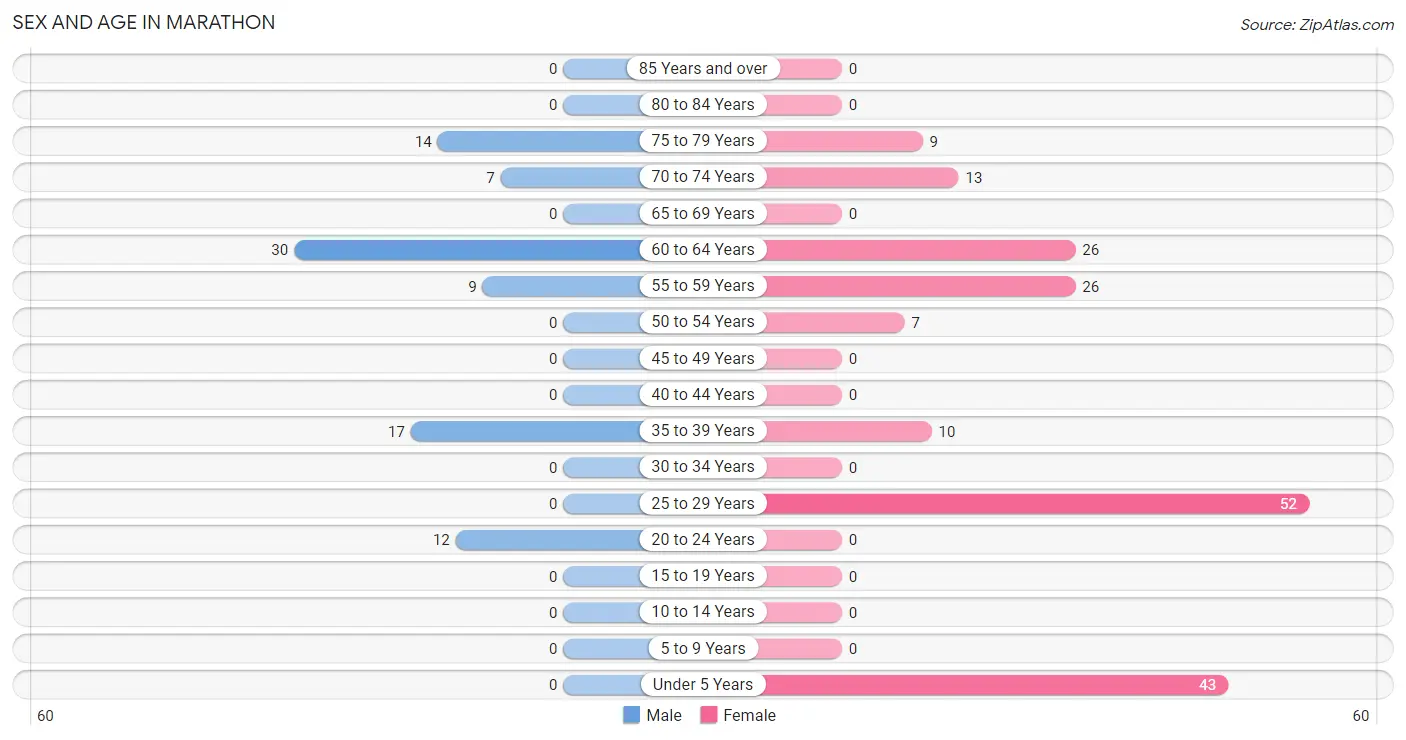
| Age Bracket | Male | Female |
| Under 5 Years | 0 (0.0%) | 43 (23.1%) |
| 5 to 9 Years | 0 (0.0%) | 0 (0.0%) |
| 10 to 14 Years | 0 (0.0%) | 0 (0.0%) |
| 15 to 19 Years | 0 (0.0%) | 0 (0.0%) |
| 20 to 24 Years | 12 (13.5%) | 0 (0.0%) |
| 25 to 29 Years | 0 (0.0%) | 52 (28.0%) |
| 30 to 34 Years | 0 (0.0%) | 0 (0.0%) |
| 35 to 39 Years | 17 (19.1%) | 10 (5.4%) |
| 40 to 44 Years | 0 (0.0%) | 0 (0.0%) |
| 45 to 49 Years | 0 (0.0%) | 0 (0.0%) |
| 50 to 54 Years | 0 (0.0%) | 7 (3.8%) |
| 55 to 59 Years | 9 (10.1%) | 26 (14.0%) |
| 60 to 64 Years | 30 (33.7%) | 26 (14.0%) |
| 65 to 69 Years | 0 (0.0%) | 0 (0.0%) |
| 70 to 74 Years | 7 (7.9%) | 13 (7.0%) |
| 75 to 79 Years | 14 (15.7%) | 9 (4.8%) |
| 80 to 84 Years | 0 (0.0%) | 0 (0.0%) |
| 85 Years and over | 0 (0.0%) | 0 (0.0%) |
| Total | 89 (100.0%) | 186 (100.0%) |
Families and Households in Marathon
Median Family Size in Marathon
The median family size in Marathon is 1.75 persons per family, with single male/father families (17 | 12.7%) accounting for the largest median family size of 2.94 persons per family. On the other hand, single female/mother families (61 | 45.5%) represent the smallest median family size with 1.20 persons per family.
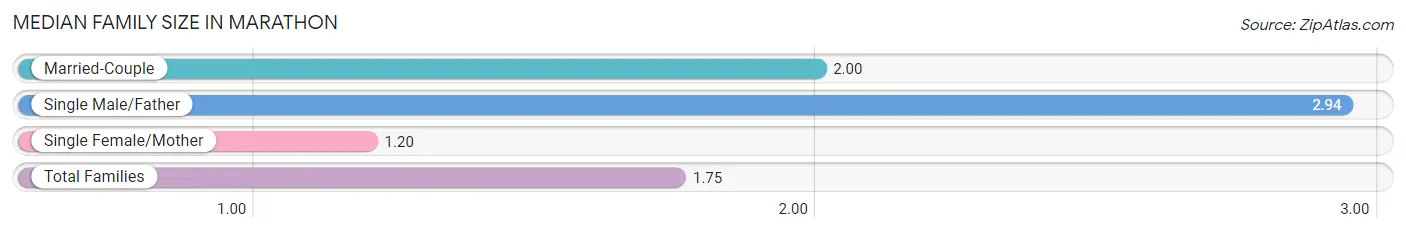
| Family Type | # Families | Family Size |
| Married-Couple | 56 (41.8%) | 2.00 |
| Single Male/Father | 17 (12.7%) | 2.94 |
| Single Female/Mother | 61 (45.5%) | 1.20 |
| Total Families | 134 (100.0%) | 1.75 |
Median Household Size in Marathon
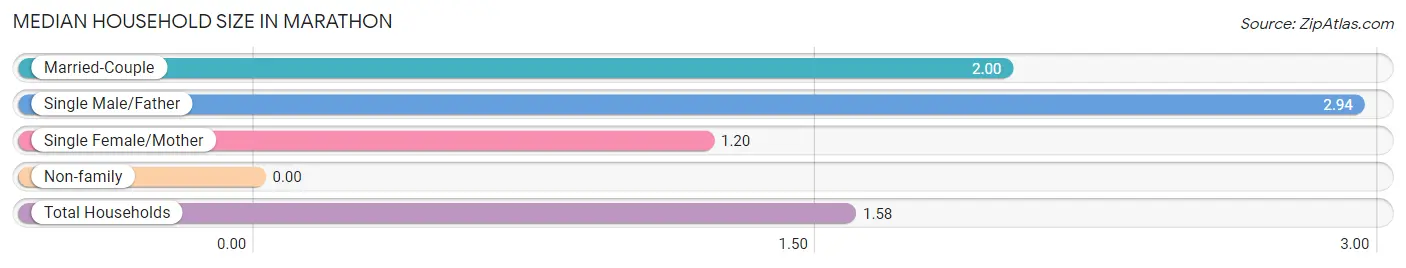
| Household Type | # Households | Household Size |
| Married-Couple | 56 (32.2%) | 2.00 |
| Single Male/Father | 17 (9.8%) | 2.94 |
| Single Female/Mother | 61 (35.1%) | 1.20 |
| Non-family | 40 (23.0%) | - |
| Total Households | 174 (100.0%) | 1.58 |
Household Size by Marriage Status in Marathon
Out of a total of 174 households in Marathon, 134 (77.0%) are family households, while 40 (23.0%) are nonfamily households. The most numerous type of family households are 2-person households, comprising 117, and the most common type of nonfamily households are 1-person households, comprising 40.
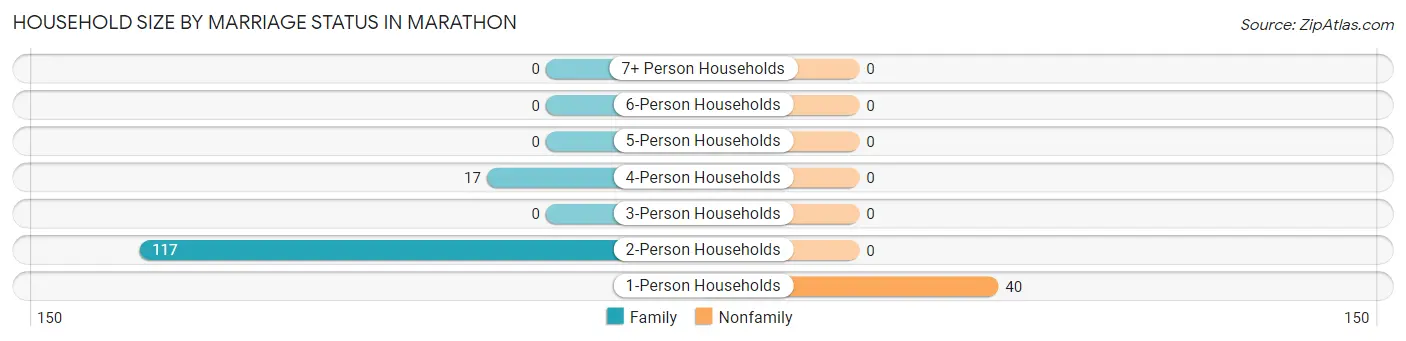
| Household Size | Family Households | Nonfamily Households |
| 1-Person Households | - | 40 (23.0%) |
| 2-Person Households | 117 (67.2%) | 0 (0.0%) |
| 3-Person Households | 0 (0.0%) | 0 (0.0%) |
| 4-Person Households | 17 (9.8%) | 0 (0.0%) |
| 5-Person Households | 0 (0.0%) | 0 (0.0%) |
| 6-Person Households | 0 (0.0%) | 0 (0.0%) |
| 7+ Person Households | 0 (0.0%) | 0 (0.0%) |
| Total | 134 (77.0%) | 40 (23.0%) |
Female Fertility in Marathon
Fertility by Age in Marathon
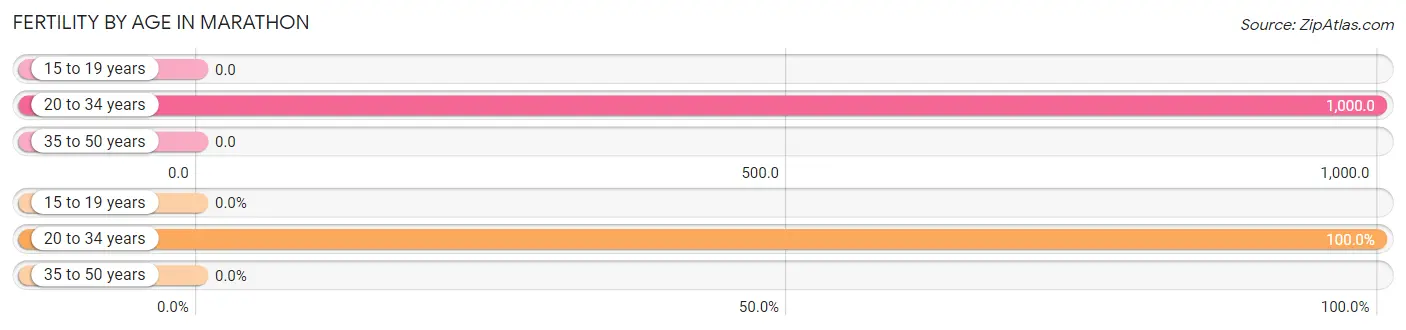
Average fertility rate in Marathon is 839.0 births per 1,000 women. Women in the age bracket of 20 to 34 years have the highest fertility rate with 1,000.0 births per 1,000 women. Women in the age bracket of 20 to 34 years acount for 100.0% of all women with births.
| Age Bracket | Women with Births | Births / 1,000 Women |
| 15 to 19 years | 0 (0.0%) | 0.0 |
| 20 to 34 years | 52 (100.0%) | 1,000.0 |
| 35 to 50 years | 0 (0.0%) | 0.0 |
| Total | 52 (100.0%) | 839.0 |
Fertility by Age by Marriage Status in Marathon
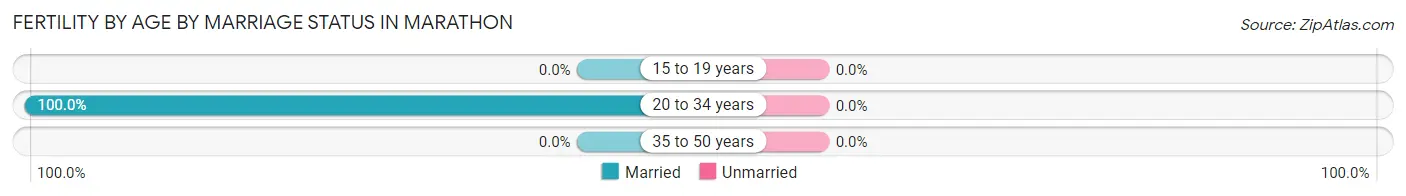
| Age Bracket | Married | Unmarried |
| 15 to 19 years | 0 (0.0%) | 0 (0.0%) |
| 20 to 34 years | 52 (100.0%) | 0 (0.0%) |
| 35 to 50 years | 0 (0.0%) | 0 (0.0%) |
| Total | 52 (100.0%) | 0 (0.0%) |
Fertility by Education in Marathon
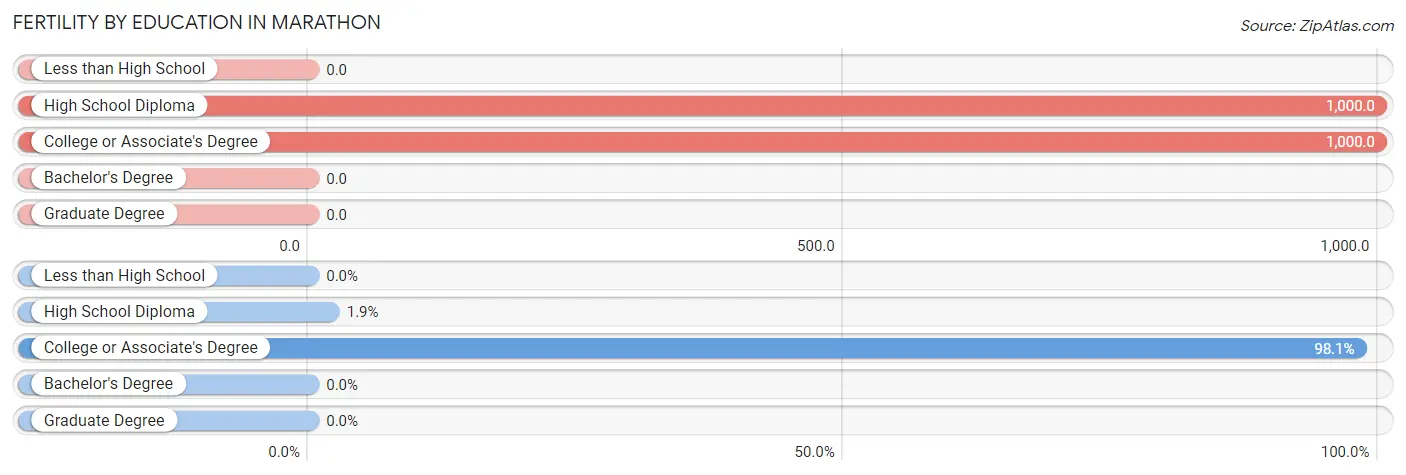
| Educational Attainment | Women with Births | Births / 1,000 Women |
| Less than High School | 0 (0.0%) | 0.0 |
| High School Diploma | 1 (1.9%) | 1,000.0 |
| College or Associate's Degree | 51 (98.1%) | 1,000.0 |
| Bachelor's Degree | 0 (0.0%) | 0.0 |
| Graduate Degree | 0 (0.0%) | 0.0 |
| Total | 52 (100.0%) | 839.0 |
Fertility by Education by Marriage Status in Marathon
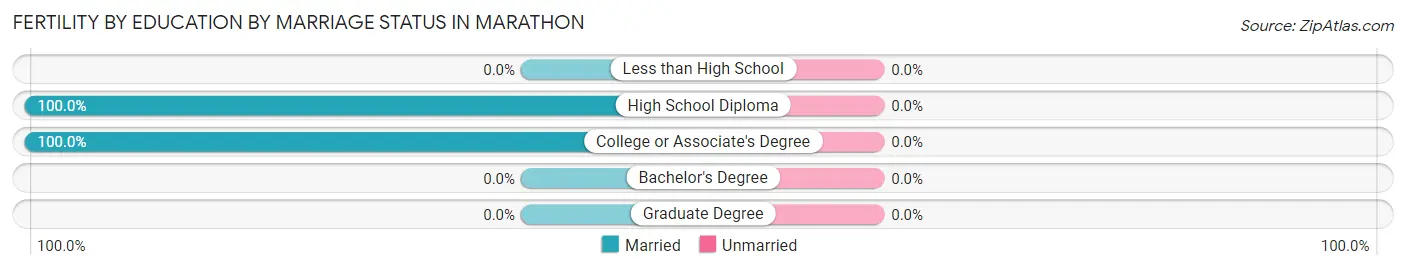
| Educational Attainment | Married | Unmarried |
| Less than High School | 0 (0.0%) | 0 (0.0%) |
| High School Diploma | 1 (100.0%) | 0 (0.0%) |
| College or Associate's Degree | 51 (100.0%) | 0 (0.0%) |
| Bachelor's Degree | 0 (0.0%) | 0 (0.0%) |
| Graduate Degree | 0 (0.0%) | 0 (0.0%) |
| Total | 52 (100.0%) | 0 (0.0%) |
Employment Characteristics in Marathon
Employment by Class of Employer in Marathon
Among the 154 employed individuals in Marathon, private company employees (107 | 69.5%), federal government employees (38 | 24.7%), and state government employees (9 | 5.8%) make up the most common classes of employment.
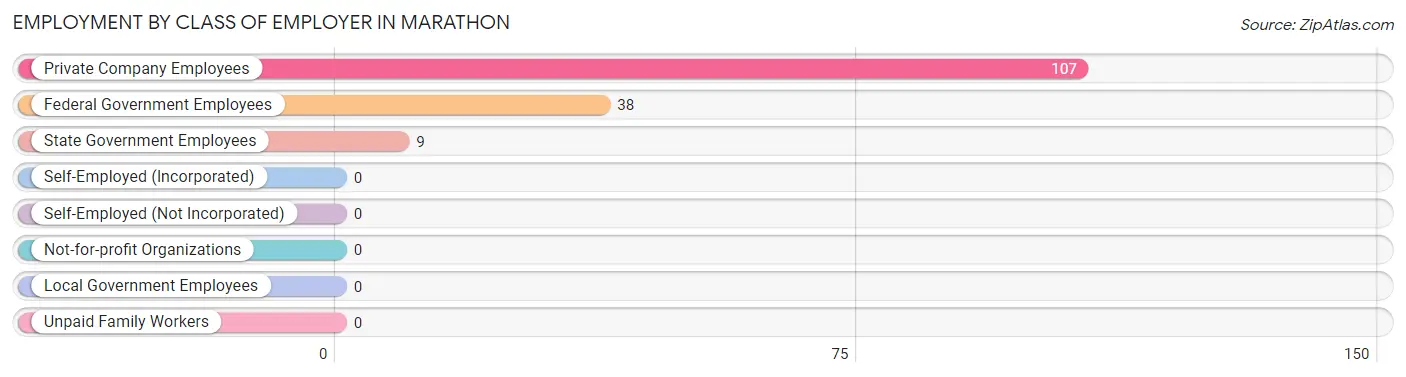
| Employer Class | # Employees | % Employees |
| Private Company Employees | 107 | 69.5% |
| Self-Employed (Incorporated) | 0 | 0.0% |
| Self-Employed (Not Incorporated) | 0 | 0.0% |
| Not-for-profit Organizations | 0 | 0.0% |
| Local Government Employees | 0 | 0.0% |
| State Government Employees | 9 | 5.8% |
| Federal Government Employees | 38 | 24.7% |
| Unpaid Family Workers | 0 | 0.0% |
| Total | 154 | 100.0% |
Employment Status by Age in Marathon
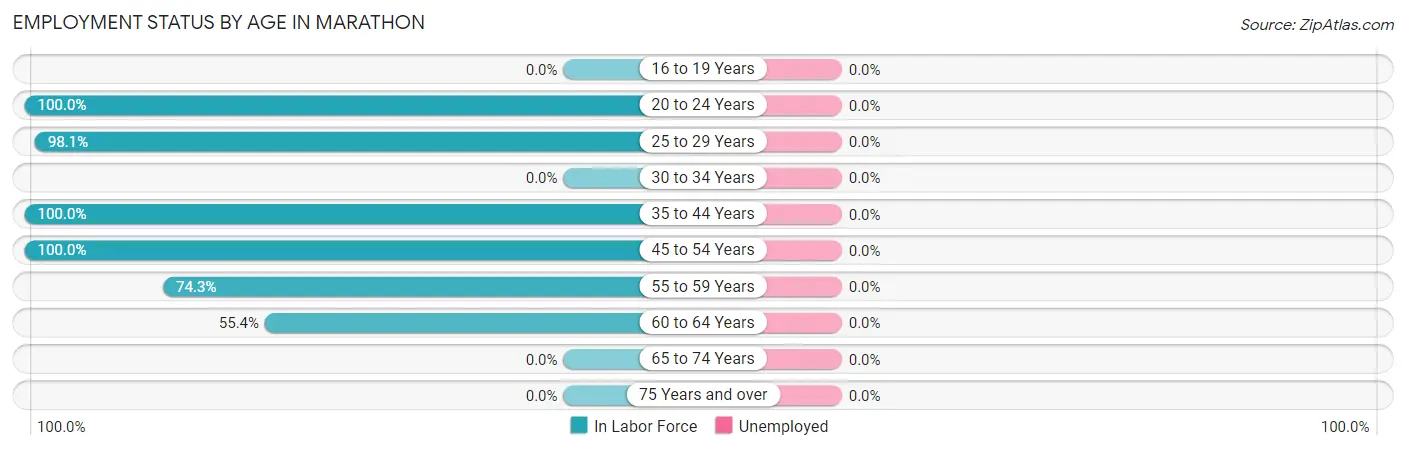
| Age Bracket | In Labor Force | Unemployed |
| 16 to 19 Years | 0 (0.0%) | 0 (0.0%) |
| 20 to 24 Years | 12 (100.0%) | 0 (0.0%) |
| 25 to 29 Years | 51 (98.1%) | 0 (0.0%) |
| 30 to 34 Years | 0 (0.0%) | 0 (0.0%) |
| 35 to 44 Years | 27 (100.0%) | 0 (0.0%) |
| 45 to 54 Years | 7 (100.0%) | 0 (0.0%) |
| 55 to 59 Years | 26 (74.3%) | 0 (0.0%) |
| 60 to 64 Years | 31 (55.4%) | 0 (0.0%) |
| 65 to 74 Years | 0 (0.0%) | 0 (0.0%) |
| 75 Years and over | 0 (0.0%) | 0 (0.0%) |
| Total | 154 (66.4%) | 0 (0.0%) |
Employment Status by Educational Attainment in Marathon
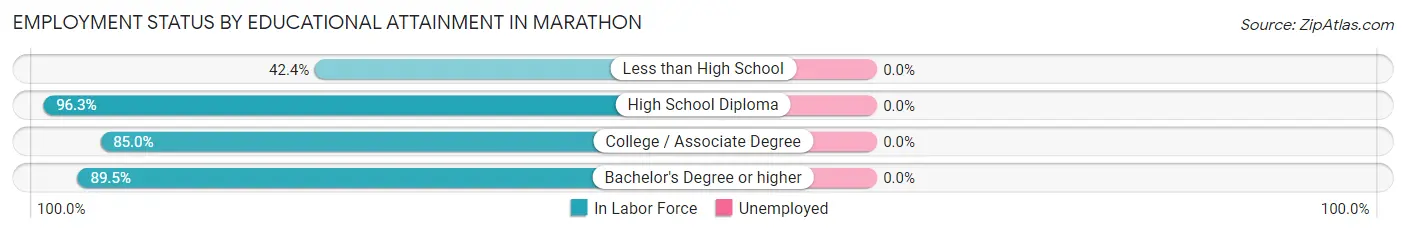
| Educational Attainment | In Labor Force | Unemployed |
| Less than High School | 14 (42.4%) | 0 (0.0%) |
| High School Diploma | 26 (96.3%) | 0 (0.0%) |
| College / Associate Degree | 51 (85.0%) | 0 (0.0%) |
| Bachelor's Degree or higher | 51 (89.5%) | 0 (0.0%) |
| Total | 142 (80.2%) | 0 (0.0%) |
Employment Occupations by Sex in Marathon
Management, Business, Science and Arts Occupations
The most common Management, Business, Science and Arts occupations in Marathon are , and Business & Financial (1 | 0.6%).
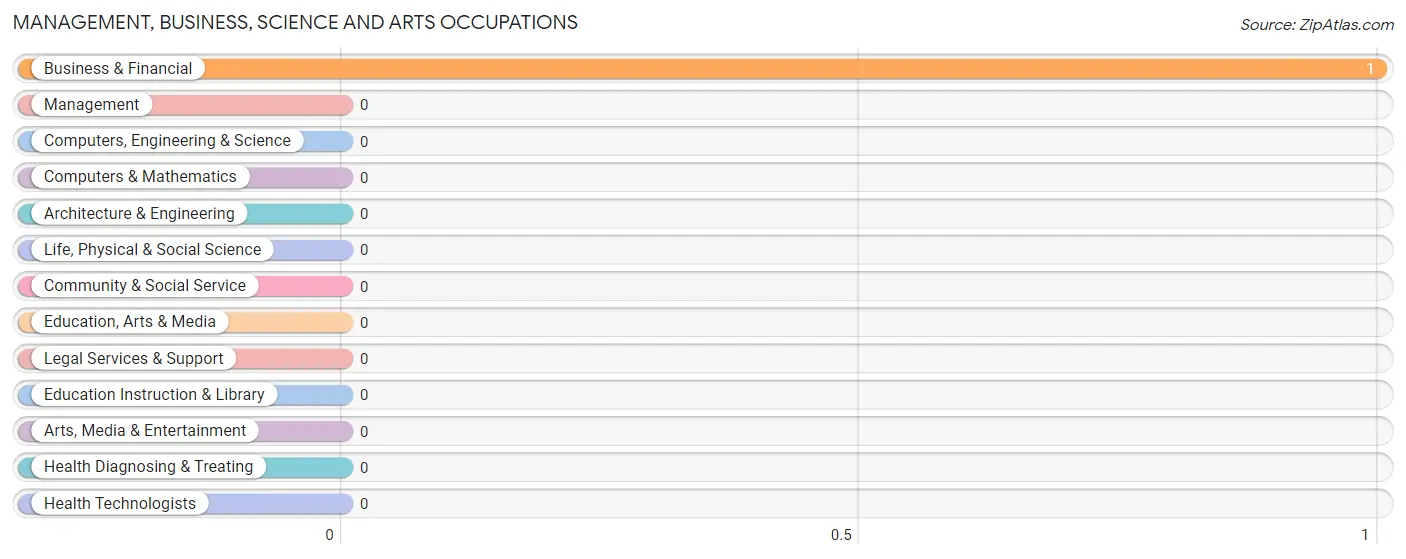
Management, Business, Science and Arts Occupations by Sex
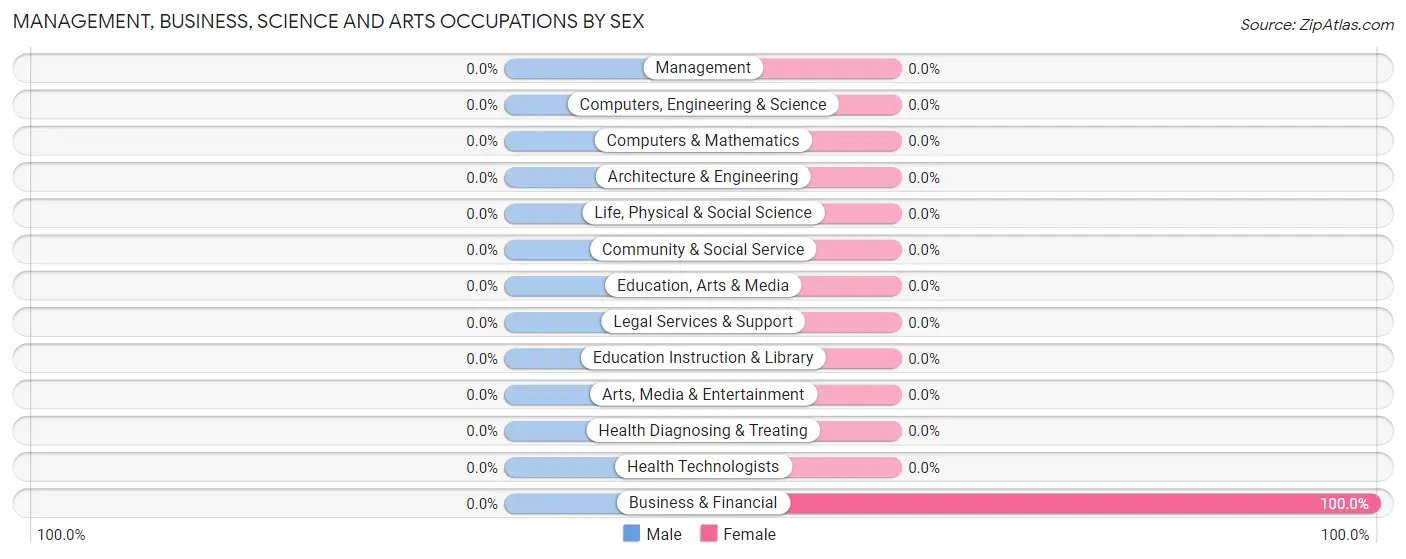
| Occupation | Male | Female |
| Management | 0 (0.0%) | 0 (0.0%) |
| Business & Financial | 0 (0.0%) | 1 (100.0%) |
| Computers, Engineering & Science | 0 (0.0%) | 0 (0.0%) |
| Computers & Mathematics | 0 (0.0%) | 0 (0.0%) |
| Architecture & Engineering | 0 (0.0%) | 0 (0.0%) |
| Life, Physical & Social Science | 0 (0.0%) | 0 (0.0%) |
| Community & Social Service | 0 (0.0%) | 0 (0.0%) |
| Education, Arts & Media | 0 (0.0%) | 0 (0.0%) |
| Legal Services & Support | 0 (0.0%) | 0 (0.0%) |
| Education Instruction & Library | 0 (0.0%) | 0 (0.0%) |
| Arts, Media & Entertainment | 0 (0.0%) | 0 (0.0%) |
| Health Diagnosing & Treating | 0 (0.0%) | 0 (0.0%) |
| Health Technologists | 0 (0.0%) | 0 (0.0%) |
| Total (Category) | 0 (0.0%) | 1 (100.0%) |
| Total (Overall) | 68 (44.2%) | 86 (55.8%) |
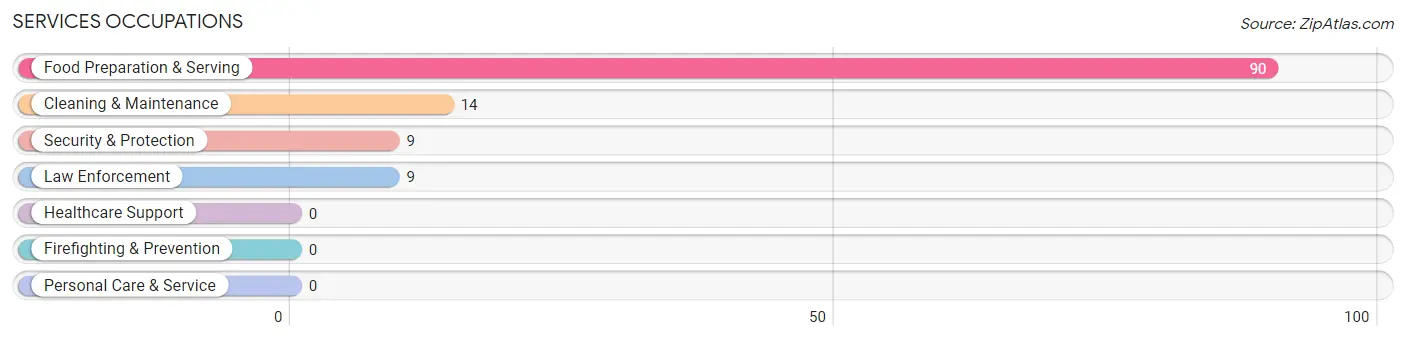
Services Occupations
The most common Services occupations in Marathon are Food Preparation & Serving (90 | 58.4%), Cleaning & Maintenance (14 | 9.1%), Security & Protection (9 | 5.8%), and Law Enforcement (9 | 5.8%).
Services Occupations by Sex
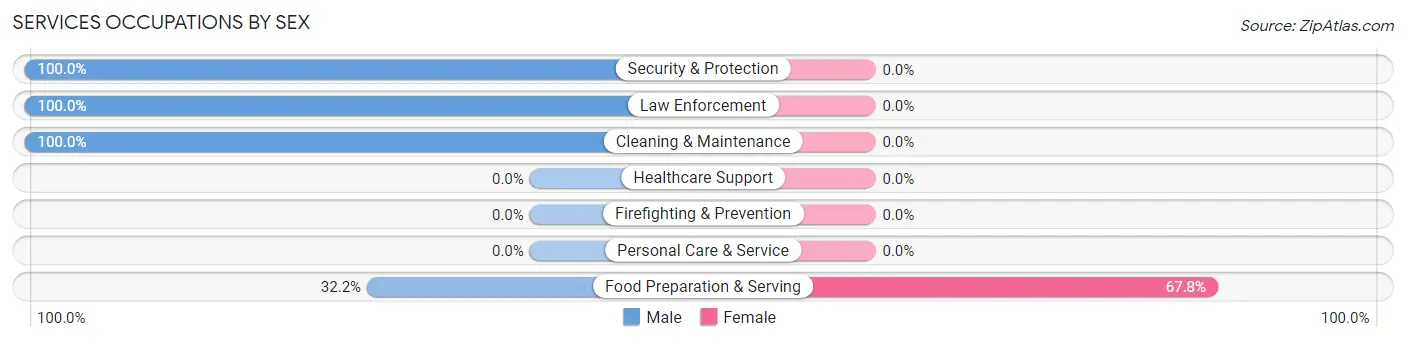
| Occupation | Male | Female |
| Healthcare Support | 0 (0.0%) | 0 (0.0%) |
| Security & Protection | 9 (100.0%) | 0 (0.0%) |
| Firefighting & Prevention | 0 (0.0%) | 0 (0.0%) |
| Law Enforcement | 9 (100.0%) | 0 (0.0%) |
| Food Preparation & Serving | 29 (32.2%) | 61 (67.8%) |
| Cleaning & Maintenance | 14 (100.0%) | 0 (0.0%) |
| Personal Care & Service | 0 (0.0%) | 0 (0.0%) |
| Total (Category) | 52 (46.0%) | 61 (54.0%) |
| Total (Overall) | 68 (44.2%) | 86 (55.8%) |
Sales and Office Occupations
The most common Sales and Office occupations in Marathon are , and Office & Administration (24 | 15.6%).
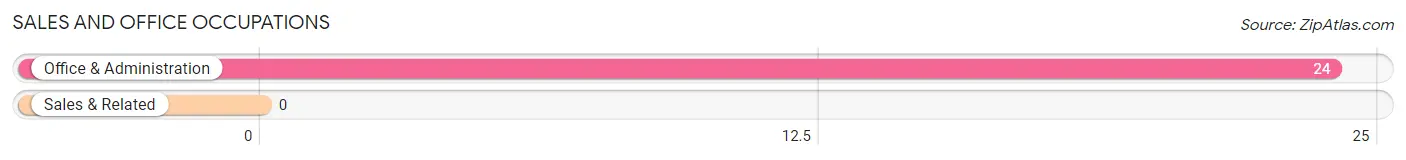
Sales and Office Occupations by Sex
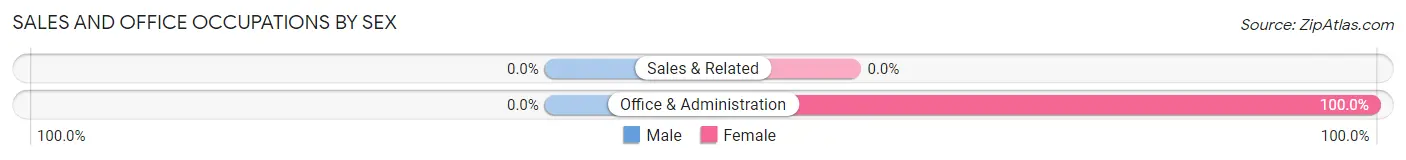
| Occupation | Male | Female |
| Sales & Related | 0 (0.0%) | 0 (0.0%) |
| Office & Administration | 0 (0.0%) | 24 (100.0%) |
| Total (Category) | 0 (0.0%) | 24 (100.0%) |
| Total (Overall) | 68 (44.2%) | 86 (55.8%) |
Natural Resources, Construction and Maintenance Occupations
The most common Natural Resources, Construction and Maintenance occupations in Marathon are , and Installation, Maintenance & Repair (16 | 10.4%).
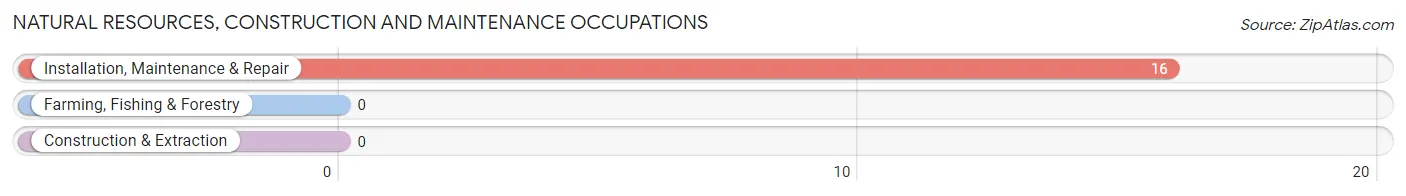
Natural Resources, Construction and Maintenance Occupations by Sex
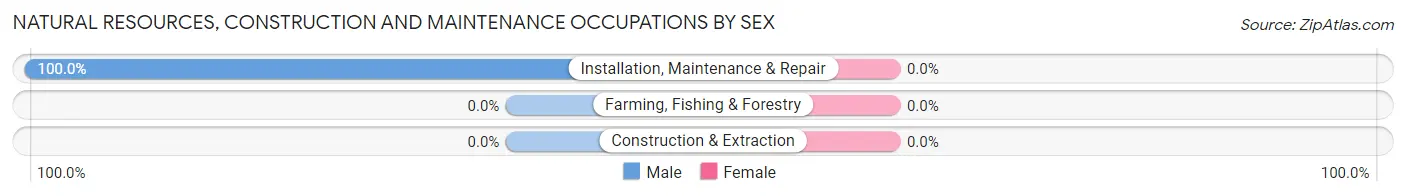
| Occupation | Male | Female |
| Farming, Fishing & Forestry | 0 (0.0%) | 0 (0.0%) |
| Construction & Extraction | 0 (0.0%) | 0 (0.0%) |
| Installation, Maintenance & Repair | 16 (100.0%) | 0 (0.0%) |
| Total (Category) | 16 (100.0%) | 0 (0.0%) |
| Total (Overall) | 68 (44.2%) | 86 (55.8%) |
Production, Transportation and Moving Occupations
Production, Transportation and Moving Occupations by Sex
| Occupation | Male | Female |
| Production | 0 (0.0%) | 0 (0.0%) |
| Transportation | 0 (0.0%) | 0 (0.0%) |
| Material Moving | 0 (0.0%) | 0 (0.0%) |
| Total (Category) | 0 (0.0%) | 0 (0.0%) |
| Total (Overall) | 68 (44.2%) | 86 (55.8%) |
Employment Industries by Sex in Marathon
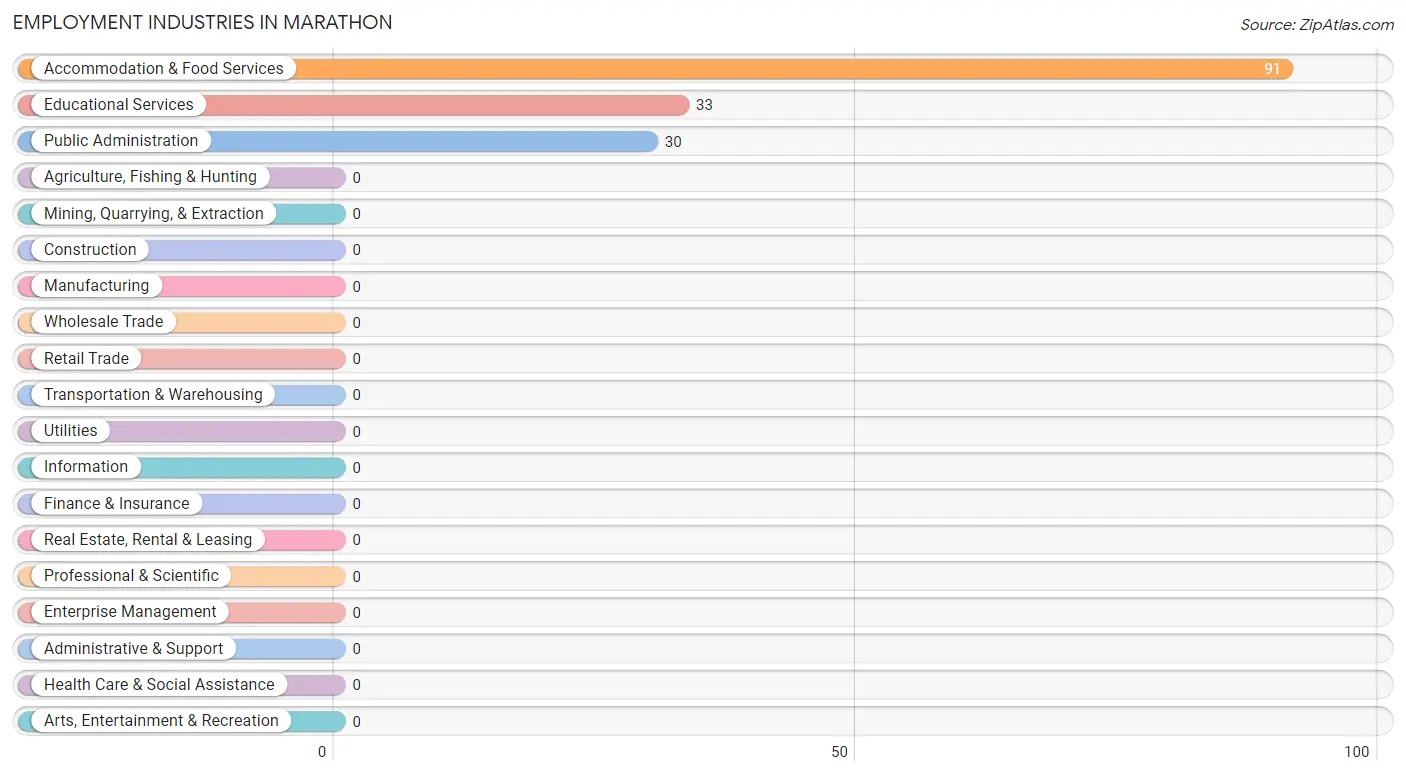
Employment Industries in Marathon
The major employment industries in Marathon include Accommodation & Food Services (91 | 59.1%), Educational Services (33 | 21.4%), and Public Administration (30 | 19.5%).
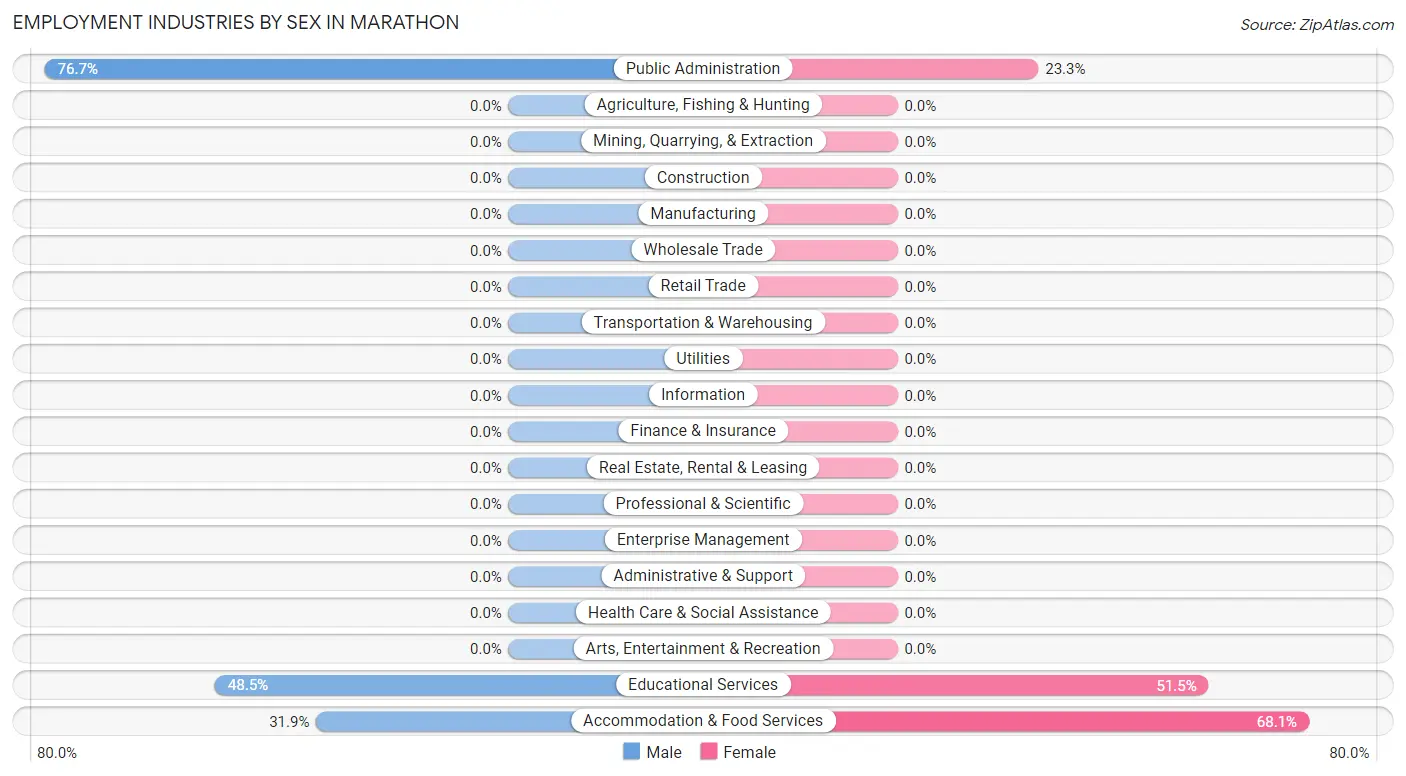
Employment Industries by Sex in Marathon
The Marathon industries that see more men than women are Public Administration (76.7%), Educational Services (48.5%), and Accommodation & Food Services (31.9%), whereas the industries that tend to have a higher number of women are Accommodation & Food Services (68.1%), Educational Services (51.5%), and Public Administration (23.3%).
| Industry | Male | Female |
| Agriculture, Fishing & Hunting | 0 (0.0%) | 0 (0.0%) |
| Mining, Quarrying, & Extraction | 0 (0.0%) | 0 (0.0%) |
| Construction | 0 (0.0%) | 0 (0.0%) |
| Manufacturing | 0 (0.0%) | 0 (0.0%) |
| Wholesale Trade | 0 (0.0%) | 0 (0.0%) |
| Retail Trade | 0 (0.0%) | 0 (0.0%) |
| Transportation & Warehousing | 0 (0.0%) | 0 (0.0%) |
| Utilities | 0 (0.0%) | 0 (0.0%) |
| Information | 0 (0.0%) | 0 (0.0%) |
| Finance & Insurance | 0 (0.0%) | 0 (0.0%) |
| Real Estate, Rental & Leasing | 0 (0.0%) | 0 (0.0%) |
| Professional & Scientific | 0 (0.0%) | 0 (0.0%) |
| Enterprise Management | 0 (0.0%) | 0 (0.0%) |
| Administrative & Support | 0 (0.0%) | 0 (0.0%) |
| Educational Services | 16 (48.5%) | 17 (51.5%) |
| Health Care & Social Assistance | 0 (0.0%) | 0 (0.0%) |
| Arts, Entertainment & Recreation | 0 (0.0%) | 0 (0.0%) |
| Accommodation & Food Services | 29 (31.9%) | 62 (68.1%) |
| Public Administration | 23 (76.7%) | 7 (23.3%) |
| Total | 68 (44.2%) | 86 (55.8%) |
Education in Marathon
School Enrollment in Marathon
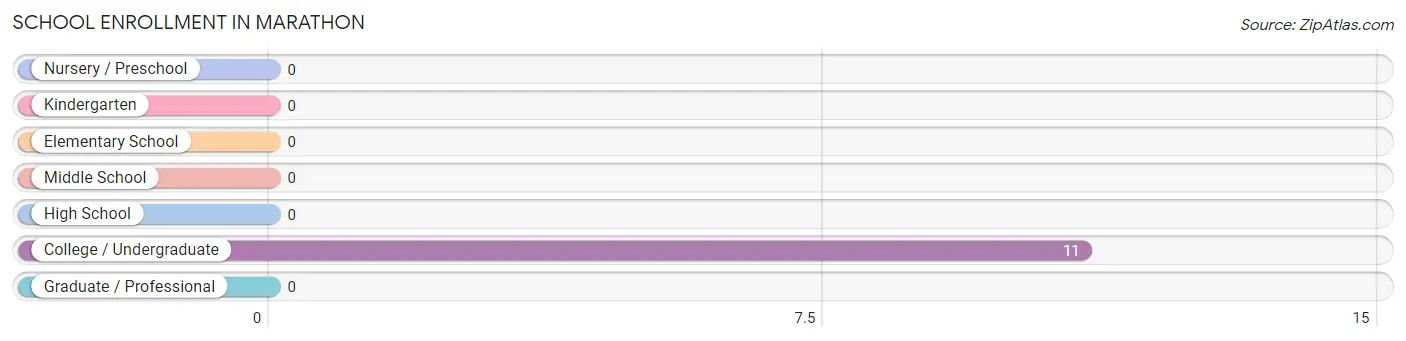
| School Level | # Students | % Students |
| Nursery / Preschool | 0 | 0.0% |
| Kindergarten | 0 | 0.0% |
| Elementary School | 0 | 0.0% |
| Middle School | 0 | 0.0% |
| High School | 0 | 0.0% |
| College / Undergraduate | 11 | 100.0% |
| Graduate / Professional | 0 | 0.0% |
| Total | 11 | 100.0% |
School Enrollment by Age by Funding Source in Marathon
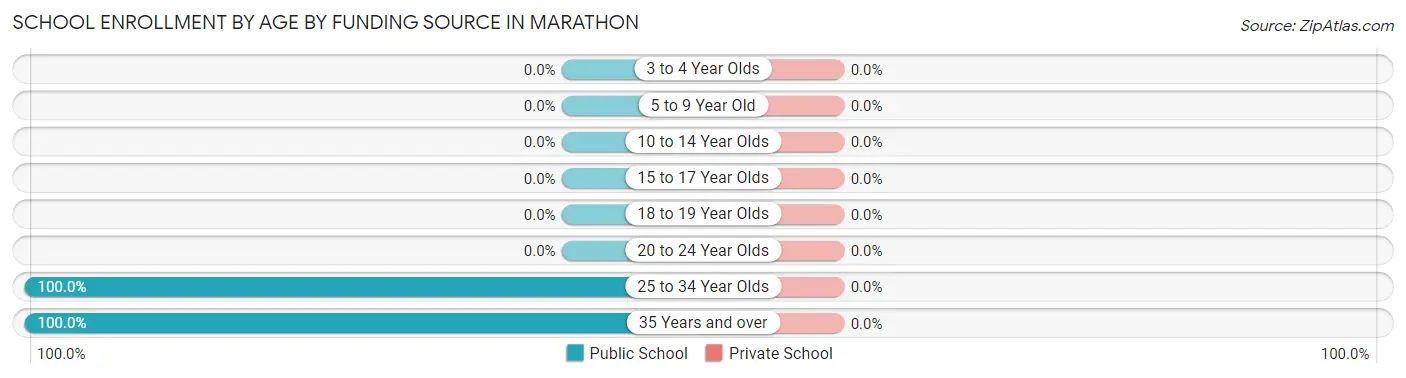
| Age Bracket | Public School | Private School |
| 3 to 4 Year Olds | 0 (0.0%) | 0 (0.0%) |
| 5 to 9 Year Old | 0 (0.0%) | 0 (0.0%) |
| 10 to 14 Year Olds | 0 (0.0%) | 0 (0.0%) |
| 15 to 17 Year Olds | 0 (0.0%) | 0 (0.0%) |
| 18 to 19 Year Olds | 0 (0.0%) | 0 (0.0%) |
| 20 to 24 Year Olds | 0 (0.0%) | 0 (0.0%) |
| 25 to 34 Year Olds | 1 (100.0%) | 0 (0.0%) |
| 35 Years and over | 10 (100.0%) | 0 (0.0%) |
| Total | 11 (100.0%) | 0 (0.0%) |
Educational Attainment by Field of Study in Marathon
Education (26 | 39.4%), physical & health sciences (17 | 25.8%), business (10 | 15.1%), arts & humanities (7 | 10.6%), and bio, nature & agricultural (6 | 9.1%) are the most common fields of study among 66 individuals in Marathon who have obtained a bachelor's degree or higher.
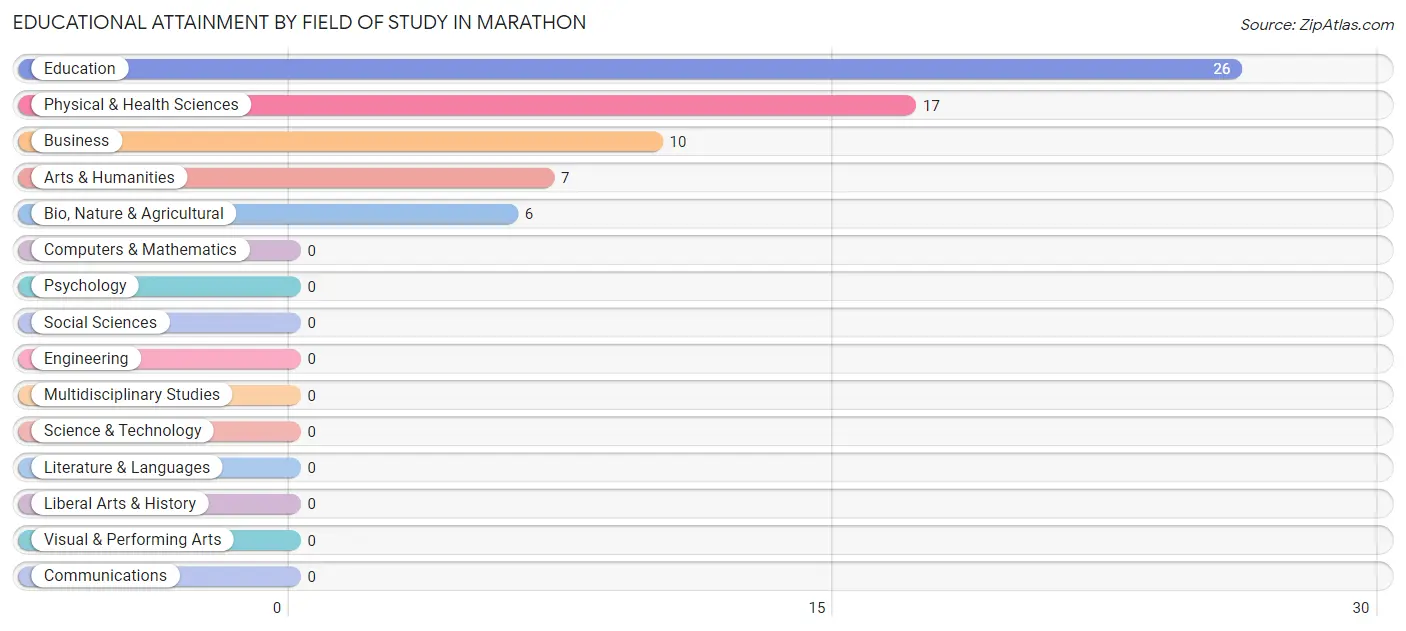
| Field of Study | # Graduates | % Graduates |
| Computers & Mathematics | 0 | 0.0% |
| Bio, Nature & Agricultural | 6 | 9.1% |
| Physical & Health Sciences | 17 | 25.8% |
| Psychology | 0 | 0.0% |
| Social Sciences | 0 | 0.0% |
| Engineering | 0 | 0.0% |
| Multidisciplinary Studies | 0 | 0.0% |
| Science & Technology | 0 | 0.0% |
| Business | 10 | 15.1% |
| Education | 26 | 39.4% |
| Literature & Languages | 0 | 0.0% |
| Liberal Arts & History | 0 | 0.0% |
| Visual & Performing Arts | 0 | 0.0% |
| Communications | 0 | 0.0% |
| Arts & Humanities | 7 | 10.6% |
| Total | 66 | 100.0% |
Transportation & Commute in Marathon
Vehicle Availability by Sex in Marathon
The most prevalent vehicle ownership categories in Marathon are males with 4 vehicles (33, accounting for 48.5%) and females with 4 vehicles (0, making up 38.4%).
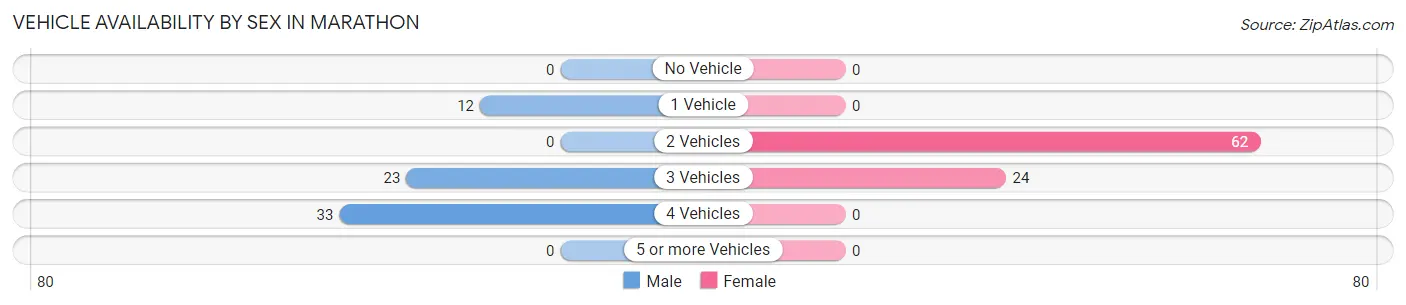
| Vehicles Available | Male | Female |
| No Vehicle | 0 (0.0%) | 0 (0.0%) |
| 1 Vehicle | 12 (17.6%) | 0 (0.0%) |
| 2 Vehicles | 0 (0.0%) | 62 (72.1%) |
| 3 Vehicles | 23 (33.8%) | 24 (27.9%) |
| 4 Vehicles | 33 (48.5%) | 0 (0.0%) |
| 5 or more Vehicles | 0 (0.0%) | 0 (0.0%) |
| Total | 68 (100.0%) | 86 (100.0%) |
Commute Time in Marathon
The most frequently occuring commute durations in Marathon are 5 to 9 minutes (73 commuters, 49.7%), 60 to 89 minutes (31 commuters, 21.1%), and less than 5 minutes (17 commuters, 11.6%).
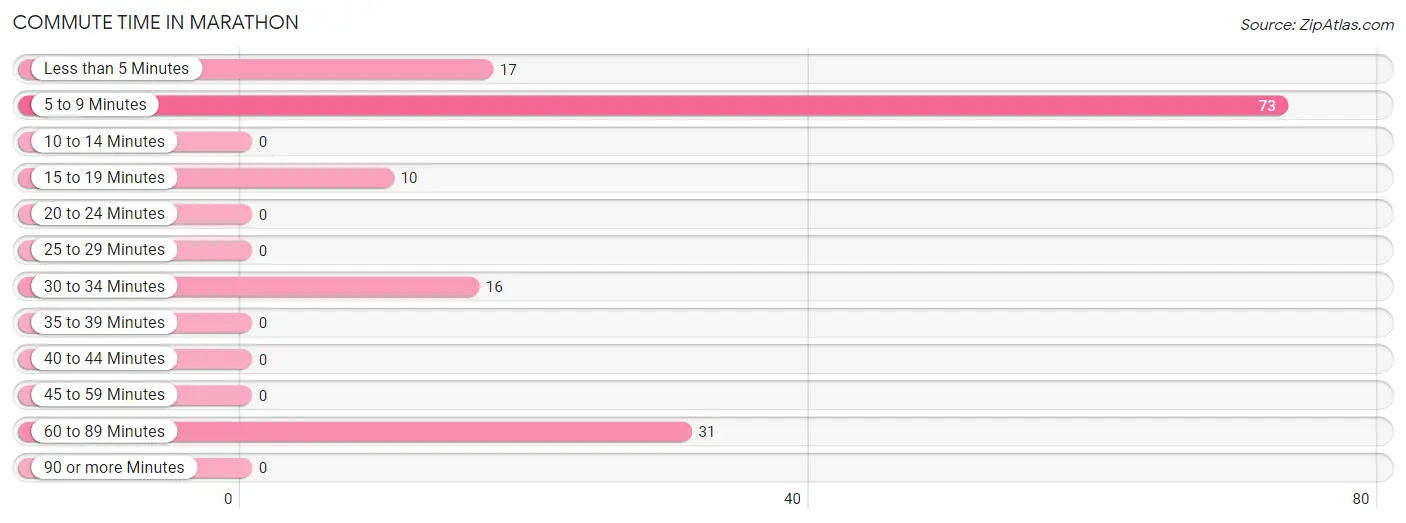
| Commute Time | # Commuters | % Commuters |
| Less than 5 Minutes | 17 | 11.6% |
| 5 to 9 Minutes | 73 | 49.7% |
| 10 to 14 Minutes | 0 | 0.0% |
| 15 to 19 Minutes | 10 | 6.8% |
| 20 to 24 Minutes | 0 | 0.0% |
| 25 to 29 Minutes | 0 | 0.0% |
| 30 to 34 Minutes | 16 | 10.9% |
| 35 to 39 Minutes | 0 | 0.0% |
| 40 to 44 Minutes | 0 | 0.0% |
| 45 to 59 Minutes | 0 | 0.0% |
| 60 to 89 Minutes | 31 | 21.1% |
| 90 or more Minutes | 0 | 0.0% |
Commute Time by Sex in Marathon
The most common commute times in Marathon are 5 to 9 minutes (21 commuters, 30.9%) for males and 5 to 9 minutes (52 commuters, 65.8%) for females.
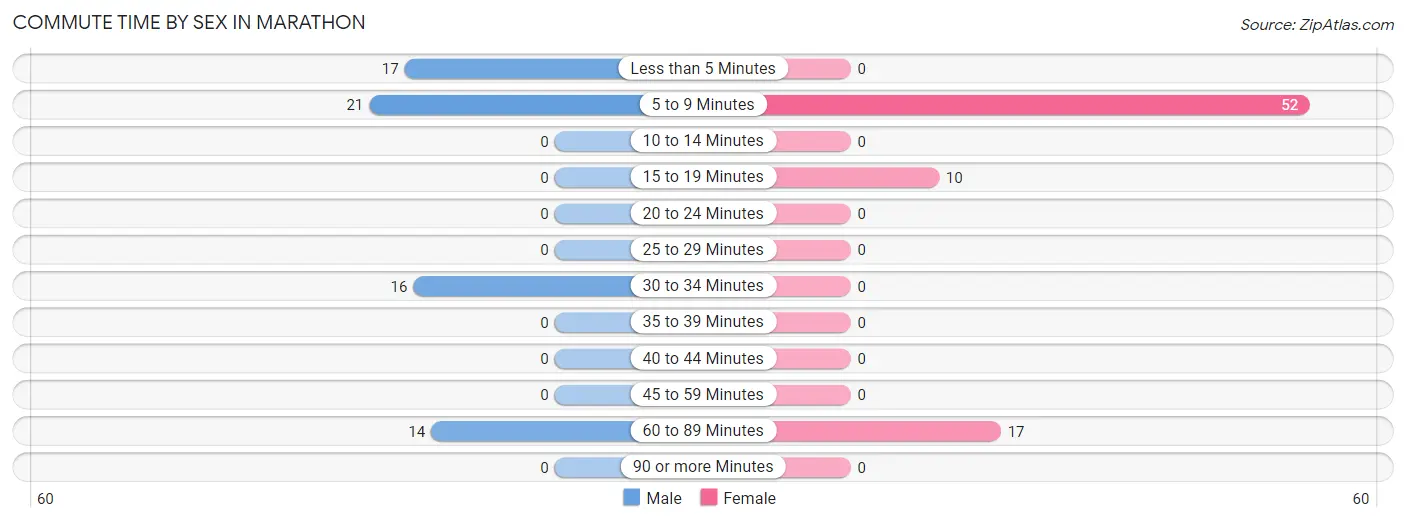
| Commute Time | Male | Female |
| Less than 5 Minutes | 17 (25.0%) | 0 (0.0%) |
| 5 to 9 Minutes | 21 (30.9%) | 52 (65.8%) |
| 10 to 14 Minutes | 0 (0.0%) | 0 (0.0%) |
| 15 to 19 Minutes | 0 (0.0%) | 10 (12.7%) |
| 20 to 24 Minutes | 0 (0.0%) | 0 (0.0%) |
| 25 to 29 Minutes | 0 (0.0%) | 0 (0.0%) |
| 30 to 34 Minutes | 16 (23.5%) | 0 (0.0%) |
| 35 to 39 Minutes | 0 (0.0%) | 0 (0.0%) |
| 40 to 44 Minutes | 0 (0.0%) | 0 (0.0%) |
| 45 to 59 Minutes | 0 (0.0%) | 0 (0.0%) |
| 60 to 89 Minutes | 14 (20.6%) | 17 (21.5%) |
| 90 or more Minutes | 0 (0.0%) | 0 (0.0%) |
Time of Departure to Work by Sex in Marathon
The most frequent times of departure to work in Marathon are 12:00 PM to 3:59 PM (29, 42.6%) for males and 8:30 AM to 8:59 AM (51, 64.6%) for females.
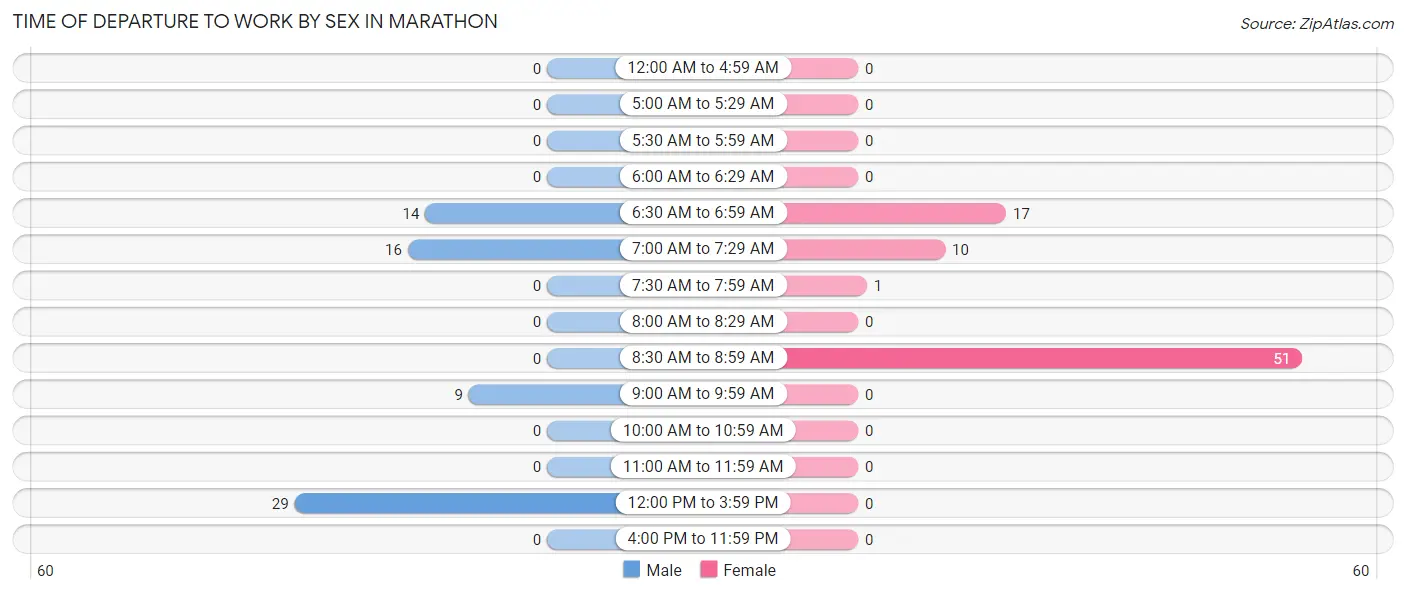
| Time of Departure | Male | Female |
| 12:00 AM to 4:59 AM | 0 (0.0%) | 0 (0.0%) |
| 5:00 AM to 5:29 AM | 0 (0.0%) | 0 (0.0%) |
| 5:30 AM to 5:59 AM | 0 (0.0%) | 0 (0.0%) |
| 6:00 AM to 6:29 AM | 0 (0.0%) | 0 (0.0%) |
| 6:30 AM to 6:59 AM | 14 (20.6%) | 17 (21.5%) |
| 7:00 AM to 7:29 AM | 16 (23.5%) | 10 (12.7%) |
| 7:30 AM to 7:59 AM | 0 (0.0%) | 1 (1.3%) |
| 8:00 AM to 8:29 AM | 0 (0.0%) | 0 (0.0%) |
| 8:30 AM to 8:59 AM | 0 (0.0%) | 51 (64.6%) |
| 9:00 AM to 9:59 AM | 9 (13.2%) | 0 (0.0%) |
| 10:00 AM to 10:59 AM | 0 (0.0%) | 0 (0.0%) |
| 11:00 AM to 11:59 AM | 0 (0.0%) | 0 (0.0%) |
| 12:00 PM to 3:59 PM | 29 (42.6%) | 0 (0.0%) |
| 4:00 PM to 11:59 PM | 0 (0.0%) | 0 (0.0%) |
| Total | 68 (100.0%) | 79 (100.0%) |
Housing Occupancy in Marathon
Occupancy by Ownership in Marathon
Of the total 174 dwellings in Marathon, owner-occupied units account for 94 (54.0%), while renter-occupied units make up 80 (46.0%).
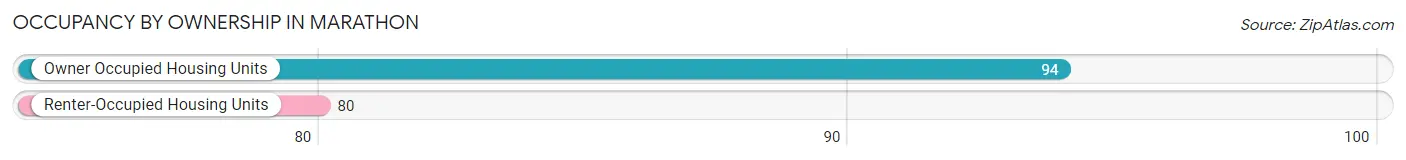
| Occupancy | # Housing Units | % Housing Units |
| Owner Occupied Housing Units | 94 | 54.0% |
| Renter-Occupied Housing Units | 80 | 46.0% |
| Total Occupied Housing Units | 174 | 100.0% |
Occupancy by Household Size in Marathon
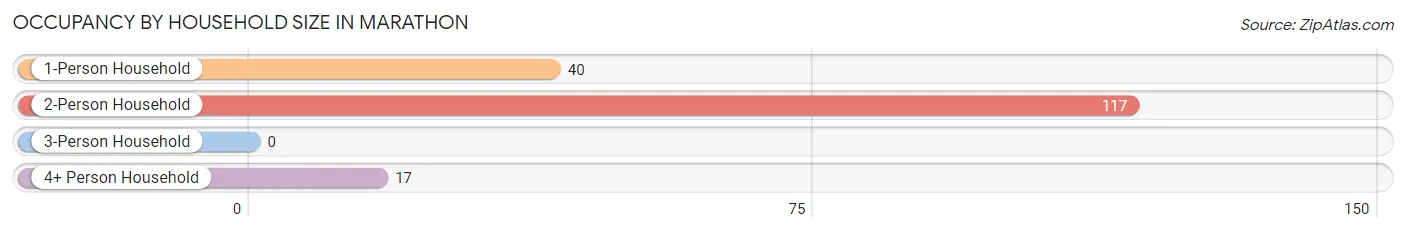
| Household Size | # Housing Units | % Housing Units |
| 1-Person Household | 40 | 23.0% |
| 2-Person Household | 117 | 67.2% |
| 3-Person Household | 0 | 0.0% |
| 4+ Person Household | 17 | 9.8% |
| Total Housing Units | 174 | 100.0% |
Occupancy by Ownership by Household Size in Marathon
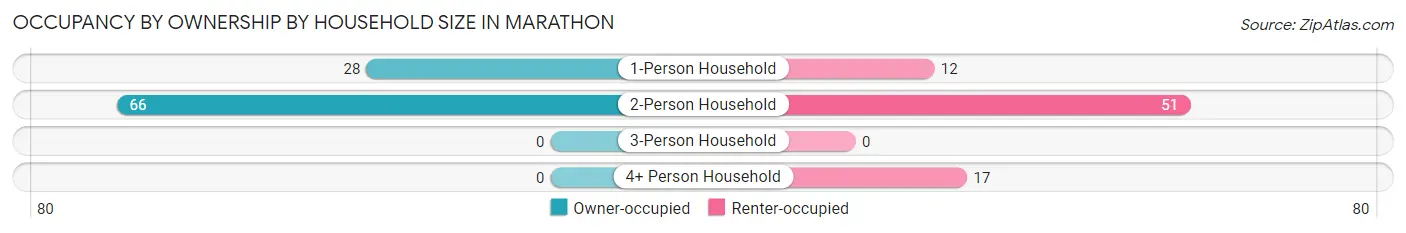
| Household Size | Owner-occupied | Renter-occupied |
| 1-Person Household | 28 (70.0%) | 12 (30.0%) |
| 2-Person Household | 66 (56.4%) | 51 (43.6%) |
| 3-Person Household | 0 (0.0%) | 0 (0.0%) |
| 4+ Person Household | 0 (0.0%) | 17 (100.0%) |
| Total Housing Units | 94 (54.0%) | 80 (46.0%) |
Occupancy by Educational Attainment in Marathon
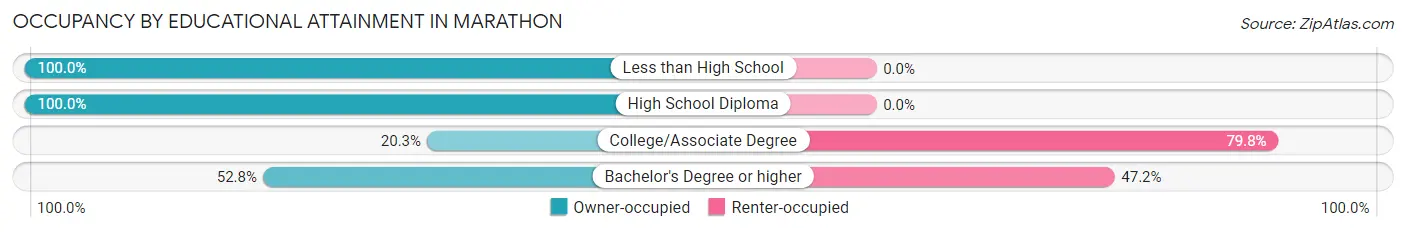
| Household Size | Owner-occupied | Renter-occupied |
| Less than High School | 33 (100.0%) | 0 (0.0%) |
| High School Diploma | 26 (100.0%) | 0 (0.0%) |
| College/Associate Degree | 16 (20.3%) | 63 (79.7%) |
| Bachelor's Degree or higher | 19 (52.8%) | 17 (47.2%) |
Occupancy by Age of Householder in Marathon
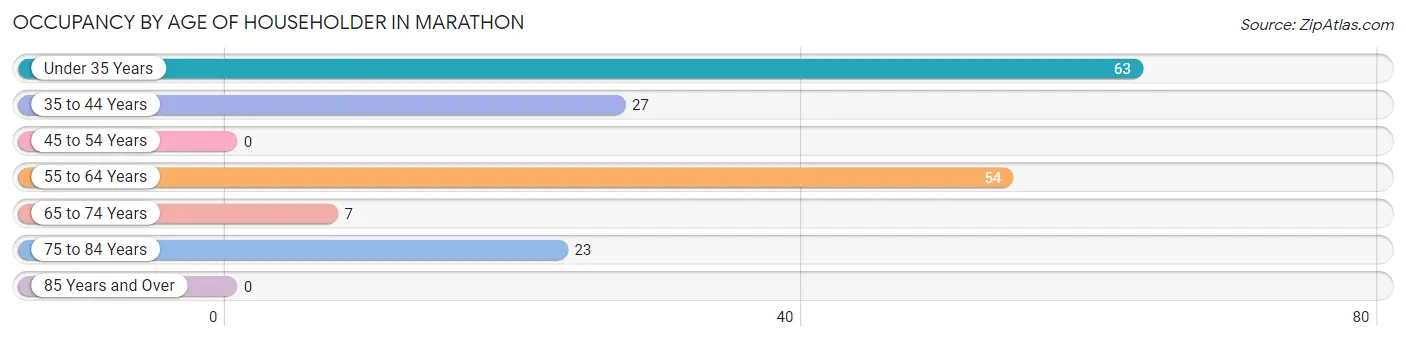
| Age Bracket | # Households | % Households |
| Under 35 Years | 63 | 36.2% |
| 35 to 44 Years | 27 | 15.5% |
| 45 to 54 Years | 0 | 0.0% |
| 55 to 64 Years | 54 | 31.0% |
| 65 to 74 Years | 7 | 4.0% |
| 75 to 84 Years | 23 | 13.2% |
| 85 Years and Over | 0 | 0.0% |
| Total | 174 | 100.0% |
Housing Finances in Marathon
Median Income by Occupancy in Marathon
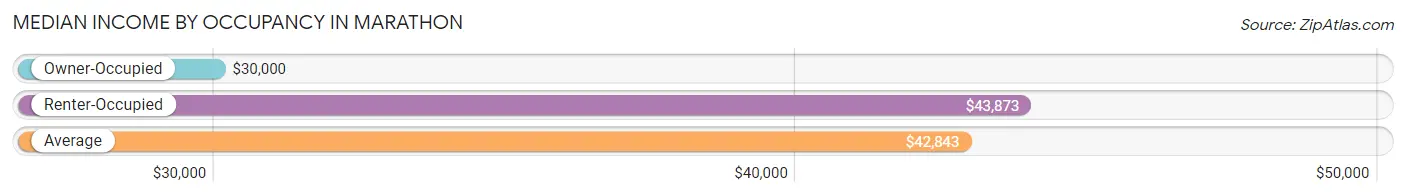
| Occupancy Type | # Households | Median Income |
| Owner-Occupied | 94 (54.0%) | $30,000 |
| Renter-Occupied | 80 (46.0%) | $43,873 |
| Average | 174 (100.0%) | $42,843 |
Occupancy by Householder Income Bracket in Marathon
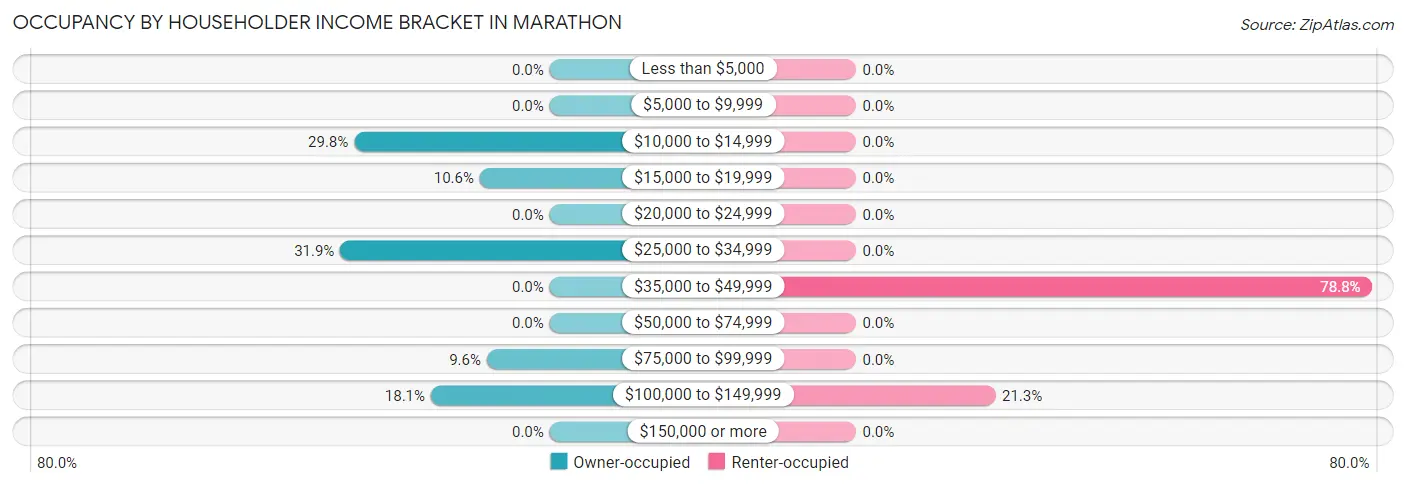
| Income Bracket | Owner-occupied | Renter-occupied |
| Less than $5,000 | 0 (0.0%) | 0 (0.0%) |
| $5,000 to $9,999 | 0 (0.0%) | 0 (0.0%) |
| $10,000 to $14,999 | 28 (29.8%) | 0 (0.0%) |
| $15,000 to $19,999 | 10 (10.6%) | 0 (0.0%) |
| $20,000 to $24,999 | 0 (0.0%) | 0 (0.0%) |
| $25,000 to $34,999 | 30 (31.9%) | 0 (0.0%) |
| $35,000 to $49,999 | 0 (0.0%) | 63 (78.7%) |
| $50,000 to $74,999 | 0 (0.0%) | 0 (0.0%) |
| $75,000 to $99,999 | 9 (9.6%) | 0 (0.0%) |
| $100,000 to $149,999 | 17 (18.1%) | 17 (21.2%) |
| $150,000 or more | 0 (0.0%) | 0 (0.0%) |
| Total | 94 (100.0%) | 80 (100.0%) |
Monthly Housing Cost Tiers in Marathon
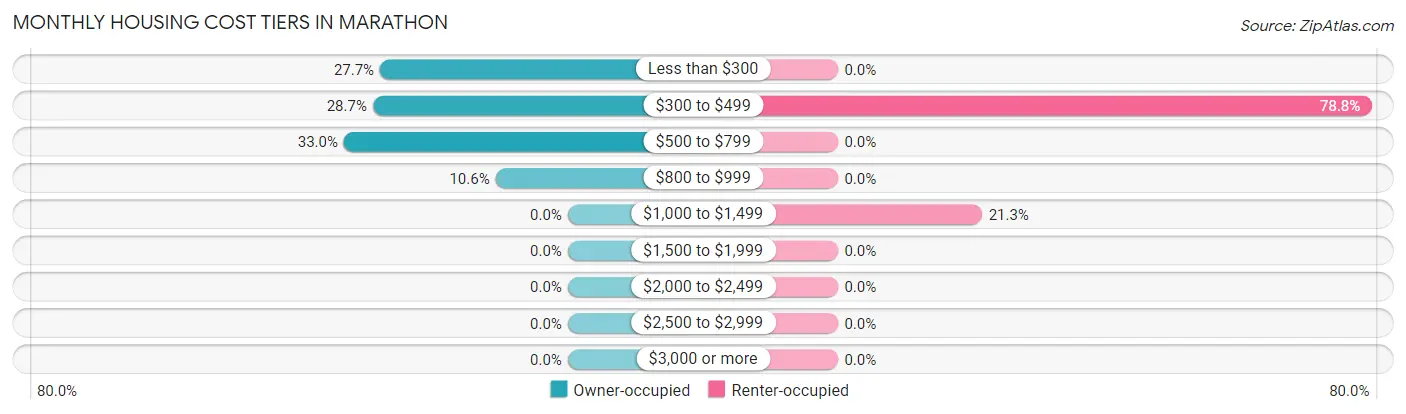
| Monthly Cost | Owner-occupied | Renter-occupied |
| Less than $300 | 26 (27.7%) | 0 (0.0%) |
| $300 to $499 | 27 (28.7%) | 63 (78.7%) |
| $500 to $799 | 31 (33.0%) | 0 (0.0%) |
| $800 to $999 | 10 (10.6%) | 0 (0.0%) |
| $1,000 to $1,499 | 0 (0.0%) | 17 (21.2%) |
| $1,500 to $1,999 | 0 (0.0%) | 0 (0.0%) |
| $2,000 to $2,499 | 0 (0.0%) | 0 (0.0%) |
| $2,500 to $2,999 | 0 (0.0%) | 0 (0.0%) |
| $3,000 or more | 0 (0.0%) | 0 (0.0%) |
| Total | 94 (100.0%) | 80 (100.0%) |
Physical Housing Characteristics in Marathon
Housing Structures in Marathon
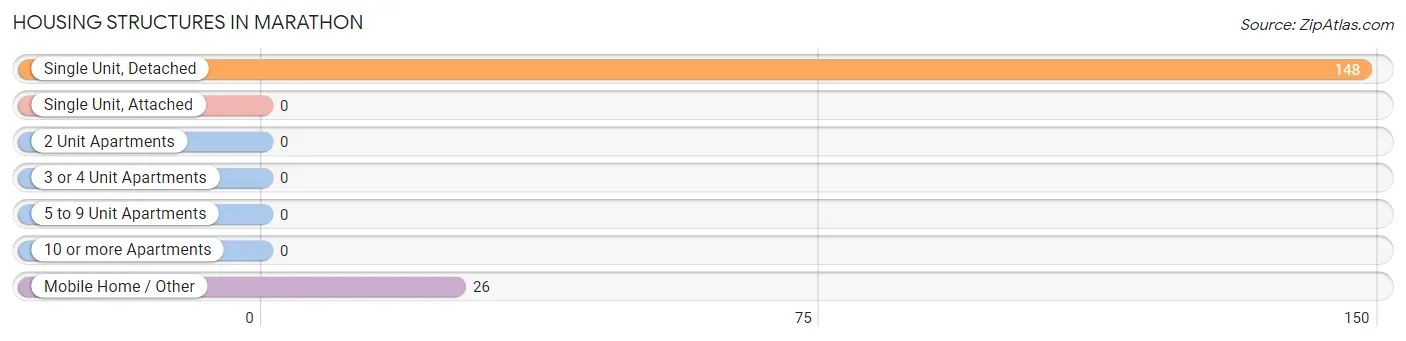
| Structure Type | # Housing Units | % Housing Units |
| Single Unit, Detached | 148 | 85.1% |
| Single Unit, Attached | 0 | 0.0% |
| 2 Unit Apartments | 0 | 0.0% |
| 3 or 4 Unit Apartments | 0 | 0.0% |
| 5 to 9 Unit Apartments | 0 | 0.0% |
| 10 or more Apartments | 0 | 0.0% |
| Mobile Home / Other | 26 | 14.9% |
| Total | 174 | 100.0% |
Housing Structures by Occupancy in Marathon
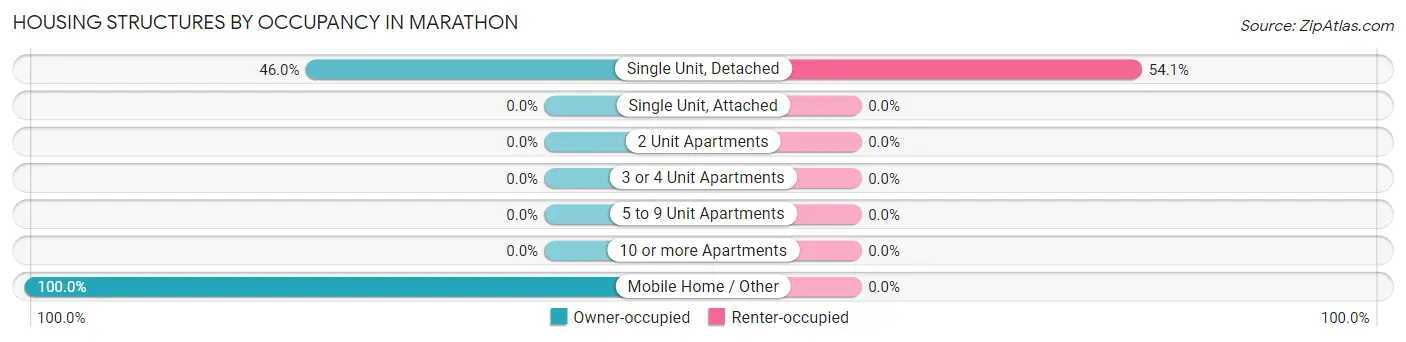
| Structure Type | Owner-occupied | Renter-occupied |
| Single Unit, Detached | 68 (46.0%) | 80 (54.0%) |
| Single Unit, Attached | 0 (0.0%) | 0 (0.0%) |
| 2 Unit Apartments | 0 (0.0%) | 0 (0.0%) |
| 3 or 4 Unit Apartments | 0 (0.0%) | 0 (0.0%) |
| 5 to 9 Unit Apartments | 0 (0.0%) | 0 (0.0%) |
| 10 or more Apartments | 0 (0.0%) | 0 (0.0%) |
| Mobile Home / Other | 26 (100.0%) | 0 (0.0%) |
| Total | 94 (54.0%) | 80 (46.0%) |
Housing Structures by Number of Rooms in Marathon
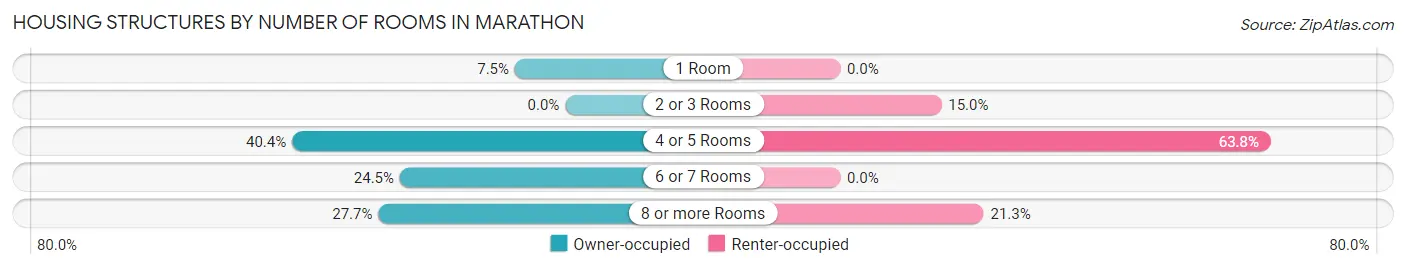
| Number of Rooms | Owner-occupied | Renter-occupied |
| 1 Room | 7 (7.4%) | 0 (0.0%) |
| 2 or 3 Rooms | 0 (0.0%) | 12 (15.0%) |
| 4 or 5 Rooms | 38 (40.4%) | 51 (63.7%) |
| 6 or 7 Rooms | 23 (24.5%) | 0 (0.0%) |
| 8 or more Rooms | 26 (27.7%) | 17 (21.2%) |
| Total | 94 (100.0%) | 80 (100.0%) |
Housing Structure by Heating Type in Marathon
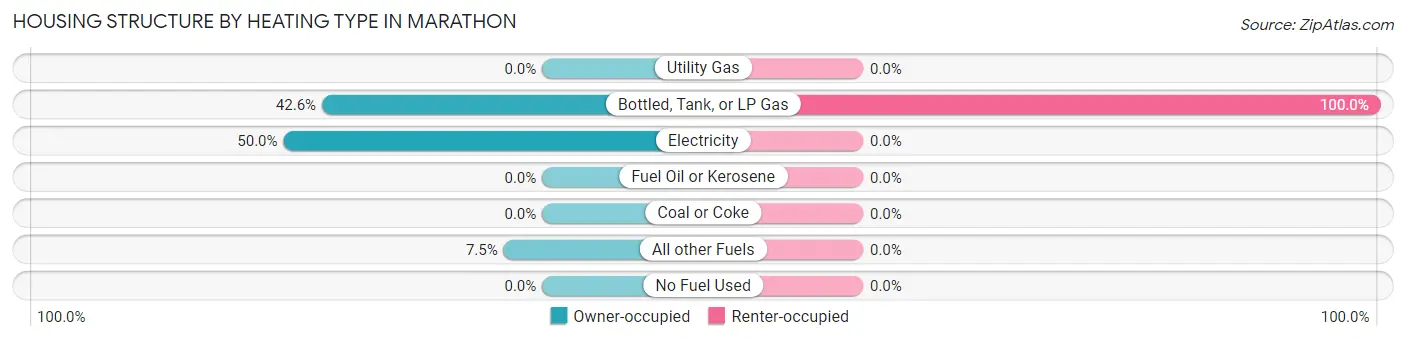
| Heating Type | Owner-occupied | Renter-occupied |
| Utility Gas | 0 (0.0%) | 0 (0.0%) |
| Bottled, Tank, or LP Gas | 40 (42.5%) | 80 (100.0%) |
| Electricity | 47 (50.0%) | 0 (0.0%) |
| Fuel Oil or Kerosene | 0 (0.0%) | 0 (0.0%) |
| Coal or Coke | 0 (0.0%) | 0 (0.0%) |
| All other Fuels | 7 (7.4%) | 0 (0.0%) |
| No Fuel Used | 0 (0.0%) | 0 (0.0%) |
| Total | 94 (100.0%) | 80 (100.0%) |
Household Vehicle Usage in Marathon
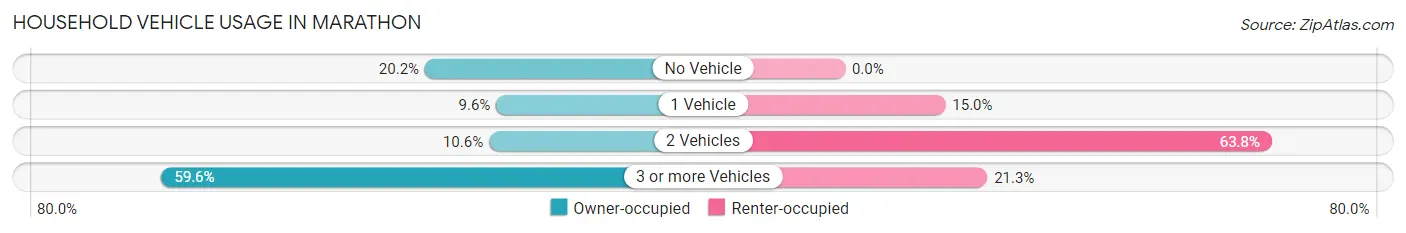
| Vehicles per Household | Owner-occupied | Renter-occupied |
| No Vehicle | 19 (20.2%) | 0 (0.0%) |
| 1 Vehicle | 9 (9.6%) | 12 (15.0%) |
| 2 Vehicles | 10 (10.6%) | 51 (63.7%) |
| 3 or more Vehicles | 56 (59.6%) | 17 (21.2%) |
| Total | 94 (100.0%) | 80 (100.0%) |
Real Estate & Mortgages in Marathon
Real Estate and Mortgage Overview in Marathon
| Characteristic | Without Mortgage | With Mortgage |
| Housing Units | 77 | 17 |
| Median Property Value | $129,200 | $0 |
| Median Household Income | - | - |
| Monthly Housing Costs | $458 | $0 |
| Real Estate Taxes | $1,650 | $0 |
Property Value by Mortgage Status in Marathon
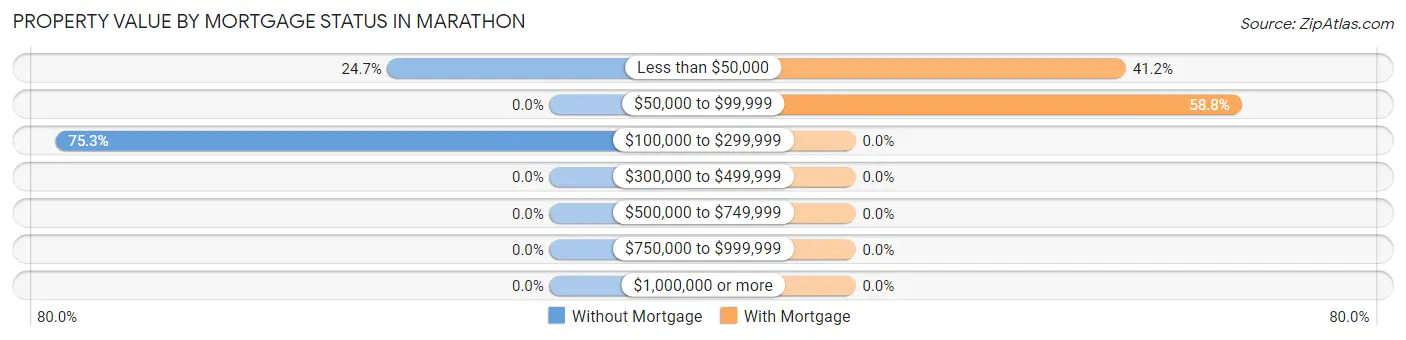
| Property Value | Without Mortgage | With Mortgage |
| Less than $50,000 | 19 (24.7%) | 7 (41.2%) |
| $50,000 to $99,999 | 0 (0.0%) | 10 (58.8%) |
| $100,000 to $299,999 | 58 (75.3%) | 0 (0.0%) |
| $300,000 to $499,999 | 0 (0.0%) | 0 (0.0%) |
| $500,000 to $749,999 | 0 (0.0%) | 0 (0.0%) |
| $750,000 to $999,999 | 0 (0.0%) | 0 (0.0%) |
| $1,000,000 or more | 0 (0.0%) | 0 (0.0%) |
| Total | 77 (100.0%) | 17 (100.0%) |
Household Income by Mortgage Status in Marathon
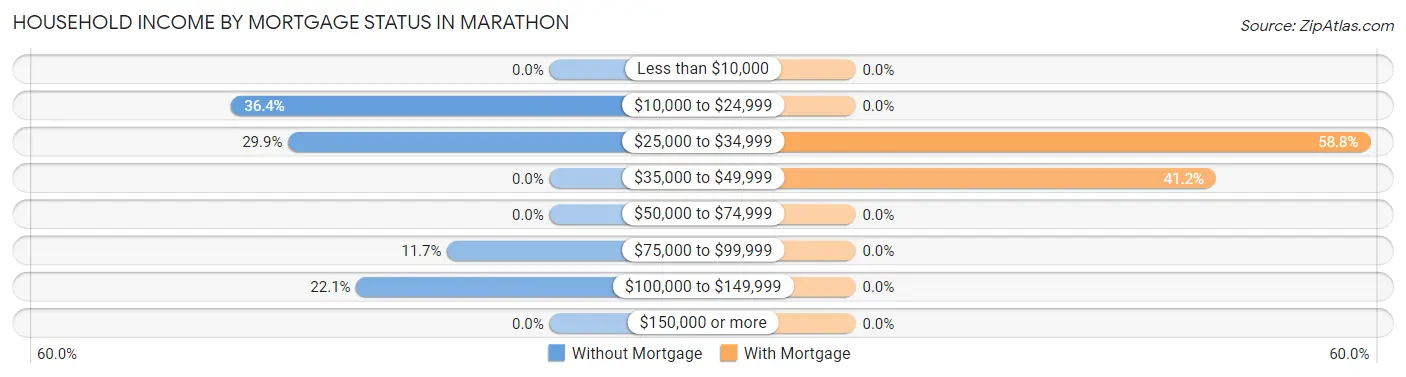
| Household Income | Without Mortgage | With Mortgage |
| Less than $10,000 | 0 (0.0%) | 0 (0.0%) |
| $10,000 to $24,999 | 28 (36.4%) | 0 (0.0%) |
| $25,000 to $34,999 | 23 (29.9%) | 10 (58.8%) |
| $35,000 to $49,999 | 0 (0.0%) | 7 (41.2%) |
| $50,000 to $74,999 | 0 (0.0%) | 0 (0.0%) |
| $75,000 to $99,999 | 9 (11.7%) | 0 (0.0%) |
| $100,000 to $149,999 | 17 (22.1%) | 0 (0.0%) |
| $150,000 or more | 0 (0.0%) | 0 (0.0%) |
| Total | 77 (100.0%) | 17 (100.0%) |
Property Value to Household Income Ratio in Marathon
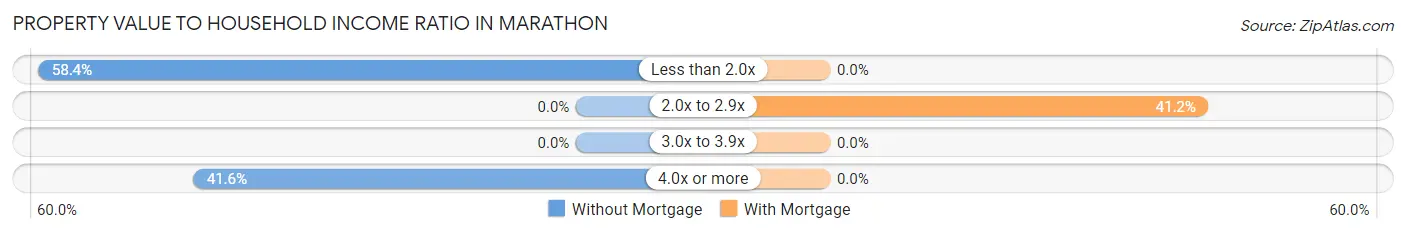
| Value-to-Income Ratio | Without Mortgage | With Mortgage |
| Less than 2.0x | 45 (58.4%) | 0 (0.0%) |
| 2.0x to 2.9x | 0 (0.0%) | 7 (41.2%) |
| 3.0x to 3.9x | 0 (0.0%) | 0 (0.0%) |
| 4.0x or more | 32 (41.6%) | 0 (0.0%) |
| Total | 77 (100.0%) | 17 (100.0%) |
Real Estate Taxes by Mortgage Status in Marathon
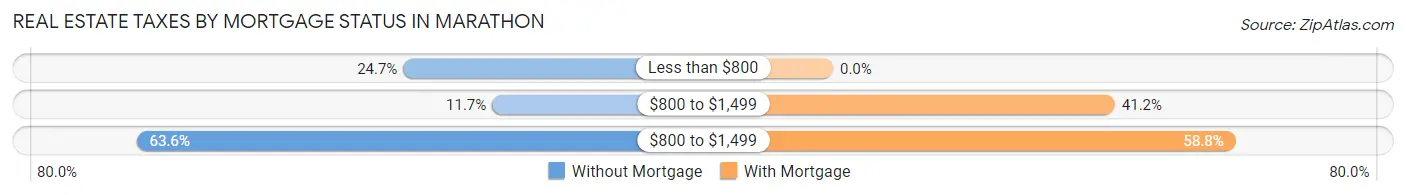
| Property Taxes | Without Mortgage | With Mortgage |
| Less than $800 | 19 (24.7%) | 0 (0.0%) |
| $800 to $1,499 | 9 (11.7%) | 7 (41.2%) |
| $800 to $1,499 | 49 (63.6%) | 10 (58.8%) |
| Total | 77 (100.0%) | 17 (100.0%) |
Health & Disability in Marathon
Health Insurance Coverage by Age in Marathon
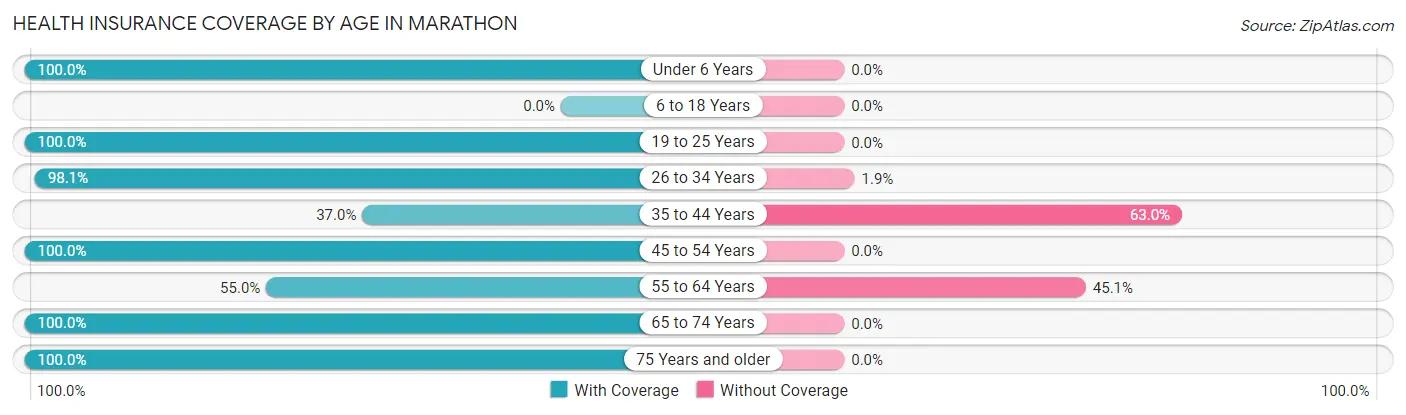
| Age Bracket | With Coverage | Without Coverage |
| Under 6 Years | 43 (100.0%) | 0 (0.0%) |
| 6 to 18 Years | 0 (0.0%) | 0 (0.0%) |
| 19 to 25 Years | 12 (100.0%) | 0 (0.0%) |
| 26 to 34 Years | 51 (98.1%) | 1 (1.9%) |
| 35 to 44 Years | 10 (37.0%) | 17 (63.0%) |
| 45 to 54 Years | 7 (100.0%) | 0 (0.0%) |
| 55 to 64 Years | 50 (54.9%) | 41 (45.1%) |
| 65 to 74 Years | 20 (100.0%) | 0 (0.0%) |
| 75 Years and older | 23 (100.0%) | 0 (0.0%) |
| Total | 216 (78.5%) | 59 (21.4%) |
Health Insurance Coverage by Citizenship Status in Marathon
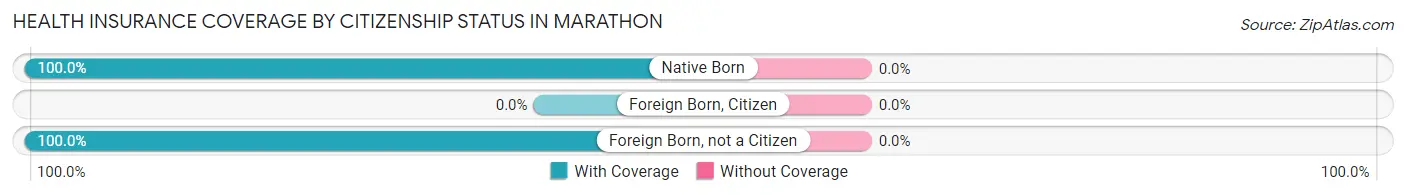
| Citizenship Status | With Coverage | Without Coverage |
| Native Born | 43 (100.0%) | 0 (0.0%) |
| Foreign Born, Citizen | 0 (0.0%) | 0 (0.0%) |
| Foreign Born, not a Citizen | 12 (100.0%) | 0 (0.0%) |
Health Insurance Coverage by Household Income in Marathon
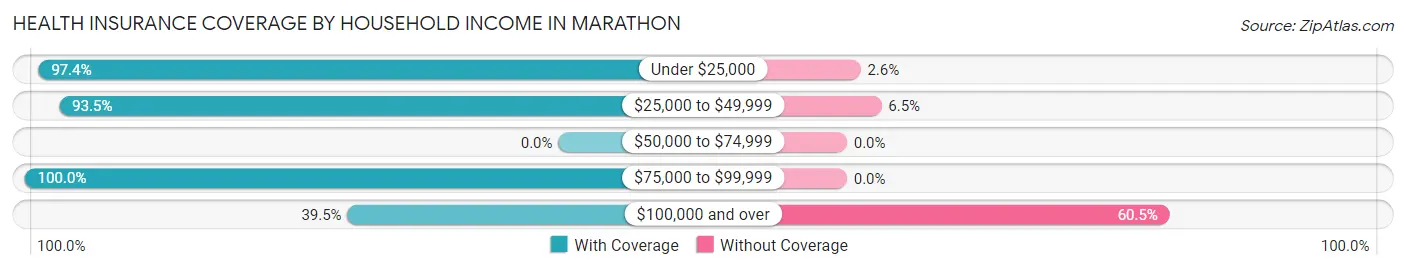
| Household Income | With Coverage | Without Coverage |
| Under $25,000 | 38 (97.4%) | 1 (2.6%) |
| $25,000 to $49,999 | 130 (93.5%) | 9 (6.5%) |
| $50,000 to $74,999 | 0 (0.0%) | 0 (0.0%) |
| $75,000 to $99,999 | 16 (100.0%) | 0 (0.0%) |
| $100,000 and over | 32 (39.5%) | 49 (60.5%) |
Public vs Private Health Insurance Coverage by Age in Marathon
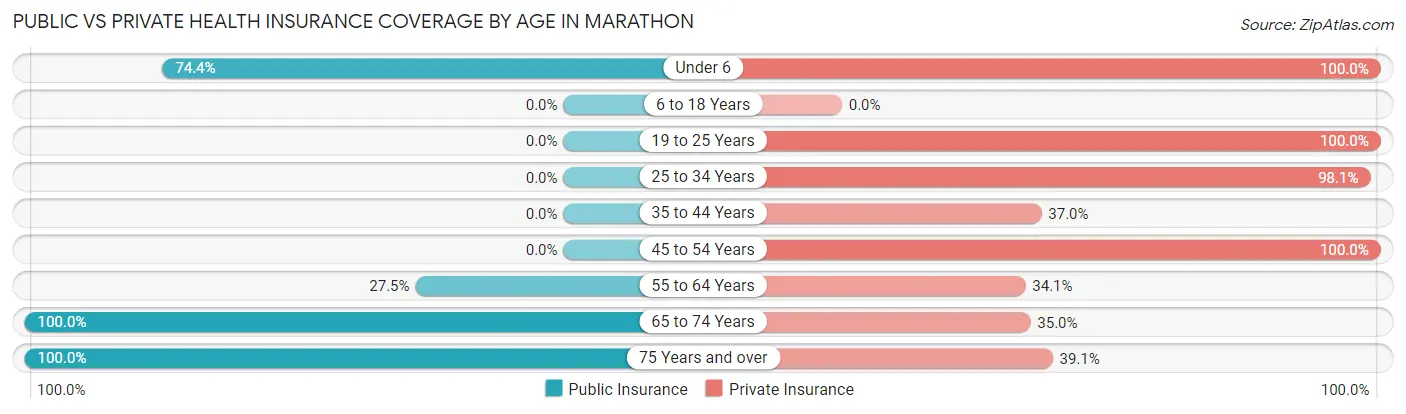
| Age Bracket | Public Insurance | Private Insurance |
| Under 6 | 32 (74.4%) | 43 (100.0%) |
| 6 to 18 Years | 0 (0.0%) | 0 (0.0%) |
| 19 to 25 Years | 0 (0.0%) | 12 (100.0%) |
| 25 to 34 Years | 0 (0.0%) | 51 (98.1%) |
| 35 to 44 Years | 0 (0.0%) | 10 (37.0%) |
| 45 to 54 Years | 0 (0.0%) | 7 (100.0%) |
| 55 to 64 Years | 25 (27.5%) | 31 (34.1%) |
| 65 to 74 Years | 20 (100.0%) | 7 (35.0%) |
| 75 Years and over | 23 (100.0%) | 9 (39.1%) |
| Total | 100 (36.4%) | 170 (61.8%) |
Disability Status by Sex by Age in Marathon
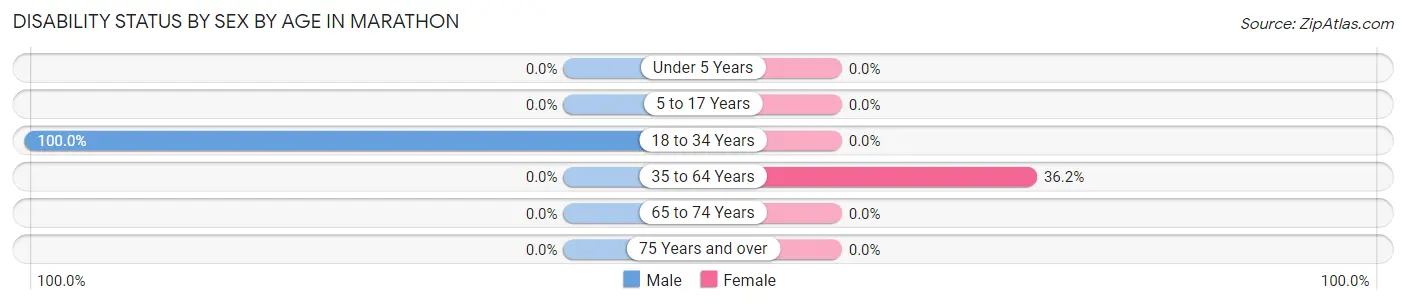
| Age Bracket | Male | Female |
| Under 5 Years | 0 (0.0%) | 0 (0.0%) |
| 5 to 17 Years | 0 (0.0%) | 0 (0.0%) |
| 18 to 34 Years | 12 (100.0%) | 0 (0.0%) |
| 35 to 64 Years | 0 (0.0%) | 25 (36.2%) |
| 65 to 74 Years | 0 (0.0%) | 0 (0.0%) |
| 75 Years and over | 0 (0.0%) | 0 (0.0%) |
Disability Class by Sex by Age in Marathon
Disability Class: Hearing Difficulty
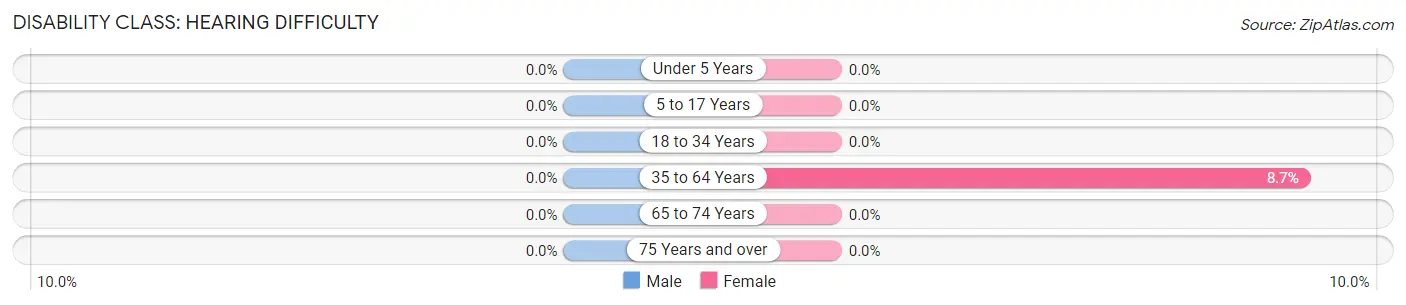
| Age Bracket | Male | Female |
| Under 5 Years | 0 (0.0%) | 0 (0.0%) |
| 5 to 17 Years | 0 (0.0%) | 0 (0.0%) |
| 18 to 34 Years | 0 (0.0%) | 0 (0.0%) |
| 35 to 64 Years | 0 (0.0%) | 6 (8.7%) |
| 65 to 74 Years | 0 (0.0%) | 0 (0.0%) |
| 75 Years and over | 0 (0.0%) | 0 (0.0%) |
Disability Class: Vision Difficulty
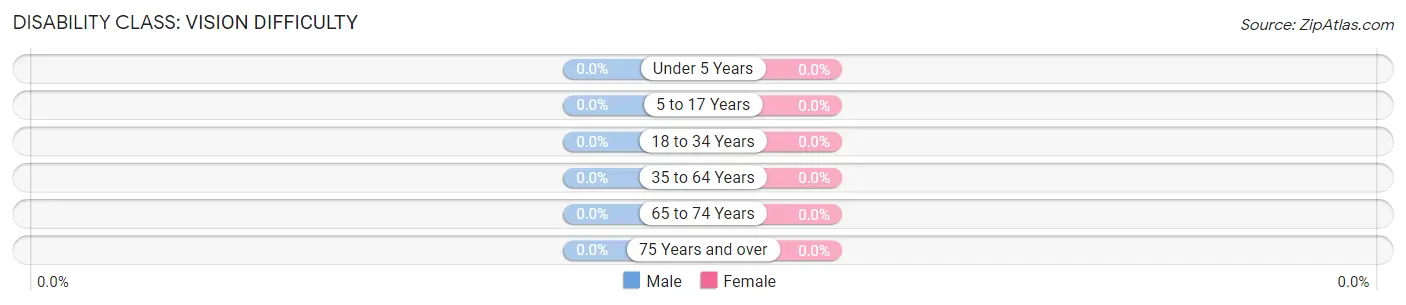
| Age Bracket | Male | Female |
| Under 5 Years | 0 (0.0%) | 0 (0.0%) |
| 5 to 17 Years | 0 (0.0%) | 0 (0.0%) |
| 18 to 34 Years | 0 (0.0%) | 0 (0.0%) |
| 35 to 64 Years | 0 (0.0%) | 0 (0.0%) |
| 65 to 74 Years | 0 (0.0%) | 0 (0.0%) |
| 75 Years and over | 0 (0.0%) | 0 (0.0%) |
Disability Class: Cognitive Difficulty
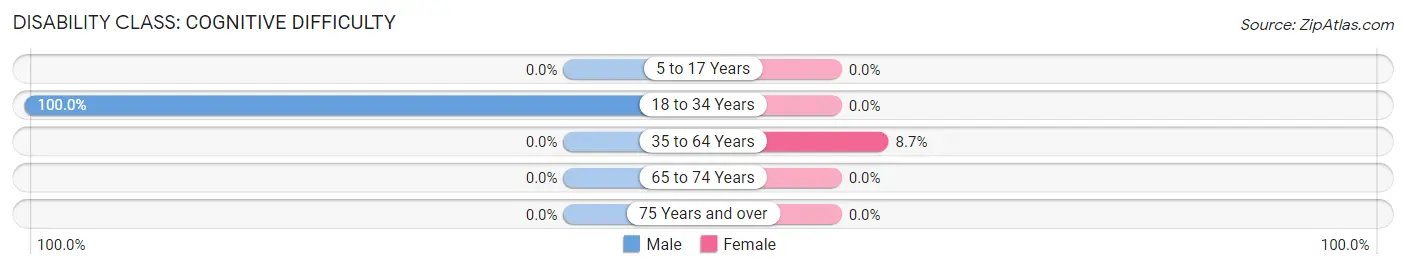
| Age Bracket | Male | Female |
| 5 to 17 Years | 0 (0.0%) | 0 (0.0%) |
| 18 to 34 Years | 12 (100.0%) | 0 (0.0%) |
| 35 to 64 Years | 0 (0.0%) | 6 (8.7%) |
| 65 to 74 Years | 0 (0.0%) | 0 (0.0%) |
| 75 Years and over | 0 (0.0%) | 0 (0.0%) |
Disability Class: Ambulatory Difficulty
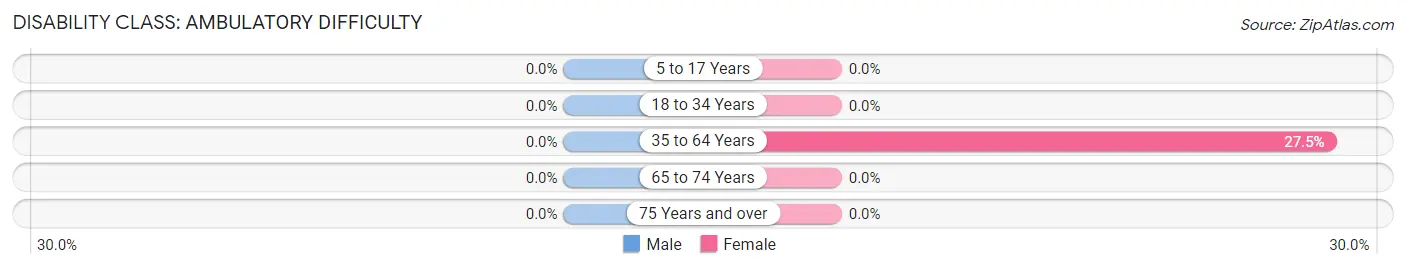
| Age Bracket | Male | Female |
| 5 to 17 Years | 0 (0.0%) | 0 (0.0%) |
| 18 to 34 Years | 0 (0.0%) | 0 (0.0%) |
| 35 to 64 Years | 0 (0.0%) | 19 (27.5%) |
| 65 to 74 Years | 0 (0.0%) | 0 (0.0%) |
| 75 Years and over | 0 (0.0%) | 0 (0.0%) |
Disability Class: Self-Care Difficulty
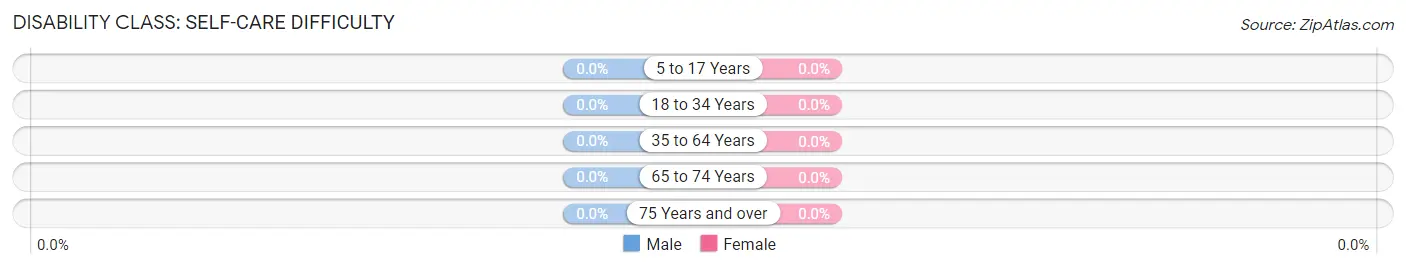
| Age Bracket | Male | Female |
| 5 to 17 Years | 0 (0.0%) | 0 (0.0%) |
| 18 to 34 Years | 0 (0.0%) | 0 (0.0%) |
| 35 to 64 Years | 0 (0.0%) | 0 (0.0%) |
| 65 to 74 Years | 0 (0.0%) | 0 (0.0%) |
| 75 Years and over | 0 (0.0%) | 0 (0.0%) |
Technology Access in Marathon
Computing Device Access in Marathon
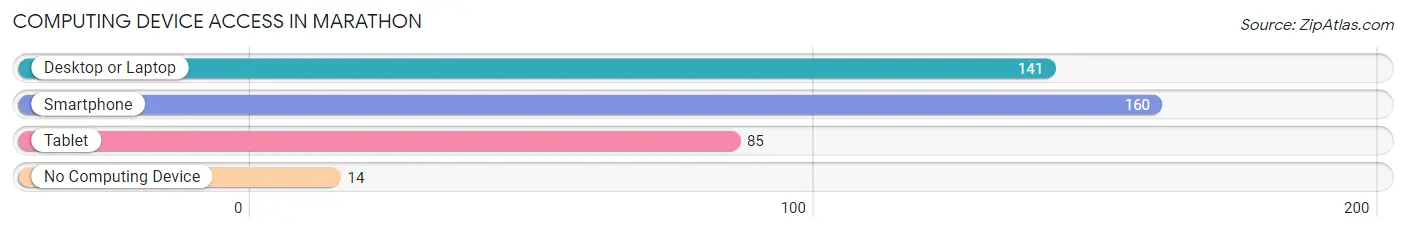
| Device Type | # Households | % Households |
| Desktop or Laptop | 141 | 81.0% |
| Smartphone | 160 | 91.9% |
| Tablet | 85 | 48.8% |
| No Computing Device | 14 | 8.1% |
| Total | 174 | 100.0% |
Internet Access in Marathon
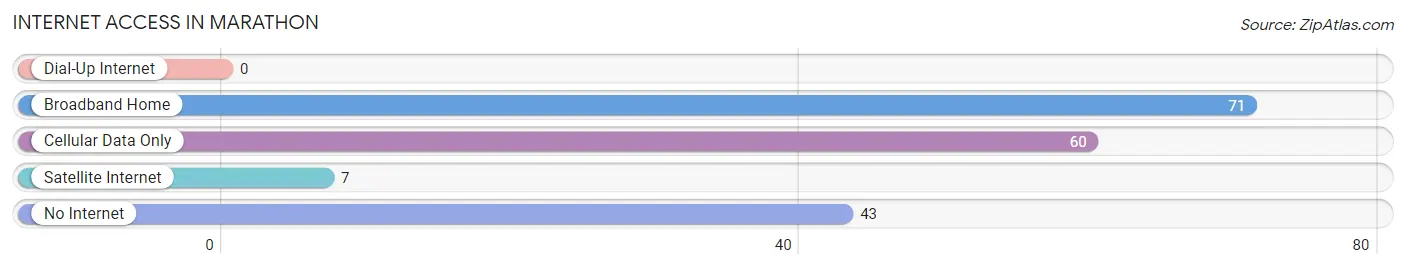
| Internet Type | # Households | % Households |
| Dial-Up Internet | 0 | 0.0% |
| Broadband Home | 71 | 40.8% |
| Cellular Data Only | 60 | 34.5% |
| Satellite Internet | 7 | 4.0% |
| No Internet | 43 | 24.7% |
| Total | 174 | 100.0% |
Marathon Summary
Marathon, Texas is a small town located in Brewster County in the Trans-Pecos region of West Texas. It is situated on the banks of the Rio Grande River, near the Big Bend National Park. The town was founded in 1882 and has a population of approximately 1,800 people.
History
Marathon was founded in 1882 by a group of ranchers and farmers who were looking for a place to settle and raise their families. The town was named after the nearby Marathon Mountains, which were named after the Greek legend of the Marathon race. The town was originally a stop on the Southern Pacific Railroad, and it quickly grew into a bustling community.
In the early 1900s, Marathon was a major center for the cattle industry. The town was home to several large ranches, and it was a popular destination for cowboys and ranchers. The town also had a thriving business district, with several stores, saloons, and hotels.
In the 1920s, Marathon began to experience a decline in population as the cattle industry moved away from the area. The town was also affected by the Great Depression, and many of the businesses closed. However, the town was able to survive and eventually began to experience a resurgence in the 1950s.
Geography
Marathon is located in Brewster County in the Trans-Pecos region of West Texas. It is situated on the banks of the Rio Grande River, near the Big Bend National Park. The town is surrounded by desert and mountains, and it has a semi-arid climate with hot summers and mild winters.
The town is located at an elevation of 2,845 feet, and it covers an area of 1.3 square miles. The terrain is mostly flat, with some hills and mountains in the surrounding area.
Economy
Marathon’s economy is largely based on tourism and agriculture. The town is a popular destination for tourists who come to visit the nearby Big Bend National Park. The town also has several restaurants, hotels, and other businesses that cater to tourists.
Agriculture is also an important part of the local economy. The town is home to several large ranches, and it is a major producer of cattle, sheep, and goats. The town also produces a variety of fruits and vegetables, including pecans, melons, and squash.
Demographics
As of the 2010 census, Marathon had a population of 1,788 people. The town is predominantly white, with a small Hispanic population. The median household income is $31,250, and the median home value is $90,000.
Marathon is served by the Brewster County School District, which includes two elementary schools, one middle school, and one high school. The town also has a library, a museum, and several churches.
Marathon is a small town with a rich history and a vibrant economy. It is a popular destination for tourists, and it is home to several large ranches and farms. The town is also home to a diverse population, and it is a great place to live and work.
Common Questions
What is Per Capita Income in Marathon?
Per Capita income in Marathon is $32,833.
What is the Median Family Income in Marathon?
Median Family Income in Marathon is $43,824.
What is the Median Household income in Marathon?
Median Household Income in Marathon is $42,843.
What is Income or Wage Gap in Marathon?
Income or Wage Gap in Marathon is 10.0%.
Women in Marathon earn 90.0 cents for every dollar earned by a man.
What is Inequality or Gini Index in Marathon?
Inequality or Gini Index in Marathon is 0.39.
What is the Total Population of Marathon?
Total Population of Marathon is 275.
What is the Total Male Population of Marathon?
Total Male Population of Marathon is 89.
What is the Total Female Population of Marathon?
Total Female Population of Marathon is 186.
What is the Ratio of Males per 100 Females in Marathon?
There are 47.85 Males per 100 Females in Marathon.
What is the Ratio of Females per 100 Males in Marathon?
There are 208.99 Females per 100 Males in Marathon.
What is the Median Population Age in Marathon?
Median Population Age in Marathon is 51.5 Years.
What is the Average Family Size in Marathon
Average Family Size in Marathon is 1.8 People.
What is the Average Household Size in Marathon
Average Household Size in Marathon is 1.6 People.
How Large is the Labor Force in Marathon?
There are 154 People in the Labor Forcein in Marathon.
What is the Percentage of People in the Labor Force in Marathon?
66.4% of People are in the Labor Force in Marathon.