Emigrant, MT Map & Demographics
Emigrant Map
Emigrant Overview
$27,118
PER CAPITA INCOME
$44,013
AVG FAMILY INCOME
$43,158
AVG HOUSEHOLD INCOME
0.46
INEQUALITY / GINI INDEX
318
TOTAL POPULATION
190
MALE POPULATION
128
FEMALE POPULATION
148.44
MALES / 100 FEMALES
67.37
FEMALES / 100 MALES
55.0
MEDIAN AGE
2.1
AVG FAMILY SIZE
1.8
AVG HOUSEHOLD SIZE
150
LABOR FORCE [ PEOPLE ]
50.2%
PERCENT IN LABOR FORCE
3.3%
UNEMPLOYMENT RATE
Emigrant Zip Codes
Emigrant Area Codes
Income in Emigrant
Income Overview in Emigrant
Per Capita Income in Emigrant is $27,118, while median incomes of families and households are $44,013 and $43,158 respectively.
| Characteristic | Number | Measure |
| Per Capita Income | 318 | $27,118 |
| Median Family Income | 87 | $44,013 |
| Mean Family Income | 87 | $44,379 |
| Median Household Income | 128 | $43,158 |
| Mean Household Income | 128 | $50,202 |
| Income Deficit | 87 | $0 |
| Wage / Income Gap (%) | 318 | 0.00% |
| Wage / Income Gap ($) | 318 | 100.00¢ per $1 |
| Gini / Inequality Index | 318 | 0.46 |
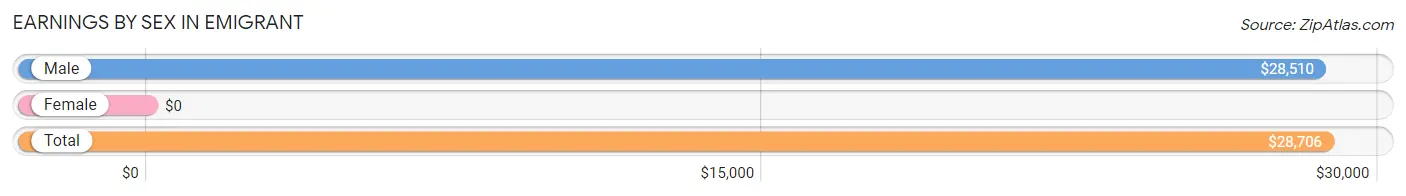
Earnings by Sex in Emigrant
| Sex | Number | Average Earnings |
| Male | 135 (72.6%) | $28,510 |
| Female | 51 (27.4%) | $0 |
| Total | 186 (100.0%) | $28,706 |
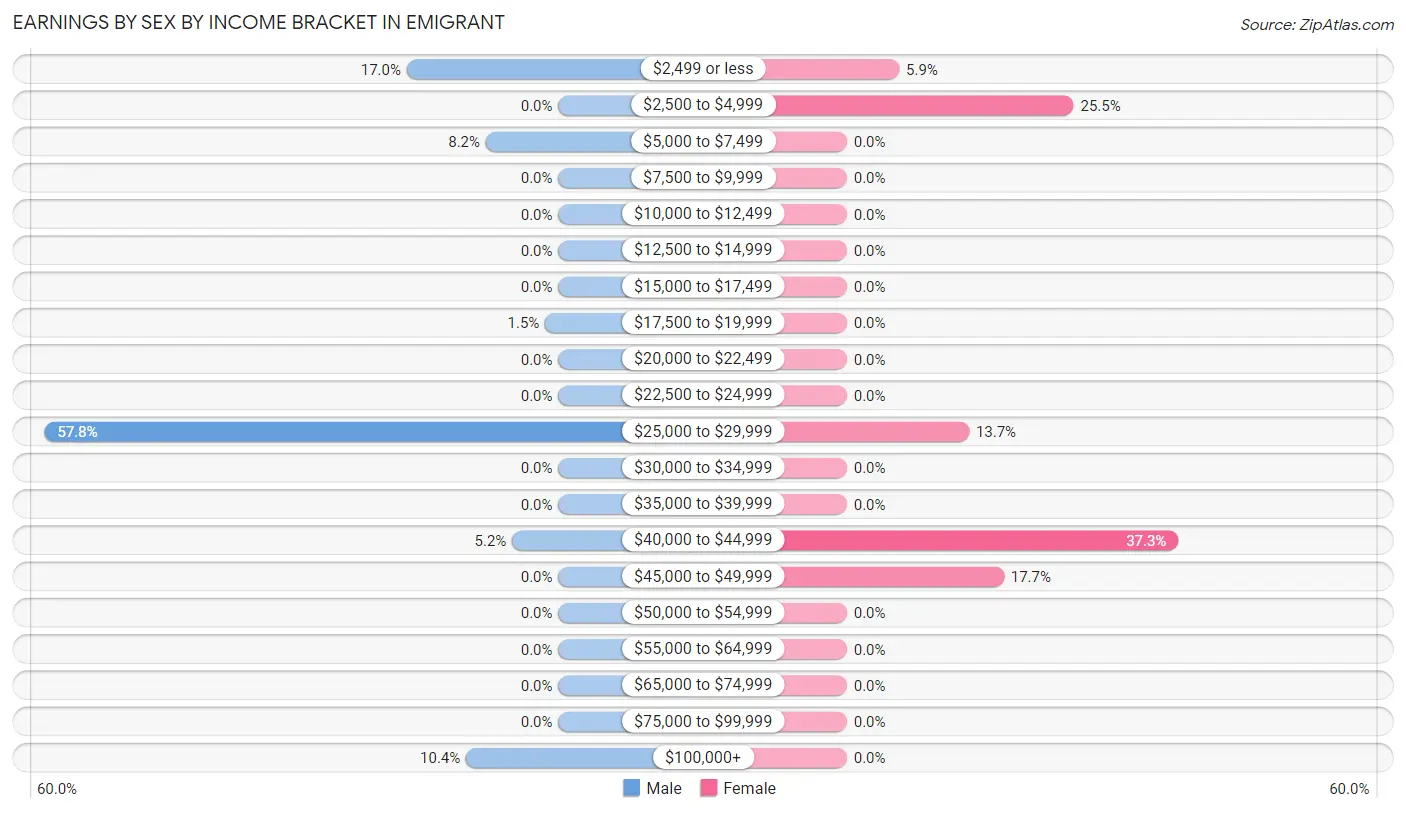
Earnings by Sex by Income Bracket in Emigrant
The most common earnings brackets in Emigrant are $25,000 to $29,999 for men (78 | 57.8%) and $40,000 to $44,999 for women (19 | 37.2%).
| Income | Male | Female |
| $2,499 or less | 23 (17.0%) | 3 (5.9%) |
| $2,500 to $4,999 | 0 (0.0%) | 13 (25.5%) |
| $5,000 to $7,499 | 11 (8.2%) | 0 (0.0%) |
| $7,500 to $9,999 | 0 (0.0%) | 0 (0.0%) |
| $10,000 to $12,499 | 0 (0.0%) | 0 (0.0%) |
| $12,500 to $14,999 | 0 (0.0%) | 0 (0.0%) |
| $15,000 to $17,499 | 0 (0.0%) | 0 (0.0%) |
| $17,500 to $19,999 | 2 (1.5%) | 0 (0.0%) |
| $20,000 to $22,499 | 0 (0.0%) | 0 (0.0%) |
| $22,500 to $24,999 | 0 (0.0%) | 0 (0.0%) |
| $25,000 to $29,999 | 78 (57.8%) | 7 (13.7%) |
| $30,000 to $34,999 | 0 (0.0%) | 0 (0.0%) |
| $35,000 to $39,999 | 0 (0.0%) | 0 (0.0%) |
| $40,000 to $44,999 | 7 (5.2%) | 19 (37.2%) |
| $45,000 to $49,999 | 0 (0.0%) | 9 (17.6%) |
| $50,000 to $54,999 | 0 (0.0%) | 0 (0.0%) |
| $55,000 to $64,999 | 0 (0.0%) | 0 (0.0%) |
| $65,000 to $74,999 | 0 (0.0%) | 0 (0.0%) |
| $75,000 to $99,999 | 0 (0.0%) | 0 (0.0%) |
| $100,000+ | 14 (10.4%) | 0 (0.0%) |
| Total | 135 (100.0%) | 51 (100.0%) |
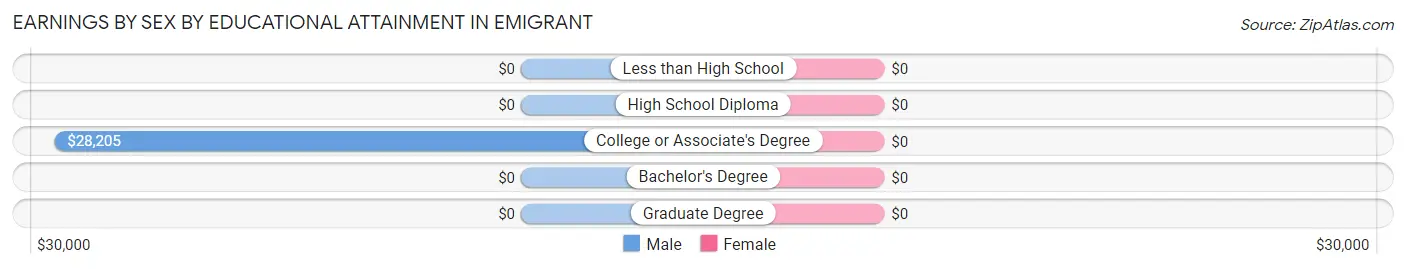
Earnings by Sex by Educational Attainment in Emigrant
| Educational Attainment | Male Income | Female Income |
| Less than High School | - | - |
| High School Diploma | - | - |
| College or Associate's Degree | $28,205 | $0 |
| Bachelor's Degree | - | - |
| Graduate Degree | - | - |
| Total | $28,510 | $0 |
Family Income in Emigrant
Family Income Brackets in Emigrant
According to the Emigrant family income data, there are 29 families falling into the $50,000 to $74,999 income range, which is the most common income bracket and makes up 33.3% of all families.
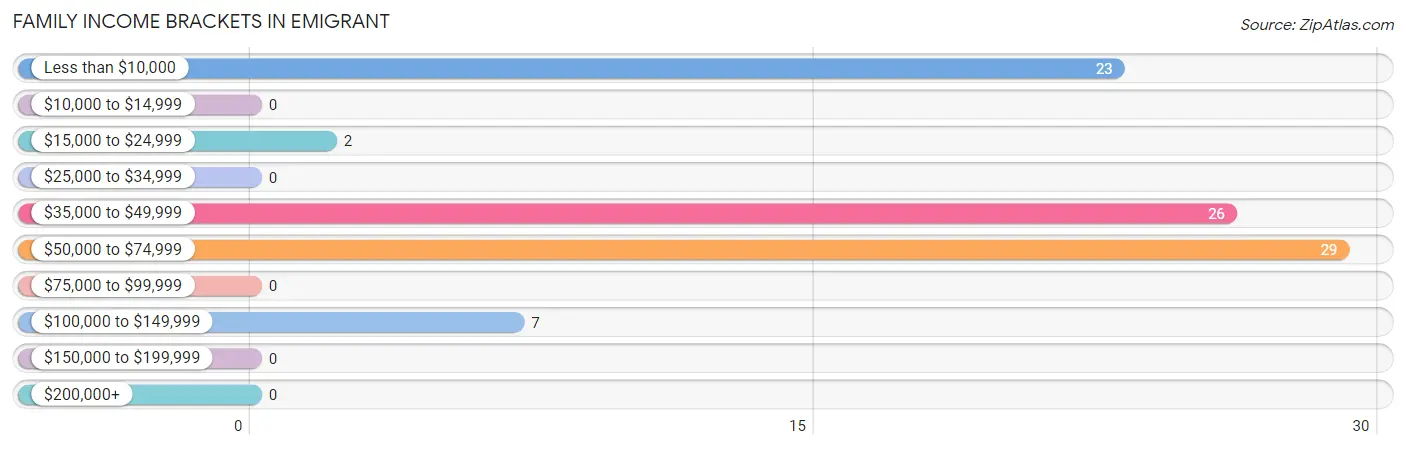
| Income Bracket | # Families | % Families |
| Less than $10,000 | 23 | 26.4% |
| $10,000 to $14,999 | 0 | 0.0% |
| $15,000 to $24,999 | 2 | 2.3% |
| $25,000 to $34,999 | 0 | 0.0% |
| $35,000 to $49,999 | 26 | 29.9% |
| $50,000 to $74,999 | 29 | 33.3% |
| $75,000 to $99,999 | 0 | 0.0% |
| $100,000 to $149,999 | 7 | 8.0% |
| $150,000 to $199,999 | 0 | 0.0% |
| $200,000+ | 0 | 0.0% |
Family Income by Famaliy Size in Emigrant
2-person families (80 | 91.9%) account for the highest median family income in Emigrant with $44,474 per family, while 2-person families (80 | 91.9%) have the highest median income of $22,237 per family member.
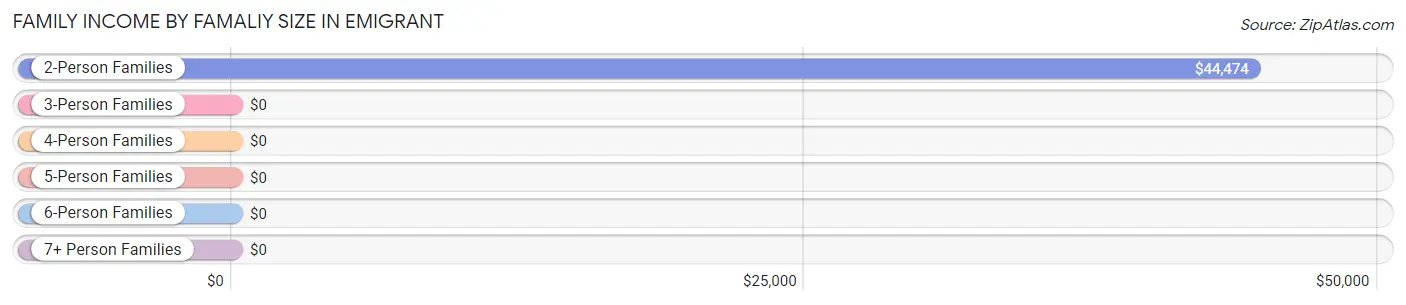
| Income Bracket | # Families | Median Income |
| 2-Person Families | 80 (91.9%) | $44,474 |
| 3-Person Families | 7 (8.1%) | $0 |
| 4-Person Families | 0 (0.0%) | $0 |
| 5-Person Families | 0 (0.0%) | $0 |
| 6-Person Families | 0 (0.0%) | $0 |
| 7+ Person Families | 0 (0.0%) | $0 |
| Total | 87 (100.0%) | $44,013 |
Family Income by Number of Earners in Emigrant
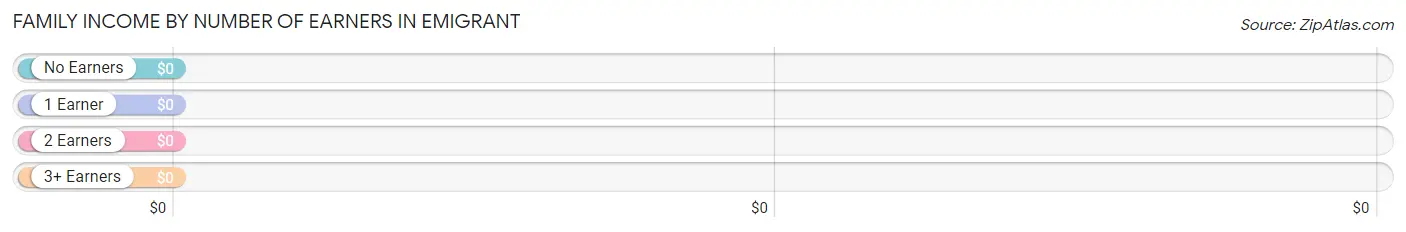
| Number of Earners | # Families | Median Income |
| No Earners | 27 (31.0%) | $0 |
| 1 Earner | 42 (48.3%) | $0 |
| 2 Earners | 18 (20.7%) | $0 |
| 3+ Earners | 0 (0.0%) | $0 |
| Total | 87 (100.0%) | $44,013 |
Household Income in Emigrant
Household Income Brackets in Emigrant
With 29 households falling in the category, the $50,000 to $74,999 income range is the most frequent in Emigrant, accounting for 22.7% of all households.
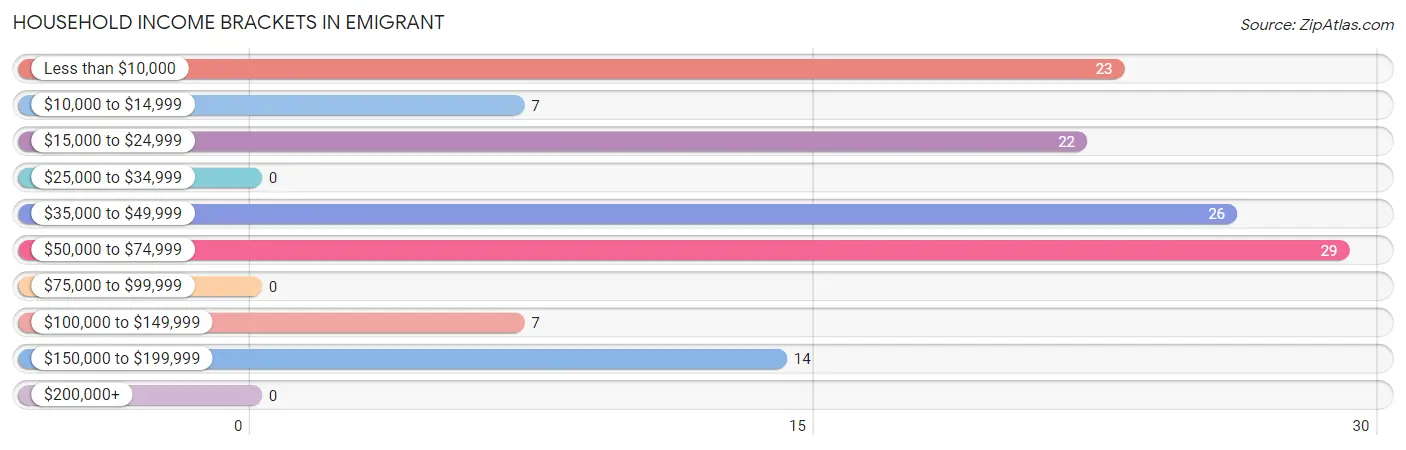
| Income Bracket | # Households | % Households |
| Less than $10,000 | 23 | 18.0% |
| $10,000 to $14,999 | 7 | 5.5% |
| $15,000 to $24,999 | 22 | 17.2% |
| $25,000 to $34,999 | 0 | 0.0% |
| $35,000 to $49,999 | 26 | 20.3% |
| $50,000 to $74,999 | 29 | 22.7% |
| $75,000 to $99,999 | 0 | 0.0% |
| $100,000 to $149,999 | 7 | 5.5% |
| $150,000 to $199,999 | 14 | 10.9% |
| $200,000+ | 0 | 0.0% |
Household Income by Householder Age in Emigrant
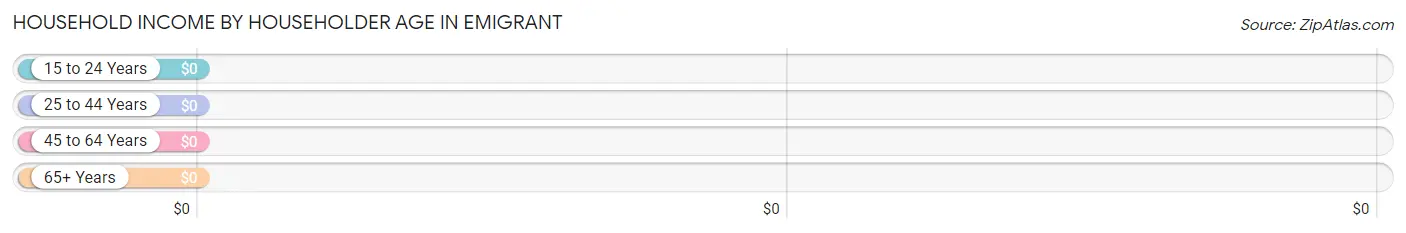
| Income Bracket | # Households | Median Income |
| 15 to 24 Years | 0 (0.0%) | $0 |
| 25 to 44 Years | 19 (14.8%) | $0 |
| 45 to 64 Years | 36 (28.1%) | $0 |
| 65+ Years | 73 (57.0%) | $0 |
| Total | 128 (100.0%) | $43,158 |
Poverty in Emigrant
Income Below Poverty by Sex and Age in Emigrant
With 13.2% poverty level for males and 35.9% for females among the residents of Emigrant, 65 to 74 year old males and 25 to 34 year old females are the most vulnerable to poverty, with 23 males (43.4%) and 13 females (100.0%) in their respective age groups living below the poverty level.
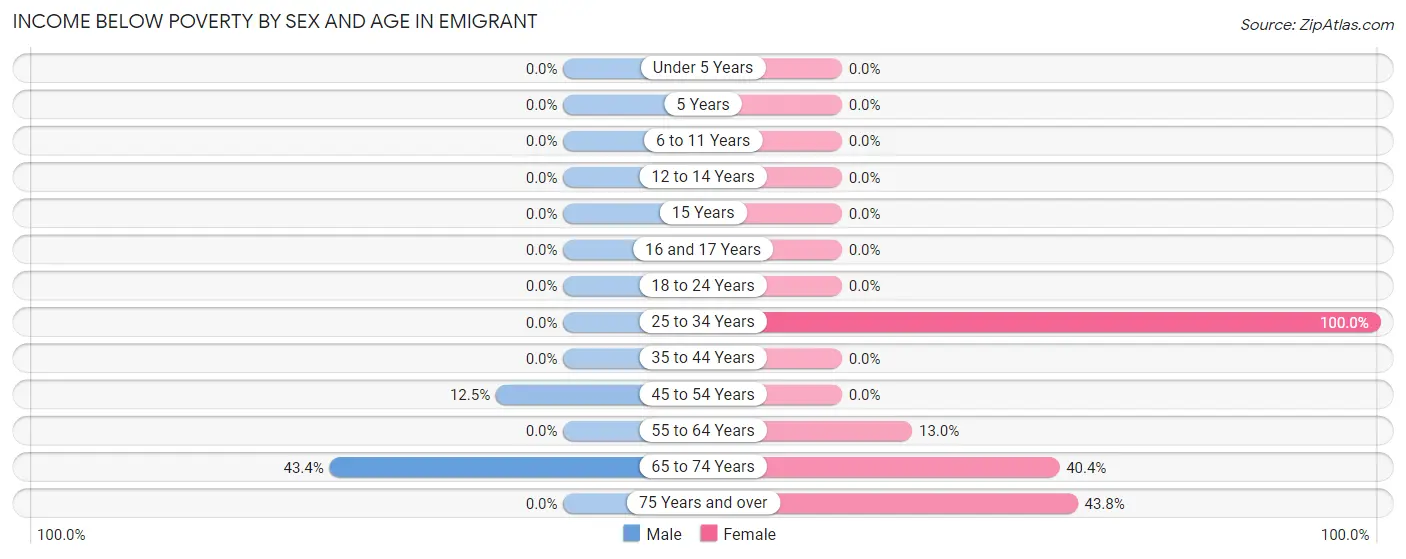
| Age Bracket | Male | Female |
| Under 5 Years | 0 (0.0%) | 0 (0.0%) |
| 5 Years | 0 (0.0%) | 0 (0.0%) |
| 6 to 11 Years | 0 (0.0%) | 0 (0.0%) |
| 12 to 14 Years | 0 (0.0%) | 0 (0.0%) |
| 15 Years | 0 (0.0%) | 0 (0.0%) |
| 16 and 17 Years | 0 (0.0%) | 0 (0.0%) |
| 18 to 24 Years | 0 (0.0%) | 0 (0.0%) |
| 25 to 34 Years | 0 (0.0%) | 13 (100.0%) |
| 35 to 44 Years | 0 (0.0%) | 0 (0.0%) |
| 45 to 54 Years | 2 (12.5%) | 0 (0.0%) |
| 55 to 64 Years | 0 (0.0%) | 3 (13.0%) |
| 65 to 74 Years | 23 (43.4%) | 23 (40.4%) |
| 75 Years and over | 0 (0.0%) | 7 (43.8%) |
| Total | 25 (13.2%) | 46 (35.9%) |
Income Above Poverty by Sex and Age in Emigrant
According to the poverty statistics in Emigrant, males aged 12 to 14 years and females aged 35 to 44 years are the age groups that are most secure financially, with 100.0% of males and 100.0% of females in these age groups living above the poverty line.
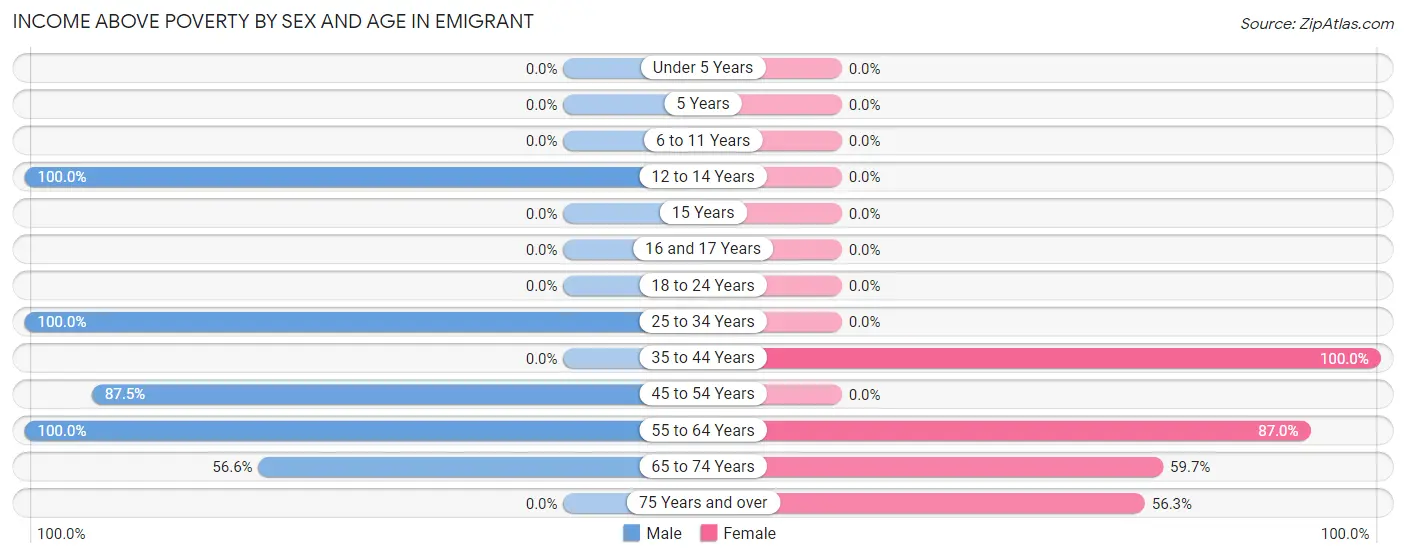
| Age Bracket | Male | Female |
| Under 5 Years | 0 (0.0%) | 0 (0.0%) |
| 5 Years | 0 (0.0%) | 0 (0.0%) |
| 6 to 11 Years | 0 (0.0%) | 0 (0.0%) |
| 12 to 14 Years | 19 (100.0%) | 0 (0.0%) |
| 15 Years | 0 (0.0%) | 0 (0.0%) |
| 16 and 17 Years | 0 (0.0%) | 0 (0.0%) |
| 18 to 24 Years | 0 (0.0%) | 0 (0.0%) |
| 25 to 34 Years | 91 (100.0%) | 0 (0.0%) |
| 35 to 44 Years | 0 (0.0%) | 19 (100.0%) |
| 45 to 54 Years | 14 (87.5%) | 0 (0.0%) |
| 55 to 64 Years | 11 (100.0%) | 20 (87.0%) |
| 65 to 74 Years | 30 (56.6%) | 34 (59.7%) |
| 75 Years and over | 0 (0.0%) | 9 (56.2%) |
| Total | 165 (86.8%) | 82 (64.1%) |
Income Below Poverty Among Married-Couple Families in Emigrant
The poverty statistics for married-couple families in Emigrant show that 42.4% or 25 of the total 59 families live below the poverty line. Families with no children have the highest poverty rate of 42.4%, comprising of 25 families. On the other hand, families with no children have the lowest poverty rate of 42.4%, which includes 25 families.
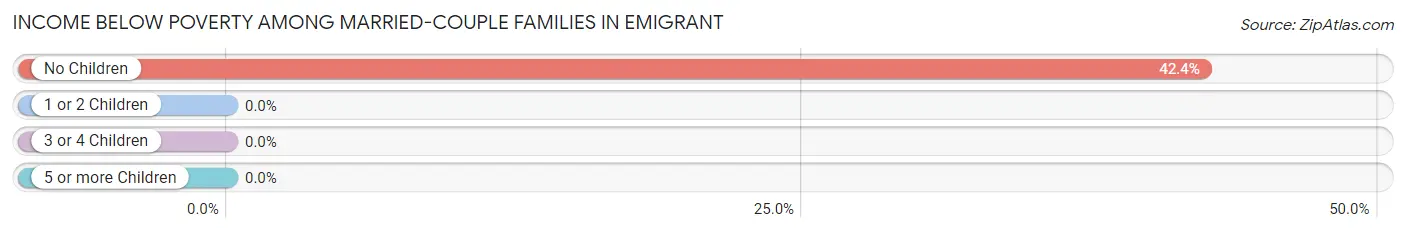
| Children | Above Poverty | Below Poverty |
| No Children | 34 (57.6%) | 25 (42.4%) |
| 1 or 2 Children | 0 (0.0%) | 0 (0.0%) |
| 3 or 4 Children | 0 (0.0%) | 0 (0.0%) |
| 5 or more Children | 0 (0.0%) | 0 (0.0%) |
| Total | 34 (57.6%) | 25 (42.4%) |
Income Below Poverty Among Single-Parent Households in Emigrant
| Children | Single Father | Single Mother |
| No Children | 0 (0.0%) | 0 (0.0%) |
| 1 or 2 Children | 0 (0.0%) | 0 (0.0%) |
| 3 or 4 Children | 0 (0.0%) | 0 (0.0%) |
| 5 or more Children | 0 (0.0%) | 0 (0.0%) |
| Total | 0 (0.0%) | 0 (0.0%) |
Income Below Poverty Among Married-Couple vs Single-Parent Households in Emigrant
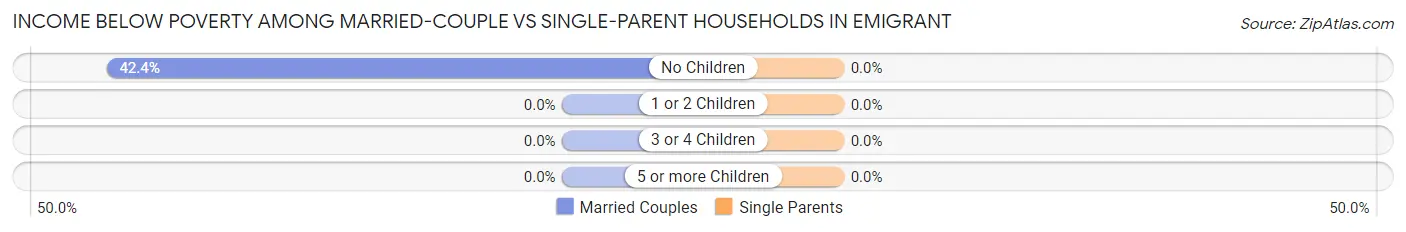
| Children | Married-Couple Families | Single-Parent Households |
| No Children | 25 (42.4%) | 0 (0.0%) |
| 1 or 2 Children | 0 (0.0%) | 0 (0.0%) |
| 3 or 4 Children | 0 (0.0%) | 0 (0.0%) |
| 5 or more Children | 0 (0.0%) | 0 (0.0%) |
| Total | 25 (42.4%) | 0 (0.0%) |
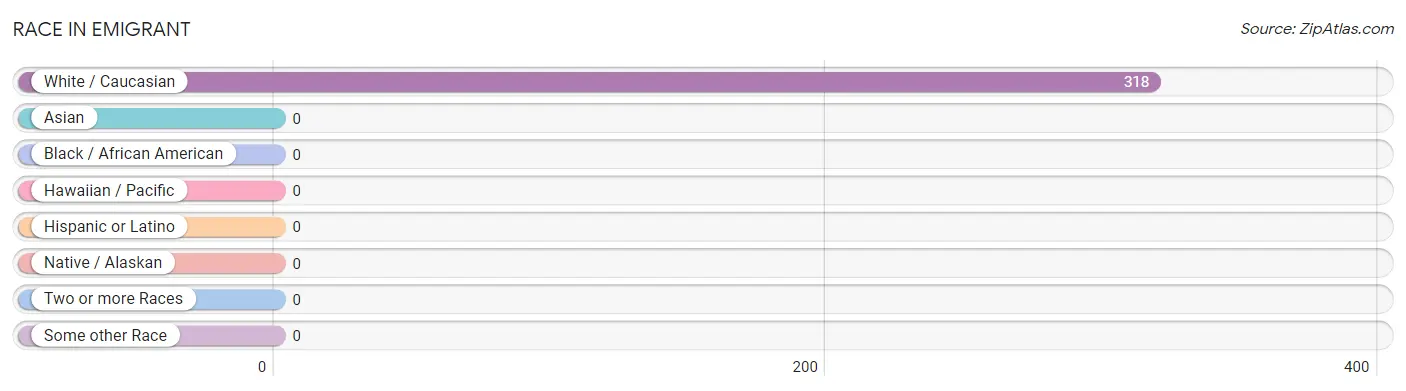
Race in Emigrant
The most populous races in Emigrant are , and White / Caucasian (318 | 100.0%).
| Race | # Population | % Population |
| Asian | 0 | 0.0% |
| Black / African American | 0 | 0.0% |
| Hawaiian / Pacific | 0 | 0.0% |
| Hispanic or Latino | 0 | 0.0% |
| Native / Alaskan | 0 | 0.0% |
| White / Caucasian | 318 | 100.0% |
| Two or more Races | 0 | 0.0% |
| Some other Race | 0 | 0.0% |
| Total | 318 | 100.0% |
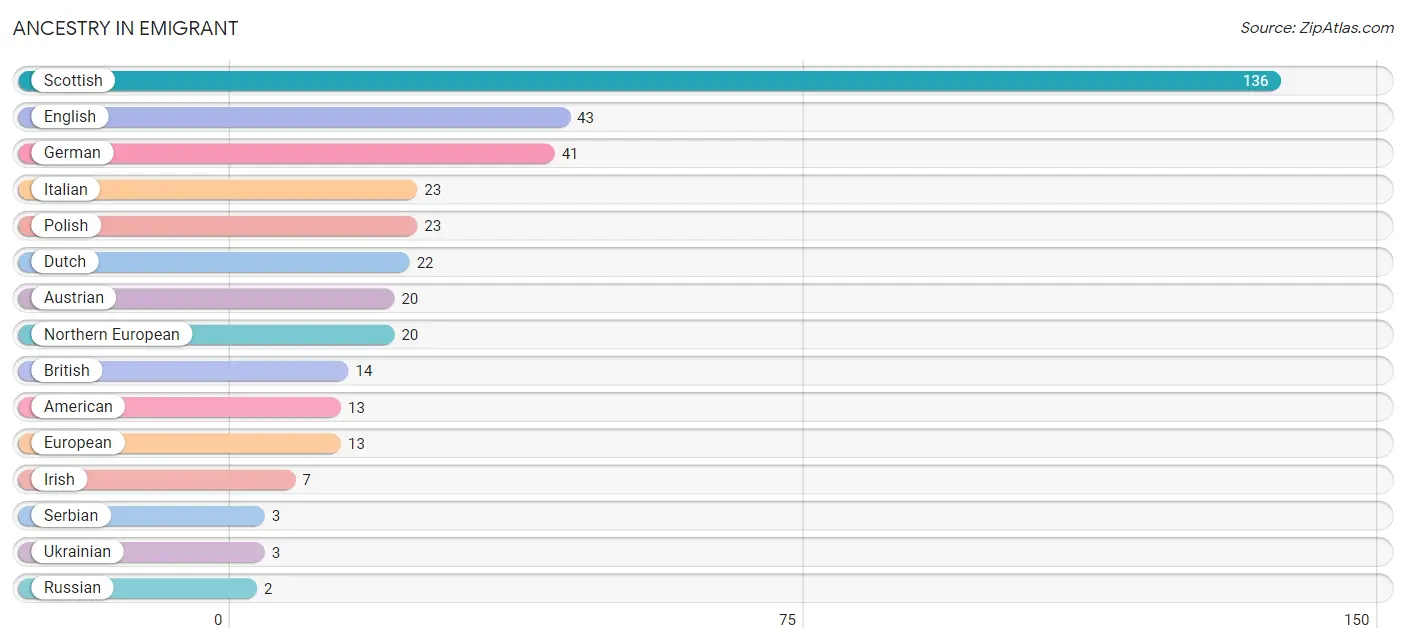
Ancestry in Emigrant
The most populous ancestries reported in Emigrant are Scottish (136 | 42.8%), English (43 | 13.5%), German (41 | 12.9%), Italian (23 | 7.2%), and Polish (23 | 7.2%), together accounting for 83.6% of all Emigrant residents.
| Ancestry | # Population | % Population |
| American | 13 | 4.1% |
| Austrian | 20 | 6.3% |
| British | 14 | 4.4% |
| Dutch | 22 | 6.9% |
| English | 43 | 13.5% |
| European | 13 | 4.1% |
| German | 41 | 12.9% |
| Irish | 7 | 2.2% |
| Italian | 23 | 7.2% |
| Northern European | 20 | 6.3% |
| Polish | 23 | 7.2% |
| Russian | 2 | 0.6% |
| Scottish | 136 | 42.8% |
| Serbian | 3 | 0.9% |
| Ukrainian | 3 | 0.9% | View All 15 Rows |
Immigrants in Emigrant

| Immigration Origin | # Population | % Population | View All 0 Rows |
Sex and Age in Emigrant
Sex and Age in Emigrant
The most populous age groups in Emigrant are 25 to 29 Years (78 | 41.0%) for men and 70 to 74 Years (30 | 23.4%) for women.
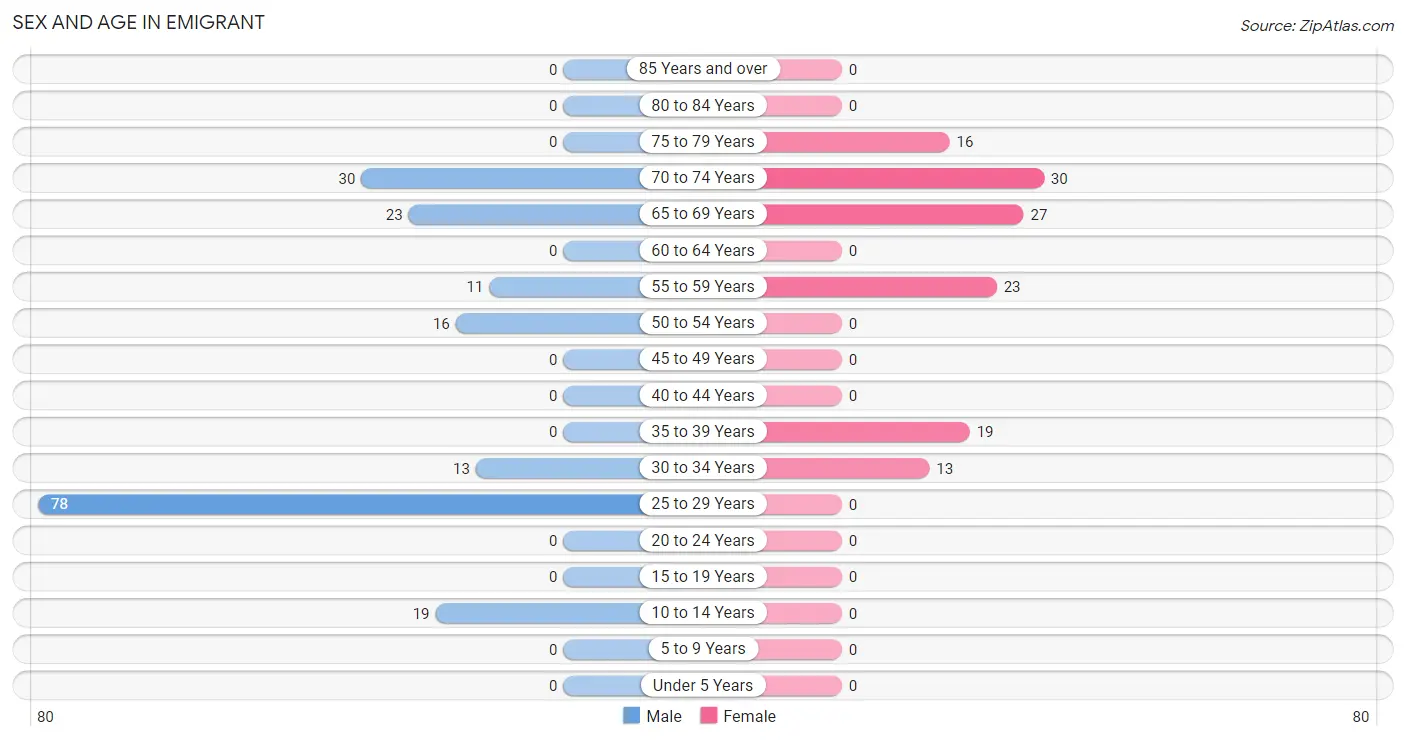
| Age Bracket | Male | Female |
| Under 5 Years | 0 (0.0%) | 0 (0.0%) |
| 5 to 9 Years | 0 (0.0%) | 0 (0.0%) |
| 10 to 14 Years | 19 (10.0%) | 0 (0.0%) |
| 15 to 19 Years | 0 (0.0%) | 0 (0.0%) |
| 20 to 24 Years | 0 (0.0%) | 0 (0.0%) |
| 25 to 29 Years | 78 (41.0%) | 0 (0.0%) |
| 30 to 34 Years | 13 (6.8%) | 13 (10.2%) |
| 35 to 39 Years | 0 (0.0%) | 19 (14.8%) |
| 40 to 44 Years | 0 (0.0%) | 0 (0.0%) |
| 45 to 49 Years | 0 (0.0%) | 0 (0.0%) |
| 50 to 54 Years | 16 (8.4%) | 0 (0.0%) |
| 55 to 59 Years | 11 (5.8%) | 23 (18.0%) |
| 60 to 64 Years | 0 (0.0%) | 0 (0.0%) |
| 65 to 69 Years | 23 (12.1%) | 27 (21.1%) |
| 70 to 74 Years | 30 (15.8%) | 30 (23.4%) |
| 75 to 79 Years | 0 (0.0%) | 16 (12.5%) |
| 80 to 84 Years | 0 (0.0%) | 0 (0.0%) |
| 85 Years and over | 0 (0.0%) | 0 (0.0%) |
| Total | 190 (100.0%) | 128 (100.0%) |
Families and Households in Emigrant
Median Family Size in Emigrant
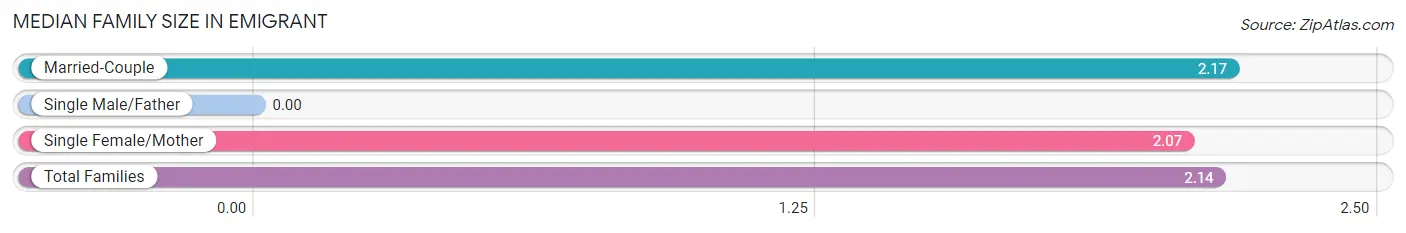
| Family Type | # Families | Family Size |
| Married-Couple | 59 (67.8%) | 2.17 |
| Single Male/Father | 0 (0.0%) | - |
| Single Female/Mother | 28 (32.2%) | 2.07 |
| Total Families | 87 (100.0%) | 2.14 |
Median Household Size in Emigrant
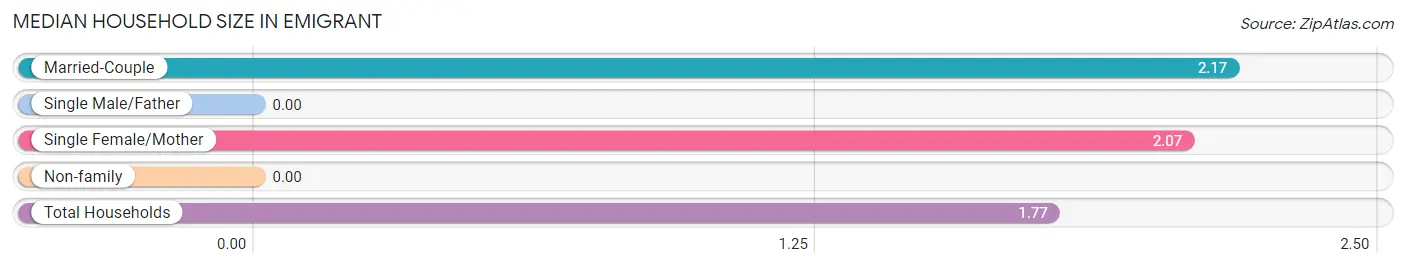
| Household Type | # Households | Household Size |
| Married-Couple | 59 (46.1%) | 2.17 |
| Single Male/Father | 0 (0.0%) | - |
| Single Female/Mother | 28 (21.9%) | 2.07 |
| Non-family | 41 (32.0%) | - |
| Total Households | 128 (100.0%) | 1.77 |
Household Size by Marriage Status in Emigrant
Out of a total of 128 households in Emigrant, 87 (68.0%) are family households, while 41 (32.0%) are nonfamily households. The most numerous type of family households are 2-person households, comprising 80, and the most common type of nonfamily households are 1-person households, comprising 41.
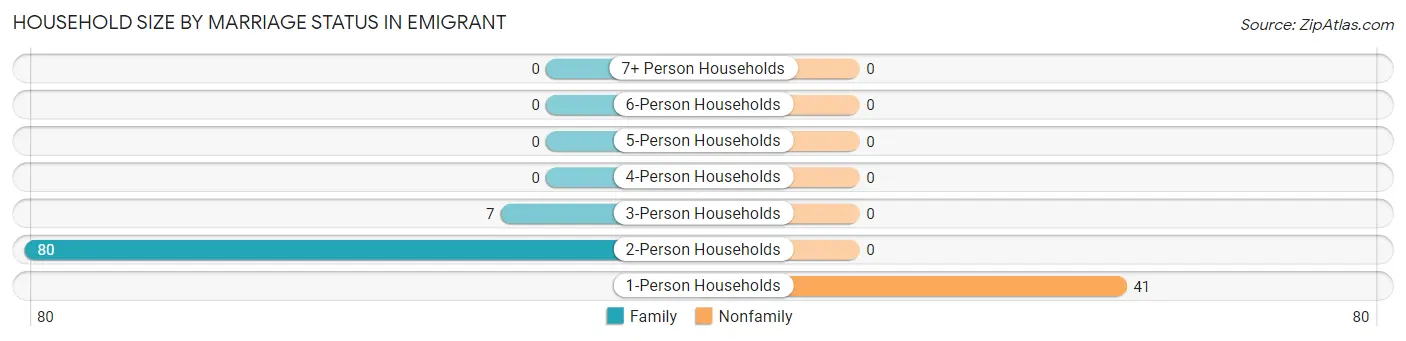
| Household Size | Family Households | Nonfamily Households |
| 1-Person Households | - | 41 (32.0%) |
| 2-Person Households | 80 (62.5%) | 0 (0.0%) |
| 3-Person Households | 7 (5.5%) | 0 (0.0%) |
| 4-Person Households | 0 (0.0%) | 0 (0.0%) |
| 5-Person Households | 0 (0.0%) | 0 (0.0%) |
| 6-Person Households | 0 (0.0%) | 0 (0.0%) |
| 7+ Person Households | 0 (0.0%) | 0 (0.0%) |
| Total | 87 (68.0%) | 41 (32.0%) |
Female Fertility in Emigrant
Fertility by Age in Emigrant
| Age Bracket | Women with Births | Births / 1,000 Women |
| 15 to 19 years | 0 (0.0%) | 0.0 |
| 20 to 34 years | 0 (0.0%) | 0.0 |
| 35 to 50 years | 0 (0.0%) | 0.0 |
| Total | 0 (0.0%) | 0.0 |
Fertility by Age by Marriage Status in Emigrant
| Age Bracket | Married | Unmarried |
| 15 to 19 years | 0 (0.0%) | 0 (0.0%) |
| 20 to 34 years | 0 (0.0%) | 0 (0.0%) |
| 35 to 50 years | 0 (0.0%) | 0 (0.0%) |
| Total | 0 (0.0%) | 0 (0.0%) |
Fertility by Education in Emigrant
| Educational Attainment | Women with Births | Births / 1,000 Women |
| Less than High School | 0 (0.0%) | 0.0 |
| High School Diploma | 0 (0.0%) | 0.0 |
| College or Associate's Degree | 0 (0.0%) | 0.0 |
| Bachelor's Degree | 0 (0.0%) | 0.0 |
| Graduate Degree | 0 (0.0%) | 0.0 |
| Total | 0 (0.0%) | 0.0 |
Fertility by Education by Marriage Status in Emigrant
| Educational Attainment | Married | Unmarried |
| Less than High School | 0 (0.0%) | 0 (0.0%) |
| High School Diploma | 0 (0.0%) | 0 (0.0%) |
| College or Associate's Degree | 0 (0.0%) | 0 (0.0%) |
| Bachelor's Degree | 0 (0.0%) | 0 (0.0%) |
| Graduate Degree | 0 (0.0%) | 0 (0.0%) |
| Total | 0 (0.0%) | 0 (0.0%) |
Employment Characteristics in Emigrant
Employment by Class of Employer in Emigrant
Among the 145 employed individuals in Emigrant, private company employees (97 | 66.9%), not-for-profit organizations (14 | 9.7%), and federal government employees (14 | 9.7%) make up the most common classes of employment.
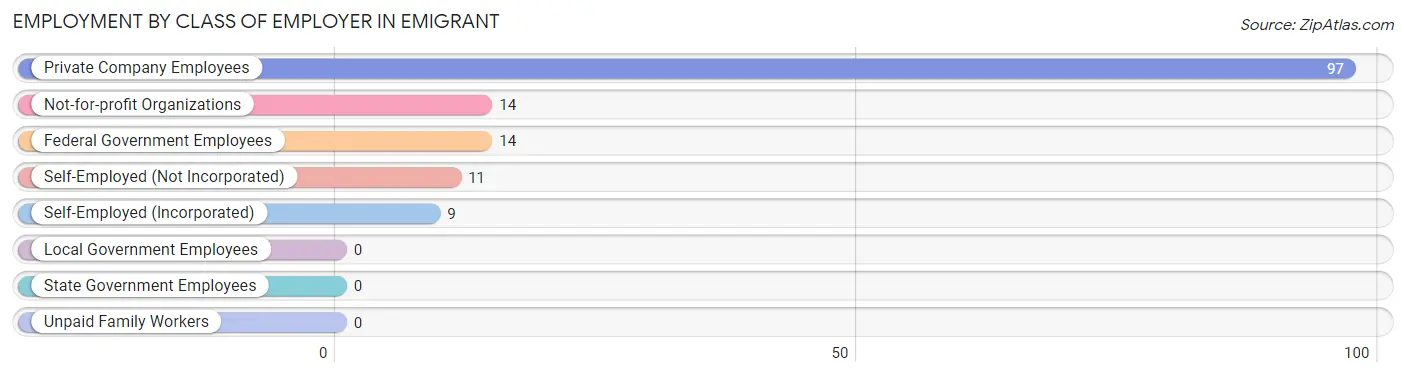
| Employer Class | # Employees | % Employees |
| Private Company Employees | 97 | 66.9% |
| Self-Employed (Incorporated) | 9 | 6.2% |
| Self-Employed (Not Incorporated) | 11 | 7.6% |
| Not-for-profit Organizations | 14 | 9.7% |
| Local Government Employees | 0 | 0.0% |
| State Government Employees | 0 | 0.0% |
| Federal Government Employees | 14 | 9.7% |
| Unpaid Family Workers | 0 | 0.0% |
| Total | 145 | 100.0% |
Employment Status by Age in Emigrant
According to the labor force statistics for Emigrant, out of the total population over 16 years of age (299), 50.2% or 150 individuals are in the labor force, with 3.3% or 5 of them unemployed. The age group with the highest labor force participation rate is 25 to 29 years, with 100.0% or 78 individuals in the labor force. Within the labor force, the 55 to 59 years age range has the highest percentage of unemployed individuals, with 21.4% or 3 of them being unemployed.
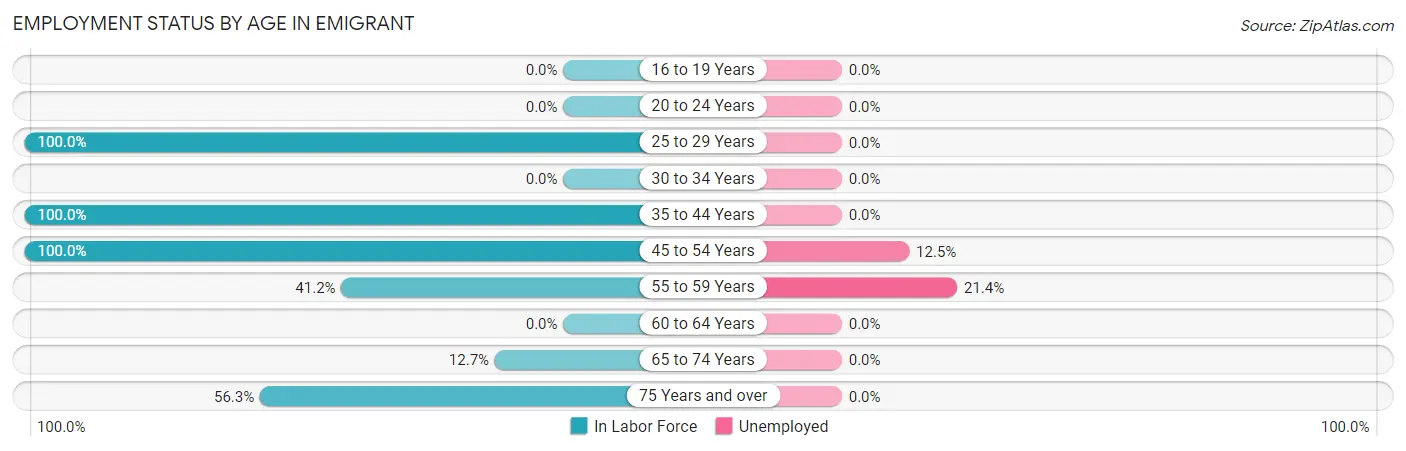
| Age Bracket | In Labor Force | Unemployed |
| 16 to 19 Years | 0 (0.0%) | 0 (0.0%) |
| 20 to 24 Years | 0 (0.0%) | 0 (0.0%) |
| 25 to 29 Years | 78 (100.0%) | 0 (0.0%) |
| 30 to 34 Years | 0 (0.0%) | 0 (0.0%) |
| 35 to 44 Years | 19 (100.0%) | 0 (0.0%) |
| 45 to 54 Years | 16 (100.0%) | 2 (12.5%) |
| 55 to 59 Years | 14 (41.2%) | 3 (21.4%) |
| 60 to 64 Years | 0 (0.0%) | 0 (0.0%) |
| 65 to 74 Years | 14 (12.7%) | 0 (0.0%) |
| 75 Years and over | 9 (56.3%) | 0 (0.0%) |
| Total | 150 (50.2%) | 5 (3.3%) |
Employment Status by Educational Attainment in Emigrant
According to labor force statistics for Emigrant, 73.4% of individuals (127) out of the total population between 25 and 64 years of age (173) are in the labor force, with 3.9% or 5 of them being unemployed. The group with the highest labor force participation rate are those with the educational attainment of college / associate degree, with 100.0% or 89 individuals in the labor force. Within the labor force, individuals with high school diploma education have the highest percentage of unemployment, with 100.0% or 2 of them being unemployed.
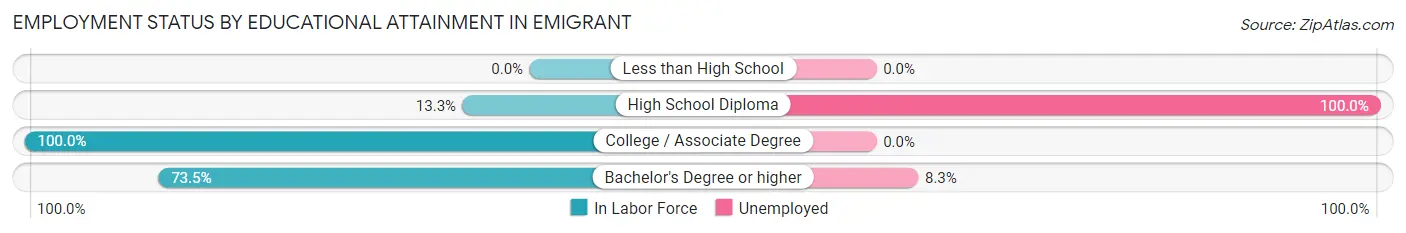
| Educational Attainment | In Labor Force | Unemployed |
| Less than High School | 0 (0.0%) | 0 (0.0%) |
| High School Diploma | 2 (13.3%) | 15 (100.0%) |
| College / Associate Degree | 89 (100.0%) | 0 (0.0%) |
| Bachelor's Degree or higher | 36 (73.5%) | 4 (8.3%) |
| Total | 127 (73.4%) | 7 (3.9%) |
Employment Occupations by Sex in Emigrant
Management, Business, Science and Arts Occupations
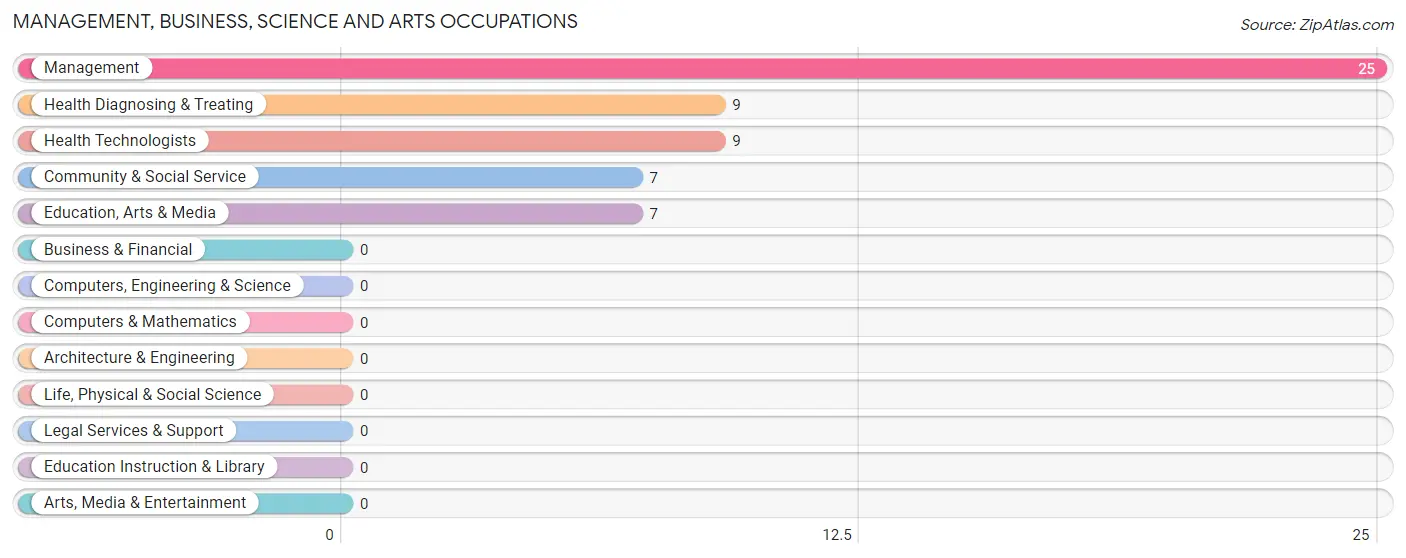
The most common Management, Business, Science and Arts occupations in Emigrant are Management (25 | 17.2%), Health Diagnosing & Treating (9 | 6.2%), Health Technologists (9 | 6.2%), Community & Social Service (7 | 4.8%), and Education, Arts & Media (7 | 4.8%).
Management, Business, Science and Arts Occupations by Sex
Within the Management, Business, Science and Arts occupations in Emigrant, the most male-oriented occupations are Management (100.0%), Community & Social Service (100.0%), and Education, Arts & Media (100.0%), while the most female-oriented occupations are Health Diagnosing & Treating (100.0%), and Health Technologists (100.0%).
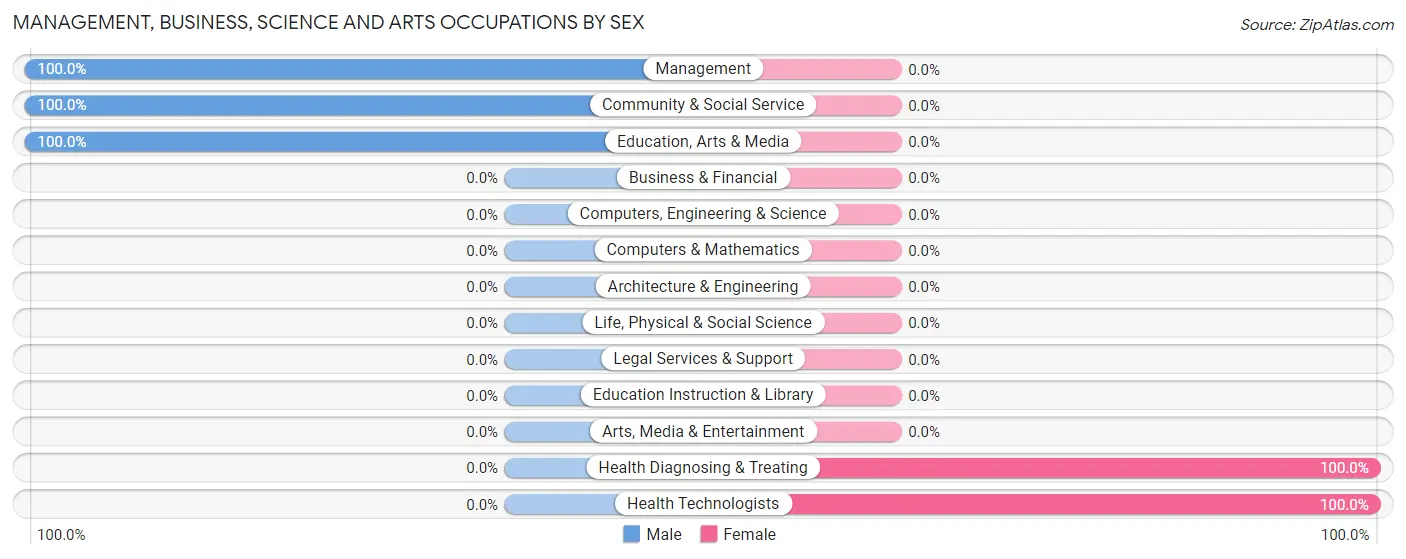
| Occupation | Male | Female |
| Management | 25 (100.0%) | 0 (0.0%) |
| Business & Financial | 0 (0.0%) | 0 (0.0%) |
| Computers, Engineering & Science | 0 (0.0%) | 0 (0.0%) |
| Computers & Mathematics | 0 (0.0%) | 0 (0.0%) |
| Architecture & Engineering | 0 (0.0%) | 0 (0.0%) |
| Life, Physical & Social Science | 0 (0.0%) | 0 (0.0%) |
| Community & Social Service | 7 (100.0%) | 0 (0.0%) |
| Education, Arts & Media | 7 (100.0%) | 0 (0.0%) |
| Legal Services & Support | 0 (0.0%) | 0 (0.0%) |
| Education Instruction & Library | 0 (0.0%) | 0 (0.0%) |
| Arts, Media & Entertainment | 0 (0.0%) | 0 (0.0%) |
| Health Diagnosing & Treating | 0 (0.0%) | 9 (100.0%) |
| Health Technologists | 0 (0.0%) | 9 (100.0%) |
| Total (Category) | 32 (78.0%) | 9 (22.0%) |
| Total (Overall) | 110 (75.9%) | 35 (24.1%) |
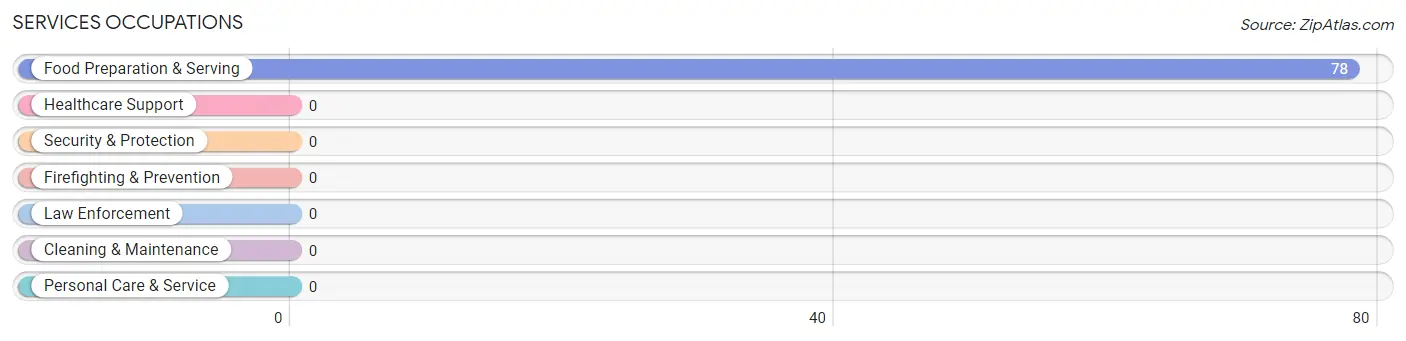
Services Occupations
The most common Services occupations in Emigrant are , and Food Preparation & Serving (78 | 53.8%).
Services Occupations by Sex
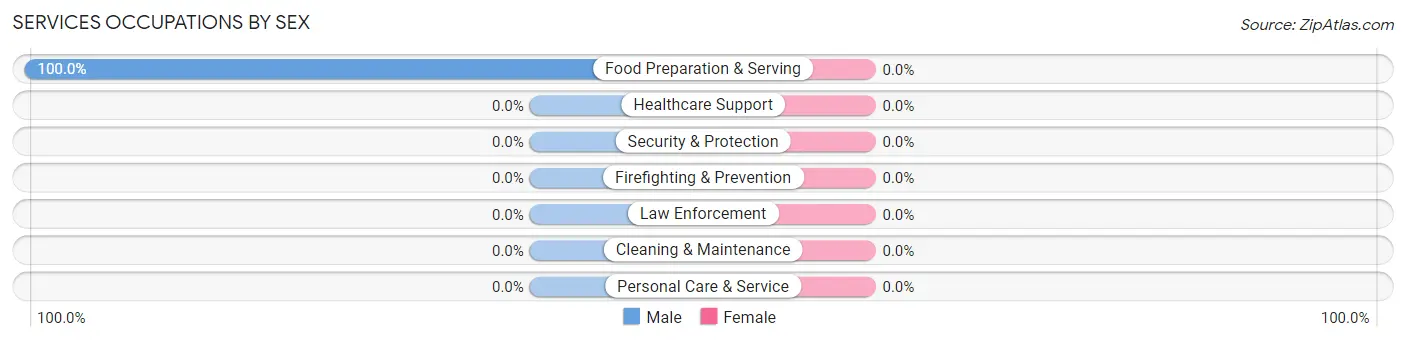
| Occupation | Male | Female |
| Healthcare Support | 0 (0.0%) | 0 (0.0%) |
| Security & Protection | 0 (0.0%) | 0 (0.0%) |
| Firefighting & Prevention | 0 (0.0%) | 0 (0.0%) |
| Law Enforcement | 0 (0.0%) | 0 (0.0%) |
| Food Preparation & Serving | 78 (100.0%) | 0 (0.0%) |
| Cleaning & Maintenance | 0 (0.0%) | 0 (0.0%) |
| Personal Care & Service | 0 (0.0%) | 0 (0.0%) |
| Total (Category) | 78 (100.0%) | 0 (0.0%) |
| Total (Overall) | 110 (75.9%) | 35 (24.1%) |
Sales and Office Occupations
The most common Sales and Office occupations in Emigrant are , and Office & Administration (7 | 4.8%).

Sales and Office Occupations by Sex

| Occupation | Male | Female |
| Sales & Related | 0 (0.0%) | 0 (0.0%) |
| Office & Administration | 0 (0.0%) | 7 (100.0%) |
| Total (Category) | 0 (0.0%) | 7 (100.0%) |
| Total (Overall) | 110 (75.9%) | 35 (24.1%) |
Natural Resources, Construction and Maintenance Occupations
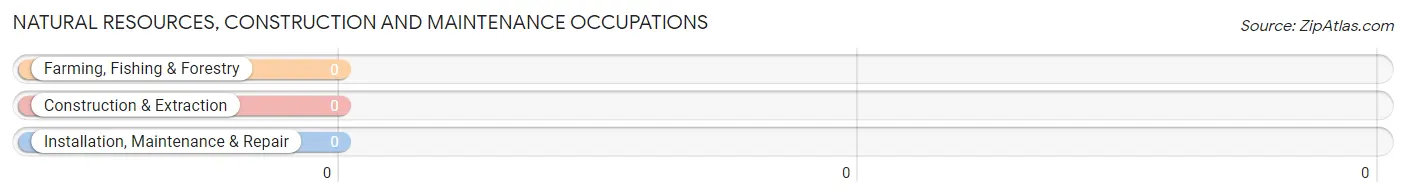
Natural Resources, Construction and Maintenance Occupations by Sex
| Occupation | Male | Female |
| Farming, Fishing & Forestry | 0 (0.0%) | 0 (0.0%) |
| Construction & Extraction | 0 (0.0%) | 0 (0.0%) |
| Installation, Maintenance & Repair | 0 (0.0%) | 0 (0.0%) |
| Total (Category) | 0 (0.0%) | 0 (0.0%) |
| Total (Overall) | 110 (75.9%) | 35 (24.1%) |
Production, Transportation and Moving Occupations
The most common Production, Transportation and Moving occupations in Emigrant are , and Production (19 | 13.1%).
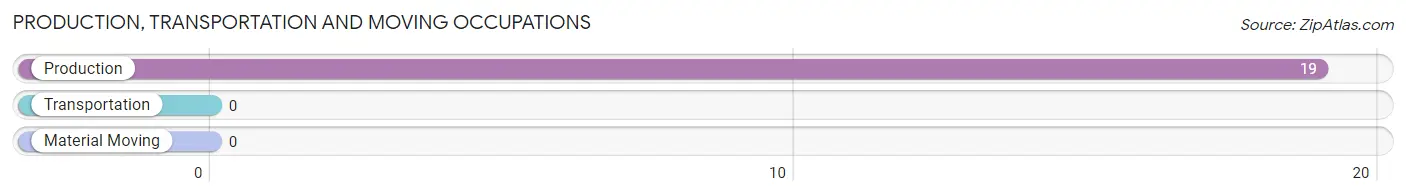
Production, Transportation and Moving Occupations by Sex
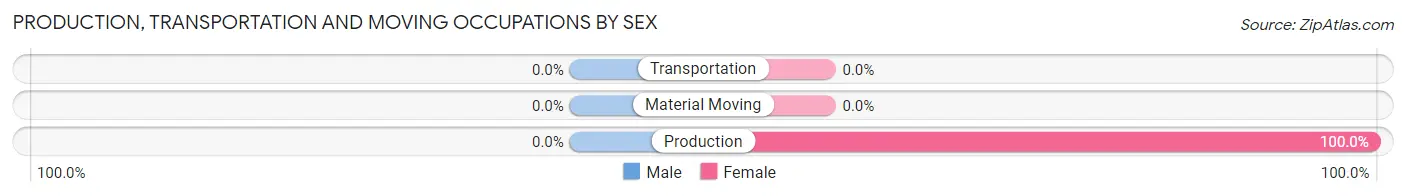
| Occupation | Male | Female |
| Production | 0 (0.0%) | 19 (100.0%) |
| Transportation | 0 (0.0%) | 0 (0.0%) |
| Material Moving | 0 (0.0%) | 0 (0.0%) |
| Total (Category) | 0 (0.0%) | 19 (100.0%) |
| Total (Overall) | 110 (75.9%) | 35 (24.1%) |
Employment Industries by Sex in Emigrant
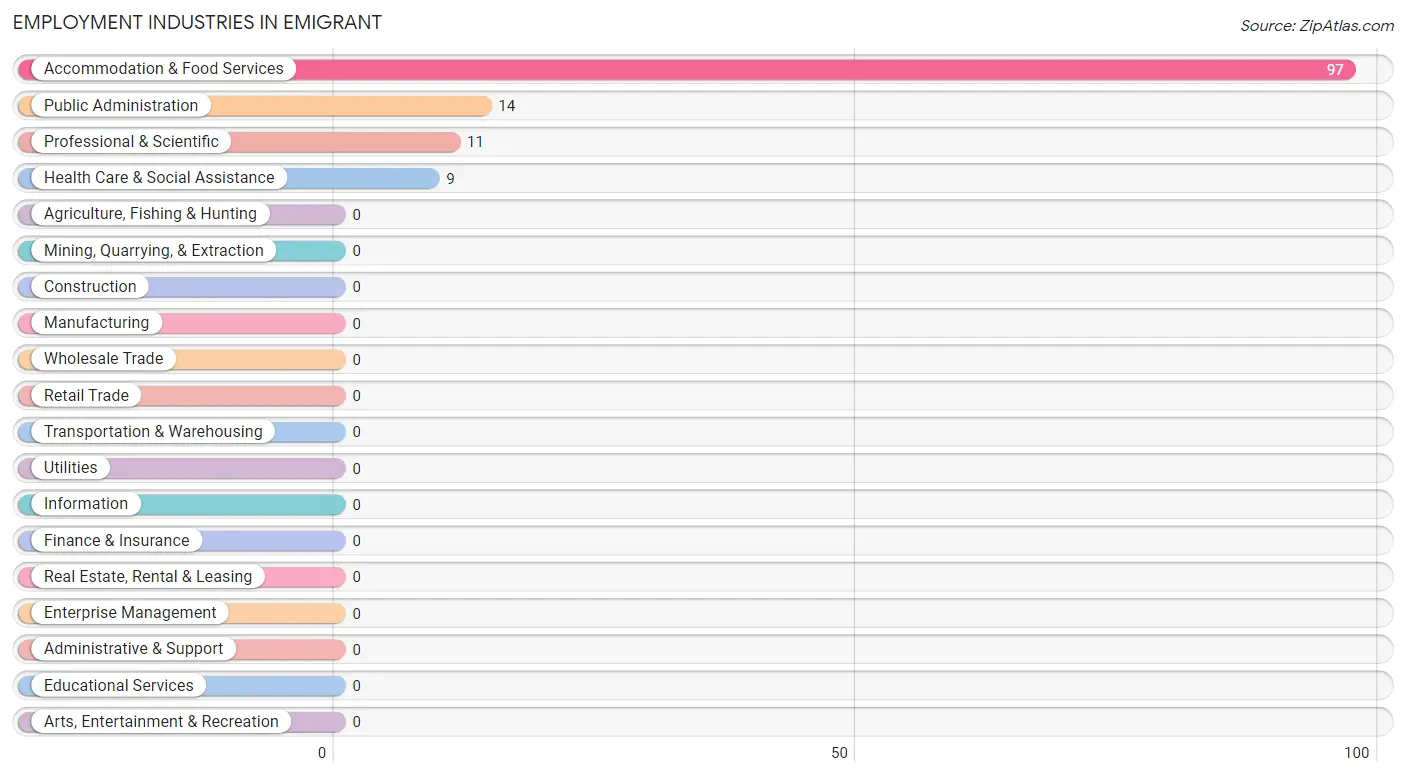
Employment Industries in Emigrant
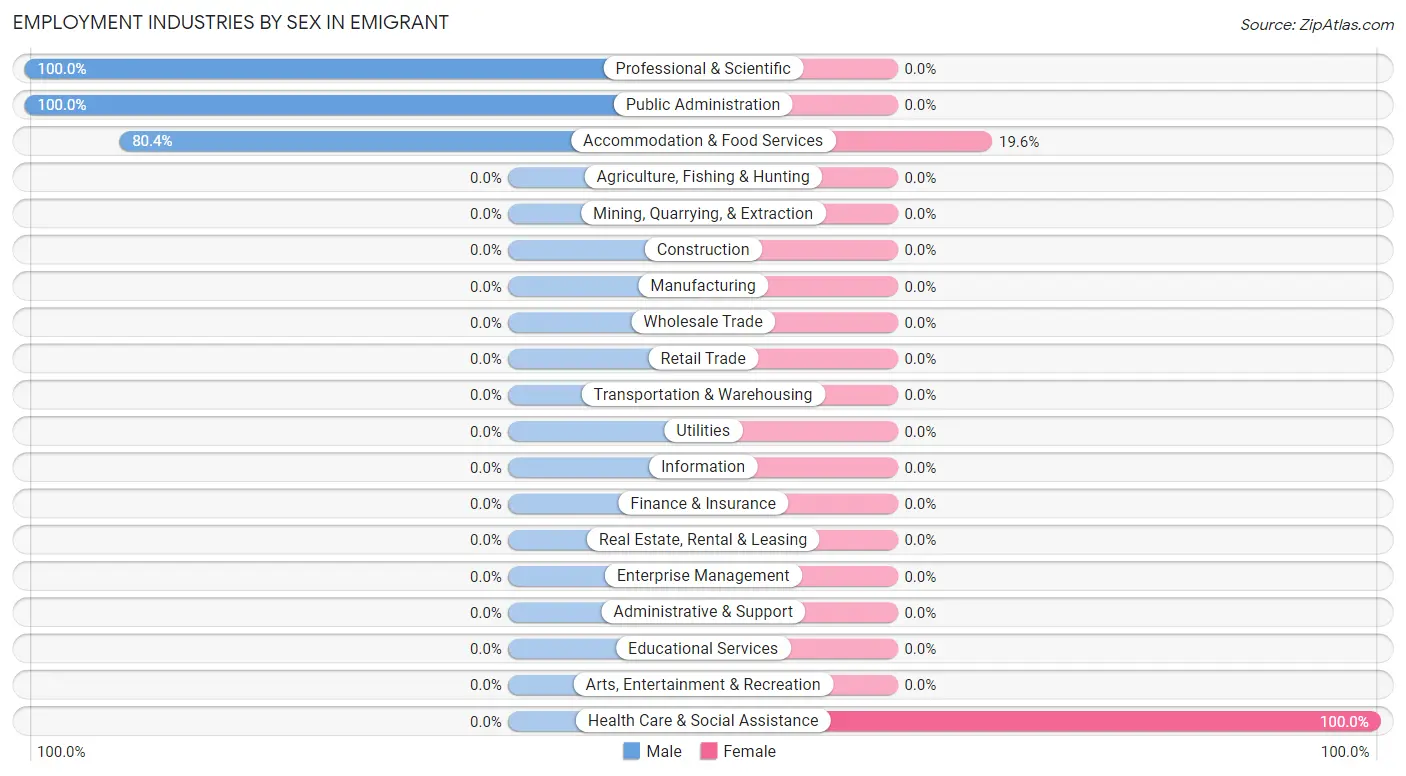
The major employment industries in Emigrant include Accommodation & Food Services (97 | 66.9%), Public Administration (14 | 9.7%), Professional & Scientific (11 | 7.6%), and Health Care & Social Assistance (9 | 6.2%).
Employment Industries by Sex in Emigrant
The Emigrant industries that see more men than women are Professional & Scientific (100.0%), Public Administration (100.0%), and Accommodation & Food Services (80.4%), whereas the industries that tend to have a higher number of women are Health Care & Social Assistance (100.0%), and Accommodation & Food Services (19.6%).
| Industry | Male | Female |
| Agriculture, Fishing & Hunting | 0 (0.0%) | 0 (0.0%) |
| Mining, Quarrying, & Extraction | 0 (0.0%) | 0 (0.0%) |
| Construction | 0 (0.0%) | 0 (0.0%) |
| Manufacturing | 0 (0.0%) | 0 (0.0%) |
| Wholesale Trade | 0 (0.0%) | 0 (0.0%) |
| Retail Trade | 0 (0.0%) | 0 (0.0%) |
| Transportation & Warehousing | 0 (0.0%) | 0 (0.0%) |
| Utilities | 0 (0.0%) | 0 (0.0%) |
| Information | 0 (0.0%) | 0 (0.0%) |
| Finance & Insurance | 0 (0.0%) | 0 (0.0%) |
| Real Estate, Rental & Leasing | 0 (0.0%) | 0 (0.0%) |
| Professional & Scientific | 11 (100.0%) | 0 (0.0%) |
| Enterprise Management | 0 (0.0%) | 0 (0.0%) |
| Administrative & Support | 0 (0.0%) | 0 (0.0%) |
| Educational Services | 0 (0.0%) | 0 (0.0%) |
| Health Care & Social Assistance | 0 (0.0%) | 9 (100.0%) |
| Arts, Entertainment & Recreation | 0 (0.0%) | 0 (0.0%) |
| Accommodation & Food Services | 78 (80.4%) | 19 (19.6%) |
| Public Administration | 14 (100.0%) | 0 (0.0%) |
| Total | 110 (75.9%) | 35 (24.1%) |
Education in Emigrant
School Enrollment in Emigrant
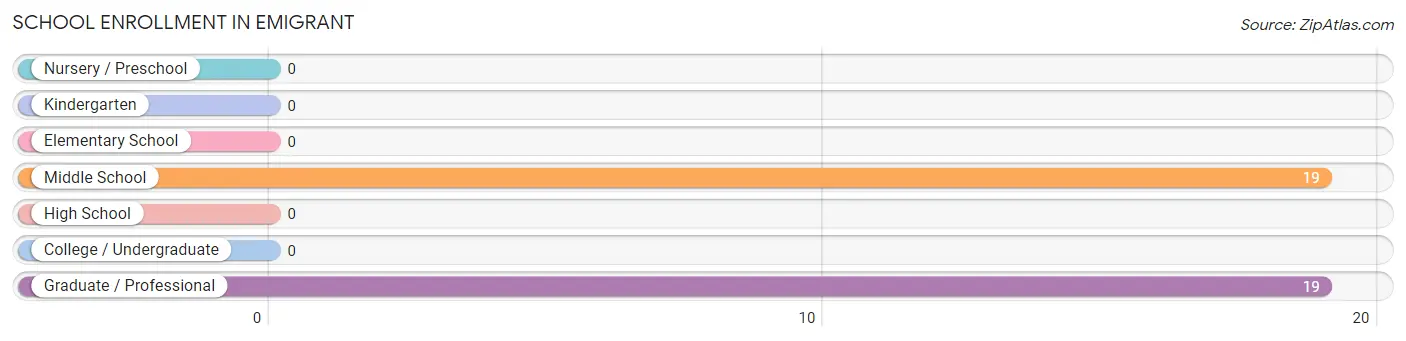
The most common levels of schooling among the 38 students in Emigrant are middle school (19 | 50.0%), and graduate / professional (19 | 50.0%).
| School Level | # Students | % Students |
| Nursery / Preschool | 0 | 0.0% |
| Kindergarten | 0 | 0.0% |
| Elementary School | 0 | 0.0% |
| Middle School | 19 | 50.0% |
| High School | 0 | 0.0% |
| College / Undergraduate | 0 | 0.0% |
| Graduate / Professional | 19 | 50.0% |
| Total | 38 | 100.0% |
School Enrollment by Age by Funding Source in Emigrant
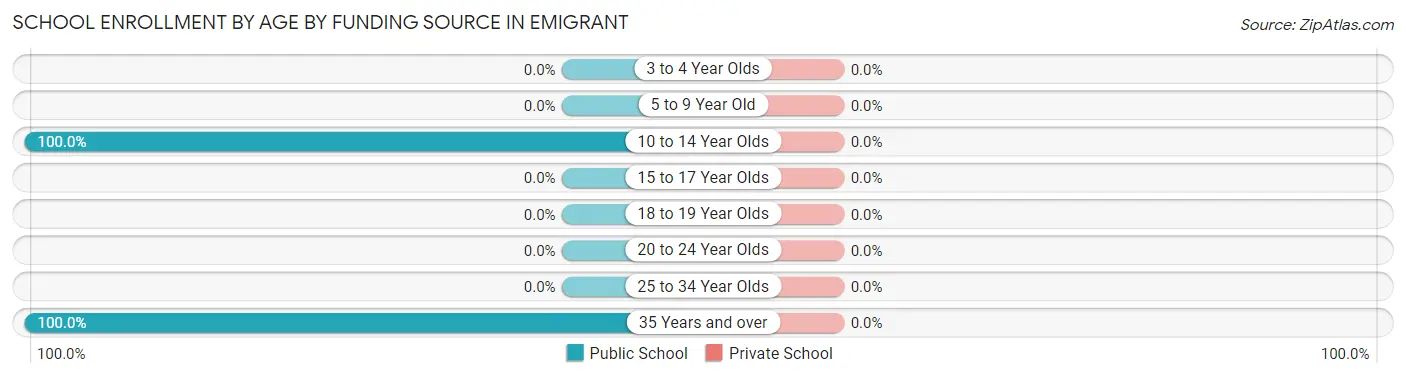
| Age Bracket | Public School | Private School |
| 3 to 4 Year Olds | 0 (0.0%) | 0 (0.0%) |
| 5 to 9 Year Old | 0 (0.0%) | 0 (0.0%) |
| 10 to 14 Year Olds | 19 (100.0%) | 0 (0.0%) |
| 15 to 17 Year Olds | 0 (0.0%) | 0 (0.0%) |
| 18 to 19 Year Olds | 0 (0.0%) | 0 (0.0%) |
| 20 to 24 Year Olds | 0 (0.0%) | 0 (0.0%) |
| 25 to 34 Year Olds | 0 (0.0%) | 0 (0.0%) |
| 35 Years and over | 19 (100.0%) | 0 (0.0%) |
| Total | 38 (100.0%) | 0 (0.0%) |
Educational Attainment by Field of Study in Emigrant
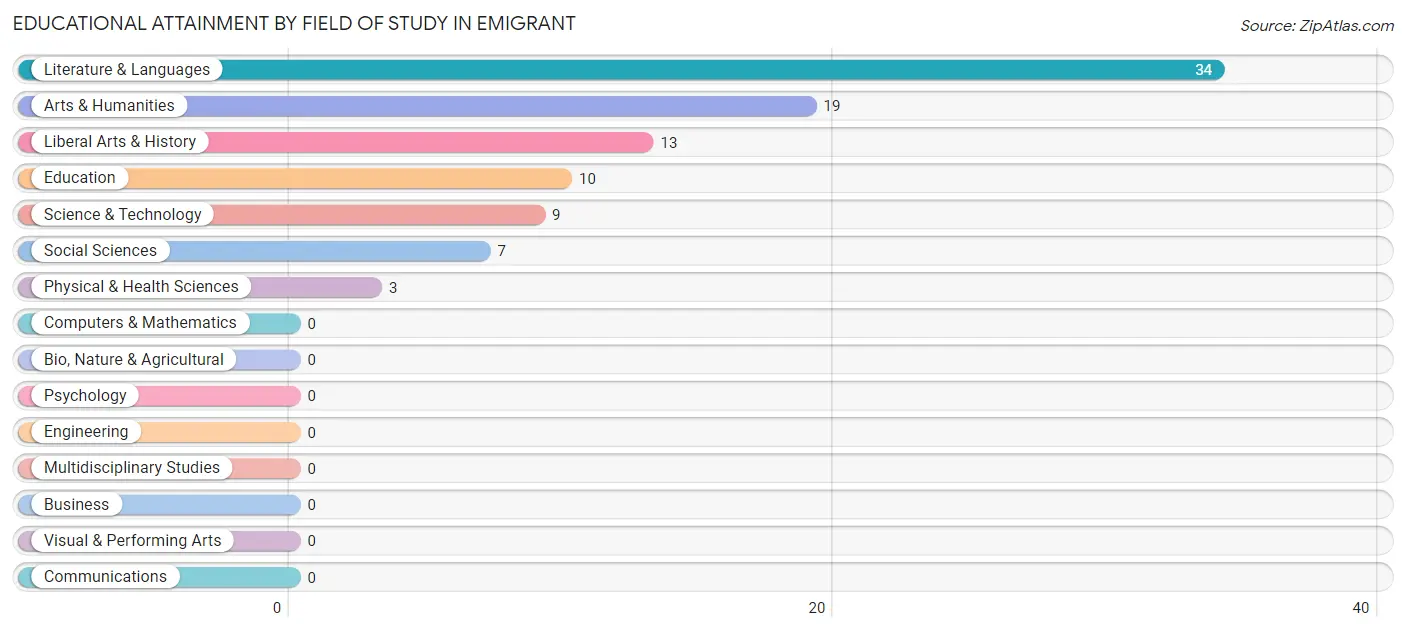
Literature & languages (34 | 35.8%), arts & humanities (19 | 20.0%), liberal arts & history (13 | 13.7%), education (10 | 10.5%), and science & technology (9 | 9.5%) are the most common fields of study among 95 individuals in Emigrant who have obtained a bachelor's degree or higher.
| Field of Study | # Graduates | % Graduates |
| Computers & Mathematics | 0 | 0.0% |
| Bio, Nature & Agricultural | 0 | 0.0% |
| Physical & Health Sciences | 3 | 3.2% |
| Psychology | 0 | 0.0% |
| Social Sciences | 7 | 7.4% |
| Engineering | 0 | 0.0% |
| Multidisciplinary Studies | 0 | 0.0% |
| Science & Technology | 9 | 9.5% |
| Business | 0 | 0.0% |
| Education | 10 | 10.5% |
| Literature & Languages | 34 | 35.8% |
| Liberal Arts & History | 13 | 13.7% |
| Visual & Performing Arts | 0 | 0.0% |
| Communications | 0 | 0.0% |
| Arts & Humanities | 19 | 20.0% |
| Total | 95 | 100.0% |
Transportation & Commute in Emigrant
Vehicle Availability by Sex in Emigrant
The most prevalent vehicle ownership categories in Emigrant are males with 2 vehicles (25, accounting for 78.1%) and females with 2 vehicles (9, making up 71.4%).
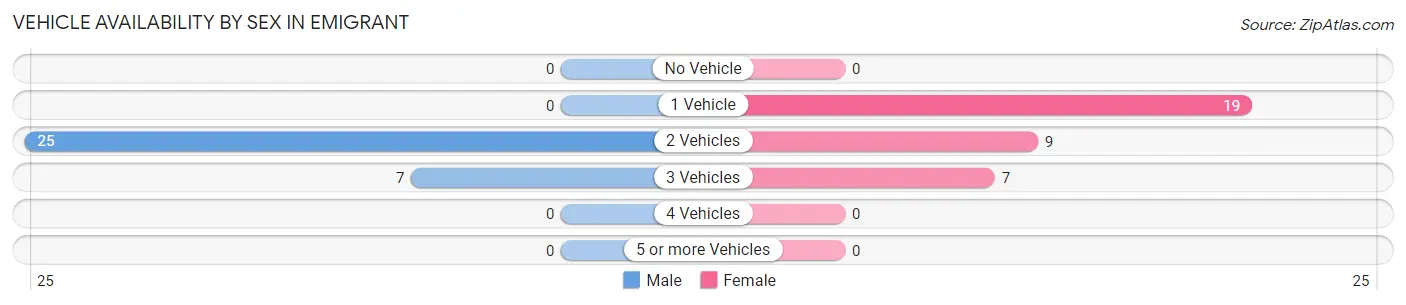
| Vehicles Available | Male | Female |
| No Vehicle | 0 (0.0%) | 0 (0.0%) |
| 1 Vehicle | 0 (0.0%) | 19 (54.3%) |
| 2 Vehicles | 25 (78.1%) | 9 (25.7%) |
| 3 Vehicles | 7 (21.9%) | 7 (20.0%) |
| 4 Vehicles | 0 (0.0%) | 0 (0.0%) |
| 5 or more Vehicles | 0 (0.0%) | 0 (0.0%) |
| Total | 32 (100.0%) | 35 (100.0%) |
Commute Time in Emigrant
The most frequently occuring commute durations in Emigrant are less than 5 minutes (78 commuters, 62.4%), 35 to 39 minutes (19 commuters, 15.2%), and 30 to 34 minutes (14 commuters, 11.2%).
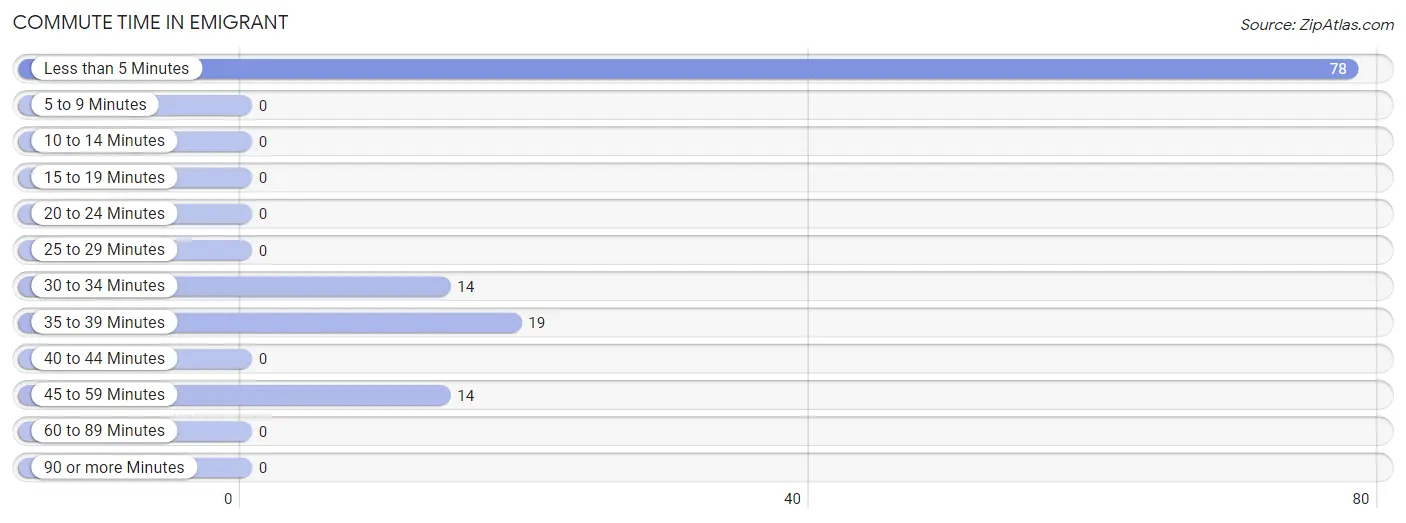
| Commute Time | # Commuters | % Commuters |
| Less than 5 Minutes | 78 | 62.4% |
| 5 to 9 Minutes | 0 | 0.0% |
| 10 to 14 Minutes | 0 | 0.0% |
| 15 to 19 Minutes | 0 | 0.0% |
| 20 to 24 Minutes | 0 | 0.0% |
| 25 to 29 Minutes | 0 | 0.0% |
| 30 to 34 Minutes | 14 | 11.2% |
| 35 to 39 Minutes | 19 | 15.2% |
| 40 to 44 Minutes | 0 | 0.0% |
| 45 to 59 Minutes | 14 | 11.2% |
| 60 to 89 Minutes | 0 | 0.0% |
| 90 or more Minutes | 0 | 0.0% |
Commute Time by Sex in Emigrant
The most common commute times in Emigrant are less than 5 minutes (78 commuters, 78.8%) for males and 35 to 39 minutes (19 commuters, 73.1%) for females.
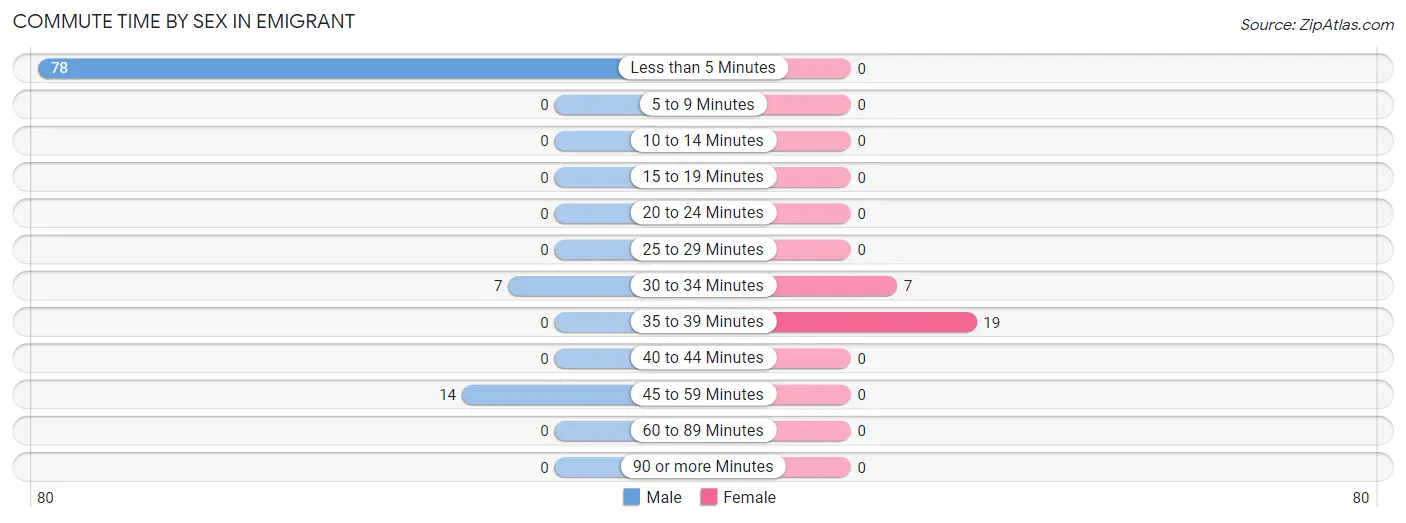
| Commute Time | Male | Female |
| Less than 5 Minutes | 78 (78.8%) | 0 (0.0%) |
| 5 to 9 Minutes | 0 (0.0%) | 0 (0.0%) |
| 10 to 14 Minutes | 0 (0.0%) | 0 (0.0%) |
| 15 to 19 Minutes | 0 (0.0%) | 0 (0.0%) |
| 20 to 24 Minutes | 0 (0.0%) | 0 (0.0%) |
| 25 to 29 Minutes | 0 (0.0%) | 0 (0.0%) |
| 30 to 34 Minutes | 7 (7.1%) | 7 (26.9%) |
| 35 to 39 Minutes | 0 (0.0%) | 19 (73.1%) |
| 40 to 44 Minutes | 0 (0.0%) | 0 (0.0%) |
| 45 to 59 Minutes | 14 (14.1%) | 0 (0.0%) |
| 60 to 89 Minutes | 0 (0.0%) | 0 (0.0%) |
| 90 or more Minutes | 0 (0.0%) | 0 (0.0%) |
Time of Departure to Work by Sex in Emigrant
The most frequent times of departure to work in Emigrant are 7:00 AM to 7:29 AM (78, 78.8%) for males and 12:00 AM to 4:59 AM (19, 73.1%) for females.
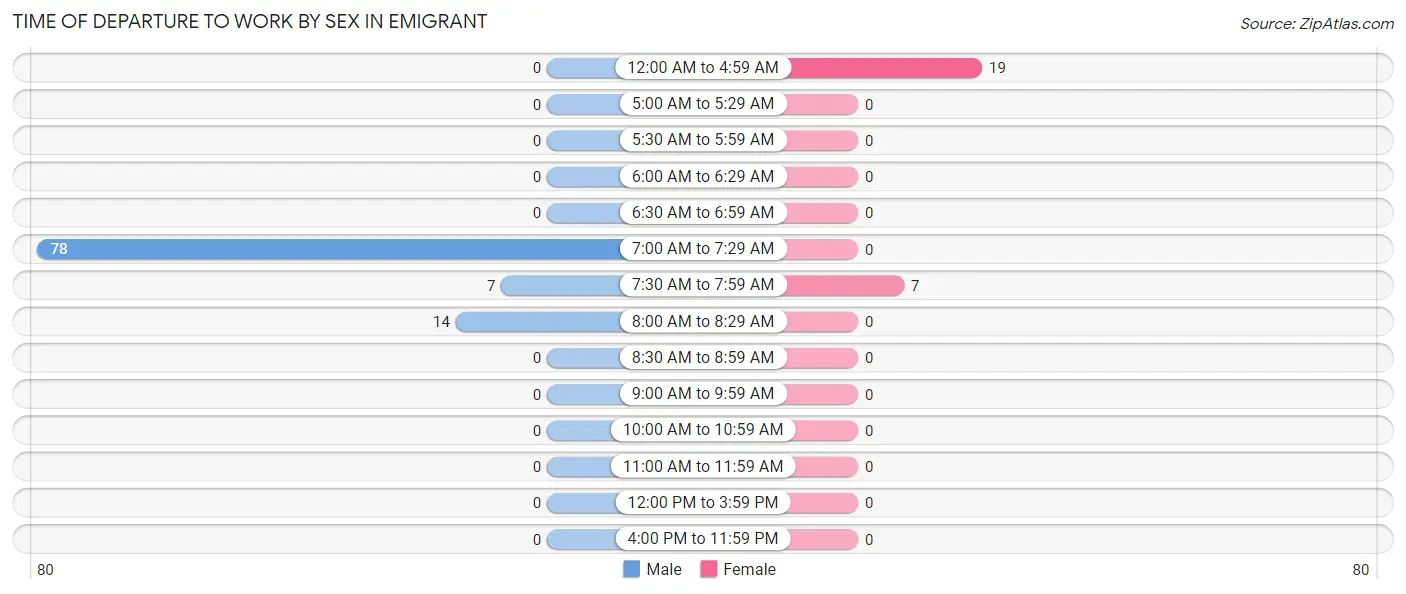
| Time of Departure | Male | Female |
| 12:00 AM to 4:59 AM | 0 (0.0%) | 19 (73.1%) |
| 5:00 AM to 5:29 AM | 0 (0.0%) | 0 (0.0%) |
| 5:30 AM to 5:59 AM | 0 (0.0%) | 0 (0.0%) |
| 6:00 AM to 6:29 AM | 0 (0.0%) | 0 (0.0%) |
| 6:30 AM to 6:59 AM | 0 (0.0%) | 0 (0.0%) |
| 7:00 AM to 7:29 AM | 78 (78.8%) | 0 (0.0%) |
| 7:30 AM to 7:59 AM | 7 (7.1%) | 7 (26.9%) |
| 8:00 AM to 8:29 AM | 14 (14.1%) | 0 (0.0%) |
| 8:30 AM to 8:59 AM | 0 (0.0%) | 0 (0.0%) |
| 9:00 AM to 9:59 AM | 0 (0.0%) | 0 (0.0%) |
| 10:00 AM to 10:59 AM | 0 (0.0%) | 0 (0.0%) |
| 11:00 AM to 11:59 AM | 0 (0.0%) | 0 (0.0%) |
| 12:00 PM to 3:59 PM | 0 (0.0%) | 0 (0.0%) |
| 4:00 PM to 11:59 PM | 0 (0.0%) | 0 (0.0%) |
| Total | 99 (100.0%) | 26 (100.0%) |
Housing Occupancy in Emigrant
Occupancy by Ownership in Emigrant
Of the total 128 dwellings in Emigrant, owner-occupied units account for 80 (62.5%), while renter-occupied units make up 48 (37.5%).
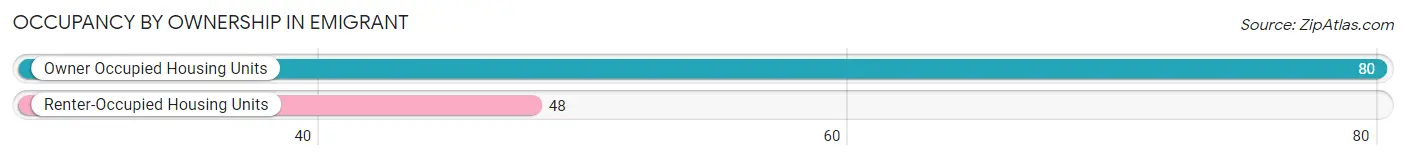
| Occupancy | # Housing Units | % Housing Units |
| Owner Occupied Housing Units | 80 | 62.5% |
| Renter-Occupied Housing Units | 48 | 37.5% |
| Total Occupied Housing Units | 128 | 100.0% |
Occupancy by Household Size in Emigrant
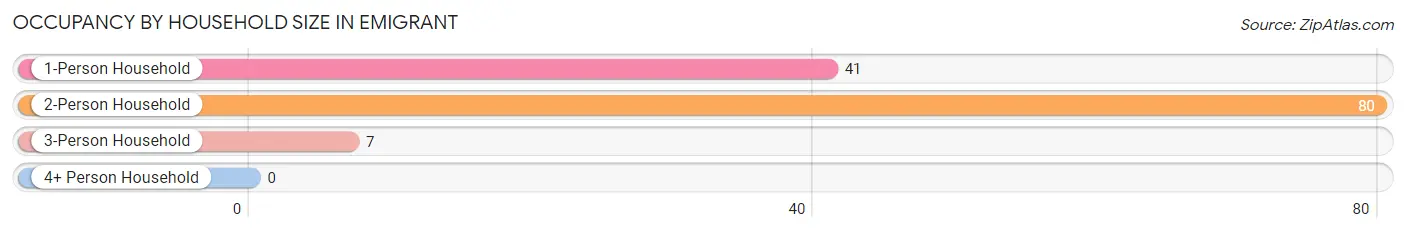
| Household Size | # Housing Units | % Housing Units |
| 1-Person Household | 41 | 32.0% |
| 2-Person Household | 80 | 62.5% |
| 3-Person Household | 7 | 5.5% |
| 4+ Person Household | 0 | 0.0% |
| Total Housing Units | 128 | 100.0% |
Occupancy by Ownership by Household Size in Emigrant
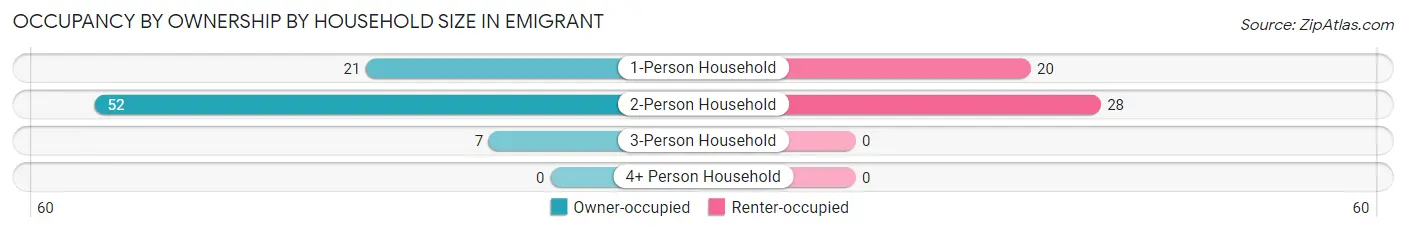
| Household Size | Owner-occupied | Renter-occupied |
| 1-Person Household | 21 (51.2%) | 20 (48.8%) |
| 2-Person Household | 52 (65.0%) | 28 (35.0%) |
| 3-Person Household | 7 (100.0%) | 0 (0.0%) |
| 4+ Person Household | 0 (0.0%) | 0 (0.0%) |
| Total Housing Units | 80 (62.5%) | 48 (37.5%) |
Occupancy by Educational Attainment in Emigrant
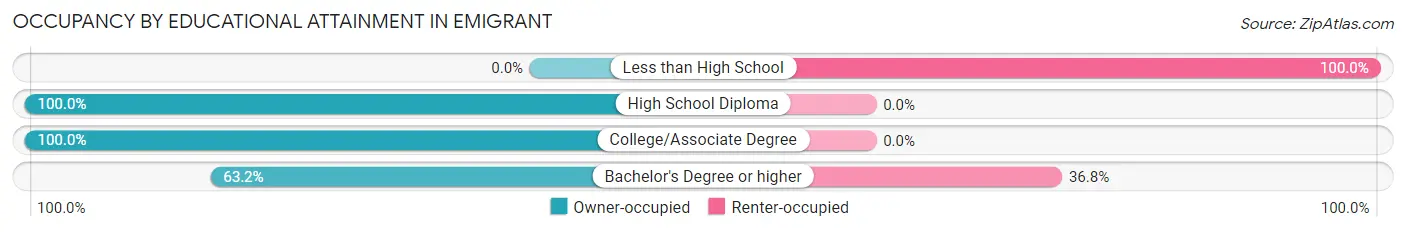
| Household Size | Owner-occupied | Renter-occupied |
| Less than High School | 0 (0.0%) | 20 (100.0%) |
| High School Diploma | 2 (100.0%) | 0 (0.0%) |
| College/Associate Degree | 30 (100.0%) | 0 (0.0%) |
| Bachelor's Degree or higher | 48 (63.2%) | 28 (36.8%) |
Occupancy by Age of Householder in Emigrant
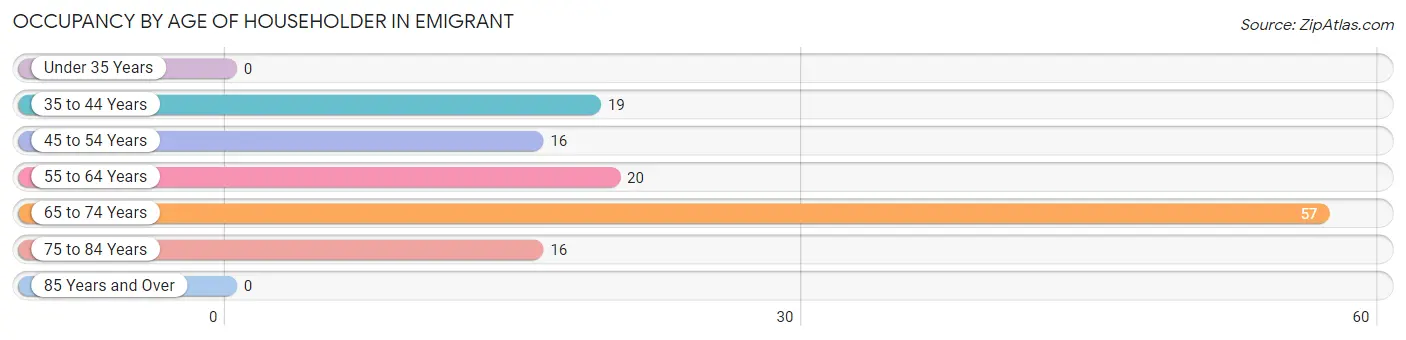
| Age Bracket | # Households | % Households |
| Under 35 Years | 0 | 0.0% |
| 35 to 44 Years | 19 | 14.8% |
| 45 to 54 Years | 16 | 12.5% |
| 55 to 64 Years | 20 | 15.6% |
| 65 to 74 Years | 57 | 44.5% |
| 75 to 84 Years | 16 | 12.5% |
| 85 Years and Over | 0 | 0.0% |
| Total | 128 | 100.0% |
Housing Finances in Emigrant
Median Income by Occupancy in Emigrant
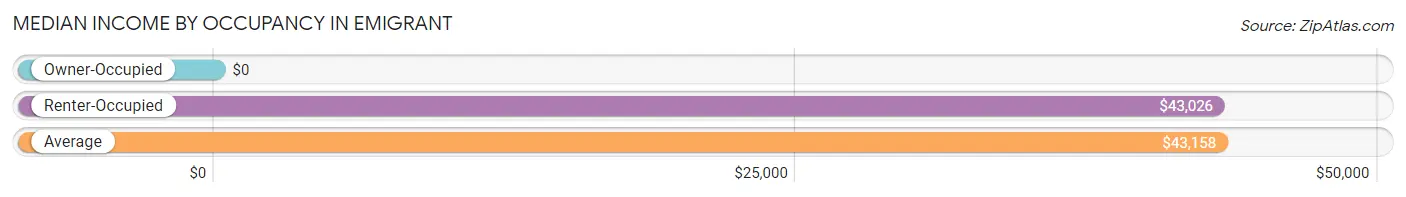
| Occupancy Type | # Households | Median Income |
| Owner-Occupied | 80 (62.5%) | $0 |
| Renter-Occupied | 48 (37.5%) | $43,026 |
| Average | 128 (100.0%) | $43,158 |
Occupancy by Householder Income Bracket in Emigrant
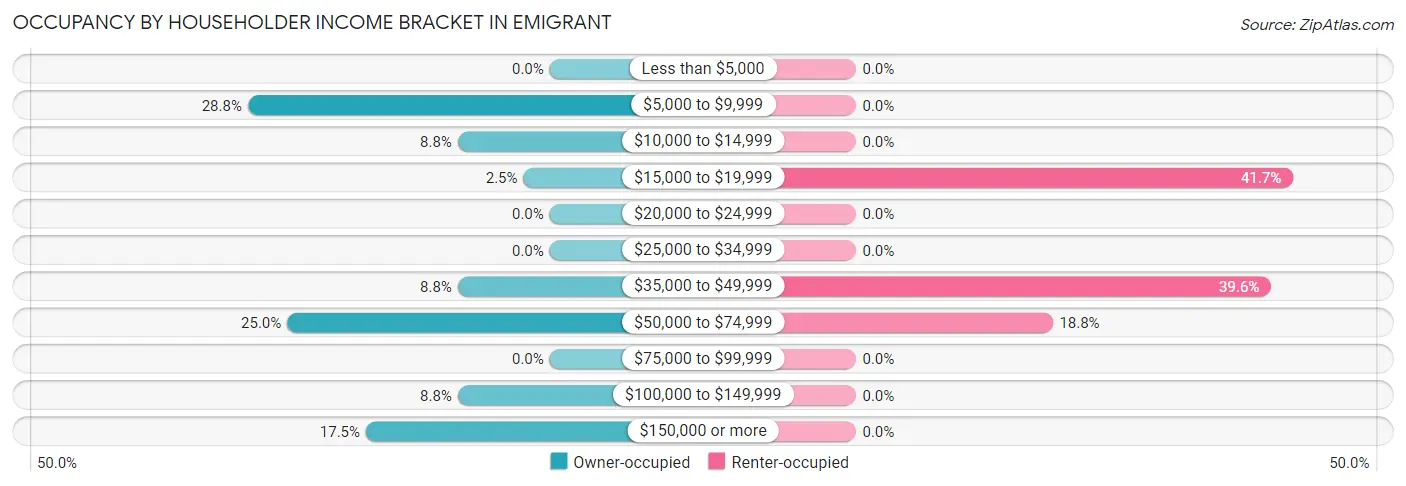
| Income Bracket | Owner-occupied | Renter-occupied |
| Less than $5,000 | 0 (0.0%) | 0 (0.0%) |
| $5,000 to $9,999 | 23 (28.7%) | 0 (0.0%) |
| $10,000 to $14,999 | 7 (8.7%) | 0 (0.0%) |
| $15,000 to $19,999 | 2 (2.5%) | 20 (41.7%) |
| $20,000 to $24,999 | 0 (0.0%) | 0 (0.0%) |
| $25,000 to $34,999 | 0 (0.0%) | 0 (0.0%) |
| $35,000 to $49,999 | 7 (8.7%) | 19 (39.6%) |
| $50,000 to $74,999 | 20 (25.0%) | 9 (18.8%) |
| $75,000 to $99,999 | 0 (0.0%) | 0 (0.0%) |
| $100,000 to $149,999 | 7 (8.7%) | 0 (0.0%) |
| $150,000 or more | 14 (17.5%) | 0 (0.0%) |
| Total | 80 (100.0%) | 48 (100.0%) |
Monthly Housing Cost Tiers in Emigrant
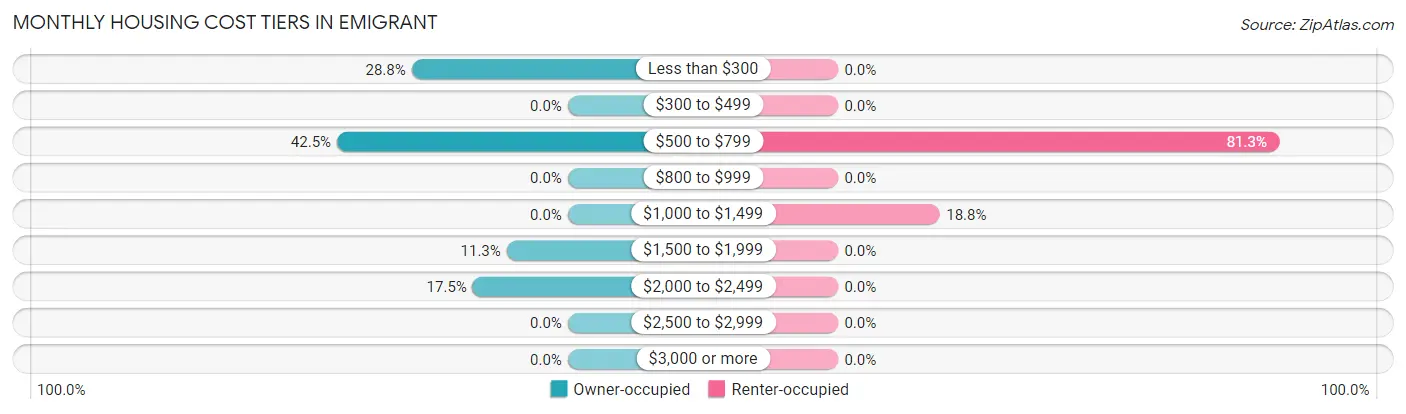
| Monthly Cost | Owner-occupied | Renter-occupied |
| Less than $300 | 23 (28.7%) | 0 (0.0%) |
| $300 to $499 | 0 (0.0%) | 0 (0.0%) |
| $500 to $799 | 34 (42.5%) | 39 (81.2%) |
| $800 to $999 | 0 (0.0%) | 0 (0.0%) |
| $1,000 to $1,499 | 0 (0.0%) | 9 (18.8%) |
| $1,500 to $1,999 | 9 (11.3%) | 0 (0.0%) |
| $2,000 to $2,499 | 14 (17.5%) | 0 (0.0%) |
| $2,500 to $2,999 | 0 (0.0%) | 0 (0.0%) |
| $3,000 or more | 0 (0.0%) | 0 (0.0%) |
| Total | 80 (100.0%) | 48 (100.0%) |
Physical Housing Characteristics in Emigrant
Housing Structures in Emigrant
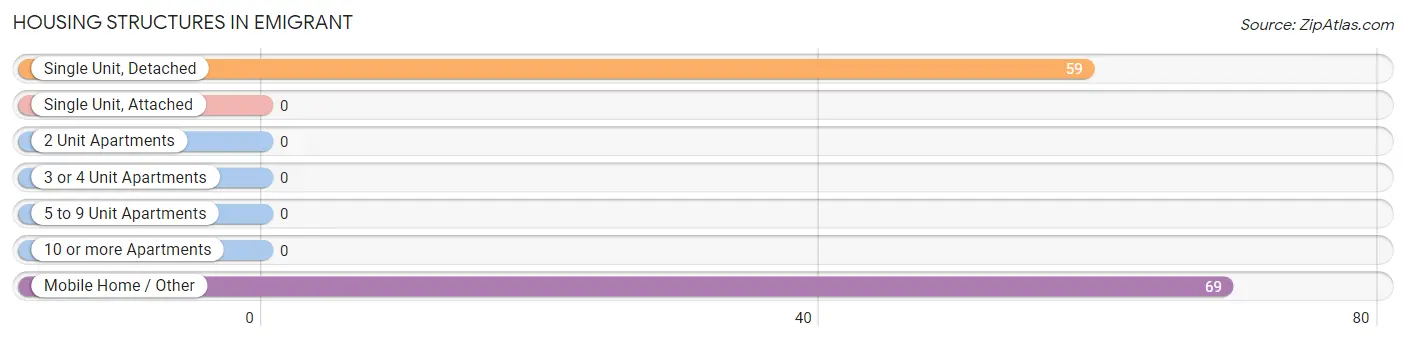
| Structure Type | # Housing Units | % Housing Units |
| Single Unit, Detached | 59 | 46.1% |
| Single Unit, Attached | 0 | 0.0% |
| 2 Unit Apartments | 0 | 0.0% |
| 3 or 4 Unit Apartments | 0 | 0.0% |
| 5 to 9 Unit Apartments | 0 | 0.0% |
| 10 or more Apartments | 0 | 0.0% |
| Mobile Home / Other | 69 | 53.9% |
| Total | 128 | 100.0% |
Housing Structures by Occupancy in Emigrant
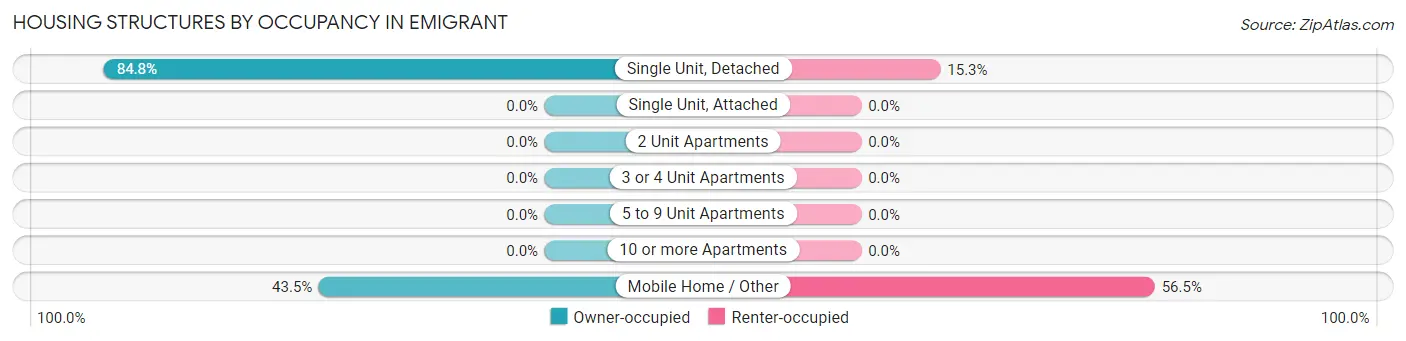
| Structure Type | Owner-occupied | Renter-occupied |
| Single Unit, Detached | 50 (84.8%) | 9 (15.2%) |
| Single Unit, Attached | 0 (0.0%) | 0 (0.0%) |
| 2 Unit Apartments | 0 (0.0%) | 0 (0.0%) |
| 3 or 4 Unit Apartments | 0 (0.0%) | 0 (0.0%) |
| 5 to 9 Unit Apartments | 0 (0.0%) | 0 (0.0%) |
| 10 or more Apartments | 0 (0.0%) | 0 (0.0%) |
| Mobile Home / Other | 30 (43.5%) | 39 (56.5%) |
| Total | 80 (62.5%) | 48 (37.5%) |
Housing Structures by Number of Rooms in Emigrant
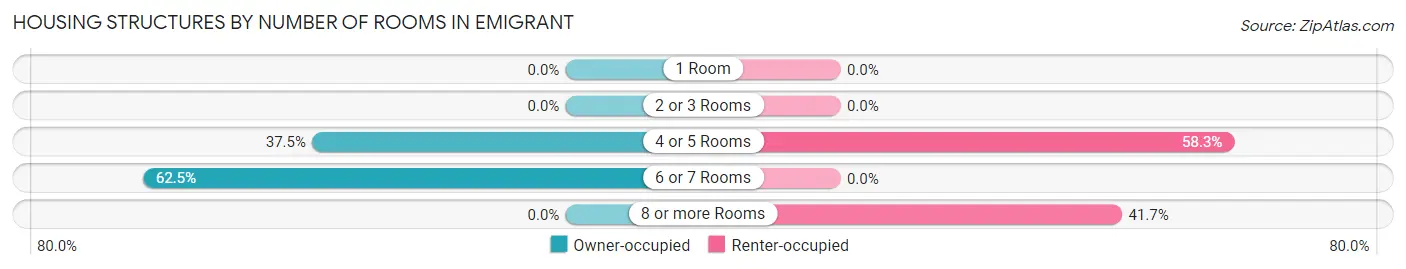
| Number of Rooms | Owner-occupied | Renter-occupied |
| 1 Room | 0 (0.0%) | 0 (0.0%) |
| 2 or 3 Rooms | 0 (0.0%) | 0 (0.0%) |
| 4 or 5 Rooms | 30 (37.5%) | 28 (58.3%) |
| 6 or 7 Rooms | 50 (62.5%) | 0 (0.0%) |
| 8 or more Rooms | 0 (0.0%) | 20 (41.7%) |
| Total | 80 (100.0%) | 48 (100.0%) |
Housing Structure by Heating Type in Emigrant
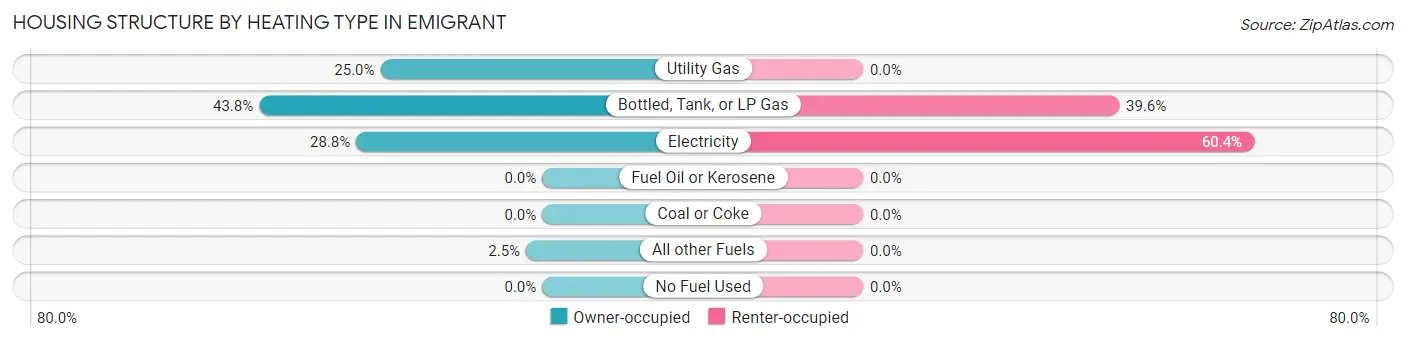
| Heating Type | Owner-occupied | Renter-occupied |
| Utility Gas | 20 (25.0%) | 0 (0.0%) |
| Bottled, Tank, or LP Gas | 35 (43.8%) | 19 (39.6%) |
| Electricity | 23 (28.7%) | 29 (60.4%) |
| Fuel Oil or Kerosene | 0 (0.0%) | 0 (0.0%) |
| Coal or Coke | 0 (0.0%) | 0 (0.0%) |
| All other Fuels | 2 (2.5%) | 0 (0.0%) |
| No Fuel Used | 0 (0.0%) | 0 (0.0%) |
| Total | 80 (100.0%) | 48 (100.0%) |
Household Vehicle Usage in Emigrant
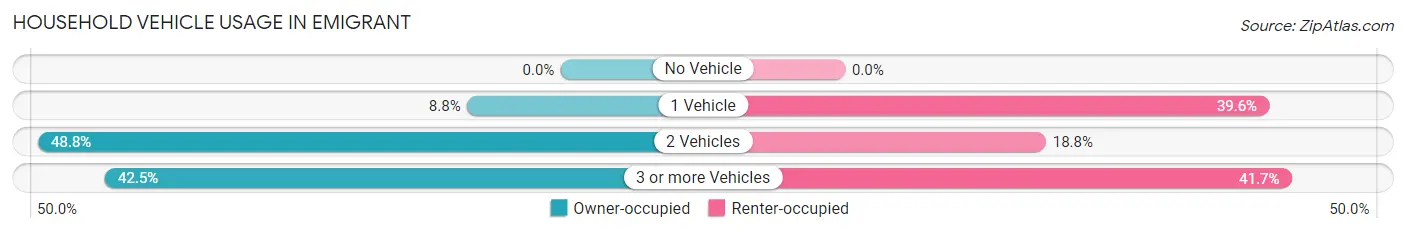
| Vehicles per Household | Owner-occupied | Renter-occupied |
| No Vehicle | 0 (0.0%) | 0 (0.0%) |
| 1 Vehicle | 7 (8.7%) | 19 (39.6%) |
| 2 Vehicles | 39 (48.7%) | 9 (18.8%) |
| 3 or more Vehicles | 34 (42.5%) | 20 (41.7%) |
| Total | 80 (100.0%) | 48 (100.0%) |
Real Estate & Mortgages in Emigrant
Real Estate and Mortgage Overview in Emigrant
| Characteristic | Without Mortgage | With Mortgage |
| Housing Units | 57 | 23 |
| Median Property Value | - | - |
| Median Household Income | - | - |
| Monthly Housing Costs | - | - |
| Real Estate Taxes | $1,250 | $0 |
Property Value by Mortgage Status in Emigrant
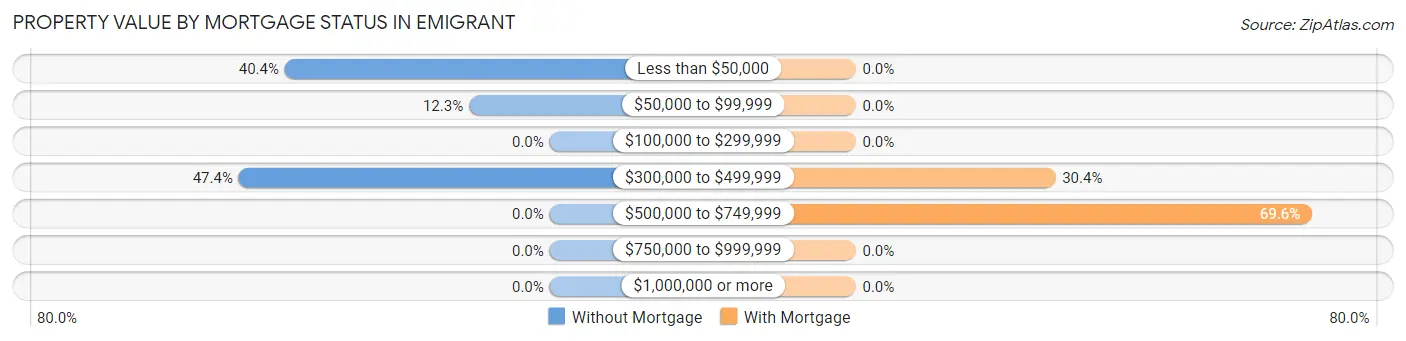
| Property Value | Without Mortgage | With Mortgage |
| Less than $50,000 | 23 (40.4%) | 0 (0.0%) |
| $50,000 to $99,999 | 7 (12.3%) | 0 (0.0%) |
| $100,000 to $299,999 | 0 (0.0%) | 0 (0.0%) |
| $300,000 to $499,999 | 27 (47.4%) | 7 (30.4%) |
| $500,000 to $749,999 | 0 (0.0%) | 16 (69.6%) |
| $750,000 to $999,999 | 0 (0.0%) | 0 (0.0%) |
| $1,000,000 or more | 0 (0.0%) | 0 (0.0%) |
| Total | 57 (100.0%) | 23 (100.0%) |
Household Income by Mortgage Status in Emigrant
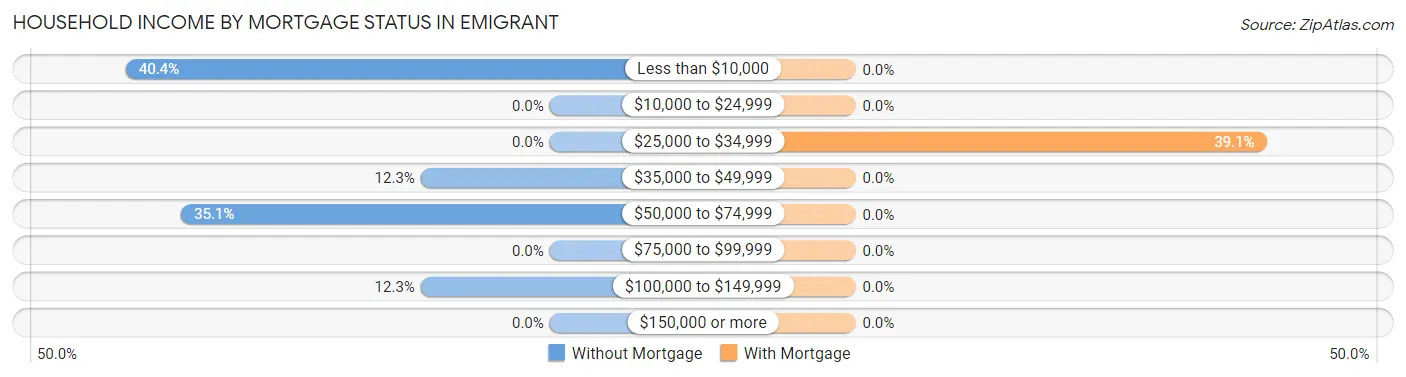
| Household Income | Without Mortgage | With Mortgage |
| Less than $10,000 | 23 (40.4%) | 0 (0.0%) |
| $10,000 to $24,999 | 0 (0.0%) | 0 (0.0%) |
| $25,000 to $34,999 | 0 (0.0%) | 9 (39.1%) |
| $35,000 to $49,999 | 7 (12.3%) | 0 (0.0%) |
| $50,000 to $74,999 | 20 (35.1%) | 0 (0.0%) |
| $75,000 to $99,999 | 0 (0.0%) | 0 (0.0%) |
| $100,000 to $149,999 | 7 (12.3%) | 0 (0.0%) |
| $150,000 or more | 0 (0.0%) | 0 (0.0%) |
| Total | 57 (100.0%) | 23 (100.0%) |
Property Value to Household Income Ratio in Emigrant
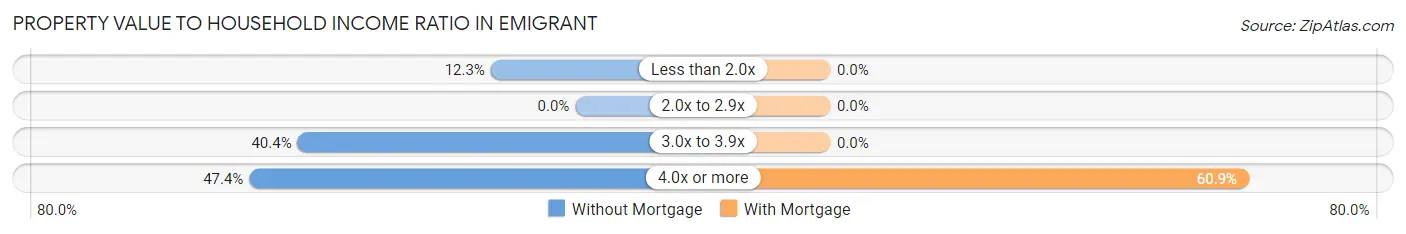
| Value-to-Income Ratio | Without Mortgage | With Mortgage |
| Less than 2.0x | 7 (12.3%) | 0 (0.0%) |
| 2.0x to 2.9x | 0 (0.0%) | 0 (0.0%) |
| 3.0x to 3.9x | 23 (40.4%) | 0 (0.0%) |
| 4.0x or more | 27 (47.4%) | 14 (60.9%) |
| Total | 57 (100.0%) | 23 (100.0%) |
Real Estate Taxes by Mortgage Status in Emigrant
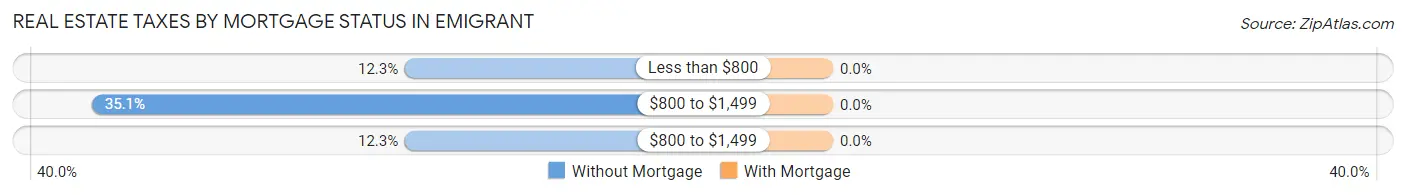
| Property Taxes | Without Mortgage | With Mortgage |
| Less than $800 | 7 (12.3%) | 0 (0.0%) |
| $800 to $1,499 | 20 (35.1%) | 0 (0.0%) |
| $800 to $1,499 | 7 (12.3%) | 0 (0.0%) |
| Total | 57 (100.0%) | 23 (100.0%) |
Health & Disability in Emigrant
Health Insurance Coverage by Age in Emigrant
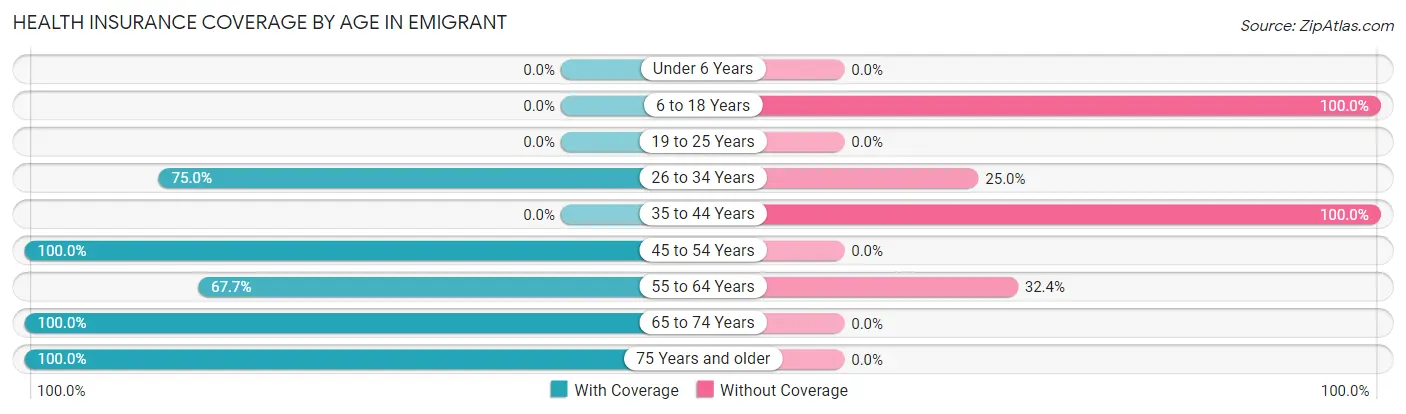
| Age Bracket | With Coverage | Without Coverage |
| Under 6 Years | 0 (0.0%) | 0 (0.0%) |
| 6 to 18 Years | 0 (0.0%) | 19 (100.0%) |
| 19 to 25 Years | 0 (0.0%) | 0 (0.0%) |
| 26 to 34 Years | 78 (75.0%) | 26 (25.0%) |
| 35 to 44 Years | 0 (0.0%) | 19 (100.0%) |
| 45 to 54 Years | 16 (100.0%) | 0 (0.0%) |
| 55 to 64 Years | 23 (67.6%) | 11 (32.4%) |
| 65 to 74 Years | 110 (100.0%) | 0 (0.0%) |
| 75 Years and older | 16 (100.0%) | 0 (0.0%) |
| Total | 243 (76.4%) | 75 (23.6%) |
Health Insurance Coverage by Citizenship Status in Emigrant

| Citizenship Status | With Coverage | Without Coverage |
| Native Born | 0 (0.0%) | 0 (0.0%) |
| Foreign Born, Citizen | 0 (0.0%) | 19 (100.0%) |
| Foreign Born, not a Citizen | 0 (0.0%) | 0 (0.0%) |
Health Insurance Coverage by Household Income in Emigrant
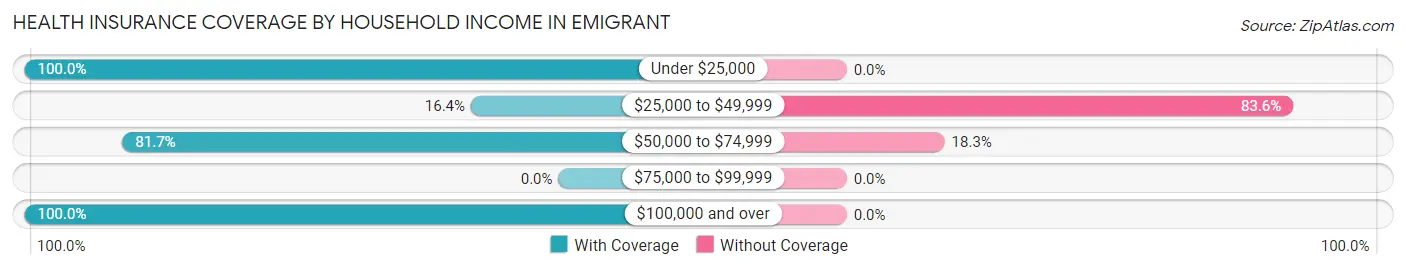
| Household Income | With Coverage | Without Coverage |
| Under $25,000 | 78 (100.0%) | 0 (0.0%) |
| $25,000 to $49,999 | 10 (16.4%) | 51 (83.6%) |
| $50,000 to $74,999 | 49 (81.7%) | 11 (18.3%) |
| $75,000 to $99,999 | 0 (0.0%) | 0 (0.0%) |
| $100,000 and over | 28 (100.0%) | 0 (0.0%) |
Public vs Private Health Insurance Coverage by Age in Emigrant
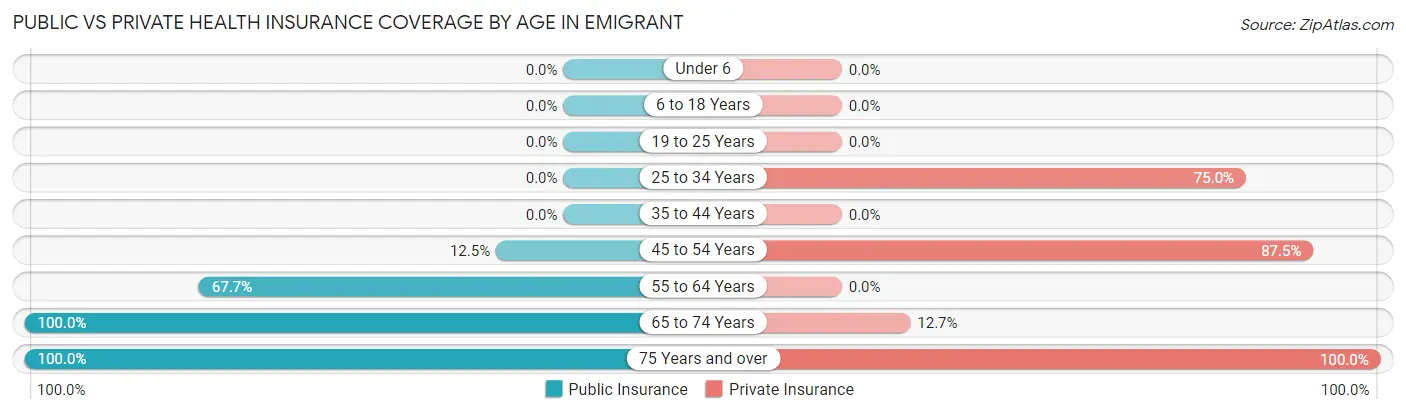
| Age Bracket | Public Insurance | Private Insurance |
| Under 6 | 0 (0.0%) | 0 (0.0%) |
| 6 to 18 Years | 0 (0.0%) | 0 (0.0%) |
| 19 to 25 Years | 0 (0.0%) | 0 (0.0%) |
| 25 to 34 Years | 0 (0.0%) | 78 (75.0%) |
| 35 to 44 Years | 0 (0.0%) | 0 (0.0%) |
| 45 to 54 Years | 2 (12.5%) | 14 (87.5%) |
| 55 to 64 Years | 23 (67.6%) | 0 (0.0%) |
| 65 to 74 Years | 110 (100.0%) | 14 (12.7%) |
| 75 Years and over | 16 (100.0%) | 16 (100.0%) |
| Total | 151 (47.5%) | 122 (38.4%) |
Disability Status by Sex by Age in Emigrant
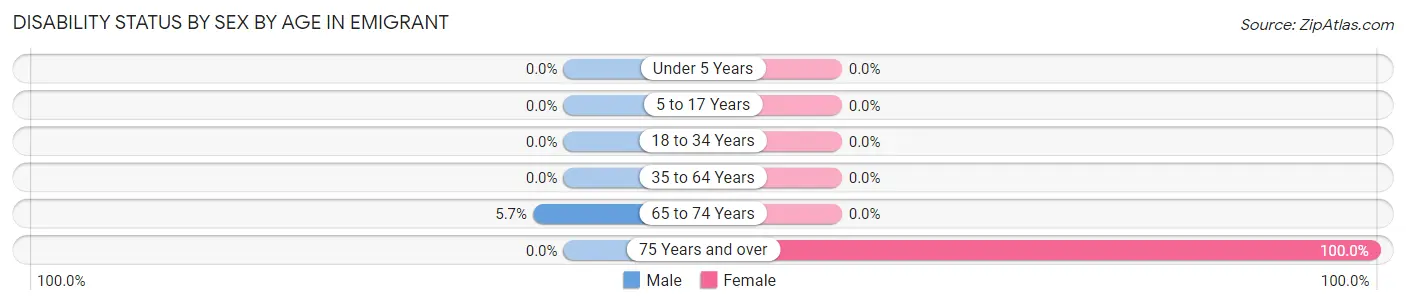
| Age Bracket | Male | Female |
| Under 5 Years | 0 (0.0%) | 0 (0.0%) |
| 5 to 17 Years | 0 (0.0%) | 0 (0.0%) |
| 18 to 34 Years | 0 (0.0%) | 0 (0.0%) |
| 35 to 64 Years | 0 (0.0%) | 0 (0.0%) |
| 65 to 74 Years | 3 (5.7%) | 0 (0.0%) |
| 75 Years and over | 0 (0.0%) | 16 (100.0%) |
Disability Class by Sex by Age in Emigrant
Disability Class: Hearing Difficulty
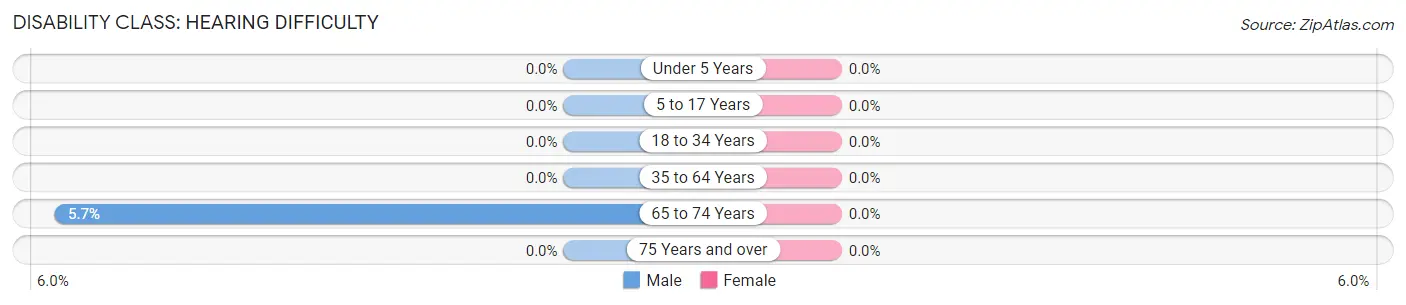
| Age Bracket | Male | Female |
| Under 5 Years | 0 (0.0%) | 0 (0.0%) |
| 5 to 17 Years | 0 (0.0%) | 0 (0.0%) |
| 18 to 34 Years | 0 (0.0%) | 0 (0.0%) |
| 35 to 64 Years | 0 (0.0%) | 0 (0.0%) |
| 65 to 74 Years | 3 (5.7%) | 0 (0.0%) |
| 75 Years and over | 0 (0.0%) | 0 (0.0%) |
Disability Class: Vision Difficulty
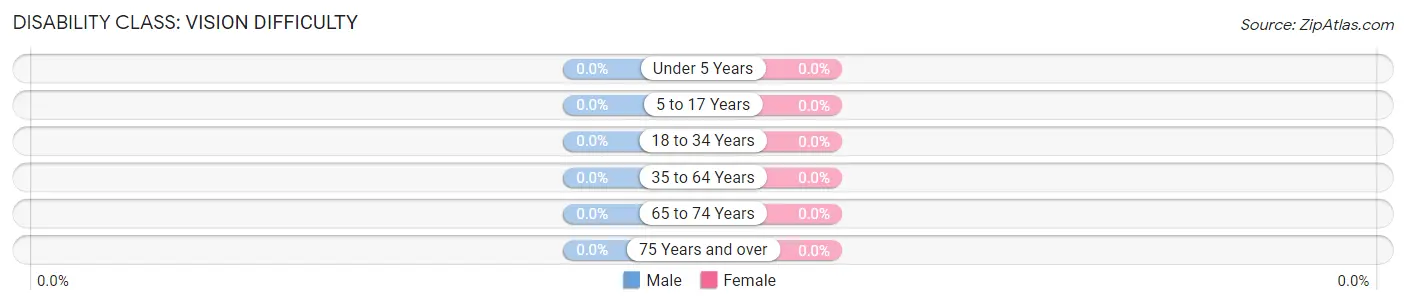
| Age Bracket | Male | Female |
| Under 5 Years | 0 (0.0%) | 0 (0.0%) |
| 5 to 17 Years | 0 (0.0%) | 0 (0.0%) |
| 18 to 34 Years | 0 (0.0%) | 0 (0.0%) |
| 35 to 64 Years | 0 (0.0%) | 0 (0.0%) |
| 65 to 74 Years | 0 (0.0%) | 0 (0.0%) |
| 75 Years and over | 0 (0.0%) | 0 (0.0%) |
Disability Class: Cognitive Difficulty
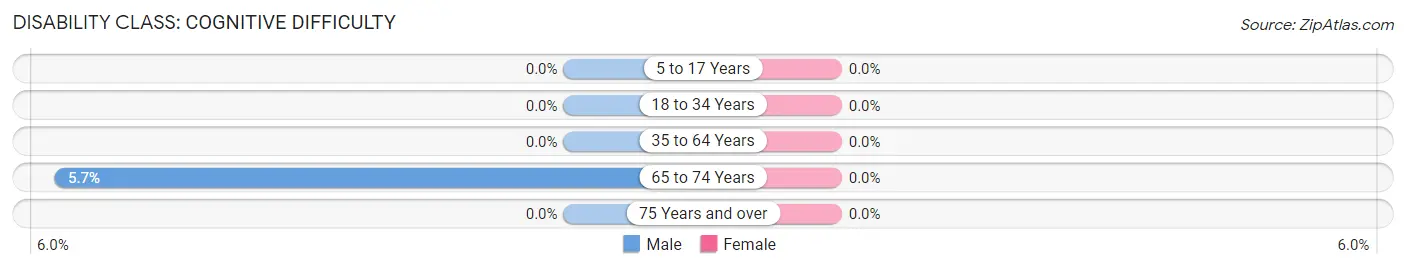
| Age Bracket | Male | Female |
| 5 to 17 Years | 0 (0.0%) | 0 (0.0%) |
| 18 to 34 Years | 0 (0.0%) | 0 (0.0%) |
| 35 to 64 Years | 0 (0.0%) | 0 (0.0%) |
| 65 to 74 Years | 3 (5.7%) | 0 (0.0%) |
| 75 Years and over | 0 (0.0%) | 0 (0.0%) |
Disability Class: Ambulatory Difficulty
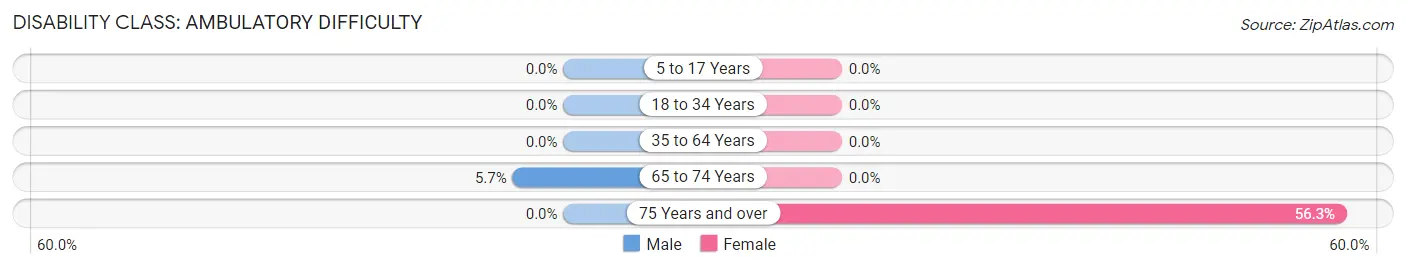
| Age Bracket | Male | Female |
| 5 to 17 Years | 0 (0.0%) | 0 (0.0%) |
| 18 to 34 Years | 0 (0.0%) | 0 (0.0%) |
| 35 to 64 Years | 0 (0.0%) | 0 (0.0%) |
| 65 to 74 Years | 3 (5.7%) | 0 (0.0%) |
| 75 Years and over | 0 (0.0%) | 9 (56.2%) |
Disability Class: Self-Care Difficulty
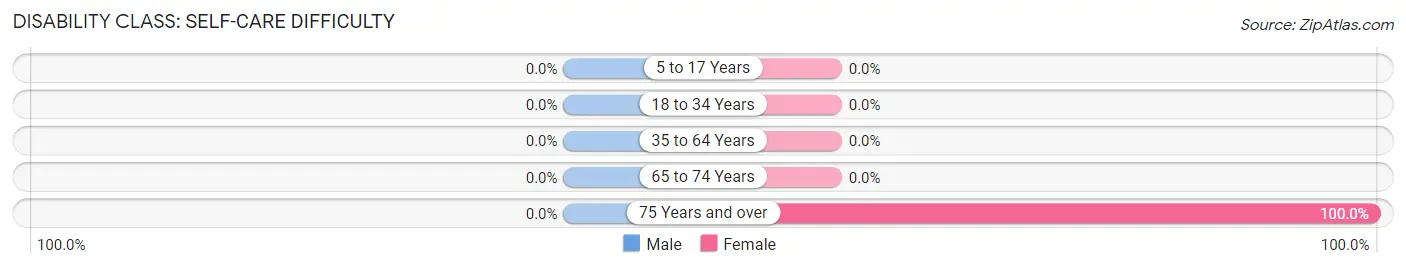
| Age Bracket | Male | Female |
| 5 to 17 Years | 0 (0.0%) | 0 (0.0%) |
| 18 to 34 Years | 0 (0.0%) | 0 (0.0%) |
| 35 to 64 Years | 0 (0.0%) | 0 (0.0%) |
| 65 to 74 Years | 0 (0.0%) | 0 (0.0%) |
| 75 Years and over | 0 (0.0%) | 16 (100.0%) |
Technology Access in Emigrant
Computing Device Access in Emigrant
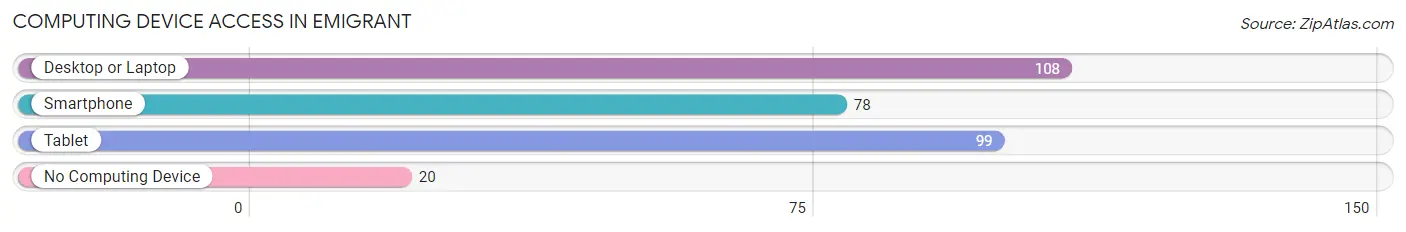
| Device Type | # Households | % Households |
| Desktop or Laptop | 108 | 84.4% |
| Smartphone | 78 | 60.9% |
| Tablet | 99 | 77.3% |
| No Computing Device | 20 | 15.6% |
| Total | 128 | 100.0% |
Internet Access in Emigrant
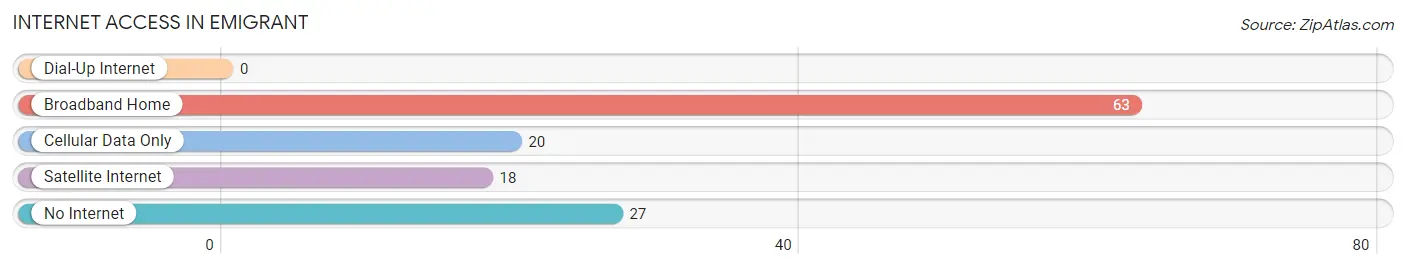
| Internet Type | # Households | % Households |
| Dial-Up Internet | 0 | 0.0% |
| Broadband Home | 63 | 49.2% |
| Cellular Data Only | 20 | 15.6% |
| Satellite Internet | 18 | 14.1% |
| No Internet | 27 | 21.1% |
| Total | 128 | 100.0% |
Emigrant Summary
Emigrant, Montana is a small unincorporated community located in Park County, Montana. It is situated in the Paradise Valley, which is a narrow valley between the Absaroka and Gallatin mountain ranges. The town is located on the Yellowstone River, and is approximately 20 miles north of Yellowstone National Park. The population of Emigrant was estimated to be around 200 people in 2020.
History
The area around Emigrant has been inhabited for thousands of years by Native American tribes, including the Crow, Shoshone, and Blackfeet. The first European settlers arrived in the area in the late 1800s, and the town of Emigrant was established in 1883. The town was named after the Emigrant Trail, which was a route used by settlers traveling westward.
The town grew quickly, and by the early 1900s, it had become a popular tourist destination. The town was home to several hotels, restaurants, and stores. In the 1920s, the town was home to a large number of sheep and cattle ranches.
Geography
Emigrant is located in the Paradise Valley, which is a narrow valley between the Absaroka and Gallatin mountain ranges. The town is situated on the Yellowstone River, and is approximately 20 miles north of Yellowstone National Park. The town is surrounded by mountains, and is known for its scenic beauty.
The climate in Emigrant is semi-arid, with hot summers and cold winters. The average annual temperature is around 45 degrees Fahrenheit. The average annual precipitation is around 12 inches.
Economy
The economy of Emigrant is largely based on tourism and agriculture. The town is home to several tourist attractions, including the Yellowstone River, the Paradise Valley, and the nearby Yellowstone National Park. The town is also home to several ranches, which raise sheep and cattle.
The town is also home to several small businesses, including restaurants, stores, and lodging. The town is also home to several art galleries, which feature the work of local artists.
Demographics
The population of Emigrant was estimated to be around 200 people in 2020. The town is predominantly white, with a small percentage of Native American and Hispanic residents. The median household income in Emigrant is around $50,000. The town has a low unemployment rate, and the majority of residents are employed in the tourism and agriculture industries.
Common Questions
What is Per Capita Income in Emigrant?
Per Capita income in Emigrant is $27,118.
What is the Median Family Income in Emigrant?
Median Family Income in Emigrant is $44,013.
What is the Median Household income in Emigrant?
Median Household Income in Emigrant is $43,158.
What is Inequality or Gini Index in Emigrant?
Inequality or Gini Index in Emigrant is 0.46.
What is the Total Population of Emigrant?
Total Population of Emigrant is 318.
What is the Total Male Population of Emigrant?
Total Male Population of Emigrant is 190.
What is the Total Female Population of Emigrant?
Total Female Population of Emigrant is 128.
What is the Ratio of Males per 100 Females in Emigrant?
There are 148.44 Males per 100 Females in Emigrant.
What is the Ratio of Females per 100 Males in Emigrant?
There are 67.37 Females per 100 Males in Emigrant.
What is the Median Population Age in Emigrant?
Median Population Age in Emigrant is 55.0 Years.
What is the Average Family Size in Emigrant
Average Family Size in Emigrant is 2.1 People.
What is the Average Household Size in Emigrant
Average Household Size in Emigrant is 1.8 People.
How Large is the Labor Force in Emigrant?
There are 150 People in the Labor Forcein in Emigrant.
What is the Percentage of People in the Labor Force in Emigrant?
50.2% of People are in the Labor Force in Emigrant.
What is the Unemployment Rate in Emigrant?
Unemployment Rate in Emigrant is 3.3%.