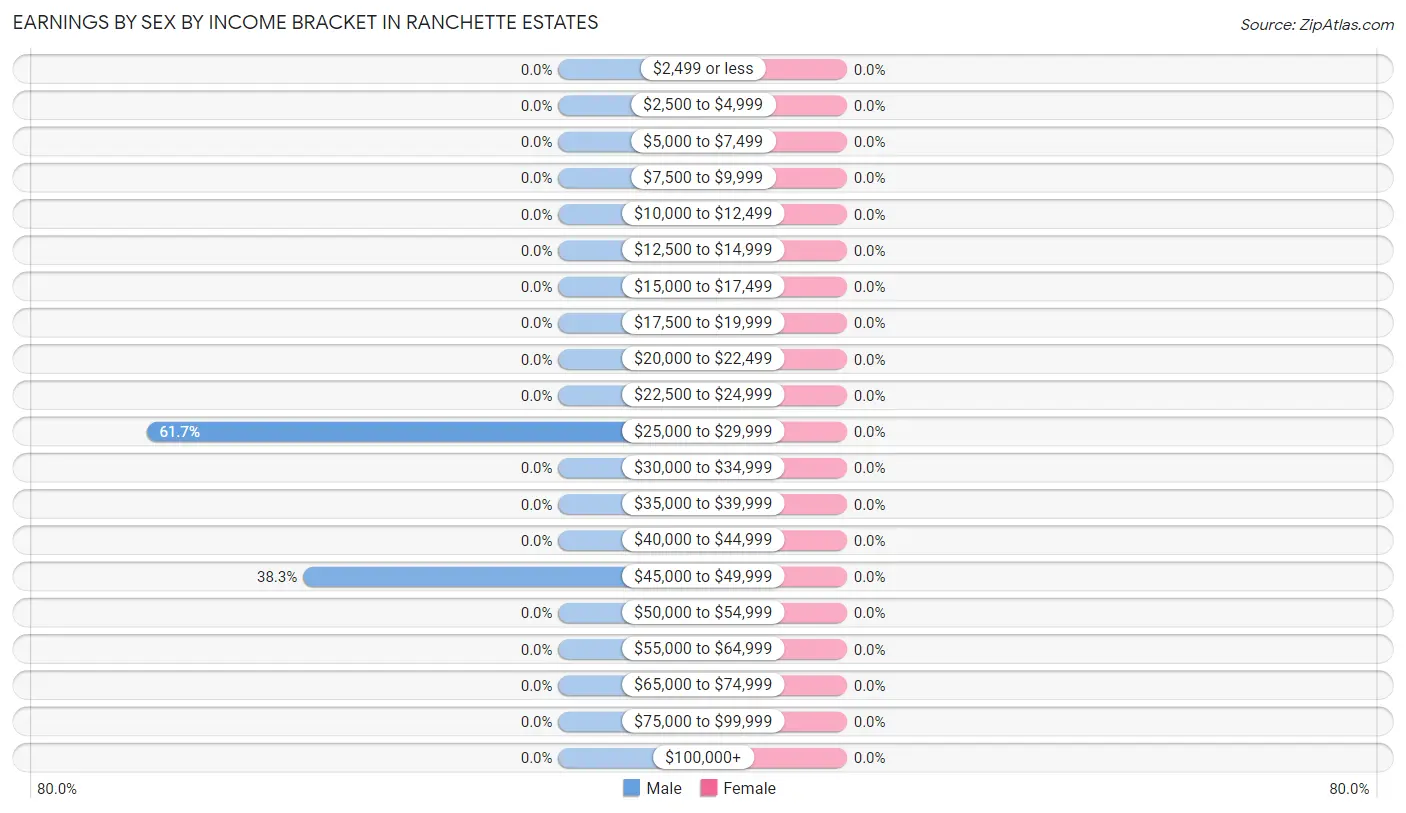
Earnings by Sex by Income Bracket in Ranchette Estates
Income
Male
Female
$2,499 or less
0 (0.0%)
0 (0.0%)
$2,500 to $4,999
0 (0.0%)
0 (0.0%)
$5,000 to $7,499
0 (0.0%)
0 (0.0%)
$7,500 to $9,999
0 (0.0%)
0 (0.0%)
$10,000 to $12,499
0 (0.0%)
0 (0.0%)
$12,500 to $14,999
0 (0.0%)
0 (0.0%)
$15,000 to $17,499
0 (0.0%)
0 (0.0%)
$17,500 to $19,999
0 (0.0%)
0 (0.0%)
$20,000 to $22,499
0 (0.0%)
0 (0.0%)
$22,500 to $24,999
0 (0.0%)
0 (0.0%)
$25,000 to $29,999
50 (61.7%)
0 (0.0%)
$30,000 to $34,999
0 (0.0%)
0 (0.0%)
$35,000 to $39,999
0 (0.0%)
0 (0.0%)
$40,000 to $44,999
0 (0.0%)
0 (0.0%)
$45,000 to $49,999
31 (38.3%)
0 (0.0%)
$50,000 to $54,999
0 (0.0%)
0 (0.0%)
$55,000 to $64,999
0 (0.0%)
0 (0.0%)
$65,000 to $74,999
0 (0.0%)
0 (0.0%)
$75,000 to $99,999
0 (0.0%)
0 (0.0%)
$100,000+
0 (0.0%)
0 (0.0%)
Total
81 (100.0%)
0 (0.0%)
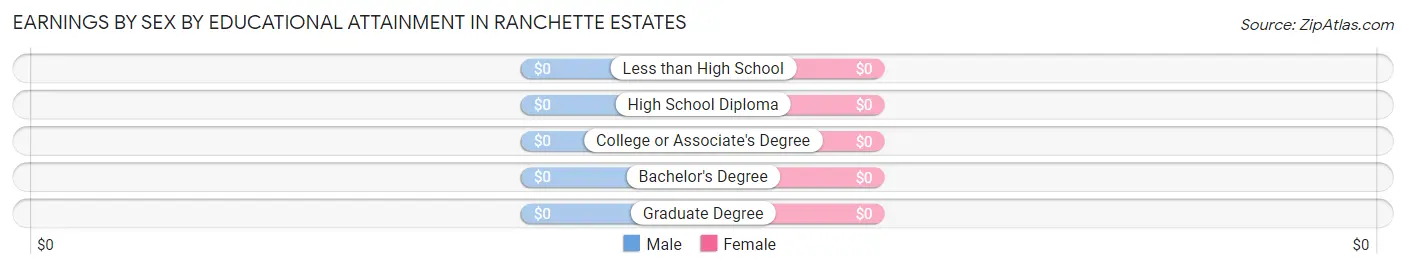
Earnings by Sex by Educational Attainment in Ranchette Estates
Educational Attainment
Male Income
Female Income
Less than High School
-
-
High School Diploma
-
-
College or Associate's Degree
-
-
Bachelor's Degree
-
-
Graduate Degree
-
-
Total
-
-
Family Income in Ranchette Estates
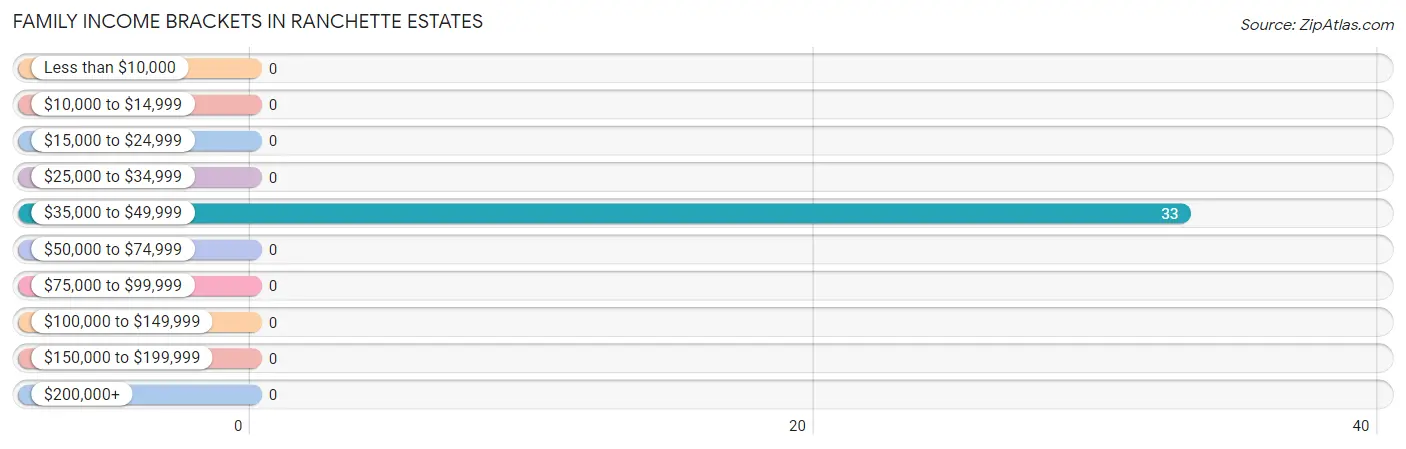
Family Income Brackets in Ranchette Estates
According to the Ranchette Estates family income data, there are 33 families falling into the $35,000 to $49,999 income range, which is the most common income bracket and makes up 100.0% of all families.
Income Bracket
# Families
% Families
Less than $10,000
0
0.0%
$10,000 to $14,999
0
0.0%
$15,000 to $24,999
0
0.0%
$25,000 to $34,999
0
0.0%
$35,000 to $49,999
33
100.0%
$50,000 to $74,999
0
0.0%
$75,000 to $99,999
0
0.0%
$100,000 to $149,999
0
0.0%
$150,000 to $199,999
0
0.0%
$200,000+
0
0.0%
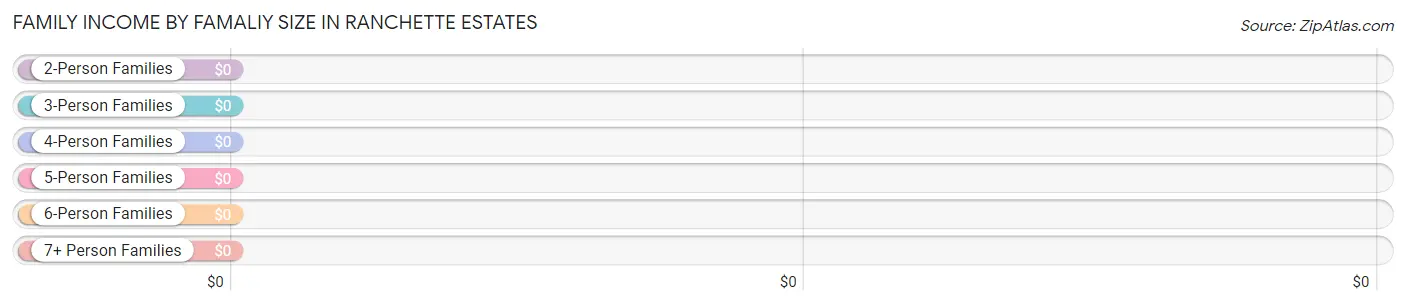
Family Income by Famaliy Size in Ranchette Estates
Income Bracket
# Families
Median Income
2-Person Families
25 (75.8%)
$0
3-Person Families
0 (0.0%)
$0
4-Person Families
0 (0.0%)
$0
5-Person Families
8 (24.2%)
$0
6-Person Families
0 (0.0%)
$0
7+ Person Families
0 (0.0%)
$0
Total
33 (100.0%)
$0
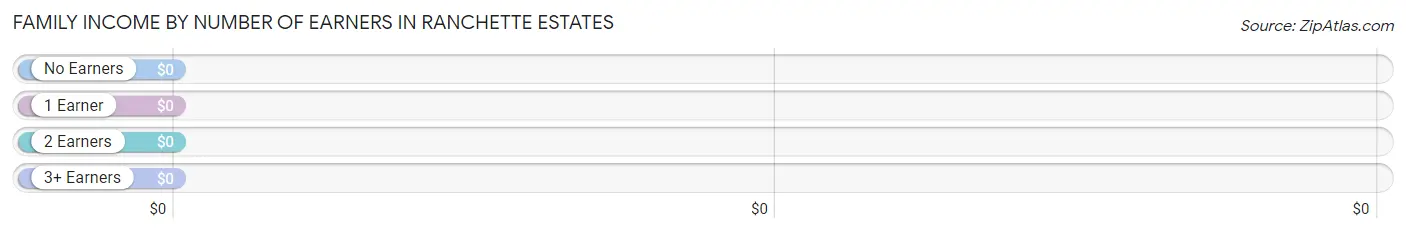
Family Income by Number of Earners in Ranchette Estates
Number of Earners
# Families
Median Income
No Earners
0 (0.0%)
$0
1 Earner
33 (100.0%)
$0
2 Earners
0 (0.0%)
$0
3+ Earners
0 (0.0%)
$0
Total
33 (100.0%)
$0
Household Income in Ranchette Estates
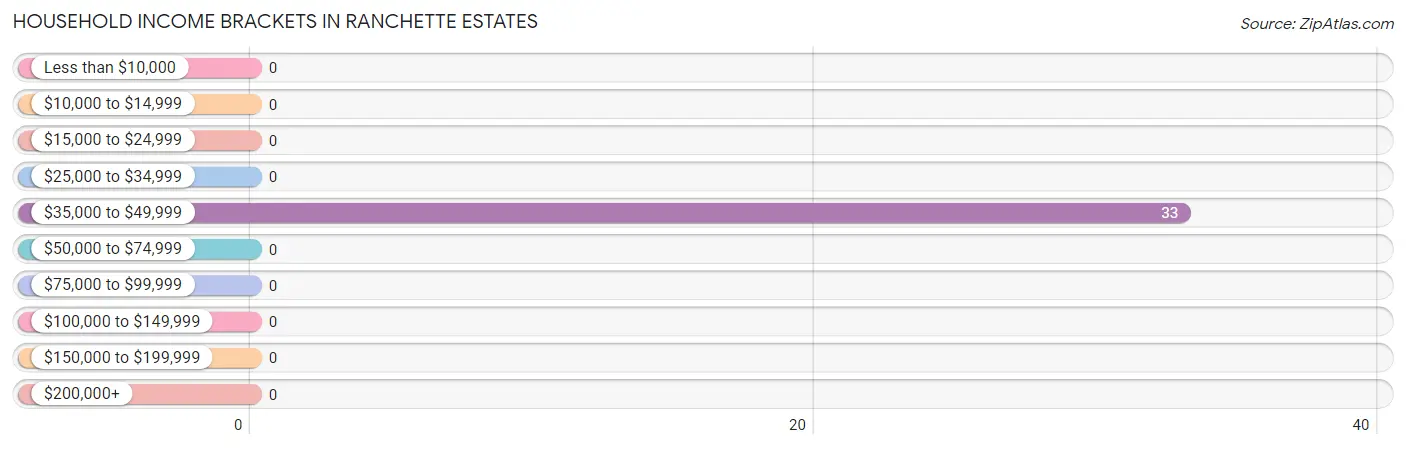
Household Income Brackets in Ranchette Estates
With 33 households falling in the category, the $35,000 to $49,999 income range is the most frequent in Ranchette Estates, accounting for 100.0% of all households.
Income Bracket
# Households
% Households
Less than $10,000
0
0.0%
$10,000 to $14,999
0
0.0%
$15,000 to $24,999
0
0.0%
$25,000 to $34,999
0
0.0%
$35,000 to $49,999
33
100.0%
$50,000 to $74,999
0
0.0%
$75,000 to $99,999
0
0.0%
$100,000 to $149,999
0
0.0%
$150,000 to $199,999
0
0.0%
$200,000+
0
0.0%
Household Income by Householder Age in Ranchette Estates
Income Bracket
# Households
Median Income
15 to 24 Years
8 (24.2%)
$0
25 to 44 Years
0 (0.0%)
$0
45 to 64 Years
25 (75.8%)
$0
65+ Years
0 (0.0%)
$0
Total
33 (100.0%)
$0
Poverty in Ranchette Estates
Income Below Poverty by Sex and Age in Ranchette Estates
Age Bracket
Male
Female
Under 5 Years
0 (0.0%)
0 (0.0%)
5 Years
0 (0.0%)
0 (0.0%)
6 to 11 Years
0 (0.0%)
0 (0.0%)
12 to 14 Years
0 (0.0%)
0 (0.0%)
15 Years
0 (0.0%)
0 (0.0%)
16 and 17 Years
0 (0.0%)
0 (0.0%)
18 to 24 Years
0 (0.0%)
0 (0.0%)
25 to 34 Years
0 (0.0%)
0 (0.0%)
35 to 44 Years
0 (0.0%)
0 (0.0%)
45 to 54 Years
0 (0.0%)
0 (0.0%)
55 to 64 Years
0 (0.0%)
0 (0.0%)
65 to 74 Years
0 (0.0%)
0 (0.0%)
75 Years and over
0 (0.0%)
0 (0.0%)
Total
0 (0.0%)
0 (0.0%)
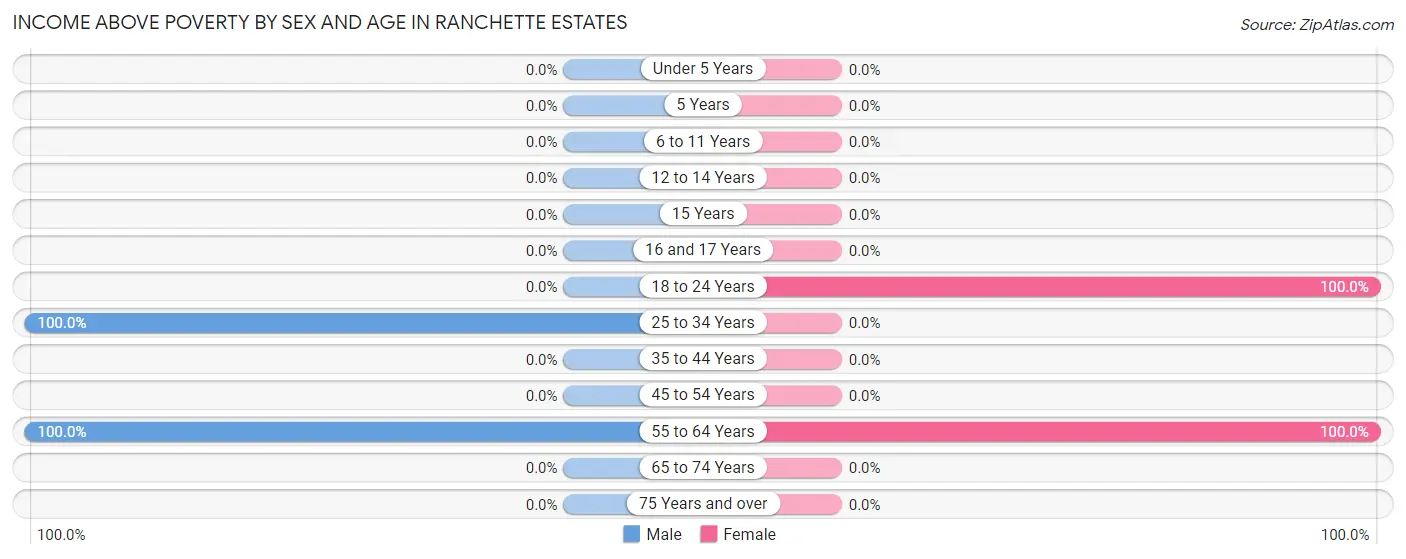
Income Above Poverty by Sex and Age in Ranchette Estates
According to the poverty statistics in Ranchette Estates, males aged 25 to 34 years and females aged 18 to 24 years are the age groups that are most secure financially, with 100.0% of males and 100.0% of females in these age groups living above the poverty line.
Age Bracket
Male
Female
Under 5 Years
0 (0.0%)
0 (0.0%)
5 Years
0 (0.0%)
0 (0.0%)
6 to 11 Years
0 (0.0%)
0 (0.0%)
12 to 14 Years
0 (0.0%)
0 (0.0%)
15 Years
0 (0.0%)
0 (0.0%)
16 and 17 Years
0 (0.0%)
0 (0.0%)
18 to 24 Years
0 (0.0%)
8 (100.0%)
25 to 34 Years
97 (100.0%)
0 (0.0%)
35 to 44 Years
0 (0.0%)
0 (0.0%)
45 to 54 Years
0 (0.0%)
0 (0.0%)
55 to 64 Years
28 (100.0%)
40 (100.0%)
65 to 74 Years
0 (0.0%)
0 (0.0%)
75 Years and over
0 (0.0%)
0 (0.0%)
Total
125 (100.0%)
48 (100.0%)
Income Below Poverty Among Married-Couple Families in Ranchette Estates
Children
Above Poverty
Below Poverty
No Children
0 (0.0%)
0 (0.0%)
1 or 2 Children
0 (0.0%)
0 (0.0%)
3 or 4 Children
0 (0.0%)
0 (0.0%)
5 or more Children
0 (0.0%)
0 (0.0%)
Total
0 (0.0%)
0 (0.0%)
Income Below Poverty Among Single-Parent Households in Ranchette Estates
Children
Single Father
Single Mother
No Children
0 (0.0%)
0 (0.0%)
1 or 2 Children
0 (0.0%)
0 (0.0%)
3 or 4 Children
0 (0.0%)
0 (0.0%)
5 or more Children
0 (0.0%)
0 (0.0%)
Total
0 (0.0%)
0 (0.0%)
Income Below Poverty Among Married-Couple vs Single-Parent Households in Ranchette Estates
Children
Married-Couple Families
Single-Parent Households
No Children
0 (0.0%)
0 (0.0%)
1 or 2 Children
0 (0.0%)
0 (0.0%)
3 or 4 Children
0 (0.0%)
0 (0.0%)
5 or more Children
0 (0.0%)
0 (0.0%)
Total
0 (0.0%)
0 (0.0%)
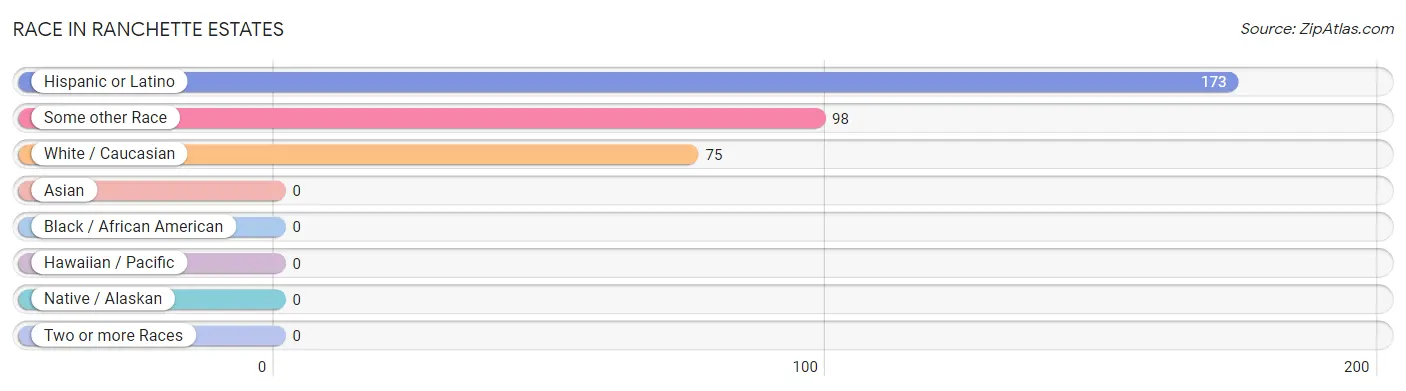
Race in Ranchette Estates
The most populous races in Ranchette Estates are Hispanic or Latino (173 | 100.0%), Some other Race (98 | 56.7%), and White / Caucasian (75 | 43.3%).
Race
# Population
% Population
Asian
0
0.0%
Black / African American
0
0.0%
Hawaiian / Pacific
0
0.0%
Hispanic or Latino
173
100.0%
Native / Alaskan
0
0.0%
White / Caucasian
75
43.3%
Two or more Races
0
0.0%
Some other Race
98
56.7%
Total
173
100.0%
Ancestry in Ranchette Estates
The most populous ancestries reported in Ranchette Estates are , and Mexican (173 | 100.0%), together accounting for 100.0% of all Ranchette Estates residents.
Ancestry
# Population
% Population
Mexican
173
100.0%
View All 1 Rows
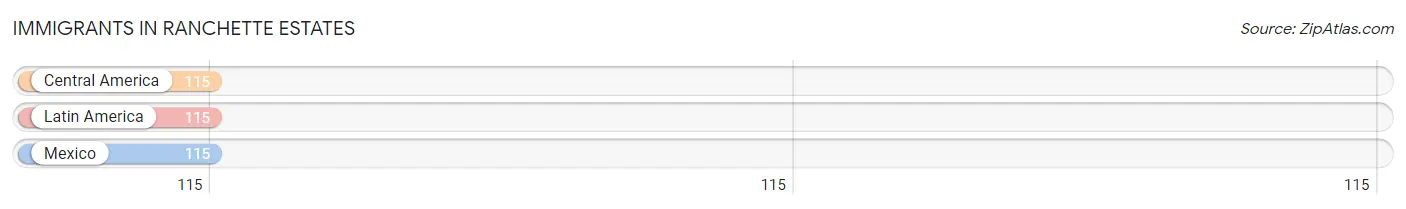
Immigrants in Ranchette Estates
The most numerous immigrant groups reported in Ranchette Estates came from Central America (115 | 66.5%), Latin America (115 | 66.5%), and Mexico (115 | 66.5%), together accounting for 199.4% of all Ranchette Estates residents.
Immigration Origin
# Population
% Population
Central America
115
66.5%
Latin America
115
66.5%
Mexico
115
66.5%
View All 3 Rows
Sex and Age in Ranchette Estates
Sex and Age in Ranchette Estates
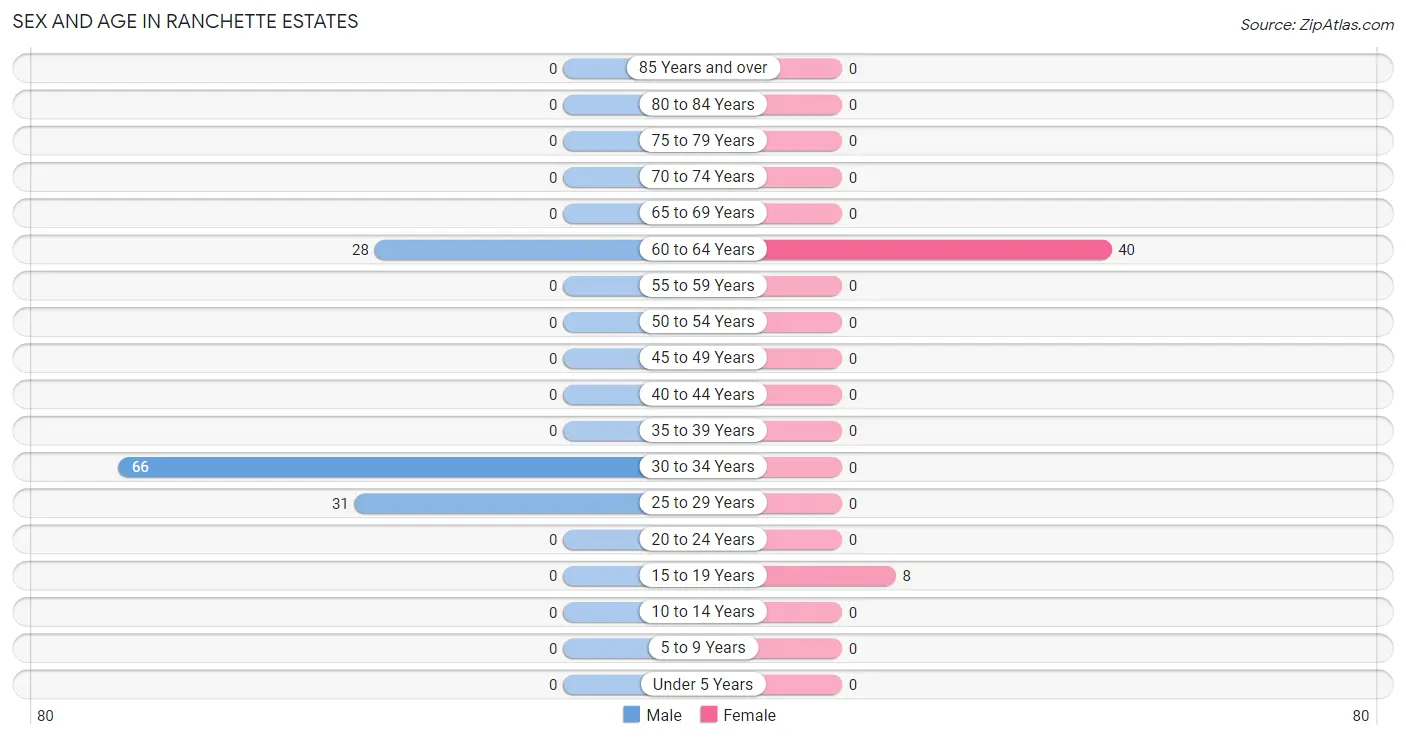
The most populous age groups in Ranchette Estates are 30 to 34 Years (66 | 52.8%) for men and 60 to 64 Years (40 | 83.3%) for women.
Age Bracket
Male
Female
Under 5 Years
0 (0.0%)
0 (0.0%)
5 to 9 Years
0 (0.0%)
0 (0.0%)
10 to 14 Years
0 (0.0%)
0 (0.0%)
15 to 19 Years
0 (0.0%)
8 (16.7%)
20 to 24 Years
0 (0.0%)
0 (0.0%)
25 to 29 Years
31 (24.8%)
0 (0.0%)
30 to 34 Years
66 (52.8%)
0 (0.0%)
35 to 39 Years
0 (0.0%)
0 (0.0%)
40 to 44 Years
0 (0.0%)
0 (0.0%)
45 to 49 Years
0 (0.0%)
0 (0.0%)
50 to 54 Years
0 (0.0%)
0 (0.0%)
55 to 59 Years
0 (0.0%)
0 (0.0%)
60 to 64 Years
28 (22.4%)
40 (83.3%)
65 to 69 Years
0 (0.0%)
0 (0.0%)
70 to 74 Years
0 (0.0%)
0 (0.0%)
75 to 79 Years
0 (0.0%)
0 (0.0%)
80 to 84 Years
0 (0.0%)
0 (0.0%)
85 Years and over
0 (0.0%)
0 (0.0%)
Total
125 (100.0%)
48 (100.0%)
Families and Households in Ranchette Estates
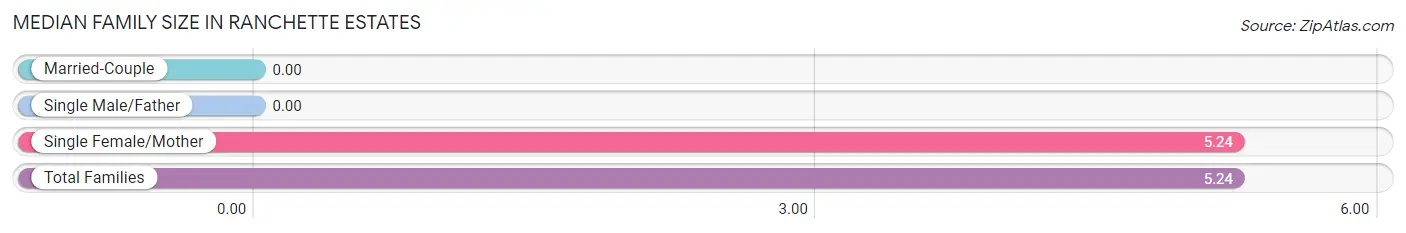
Median Family Size in Ranchette Estates
Family Type
# Families
Family Size
Married-Couple
0 (0.0%)
-
Single Male/Father
0 (0.0%)
-
Single Female/Mother
33 (100.0%)
5.24
Total Families
33 (100.0%)
5.24
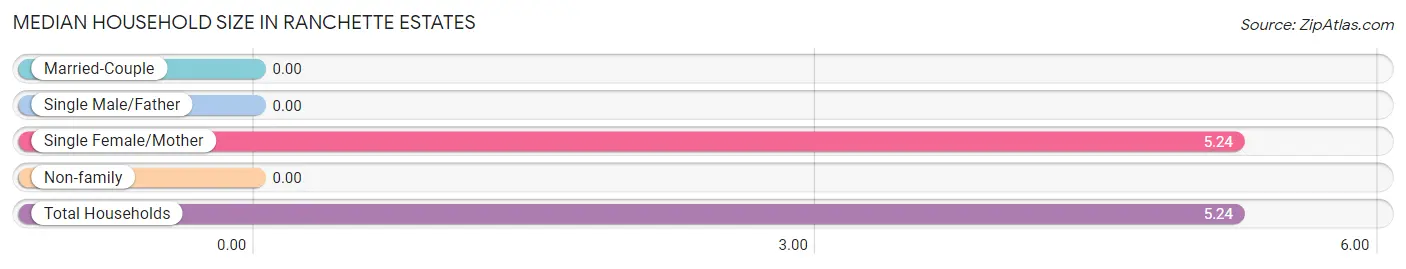
Median Household Size in Ranchette Estates
Household Type
# Households
Household Size
Married-Couple
0 (0.0%)
-
Single Male/Father
0 (0.0%)
-
Single Female/Mother
33 (100.0%)
5.24
Non-family
0 (0.0%)
-
Total Households
33 (100.0%)
5.24
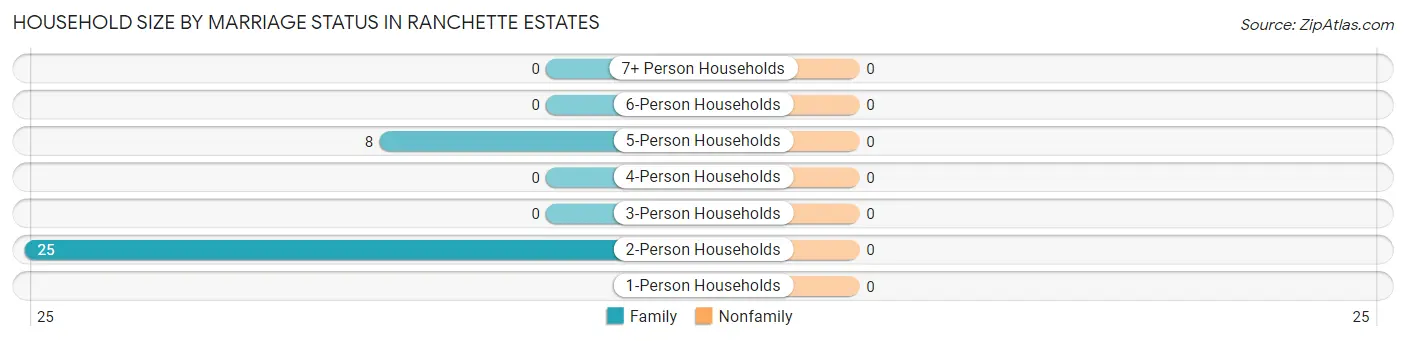
Household Size by Marriage Status in Ranchette Estates
Household Size
Family Households
Nonfamily Households
1-Person Households
-
0 (0.0%)
2-Person Households
25 (75.8%)
0 (0.0%)
3-Person Households
0 (0.0%)
0 (0.0%)
4-Person Households
0 (0.0%)
0 (0.0%)
5-Person Households
8 (24.2%)
0 (0.0%)
6-Person Households
0 (0.0%)
0 (0.0%)
7+ Person Households
0 (0.0%)
0 (0.0%)
Total
33 (100.0%)
0 (0.0%)
Female Fertility in Ranchette Estates
Fertility by Age in Ranchette Estates
Age Bracket
Women with Births
Births / 1,000 Women
15 to 19 years
0 (0.0%)
0.0
20 to 34 years
0 (0.0%)
0.0
35 to 50 years
0 (0.0%)
0.0
Total
0 (0.0%)
0.0
Fertility by Age by Marriage Status in Ranchette Estates
Age Bracket
Married
Unmarried
15 to 19 years
0 (0.0%)
0 (0.0%)
20 to 34 years
0 (0.0%)
0 (0.0%)
35 to 50 years
0 (0.0%)
0 (0.0%)
Total
0 (0.0%)
0 (0.0%)
Fertility by Education in Ranchette Estates
Educational Attainment
Women with Births
Births / 1,000 Women
Less than High School
0 (0.0%)
0.0
High School Diploma
0 (0.0%)
0.0
College or Associate's Degree
0 (0.0%)
0.0
Bachelor's Degree
0 (0.0%)
0.0
Graduate Degree
0 (0.0%)
0.0
Total
0 (0.0%)
0.0
Fertility by Education by Marriage Status in Ranchette Estates
Educational Attainment
Married
Unmarried
Less than High School
0 (0.0%)
0 (0.0%)
High School Diploma
0 (0.0%)
0 (0.0%)
College or Associate's Degree
0 (0.0%)
0 (0.0%)
Bachelor's Degree
0 (0.0%)
0 (0.0%)
Graduate Degree
0 (0.0%)
0 (0.0%)
Total
0 (0.0%)
0 (0.0%)
Employment Characteristics in Ranchette Estates
Employment by Class of Employer in Ranchette Estates
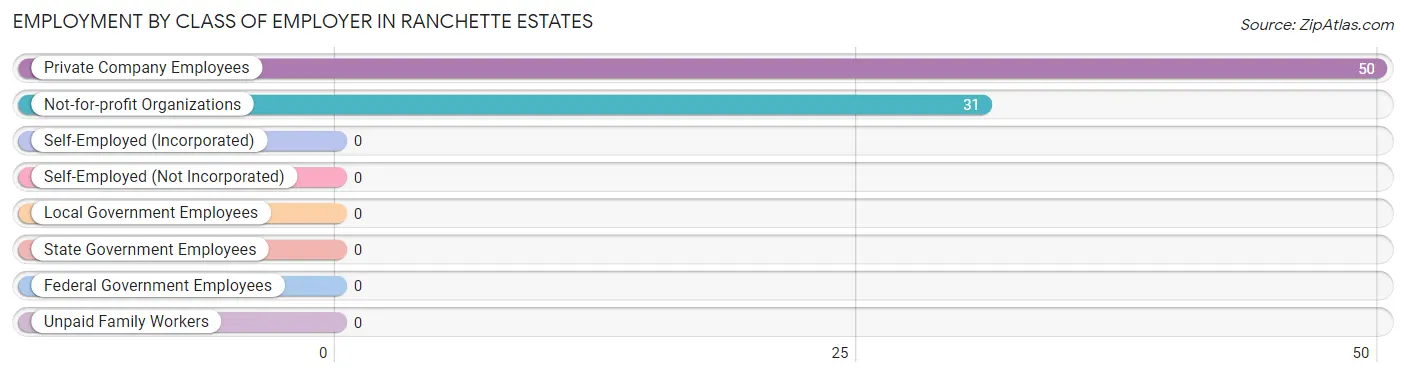
Among the 81 employed individuals in Ranchette Estates, private company employees (50 | 61.7%), and not-for-profit organizations (31 | 38.3%) make up the most common classes of employment.
Employer Class
# Employees
% Employees
Private Company Employees
50
61.7%
Self-Employed (Incorporated)
0
0.0%
Self-Employed (Not Incorporated)
0
0.0%
Not-for-profit Organizations
31
38.3%
Local Government Employees
0
0.0%
State Government Employees
0
0.0%
Federal Government Employees
0
0.0%
Unpaid Family Workers
0
0.0%
Total
81
100.0%
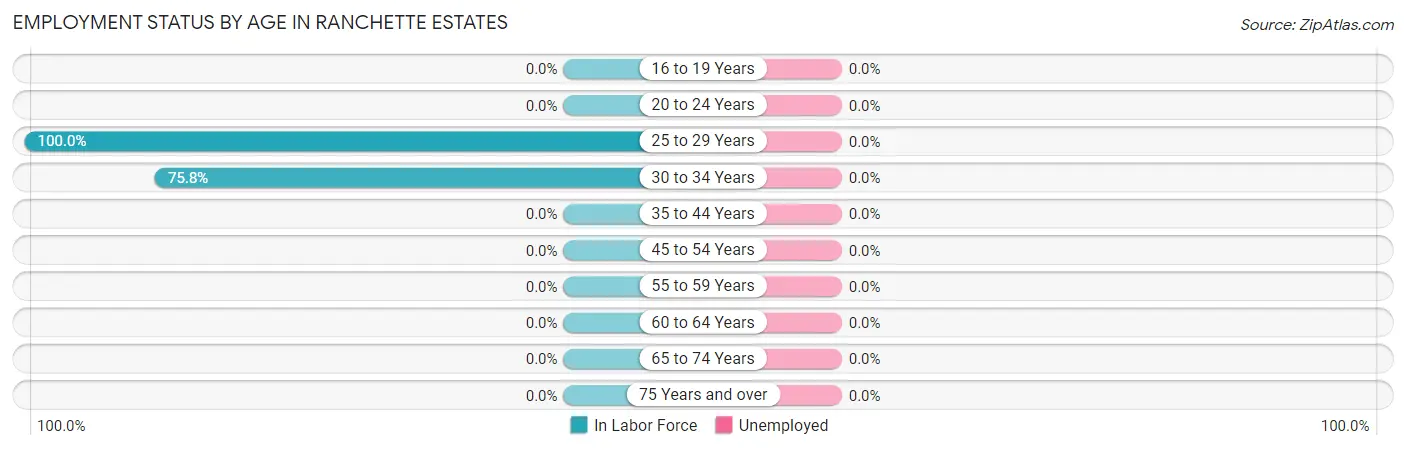
Employment Status by Age in Ranchette Estates
Age Bracket
In Labor Force
Unemployed
16 to 19 Years
0 (0.0%)
0 (0.0%)
20 to 24 Years
0 (0.0%)
0 (0.0%)
25 to 29 Years
31 (100.0%)
0 (0.0%)
30 to 34 Years
50 (75.8%)
0 (0.0%)
35 to 44 Years
0 (0.0%)
0 (0.0%)
45 to 54 Years
0 (0.0%)
0 (0.0%)
55 to 59 Years
0 (0.0%)
0 (0.0%)
60 to 64 Years
0 (0.0%)
0 (0.0%)
65 to 74 Years
0 (0.0%)
0 (0.0%)
75 Years and over
0 (0.0%)
0 (0.0%)
Total
81 (46.8%)
0 (0.0%)
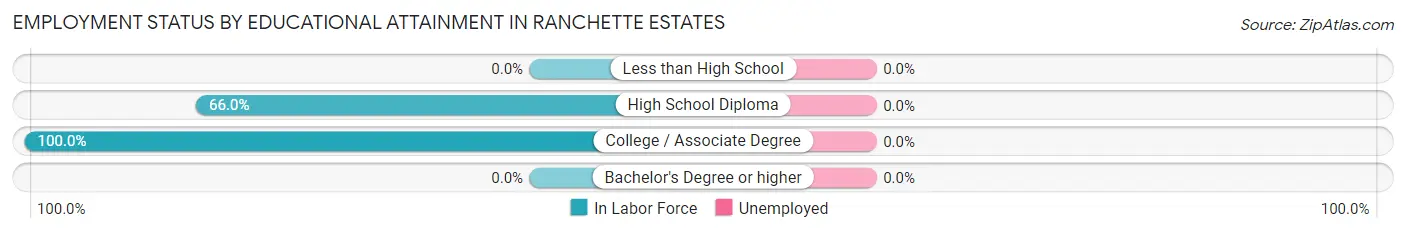
Employment Status by Educational Attainment in Ranchette Estates
Educational Attainment
In Labor Force
Unemployed
Less than High School
0 (0.0%)
0 (0.0%)
High School Diploma
31 (66.0%)
0 (0.0%)
College / Associate Degree
50 (100.0%)
0 (0.0%)
Bachelor's Degree or higher
0 (0.0%)
0 (0.0%)
Total
81 (49.1%)
0 (0.0%)
Employment Occupations by Sex in Ranchette Estates
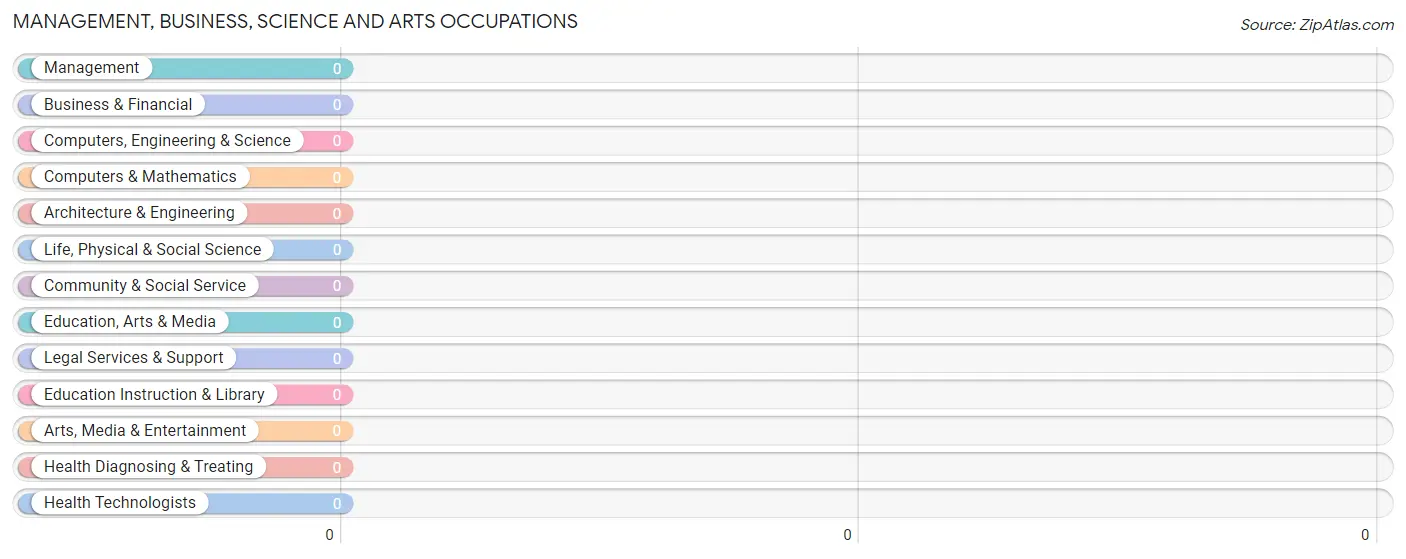
Management, Business, Science and Arts Occupations
Management, Business, Science and Arts Occupations by Sex
Occupation
Male
Female
Management
0 (0.0%)
0 (0.0%)
Business & Financial
0 (0.0%)
0 (0.0%)
Computers, Engineering & Science
0 (0.0%)
0 (0.0%)
Computers & Mathematics
0 (0.0%)
0 (0.0%)
Architecture & Engineering
0 (0.0%)
0 (0.0%)
Life, Physical & Social Science
0 (0.0%)
0 (0.0%)
Community & Social Service
0 (0.0%)
0 (0.0%)
Education, Arts & Media
0 (0.0%)
0 (0.0%)
Legal Services & Support
0 (0.0%)
0 (0.0%)
Education Instruction & Library
0 (0.0%)
0 (0.0%)
Arts, Media & Entertainment
0 (0.0%)
0 (0.0%)
Health Diagnosing & Treating
0 (0.0%)
0 (0.0%)
Health Technologists
0 (0.0%)
0 (0.0%)
Total (Category)
0 (0.0%)
0 (0.0%)
Total (Overall)
81 (100.0%)
0 (0.0%)
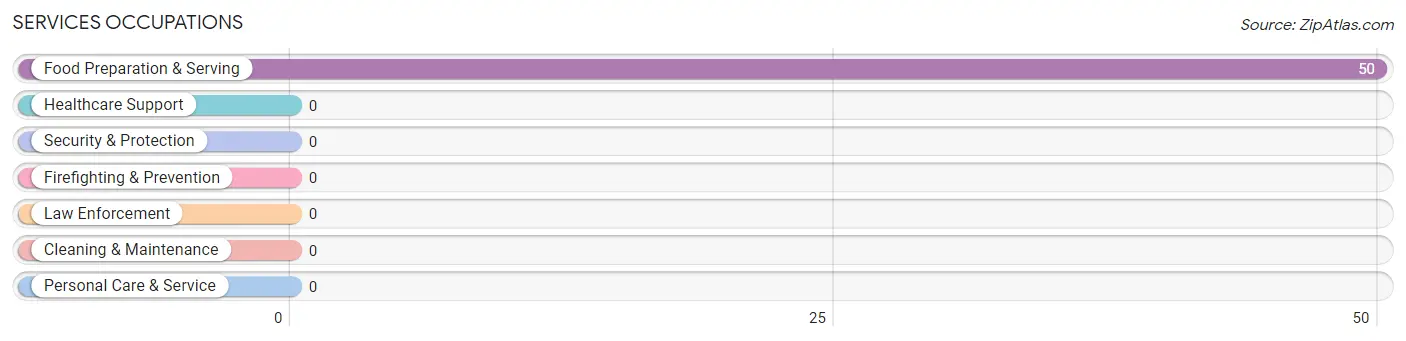
Services Occupations
The most common Services occupations in Ranchette Estates are , and Food Preparation & Serving (50 | 61.7%).
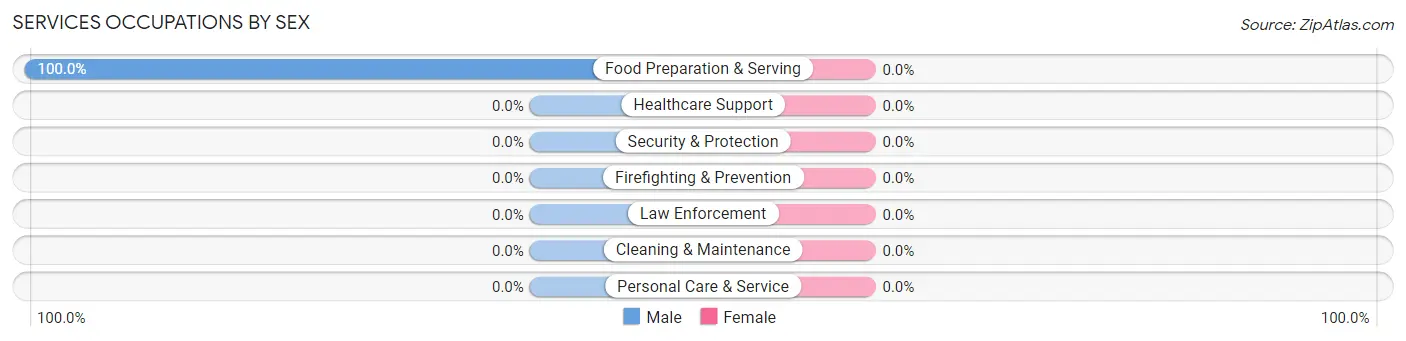
Services Occupations by Sex
Occupation
Male
Female
Healthcare Support
0 (0.0%)
0 (0.0%)
Security & Protection
0 (0.0%)
0 (0.0%)
Firefighting & Prevention
0 (0.0%)
0 (0.0%)
Law Enforcement
0 (0.0%)
0 (0.0%)
Food Preparation & Serving
50 (100.0%)
0 (0.0%)
Cleaning & Maintenance
0 (0.0%)
0 (0.0%)
Personal Care & Service
0 (0.0%)
0 (0.0%)
Total (Category)
50 (100.0%)
0 (0.0%)
Total (Overall)
81 (100.0%)
0 (0.0%)
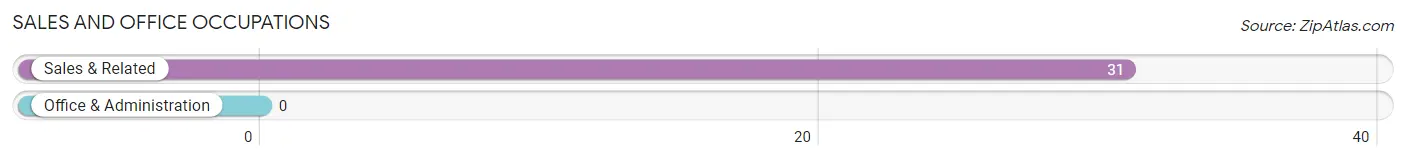
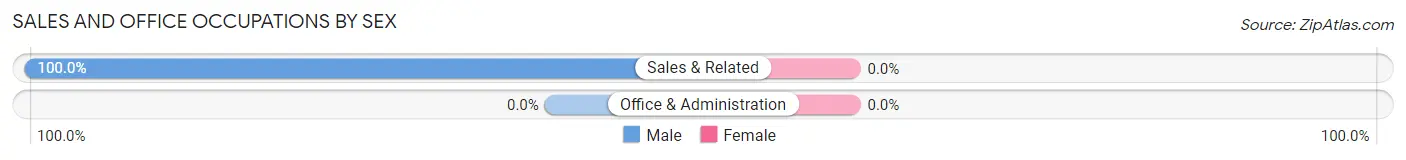
Sales and Office Occupations
The most common Sales and Office occupations in Ranchette Estates are , and Sales & Related (31 | 38.3%).
Sales and Office Occupations by Sex
Occupation
Male
Female
Sales & Related
31 (100.0%)
0 (0.0%)
Office & Administration
0 (0.0%)
0 (0.0%)
Total (Category)
31 (100.0%)
0 (0.0%)
Total (Overall)
81 (100.0%)
0 (0.0%)
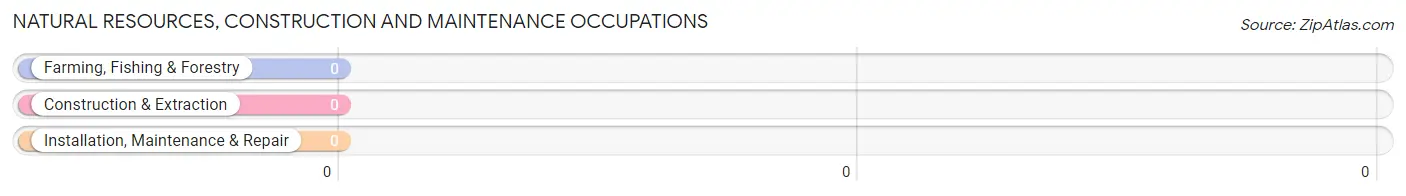
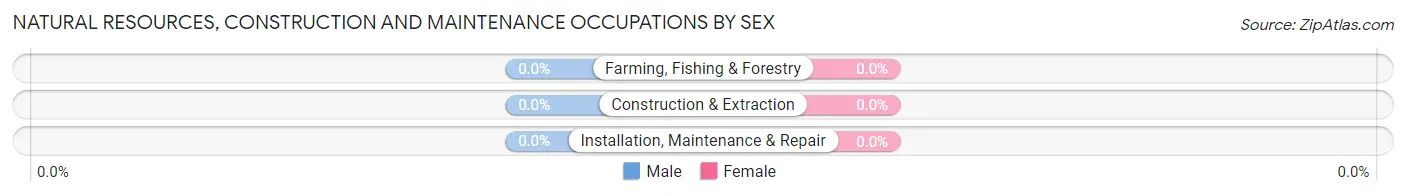
Natural Resources, Construction and Maintenance Occupations
Natural Resources, Construction and Maintenance Occupations by Sex
Occupation
Male
Female
Farming, Fishing & Forestry
0 (0.0%)
0 (0.0%)
Construction & Extraction
0 (0.0%)
0 (0.0%)
Installation, Maintenance & Repair
0 (0.0%)
0 (0.0%)
Total (Category)
0 (0.0%)
0 (0.0%)
Total (Overall)
81 (100.0%)
0 (0.0%)
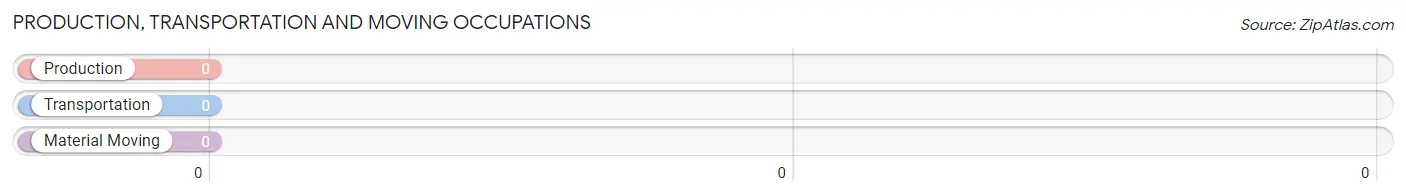
Production, Transportation and Moving Occupations
Production, Transportation and Moving Occupations by Sex
Occupation
Male
Female
Production
0 (0.0%)
0 (0.0%)
Transportation
0 (0.0%)
0 (0.0%)
Material Moving
0 (0.0%)
0 (0.0%)
Total (Category)
0 (0.0%)
0 (0.0%)
Total (Overall)
81 (100.0%)
0 (0.0%)
Employment Industries by Sex in Ranchette Estates
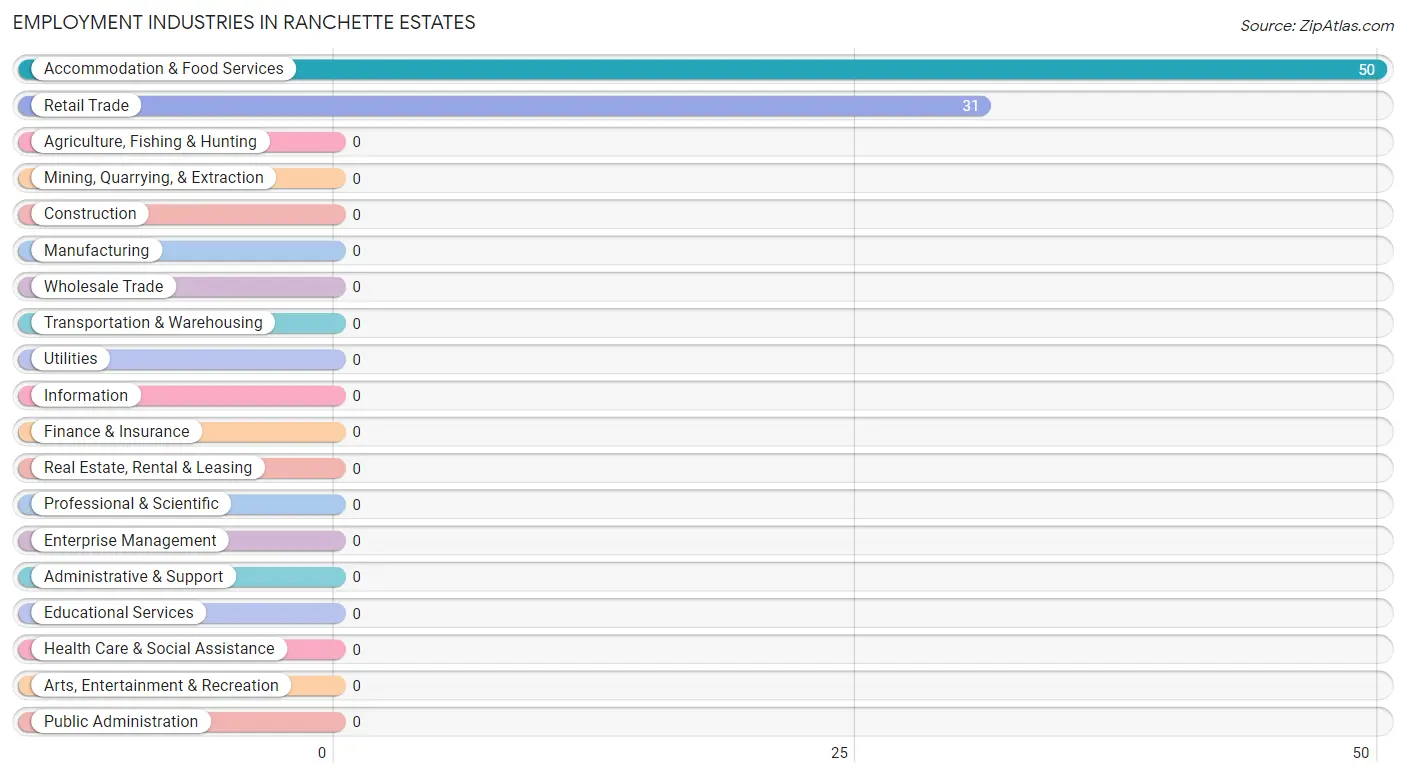
Employment Industries in Ranchette Estates
The major employment industries in Ranchette Estates include Accommodation & Food Services (50 | 61.7%), and Retail Trade (31 | 38.3%).
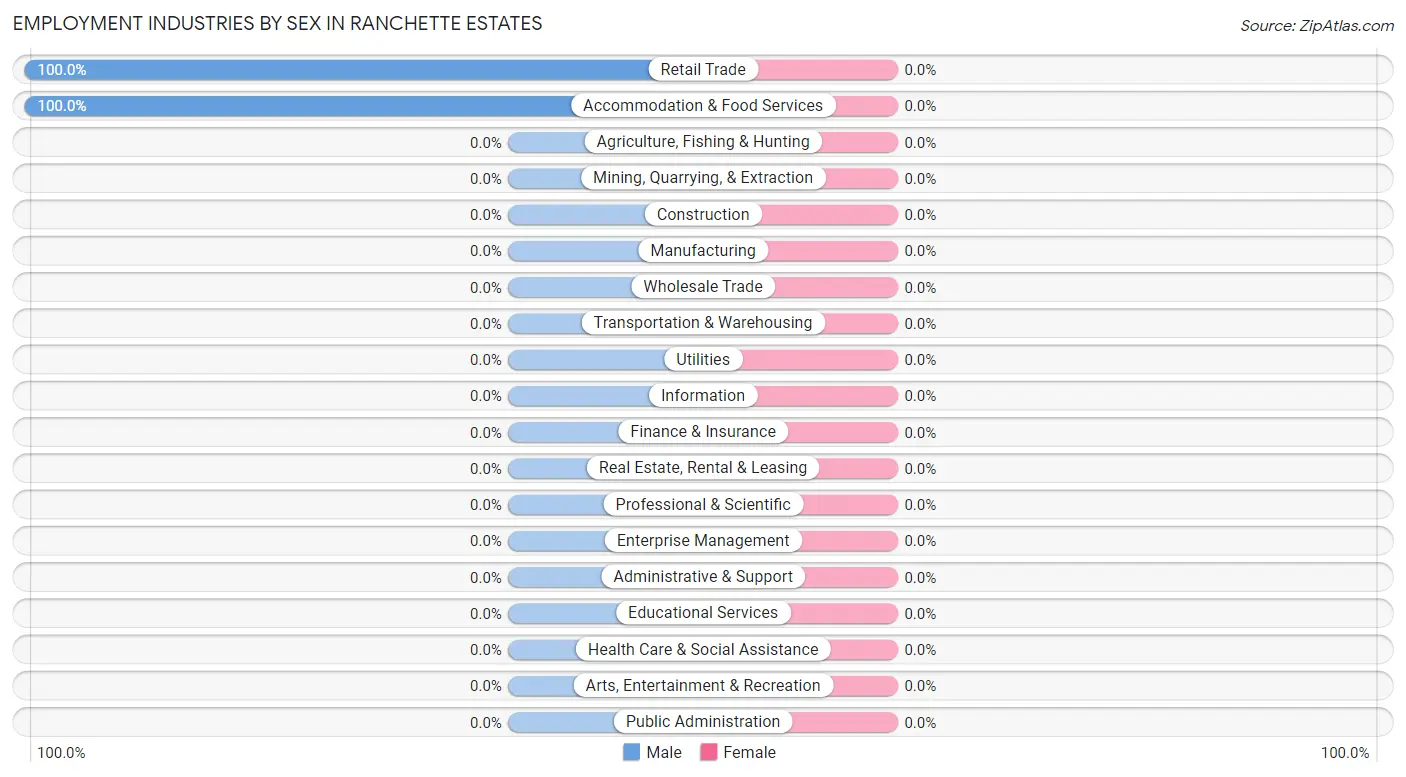
Employment Industries by Sex in Ranchette Estates
Industry
Male
Female
Agriculture, Fishing & Hunting
0 (0.0%)
0 (0.0%)
Mining, Quarrying, & Extraction
0 (0.0%)
0 (0.0%)
Construction
0 (0.0%)
0 (0.0%)
Manufacturing
0 (0.0%)
0 (0.0%)
Wholesale Trade
0 (0.0%)
0 (0.0%)
Retail Trade
31 (100.0%)
0 (0.0%)
Transportation & Warehousing
0 (0.0%)
0 (0.0%)
Utilities
0 (0.0%)
0 (0.0%)
Information
0 (0.0%)
0 (0.0%)
Finance & Insurance
0 (0.0%)
0 (0.0%)
Real Estate, Rental & Leasing
0 (0.0%)
0 (0.0%)
Professional & Scientific
0 (0.0%)
0 (0.0%)
Enterprise Management
0 (0.0%)
0 (0.0%)
Administrative & Support
0 (0.0%)
0 (0.0%)
Educational Services
0 (0.0%)
0 (0.0%)
Health Care & Social Assistance
0 (0.0%)
0 (0.0%)
Arts, Entertainment & Recreation
0 (0.0%)
0 (0.0%)
Accommodation & Food Services
50 (100.0%)
0 (0.0%)
Public Administration
0 (0.0%)
0 (0.0%)
Total
81 (100.0%)
0 (0.0%)
Education in Ranchette Estates
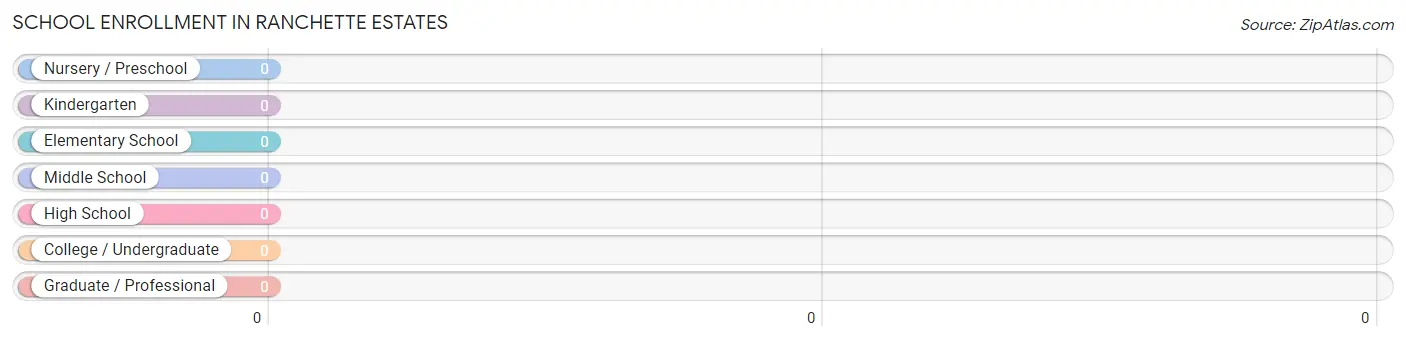
School Enrollment in Ranchette Estates
School Level
# Students
% Students
Nursery / Preschool
0
0.0%
Kindergarten
0
0.0%
Elementary School
0
0.0%
Middle School
0
0.0%
High School
0
0.0%
College / Undergraduate
0
0.0%
Graduate / Professional
0
0.0%
Total
0
0.0%
School Enrollment by Age by Funding Source in Ranchette Estates
Age Bracket
Public School
Private School
3 to 4 Year Olds
0 (0.0%)
0 (0.0%)
5 to 9 Year Old
0 (0.0%)
0 (0.0%)
10 to 14 Year Olds
0 (0.0%)
0 (0.0%)
15 to 17 Year Olds
0 (0.0%)
0 (0.0%)
18 to 19 Year Olds
0 (0.0%)
0 (0.0%)
20 to 24 Year Olds
0 (0.0%)
0 (0.0%)
25 to 34 Year Olds
0 (0.0%)
0 (0.0%)
35 Years and over
0 (0.0%)
0 (0.0%)
Total
0 (0.0%)
0 (0.0%)
Educational Attainment by Field of Study in Ranchette Estates
Field of Study
# Graduates
% Graduates
Computers & Mathematics
0
0.0%
Bio, Nature & Agricultural
0
0.0%
Physical & Health Sciences
0
0.0%
Psychology
0
0.0%
Social Sciences
0
0.0%
Engineering
0
0.0%
Multidisciplinary Studies
0
0.0%
Science & Technology
0
0.0%
Business
0
0.0%
Education
0
0.0%
Literature & Languages
0
0.0%
Liberal Arts & History
0
0.0%
Visual & Performing Arts
0
0.0%
Communications
0
0.0%
Arts & Humanities
0
0.0%
Total
0
0.0%
Transportation & Commute in Ranchette Estates
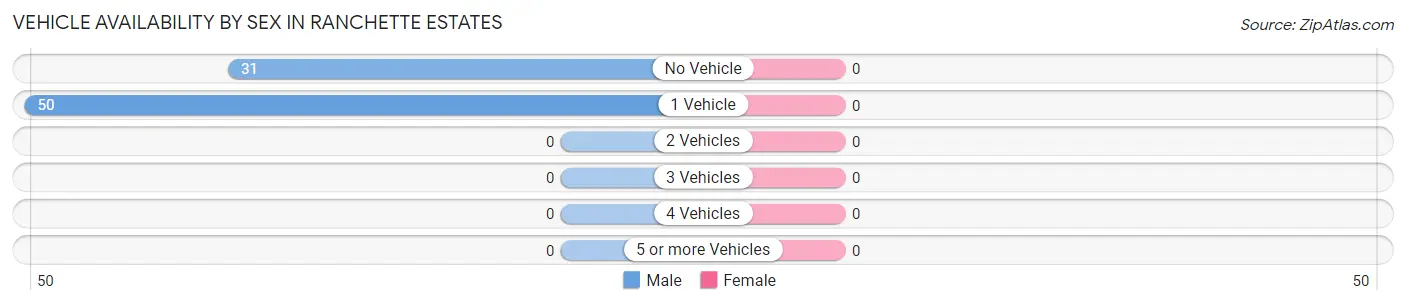
Vehicle Availability by Sex in Ranchette Estates
Vehicles Available
Male
Female
No Vehicle
31 (38.3%)
0 (0.0%)
1 Vehicle
50 (61.7%)
0 (0.0%)
2 Vehicles
0 (0.0%)
0 (0.0%)
3 Vehicles
0 (0.0%)
0 (0.0%)
4 Vehicles
0 (0.0%)
0 (0.0%)
5 or more Vehicles
0 (0.0%)
0 (0.0%)
Total
81 (100.0%)
0 (0.0%)
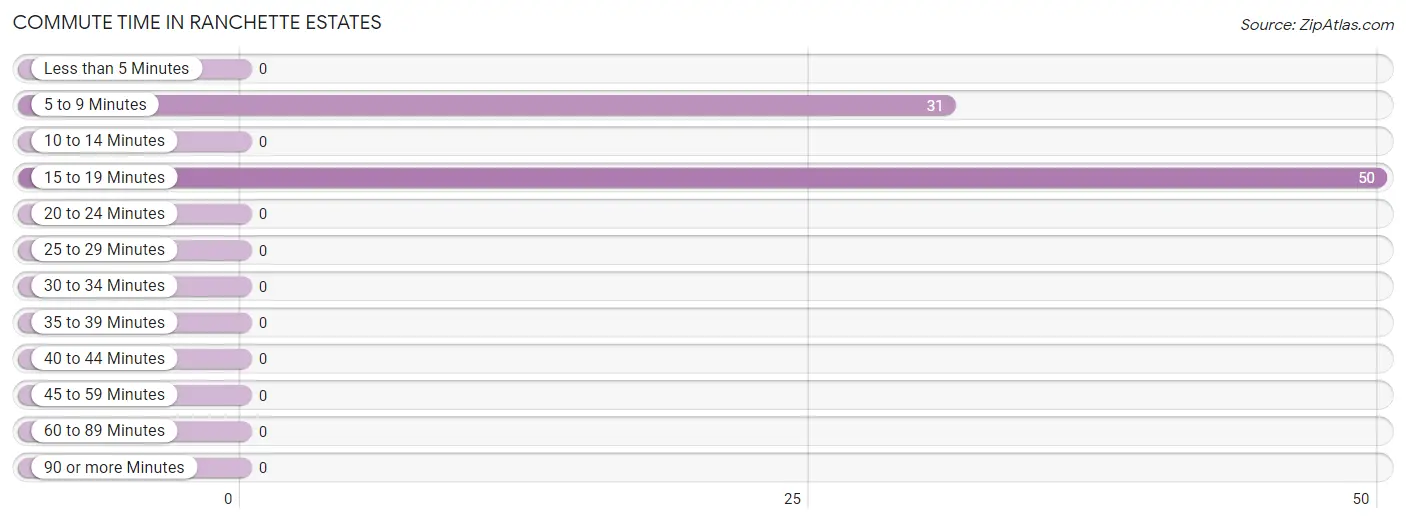
Commute Time in Ranchette Estates
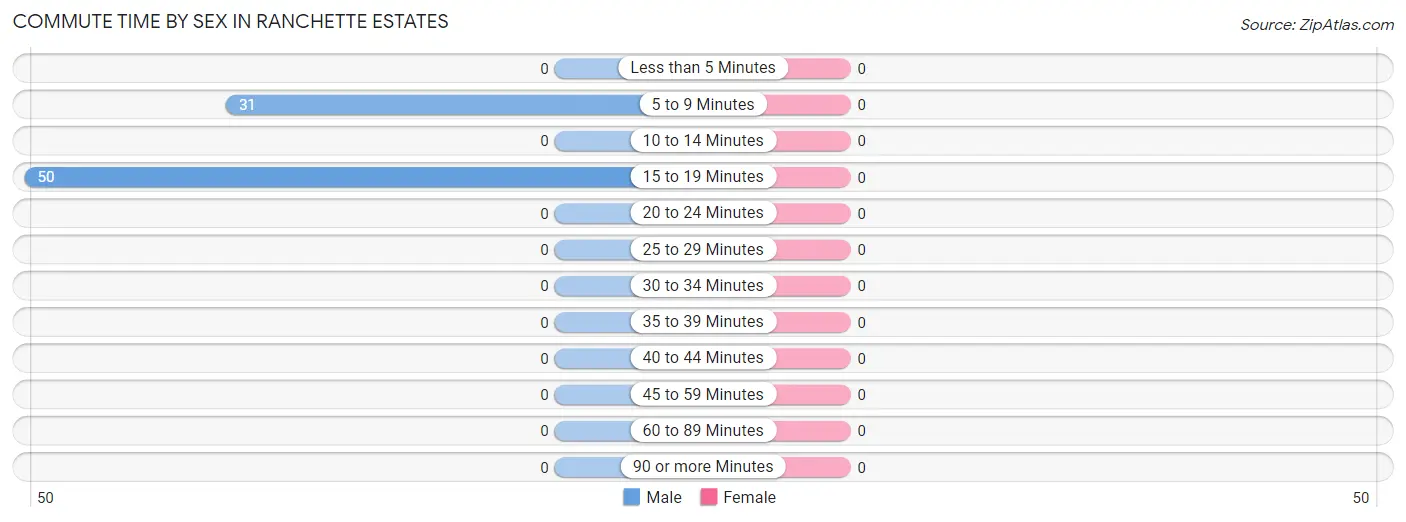
The most frequently occuring commute durations in Ranchette Estates are 15 to 19 minutes (50 commuters, 61.7%), 5 to 9 minutes (31 commuters, 38.3%), and less than 5 minutes (0 commuters, 0.0%).
Commute Time
# Commuters
% Commuters
Less than 5 Minutes
0
0.0%
5 to 9 Minutes
31
38.3%
10 to 14 Minutes
0
0.0%
15 to 19 Minutes
50
61.7%
20 to 24 Minutes
0
0.0%
25 to 29 Minutes
0
0.0%
30 to 34 Minutes
0
0.0%
35 to 39 Minutes
0
0.0%
40 to 44 Minutes
0
0.0%
45 to 59 Minutes
0
0.0%
60 to 89 Minutes
0
0.0%
90 or more Minutes
0
0.0%
Commute Time by Sex in Ranchette Estates
Commute Time
Male
Female
Less than 5 Minutes
0 (0.0%)
0 (0.0%)
5 to 9 Minutes
31 (38.3%)
0 (0.0%)
10 to 14 Minutes
0 (0.0%)
0 (0.0%)
15 to 19 Minutes
50 (61.7%)
0 (0.0%)
20 to 24 Minutes
0 (0.0%)
0 (0.0%)
25 to 29 Minutes
0 (0.0%)
0 (0.0%)
30 to 34 Minutes
0 (0.0%)
0 (0.0%)
35 to 39 Minutes
0 (0.0%)
0 (0.0%)
40 to 44 Minutes
0 (0.0%)
0 (0.0%)
45 to 59 Minutes
0 (0.0%)
0 (0.0%)
60 to 89 Minutes
0 (0.0%)
0 (0.0%)
90 or more Minutes
0 (0.0%)
0 (0.0%)
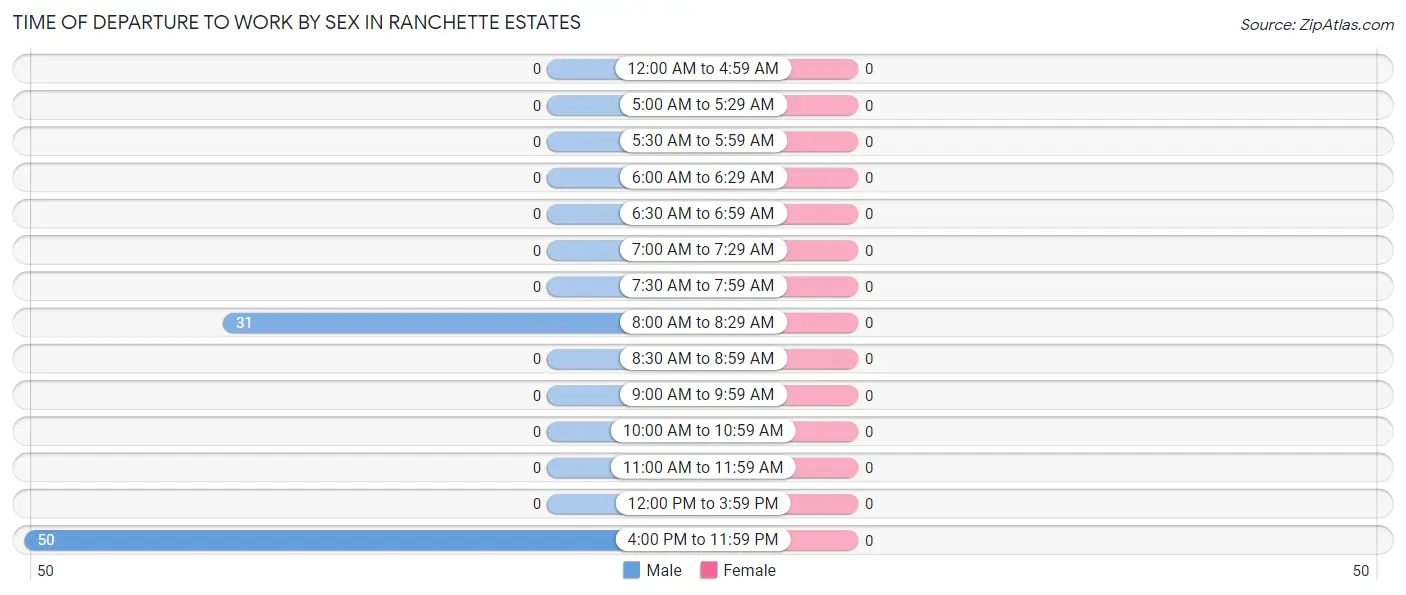
Time of Departure to Work by Sex in Ranchette Estates
Time of Departure
Male
Female
12:00 AM to 4:59 AM
0 (0.0%)
0 (0.0%)
5:00 AM to 5:29 AM
0 (0.0%)
0 (0.0%)
5:30 AM to 5:59 AM
0 (0.0%)
0 (0.0%)
6:00 AM to 6:29 AM
0 (0.0%)
0 (0.0%)
6:30 AM to 6:59 AM
0 (0.0%)
0 (0.0%)
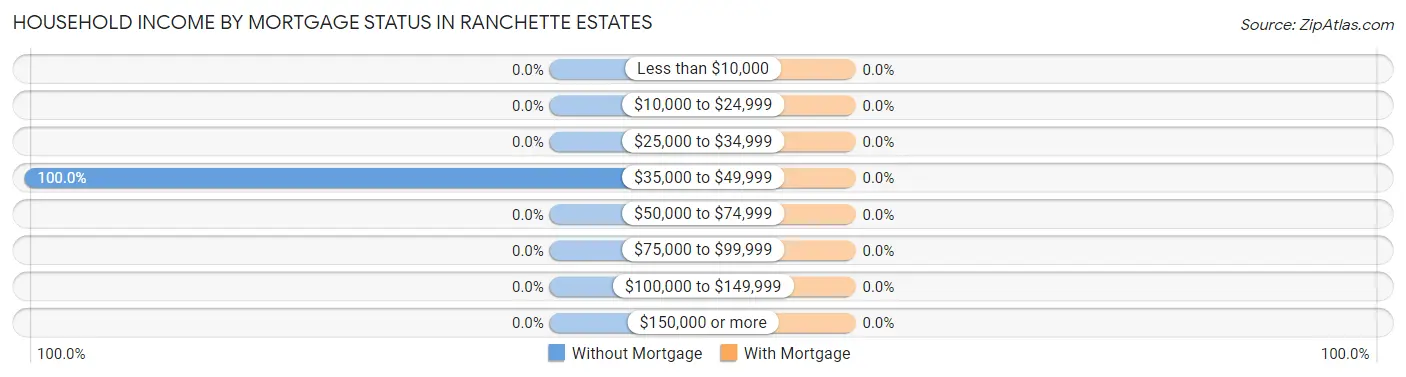
7:00 AM to 7:29 AM
0 (0.0%)
0 (0.0%)
7:30 AM to 7:59 AM
0 (0.0%)
0 (0.0%)
8:00 AM to 8:29 AM
31 (38.3%)
0 (0.0%)
8:30 AM to 8:59 AM
0 (0.0%)
0 (0.0%)
9:00 AM to 9:59 AM
0 (0.0%)
0 (0.0%)
10:00 AM to 10:59 AM
0 (0.0%)
0 (0.0%)
11:00 AM to 11:59 AM
0 (0.0%)
0 (0.0%)
12:00 PM to 3:59 PM
0 (0.0%)
0 (0.0%)
4:00 PM to 11:59 PM
50 (61.7%)
0 (0.0%)
Total
81 (100.0%)
0 (0.0%)
Housing Occupancy in Ranchette Estates
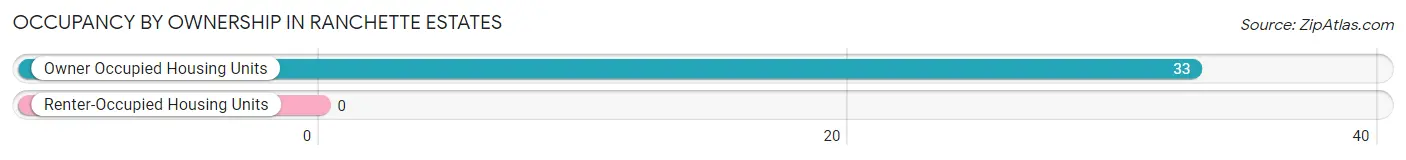
Occupancy by Ownership in Ranchette Estates
Of the total 33 dwellings in Ranchette Estates, owner-occupied units account for 33 (100.0%), while renter-occupied units make up 0 (0.0%).
Occupancy
# Housing Units
% Housing Units
Owner Occupied Housing Units
33
100.0%
Renter-Occupied Housing Units
0
0.0%
Total Occupied Housing Units
33
100.0%
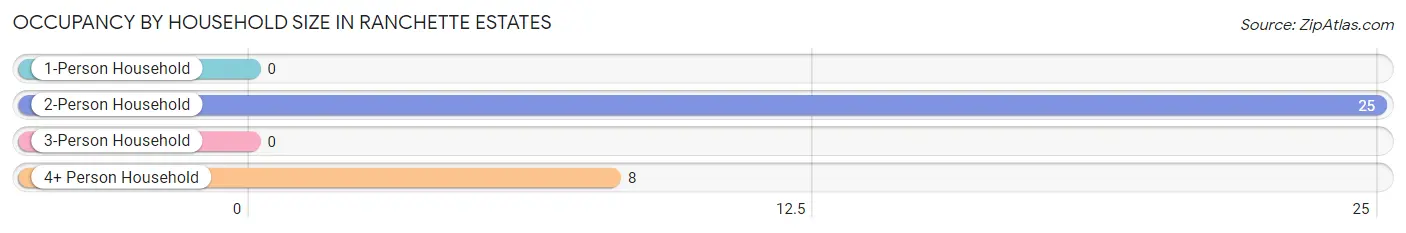
Occupancy by Household Size in Ranchette Estates
Household Size
# Housing Units
% Housing Units
1-Person Household
0
0.0%
2-Person Household
25
75.8%
3-Person Household
0
0.0%
4+ Person Household
8
24.2%
Total Housing Units
33
100.0%
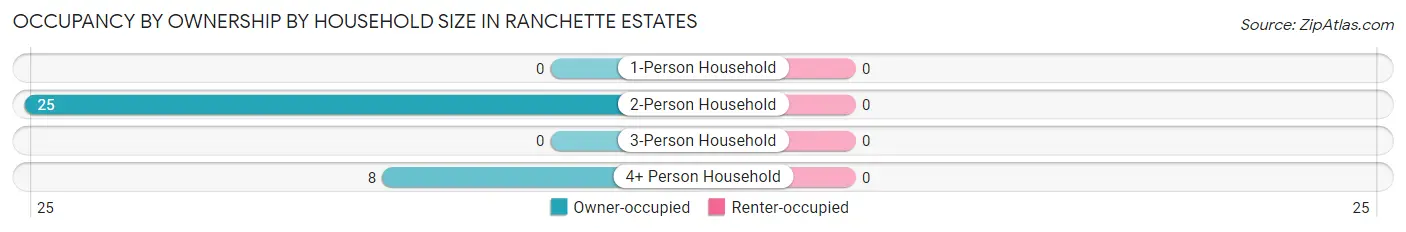
Occupancy by Ownership by Household Size in Ranchette Estates
Household Size
Owner-occupied
Renter-occupied
1-Person Household
0 (0.0%)
0 (0.0%)
2-Person Household
25 (100.0%)
0 (0.0%)
3-Person Household
0 (0.0%)
0 (0.0%)
4+ Person Household
8 (100.0%)
0 (0.0%)
Total Housing Units
33 (100.0%)
0 (0.0%)
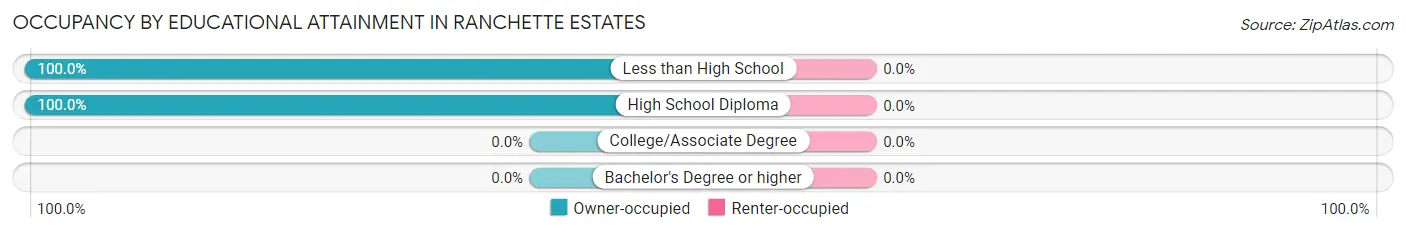
Occupancy by Educational Attainment in Ranchette Estates
Household Size
Owner-occupied
Renter-occupied
Less than High School
25 (100.0%)
0 (0.0%)
High School Diploma
8 (100.0%)
0 (0.0%)
College/Associate Degree
0 (0.0%)
0 (0.0%)
Bachelor's Degree or higher
0 (0.0%)
0 (0.0%)
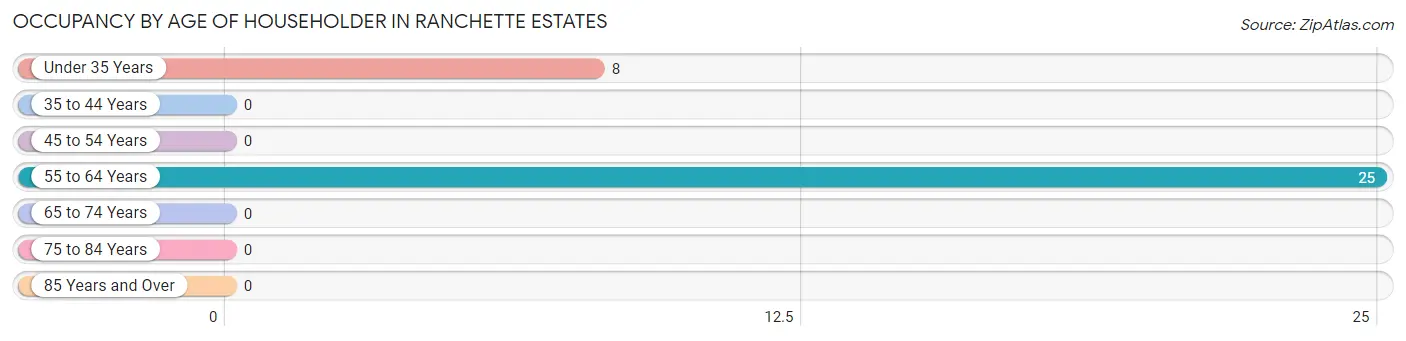
Occupancy by Age of Householder in Ranchette Estates
Age Bracket
# Households
% Households
Under 35 Years
8
24.2%
35 to 44 Years
0
0.0%
45 to 54 Years
0
0.0%
55 to 64 Years
25
75.8%
65 to 74 Years
0
0.0%
75 to 84 Years
0
0.0%
85 Years and Over
0
0.0%
Total
33
100.0%
Housing Finances in Ranchette Estates
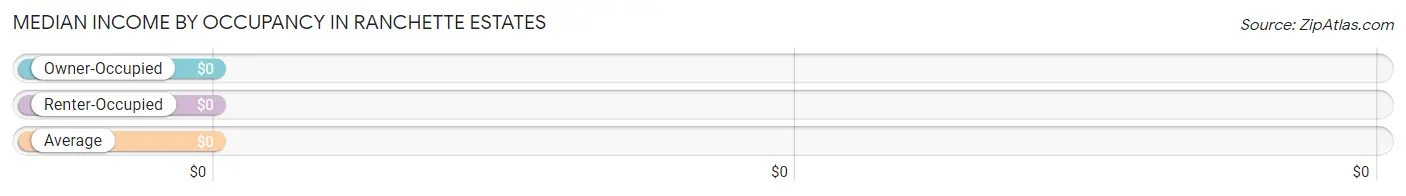
Median Income by Occupancy in Ranchette Estates
Occupancy Type
# Households
Median Income
Owner-Occupied
33 (100.0%)
$0
Renter-Occupied
0 (0.0%)
$0
Average
33 (100.0%)
$0
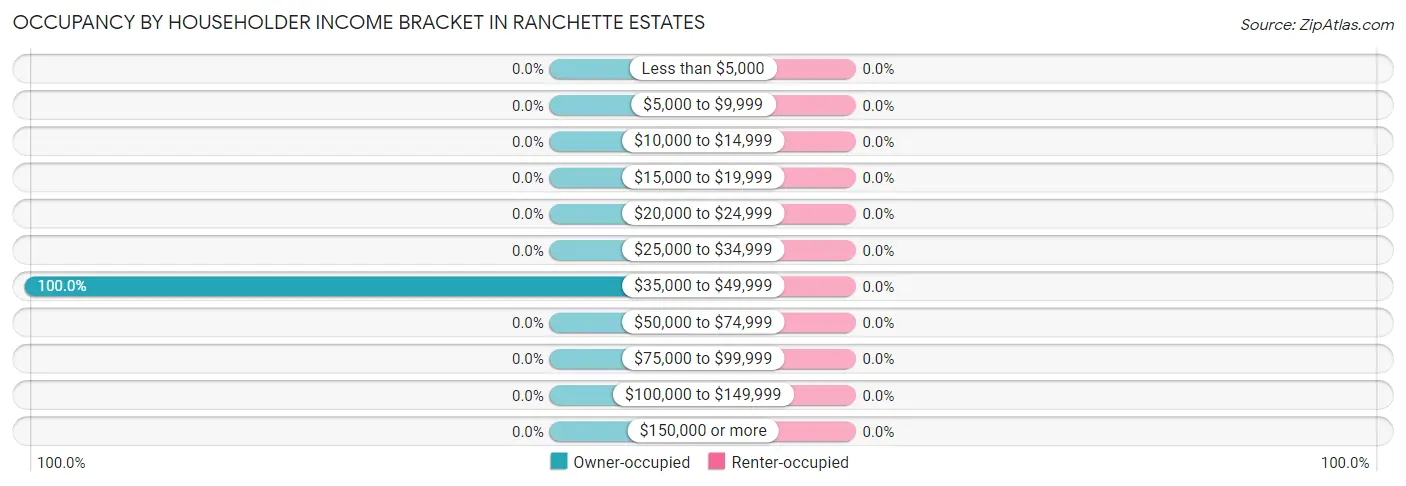
Occupancy by Householder Income Bracket in Ranchette Estates
Income Bracket
Owner-occupied
Renter-occupied
Less than $5,000
0 (0.0%)
0 (0.0%)
$5,000 to $9,999
0 (0.0%)
0 (0.0%)
$10,000 to $14,999
0 (0.0%)
0 (0.0%)
$15,000 to $19,999
0 (0.0%)
0 (0.0%)
$20,000 to $24,999
0 (0.0%)
0 (0.0%)
$25,000 to $34,999
0 (0.0%)
0 (0.0%)
$35,000 to $49,999
33 (100.0%)
0 (0.0%)
$50,000 to $74,999
0 (0.0%)
0 (0.0%)
$75,000 to $99,999
0 (0.0%)
0 (0.0%)
$100,000 to $149,999
0 (0.0%)
0 (0.0%)
$150,000 or more
0 (0.0%)
0 (0.0%)
Total
33 (100.0%)
0 (0.0%)
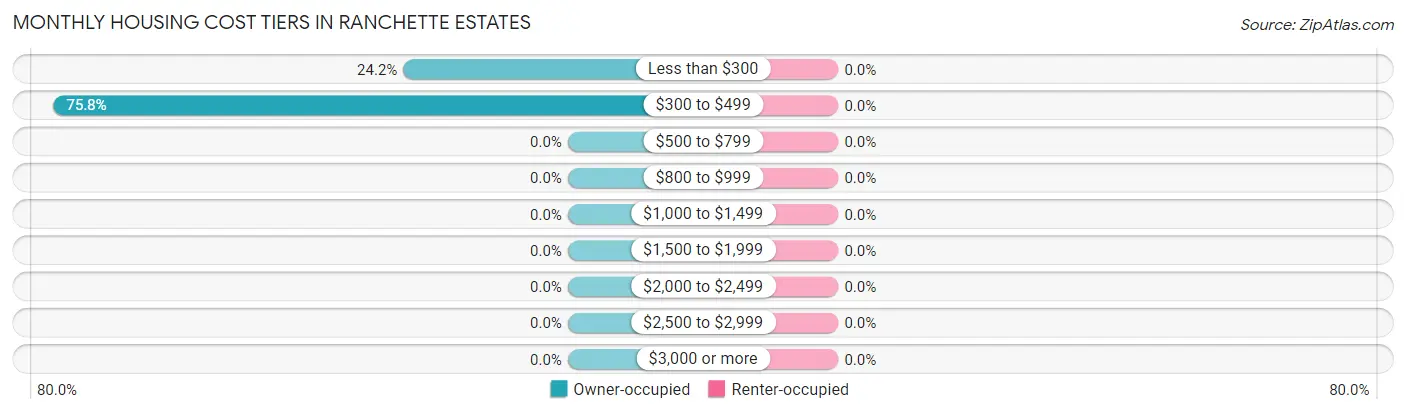
Monthly Housing Cost Tiers in Ranchette Estates
Monthly Cost
Owner-occupied
Renter-occupied
Less than $300
8 (24.2%)
0 (0.0%)
$300 to $499
25 (75.8%)
0 (0.0%)
$500 to $799
0 (0.0%)
0 (0.0%)
$800 to $999
0 (0.0%)
0 (0.0%)
$1,000 to $1,499
0 (0.0%)
0 (0.0%)
$1,500 to $1,999
0 (0.0%)
0 (0.0%)
$2,000 to $2,499
0 (0.0%)
0 (0.0%)
$2,500 to $2,999
0 (0.0%)
0 (0.0%)
$3,000 or more
0 (0.0%)
0 (0.0%)
Total
33 (100.0%)
0 (0.0%)
Physical Housing Characteristics in Ranchette Estates
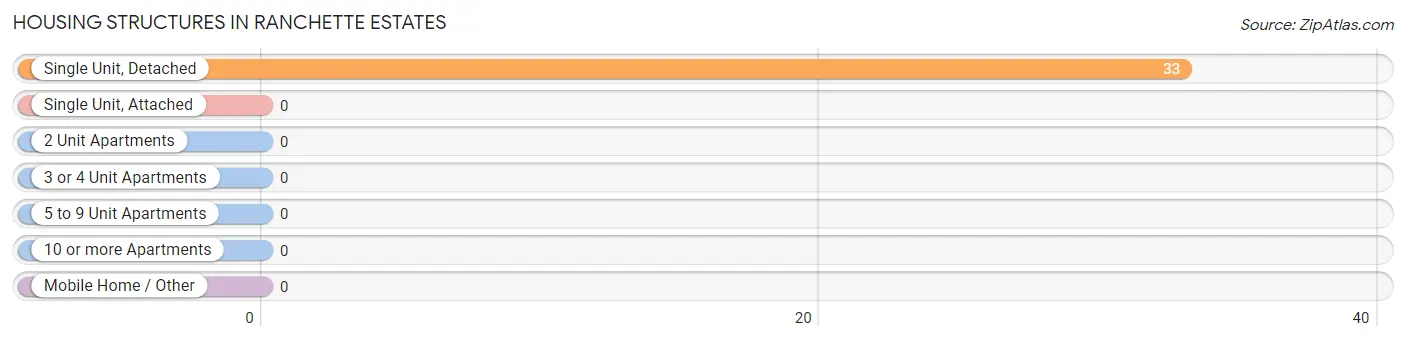
Housing Structures in Ranchette Estates
Structure Type
# Housing Units
% Housing Units
Single Unit, Detached
33
100.0%
Single Unit, Attached
0
0.0%
2 Unit Apartments
0
0.0%
3 or 4 Unit Apartments
0
0.0%
5 to 9 Unit Apartments
0
0.0%
10 or more Apartments
0
0.0%
Mobile Home / Other
0
0.0%
Total
33
100.0%
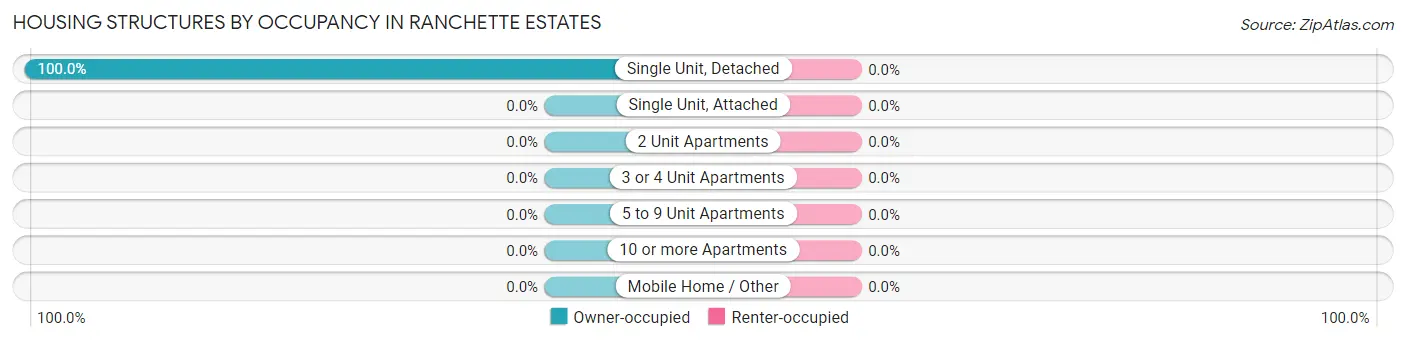
Housing Structures by Occupancy in Ranchette Estates
Structure Type
Owner-occupied
Renter-occupied
Single Unit, Detached
33 (100.0%)
0 (0.0%)
Single Unit, Attached
0 (0.0%)
0 (0.0%)
2 Unit Apartments
0 (0.0%)
0 (0.0%)
3 or 4 Unit Apartments
0 (0.0%)
0 (0.0%)
5 to 9 Unit Apartments
0 (0.0%)
0 (0.0%)
10 or more Apartments
0 (0.0%)
0 (0.0%)
Mobile Home / Other
0 (0.0%)
0 (0.0%)
Total
33 (100.0%)
0 (0.0%)
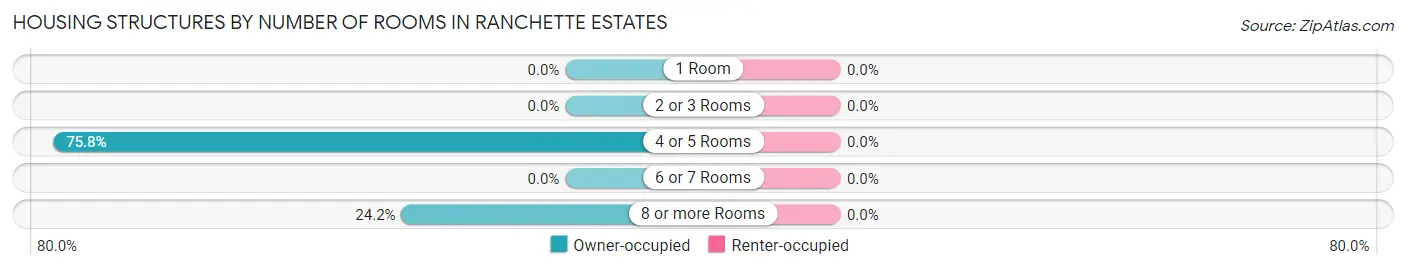
Housing Structures by Number of Rooms in Ranchette Estates
Number of Rooms
Owner-occupied
Renter-occupied
1 Room
0 (0.0%)
0 (0.0%)
2 or 3 Rooms
0 (0.0%)
0 (0.0%)
4 or 5 Rooms
25 (75.8%)
0 (0.0%)
6 or 7 Rooms
0 (0.0%)
0 (0.0%)
8 or more Rooms
8 (24.2%)
0 (0.0%)
Total
33 (100.0%)
0 (0.0%)
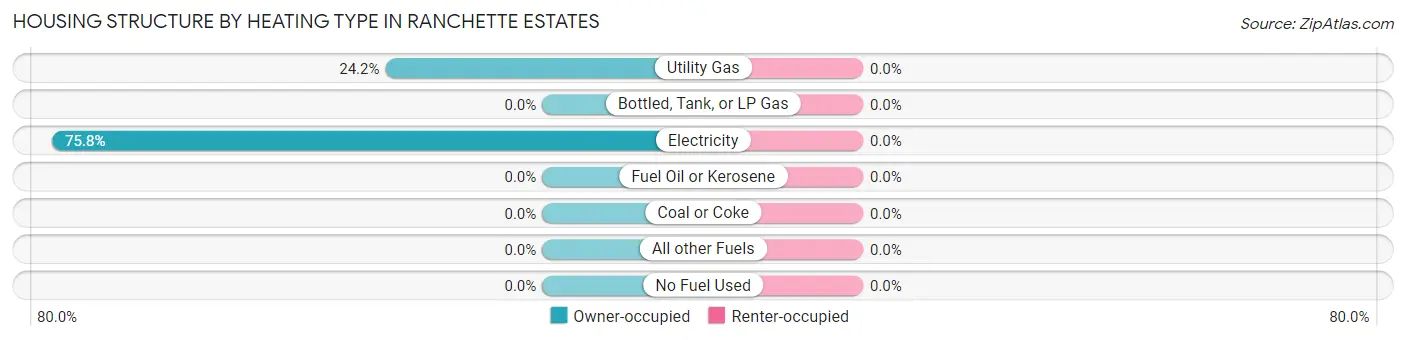
Housing Structure by Heating Type in Ranchette Estates
Heating Type
Owner-occupied
Renter-occupied
Utility Gas
8 (24.2%)
0 (0.0%)
Bottled, Tank, or LP Gas
0 (0.0%)
0 (0.0%)
Electricity
25 (75.8%)
0 (0.0%)
Fuel Oil or Kerosene
0 (0.0%)
0 (0.0%)
Coal or Coke
0 (0.0%)
0 (0.0%)
All other Fuels
0 (0.0%)
0 (0.0%)
No Fuel Used
0 (0.0%)
0 (0.0%)
Total
33 (100.0%)
0 (0.0%)
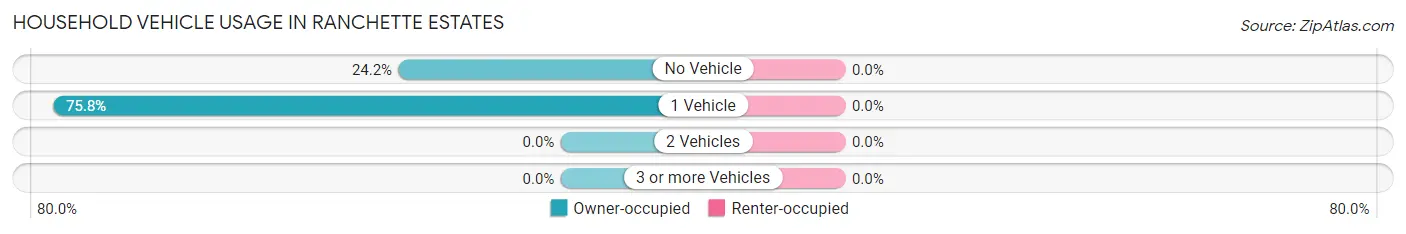
Household Vehicle Usage in Ranchette Estates
Vehicles per Household
Owner-occupied
Renter-occupied
No Vehicle
8 (24.2%)
0 (0.0%)
1 Vehicle
25 (75.8%)
0 (0.0%)
2 Vehicles
0 (0.0%)
0 (0.0%)
3 or more Vehicles
0 (0.0%)
0 (0.0%)
Total
33 (100.0%)
0 (0.0%)
Real Estate & Mortgages in Ranchette Estates
Real Estate and Mortgage Overview in Ranchette Estates
Characteristic
Without Mortgage
With Mortgage
Housing Units
33
0
Median Property Value
-
-
Median Household Income
-
-
Monthly Housing Costs
-
-
Real Estate Taxes
-
-
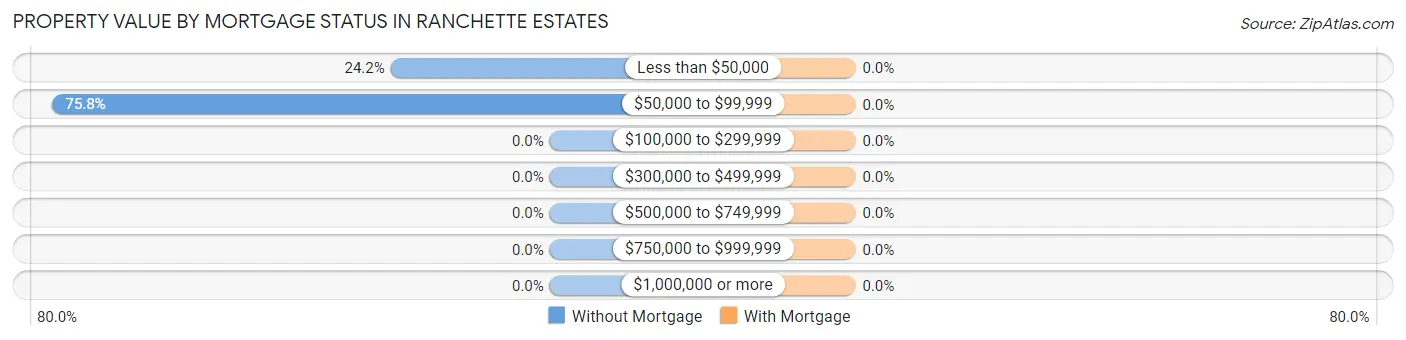
Property Value by Mortgage Status in Ranchette Estates
Property Value
Without Mortgage
With Mortgage
Less than $50,000
8 (24.2%)
0 (0.0%)
$50,000 to $99,999
25 (75.8%)
0 (0.0%)
$100,000 to $299,999
0 (0.0%)
0 (0.0%)
$300,000 to $499,999
0 (0.0%)
0 (0.0%)
$500,000 to $749,999
0 (0.0%)
0 (0.0%)
$750,000 to $999,999
0 (0.0%)
0 (0.0%)
$1,000,000 or more
0 (0.0%)
0 (0.0%)
Total
33 (100.0%)
0 (0.0%)
Household Income by Mortgage Status in Ranchette Estates
Household Income
Without Mortgage
With Mortgage
Less than $10,000
0 (0.0%)
0 (0.0%)
$10,000 to $24,999
0 (0.0%)
0 (0.0%)
$25,000 to $34,999
0 (0.0%)
0 (0.0%)
$35,000 to $49,999
33 (100.0%)
0 (0.0%)
$50,000 to $74,999
0 (0.0%)
0 (0.0%)
$75,000 to $99,999
0 (0.0%)
0 (0.0%)
$100,000 to $149,999
0 (0.0%)
0 (0.0%)
$150,000 or more
0 (0.0%)
0 (0.0%)
Total
33 (100.0%)
0 (0.0%)
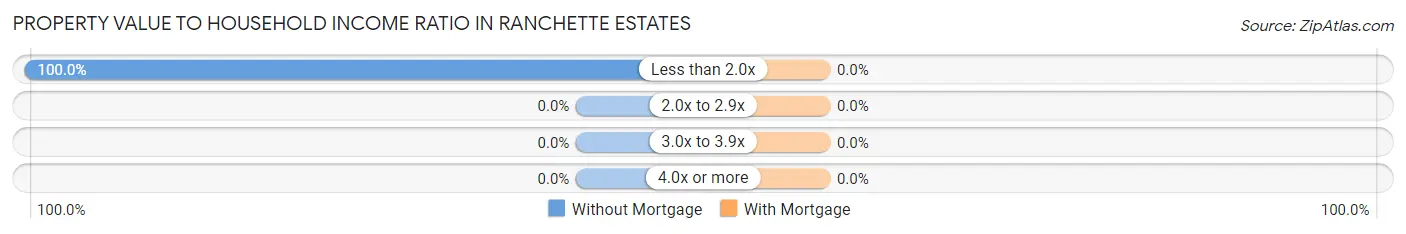
Property Value to Household Income Ratio in Ranchette Estates
Value-to-Income Ratio
Without Mortgage
With Mortgage
Less than 2.0x
33 (100.0%)
0 (0.0%)
2.0x to 2.9x
0 (0.0%)
0 (0.0%)
3.0x to 3.9x
0 (0.0%)
0 (0.0%)
4.0x or more
0 (0.0%)
0 (0.0%)
Total
33 (100.0%)
0 (0.0%)
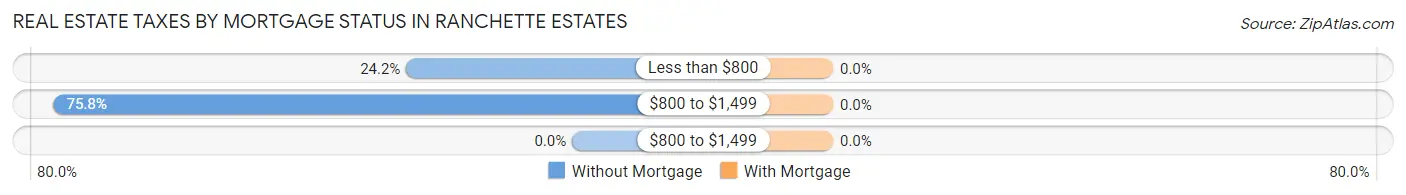
Real Estate Taxes by Mortgage Status in Ranchette Estates
Property Taxes
Without Mortgage
With Mortgage
Less than $800
8 (24.2%)
0 (0.0%)
$800 to $1,499
25 (75.8%)
0 (0.0%)
$800 to $1,499
0 (0.0%)
0 (0.0%)
Total
33 (100.0%)
0 (0.0%)
Health & Disability in Ranchette Estates
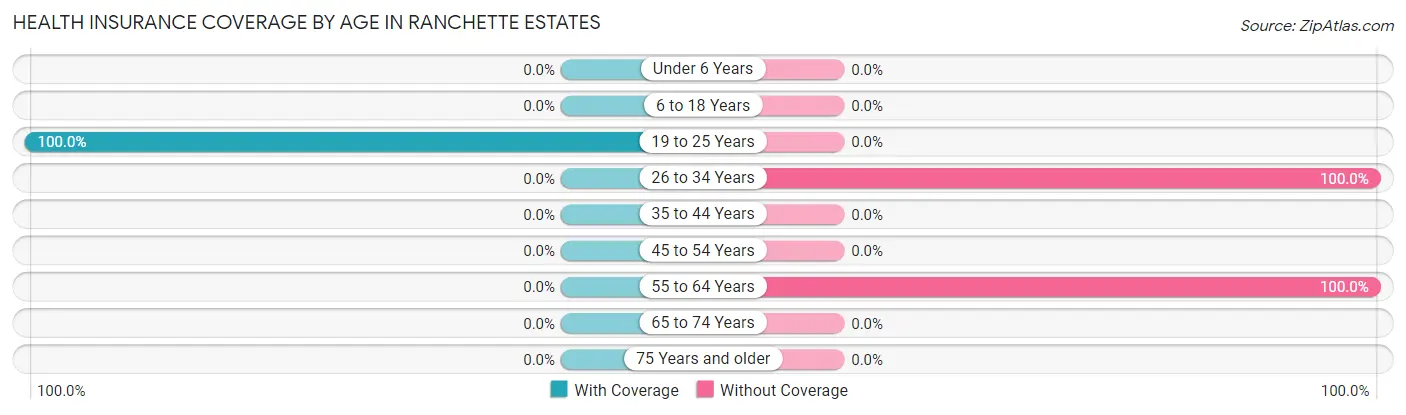
Health Insurance Coverage by Age in Ranchette Estates
Age Bracket
With Coverage
Without Coverage
Under 6 Years
0 (0.0%)
0 (0.0%)
6 to 18 Years
0 (0.0%)
0 (0.0%)
19 to 25 Years
8 (100.0%)
0 (0.0%)
26 to 34 Years
0 (0.0%)
97 (100.0%)
35 to 44 Years
0 (0.0%)
0 (0.0%)
45 to 54 Years
0 (0.0%)
0 (0.0%)
55 to 64 Years
0 (0.0%)
68 (100.0%)
65 to 74 Years
0 (0.0%)
0 (0.0%)
75 Years and older
0 (0.0%)
0 (0.0%)
Total
8 (4.6%)
165 (95.4%)
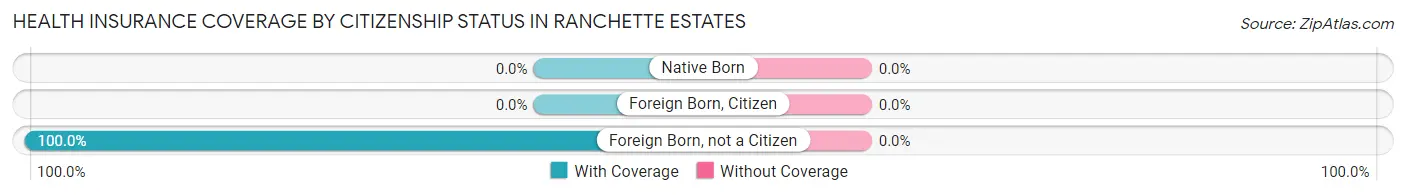
Health Insurance Coverage by Citizenship Status in Ranchette Estates
Citizenship Status
With Coverage
Without Coverage
Native Born
0 (0.0%)
0 (0.0%)
Foreign Born, Citizen
0 (0.0%)
0 (0.0%)
Foreign Born, not a Citizen
8 (100.0%)
0 (0.0%)
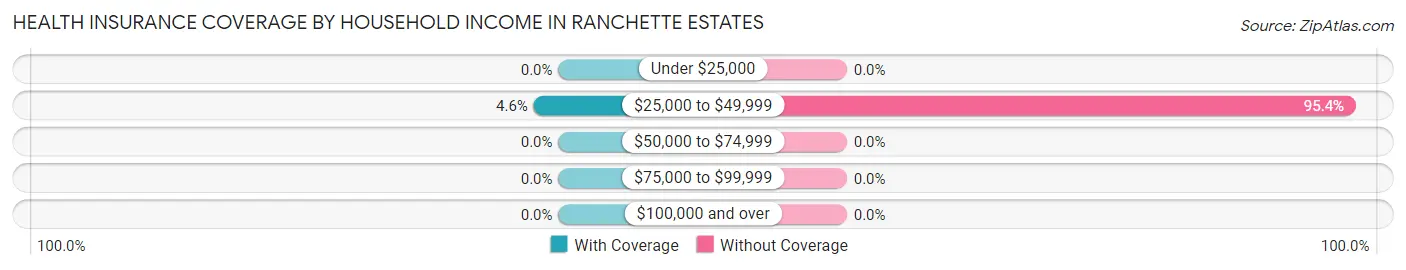
Health Insurance Coverage by Household Income in Ranchette Estates
Household Income
With Coverage
Without Coverage
Under $25,000
0 (0.0%)
0 (0.0%)
$25,000 to $49,999
8 (4.6%)
165 (95.4%)
$50,000 to $74,999
0 (0.0%)
0 (0.0%)
$75,000 to $99,999
0 (0.0%)
0 (0.0%)
$100,000 and over
0 (0.0%)
0 (0.0%)
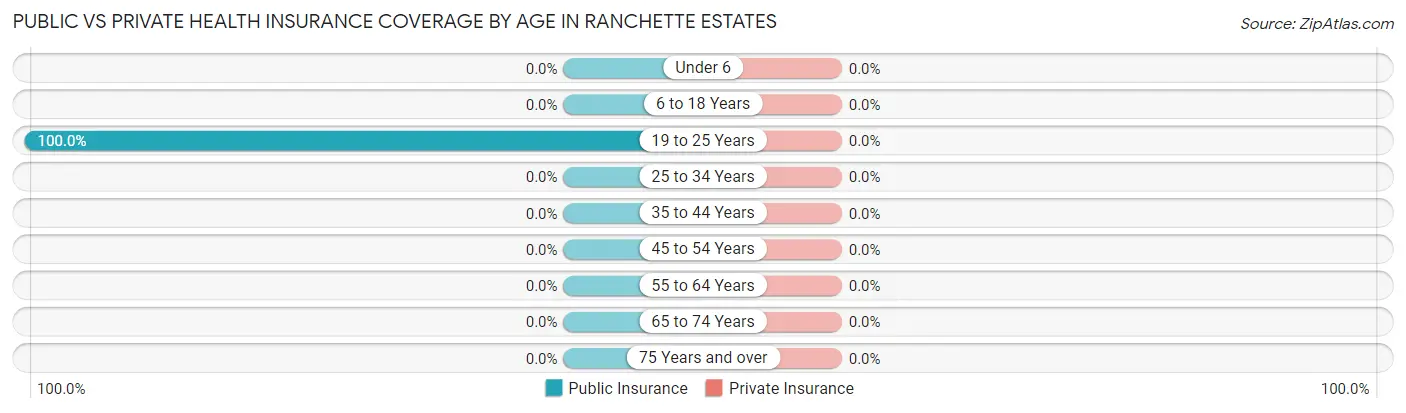
Public vs Private Health Insurance Coverage by Age in Ranchette Estates
Age Bracket
Public Insurance
Private Insurance
Under 6
0 (0.0%)
0 (0.0%)
6 to 18 Years
0 (0.0%)
0 (0.0%)
19 to 25 Years
8 (100.0%)
0 (0.0%)
25 to 34 Years
0 (0.0%)
0 (0.0%)
35 to 44 Years
0 (0.0%)
0 (0.0%)
45 to 54 Years
0 (0.0%)
0 (0.0%)
55 to 64 Years
0 (0.0%)
0 (0.0%)
65 to 74 Years
0 (0.0%)
0 (0.0%)
75 Years and over
0 (0.0%)
0 (0.0%)
Total
8 (4.6%)
0 (0.0%)
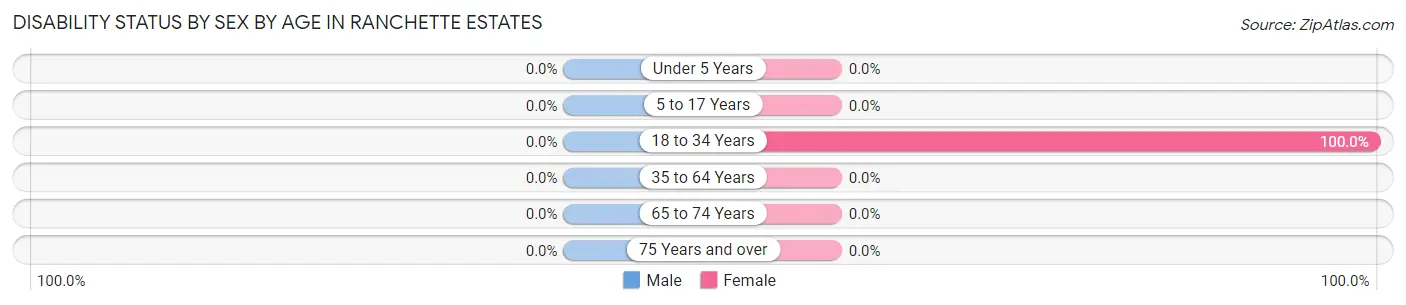
Disability Status by Sex by Age in Ranchette Estates
Age Bracket
Male
Female
Under 5 Years
0 (0.0%)
0 (0.0%)
5 to 17 Years
0 (0.0%)
0 (0.0%)
18 to 34 Years
0 (0.0%)
8 (100.0%)
35 to 64 Years
0 (0.0%)
0 (0.0%)
65 to 74 Years
0 (0.0%)
0 (0.0%)
75 Years and over
0 (0.0%)
0 (0.0%)
Disability Class by Sex by Age in Ranchette Estates
Disability Class: Hearing Difficulty
Age Bracket
Male
Female
Under 5 Years
0 (0.0%)
0 (0.0%)
5 to 17 Years
0 (0.0%)
0 (0.0%)
18 to 34 Years
0 (0.0%)
0 (0.0%)
35 to 64 Years
0 (0.0%)
0 (0.0%)
65 to 74 Years
0 (0.0%)
0 (0.0%)
75 Years and over
0 (0.0%)
0 (0.0%)
Disability Class: Vision Difficulty
Age Bracket
Male
Female
Under 5 Years
0 (0.0%)
0 (0.0%)
5 to 17 Years
0 (0.0%)
0 (0.0%)
18 to 34 Years
0 (0.0%)
8 (100.0%)
35 to 64 Years
0 (0.0%)
0 (0.0%)
65 to 74 Years
0 (0.0%)
0 (0.0%)
75 Years and over
0 (0.0%)
0 (0.0%)
Disability Class: Cognitive Difficulty
Age Bracket
Male
Female
5 to 17 Years
0 (0.0%)
0 (0.0%)
18 to 34 Years
0 (0.0%)
8 (100.0%)
35 to 64 Years
0 (0.0%)
0 (0.0%)
65 to 74 Years
0 (0.0%)
0 (0.0%)
75 Years and over
0 (0.0%)
0 (0.0%)
Disability Class: Ambulatory Difficulty
Age Bracket
Male
Female
5 to 17 Years
0 (0.0%)
0 (0.0%)
18 to 34 Years
0 (0.0%)
0 (0.0%)
35 to 64 Years
0 (0.0%)
0 (0.0%)
65 to 74 Years
0 (0.0%)
0 (0.0%)
75 Years and over
0 (0.0%)
0 (0.0%)
Disability Class: Self-Care Difficulty
Age Bracket
Male
Female
5 to 17 Years
0 (0.0%)
0 (0.0%)
18 to 34 Years
0 (0.0%)
0 (0.0%)
35 to 64 Years
0 (0.0%)
0 (0.0%)
65 to 74 Years
0 (0.0%)
0 (0.0%)
75 Years and over
0 (0.0%)
0 (0.0%)
Technology Access in Ranchette Estates
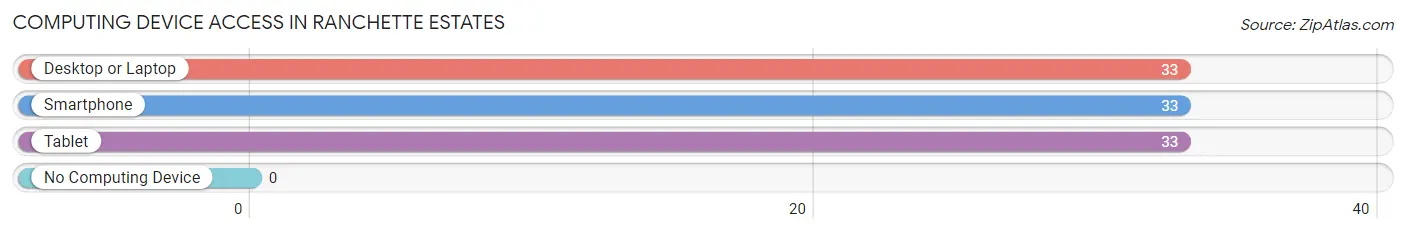
Computing Device Access in Ranchette Estates
Device Type
# Households
% Households
Desktop or Laptop
33
100.0%
Smartphone
33
100.0%
Tablet
33
100.0%
No Computing Device
0
0.0%
Total
33
100.0%
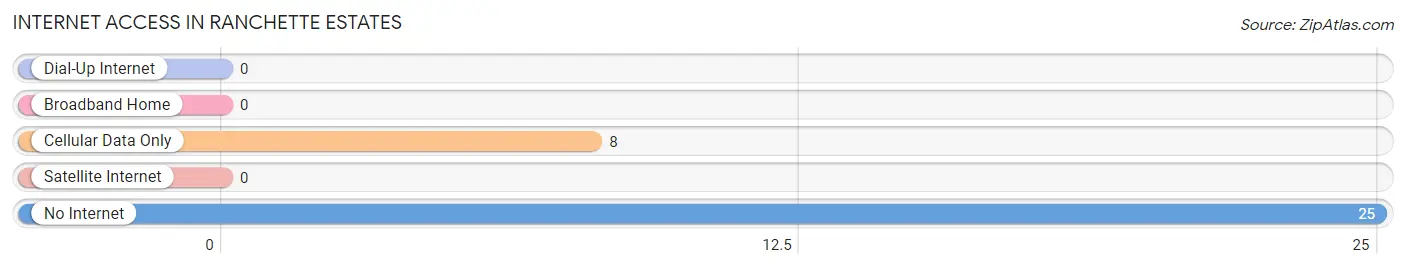
Internet Access in Ranchette Estates
Internet Type
# Households
% Households
Dial-Up Internet
0
0.0%
Broadband Home
0
0.0%
Cellular Data Only
8
24.2%
Satellite Internet
0
0.0%
No Internet
25
75.8%
Total
33
100.0%
Ranchette Estates Summary
Ranchette Estates is a small unincorporated community located in the state of Texas, in the United States. It is situated in the western part of the state, in the county of El Paso. The community is located in the foothills of the Franklin Mountains, and is surrounded by the city of El Paso.
History
Ranchette Estates was founded in the late 1950s by a group of ranchers who wanted to create a community that was close to the city of El Paso, but still had the feel of a rural area. The community was originally known as Ranchette, and was later changed to Ranchette Estates. The community was designed to be a residential area, with homes and businesses, and was intended to be a place where people could live and work in a rural setting.
Geography
Ranchette Estates is located in the western part of the state of Texas, in the county of El Paso. The community is situated in the foothills of the Franklin Mountains, and is surrounded by the city of El Paso. The area is mostly flat, with some rolling hills, and is mostly covered in grasslands and shrublands. The climate in the area is semi-arid, with hot summers and mild winters.
Economy
The economy of Ranchette Estates is largely based on the local agricultural industry. The area is home to several farms and ranches, which produce a variety of crops and livestock. The community also has a few small businesses, such as convenience stores, restaurants, and gas stations.
Demographics
As of the 2010 census, the population of Ranchette Estates was 1,845. The racial makeup of the community was 79.3% White, 0.7% African American, 0.2% Native American, 0.2% Asian, 0.1% Pacific Islander, 17.2% from other races, and 2.5% from two or more races. The median household income in the community was $37,917, and the median family income was $41,917. The per capita income in the community was $17,917.
Conclusion
Ranchette Estates is a small unincorporated community located in the western part of the state of Texas, in the county of El Paso. The community was founded in the late 1950s by a group of ranchers, and is situated in the foothills of the Franklin Mountains. The economy of the community is largely based on the local agricultural industry, and the population of the community was 1,845 as of the 2010 census. The racial makeup of the community was 79.3% White, 0.7% African American, 0.2% Native American, 0.2% Asian, 0.1% Pacific Islander, 17.2% from other races, and 2.5% from two or more races. The median household income in the community was $37,917, and the median family income was $41,917.
Common Questions
What is Per Capita Income in Ranchette Estates?
Per Capita income in Ranchette Estates is $17,675.
What is Inequality or Gini Index in Ranchette Estates?
Inequality or Gini Index in Ranchette Estates is 0.06.
What is the Total Population of Ranchette Estates?
Total Population of Ranchette Estates is 173.
What is the Total Male Population of Ranchette Estates?
Total Male Population of Ranchette Estates is 125.
What is the Total Female Population of Ranchette Estates?
Total Female Population of Ranchette Estates is 48.
What is the Ratio of Males per 100 Females in Ranchette Estates?
There are 260.42 Males per 100 Females in Ranchette Estates.
What is the Ratio of Females per 100 Males in Ranchette Estates?
There are 38.40 Females per 100 Males in Ranchette Estates.
What is the Median Population Age in Ranchette Estates?
Median Population Age in Ranchette Estates is 31.0 Years.
What is the Average Family Size in Ranchette Estates
Average Family Size in Ranchette Estates is 5.2 People.
What is the Average Household Size in Ranchette Estates
Average Household Size in Ranchette Estates is 5.2 People.
How Large is the Labor Force in Ranchette Estates?
There are 81 People in the Labor Forcein in Ranchette Estates.
What is the Percentage of People in the Labor Force in Ranchette Estates?
46.8% of People are in the Labor Force in Ranchette Estates.
Report Title
Report Link
HTML Copy & Paste Link
Social Media
Copy and paste the folowing code into any webpage where you would like this interactive chart to display