Mount Lebanon, LA Map & Demographics
Mount Lebanon Map
Mount Lebanon Overview
$19,475
PER CAPITA INCOME
$50,357
AVG FAMILY INCOME
$26,953
AVG HOUSEHOLD INCOME
0.44
INEQUALITY / GINI INDEX
167
TOTAL POPULATION
98
MALE POPULATION
69
FEMALE POPULATION
142.03
MALES / 100 FEMALES
70.41
FEMALES / 100 MALES
22.0
MEDIAN AGE
5.0
AVG FAMILY SIZE
3.3
AVG HOUSEHOLD SIZE
121
LABOR FORCE [ PEOPLE ]
77.6%
PERCENT IN LABOR FORCE
Income in Mount Lebanon
Income Overview in Mount Lebanon
Per Capita Income in Mount Lebanon is $19,475, while median incomes of families and households are $50,357 and $26,953 respectively.
| Characteristic | Number | Measure |
| Per Capita Income | 167 | $19,475 |
| Median Family Income | 28 | $50,357 |
| Mean Family Income | 28 | $64,896 |
| Median Household Income | 51 | $26,953 |
| Mean Household Income | 51 | $50,155 |
| Income Deficit | 28 | $0 |
| Wage / Income Gap (%) | 167 | 0.00% |
| Wage / Income Gap ($) | 167 | 100.00¢ per $1 |
| Gini / Inequality Index | 167 | 0.44 |
Earnings by Sex in Mount Lebanon
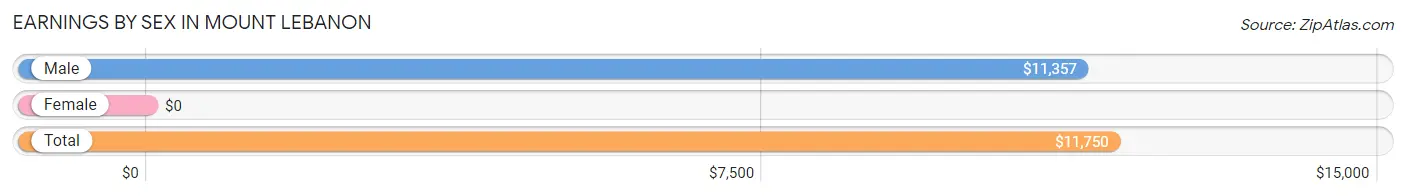
| Sex | Number | Average Earnings |
| Male | 76 (61.3%) | $11,357 |
| Female | 48 (38.7%) | $0 |
| Total | 124 (100.0%) | $11,750 |
Earnings by Sex by Income Bracket in Mount Lebanon
The most common earnings brackets in Mount Lebanon are $10,000 to $12,499 for men (70 | 92.1%) and $15,000 to $17,499 for women (11 | 22.9%).
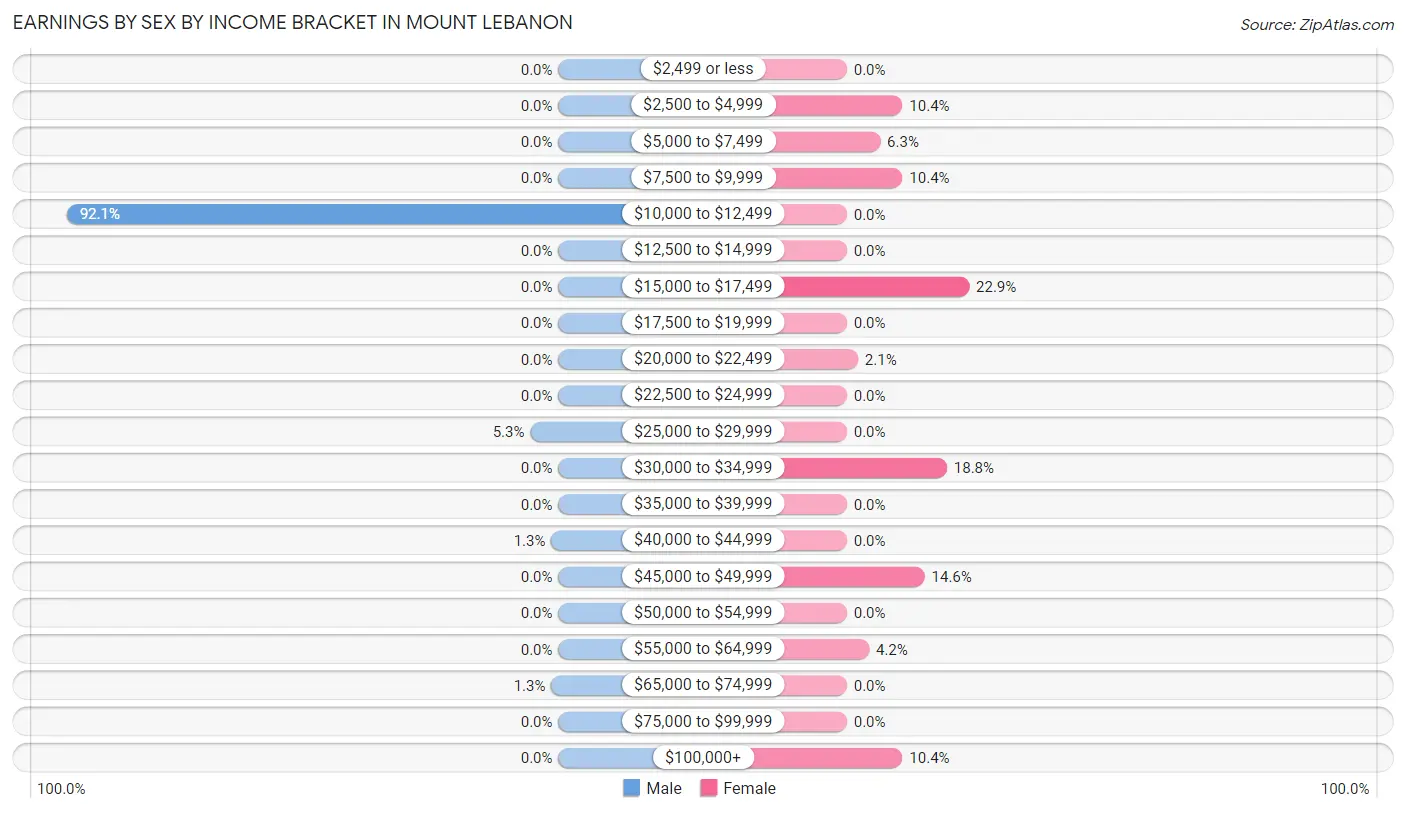
| Income | Male | Female |
| $2,499 or less | 0 (0.0%) | 0 (0.0%) |
| $2,500 to $4,999 | 0 (0.0%) | 5 (10.4%) |
| $5,000 to $7,499 | 0 (0.0%) | 3 (6.2%) |
| $7,500 to $9,999 | 0 (0.0%) | 5 (10.4%) |
| $10,000 to $12,499 | 70 (92.1%) | 0 (0.0%) |
| $12,500 to $14,999 | 0 (0.0%) | 0 (0.0%) |
| $15,000 to $17,499 | 0 (0.0%) | 11 (22.9%) |
| $17,500 to $19,999 | 0 (0.0%) | 0 (0.0%) |
| $20,000 to $22,499 | 0 (0.0%) | 1 (2.1%) |
| $22,500 to $24,999 | 0 (0.0%) | 0 (0.0%) |
| $25,000 to $29,999 | 4 (5.3%) | 0 (0.0%) |
| $30,000 to $34,999 | 0 (0.0%) | 9 (18.8%) |
| $35,000 to $39,999 | 0 (0.0%) | 0 (0.0%) |
| $40,000 to $44,999 | 1 (1.3%) | 0 (0.0%) |
| $45,000 to $49,999 | 0 (0.0%) | 7 (14.6%) |
| $50,000 to $54,999 | 0 (0.0%) | 0 (0.0%) |
| $55,000 to $64,999 | 0 (0.0%) | 2 (4.2%) |
| $65,000 to $74,999 | 1 (1.3%) | 0 (0.0%) |
| $75,000 to $99,999 | 0 (0.0%) | 0 (0.0%) |
| $100,000+ | 0 (0.0%) | 5 (10.4%) |
| Total | 76 (100.0%) | 48 (100.0%) |
Earnings by Sex by Educational Attainment in Mount Lebanon
| Educational Attainment | Male Income | Female Income |
| Less than High School | - | - |
| High School Diploma | - | - |
| College or Associate's Degree | - | - |
| Bachelor's Degree | - | - |
| Graduate Degree | - | - |
| Total | - | - |
Family Income in Mount Lebanon
Family Income Brackets in Mount Lebanon
According to the Mount Lebanon family income data, there are 13 families falling into the $25,000 to $34,999 income range, which is the most common income bracket and makes up 46.4% of all families.
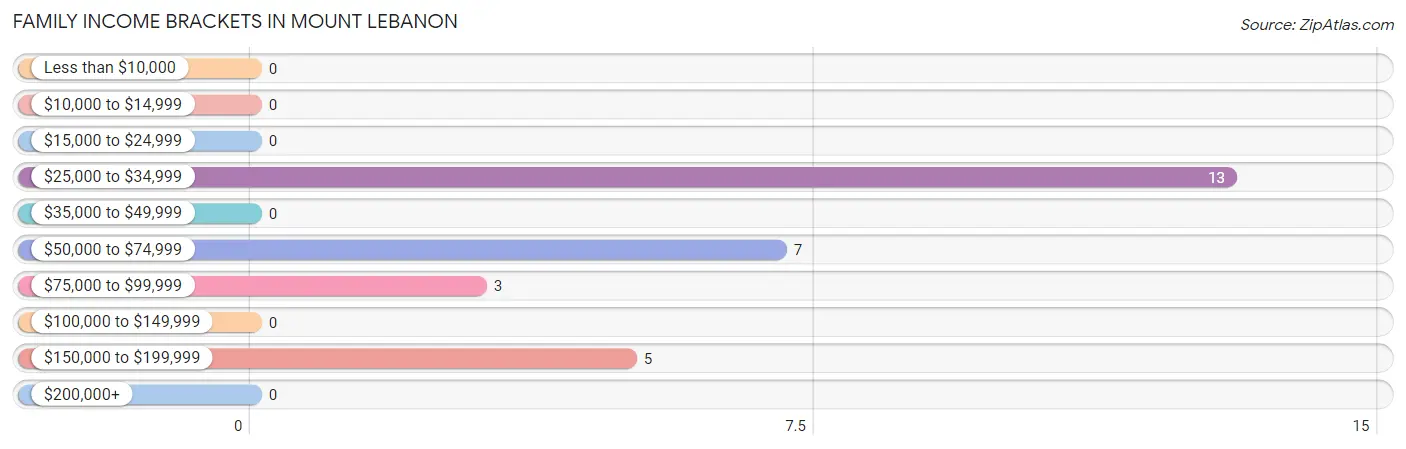
| Income Bracket | # Families | % Families |
| Less than $10,000 | 0 | 0.0% |
| $10,000 to $14,999 | 0 | 0.0% |
| $15,000 to $24,999 | 0 | 0.0% |
| $25,000 to $34,999 | 13 | 46.4% |
| $35,000 to $49,999 | 0 | 0.0% |
| $50,000 to $74,999 | 7 | 25.0% |
| $75,000 to $99,999 | 3 | 10.7% |
| $100,000 to $149,999 | 0 | 0.0% |
| $150,000 to $199,999 | 5 | 17.9% |
| $200,000+ | 0 | 0.0% |
Family Income by Famaliy Size in Mount Lebanon
2-person families (12 | 42.9%) account for the highest median family income in Mount Lebanon with $51,071 per family, while 2-person families (12 | 42.9%) have the highest median income of $25,536 per family member.
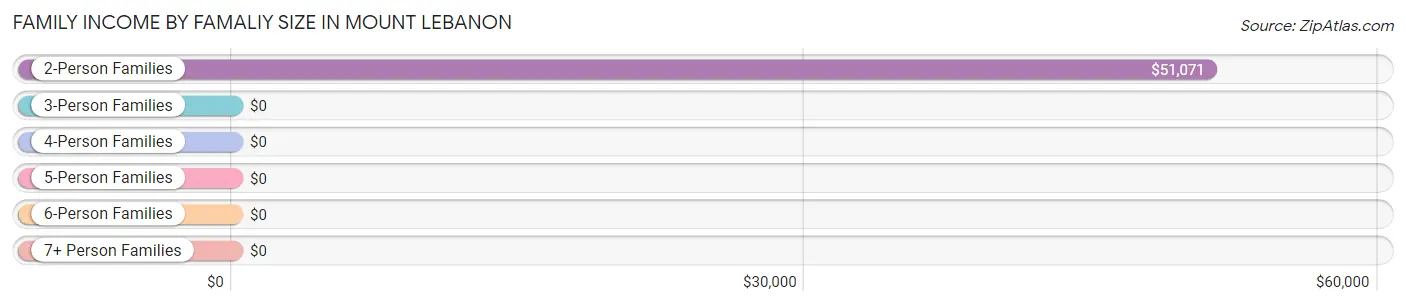
| Income Bracket | # Families | Median Income |
| 2-Person Families | 12 (42.9%) | $51,071 |
| 3-Person Families | 15 (53.6%) | $0 |
| 4-Person Families | 0 (0.0%) | $0 |
| 5-Person Families | 1 (3.6%) | $0 |
| 6-Person Families | 0 (0.0%) | $0 |
| 7+ Person Families | 0 (0.0%) | $0 |
| Total | 28 (100.0%) | $50,357 |
Family Income by Number of Earners in Mount Lebanon
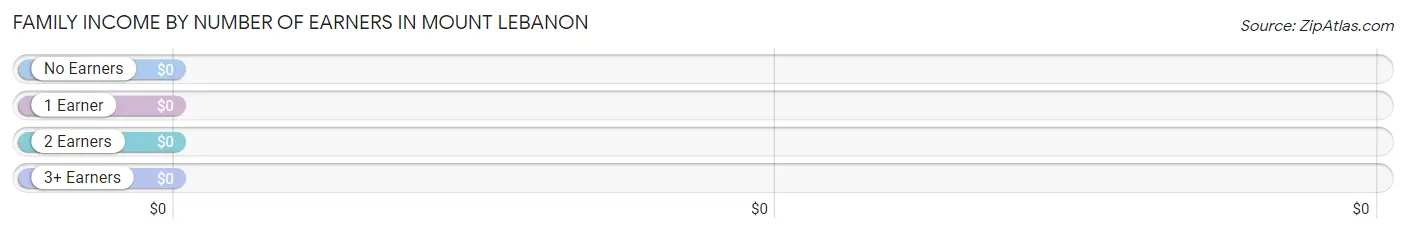
| Number of Earners | # Families | Median Income |
| No Earners | 1 (3.6%) | $0 |
| 1 Earner | 3 (10.7%) | $0 |
| 2 Earners | 23 (82.1%) | $0 |
| 3+ Earners | 1 (3.6%) | $0 |
| Total | 28 (100.0%) | $50,357 |
Household Income in Mount Lebanon
Household Income Brackets in Mount Lebanon
With 22 households falling in the category, the $25,000 to $34,999 income range is the most frequent in Mount Lebanon, accounting for 43.1% of all households.
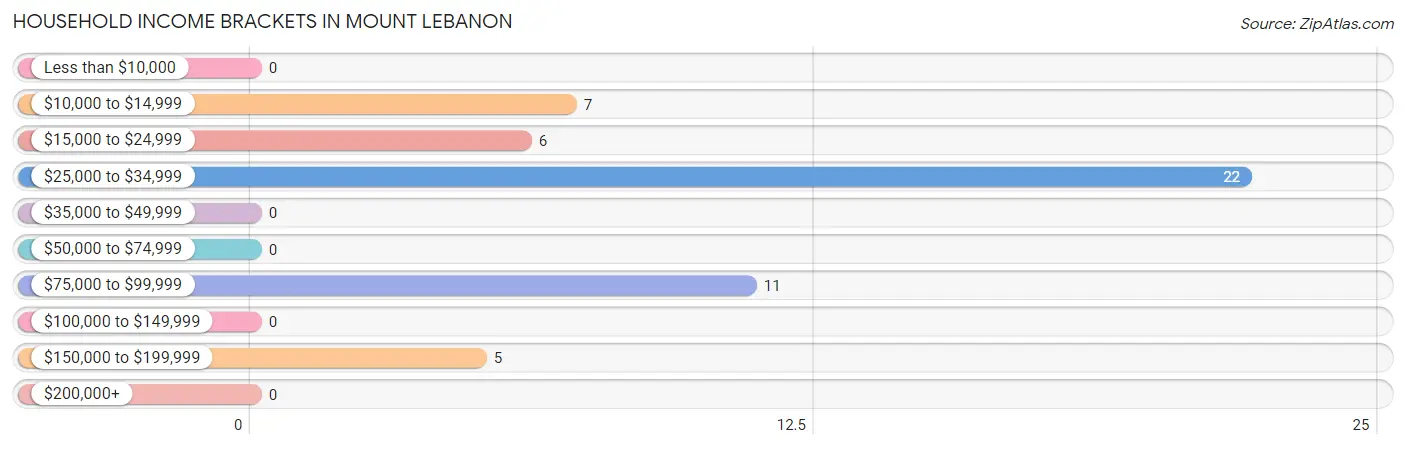
| Income Bracket | # Households | % Households |
| Less than $10,000 | 0 | 0.0% |
| $10,000 to $14,999 | 7 | 13.7% |
| $15,000 to $24,999 | 6 | 11.8% |
| $25,000 to $34,999 | 22 | 43.1% |
| $35,000 to $49,999 | 0 | 0.0% |
| $50,000 to $74,999 | 0 | 0.0% |
| $75,000 to $99,999 | 11 | 21.6% |
| $100,000 to $149,999 | 0 | 0.0% |
| $150,000 to $199,999 | 5 | 9.8% |
| $200,000+ | 0 | 0.0% |
Household Income by Householder Age in Mount Lebanon
The median household income in Mount Lebanon is $26,953, with the highest median household income of $26,250 found in the 65+ years age bracket for the primary householder. A total of 24 households (47.1%) fall into this category.
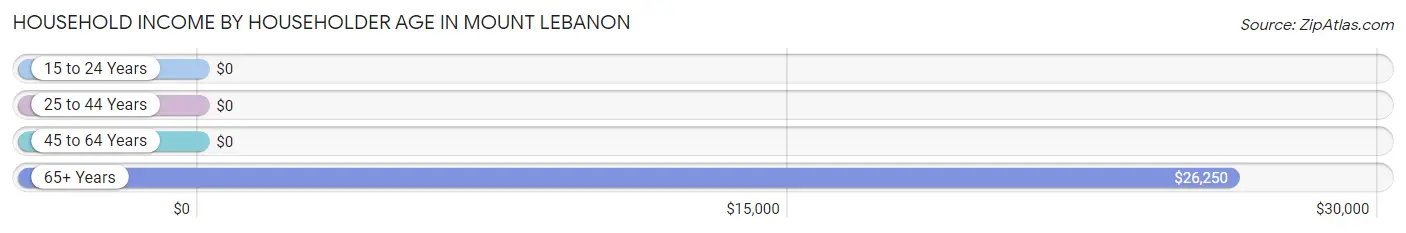
| Income Bracket | # Households | Median Income |
| 15 to 24 Years | 0 (0.0%) | $0 |
| 25 to 44 Years | 17 (33.3%) | $0 |
| 45 to 64 Years | 10 (19.6%) | $0 |
| 65+ Years | 24 (47.1%) | $26,250 |
| Total | 51 (100.0%) | $26,953 |
Poverty in Mount Lebanon
Income Below Poverty by Sex and Age in Mount Lebanon
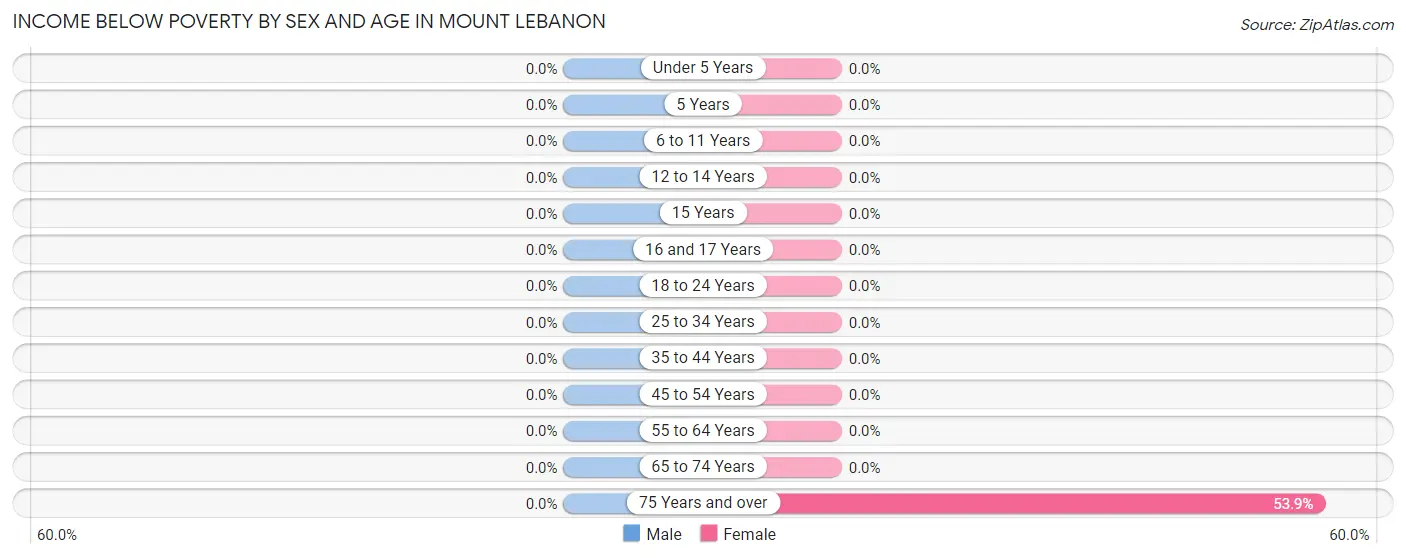
| Age Bracket | Male | Female |
| Under 5 Years | 0 (0.0%) | 0 (0.0%) |
| 5 Years | 0 (0.0%) | 0 (0.0%) |
| 6 to 11 Years | 0 (0.0%) | 0 (0.0%) |
| 12 to 14 Years | 0 (0.0%) | 0 (0.0%) |
| 15 Years | 0 (0.0%) | 0 (0.0%) |
| 16 and 17 Years | 0 (0.0%) | 0 (0.0%) |
| 18 to 24 Years | 0 (0.0%) | 0 (0.0%) |
| 25 to 34 Years | 0 (0.0%) | 0 (0.0%) |
| 35 to 44 Years | 0 (0.0%) | 0 (0.0%) |
| 45 to 54 Years | 0 (0.0%) | 0 (0.0%) |
| 55 to 64 Years | 0 (0.0%) | 0 (0.0%) |
| 65 to 74 Years | 0 (0.0%) | 0 (0.0%) |
| 75 Years and over | 0 (0.0%) | 7 (53.8%) |
| Total | 0 (0.0%) | 7 (10.1%) |
Income Above Poverty by Sex and Age in Mount Lebanon
According to the poverty statistics in Mount Lebanon, males aged under 5 years and females aged 18 to 24 years are the age groups that are most secure financially, with 100.0% of males and 100.0% of females in these age groups living above the poverty line.
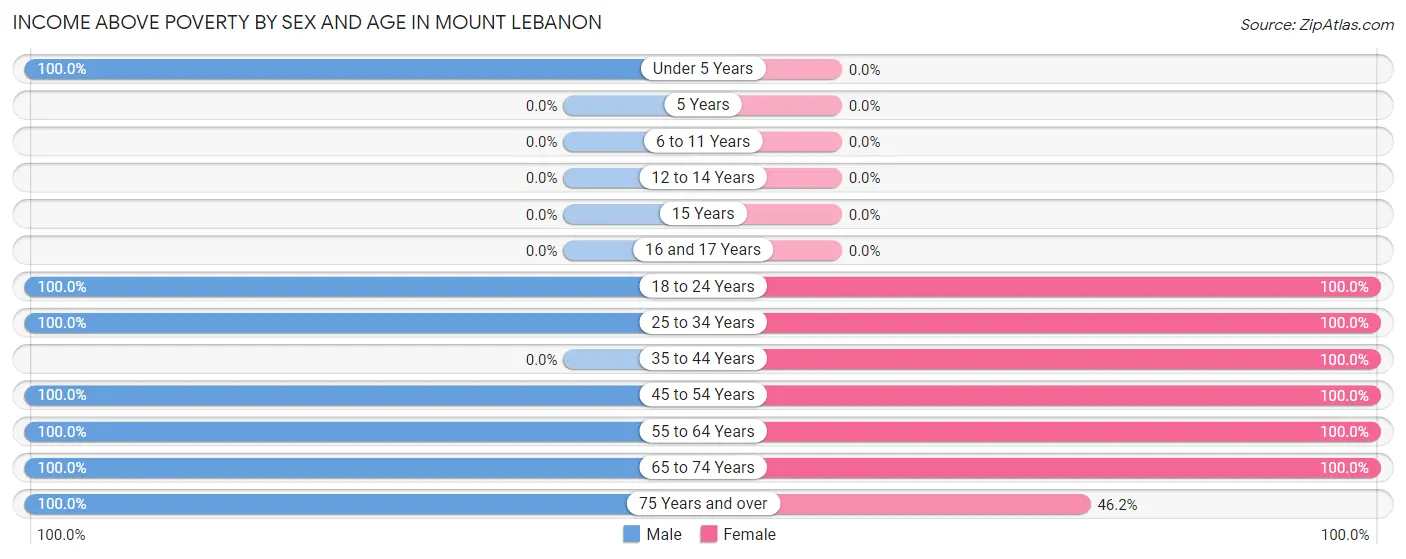
| Age Bracket | Male | Female |
| Under 5 Years | 11 (100.0%) | 0 (0.0%) |
| 5 Years | 0 (0.0%) | 0 (0.0%) |
| 6 to 11 Years | 0 (0.0%) | 0 (0.0%) |
| 12 to 14 Years | 0 (0.0%) | 0 (0.0%) |
| 15 Years | 0 (0.0%) | 0 (0.0%) |
| 16 and 17 Years | 0 (0.0%) | 0 (0.0%) |
| 18 to 24 Years | 60 (100.0%) | 17 (100.0%) |
| 25 to 34 Years | 10 (100.0%) | 16 (100.0%) |
| 35 to 44 Years | 0 (0.0%) | 7 (100.0%) |
| 45 to 54 Years | 8 (100.0%) | 5 (100.0%) |
| 55 to 64 Years | 1 (100.0%) | 7 (100.0%) |
| 65 to 74 Years | 3 (100.0%) | 4 (100.0%) |
| 75 Years and over | 5 (100.0%) | 6 (46.2%) |
| Total | 98 (100.0%) | 62 (89.9%) |
Income Below Poverty Among Married-Couple Families in Mount Lebanon
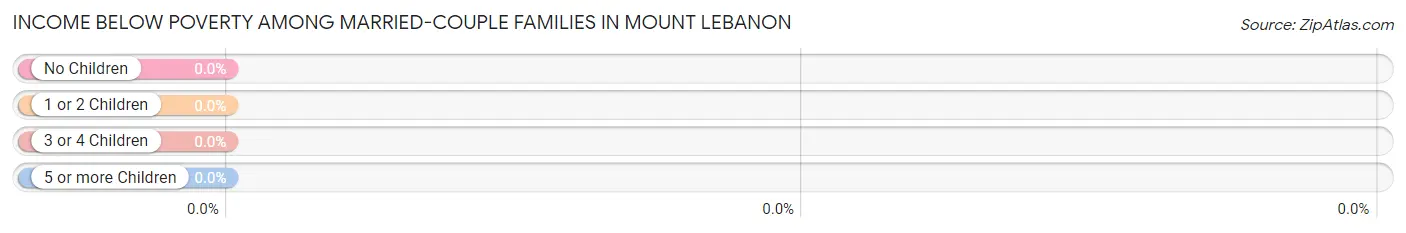
| Children | Above Poverty | Below Poverty |
| No Children | 7 (100.0%) | 0 (0.0%) |
| 1 or 2 Children | 11 (100.0%) | 0 (0.0%) |
| 3 or 4 Children | 0 (0.0%) | 0 (0.0%) |
| 5 or more Children | 0 (0.0%) | 0 (0.0%) |
| Total | 18 (100.0%) | 0 (0.0%) |
Income Below Poverty Among Single-Parent Households in Mount Lebanon
| Children | Single Father | Single Mother |
| No Children | 0 (0.0%) | 0 (0.0%) |
| 1 or 2 Children | 0 (0.0%) | 0 (0.0%) |
| 3 or 4 Children | 0 (0.0%) | 0 (0.0%) |
| 5 or more Children | 0 (0.0%) | 0 (0.0%) |
| Total | 0 (0.0%) | 0 (0.0%) |
Income Below Poverty Among Married-Couple vs Single-Parent Households in Mount Lebanon
| Children | Married-Couple Families | Single-Parent Households |
| No Children | 0 (0.0%) | 0 (0.0%) |
| 1 or 2 Children | 0 (0.0%) | 0 (0.0%) |
| 3 or 4 Children | 0 (0.0%) | 0 (0.0%) |
| 5 or more Children | 0 (0.0%) | 0 (0.0%) |
| Total | 0 (0.0%) | 0 (0.0%) |
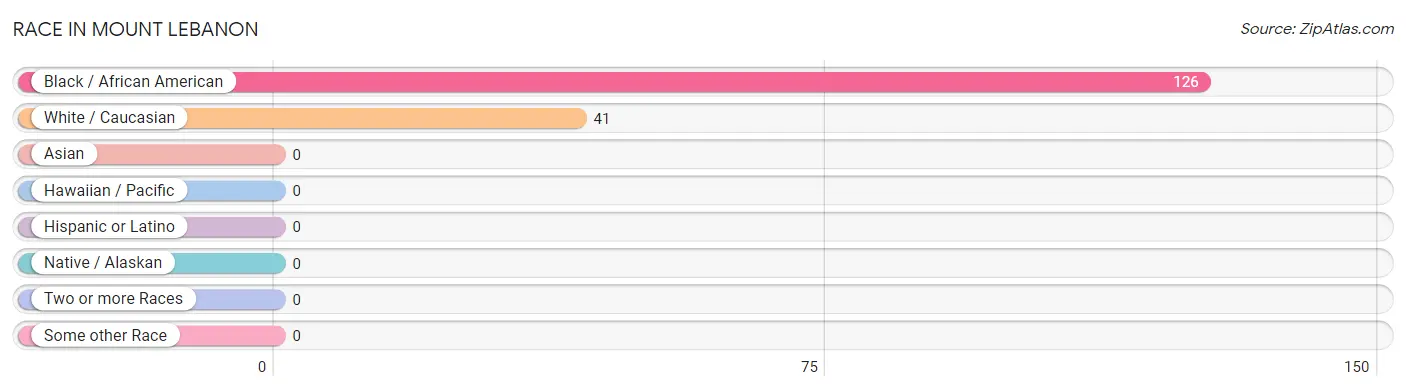
Race in Mount Lebanon
The most populous races in Mount Lebanon are Black / African American (126 | 75.4%), and White / Caucasian (41 | 24.5%).
| Race | # Population | % Population |
| Asian | 0 | 0.0% |
| Black / African American | 126 | 75.4% |
| Hawaiian / Pacific | 0 | 0.0% |
| Hispanic or Latino | 0 | 0.0% |
| Native / Alaskan | 0 | 0.0% |
| White / Caucasian | 41 | 24.5% |
| Two or more Races | 0 | 0.0% |
| Some other Race | 0 | 0.0% |
| Total | 167 | 100.0% |
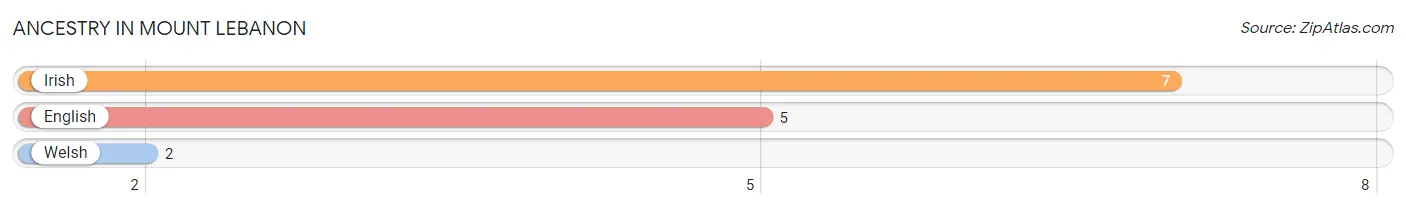
Ancestry in Mount Lebanon
The most populous ancestries reported in Mount Lebanon are Irish (7 | 4.2%), English (5 | 3.0%), and Welsh (2 | 1.2%), together accounting for 8.4% of all Mount Lebanon residents.
| Ancestry | # Population | % Population |
| English | 5 | 3.0% |
| Irish | 7 | 4.2% |
| Welsh | 2 | 1.2% | View All 3 Rows |
Immigrants in Mount Lebanon

| Immigration Origin | # Population | % Population | View All 0 Rows |
Sex and Age in Mount Lebanon
Sex and Age in Mount Lebanon
The most populous age groups in Mount Lebanon are 20 to 24 Years (60 | 61.2%) for men and 20 to 24 Years (17 | 24.6%) for women.
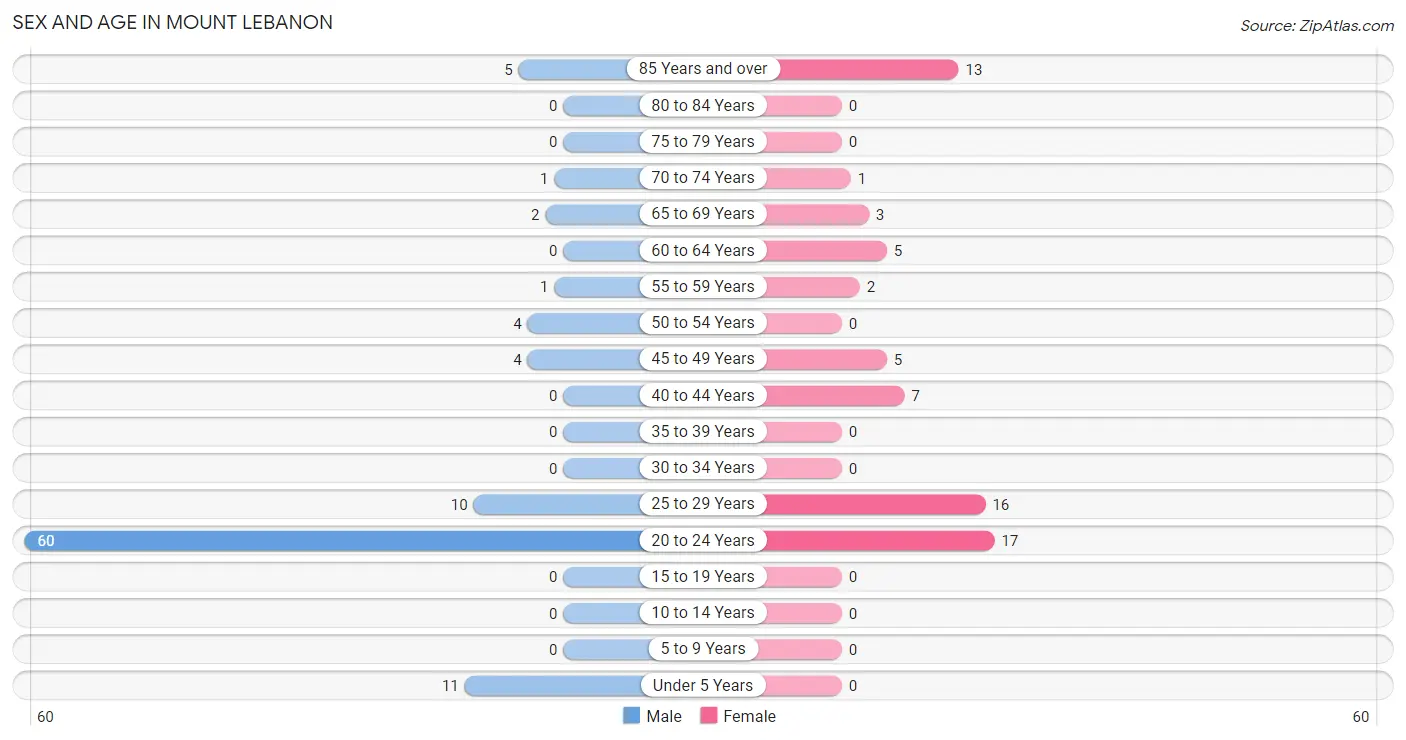
| Age Bracket | Male | Female |
| Under 5 Years | 11 (11.2%) | 0 (0.0%) |
| 5 to 9 Years | 0 (0.0%) | 0 (0.0%) |
| 10 to 14 Years | 0 (0.0%) | 0 (0.0%) |
| 15 to 19 Years | 0 (0.0%) | 0 (0.0%) |
| 20 to 24 Years | 60 (61.2%) | 17 (24.6%) |
| 25 to 29 Years | 10 (10.2%) | 16 (23.2%) |
| 30 to 34 Years | 0 (0.0%) | 0 (0.0%) |
| 35 to 39 Years | 0 (0.0%) | 0 (0.0%) |
| 40 to 44 Years | 0 (0.0%) | 7 (10.1%) |
| 45 to 49 Years | 4 (4.1%) | 5 (7.2%) |
| 50 to 54 Years | 4 (4.1%) | 0 (0.0%) |
| 55 to 59 Years | 1 (1.0%) | 2 (2.9%) |
| 60 to 64 Years | 0 (0.0%) | 5 (7.2%) |
| 65 to 69 Years | 2 (2.0%) | 3 (4.3%) |
| 70 to 74 Years | 1 (1.0%) | 1 (1.5%) |
| 75 to 79 Years | 0 (0.0%) | 0 (0.0%) |
| 80 to 84 Years | 0 (0.0%) | 0 (0.0%) |
| 85 Years and over | 5 (5.1%) | 13 (18.8%) |
| Total | 98 (100.0%) | 69 (100.0%) |
Families and Households in Mount Lebanon
Median Family Size in Mount Lebanon
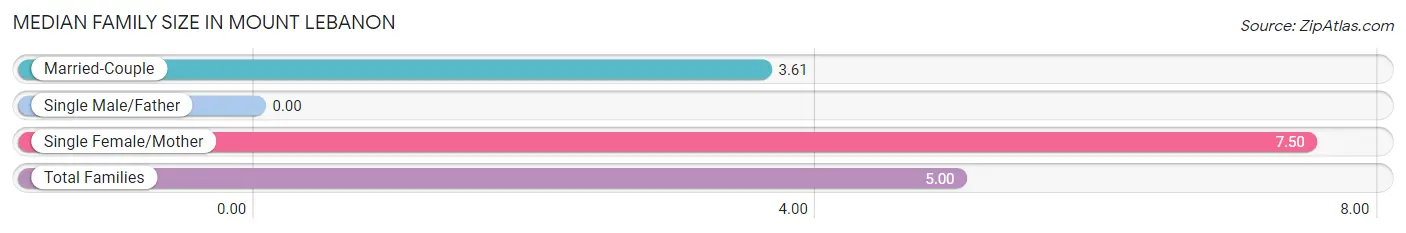
| Family Type | # Families | Family Size |
| Married-Couple | 18 (64.3%) | 3.61 |
| Single Male/Father | 0 (0.0%) | - |
| Single Female/Mother | 10 (35.7%) | 7.50 |
| Total Families | 28 (100.0%) | 5.00 |
Median Household Size in Mount Lebanon
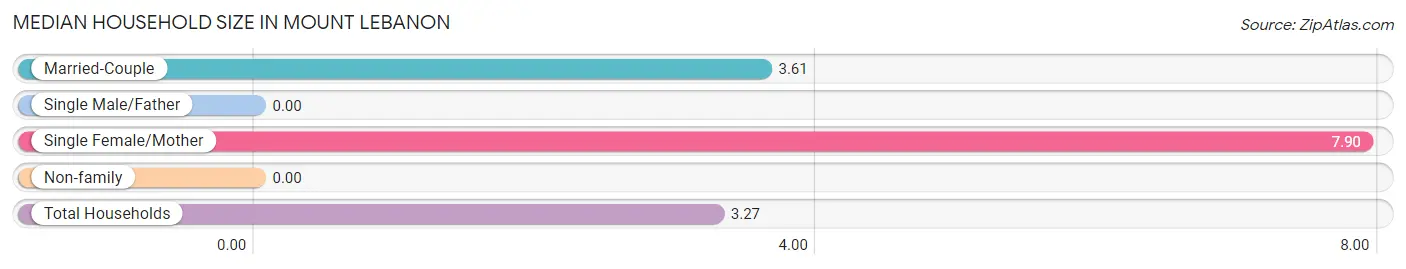
| Household Type | # Households | Household Size |
| Married-Couple | 18 (35.3%) | 3.61 |
| Single Male/Father | 0 (0.0%) | - |
| Single Female/Mother | 10 (19.6%) | 7.90 |
| Non-family | 23 (45.1%) | - |
| Total Households | 51 (100.0%) | 3.27 |
Household Size by Marriage Status in Mount Lebanon
Out of a total of 51 households in Mount Lebanon, 28 (54.9%) are family households, while 23 (45.1%) are nonfamily households. The most numerous type of family households are 3-person households, comprising 22, and the most common type of nonfamily households are 1-person households, comprising 23.
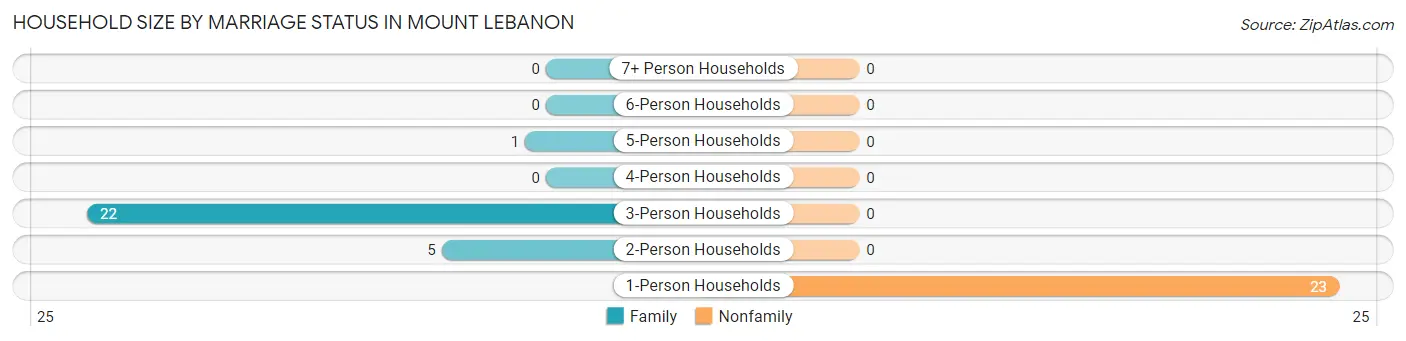
| Household Size | Family Households | Nonfamily Households |
| 1-Person Households | - | 23 (45.1%) |
| 2-Person Households | 5 (9.8%) | 0 (0.0%) |
| 3-Person Households | 22 (43.1%) | 0 (0.0%) |
| 4-Person Households | 0 (0.0%) | 0 (0.0%) |
| 5-Person Households | 1 (2.0%) | 0 (0.0%) |
| 6-Person Households | 0 (0.0%) | 0 (0.0%) |
| 7+ Person Households | 0 (0.0%) | 0 (0.0%) |
| Total | 28 (54.9%) | 23 (45.1%) |
Female Fertility in Mount Lebanon
Fertility by Age in Mount Lebanon
| Age Bracket | Women with Births | Births / 1,000 Women |
| 15 to 19 years | 0 (0.0%) | 0.0 |
| 20 to 34 years | 0 (0.0%) | 0.0 |
| 35 to 50 years | 0 (0.0%) | 0.0 |
| Total | 0 (0.0%) | 0.0 |
Fertility by Age by Marriage Status in Mount Lebanon
| Age Bracket | Married | Unmarried |
| 15 to 19 years | 0 (0.0%) | 0 (0.0%) |
| 20 to 34 years | 0 (0.0%) | 0 (0.0%) |
| 35 to 50 years | 0 (0.0%) | 0 (0.0%) |
| Total | 0 (0.0%) | 0 (0.0%) |
Fertility by Education in Mount Lebanon
| Educational Attainment | Women with Births | Births / 1,000 Women |
| Less than High School | 0 (0.0%) | 0.0 |
| High School Diploma | 0 (0.0%) | 0.0 |
| College or Associate's Degree | 0 (0.0%) | 0.0 |
| Bachelor's Degree | 0 (0.0%) | 0.0 |
| Graduate Degree | 0 (0.0%) | 0.0 |
| Total | 0 (0.0%) | 0.0 |
Fertility by Education by Marriage Status in Mount Lebanon
| Educational Attainment | Married | Unmarried |
| Less than High School | 0 (0.0%) | 0 (0.0%) |
| High School Diploma | 0 (0.0%) | 0 (0.0%) |
| College or Associate's Degree | 0 (0.0%) | 0 (0.0%) |
| Bachelor's Degree | 0 (0.0%) | 0 (0.0%) |
| Graduate Degree | 0 (0.0%) | 0 (0.0%) |
| Total | 0 (0.0%) | 0 (0.0%) |
Employment Characteristics in Mount Lebanon
Employment by Class of Employer in Mount Lebanon
Among the 121 employed individuals in Mount Lebanon, private company employees (117 | 96.7%), local government employees (2 | 1.7%), and not-for-profit organizations (1 | 0.8%) make up the most common classes of employment.
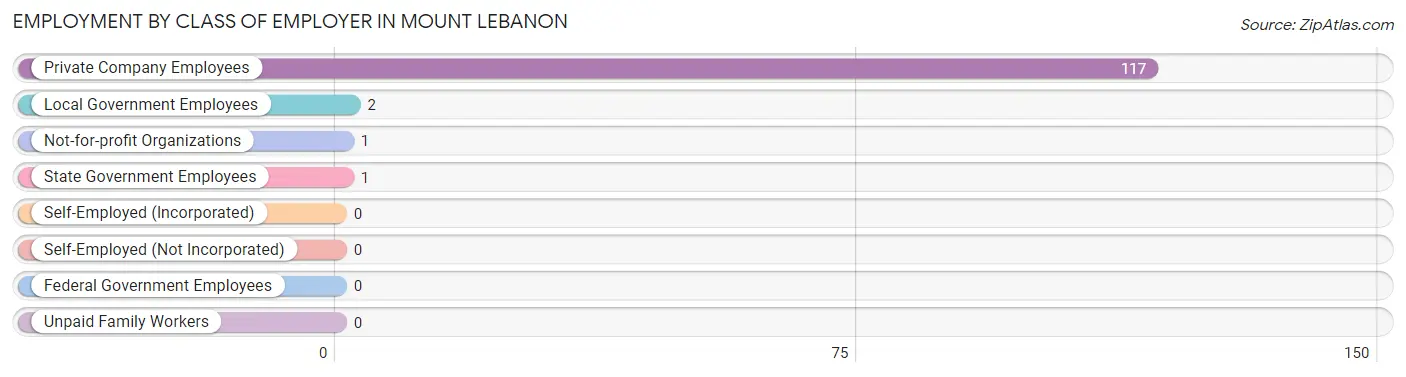
| Employer Class | # Employees | % Employees |
| Private Company Employees | 117 | 96.7% |
| Self-Employed (Incorporated) | 0 | 0.0% |
| Self-Employed (Not Incorporated) | 0 | 0.0% |
| Not-for-profit Organizations | 1 | 0.8% |
| Local Government Employees | 2 | 1.7% |
| State Government Employees | 1 | 0.8% |
| Federal Government Employees | 0 | 0.0% |
| Unpaid Family Workers | 0 | 0.0% |
| Total | 121 | 100.0% |
Employment Status by Age in Mount Lebanon
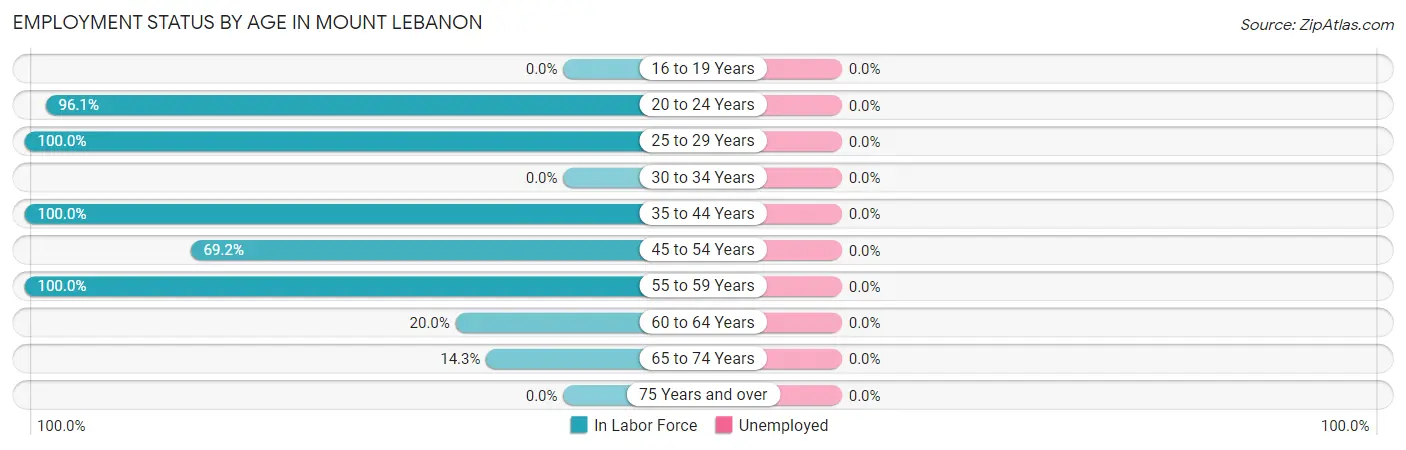
| Age Bracket | In Labor Force | Unemployed |
| 16 to 19 Years | 0 (0.0%) | 0 (0.0%) |
| 20 to 24 Years | 74 (96.1%) | 0 (0.0%) |
| 25 to 29 Years | 26 (100.0%) | 0 (0.0%) |
| 30 to 34 Years | 0 (0.0%) | 0 (0.0%) |
| 35 to 44 Years | 7 (100.0%) | 0 (0.0%) |
| 45 to 54 Years | 9 (69.2%) | 0 (0.0%) |
| 55 to 59 Years | 3 (100.0%) | 0 (0.0%) |
| 60 to 64 Years | 1 (20.0%) | 0 (0.0%) |
| 65 to 74 Years | 1 (14.3%) | 0 (0.0%) |
| 75 Years and over | 0 (0.0%) | 0 (0.0%) |
| Total | 121 (77.6%) | 0 (0.0%) |
Employment Status by Educational Attainment in Mount Lebanon
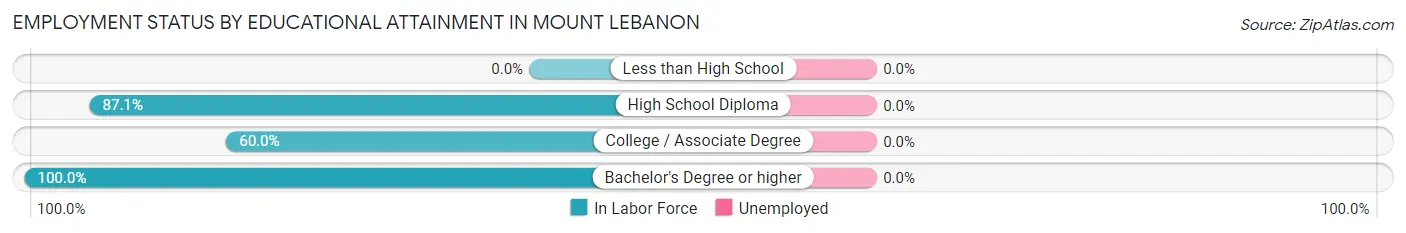
| Educational Attainment | In Labor Force | Unemployed |
| Less than High School | 0 (0.0%) | 0 (0.0%) |
| High School Diploma | 27 (87.1%) | 0 (0.0%) |
| College / Associate Degree | 6 (60.0%) | 0 (0.0%) |
| Bachelor's Degree or higher | 13 (100.0%) | 0 (0.0%) |
| Total | 46 (85.2%) | 0 (0.0%) |
Employment Occupations by Sex in Mount Lebanon
Management, Business, Science and Arts Occupations
The most common Management, Business, Science and Arts occupations in Mount Lebanon are Community & Social Service (10 | 8.3%), Education, Arts & Media (7 | 5.8%), Management (6 | 5.0%), and Education Instruction & Library (3 | 2.5%).
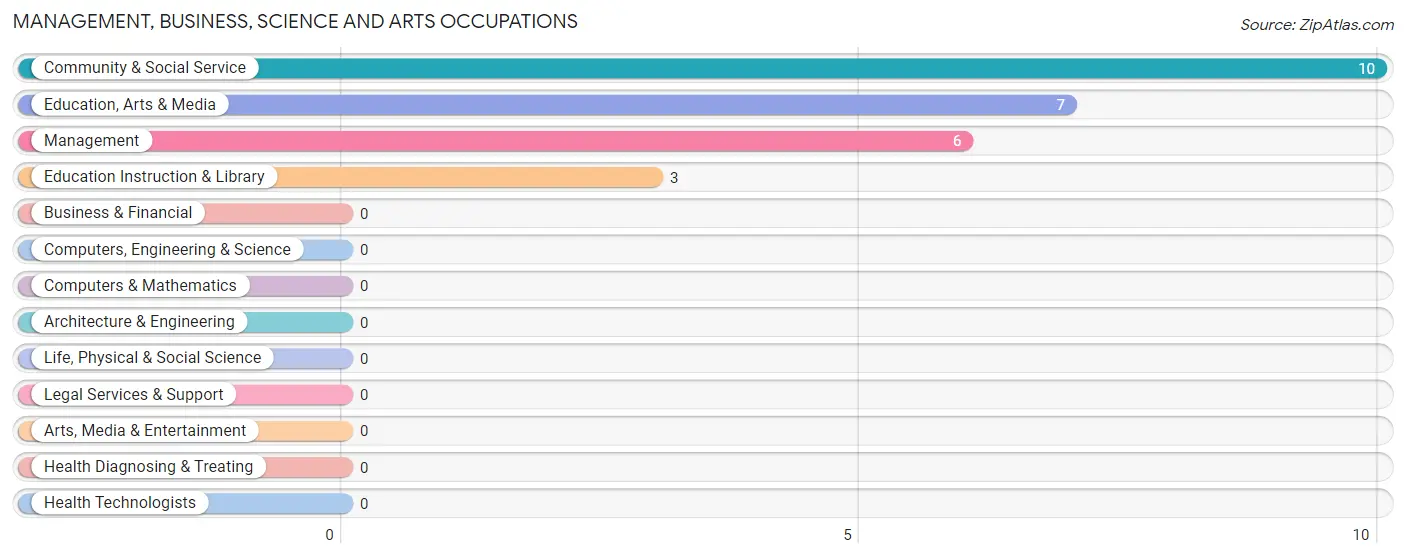
Management, Business, Science and Arts Occupations by Sex
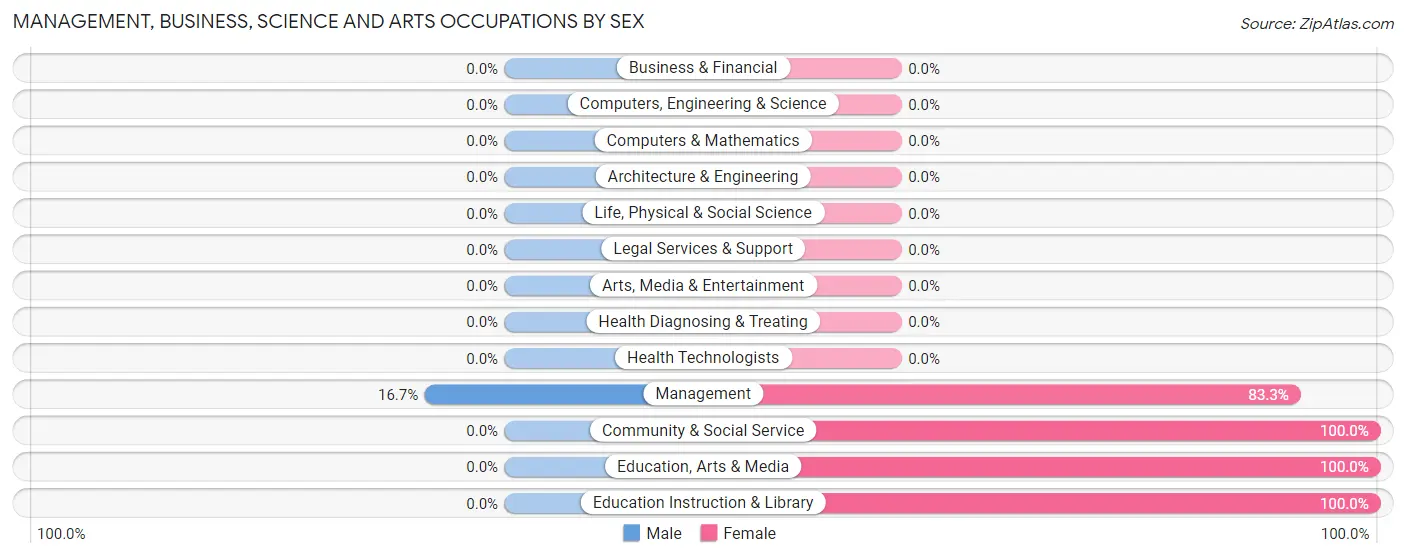
| Occupation | Male | Female |
| Management | 1 (16.7%) | 5 (83.3%) |
| Business & Financial | 0 (0.0%) | 0 (0.0%) |
| Computers, Engineering & Science | 0 (0.0%) | 0 (0.0%) |
| Computers & Mathematics | 0 (0.0%) | 0 (0.0%) |
| Architecture & Engineering | 0 (0.0%) | 0 (0.0%) |
| Life, Physical & Social Science | 0 (0.0%) | 0 (0.0%) |
| Community & Social Service | 0 (0.0%) | 10 (100.0%) |
| Education, Arts & Media | 0 (0.0%) | 7 (100.0%) |
| Legal Services & Support | 0 (0.0%) | 0 (0.0%) |
| Education Instruction & Library | 0 (0.0%) | 3 (100.0%) |
| Arts, Media & Entertainment | 0 (0.0%) | 0 (0.0%) |
| Health Diagnosing & Treating | 0 (0.0%) | 0 (0.0%) |
| Health Technologists | 0 (0.0%) | 0 (0.0%) |
| Total (Category) | 1 (6.2%) | 15 (93.8%) |
| Total (Overall) | 76 (62.8%) | 45 (37.2%) |
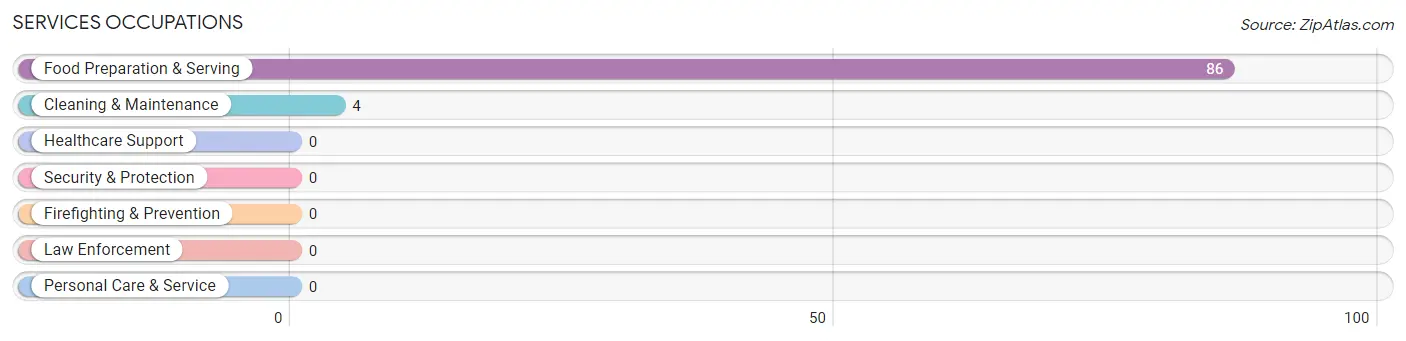
Services Occupations
The most common Services occupations in Mount Lebanon are Food Preparation & Serving (86 | 71.1%), and Cleaning & Maintenance (4 | 3.3%).
Services Occupations by Sex
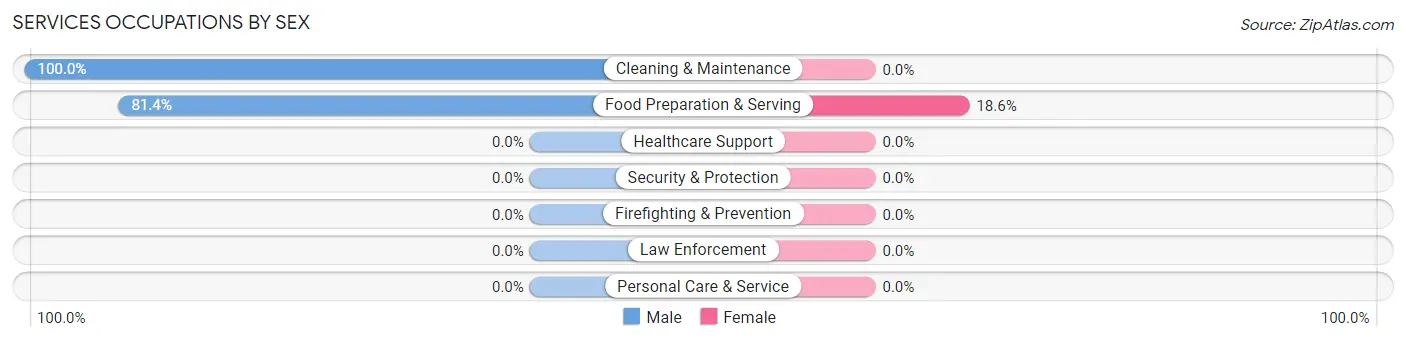
| Occupation | Male | Female |
| Healthcare Support | 0 (0.0%) | 0 (0.0%) |
| Security & Protection | 0 (0.0%) | 0 (0.0%) |
| Firefighting & Prevention | 0 (0.0%) | 0 (0.0%) |
| Law Enforcement | 0 (0.0%) | 0 (0.0%) |
| Food Preparation & Serving | 70 (81.4%) | 16 (18.6%) |
| Cleaning & Maintenance | 4 (100.0%) | 0 (0.0%) |
| Personal Care & Service | 0 (0.0%) | 0 (0.0%) |
| Total (Category) | 74 (82.2%) | 16 (17.8%) |
| Total (Overall) | 76 (62.8%) | 45 (37.2%) |
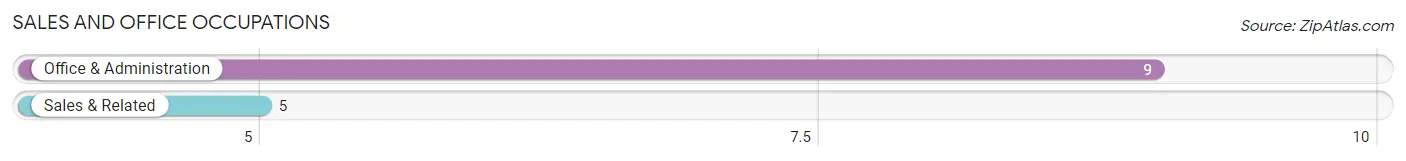
Sales and Office Occupations
The most common Sales and Office occupations in Mount Lebanon are Office & Administration (9 | 7.4%), and Sales & Related (5 | 4.1%).
Sales and Office Occupations by Sex
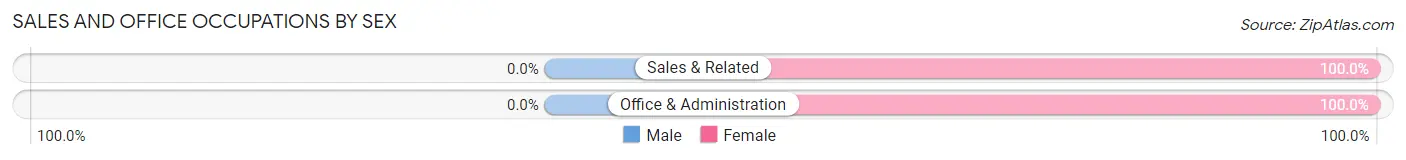
| Occupation | Male | Female |
| Sales & Related | 0 (0.0%) | 5 (100.0%) |
| Office & Administration | 0 (0.0%) | 9 (100.0%) |
| Total (Category) | 0 (0.0%) | 14 (100.0%) |
| Total (Overall) | 76 (62.8%) | 45 (37.2%) |
Natural Resources, Construction and Maintenance Occupations
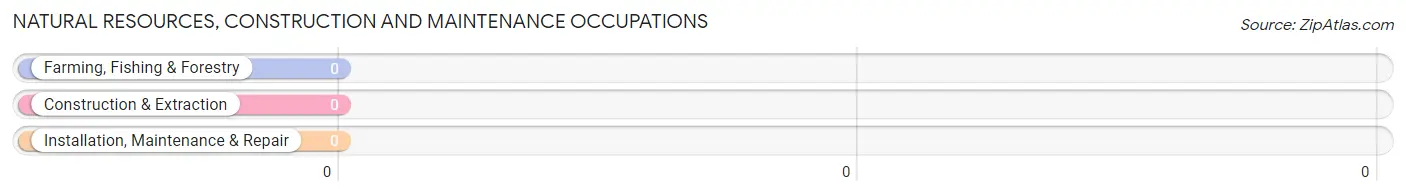
Natural Resources, Construction and Maintenance Occupations by Sex
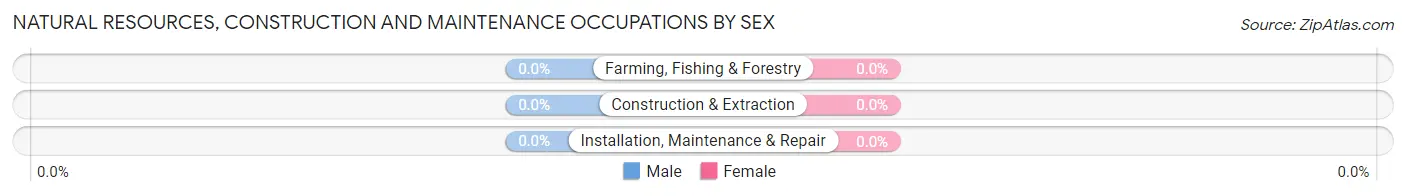
| Occupation | Male | Female |
| Farming, Fishing & Forestry | 0 (0.0%) | 0 (0.0%) |
| Construction & Extraction | 0 (0.0%) | 0 (0.0%) |
| Installation, Maintenance & Repair | 0 (0.0%) | 0 (0.0%) |
| Total (Category) | 0 (0.0%) | 0 (0.0%) |
| Total (Overall) | 76 (62.8%) | 45 (37.2%) |
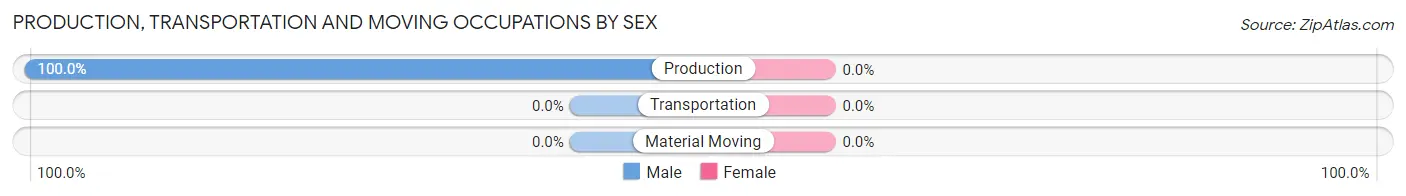
Production, Transportation and Moving Occupations
The most common Production, Transportation and Moving occupations in Mount Lebanon are , and Production (1 | 0.8%).
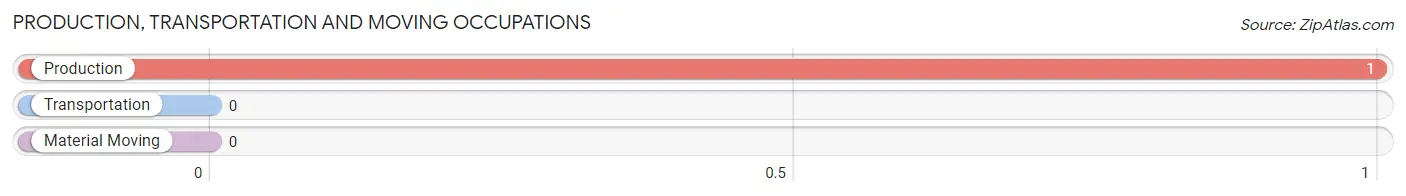
Production, Transportation and Moving Occupations by Sex
| Occupation | Male | Female |
| Production | 1 (100.0%) | 0 (0.0%) |
| Transportation | 0 (0.0%) | 0 (0.0%) |
| Material Moving | 0 (0.0%) | 0 (0.0%) |
| Total (Category) | 1 (100.0%) | 0 (0.0%) |
| Total (Overall) | 76 (62.8%) | 45 (37.2%) |
Employment Industries by Sex in Mount Lebanon
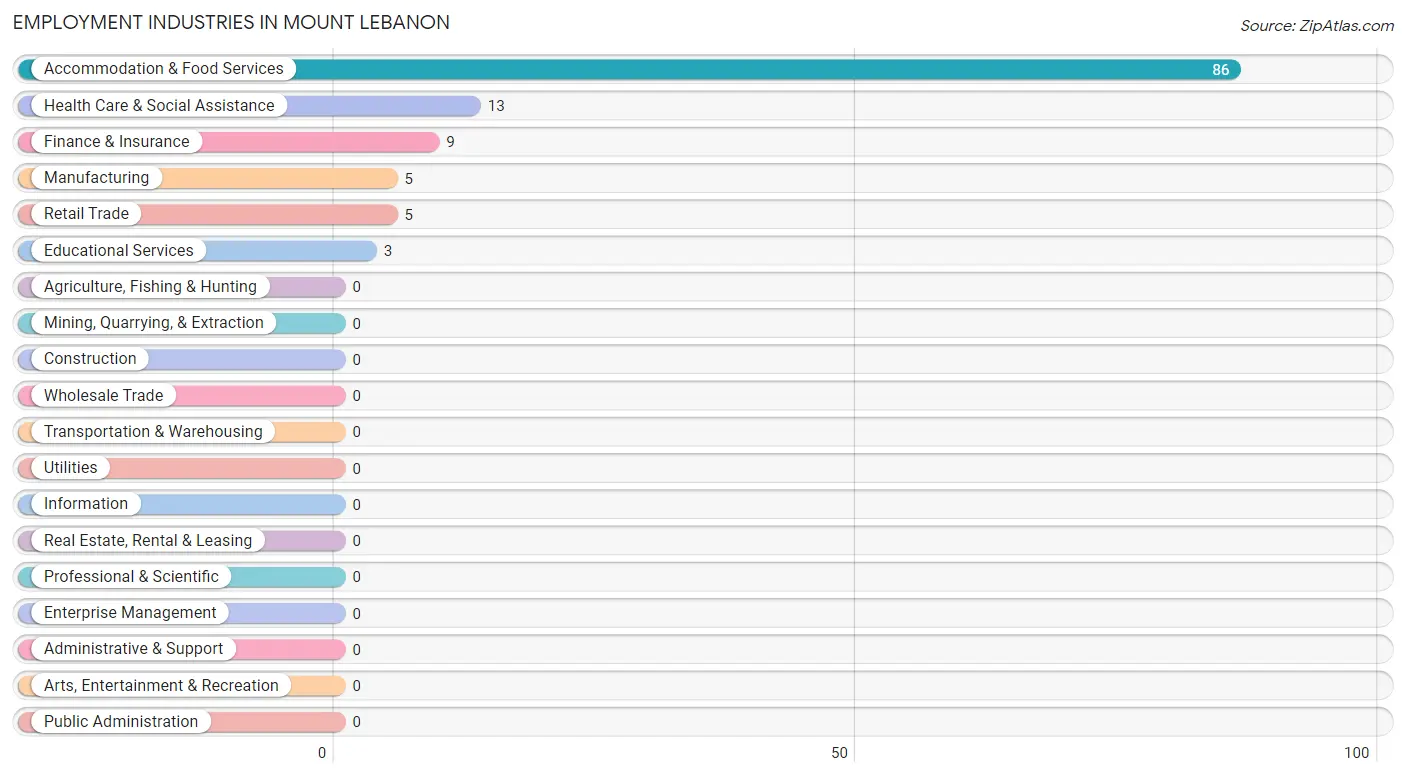
Employment Industries in Mount Lebanon
The major employment industries in Mount Lebanon include Accommodation & Food Services (86 | 71.1%), Health Care & Social Assistance (13 | 10.7%), Finance & Insurance (9 | 7.4%), Manufacturing (5 | 4.1%), and Retail Trade (5 | 4.1%).
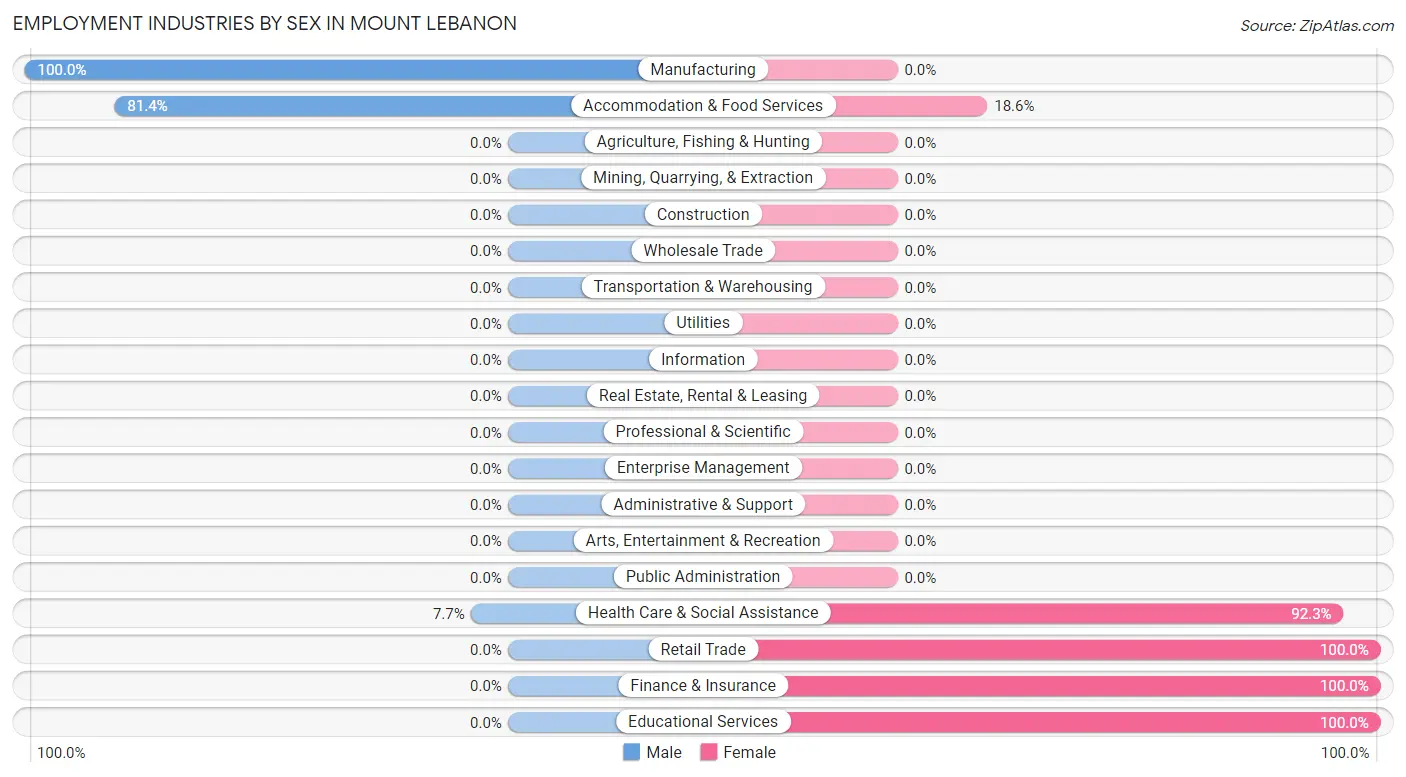
Employment Industries by Sex in Mount Lebanon
The Mount Lebanon industries that see more men than women are Manufacturing (100.0%), Accommodation & Food Services (81.4%), and Health Care & Social Assistance (7.7%), whereas the industries that tend to have a higher number of women are Retail Trade (100.0%), Finance & Insurance (100.0%), and Educational Services (100.0%).
| Industry | Male | Female |
| Agriculture, Fishing & Hunting | 0 (0.0%) | 0 (0.0%) |
| Mining, Quarrying, & Extraction | 0 (0.0%) | 0 (0.0%) |
| Construction | 0 (0.0%) | 0 (0.0%) |
| Manufacturing | 5 (100.0%) | 0 (0.0%) |
| Wholesale Trade | 0 (0.0%) | 0 (0.0%) |
| Retail Trade | 0 (0.0%) | 5 (100.0%) |
| Transportation & Warehousing | 0 (0.0%) | 0 (0.0%) |
| Utilities | 0 (0.0%) | 0 (0.0%) |
| Information | 0 (0.0%) | 0 (0.0%) |
| Finance & Insurance | 0 (0.0%) | 9 (100.0%) |
| Real Estate, Rental & Leasing | 0 (0.0%) | 0 (0.0%) |
| Professional & Scientific | 0 (0.0%) | 0 (0.0%) |
| Enterprise Management | 0 (0.0%) | 0 (0.0%) |
| Administrative & Support | 0 (0.0%) | 0 (0.0%) |
| Educational Services | 0 (0.0%) | 3 (100.0%) |
| Health Care & Social Assistance | 1 (7.7%) | 12 (92.3%) |
| Arts, Entertainment & Recreation | 0 (0.0%) | 0 (0.0%) |
| Accommodation & Food Services | 70 (81.4%) | 16 (18.6%) |
| Public Administration | 0 (0.0%) | 0 (0.0%) |
| Total | 76 (62.8%) | 45 (37.2%) |
Education in Mount Lebanon
School Enrollment in Mount Lebanon
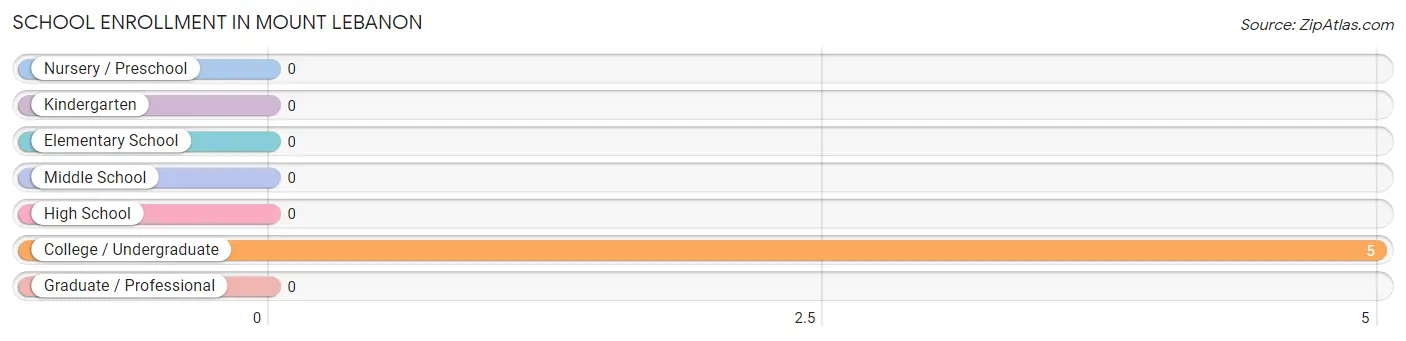
| School Level | # Students | % Students |
| Nursery / Preschool | 0 | 0.0% |
| Kindergarten | 0 | 0.0% |
| Elementary School | 0 | 0.0% |
| Middle School | 0 | 0.0% |
| High School | 0 | 0.0% |
| College / Undergraduate | 5 | 100.0% |
| Graduate / Professional | 0 | 0.0% |
| Total | 5 | 100.0% |
School Enrollment by Age by Funding Source in Mount Lebanon
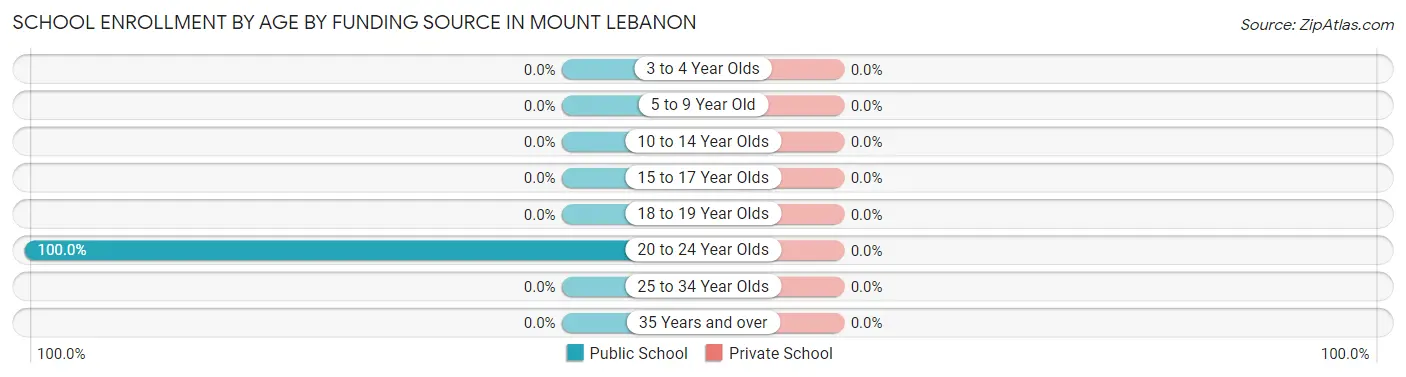
| Age Bracket | Public School | Private School |
| 3 to 4 Year Olds | 0 (0.0%) | 0 (0.0%) |
| 5 to 9 Year Old | 0 (0.0%) | 0 (0.0%) |
| 10 to 14 Year Olds | 0 (0.0%) | 0 (0.0%) |
| 15 to 17 Year Olds | 0 (0.0%) | 0 (0.0%) |
| 18 to 19 Year Olds | 0 (0.0%) | 0 (0.0%) |
| 20 to 24 Year Olds | 5 (100.0%) | 0 (0.0%) |
| 25 to 34 Year Olds | 0 (0.0%) | 0 (0.0%) |
| 35 Years and over | 0 (0.0%) | 0 (0.0%) |
| Total | 5 (100.0%) | 0 (0.0%) |
Educational Attainment by Field of Study in Mount Lebanon
Arts & humanities (13 | 48.1%), education (6 | 22.2%), science & technology (5 | 18.5%), engineering (2 | 7.4%), and business (1 | 3.7%) are the most common fields of study among 27 individuals in Mount Lebanon who have obtained a bachelor's degree or higher.
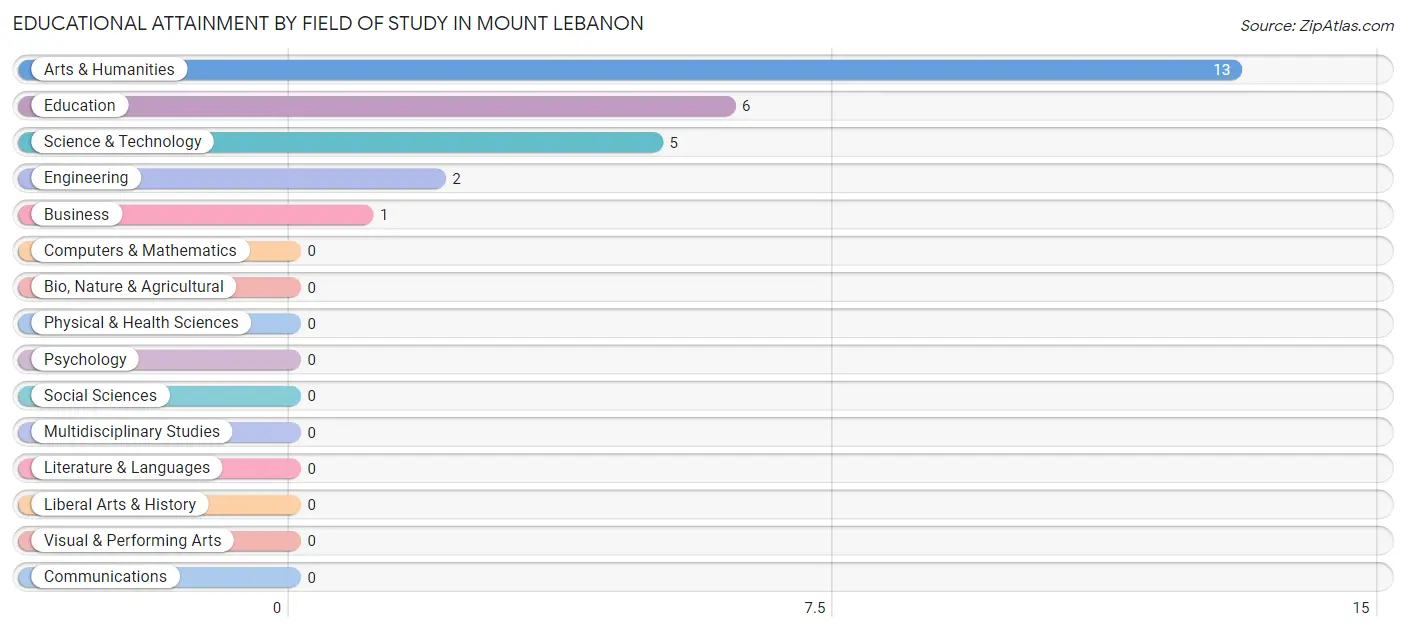
| Field of Study | # Graduates | % Graduates |
| Computers & Mathematics | 0 | 0.0% |
| Bio, Nature & Agricultural | 0 | 0.0% |
| Physical & Health Sciences | 0 | 0.0% |
| Psychology | 0 | 0.0% |
| Social Sciences | 0 | 0.0% |
| Engineering | 2 | 7.4% |
| Multidisciplinary Studies | 0 | 0.0% |
| Science & Technology | 5 | 18.5% |
| Business | 1 | 3.7% |
| Education | 6 | 22.2% |
| Literature & Languages | 0 | 0.0% |
| Liberal Arts & History | 0 | 0.0% |
| Visual & Performing Arts | 0 | 0.0% |
| Communications | 0 | 0.0% |
| Arts & Humanities | 13 | 48.1% |
| Total | 27 | 100.0% |
Transportation & Commute in Mount Lebanon
Vehicle Availability by Sex in Mount Lebanon
The most prevalent vehicle ownership categories in Mount Lebanon are males with 2 vehicles (60, accounting for 78.9%) and females with 2 vehicles (0, making up 133.3%).
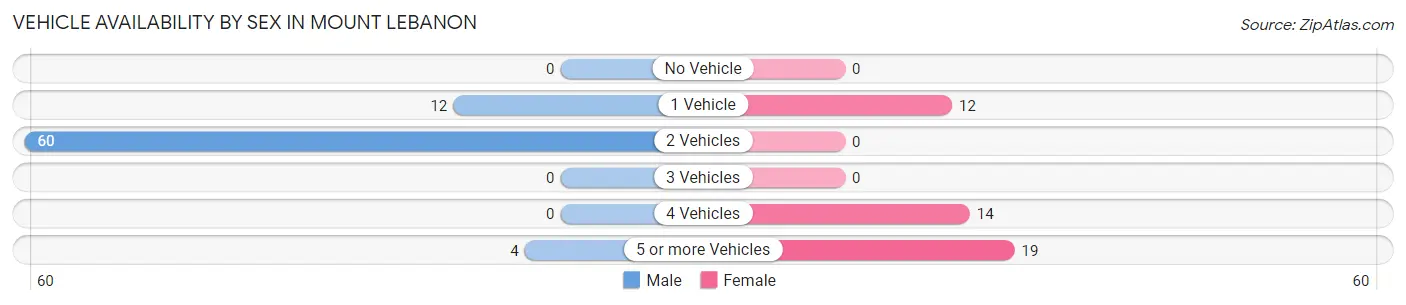
| Vehicles Available | Male | Female |
| No Vehicle | 0 (0.0%) | 0 (0.0%) |
| 1 Vehicle | 12 (15.8%) | 12 (26.7%) |
| 2 Vehicles | 60 (78.9%) | 0 (0.0%) |
| 3 Vehicles | 0 (0.0%) | 0 (0.0%) |
| 4 Vehicles | 0 (0.0%) | 14 (31.1%) |
| 5 or more Vehicles | 4 (5.3%) | 19 (42.2%) |
| Total | 76 (100.0%) | 45 (100.0%) |
Commute Time in Mount Lebanon
The most frequently occuring commute durations in Mount Lebanon are 25 to 29 minutes (60 commuters, 54.0%), 30 to 34 minutes (19 commuters, 17.1%), and 15 to 19 minutes (11 commuters, 9.9%).
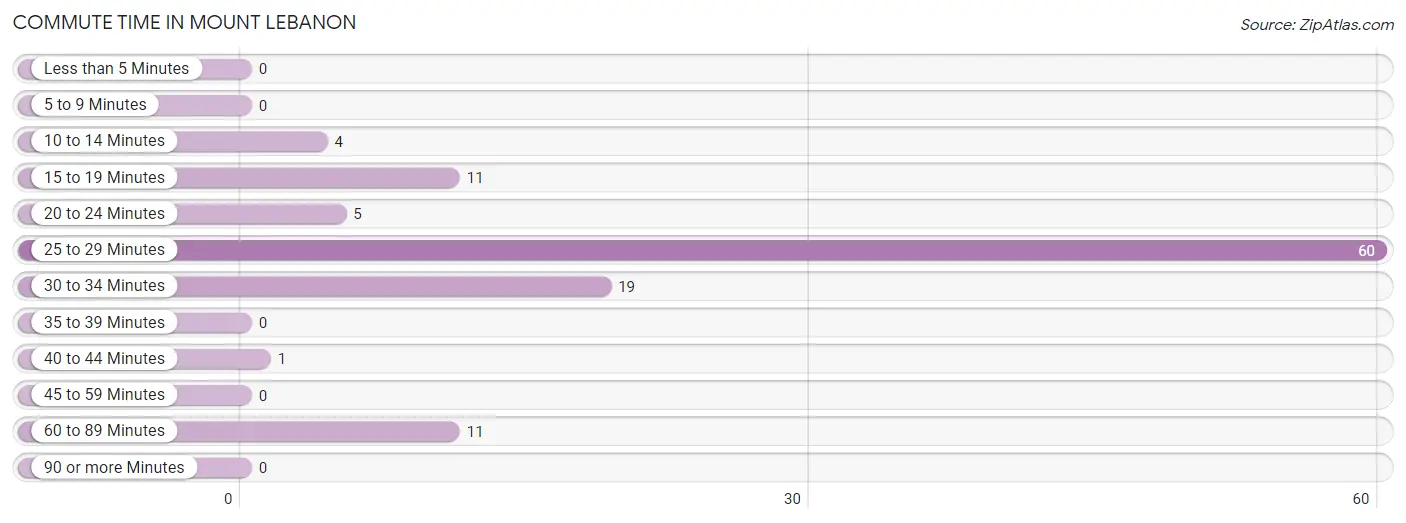
| Commute Time | # Commuters | % Commuters |
| Less than 5 Minutes | 0 | 0.0% |
| 5 to 9 Minutes | 0 | 0.0% |
| 10 to 14 Minutes | 4 | 3.6% |
| 15 to 19 Minutes | 11 | 9.9% |
| 20 to 24 Minutes | 5 | 4.5% |
| 25 to 29 Minutes | 60 | 54.0% |
| 30 to 34 Minutes | 19 | 17.1% |
| 35 to 39 Minutes | 0 | 0.0% |
| 40 to 44 Minutes | 1 | 0.9% |
| 45 to 59 Minutes | 0 | 0.0% |
| 60 to 89 Minutes | 11 | 9.9% |
| 90 or more Minutes | 0 | 0.0% |
Commute Time by Sex in Mount Lebanon
The most common commute times in Mount Lebanon are 25 to 29 minutes (60 commuters, 90.9%) for males and 30 to 34 minutes (19 commuters, 42.2%) for females.
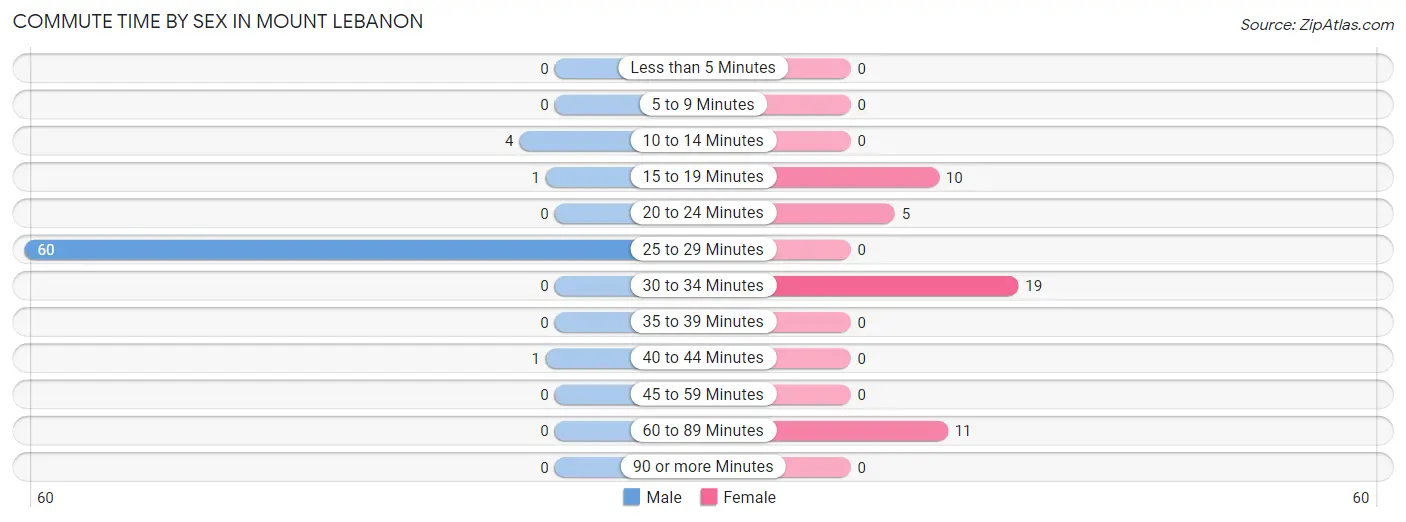
| Commute Time | Male | Female |
| Less than 5 Minutes | 0 (0.0%) | 0 (0.0%) |
| 5 to 9 Minutes | 0 (0.0%) | 0 (0.0%) |
| 10 to 14 Minutes | 4 (6.1%) | 0 (0.0%) |
| 15 to 19 Minutes | 1 (1.5%) | 10 (22.2%) |
| 20 to 24 Minutes | 0 (0.0%) | 5 (11.1%) |
| 25 to 29 Minutes | 60 (90.9%) | 0 (0.0%) |
| 30 to 34 Minutes | 0 (0.0%) | 19 (42.2%) |
| 35 to 39 Minutes | 0 (0.0%) | 0 (0.0%) |
| 40 to 44 Minutes | 1 (1.5%) | 0 (0.0%) |
| 45 to 59 Minutes | 0 (0.0%) | 0 (0.0%) |
| 60 to 89 Minutes | 0 (0.0%) | 11 (24.4%) |
| 90 or more Minutes | 0 (0.0%) | 0 (0.0%) |
Time of Departure to Work by Sex in Mount Lebanon
The most frequent times of departure to work in Mount Lebanon are 11:00 AM to 11:59 AM (60, 90.9%) for males and 7:00 AM to 7:29 AM (16, 35.6%) for females.
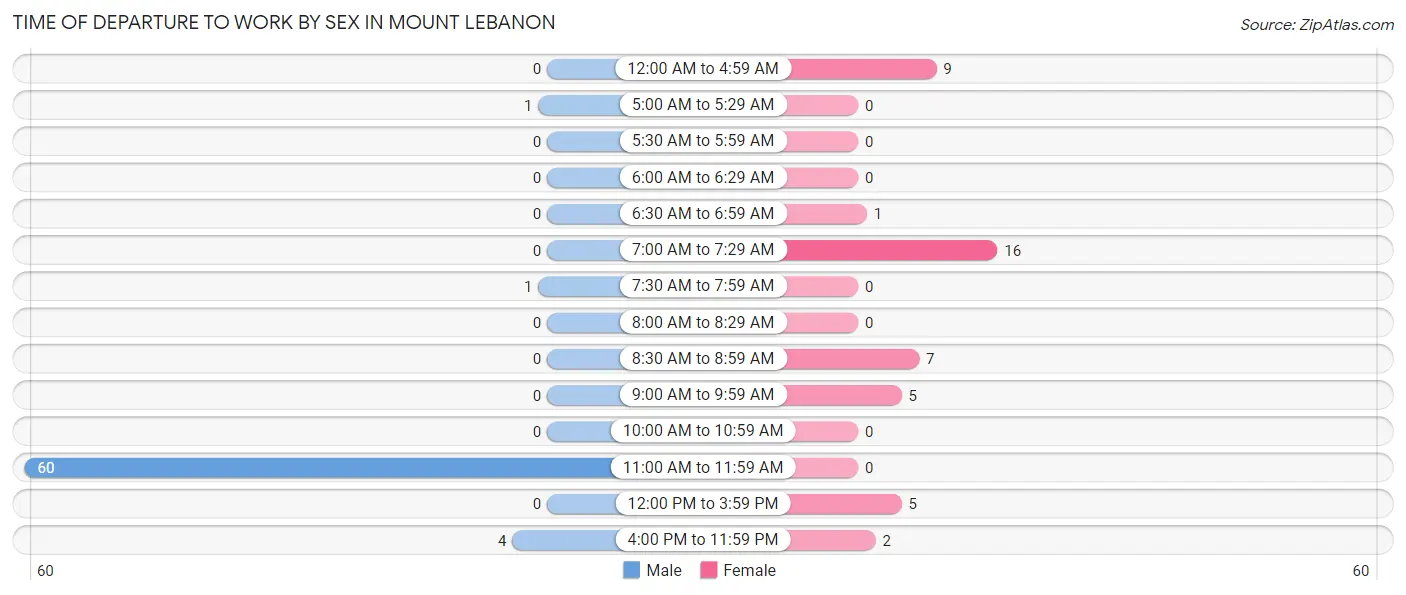
| Time of Departure | Male | Female |
| 12:00 AM to 4:59 AM | 0 (0.0%) | 9 (20.0%) |
| 5:00 AM to 5:29 AM | 1 (1.5%) | 0 (0.0%) |
| 5:30 AM to 5:59 AM | 0 (0.0%) | 0 (0.0%) |
| 6:00 AM to 6:29 AM | 0 (0.0%) | 0 (0.0%) |
| 6:30 AM to 6:59 AM | 0 (0.0%) | 1 (2.2%) |
| 7:00 AM to 7:29 AM | 0 (0.0%) | 16 (35.6%) |
| 7:30 AM to 7:59 AM | 1 (1.5%) | 0 (0.0%) |
| 8:00 AM to 8:29 AM | 0 (0.0%) | 0 (0.0%) |
| 8:30 AM to 8:59 AM | 0 (0.0%) | 7 (15.6%) |
| 9:00 AM to 9:59 AM | 0 (0.0%) | 5 (11.1%) |
| 10:00 AM to 10:59 AM | 0 (0.0%) | 0 (0.0%) |
| 11:00 AM to 11:59 AM | 60 (90.9%) | 0 (0.0%) |
| 12:00 PM to 3:59 PM | 0 (0.0%) | 5 (11.1%) |
| 4:00 PM to 11:59 PM | 4 (6.1%) | 2 (4.4%) |
| Total | 66 (100.0%) | 45 (100.0%) |
Housing Occupancy in Mount Lebanon
Occupancy by Ownership in Mount Lebanon
Of the total 51 dwellings in Mount Lebanon, owner-occupied units account for 39 (76.5%), while renter-occupied units make up 12 (23.5%).
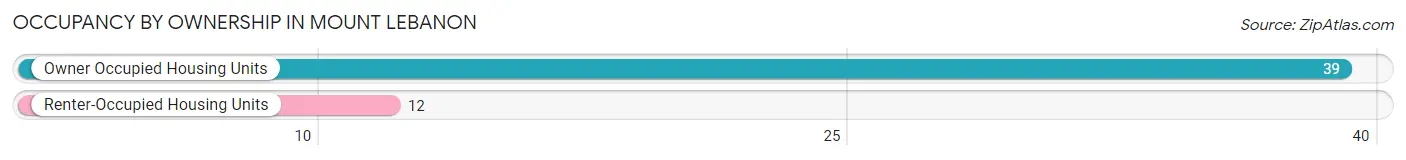
| Occupancy | # Housing Units | % Housing Units |
| Owner Occupied Housing Units | 39 | 76.5% |
| Renter-Occupied Housing Units | 12 | 23.5% |
| Total Occupied Housing Units | 51 | 100.0% |
Occupancy by Household Size in Mount Lebanon
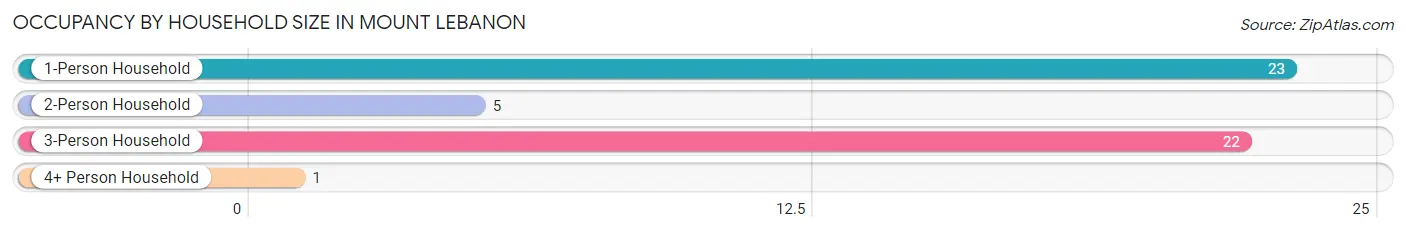
| Household Size | # Housing Units | % Housing Units |
| 1-Person Household | 23 | 45.1% |
| 2-Person Household | 5 | 9.8% |
| 3-Person Household | 22 | 43.1% |
| 4+ Person Household | 1 | 2.0% |
| Total Housing Units | 51 | 100.0% |
Occupancy by Ownership by Household Size in Mount Lebanon
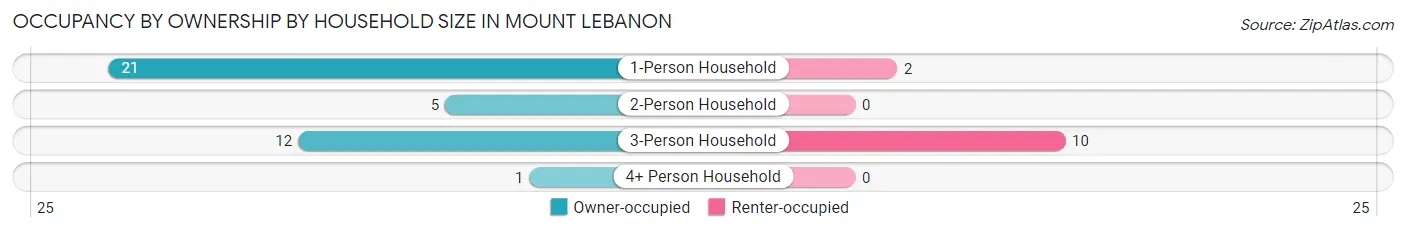
| Household Size | Owner-occupied | Renter-occupied |
| 1-Person Household | 21 (91.3%) | 2 (8.7%) |
| 2-Person Household | 5 (100.0%) | 0 (0.0%) |
| 3-Person Household | 12 (54.5%) | 10 (45.5%) |
| 4+ Person Household | 1 (100.0%) | 0 (0.0%) |
| Total Housing Units | 39 (76.5%) | 12 (23.5%) |
Occupancy by Educational Attainment in Mount Lebanon
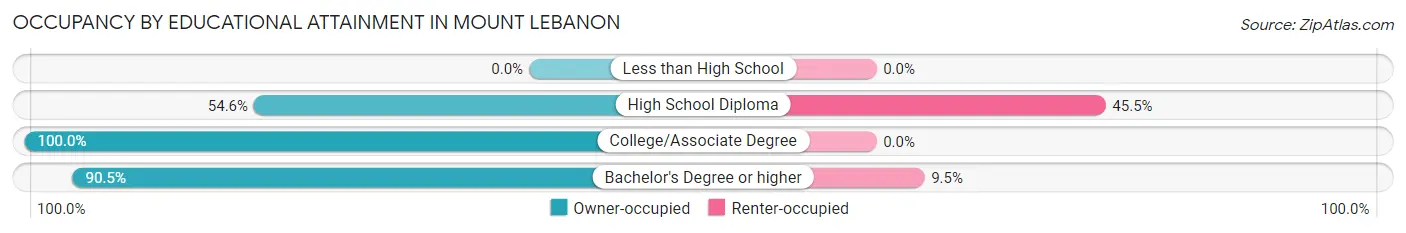
| Household Size | Owner-occupied | Renter-occupied |
| Less than High School | 0 (0.0%) | 0 (0.0%) |
| High School Diploma | 12 (54.5%) | 10 (45.5%) |
| College/Associate Degree | 8 (100.0%) | 0 (0.0%) |
| Bachelor's Degree or higher | 19 (90.5%) | 2 (9.5%) |
Occupancy by Age of Householder in Mount Lebanon
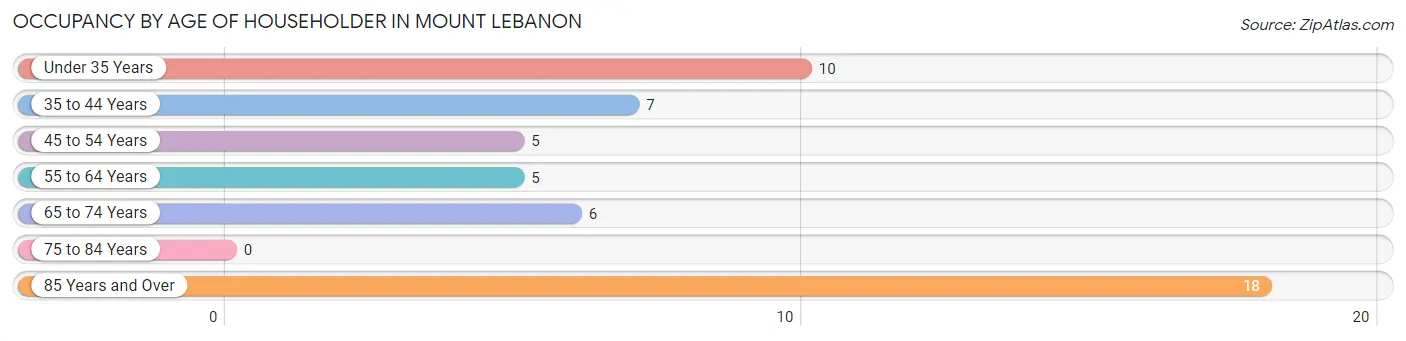
| Age Bracket | # Households | % Households |
| Under 35 Years | 10 | 19.6% |
| 35 to 44 Years | 7 | 13.7% |
| 45 to 54 Years | 5 | 9.8% |
| 55 to 64 Years | 5 | 9.8% |
| 65 to 74 Years | 6 | 11.8% |
| 75 to 84 Years | 0 | 0.0% |
| 85 Years and Over | 18 | 35.3% |
| Total | 51 | 100.0% |
Housing Finances in Mount Lebanon
Median Income by Occupancy in Mount Lebanon
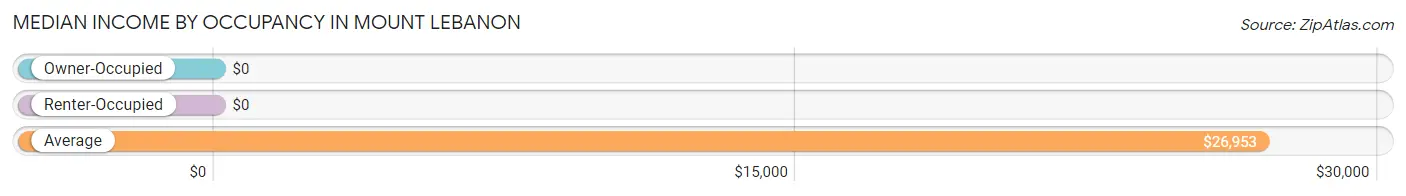
| Occupancy Type | # Households | Median Income |
| Owner-Occupied | 39 (76.5%) | $0 |
| Renter-Occupied | 12 (23.5%) | $0 |
| Average | 51 (100.0%) | $26,953 |
Occupancy by Householder Income Bracket in Mount Lebanon
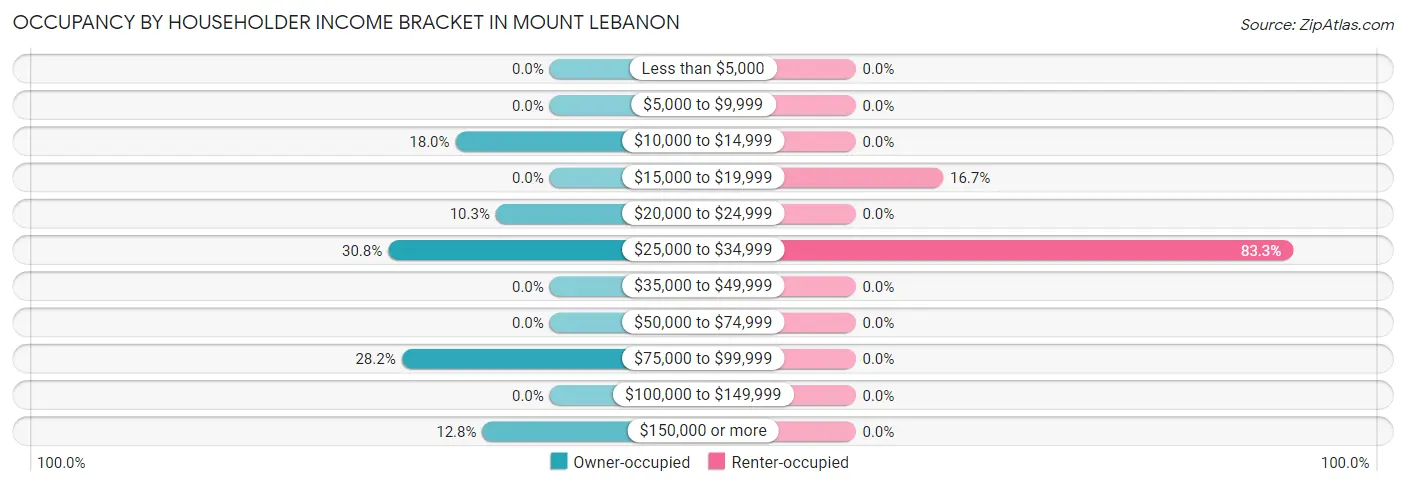
| Income Bracket | Owner-occupied | Renter-occupied |
| Less than $5,000 | 0 (0.0%) | 0 (0.0%) |
| $5,000 to $9,999 | 0 (0.0%) | 0 (0.0%) |
| $10,000 to $14,999 | 7 (17.9%) | 0 (0.0%) |
| $15,000 to $19,999 | 0 (0.0%) | 2 (16.7%) |
| $20,000 to $24,999 | 4 (10.3%) | 0 (0.0%) |
| $25,000 to $34,999 | 12 (30.8%) | 10 (83.3%) |
| $35,000 to $49,999 | 0 (0.0%) | 0 (0.0%) |
| $50,000 to $74,999 | 0 (0.0%) | 0 (0.0%) |
| $75,000 to $99,999 | 11 (28.2%) | 0 (0.0%) |
| $100,000 to $149,999 | 0 (0.0%) | 0 (0.0%) |
| $150,000 or more | 5 (12.8%) | 0 (0.0%) |
| Total | 39 (100.0%) | 12 (100.0%) |
Monthly Housing Cost Tiers in Mount Lebanon
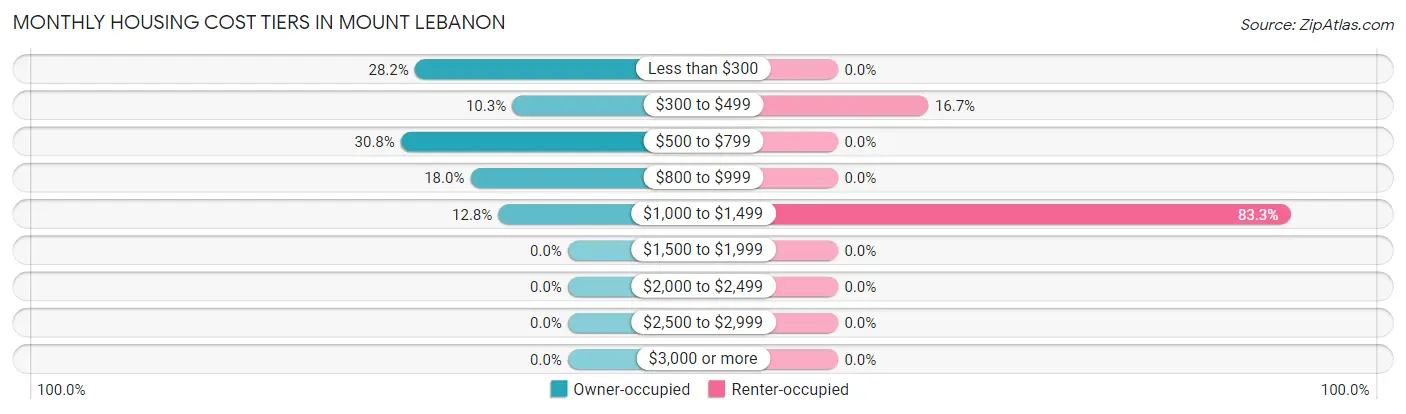
| Monthly Cost | Owner-occupied | Renter-occupied |
| Less than $300 | 11 (28.2%) | 0 (0.0%) |
| $300 to $499 | 4 (10.3%) | 2 (16.7%) |
| $500 to $799 | 12 (30.8%) | 0 (0.0%) |
| $800 to $999 | 7 (17.9%) | 0 (0.0%) |
| $1,000 to $1,499 | 5 (12.8%) | 10 (83.3%) |
| $1,500 to $1,999 | 0 (0.0%) | 0 (0.0%) |
| $2,000 to $2,499 | 0 (0.0%) | 0 (0.0%) |
| $2,500 to $2,999 | 0 (0.0%) | 0 (0.0%) |
| $3,000 or more | 0 (0.0%) | 0 (0.0%) |
| Total | 39 (100.0%) | 12 (100.0%) |
Physical Housing Characteristics in Mount Lebanon
Housing Structures in Mount Lebanon
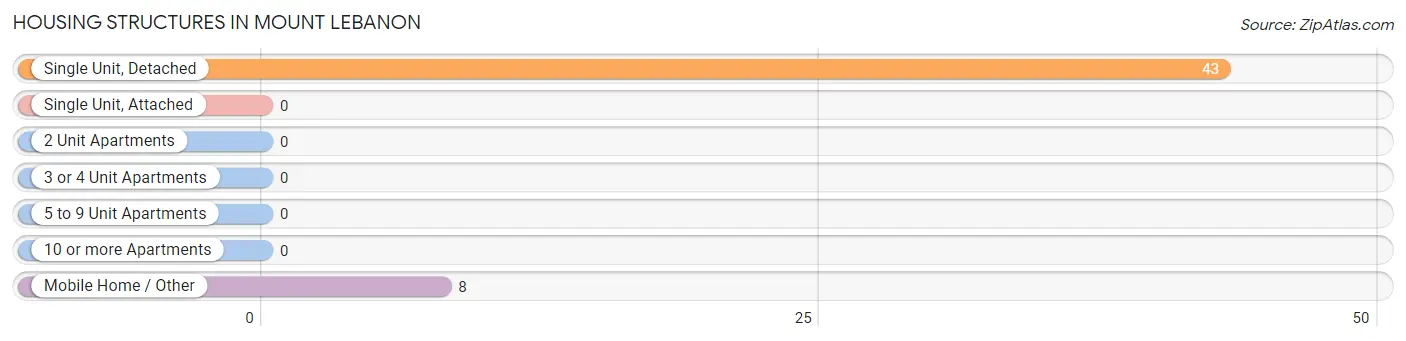
| Structure Type | # Housing Units | % Housing Units |
| Single Unit, Detached | 43 | 84.3% |
| Single Unit, Attached | 0 | 0.0% |
| 2 Unit Apartments | 0 | 0.0% |
| 3 or 4 Unit Apartments | 0 | 0.0% |
| 5 to 9 Unit Apartments | 0 | 0.0% |
| 10 or more Apartments | 0 | 0.0% |
| Mobile Home / Other | 8 | 15.7% |
| Total | 51 | 100.0% |
Housing Structures by Occupancy in Mount Lebanon
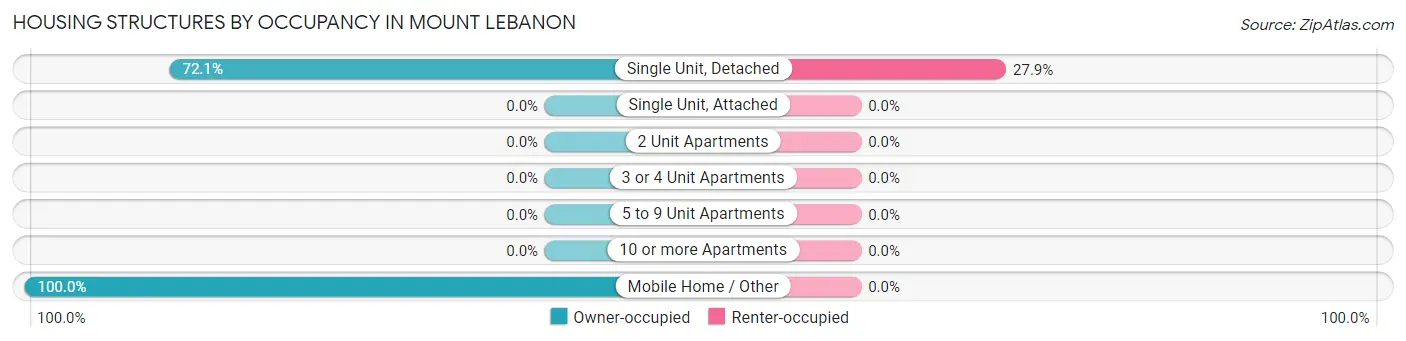
| Structure Type | Owner-occupied | Renter-occupied |
| Single Unit, Detached | 31 (72.1%) | 12 (27.9%) |
| Single Unit, Attached | 0 (0.0%) | 0 (0.0%) |
| 2 Unit Apartments | 0 (0.0%) | 0 (0.0%) |
| 3 or 4 Unit Apartments | 0 (0.0%) | 0 (0.0%) |
| 5 to 9 Unit Apartments | 0 (0.0%) | 0 (0.0%) |
| 10 or more Apartments | 0 (0.0%) | 0 (0.0%) |
| Mobile Home / Other | 8 (100.0%) | 0 (0.0%) |
| Total | 39 (76.5%) | 12 (23.5%) |
Housing Structures by Number of Rooms in Mount Lebanon
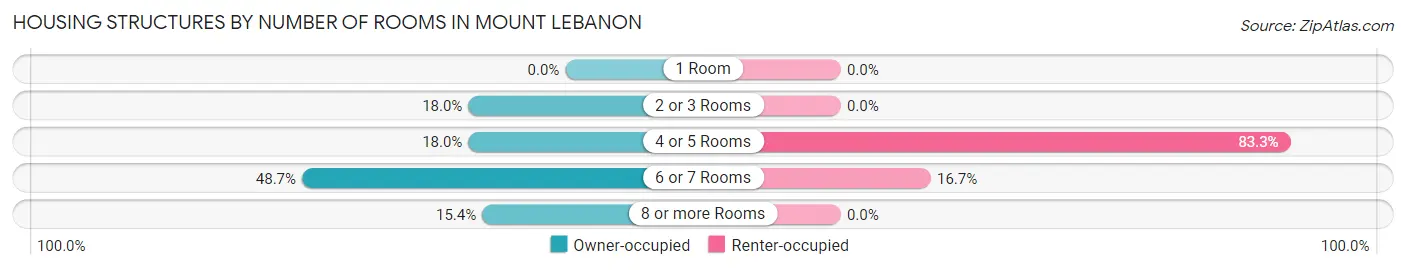
| Number of Rooms | Owner-occupied | Renter-occupied |
| 1 Room | 0 (0.0%) | 0 (0.0%) |
| 2 or 3 Rooms | 7 (17.9%) | 0 (0.0%) |
| 4 or 5 Rooms | 7 (17.9%) | 10 (83.3%) |
| 6 or 7 Rooms | 19 (48.7%) | 2 (16.7%) |
| 8 or more Rooms | 6 (15.4%) | 0 (0.0%) |
| Total | 39 (100.0%) | 12 (100.0%) |
Housing Structure by Heating Type in Mount Lebanon
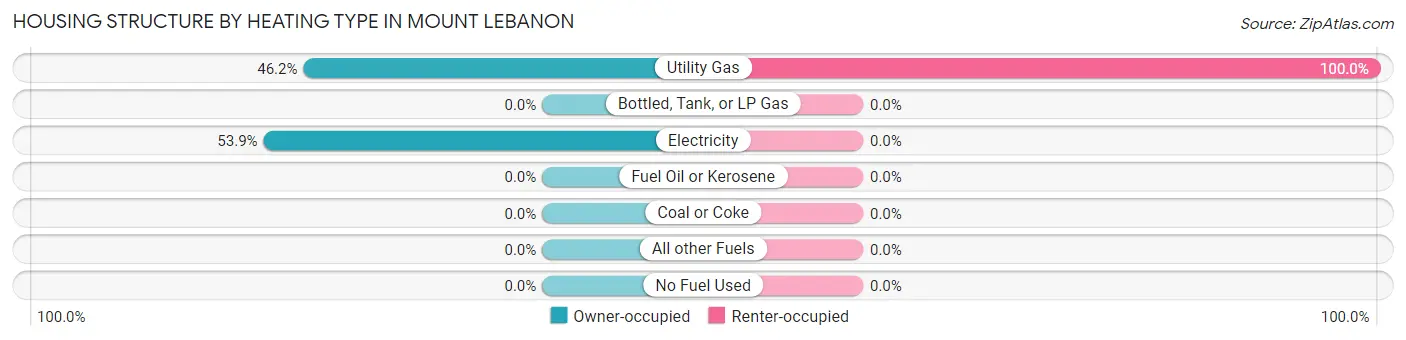
| Heating Type | Owner-occupied | Renter-occupied |
| Utility Gas | 18 (46.2%) | 12 (100.0%) |
| Bottled, Tank, or LP Gas | 0 (0.0%) | 0 (0.0%) |
| Electricity | 21 (53.8%) | 0 (0.0%) |
| Fuel Oil or Kerosene | 0 (0.0%) | 0 (0.0%) |
| Coal or Coke | 0 (0.0%) | 0 (0.0%) |
| All other Fuels | 0 (0.0%) | 0 (0.0%) |
| No Fuel Used | 0 (0.0%) | 0 (0.0%) |
| Total | 39 (100.0%) | 12 (100.0%) |
Household Vehicle Usage in Mount Lebanon
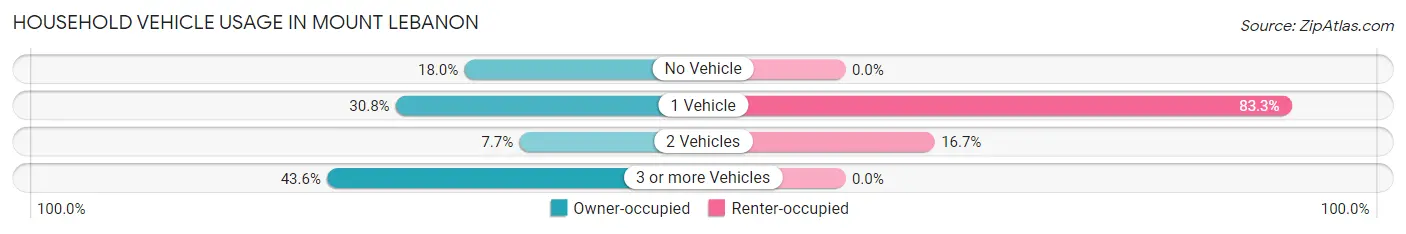
| Vehicles per Household | Owner-occupied | Renter-occupied |
| No Vehicle | 7 (17.9%) | 0 (0.0%) |
| 1 Vehicle | 12 (30.8%) | 10 (83.3%) |
| 2 Vehicles | 3 (7.7%) | 2 (16.7%) |
| 3 or more Vehicles | 17 (43.6%) | 0 (0.0%) |
| Total | 39 (100.0%) | 12 (100.0%) |
Real Estate & Mortgages in Mount Lebanon
Real Estate and Mortgage Overview in Mount Lebanon
| Characteristic | Without Mortgage | With Mortgage |
| Housing Units | 23 | 16 |
| Median Property Value | $179,200 | $0 |
| Median Household Income | $26,875 | $5 |
| Monthly Housing Costs | $308 | $0 |
| Real Estate Taxes | $700 | $11 |
Property Value by Mortgage Status in Mount Lebanon
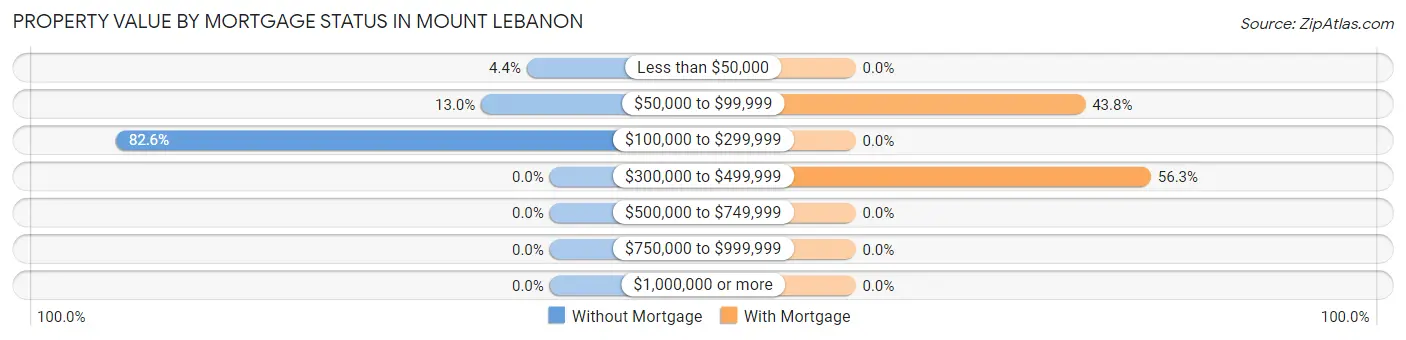
| Property Value | Without Mortgage | With Mortgage |
| Less than $50,000 | 1 (4.3%) | 0 (0.0%) |
| $50,000 to $99,999 | 3 (13.0%) | 7 (43.8%) |
| $100,000 to $299,999 | 19 (82.6%) | 0 (0.0%) |
| $300,000 to $499,999 | 0 (0.0%) | 9 (56.2%) |
| $500,000 to $749,999 | 0 (0.0%) | 0 (0.0%) |
| $750,000 to $999,999 | 0 (0.0%) | 0 (0.0%) |
| $1,000,000 or more | 0 (0.0%) | 0 (0.0%) |
| Total | 23 (100.0%) | 16 (100.0%) |
Household Income by Mortgage Status in Mount Lebanon
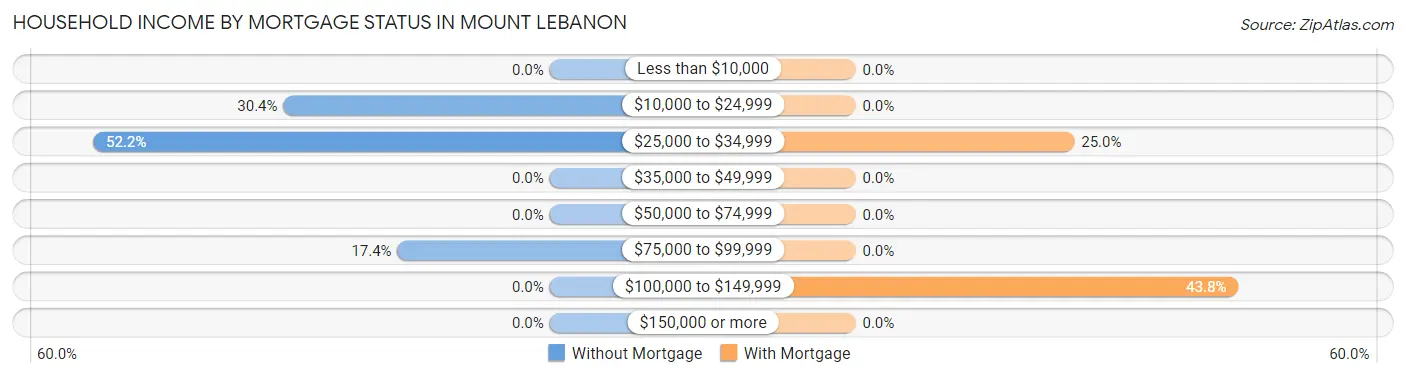
| Household Income | Without Mortgage | With Mortgage |
| Less than $10,000 | 0 (0.0%) | 0 (0.0%) |
| $10,000 to $24,999 | 7 (30.4%) | 0 (0.0%) |
| $25,000 to $34,999 | 12 (52.2%) | 4 (25.0%) |
| $35,000 to $49,999 | 0 (0.0%) | 0 (0.0%) |
| $50,000 to $74,999 | 0 (0.0%) | 0 (0.0%) |
| $75,000 to $99,999 | 4 (17.4%) | 0 (0.0%) |
| $100,000 to $149,999 | 0 (0.0%) | 7 (43.8%) |
| $150,000 or more | 0 (0.0%) | 0 (0.0%) |
| Total | 23 (100.0%) | 16 (100.0%) |
Property Value to Household Income Ratio in Mount Lebanon
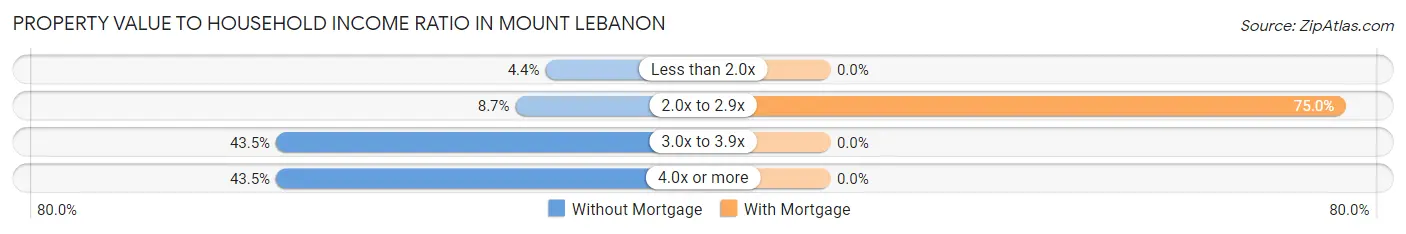
| Value-to-Income Ratio | Without Mortgage | With Mortgage |
| Less than 2.0x | 1 (4.3%) | 0 (0.0%) |
| 2.0x to 2.9x | 2 (8.7%) | 12 (75.0%) |
| 3.0x to 3.9x | 10 (43.5%) | 0 (0.0%) |
| 4.0x or more | 10 (43.5%) | 0 (0.0%) |
| Total | 23 (100.0%) | 16 (100.0%) |
Real Estate Taxes by Mortgage Status in Mount Lebanon
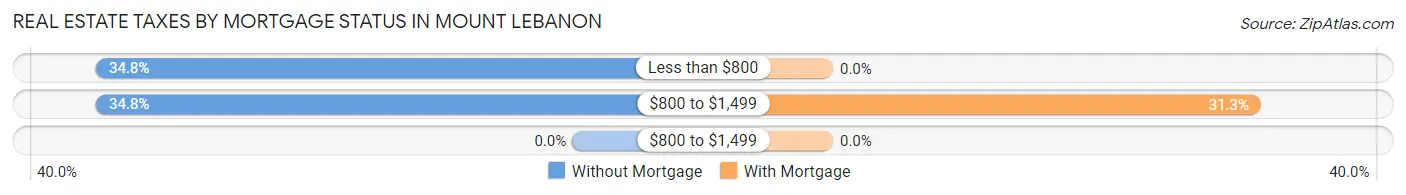
| Property Taxes | Without Mortgage | With Mortgage |
| Less than $800 | 8 (34.8%) | 0 (0.0%) |
| $800 to $1,499 | 8 (34.8%) | 5 (31.2%) |
| $800 to $1,499 | 0 (0.0%) | 0 (0.0%) |
| Total | 23 (100.0%) | 16 (100.0%) |
Health & Disability in Mount Lebanon
Health Insurance Coverage by Age in Mount Lebanon
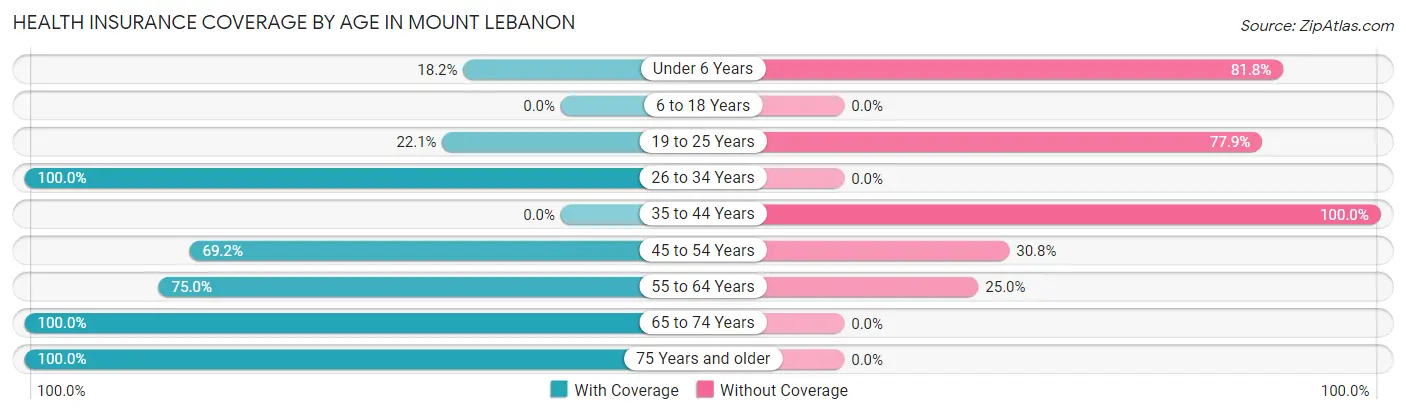
| Age Bracket | With Coverage | Without Coverage |
| Under 6 Years | 2 (18.2%) | 9 (81.8%) |
| 6 to 18 Years | 0 (0.0%) | 0 (0.0%) |
| 19 to 25 Years | 17 (22.1%) | 60 (77.9%) |
| 26 to 34 Years | 26 (100.0%) | 0 (0.0%) |
| 35 to 44 Years | 0 (0.0%) | 7 (100.0%) |
| 45 to 54 Years | 9 (69.2%) | 4 (30.8%) |
| 55 to 64 Years | 6 (75.0%) | 2 (25.0%) |
| 65 to 74 Years | 7 (100.0%) | 0 (0.0%) |
| 75 Years and older | 18 (100.0%) | 0 (0.0%) |
| Total | 85 (50.9%) | 82 (49.1%) |
Health Insurance Coverage by Citizenship Status in Mount Lebanon
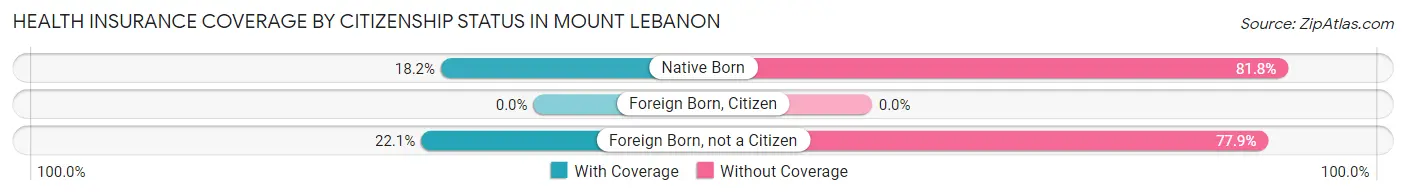
| Citizenship Status | With Coverage | Without Coverage |
| Native Born | 2 (18.2%) | 9 (81.8%) |
| Foreign Born, Citizen | 0 (0.0%) | 0 (0.0%) |
| Foreign Born, not a Citizen | 17 (22.1%) | 60 (77.9%) |
Health Insurance Coverage by Household Income in Mount Lebanon
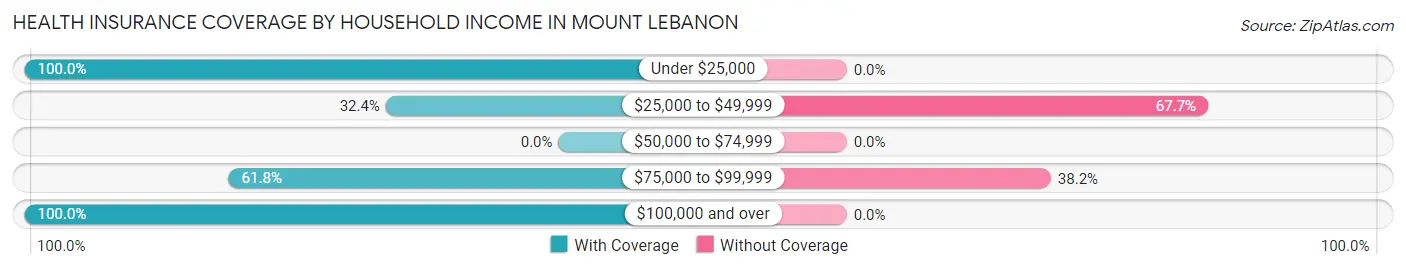
| Household Income | With Coverage | Without Coverage |
| Under $25,000 | 13 (100.0%) | 0 (0.0%) |
| $25,000 to $49,999 | 33 (32.4%) | 69 (67.6%) |
| $50,000 to $74,999 | 0 (0.0%) | 0 (0.0%) |
| $75,000 to $99,999 | 21 (61.8%) | 13 (38.2%) |
| $100,000 and over | 18 (100.0%) | 0 (0.0%) |
Public vs Private Health Insurance Coverage by Age in Mount Lebanon
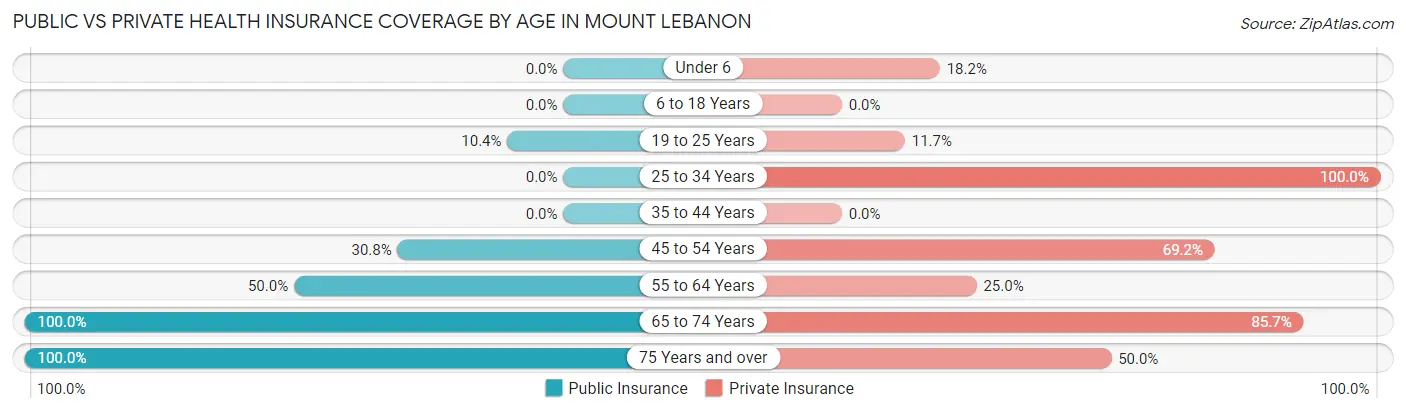
| Age Bracket | Public Insurance | Private Insurance |
| Under 6 | 0 (0.0%) | 2 (18.2%) |
| 6 to 18 Years | 0 (0.0%) | 0 (0.0%) |
| 19 to 25 Years | 8 (10.4%) | 9 (11.7%) |
| 25 to 34 Years | 0 (0.0%) | 26 (100.0%) |
| 35 to 44 Years | 0 (0.0%) | 0 (0.0%) |
| 45 to 54 Years | 4 (30.8%) | 9 (69.2%) |
| 55 to 64 Years | 4 (50.0%) | 2 (25.0%) |
| 65 to 74 Years | 7 (100.0%) | 6 (85.7%) |
| 75 Years and over | 18 (100.0%) | 9 (50.0%) |
| Total | 41 (24.5%) | 63 (37.7%) |
Disability Status by Sex by Age in Mount Lebanon
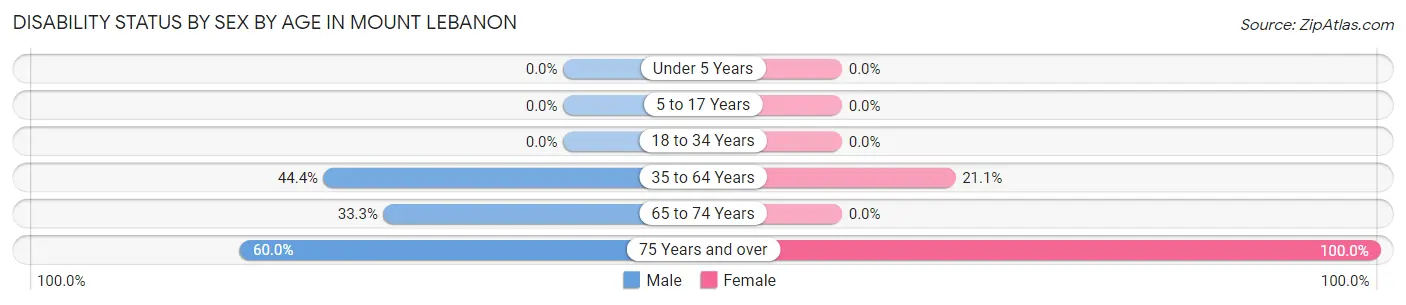
| Age Bracket | Male | Female |
| Under 5 Years | 0 (0.0%) | 0 (0.0%) |
| 5 to 17 Years | 0 (0.0%) | 0 (0.0%) |
| 18 to 34 Years | 0 (0.0%) | 0 (0.0%) |
| 35 to 64 Years | 4 (44.4%) | 4 (21.0%) |
| 65 to 74 Years | 1 (33.3%) | 0 (0.0%) |
| 75 Years and over | 3 (60.0%) | 13 (100.0%) |
Disability Class by Sex by Age in Mount Lebanon
Disability Class: Hearing Difficulty
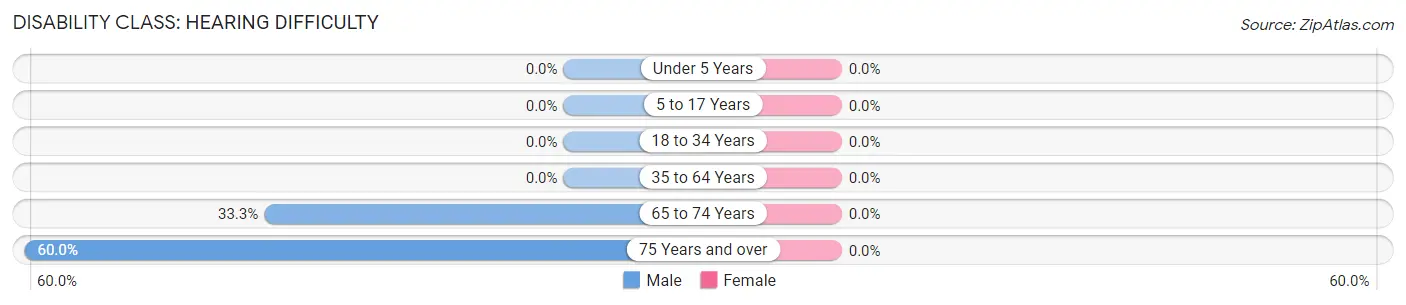
| Age Bracket | Male | Female |
| Under 5 Years | 0 (0.0%) | 0 (0.0%) |
| 5 to 17 Years | 0 (0.0%) | 0 (0.0%) |
| 18 to 34 Years | 0 (0.0%) | 0 (0.0%) |
| 35 to 64 Years | 0 (0.0%) | 0 (0.0%) |
| 65 to 74 Years | 1 (33.3%) | 0 (0.0%) |
| 75 Years and over | 3 (60.0%) | 0 (0.0%) |
Disability Class: Vision Difficulty
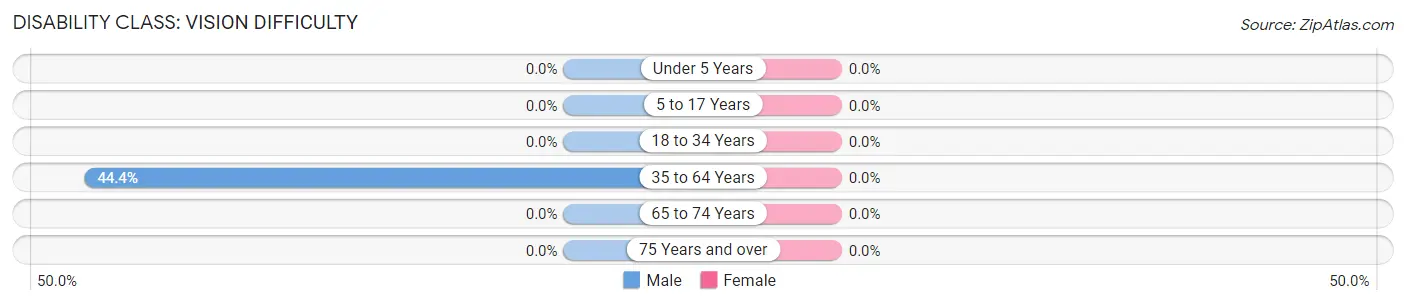
| Age Bracket | Male | Female |
| Under 5 Years | 0 (0.0%) | 0 (0.0%) |
| 5 to 17 Years | 0 (0.0%) | 0 (0.0%) |
| 18 to 34 Years | 0 (0.0%) | 0 (0.0%) |
| 35 to 64 Years | 4 (44.4%) | 0 (0.0%) |
| 65 to 74 Years | 0 (0.0%) | 0 (0.0%) |
| 75 Years and over | 0 (0.0%) | 0 (0.0%) |
Disability Class: Cognitive Difficulty
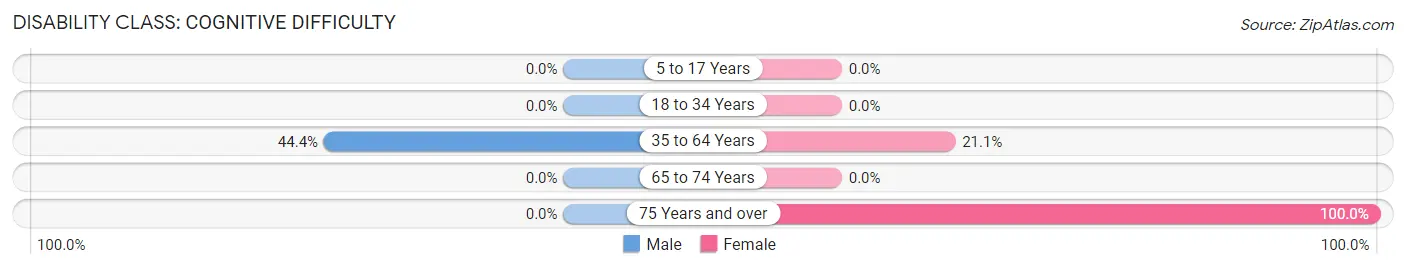
| Age Bracket | Male | Female |
| 5 to 17 Years | 0 (0.0%) | 0 (0.0%) |
| 18 to 34 Years | 0 (0.0%) | 0 (0.0%) |
| 35 to 64 Years | 4 (44.4%) | 4 (21.0%) |
| 65 to 74 Years | 0 (0.0%) | 0 (0.0%) |
| 75 Years and over | 0 (0.0%) | 13 (100.0%) |
Disability Class: Ambulatory Difficulty
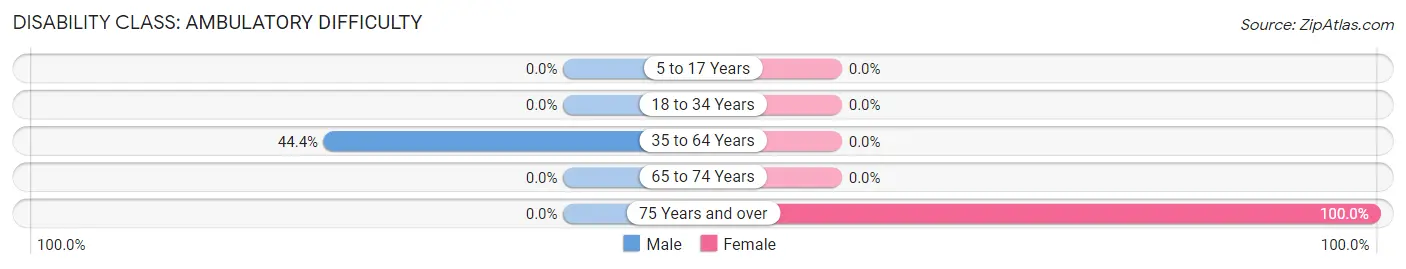
| Age Bracket | Male | Female |
| 5 to 17 Years | 0 (0.0%) | 0 (0.0%) |
| 18 to 34 Years | 0 (0.0%) | 0 (0.0%) |
| 35 to 64 Years | 4 (44.4%) | 0 (0.0%) |
| 65 to 74 Years | 0 (0.0%) | 0 (0.0%) |
| 75 Years and over | 0 (0.0%) | 13 (100.0%) |
Disability Class: Self-Care Difficulty
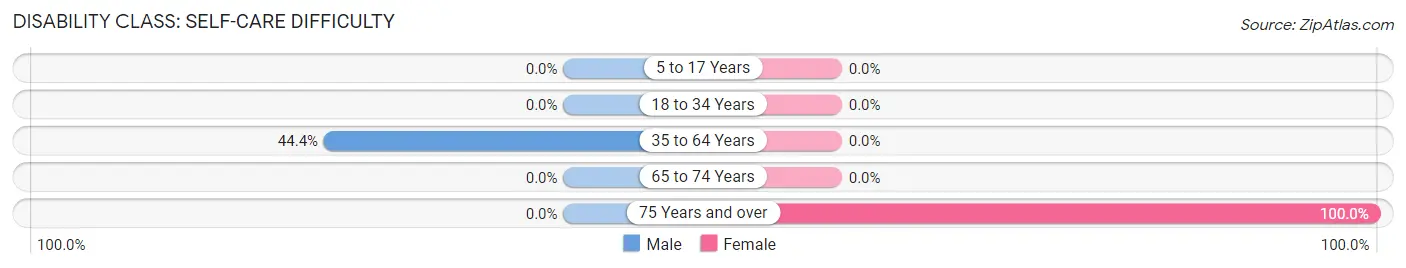
| Age Bracket | Male | Female |
| 5 to 17 Years | 0 (0.0%) | 0 (0.0%) |
| 18 to 34 Years | 0 (0.0%) | 0 (0.0%) |
| 35 to 64 Years | 4 (44.4%) | 0 (0.0%) |
| 65 to 74 Years | 0 (0.0%) | 0 (0.0%) |
| 75 Years and over | 0 (0.0%) | 13 (100.0%) |
Technology Access in Mount Lebanon
Computing Device Access in Mount Lebanon
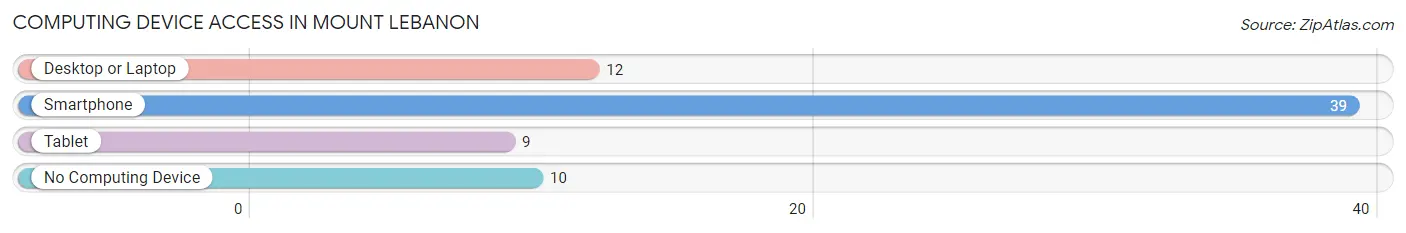
| Device Type | # Households | % Households |
| Desktop or Laptop | 12 | 23.5% |
| Smartphone | 39 | 76.5% |
| Tablet | 9 | 17.6% |
| No Computing Device | 10 | 19.6% |
| Total | 51 | 100.0% |
Internet Access in Mount Lebanon
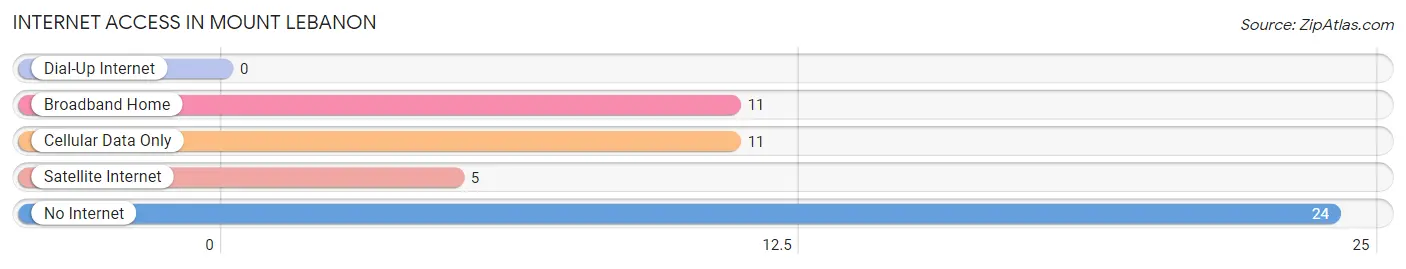
| Internet Type | # Households | % Households |
| Dial-Up Internet | 0 | 0.0% |
| Broadband Home | 11 | 21.6% |
| Cellular Data Only | 11 | 21.6% |
| Satellite Internet | 5 | 9.8% |
| No Internet | 24 | 47.1% |
| Total | 51 | 100.0% |
Mount Lebanon Summary
Lebanon, Louisiana is a small town located in the northern part of the state, just south of the Arkansas border. It is part of the Shreveport-Bossier City metropolitan area and is home to a population of just over 1,000 people. The town is known for its rural charm and its close proximity to the Red River.
History
Lebanon was founded in 1836 by a group of settlers from Tennessee. The town was named after the biblical city of Lebanon, which was located in the ancient Middle East. The settlers were attracted to the area due to its fertile soil and abundant timber. The town quickly grew and by the late 1800s, it had become a thriving agricultural center.
In the early 1900s, the town began to experience a decline in population as many of its residents moved away in search of better economic opportunities. This trend continued until the 1950s when the town began to experience a resurgence in population growth. This was due in part to the construction of the nearby Red River Army Depot, which provided jobs for many of the town’s residents.
Geography
Lebanon is located in the northern part of Louisiana, just south of the Arkansas border. It is situated in the Red River Valley, which is a fertile agricultural region. The town is surrounded by rolling hills and is located near the Red River. The town is also located near the Sabine National Forest, which provides a variety of outdoor recreational opportunities.
Economy
Lebanon’s economy is largely based on agriculture. The town is home to several farms that produce a variety of crops, including cotton, soybeans, corn, and wheat. The town is also home to several small businesses, including a grocery store, a hardware store, and a few restaurants.
Demographics
As of the 2010 census, Lebanon had a population of 1,072 people. The racial makeup of the town was 94.3% White, 2.7% African American, 0.3% Native American, 0.2% Asian, 0.1% Pacific Islander, and 2.4% from other races. The median household income was $31,250 and the median family income was $37,500.
Conclusion
Lebanon, Louisiana is a small town located in the northern part of the state, just south of the Arkansas border. It is part of the Shreveport-Bossier City metropolitan area and is home to a population of just over 1,000 people. The town is known for its rural charm and its close proximity to the Red River. The town’s economy is largely based on agriculture and it is home to several small businesses. The town’s population is mostly White, with a small percentage of African Americans, Native Americans, Asians, and Pacific Islanders.
Common Questions
What is Per Capita Income in Mount Lebanon?
Per Capita income in Mount Lebanon is $19,475.
What is the Median Family Income in Mount Lebanon?
Median Family Income in Mount Lebanon is $50,357.
What is the Median Household income in Mount Lebanon?
Median Household Income in Mount Lebanon is $26,953.
What is Inequality or Gini Index in Mount Lebanon?
Inequality or Gini Index in Mount Lebanon is 0.44.
What is the Total Population of Mount Lebanon?
Total Population of Mount Lebanon is 167.
What is the Total Male Population of Mount Lebanon?
Total Male Population of Mount Lebanon is 98.
What is the Total Female Population of Mount Lebanon?
Total Female Population of Mount Lebanon is 69.
What is the Ratio of Males per 100 Females in Mount Lebanon?
There are 142.03 Males per 100 Females in Mount Lebanon.
What is the Ratio of Females per 100 Males in Mount Lebanon?
There are 70.41 Females per 100 Males in Mount Lebanon.
What is the Median Population Age in Mount Lebanon?
Median Population Age in Mount Lebanon is 22.0 Years.
What is the Average Family Size in Mount Lebanon
Average Family Size in Mount Lebanon is 5.0 People.
What is the Average Household Size in Mount Lebanon
Average Household Size in Mount Lebanon is 3.3 People.
How Large is the Labor Force in Mount Lebanon?
There are 121 People in the Labor Forcein in Mount Lebanon.
What is the Percentage of People in the Labor Force in Mount Lebanon?
77.6% of People are in the Labor Force in Mount Lebanon.