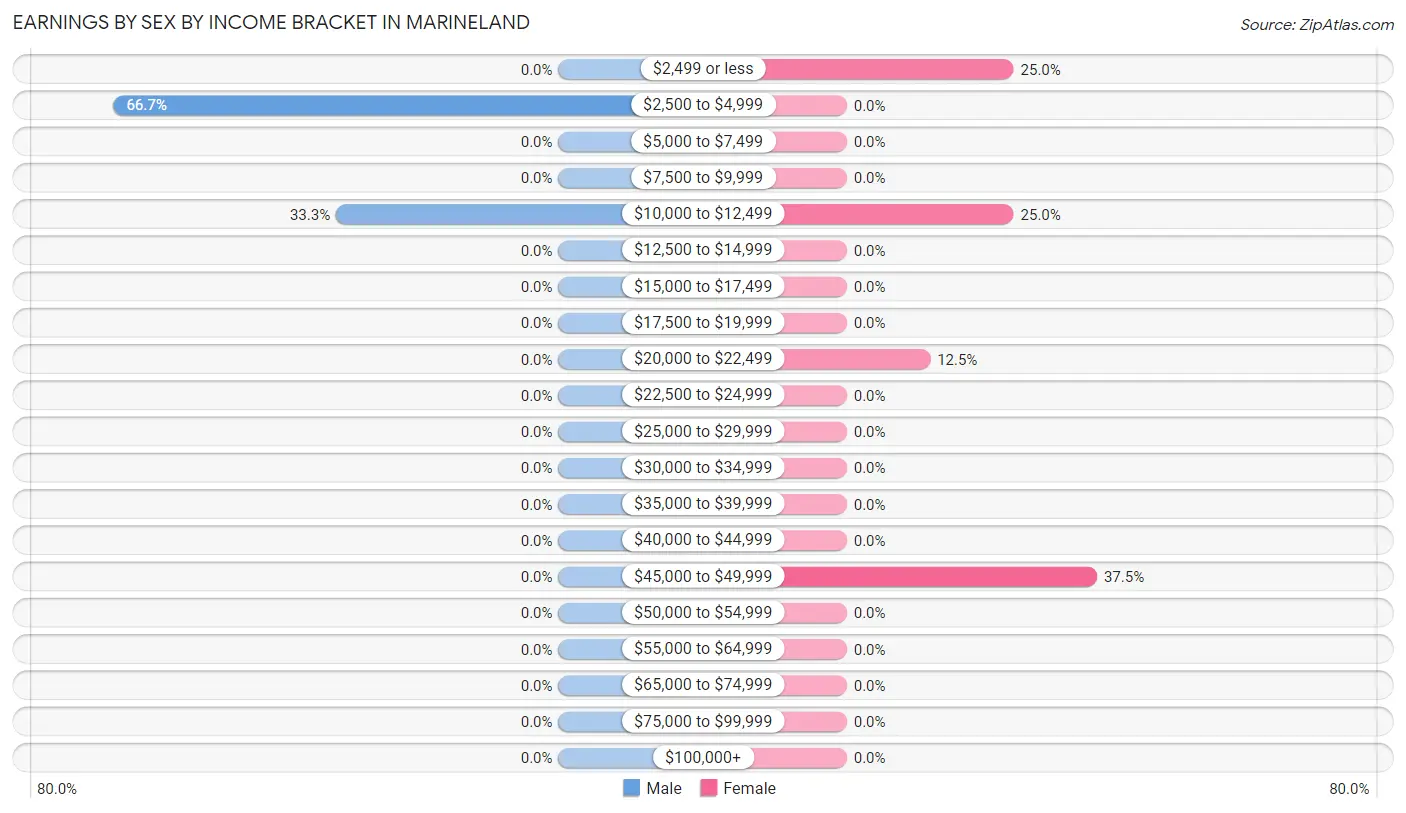
The most common earnings brackets in Marineland are $2,500 to $4,999 for men (2 | 66.7%) and $45,000 to $49,999 for women (3 | 37.5%).
Income
Male
Female
$2,499 or less
0 (0.0%)
2 (25.0%)
$2,500 to $4,999
2 (66.7%)
0 (0.0%)
$5,000 to $7,499
0 (0.0%)
0 (0.0%)
$7,500 to $9,999
0 (0.0%)
0 (0.0%)
$10,000 to $12,499
1 (33.3%)
2 (25.0%)
$12,500 to $14,999
0 (0.0%)
0 (0.0%)
$15,000 to $17,499
0 (0.0%)
0 (0.0%)
$17,500 to $19,999
0 (0.0%)
0 (0.0%)
$20,000 to $22,499
0 (0.0%)
1 (12.5%)
$22,500 to $24,999
0 (0.0%)
0 (0.0%)
$25,000 to $29,999
0 (0.0%)
0 (0.0%)
$30,000 to $34,999
0 (0.0%)
0 (0.0%)
$35,000 to $39,999
0 (0.0%)
0 (0.0%)
$40,000 to $44,999
0 (0.0%)
0 (0.0%)
$45,000 to $49,999
0 (0.0%)
3 (37.5%)
$50,000 to $54,999
0 (0.0%)
0 (0.0%)
$55,000 to $64,999
0 (0.0%)
0 (0.0%)
$65,000 to $74,999
0 (0.0%)
0 (0.0%)
$75,000 to $99,999
0 (0.0%)
0 (0.0%)
$100,000+
0 (0.0%)
0 (0.0%)
Total
3 (100.0%)
8 (100.0%)
Earnings by Sex by Educational Attainment in Marineland
Educational Attainment
Male Income
Female Income
Less than High School
-
-
High School Diploma
-
-
College or Associate's Degree
-
-
Bachelor's Degree
-
-
Graduate Degree
-
-
Total
-
-
Family Income in Marineland
Family Income Brackets in Marineland
Income Bracket
# Families
% Families
Less than $10,000
0
0.0%
$10,000 to $14,999
0
0.0%
$15,000 to $24,999
0
0.0%
$25,000 to $34,999
0
0.0%
$35,000 to $49,999
0
0.0%
$50,000 to $74,999
0
0.0%
$75,000 to $99,999
0
0.0%
$100,000 to $149,999
0
0.0%
$150,000 to $199,999
0
0.0%
$200,000+
0
0.0%
Family Income by Famaliy Size in Marineland
Income Bracket
# Families
Median Income
2-Person Families
0 (0.0%)
$0
3-Person Families
0 (0.0%)
$0
4-Person Families
0 (0.0%)
$0
5-Person Families
0 (0.0%)
$0
6-Person Families
0 (0.0%)
$0
7+ Person Families
0 (0.0%)
$0
Total
0 (0.0%)
$0
Family Income by Number of Earners in Marineland
Number of Earners
# Families
Median Income
No Earners
0 (0.0%)
$0
1 Earner
0 (0.0%)
$0
2 Earners
0 (0.0%)
$0
3+ Earners
0 (0.0%)
$0
Total
0 (0.0%)
$0
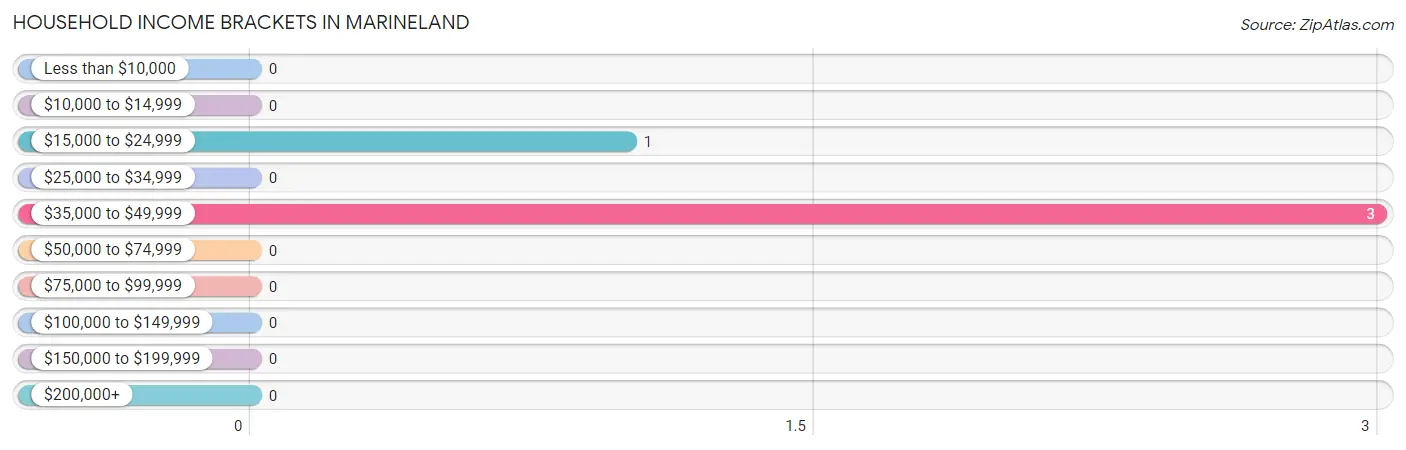
Household Income in Marineland
Household Income Brackets in Marineland
With 3 households falling in the category, the $35,000 to $49,999 income range is the most frequent in Marineland, accounting for 75.0% of all households.
Income Bracket
# Households
% Households
Less than $10,000
0
0.0%
$10,000 to $14,999
0
0.0%
$15,000 to $24,999
1
25.0%
$25,000 to $34,999
0
0.0%
$35,000 to $49,999
3
75.0%
$50,000 to $74,999
0
0.0%
$75,000 to $99,999
0
0.0%
$100,000 to $149,999
0
0.0%
$150,000 to $199,999
0
0.0%
$200,000+
0
0.0%
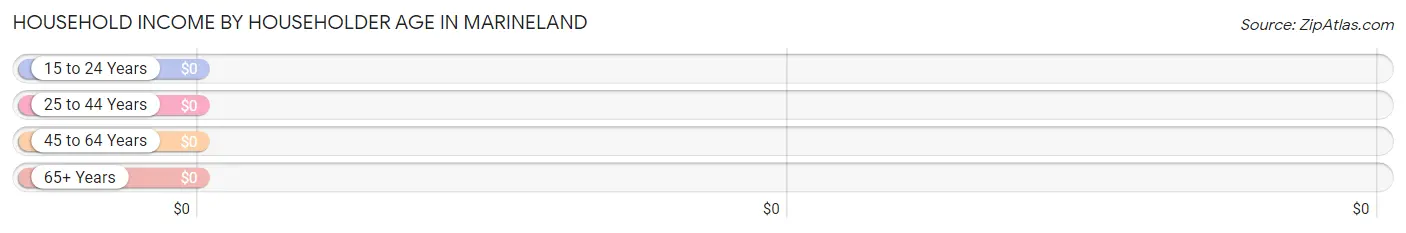
Household Income by Householder Age in Marineland
Income Bracket
# Households
Median Income
15 to 24 Years
1 (25.0%)
$0
25 to 44 Years
0 (0.0%)
$0
45 to 64 Years
3 (75.0%)
$0
65+ Years
0 (0.0%)
$0
Total
4 (100.0%)
$0
Poverty in Marineland
Income Below Poverty by Sex and Age in Marineland
Age Bracket
Male
Female
Under 5 Years
0 (0.0%)
0 (0.0%)
5 Years
0 (0.0%)
0 (0.0%)
6 to 11 Years
0 (0.0%)
0 (0.0%)
12 to 14 Years
0 (0.0%)
0 (0.0%)
15 Years
0 (0.0%)
0 (0.0%)
16 and 17 Years
0 (0.0%)
0 (0.0%)
18 to 24 Years
0 (0.0%)
0 (0.0%)
25 to 34 Years
0 (0.0%)
0 (0.0%)
35 to 44 Years
0 (0.0%)
0 (0.0%)
45 to 54 Years
0 (0.0%)
0 (0.0%)
55 to 64 Years
0 (0.0%)
0 (0.0%)
65 to 74 Years
0 (0.0%)
0 (0.0%)
75 Years and over
0 (0.0%)
0 (0.0%)
Total
0 (0.0%)
0 (0.0%)
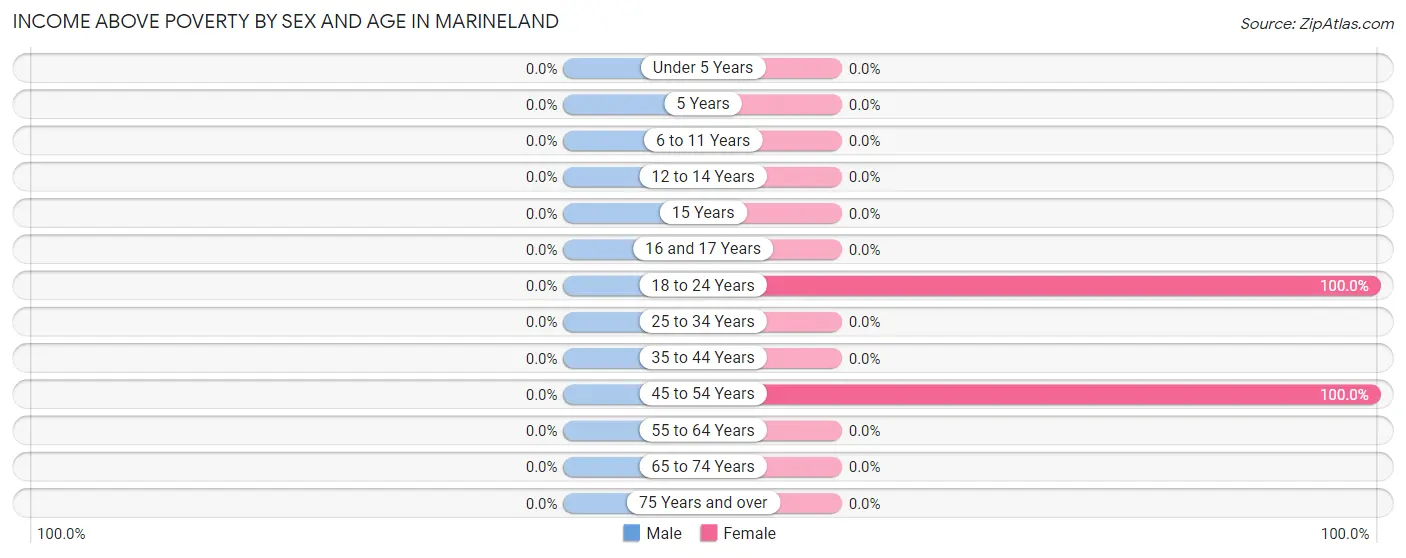
Income Above Poverty by Sex and Age in Marineland
Age Bracket
Male
Female
Under 5 Years
0 (0.0%)
0 (0.0%)
5 Years
0 (0.0%)
0 (0.0%)
6 to 11 Years
0 (0.0%)
0 (0.0%)
12 to 14 Years
0 (0.0%)
0 (0.0%)
15 Years
0 (0.0%)
0 (0.0%)
16 and 17 Years
0 (0.0%)
0 (0.0%)
18 to 24 Years
0 (0.0%)
1 (100.0%)
25 to 34 Years
0 (0.0%)
0 (0.0%)
35 to 44 Years
0 (0.0%)
0 (0.0%)
45 to 54 Years
0 (0.0%)
3 (100.0%)
55 to 64 Years
0 (0.0%)
0 (0.0%)
65 to 74 Years
0 (0.0%)
0 (0.0%)
75 Years and over
0 (0.0%)
0 (0.0%)
Total
0 (0.0%)
4 (100.0%)
Income Below Poverty Among Married-Couple Families in Marineland
Children
Above Poverty
Below Poverty
No Children
0 (0.0%)
0 (0.0%)
1 or 2 Children
0 (0.0%)
0 (0.0%)
3 or 4 Children
0 (0.0%)
0 (0.0%)
5 or more Children
0 (0.0%)
0 (0.0%)
Total
0 (0.0%)
0 (0.0%)
Income Below Poverty Among Single-Parent Households in Marineland
Children
Single Father
Single Mother
No Children
0 (0.0%)
0 (0.0%)
1 or 2 Children
0 (0.0%)
0 (0.0%)
3 or 4 Children
0 (0.0%)
0 (0.0%)
5 or more Children
0 (0.0%)
0 (0.0%)
Total
0 (0.0%)
0 (0.0%)
Income Below Poverty Among Married-Couple vs Single-Parent Households in Marineland
Children
Married-Couple Families
Single-Parent Households
No Children
0 (0.0%)
0 (0.0%)
1 or 2 Children
0 (0.0%)
0 (0.0%)
3 or 4 Children
0 (0.0%)
0 (0.0%)
5 or more Children
0 (0.0%)
0 (0.0%)
Total
0 (0.0%)
0 (0.0%)
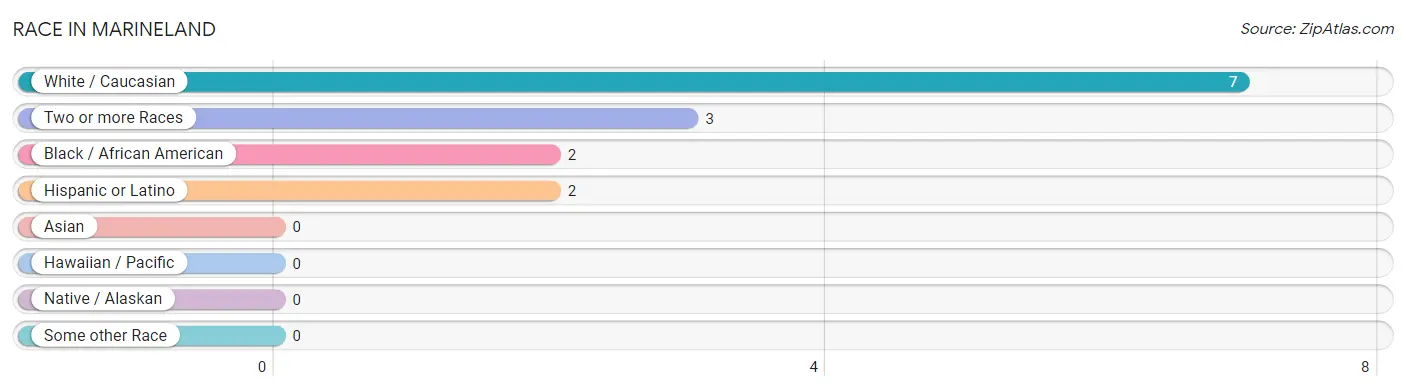
Race in Marineland
The most populous races in Marineland are White / Caucasian (7 | 58.3%), Two or more Races (3 | 25.0%), and Black / African American (2 | 16.7%).
Race
# Population
% Population
Asian
0
0.0%
Black / African American
2
16.7%
Hawaiian / Pacific
0
0.0%
Hispanic or Latino
2
16.7%
Native / Alaskan
0
0.0%
White / Caucasian
7
58.3%
Two or more Races
3
25.0%
Some other Race
0
0.0%
Total
12
100.0%
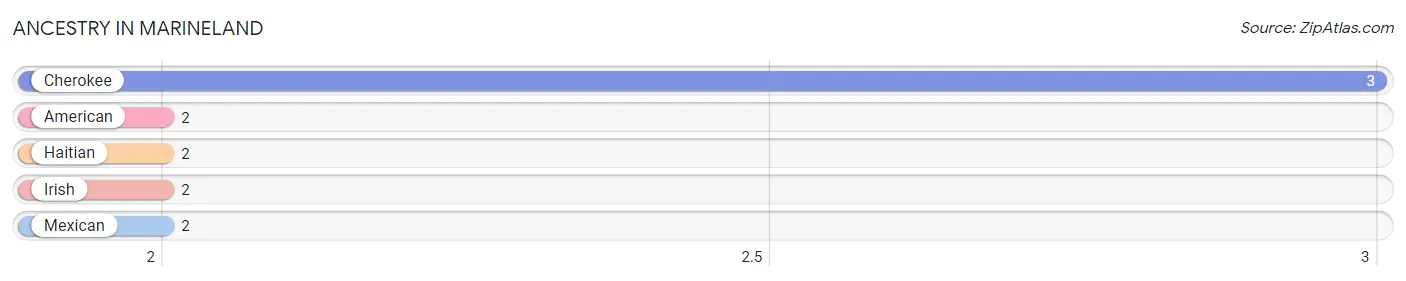
Ancestry in Marineland
The most populous ancestries reported in Marineland are Cherokee (3 | 25.0%), American (2 | 16.7%), Haitian (2 | 16.7%), Irish (2 | 16.7%), and Mexican (2 | 16.7%), together accounting for 91.7% of all Marineland residents.
Ancestry
# Population
% Population
American
2
16.7%
Cherokee
3
25.0%
Haitian
2
16.7%
Irish
2
16.7%
Mexican
2
16.7%
View All 5 Rows
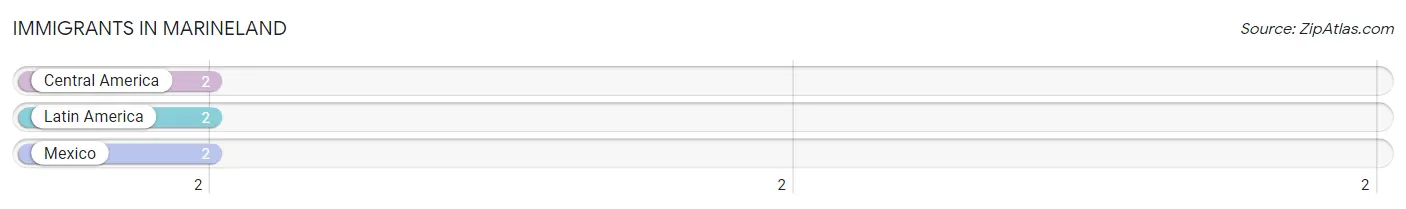
Immigrants in Marineland
The most numerous immigrant groups reported in Marineland came from Central America (2 | 16.7%), Latin America (2 | 16.7%), and Mexico (2 | 16.7%), together accounting for 50.0% of all Marineland residents.
Immigration Origin
# Population
% Population
Central America
2
16.7%
Latin America
2
16.7%
Mexico
2
16.7%
View All 3 Rows
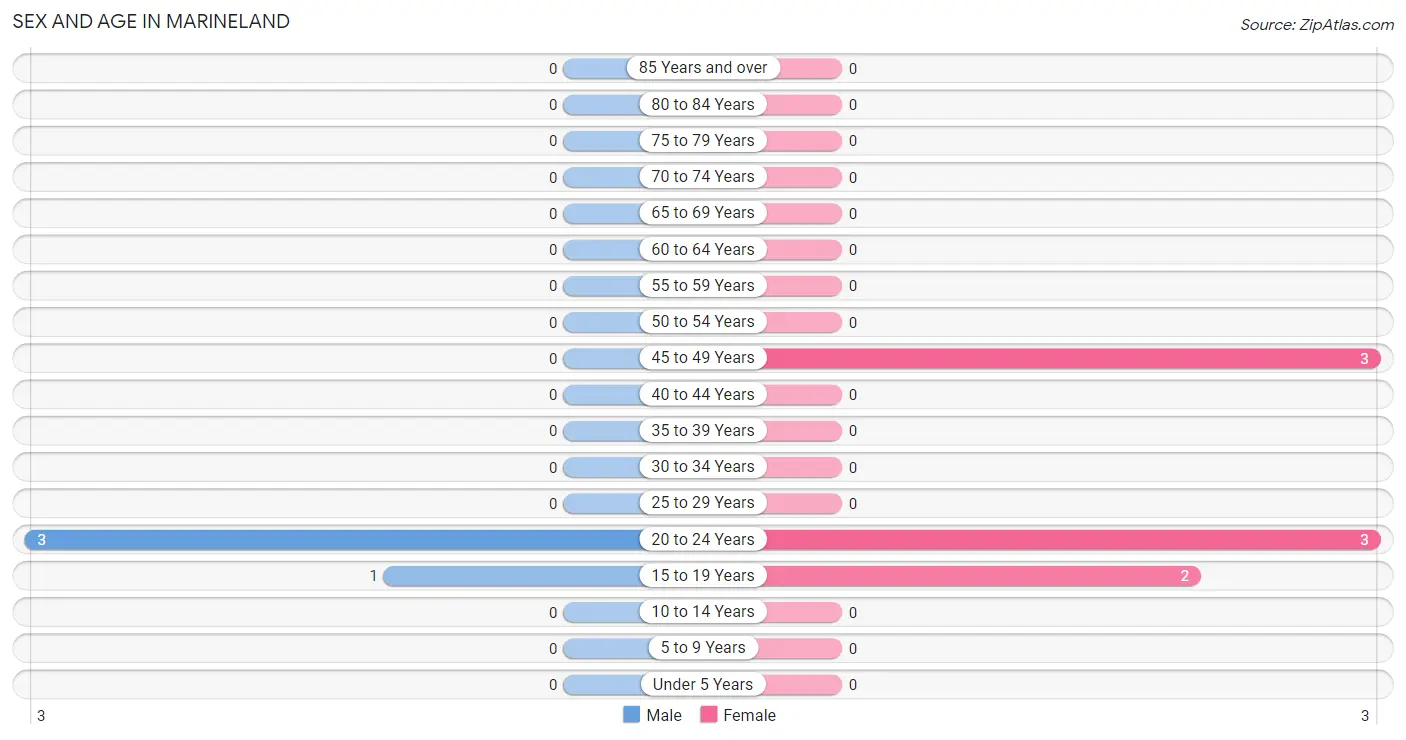
Sex and Age in Marineland
Sex and Age in Marineland
The most populous age groups in Marineland are 20 to 24 Years (3 | 75.0%) for men and 20 to 24 Years (3 | 37.5%) for women.
Age Bracket
Male
Female
Under 5 Years
0 (0.0%)
0 (0.0%)
5 to 9 Years
0 (0.0%)
0 (0.0%)
10 to 14 Years
0 (0.0%)
0 (0.0%)
15 to 19 Years
1 (25.0%)
2 (25.0%)
20 to 24 Years
3 (75.0%)
3 (37.5%)
25 to 29 Years
0 (0.0%)
0 (0.0%)
30 to 34 Years
0 (0.0%)
0 (0.0%)
35 to 39 Years
0 (0.0%)
0 (0.0%)
40 to 44 Years
0 (0.0%)
0 (0.0%)
45 to 49 Years
0 (0.0%)
3 (37.5%)
50 to 54 Years
0 (0.0%)
0 (0.0%)
55 to 59 Years
0 (0.0%)
0 (0.0%)
60 to 64 Years
0 (0.0%)
0 (0.0%)
65 to 69 Years
0 (0.0%)
0 (0.0%)
70 to 74 Years
0 (0.0%)
0 (0.0%)
75 to 79 Years
0 (0.0%)
0 (0.0%)
80 to 84 Years
0 (0.0%)
0 (0.0%)
85 Years and over
0 (0.0%)
0 (0.0%)
Total
4 (100.0%)
8 (100.0%)
Families and Households in Marineland
Median Family Size in Marineland
Family Type
# Families
Family Size
Married-Couple
0 (0.0%)
-
Single Male/Father
0 (0.0%)
-
Single Female/Mother
0 (0.0%)
-
Total Families
0 (0.0%)
-
Median Household Size in Marineland
Household Type
# Households
Household Size
Married-Couple
0 (0.0%)
-
Single Male/Father
0 (0.0%)
-
Single Female/Mother
0 (0.0%)
-
Non-family
4 (100.0%)
-
Total Households
4 (100.0%)
-
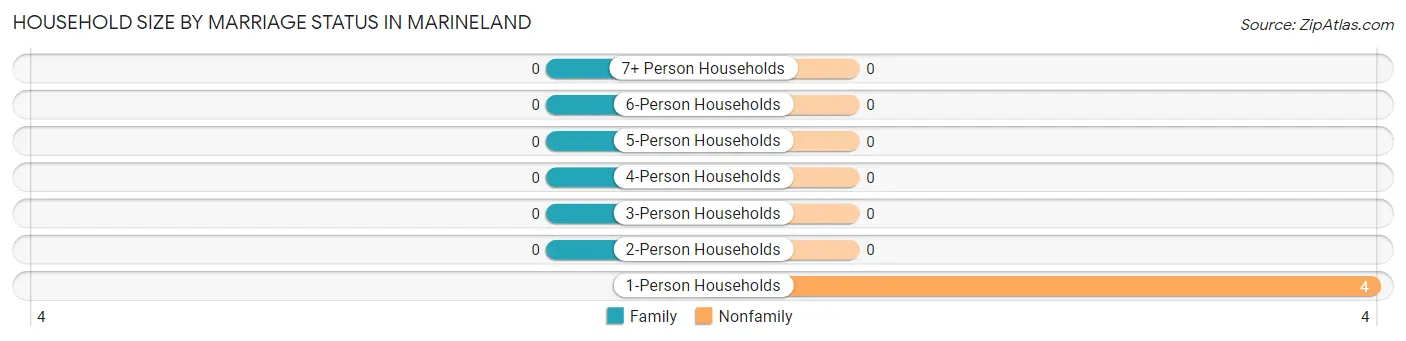
Household Size by Marriage Status in Marineland
Household Size
Family Households
Nonfamily Households
1-Person Households
-
4 (100.0%)
2-Person Households
0 (0.0%)
0 (0.0%)
3-Person Households
0 (0.0%)
0 (0.0%)
4-Person Households
0 (0.0%)
0 (0.0%)
5-Person Households
0 (0.0%)
0 (0.0%)
6-Person Households
0 (0.0%)
0 (0.0%)
7+ Person Households
0 (0.0%)
0 (0.0%)
Total
0 (0.0%)
4 (100.0%)
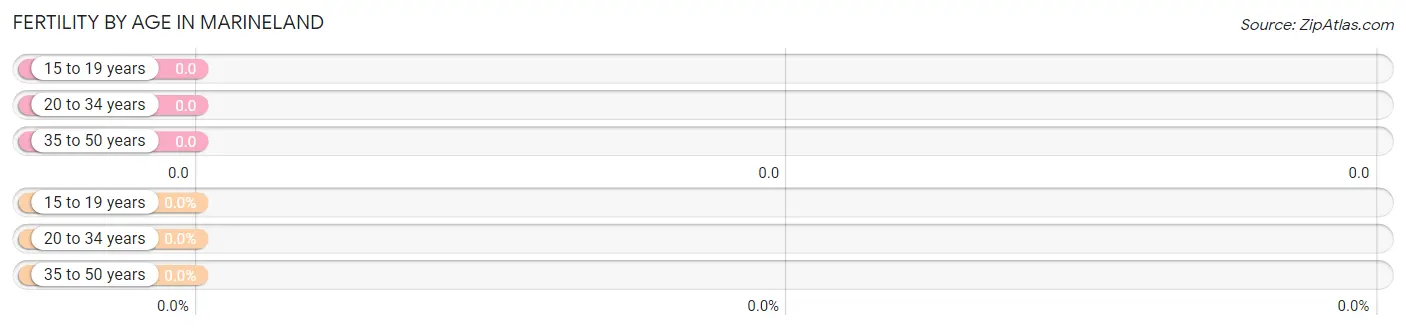
Female Fertility in Marineland
Fertility by Age in Marineland
Age Bracket
Women with Births
Births / 1,000 Women
15 to 19 years
0 (0.0%)
0.0
20 to 34 years
0 (0.0%)
0.0
35 to 50 years
0 (0.0%)
0.0
Total
0 (0.0%)
0.0
Fertility by Age by Marriage Status in Marineland
Age Bracket
Married
Unmarried
15 to 19 years
0 (0.0%)
0 (0.0%)
20 to 34 years
0 (0.0%)
0 (0.0%)
35 to 50 years
0 (0.0%)
0 (0.0%)
Total
0 (0.0%)
0 (0.0%)
Fertility by Education in Marineland
Educational Attainment
Women with Births
Births / 1,000 Women
Less than High School
0 (0.0%)
0.0
High School Diploma
0 (0.0%)
0.0
College or Associate's Degree
0 (0.0%)
0.0
Bachelor's Degree
0 (0.0%)
0.0
Graduate Degree
0 (0.0%)
0.0
Total
0 (0.0%)
0.0
Fertility by Education by Marriage Status in Marineland
Educational Attainment
Married
Unmarried
Less than High School
0 (0.0%)
0 (0.0%)
High School Diploma
0 (0.0%)
0 (0.0%)
College or Associate's Degree
0 (0.0%)
0 (0.0%)
Bachelor's Degree
0 (0.0%)
0 (0.0%)
Graduate Degree
0 (0.0%)
0 (0.0%)
Total
0 (0.0%)
0 (0.0%)
Employment Characteristics in Marineland
Employment by Class of Employer in Marineland
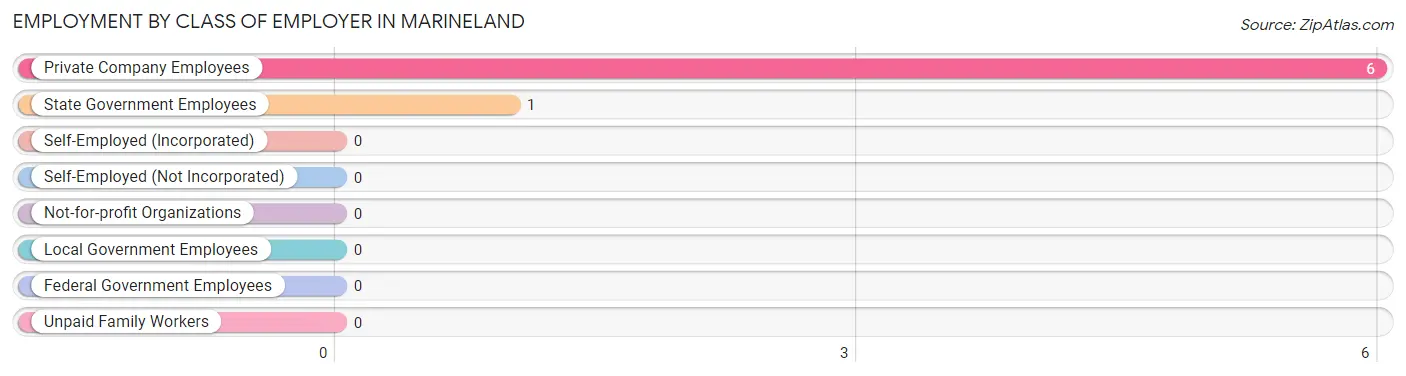
Among the 7 employed individuals in Marineland, private company employees (6 | 85.7%), and state government employees (1 | 14.3%) make up the most common classes of employment.
Employer Class
# Employees
% Employees
Private Company Employees
6
85.7%
Self-Employed (Incorporated)
0
0.0%
Self-Employed (Not Incorporated)
0
0.0%
Not-for-profit Organizations
0
0.0%
Local Government Employees
0
0.0%
State Government Employees
1
14.3%
Federal Government Employees
0
0.0%
Unpaid Family Workers
0
0.0%
Total
7
100.0%
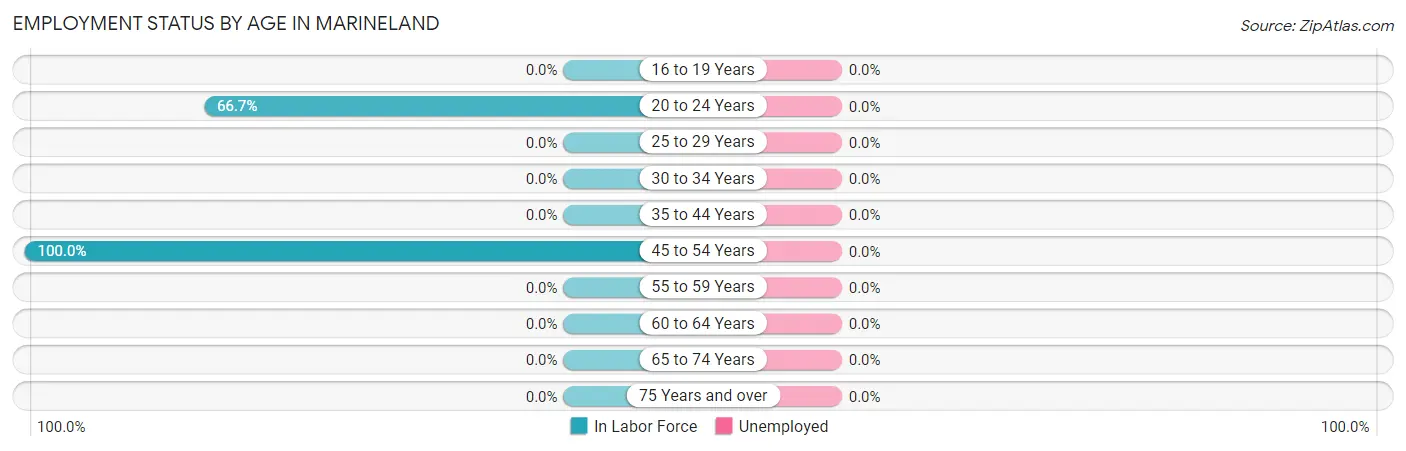
Employment Status by Age in Marineland
Age Bracket
In Labor Force
Unemployed
16 to 19 Years
0 (0.0%)
0 (0.0%)
20 to 24 Years
4 (66.7%)
0 (0.0%)
25 to 29 Years
0 (0.0%)
0 (0.0%)
30 to 34 Years
0 (0.0%)
0 (0.0%)
35 to 44 Years
0 (0.0%)
0 (0.0%)
45 to 54 Years
3 (100.0%)
0 (0.0%)
55 to 59 Years
0 (0.0%)
0 (0.0%)
60 to 64 Years
0 (0.0%)
0 (0.0%)
65 to 74 Years
0 (0.0%)
0 (0.0%)
75 Years and over
0 (0.0%)
0 (0.0%)
Total
7 (58.3%)
0 (0.0%)
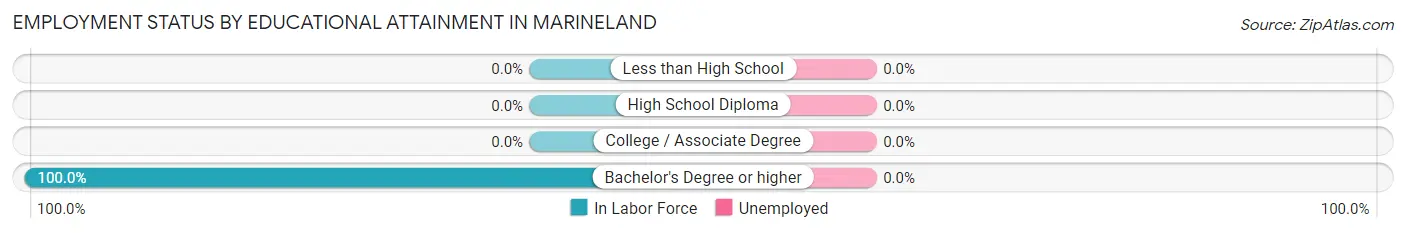
Employment Status by Educational Attainment in Marineland
Educational Attainment
In Labor Force
Unemployed
Less than High School
0 (0.0%)
0 (0.0%)
High School Diploma
0 (0.0%)
0 (0.0%)
College / Associate Degree
0 (0.0%)
0 (0.0%)
Bachelor's Degree or higher
3 (100.0%)
0 (0.0%)
Total
3 (100.0%)
0 (0.0%)
Employment Occupations by Sex in Marineland
Management, Business, Science and Arts Occupations
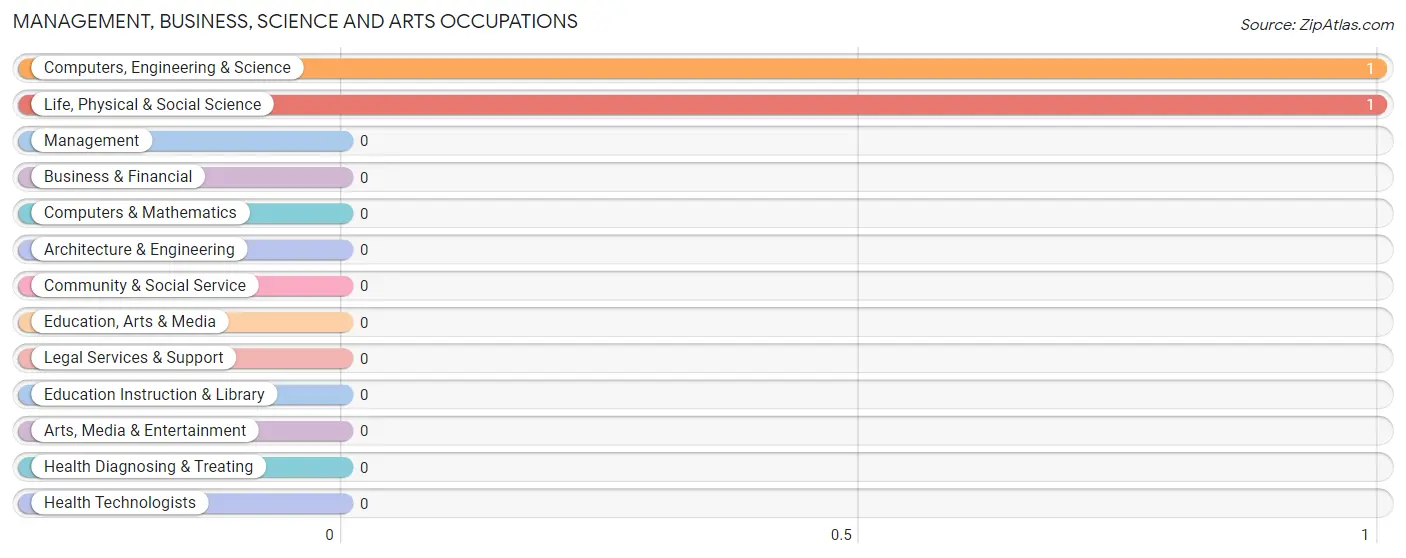
The most common Management, Business, Science and Arts occupations in Marineland are Computers, Engineering & Science (1 | 14.3%), and Life, Physical & Social Science (1 | 14.3%).
Management, Business, Science and Arts Occupations by Sex
Occupation
Male
Female
Management
0 (0.0%)
0 (0.0%)
Business & Financial
0 (0.0%)
0 (0.0%)
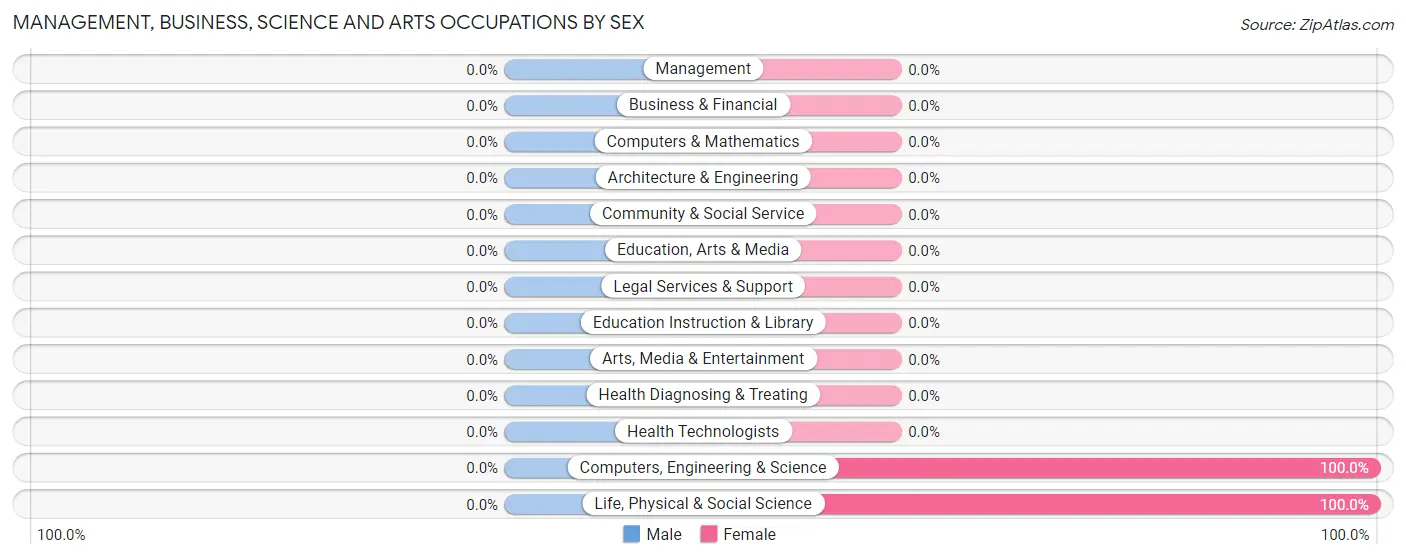
Computers, Engineering & Science
0 (0.0%)
1 (100.0%)
Computers & Mathematics
0 (0.0%)
0 (0.0%)
Architecture & Engineering
0 (0.0%)
0 (0.0%)
Life, Physical & Social Science
0 (0.0%)
1 (100.0%)
Community & Social Service
0 (0.0%)
0 (0.0%)
Education, Arts & Media
0 (0.0%)
0 (0.0%)
Legal Services & Support
0 (0.0%)
0 (0.0%)
Education Instruction & Library
0 (0.0%)
0 (0.0%)
Arts, Media & Entertainment
0 (0.0%)
0 (0.0%)
Health Diagnosing & Treating
0 (0.0%)
0 (0.0%)
Health Technologists
0 (0.0%)
0 (0.0%)
Total (Category)
0 (0.0%)
1 (100.0%)
Total (Overall)
1 (14.3%)
6 (85.7%)
Services Occupations
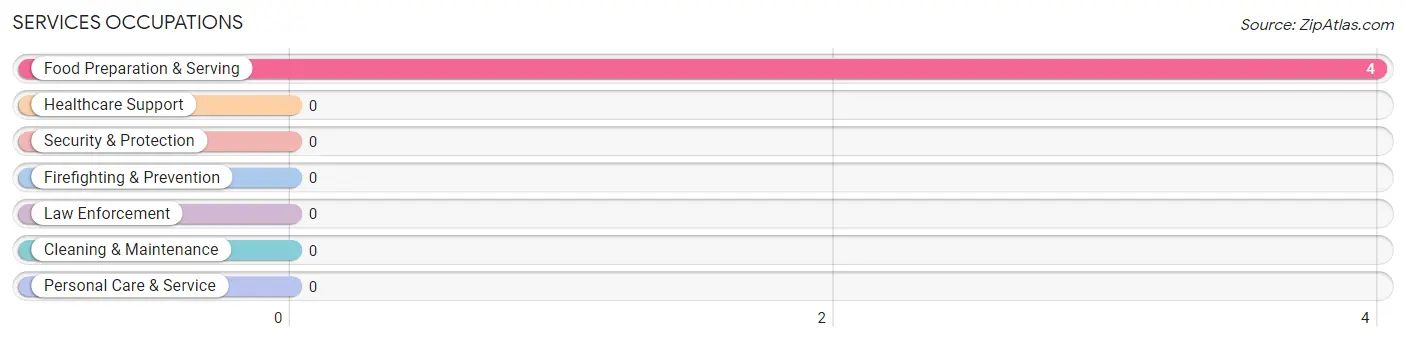
The most common Services occupations in Marineland are , and Food Preparation & Serving (4 | 57.1%).
Services Occupations by Sex
Occupation
Male
Female
Healthcare Support
0 (0.0%)
0 (0.0%)
Security & Protection
0 (0.0%)
0 (0.0%)
Firefighting & Prevention
0 (0.0%)
0 (0.0%)
Law Enforcement
0 (0.0%)
0 (0.0%)
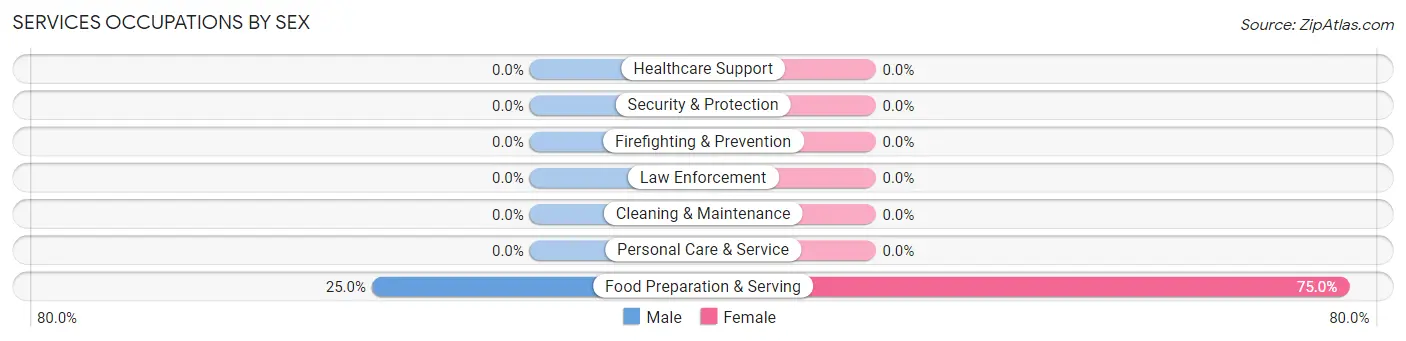
Food Preparation & Serving
1 (25.0%)
3 (75.0%)
Cleaning & Maintenance
0 (0.0%)
0 (0.0%)
Personal Care & Service
0 (0.0%)
0 (0.0%)
Total (Category)
1 (25.0%)
3 (75.0%)
Total (Overall)
1 (14.3%)
6 (85.7%)
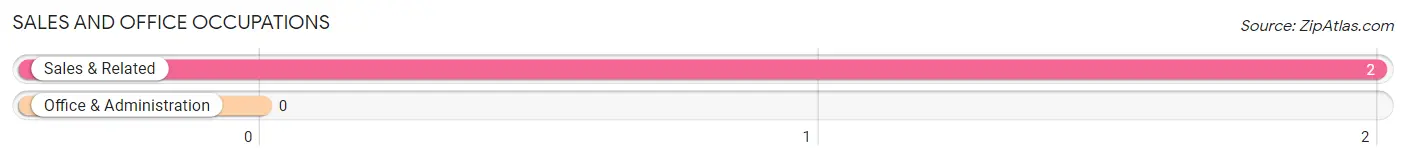
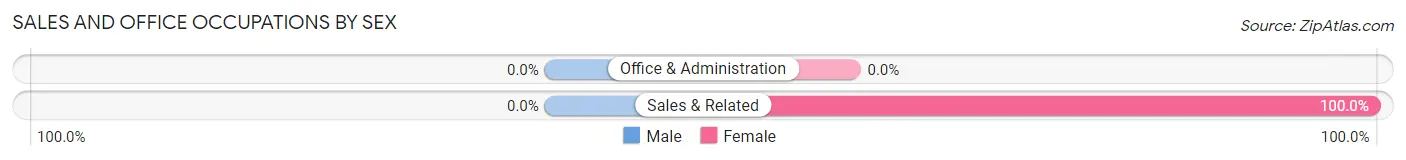
Sales and Office Occupations
The most common Sales and Office occupations in Marineland are , and Sales & Related (2 | 28.6%).
Sales and Office Occupations by Sex
Occupation
Male
Female
Sales & Related
0 (0.0%)
2 (100.0%)
Office & Administration
0 (0.0%)
0 (0.0%)
Total (Category)
0 (0.0%)
2 (100.0%)
Total (Overall)
1 (14.3%)
6 (85.7%)
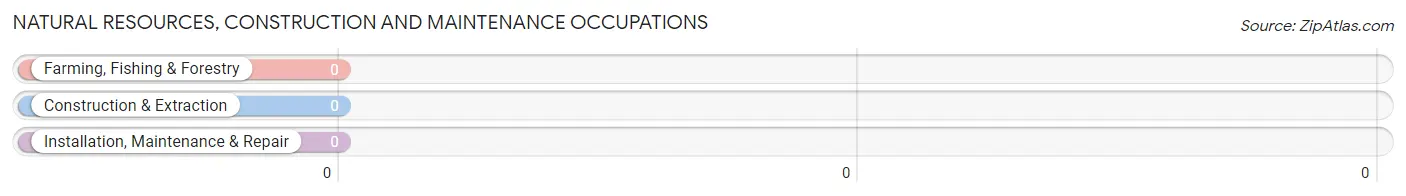
Natural Resources, Construction and Maintenance Occupations
Natural Resources, Construction and Maintenance Occupations by Sex
Occupation
Male
Female
Farming, Fishing & Forestry
0 (0.0%)
0 (0.0%)
Construction & Extraction
0 (0.0%)
0 (0.0%)
Installation, Maintenance & Repair
0 (0.0%)
0 (0.0%)
Total (Category)
0 (0.0%)
0 (0.0%)
Total (Overall)
1 (14.3%)
6 (85.7%)
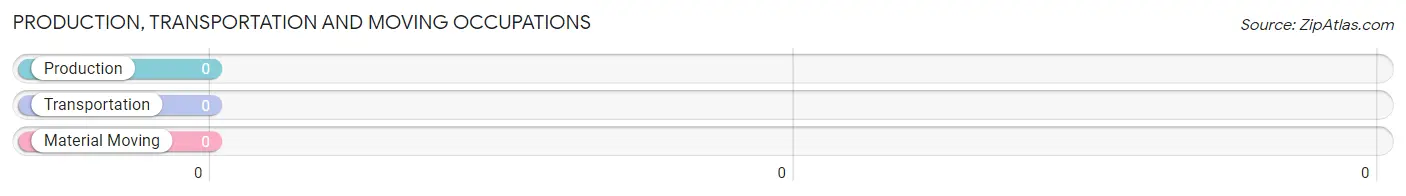
Production, Transportation and Moving Occupations
Production, Transportation and Moving Occupations by Sex
Occupation
Male
Female
Production
0 (0.0%)
0 (0.0%)
Transportation
0 (0.0%)
0 (0.0%)
Material Moving
0 (0.0%)
0 (0.0%)
Total (Category)
0 (0.0%)
0 (0.0%)
Total (Overall)
1 (14.3%)
6 (85.7%)
Employment Industries by Sex in Marineland
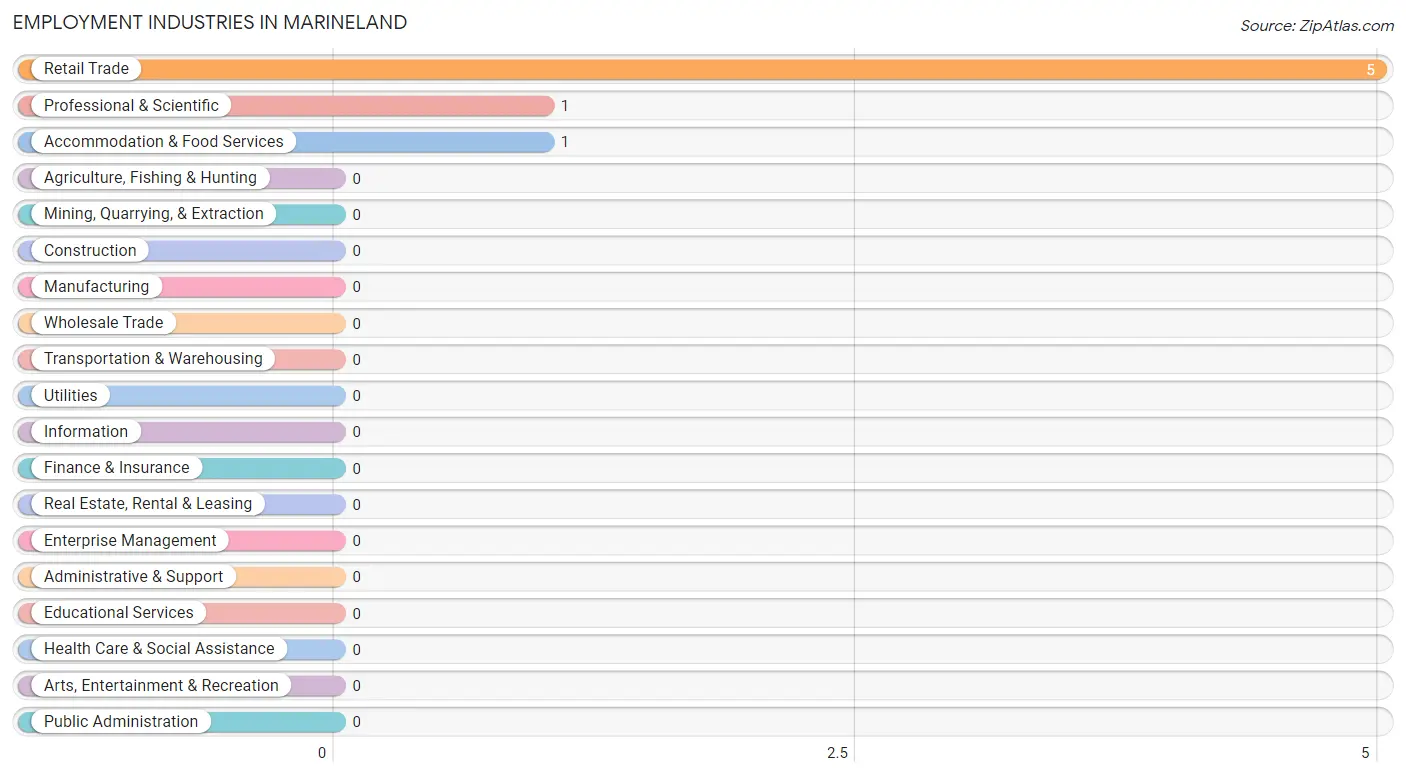
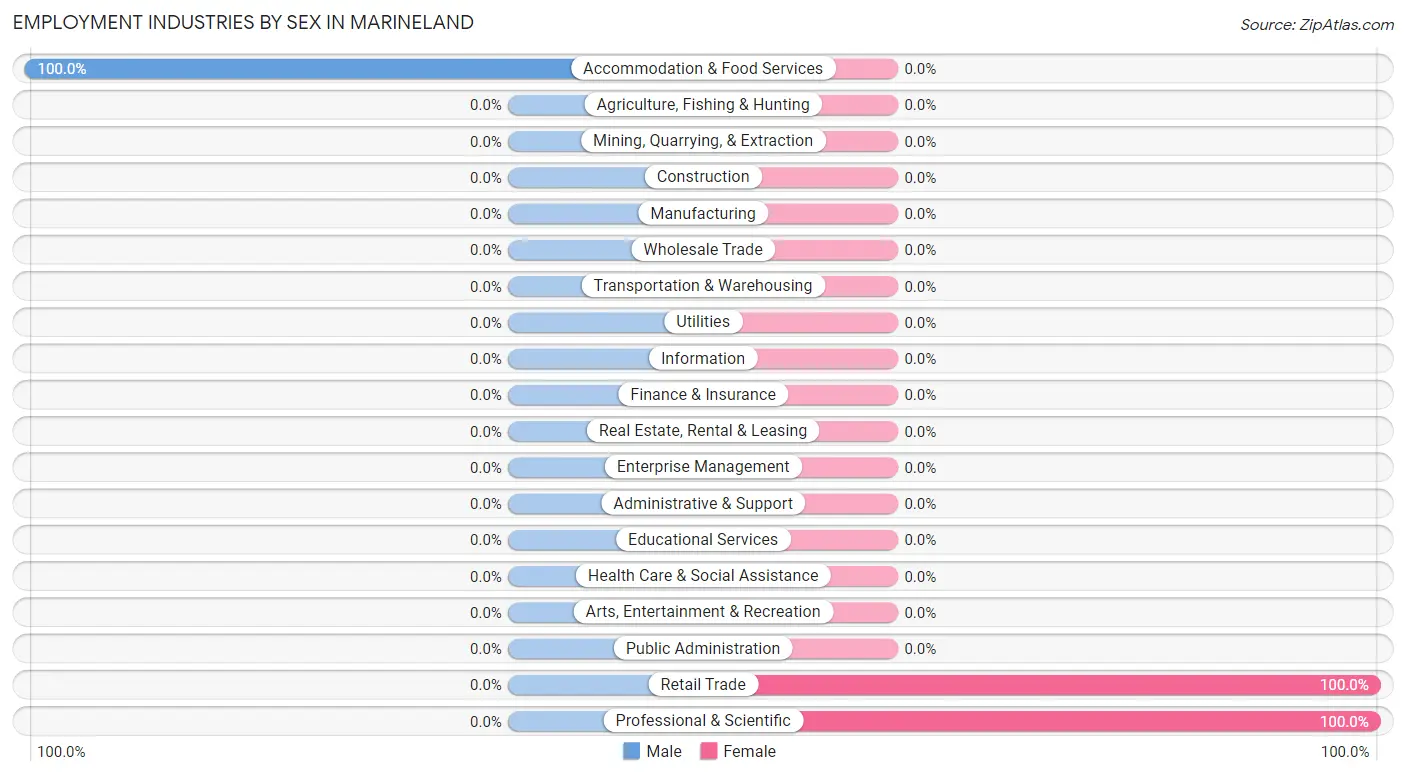
Employment Industries in Marineland
The major employment industries in Marineland include Retail Trade (5 | 71.4%), Professional & Scientific (1 | 14.3%), and Accommodation & Food Services (1 | 14.3%).
Employment Industries by Sex in Marineland
Industry
Male
Female
Agriculture, Fishing & Hunting
0 (0.0%)
0 (0.0%)
Mining, Quarrying, & Extraction
0 (0.0%)
0 (0.0%)
Construction
0 (0.0%)
0 (0.0%)
Manufacturing
0 (0.0%)
0 (0.0%)
Wholesale Trade
0 (0.0%)
0 (0.0%)
Retail Trade
0 (0.0%)
5 (100.0%)
Transportation & Warehousing
0 (0.0%)
0 (0.0%)
Utilities
0 (0.0%)
0 (0.0%)
Information
0 (0.0%)
0 (0.0%)
Finance & Insurance
0 (0.0%)
0 (0.0%)
Real Estate, Rental & Leasing
0 (0.0%)
0 (0.0%)
Professional & Scientific
0 (0.0%)
1 (100.0%)
Enterprise Management
0 (0.0%)
0 (0.0%)
Administrative & Support
0 (0.0%)
0 (0.0%)
Educational Services
0 (0.0%)
0 (0.0%)
Health Care & Social Assistance
0 (0.0%)
0 (0.0%)
Arts, Entertainment & Recreation
0 (0.0%)
0 (0.0%)
Accommodation & Food Services
1 (100.0%)
0 (0.0%)
Public Administration
0 (0.0%)
0 (0.0%)
Total
1 (14.3%)
6 (85.7%)
Education in Marineland
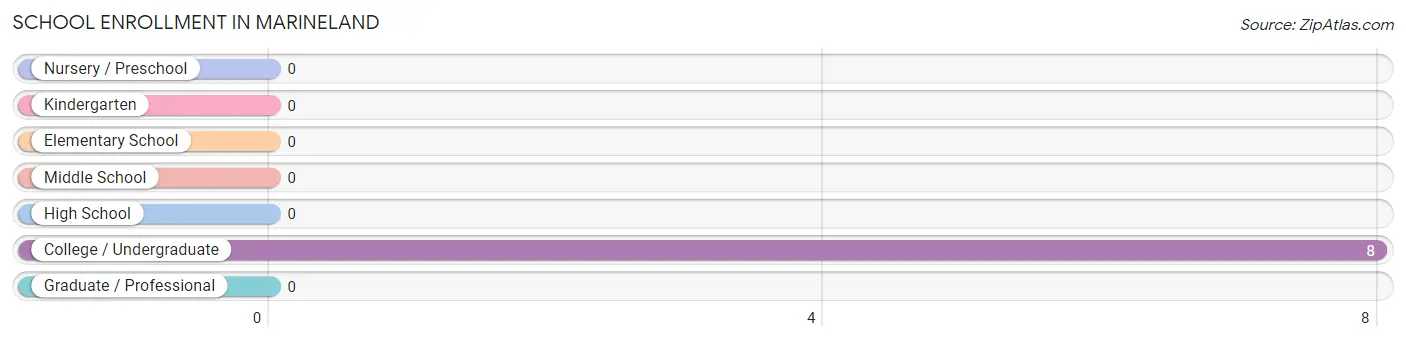
School Enrollment in Marineland
School Level
# Students
% Students
Nursery / Preschool
0
0.0%
Kindergarten
0
0.0%
Elementary School
0
0.0%
Middle School
0
0.0%
High School
0
0.0%
College / Undergraduate
8
100.0%
Graduate / Professional
0
0.0%
Total
8
100.0%
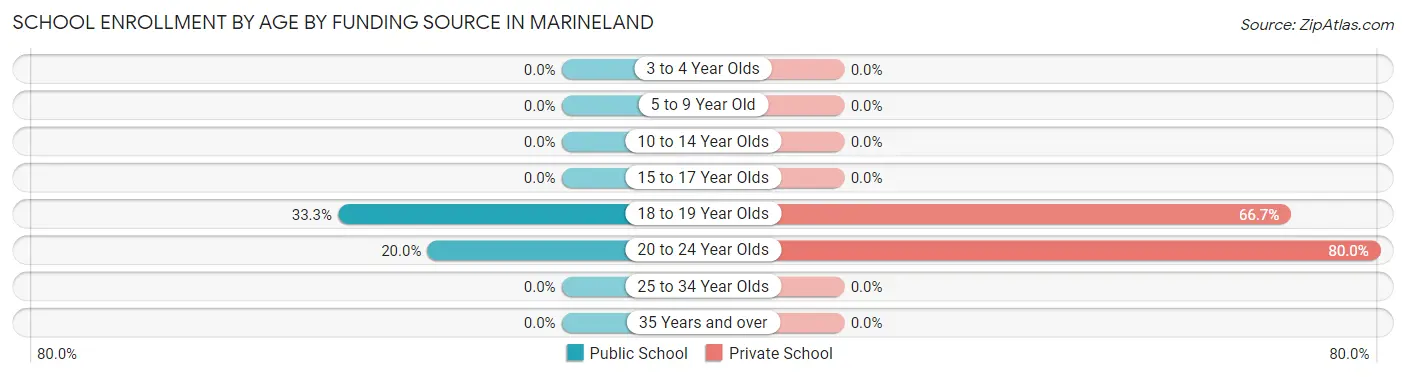
School Enrollment by Age by Funding Source in Marineland
Out of a total of 8 students who are enrolled in schools in Marineland, 6 (75.0%) attend a private institution, while the remaining 2 (25.0%) are enrolled in public schools. The age group of 20 to 24 year olds has the highest likelihood of being enrolled in private schools, with 4 (80.0% in the age bracket) enrolled. Conversely, the age group of 18 to 19 year olds has the lowest likelihood of being enrolled in a private school, with 1 (33.3% in the age bracket) attending a public institution.
Age Bracket
Public School
Private School
3 to 4 Year Olds
0 (0.0%)
0 (0.0%)
5 to 9 Year Old
0 (0.0%)
0 (0.0%)
10 to 14 Year Olds
0 (0.0%)
0 (0.0%)
15 to 17 Year Olds
0 (0.0%)
0 (0.0%)
18 to 19 Year Olds
1 (33.3%)
2 (66.7%)
20 to 24 Year Olds
1 (20.0%)
4 (80.0%)
25 to 34 Year Olds
0 (0.0%)
0 (0.0%)
35 Years and over
0 (0.0%)
0 (0.0%)
Total
2 (25.0%)
6 (75.0%)
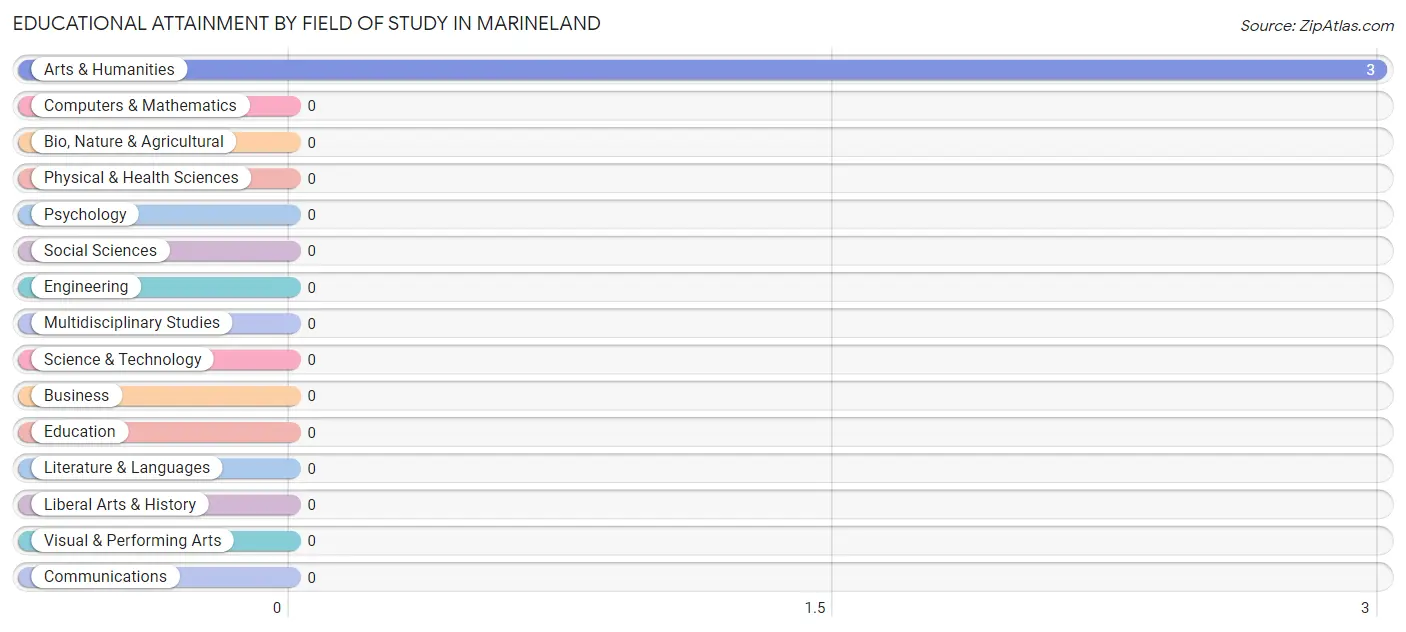
Educational Attainment by Field of Study in Marineland
, and arts & humanities (3 | 100.0%) are the most common fields of study among 3 individuals in Marineland who have obtained a bachelor's degree or higher.
Field of Study
# Graduates
% Graduates
Computers & Mathematics
0
0.0%
Bio, Nature & Agricultural
0
0.0%
Physical & Health Sciences
0
0.0%
Psychology
0
0.0%
Social Sciences
0
0.0%
Engineering
0
0.0%
Multidisciplinary Studies
0
0.0%
Science & Technology
0
0.0%
Business
0
0.0%
Education
0
0.0%
Literature & Languages
0
0.0%
Liberal Arts & History
0
0.0%
Visual & Performing Arts
0
0.0%
Communications
0
0.0%
Arts & Humanities
3
100.0%
Total
3
100.0%
Transportation & Commute in Marineland
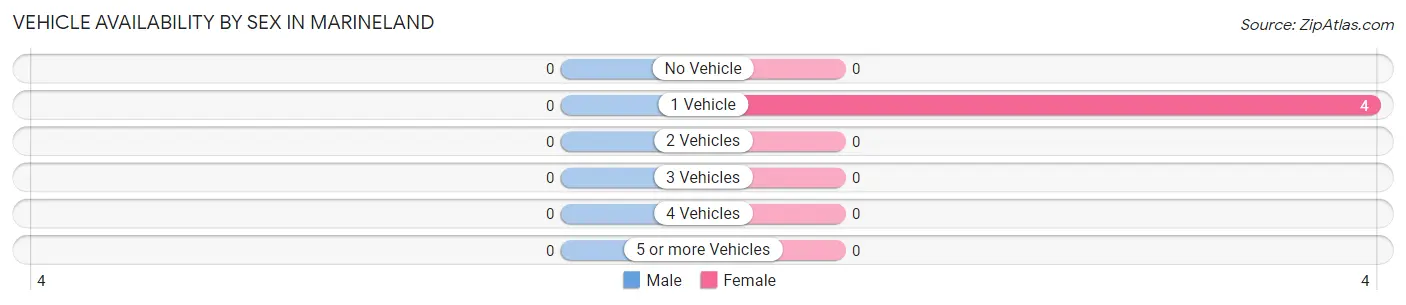
Vehicle Availability by Sex in Marineland
Vehicles Available
Male
Female
No Vehicle
0 (0.0%)
0 (0.0%)
1 Vehicle
0 (0.0%)
4 (100.0%)
2 Vehicles
0 (0.0%)
0 (0.0%)
3 Vehicles
0 (0.0%)
0 (0.0%)
4 Vehicles
0 (0.0%)
0 (0.0%)
5 or more Vehicles
0 (0.0%)
0 (0.0%)
Total
0 (0.0%)
4 (100.0%)
Commute Time in Marineland
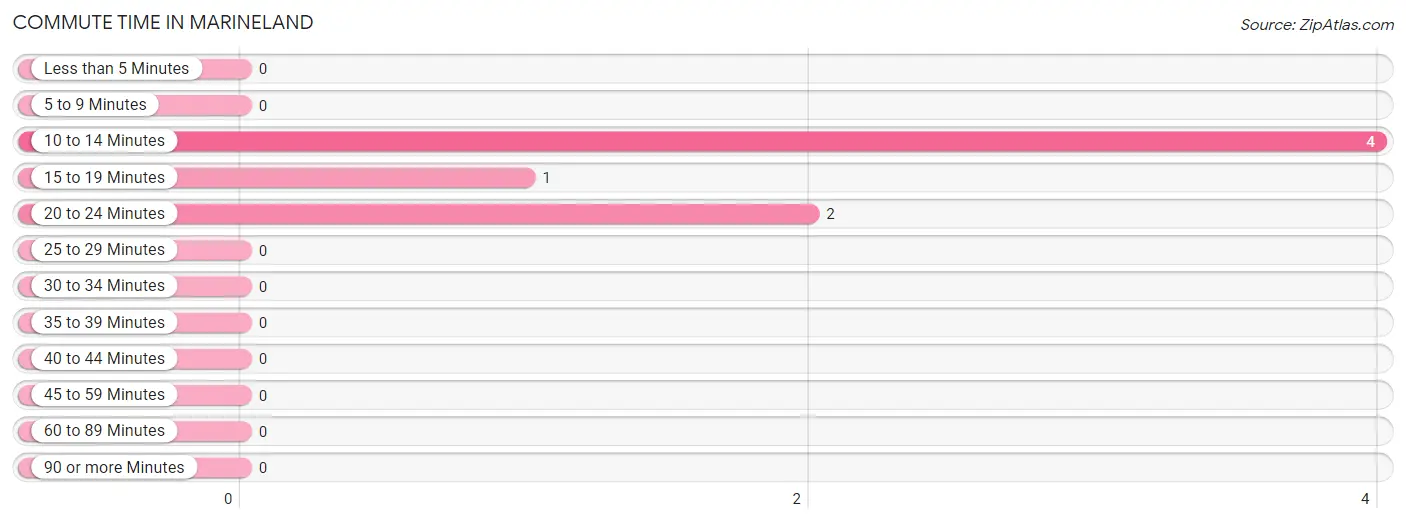
The most frequently occuring commute durations in Marineland are 10 to 14 minutes (4 commuters, 57.1%), 20 to 24 minutes (2 commuters, 28.6%), and 15 to 19 minutes (1 commuters, 14.3%).
Commute Time
# Commuters
% Commuters
Less than 5 Minutes
0
0.0%
5 to 9 Minutes
0
0.0%
10 to 14 Minutes
4
57.1%
15 to 19 Minutes
1
14.3%
20 to 24 Minutes
2
28.6%
25 to 29 Minutes
0
0.0%
30 to 34 Minutes
0
0.0%
35 to 39 Minutes
0
0.0%
40 to 44 Minutes
0
0.0%
45 to 59 Minutes
0
0.0%
60 to 89 Minutes
0
0.0%
90 or more Minutes
0
0.0%
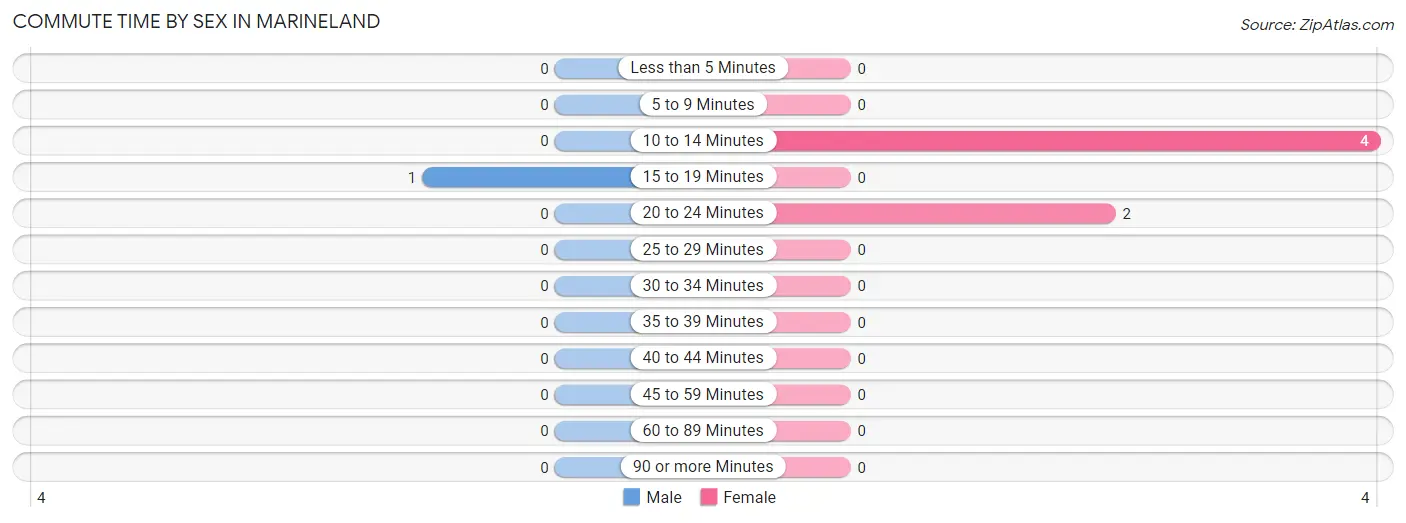
Commute Time by Sex in Marineland
The most common commute times in Marineland are 15 to 19 minutes (1 commuters, 100.0%) for males and 10 to 14 minutes (4 commuters, 66.7%) for females.
Commute Time
Male
Female
Less than 5 Minutes
0 (0.0%)
0 (0.0%)
5 to 9 Minutes
0 (0.0%)
0 (0.0%)
10 to 14 Minutes
0 (0.0%)
4 (66.7%)
15 to 19 Minutes
1 (100.0%)
0 (0.0%)
20 to 24 Minutes
0 (0.0%)
2 (33.3%)
25 to 29 Minutes
0 (0.0%)
0 (0.0%)
30 to 34 Minutes
0 (0.0%)
0 (0.0%)
35 to 39 Minutes
0 (0.0%)
0 (0.0%)
40 to 44 Minutes
0 (0.0%)
0 (0.0%)
45 to 59 Minutes
0 (0.0%)
0 (0.0%)
60 to 89 Minutes
0 (0.0%)
0 (0.0%)
90 or more Minutes
0 (0.0%)
0 (0.0%)
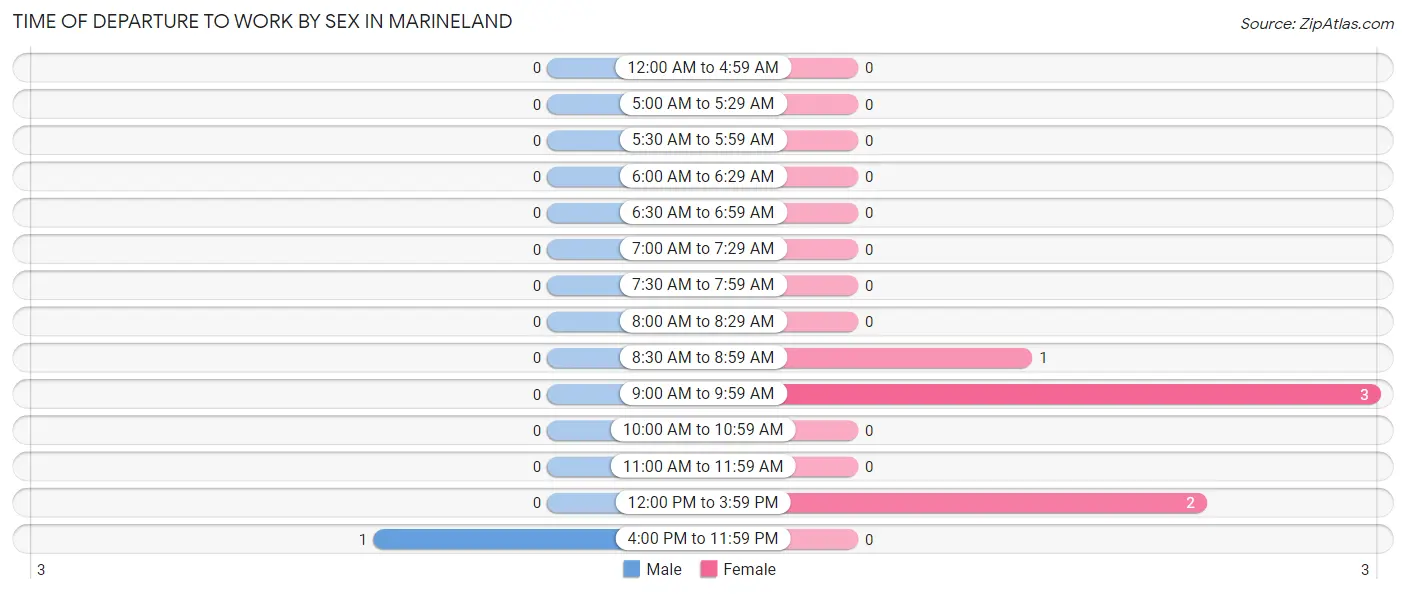
Time of Departure to Work by Sex in Marineland
The most frequent times of departure to work in Marineland are 4:00 PM to 11:59 PM (1, 100.0%) for males and 9:00 AM to 9:59 AM (3, 50.0%) for females.
Time of Departure
Male
Female
12:00 AM to 4:59 AM
0 (0.0%)
0 (0.0%)
5:00 AM to 5:29 AM
0 (0.0%)
0 (0.0%)
5:30 AM to 5:59 AM
0 (0.0%)
0 (0.0%)
6:00 AM to 6:29 AM
0 (0.0%)
0 (0.0%)
6:30 AM to 6:59 AM
0 (0.0%)
0 (0.0%)
7:00 AM to 7:29 AM
0 (0.0%)
0 (0.0%)
7:30 AM to 7:59 AM
0 (0.0%)
0 (0.0%)
8:00 AM to 8:29 AM
0 (0.0%)
0 (0.0%)
8:30 AM to 8:59 AM
0 (0.0%)
1 (16.7%)
9:00 AM to 9:59 AM
0 (0.0%)
3 (50.0%)
10:00 AM to 10:59 AM
0 (0.0%)
0 (0.0%)
11:00 AM to 11:59 AM
0 (0.0%)
0 (0.0%)
12:00 PM to 3:59 PM
0 (0.0%)
2 (33.3%)
4:00 PM to 11:59 PM
1 (100.0%)
0 (0.0%)
Total
1 (100.0%)
6 (100.0%)
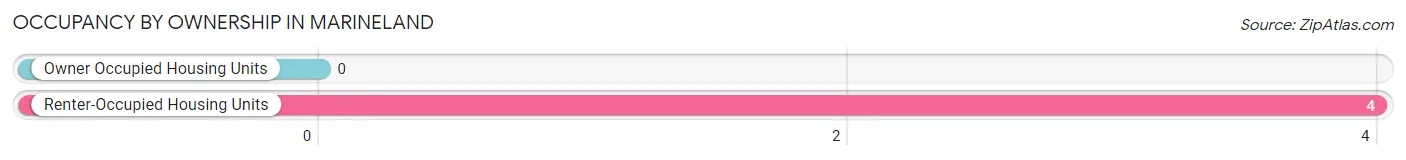
Housing Occupancy in Marineland
Occupancy by Ownership in Marineland
Of the total 4 dwellings in Marineland, owner-occupied units account for 0 (0.0%), while renter-occupied units make up 4 (100.0%).
Occupancy
# Housing Units
% Housing Units
Owner Occupied Housing Units
0
0.0%
Renter-Occupied Housing Units
4
100.0%
Total Occupied Housing Units
4
100.0%
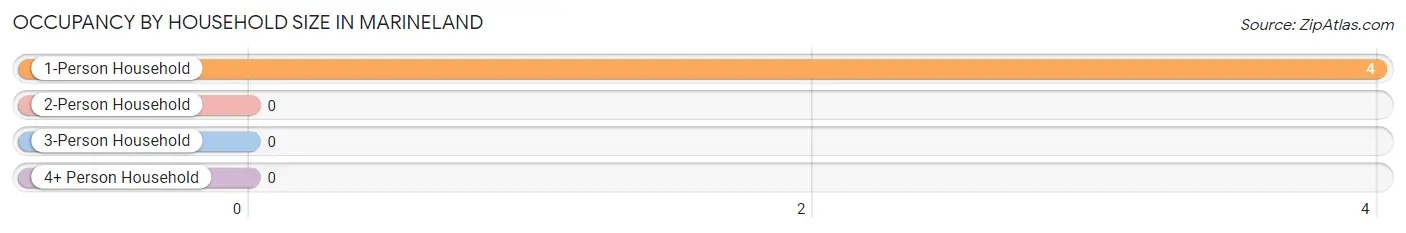
Occupancy by Household Size in Marineland
Household Size
# Housing Units
% Housing Units
1-Person Household
4
100.0%
2-Person Household
0
0.0%
3-Person Household
0
0.0%
4+ Person Household
0
0.0%
Total Housing Units
4
100.0%
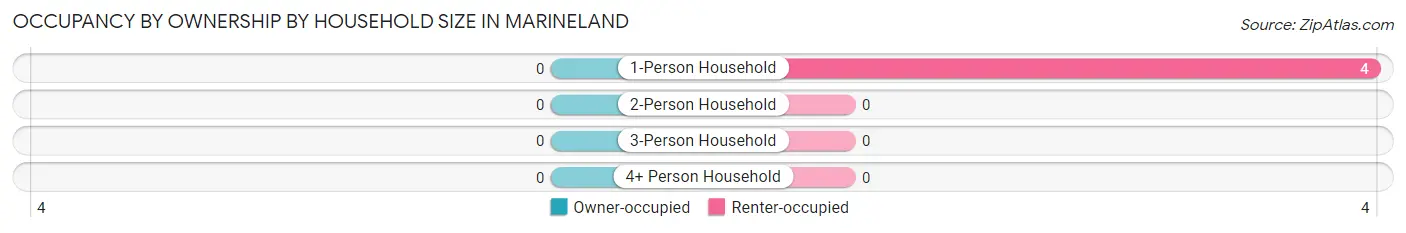
Occupancy by Ownership by Household Size in Marineland
Household Size
Owner-occupied
Renter-occupied
1-Person Household
0 (0.0%)
4 (100.0%)
2-Person Household
0 (0.0%)
0 (0.0%)
3-Person Household
0 (0.0%)
0 (0.0%)
4+ Person Household
0 (0.0%)
0 (0.0%)
Total Housing Units
0 (0.0%)
4 (100.0%)
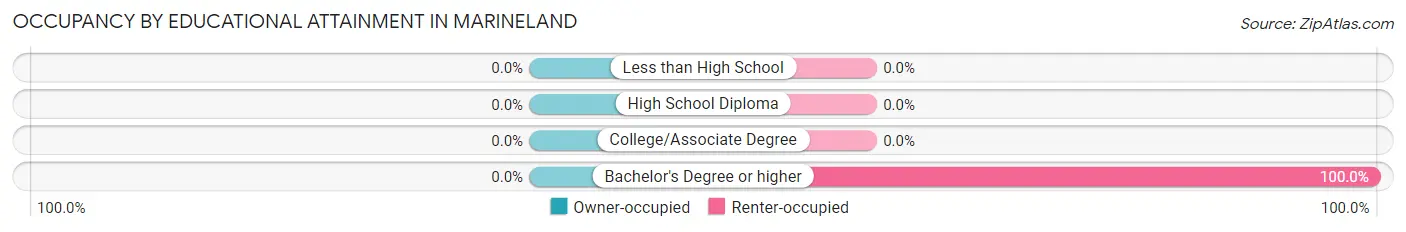
Occupancy by Educational Attainment in Marineland
Household Size
Owner-occupied
Renter-occupied
Less than High School
0 (0.0%)
0 (0.0%)
High School Diploma
0 (0.0%)
0 (0.0%)
College/Associate Degree
0 (0.0%)
0 (0.0%)
Bachelor's Degree or higher
0 (0.0%)
4 (100.0%)
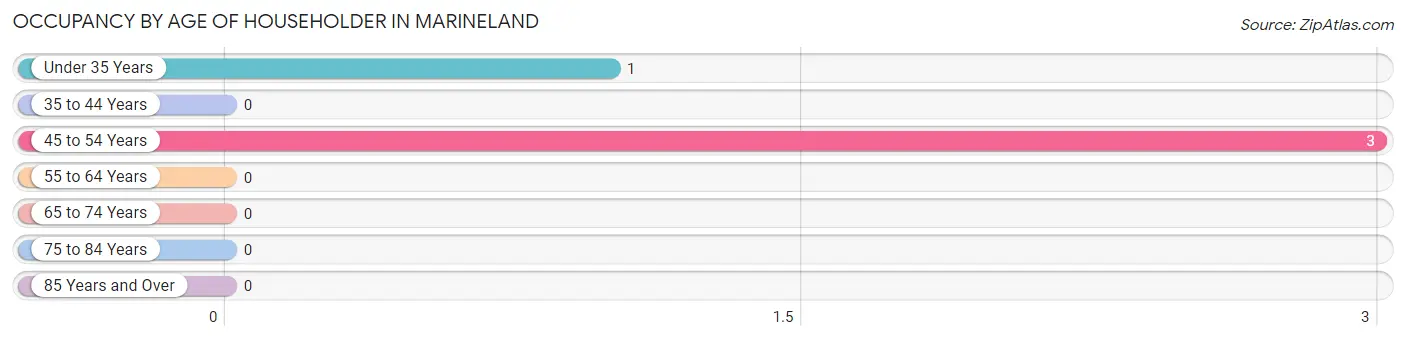
Occupancy by Age of Householder in Marineland
Age Bracket
# Households
% Households
Under 35 Years
1
25.0%
35 to 44 Years
0
0.0%
45 to 54 Years
3
75.0%
55 to 64 Years
0
0.0%
65 to 74 Years
0
0.0%
75 to 84 Years
0
0.0%
85 Years and Over
0
0.0%
Total
4
100.0%
Housing Finances in Marineland
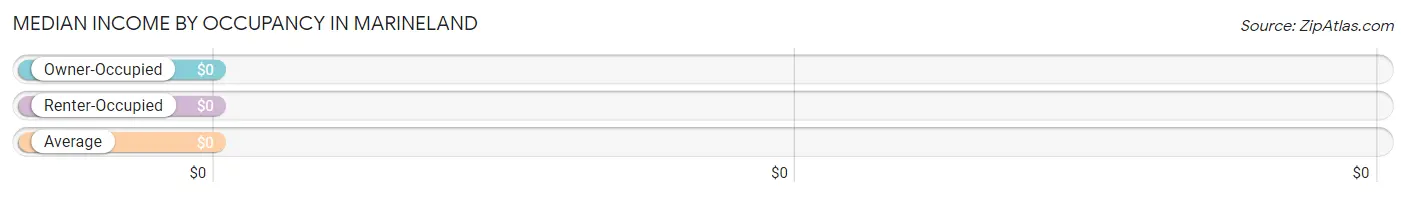
Median Income by Occupancy in Marineland
Occupancy Type
# Households
Median Income
Owner-Occupied
0 (0.0%)
$0
Renter-Occupied
4 (100.0%)
$0
Average
4 (100.0%)
$0
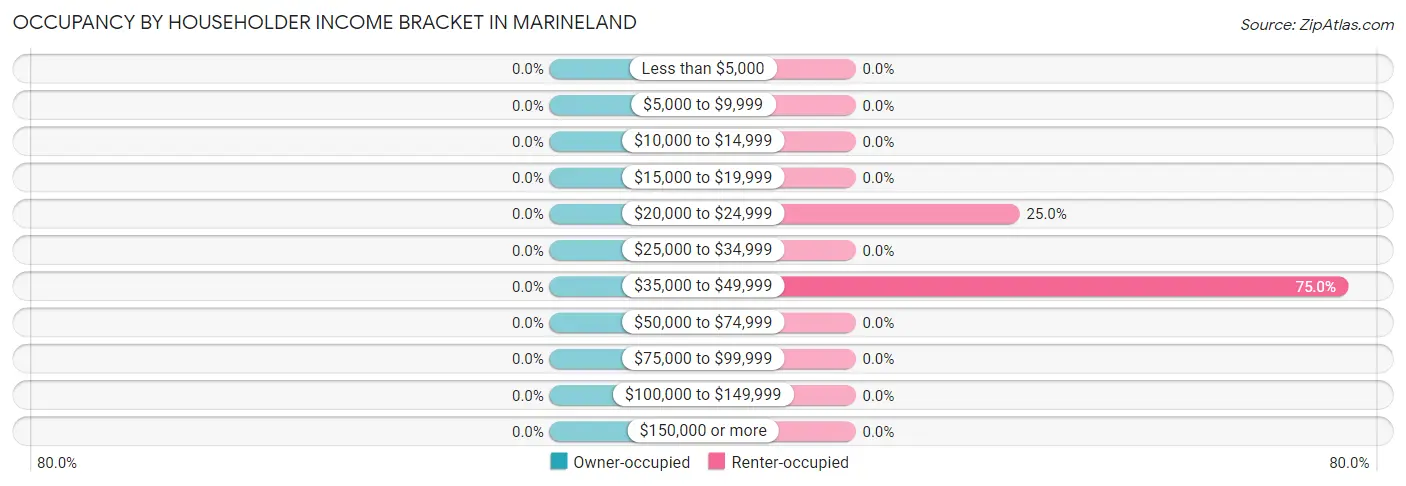
Occupancy by Householder Income Bracket in Marineland
Income Bracket
Owner-occupied
Renter-occupied
Less than $5,000
0 (0.0%)
0 (0.0%)
$5,000 to $9,999
0 (0.0%)
0 (0.0%)
$10,000 to $14,999
0 (0.0%)
0 (0.0%)
$15,000 to $19,999
0 (0.0%)
0 (0.0%)
$20,000 to $24,999
0 (0.0%)
1 (25.0%)
$25,000 to $34,999
0 (0.0%)
0 (0.0%)
$35,000 to $49,999
0 (0.0%)
3 (75.0%)
$50,000 to $74,999
0 (0.0%)
0 (0.0%)
$75,000 to $99,999
0 (0.0%)
0 (0.0%)
$100,000 to $149,999
0 (0.0%)
0 (0.0%)
$150,000 or more
0 (0.0%)
0 (0.0%)
Total
0 (0.0%)
4 (100.0%)
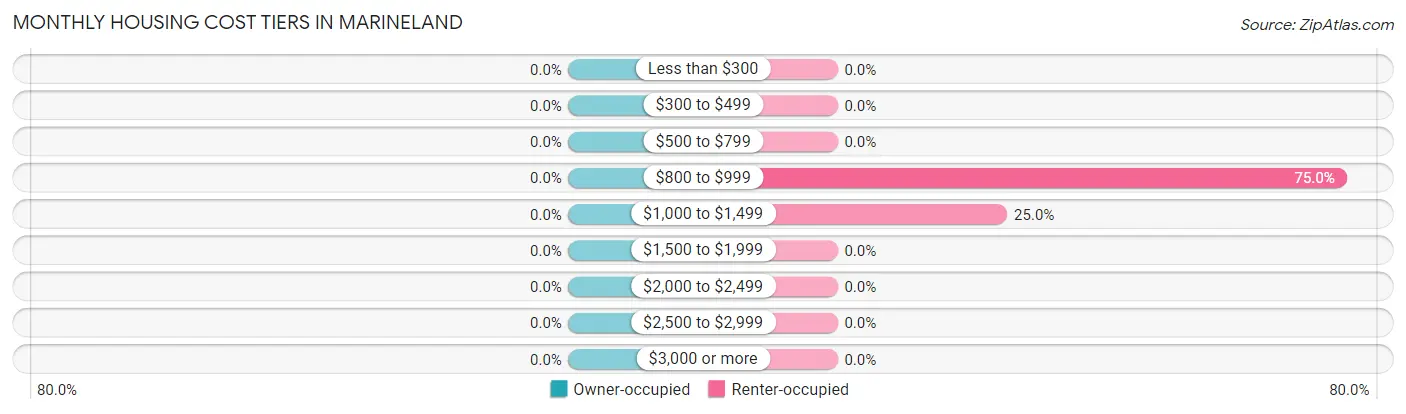
Monthly Housing Cost Tiers in Marineland
Monthly Cost
Owner-occupied
Renter-occupied
Less than $300
0 (0.0%)
0 (0.0%)
$300 to $499
0 (0.0%)
0 (0.0%)
$500 to $799
0 (0.0%)
0 (0.0%)
$800 to $999
0 (0.0%)
3 (75.0%)
$1,000 to $1,499
0 (0.0%)
1 (25.0%)
$1,500 to $1,999
0 (0.0%)
0 (0.0%)
$2,000 to $2,499
0 (0.0%)
0 (0.0%)
$2,500 to $2,999
0 (0.0%)
0 (0.0%)
$3,000 or more
0 (0.0%)
0 (0.0%)
Total
0 (0.0%)
4 (100.0%)
Physical Housing Characteristics in Marineland
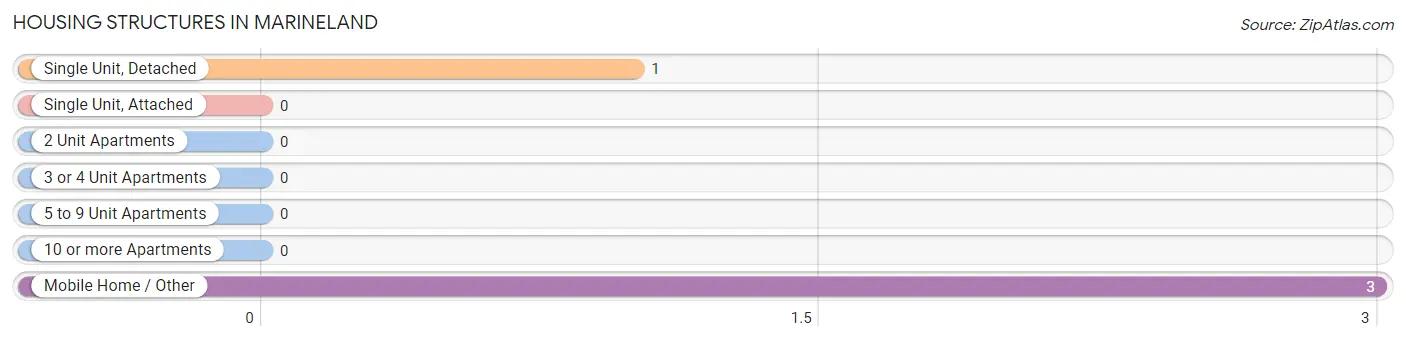
Housing Structures in Marineland
Structure Type
# Housing Units
% Housing Units
Single Unit, Detached
1
25.0%
Single Unit, Attached
0
0.0%
2 Unit Apartments
0
0.0%
3 or 4 Unit Apartments
0
0.0%
5 to 9 Unit Apartments
0
0.0%
10 or more Apartments
0
0.0%
Mobile Home / Other
3
75.0%
Total
4
100.0%
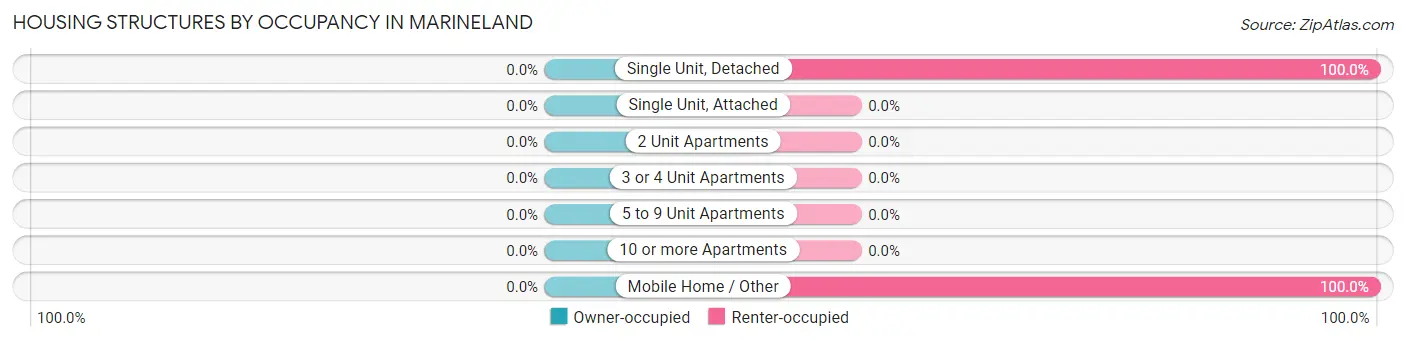
Housing Structures by Occupancy in Marineland
Structure Type
Owner-occupied
Renter-occupied
Single Unit, Detached
0 (0.0%)
1 (100.0%)
Single Unit, Attached
0 (0.0%)
0 (0.0%)
2 Unit Apartments
0 (0.0%)
0 (0.0%)
3 or 4 Unit Apartments
0 (0.0%)
0 (0.0%)
5 to 9 Unit Apartments
0 (0.0%)
0 (0.0%)
10 or more Apartments
0 (0.0%)
0 (0.0%)
Mobile Home / Other
0 (0.0%)
3 (100.0%)
Total
0 (0.0%)
4 (100.0%)
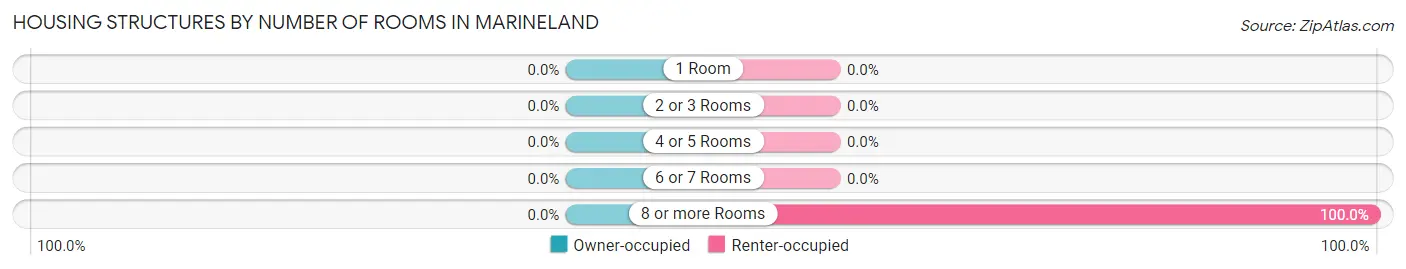
Housing Structures by Number of Rooms in Marineland
Number of Rooms
Owner-occupied
Renter-occupied
1 Room
0 (0.0%)
0 (0.0%)
2 or 3 Rooms
0 (0.0%)
0 (0.0%)
4 or 5 Rooms
0 (0.0%)
0 (0.0%)
6 or 7 Rooms
0 (0.0%)
0 (0.0%)
8 or more Rooms
0 (0.0%)
4 (100.0%)
Total
0 (0.0%)
4 (100.0%)
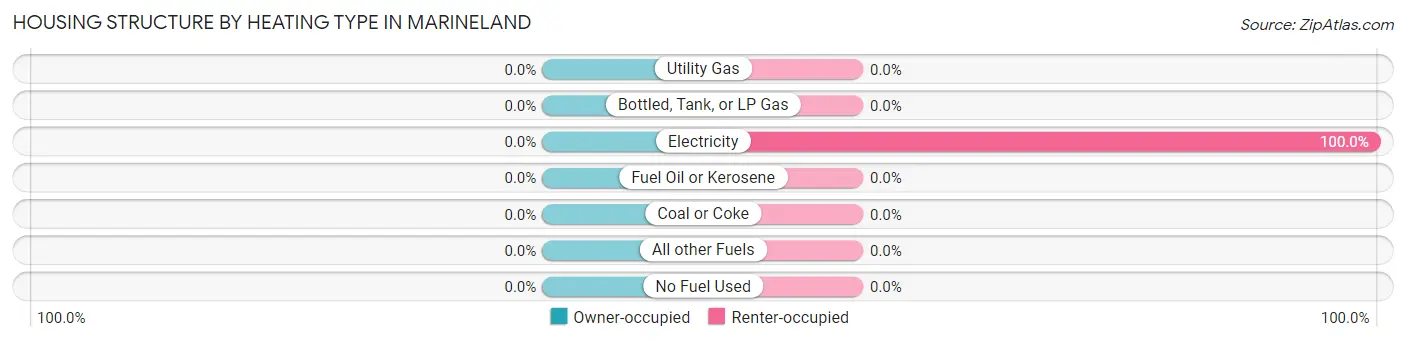
Housing Structure by Heating Type in Marineland
Heating Type
Owner-occupied
Renter-occupied
Utility Gas
0 (0.0%)
0 (0.0%)
Bottled, Tank, or LP Gas
0 (0.0%)
0 (0.0%)
Electricity
0 (0.0%)
4 (100.0%)
Fuel Oil or Kerosene
0 (0.0%)
0 (0.0%)
Coal or Coke
0 (0.0%)
0 (0.0%)
All other Fuels
0 (0.0%)
0 (0.0%)
No Fuel Used
0 (0.0%)
0 (0.0%)
Total
0 (0.0%)
4 (100.0%)
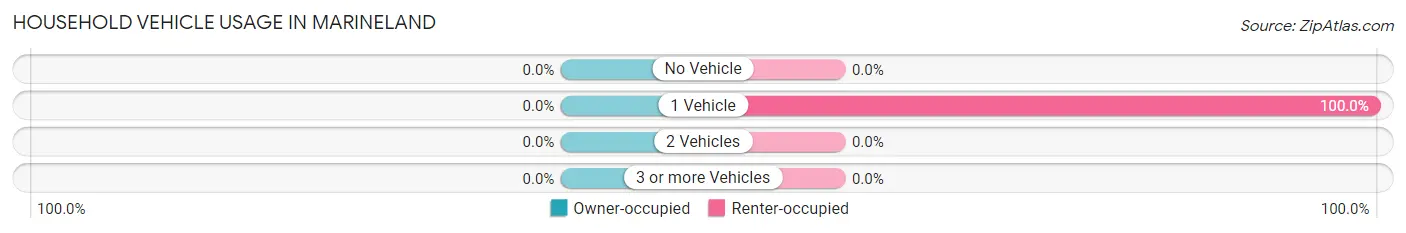
Household Vehicle Usage in Marineland
Vehicles per Household
Owner-occupied
Renter-occupied
No Vehicle
0 (0.0%)
0 (0.0%)
1 Vehicle
0 (0.0%)
4 (100.0%)
2 Vehicles
0 (0.0%)
0 (0.0%)
3 or more Vehicles
0 (0.0%)
0 (0.0%)
Total
0 (0.0%)
4 (100.0%)
Real Estate & Mortgages in Marineland
Real Estate and Mortgage Overview in Marineland
Characteristic
Without Mortgage
With Mortgage
Housing Units
0
0
Median Property Value
-
-
Median Household Income
-
-
Monthly Housing Costs
-
-
Real Estate Taxes
-
-
Property Value by Mortgage Status in Marineland
Property Value
Without Mortgage
With Mortgage
Less than $50,000
0 (0.0%)
0 (0.0%)
$50,000 to $99,999
0 (0.0%)
0 (0.0%)
$100,000 to $299,999
0 (0.0%)
0 (0.0%)
$300,000 to $499,999
0 (0.0%)
0 (0.0%)
$500,000 to $749,999
0 (0.0%)
0 (0.0%)
$750,000 to $999,999
0 (0.0%)
0 (0.0%)
$1,000,000 or more
0 (0.0%)
0 (0.0%)
Total
0 (0.0%)
0 (0.0%)
Household Income by Mortgage Status in Marineland
Household Income
Without Mortgage
With Mortgage
Less than $10,000
0 (0.0%)
0 (0.0%)
$10,000 to $24,999
0 (0.0%)
0 (0.0%)
$25,000 to $34,999
0 (0.0%)
0 (0.0%)
$35,000 to $49,999
0 (0.0%)
0 (0.0%)
$50,000 to $74,999
0 (0.0%)
0 (0.0%)
$75,000 to $99,999
0 (0.0%)
0 (0.0%)
$100,000 to $149,999
0 (0.0%)
0 (0.0%)
$150,000 or more
0 (0.0%)
0 (0.0%)
Total
0 (0.0%)
0 (0.0%)
Property Value to Household Income Ratio in Marineland
Value-to-Income Ratio
Without Mortgage
With Mortgage
Less than 2.0x
0 (0.0%)
0 (0.0%)
2.0x to 2.9x
0 (0.0%)
0 (0.0%)
3.0x to 3.9x
0 (0.0%)
0 (0.0%)
4.0x or more
0 (0.0%)
0 (0.0%)
Total
0 (0.0%)
0 (0.0%)
Real Estate Taxes by Mortgage Status in Marineland
Property Taxes
Without Mortgage
With Mortgage
Less than $800
0 (0.0%)
0 (0.0%)
$800 to $1,499
0 (0.0%)
0 (0.0%)
$800 to $1,499
0 (0.0%)
0 (0.0%)
Total
0 (0.0%)
0 (0.0%)
Health & Disability in Marineland
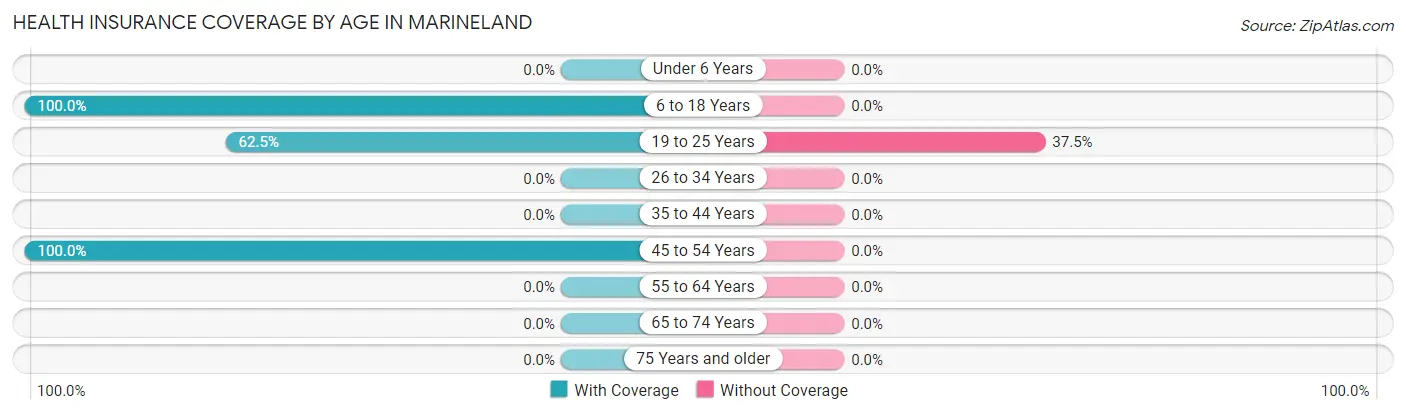
Health Insurance Coverage by Age in Marineland
Age Bracket
With Coverage
Without Coverage
Under 6 Years
0 (0.0%)
0 (0.0%)
6 to 18 Years
1 (100.0%)
0 (0.0%)
19 to 25 Years
5 (62.5%)
3 (37.5%)
26 to 34 Years
0 (0.0%)
0 (0.0%)
35 to 44 Years
0 (0.0%)
0 (0.0%)
45 to 54 Years
3 (100.0%)
0 (0.0%)
55 to 64 Years
0 (0.0%)
0 (0.0%)
65 to 74 Years
0 (0.0%)
0 (0.0%)
75 Years and older
0 (0.0%)
0 (0.0%)
Total
9 (75.0%)
3 (25.0%)
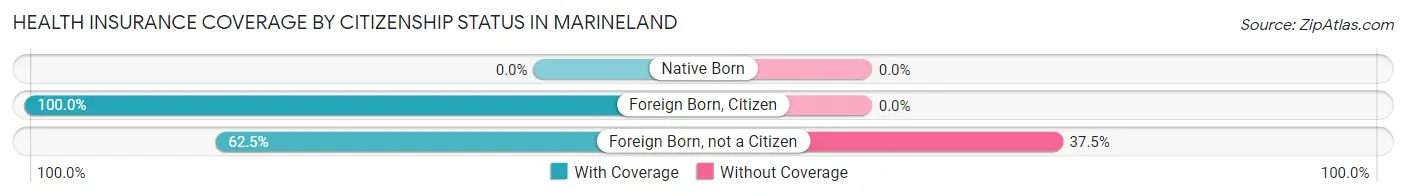
Health Insurance Coverage by Citizenship Status in Marineland
Citizenship Status
With Coverage
Without Coverage
Native Born
0 (0.0%)
0 (0.0%)
Foreign Born, Citizen
1 (100.0%)
0 (0.0%)
Foreign Born, not a Citizen
5 (62.5%)
3 (37.5%)
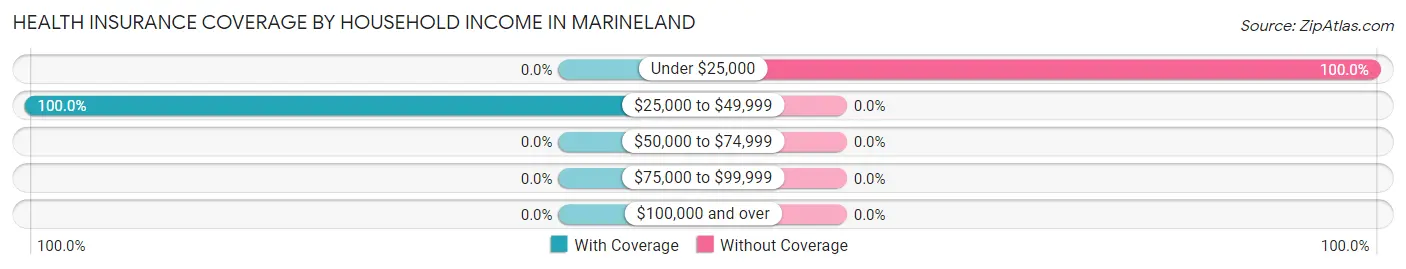
Health Insurance Coverage by Household Income in Marineland
Household Income
With Coverage
Without Coverage
Under $25,000
0 (0.0%)
1 (100.0%)
$25,000 to $49,999
3 (100.0%)
0 (0.0%)
$50,000 to $74,999
0 (0.0%)
0 (0.0%)
$75,000 to $99,999
0 (0.0%)
0 (0.0%)
$100,000 and over
0 (0.0%)
0 (0.0%)
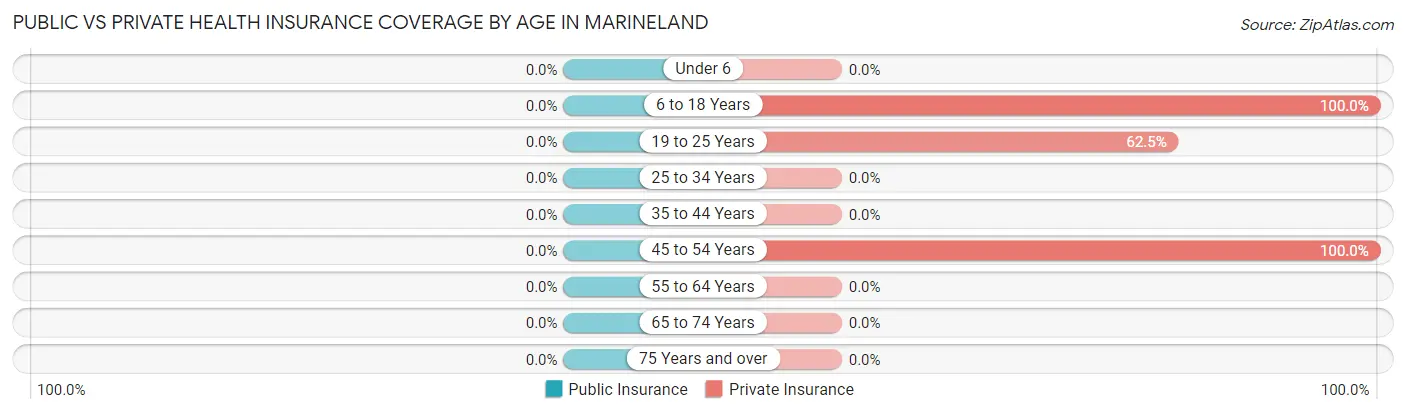
Public vs Private Health Insurance Coverage by Age in Marineland
Age Bracket
Public Insurance
Private Insurance
Under 6
0 (0.0%)
0 (0.0%)
6 to 18 Years
0 (0.0%)
1 (100.0%)
19 to 25 Years
0 (0.0%)
5 (62.5%)
25 to 34 Years
0 (0.0%)
0 (0.0%)
35 to 44 Years
0 (0.0%)
0 (0.0%)
45 to 54 Years
0 (0.0%)
3 (100.0%)
55 to 64 Years
0 (0.0%)
0 (0.0%)
65 to 74 Years
0 (0.0%)
0 (0.0%)
75 Years and over
0 (0.0%)
0 (0.0%)
Total
0 (0.0%)
9 (75.0%)
Disability Status by Sex by Age in Marineland
Age Bracket
Male
Female
Under 5 Years
0 (0.0%)
0 (0.0%)
5 to 17 Years
0 (0.0%)
0 (0.0%)
18 to 34 Years
0 (0.0%)
0 (0.0%)
35 to 64 Years
0 (0.0%)
0 (0.0%)
65 to 74 Years
0 (0.0%)
0 (0.0%)
75 Years and over
0 (0.0%)
0 (0.0%)
Disability Class by Sex by Age in Marineland
Disability Class: Hearing Difficulty
Age Bracket
Male
Female
Under 5 Years
0 (0.0%)
0 (0.0%)
5 to 17 Years
0 (0.0%)
0 (0.0%)
18 to 34 Years
0 (0.0%)
0 (0.0%)
35 to 64 Years
0 (0.0%)
0 (0.0%)
65 to 74 Years
0 (0.0%)
0 (0.0%)
75 Years and over
0 (0.0%)
0 (0.0%)
Disability Class: Vision Difficulty
Age Bracket
Male
Female
Under 5 Years
0 (0.0%)
0 (0.0%)
5 to 17 Years
0 (0.0%)
0 (0.0%)
18 to 34 Years
0 (0.0%)
0 (0.0%)
35 to 64 Years
0 (0.0%)
0 (0.0%)
65 to 74 Years
0 (0.0%)
0 (0.0%)
75 Years and over
0 (0.0%)
0 (0.0%)
Disability Class: Cognitive Difficulty
Age Bracket
Male
Female
5 to 17 Years
0 (0.0%)
0 (0.0%)
18 to 34 Years
0 (0.0%)
0 (0.0%)
35 to 64 Years
0 (0.0%)
0 (0.0%)
65 to 74 Years
0 (0.0%)
0 (0.0%)
75 Years and over
0 (0.0%)
0 (0.0%)
Disability Class: Ambulatory Difficulty
Age Bracket
Male
Female
5 to 17 Years
0 (0.0%)
0 (0.0%)
18 to 34 Years
0 (0.0%)
0 (0.0%)
35 to 64 Years
0 (0.0%)
0 (0.0%)
65 to 74 Years
0 (0.0%)
0 (0.0%)
75 Years and over
0 (0.0%)
0 (0.0%)
Disability Class: Self-Care Difficulty
Age Bracket
Male
Female
5 to 17 Years
0 (0.0%)
0 (0.0%)
18 to 34 Years
0 (0.0%)
0 (0.0%)
35 to 64 Years
0 (0.0%)
0 (0.0%)
65 to 74 Years
0 (0.0%)
0 (0.0%)
75 Years and over
0 (0.0%)
0 (0.0%)
Technology Access in Marineland
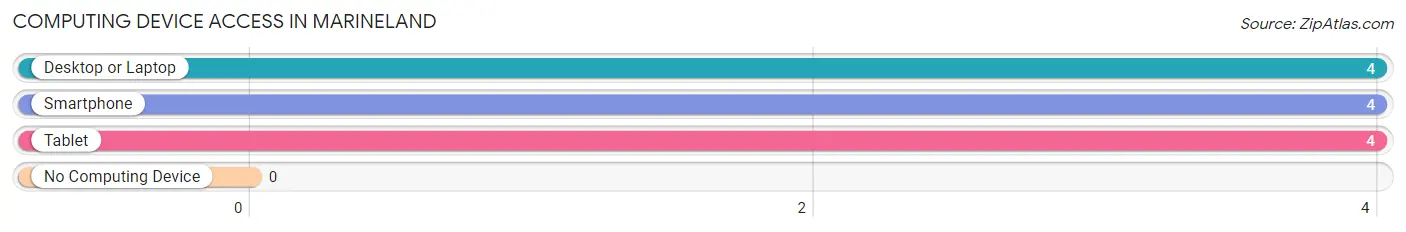
Computing Device Access in Marineland
Device Type
# Households
% Households
Desktop or Laptop
4
100.0%
Smartphone
4
100.0%
Tablet
4
100.0%
No Computing Device
0
0.0%
Total
4
100.0%
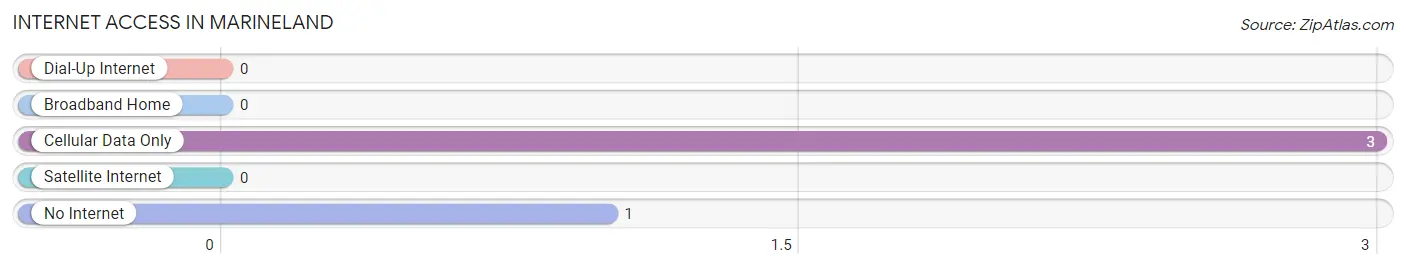
Internet Access in Marineland
Internet Type
# Households
% Households
Dial-Up Internet
0
0.0%
Broadband Home
0
0.0%
Cellular Data Only
3
75.0%
Satellite Internet
0
0.0%
No Internet
1
25.0%
Total
4
100.0%
Marineland Summary
Marineland, Florida is a small coastal town located in St. Johns County, Florida. It is situated on the Atlantic Ocean, just south of St. Augustine. The town was founded in 1938 by the Marineland Corporation, which was established to create a marine park and aquarium. The town has a population of approximately 500 people and is a popular tourist destination.
History
Marineland was founded in 1938 by the Marineland Corporation, which was established to create a marine park and aquarium. The park was designed to be a tourist attraction and to provide educational opportunities for visitors. The park was opened to the public in 1938 and quickly became a popular destination for tourists. The park featured a variety of marine life, including dolphins, sea lions, and sharks. The park also featured a variety of educational exhibits and activities.
In the 1950s, Marineland began to focus more on entertainment and began to feature shows with trained dolphins and sea lions. The park also began to feature a variety of other attractions, such as a water slide and a roller coaster. In the 1960s, Marineland began to focus more on conservation and research and began to feature a variety of educational exhibits and activities.
In the 1970s, Marineland began to focus more on conservation and research and began to feature a variety of educational exhibits and activities. In the 1980s, Marineland began to focus more on entertainment and began to feature shows with trained dolphins and sea lions. In the 1990s, Marineland began to focus more on conservation and research and began to feature a variety of educational exhibits and activities.
Geography
Marineland is located in St. Johns County, Florida. It is situated on the Atlantic Ocean, just south of St. Augustine. The town is located on the Intracoastal Waterway and is surrounded by a variety of natural habitats, including salt marshes, mangroves, and estuaries. The town is also located near a variety of recreational areas, including beaches, parks, and nature preserves.
Economy
Marineland’s economy is largely based on tourism. The town is home to the Marineland Aquarium and Marine Park, which is a popular tourist destination. The park features a variety of marine life, including dolphins, sea lions, and sharks. The park also features a variety of educational exhibits and activities. The town also has a variety of restaurants, shops, and other businesses that cater to tourists.
Demographics
As of the 2010 census, Marineland had a population of 500 people. The town has a median age of 44.7 years and a median household income of $41,250. The town is predominantly white, with 87.2% of the population identifying as white. The town also has a small Hispanic population, with 8.2% of the population identifying as Hispanic or Latino. The town also has a small African American population, with 2.2% of the population identifying as African American.
Common Questions
What is Per Capita Income in Marineland?
Per Capita income in Marineland is $16,867.
What is Inequality or Gini Index in Marineland?
Inequality or Gini Index in Marineland is 0.11.
What is the Total Population of Marineland?
Total Population of Marineland is 12.
What is the Total Male Population of Marineland?
Total Male Population of Marineland is 4.
What is the Total Female Population of Marineland?
Total Female Population of Marineland is 8.
What is the Ratio of Males per 100 Females in Marineland?
There are 50.00 Males per 100 Females in Marineland.
What is the Ratio of Females per 100 Males in Marineland?
There are 200.00 Females per 100 Males in Marineland.
What is the Median Population Age in Marineland?
Median Population Age in Marineland is 22.0 Years.
How Large is the Labor Force in Marineland?
There are 7 People in the Labor Forcein in Marineland.
What is the Percentage of People in the Labor Force in Marineland?
58.3% of People are in the Labor Force in Marineland.
Report Title
Report Link
HTML Copy & Paste Link
Social Media
Copy and paste the folowing code into any webpage where you would like this interactive chart to display