Johnson Village, CO Map & Demographics
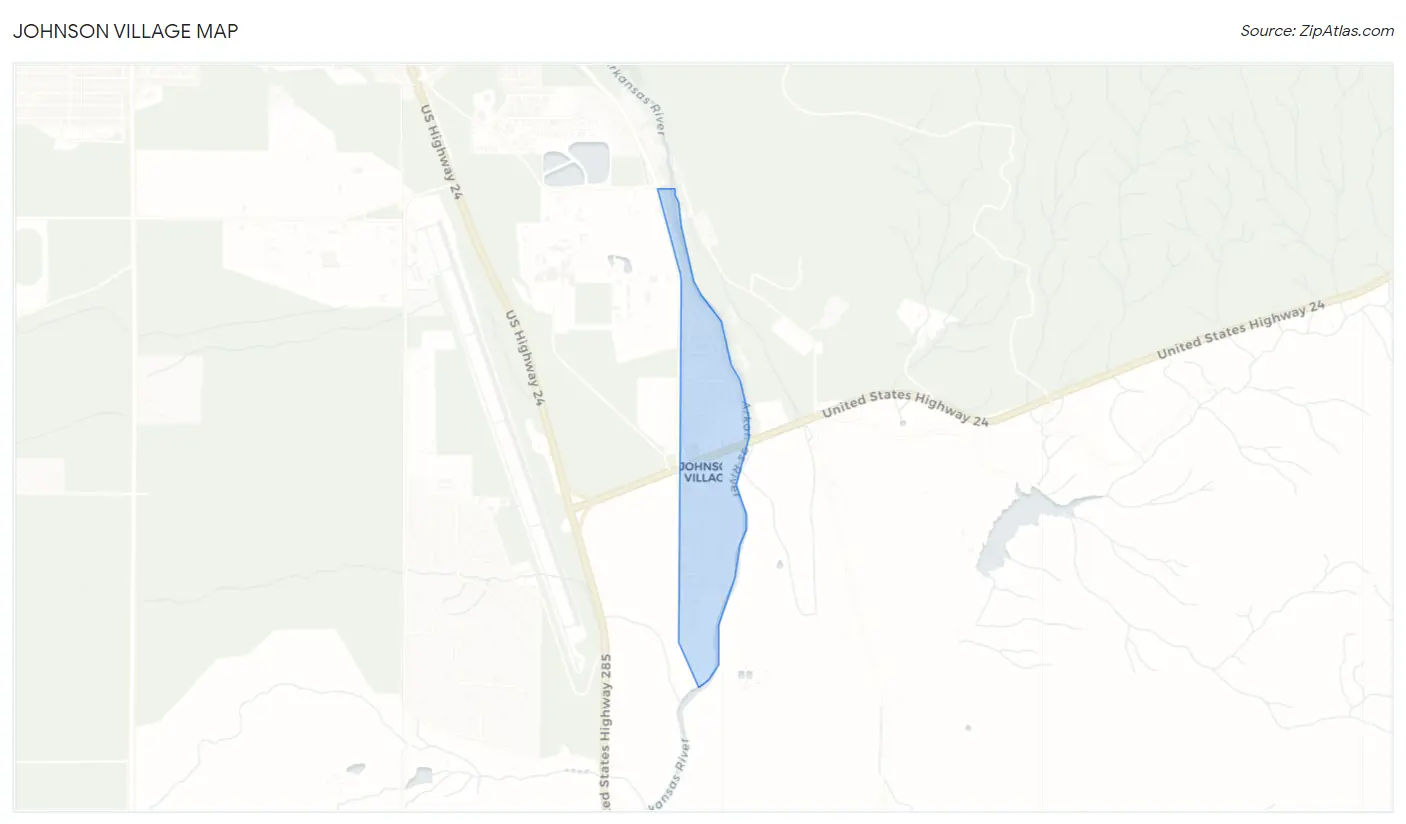
Johnson Village Map
Johnson Village Overview
$34,754
PER CAPITA INCOME
$65,655
AVG HOUSEHOLD INCOME
0.21
INEQUALITY / GINI INDEX
314
TOTAL POPULATION
128
MALE POPULATION
186
FEMALE POPULATION
68.82
MALES / 100 FEMALES
145.31
FEMALES / 100 MALES
60.5
MEDIAN AGE
2.0
AVG FAMILY SIZE
1.2
AVG HOUSEHOLD SIZE
192
LABOR FORCE [ PEOPLE ]
61.1%
PERCENT IN LABOR FORCE
6.8%
UNEMPLOYMENT RATE
Income in Johnson Village
Income Overview in Johnson Village
| Characteristic | Number | Measure |
| Per Capita Income | 314 | $34,754 |
| Median Family Income | 34 | $0 |
| Mean Family Income | 34 | $0 |
| Median Household Income | 251 | $65,655 |
| Mean Household Income | 251 | $57,741 |
| Income Deficit | 34 | $0 |
| Wage / Income Gap (%) | 314 | 0.00% |
| Wage / Income Gap ($) | 314 | 100.00¢ per $1 |
| Gini / Inequality Index | 314 | 0.21 |
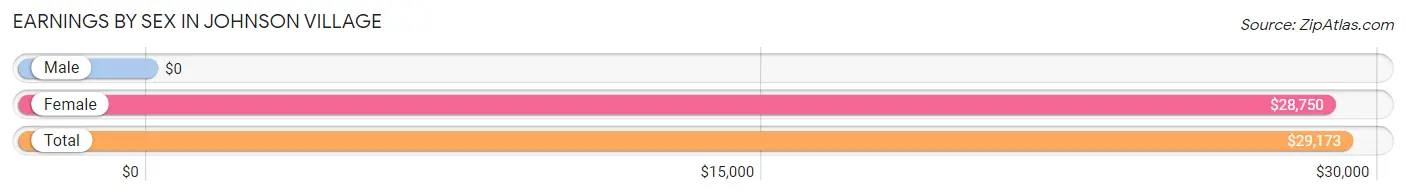
Earnings by Sex in Johnson Village
| Sex | Number | Average Earnings |
| Male | 42 (21.9%) | $0 |
| Female | 150 (78.1%) | $28,750 |
| Total | 192 (100.0%) | $29,173 |
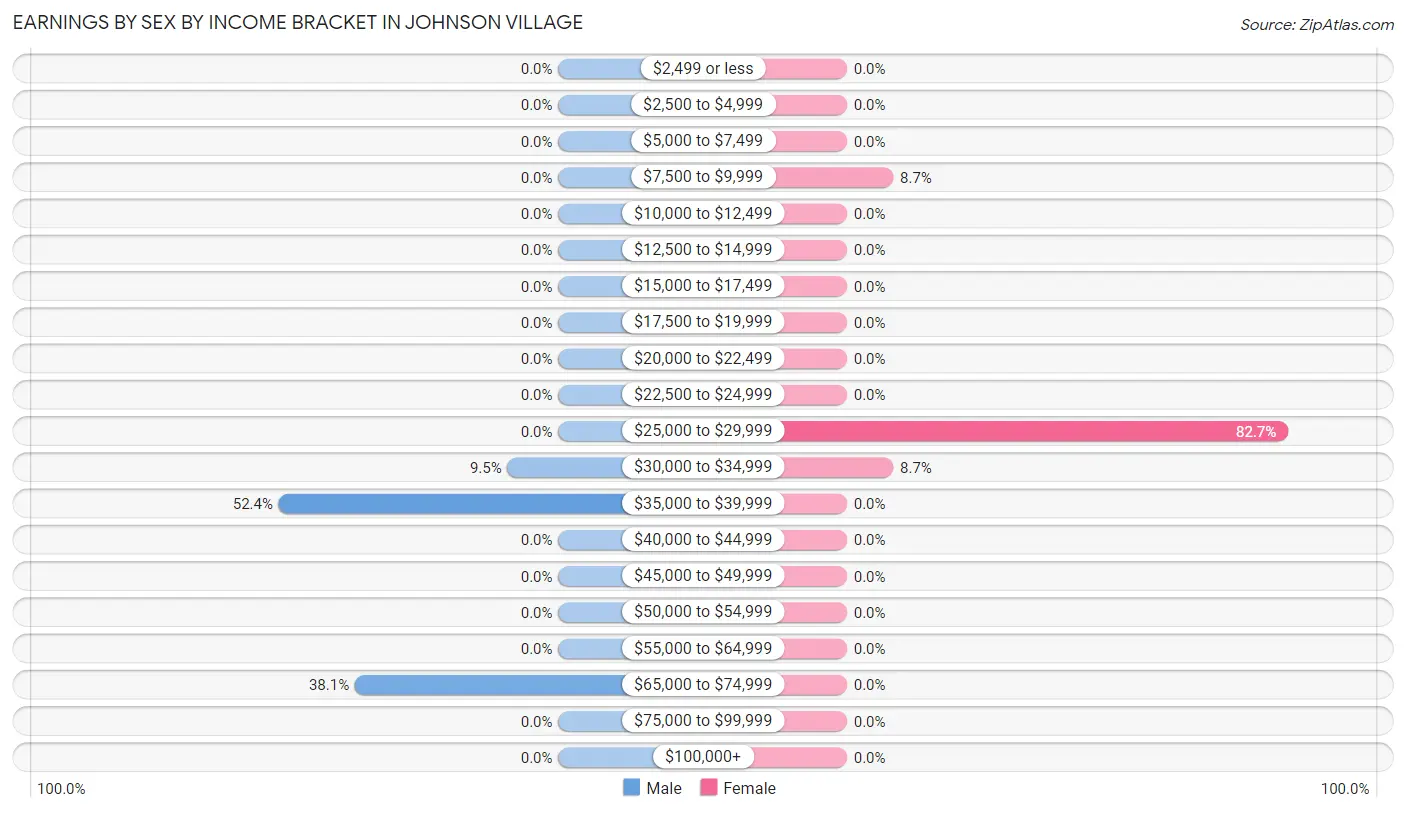
Earnings by Sex by Income Bracket in Johnson Village
The most common earnings brackets in Johnson Village are $35,000 to $39,999 for men (22 | 52.4%) and $25,000 to $29,999 for women (124 | 82.7%).
| Income | Male | Female |
| $2,499 or less | 0 (0.0%) | 0 (0.0%) |
| $2,500 to $4,999 | 0 (0.0%) | 0 (0.0%) |
| $5,000 to $7,499 | 0 (0.0%) | 0 (0.0%) |
| $7,500 to $9,999 | 0 (0.0%) | 13 (8.7%) |
| $10,000 to $12,499 | 0 (0.0%) | 0 (0.0%) |
| $12,500 to $14,999 | 0 (0.0%) | 0 (0.0%) |
| $15,000 to $17,499 | 0 (0.0%) | 0 (0.0%) |
| $17,500 to $19,999 | 0 (0.0%) | 0 (0.0%) |
| $20,000 to $22,499 | 0 (0.0%) | 0 (0.0%) |
| $22,500 to $24,999 | 0 (0.0%) | 0 (0.0%) |
| $25,000 to $29,999 | 0 (0.0%) | 124 (82.7%) |
| $30,000 to $34,999 | 4 (9.5%) | 13 (8.7%) |
| $35,000 to $39,999 | 22 (52.4%) | 0 (0.0%) |
| $40,000 to $44,999 | 0 (0.0%) | 0 (0.0%) |
| $45,000 to $49,999 | 0 (0.0%) | 0 (0.0%) |
| $50,000 to $54,999 | 0 (0.0%) | 0 (0.0%) |
| $55,000 to $64,999 | 0 (0.0%) | 0 (0.0%) |
| $65,000 to $74,999 | 16 (38.1%) | 0 (0.0%) |
| $75,000 to $99,999 | 0 (0.0%) | 0 (0.0%) |
| $100,000+ | 0 (0.0%) | 0 (0.0%) |
| Total | 42 (100.0%) | 150 (100.0%) |
Earnings by Sex by Educational Attainment in Johnson Village
| Educational Attainment | Male Income | Female Income |
| Less than High School | - | - |
| High School Diploma | - | - |
| College or Associate's Degree | - | - |
| Bachelor's Degree | - | - |
| Graduate Degree | - | - |
| Total | - | - |
Family Income in Johnson Village
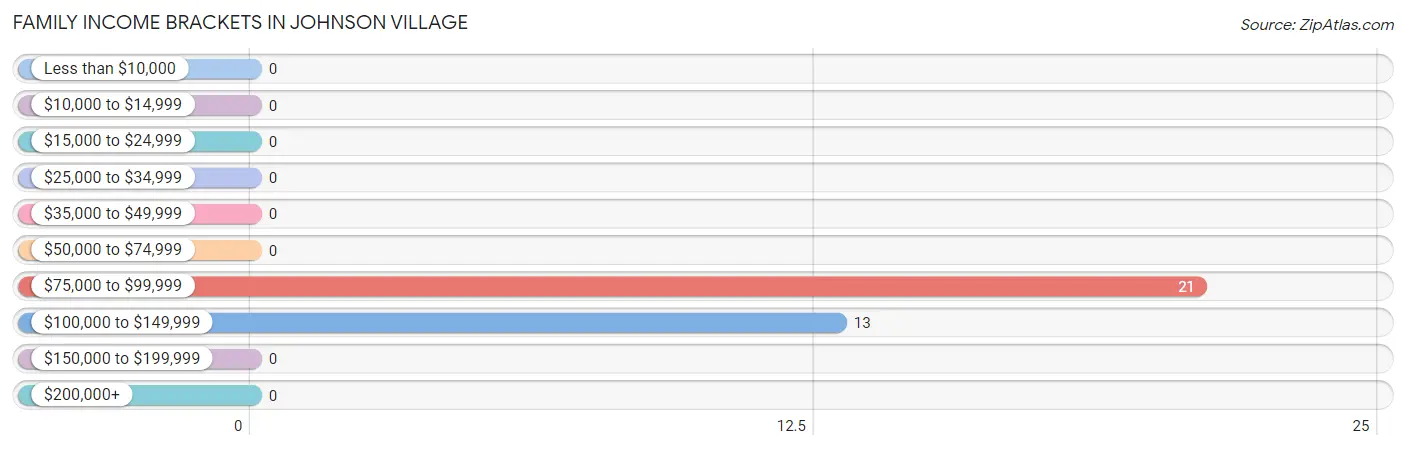
Family Income Brackets in Johnson Village
According to the Johnson Village family income data, there are 21 families falling into the $75,000 to $99,999 income range, which is the most common income bracket and makes up 61.8% of all families.
| Income Bracket | # Families | % Families |
| Less than $10,000 | 0 | 0.0% |
| $10,000 to $14,999 | 0 | 0.0% |
| $15,000 to $24,999 | 0 | 0.0% |
| $25,000 to $34,999 | 0 | 0.0% |
| $35,000 to $49,999 | 0 | 0.0% |
| $50,000 to $74,999 | 0 | 0.0% |
| $75,000 to $99,999 | 21 | 61.8% |
| $100,000 to $149,999 | 13 | 38.2% |
| $150,000 to $199,999 | 0 | 0.0% |
| $200,000+ | 0 | 0.0% |
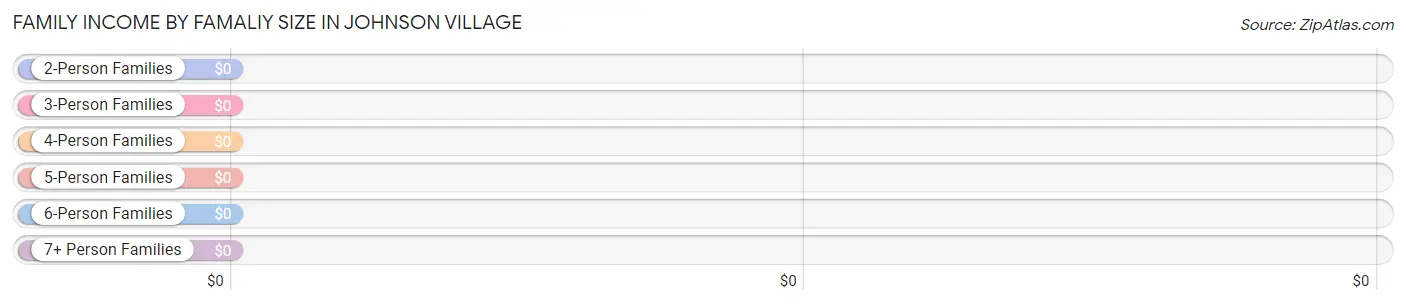
Family Income by Famaliy Size in Johnson Village
| Income Bracket | # Families | Median Income |
| 2-Person Families | 34 (100.0%) | $0 |
| 3-Person Families | 0 (0.0%) | $0 |
| 4-Person Families | 0 (0.0%) | $0 |
| 5-Person Families | 0 (0.0%) | $0 |
| 6-Person Families | 0 (0.0%) | $0 |
| 7+ Person Families | 0 (0.0%) | $0 |
| Total | 34 (100.0%) | $0 |
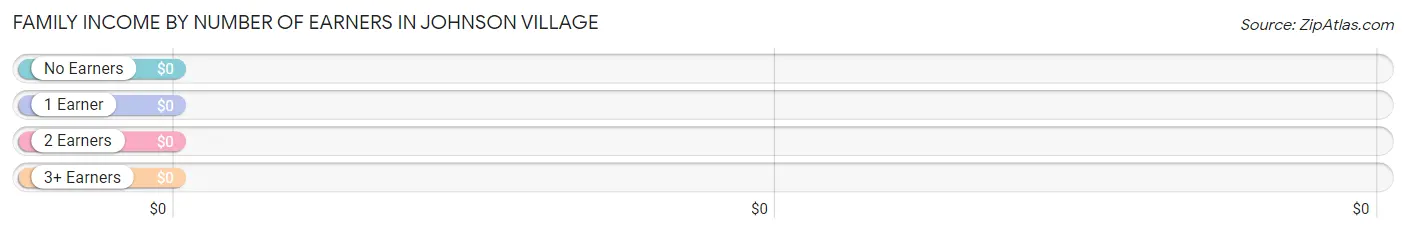
Family Income by Number of Earners in Johnson Village
| Number of Earners | # Families | Median Income |
| No Earners | 21 (61.8%) | $0 |
| 1 Earner | 0 (0.0%) | $0 |
| 2 Earners | 13 (38.2%) | $0 |
| 3+ Earners | 0 (0.0%) | $0 |
| Total | 34 (100.0%) | $0 |
Household Income in Johnson Village
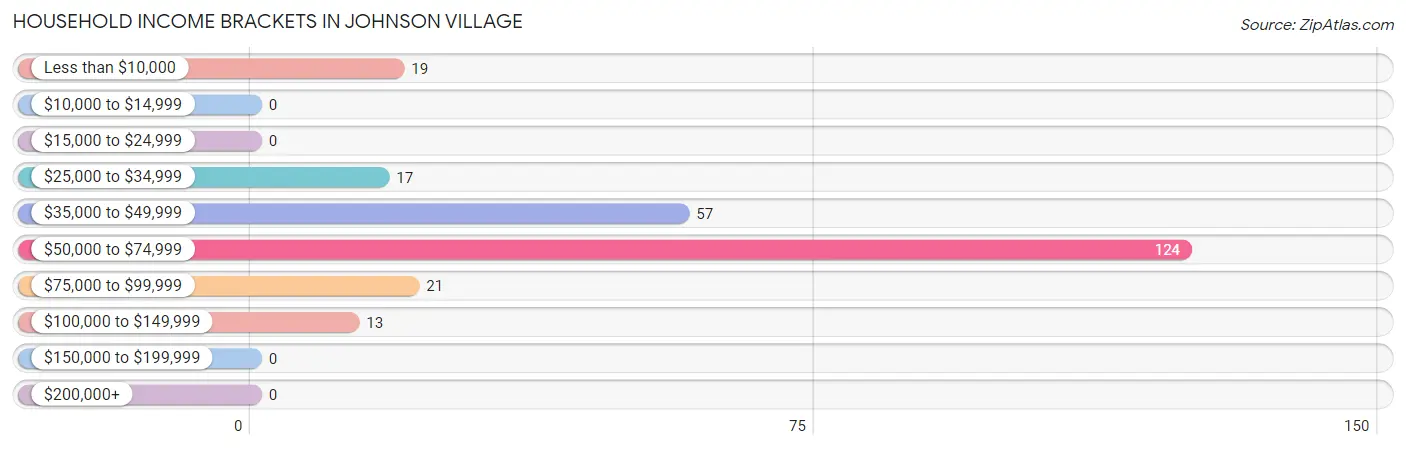
Household Income Brackets in Johnson Village
With 124 households falling in the category, the $50,000 to $74,999 income range is the most frequent in Johnson Village, accounting for 49.4% of all households.
| Income Bracket | # Households | % Households |
| Less than $10,000 | 19 | 7.6% |
| $10,000 to $14,999 | 0 | 0.0% |
| $15,000 to $24,999 | 0 | 0.0% |
| $25,000 to $34,999 | 17 | 6.8% |
| $35,000 to $49,999 | 57 | 22.7% |
| $50,000 to $74,999 | 124 | 49.4% |
| $75,000 to $99,999 | 21 | 8.4% |
| $100,000 to $149,999 | 13 | 5.2% |
| $150,000 to $199,999 | 0 | 0.0% |
| $200,000+ | 0 | 0.0% |
Household Income by Householder Age in Johnson Village
The median household income in Johnson Village is $65,655, with the highest median household income of $43,509 found in the 65+ years age bracket for the primary householder. A total of 110 households (43.8%) fall into this category. Meanwhile, the 15 to 24 years age bracket for the primary householder has the lowest median household income of $0, with 124 households (49.4%) in this group.
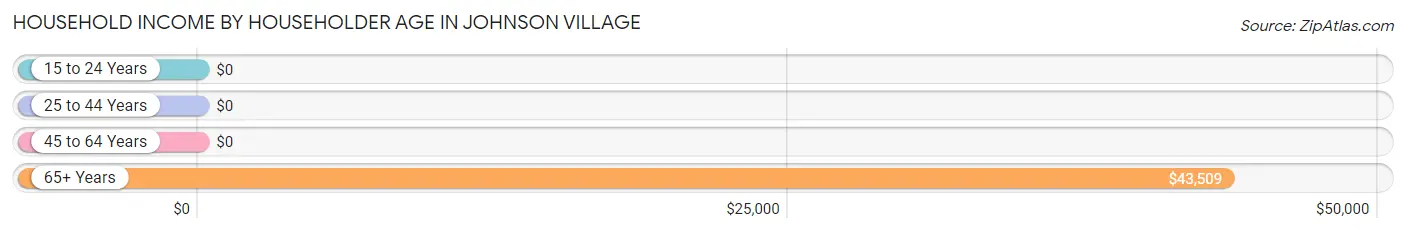
| Income Bracket | # Households | Median Income |
| 15 to 24 Years | 124 (49.4%) | $0 |
| 25 to 44 Years | 0 (0.0%) | $0 |
| 45 to 64 Years | 17 (6.8%) | $0 |
| 65+ Years | 110 (43.8%) | $43,509 |
| Total | 251 (100.0%) | $65,655 |
Poverty in Johnson Village
Income Below Poverty by Sex and Age in Johnson Village
With 6.2% poverty level for males and 10.2% for females among the residents of Johnson Village, 75 year old and over males and 65 to 74 year old females are the most vulnerable to poverty, with 8 males (12.3%) and 19 females (100.0%) in their respective age groups living below the poverty level.
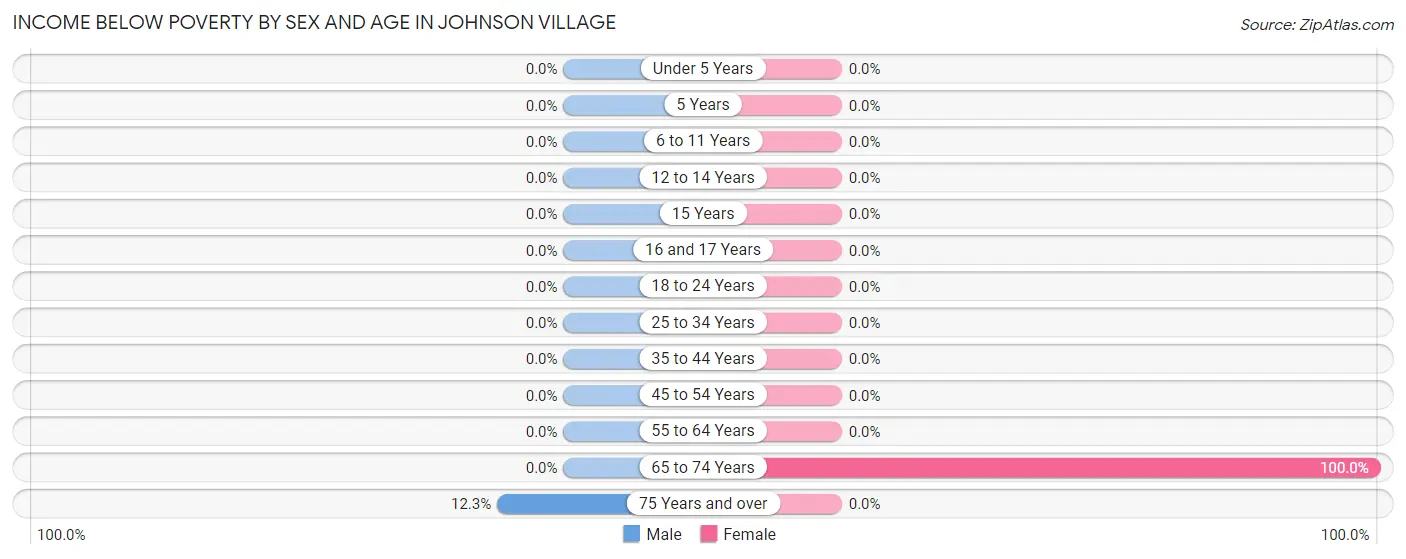
| Age Bracket | Male | Female |
| Under 5 Years | 0 (0.0%) | 0 (0.0%) |
| 5 Years | 0 (0.0%) | 0 (0.0%) |
| 6 to 11 Years | 0 (0.0%) | 0 (0.0%) |
| 12 to 14 Years | 0 (0.0%) | 0 (0.0%) |
| 15 Years | 0 (0.0%) | 0 (0.0%) |
| 16 and 17 Years | 0 (0.0%) | 0 (0.0%) |
| 18 to 24 Years | 0 (0.0%) | 0 (0.0%) |
| 25 to 34 Years | 0 (0.0%) | 0 (0.0%) |
| 35 to 44 Years | 0 (0.0%) | 0 (0.0%) |
| 45 to 54 Years | 0 (0.0%) | 0 (0.0%) |
| 55 to 64 Years | 0 (0.0%) | 0 (0.0%) |
| 65 to 74 Years | 0 (0.0%) | 19 (100.0%) |
| 75 Years and over | 8 (12.3%) | 0 (0.0%) |
| Total | 8 (6.2%) | 19 (10.2%) |
Income Above Poverty by Sex and Age in Johnson Village
According to the poverty statistics in Johnson Village, males aged 18 to 24 years and females aged 18 to 24 years are the age groups that are most secure financially, with 100.0% of males and 100.0% of females in these age groups living above the poverty line.
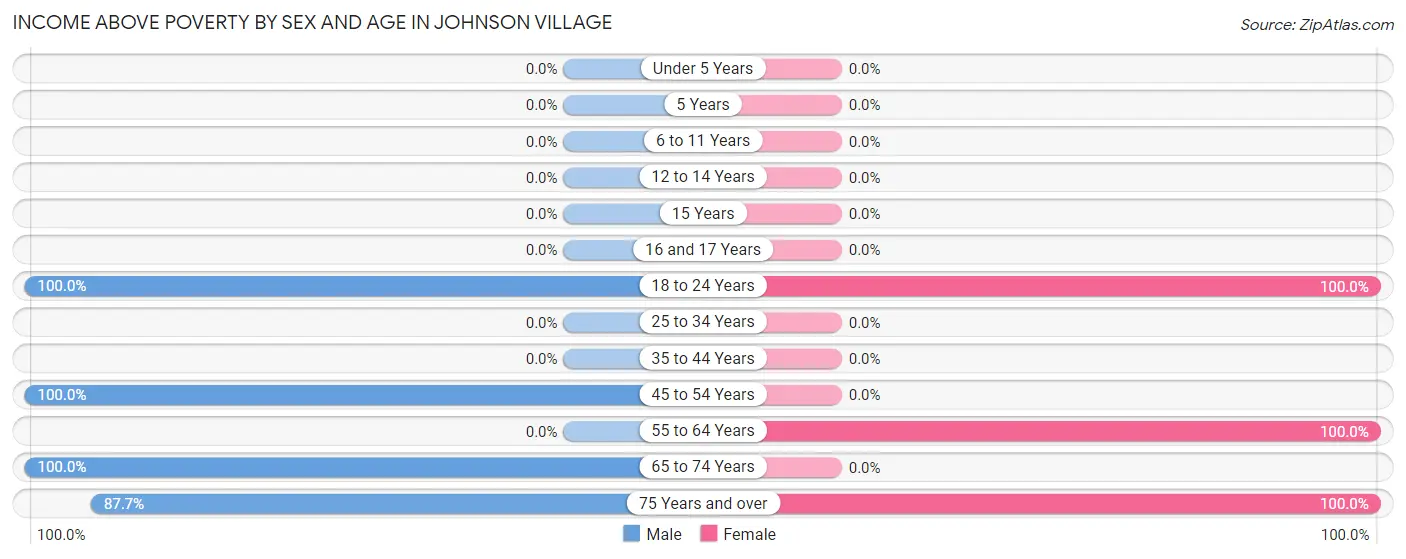
| Age Bracket | Male | Female |
| Under 5 Years | 0 (0.0%) | 0 (0.0%) |
| 5 Years | 0 (0.0%) | 0 (0.0%) |
| 6 to 11 Years | 0 (0.0%) | 0 (0.0%) |
| 12 to 14 Years | 0 (0.0%) | 0 (0.0%) |
| 15 Years | 0 (0.0%) | 0 (0.0%) |
| 16 and 17 Years | 0 (0.0%) | 0 (0.0%) |
| 18 to 24 Years | 22 (100.0%) | 124 (100.0%) |
| 25 to 34 Years | 0 (0.0%) | 0 (0.0%) |
| 35 to 44 Years | 0 (0.0%) | 0 (0.0%) |
| 45 to 54 Years | 4 (100.0%) | 0 (0.0%) |
| 55 to 64 Years | 0 (0.0%) | 30 (100.0%) |
| 65 to 74 Years | 37 (100.0%) | 0 (0.0%) |
| 75 Years and over | 57 (87.7%) | 13 (100.0%) |
| Total | 120 (93.8%) | 167 (89.8%) |
Income Below Poverty Among Married-Couple Families in Johnson Village
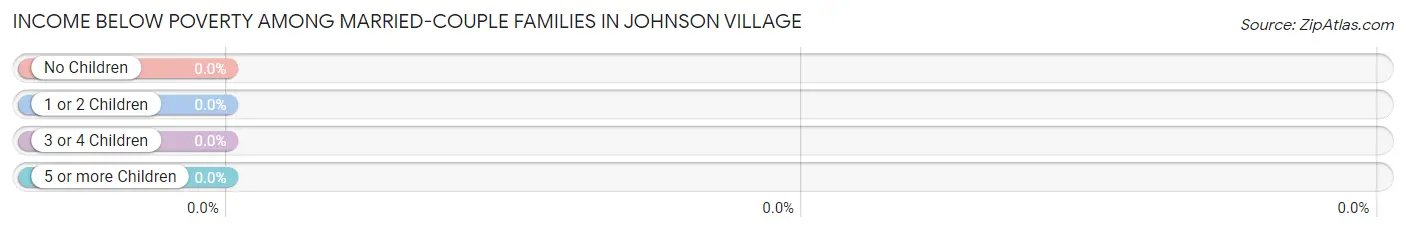
| Children | Above Poverty | Below Poverty |
| No Children | 34 (100.0%) | 0 (0.0%) |
| 1 or 2 Children | 0 (0.0%) | 0 (0.0%) |
| 3 or 4 Children | 0 (0.0%) | 0 (0.0%) |
| 5 or more Children | 0 (0.0%) | 0 (0.0%) |
| Total | 34 (100.0%) | 0 (0.0%) |
Income Below Poverty Among Single-Parent Households in Johnson Village
| Children | Single Father | Single Mother |
| No Children | 0 (0.0%) | 0 (0.0%) |
| 1 or 2 Children | 0 (0.0%) | 0 (0.0%) |
| 3 or 4 Children | 0 (0.0%) | 0 (0.0%) |
| 5 or more Children | 0 (0.0%) | 0 (0.0%) |
| Total | 0 (0.0%) | 0 (0.0%) |
Income Below Poverty Among Married-Couple vs Single-Parent Households in Johnson Village
| Children | Married-Couple Families | Single-Parent Households |
| No Children | 0 (0.0%) | 0 (0.0%) |
| 1 or 2 Children | 0 (0.0%) | 0 (0.0%) |
| 3 or 4 Children | 0 (0.0%) | 0 (0.0%) |
| 5 or more Children | 0 (0.0%) | 0 (0.0%) |
| Total | 0 (0.0%) | 0 (0.0%) |
Race in Johnson Village
The most populous races in Johnson Village are White / Caucasian (314 | 100.0%), and Hispanic or Latino (19 | 6.0%).
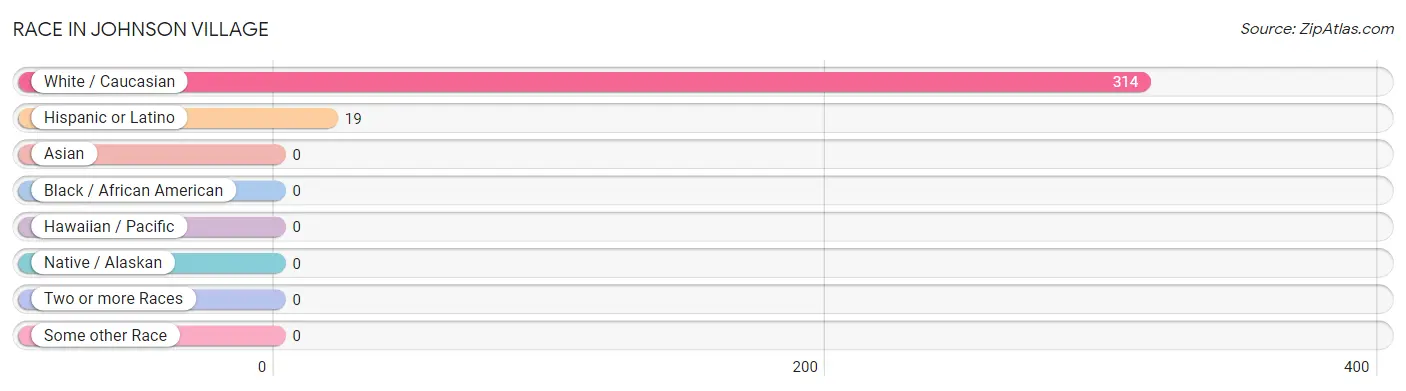
| Race | # Population | % Population |
| Asian | 0 | 0.0% |
| Black / African American | 0 | 0.0% |
| Hawaiian / Pacific | 0 | 0.0% |
| Hispanic or Latino | 19 | 6.0% |
| Native / Alaskan | 0 | 0.0% |
| White / Caucasian | 314 | 100.0% |
| Two or more Races | 0 | 0.0% |
| Some other Race | 0 | 0.0% |
| Total | 314 | 100.0% |
Ancestry in Johnson Village
The most populous ancestries reported in Johnson Village are German (174 | 55.4%), English (86 | 27.4%), Austrian (22 | 7.0%), Cuban (19 | 6.0%), and Portuguese (19 | 6.0%), together accounting for 101.9% of all Johnson Village residents.
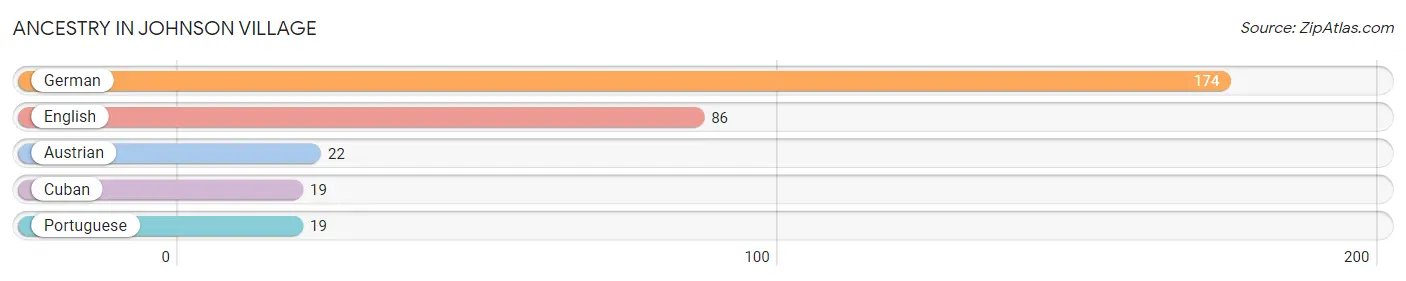
| Ancestry | # Population | % Population |
| Austrian | 22 | 7.0% |
| Cuban | 19 | 6.0% |
| English | 86 | 27.4% |
| German | 174 | 55.4% |
| Portuguese | 19 | 6.0% | View All 5 Rows |
Immigrants in Johnson Village

| Immigration Origin | # Population | % Population | View All 0 Rows |
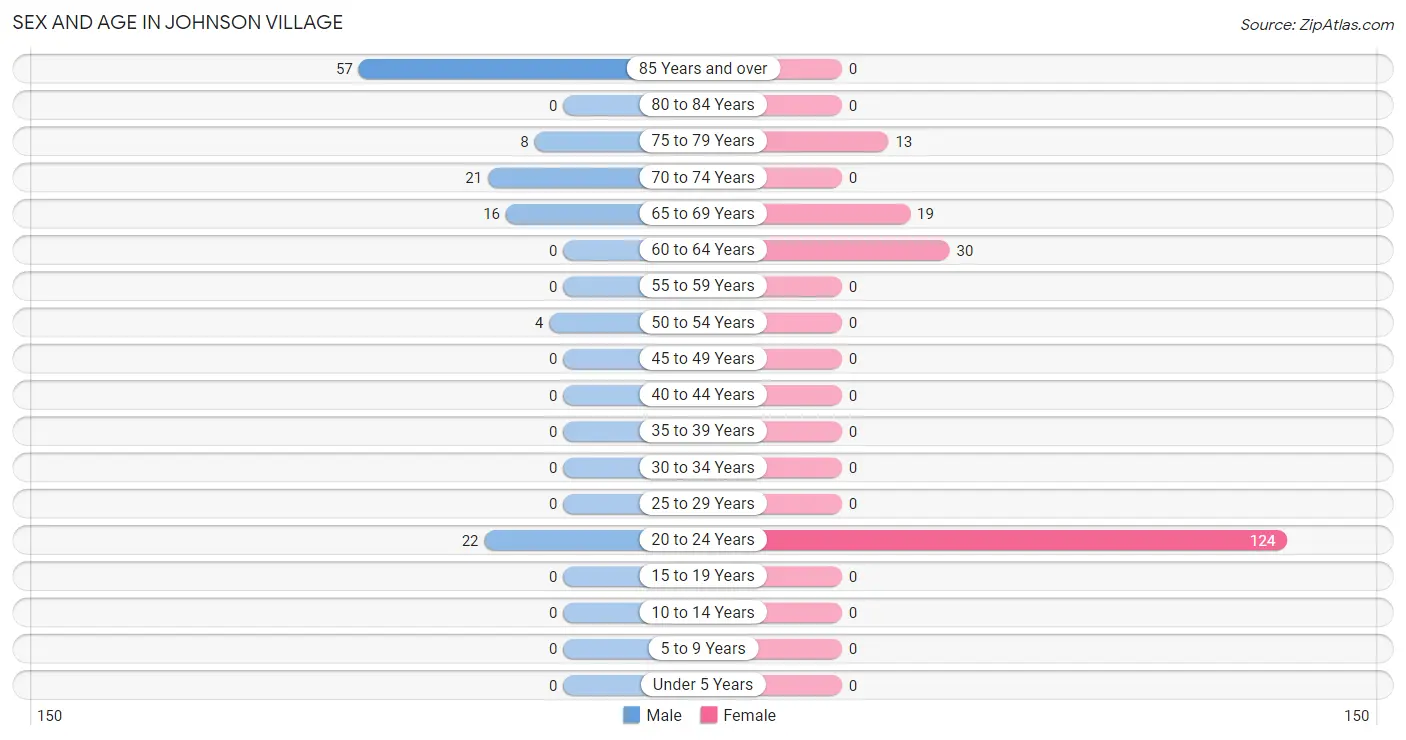
Sex and Age in Johnson Village
Sex and Age in Johnson Village
The most populous age groups in Johnson Village are 85 Years and over (57 | 44.5%) for men and 20 to 24 Years (124 | 66.7%) for women.
| Age Bracket | Male | Female |
| Under 5 Years | 0 (0.0%) | 0 (0.0%) |
| 5 to 9 Years | 0 (0.0%) | 0 (0.0%) |
| 10 to 14 Years | 0 (0.0%) | 0 (0.0%) |
| 15 to 19 Years | 0 (0.0%) | 0 (0.0%) |
| 20 to 24 Years | 22 (17.2%) | 124 (66.7%) |
| 25 to 29 Years | 0 (0.0%) | 0 (0.0%) |
| 30 to 34 Years | 0 (0.0%) | 0 (0.0%) |
| 35 to 39 Years | 0 (0.0%) | 0 (0.0%) |
| 40 to 44 Years | 0 (0.0%) | 0 (0.0%) |
| 45 to 49 Years | 0 (0.0%) | 0 (0.0%) |
| 50 to 54 Years | 4 (3.1%) | 0 (0.0%) |
| 55 to 59 Years | 0 (0.0%) | 0 (0.0%) |
| 60 to 64 Years | 0 (0.0%) | 30 (16.1%) |
| 65 to 69 Years | 16 (12.5%) | 19 (10.2%) |
| 70 to 74 Years | 21 (16.4%) | 0 (0.0%) |
| 75 to 79 Years | 8 (6.2%) | 13 (7.0%) |
| 80 to 84 Years | 0 (0.0%) | 0 (0.0%) |
| 85 Years and over | 57 (44.5%) | 0 (0.0%) |
| Total | 128 (100.0%) | 186 (100.0%) |
Families and Households in Johnson Village
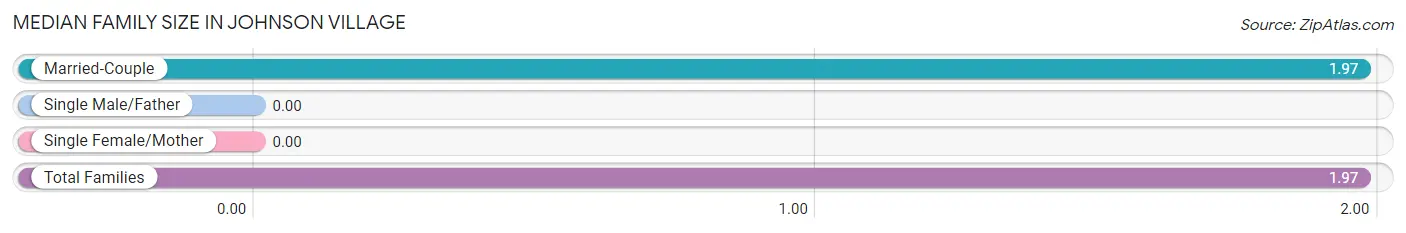
Median Family Size in Johnson Village
| Family Type | # Families | Family Size |
| Married-Couple | 34 (100.0%) | 1.97 |
| Single Male/Father | 0 (0.0%) | - |
| Single Female/Mother | 0 (0.0%) | - |
| Total Families | 34 (100.0%) | 1.97 |
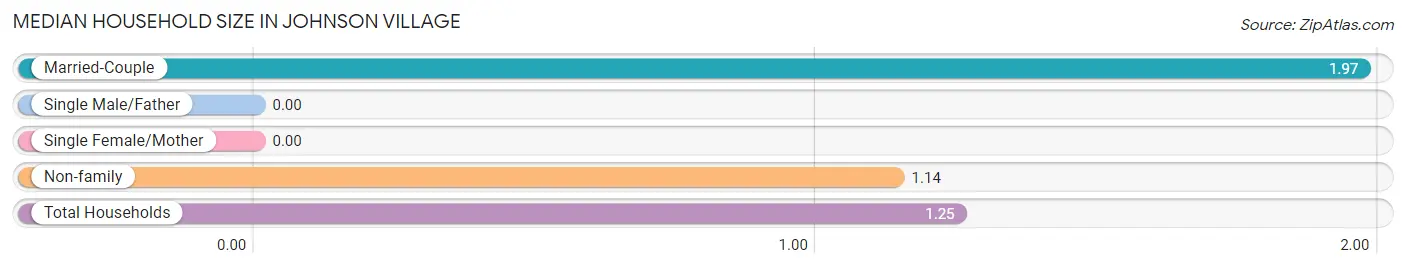
Median Household Size in Johnson Village
| Household Type | # Households | Household Size |
| Married-Couple | 34 (13.6%) | 1.97 |
| Single Male/Father | 0 (0.0%) | - |
| Single Female/Mother | 0 (0.0%) | - |
| Non-family | 217 (86.5%) | 1.14 |
| Total Households | 251 (100.0%) | 1.25 |
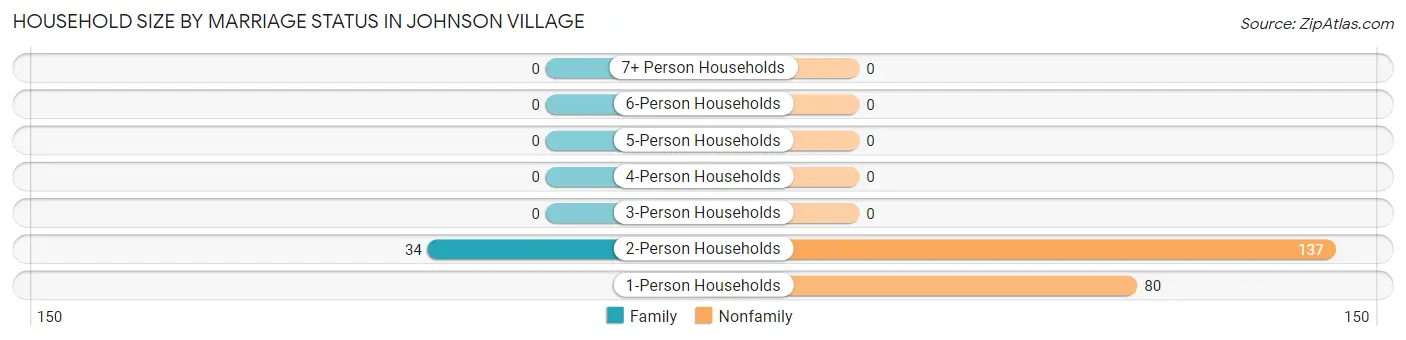
Household Size by Marriage Status in Johnson Village
Out of a total of 251 households in Johnson Village, 34 (13.6%) are family households, while 217 (86.5%) are nonfamily households. The most numerous type of family households are 2-person households, comprising 34, and the most common type of nonfamily households are 2-person households, comprising 137.
| Household Size | Family Households | Nonfamily Households |
| 1-Person Households | - | 80 (31.9%) |
| 2-Person Households | 34 (13.6%) | 137 (54.6%) |
| 3-Person Households | 0 (0.0%) | 0 (0.0%) |
| 4-Person Households | 0 (0.0%) | 0 (0.0%) |
| 5-Person Households | 0 (0.0%) | 0 (0.0%) |
| 6-Person Households | 0 (0.0%) | 0 (0.0%) |
| 7+ Person Households | 0 (0.0%) | 0 (0.0%) |
| Total | 34 (13.6%) | 217 (86.5%) |
Female Fertility in Johnson Village
Fertility by Age in Johnson Village
| Age Bracket | Women with Births | Births / 1,000 Women |
| 15 to 19 years | 0 (0.0%) | 0.0 |
| 20 to 34 years | 0 (0.0%) | 0.0 |
| 35 to 50 years | 0 (0.0%) | 0.0 |
| Total | 0 (0.0%) | 0.0 |
Fertility by Age by Marriage Status in Johnson Village
| Age Bracket | Married | Unmarried |
| 15 to 19 years | 0 (0.0%) | 0 (0.0%) |
| 20 to 34 years | 0 (0.0%) | 0 (0.0%) |
| 35 to 50 years | 0 (0.0%) | 0 (0.0%) |
| Total | 0 (0.0%) | 0 (0.0%) |
Fertility by Education in Johnson Village
| Educational Attainment | Women with Births | Births / 1,000 Women |
| Less than High School | 0 (0.0%) | 0.0 |
| High School Diploma | 0 (0.0%) | 0.0 |
| College or Associate's Degree | 0 (0.0%) | 0.0 |
| Bachelor's Degree | 0 (0.0%) | 0.0 |
| Graduate Degree | 0 (0.0%) | 0.0 |
| Total | 0 (0.0%) | 0.0 |
Fertility by Education by Marriage Status in Johnson Village
| Educational Attainment | Married | Unmarried |
| Less than High School | 0 (0.0%) | 0 (0.0%) |
| High School Diploma | 0 (0.0%) | 0 (0.0%) |
| College or Associate's Degree | 0 (0.0%) | 0 (0.0%) |
| Bachelor's Degree | 0 (0.0%) | 0 (0.0%) |
| Graduate Degree | 0 (0.0%) | 0 (0.0%) |
| Total | 0 (0.0%) | 0 (0.0%) |
Employment Characteristics in Johnson Village
Employment by Class of Employer in Johnson Village
Among the 179 employed individuals in Johnson Village, private company employees (166 | 92.7%), and local government employees (13 | 7.3%) make up the most common classes of employment.
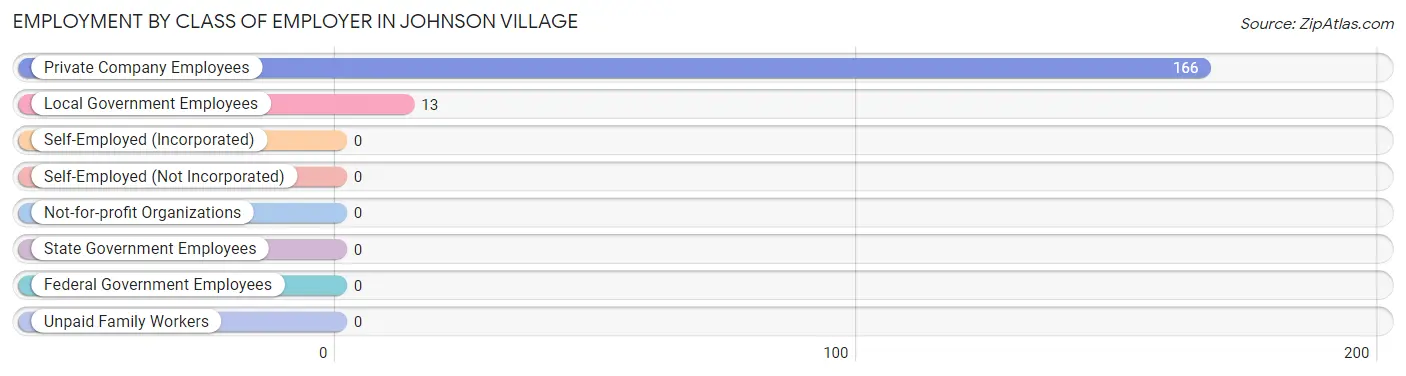
| Employer Class | # Employees | % Employees |
| Private Company Employees | 166 | 92.7% |
| Self-Employed (Incorporated) | 0 | 0.0% |
| Self-Employed (Not Incorporated) | 0 | 0.0% |
| Not-for-profit Organizations | 0 | 0.0% |
| Local Government Employees | 13 | 7.3% |
| State Government Employees | 0 | 0.0% |
| Federal Government Employees | 0 | 0.0% |
| Unpaid Family Workers | 0 | 0.0% |
| Total | 179 | 100.0% |
Employment Status by Age in Johnson Village
According to the labor force statistics for Johnson Village, out of the total population over 16 years of age (314), 61.1% or 192 individuals are in the labor force, with 6.8% or 13 of them unemployed. The age group with the highest labor force participation rate is 20 to 24 years, with 100.0% or 146 individuals in the labor force. Within the labor force, the 60 to 64 years age range has the highest percentage of unemployed individuals, with 100.0% or 13 of them being unemployed.
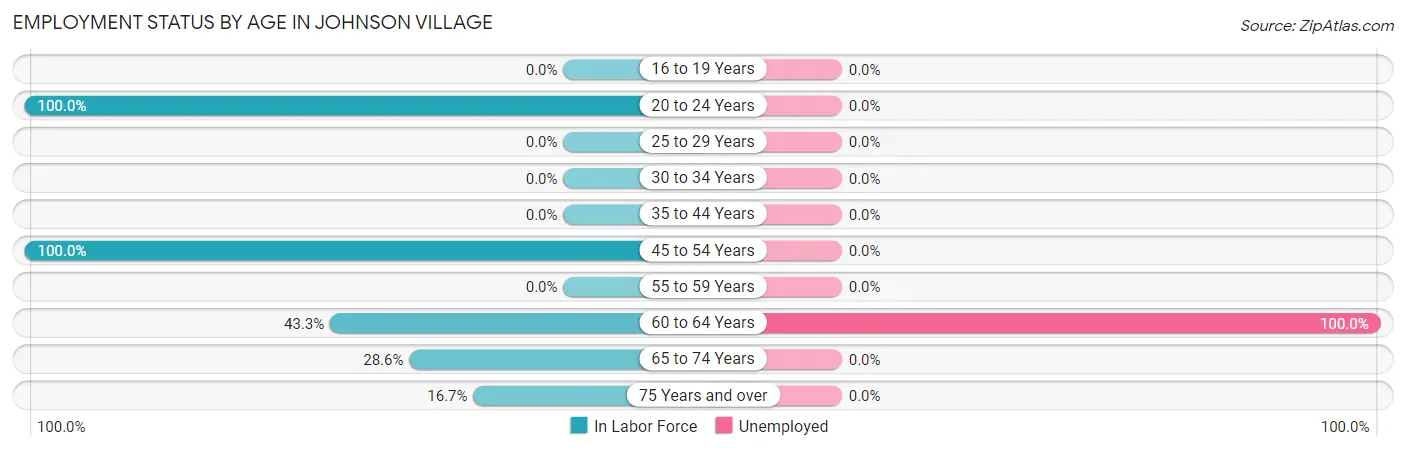
| Age Bracket | In Labor Force | Unemployed |
| 16 to 19 Years | 0 (0.0%) | 0 (0.0%) |
| 20 to 24 Years | 146 (100.0%) | 0 (0.0%) |
| 25 to 29 Years | 0 (0.0%) | 0 (0.0%) |
| 30 to 34 Years | 0 (0.0%) | 0 (0.0%) |
| 35 to 44 Years | 0 (0.0%) | 0 (0.0%) |
| 45 to 54 Years | 4 (100.0%) | 0 (0.0%) |
| 55 to 59 Years | 0 (0.0%) | 0 (0.0%) |
| 60 to 64 Years | 13 (43.3%) | 13 (100.0%) |
| 65 to 74 Years | 16 (28.6%) | 0 (0.0%) |
| 75 Years and over | 13 (16.7%) | 0 (0.0%) |
| Total | 192 (61.1%) | 13 (6.8%) |
Employment Status by Educational Attainment in Johnson Village
According to labor force statistics for Johnson Village, 50.0% of individuals (17) out of the total population between 25 and 64 years of age (34) are in the labor force, with 76.5% or 13 of them being unemployed. The group with the highest labor force participation rate are those with the educational attainment of less than high school, with 100.0% or 4 individuals in the labor force. Within the labor force, individuals with bachelor's degree or higher education have the highest percentage of unemployment, with 100.0% or 13 of them being unemployed.
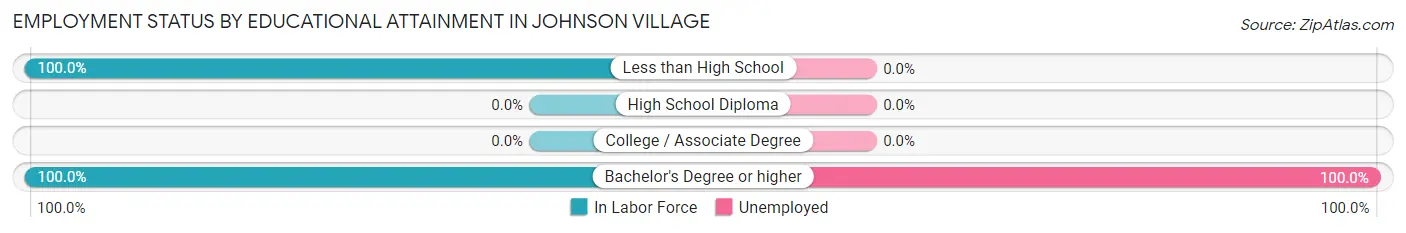
| Educational Attainment | In Labor Force | Unemployed |
| Less than High School | 4 (100.0%) | 0 (0.0%) |
| High School Diploma | 0 (0.0%) | 0 (0.0%) |
| College / Associate Degree | 0 (0.0%) | 0 (0.0%) |
| Bachelor's Degree or higher | 13 (100.0%) | 13 (100.0%) |
| Total | 17 (50.0%) | 26 (76.5%) |
Employment Occupations by Sex in Johnson Village
Management, Business, Science and Arts Occupations
The most common Management, Business, Science and Arts occupations in Johnson Village are , and Management (13 | 7.3%).
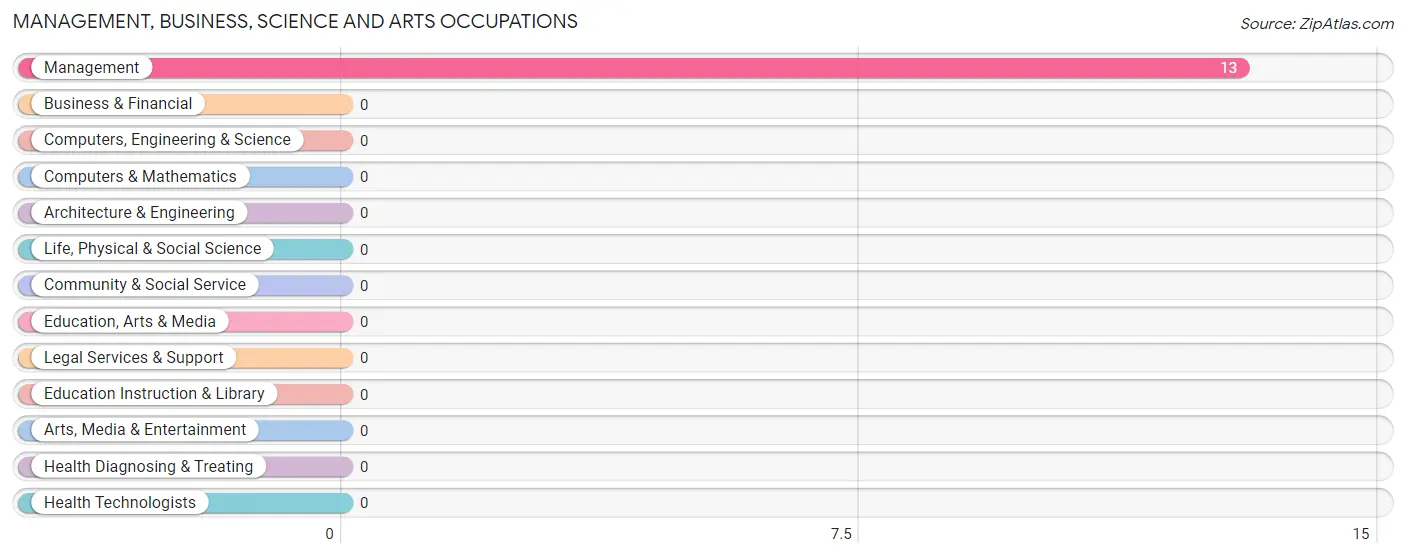
Management, Business, Science and Arts Occupations by Sex
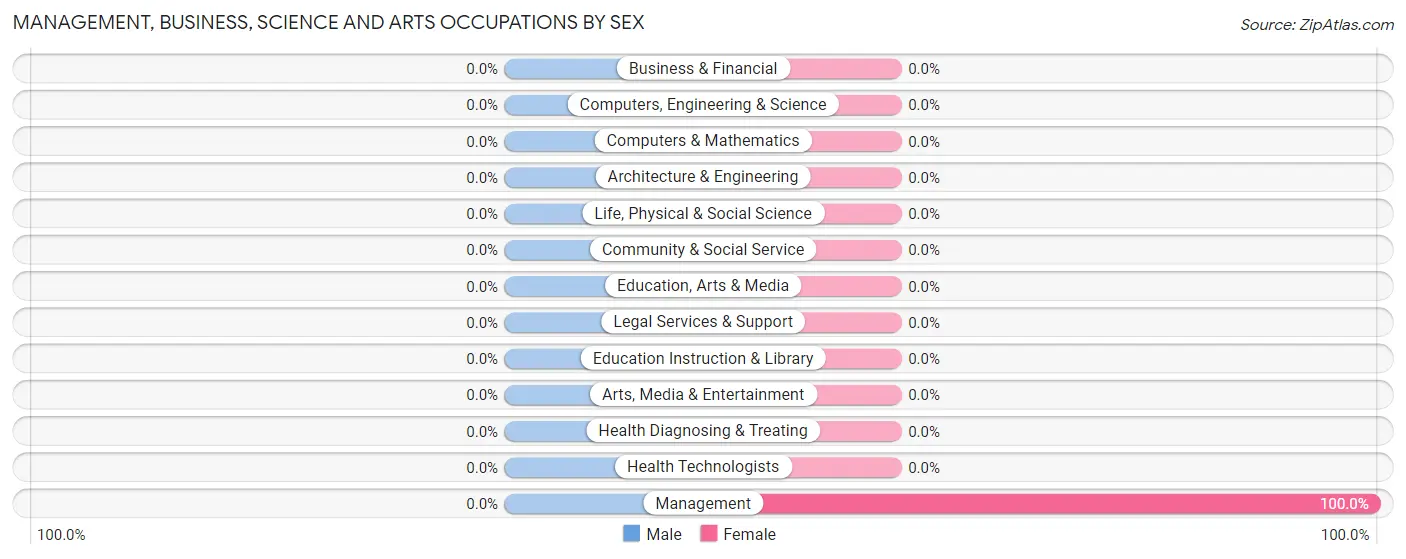
| Occupation | Male | Female |
| Management | 0 (0.0%) | 13 (100.0%) |
| Business & Financial | 0 (0.0%) | 0 (0.0%) |
| Computers, Engineering & Science | 0 (0.0%) | 0 (0.0%) |
| Computers & Mathematics | 0 (0.0%) | 0 (0.0%) |
| Architecture & Engineering | 0 (0.0%) | 0 (0.0%) |
| Life, Physical & Social Science | 0 (0.0%) | 0 (0.0%) |
| Community & Social Service | 0 (0.0%) | 0 (0.0%) |
| Education, Arts & Media | 0 (0.0%) | 0 (0.0%) |
| Legal Services & Support | 0 (0.0%) | 0 (0.0%) |
| Education Instruction & Library | 0 (0.0%) | 0 (0.0%) |
| Arts, Media & Entertainment | 0 (0.0%) | 0 (0.0%) |
| Health Diagnosing & Treating | 0 (0.0%) | 0 (0.0%) |
| Health Technologists | 0 (0.0%) | 0 (0.0%) |
| Total (Category) | 0 (0.0%) | 13 (100.0%) |
| Total (Overall) | 42 (23.5%) | 137 (76.5%) |
Services Occupations
The most common Services occupations in Johnson Village are , and Food Preparation & Serving (146 | 81.6%).
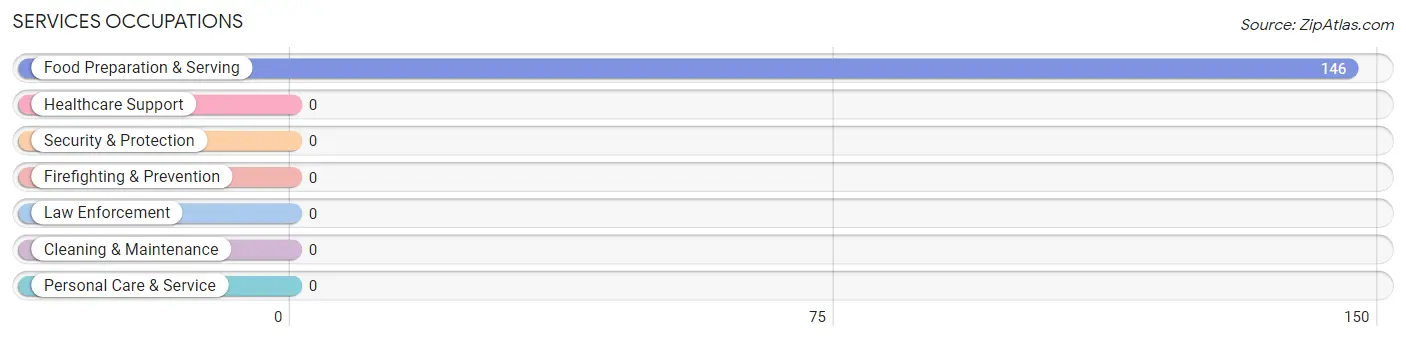
Services Occupations by Sex
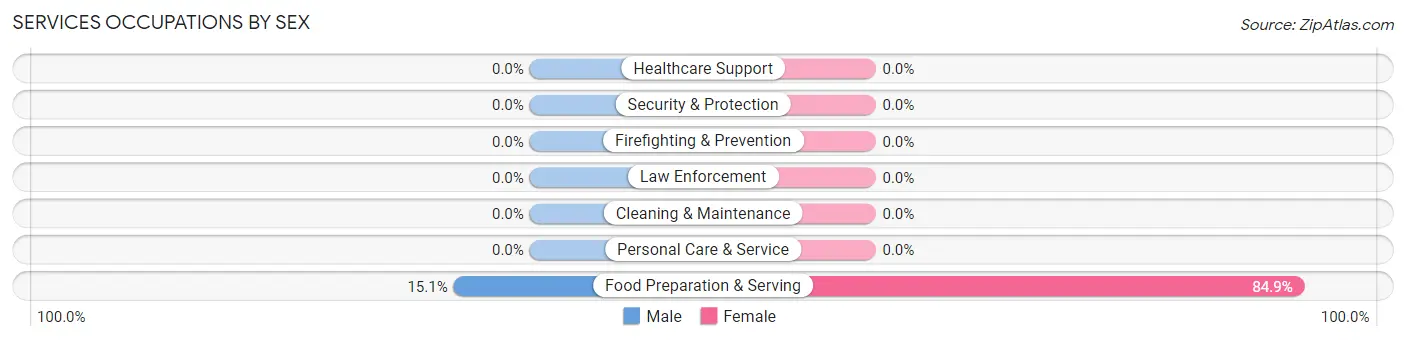
| Occupation | Male | Female |
| Healthcare Support | 0 (0.0%) | 0 (0.0%) |
| Security & Protection | 0 (0.0%) | 0 (0.0%) |
| Firefighting & Prevention | 0 (0.0%) | 0 (0.0%) |
| Law Enforcement | 0 (0.0%) | 0 (0.0%) |
| Food Preparation & Serving | 22 (15.1%) | 124 (84.9%) |
| Cleaning & Maintenance | 0 (0.0%) | 0 (0.0%) |
| Personal Care & Service | 0 (0.0%) | 0 (0.0%) |
| Total (Category) | 22 (15.1%) | 124 (84.9%) |
| Total (Overall) | 42 (23.5%) | 137 (76.5%) |
Sales and Office Occupations
The most common Sales and Office occupations in Johnson Village are , and Sales & Related (16 | 8.9%).
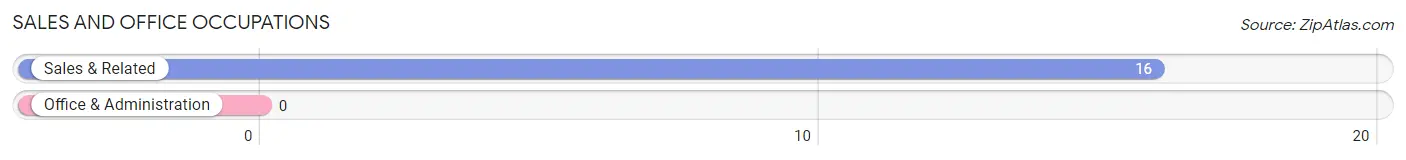
Sales and Office Occupations by Sex
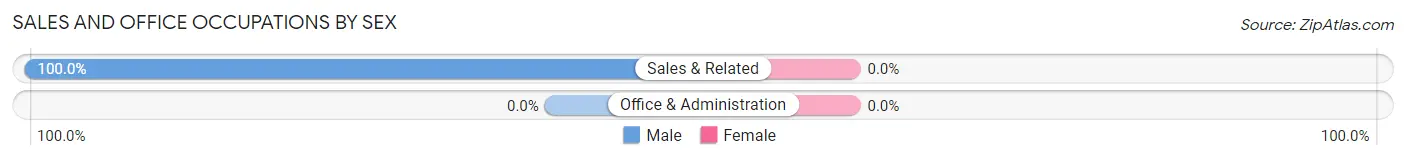
| Occupation | Male | Female |
| Sales & Related | 16 (100.0%) | 0 (0.0%) |
| Office & Administration | 0 (0.0%) | 0 (0.0%) |
| Total (Category) | 16 (100.0%) | 0 (0.0%) |
| Total (Overall) | 42 (23.5%) | 137 (76.5%) |
Natural Resources, Construction and Maintenance Occupations
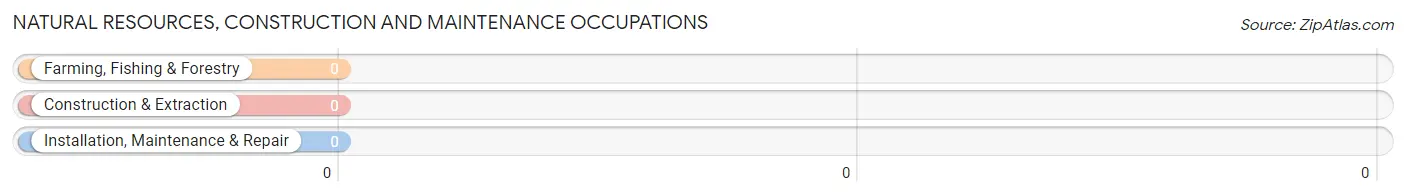
Natural Resources, Construction and Maintenance Occupations by Sex
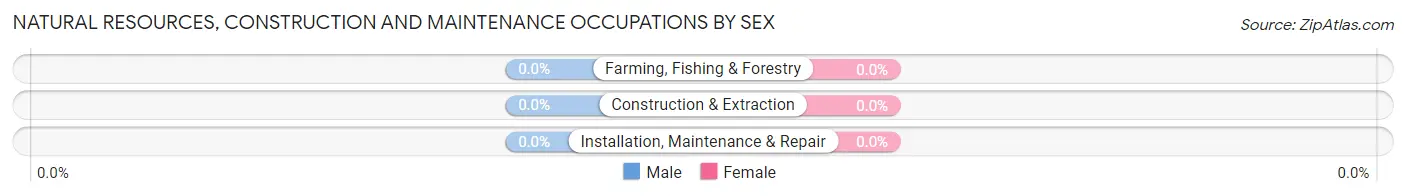
| Occupation | Male | Female |
| Farming, Fishing & Forestry | 0 (0.0%) | 0 (0.0%) |
| Construction & Extraction | 0 (0.0%) | 0 (0.0%) |
| Installation, Maintenance & Repair | 0 (0.0%) | 0 (0.0%) |
| Total (Category) | 0 (0.0%) | 0 (0.0%) |
| Total (Overall) | 42 (23.5%) | 137 (76.5%) |
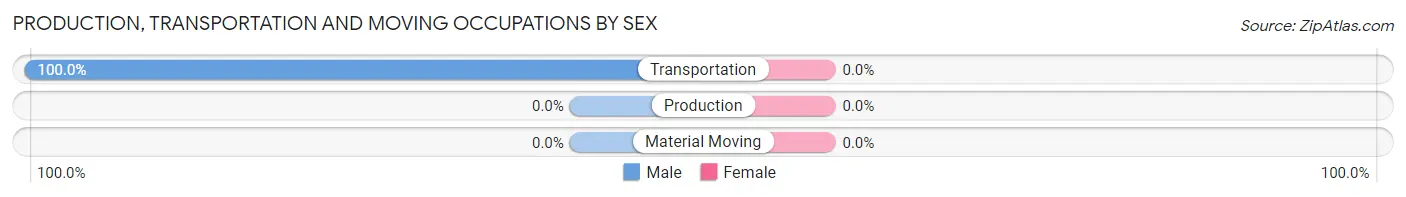
Production, Transportation and Moving Occupations
The most common Production, Transportation and Moving occupations in Johnson Village are , and Transportation (4 | 2.2%).
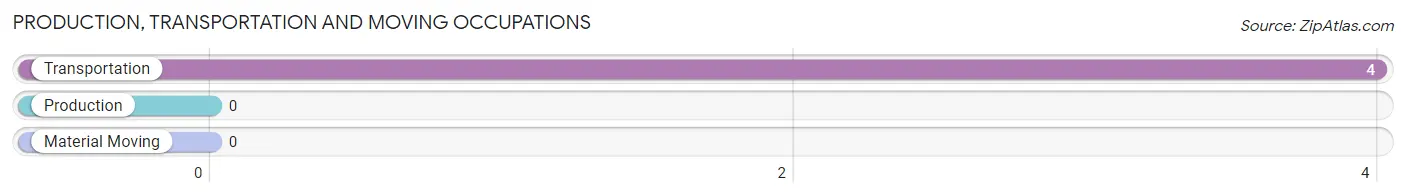
Production, Transportation and Moving Occupations by Sex
| Occupation | Male | Female |
| Production | 0 (0.0%) | 0 (0.0%) |
| Transportation | 4 (100.0%) | 0 (0.0%) |
| Material Moving | 0 (0.0%) | 0 (0.0%) |
| Total (Category) | 4 (100.0%) | 0 (0.0%) |
| Total (Overall) | 42 (23.5%) | 137 (76.5%) |
Employment Industries by Sex in Johnson Village
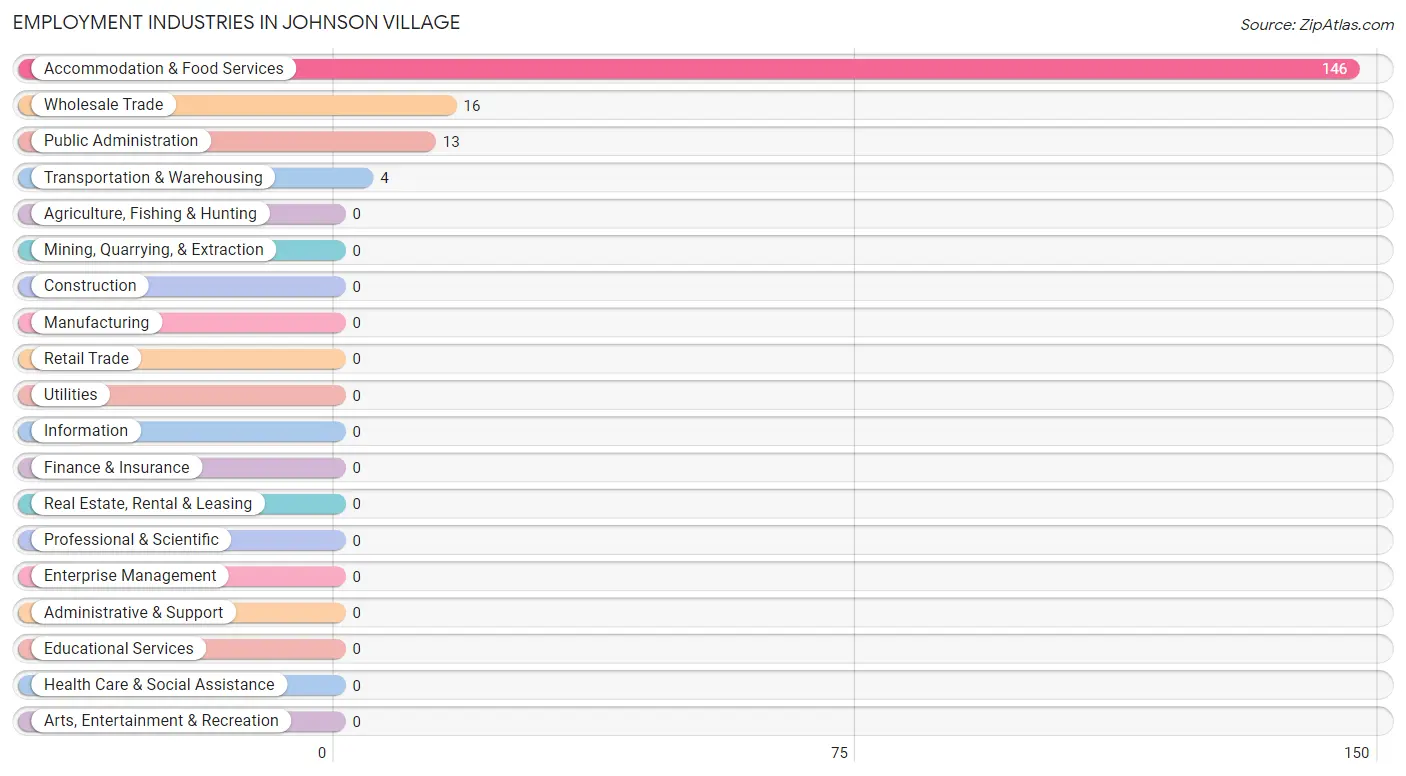
Employment Industries in Johnson Village
The major employment industries in Johnson Village include Accommodation & Food Services (146 | 81.6%), Wholesale Trade (16 | 8.9%), Public Administration (13 | 7.3%), and Transportation & Warehousing (4 | 2.2%).
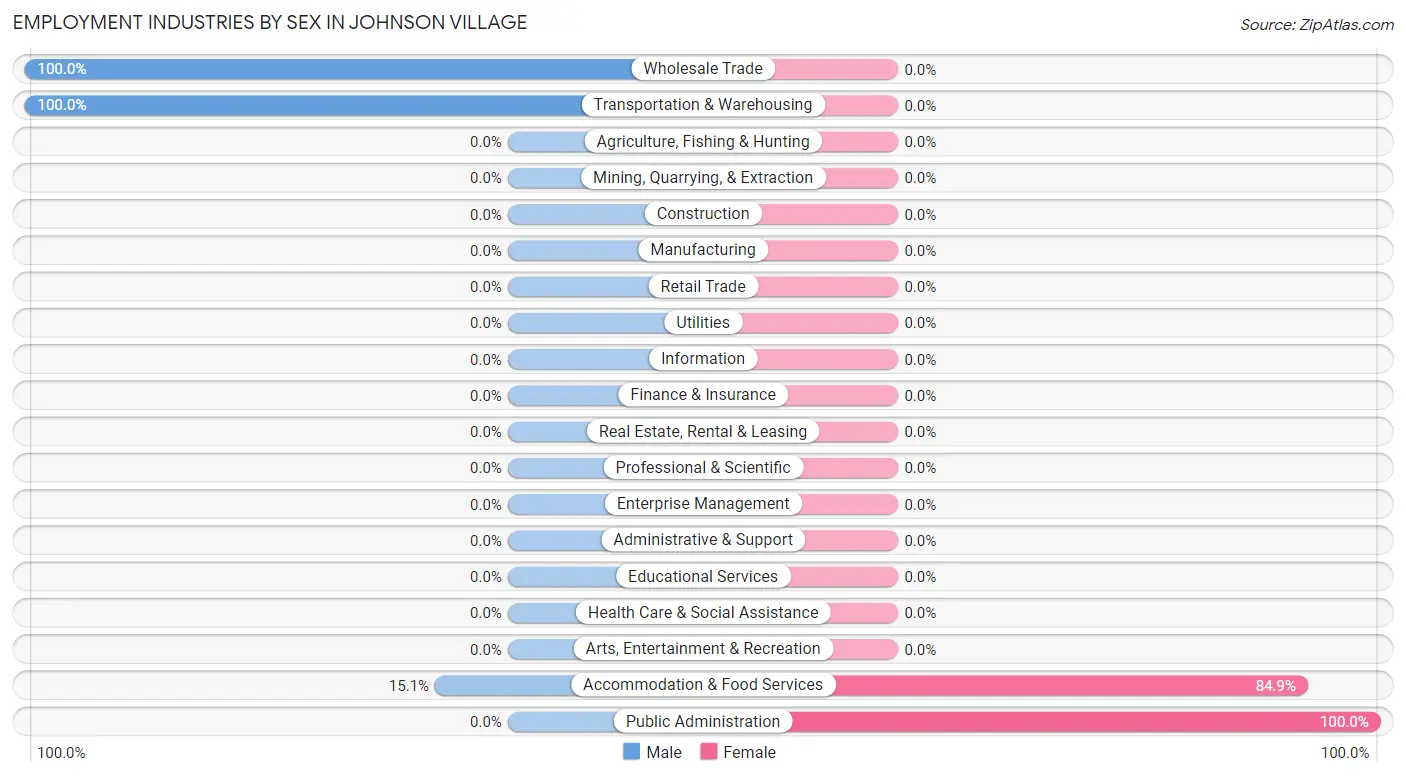
Employment Industries by Sex in Johnson Village
The Johnson Village industries that see more men than women are Wholesale Trade (100.0%), Transportation & Warehousing (100.0%), and Accommodation & Food Services (15.1%), whereas the industries that tend to have a higher number of women are Public Administration (100.0%), and Accommodation & Food Services (84.9%).
| Industry | Male | Female |
| Agriculture, Fishing & Hunting | 0 (0.0%) | 0 (0.0%) |
| Mining, Quarrying, & Extraction | 0 (0.0%) | 0 (0.0%) |
| Construction | 0 (0.0%) | 0 (0.0%) |
| Manufacturing | 0 (0.0%) | 0 (0.0%) |
| Wholesale Trade | 16 (100.0%) | 0 (0.0%) |
| Retail Trade | 0 (0.0%) | 0 (0.0%) |
| Transportation & Warehousing | 4 (100.0%) | 0 (0.0%) |
| Utilities | 0 (0.0%) | 0 (0.0%) |
| Information | 0 (0.0%) | 0 (0.0%) |
| Finance & Insurance | 0 (0.0%) | 0 (0.0%) |
| Real Estate, Rental & Leasing | 0 (0.0%) | 0 (0.0%) |
| Professional & Scientific | 0 (0.0%) | 0 (0.0%) |
| Enterprise Management | 0 (0.0%) | 0 (0.0%) |
| Administrative & Support | 0 (0.0%) | 0 (0.0%) |
| Educational Services | 0 (0.0%) | 0 (0.0%) |
| Health Care & Social Assistance | 0 (0.0%) | 0 (0.0%) |
| Arts, Entertainment & Recreation | 0 (0.0%) | 0 (0.0%) |
| Accommodation & Food Services | 22 (15.1%) | 124 (84.9%) |
| Public Administration | 0 (0.0%) | 13 (100.0%) |
| Total | 42 (23.5%) | 137 (76.5%) |
Education in Johnson Village
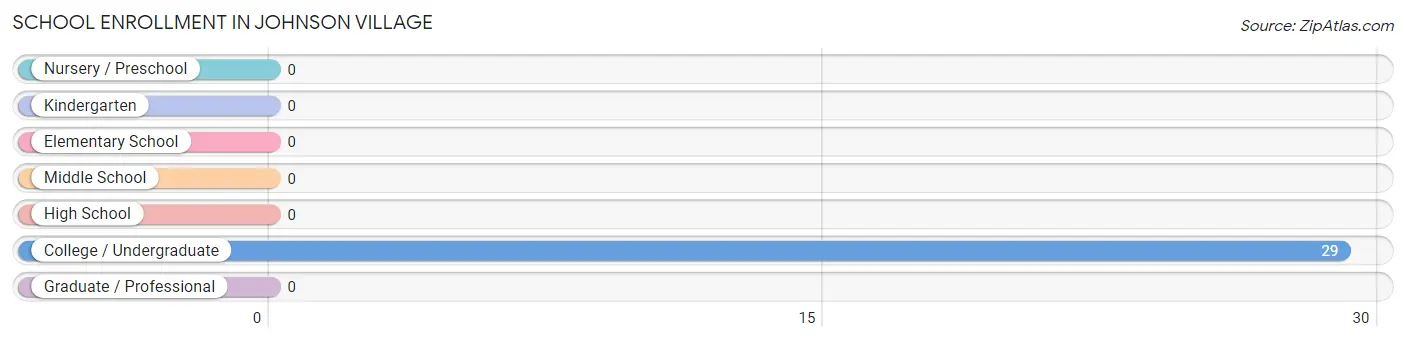
School Enrollment in Johnson Village
| School Level | # Students | % Students |
| Nursery / Preschool | 0 | 0.0% |
| Kindergarten | 0 | 0.0% |
| Elementary School | 0 | 0.0% |
| Middle School | 0 | 0.0% |
| High School | 0 | 0.0% |
| College / Undergraduate | 29 | 100.0% |
| Graduate / Professional | 0 | 0.0% |
| Total | 29 | 100.0% |
School Enrollment by Age by Funding Source in Johnson Village
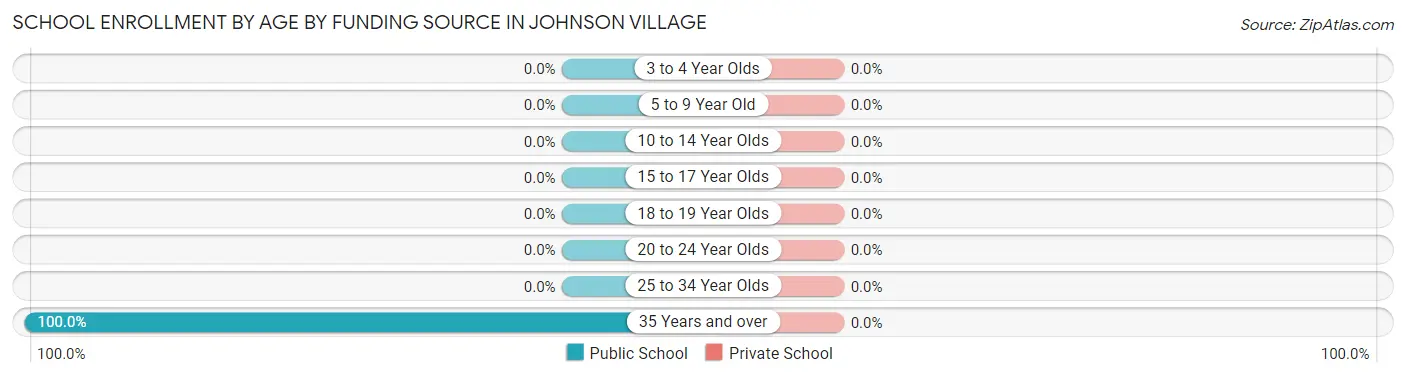
| Age Bracket | Public School | Private School |
| 3 to 4 Year Olds | 0 (0.0%) | 0 (0.0%) |
| 5 to 9 Year Old | 0 (0.0%) | 0 (0.0%) |
| 10 to 14 Year Olds | 0 (0.0%) | 0 (0.0%) |
| 15 to 17 Year Olds | 0 (0.0%) | 0 (0.0%) |
| 18 to 19 Year Olds | 0 (0.0%) | 0 (0.0%) |
| 20 to 24 Year Olds | 0 (0.0%) | 0 (0.0%) |
| 25 to 34 Year Olds | 0 (0.0%) | 0 (0.0%) |
| 35 Years and over | 29 (100.0%) | 0 (0.0%) |
| Total | 29 (100.0%) | 0 (0.0%) |
Educational Attainment by Field of Study in Johnson Village
Visual & performing arts (57 | 81.4%), and business (13 | 18.6%) are the most common fields of study among 70 individuals in Johnson Village who have obtained a bachelor's degree or higher.
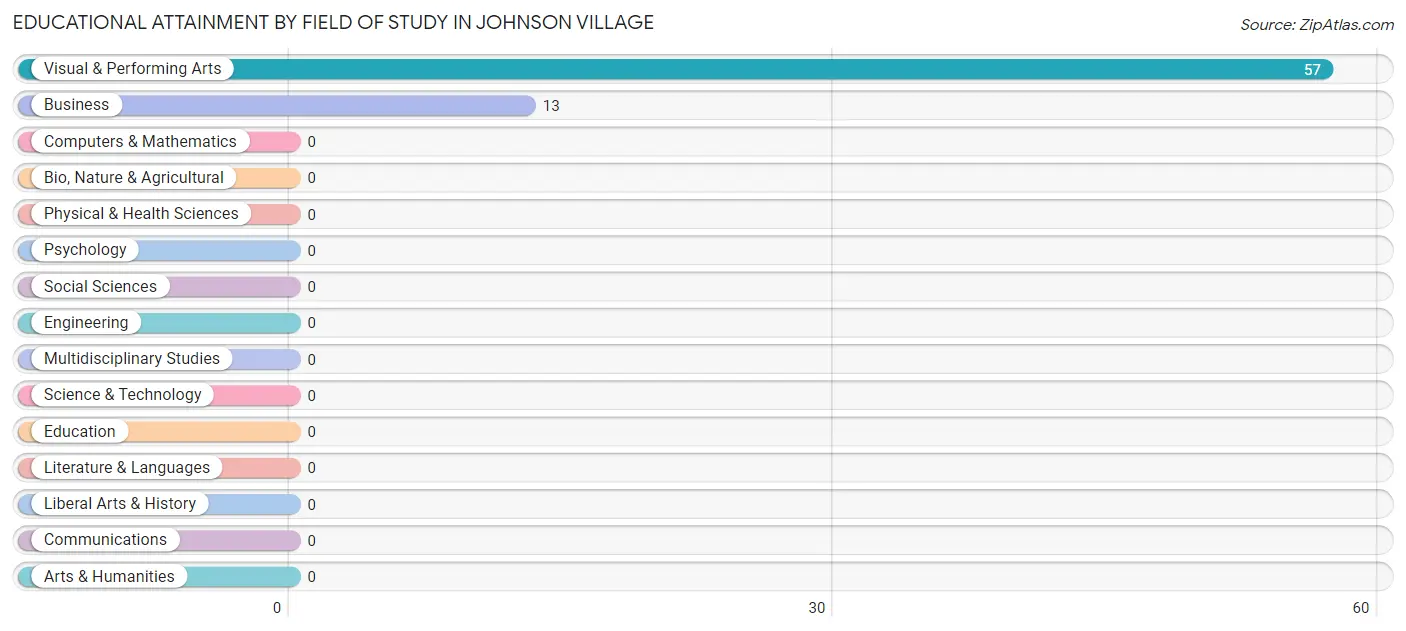
| Field of Study | # Graduates | % Graduates |
| Computers & Mathematics | 0 | 0.0% |
| Bio, Nature & Agricultural | 0 | 0.0% |
| Physical & Health Sciences | 0 | 0.0% |
| Psychology | 0 | 0.0% |
| Social Sciences | 0 | 0.0% |
| Engineering | 0 | 0.0% |
| Multidisciplinary Studies | 0 | 0.0% |
| Science & Technology | 0 | 0.0% |
| Business | 13 | 18.6% |
| Education | 0 | 0.0% |
| Literature & Languages | 0 | 0.0% |
| Liberal Arts & History | 0 | 0.0% |
| Visual & Performing Arts | 57 | 81.4% |
| Communications | 0 | 0.0% |
| Arts & Humanities | 0 | 0.0% |
| Total | 70 | 100.0% |
Transportation & Commute in Johnson Village
Vehicle Availability by Sex in Johnson Village
The most prevalent vehicle ownership categories in Johnson Village are males with 2 vehicles (38, accounting for 90.5%) and females with 2 vehicles (124, making up 27.7%).
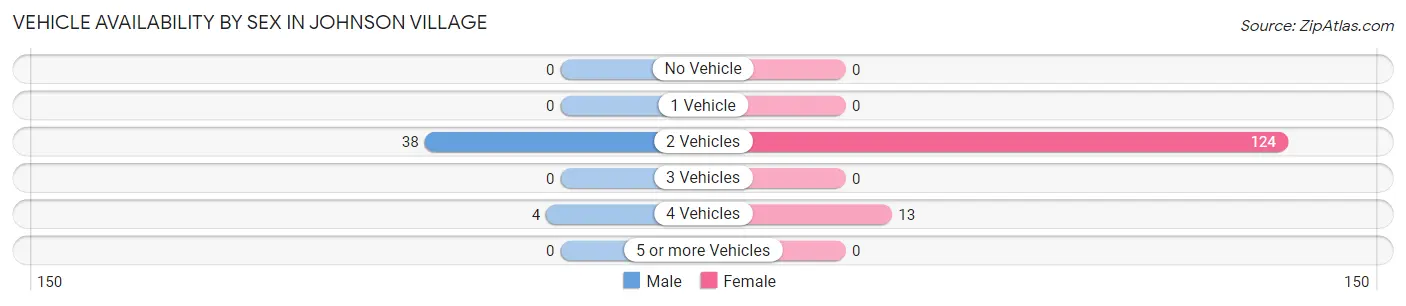
| Vehicles Available | Male | Female |
| No Vehicle | 0 (0.0%) | 0 (0.0%) |
| 1 Vehicle | 0 (0.0%) | 0 (0.0%) |
| 2 Vehicles | 38 (90.5%) | 124 (90.5%) |
| 3 Vehicles | 0 (0.0%) | 0 (0.0%) |
| 4 Vehicles | 4 (9.5%) | 13 (9.5%) |
| 5 or more Vehicles | 0 (0.0%) | 0 (0.0%) |
| Total | 42 (100.0%) | 137 (100.0%) |
Commute Time in Johnson Village
The most frequently occuring commute durations in Johnson Village are 5 to 9 minutes (146 commuters, 89.6%), 90 or more minutes (13 commuters, 8.0%), and 25 to 29 minutes (4 commuters, 2.5%).
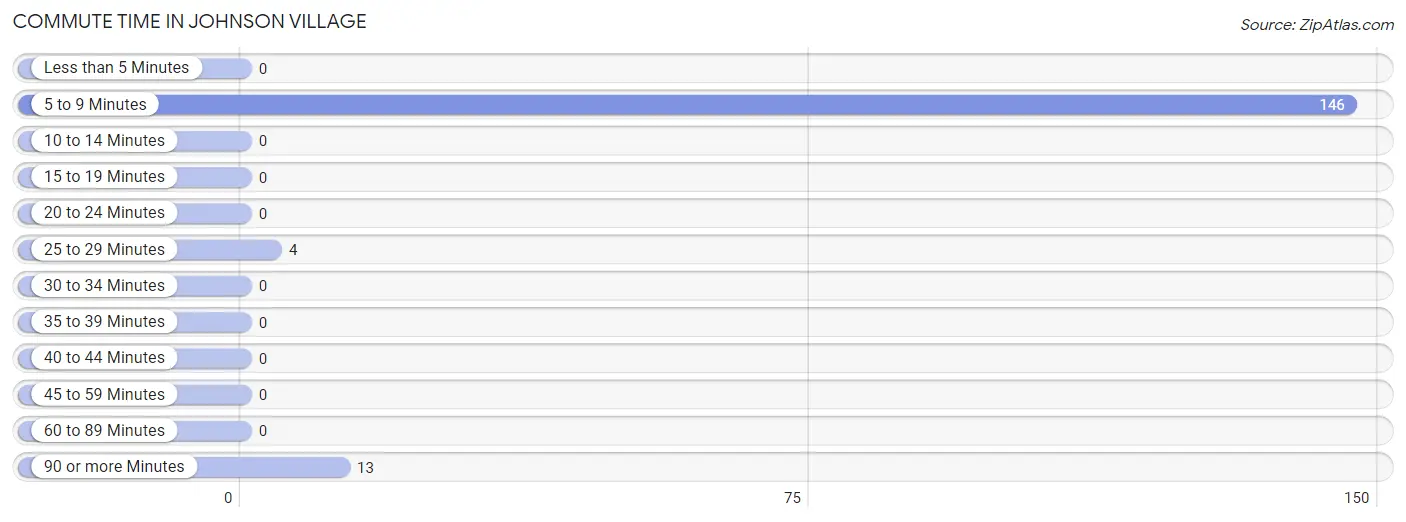
| Commute Time | # Commuters | % Commuters |
| Less than 5 Minutes | 0 | 0.0% |
| 5 to 9 Minutes | 146 | 89.6% |
| 10 to 14 Minutes | 0 | 0.0% |
| 15 to 19 Minutes | 0 | 0.0% |
| 20 to 24 Minutes | 0 | 0.0% |
| 25 to 29 Minutes | 4 | 2.5% |
| 30 to 34 Minutes | 0 | 0.0% |
| 35 to 39 Minutes | 0 | 0.0% |
| 40 to 44 Minutes | 0 | 0.0% |
| 45 to 59 Minutes | 0 | 0.0% |
| 60 to 89 Minutes | 0 | 0.0% |
| 90 or more Minutes | 13 | 8.0% |
Commute Time by Sex in Johnson Village
The most common commute times in Johnson Village are 5 to 9 minutes (22 commuters, 84.6%) for males and 5 to 9 minutes (124 commuters, 90.5%) for females.
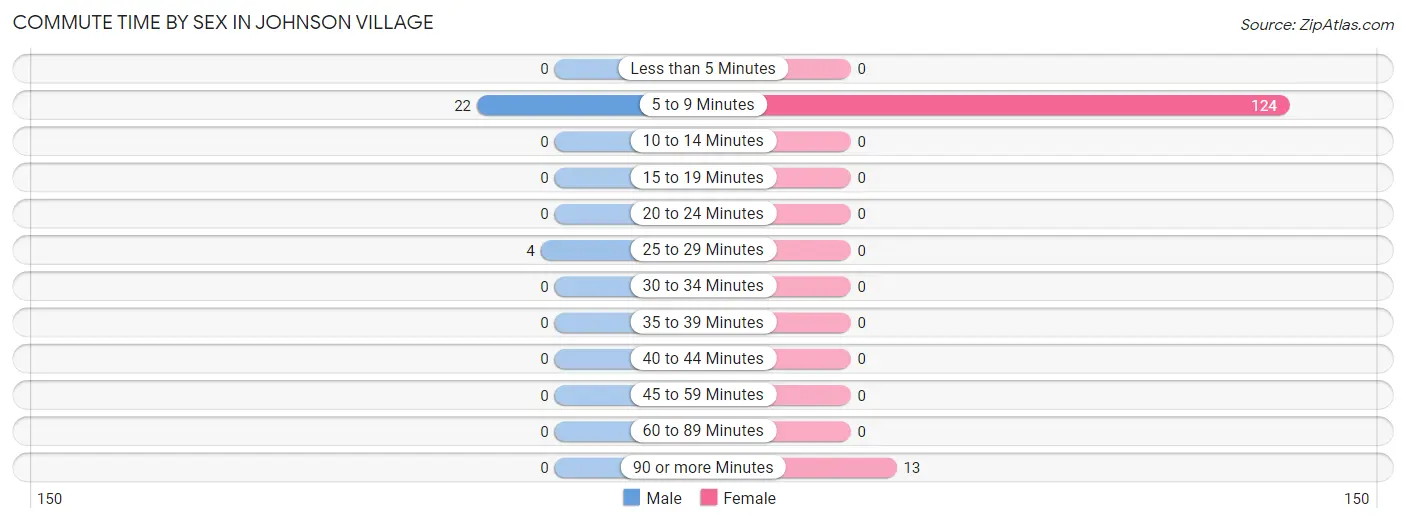
| Commute Time | Male | Female |
| Less than 5 Minutes | 0 (0.0%) | 0 (0.0%) |
| 5 to 9 Minutes | 22 (84.6%) | 124 (90.5%) |
| 10 to 14 Minutes | 0 (0.0%) | 0 (0.0%) |
| 15 to 19 Minutes | 0 (0.0%) | 0 (0.0%) |
| 20 to 24 Minutes | 0 (0.0%) | 0 (0.0%) |
| 25 to 29 Minutes | 4 (15.4%) | 0 (0.0%) |
| 30 to 34 Minutes | 0 (0.0%) | 0 (0.0%) |
| 35 to 39 Minutes | 0 (0.0%) | 0 (0.0%) |
| 40 to 44 Minutes | 0 (0.0%) | 0 (0.0%) |
| 45 to 59 Minutes | 0 (0.0%) | 0 (0.0%) |
| 60 to 89 Minutes | 0 (0.0%) | 0 (0.0%) |
| 90 or more Minutes | 0 (0.0%) | 13 (9.5%) |
Time of Departure to Work by Sex in Johnson Village
The most frequent times of departure to work in Johnson Village are 4:00 PM to 11:59 PM (22, 84.6%) for males and 4:00 PM to 11:59 PM (137, 100.0%) for females.
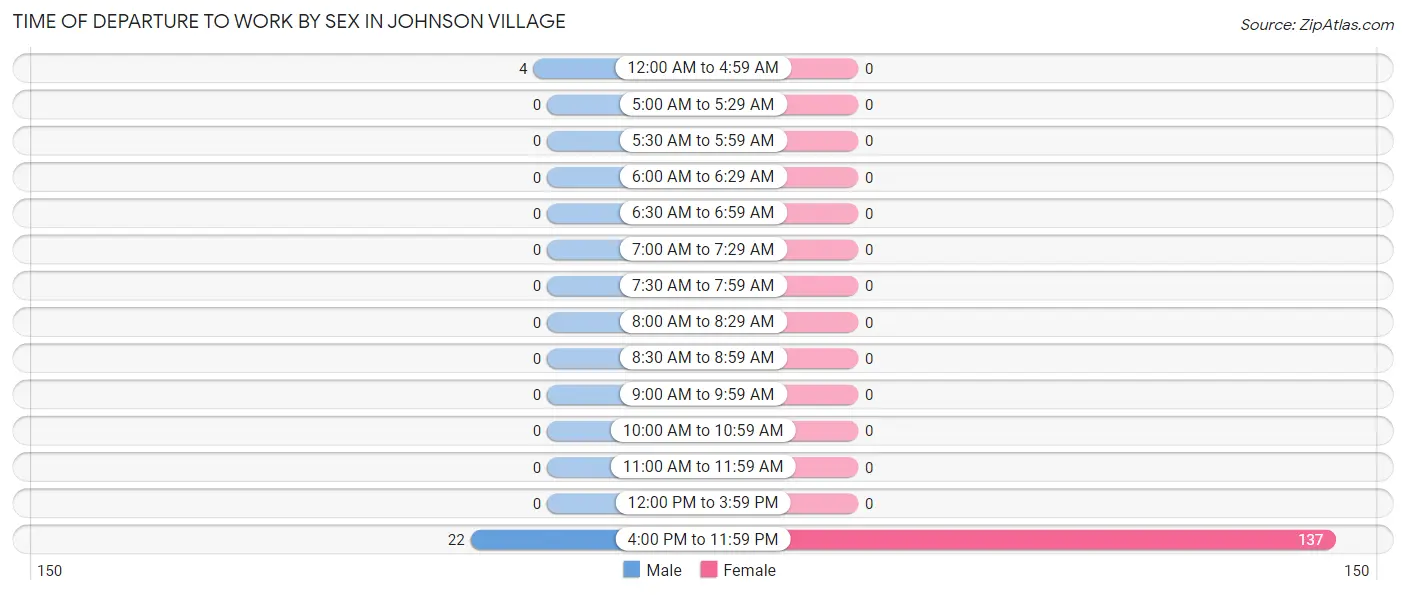
| Time of Departure | Male | Female |
| 12:00 AM to 4:59 AM | 4 (15.4%) | 0 (0.0%) |
| 5:00 AM to 5:29 AM | 0 (0.0%) | 0 (0.0%) |
| 5:30 AM to 5:59 AM | 0 (0.0%) | 0 (0.0%) |
| 6:00 AM to 6:29 AM | 0 (0.0%) | 0 (0.0%) |
| 6:30 AM to 6:59 AM | 0 (0.0%) | 0 (0.0%) |
| 7:00 AM to 7:29 AM | 0 (0.0%) | 0 (0.0%) |
| 7:30 AM to 7:59 AM | 0 (0.0%) | 0 (0.0%) |
| 8:00 AM to 8:29 AM | 0 (0.0%) | 0 (0.0%) |
| 8:30 AM to 8:59 AM | 0 (0.0%) | 0 (0.0%) |
| 9:00 AM to 9:59 AM | 0 (0.0%) | 0 (0.0%) |
| 10:00 AM to 10:59 AM | 0 (0.0%) | 0 (0.0%) |
| 11:00 AM to 11:59 AM | 0 (0.0%) | 0 (0.0%) |
| 12:00 PM to 3:59 PM | 0 (0.0%) | 0 (0.0%) |
| 4:00 PM to 11:59 PM | 22 (84.6%) | 137 (100.0%) |
| Total | 26 (100.0%) | 137 (100.0%) |
Housing Occupancy in Johnson Village
Occupancy by Ownership in Johnson Village
Of the total 251 dwellings in Johnson Village, owner-occupied units account for 127 (50.6%), while renter-occupied units make up 124 (49.4%).
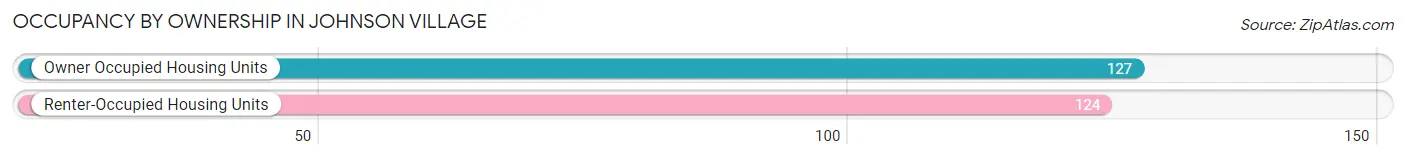
| Occupancy | # Housing Units | % Housing Units |
| Owner Occupied Housing Units | 127 | 50.6% |
| Renter-Occupied Housing Units | 124 | 49.4% |
| Total Occupied Housing Units | 251 | 100.0% |
Occupancy by Household Size in Johnson Village
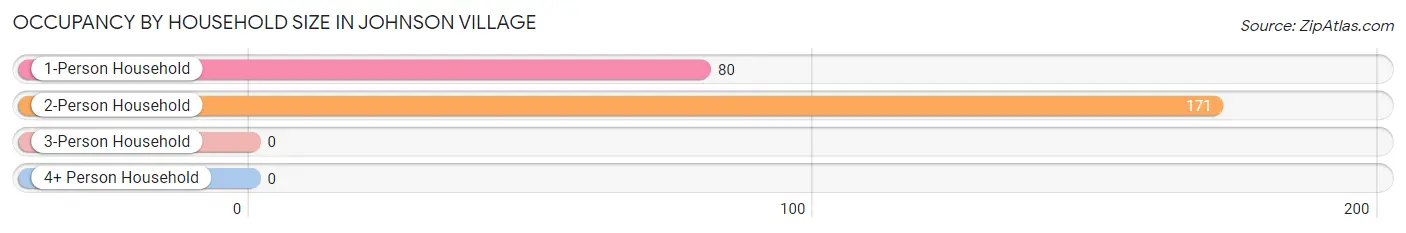
| Household Size | # Housing Units | % Housing Units |
| 1-Person Household | 80 | 31.9% |
| 2-Person Household | 171 | 68.1% |
| 3-Person Household | 0 | 0.0% |
| 4+ Person Household | 0 | 0.0% |
| Total Housing Units | 251 | 100.0% |
Occupancy by Ownership by Household Size in Johnson Village
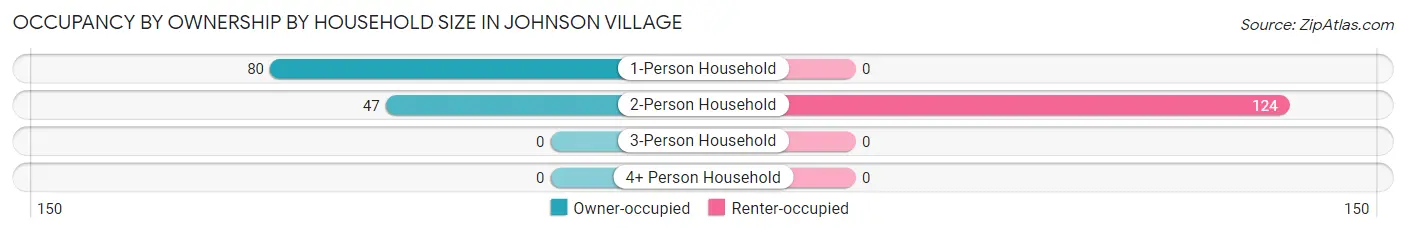
| Household Size | Owner-occupied | Renter-occupied |
| 1-Person Household | 80 (100.0%) | 0 (0.0%) |
| 2-Person Household | 47 (27.5%) | 124 (72.5%) |
| 3-Person Household | 0 (0.0%) | 0 (0.0%) |
| 4+ Person Household | 0 (0.0%) | 0 (0.0%) |
| Total Housing Units | 127 (50.6%) | 124 (49.4%) |
Occupancy by Educational Attainment in Johnson Village
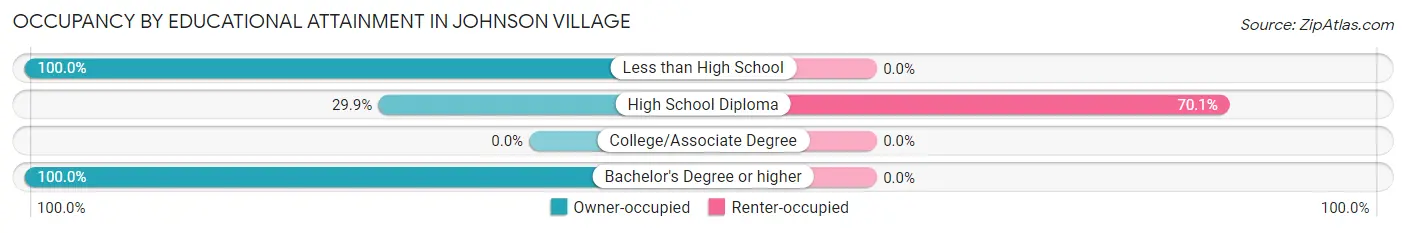
| Household Size | Owner-occupied | Renter-occupied |
| Less than High School | 4 (100.0%) | 0 (0.0%) |
| High School Diploma | 53 (29.9%) | 124 (70.1%) |
| College/Associate Degree | 0 (0.0%) | 0 (0.0%) |
| Bachelor's Degree or higher | 70 (100.0%) | 0 (0.0%) |
Occupancy by Age of Householder in Johnson Village
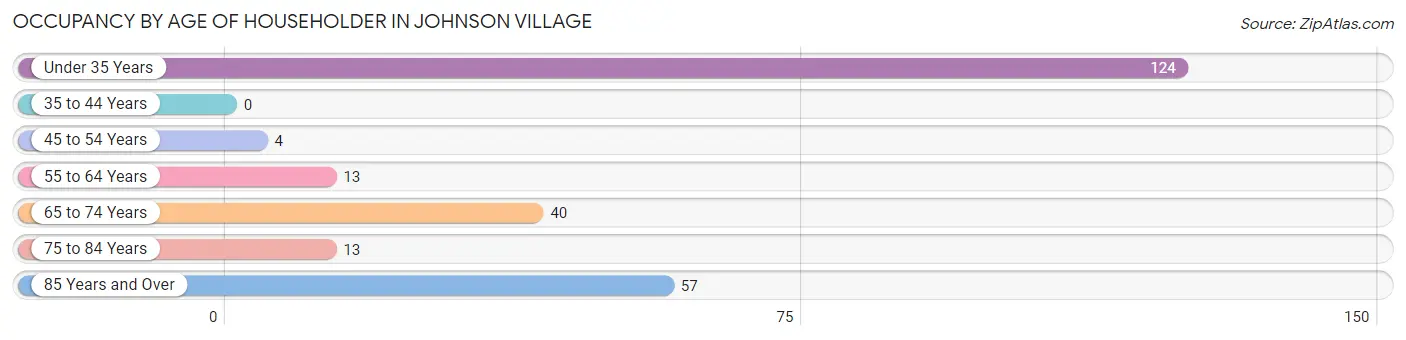
| Age Bracket | # Households | % Households |
| Under 35 Years | 124 | 49.4% |
| 35 to 44 Years | 0 | 0.0% |
| 45 to 54 Years | 4 | 1.6% |
| 55 to 64 Years | 13 | 5.2% |
| 65 to 74 Years | 40 | 15.9% |
| 75 to 84 Years | 13 | 5.2% |
| 85 Years and Over | 57 | 22.7% |
| Total | 251 | 100.0% |
Housing Finances in Johnson Village
Median Income by Occupancy in Johnson Village
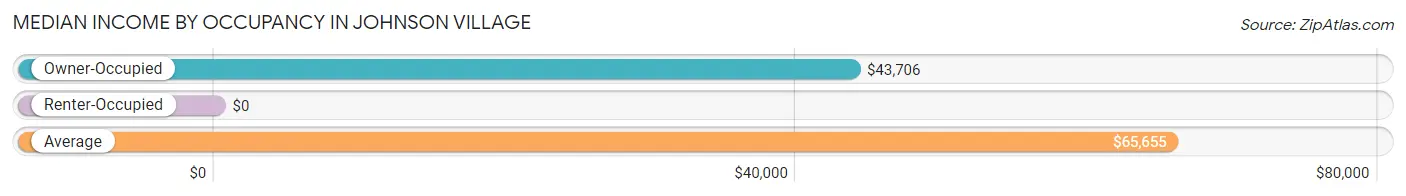
| Occupancy Type | # Households | Median Income |
| Owner-Occupied | 127 (50.6%) | $43,706 |
| Renter-Occupied | 124 (49.4%) | $0 |
| Average | 251 (100.0%) | $65,655 |
Occupancy by Householder Income Bracket in Johnson Village
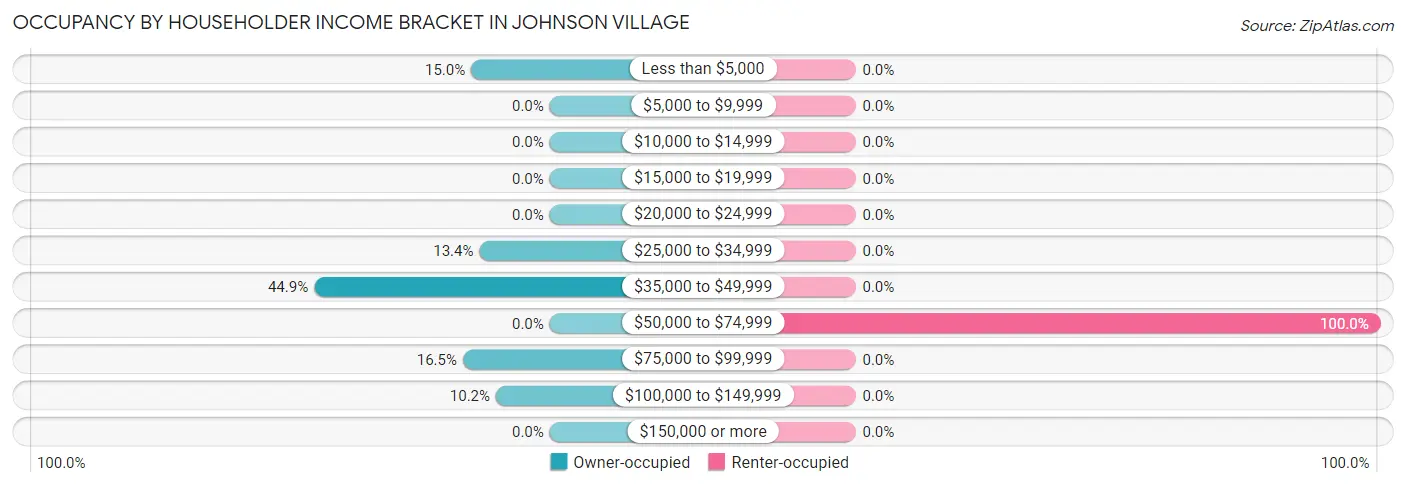
| Income Bracket | Owner-occupied | Renter-occupied |
| Less than $5,000 | 19 (15.0%) | 0 (0.0%) |
| $5,000 to $9,999 | 0 (0.0%) | 0 (0.0%) |
| $10,000 to $14,999 | 0 (0.0%) | 0 (0.0%) |
| $15,000 to $19,999 | 0 (0.0%) | 0 (0.0%) |
| $20,000 to $24,999 | 0 (0.0%) | 0 (0.0%) |
| $25,000 to $34,999 | 17 (13.4%) | 0 (0.0%) |
| $35,000 to $49,999 | 57 (44.9%) | 0 (0.0%) |
| $50,000 to $74,999 | 0 (0.0%) | 124 (100.0%) |
| $75,000 to $99,999 | 21 (16.5%) | 0 (0.0%) |
| $100,000 to $149,999 | 13 (10.2%) | 0 (0.0%) |
| $150,000 or more | 0 (0.0%) | 0 (0.0%) |
| Total | 127 (100.0%) | 124 (100.0%) |
Monthly Housing Cost Tiers in Johnson Village
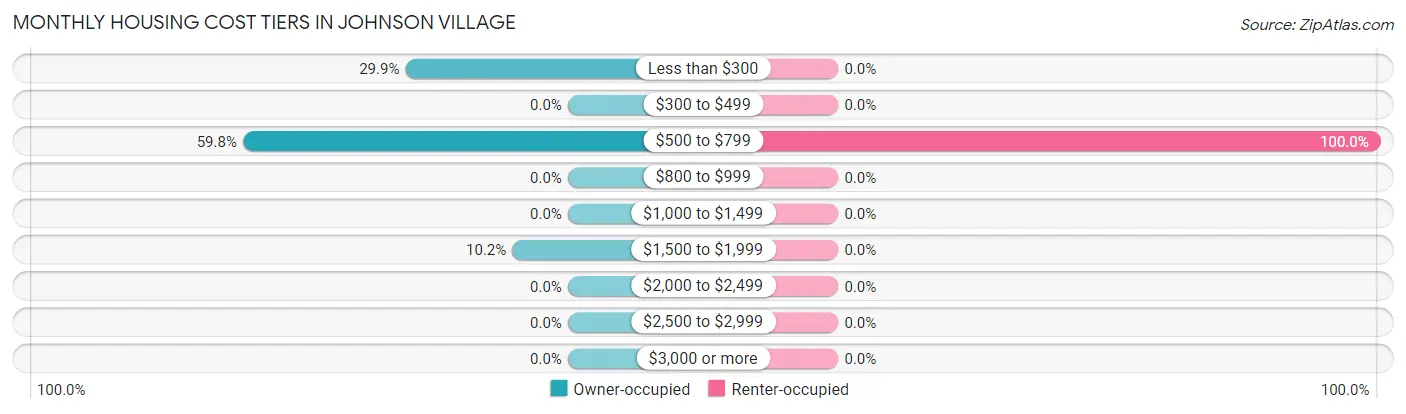
| Monthly Cost | Owner-occupied | Renter-occupied |
| Less than $300 | 38 (29.9%) | 0 (0.0%) |
| $300 to $499 | 0 (0.0%) | 0 (0.0%) |
| $500 to $799 | 76 (59.8%) | 124 (100.0%) |
| $800 to $999 | 0 (0.0%) | 0 (0.0%) |
| $1,000 to $1,499 | 0 (0.0%) | 0 (0.0%) |
| $1,500 to $1,999 | 13 (10.2%) | 0 (0.0%) |
| $2,000 to $2,499 | 0 (0.0%) | 0 (0.0%) |
| $2,500 to $2,999 | 0 (0.0%) | 0 (0.0%) |
| $3,000 or more | 0 (0.0%) | 0 (0.0%) |
| Total | 127 (100.0%) | 124 (100.0%) |
Physical Housing Characteristics in Johnson Village
Housing Structures in Johnson Village
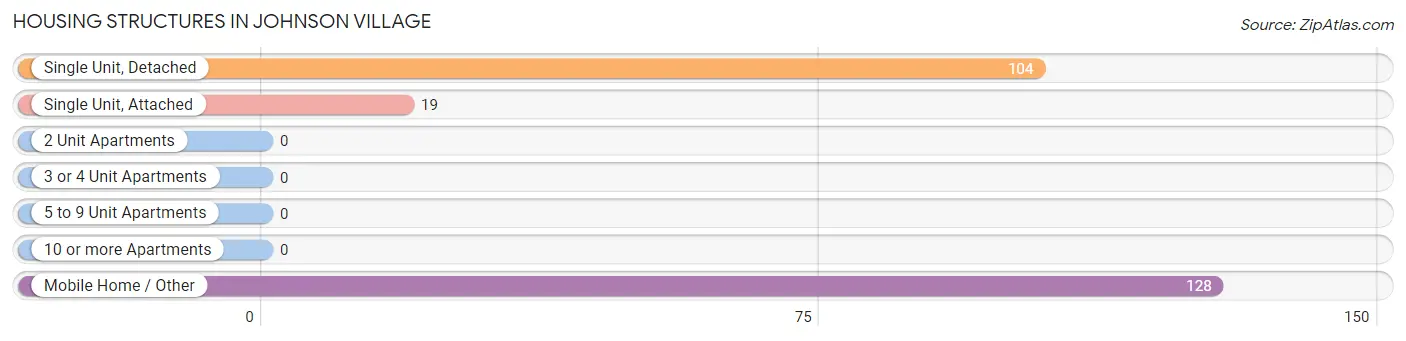
| Structure Type | # Housing Units | % Housing Units |
| Single Unit, Detached | 104 | 41.4% |
| Single Unit, Attached | 19 | 7.6% |
| 2 Unit Apartments | 0 | 0.0% |
| 3 or 4 Unit Apartments | 0 | 0.0% |
| 5 to 9 Unit Apartments | 0 | 0.0% |
| 10 or more Apartments | 0 | 0.0% |
| Mobile Home / Other | 128 | 51.0% |
| Total | 251 | 100.0% |
Housing Structures by Occupancy in Johnson Village
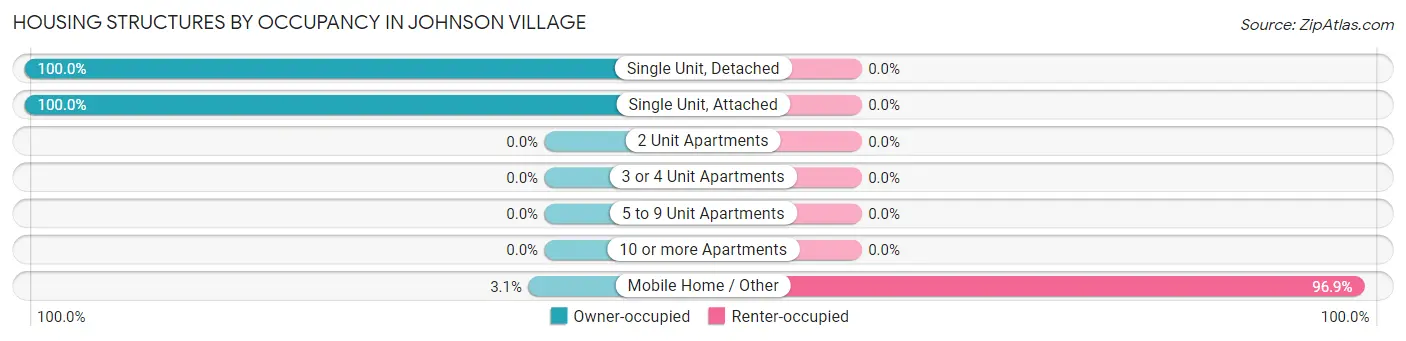
| Structure Type | Owner-occupied | Renter-occupied |
| Single Unit, Detached | 104 (100.0%) | 0 (0.0%) |
| Single Unit, Attached | 19 (100.0%) | 0 (0.0%) |
| 2 Unit Apartments | 0 (0.0%) | 0 (0.0%) |
| 3 or 4 Unit Apartments | 0 (0.0%) | 0 (0.0%) |
| 5 to 9 Unit Apartments | 0 (0.0%) | 0 (0.0%) |
| 10 or more Apartments | 0 (0.0%) | 0 (0.0%) |
| Mobile Home / Other | 4 (3.1%) | 124 (96.9%) |
| Total | 127 (50.6%) | 124 (49.4%) |
Housing Structures by Number of Rooms in Johnson Village
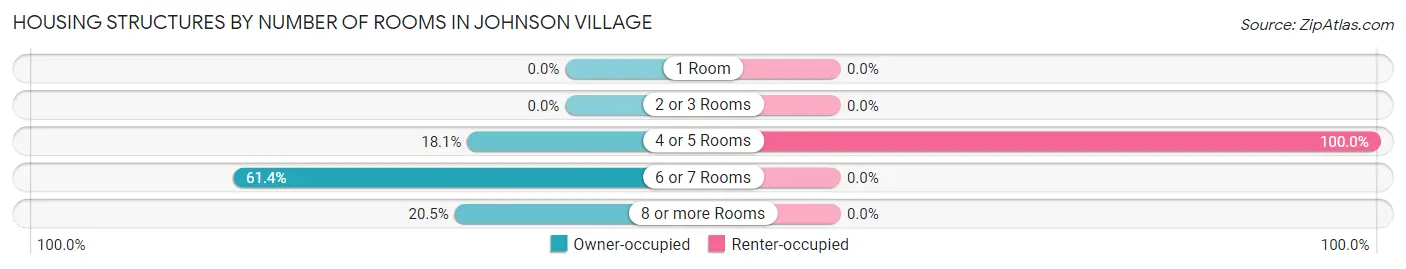
| Number of Rooms | Owner-occupied | Renter-occupied |
| 1 Room | 0 (0.0%) | 0 (0.0%) |
| 2 or 3 Rooms | 0 (0.0%) | 0 (0.0%) |
| 4 or 5 Rooms | 23 (18.1%) | 124 (100.0%) |
| 6 or 7 Rooms | 78 (61.4%) | 0 (0.0%) |
| 8 or more Rooms | 26 (20.5%) | 0 (0.0%) |
| Total | 127 (100.0%) | 124 (100.0%) |
Housing Structure by Heating Type in Johnson Village
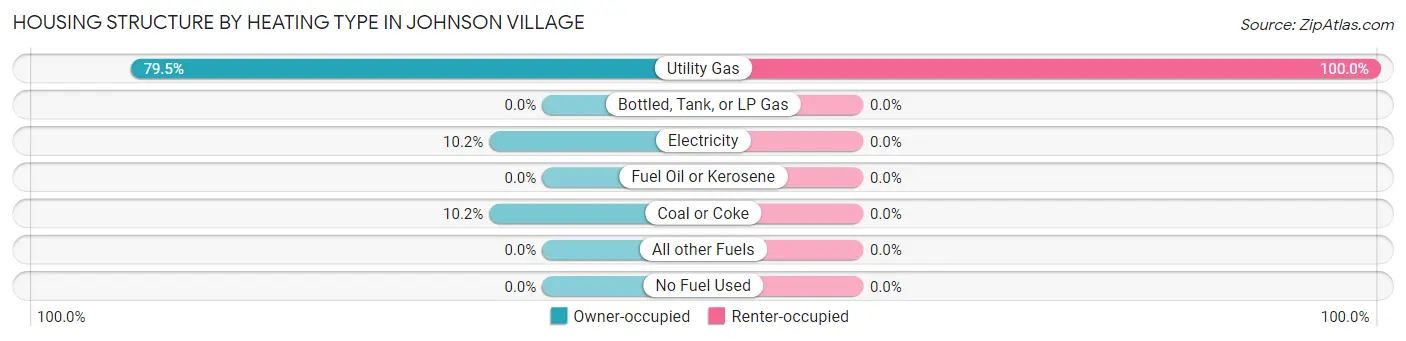
| Heating Type | Owner-occupied | Renter-occupied |
| Utility Gas | 101 (79.5%) | 124 (100.0%) |
| Bottled, Tank, or LP Gas | 0 (0.0%) | 0 (0.0%) |
| Electricity | 13 (10.2%) | 0 (0.0%) |
| Fuel Oil or Kerosene | 0 (0.0%) | 0 (0.0%) |
| Coal or Coke | 13 (10.2%) | 0 (0.0%) |
| All other Fuels | 0 (0.0%) | 0 (0.0%) |
| No Fuel Used | 0 (0.0%) | 0 (0.0%) |
| Total | 127 (100.0%) | 124 (100.0%) |
Household Vehicle Usage in Johnson Village
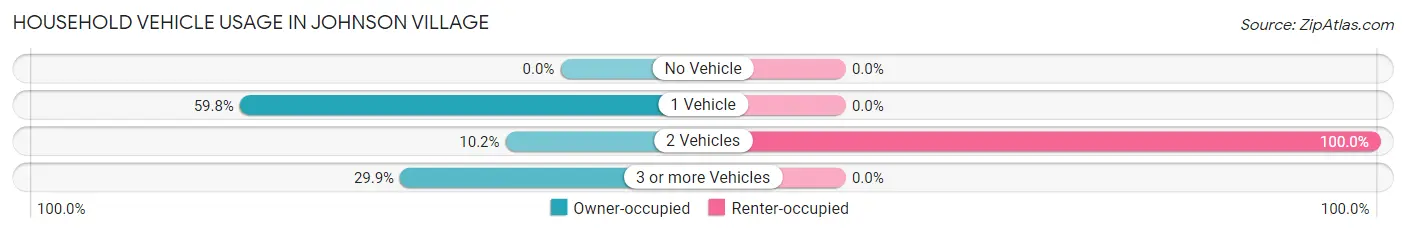
| Vehicles per Household | Owner-occupied | Renter-occupied |
| No Vehicle | 0 (0.0%) | 0 (0.0%) |
| 1 Vehicle | 76 (59.8%) | 0 (0.0%) |
| 2 Vehicles | 13 (10.2%) | 124 (100.0%) |
| 3 or more Vehicles | 38 (29.9%) | 0 (0.0%) |
| Total | 127 (100.0%) | 124 (100.0%) |
Real Estate & Mortgages in Johnson Village
Real Estate and Mortgage Overview in Johnson Village
| Characteristic | Without Mortgage | With Mortgage |
| Housing Units | 51 | 76 |
| Median Property Value | - | - |
| Median Household Income | $86,012 | $0 |
| Monthly Housing Costs | - | - |
| Real Estate Taxes | - | - |
Property Value by Mortgage Status in Johnson Village
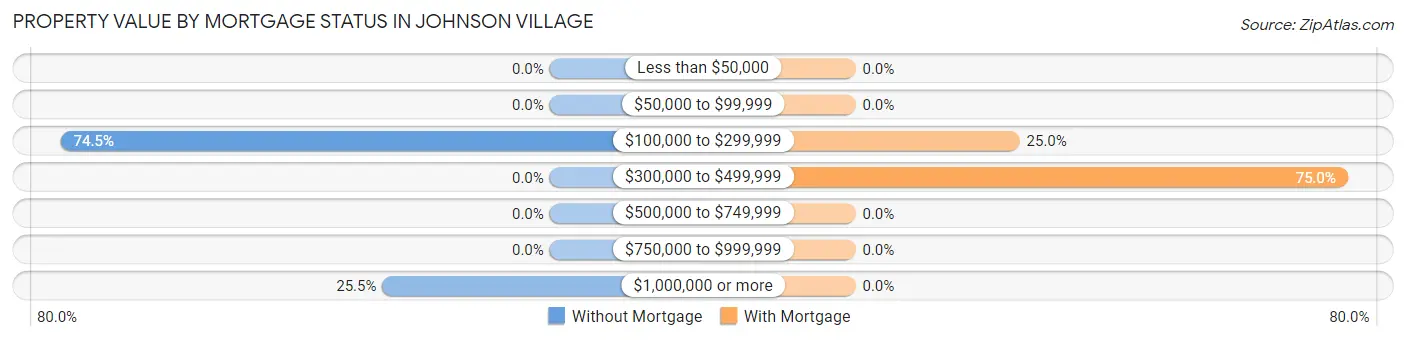
| Property Value | Without Mortgage | With Mortgage |
| Less than $50,000 | 0 (0.0%) | 0 (0.0%) |
| $50,000 to $99,999 | 0 (0.0%) | 0 (0.0%) |
| $100,000 to $299,999 | 38 (74.5%) | 19 (25.0%) |
| $300,000 to $499,999 | 0 (0.0%) | 57 (75.0%) |
| $500,000 to $749,999 | 0 (0.0%) | 0 (0.0%) |
| $750,000 to $999,999 | 0 (0.0%) | 0 (0.0%) |
| $1,000,000 or more | 13 (25.5%) | 0 (0.0%) |
| Total | 51 (100.0%) | 76 (100.0%) |
Household Income by Mortgage Status in Johnson Village
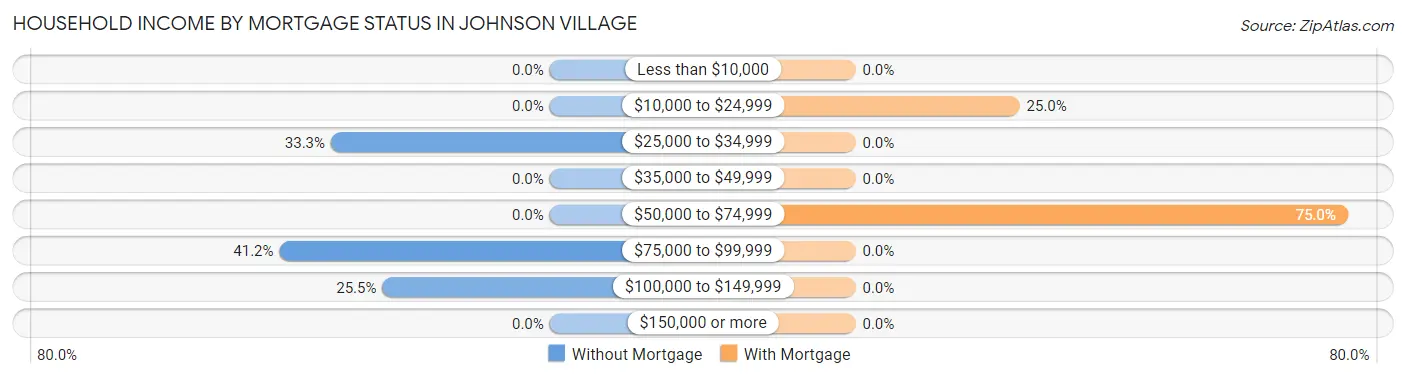
| Household Income | Without Mortgage | With Mortgage |
| Less than $10,000 | 0 (0.0%) | 0 (0.0%) |
| $10,000 to $24,999 | 0 (0.0%) | 19 (25.0%) |
| $25,000 to $34,999 | 17 (33.3%) | 0 (0.0%) |
| $35,000 to $49,999 | 0 (0.0%) | 0 (0.0%) |
| $50,000 to $74,999 | 0 (0.0%) | 57 (75.0%) |
| $75,000 to $99,999 | 21 (41.2%) | 0 (0.0%) |
| $100,000 to $149,999 | 13 (25.5%) | 0 (0.0%) |
| $150,000 or more | 0 (0.0%) | 0 (0.0%) |
| Total | 51 (100.0%) | 76 (100.0%) |
Property Value to Household Income Ratio in Johnson Village
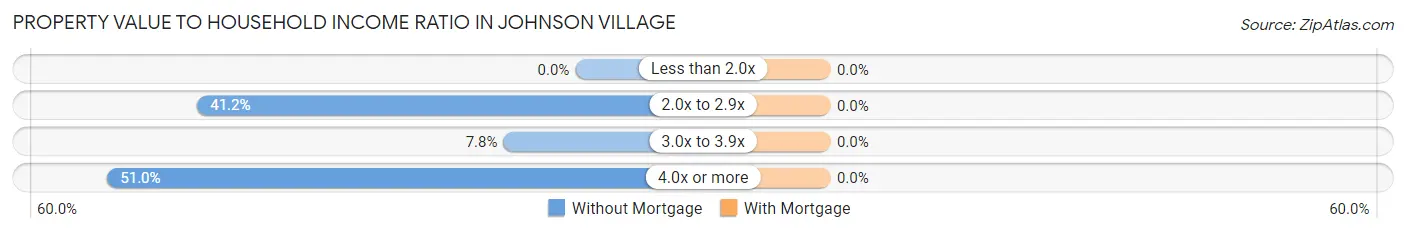
| Value-to-Income Ratio | Without Mortgage | With Mortgage |
| Less than 2.0x | 0 (0.0%) | 0 (0.0%) |
| 2.0x to 2.9x | 21 (41.2%) | 0 (0.0%) |
| 3.0x to 3.9x | 4 (7.8%) | 0 (0.0%) |
| 4.0x or more | 26 (51.0%) | 0 (0.0%) |
| Total | 51 (100.0%) | 76 (100.0%) |
Real Estate Taxes by Mortgage Status in Johnson Village
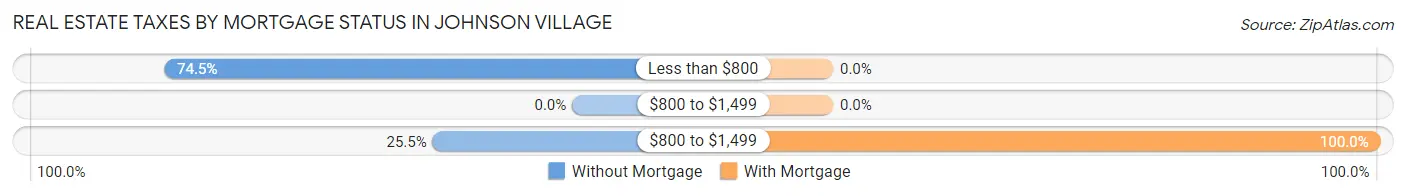
| Property Taxes | Without Mortgage | With Mortgage |
| Less than $800 | 38 (74.5%) | 0 (0.0%) |
| $800 to $1,499 | 0 (0.0%) | 0 (0.0%) |
| $800 to $1,499 | 13 (25.5%) | 76 (100.0%) |
| Total | 51 (100.0%) | 76 (100.0%) |
Health & Disability in Johnson Village
Health Insurance Coverage by Age in Johnson Village
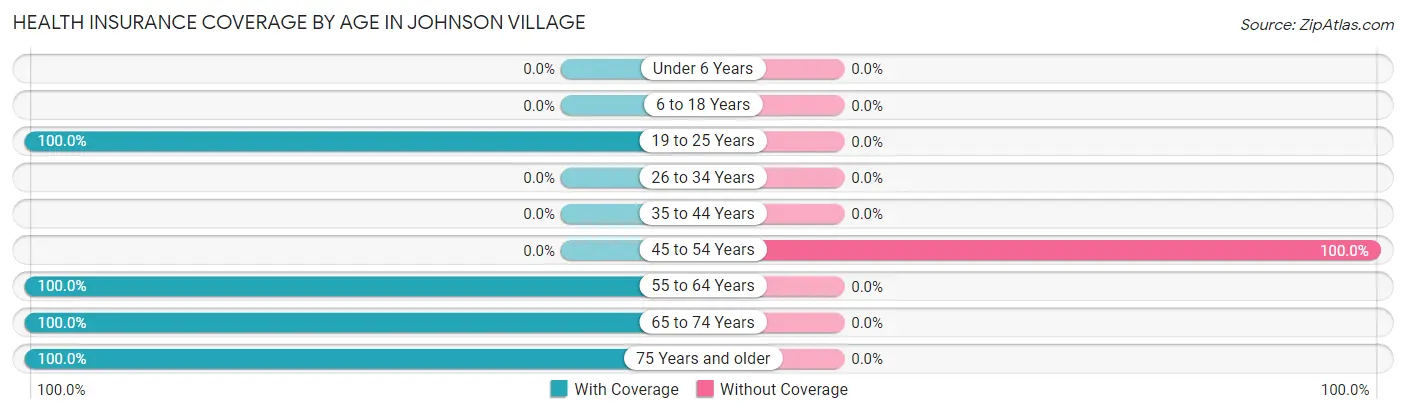
| Age Bracket | With Coverage | Without Coverage |
| Under 6 Years | 0 (0.0%) | 0 (0.0%) |
| 6 to 18 Years | 0 (0.0%) | 0 (0.0%) |
| 19 to 25 Years | 146 (100.0%) | 0 (0.0%) |
| 26 to 34 Years | 0 (0.0%) | 0 (0.0%) |
| 35 to 44 Years | 0 (0.0%) | 0 (0.0%) |
| 45 to 54 Years | 0 (0.0%) | 4 (100.0%) |
| 55 to 64 Years | 30 (100.0%) | 0 (0.0%) |
| 65 to 74 Years | 56 (100.0%) | 0 (0.0%) |
| 75 Years and older | 78 (100.0%) | 0 (0.0%) |
| Total | 310 (98.7%) | 4 (1.3%) |
Health Insurance Coverage by Citizenship Status in Johnson Village
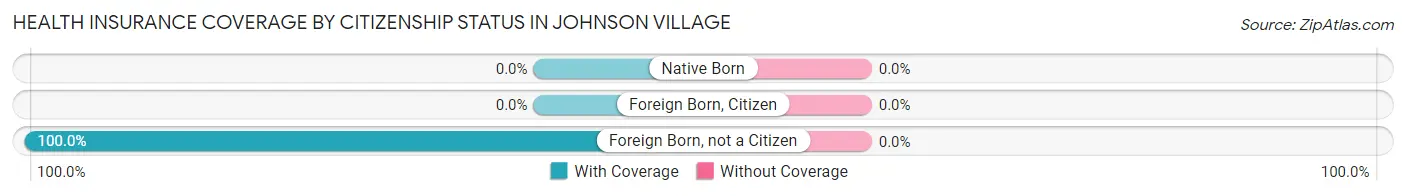
| Citizenship Status | With Coverage | Without Coverage |
| Native Born | 0 (0.0%) | 0 (0.0%) |
| Foreign Born, Citizen | 0 (0.0%) | 0 (0.0%) |
| Foreign Born, not a Citizen | 146 (100.0%) | 0 (0.0%) |
Health Insurance Coverage by Household Income in Johnson Village
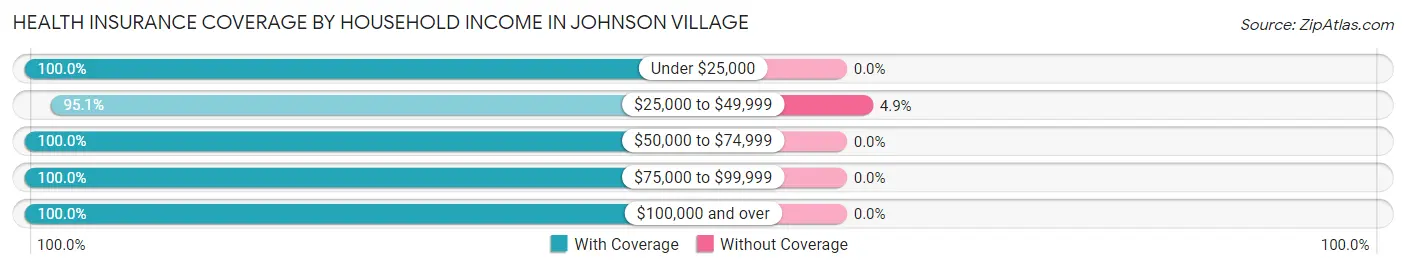
| Household Income | With Coverage | Without Coverage |
| Under $25,000 | 19 (100.0%) | 0 (0.0%) |
| $25,000 to $49,999 | 78 (95.1%) | 4 (4.9%) |
| $50,000 to $74,999 | 146 (100.0%) | 0 (0.0%) |
| $75,000 to $99,999 | 38 (100.0%) | 0 (0.0%) |
| $100,000 and over | 29 (100.0%) | 0 (0.0%) |
Public vs Private Health Insurance Coverage by Age in Johnson Village
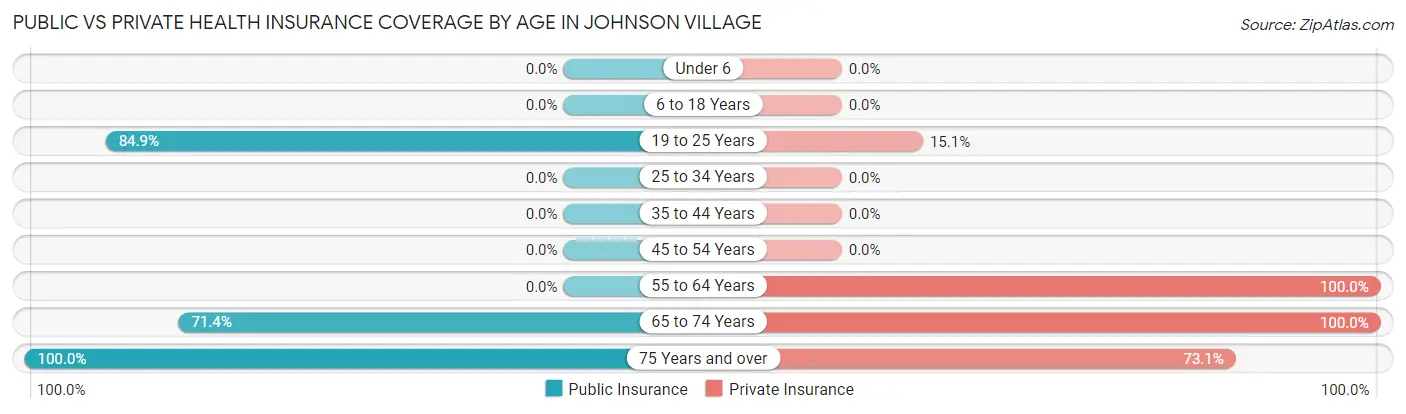
| Age Bracket | Public Insurance | Private Insurance |
| Under 6 | 0 (0.0%) | 0 (0.0%) |
| 6 to 18 Years | 0 (0.0%) | 0 (0.0%) |
| 19 to 25 Years | 124 (84.9%) | 22 (15.1%) |
| 25 to 34 Years | 0 (0.0%) | 0 (0.0%) |
| 35 to 44 Years | 0 (0.0%) | 0 (0.0%) |
| 45 to 54 Years | 0 (0.0%) | 0 (0.0%) |
| 55 to 64 Years | 0 (0.0%) | 30 (100.0%) |
| 65 to 74 Years | 40 (71.4%) | 56 (100.0%) |
| 75 Years and over | 78 (100.0%) | 57 (73.1%) |
| Total | 242 (77.1%) | 165 (52.5%) |
Disability Status by Sex by Age in Johnson Village
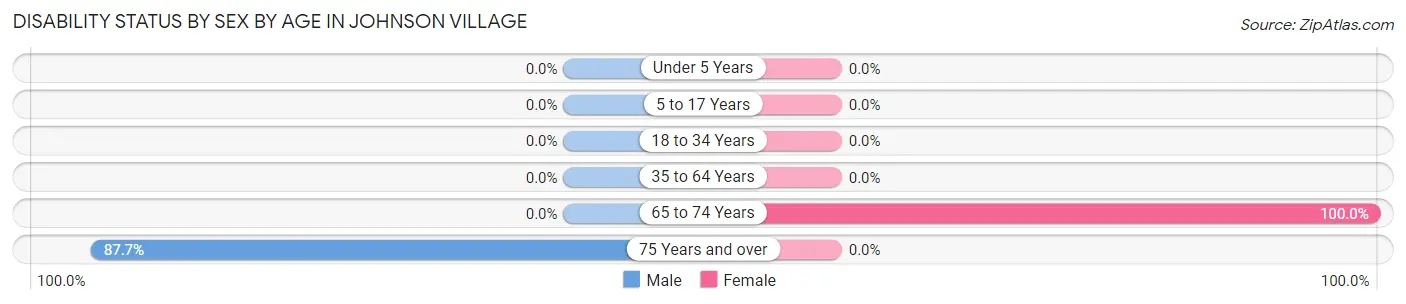
| Age Bracket | Male | Female |
| Under 5 Years | 0 (0.0%) | 0 (0.0%) |
| 5 to 17 Years | 0 (0.0%) | 0 (0.0%) |
| 18 to 34 Years | 0 (0.0%) | 0 (0.0%) |
| 35 to 64 Years | 0 (0.0%) | 0 (0.0%) |
| 65 to 74 Years | 0 (0.0%) | 19 (100.0%) |
| 75 Years and over | 57 (87.7%) | 0 (0.0%) |
Disability Class by Sex by Age in Johnson Village
Disability Class: Hearing Difficulty
| Age Bracket | Male | Female |
| Under 5 Years | 0 (0.0%) | 0 (0.0%) |
| 5 to 17 Years | 0 (0.0%) | 0 (0.0%) |
| 18 to 34 Years | 0 (0.0%) | 0 (0.0%) |
| 35 to 64 Years | 0 (0.0%) | 0 (0.0%) |
| 65 to 74 Years | 0 (0.0%) | 0 (0.0%) |
| 75 Years and over | 0 (0.0%) | 0 (0.0%) |
Disability Class: Vision Difficulty
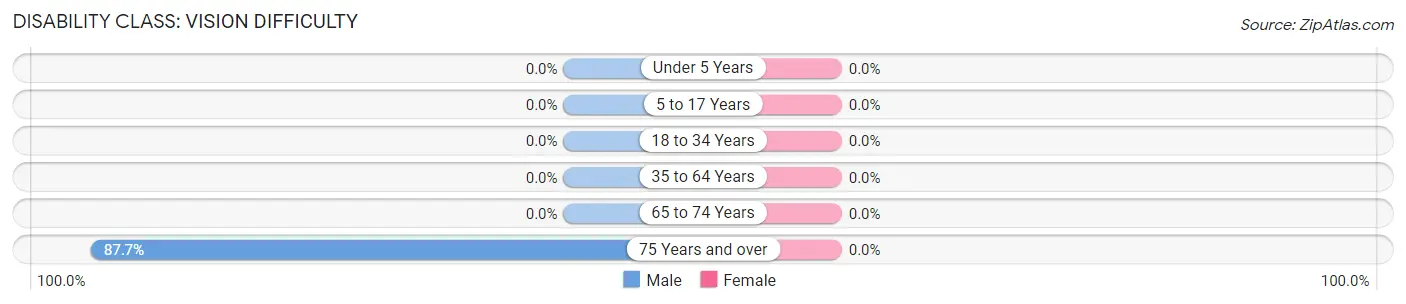
| Age Bracket | Male | Female |
| Under 5 Years | 0 (0.0%) | 0 (0.0%) |
| 5 to 17 Years | 0 (0.0%) | 0 (0.0%) |
| 18 to 34 Years | 0 (0.0%) | 0 (0.0%) |
| 35 to 64 Years | 0 (0.0%) | 0 (0.0%) |
| 65 to 74 Years | 0 (0.0%) | 0 (0.0%) |
| 75 Years and over | 57 (87.7%) | 0 (0.0%) |
Disability Class: Cognitive Difficulty
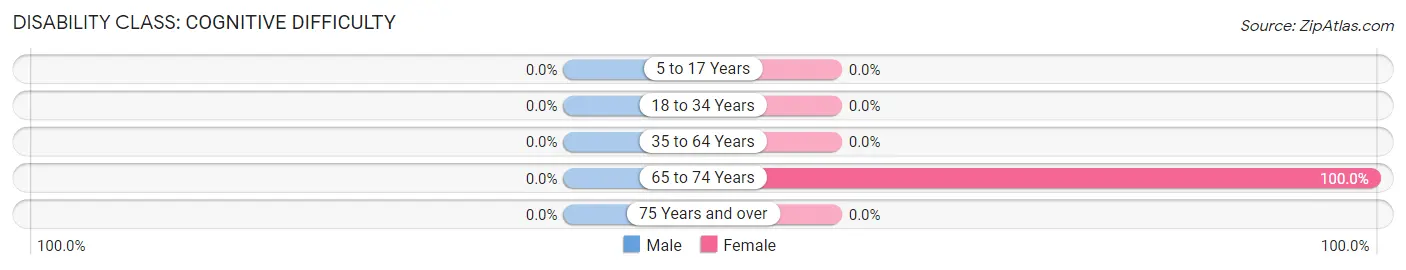
| Age Bracket | Male | Female |
| 5 to 17 Years | 0 (0.0%) | 0 (0.0%) |
| 18 to 34 Years | 0 (0.0%) | 0 (0.0%) |
| 35 to 64 Years | 0 (0.0%) | 0 (0.0%) |
| 65 to 74 Years | 0 (0.0%) | 19 (100.0%) |
| 75 Years and over | 0 (0.0%) | 0 (0.0%) |
Disability Class: Ambulatory Difficulty
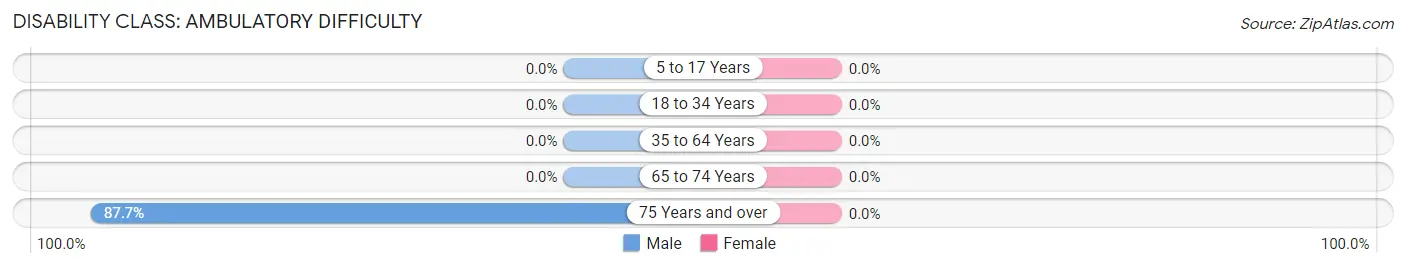
| Age Bracket | Male | Female |
| 5 to 17 Years | 0 (0.0%) | 0 (0.0%) |
| 18 to 34 Years | 0 (0.0%) | 0 (0.0%) |
| 35 to 64 Years | 0 (0.0%) | 0 (0.0%) |
| 65 to 74 Years | 0 (0.0%) | 0 (0.0%) |
| 75 Years and over | 57 (87.7%) | 0 (0.0%) |
Disability Class: Self-Care Difficulty

| Age Bracket | Male | Female |
| 5 to 17 Years | 0 (0.0%) | 0 (0.0%) |
| 18 to 34 Years | 0 (0.0%) | 0 (0.0%) |
| 35 to 64 Years | 0 (0.0%) | 0 (0.0%) |
| 65 to 74 Years | 0 (0.0%) | 0 (0.0%) |
| 75 Years and over | 57 (87.7%) | 0 (0.0%) |
Technology Access in Johnson Village
Computing Device Access in Johnson Village
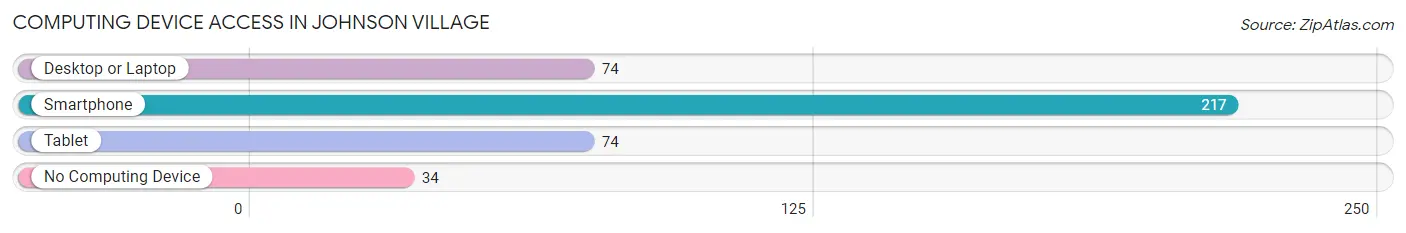
| Device Type | # Households | % Households |
| Desktop or Laptop | 74 | 29.5% |
| Smartphone | 217 | 86.5% |
| Tablet | 74 | 29.5% |
| No Computing Device | 34 | 13.6% |
| Total | 251 | 100.0% |
Internet Access in Johnson Village
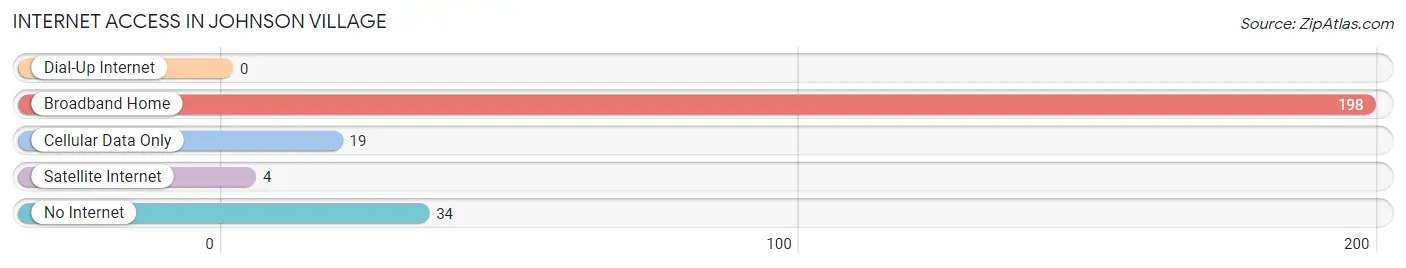
| Internet Type | # Households | % Households |
| Dial-Up Internet | 0 | 0.0% |
| Broadband Home | 198 | 78.9% |
| Cellular Data Only | 19 | 7.6% |
| Satellite Internet | 4 | 1.6% |
| No Internet | 34 | 13.6% |
| Total | 251 | 100.0% |
Johnson Village Summary
Introduction
Johnson Village is a small unincorporated community located in Chaffee County, Colorado. It is situated in the heart of the Rocky Mountains, just south of the Arkansas River. The village is home to a population of approximately 200 people, and is known for its picturesque mountain views and outdoor recreation opportunities.
History
Johnson Village was founded in 1881 by a group of settlers from the Midwest. The village was named after the first settler, John Johnson, who had come to the area in search of gold. The village quickly grew in size and by the early 1900s, it had become a bustling community with a post office, general store, and several other businesses.
In the 1920s, the village began to decline as the gold rush ended and the population began to move away. However, the village was able to survive due to its proximity to the Arkansas River, which provided a steady source of water for the local farms and ranches.
In the 1950s, the village began to experience a resurgence as tourists began to visit the area for its outdoor recreation opportunities. The village was able to capitalize on this new influx of visitors and began to develop a tourism industry. Today, Johnson Village is a popular destination for outdoor enthusiasts, and is home to several restaurants, lodging options, and other businesses.
Geography
Johnson Village is located in the heart of the Rocky Mountains, just south of the Arkansas River. The village is situated at an elevation of 8,000 feet, and is surrounded by the majestic peaks of the Sawatch Range. The village is located in a valley, and is surrounded by lush forests and meadows.
The climate in Johnson Village is generally mild, with warm summers and cold winters. The average annual temperature is around 45 degrees Fahrenheit, and the average annual precipitation is around 20 inches.
Economy
The economy of Johnson Village is largely based on tourism. The village is a popular destination for outdoor enthusiasts, and is home to several restaurants, lodging options, and other businesses. The village also has a small agricultural sector, with several local farms and ranches.
Demographics
As of the 2010 census, the population of Johnson Village was approximately 200 people. The racial makeup of the village was 95.5% White, 0.5% African American, 0.5% Native American, 0.5% Asian, and 3% from other races. The median household income was $37,500, and the median age was 44 years.
Conclusion
Johnson Village is a small unincorporated community located in Chaffee County, Colorado. It is situated in the heart of the Rocky Mountains, just south of the Arkansas River. The village is home to a population of approximately 200 people, and is known for its picturesque mountain views and outdoor recreation opportunities. The economy of Johnson Village is largely based on tourism, and the village is a popular destination for outdoor enthusiasts. The racial makeup of the village is predominantly White, with a small percentage of African American, Native American, and Asian residents.
Common Questions
What is Per Capita Income in Johnson Village?
Per Capita income in Johnson Village is $34,754.
What is the Median Household income in Johnson Village?
Median Household Income in Johnson Village is $65,655.
What is Inequality or Gini Index in Johnson Village?
Inequality or Gini Index in Johnson Village is 0.21.
What is the Total Population of Johnson Village?
Total Population of Johnson Village is 314.
What is the Total Male Population of Johnson Village?
Total Male Population of Johnson Village is 128.
What is the Total Female Population of Johnson Village?
Total Female Population of Johnson Village is 186.
What is the Ratio of Males per 100 Females in Johnson Village?
There are 68.82 Males per 100 Females in Johnson Village.
What is the Ratio of Females per 100 Males in Johnson Village?
There are 145.31 Females per 100 Males in Johnson Village.
What is the Median Population Age in Johnson Village?
Median Population Age in Johnson Village is 60.5 Years.
What is the Average Family Size in Johnson Village
Average Family Size in Johnson Village is 2.0 People.
What is the Average Household Size in Johnson Village
Average Household Size in Johnson Village is 1.2 People.
How Large is the Labor Force in Johnson Village?
There are 192 People in the Labor Forcein in Johnson Village.
What is the Percentage of People in the Labor Force in Johnson Village?
61.1% of People are in the Labor Force in Johnson Village.
What is the Unemployment Rate in Johnson Village?
Unemployment Rate in Johnson Village is 6.8%.