Muscatine, IA Map & Demographics
Muscatine Map
Muscatine Overview
$29,550
PER CAPITA INCOME
$71,960
AVG FAMILY INCOME
$58,474
AVG HOUSEHOLD INCOME
42.1%
WAGE / INCOME GAP [ % ]
57.9¢/ $1
WAGE / INCOME GAP [ $ ]
$12,581
FAMILY INCOME DEFICIT
0.41
INEQUALITY / GINI INDEX
23,671
TOTAL POPULATION
11,907
MALE POPULATION
11,764
FEMALE POPULATION
101.22
MALES / 100 FEMALES
98.80
FEMALES / 100 MALES
35.9
MEDIAN AGE
3.0
AVG FAMILY SIZE
2.5
AVG HOUSEHOLD SIZE
12,000
LABOR FORCE [ PEOPLE ]
64.9%
PERCENT IN LABOR FORCE
4.3%
UNEMPLOYMENT RATE
Muscatine Zip Codes
Muscatine Area Codes
Income in Muscatine
Income Overview in Muscatine
Per Capita Income in Muscatine is $29,550, while median incomes of families and households are $71,960 and $58,474 respectively.
| Characteristic | Number | Measure |
| Per Capita Income | 23,671 | $29,550 |
| Median Family Income | 6,185 | $71,960 |
| Mean Family Income | 6,185 | $81,856 |
| Median Household Income | 9,415 | $58,474 |
| Mean Household Income | 9,415 | $73,029 |
| Income Deficit | 6,185 | $12,581 |
| Wage / Income Gap (%) | 23,671 | 42.07% |
| Wage / Income Gap ($) | 23,671 | 57.93¢ per $1 |
| Gini / Inequality Index | 23,671 | 0.41 |
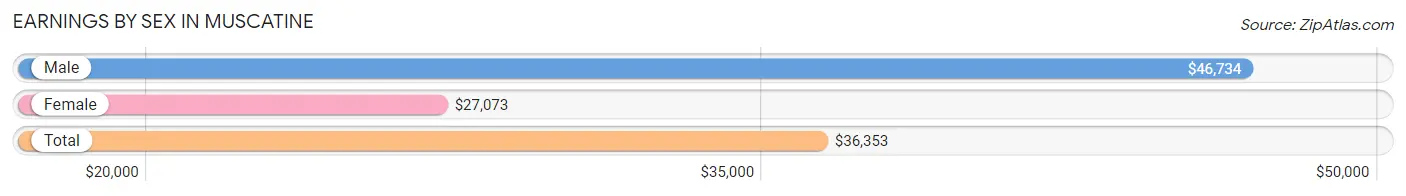
Earnings by Sex in Muscatine
Average Earnings in Muscatine are $36,353, $46,734 for men and $27,073 for women, a difference of 42.1%.
| Sex | Number | Average Earnings |
| Male | 7,011 (54.2%) | $46,734 |
| Female | 5,916 (45.8%) | $27,073 |
| Total | 12,927 (100.0%) | $36,353 |
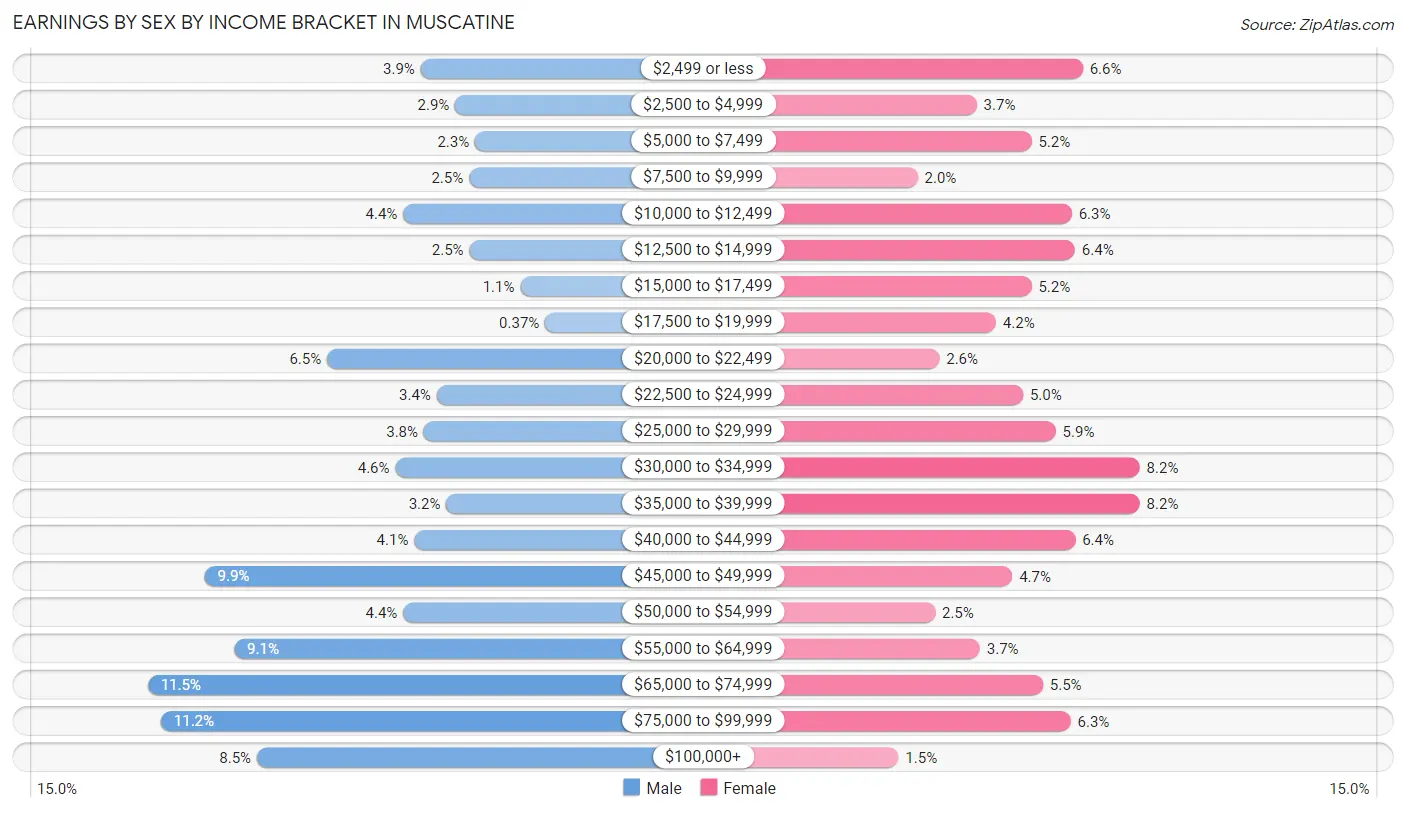
Earnings by Sex by Income Bracket in Muscatine
The most common earnings brackets in Muscatine are $65,000 to $74,999 for men (809 | 11.5%) and $30,000 to $34,999 for women (487 | 8.2%).
| Income | Male | Female |
| $2,499 or less | 271 (3.9%) | 392 (6.6%) |
| $2,500 to $4,999 | 203 (2.9%) | 216 (3.6%) |
| $5,000 to $7,499 | 164 (2.3%) | 307 (5.2%) |
| $7,500 to $9,999 | 176 (2.5%) | 118 (2.0%) |
| $10,000 to $12,499 | 306 (4.4%) | 374 (6.3%) |
| $12,500 to $14,999 | 175 (2.5%) | 379 (6.4%) |
| $15,000 to $17,499 | 75 (1.1%) | 307 (5.2%) |
| $17,500 to $19,999 | 26 (0.4%) | 248 (4.2%) |
| $20,000 to $22,499 | 456 (6.5%) | 154 (2.6%) |
| $22,500 to $24,999 | 240 (3.4%) | 293 (5.0%) |
| $25,000 to $29,999 | 265 (3.8%) | 347 (5.9%) |
| $30,000 to $34,999 | 321 (4.6%) | 487 (8.2%) |
| $35,000 to $39,999 | 221 (3.2%) | 487 (8.2%) |
| $40,000 to $44,999 | 284 (4.1%) | 380 (6.4%) |
| $45,000 to $49,999 | 697 (9.9%) | 275 (4.6%) |
| $50,000 to $54,999 | 306 (4.4%) | 147 (2.5%) |
| $55,000 to $64,999 | 639 (9.1%) | 221 (3.7%) |
| $65,000 to $74,999 | 809 (11.5%) | 326 (5.5%) |
| $75,000 to $99,999 | 783 (11.2%) | 372 (6.3%) |
| $100,000+ | 594 (8.5%) | 86 (1.5%) |
| Total | 7,011 (100.0%) | 5,916 (100.0%) |
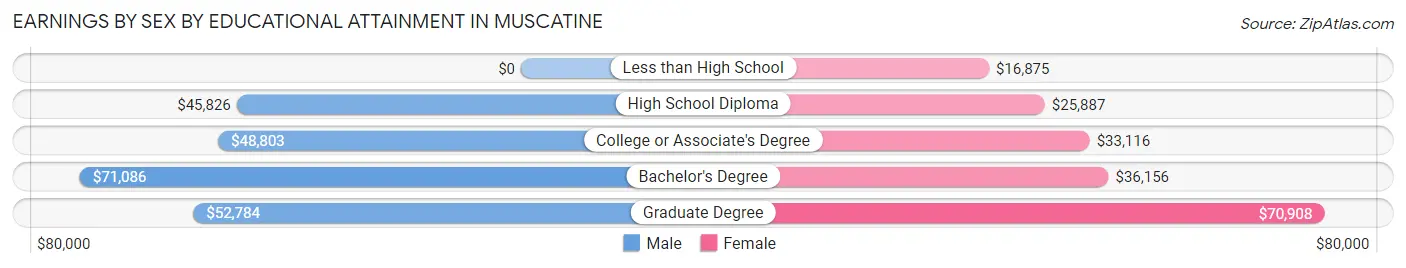
Earnings by Sex by Educational Attainment in Muscatine
Average earnings in Muscatine are $51,155 for men and $31,637 for women, a difference of 38.2%. Men with an educational attainment of bachelor's degree enjoy the highest average annual earnings of $71,086, while those with high school diploma education earn the least with $45,826. Women with an educational attainment of graduate degree earn the most with the average annual earnings of $70,908, while those with less than high school education have the smallest earnings of $16,875.
| Educational Attainment | Male Income | Female Income |
| Less than High School | - | - |
| High School Diploma | $45,826 | $25,887 |
| College or Associate's Degree | $48,803 | $33,116 |
| Bachelor's Degree | $71,086 | $36,156 |
| Graduate Degree | $52,784 | $70,908 |
| Total | $51,155 | $31,637 |
Family Income in Muscatine
Family Income Brackets in Muscatine
According to the Muscatine family income data, there are 1,484 families falling into the $100,000 to $149,999 income range, which is the most common income bracket and makes up 24.0% of all families. Conversely, the $200,000+ income bracket is the least frequent group with only 216 families (3.5%) belonging to this category.
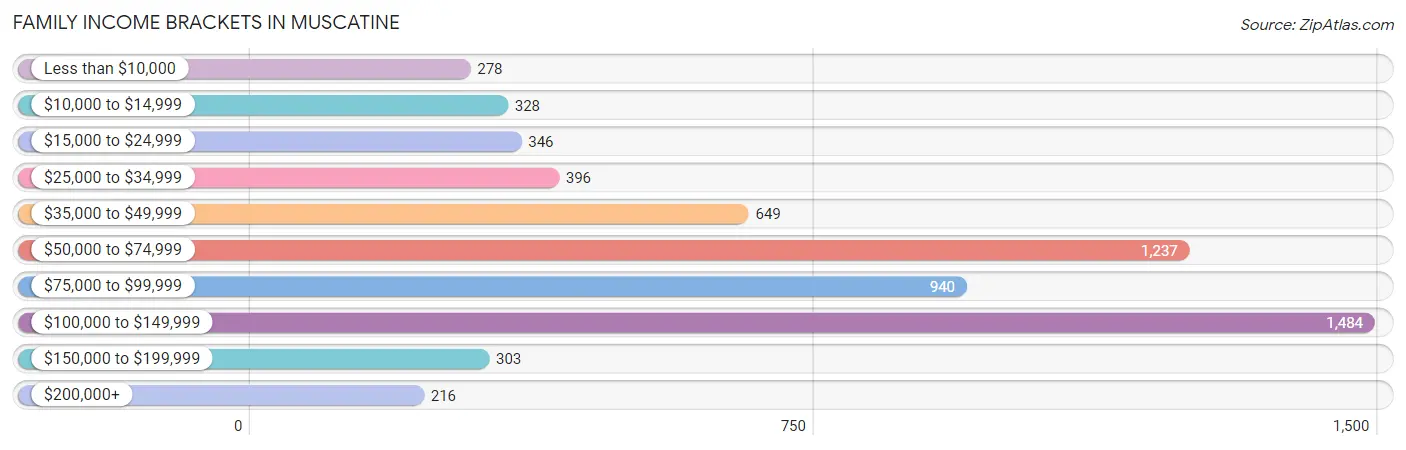
| Income Bracket | # Families | % Families |
| Less than $10,000 | 278 | 4.5% |
| $10,000 to $14,999 | 328 | 5.3% |
| $15,000 to $24,999 | 346 | 5.6% |
| $25,000 to $34,999 | 396 | 6.4% |
| $35,000 to $49,999 | 649 | 10.5% |
| $50,000 to $74,999 | 1,237 | 20.0% |
| $75,000 to $99,999 | 940 | 15.2% |
| $100,000 to $149,999 | 1,484 | 24.0% |
| $150,000 to $199,999 | 303 | 4.9% |
| $200,000+ | 216 | 3.5% |
Family Income by Famaliy Size in Muscatine
7+ person families (88 | 1.4%) account for the highest median family income in Muscatine with $116,000 per family, while 2-person families (2,693 | 43.5%) have the highest median income of $30,205 per family member.
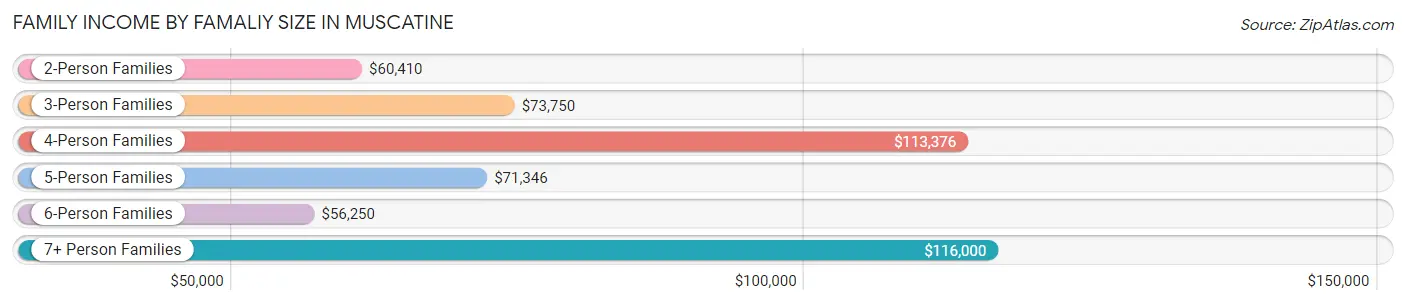
| Income Bracket | # Families | Median Income |
| 2-Person Families | 2,693 (43.5%) | $60,410 |
| 3-Person Families | 1,426 (23.1%) | $73,750 |
| 4-Person Families | 1,044 (16.9%) | $113,376 |
| 5-Person Families | 688 (11.1%) | $71,346 |
| 6-Person Families | 246 (4.0%) | $56,250 |
| 7+ Person Families | 88 (1.4%) | $116,000 |
| Total | 6,185 (100.0%) | $71,960 |
Family Income by Number of Earners in Muscatine
The median family income in Muscatine is $71,960, with families comprising 3+ earners (960) having the highest median family income of $116,786, while families with no earners (709) have the lowest median family income of $33,347, accounting for 15.5% and 11.5% of families, respectively.
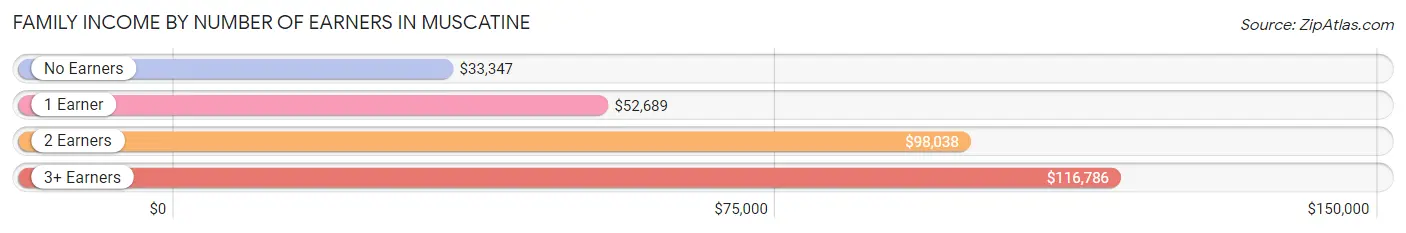
| Number of Earners | # Families | Median Income |
| No Earners | 709 (11.5%) | $33,347 |
| 1 Earner | 2,147 (34.7%) | $52,689 |
| 2 Earners | 2,369 (38.3%) | $98,038 |
| 3+ Earners | 960 (15.5%) | $116,786 |
| Total | 6,185 (100.0%) | $71,960 |
Household Income in Muscatine
Household Income Brackets in Muscatine
With 1,779 households falling in the category, the $50,000 to $74,999 income range is the most frequent in Muscatine, accounting for 18.9% of all households. In contrast, only 264 households (2.8%) fall into the $200,000+ income bracket, making it the least populous group.
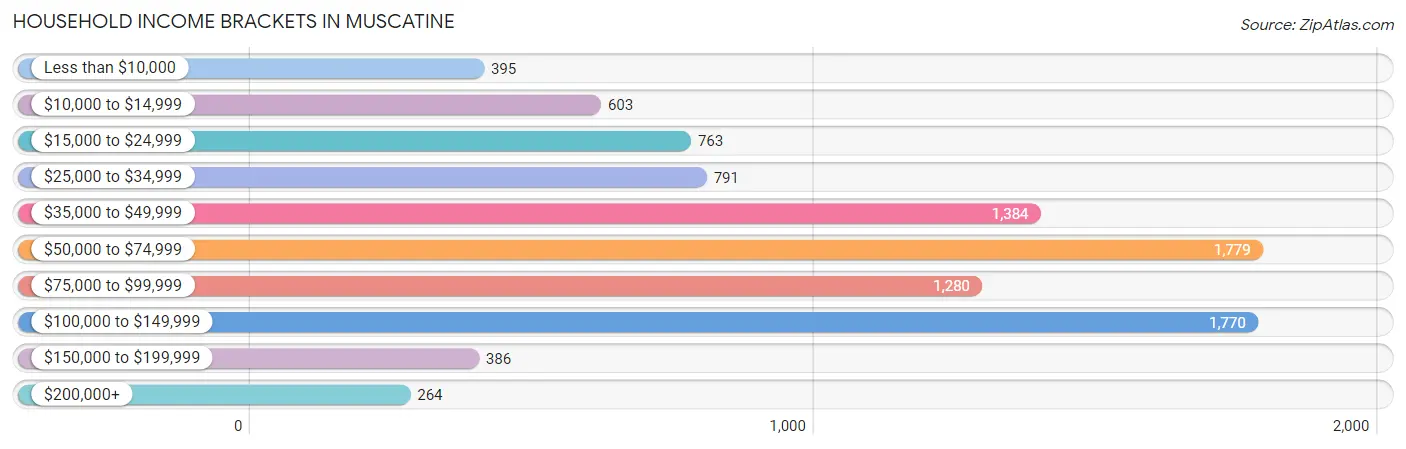
| Income Bracket | # Households | % Households |
| Less than $10,000 | 395 | 4.2% |
| $10,000 to $14,999 | 603 | 6.4% |
| $15,000 to $24,999 | 763 | 8.1% |
| $25,000 to $34,999 | 791 | 8.4% |
| $35,000 to $49,999 | 1,384 | 14.7% |
| $50,000 to $74,999 | 1,779 | 18.9% |
| $75,000 to $99,999 | 1,280 | 13.6% |
| $100,000 to $149,999 | 1,770 | 18.8% |
| $150,000 to $199,999 | 386 | 4.1% |
| $200,000+ | 264 | 2.8% |
Household Income by Householder Age in Muscatine
The median household income in Muscatine is $58,474, with the highest median household income of $69,790 found in the 25 to 44 years age bracket for the primary householder. A total of 3,219 households (34.2%) fall into this category. Meanwhile, the 65+ years age bracket for the primary householder has the lowest median household income of $43,778, with 2,381 households (25.3%) in this group.
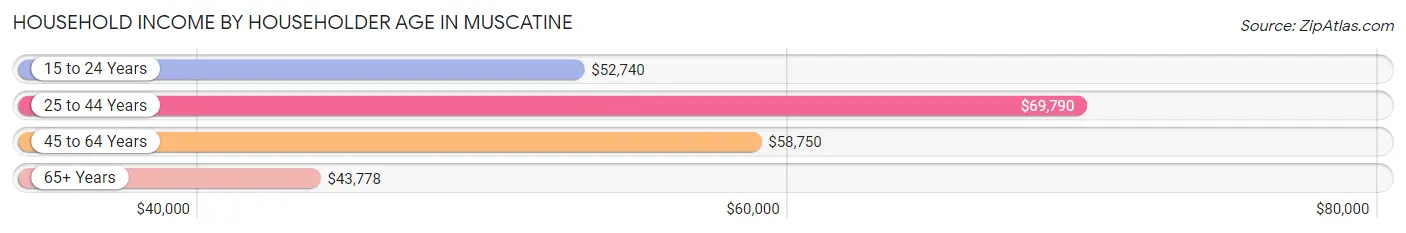
| Income Bracket | # Households | Median Income |
| 15 to 24 Years | 554 (5.9%) | $52,740 |
| 25 to 44 Years | 3,219 (34.2%) | $69,790 |
| 45 to 64 Years | 3,261 (34.6%) | $58,750 |
| 65+ Years | 2,381 (25.3%) | $43,778 |
| Total | 9,415 (100.0%) | $58,474 |
Poverty in Muscatine
Income Below Poverty by Sex and Age in Muscatine
With 15.3% poverty level for males and 19.5% for females among the residents of Muscatine, 12 to 14 year old males and 5 year old females are the most vulnerable to poverty, with 245 males (41.7%) and 98 females (46.9%) in their respective age groups living below the poverty level.
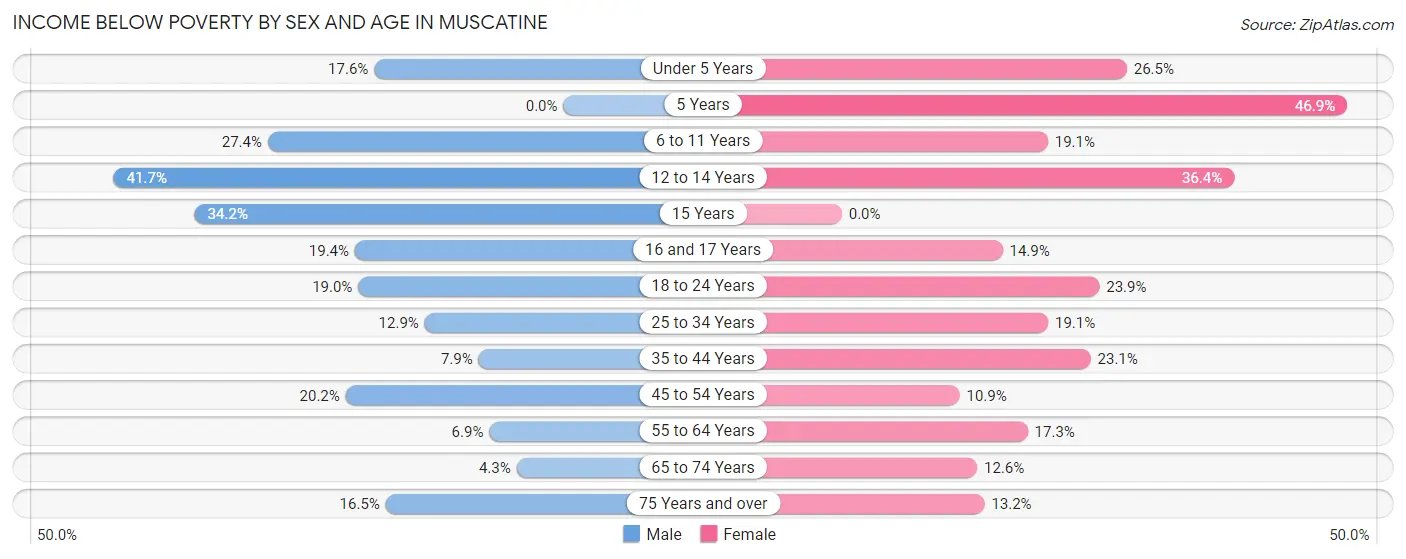
| Age Bracket | Male | Female |
| Under 5 Years | 158 (17.6%) | 214 (26.5%) |
| 5 Years | 0 (0.0%) | 98 (46.9%) |
| 6 to 11 Years | 240 (27.4%) | 165 (19.1%) |
| 12 to 14 Years | 245 (41.7%) | 202 (36.4%) |
| 15 Years | 38 (34.2%) | 0 (0.0%) |
| 16 and 17 Years | 72 (19.4%) | 57 (14.9%) |
| 18 to 24 Years | 223 (19.0%) | 239 (23.9%) |
| 25 to 34 Years | 186 (12.9%) | 338 (19.1%) |
| 35 to 44 Years | 133 (7.9%) | 317 (23.1%) |
| 45 to 54 Years | 235 (20.2%) | 136 (10.9%) |
| 55 to 64 Years | 118 (6.9%) | 238 (17.2%) |
| 65 to 74 Years | 40 (4.3%) | 154 (12.6%) |
| 75 Years and over | 79 (16.5%) | 99 (13.2%) |
| Total | 1,767 (15.3%) | 2,257 (19.5%) |
Income Above Poverty by Sex and Age in Muscatine
According to the poverty statistics in Muscatine, males aged 5 years and females aged 15 years are the age groups that are most secure financially, with 100.0% of males and 100.0% of females in these age groups living above the poverty line.
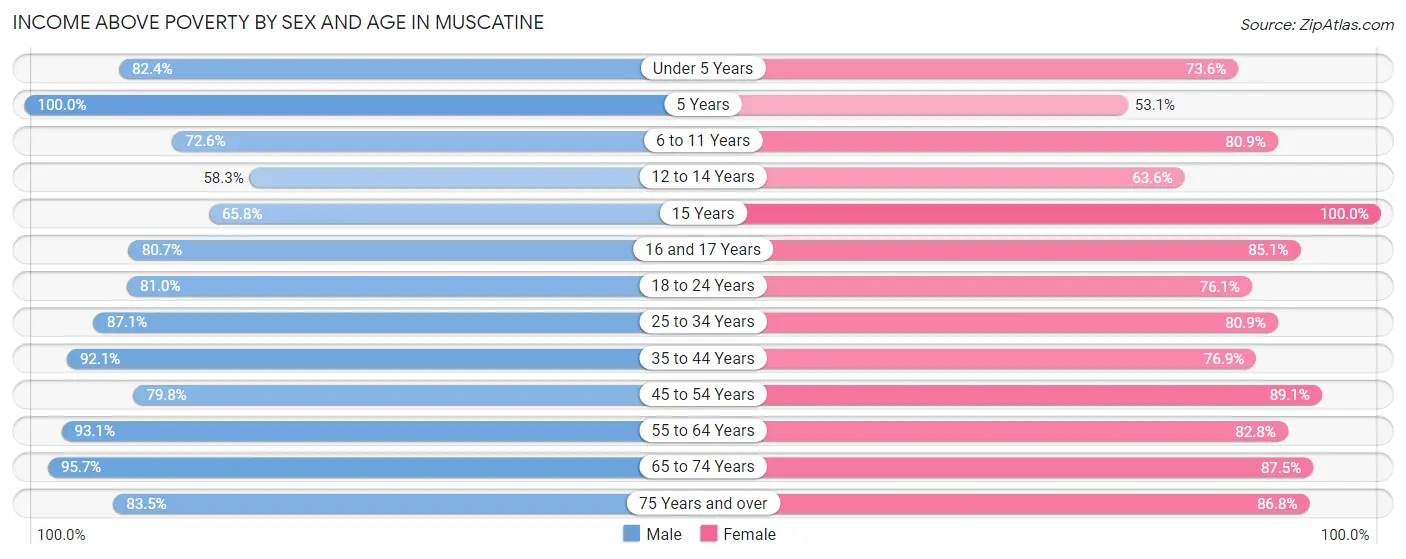
| Age Bracket | Male | Female |
| Under 5 Years | 742 (82.4%) | 595 (73.6%) |
| 5 Years | 152 (100.0%) | 111 (53.1%) |
| 6 to 11 Years | 635 (72.6%) | 698 (80.9%) |
| 12 to 14 Years | 342 (58.3%) | 353 (63.6%) |
| 15 Years | 73 (65.8%) | 16 (100.0%) |
| 16 and 17 Years | 300 (80.6%) | 325 (85.1%) |
| 18 to 24 Years | 948 (81.0%) | 761 (76.1%) |
| 25 to 34 Years | 1,259 (87.1%) | 1,428 (80.9%) |
| 35 to 44 Years | 1,557 (92.1%) | 1,056 (76.9%) |
| 45 to 54 Years | 928 (79.8%) | 1,108 (89.1%) |
| 55 to 64 Years | 1,597 (93.1%) | 1,142 (82.8%) |
| 65 to 74 Years | 881 (95.7%) | 1,073 (87.5%) |
| 75 Years and over | 400 (83.5%) | 649 (86.8%) |
| Total | 9,814 (84.7%) | 9,315 (80.5%) |
Income Below Poverty Among Married-Couple Families in Muscatine
The poverty statistics for married-couple families in Muscatine show that 7.1% or 291 of the total 4,073 families live below the poverty line. Families with 3 or 4 children have the highest poverty rate of 33.3%, comprising of 142 families. On the other hand, families with 5 or more children have the lowest poverty rate of 0.0%, which includes 0 families.
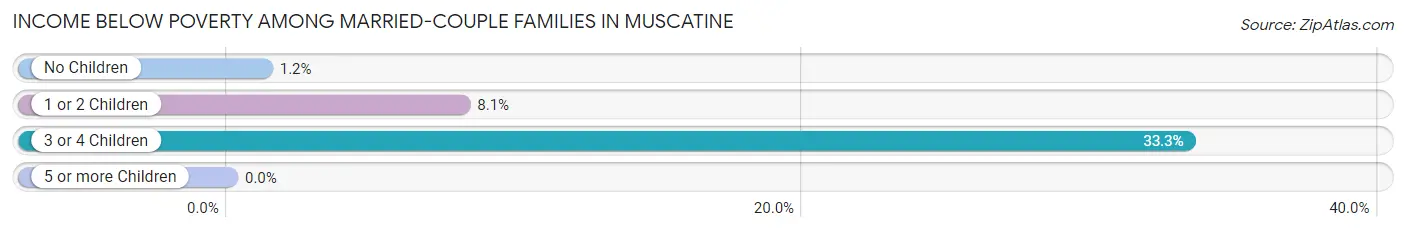
| Children | Above Poverty | Below Poverty |
| No Children | 2,036 (98.8%) | 25 (1.2%) |
| 1 or 2 Children | 1,408 (91.9%) | 124 (8.1%) |
| 3 or 4 Children | 284 (66.7%) | 142 (33.3%) |
| 5 or more Children | 54 (100.0%) | 0 (0.0%) |
| Total | 3,782 (92.9%) | 291 (7.1%) |
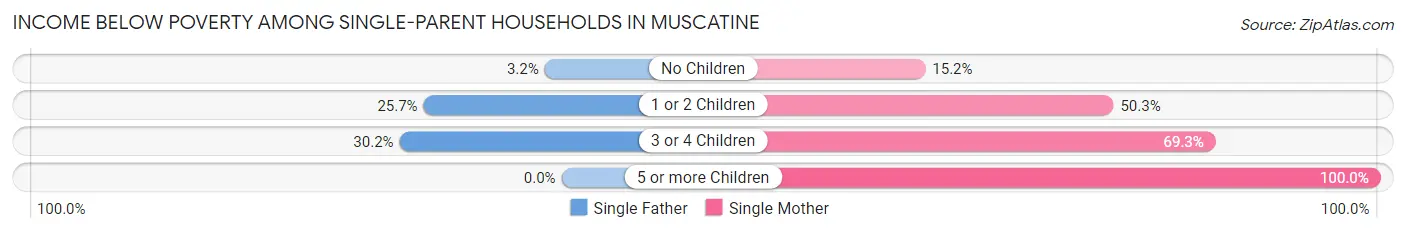
Income Below Poverty Among Single-Parent Households in Muscatine
According to the poverty data in Muscatine, 21.6% or 164 single-father households and 39.6% or 536 single-mother households are living below the poverty line. Among single-father households, those with 3 or 4 children have the highest poverty rate, with 32 households (30.2%) experiencing poverty. Likewise, among single-mother households, those with 5 or more children have the highest poverty rate, with 39 households (100.0%) falling below the poverty line.
| Children | Single Father | Single Mother |
| No Children | 5 (3.2%) | 86 (15.2%) |
| 1 or 2 Children | 127 (25.7%) | 287 (50.3%) |
| 3 or 4 Children | 32 (30.2%) | 124 (69.3%) |
| 5 or more Children | 0 (0.0%) | 39 (100.0%) |
| Total | 164 (21.6%) | 536 (39.6%) |
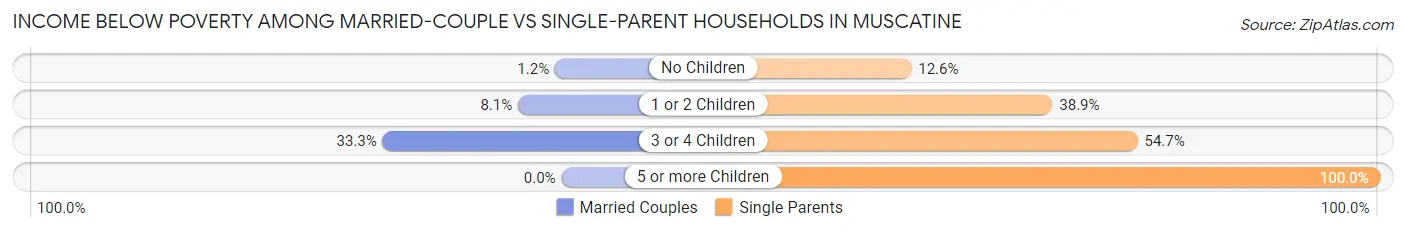
Income Below Poverty Among Married-Couple vs Single-Parent Households in Muscatine
The poverty data for Muscatine shows that 291 of the married-couple family households (7.1%) and 700 of the single-parent households (33.1%) are living below the poverty level. Within the married-couple family households, those with 3 or 4 children have the highest poverty rate, with 142 households (33.3%) falling below the poverty line. Among the single-parent households, those with 5 or more children have the highest poverty rate, with 39 household (100.0%) living below poverty.
| Children | Married-Couple Families | Single-Parent Households |
| No Children | 25 (1.2%) | 91 (12.6%) |
| 1 or 2 Children | 124 (8.1%) | 414 (38.9%) |
| 3 or 4 Children | 142 (33.3%) | 156 (54.7%) |
| 5 or more Children | 0 (0.0%) | 39 (100.0%) |
| Total | 291 (7.1%) | 700 (33.1%) |
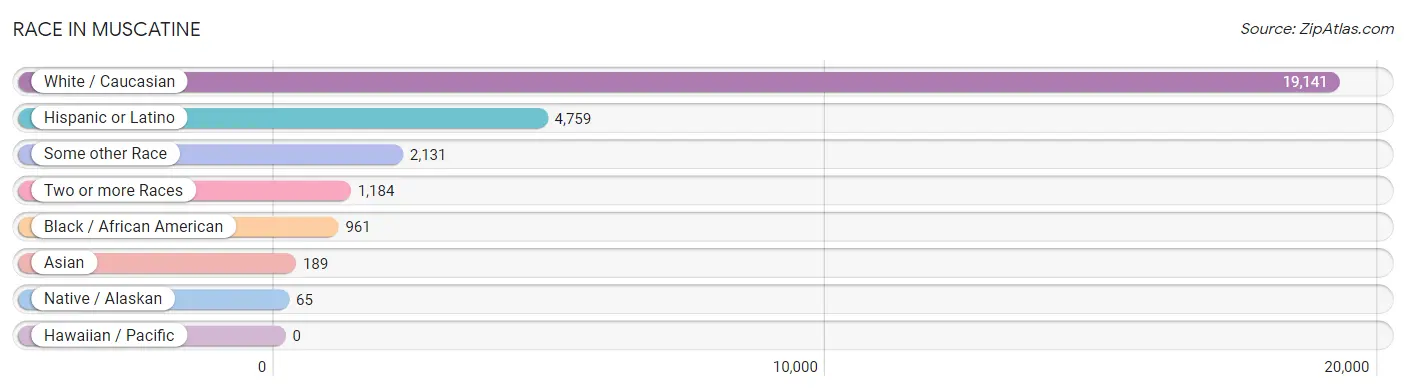
Race in Muscatine
The most populous races in Muscatine are White / Caucasian (19,141 | 80.9%), Hispanic or Latino (4,759 | 20.1%), and Some other Race (2,131 | 9.0%).
| Race | # Population | % Population |
| Asian | 189 | 0.8% |
| Black / African American | 961 | 4.1% |
| Hawaiian / Pacific | 0 | 0.0% |
| Hispanic or Latino | 4,759 | 20.1% |
| Native / Alaskan | 65 | 0.3% |
| White / Caucasian | 19,141 | 80.9% |
| Two or more Races | 1,184 | 5.0% |
| Some other Race | 2,131 | 9.0% |
| Total | 23,671 | 100.0% |
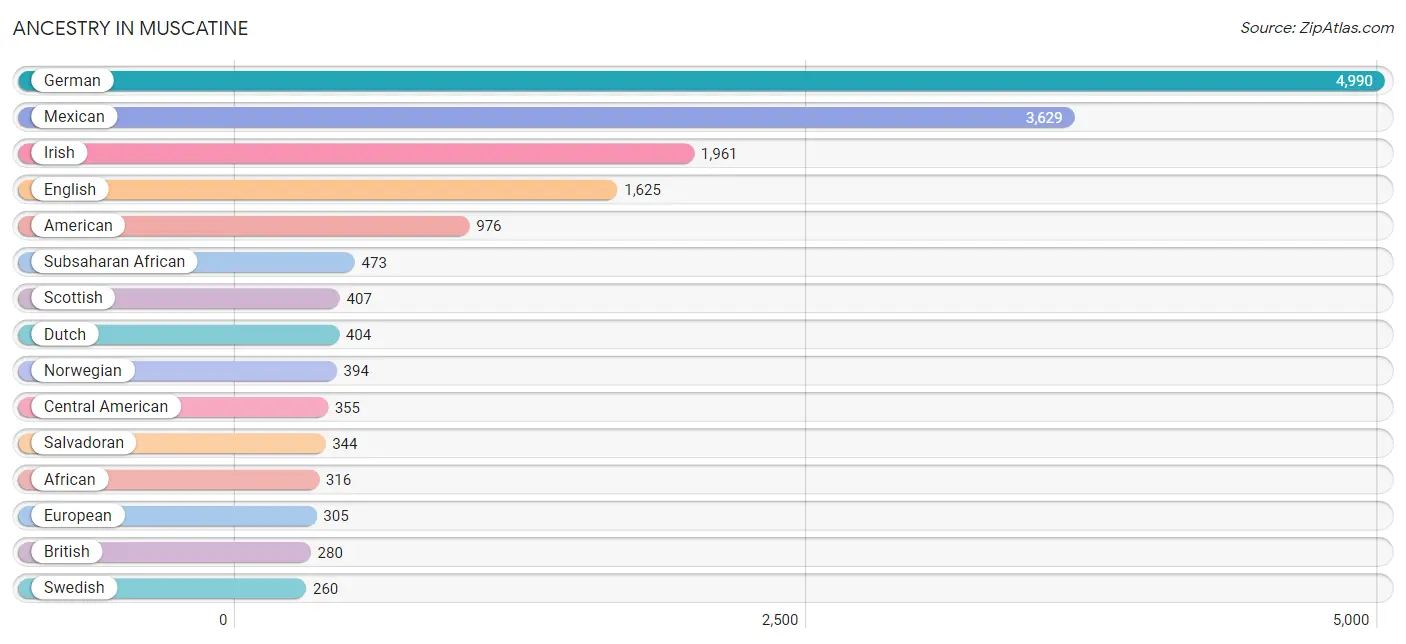
Ancestry in Muscatine
The most populous ancestries reported in Muscatine are German (4,990 | 21.1%), Mexican (3,629 | 15.3%), Irish (1,961 | 8.3%), English (1,625 | 6.9%), and American (976 | 4.1%), together accounting for 55.7% of all Muscatine residents.
| Ancestry | # Population | % Population |
| African | 316 | 1.3% |
| American | 976 | 4.1% |
| Arab | 27 | 0.1% |
| Australian | 59 | 0.3% |
| Austrian | 31 | 0.1% |
| Belgian | 77 | 0.3% |
| Blackfeet | 70 | 0.3% |
| Brazilian | 37 | 0.2% |
| British | 280 | 1.2% |
| Central American | 355 | 1.5% |
| Cherokee | 14 | 0.1% |
| Chippewa | 6 | 0.0% |
| Colombian | 52 | 0.2% |
| Croatian | 42 | 0.2% |
| Cuban | 31 | 0.1% |
| Czech | 73 | 0.3% |
| Czechoslovakian | 14 | 0.1% |
| Danish | 134 | 0.6% |
| Dutch | 404 | 1.7% |
| Eastern European | 44 | 0.2% |
| Egyptian | 27 | 0.1% |
| English | 1,625 | 6.9% |
| European | 305 | 1.3% |
| Filipino | 18 | 0.1% |
| Finnish | 47 | 0.2% |
| French | 204 | 0.9% |
| French American Indian | 14 | 0.1% |
| French Canadian | 76 | 0.3% |
| German | 4,990 | 21.1% |
| Greek | 68 | 0.3% |
| Guatemalan | 5 | 0.0% |
| Honduran | 6 | 0.0% |
| Hungarian | 47 | 0.2% |
| Indian (Asian) | 29 | 0.1% |
| Inupiat | 7 | 0.0% |
| Irish | 1,961 | 8.3% |
| Italian | 213 | 0.9% |
| Korean | 121 | 0.5% |
| Liberian | 192 | 0.8% |
| Lithuanian | 14 | 0.1% |
| Luxembourger | 14 | 0.1% |
| Mexican | 3,629 | 15.3% |
| Mexican American Indian | 32 | 0.1% |
| Navajo | 9 | 0.0% |
| Northern European | 26 | 0.1% |
| Norwegian | 394 | 1.7% |
| Pennsylvania German | 24 | 0.1% |
| Polish | 172 | 0.7% |
| Portuguese | 25 | 0.1% |
| Puerto Rican | 147 | 0.6% |
| Romanian | 19 | 0.1% |
| Salvadoran | 344 | 1.5% |
| Scandinavian | 71 | 0.3% |
| Scotch-Irish | 159 | 0.7% |
| Scottish | 407 | 1.7% |
| Sioux | 82 | 0.4% |
| South American | 52 | 0.2% |
| Spaniard | 18 | 0.1% |
| Sri Lankan | 68 | 0.3% |
| Subsaharan African | 473 | 2.0% |
| Swedish | 260 | 1.1% |
| Swiss | 27 | 0.1% |
| Thai | 172 | 0.7% |
| Ukrainian | 17 | 0.1% |
| Welsh | 73 | 0.3% | View All 65 Rows |
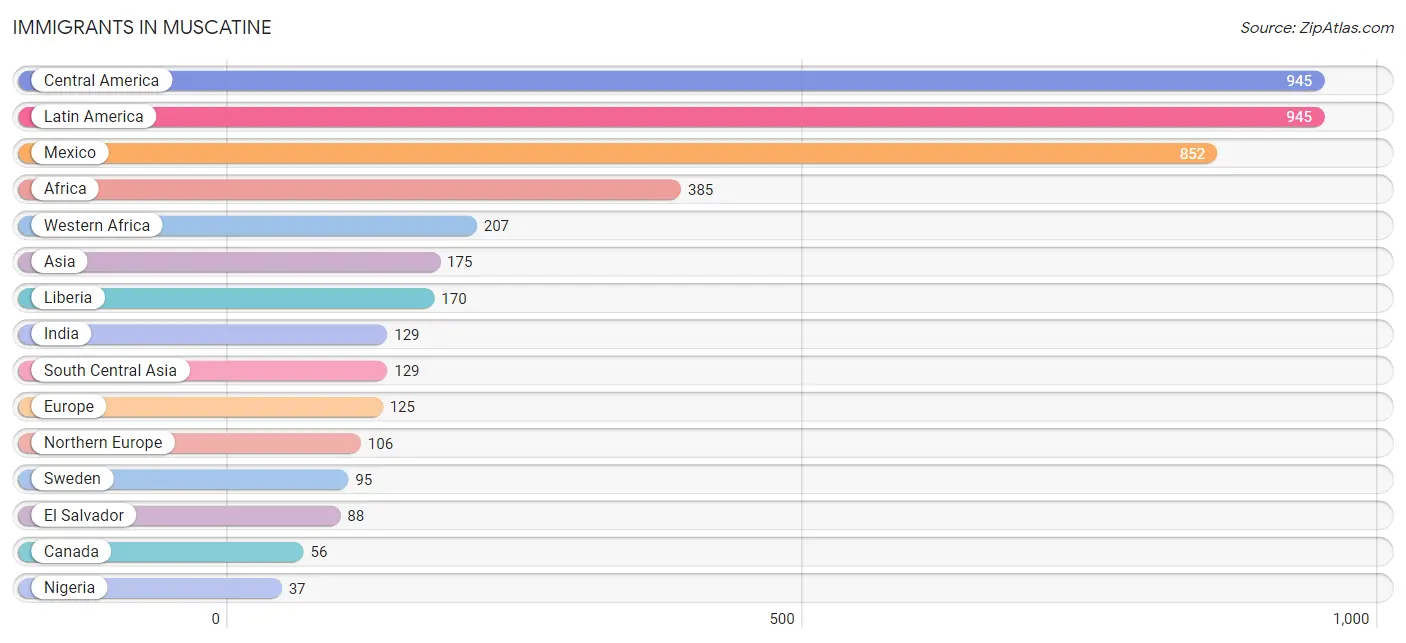
Immigrants in Muscatine
The most numerous immigrant groups reported in Muscatine came from Central America (945 | 4.0%), Latin America (945 | 4.0%), Mexico (852 | 3.6%), Africa (385 | 1.6%), and Western Africa (207 | 0.9%), together accounting for 14.1% of all Muscatine residents.
| Immigration Origin | # Population | % Population |
| Africa | 385 | 1.6% |
| Asia | 175 | 0.7% |
| Canada | 56 | 0.2% |
| Central America | 945 | 4.0% |
| China | 11 | 0.1% |
| Eastern Asia | 11 | 0.1% |
| Eastern Europe | 19 | 0.1% |
| Egypt | 27 | 0.1% |
| El Salvador | 88 | 0.4% |
| England | 11 | 0.1% |
| Europe | 125 | 0.5% |
| Guatemala | 5 | 0.0% |
| India | 129 | 0.5% |
| Latin America | 945 | 4.0% |
| Liberia | 170 | 0.7% |
| Mexico | 852 | 3.6% |
| Nigeria | 37 | 0.2% |
| Northern Africa | 27 | 0.1% |
| Northern Europe | 106 | 0.4% |
| Philippines | 17 | 0.1% |
| Romania | 19 | 0.1% |
| South Central Asia | 129 | 0.5% |
| South Eastern Asia | 35 | 0.2% |
| Sweden | 95 | 0.4% |
| Vietnam | 18 | 0.1% |
| Western Africa | 207 | 0.9% | View All 26 Rows |
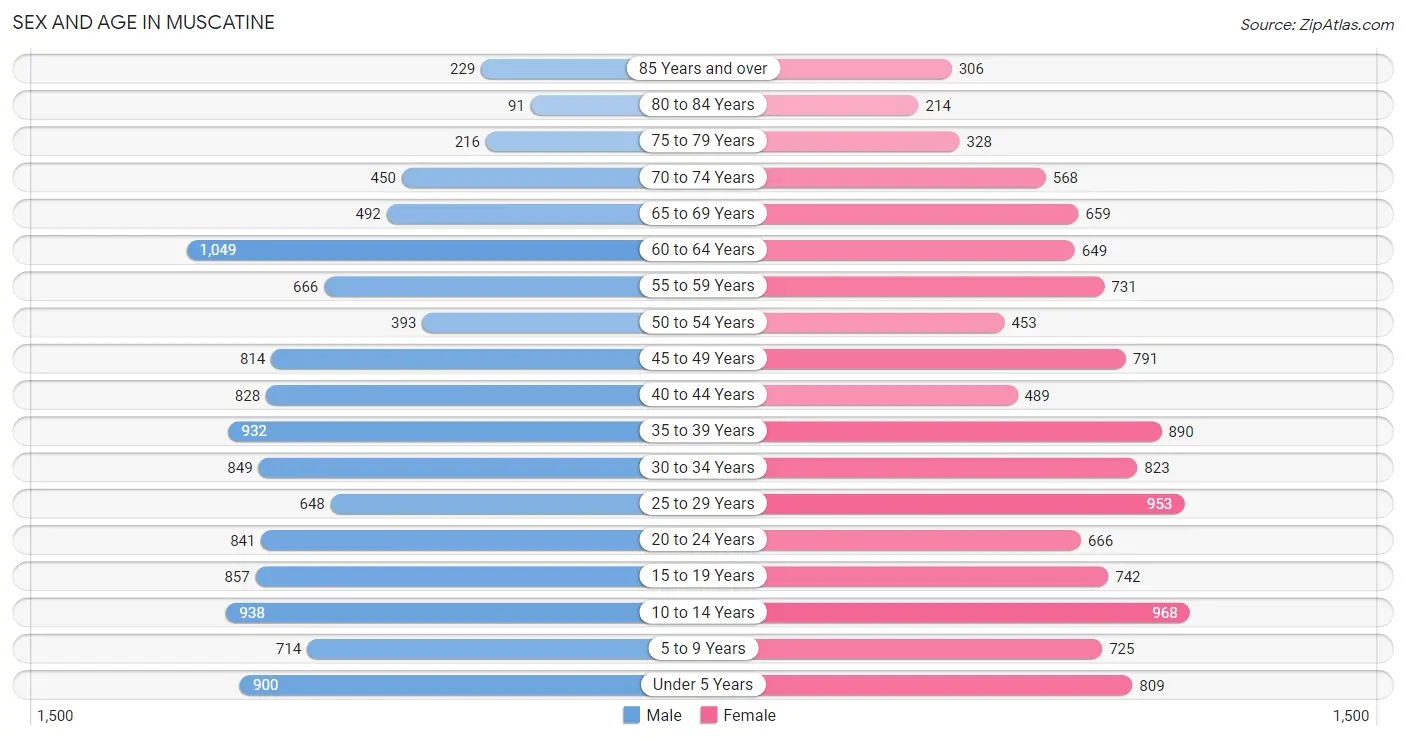
Sex and Age in Muscatine
Sex and Age in Muscatine
The most populous age groups in Muscatine are 60 to 64 Years (1,049 | 8.8%) for men and 10 to 14 Years (968 | 8.2%) for women.
| Age Bracket | Male | Female |
| Under 5 Years | 900 (7.6%) | 809 (6.9%) |
| 5 to 9 Years | 714 (6.0%) | 725 (6.2%) |
| 10 to 14 Years | 938 (7.9%) | 968 (8.2%) |
| 15 to 19 Years | 857 (7.2%) | 742 (6.3%) |
| 20 to 24 Years | 841 (7.1%) | 666 (5.7%) |
| 25 to 29 Years | 648 (5.4%) | 953 (8.1%) |
| 30 to 34 Years | 849 (7.1%) | 823 (7.0%) |
| 35 to 39 Years | 932 (7.8%) | 890 (7.6%) |
| 40 to 44 Years | 828 (7.0%) | 489 (4.2%) |
| 45 to 49 Years | 814 (6.8%) | 791 (6.7%) |
| 50 to 54 Years | 393 (3.3%) | 453 (3.8%) |
| 55 to 59 Years | 666 (5.6%) | 731 (6.2%) |
| 60 to 64 Years | 1,049 (8.8%) | 649 (5.5%) |
| 65 to 69 Years | 492 (4.1%) | 659 (5.6%) |
| 70 to 74 Years | 450 (3.8%) | 568 (4.8%) |
| 75 to 79 Years | 216 (1.8%) | 328 (2.8%) |
| 80 to 84 Years | 91 (0.8%) | 214 (1.8%) |
| 85 Years and over | 229 (1.9%) | 306 (2.6%) |
| Total | 11,907 (100.0%) | 11,764 (100.0%) |
Families and Households in Muscatine
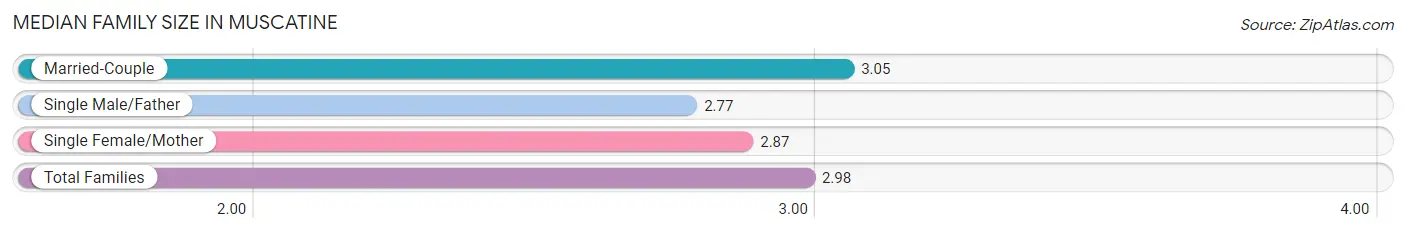
Median Family Size in Muscatine
The median family size in Muscatine is 2.98 persons per family, with married-couple families (4,073 | 65.8%) accounting for the largest median family size of 3.05 persons per family. On the other hand, single male/father families (758 | 12.3%) represent the smallest median family size with 2.77 persons per family.
| Family Type | # Families | Family Size |
| Married-Couple | 4,073 (65.8%) | 3.05 |
| Single Male/Father | 758 (12.3%) | 2.77 |
| Single Female/Mother | 1,354 (21.9%) | 2.87 |
| Total Families | 6,185 (100.0%) | 2.98 |
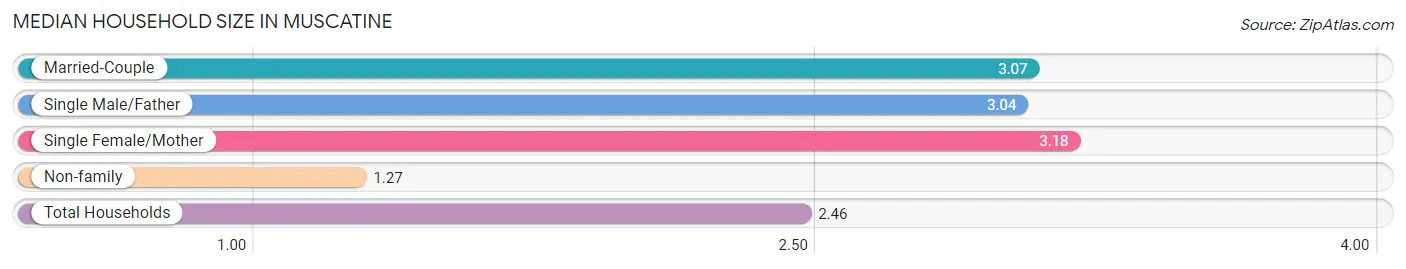
Median Household Size in Muscatine
The median household size in Muscatine is 2.46 persons per household, with single female/mother households (1,354 | 14.4%) accounting for the largest median household size of 3.18 persons per household. non-family households (3,230 | 34.3%) represent the smallest median household size with 1.27 persons per household.
| Household Type | # Households | Household Size |
| Married-Couple | 4,073 (43.3%) | 3.07 |
| Single Male/Father | 758 (8.1%) | 3.04 |
| Single Female/Mother | 1,354 (14.4%) | 3.18 |
| Non-family | 3,230 (34.3%) | 1.27 |
| Total Households | 9,415 (100.0%) | 2.46 |
Household Size by Marriage Status in Muscatine
Out of a total of 9,415 households in Muscatine, 6,185 (65.7%) are family households, while 3,230 (34.3%) are nonfamily households. The most numerous type of family households are 2-person households, comprising 2,543, and the most common type of nonfamily households are 1-person households, comprising 2,578.
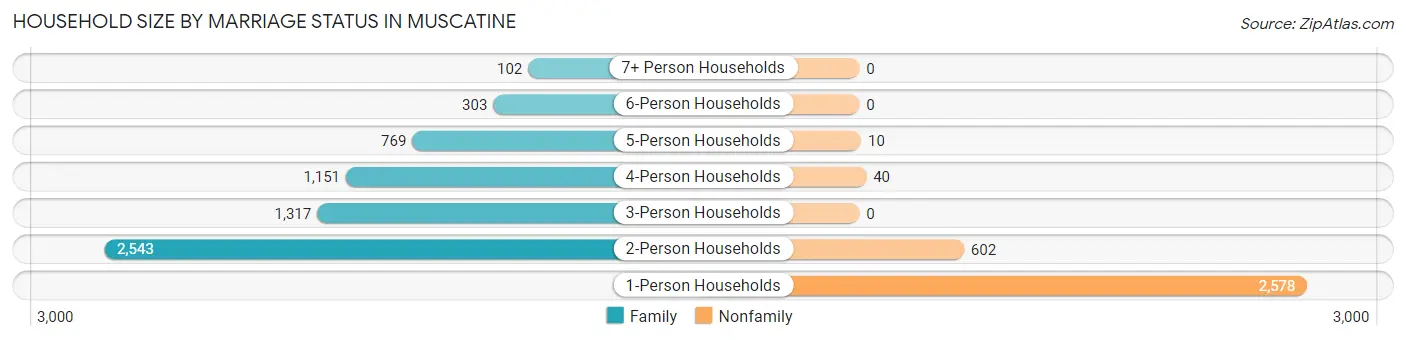
| Household Size | Family Households | Nonfamily Households |
| 1-Person Households | - | 2,578 (27.4%) |
| 2-Person Households | 2,543 (27.0%) | 602 (6.4%) |
| 3-Person Households | 1,317 (14.0%) | 0 (0.0%) |
| 4-Person Households | 1,151 (12.2%) | 40 (0.4%) |
| 5-Person Households | 769 (8.2%) | 10 (0.1%) |
| 6-Person Households | 303 (3.2%) | 0 (0.0%) |
| 7+ Person Households | 102 (1.1%) | 0 (0.0%) |
| Total | 6,185 (65.7%) | 3,230 (34.3%) |
Female Fertility in Muscatine
Fertility by Age in Muscatine
Average fertility rate in Muscatine is 50.0 births per 1,000 women. Women in the age bracket of 20 to 34 years have the highest fertility rate with 101.0 births per 1,000 women. Women in the age bracket of 20 to 34 years acount for 89.4% of all women with births.
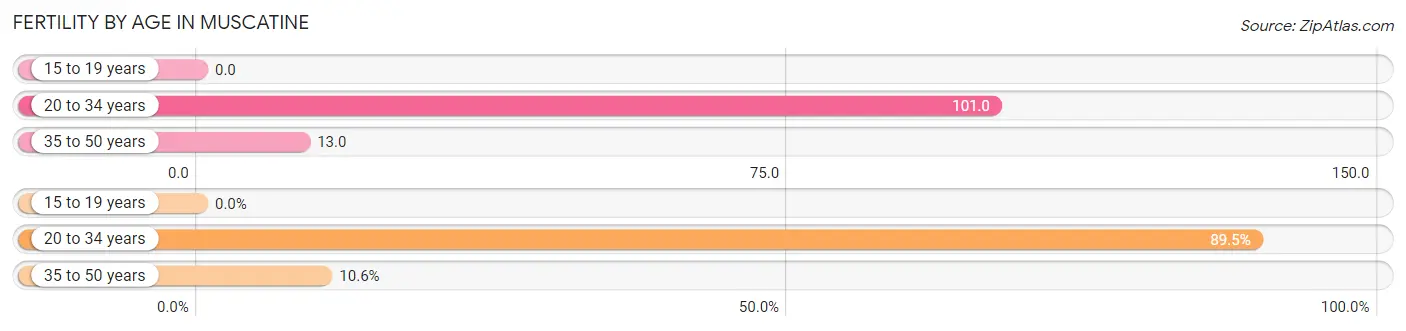
| Age Bracket | Women with Births | Births / 1,000 Women |
| 15 to 19 years | 0 (0.0%) | 0.0 |
| 20 to 34 years | 246 (89.4%) | 101.0 |
| 35 to 50 years | 29 (10.5%) | 13.0 |
| Total | 275 (100.0%) | 50.0 |
Fertility by Age by Marriage Status in Muscatine
68.0% of women with births (275) in Muscatine are married. The highest percentage of unmarried women with births falls into 20 to 34 years age bracket with 35.8% of them unmarried at the time of birth, while the lowest percentage of unmarried women with births belong to 35 to 50 years age bracket with 0.0% of them unmarried.
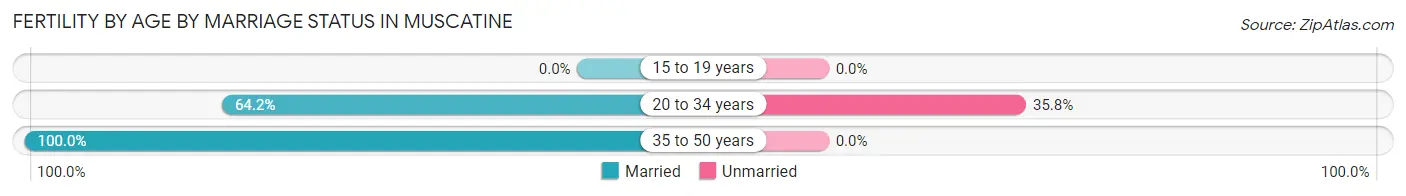
| Age Bracket | Married | Unmarried |
| 15 to 19 years | 0 (0.0%) | 0 (0.0%) |
| 20 to 34 years | 158 (64.2%) | 88 (35.8%) |
| 35 to 50 years | 29 (100.0%) | 0 (0.0%) |
| Total | 187 (68.0%) | 88 (32.0%) |
Fertility by Education in Muscatine
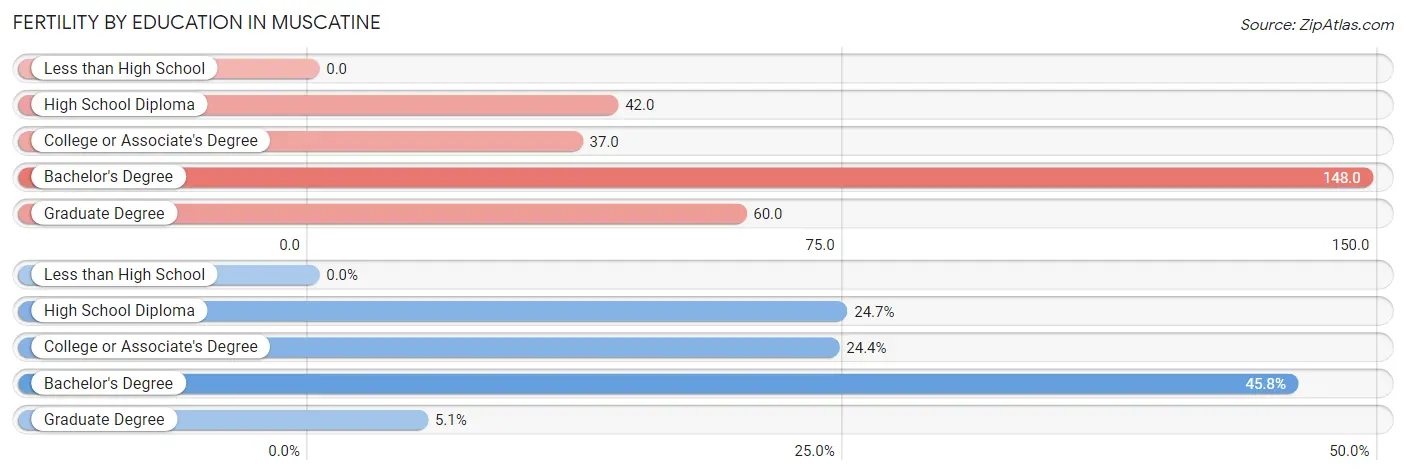
| Educational Attainment | Women with Births | Births / 1,000 Women |
| Less than High School | 0 (0.0%) | 0.0 |
| High School Diploma | 68 (24.7%) | 42.0 |
| College or Associate's Degree | 67 (24.4%) | 37.0 |
| Bachelor's Degree | 126 (45.8%) | 148.0 |
| Graduate Degree | 14 (5.1%) | 60.0 |
| Total | 275 (100.0%) | 50.0 |
Fertility by Education by Marriage Status in Muscatine
32.0% of women with births in Muscatine are unmarried. Women with the educational attainment of graduate degree are most likely to be married with 100.0% of them married at childbirth, while women with the educational attainment of high school diploma are least likely to be married with 73.5% of them unmarried at childbirth.
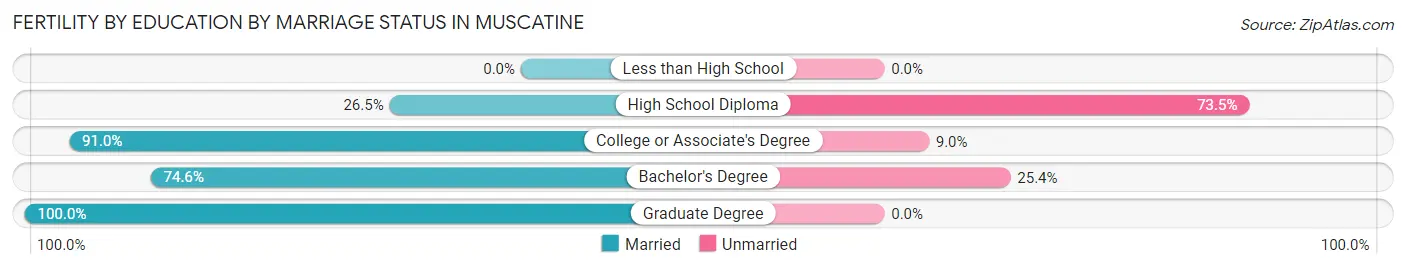
| Educational Attainment | Married | Unmarried |
| Less than High School | 0 (0.0%) | 0 (0.0%) |
| High School Diploma | 18 (26.5%) | 50 (73.5%) |
| College or Associate's Degree | 61 (91.0%) | 6 (9.0%) |
| Bachelor's Degree | 94 (74.6%) | 32 (25.4%) |
| Graduate Degree | 14 (100.0%) | 0 (0.0%) |
| Total | 187 (68.0%) | 88 (32.0%) |
Employment Characteristics in Muscatine
Employment by Class of Employer in Muscatine
Among the 11,300 employed individuals in Muscatine, private company employees (8,345 | 73.9%), local government employees (768 | 6.8%), and not-for-profit organizations (766 | 6.8%) make up the most common classes of employment.
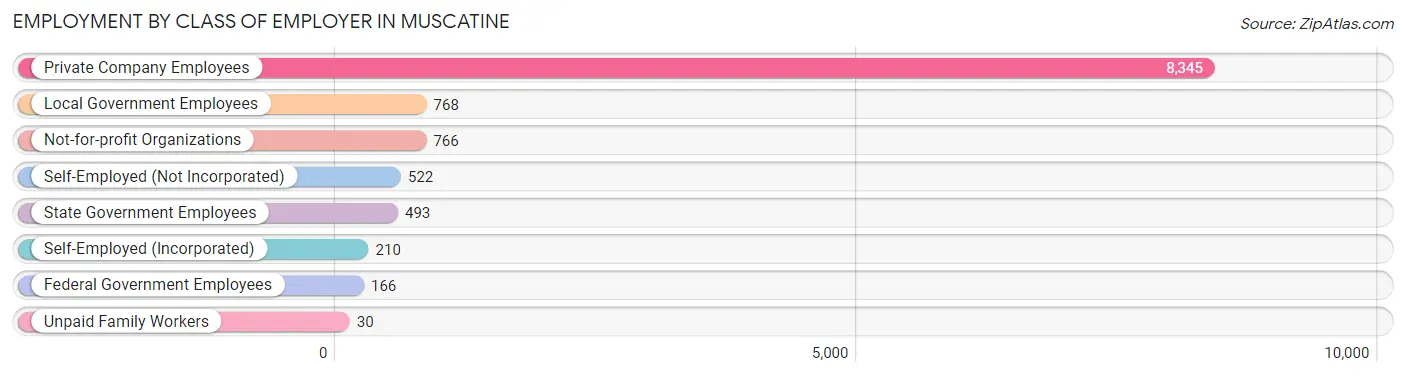
| Employer Class | # Employees | % Employees |
| Private Company Employees | 8,345 | 73.9% |
| Self-Employed (Incorporated) | 210 | 1.9% |
| Self-Employed (Not Incorporated) | 522 | 4.6% |
| Not-for-profit Organizations | 766 | 6.8% |
| Local Government Employees | 768 | 6.8% |
| State Government Employees | 493 | 4.4% |
| Federal Government Employees | 166 | 1.5% |
| Unpaid Family Workers | 30 | 0.3% |
| Total | 11,300 | 100.0% |
Employment Status by Age in Muscatine
According to the labor force statistics for Muscatine, out of the total population over 16 years of age (18,490), 64.9% or 12,000 individuals are in the labor force, with 4.3% or 516 of them unemployed. The age group with the highest labor force participation rate is 30 to 34 years, with 88.4% or 1,478 individuals in the labor force. Within the labor force, the 16 to 19 years age range has the highest percentage of unemployed individuals, with 13.0% or 87 of them being unemployed.
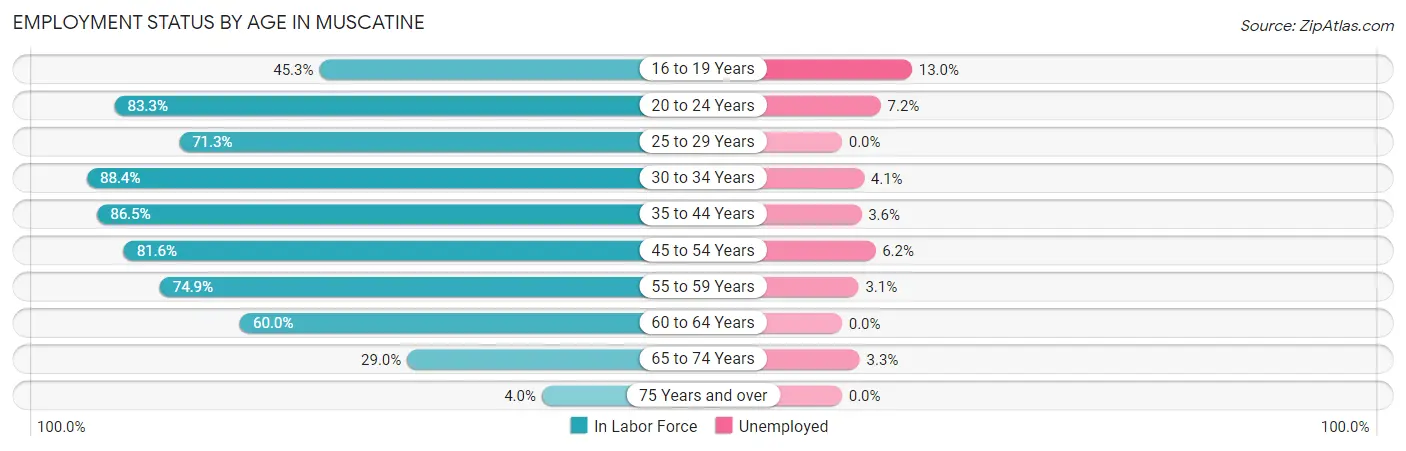
| Age Bracket | In Labor Force | Unemployed |
| 16 to 19 Years | 667 (45.3%) | 87 (13.0%) |
| 20 to 24 Years | 1,255 (83.3%) | 90 (7.2%) |
| 25 to 29 Years | 1,142 (71.3%) | 0 (0.0%) |
| 30 to 34 Years | 1,478 (88.4%) | 61 (4.1%) |
| 35 to 44 Years | 2,715 (86.5%) | 98 (3.6%) |
| 45 to 54 Years | 2,000 (81.6%) | 124 (6.2%) |
| 55 to 59 Years | 1,046 (74.9%) | 32 (3.1%) |
| 60 to 64 Years | 1,019 (60.0%) | 0 (0.0%) |
| 65 to 74 Years | 629 (29.0%) | 21 (3.3%) |
| 75 Years and over | 55 (4.0%) | 0 (0.0%) |
| Total | 12,000 (64.9%) | 516 (4.3%) |
Employment Status by Educational Attainment in Muscatine
According to labor force statistics for Muscatine, 78.6% of individuals (9,399) out of the total population between 25 and 64 years of age (11,958) are in the labor force, with 3.4% or 320 of them being unemployed. The group with the highest labor force participation rate are those with the educational attainment of bachelor's degree or higher, with 86.1% or 2,219 individuals in the labor force. Within the labor force, individuals with less than high school education have the highest percentage of unemployment, with 6.6% or 48 of them being unemployed.
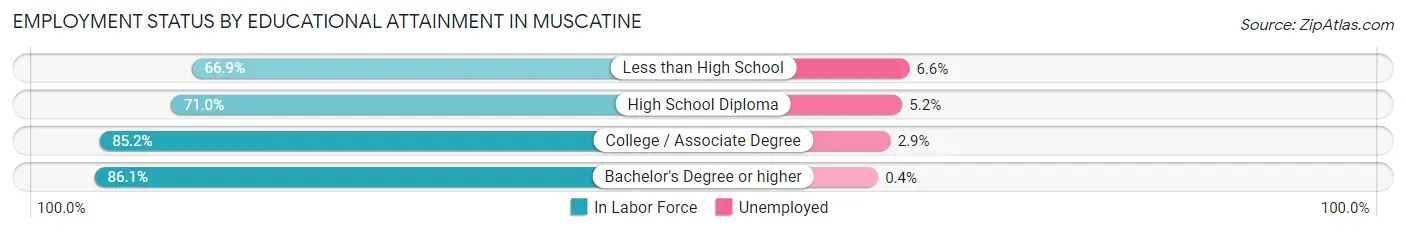
| Educational Attainment | In Labor Force | Unemployed |
| Less than High School | 729 (66.9%) | 72 (6.6%) |
| High School Diploma | 3,052 (71.0%) | 223 (5.2%) |
| College / Associate Degree | 3,403 (85.2%) | 116 (2.9%) |
| Bachelor's Degree or higher | 2,219 (86.1%) | 10 (0.4%) |
| Total | 9,399 (78.6%) | 407 (3.4%) |
Employment Occupations by Sex in Muscatine
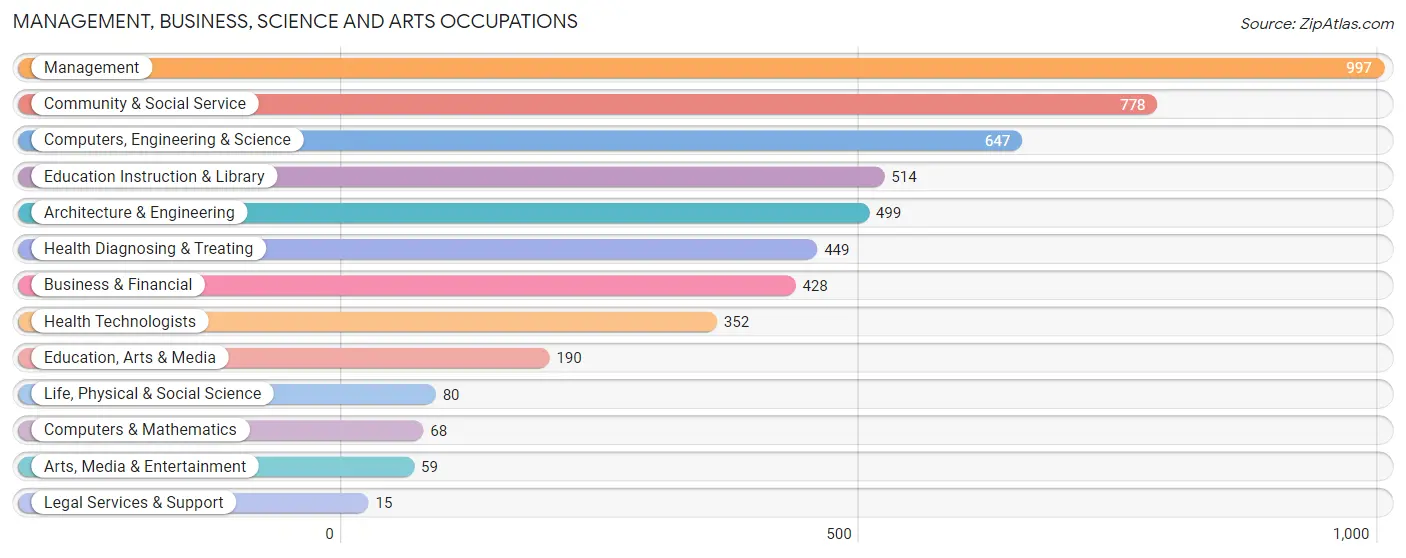
Management, Business, Science and Arts Occupations
The most common Management, Business, Science and Arts occupations in Muscatine are Management (997 | 8.7%), Community & Social Service (778 | 6.8%), Computers, Engineering & Science (647 | 5.7%), Education Instruction & Library (514 | 4.5%), and Architecture & Engineering (499 | 4.4%).
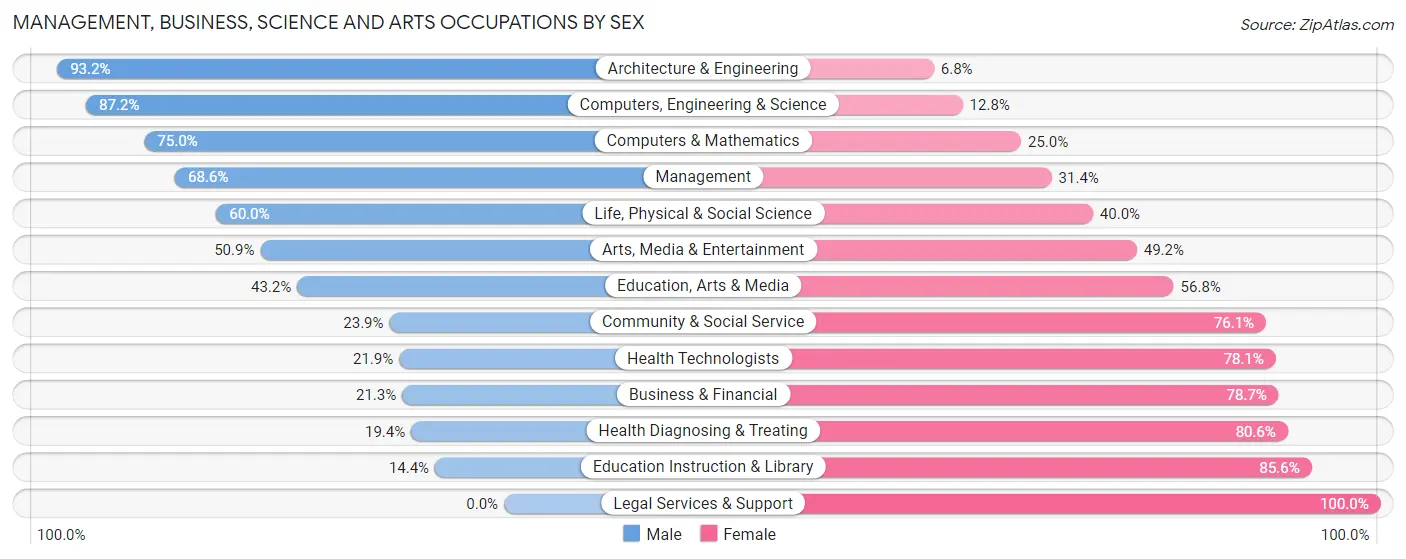
Management, Business, Science and Arts Occupations by Sex
Within the Management, Business, Science and Arts occupations in Muscatine, the most male-oriented occupations are Architecture & Engineering (93.2%), Computers, Engineering & Science (87.2%), and Computers & Mathematics (75.0%), while the most female-oriented occupations are Legal Services & Support (100.0%), Education Instruction & Library (85.6%), and Health Diagnosing & Treating (80.6%).
| Occupation | Male | Female |
| Management | 684 (68.6%) | 313 (31.4%) |
| Business & Financial | 91 (21.3%) | 337 (78.7%) |
| Computers, Engineering & Science | 564 (87.2%) | 83 (12.8%) |
| Computers & Mathematics | 51 (75.0%) | 17 (25.0%) |
| Architecture & Engineering | 465 (93.2%) | 34 (6.8%) |
| Life, Physical & Social Science | 48 (60.0%) | 32 (40.0%) |
| Community & Social Service | 186 (23.9%) | 592 (76.1%) |
| Education, Arts & Media | 82 (43.2%) | 108 (56.8%) |
| Legal Services & Support | 0 (0.0%) | 15 (100.0%) |
| Education Instruction & Library | 74 (14.4%) | 440 (85.6%) |
| Arts, Media & Entertainment | 30 (50.8%) | 29 (49.1%) |
| Health Diagnosing & Treating | 87 (19.4%) | 362 (80.6%) |
| Health Technologists | 77 (21.9%) | 275 (78.1%) |
| Total (Category) | 1,612 (48.9%) | 1,687 (51.1%) |
| Total (Overall) | 6,222 (54.5%) | 5,203 (45.5%) |
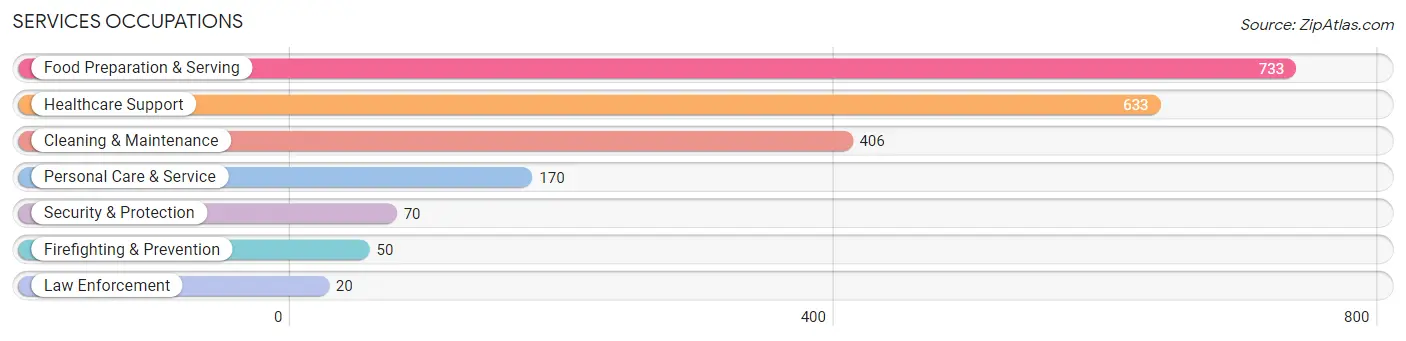
Services Occupations
The most common Services occupations in Muscatine are Food Preparation & Serving (733 | 6.4%), Healthcare Support (633 | 5.5%), Cleaning & Maintenance (406 | 3.5%), Personal Care & Service (170 | 1.5%), and Security & Protection (70 | 0.6%).
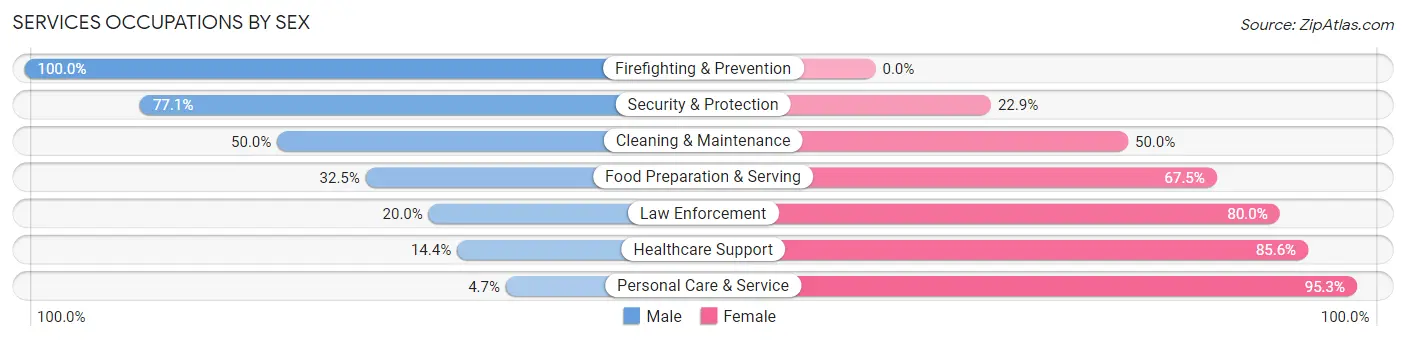
Services Occupations by Sex
Within the Services occupations in Muscatine, the most male-oriented occupations are Firefighting & Prevention (100.0%), Security & Protection (77.1%), and Cleaning & Maintenance (50.0%), while the most female-oriented occupations are Personal Care & Service (95.3%), Healthcare Support (85.6%), and Law Enforcement (80.0%).
| Occupation | Male | Female |
| Healthcare Support | 91 (14.4%) | 542 (85.6%) |
| Security & Protection | 54 (77.1%) | 16 (22.9%) |
| Firefighting & Prevention | 50 (100.0%) | 0 (0.0%) |
| Law Enforcement | 4 (20.0%) | 16 (80.0%) |
| Food Preparation & Serving | 238 (32.5%) | 495 (67.5%) |
| Cleaning & Maintenance | 203 (50.0%) | 203 (50.0%) |
| Personal Care & Service | 8 (4.7%) | 162 (95.3%) |
| Total (Category) | 594 (29.5%) | 1,418 (70.5%) |
| Total (Overall) | 6,222 (54.5%) | 5,203 (45.5%) |
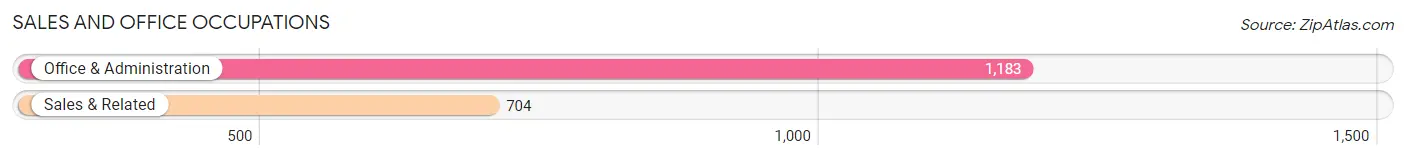
Sales and Office Occupations
The most common Sales and Office occupations in Muscatine are Office & Administration (1,183 | 10.3%), and Sales & Related (704 | 6.2%).
Sales and Office Occupations by Sex
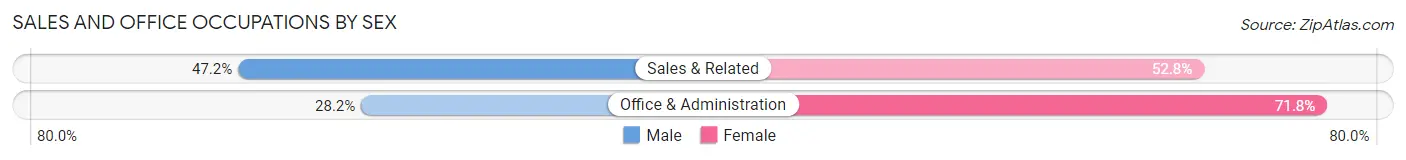
| Occupation | Male | Female |
| Sales & Related | 332 (47.2%) | 372 (52.8%) |
| Office & Administration | 334 (28.2%) | 849 (71.8%) |
| Total (Category) | 666 (35.3%) | 1,221 (64.7%) |
| Total (Overall) | 6,222 (54.5%) | 5,203 (45.5%) |
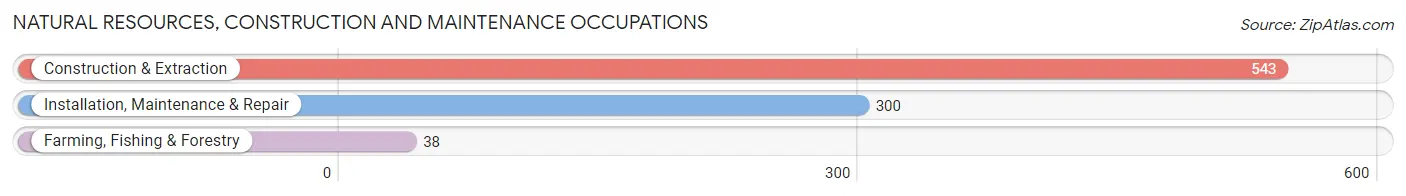
Natural Resources, Construction and Maintenance Occupations
The most common Natural Resources, Construction and Maintenance occupations in Muscatine are Construction & Extraction (543 | 4.8%), Installation, Maintenance & Repair (300 | 2.6%), and Farming, Fishing & Forestry (38 | 0.3%).
Natural Resources, Construction and Maintenance Occupations by Sex
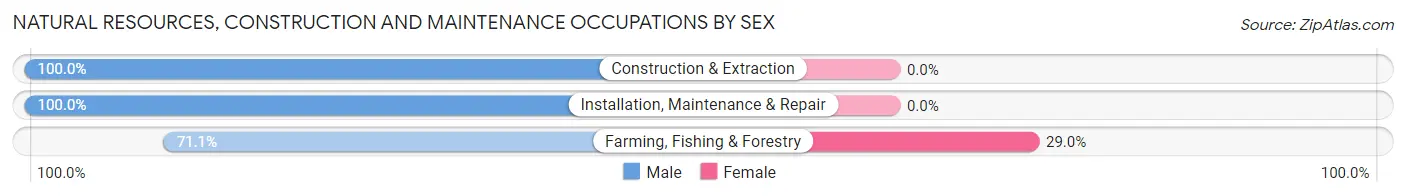
| Occupation | Male | Female |
| Farming, Fishing & Forestry | 27 (71.1%) | 11 (28.9%) |
| Construction & Extraction | 543 (100.0%) | 0 (0.0%) |
| Installation, Maintenance & Repair | 300 (100.0%) | 0 (0.0%) |
| Total (Category) | 870 (98.8%) | 11 (1.3%) |
| Total (Overall) | 6,222 (54.5%) | 5,203 (45.5%) |
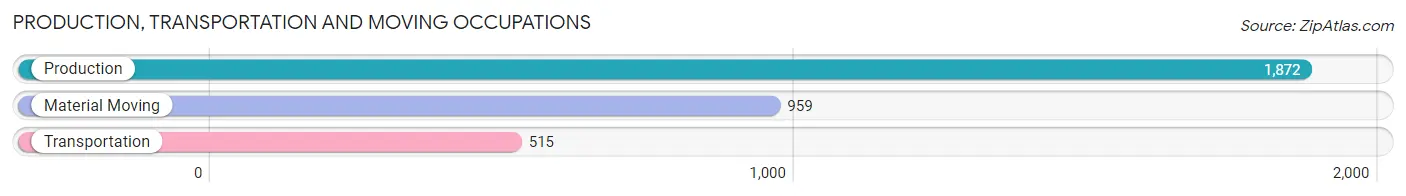
Production, Transportation and Moving Occupations
The most common Production, Transportation and Moving occupations in Muscatine are Production (1,872 | 16.4%), Material Moving (959 | 8.4%), and Transportation (515 | 4.5%).
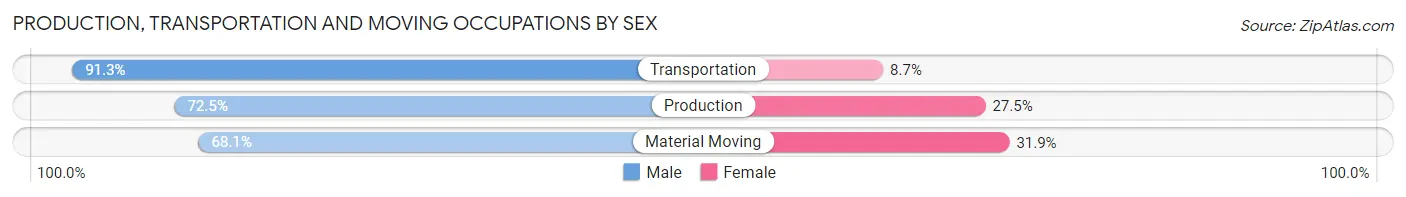
Production, Transportation and Moving Occupations by Sex
| Occupation | Male | Female |
| Production | 1,357 (72.5%) | 515 (27.5%) |
| Transportation | 470 (91.3%) | 45 (8.7%) |
| Material Moving | 653 (68.1%) | 306 (31.9%) |
| Total (Category) | 2,480 (74.1%) | 866 (25.9%) |
| Total (Overall) | 6,222 (54.5%) | 5,203 (45.5%) |
Employment Industries by Sex in Muscatine
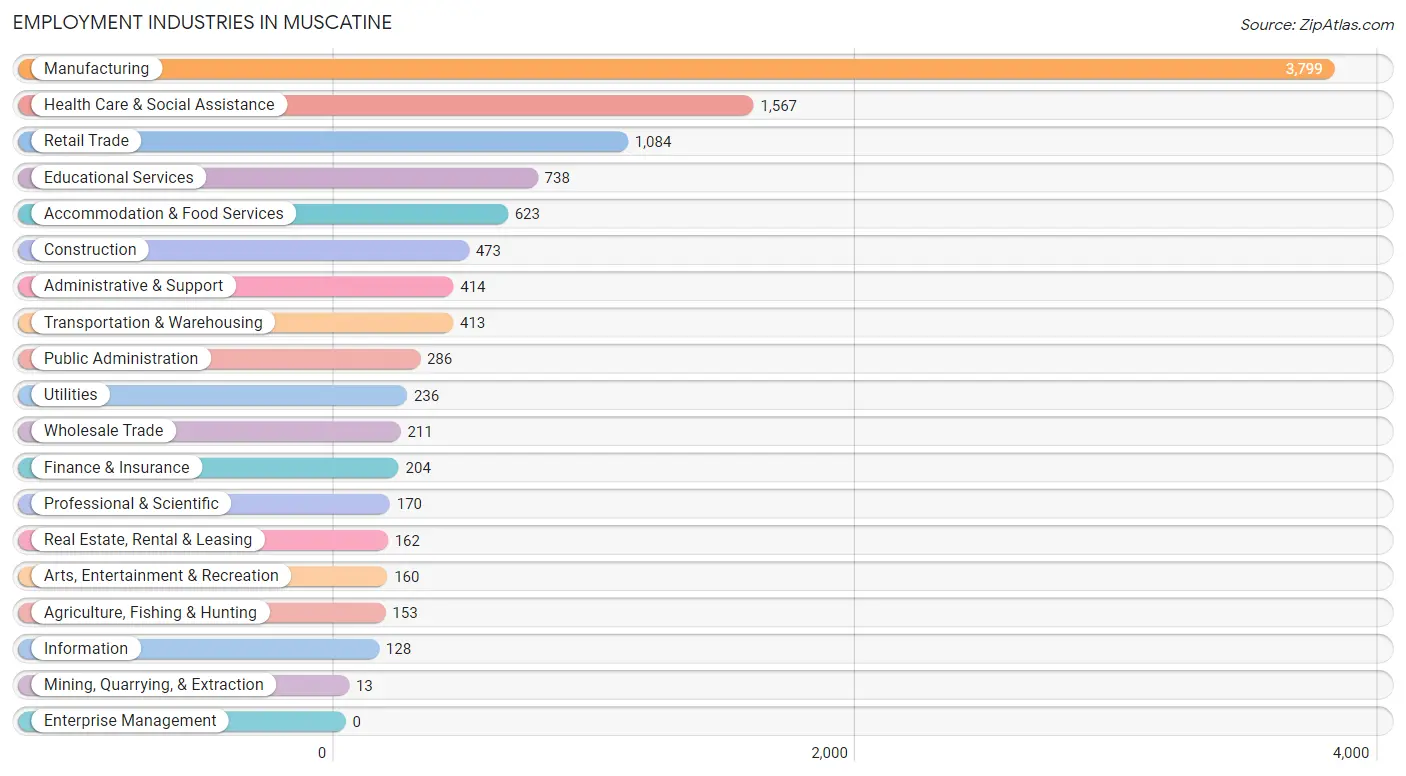
Employment Industries in Muscatine
The major employment industries in Muscatine include Manufacturing (3,799 | 33.3%), Health Care & Social Assistance (1,567 | 13.7%), Retail Trade (1,084 | 9.5%), Educational Services (738 | 6.5%), and Accommodation & Food Services (623 | 5.4%).
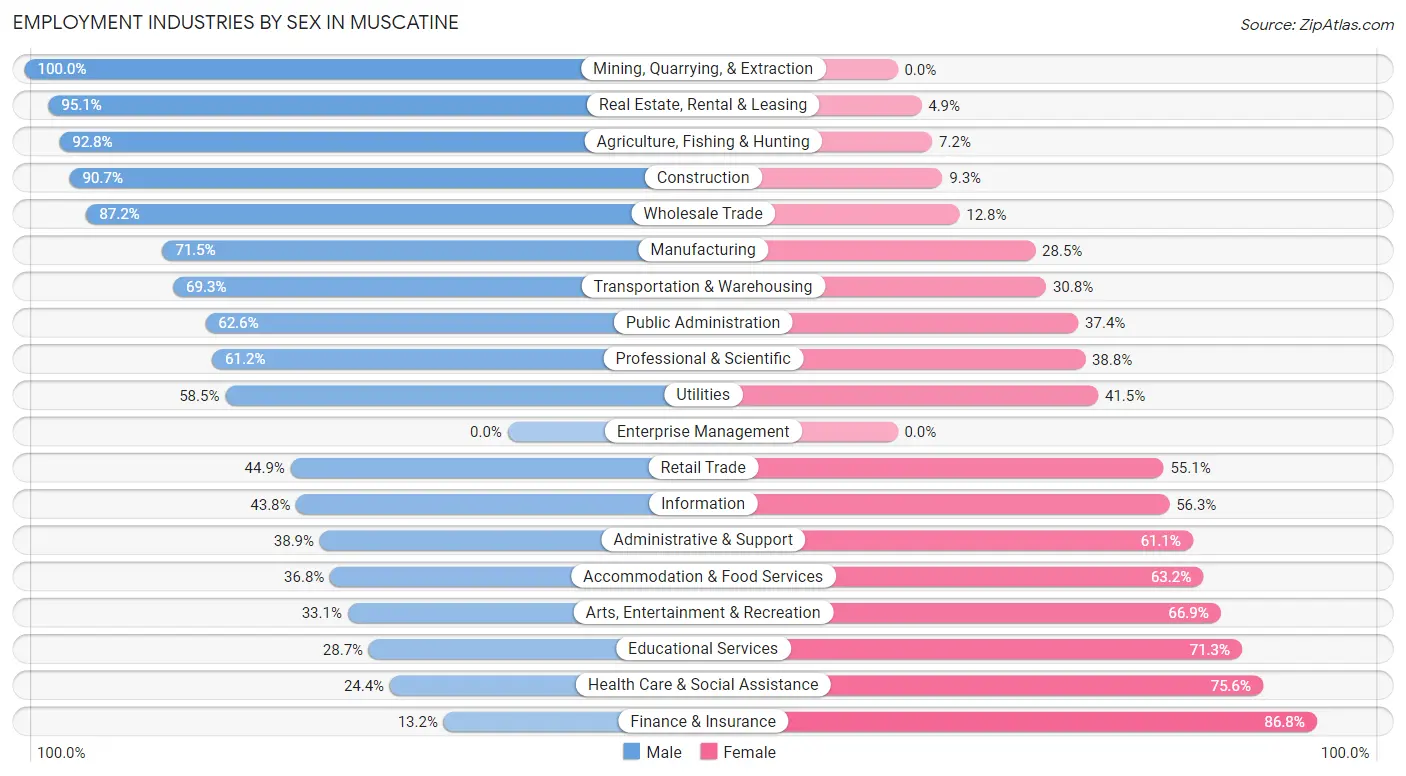
Employment Industries by Sex in Muscatine
The Muscatine industries that see more men than women are Mining, Quarrying, & Extraction (100.0%), Real Estate, Rental & Leasing (95.1%), and Agriculture, Fishing & Hunting (92.8%), whereas the industries that tend to have a higher number of women are Finance & Insurance (86.8%), Health Care & Social Assistance (75.6%), and Educational Services (71.3%).
| Industry | Male | Female |
| Agriculture, Fishing & Hunting | 142 (92.8%) | 11 (7.2%) |
| Mining, Quarrying, & Extraction | 13 (100.0%) | 0 (0.0%) |
| Construction | 429 (90.7%) | 44 (9.3%) |
| Manufacturing | 2,716 (71.5%) | 1,083 (28.5%) |
| Wholesale Trade | 184 (87.2%) | 27 (12.8%) |
| Retail Trade | 487 (44.9%) | 597 (55.1%) |
| Transportation & Warehousing | 286 (69.3%) | 127 (30.7%) |
| Utilities | 138 (58.5%) | 98 (41.5%) |
| Information | 56 (43.8%) | 72 (56.2%) |
| Finance & Insurance | 27 (13.2%) | 177 (86.8%) |
| Real Estate, Rental & Leasing | 154 (95.1%) | 8 (4.9%) |
| Professional & Scientific | 104 (61.2%) | 66 (38.8%) |
| Enterprise Management | 0 (0.0%) | 0 (0.0%) |
| Administrative & Support | 161 (38.9%) | 253 (61.1%) |
| Educational Services | 212 (28.7%) | 526 (71.3%) |
| Health Care & Social Assistance | 382 (24.4%) | 1,185 (75.6%) |
| Arts, Entertainment & Recreation | 53 (33.1%) | 107 (66.9%) |
| Accommodation & Food Services | 229 (36.8%) | 394 (63.2%) |
| Public Administration | 179 (62.6%) | 107 (37.4%) |
| Total | 6,222 (54.5%) | 5,203 (45.5%) |
Education in Muscatine
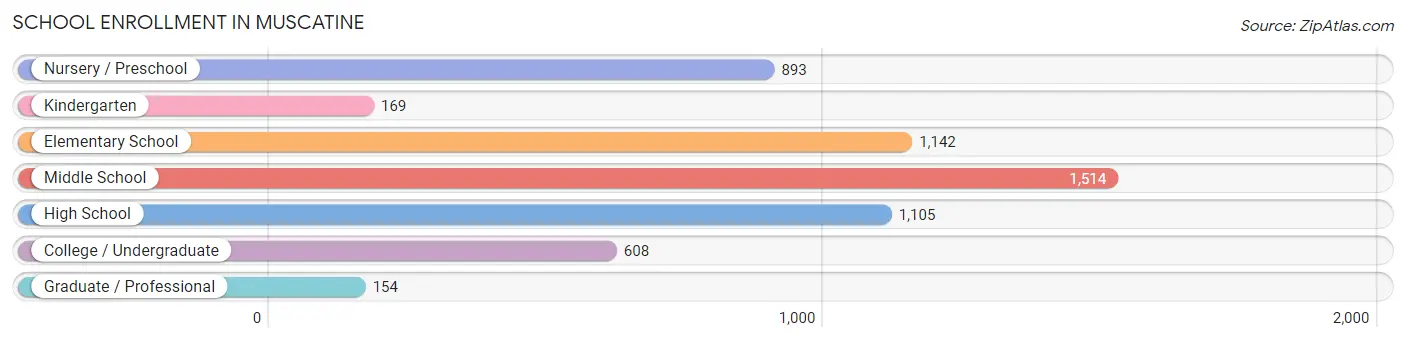
School Enrollment in Muscatine
The most common levels of schooling among the 5,585 students in Muscatine are middle school (1,514 | 27.1%), elementary school (1,142 | 20.4%), and high school (1,105 | 19.8%).
| School Level | # Students | % Students |
| Nursery / Preschool | 893 | 16.0% |
| Kindergarten | 169 | 3.0% |
| Elementary School | 1,142 | 20.4% |
| Middle School | 1,514 | 27.1% |
| High School | 1,105 | 19.8% |
| College / Undergraduate | 608 | 10.9% |
| Graduate / Professional | 154 | 2.8% |
| Total | 5,585 | 100.0% |
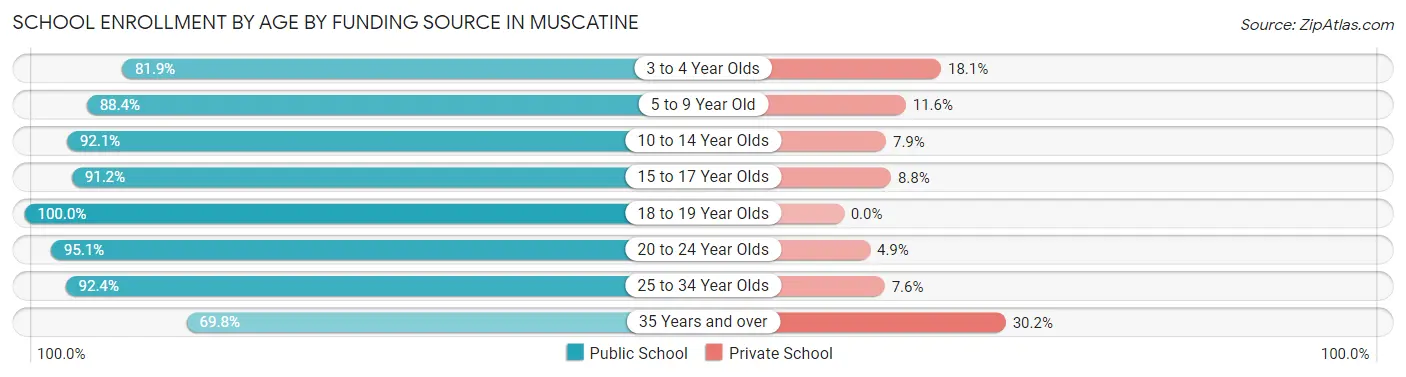
School Enrollment by Age by Funding Source in Muscatine
Out of a total of 5,585 students who are enrolled in schools in Muscatine, 564 (10.1%) attend a private institution, while the remaining 5,021 (89.9%) are enrolled in public schools. The age group of 35 years and over has the highest likelihood of being enrolled in private schools, with 48 (30.2% in the age bracket) enrolled. Conversely, the age group of 18 to 19 year olds has the lowest likelihood of being enrolled in a private school, with 319 (100.0% in the age bracket) attending a public institution.
| Age Bracket | Public School | Private School |
| 3 to 4 Year Olds | 510 (81.9%) | 113 (18.1%) |
| 5 to 9 Year Old | 1,246 (88.4%) | 163 (11.6%) |
| 10 to 14 Year Olds | 1,680 (92.1%) | 144 (7.9%) |
| 15 to 17 Year Olds | 756 (91.2%) | 73 (8.8%) |
| 18 to 19 Year Olds | 319 (100.0%) | 0 (0.0%) |
| 20 to 24 Year Olds | 252 (95.1%) | 13 (4.9%) |
| 25 to 34 Year Olds | 145 (92.4%) | 12 (7.6%) |
| 35 Years and over | 111 (69.8%) | 48 (30.2%) |
| Total | 5,021 (89.9%) | 564 (10.1%) |
Educational Attainment by Field of Study in Muscatine
Business (826 | 23.4%), education (497 | 14.1%), science & technology (408 | 11.6%), bio, nature & agricultural (318 | 9.0%), and engineering (252 | 7.1%) are the most common fields of study among 3,530 individuals in Muscatine who have obtained a bachelor's degree or higher.
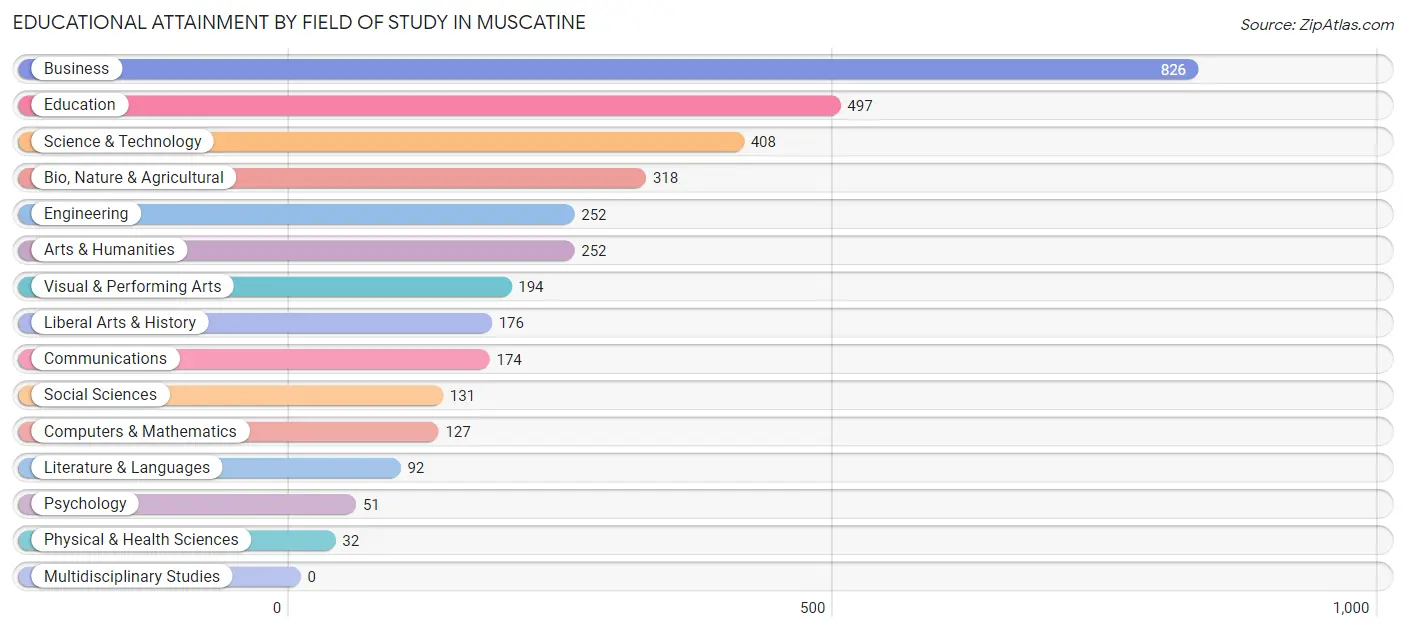
| Field of Study | # Graduates | % Graduates |
| Computers & Mathematics | 127 | 3.6% |
| Bio, Nature & Agricultural | 318 | 9.0% |
| Physical & Health Sciences | 32 | 0.9% |
| Psychology | 51 | 1.4% |
| Social Sciences | 131 | 3.7% |
| Engineering | 252 | 7.1% |
| Multidisciplinary Studies | 0 | 0.0% |
| Science & Technology | 408 | 11.6% |
| Business | 826 | 23.4% |
| Education | 497 | 14.1% |
| Literature & Languages | 92 | 2.6% |
| Liberal Arts & History | 176 | 5.0% |
| Visual & Performing Arts | 194 | 5.5% |
| Communications | 174 | 4.9% |
| Arts & Humanities | 252 | 7.1% |
| Total | 3,530 | 100.0% |
Transportation & Commute in Muscatine
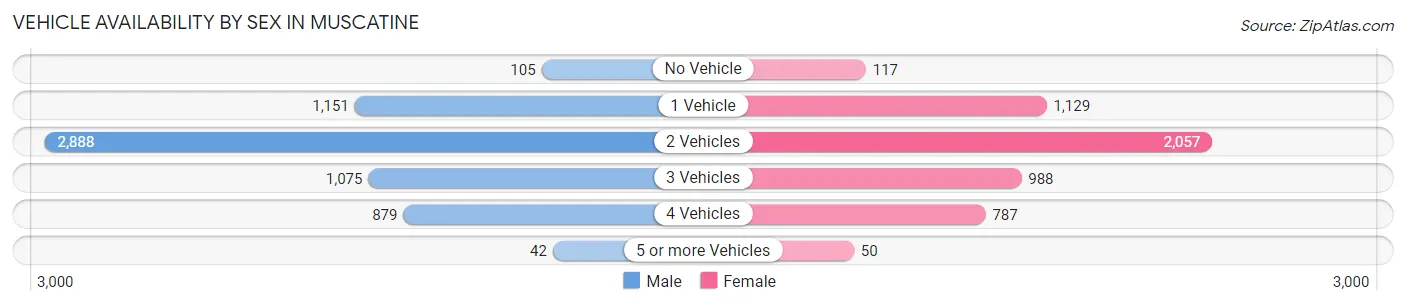
Vehicle Availability by Sex in Muscatine
The most prevalent vehicle ownership categories in Muscatine are males with 2 vehicles (2,888, accounting for 47.0%) and females with 2 vehicles (2,057, making up 56.3%).
| Vehicles Available | Male | Female |
| No Vehicle | 105 (1.7%) | 117 (2.3%) |
| 1 Vehicle | 1,151 (18.8%) | 1,129 (22.0%) |
| 2 Vehicles | 2,888 (47.0%) | 2,057 (40.1%) |
| 3 Vehicles | 1,075 (17.5%) | 988 (19.3%) |
| 4 Vehicles | 879 (14.3%) | 787 (15.3%) |
| 5 or more Vehicles | 42 (0.7%) | 50 (1.0%) |
| Total | 6,140 (100.0%) | 5,128 (100.0%) |
Commute Time in Muscatine
The most frequently occuring commute durations in Muscatine are 5 to 9 minutes (2,955 commuters, 27.4%), 10 to 14 minutes (2,809 commuters, 26.0%), and 15 to 19 minutes (1,582 commuters, 14.7%).
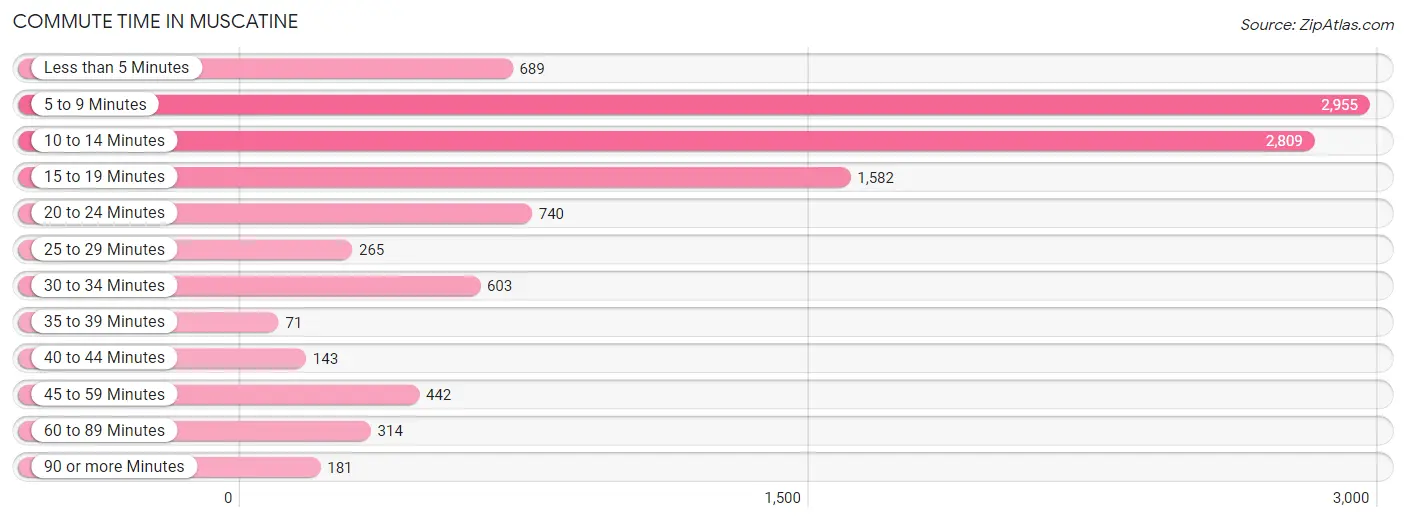
| Commute Time | # Commuters | % Commuters |
| Less than 5 Minutes | 689 | 6.4% |
| 5 to 9 Minutes | 2,955 | 27.4% |
| 10 to 14 Minutes | 2,809 | 26.0% |
| 15 to 19 Minutes | 1,582 | 14.7% |
| 20 to 24 Minutes | 740 | 6.9% |
| 25 to 29 Minutes | 265 | 2.5% |
| 30 to 34 Minutes | 603 | 5.6% |
| 35 to 39 Minutes | 71 | 0.7% |
| 40 to 44 Minutes | 143 | 1.3% |
| 45 to 59 Minutes | 442 | 4.1% |
| 60 to 89 Minutes | 314 | 2.9% |
| 90 or more Minutes | 181 | 1.7% |
Commute Time by Sex in Muscatine
The most common commute times in Muscatine are 10 to 14 minutes (1,650 commuters, 27.3%) for males and 5 to 9 minutes (1,516 commuters, 32.0%) for females.
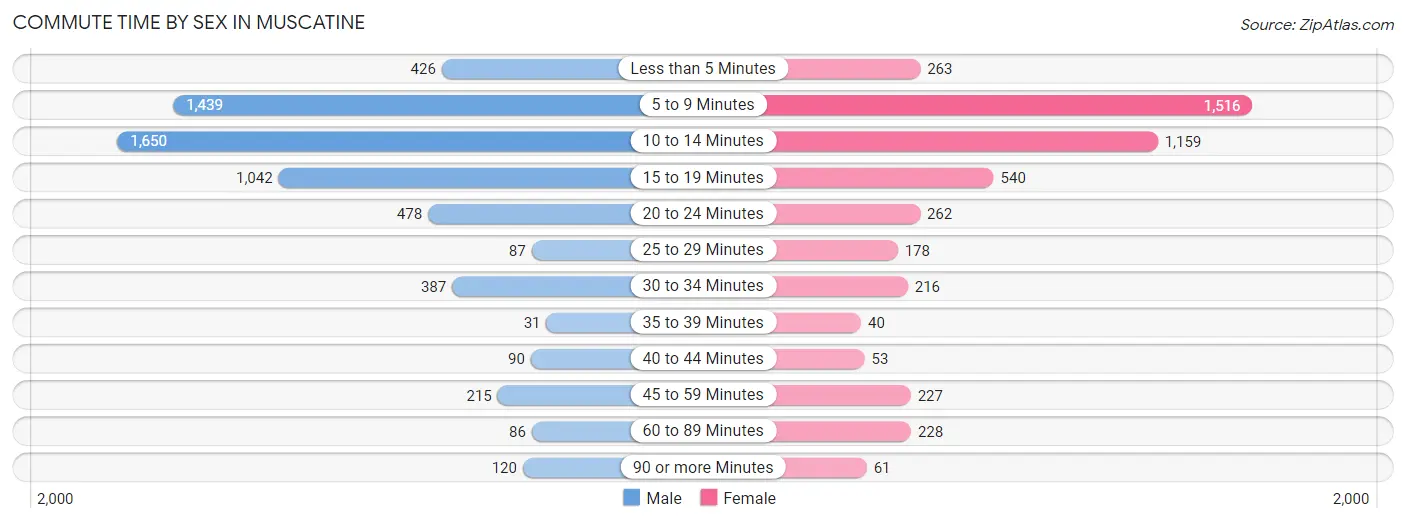
| Commute Time | Male | Female |
| Less than 5 Minutes | 426 (7.0%) | 263 (5.6%) |
| 5 to 9 Minutes | 1,439 (23.8%) | 1,516 (32.0%) |
| 10 to 14 Minutes | 1,650 (27.3%) | 1,159 (24.4%) |
| 15 to 19 Minutes | 1,042 (17.2%) | 540 (11.4%) |
| 20 to 24 Minutes | 478 (7.9%) | 262 (5.5%) |
| 25 to 29 Minutes | 87 (1.4%) | 178 (3.7%) |
| 30 to 34 Minutes | 387 (6.4%) | 216 (4.5%) |
| 35 to 39 Minutes | 31 (0.5%) | 40 (0.8%) |
| 40 to 44 Minutes | 90 (1.5%) | 53 (1.1%) |
| 45 to 59 Minutes | 215 (3.5%) | 227 (4.8%) |
| 60 to 89 Minutes | 86 (1.4%) | 228 (4.8%) |
| 90 or more Minutes | 120 (2.0%) | 61 (1.3%) |
Time of Departure to Work by Sex in Muscatine
The most frequent times of departure to work in Muscatine are 6:30 AM to 6:59 AM (777, 12.8%) for males and 7:30 AM to 7:59 AM (980, 20.7%) for females.
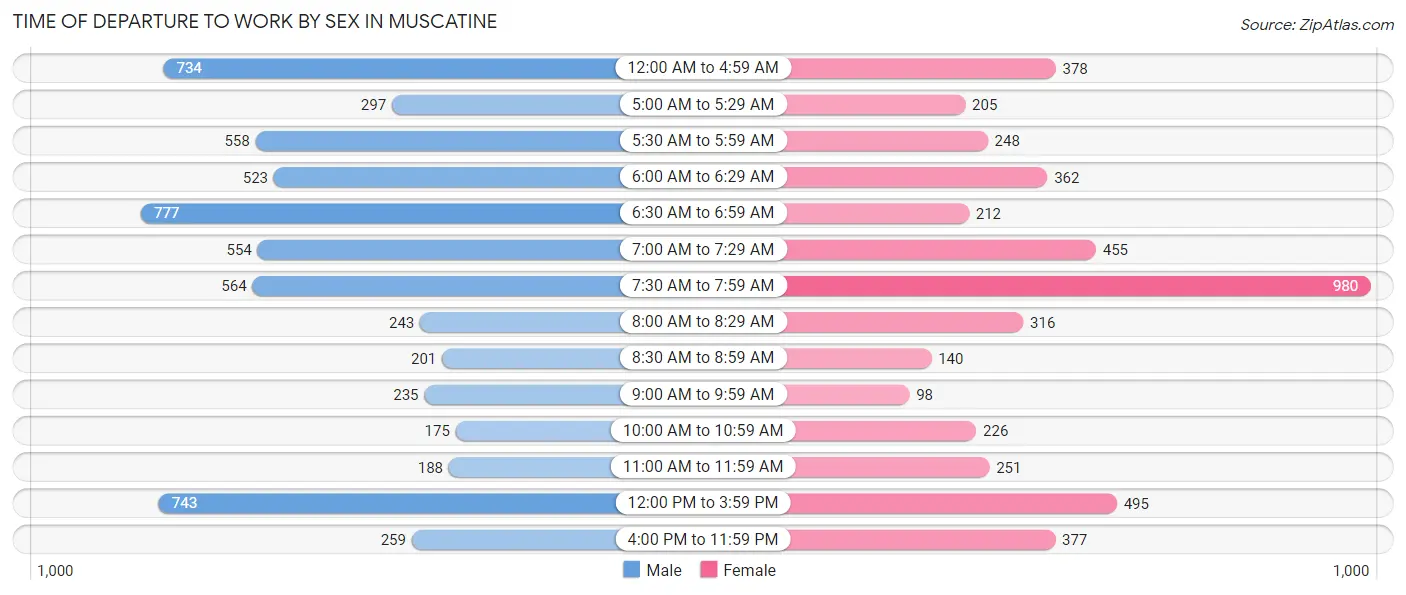
| Time of Departure | Male | Female |
| 12:00 AM to 4:59 AM | 734 (12.1%) | 378 (8.0%) |
| 5:00 AM to 5:29 AM | 297 (4.9%) | 205 (4.3%) |
| 5:30 AM to 5:59 AM | 558 (9.2%) | 248 (5.2%) |
| 6:00 AM to 6:29 AM | 523 (8.6%) | 362 (7.6%) |
| 6:30 AM to 6:59 AM | 777 (12.8%) | 212 (4.5%) |
| 7:00 AM to 7:29 AM | 554 (9.2%) | 455 (9.6%) |
| 7:30 AM to 7:59 AM | 564 (9.3%) | 980 (20.7%) |
| 8:00 AM to 8:29 AM | 243 (4.0%) | 316 (6.7%) |
| 8:30 AM to 8:59 AM | 201 (3.3%) | 140 (2.9%) |
| 9:00 AM to 9:59 AM | 235 (3.9%) | 98 (2.1%) |
| 10:00 AM to 10:59 AM | 175 (2.9%) | 226 (4.8%) |
| 11:00 AM to 11:59 AM | 188 (3.1%) | 251 (5.3%) |
| 12:00 PM to 3:59 PM | 743 (12.3%) | 495 (10.4%) |
| 4:00 PM to 11:59 PM | 259 (4.3%) | 377 (8.0%) |
| Total | 6,051 (100.0%) | 4,743 (100.0%) |
Housing Occupancy in Muscatine
Occupancy by Ownership in Muscatine
Of the total 9,415 dwellings in Muscatine, owner-occupied units account for 6,522 (69.3%), while renter-occupied units make up 2,893 (30.7%).
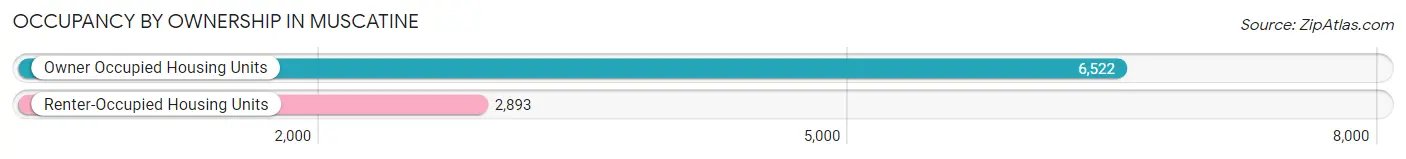
| Occupancy | # Housing Units | % Housing Units |
| Owner Occupied Housing Units | 6,522 | 69.3% |
| Renter-Occupied Housing Units | 2,893 | 30.7% |
| Total Occupied Housing Units | 9,415 | 100.0% |
Occupancy by Household Size in Muscatine
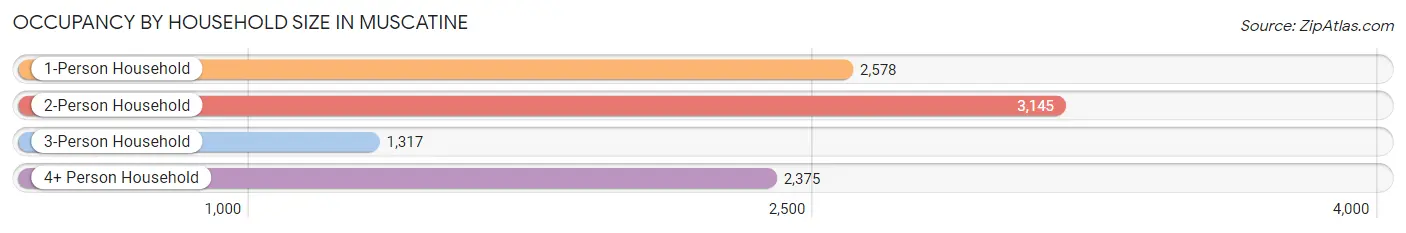
| Household Size | # Housing Units | % Housing Units |
| 1-Person Household | 2,578 | 27.4% |
| 2-Person Household | 3,145 | 33.4% |
| 3-Person Household | 1,317 | 14.0% |
| 4+ Person Household | 2,375 | 25.2% |
| Total Housing Units | 9,415 | 100.0% |
Occupancy by Ownership by Household Size in Muscatine
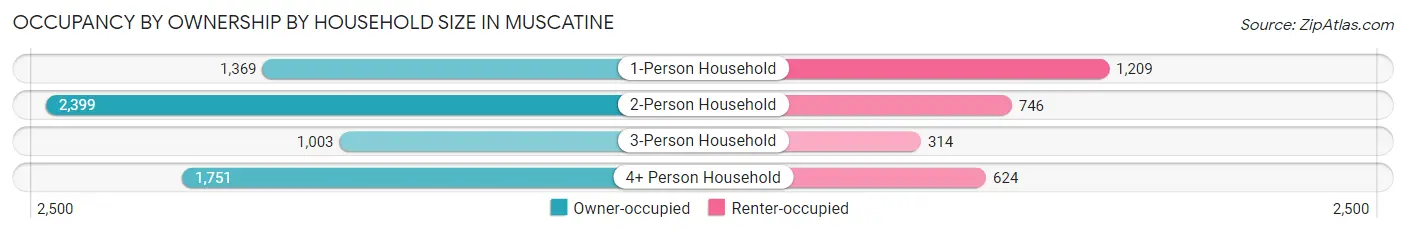
| Household Size | Owner-occupied | Renter-occupied |
| 1-Person Household | 1,369 (53.1%) | 1,209 (46.9%) |
| 2-Person Household | 2,399 (76.3%) | 746 (23.7%) |
| 3-Person Household | 1,003 (76.2%) | 314 (23.8%) |
| 4+ Person Household | 1,751 (73.7%) | 624 (26.3%) |
| Total Housing Units | 6,522 (69.3%) | 2,893 (30.7%) |
Occupancy by Educational Attainment in Muscatine
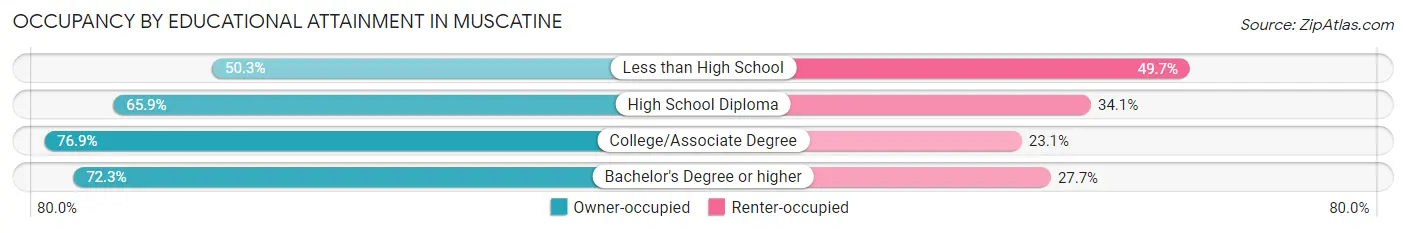
| Household Size | Owner-occupied | Renter-occupied |
| Less than High School | 491 (50.3%) | 486 (49.7%) |
| High School Diploma | 2,161 (65.9%) | 1,117 (34.1%) |
| College/Associate Degree | 2,342 (76.9%) | 704 (23.1%) |
| Bachelor's Degree or higher | 1,528 (72.3%) | 586 (27.7%) |
Occupancy by Age of Householder in Muscatine
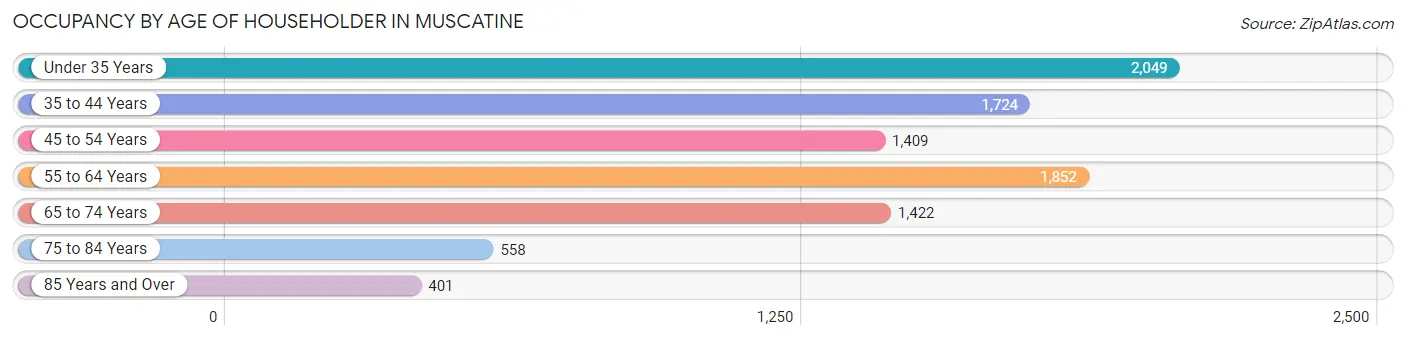
| Age Bracket | # Households | % Households |
| Under 35 Years | 2,049 | 21.8% |
| 35 to 44 Years | 1,724 | 18.3% |
| 45 to 54 Years | 1,409 | 15.0% |
| 55 to 64 Years | 1,852 | 19.7% |
| 65 to 74 Years | 1,422 | 15.1% |
| 75 to 84 Years | 558 | 5.9% |
| 85 Years and Over | 401 | 4.3% |
| Total | 9,415 | 100.0% |
Housing Finances in Muscatine
Median Income by Occupancy in Muscatine
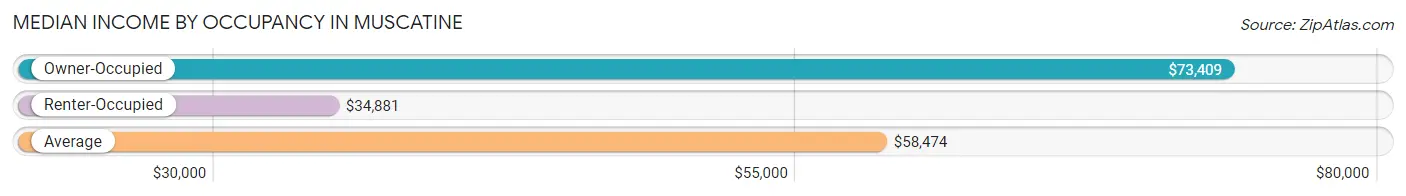
| Occupancy Type | # Households | Median Income |
| Owner-Occupied | 6,522 (69.3%) | $73,409 |
| Renter-Occupied | 2,893 (30.7%) | $34,881 |
| Average | 9,415 (100.0%) | $58,474 |
Occupancy by Householder Income Bracket in Muscatine
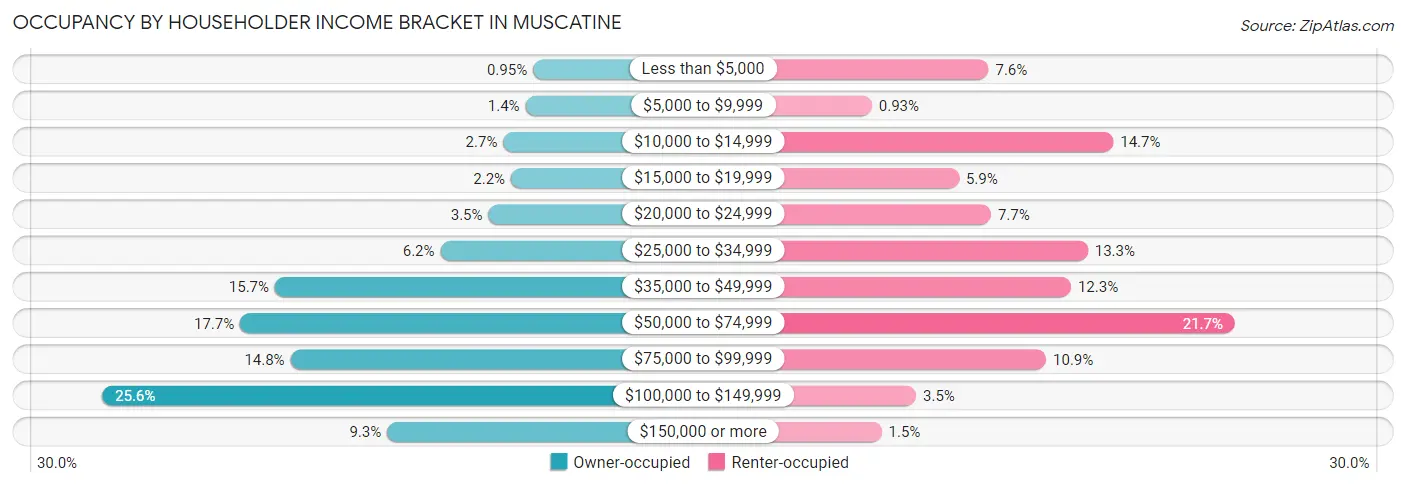
| Income Bracket | Owner-occupied | Renter-occupied |
| Less than $5,000 | 62 (0.9%) | 220 (7.6%) |
| $5,000 to $9,999 | 90 (1.4%) | 27 (0.9%) |
| $10,000 to $14,999 | 173 (2.6%) | 426 (14.7%) |
| $15,000 to $19,999 | 144 (2.2%) | 171 (5.9%) |
| $20,000 to $24,999 | 228 (3.5%) | 224 (7.7%) |
| $25,000 to $34,999 | 407 (6.2%) | 384 (13.3%) |
| $35,000 to $49,999 | 1,024 (15.7%) | 356 (12.3%) |
| $50,000 to $74,999 | 1,154 (17.7%) | 627 (21.7%) |
| $75,000 to $99,999 | 966 (14.8%) | 315 (10.9%) |
| $100,000 to $149,999 | 1,668 (25.6%) | 100 (3.5%) |
| $150,000 or more | 606 (9.3%) | 43 (1.5%) |
| Total | 6,522 (100.0%) | 2,893 (100.0%) |
Monthly Housing Cost Tiers in Muscatine
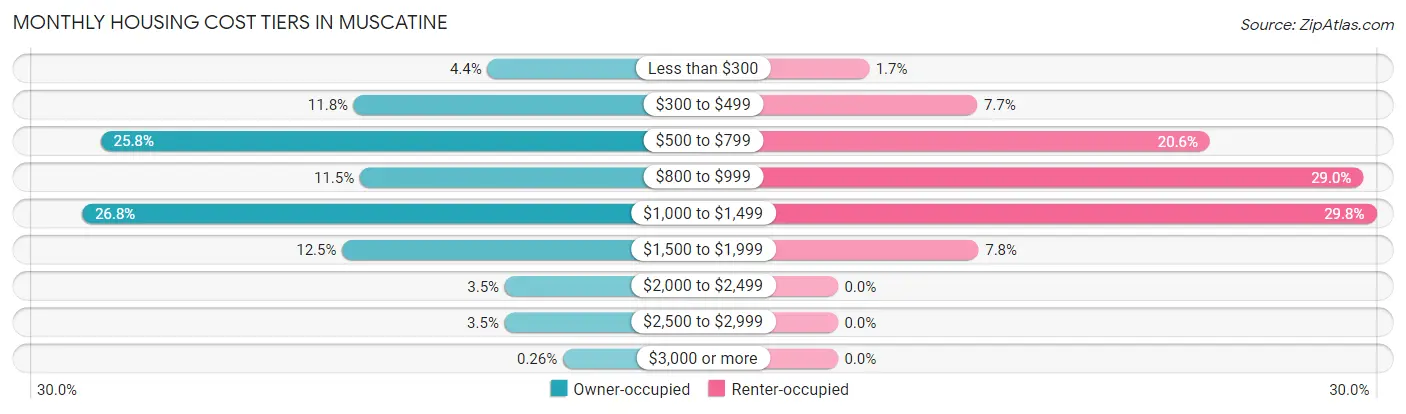
| Monthly Cost | Owner-occupied | Renter-occupied |
| Less than $300 | 289 (4.4%) | 50 (1.7%) |
| $300 to $499 | 770 (11.8%) | 223 (7.7%) |
| $500 to $799 | 1,683 (25.8%) | 595 (20.6%) |
| $800 to $999 | 748 (11.5%) | 840 (29.0%) |
| $1,000 to $1,499 | 1,750 (26.8%) | 861 (29.8%) |
| $1,500 to $1,999 | 812 (12.4%) | 225 (7.8%) |
| $2,000 to $2,499 | 226 (3.5%) | 0 (0.0%) |
| $2,500 to $2,999 | 227 (3.5%) | 0 (0.0%) |
| $3,000 or more | 17 (0.3%) | 0 (0.0%) |
| Total | 6,522 (100.0%) | 2,893 (100.0%) |
Physical Housing Characteristics in Muscatine
Housing Structures in Muscatine
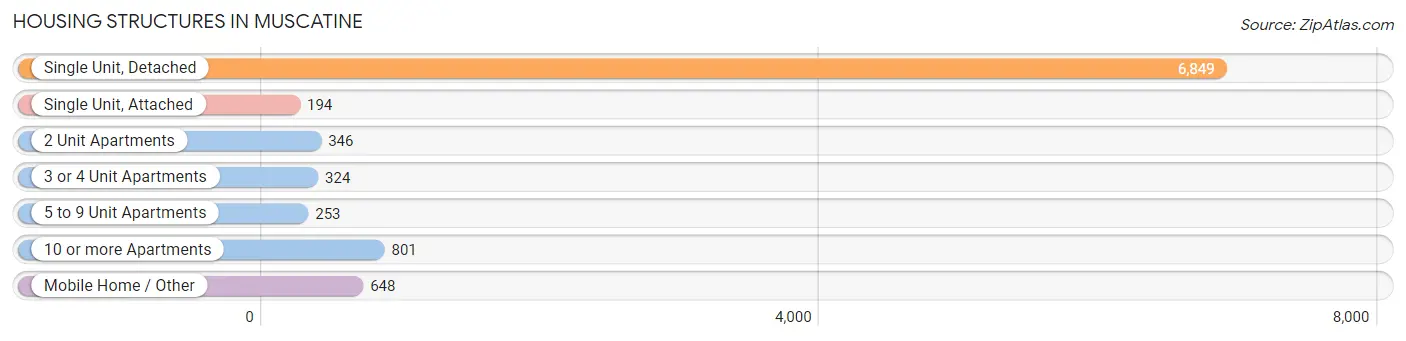
| Structure Type | # Housing Units | % Housing Units |
| Single Unit, Detached | 6,849 | 72.8% |
| Single Unit, Attached | 194 | 2.1% |
| 2 Unit Apartments | 346 | 3.7% |
| 3 or 4 Unit Apartments | 324 | 3.4% |
| 5 to 9 Unit Apartments | 253 | 2.7% |
| 10 or more Apartments | 801 | 8.5% |
| Mobile Home / Other | 648 | 6.9% |
| Total | 9,415 | 100.0% |
Housing Structures by Occupancy in Muscatine
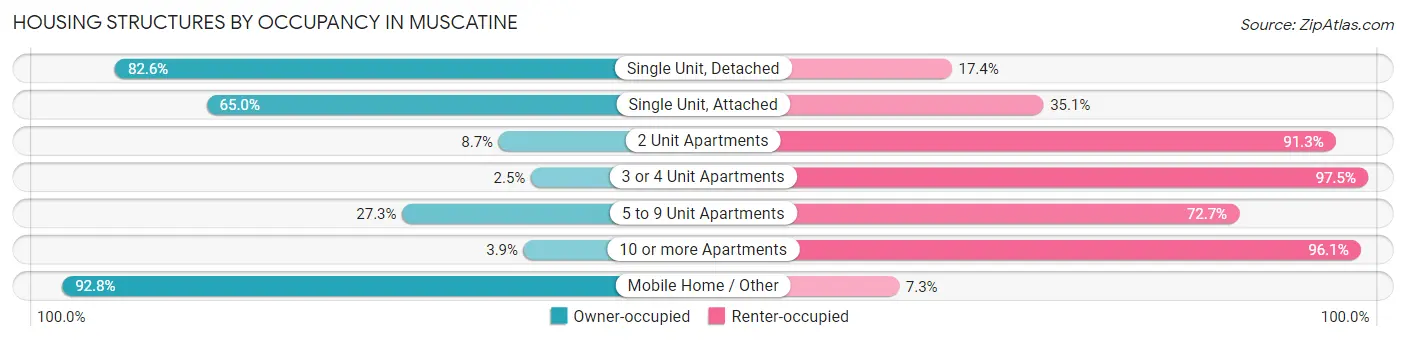
| Structure Type | Owner-occupied | Renter-occupied |
| Single Unit, Detached | 5,657 (82.6%) | 1,192 (17.4%) |
| Single Unit, Attached | 126 (64.9%) | 68 (35.0%) |
| 2 Unit Apartments | 30 (8.7%) | 316 (91.3%) |
| 3 or 4 Unit Apartments | 8 (2.5%) | 316 (97.5%) |
| 5 to 9 Unit Apartments | 69 (27.3%) | 184 (72.7%) |
| 10 or more Apartments | 31 (3.9%) | 770 (96.1%) |
| Mobile Home / Other | 601 (92.7%) | 47 (7.2%) |
| Total | 6,522 (69.3%) | 2,893 (30.7%) |
Housing Structures by Number of Rooms in Muscatine
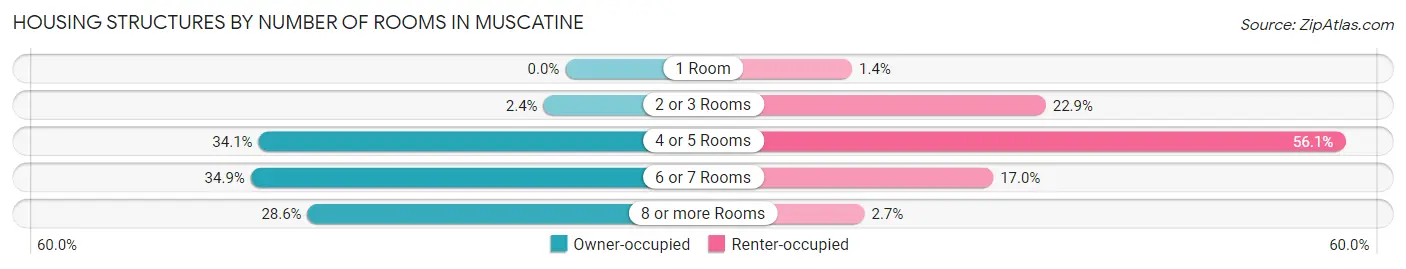
| Number of Rooms | Owner-occupied | Renter-occupied |
| 1 Room | 0 (0.0%) | 39 (1.3%) |
| 2 or 3 Rooms | 158 (2.4%) | 661 (22.9%) |
| 4 or 5 Rooms | 2,221 (34.1%) | 1,622 (56.1%) |
| 6 or 7 Rooms | 2,277 (34.9%) | 492 (17.0%) |
| 8 or more Rooms | 1,866 (28.6%) | 79 (2.7%) |
| Total | 6,522 (100.0%) | 2,893 (100.0%) |
Housing Structure by Heating Type in Muscatine
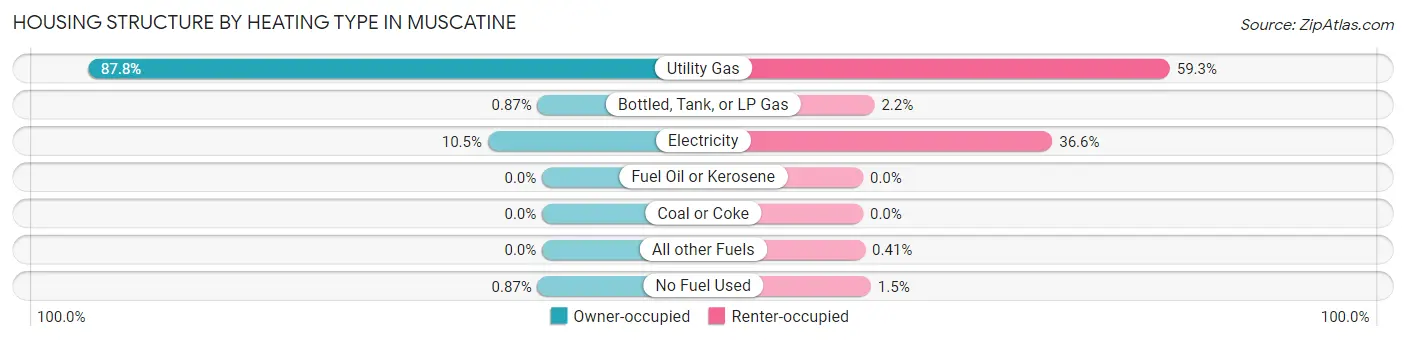
| Heating Type | Owner-occupied | Renter-occupied |
| Utility Gas | 5,724 (87.8%) | 1,715 (59.3%) |
| Bottled, Tank, or LP Gas | 57 (0.9%) | 64 (2.2%) |
| Electricity | 684 (10.5%) | 1,058 (36.6%) |
| Fuel Oil or Kerosene | 0 (0.0%) | 0 (0.0%) |
| Coal or Coke | 0 (0.0%) | 0 (0.0%) |
| All other Fuels | 0 (0.0%) | 12 (0.4%) |
| No Fuel Used | 57 (0.9%) | 44 (1.5%) |
| Total | 6,522 (100.0%) | 2,893 (100.0%) |
Household Vehicle Usage in Muscatine
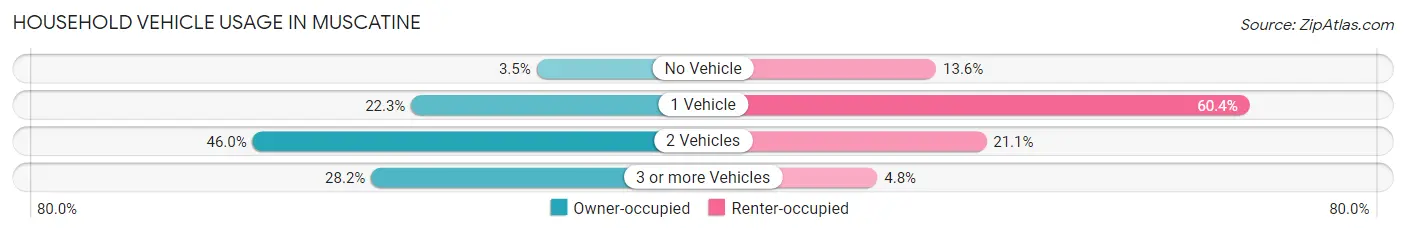
| Vehicles per Household | Owner-occupied | Renter-occupied |
| No Vehicle | 231 (3.5%) | 394 (13.6%) |
| 1 Vehicle | 1,452 (22.3%) | 1,748 (60.4%) |
| 2 Vehicles | 2,997 (46.0%) | 611 (21.1%) |
| 3 or more Vehicles | 1,842 (28.2%) | 140 (4.8%) |
| Total | 6,522 (100.0%) | 2,893 (100.0%) |
Real Estate & Mortgages in Muscatine
Real Estate and Mortgage Overview in Muscatine
| Characteristic | Without Mortgage | With Mortgage |
| Housing Units | 2,723 | 3,799 |
| Median Property Value | $109,300 | $141,400 |
| Median Household Income | $56,118 | $470 |
| Monthly Housing Costs | $557 | $17 |
| Real Estate Taxes | $2,045 | $10 |
Property Value by Mortgage Status in Muscatine
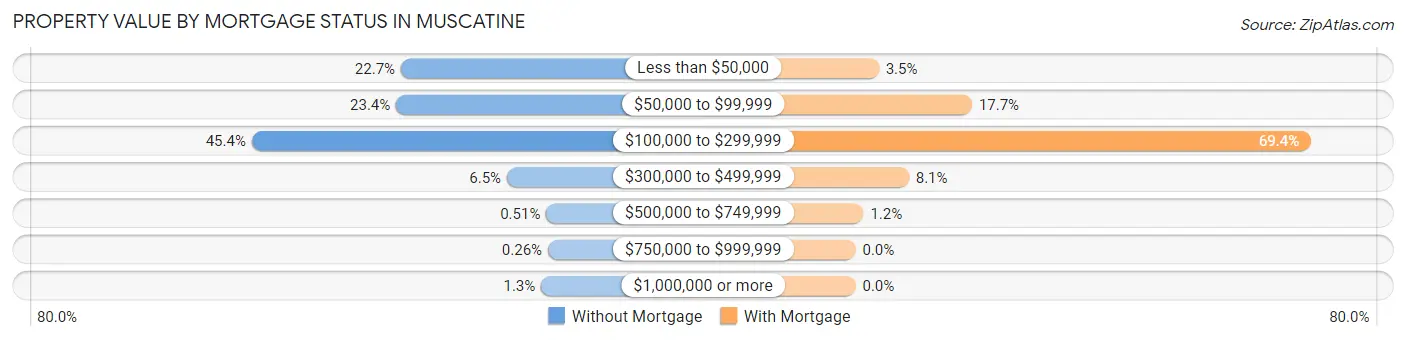
| Property Value | Without Mortgage | With Mortgage |
| Less than $50,000 | 617 (22.7%) | 134 (3.5%) |
| $50,000 to $99,999 | 637 (23.4%) | 674 (17.7%) |
| $100,000 to $299,999 | 1,236 (45.4%) | 2,637 (69.4%) |
| $300,000 to $499,999 | 177 (6.5%) | 308 (8.1%) |
| $500,000 to $749,999 | 14 (0.5%) | 46 (1.2%) |
| $750,000 to $999,999 | 7 (0.3%) | 0 (0.0%) |
| $1,000,000 or more | 35 (1.3%) | 0 (0.0%) |
| Total | 2,723 (100.0%) | 3,799 (100.0%) |
Household Income by Mortgage Status in Muscatine
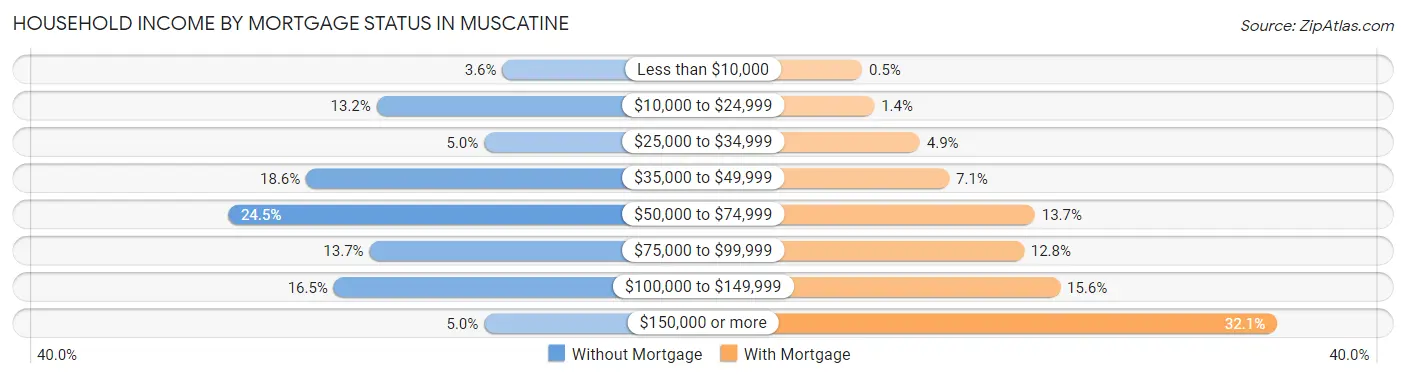
| Household Income | Without Mortgage | With Mortgage |
| Less than $10,000 | 98 (3.6%) | 19 (0.5%) |
| $10,000 to $24,999 | 359 (13.2%) | 54 (1.4%) |
| $25,000 to $34,999 | 136 (5.0%) | 186 (4.9%) |
| $35,000 to $49,999 | 505 (18.5%) | 271 (7.1%) |
| $50,000 to $74,999 | 667 (24.5%) | 519 (13.7%) |
| $75,000 to $99,999 | 374 (13.7%) | 487 (12.8%) |
| $100,000 to $149,999 | 448 (16.5%) | 592 (15.6%) |
| $150,000 or more | 136 (5.0%) | 1,220 (32.1%) |
| Total | 2,723 (100.0%) | 3,799 (100.0%) |
Property Value to Household Income Ratio in Muscatine
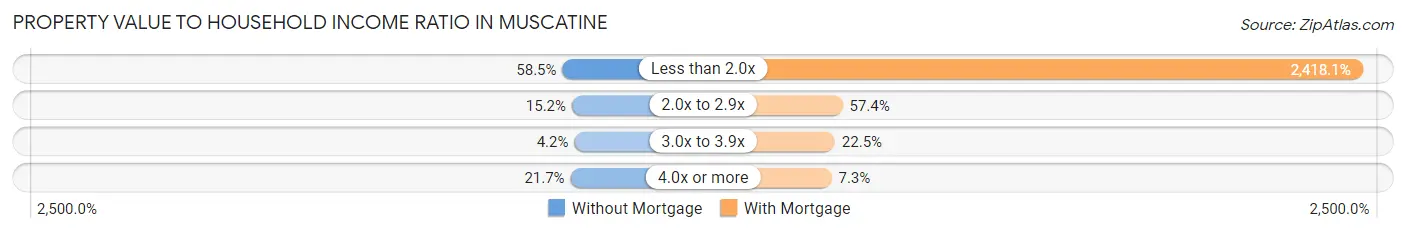
| Value-to-Income Ratio | Without Mortgage | With Mortgage |
| Less than 2.0x | 1,592 (58.5%) | 91,862 (2,418.1%) |
| 2.0x to 2.9x | 415 (15.2%) | 2,182 (57.4%) |
| 3.0x to 3.9x | 114 (4.2%) | 856 (22.5%) |
| 4.0x or more | 591 (21.7%) | 276 (7.3%) |
| Total | 2,723 (100.0%) | 3,799 (100.0%) |
Real Estate Taxes by Mortgage Status in Muscatine
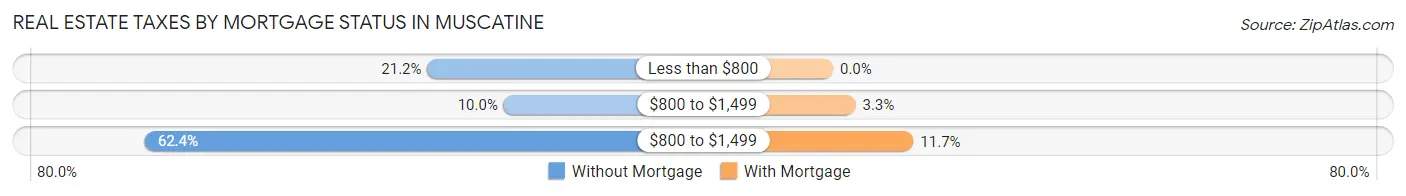
| Property Taxes | Without Mortgage | With Mortgage |
| Less than $800 | 576 (21.1%) | 0 (0.0%) |
| $800 to $1,499 | 272 (10.0%) | 125 (3.3%) |
| $800 to $1,499 | 1,700 (62.4%) | 446 (11.7%) |
| Total | 2,723 (100.0%) | 3,799 (100.0%) |
Health & Disability in Muscatine
Health Insurance Coverage by Age in Muscatine
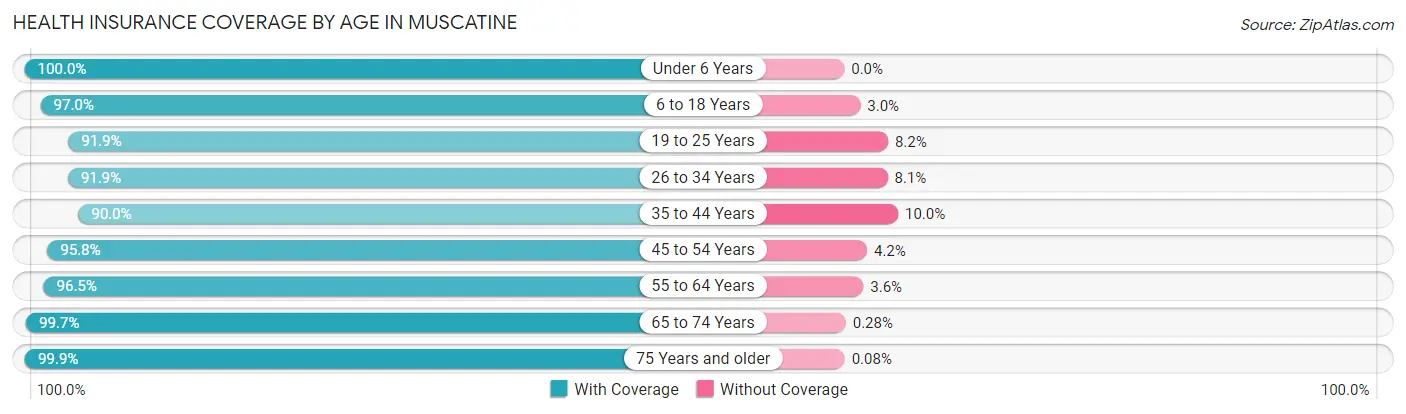
| Age Bracket | With Coverage | Without Coverage |
| Under 6 Years | 2,097 (100.0%) | 0 (0.0%) |
| 6 to 18 Years | 3,993 (97.0%) | 123 (3.0%) |
| 19 to 25 Years | 2,018 (91.8%) | 179 (8.2%) |
| 26 to 34 Years | 2,609 (91.9%) | 229 (8.1%) |
| 35 to 44 Years | 2,756 (90.0%) | 307 (10.0%) |
| 45 to 54 Years | 2,305 (95.8%) | 102 (4.2%) |
| 55 to 64 Years | 2,985 (96.5%) | 110 (3.5%) |
| 65 to 74 Years | 2,142 (99.7%) | 6 (0.3%) |
| 75 Years and older | 1,226 (99.9%) | 1 (0.1%) |
| Total | 22,131 (95.4%) | 1,057 (4.6%) |
Health Insurance Coverage by Citizenship Status in Muscatine
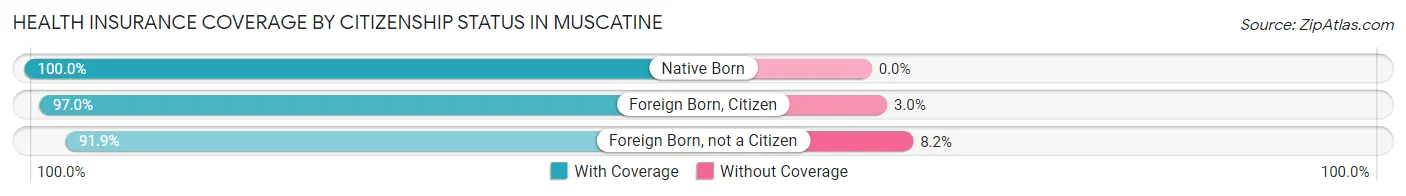
| Citizenship Status | With Coverage | Without Coverage |
| Native Born | 2,097 (100.0%) | 0 (0.0%) |
| Foreign Born, Citizen | 3,993 (97.0%) | 123 (3.0%) |
| Foreign Born, not a Citizen | 2,018 (91.8%) | 179 (8.2%) |
Health Insurance Coverage by Household Income in Muscatine
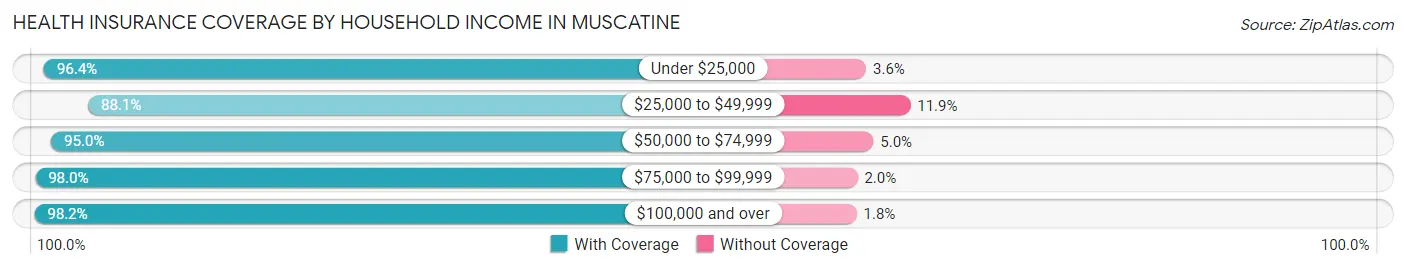
| Household Income | With Coverage | Without Coverage |
| Under $25,000 | 3,146 (96.4%) | 118 (3.6%) |
| $25,000 to $49,999 | 3,588 (88.1%) | 484 (11.9%) |
| $50,000 to $74,999 | 4,356 (95.0%) | 228 (5.0%) |
| $75,000 to $99,999 | 3,424 (98.0%) | 70 (2.0%) |
| $100,000 and over | 7,572 (98.2%) | 141 (1.8%) |
Public vs Private Health Insurance Coverage by Age in Muscatine
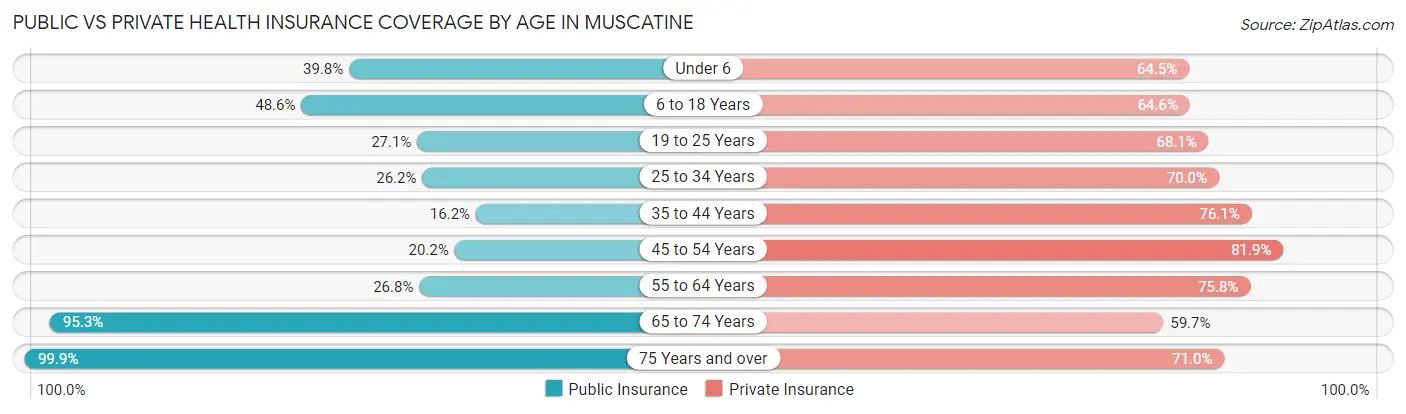
| Age Bracket | Public Insurance | Private Insurance |
| Under 6 | 834 (39.8%) | 1,352 (64.5%) |
| 6 to 18 Years | 2,002 (48.6%) | 2,658 (64.6%) |
| 19 to 25 Years | 596 (27.1%) | 1,496 (68.1%) |
| 25 to 34 Years | 743 (26.2%) | 1,986 (70.0%) |
| 35 to 44 Years | 497 (16.2%) | 2,330 (76.1%) |
| 45 to 54 Years | 486 (20.2%) | 1,972 (81.9%) |
| 55 to 64 Years | 828 (26.8%) | 2,346 (75.8%) |
| 65 to 74 Years | 2,047 (95.3%) | 1,282 (59.7%) |
| 75 Years and over | 1,226 (99.9%) | 871 (71.0%) |
| Total | 9,259 (39.9%) | 16,293 (70.3%) |
Disability Status by Sex by Age in Muscatine
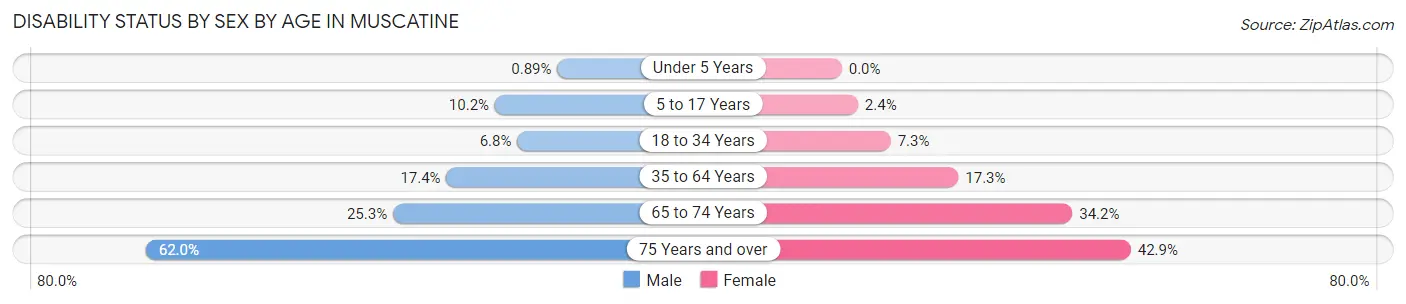
| Age Bracket | Male | Female |
| Under 5 Years | 8 (0.9%) | 0 (0.0%) |
| 5 to 17 Years | 217 (10.2%) | 50 (2.4%) |
| 18 to 34 Years | 179 (6.8%) | 196 (7.3%) |
| 35 to 64 Years | 793 (17.4%) | 692 (17.3%) |
| 65 to 74 Years | 233 (25.3%) | 420 (34.2%) |
| 75 Years and over | 297 (62.0%) | 321 (42.9%) |
Disability Class by Sex by Age in Muscatine
Disability Class: Hearing Difficulty
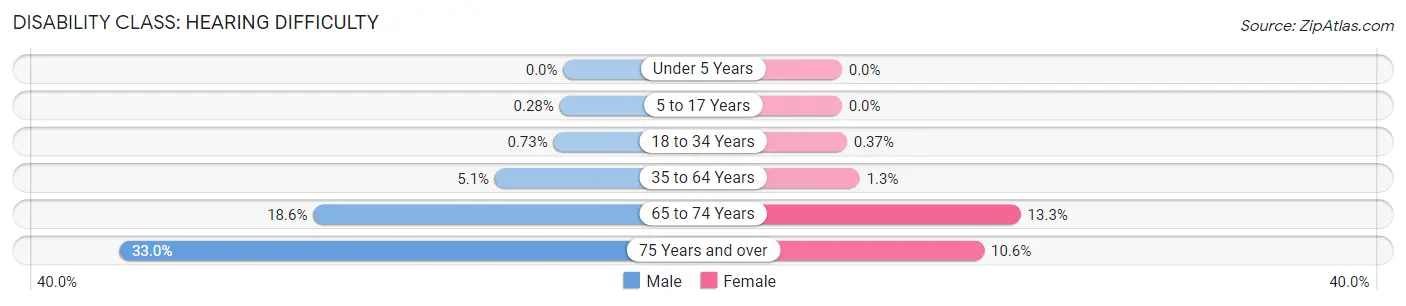
| Age Bracket | Male | Female |
| Under 5 Years | 0 (0.0%) | 0 (0.0%) |
| 5 to 17 Years | 6 (0.3%) | 0 (0.0%) |
| 18 to 34 Years | 19 (0.7%) | 10 (0.4%) |
| 35 to 64 Years | 232 (5.1%) | 53 (1.3%) |
| 65 to 74 Years | 171 (18.6%) | 163 (13.3%) |
| 75 Years and over | 158 (33.0%) | 79 (10.6%) |
Disability Class: Vision Difficulty
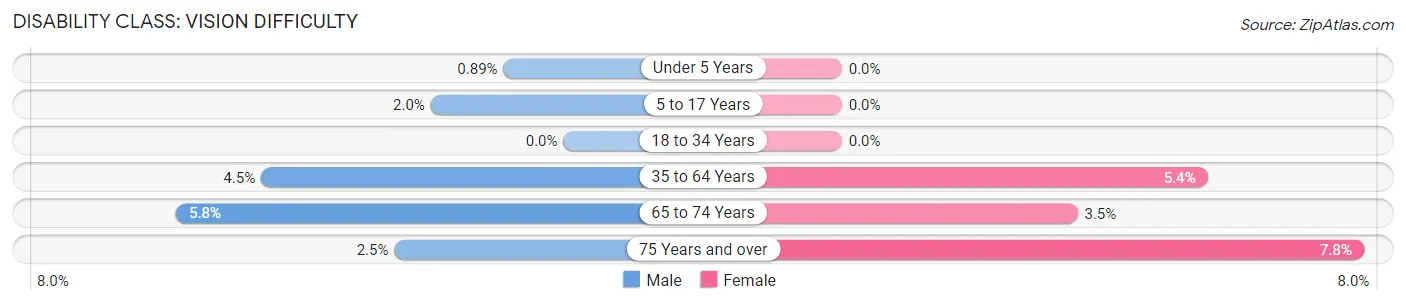
| Age Bracket | Male | Female |
| Under 5 Years | 8 (0.9%) | 0 (0.0%) |
| 5 to 17 Years | 42 (2.0%) | 0 (0.0%) |
| 18 to 34 Years | 0 (0.0%) | 0 (0.0%) |
| 35 to 64 Years | 205 (4.5%) | 217 (5.4%) |
| 65 to 74 Years | 53 (5.8%) | 43 (3.5%) |
| 75 Years and over | 12 (2.5%) | 58 (7.7%) |
Disability Class: Cognitive Difficulty
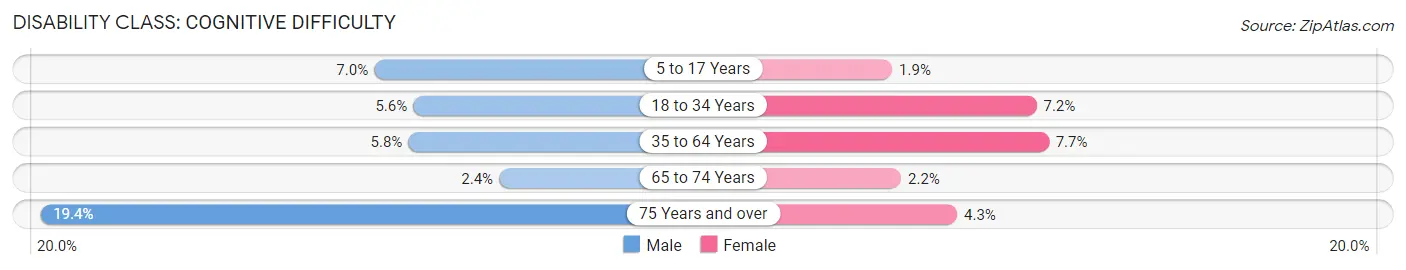
| Age Bracket | Male | Female |
| 5 to 17 Years | 150 (7.0%) | 39 (1.9%) |
| 18 to 34 Years | 146 (5.6%) | 195 (7.2%) |
| 35 to 64 Years | 263 (5.8%) | 307 (7.7%) |
| 65 to 74 Years | 22 (2.4%) | 27 (2.2%) |
| 75 Years and over | 93 (19.4%) | 32 (4.3%) |
Disability Class: Ambulatory Difficulty
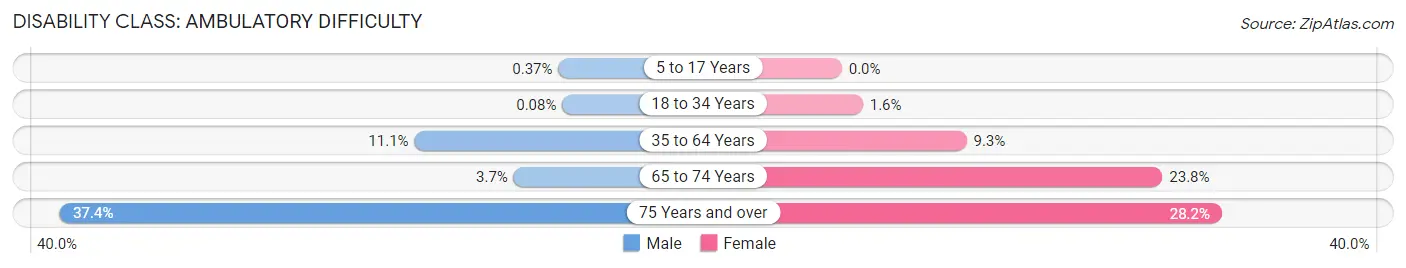
| Age Bracket | Male | Female |
| 5 to 17 Years | 8 (0.4%) | 0 (0.0%) |
| 18 to 34 Years | 2 (0.1%) | 42 (1.6%) |
| 35 to 64 Years | 505 (11.1%) | 370 (9.3%) |
| 65 to 74 Years | 34 (3.7%) | 292 (23.8%) |
| 75 Years and over | 179 (37.4%) | 211 (28.2%) |
Disability Class: Self-Care Difficulty
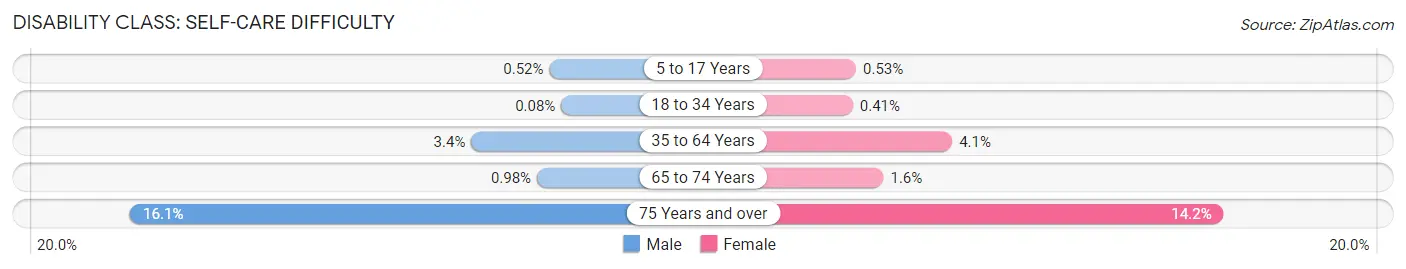
| Age Bracket | Male | Female |
| 5 to 17 Years | 11 (0.5%) | 11 (0.5%) |
| 18 to 34 Years | 2 (0.1%) | 11 (0.4%) |
| 35 to 64 Years | 156 (3.4%) | 164 (4.1%) |
| 65 to 74 Years | 9 (1.0%) | 19 (1.5%) |
| 75 Years and over | 77 (16.1%) | 106 (14.2%) |
Technology Access in Muscatine
Computing Device Access in Muscatine
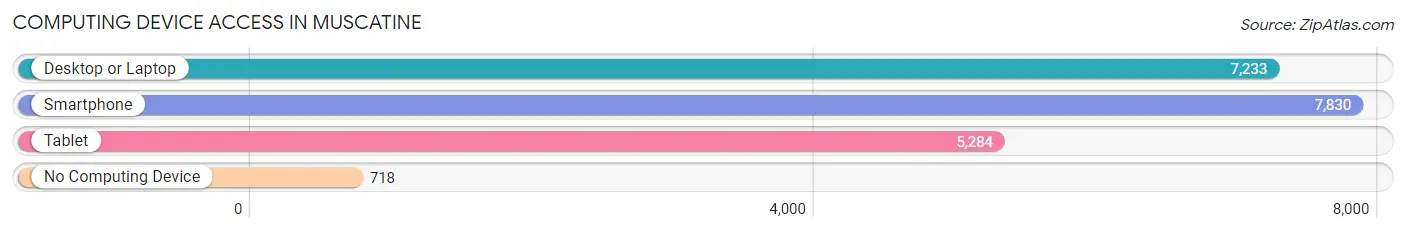
| Device Type | # Households | % Households |
| Desktop or Laptop | 7,233 | 76.8% |
| Smartphone | 7,830 | 83.2% |
| Tablet | 5,284 | 56.1% |
| No Computing Device | 718 | 7.6% |
| Total | 9,415 | 100.0% |
Internet Access in Muscatine
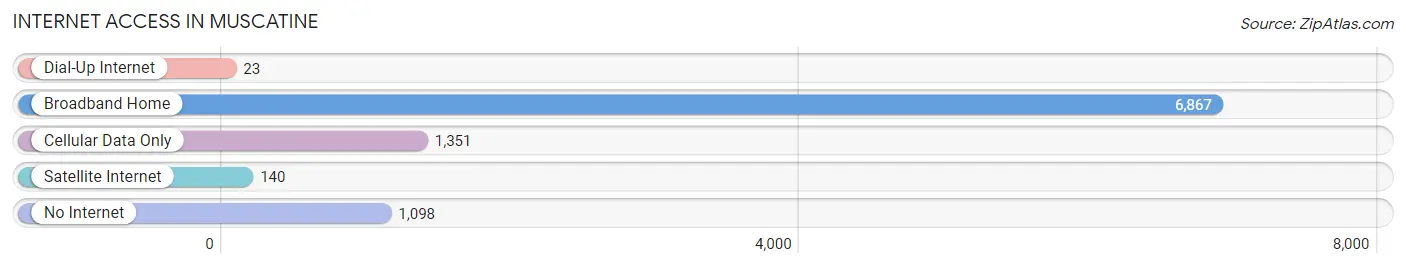
| Internet Type | # Households | % Households |
| Dial-Up Internet | 23 | 0.2% |
| Broadband Home | 6,867 | 72.9% |
| Cellular Data Only | 1,351 | 14.3% |
| Satellite Internet | 140 | 1.5% |
| No Internet | 1,098 | 11.7% |
| Total | 9,415 | 100.0% |
Muscatine Summary
History
The city of Muscatine, Iowa is located in the southeastern corner of the state along the Mississippi River. It is the county seat of Muscatine County and is the largest city in the county. The city was founded in 1833 by William D. Brown and was originally named Bloomington. The name was changed to Muscatine in 1836, after the Mascouten Native American tribe that had lived in the area.
The city was an important port on the Mississippi River in the 19th century, and it was the site of the first railroad bridge to span the river. The city was also an important center for the lumber industry, and it was home to several large sawmills. The city was also a major center for the production of pearl buttons, which were made from the shells of freshwater mussels found in the river.
The city was also an important center for the abolitionist movement in the mid-19th century. The city was home to several prominent abolitionists, including the Reverend John G. Fee, who founded Berea College in Kentucky.
Geography
Muscatine is located in the southeastern corner of Iowa, along the Mississippi River. The city is situated on the east bank of the river, and it is bordered by the cities of Davenport to the north, Bettendorf to the east, and Wilton to the south. The city is located in a flat, low-lying area, and it is surrounded by rolling hills and bluffs. The city is located at an elevation of 590 feet above sea level.
The climate in Muscatine is humid continental, with hot, humid summers and cold, snowy winters. The average annual temperature is 50 degrees Fahrenheit, and the average annual precipitation is 36 inches.
Economy
The economy of Muscatine is largely based on agriculture and manufacturing. The city is home to several large agricultural companies, including Cargill, Monsanto, and Syngenta. The city is also home to several large manufacturing companies, including HON Industries, Muscatine Foods, and Muscatine Power and Water.
The city is also home to several large retail stores, including Walmart, Target, and Kohl's. The city is also home to several large healthcare providers, including UnityPoint Health and Genesis Health System.
Demographics
As of the 2010 census, the population of Muscatine was 22,886. The racial makeup of the city was 90.2% White, 4.2% African American, 0.7% Native American, 1.2% Asian, 0.1% Pacific Islander, 1.3% from other races, and 2.4% from two or more races. Hispanic or Latino of any race were 4.2% of the population.
The median household income in Muscatine was $45,845, and the median family income was $54,845. The per capita income in the city was $22,845. About 11.2% of the population was below the poverty line.
Common Questions
What is Per Capita Income in Muscatine?
Per Capita income in Muscatine is $29,550.
What is the Median Family Income in Muscatine?
Median Family Income in Muscatine is $71,960.
What is the Median Household income in Muscatine?
Median Household Income in Muscatine is $58,474.
What is Income or Wage Gap in Muscatine?
Income or Wage Gap in Muscatine is 42.1%.
Women in Muscatine earn 57.9 cents for every dollar earned by a man.
What is Family Income Deficit in Muscatine?
Family Income Deficit in Muscatine is $12,581.
Families that are below poverty line in Muscatine earn $12,581 less on average than the poverty threshold level.
What is Inequality or Gini Index in Muscatine?
Inequality or Gini Index in Muscatine is 0.41.
What is the Total Population of Muscatine?
Total Population of Muscatine is 23,671.
What is the Total Male Population of Muscatine?
Total Male Population of Muscatine is 11,907.
What is the Total Female Population of Muscatine?
Total Female Population of Muscatine is 11,764.
What is the Ratio of Males per 100 Females in Muscatine?
There are 101.22 Males per 100 Females in Muscatine.
What is the Ratio of Females per 100 Males in Muscatine?
There are 98.80 Females per 100 Males in Muscatine.
What is the Median Population Age in Muscatine?
Median Population Age in Muscatine is 35.9 Years.
What is the Average Family Size in Muscatine
Average Family Size in Muscatine is 3.0 People.
What is the Average Household Size in Muscatine
Average Household Size in Muscatine is 2.5 People.
How Large is the Labor Force in Muscatine?
There are 12,000 People in the Labor Forcein in Muscatine.
What is the Percentage of People in the Labor Force in Muscatine?
64.9% of People are in the Labor Force in Muscatine.
What is the Unemployment Rate in Muscatine?
Unemployment Rate in Muscatine is 4.3%.