East Point, GA Map & Demographics
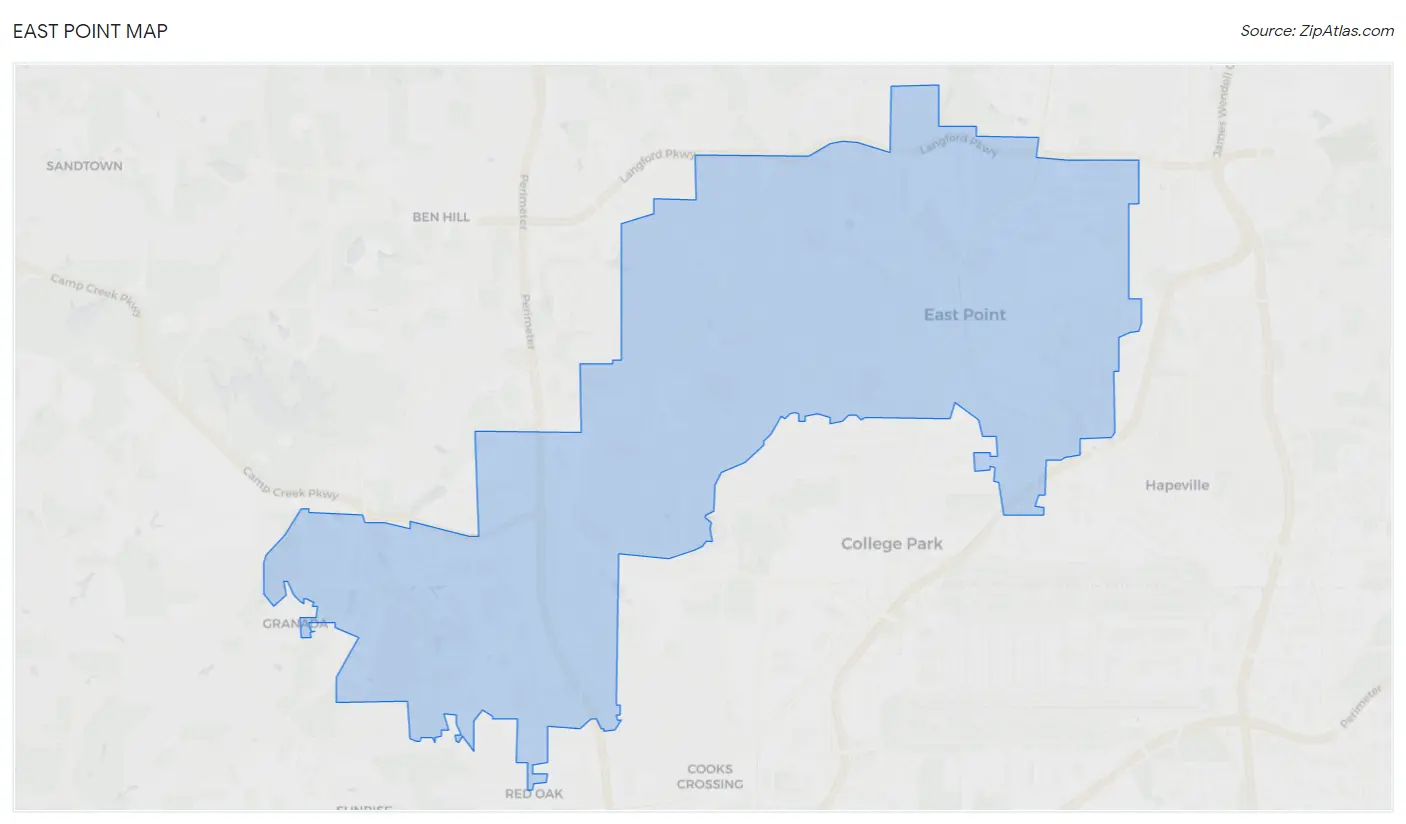
East Point Map
East Point Overview
$33,665
PER CAPITA INCOME
$68,299
AVG FAMILY INCOME
$59,602
AVG HOUSEHOLD INCOME
6.6%
WAGE / INCOME GAP [ % ]
93.4¢/ $1
WAGE / INCOME GAP [ $ ]
$9,323
FAMILY INCOME DEFICIT
0.43
INEQUALITY / GINI INDEX
38,113
TOTAL POPULATION
17,941
MALE POPULATION
20,172
FEMALE POPULATION
88.94
MALES / 100 FEMALES
112.44
FEMALES / 100 MALES
34.7
MEDIAN AGE
3.3
AVG FAMILY SIZE
2.4
AVG HOUSEHOLD SIZE
21,281
LABOR FORCE [ PEOPLE ]
71.4%
PERCENT IN LABOR FORCE
7.1%
UNEMPLOYMENT RATE
Income in East Point
Income Overview in East Point
Per Capita Income in East Point is $33,665, while median incomes of families and households are $68,299 and $59,602 respectively.
| Characteristic | Number | Measure |
| Per Capita Income | 38,113 | $33,665 |
| Median Family Income | 8,463 | $68,299 |
| Mean Family Income | 8,463 | $89,117 |
| Median Household Income | 16,062 | $59,602 |
| Mean Household Income | 16,062 | $77,016 |
| Income Deficit | 8,463 | $9,323 |
| Wage / Income Gap (%) | 38,113 | 6.60% |
| Wage / Income Gap ($) | 38,113 | 93.40¢ per $1 |
| Gini / Inequality Index | 38,113 | 0.43 |
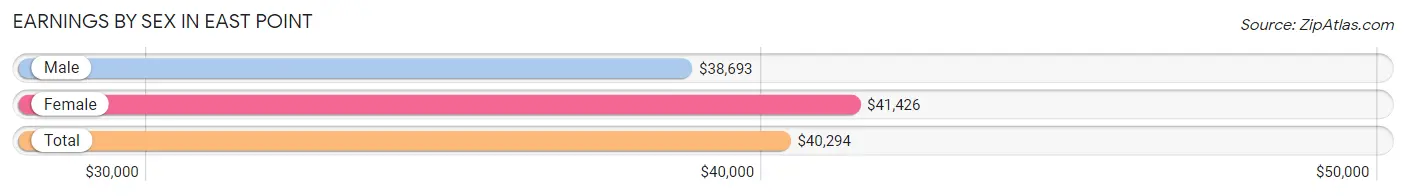
Earnings by Sex in East Point
Average Earnings in East Point are $40,294, $38,693 for men and $41,426 for women, a difference of 6.6%.
| Sex | Number | Average Earnings |
| Male | 9,837 (46.2%) | $38,693 |
| Female | 11,468 (53.8%) | $41,426 |
| Total | 21,305 (100.0%) | $40,294 |
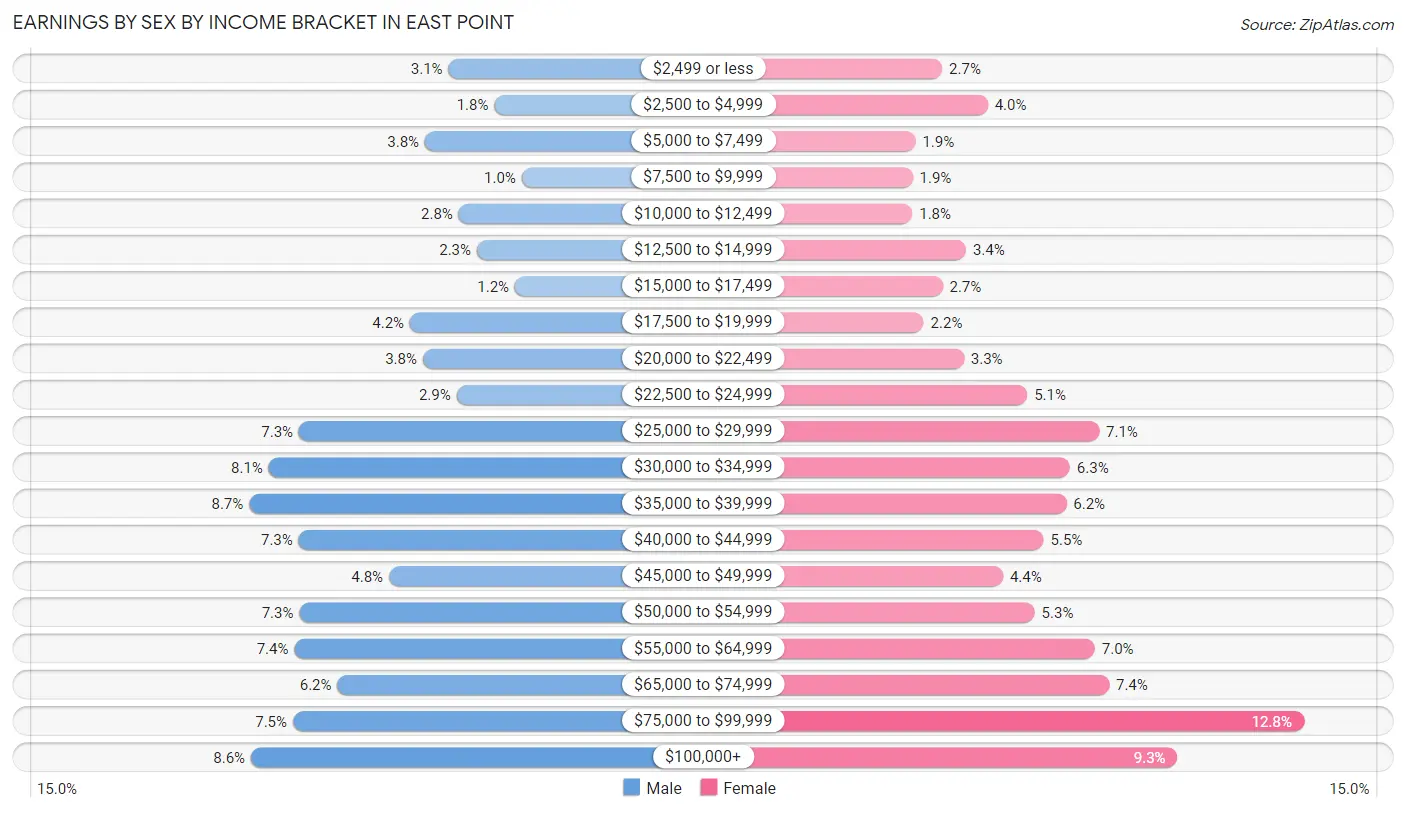
Earnings by Sex by Income Bracket in East Point
The most common earnings brackets in East Point are $35,000 to $39,999 for men (855 | 8.7%) and $75,000 to $99,999 for women (1,473 | 12.8%).
| Income | Male | Female |
| $2,499 or less | 304 (3.1%) | 307 (2.7%) |
| $2,500 to $4,999 | 177 (1.8%) | 454 (4.0%) |
| $5,000 to $7,499 | 369 (3.7%) | 221 (1.9%) |
| $7,500 to $9,999 | 101 (1.0%) | 212 (1.8%) |
| $10,000 to $12,499 | 275 (2.8%) | 211 (1.8%) |
| $12,500 to $14,999 | 225 (2.3%) | 384 (3.4%) |
| $15,000 to $17,499 | 120 (1.2%) | 309 (2.7%) |
| $17,500 to $19,999 | 410 (4.2%) | 248 (2.2%) |
| $20,000 to $22,499 | 375 (3.8%) | 377 (3.3%) |
| $22,500 to $24,999 | 281 (2.9%) | 581 (5.1%) |
| $25,000 to $29,999 | 717 (7.3%) | 813 (7.1%) |
| $30,000 to $34,999 | 801 (8.1%) | 719 (6.3%) |
| $35,000 to $39,999 | 855 (8.7%) | 708 (6.2%) |
| $40,000 to $44,999 | 718 (7.3%) | 634 (5.5%) |
| $45,000 to $49,999 | 468 (4.8%) | 503 (4.4%) |
| $50,000 to $54,999 | 716 (7.3%) | 605 (5.3%) |
| $55,000 to $64,999 | 730 (7.4%) | 799 (7.0%) |
| $65,000 to $74,999 | 611 (6.2%) | 845 (7.4%) |
| $75,000 to $99,999 | 734 (7.5%) | 1,473 (12.8%) |
| $100,000+ | 850 (8.6%) | 1,065 (9.3%) |
| Total | 9,837 (100.0%) | 11,468 (100.0%) |
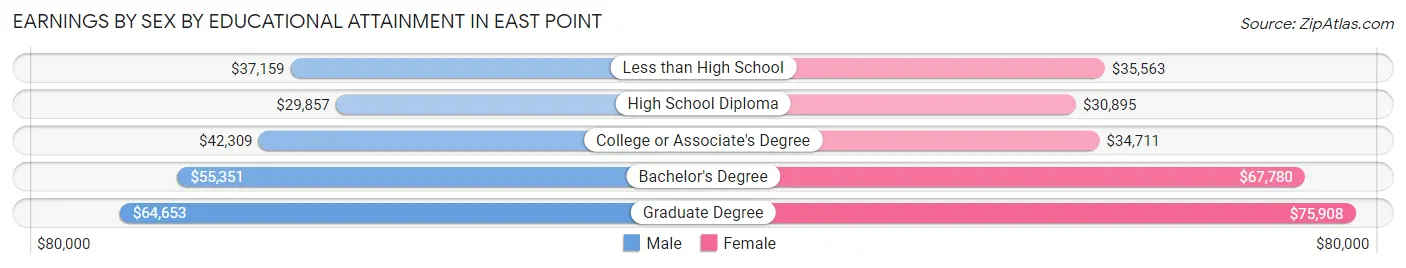
Earnings by Sex by Educational Attainment in East Point
Average earnings in East Point are $42,117 for men and $46,284 for women, a difference of 9.0%. Men with an educational attainment of graduate degree enjoy the highest average annual earnings of $64,653, while those with high school diploma education earn the least with $29,857. Women with an educational attainment of graduate degree earn the most with the average annual earnings of $75,908, while those with high school diploma education have the smallest earnings of $30,895.
| Educational Attainment | Male Income | Female Income |
| Less than High School | $37,159 | $35,563 |
| High School Diploma | $29,857 | $30,895 |
| College or Associate's Degree | $42,309 | $34,711 |
| Bachelor's Degree | $55,351 | $67,780 |
| Graduate Degree | $64,653 | $75,908 |
| Total | $42,117 | $46,284 |
Family Income in East Point
Family Income Brackets in East Point
According to the East Point family income data, there are 1,413 families falling into the $100,000 to $149,999 income range, which is the most common income bracket and makes up 16.7% of all families. Conversely, the $10,000 to $14,999 income bracket is the least frequent group with only 212 families (2.5%) belonging to this category.
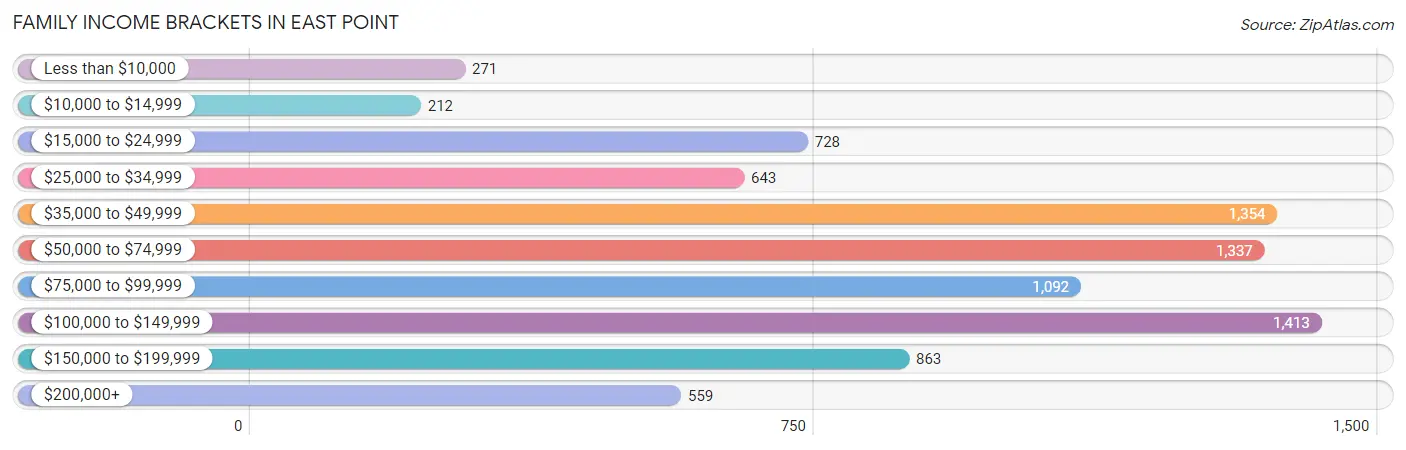
| Income Bracket | # Families | % Families |
| Less than $10,000 | 271 | 3.2% |
| $10,000 to $14,999 | 212 | 2.5% |
| $15,000 to $24,999 | 728 | 8.6% |
| $25,000 to $34,999 | 643 | 7.6% |
| $35,000 to $49,999 | 1,354 | 16.0% |
| $50,000 to $74,999 | 1,337 | 15.8% |
| $75,000 to $99,999 | 1,092 | 12.9% |
| $100,000 to $149,999 | 1,413 | 16.7% |
| $150,000 to $199,999 | 863 | 10.2% |
| $200,000+ | 559 | 6.6% |
Family Income by Famaliy Size in East Point
7+ person families (164 | 1.9%) account for the highest median family income in East Point with $86,250 per family, while 2-person families (4,046 | 47.8%) have the highest median income of $34,464 per family member.
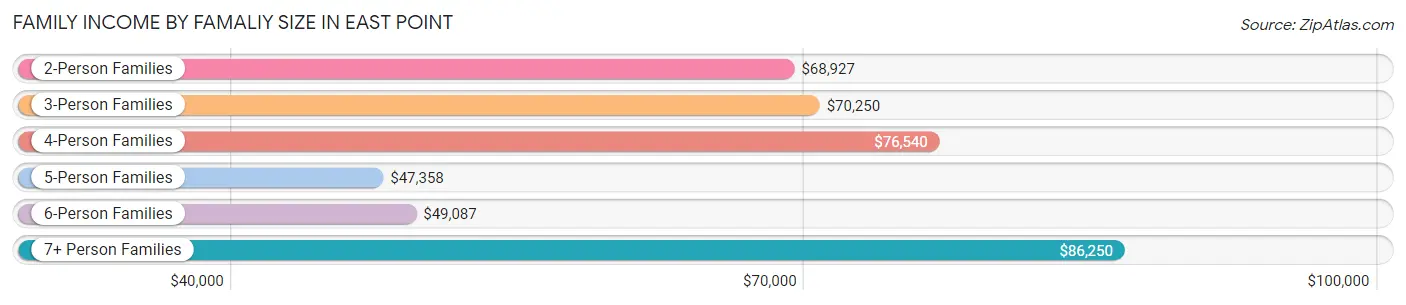
| Income Bracket | # Families | Median Income |
| 2-Person Families | 4,046 (47.8%) | $68,927 |
| 3-Person Families | 2,106 (24.9%) | $70,250 |
| 4-Person Families | 1,197 (14.1%) | $76,540 |
| 5-Person Families | 833 (9.8%) | $47,358 |
| 6-Person Families | 117 (1.4%) | $49,087 |
| 7+ Person Families | 164 (1.9%) | $86,250 |
| Total | 8,463 (100.0%) | $68,299 |
Family Income by Number of Earners in East Point
The median family income in East Point is $68,299, with families comprising 2 earners (3,231) having the highest median family income of $115,384, while families with no earners (829) have the lowest median family income of $31,490, accounting for 38.2% and 9.8% of families, respectively.
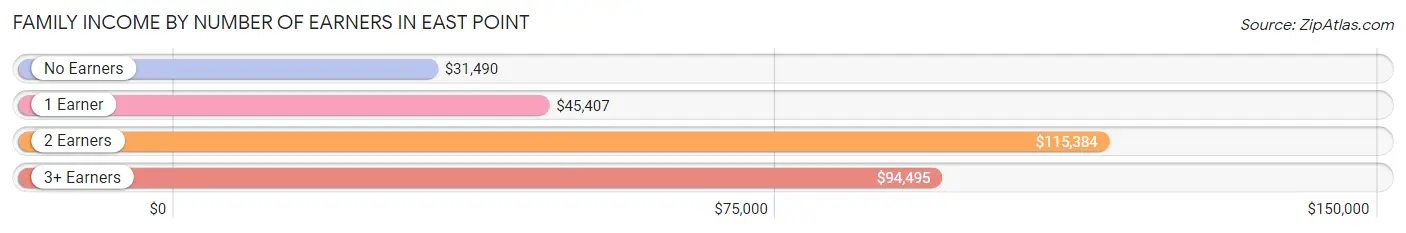
| Number of Earners | # Families | Median Income |
| No Earners | 829 (9.8%) | $31,490 |
| 1 Earner | 3,754 (44.4%) | $45,407 |
| 2 Earners | 3,231 (38.2%) | $115,384 |
| 3+ Earners | 649 (7.7%) | $94,495 |
| Total | 8,463 (100.0%) | $68,299 |
Household Income in East Point
Household Income Brackets in East Point
With 2,907 households falling in the category, the $50,000 to $74,999 income range is the most frequent in East Point, accounting for 18.1% of all households. In contrast, only 675 households (4.2%) fall into the $200,000+ income bracket, making it the least populous group.
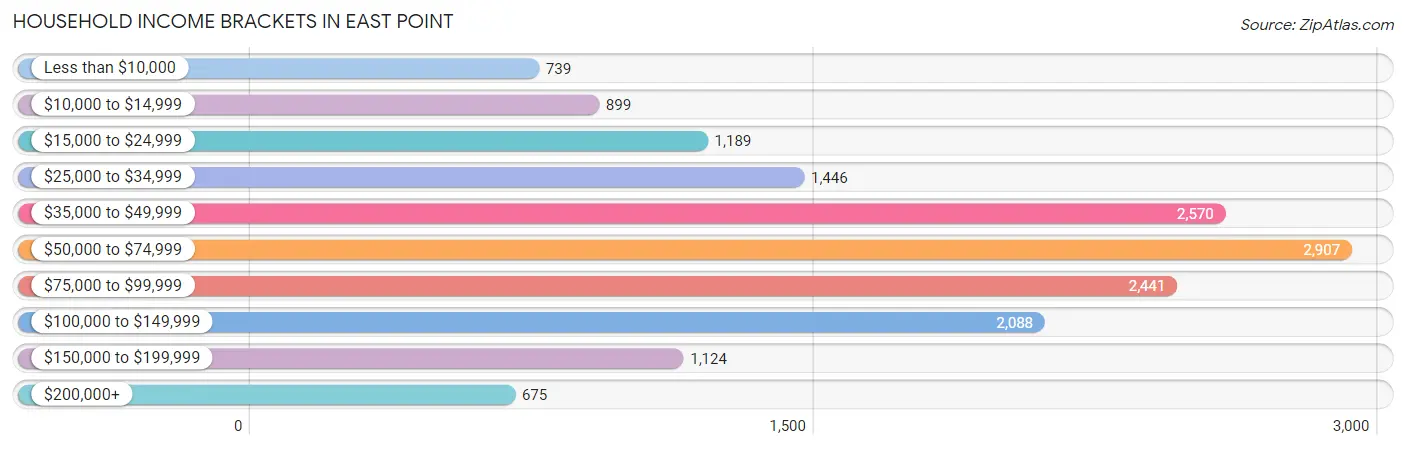
| Income Bracket | # Households | % Households |
| Less than $10,000 | 739 | 4.6% |
| $10,000 to $14,999 | 899 | 5.6% |
| $15,000 to $24,999 | 1,189 | 7.4% |
| $25,000 to $34,999 | 1,446 | 9.0% |
| $35,000 to $49,999 | 2,570 | 16.0% |
| $50,000 to $74,999 | 2,907 | 18.1% |
| $75,000 to $99,999 | 2,441 | 15.2% |
| $100,000 to $149,999 | 2,088 | 13.0% |
| $150,000 to $199,999 | 1,124 | 7.0% |
| $200,000+ | 675 | 4.2% |
Household Income by Householder Age in East Point
The median household income in East Point is $59,602, with the highest median household income of $69,030 found in the 45 to 64 years age bracket for the primary householder. A total of 5,784 households (36.0%) fall into this category. Meanwhile, the 65+ years age bracket for the primary householder has the lowest median household income of $47,047, with 2,769 households (17.2%) in this group.
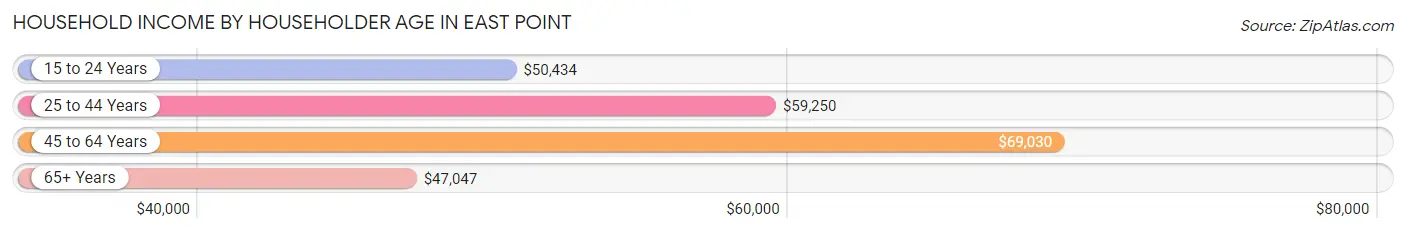
| Income Bracket | # Households | Median Income |
| 15 to 24 Years | 607 (3.8%) | $50,434 |
| 25 to 44 Years | 6,902 (43.0%) | $59,250 |
| 45 to 64 Years | 5,784 (36.0%) | $69,030 |
| 65+ Years | 2,769 (17.2%) | $47,047 |
| Total | 16,062 (100.0%) | $59,602 |
Poverty in East Point
Income Below Poverty by Sex and Age in East Point
With 20.3% poverty level for males and 19.3% for females among the residents of East Point, 5 year old males and 6 to 11 year old females are the most vulnerable to poverty, with 225 males (71.7%) and 746 females (49.3%) in their respective age groups living below the poverty level.
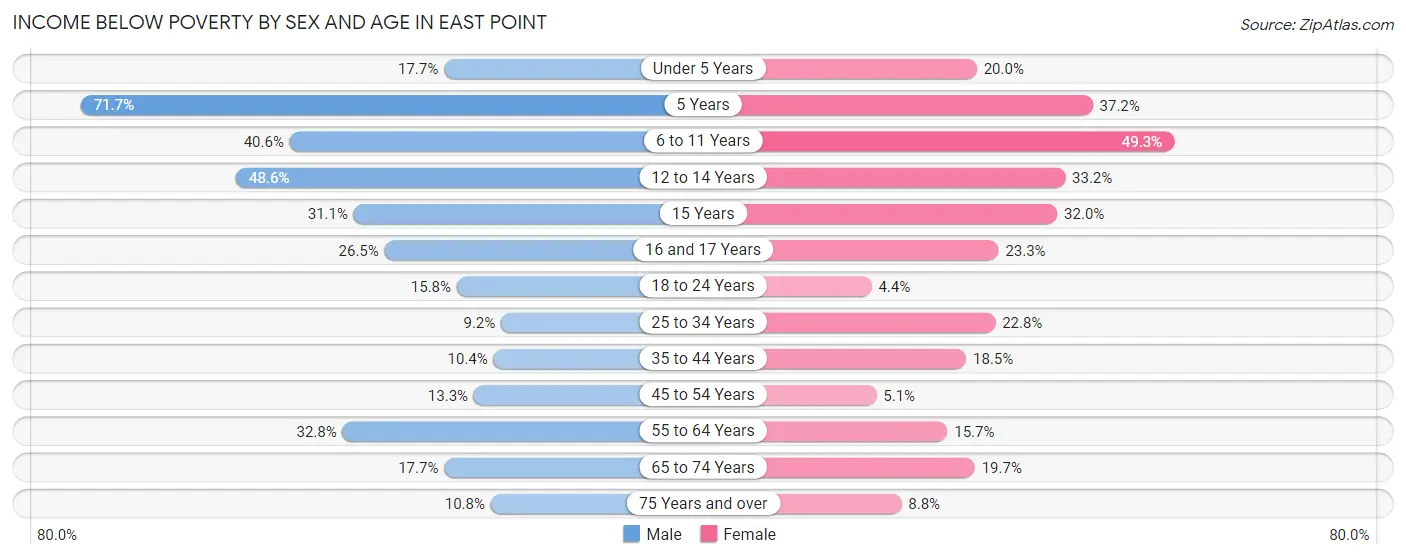
| Age Bracket | Male | Female |
| Under 5 Years | 257 (17.7%) | 201 (20.0%) |
| 5 Years | 225 (71.7%) | 89 (37.2%) |
| 6 to 11 Years | 707 (40.6%) | 746 (49.3%) |
| 12 to 14 Years | 274 (48.6%) | 310 (33.2%) |
| 15 Years | 108 (31.1%) | 63 (32.0%) |
| 16 and 17 Years | 43 (26.5%) | 124 (23.3%) |
| 18 to 24 Years | 234 (15.8%) | 71 (4.4%) |
| 25 to 34 Years | 309 (9.2%) | 811 (22.8%) |
| 35 to 44 Years | 247 (10.4%) | 595 (18.5%) |
| 45 to 54 Years | 324 (13.3%) | 133 (5.1%) |
| 55 to 64 Years | 624 (32.8%) | 365 (15.7%) |
| 65 to 74 Years | 208 (17.7%) | 284 (19.7%) |
| 75 Years and over | 50 (10.8%) | 75 (8.8%) |
| Total | 3,610 (20.3%) | 3,867 (19.3%) |
Income Above Poverty by Sex and Age in East Point
According to the poverty statistics in East Point, males aged 25 to 34 years and females aged 18 to 24 years are the age groups that are most secure financially, with 90.8% of males and 95.6% of females in these age groups living above the poverty line.
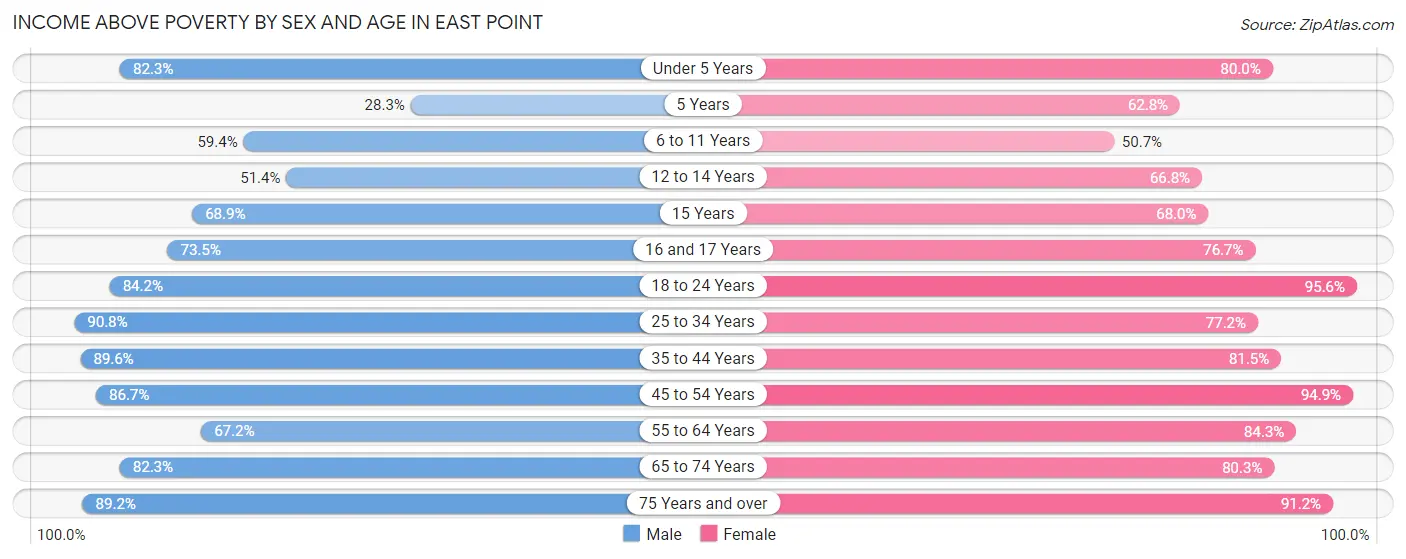
| Age Bracket | Male | Female |
| Under 5 Years | 1,193 (82.3%) | 802 (80.0%) |
| 5 Years | 89 (28.3%) | 150 (62.8%) |
| 6 to 11 Years | 1,033 (59.4%) | 767 (50.7%) |
| 12 to 14 Years | 290 (51.4%) | 625 (66.8%) |
| 15 Years | 239 (68.9%) | 134 (68.0%) |
| 16 and 17 Years | 119 (73.5%) | 409 (76.7%) |
| 18 to 24 Years | 1,246 (84.2%) | 1,543 (95.6%) |
| 25 to 34 Years | 3,034 (90.8%) | 2,749 (77.2%) |
| 35 to 44 Years | 2,134 (89.6%) | 2,628 (81.5%) |
| 45 to 54 Years | 2,115 (86.7%) | 2,460 (94.9%) |
| 55 to 64 Years | 1,279 (67.2%) | 1,965 (84.3%) |
| 65 to 74 Years | 968 (82.3%) | 1,155 (80.3%) |
| 75 Years and over | 414 (89.2%) | 773 (91.2%) |
| Total | 14,153 (79.7%) | 16,160 (80.7%) |
Income Below Poverty Among Married-Couple Families in East Point
The poverty statistics for married-couple families in East Point show that 7.4% or 251 of the total 3,407 families live below the poverty line. Families with 5 or more children have the highest poverty rate of 63.6%, comprising of 49 families. On the other hand, families with no children have the lowest poverty rate of 3.5%, which includes 75 families.
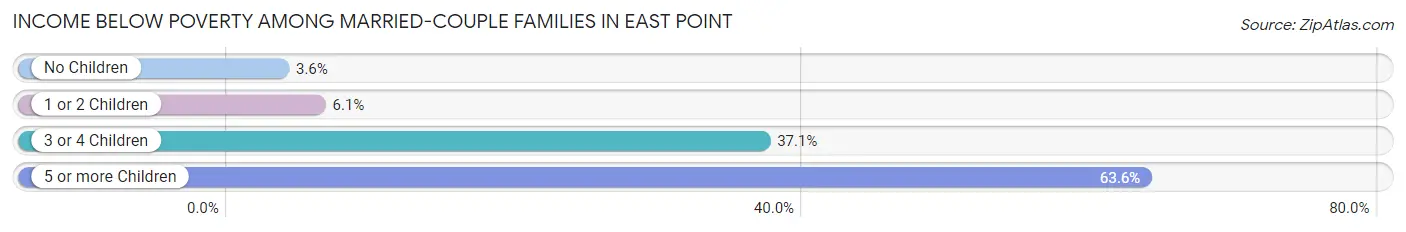
| Children | Above Poverty | Below Poverty |
| No Children | 2,036 (96.5%) | 75 (3.5%) |
| 1 or 2 Children | 985 (93.9%) | 64 (6.1%) |
| 3 or 4 Children | 107 (62.9%) | 63 (37.1%) |
| 5 or more Children | 28 (36.4%) | 49 (63.6%) |
| Total | 3,156 (92.6%) | 251 (7.4%) |
Income Below Poverty Among Single-Parent Households in East Point
According to the poverty data in East Point, 12.9% or 107 single-father households and 22.6% or 957 single-mother households are living below the poverty line. Among single-father households, those with 3 or 4 children have the highest poverty rate, with 26 households (28.0%) experiencing poverty. Likewise, among single-mother households, those with 3 or 4 children have the highest poverty rate, with 468 households (66.3%) falling below the poverty line.
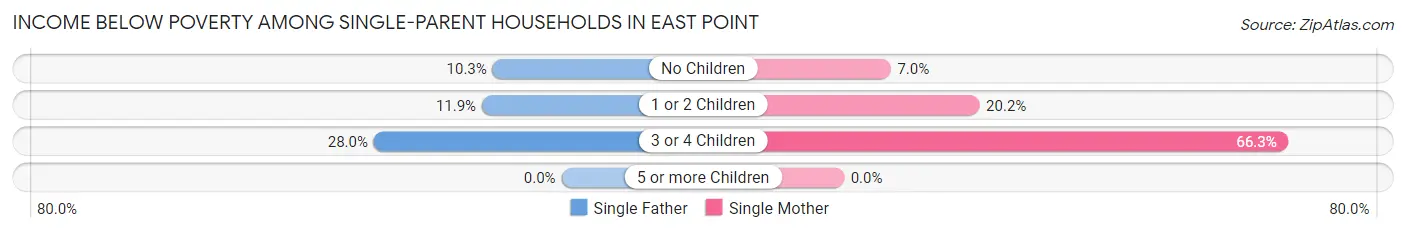
| Children | Single Father | Single Mother |
| No Children | 40 (10.3%) | 115 (7.0%) |
| 1 or 2 Children | 41 (11.8%) | 374 (20.2%) |
| 3 or 4 Children | 26 (28.0%) | 468 (66.3%) |
| 5 or more Children | 0 (0.0%) | 0 (0.0%) |
| Total | 107 (12.9%) | 957 (22.6%) |
Income Below Poverty Among Married-Couple vs Single-Parent Households in East Point
The poverty data for East Point shows that 251 of the married-couple family households (7.4%) and 1,064 of the single-parent households (21.0%) are living below the poverty level. Within the married-couple family households, those with 5 or more children have the highest poverty rate, with 49 households (63.6%) falling below the poverty line. Among the single-parent households, those with 3 or 4 children have the highest poverty rate, with 494 household (61.8%) living below poverty.
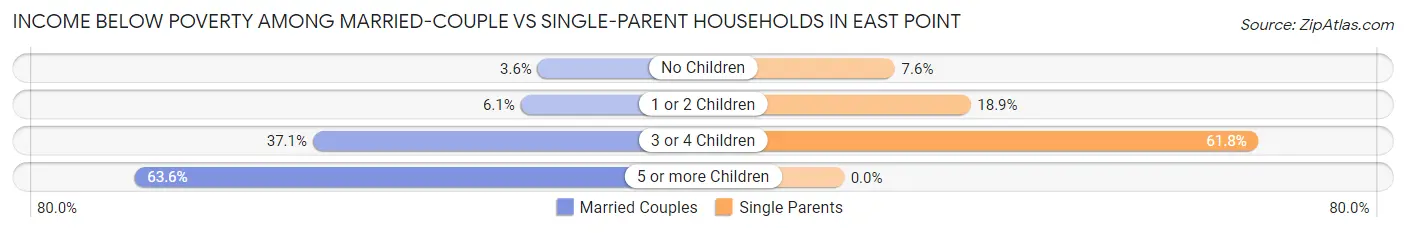
| Children | Married-Couple Families | Single-Parent Households |
| No Children | 75 (3.5%) | 155 (7.6%) |
| 1 or 2 Children | 64 (6.1%) | 415 (18.9%) |
| 3 or 4 Children | 63 (37.1%) | 494 (61.8%) |
| 5 or more Children | 49 (63.6%) | 0 (0.0%) |
| Total | 251 (7.4%) | 1,064 (21.0%) |
Race in East Point
The most populous races in East Point are Black / African American (29,115 | 76.4%), White / Caucasian (5,632 | 14.8%), and Hispanic or Latino (3,289 | 8.6%).
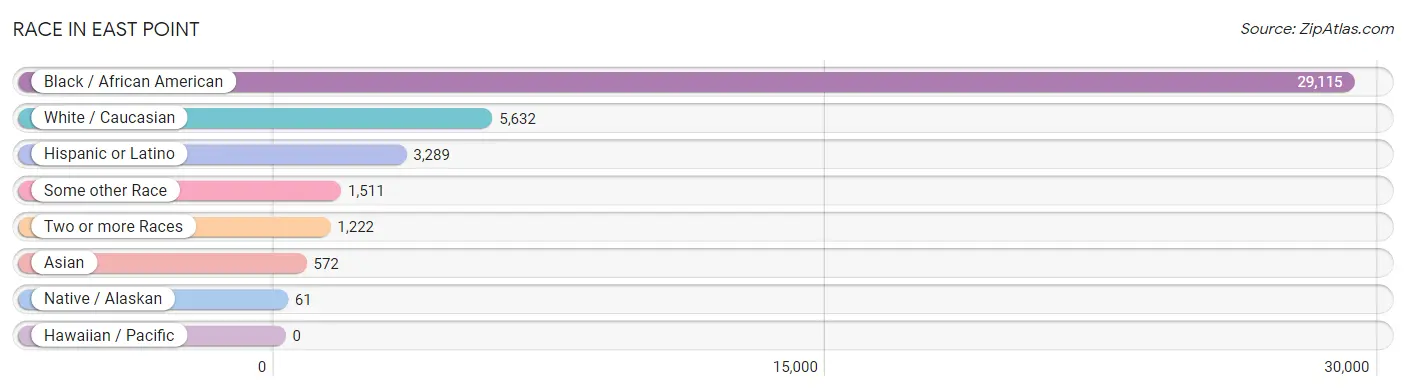
| Race | # Population | % Population |
| Asian | 572 | 1.5% |
| Black / African American | 29,115 | 76.4% |
| Hawaiian / Pacific | 0 | 0.0% |
| Hispanic or Latino | 3,289 | 8.6% |
| Native / Alaskan | 61 | 0.2% |
| White / Caucasian | 5,632 | 14.8% |
| Two or more Races | 1,222 | 3.2% |
| Some other Race | 1,511 | 4.0% |
| Total | 38,113 | 100.0% |
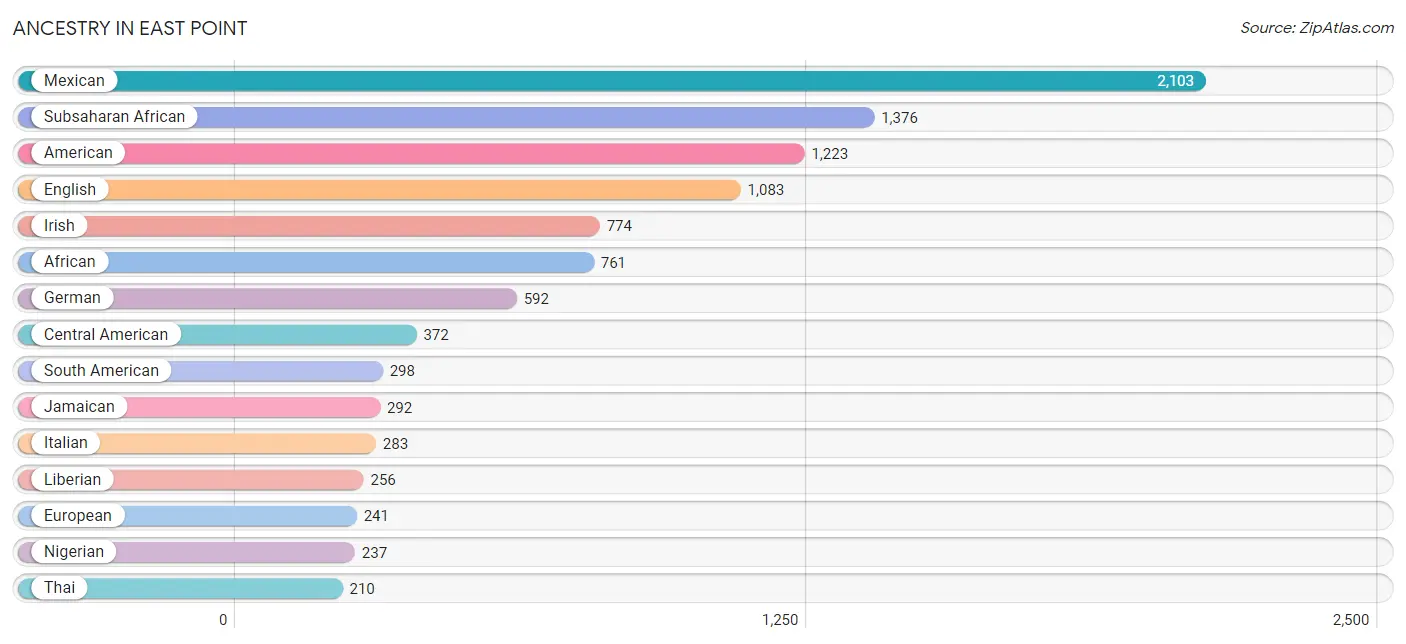
Ancestry in East Point
The most populous ancestries reported in East Point are Mexican (2,103 | 5.5%), Subsaharan African (1,376 | 3.6%), American (1,223 | 3.2%), English (1,083 | 2.8%), and Irish (774 | 2.0%), together accounting for 17.2% of all East Point residents.
| Ancestry | # Population | % Population |
| African | 761 | 2.0% |
| American | 1,223 | 3.2% |
| Arab | 39 | 0.1% |
| Argentinean | 64 | 0.2% |
| Armenian | 8 | 0.0% |
| Australian | 40 | 0.1% |
| Austrian | 15 | 0.0% |
| Bahamian | 23 | 0.1% |
| Belgian | 14 | 0.0% |
| Belizean | 11 | 0.0% |
| Bermudan | 9 | 0.0% |
| Bhutanese | 24 | 0.1% |
| British | 68 | 0.2% |
| Burmese | 66 | 0.2% |
| Canadian | 7 | 0.0% |
| Central American | 372 | 1.0% |
| Cherokee | 54 | 0.1% |
| Choctaw | 16 | 0.0% |
| Colombian | 185 | 0.5% |
| Costa Rican | 59 | 0.2% |
| Croatian | 17 | 0.0% |
| Cuban | 58 | 0.2% |
| Czech | 4 | 0.0% |
| Dominican | 122 | 0.3% |
| Dutch | 83 | 0.2% |
| Dutch West Indian | 19 | 0.1% |
| Eastern European | 6 | 0.0% |
| Egyptian | 33 | 0.1% |
| English | 1,083 | 2.8% |
| European | 241 | 0.6% |
| French | 205 | 0.5% |
| French Canadian | 38 | 0.1% |
| German | 592 | 1.5% |
| Greek | 70 | 0.2% |
| Guatemalan | 53 | 0.1% |
| Guyanese | 23 | 0.1% |
| Haitian | 52 | 0.1% |
| Honduran | 36 | 0.1% |
| Hungarian | 9 | 0.0% |
| Indian (Asian) | 105 | 0.3% |
| Irish | 774 | 2.0% |
| Iroquois | 1 | 0.0% |
| Italian | 283 | 0.7% |
| Jamaican | 292 | 0.8% |
| Korean | 204 | 0.5% |
| Lebanese | 6 | 0.0% |
| Liberian | 256 | 0.7% |
| Mexican | 2,103 | 5.5% |
| Mexican American Indian | 37 | 0.1% |
| Nicaraguan | 158 | 0.4% |
| Nigerian | 237 | 0.6% |
| Norwegian | 56 | 0.2% |
| Pakistani | 16 | 0.0% |
| Panamanian | 12 | 0.0% |
| Polish | 42 | 0.1% |
| Portuguese | 203 | 0.5% |
| Puerto Rican | 186 | 0.5% |
| Romanian | 27 | 0.1% |
| Russian | 148 | 0.4% |
| Salvadoran | 54 | 0.1% |
| Scandinavian | 60 | 0.2% |
| Scotch-Irish | 36 | 0.1% |
| Scottish | 75 | 0.2% |
| Senegalese | 11 | 0.0% |
| Sierra Leonean | 77 | 0.2% |
| South American | 298 | 0.8% |
| Spanish | 11 | 0.0% |
| Sri Lankan | 62 | 0.2% |
| Subsaharan African | 1,376 | 3.6% |
| Sudanese | 27 | 0.1% |
| Swedish | 108 | 0.3% |
| Swiss | 7 | 0.0% |
| Thai | 210 | 0.5% |
| Ukrainian | 27 | 0.1% |
| Uruguayan | 13 | 0.0% |
| Venezuelan | 36 | 0.1% |
| Welsh | 76 | 0.2% | View All 77 Rows |
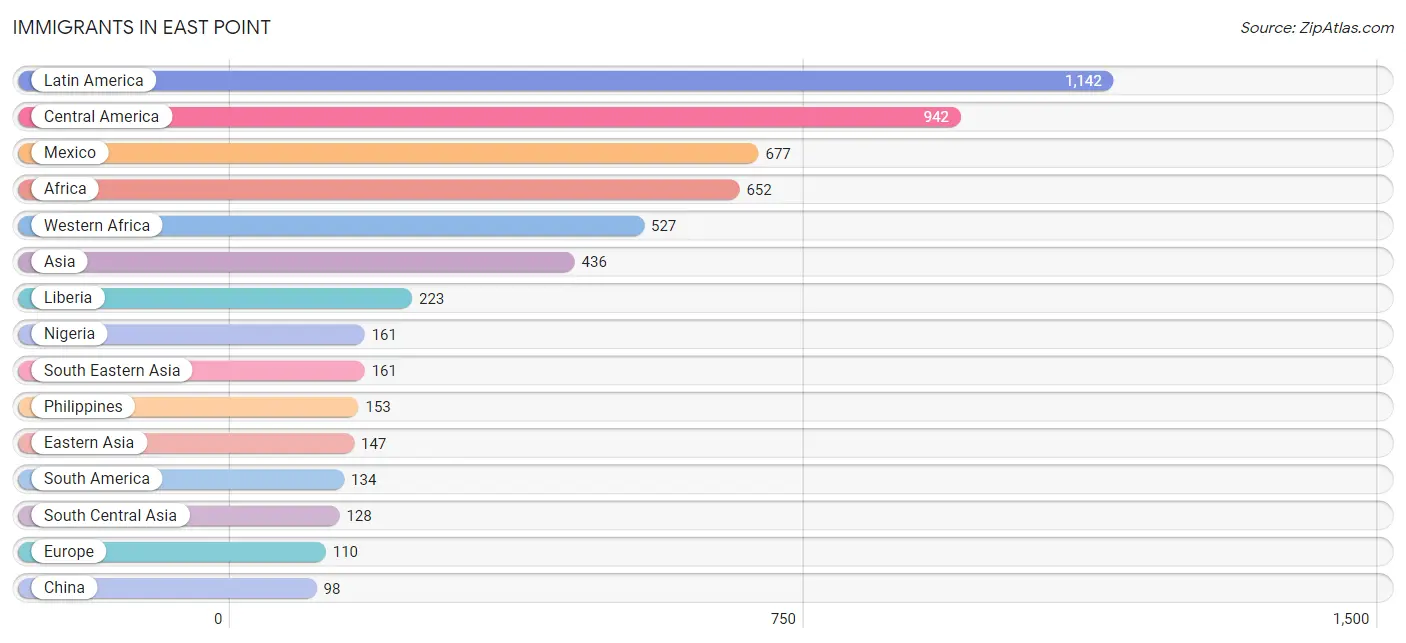
Immigrants in East Point
The most numerous immigrant groups reported in East Point came from Latin America (1,142 | 3.0%), Central America (942 | 2.5%), Mexico (677 | 1.8%), Africa (652 | 1.7%), and Western Africa (527 | 1.4%), together accounting for 10.3% of all East Point residents.
| Immigration Origin | # Population | % Population |
| Africa | 652 | 1.7% |
| Asia | 436 | 1.1% |
| Australia | 19 | 0.1% |
| Bahamas | 23 | 0.1% |
| Belize | 11 | 0.0% |
| Bolivia | 7 | 0.0% |
| Canada | 46 | 0.1% |
| Caribbean | 66 | 0.2% |
| Central America | 942 | 2.5% |
| China | 98 | 0.3% |
| Colombia | 91 | 0.2% |
| Costa Rica | 59 | 0.2% |
| Eastern Asia | 147 | 0.4% |
| Eastern Europe | 34 | 0.1% |
| Egypt | 86 | 0.2% |
| Europe | 110 | 0.3% |
| France | 4 | 0.0% |
| Germany | 41 | 0.1% |
| Guatemala | 66 | 0.2% |
| Honduras | 62 | 0.2% |
| India | 35 | 0.1% |
| Jamaica | 43 | 0.1% |
| Korea | 49 | 0.1% |
| Latin America | 1,142 | 3.0% |
| Liberia | 223 | 0.6% |
| Mexico | 677 | 1.8% |
| Nicaragua | 55 | 0.1% |
| Nigeria | 161 | 0.4% |
| Northern Africa | 86 | 0.2% |
| Northern Europe | 20 | 0.1% |
| Oceania | 19 | 0.1% |
| Pakistan | 93 | 0.2% |
| Panama | 12 | 0.0% |
| Philippines | 153 | 0.4% |
| Russia | 34 | 0.1% |
| Senegal | 44 | 0.1% |
| South Africa | 39 | 0.1% |
| South America | 134 | 0.4% |
| South Central Asia | 128 | 0.3% |
| South Eastern Asia | 161 | 0.4% |
| Thailand | 8 | 0.0% |
| Venezuela | 36 | 0.1% |
| Western Africa | 527 | 1.4% |
| Western Europe | 45 | 0.1% | View All 44 Rows |
Sex and Age in East Point
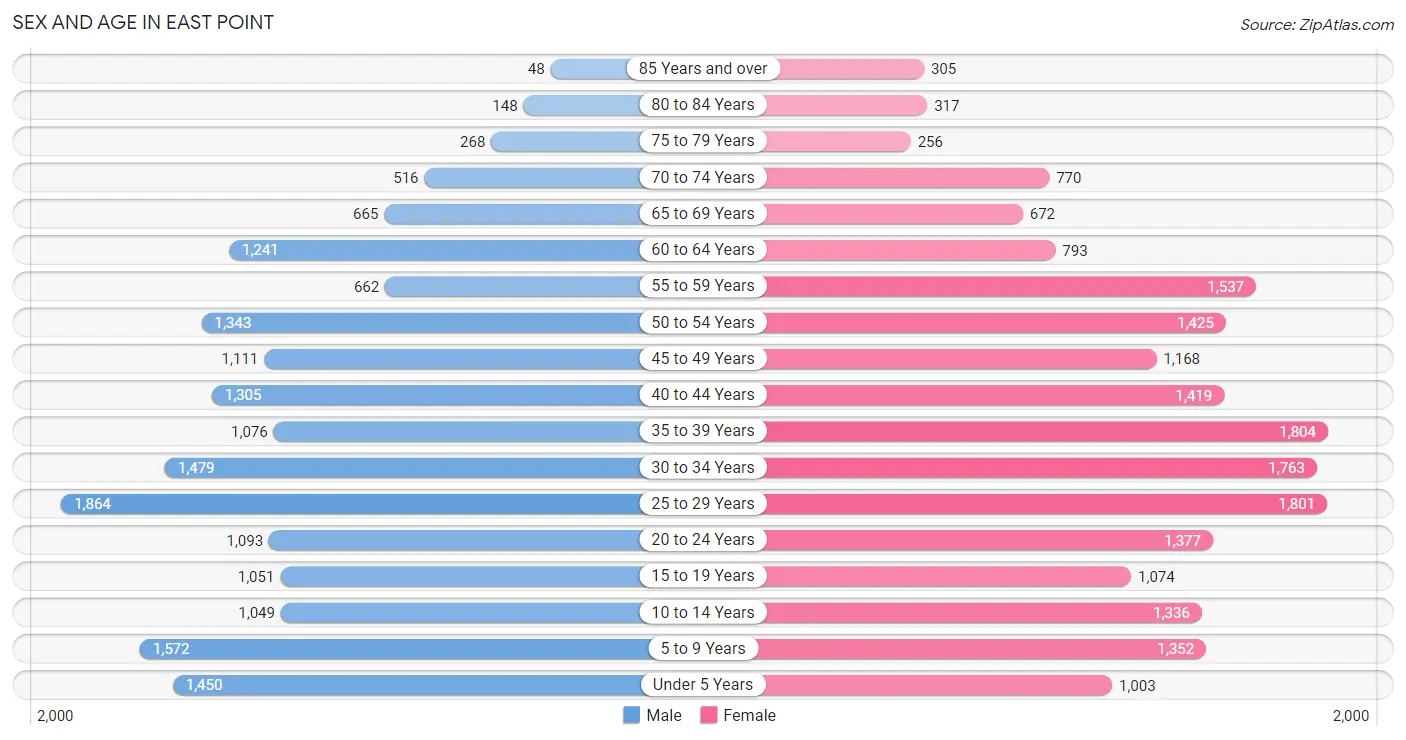
Sex and Age in East Point
The most populous age groups in East Point are 25 to 29 Years (1,864 | 10.4%) for men and 35 to 39 Years (1,804 | 8.9%) for women.
| Age Bracket | Male | Female |
| Under 5 Years | 1,450 (8.1%) | 1,003 (5.0%) |
| 5 to 9 Years | 1,572 (8.8%) | 1,352 (6.7%) |
| 10 to 14 Years | 1,049 (5.9%) | 1,336 (6.6%) |
| 15 to 19 Years | 1,051 (5.9%) | 1,074 (5.3%) |
| 20 to 24 Years | 1,093 (6.1%) | 1,377 (6.8%) |
| 25 to 29 Years | 1,864 (10.4%) | 1,801 (8.9%) |
| 30 to 34 Years | 1,479 (8.2%) | 1,763 (8.7%) |
| 35 to 39 Years | 1,076 (6.0%) | 1,804 (8.9%) |
| 40 to 44 Years | 1,305 (7.3%) | 1,419 (7.0%) |
| 45 to 49 Years | 1,111 (6.2%) | 1,168 (5.8%) |
| 50 to 54 Years | 1,343 (7.5%) | 1,425 (7.1%) |
| 55 to 59 Years | 662 (3.7%) | 1,537 (7.6%) |
| 60 to 64 Years | 1,241 (6.9%) | 793 (3.9%) |
| 65 to 69 Years | 665 (3.7%) | 672 (3.3%) |
| 70 to 74 Years | 516 (2.9%) | 770 (3.8%) |
| 75 to 79 Years | 268 (1.5%) | 256 (1.3%) |
| 80 to 84 Years | 148 (0.8%) | 317 (1.6%) |
| 85 Years and over | 48 (0.3%) | 305 (1.5%) |
| Total | 17,941 (100.0%) | 20,172 (100.0%) |
Families and Households in East Point
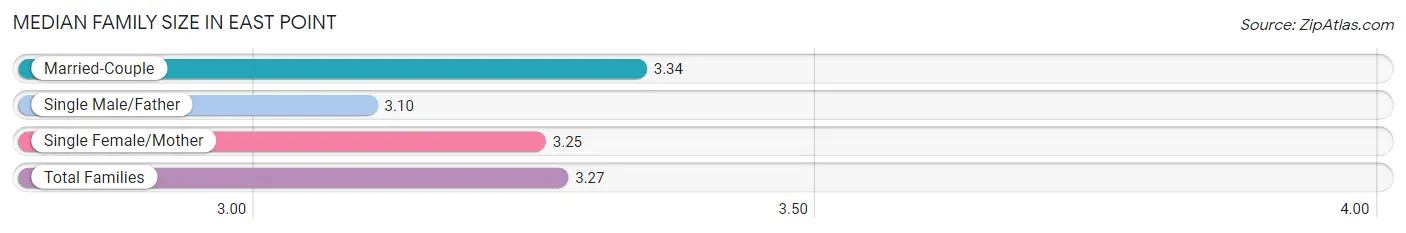
Median Family Size in East Point
The median family size in East Point is 3.27 persons per family, with married-couple families (3,407 | 40.3%) accounting for the largest median family size of 3.34 persons per family. On the other hand, single male/father families (829 | 9.8%) represent the smallest median family size with 3.10 persons per family.
| Family Type | # Families | Family Size |
| Married-Couple | 3,407 (40.3%) | 3.34 |
| Single Male/Father | 829 (9.8%) | 3.10 |
| Single Female/Mother | 4,227 (49.9%) | 3.25 |
| Total Families | 8,463 (100.0%) | 3.27 |
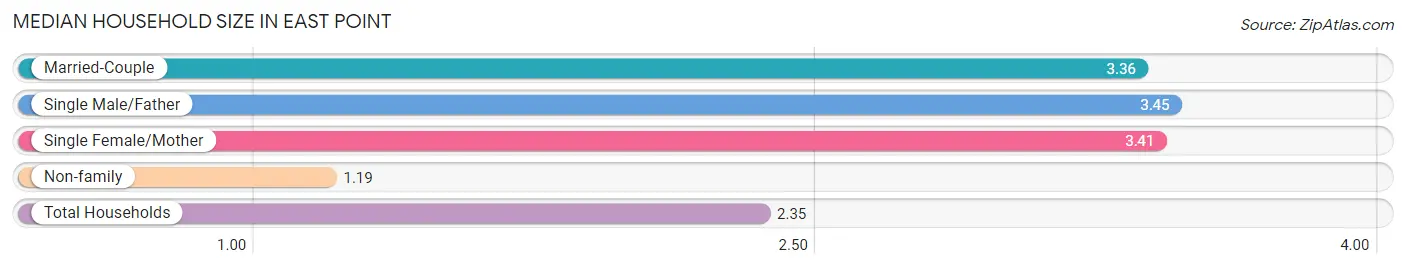
Median Household Size in East Point
The median household size in East Point is 2.35 persons per household, with single male/father households (829 | 5.2%) accounting for the largest median household size of 3.45 persons per household. non-family households (7,599 | 47.3%) represent the smallest median household size with 1.19 persons per household.
| Household Type | # Households | Household Size |
| Married-Couple | 3,407 (21.2%) | 3.36 |
| Single Male/Father | 829 (5.2%) | 3.45 |
| Single Female/Mother | 4,227 (26.3%) | 3.41 |
| Non-family | 7,599 (47.3%) | 1.19 |
| Total Households | 16,062 (100.0%) | 2.35 |
Household Size by Marriage Status in East Point
Out of a total of 16,062 households in East Point, 8,463 (52.7%) are family households, while 7,599 (47.3%) are nonfamily households. The most numerous type of family households are 2-person households, comprising 3,421, and the most common type of nonfamily households are 1-person households, comprising 6,297.
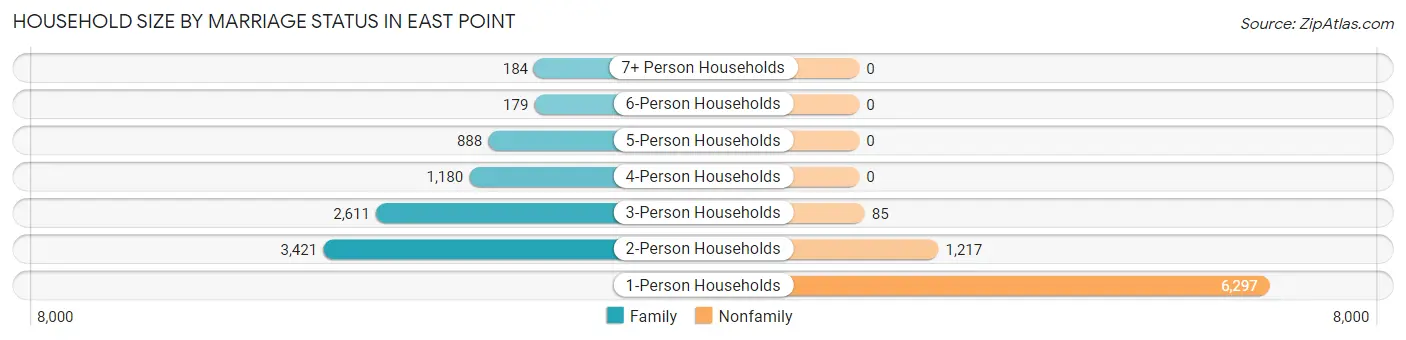
| Household Size | Family Households | Nonfamily Households |
| 1-Person Households | - | 6,297 (39.2%) |
| 2-Person Households | 3,421 (21.3%) | 1,217 (7.6%) |
| 3-Person Households | 2,611 (16.3%) | 85 (0.5%) |
| 4-Person Households | 1,180 (7.3%) | 0 (0.0%) |
| 5-Person Households | 888 (5.5%) | 0 (0.0%) |
| 6-Person Households | 179 (1.1%) | 0 (0.0%) |
| 7+ Person Households | 184 (1.1%) | 0 (0.0%) |
| Total | 8,463 (52.7%) | 7,599 (47.3%) |
Female Fertility in East Point
Fertility by Age in East Point
Average fertility rate in East Point is 57.0 births per 1,000 women. Women in the age bracket of 20 to 34 years have the highest fertility rate with 97.0 births per 1,000 women. Women in the age bracket of 20 to 34 years acount for 77.5% of all women with births.
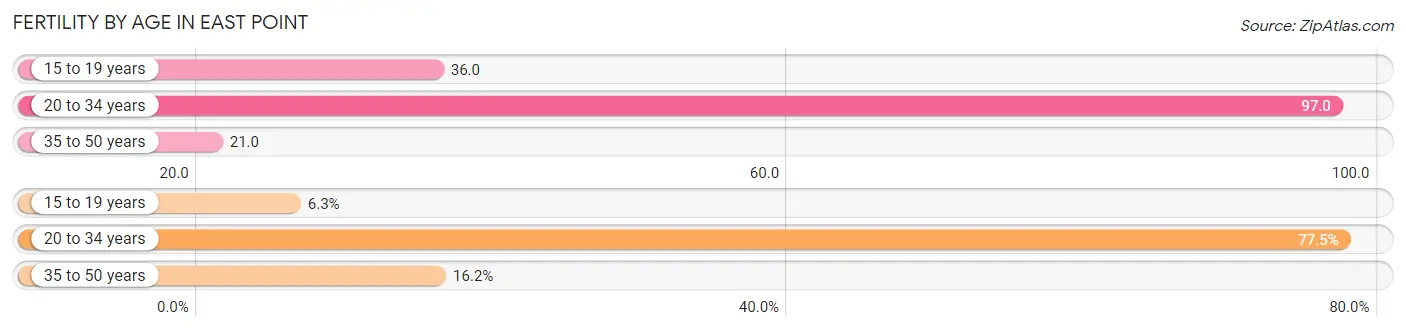
| Age Bracket | Women with Births | Births / 1,000 Women |
| 15 to 19 years | 39 (6.3%) | 36.0 |
| 20 to 34 years | 480 (77.5%) | 97.0 |
| 35 to 50 years | 100 (16.2%) | 21.0 |
| Total | 619 (100.0%) | 57.0 |
Fertility by Age by Marriage Status in East Point
35.2% of women with births (619) in East Point are married. The highest percentage of unmarried women with births falls into 20 to 34 years age bracket with 77.3% of them unmarried at the time of birth, while the lowest percentage of unmarried women with births belong to 35 to 50 years age bracket with 0.0% of them unmarried.
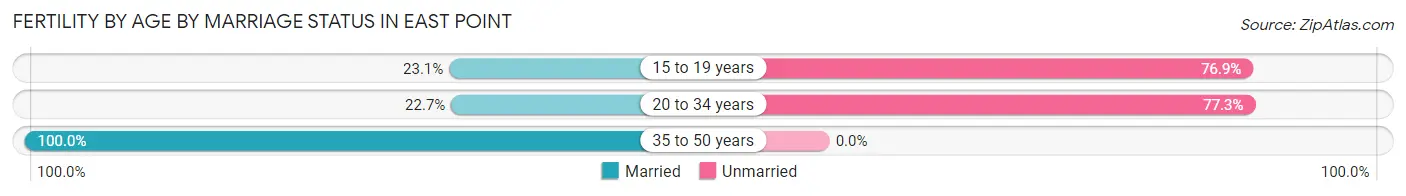
| Age Bracket | Married | Unmarried |
| 15 to 19 years | 9 (23.1%) | 30 (76.9%) |
| 20 to 34 years | 109 (22.7%) | 371 (77.3%) |
| 35 to 50 years | 100 (100.0%) | 0 (0.0%) |
| Total | 218 (35.2%) | 401 (64.8%) |
Fertility by Education in East Point
Average fertility rate in East Point is 57.0 births per 1,000 women. Women with the education attainment of college or associate's degree have the highest fertility rate of 119.0 births per 1,000 women, while women with the education attainment of less than high school have the lowest fertility at 22.0 births per 1,000 women. Women with the education attainment of college or associate's degree represent 50.7% of all women with births.
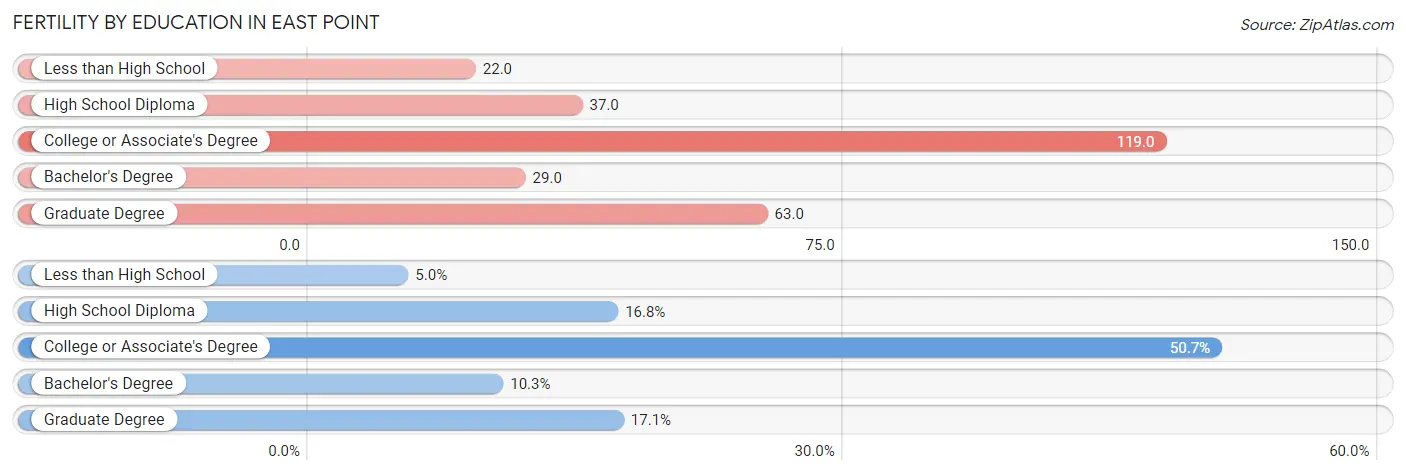
| Educational Attainment | Women with Births | Births / 1,000 Women |
| Less than High School | 31 (5.0%) | 22.0 |
| High School Diploma | 104 (16.8%) | 37.0 |
| College or Associate's Degree | 314 (50.7%) | 119.0 |
| Bachelor's Degree | 64 (10.3%) | 29.0 |
| Graduate Degree | 106 (17.1%) | 63.0 |
| Total | 619 (100.0%) | 57.0 |
Fertility by Education by Marriage Status in East Point
64.8% of women with births in East Point are unmarried. Women with the educational attainment of graduate degree are most likely to be married with 76.4% of them married at childbirth, while women with the educational attainment of bachelor's degree are least likely to be married with 100.0% of them unmarried at childbirth.
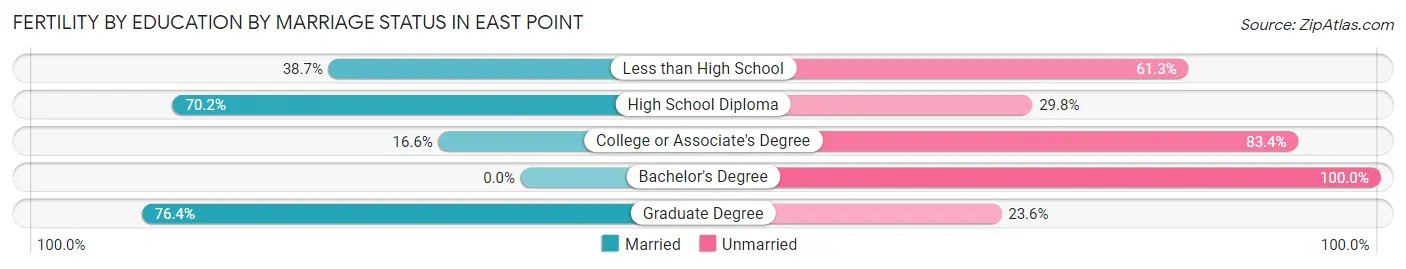
| Educational Attainment | Married | Unmarried |
| Less than High School | 12 (38.7%) | 19 (61.3%) |
| High School Diploma | 73 (70.2%) | 31 (29.8%) |
| College or Associate's Degree | 52 (16.6%) | 262 (83.4%) |
| Bachelor's Degree | 0 (0.0%) | 64 (100.0%) |
| Graduate Degree | 81 (76.4%) | 25 (23.6%) |
| Total | 218 (35.2%) | 401 (64.8%) |
Employment Characteristics in East Point
Employment by Class of Employer in East Point
Among the 19,212 employed individuals in East Point, private company employees (13,859 | 72.1%), not-for-profit organizations (1,274 | 6.6%), and local government employees (1,147 | 6.0%) make up the most common classes of employment.
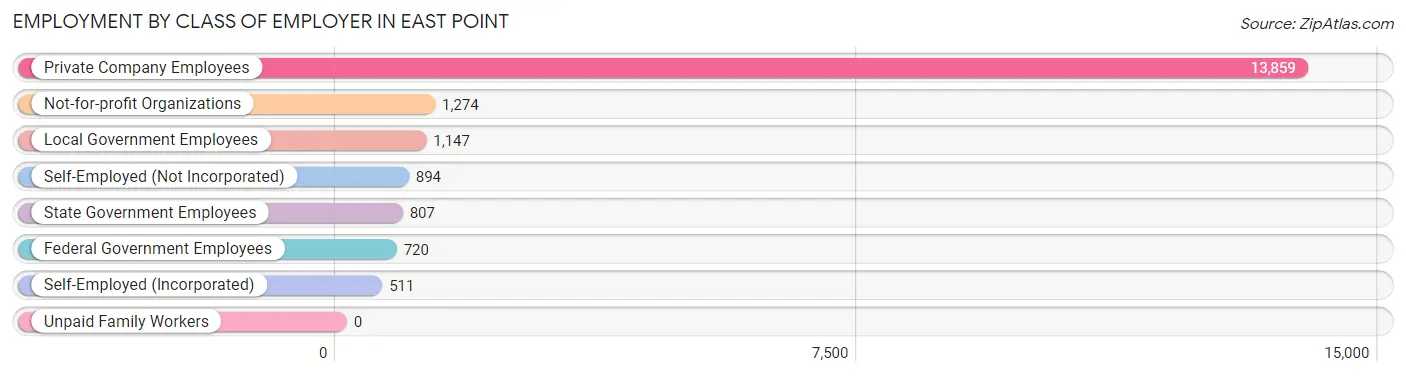
| Employer Class | # Employees | % Employees |
| Private Company Employees | 13,859 | 72.1% |
| Self-Employed (Incorporated) | 511 | 2.7% |
| Self-Employed (Not Incorporated) | 894 | 4.6% |
| Not-for-profit Organizations | 1,274 | 6.6% |
| Local Government Employees | 1,147 | 6.0% |
| State Government Employees | 807 | 4.2% |
| Federal Government Employees | 720 | 3.7% |
| Unpaid Family Workers | 0 | 0.0% |
| Total | 19,212 | 100.0% |
Employment Status by Age in East Point
According to the labor force statistics for East Point, out of the total population over 16 years of age (29,806), 71.4% or 21,281 individuals are in the labor force, with 7.1% or 1,511 of them unemployed. The age group with the highest labor force participation rate is 30 to 34 years, with 93.6% or 3,035 individuals in the labor force. Within the labor force, the 20 to 24 years age range has the highest percentage of unemployed individuals, with 20.5% or 405 of them being unemployed.
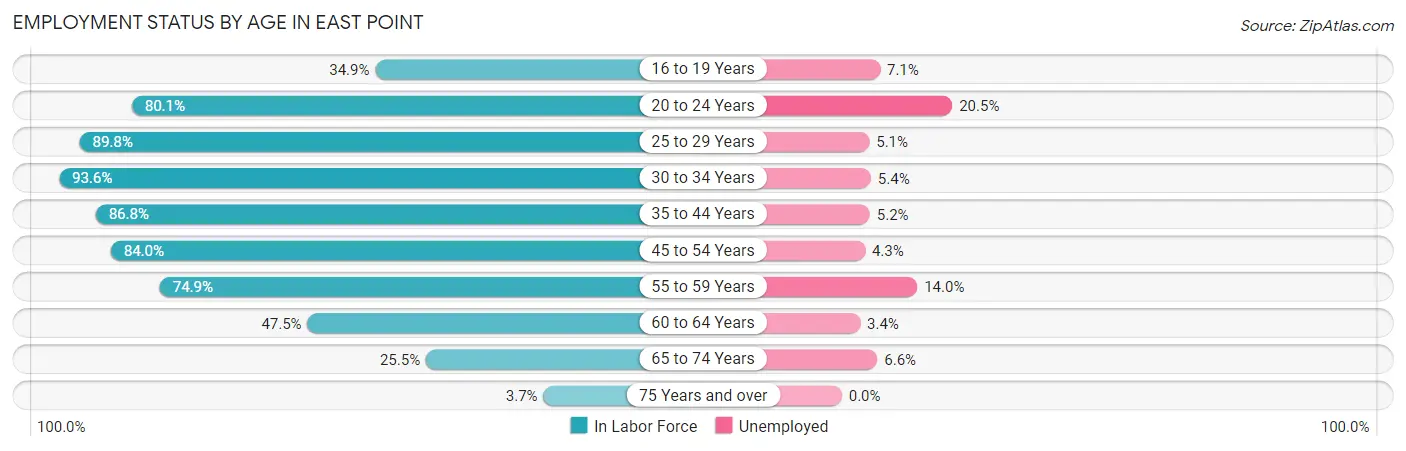
| Age Bracket | In Labor Force | Unemployed |
| 16 to 19 Years | 551 (34.9%) | 39 (7.1%) |
| 20 to 24 Years | 1,978 (80.1%) | 405 (20.5%) |
| 25 to 29 Years | 3,291 (89.8%) | 168 (5.1%) |
| 30 to 34 Years | 3,035 (93.6%) | 164 (5.4%) |
| 35 to 44 Years | 4,864 (86.8%) | 253 (5.2%) |
| 45 to 54 Years | 4,239 (84.0%) | 182 (4.3%) |
| 55 to 59 Years | 1,647 (74.9%) | 231 (14.0%) |
| 60 to 64 Years | 966 (47.5%) | 33 (3.4%) |
| 65 to 74 Years | 669 (25.5%) | 44 (6.6%) |
| 75 Years and over | 50 (3.7%) | 0 (0.0%) |
| Total | 21,281 (71.4%) | 1,511 (7.1%) |
Employment Status by Educational Attainment in East Point
According to labor force statistics for East Point, 82.8% of individuals (18,043) out of the total population between 25 and 64 years of age (21,791) are in the labor force, with 5.7% or 1,028 of them being unemployed. The group with the highest labor force participation rate are those with the educational attainment of bachelor's degree or higher, with 91.6% or 7,424 individuals in the labor force. Within the labor force, individuals with less than high school education have the highest percentage of unemployment, with 9.8% or 145 of them being unemployed.
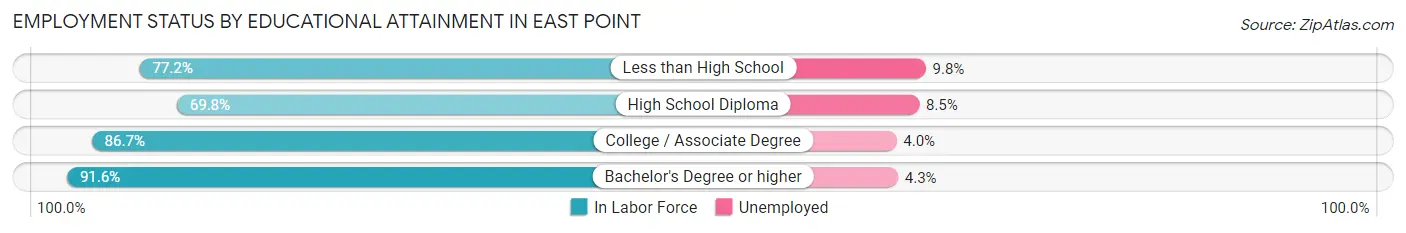
| Educational Attainment | In Labor Force | Unemployed |
| Less than High School | 1,481 (77.2%) | 188 (9.8%) |
| High School Diploma | 4,402 (69.8%) | 536 (8.5%) |
| College / Associate Degree | 4,735 (86.7%) | 218 (4.0%) |
| Bachelor's Degree or higher | 7,424 (91.6%) | 349 (4.3%) |
| Total | 18,043 (82.8%) | 1,242 (5.7%) |
Employment Occupations by Sex in East Point
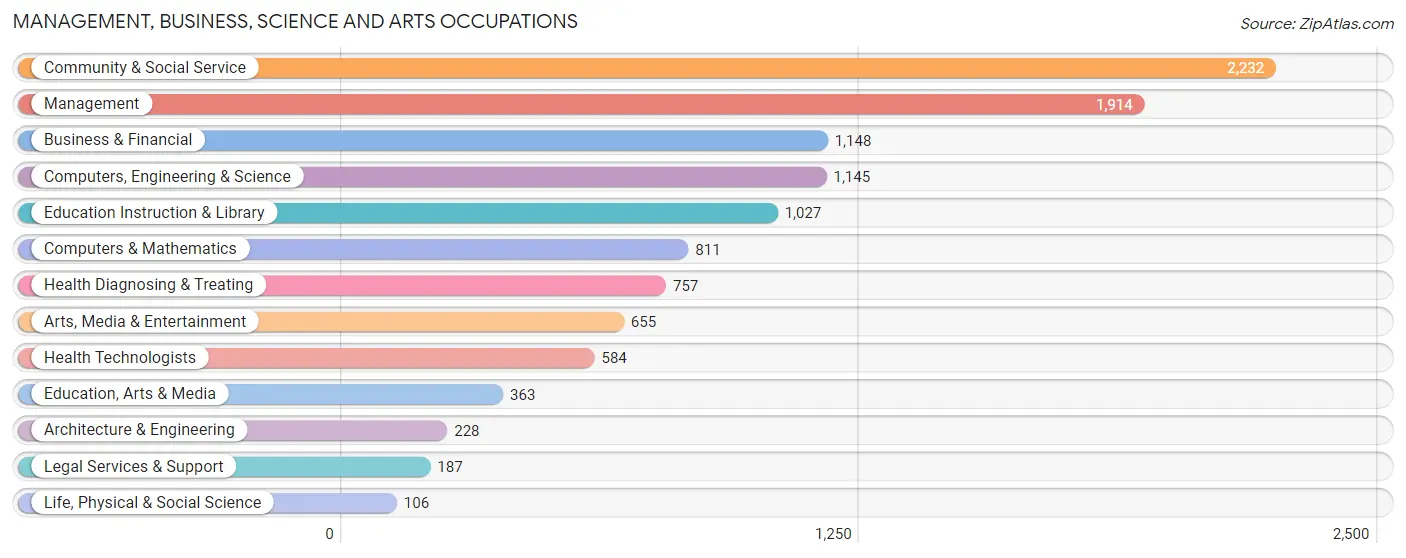
Management, Business, Science and Arts Occupations
The most common Management, Business, Science and Arts occupations in East Point are Community & Social Service (2,232 | 11.3%), Management (1,914 | 9.7%), Business & Financial (1,148 | 5.8%), Computers, Engineering & Science (1,145 | 5.8%), and Education Instruction & Library (1,027 | 5.2%).
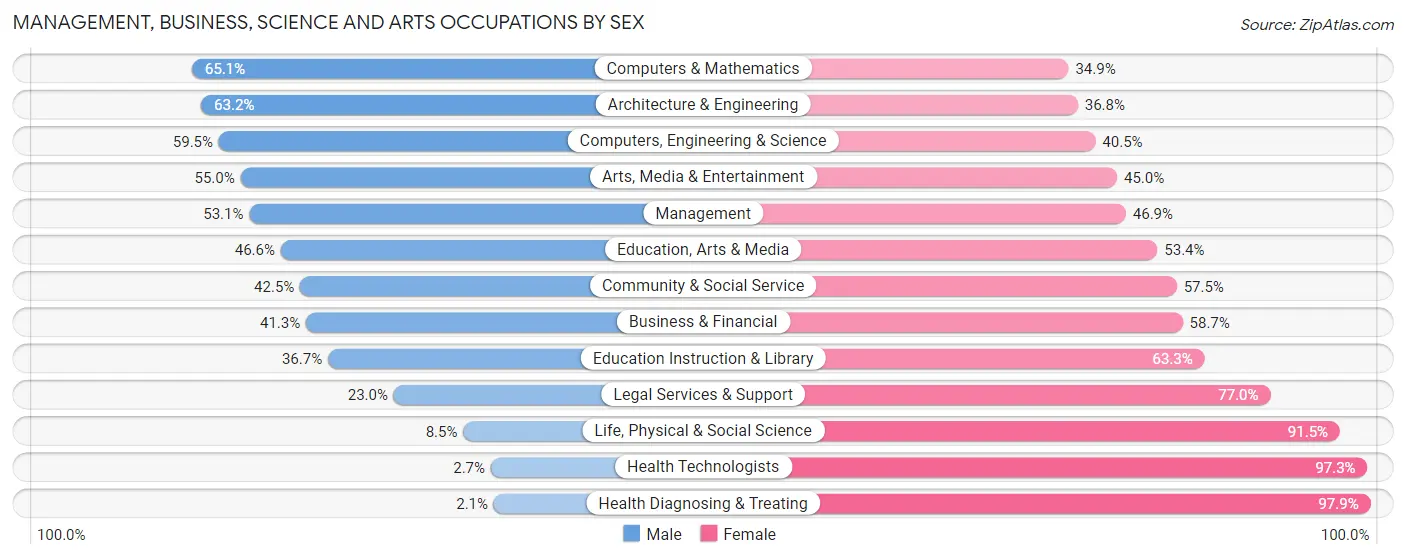
Management, Business, Science and Arts Occupations by Sex
Within the Management, Business, Science and Arts occupations in East Point, the most male-oriented occupations are Computers & Mathematics (65.1%), Architecture & Engineering (63.2%), and Computers, Engineering & Science (59.5%), while the most female-oriented occupations are Health Diagnosing & Treating (97.9%), Health Technologists (97.3%), and Life, Physical & Social Science (91.5%).
| Occupation | Male | Female |
| Management | 1,017 (53.1%) | 897 (46.9%) |
| Business & Financial | 474 (41.3%) | 674 (58.7%) |
| Computers, Engineering & Science | 681 (59.5%) | 464 (40.5%) |
| Computers & Mathematics | 528 (65.1%) | 283 (34.9%) |
| Architecture & Engineering | 144 (63.2%) | 84 (36.8%) |
| Life, Physical & Social Science | 9 (8.5%) | 97 (91.5%) |
| Community & Social Service | 949 (42.5%) | 1,283 (57.5%) |
| Education, Arts & Media | 169 (46.6%) | 194 (53.4%) |
| Legal Services & Support | 43 (23.0%) | 144 (77.0%) |
| Education Instruction & Library | 377 (36.7%) | 650 (63.3%) |
| Arts, Media & Entertainment | 360 (55.0%) | 295 (45.0%) |
| Health Diagnosing & Treating | 16 (2.1%) | 741 (97.9%) |
| Health Technologists | 16 (2.7%) | 568 (97.3%) |
| Total (Category) | 3,137 (43.6%) | 4,059 (56.4%) |
| Total (Overall) | 9,123 (46.1%) | 10,649 (53.9%) |
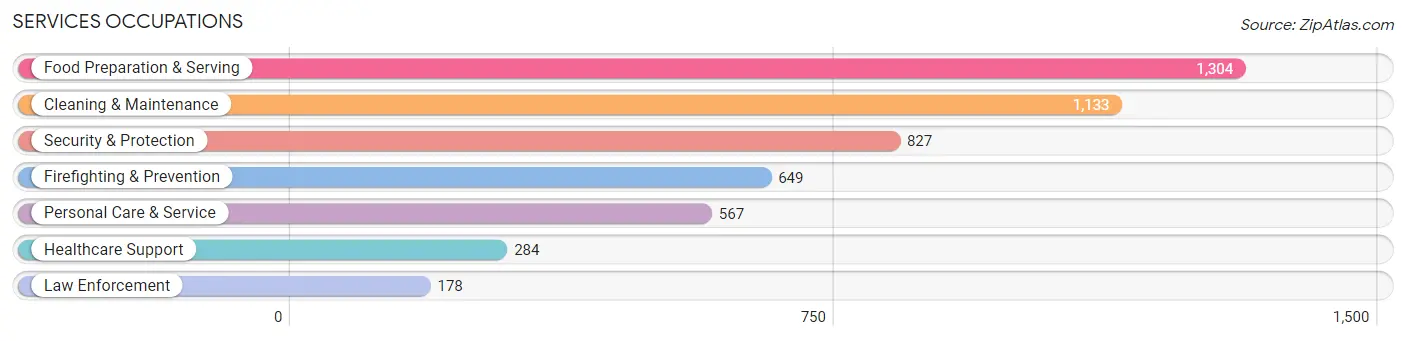
Services Occupations
The most common Services occupations in East Point are Food Preparation & Serving (1,304 | 6.6%), Cleaning & Maintenance (1,133 | 5.7%), Security & Protection (827 | 4.2%), Firefighting & Prevention (649 | 3.3%), and Personal Care & Service (567 | 2.9%).
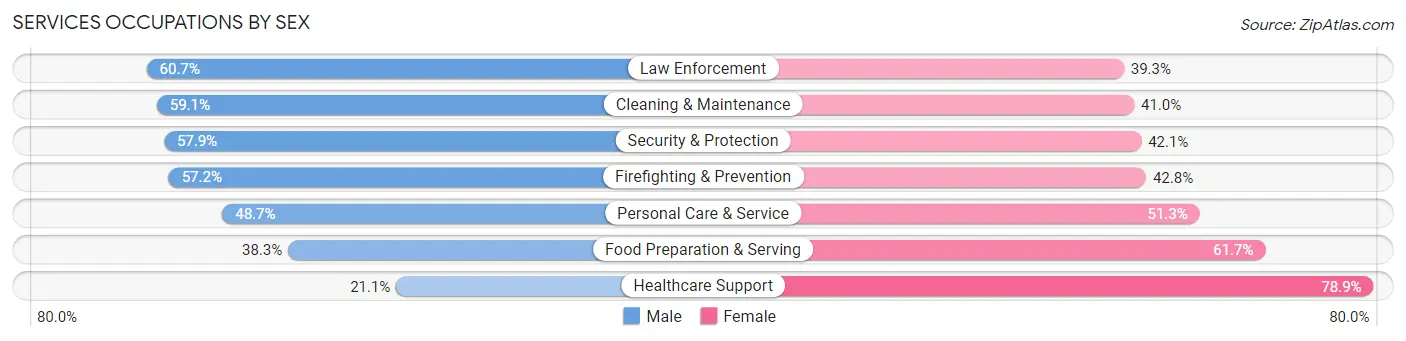
Services Occupations by Sex
Within the Services occupations in East Point, the most male-oriented occupations are Law Enforcement (60.7%), Cleaning & Maintenance (59.1%), and Security & Protection (57.9%), while the most female-oriented occupations are Healthcare Support (78.9%), Food Preparation & Serving (61.7%), and Personal Care & Service (51.3%).
| Occupation | Male | Female |
| Healthcare Support | 60 (21.1%) | 224 (78.9%) |
| Security & Protection | 479 (57.9%) | 348 (42.1%) |
| Firefighting & Prevention | 371 (57.2%) | 278 (42.8%) |
| Law Enforcement | 108 (60.7%) | 70 (39.3%) |
| Food Preparation & Serving | 499 (38.3%) | 805 (61.7%) |
| Cleaning & Maintenance | 669 (59.1%) | 464 (40.9%) |
| Personal Care & Service | 276 (48.7%) | 291 (51.3%) |
| Total (Category) | 1,983 (48.2%) | 2,132 (51.8%) |
| Total (Overall) | 9,123 (46.1%) | 10,649 (53.9%) |
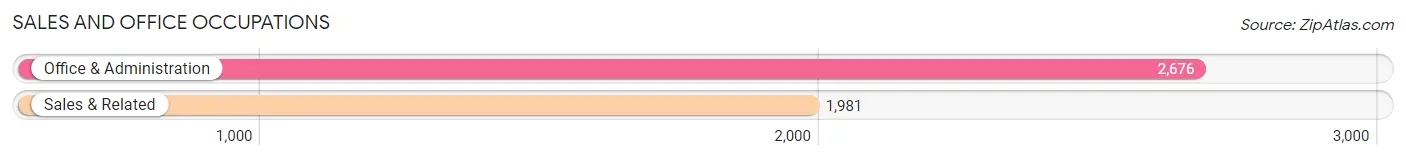
Sales and Office Occupations
The most common Sales and Office occupations in East Point are Office & Administration (2,676 | 13.5%), and Sales & Related (1,981 | 10.0%).
Sales and Office Occupations by Sex
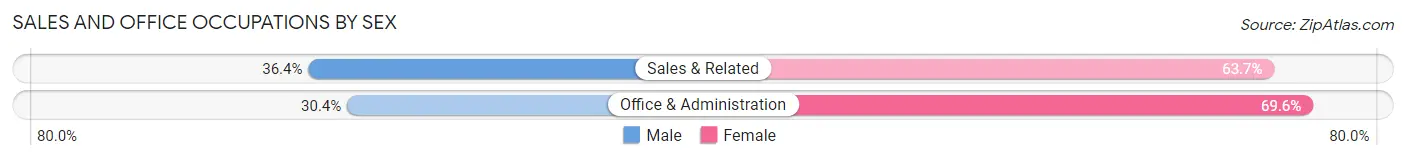
| Occupation | Male | Female |
| Sales & Related | 720 (36.3%) | 1,261 (63.6%) |
| Office & Administration | 813 (30.4%) | 1,863 (69.6%) |
| Total (Category) | 1,533 (32.9%) | 3,124 (67.1%) |
| Total (Overall) | 9,123 (46.1%) | 10,649 (53.9%) |
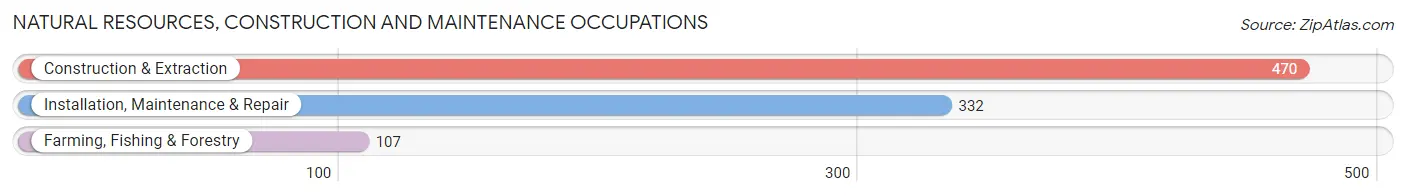
Natural Resources, Construction and Maintenance Occupations
The most common Natural Resources, Construction and Maintenance occupations in East Point are Construction & Extraction (470 | 2.4%), Installation, Maintenance & Repair (332 | 1.7%), and Farming, Fishing & Forestry (107 | 0.5%).
Natural Resources, Construction and Maintenance Occupations by Sex
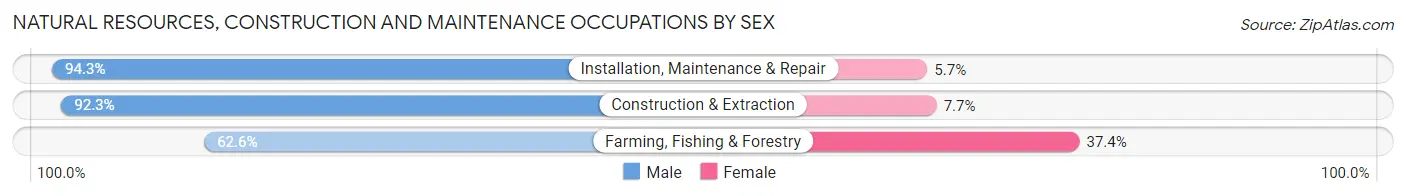
| Occupation | Male | Female |
| Farming, Fishing & Forestry | 67 (62.6%) | 40 (37.4%) |
| Construction & Extraction | 434 (92.3%) | 36 (7.7%) |
| Installation, Maintenance & Repair | 313 (94.3%) | 19 (5.7%) |
| Total (Category) | 814 (89.5%) | 95 (10.4%) |
| Total (Overall) | 9,123 (46.1%) | 10,649 (53.9%) |
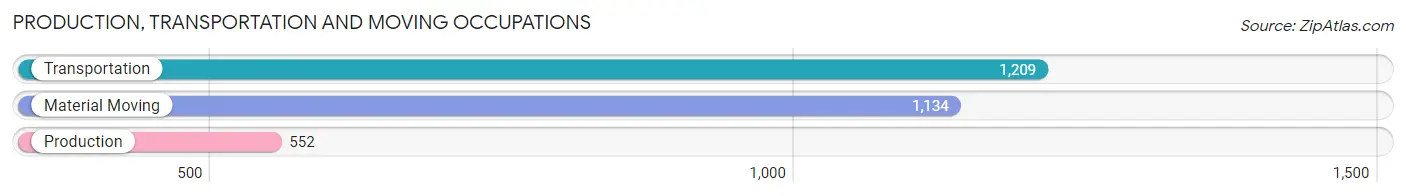
Production, Transportation and Moving Occupations
The most common Production, Transportation and Moving occupations in East Point are Transportation (1,209 | 6.1%), Material Moving (1,134 | 5.7%), and Production (552 | 2.8%).
Production, Transportation and Moving Occupations by Sex
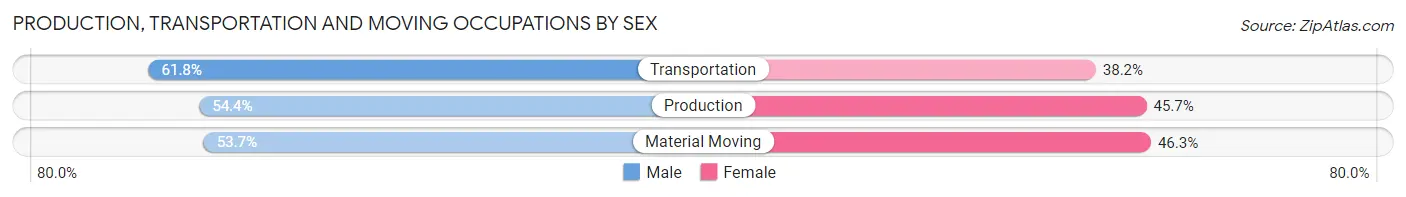
| Occupation | Male | Female |
| Production | 300 (54.3%) | 252 (45.7%) |
| Transportation | 747 (61.8%) | 462 (38.2%) |
| Material Moving | 609 (53.7%) | 525 (46.3%) |
| Total (Category) | 1,656 (57.2%) | 1,239 (42.8%) |
| Total (Overall) | 9,123 (46.1%) | 10,649 (53.9%) |
Employment Industries by Sex in East Point
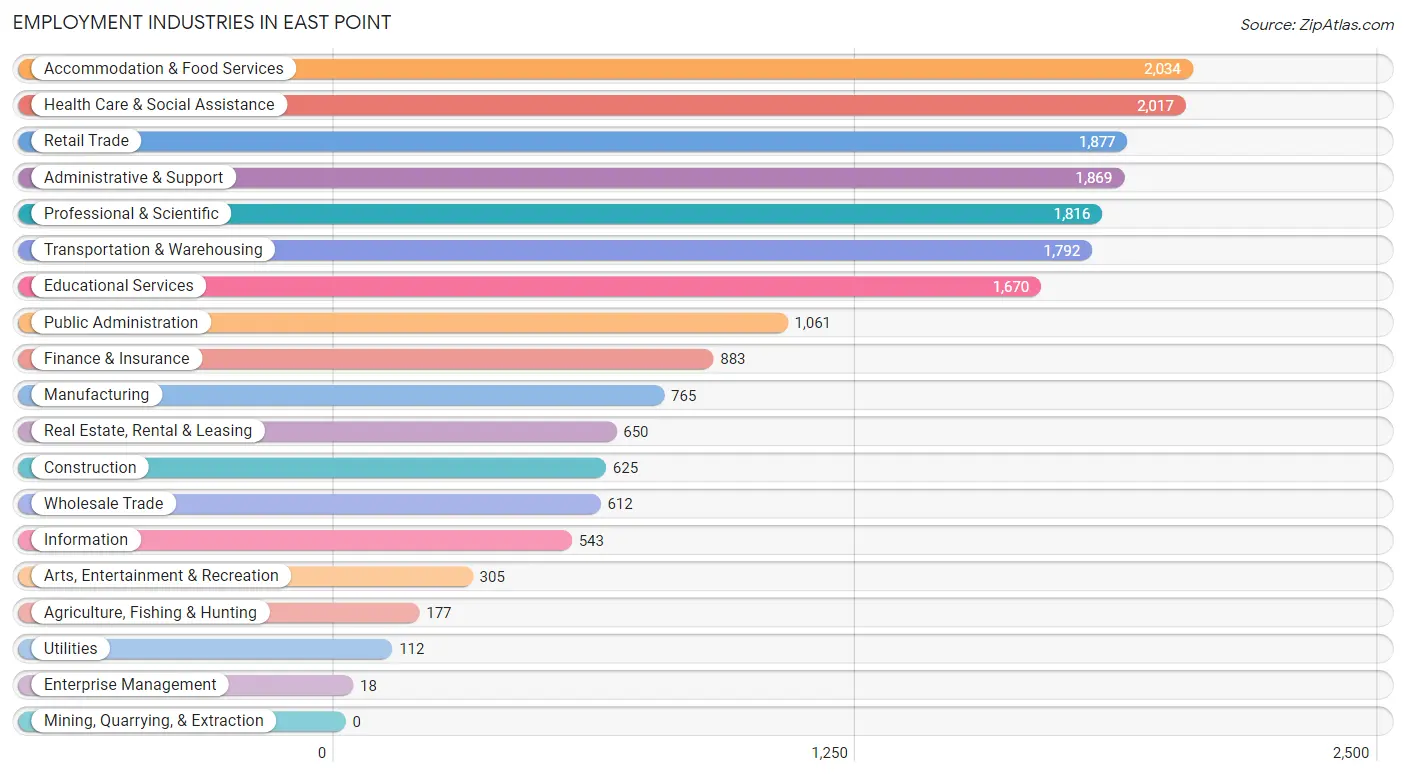
Employment Industries in East Point
The major employment industries in East Point include Accommodation & Food Services (2,034 | 10.3%), Health Care & Social Assistance (2,017 | 10.2%), Retail Trade (1,877 | 9.5%), Administrative & Support (1,869 | 9.5%), and Professional & Scientific (1,816 | 9.2%).
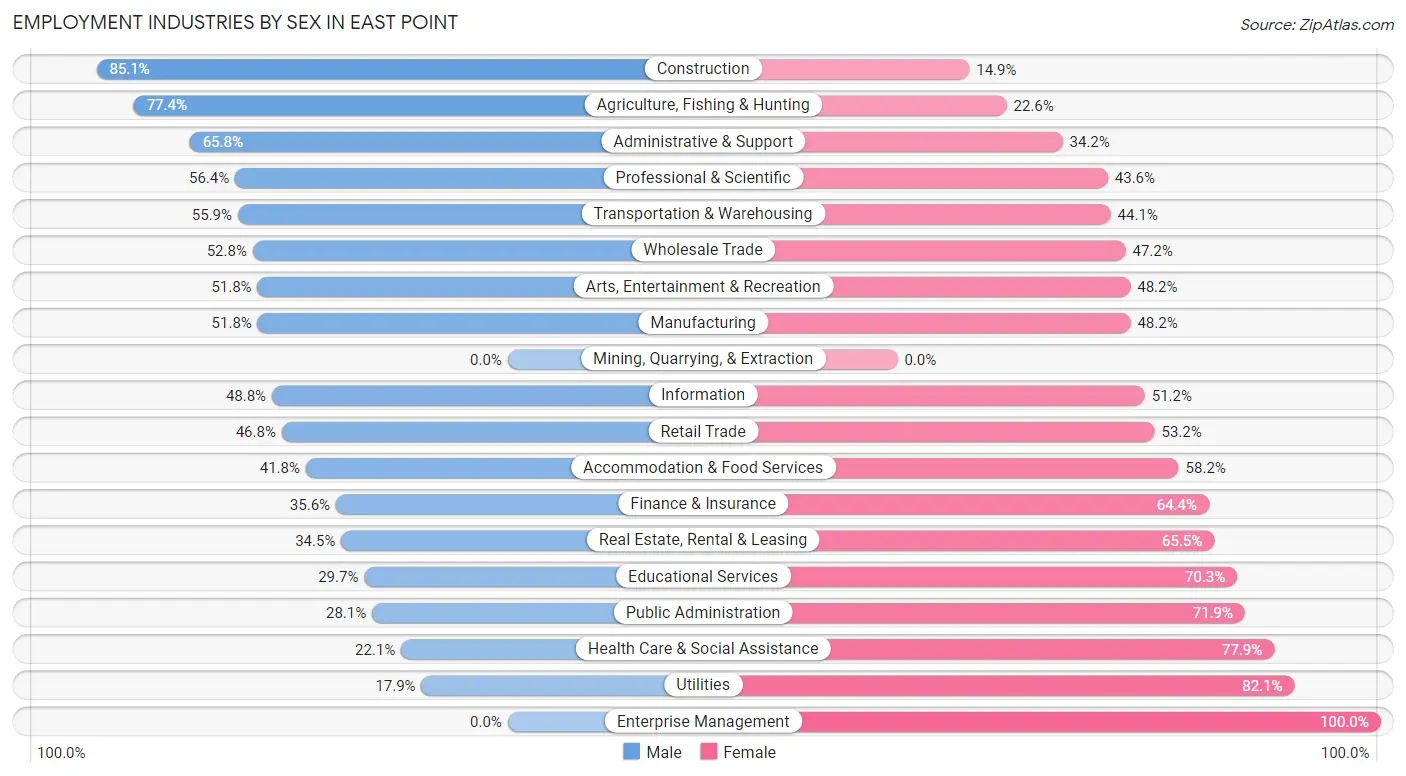
Employment Industries by Sex in East Point
The East Point industries that see more men than women are Construction (85.1%), Agriculture, Fishing & Hunting (77.4%), and Administrative & Support (65.8%), whereas the industries that tend to have a higher number of women are Enterprise Management (100.0%), Utilities (82.1%), and Health Care & Social Assistance (77.9%).
| Industry | Male | Female |
| Agriculture, Fishing & Hunting | 137 (77.4%) | 40 (22.6%) |
| Mining, Quarrying, & Extraction | 0 (0.0%) | 0 (0.0%) |
| Construction | 532 (85.1%) | 93 (14.9%) |
| Manufacturing | 396 (51.8%) | 369 (48.2%) |
| Wholesale Trade | 323 (52.8%) | 289 (47.2%) |
| Retail Trade | 878 (46.8%) | 999 (53.2%) |
| Transportation & Warehousing | 1,001 (55.9%) | 791 (44.1%) |
| Utilities | 20 (17.9%) | 92 (82.1%) |
| Information | 265 (48.8%) | 278 (51.2%) |
| Finance & Insurance | 314 (35.6%) | 569 (64.4%) |
| Real Estate, Rental & Leasing | 224 (34.5%) | 426 (65.5%) |
| Professional & Scientific | 1,025 (56.4%) | 791 (43.6%) |
| Enterprise Management | 0 (0.0%) | 18 (100.0%) |
| Administrative & Support | 1,230 (65.8%) | 639 (34.2%) |
| Educational Services | 496 (29.7%) | 1,174 (70.3%) |
| Health Care & Social Assistance | 445 (22.1%) | 1,572 (77.9%) |
| Arts, Entertainment & Recreation | 158 (51.8%) | 147 (48.2%) |
| Accommodation & Food Services | 850 (41.8%) | 1,184 (58.2%) |
| Public Administration | 298 (28.1%) | 763 (71.9%) |
| Total | 9,123 (46.1%) | 10,649 (53.9%) |
Education in East Point
School Enrollment in East Point
The most common levels of schooling among the 10,047 students in East Point are elementary school (2,296 | 22.9%), middle school (2,161 | 21.5%), and college / undergraduate (1,892 | 18.8%).
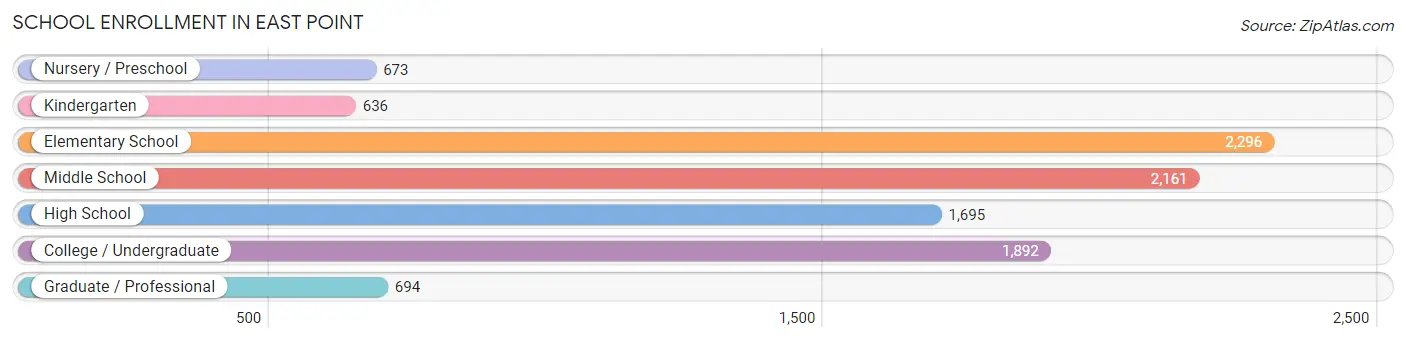
| School Level | # Students | % Students |
| Nursery / Preschool | 673 | 6.7% |
| Kindergarten | 636 | 6.3% |
| Elementary School | 2,296 | 22.9% |
| Middle School | 2,161 | 21.5% |
| High School | 1,695 | 16.9% |
| College / Undergraduate | 1,892 | 18.8% |
| Graduate / Professional | 694 | 6.9% |
| Total | 10,047 | 100.0% |
School Enrollment by Age by Funding Source in East Point
Out of a total of 10,047 students who are enrolled in schools in East Point, 1,477 (14.7%) attend a private institution, while the remaining 8,570 (85.3%) are enrolled in public schools. The age group of 18 to 19 year olds has the highest likelihood of being enrolled in private schools, with 390 (57.9% in the age bracket) enrolled. Conversely, the age group of 10 to 14 year olds has the lowest likelihood of being enrolled in a private school, with 2,246 (94.9% in the age bracket) attending a public institution.
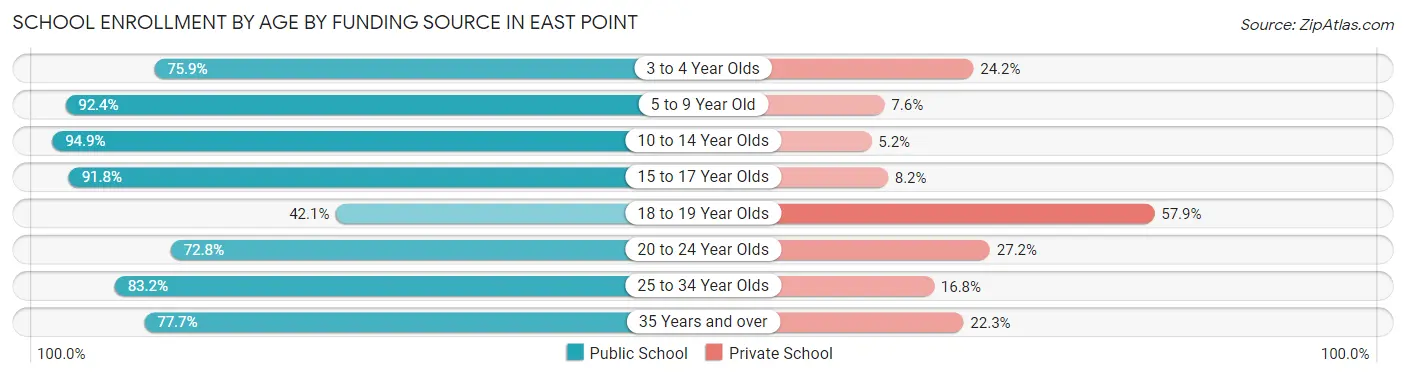
| Age Bracket | Public School | Private School |
| 3 to 4 Year Olds | 446 (75.8%) | 142 (24.1%) |
| 5 to 9 Year Old | 2,628 (92.4%) | 216 (7.6%) |
| 10 to 14 Year Olds | 2,246 (94.9%) | 122 (5.1%) |
| 15 to 17 Year Olds | 1,127 (91.8%) | 101 (8.2%) |
| 18 to 19 Year Olds | 284 (42.1%) | 390 (57.9%) |
| 20 to 24 Year Olds | 489 (72.8%) | 183 (27.2%) |
| 25 to 34 Year Olds | 713 (83.2%) | 144 (16.8%) |
| 35 Years and over | 634 (77.7%) | 182 (22.3%) |
| Total | 8,570 (85.3%) | 1,477 (14.7%) |
Educational Attainment by Field of Study in East Point
Business (2,906 | 29.1%), social sciences (1,149 | 11.5%), science & technology (1,087 | 10.9%), communications (811 | 8.1%), and education (597 | 6.0%) are the most common fields of study among 9,991 individuals in East Point who have obtained a bachelor's degree or higher.
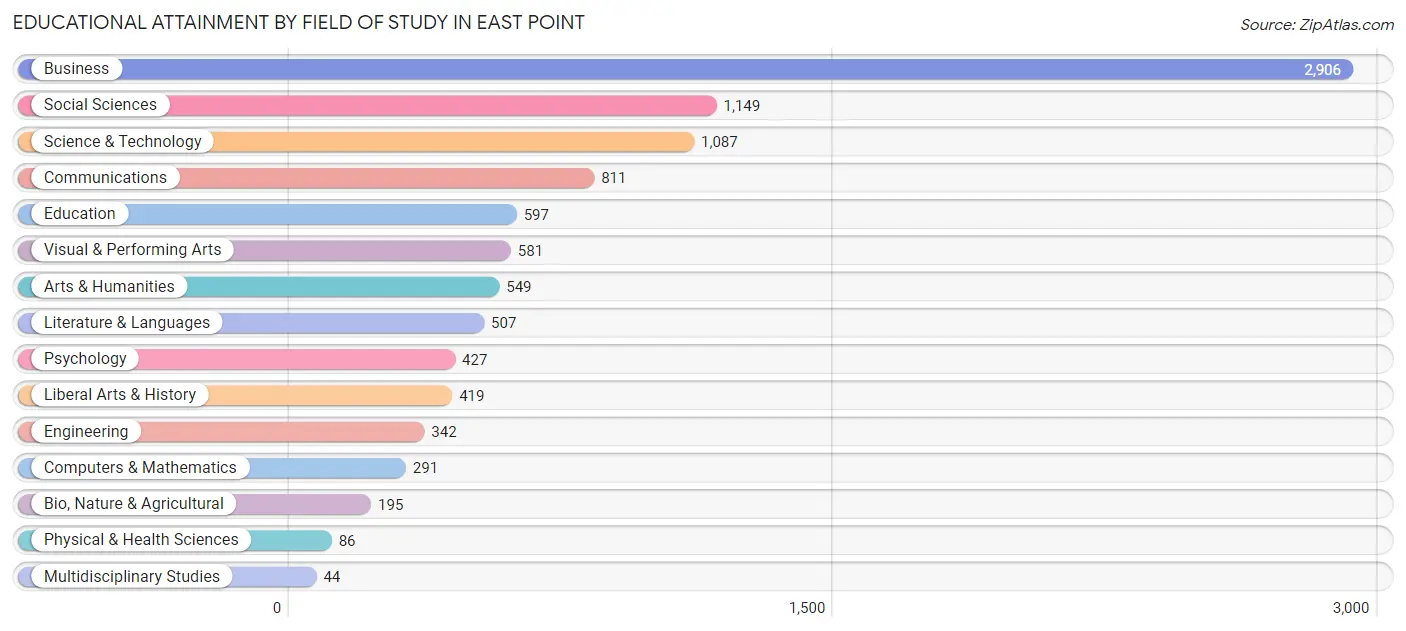
| Field of Study | # Graduates | % Graduates |
| Computers & Mathematics | 291 | 2.9% |
| Bio, Nature & Agricultural | 195 | 1.9% |
| Physical & Health Sciences | 86 | 0.9% |
| Psychology | 427 | 4.3% |
| Social Sciences | 1,149 | 11.5% |
| Engineering | 342 | 3.4% |
| Multidisciplinary Studies | 44 | 0.4% |
| Science & Technology | 1,087 | 10.9% |
| Business | 2,906 | 29.1% |
| Education | 597 | 6.0% |
| Literature & Languages | 507 | 5.1% |
| Liberal Arts & History | 419 | 4.2% |
| Visual & Performing Arts | 581 | 5.8% |
| Communications | 811 | 8.1% |
| Arts & Humanities | 549 | 5.5% |
| Total | 9,991 | 100.0% |
Transportation & Commute in East Point
Vehicle Availability by Sex in East Point
The most prevalent vehicle ownership categories in East Point are males with 2 vehicles (3,632, accounting for 40.4%) and females with 2 vehicles (4,027, making up 35.6%).
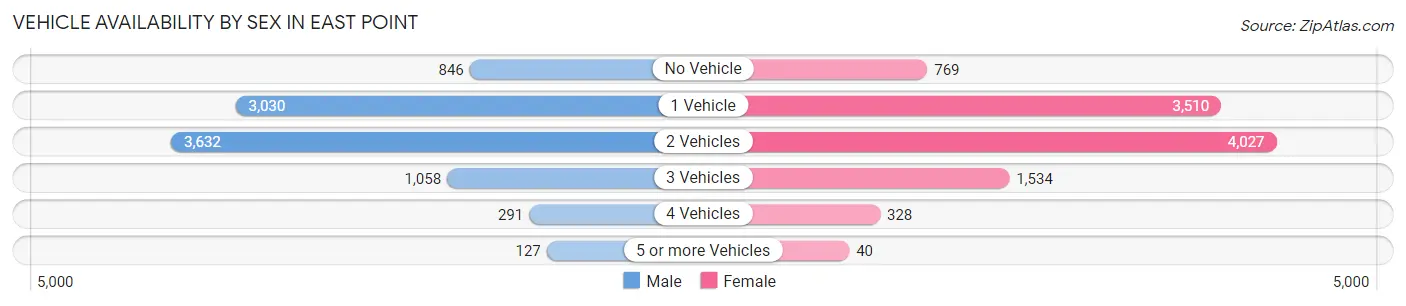
| Vehicles Available | Male | Female |
| No Vehicle | 846 (9.4%) | 769 (7.5%) |
| 1 Vehicle | 3,030 (33.7%) | 3,510 (34.4%) |
| 2 Vehicles | 3,632 (40.4%) | 4,027 (39.5%) |
| 3 Vehicles | 1,058 (11.8%) | 1,534 (15.0%) |
| 4 Vehicles | 291 (3.2%) | 328 (3.2%) |
| 5 or more Vehicles | 127 (1.4%) | 40 (0.4%) |
| Total | 8,984 (100.0%) | 10,208 (100.0%) |
Commute Time in East Point
The most frequently occuring commute durations in East Point are 30 to 34 minutes (4,002 commuters, 23.9%), 20 to 24 minutes (2,997 commuters, 17.9%), and 15 to 19 minutes (1,941 commuters, 11.6%).
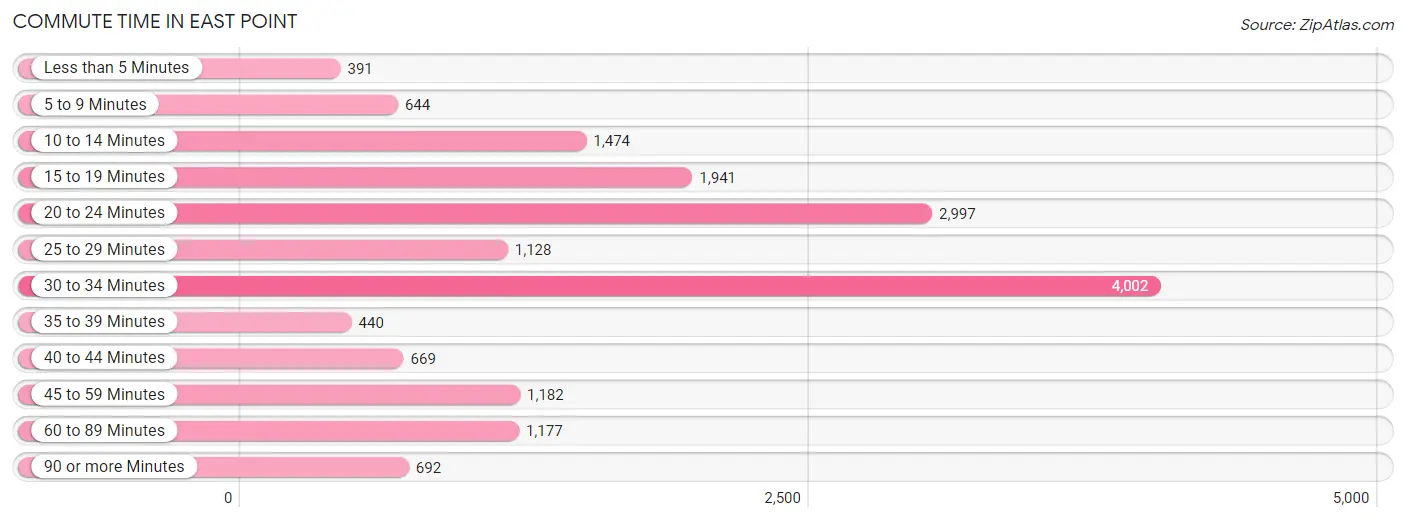
| Commute Time | # Commuters | % Commuters |
| Less than 5 Minutes | 391 | 2.3% |
| 5 to 9 Minutes | 644 | 3.8% |
| 10 to 14 Minutes | 1,474 | 8.8% |
| 15 to 19 Minutes | 1,941 | 11.6% |
| 20 to 24 Minutes | 2,997 | 17.9% |
| 25 to 29 Minutes | 1,128 | 6.7% |
| 30 to 34 Minutes | 4,002 | 23.9% |
| 35 to 39 Minutes | 440 | 2.6% |
| 40 to 44 Minutes | 669 | 4.0% |
| 45 to 59 Minutes | 1,182 | 7.1% |
| 60 to 89 Minutes | 1,177 | 7.0% |
| 90 or more Minutes | 692 | 4.1% |
Commute Time by Sex in East Point
The most common commute times in East Point are 30 to 34 minutes (1,732 commuters, 21.9%) for males and 30 to 34 minutes (2,270 commuters, 25.7%) for females.
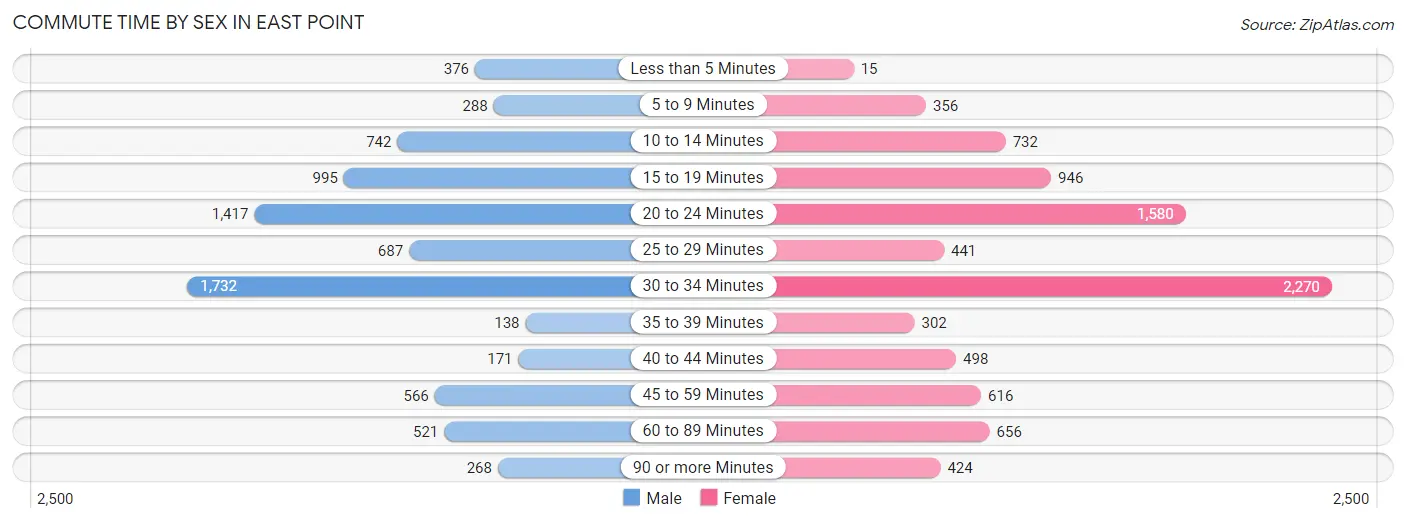
| Commute Time | Male | Female |
| Less than 5 Minutes | 376 (4.8%) | 15 (0.2%) |
| 5 to 9 Minutes | 288 (3.6%) | 356 (4.0%) |
| 10 to 14 Minutes | 742 (9.4%) | 732 (8.3%) |
| 15 to 19 Minutes | 995 (12.6%) | 946 (10.7%) |
| 20 to 24 Minutes | 1,417 (17.9%) | 1,580 (17.9%) |
| 25 to 29 Minutes | 687 (8.7%) | 441 (5.0%) |
| 30 to 34 Minutes | 1,732 (21.9%) | 2,270 (25.7%) |
| 35 to 39 Minutes | 138 (1.8%) | 302 (3.4%) |
| 40 to 44 Minutes | 171 (2.2%) | 498 (5.6%) |
| 45 to 59 Minutes | 566 (7.2%) | 616 (7.0%) |
| 60 to 89 Minutes | 521 (6.6%) | 656 (7.4%) |
| 90 or more Minutes | 268 (3.4%) | 424 (4.8%) |
Time of Departure to Work by Sex in East Point
The most frequent times of departure to work in East Point are 7:00 AM to 7:29 AM (1,132, 14.3%) for males and 7:00 AM to 7:29 AM (1,848, 20.9%) for females.
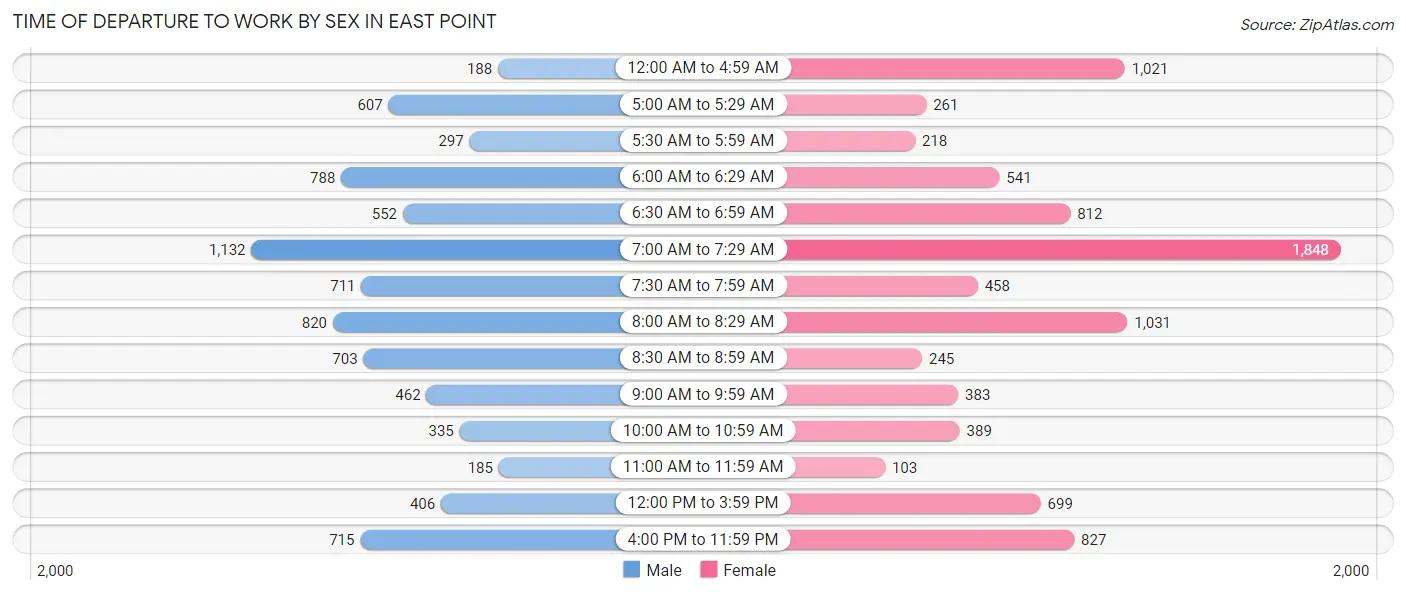
| Time of Departure | Male | Female |
| 12:00 AM to 4:59 AM | 188 (2.4%) | 1,021 (11.6%) |
| 5:00 AM to 5:29 AM | 607 (7.7%) | 261 (2.9%) |
| 5:30 AM to 5:59 AM | 297 (3.8%) | 218 (2.5%) |
| 6:00 AM to 6:29 AM | 788 (10.0%) | 541 (6.1%) |
| 6:30 AM to 6:59 AM | 552 (7.0%) | 812 (9.2%) |
| 7:00 AM to 7:29 AM | 1,132 (14.3%) | 1,848 (20.9%) |
| 7:30 AM to 7:59 AM | 711 (9.0%) | 458 (5.2%) |
| 8:00 AM to 8:29 AM | 820 (10.4%) | 1,031 (11.7%) |
| 8:30 AM to 8:59 AM | 703 (8.9%) | 245 (2.8%) |
| 9:00 AM to 9:59 AM | 462 (5.9%) | 383 (4.3%) |
| 10:00 AM to 10:59 AM | 335 (4.2%) | 389 (4.4%) |
| 11:00 AM to 11:59 AM | 185 (2.3%) | 103 (1.2%) |
| 12:00 PM to 3:59 PM | 406 (5.1%) | 699 (7.9%) |
| 4:00 PM to 11:59 PM | 715 (9.0%) | 827 (9.4%) |
| Total | 7,901 (100.0%) | 8,836 (100.0%) |
Housing Occupancy in East Point
Occupancy by Ownership in East Point
Of the total 16,062 dwellings in East Point, owner-occupied units account for 6,754 (42.0%), while renter-occupied units make up 9,308 (58.0%).
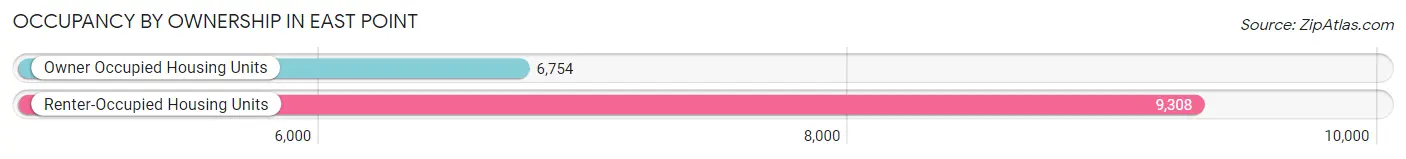
| Occupancy | # Housing Units | % Housing Units |
| Owner Occupied Housing Units | 6,754 | 42.0% |
| Renter-Occupied Housing Units | 9,308 | 58.0% |
| Total Occupied Housing Units | 16,062 | 100.0% |
Occupancy by Household Size in East Point
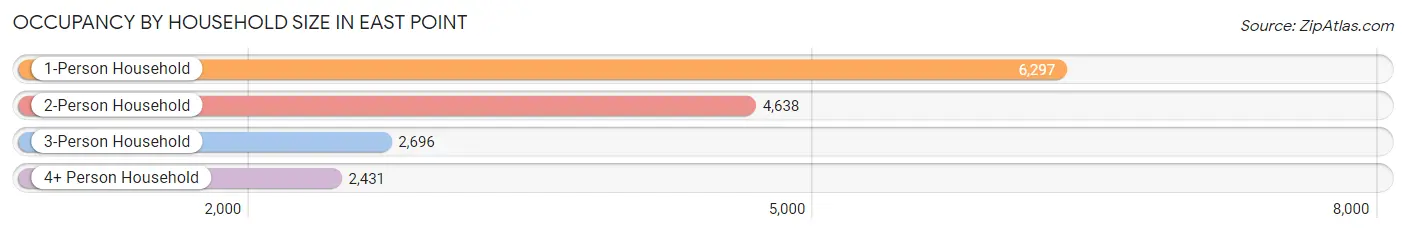
| Household Size | # Housing Units | % Housing Units |
| 1-Person Household | 6,297 | 39.2% |
| 2-Person Household | 4,638 | 28.9% |
| 3-Person Household | 2,696 | 16.8% |
| 4+ Person Household | 2,431 | 15.1% |
| Total Housing Units | 16,062 | 100.0% |
Occupancy by Ownership by Household Size in East Point
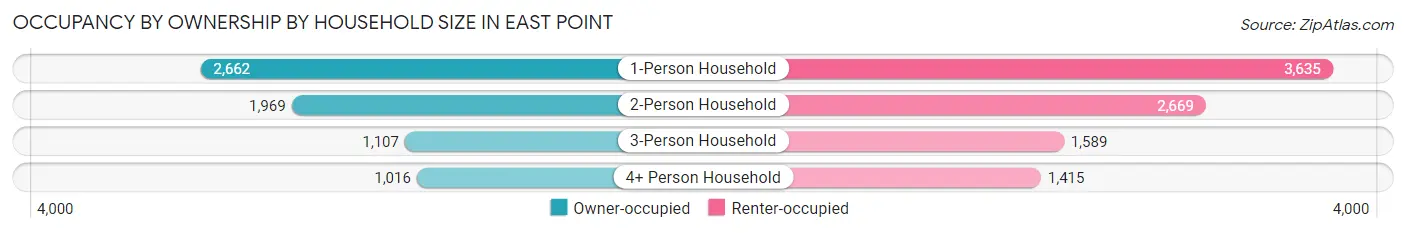
| Household Size | Owner-occupied | Renter-occupied |
| 1-Person Household | 2,662 (42.3%) | 3,635 (57.7%) |
| 2-Person Household | 1,969 (42.4%) | 2,669 (57.6%) |
| 3-Person Household | 1,107 (41.1%) | 1,589 (58.9%) |
| 4+ Person Household | 1,016 (41.8%) | 1,415 (58.2%) |
| Total Housing Units | 6,754 (42.0%) | 9,308 (58.0%) |
Occupancy by Educational Attainment in East Point
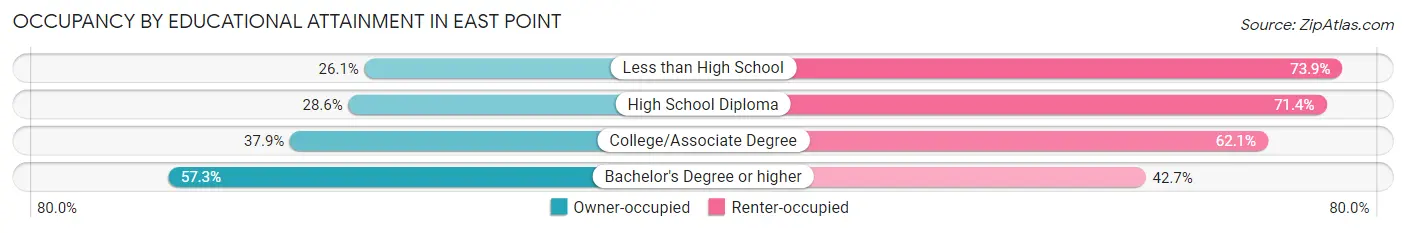
| Household Size | Owner-occupied | Renter-occupied |
| Less than High School | 337 (26.1%) | 956 (73.9%) |
| High School Diploma | 1,188 (28.6%) | 2,963 (71.4%) |
| College/Associate Degree | 1,666 (37.9%) | 2,732 (62.1%) |
| Bachelor's Degree or higher | 3,563 (57.3%) | 2,657 (42.7%) |
Occupancy by Age of Householder in East Point
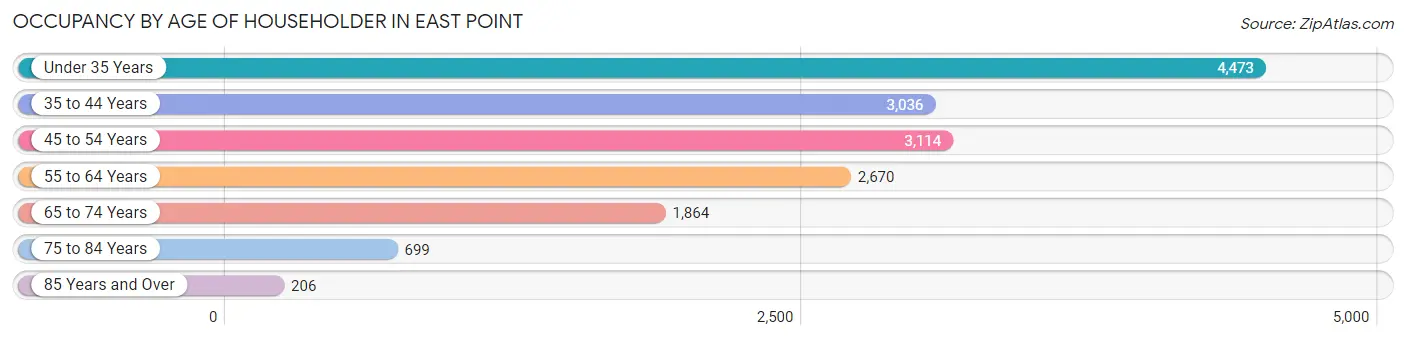
| Age Bracket | # Households | % Households |
| Under 35 Years | 4,473 | 27.9% |
| 35 to 44 Years | 3,036 | 18.9% |
| 45 to 54 Years | 3,114 | 19.4% |
| 55 to 64 Years | 2,670 | 16.6% |
| 65 to 74 Years | 1,864 | 11.6% |
| 75 to 84 Years | 699 | 4.3% |
| 85 Years and Over | 206 | 1.3% |
| Total | 16,062 | 100.0% |
Housing Finances in East Point
Median Income by Occupancy in East Point
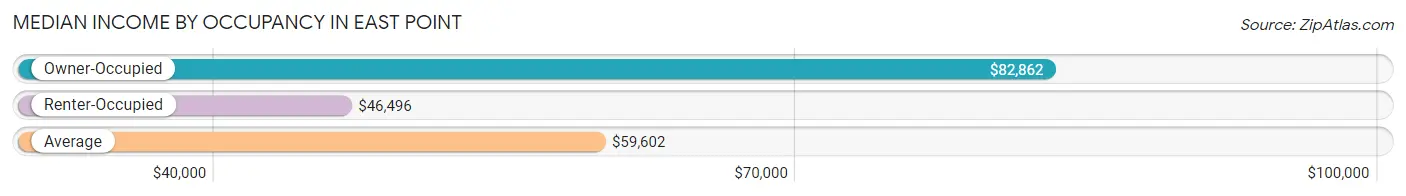
| Occupancy Type | # Households | Median Income |
| Owner-Occupied | 6,754 (42.0%) | $82,862 |
| Renter-Occupied | 9,308 (58.0%) | $46,496 |
| Average | 16,062 (100.0%) | $59,602 |
Occupancy by Householder Income Bracket in East Point
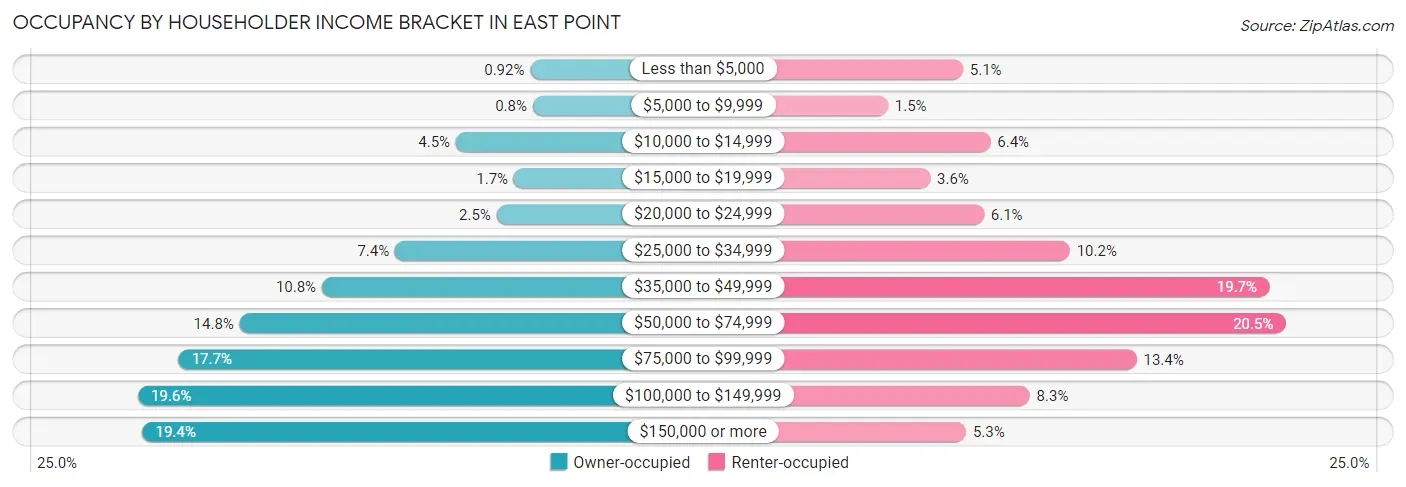
| Income Bracket | Owner-occupied | Renter-occupied |
| Less than $5,000 | 62 (0.9%) | 476 (5.1%) |
| $5,000 to $9,999 | 54 (0.8%) | 143 (1.5%) |
| $10,000 to $14,999 | 301 (4.5%) | 598 (6.4%) |
| $15,000 to $19,999 | 115 (1.7%) | 330 (3.5%) |
| $20,000 to $24,999 | 170 (2.5%) | 569 (6.1%) |
| $25,000 to $34,999 | 497 (7.4%) | 949 (10.2%) |
| $35,000 to $49,999 | 732 (10.8%) | 1,832 (19.7%) |
| $50,000 to $74,999 | 997 (14.8%) | 1,904 (20.5%) |
| $75,000 to $99,999 | 1,193 (17.7%) | 1,245 (13.4%) |
| $100,000 to $149,999 | 1,324 (19.6%) | 772 (8.3%) |
| $150,000 or more | 1,309 (19.4%) | 490 (5.3%) |
| Total | 6,754 (100.0%) | 9,308 (100.0%) |
Monthly Housing Cost Tiers in East Point
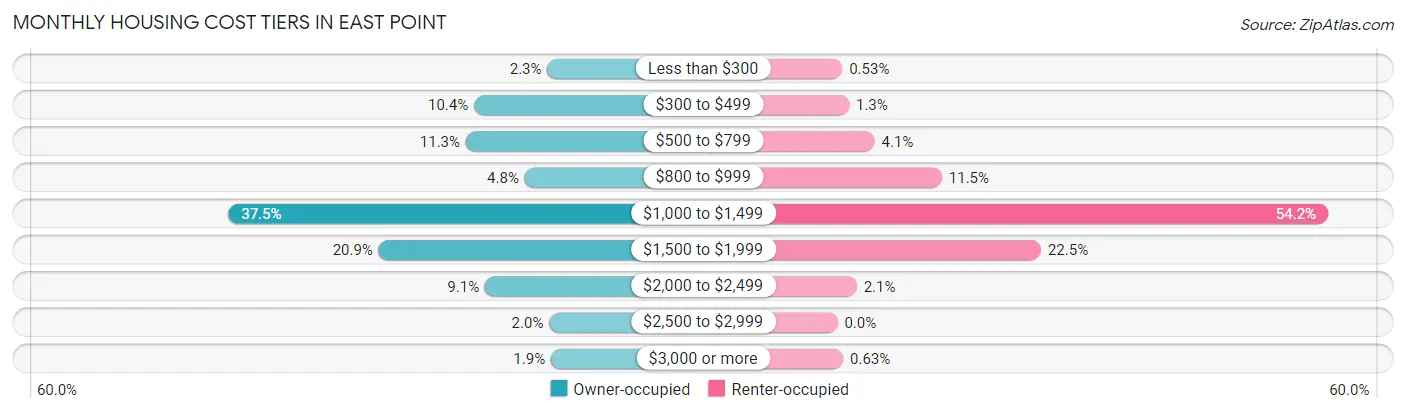
| Monthly Cost | Owner-occupied | Renter-occupied |
| Less than $300 | 152 (2.2%) | 49 (0.5%) |
| $300 to $499 | 699 (10.3%) | 119 (1.3%) |
| $500 to $799 | 760 (11.3%) | 383 (4.1%) |
| $800 to $999 | 321 (4.8%) | 1,074 (11.5%) |
| $1,000 to $1,499 | 2,532 (37.5%) | 5,043 (54.2%) |
| $1,500 to $1,999 | 1,410 (20.9%) | 2,093 (22.5%) |
| $2,000 to $2,499 | 617 (9.1%) | 198 (2.1%) |
| $2,500 to $2,999 | 138 (2.0%) | 0 (0.0%) |
| $3,000 or more | 125 (1.8%) | 59 (0.6%) |
| Total | 6,754 (100.0%) | 9,308 (100.0%) |
Physical Housing Characteristics in East Point
Housing Structures in East Point
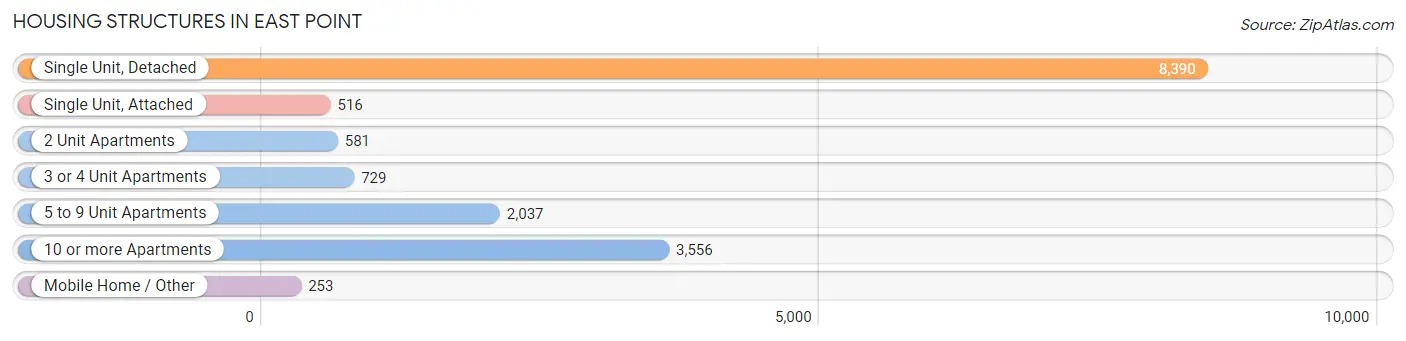
| Structure Type | # Housing Units | % Housing Units |
| Single Unit, Detached | 8,390 | 52.2% |
| Single Unit, Attached | 516 | 3.2% |
| 2 Unit Apartments | 581 | 3.6% |
| 3 or 4 Unit Apartments | 729 | 4.5% |
| 5 to 9 Unit Apartments | 2,037 | 12.7% |
| 10 or more Apartments | 3,556 | 22.1% |
| Mobile Home / Other | 253 | 1.6% |
| Total | 16,062 | 100.0% |
Housing Structures by Occupancy in East Point
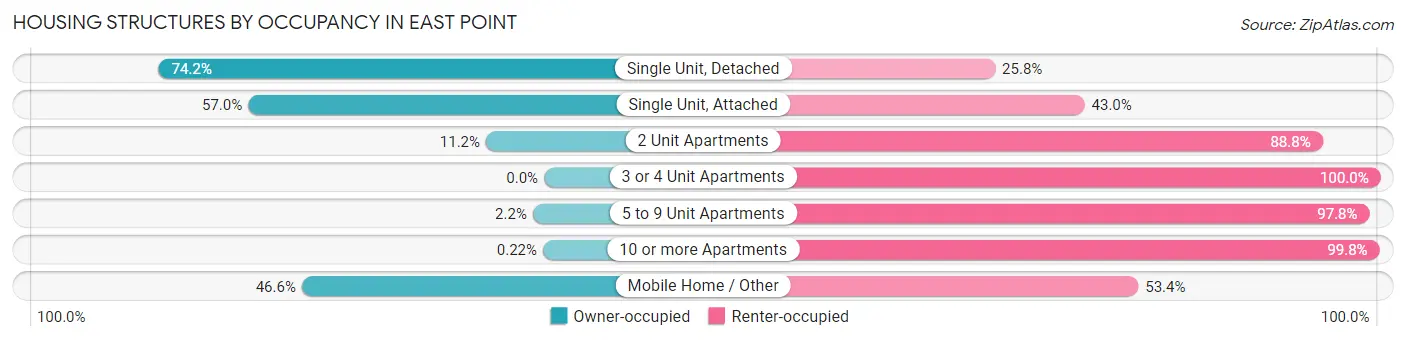
| Structure Type | Owner-occupied | Renter-occupied |
| Single Unit, Detached | 6,225 (74.2%) | 2,165 (25.8%) |
| Single Unit, Attached | 294 (57.0%) | 222 (43.0%) |
| 2 Unit Apartments | 65 (11.2%) | 516 (88.8%) |
| 3 or 4 Unit Apartments | 0 (0.0%) | 729 (100.0%) |
| 5 to 9 Unit Apartments | 44 (2.2%) | 1,993 (97.8%) |
| 10 or more Apartments | 8 (0.2%) | 3,548 (99.8%) |
| Mobile Home / Other | 118 (46.6%) | 135 (53.4%) |
| Total | 6,754 (42.0%) | 9,308 (58.0%) |
Housing Structures by Number of Rooms in East Point
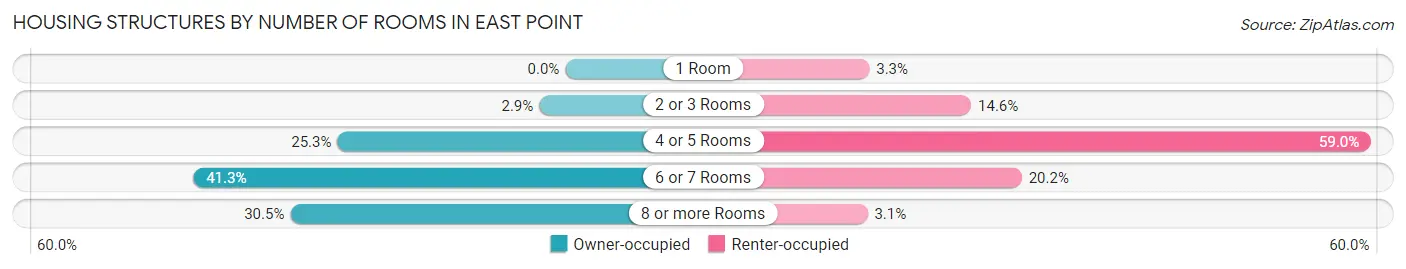
| Number of Rooms | Owner-occupied | Renter-occupied |
| 1 Room | 0 (0.0%) | 303 (3.3%) |
| 2 or 3 Rooms | 196 (2.9%) | 1,355 (14.6%) |
| 4 or 5 Rooms | 1,709 (25.3%) | 5,487 (59.0%) |
| 6 or 7 Rooms | 2,788 (41.3%) | 1,878 (20.2%) |
| 8 or more Rooms | 2,061 (30.5%) | 285 (3.1%) |
| Total | 6,754 (100.0%) | 9,308 (100.0%) |
Housing Structure by Heating Type in East Point
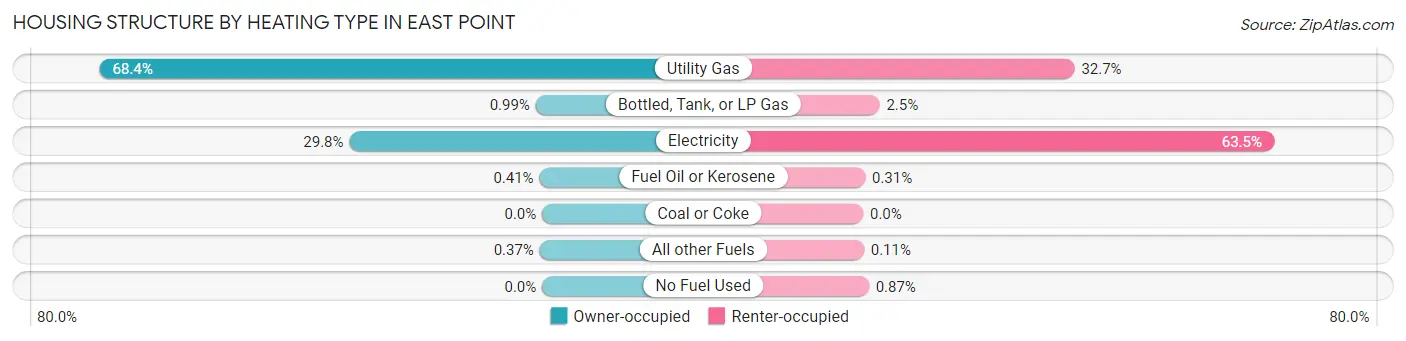
| Heating Type | Owner-occupied | Renter-occupied |
| Utility Gas | 4,621 (68.4%) | 3,042 (32.7%) |
| Bottled, Tank, or LP Gas | 67 (1.0%) | 236 (2.5%) |
| Electricity | 2,013 (29.8%) | 5,910 (63.5%) |
| Fuel Oil or Kerosene | 28 (0.4%) | 29 (0.3%) |
| Coal or Coke | 0 (0.0%) | 0 (0.0%) |
| All other Fuels | 25 (0.4%) | 10 (0.1%) |
| No Fuel Used | 0 (0.0%) | 81 (0.9%) |
| Total | 6,754 (100.0%) | 9,308 (100.0%) |
Household Vehicle Usage in East Point
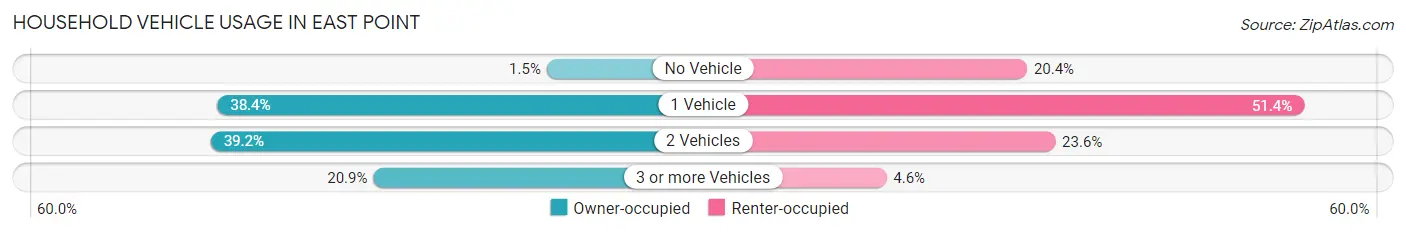
| Vehicles per Household | Owner-occupied | Renter-occupied |
| No Vehicle | 102 (1.5%) | 1,898 (20.4%) |
| 1 Vehicle | 2,594 (38.4%) | 4,786 (51.4%) |
| 2 Vehicles | 2,644 (39.2%) | 2,192 (23.5%) |
| 3 or more Vehicles | 1,414 (20.9%) | 432 (4.6%) |
| Total | 6,754 (100.0%) | 9,308 (100.0%) |
Real Estate & Mortgages in East Point
Real Estate and Mortgage Overview in East Point
| Characteristic | Without Mortgage | With Mortgage |
| Housing Units | 1,551 | 5,203 |
| Median Property Value | $180,500 | $229,700 |
| Median Household Income | $66,891 | $1,054 |
| Monthly Housing Costs | $494 | $125 |
| Real Estate Taxes | $1,193 | $14 |
Property Value by Mortgage Status in East Point
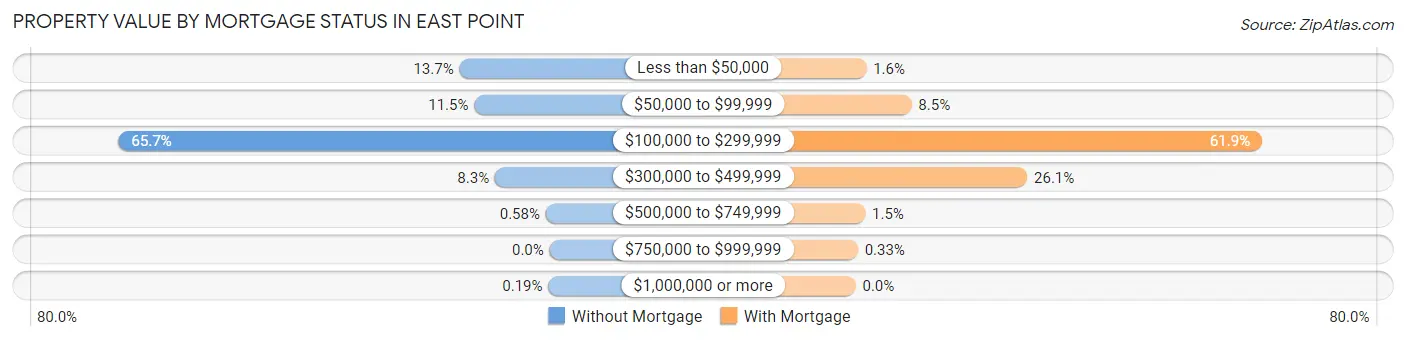
| Property Value | Without Mortgage | With Mortgage |
| Less than $50,000 | 213 (13.7%) | 85 (1.6%) |
| $50,000 to $99,999 | 178 (11.5%) | 443 (8.5%) |
| $100,000 to $299,999 | 1,019 (65.7%) | 3,222 (61.9%) |
| $300,000 to $499,999 | 129 (8.3%) | 1,360 (26.1%) |
| $500,000 to $749,999 | 9 (0.6%) | 76 (1.5%) |
| $750,000 to $999,999 | 0 (0.0%) | 17 (0.3%) |
| $1,000,000 or more | 3 (0.2%) | 0 (0.0%) |
| Total | 1,551 (100.0%) | 5,203 (100.0%) |
Household Income by Mortgage Status in East Point
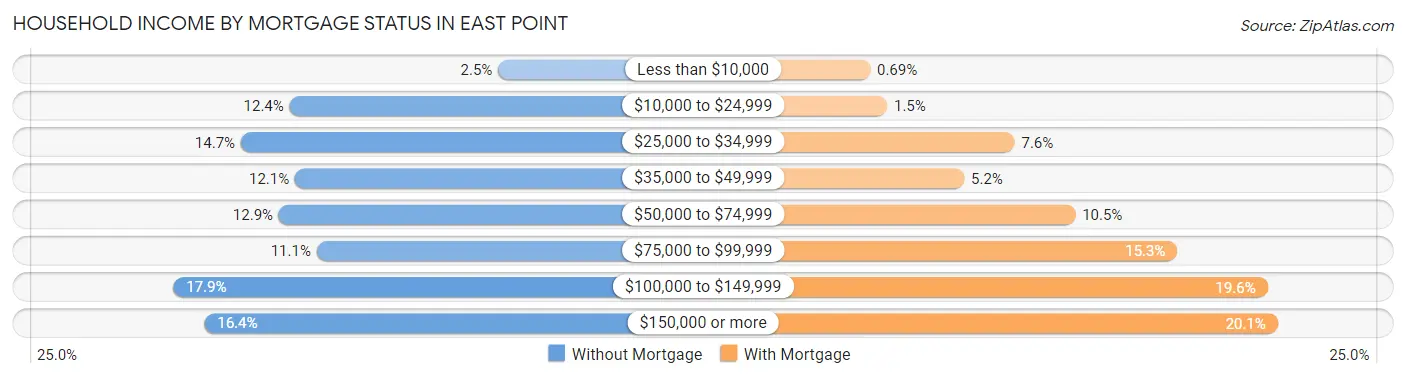
| Household Income | Without Mortgage | With Mortgage |
| Less than $10,000 | 38 (2.5%) | 36 (0.7%) |
| $10,000 to $24,999 | 192 (12.4%) | 78 (1.5%) |
| $25,000 to $34,999 | 228 (14.7%) | 394 (7.6%) |
| $35,000 to $49,999 | 188 (12.1%) | 269 (5.2%) |
| $50,000 to $74,999 | 200 (12.9%) | 544 (10.5%) |
| $75,000 to $99,999 | 172 (11.1%) | 797 (15.3%) |
| $100,000 to $149,999 | 278 (17.9%) | 1,021 (19.6%) |
| $150,000 or more | 255 (16.4%) | 1,046 (20.1%) |
| Total | 1,551 (100.0%) | 5,203 (100.0%) |
Property Value to Household Income Ratio in East Point
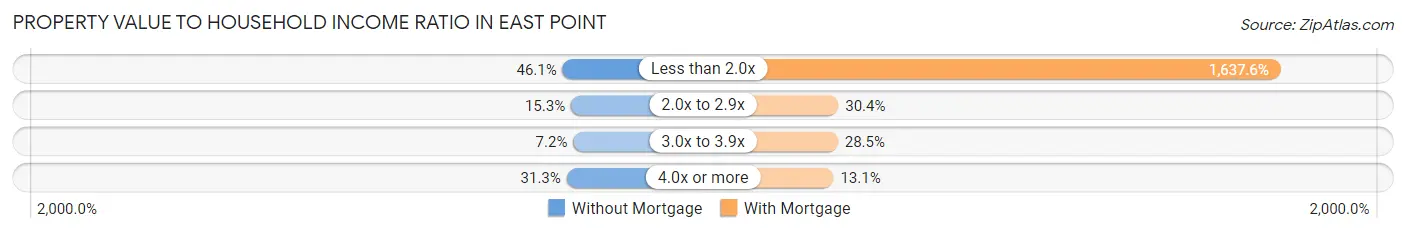
| Value-to-Income Ratio | Without Mortgage | With Mortgage |
| Less than 2.0x | 715 (46.1%) | 85,203 (1,637.6%) |
| 2.0x to 2.9x | 238 (15.3%) | 1,583 (30.4%) |
| 3.0x to 3.9x | 112 (7.2%) | 1,483 (28.5%) |
| 4.0x or more | 486 (31.3%) | 679 (13.1%) |
| Total | 1,551 (100.0%) | 5,203 (100.0%) |
Real Estate Taxes by Mortgage Status in East Point
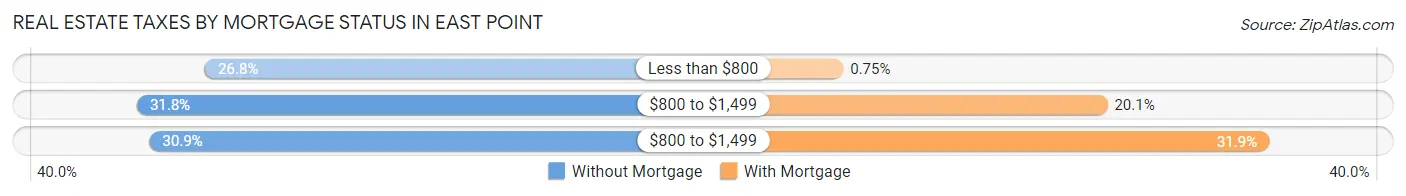
| Property Taxes | Without Mortgage | With Mortgage |
| Less than $800 | 416 (26.8%) | 39 (0.7%) |
| $800 to $1,499 | 493 (31.8%) | 1,043 (20.1%) |
| $800 to $1,499 | 479 (30.9%) | 1,657 (31.9%) |
| Total | 1,551 (100.0%) | 5,203 (100.0%) |
Health & Disability in East Point
Health Insurance Coverage by Age in East Point
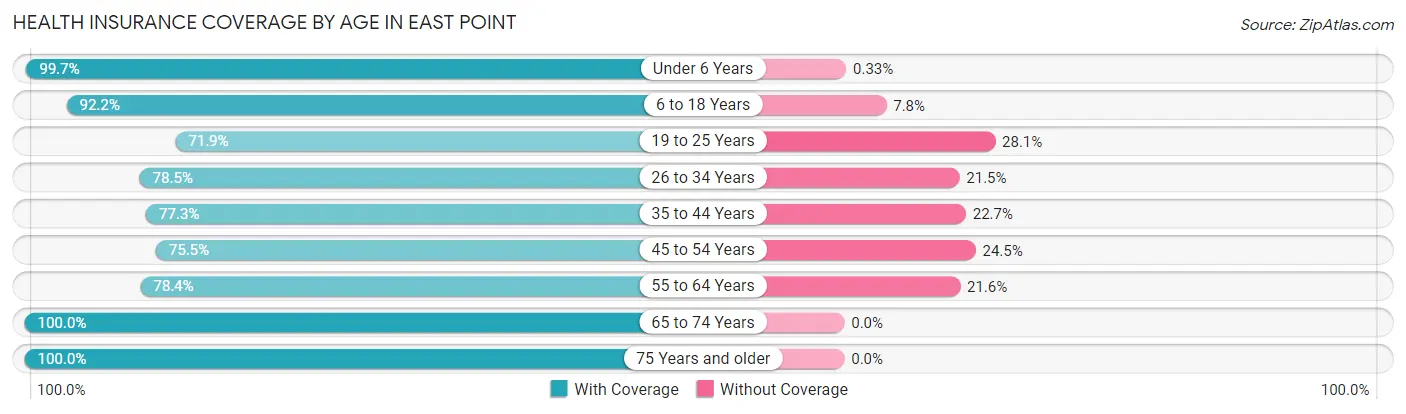
| Age Bracket | With Coverage | Without Coverage |
| Under 6 Years | 2,996 (99.7%) | 10 (0.3%) |
| 6 to 18 Years | 5,829 (92.2%) | 495 (7.8%) |
| 19 to 25 Years | 2,822 (71.9%) | 1,104 (28.1%) |
| 26 to 34 Years | 4,709 (78.5%) | 1,287 (21.5%) |
| 35 to 44 Years | 4,334 (77.3%) | 1,270 (22.7%) |
| 45 to 54 Years | 3,800 (75.5%) | 1,232 (24.5%) |
| 55 to 64 Years | 3,319 (78.4%) | 914 (21.6%) |
| 65 to 74 Years | 2,615 (100.0%) | 0 (0.0%) |
| 75 Years and older | 1,312 (100.0%) | 0 (0.0%) |
| Total | 31,736 (83.4%) | 6,312 (16.6%) |
Health Insurance Coverage by Citizenship Status in East Point
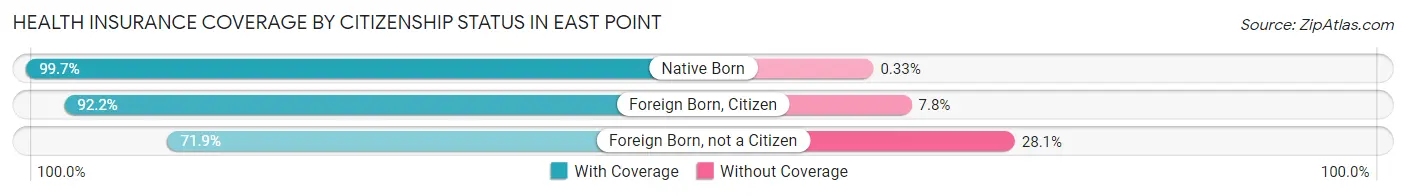
| Citizenship Status | With Coverage | Without Coverage |
| Native Born | 2,996 (99.7%) | 10 (0.3%) |
| Foreign Born, Citizen | 5,829 (92.2%) | 495 (7.8%) |
| Foreign Born, not a Citizen | 2,822 (71.9%) | 1,104 (28.1%) |
Health Insurance Coverage by Household Income in East Point
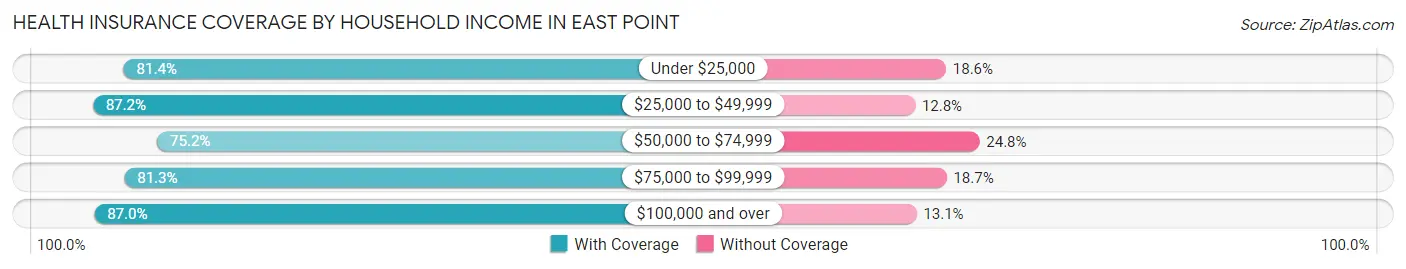
| Household Income | With Coverage | Without Coverage |
| Under $25,000 | 4,624 (81.4%) | 1,054 (18.6%) |
| $25,000 to $49,999 | 7,458 (87.2%) | 1,092 (12.8%) |
| $50,000 to $74,999 | 4,539 (75.2%) | 1,500 (24.8%) |
| $75,000 to $99,999 | 5,059 (81.3%) | 1,162 (18.7%) |
| $100,000 and over | 9,778 (87.0%) | 1,468 (13.1%) |
Public vs Private Health Insurance Coverage by Age in East Point
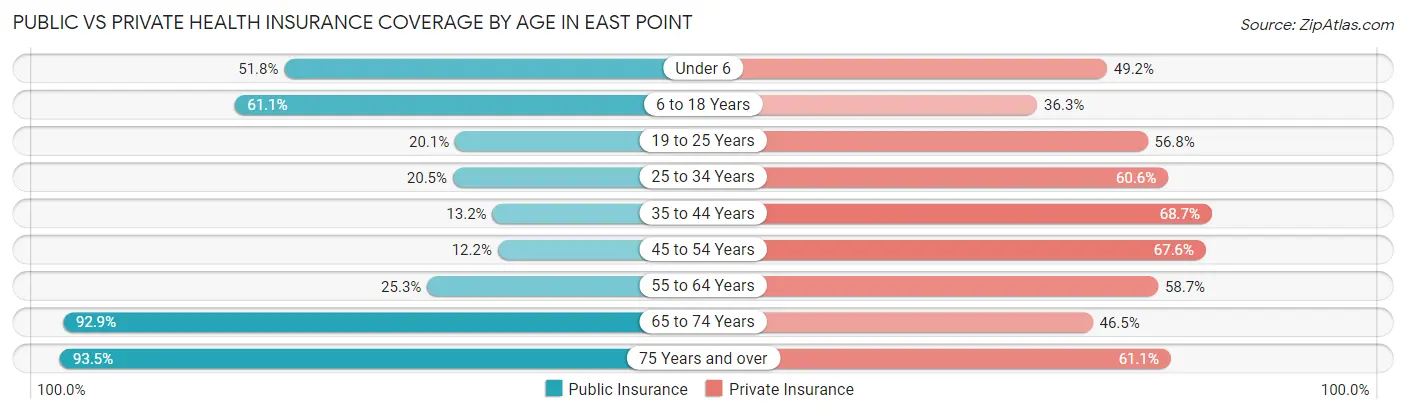
| Age Bracket | Public Insurance | Private Insurance |
| Under 6 | 1,557 (51.8%) | 1,479 (49.2%) |
| 6 to 18 Years | 3,862 (61.1%) | 2,293 (36.3%) |
| 19 to 25 Years | 789 (20.1%) | 2,228 (56.8%) |
| 25 to 34 Years | 1,230 (20.5%) | 3,631 (60.6%) |
| 35 to 44 Years | 738 (13.2%) | 3,848 (68.7%) |
| 45 to 54 Years | 613 (12.2%) | 3,400 (67.6%) |
| 55 to 64 Years | 1,070 (25.3%) | 2,484 (58.7%) |
| 65 to 74 Years | 2,429 (92.9%) | 1,217 (46.5%) |
| 75 Years and over | 1,226 (93.4%) | 801 (61.1%) |
| Total | 13,514 (35.5%) | 21,381 (56.2%) |
Disability Status by Sex by Age in East Point
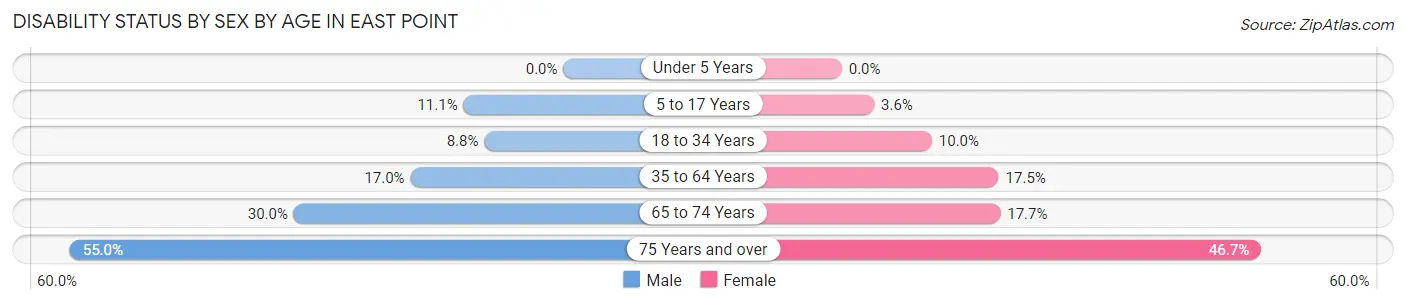
| Age Bracket | Male | Female |
| Under 5 Years | 0 (0.0%) | 0 (0.0%) |
| 5 to 17 Years | 348 (11.1%) | 123 (3.6%) |
| 18 to 34 Years | 437 (8.8%) | 530 (10.0%) |
| 35 to 64 Years | 1,145 (17.0%) | 1,423 (17.5%) |
| 65 to 74 Years | 353 (30.0%) | 254 (17.6%) |
| 75 Years and over | 255 (55.0%) | 396 (46.7%) |
Disability Class by Sex by Age in East Point
Disability Class: Hearing Difficulty
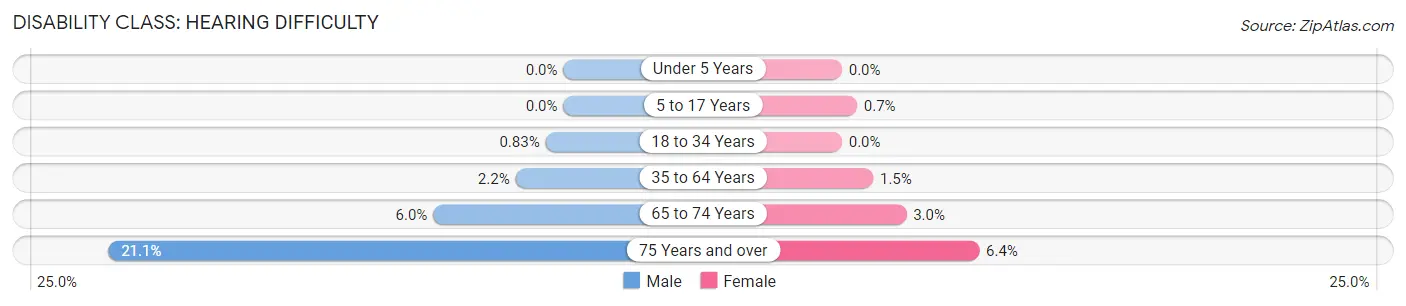
| Age Bracket | Male | Female |
| Under 5 Years | 0 (0.0%) | 0 (0.0%) |
| 5 to 17 Years | 0 (0.0%) | 24 (0.7%) |
| 18 to 34 Years | 41 (0.8%) | 0 (0.0%) |
| 35 to 64 Years | 149 (2.2%) | 118 (1.5%) |
| 65 to 74 Years | 71 (6.0%) | 43 (3.0%) |
| 75 Years and over | 98 (21.1%) | 54 (6.4%) |
Disability Class: Vision Difficulty
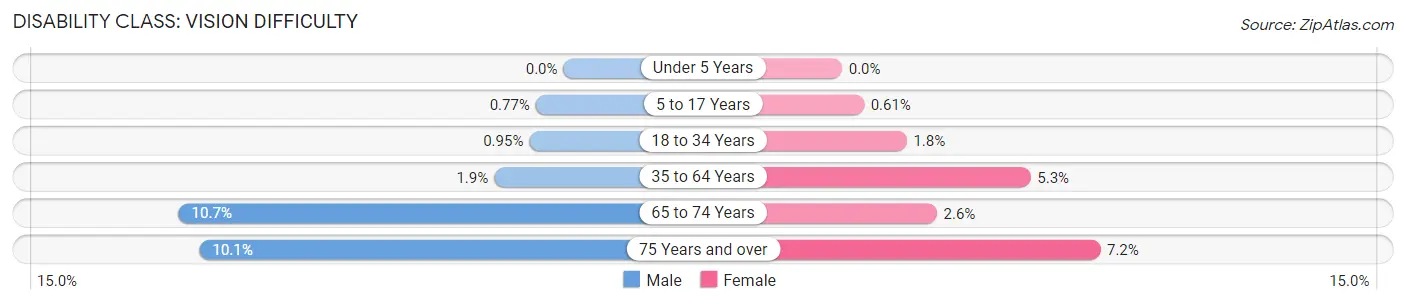
| Age Bracket | Male | Female |
| Under 5 Years | 0 (0.0%) | 0 (0.0%) |
| 5 to 17 Years | 24 (0.8%) | 21 (0.6%) |
| 18 to 34 Years | 47 (0.9%) | 95 (1.8%) |
| 35 to 64 Years | 130 (1.9%) | 428 (5.2%) |
| 65 to 74 Years | 126 (10.7%) | 38 (2.6%) |
| 75 Years and over | 47 (10.1%) | 61 (7.2%) |
Disability Class: Cognitive Difficulty
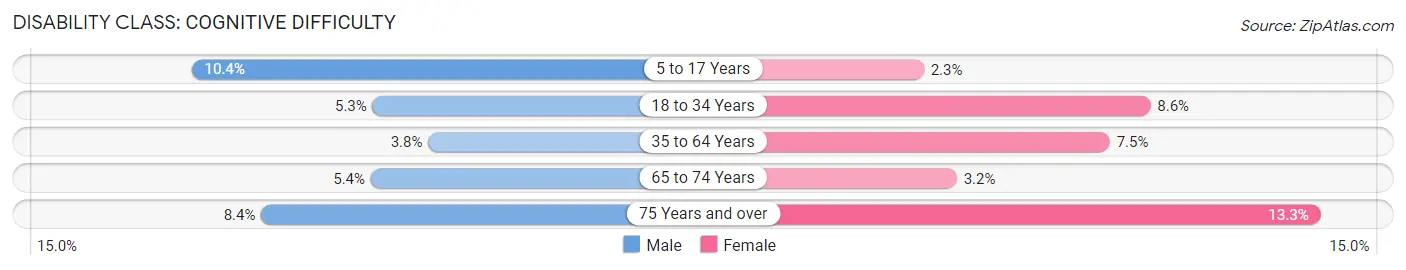
| Age Bracket | Male | Female |
| 5 to 17 Years | 324 (10.3%) | 78 (2.3%) |
| 18 to 34 Years | 264 (5.3%) | 454 (8.6%) |
| 35 to 64 Years | 253 (3.8%) | 608 (7.5%) |
| 65 to 74 Years | 63 (5.4%) | 46 (3.2%) |
| 75 Years and over | 39 (8.4%) | 113 (13.3%) |
Disability Class: Ambulatory Difficulty
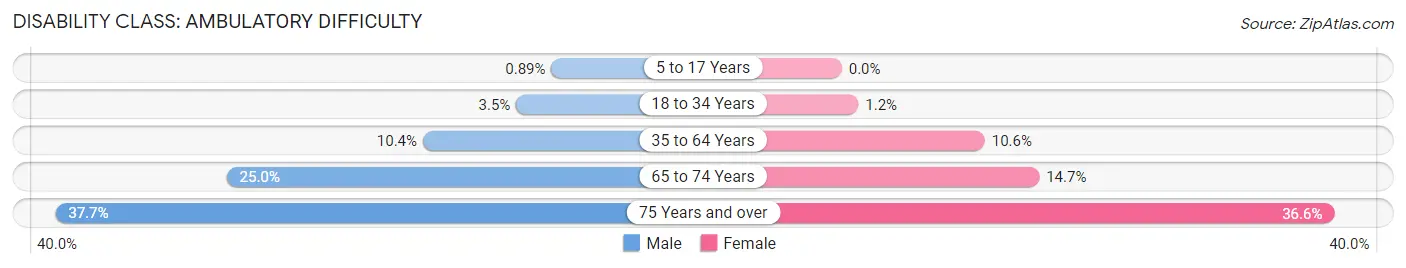
| Age Bracket | Male | Female |
| 5 to 17 Years | 28 (0.9%) | 0 (0.0%) |
| 18 to 34 Years | 174 (3.5%) | 65 (1.2%) |
| 35 to 64 Years | 701 (10.4%) | 865 (10.6%) |
| 65 to 74 Years | 294 (25.0%) | 211 (14.7%) |
| 75 Years and over | 175 (37.7%) | 310 (36.6%) |
Disability Class: Self-Care Difficulty
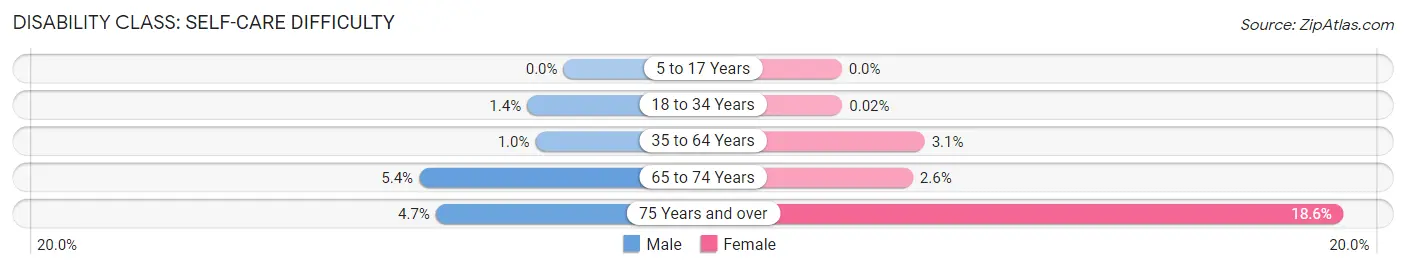
| Age Bracket | Male | Female |
| 5 to 17 Years | 0 (0.0%) | 0 (0.0%) |
| 18 to 34 Years | 67 (1.3%) | 1 (0.0%) |
| 35 to 64 Years | 70 (1.0%) | 251 (3.1%) |
| 65 to 74 Years | 63 (5.4%) | 38 (2.6%) |
| 75 Years and over | 22 (4.7%) | 158 (18.6%) |
Technology Access in East Point
Computing Device Access in East Point
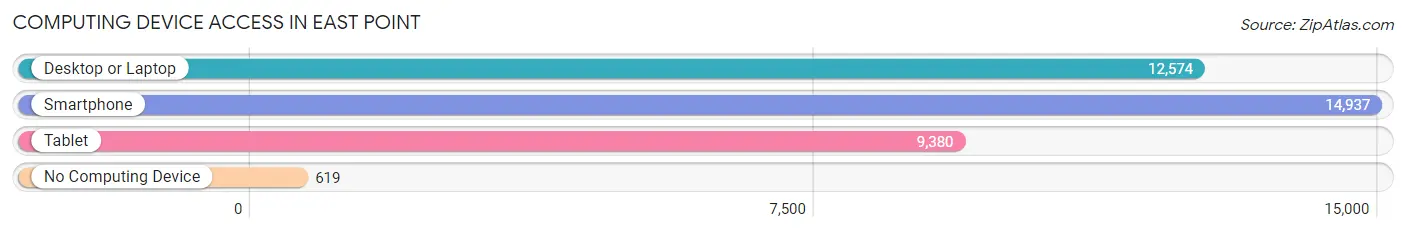
| Device Type | # Households | % Households |
| Desktop or Laptop | 12,574 | 78.3% |
| Smartphone | 14,937 | 93.0% |
| Tablet | 9,380 | 58.4% |
| No Computing Device | 619 | 3.8% |
| Total | 16,062 | 100.0% |
Internet Access in East Point
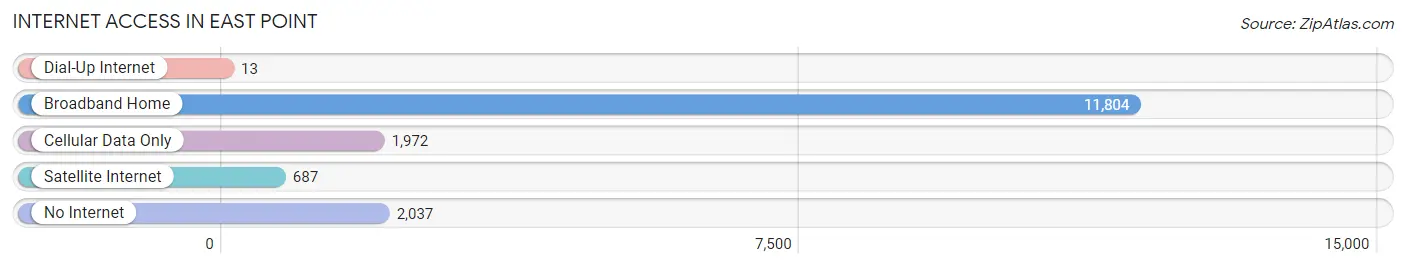
| Internet Type | # Households | % Households |
| Dial-Up Internet | 13 | 0.1% |
| Broadband Home | 11,804 | 73.5% |
| Cellular Data Only | 1,972 | 12.3% |
| Satellite Internet | 687 | 4.3% |
| No Internet | 2,037 | 12.7% |
| Total | 16,062 | 100.0% |
East Point Summary
History
East Point is a city located in Fulton County, Georgia, United States. It is located just south of Atlanta and is part of the Atlanta metropolitan area. The city was incorporated in 1887 and has a population of 35,000.
East Point was originally part of the Creek Indian Nation, and the area was known as Standing Peachtree. The Creek Indians were forced to cede the land to the state of Georgia in 1821, and the area was then divided into lots and sold to settlers. The city was named East Point because it was the easternmost point of the Atlanta and West Point Railroad.
The city grew rapidly in the late 19th and early 20th centuries, and by the 1920s it was a thriving industrial center. The city was home to several factories, including the East Point Foundry and Machine Company, which produced cast iron products. The city also had a large number of textile mills, which employed many of the city's residents.
In the 1950s, the city began to decline as the factories closed and the population moved to the suburbs. The city was hit hard by the Great Recession of 2008, and the population has continued to decline since then.
Geography
East Point is located in the southwestern part of Fulton County, Georgia, about 10 miles south of downtown Atlanta. The city is situated on the banks of the Chattahoochee River and is bordered by the cities of College Park, Hapeville, and Union City.
The city has a total area of 8.3 square miles, of which 8.2 square miles is land and 0.1 square miles is water. The terrain is mostly flat, with some rolling hills in the northern part of the city.
Economy
East Point is a diverse city with a variety of industries. The city is home to several large companies, including Delta Air Lines, which has its headquarters in the city. Other major employers include the East Point Foundry and Machine Company, the East Point Textile Mills, and the East Point Manufacturing Company.
The city also has a thriving retail sector, with several shopping centers and malls. The city is also home to several restaurants, bars, and entertainment venues.
Demographics
As of the 2010 census, East Point had a population of 33,712. The racial makeup of the city was 54.3% African American, 33.2% White, 8.2% Hispanic or Latino, 2.2% Asian, and 0.9% Native American.
The median household income in East Point was $37,845, and the median family income was $45,845. The per capita income was $20,845. About 20.3% of the population was below the poverty line.
East Point is a diverse city with a variety of cultures and backgrounds. The city is home to a large African American population, as well as a growing Hispanic population. The city also has a large number of immigrants from countries such as India, China, and Mexico.
Common Questions
What is Per Capita Income in East Point?
Per Capita income in East Point is $33,665.
What is the Median Family Income in East Point?
Median Family Income in East Point is $68,299.
What is the Median Household income in East Point?
Median Household Income in East Point is $59,602.
What is Income or Wage Gap in East Point?
Income or Wage Gap in East Point is 6.6%.
Women in East Point earn 93.4 cents for every dollar earned by a man.
What is Family Income Deficit in East Point?
Family Income Deficit in East Point is $9,323.
Families that are below poverty line in East Point earn $9,323 less on average than the poverty threshold level.
What is Inequality or Gini Index in East Point?
Inequality or Gini Index in East Point is 0.43.
What is the Total Population of East Point?
Total Population of East Point is 38,113.
What is the Total Male Population of East Point?
Total Male Population of East Point is 17,941.
What is the Total Female Population of East Point?
Total Female Population of East Point is 20,172.
What is the Ratio of Males per 100 Females in East Point?
There are 88.94 Males per 100 Females in East Point.
What is the Ratio of Females per 100 Males in East Point?
There are 112.44 Females per 100 Males in East Point.
What is the Median Population Age in East Point?
Median Population Age in East Point is 34.7 Years.
What is the Average Family Size in East Point
Average Family Size in East Point is 3.3 People.
What is the Average Household Size in East Point
Average Household Size in East Point is 2.4 People.
How Large is the Labor Force in East Point?
There are 21,281 People in the Labor Forcein in East Point.
What is the Percentage of People in the Labor Force in East Point?
71.4% of People are in the Labor Force in East Point.
What is the Unemployment Rate in East Point?
Unemployment Rate in East Point is 7.1%.