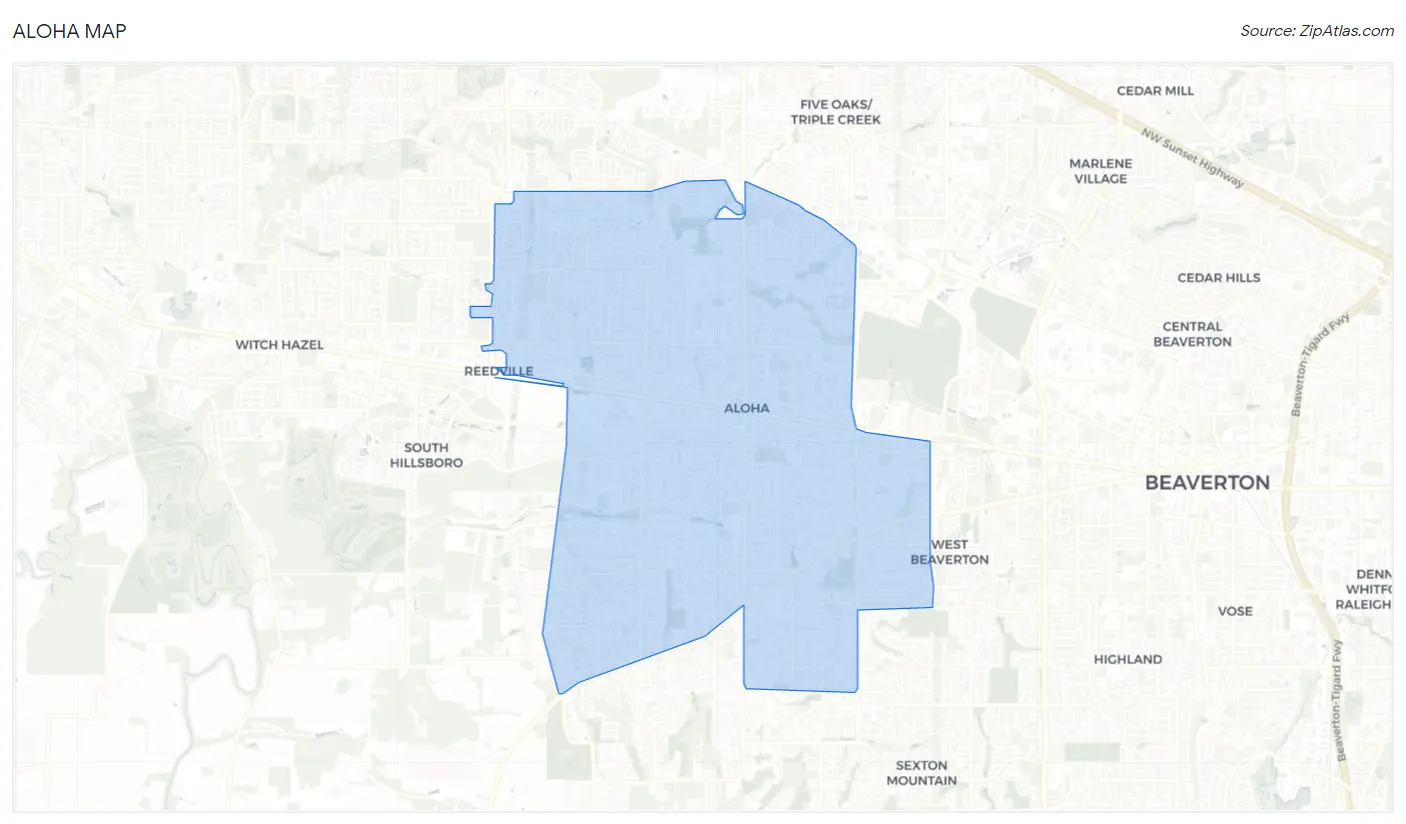
Aloha, OR Map & Demographics
Aloha Map
Aloha Overview
$37,909
PER CAPITA INCOME
$96,409
AVG FAMILY INCOME
$90,533
AVG HOUSEHOLD INCOME
24.2%
WAGE / INCOME GAP [ % ]
75.8¢/ $1
WAGE / INCOME GAP [ $ ]
0.38
INEQUALITY / GINI INDEX
53,532
TOTAL POPULATION
27,019
MALE POPULATION
26,513
FEMALE POPULATION
101.91
MALES / 100 FEMALES
98.13
FEMALES / 100 MALES
36.0
MEDIAN AGE
3.3
AVG FAMILY SIZE
2.9
AVG HOUSEHOLD SIZE
29,937
LABOR FORCE [ PEOPLE ]
69.1%
PERCENT IN LABOR FORCE
5.1%
UNEMPLOYMENT RATE
Income in Aloha
Income Overview in Aloha
Per Capita Income in Aloha is $37,909, while median incomes of families and households are $96,409 and $90,533 respectively.
| Characteristic | Number | Measure |
| Per Capita Income | 53,532 | $37,909 |
| Median Family Income | 13,096 | $96,409 |
| Mean Family Income | 13,096 | $115,698 |
| Median Household Income | 18,481 | $90,533 |
| Mean Household Income | 18,481 | $107,606 |
| Income Deficit | 13,096 | $0 |
| Wage / Income Gap (%) | 53,532 | 24.16% |
| Wage / Income Gap ($) | 53,532 | 75.84¢ per $1 |
| Gini / Inequality Index | 53,532 | 0.38 |
Earnings by Sex in Aloha
Average Earnings in Aloha are $45,508, $50,976 for men and $38,662 for women, a difference of 24.2%.
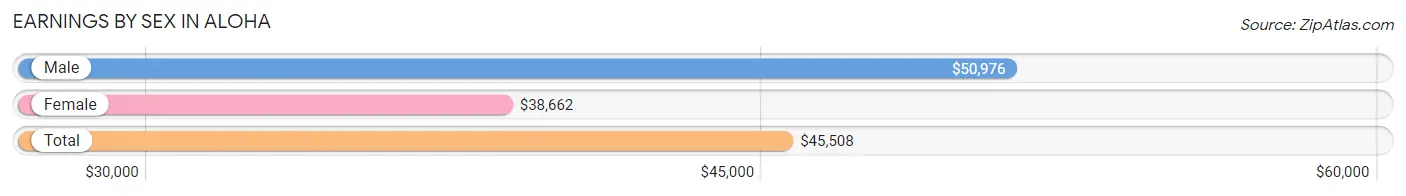
| Sex | Number | Average Earnings |
| Male | 16,750 (54.1%) | $50,976 |
| Female | 14,203 (45.9%) | $38,662 |
| Total | 30,953 (100.0%) | $45,508 |
Earnings by Sex by Income Bracket in Aloha
The most common earnings brackets in Aloha are $100,000+ for men (2,814 | 16.8%) and $75,000 to $99,999 for women (1,360 | 9.6%).
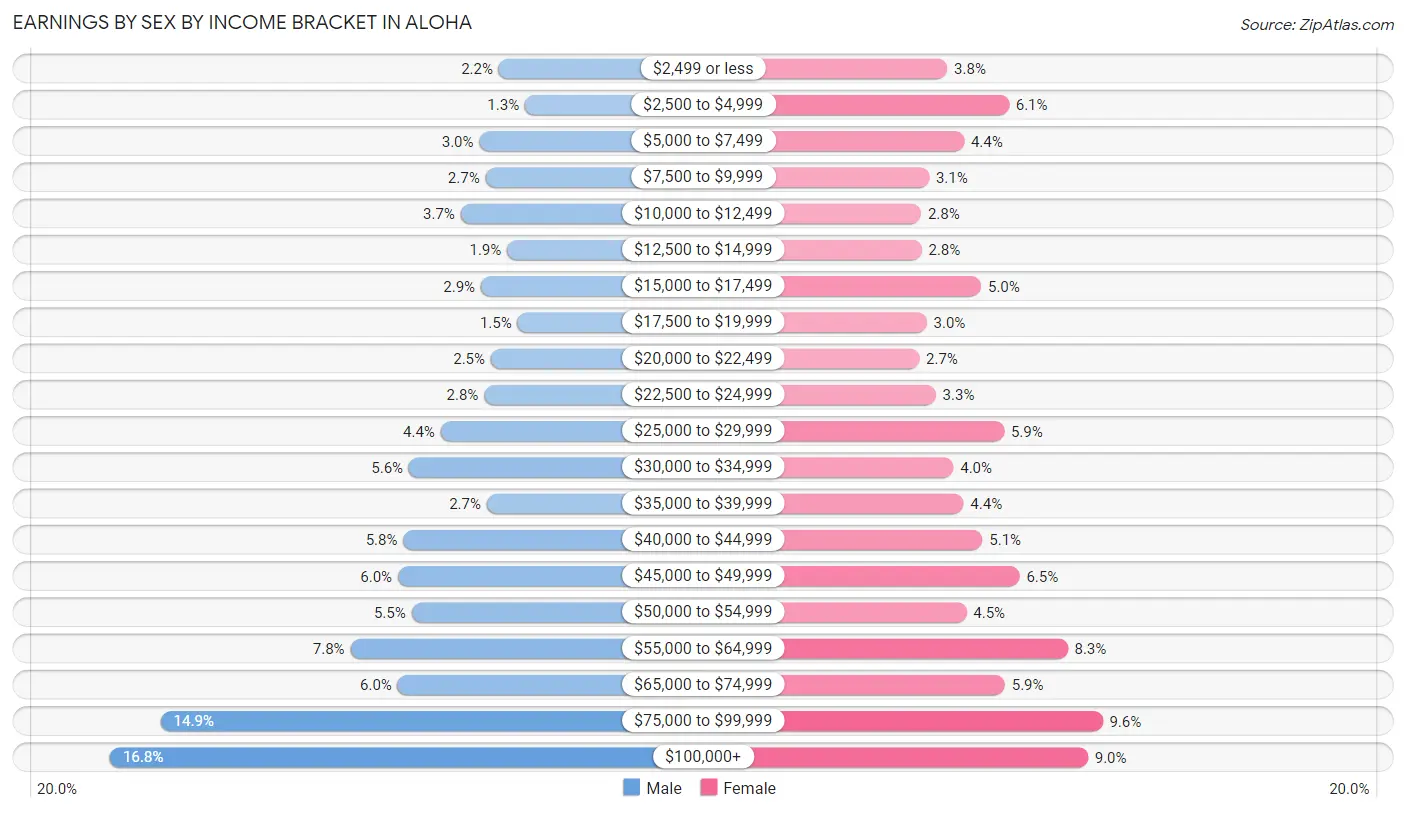
| Income | Male | Female |
| $2,499 or less | 374 (2.2%) | 534 (3.8%) |
| $2,500 to $4,999 | 209 (1.3%) | 862 (6.1%) |
| $5,000 to $7,499 | 495 (3.0%) | 623 (4.4%) |
| $7,500 to $9,999 | 458 (2.7%) | 438 (3.1%) |
| $10,000 to $12,499 | 613 (3.7%) | 395 (2.8%) |
| $12,500 to $14,999 | 322 (1.9%) | 397 (2.8%) |
| $15,000 to $17,499 | 485 (2.9%) | 714 (5.0%) |
| $17,500 to $19,999 | 256 (1.5%) | 425 (3.0%) |
| $20,000 to $22,499 | 424 (2.5%) | 385 (2.7%) |
| $22,500 to $24,999 | 466 (2.8%) | 473 (3.3%) |
| $25,000 to $29,999 | 738 (4.4%) | 836 (5.9%) |
| $30,000 to $34,999 | 938 (5.6%) | 567 (4.0%) |
| $35,000 to $39,999 | 449 (2.7%) | 620 (4.4%) |
| $40,000 to $44,999 | 973 (5.8%) | 722 (5.1%) |
| $45,000 to $49,999 | 1,006 (6.0%) | 919 (6.5%) |
| $50,000 to $54,999 | 921 (5.5%) | 636 (4.5%) |
| $55,000 to $64,999 | 1,304 (7.8%) | 1,174 (8.3%) |
| $65,000 to $74,999 | 1,009 (6.0%) | 841 (5.9%) |
| $75,000 to $99,999 | 2,496 (14.9%) | 1,360 (9.6%) |
| $100,000+ | 2,814 (16.8%) | 1,282 (9.0%) |
| Total | 16,750 (100.0%) | 14,203 (100.0%) |
Earnings by Sex by Educational Attainment in Aloha
Average earnings in Aloha are $57,331 for men and $45,205 for women, a difference of 21.1%. Men with an educational attainment of graduate degree enjoy the highest average annual earnings of $116,667, while those with high school diploma education earn the least with $45,753. Women with an educational attainment of graduate degree earn the most with the average annual earnings of $57,941, while those with less than high school education have the smallest earnings of $26,190.
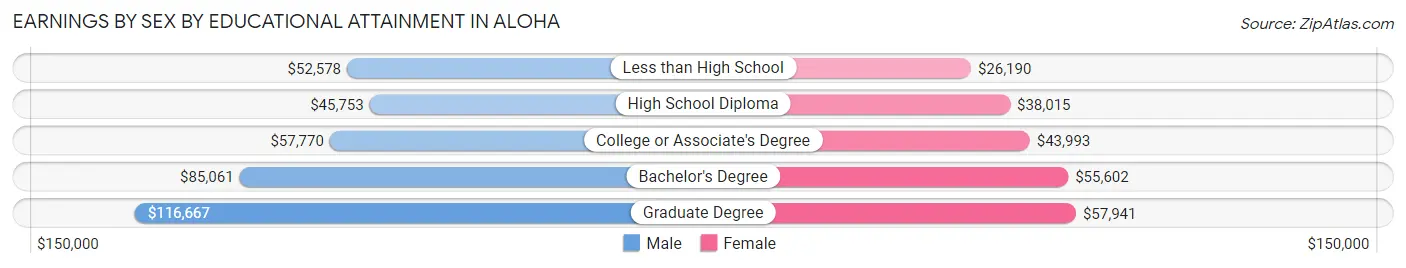
| Educational Attainment | Male Income | Female Income |
| Less than High School | $52,578 | $26,190 |
| High School Diploma | $45,753 | $38,015 |
| College or Associate's Degree | $57,770 | $43,993 |
| Bachelor's Degree | $85,061 | $55,602 |
| Graduate Degree | $116,667 | $57,941 |
| Total | $57,331 | $45,205 |
Family Income in Aloha
Family Income Brackets in Aloha
According to the Aloha family income data, there are 3,182 families falling into the $100,000 to $149,999 income range, which is the most common income bracket and makes up 24.3% of all families. Conversely, the $10,000 to $14,999 income bracket is the least frequent group with only 118 families (0.9%) belonging to this category.
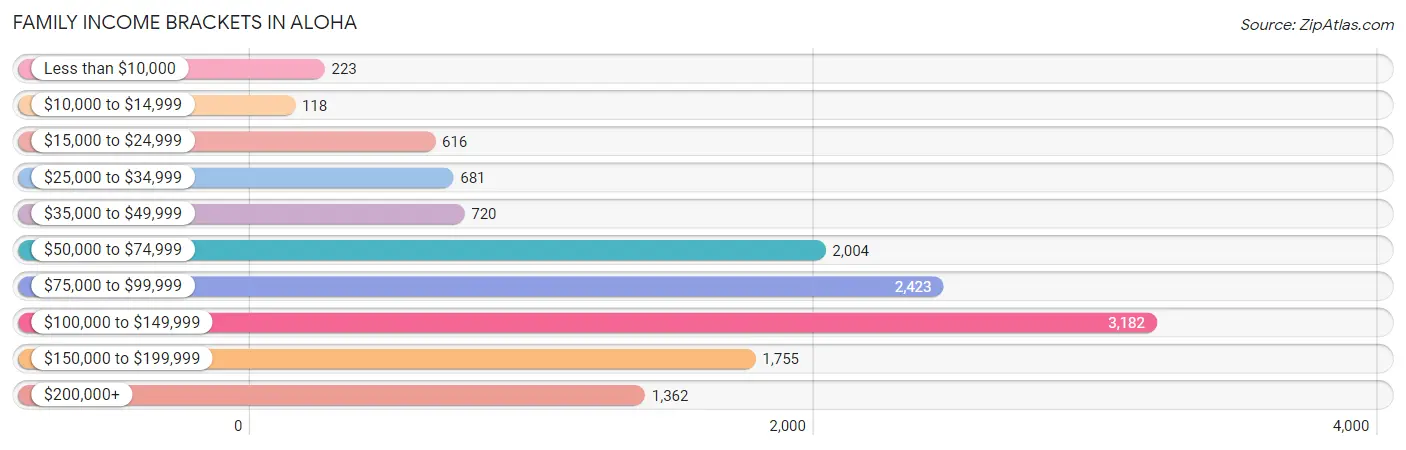
| Income Bracket | # Families | % Families |
| Less than $10,000 | 223 | 1.7% |
| $10,000 to $14,999 | 118 | 0.9% |
| $15,000 to $24,999 | 616 | 4.7% |
| $25,000 to $34,999 | 681 | 5.2% |
| $35,000 to $49,999 | 720 | 5.5% |
| $50,000 to $74,999 | 2,004 | 15.3% |
| $75,000 to $99,999 | 2,423 | 18.5% |
| $100,000 to $149,999 | 3,182 | 24.3% |
| $150,000 to $199,999 | 1,755 | 13.4% |
| $200,000+ | 1,362 | 10.4% |
Family Income by Famaliy Size in Aloha
6-person families (462 | 3.5%) account for the highest median family income in Aloha with $115,476 per family, while 2-person families (5,692 | 43.5%) have the highest median income of $43,566 per family member.
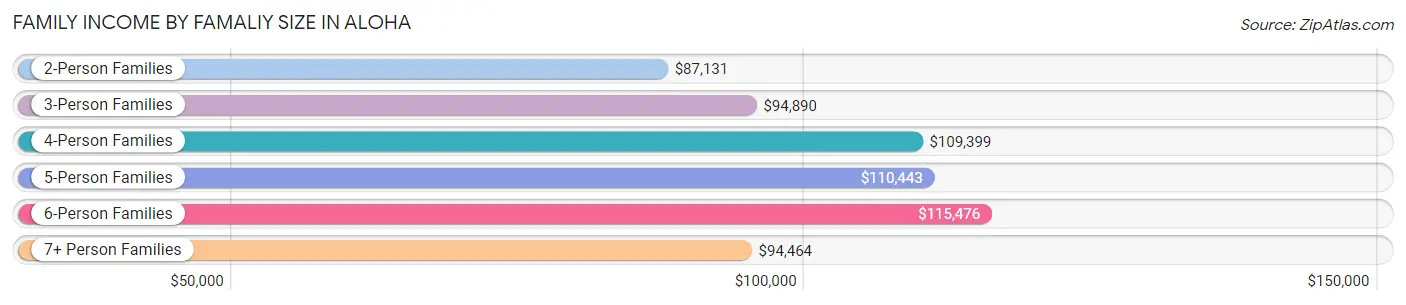
| Income Bracket | # Families | Median Income |
| 2-Person Families | 5,692 (43.5%) | $87,131 |
| 3-Person Families | 2,786 (21.3%) | $94,890 |
| 4-Person Families | 2,582 (19.7%) | $109,399 |
| 5-Person Families | 1,283 (9.8%) | $110,443 |
| 6-Person Families | 462 (3.5%) | $115,476 |
| 7+ Person Families | 291 (2.2%) | $94,464 |
| Total | 13,096 (100.0%) | $96,409 |
Family Income by Number of Earners in Aloha
The median family income in Aloha is $96,409, with families comprising 3+ earners (2,330) having the highest median family income of $147,075, while families with no earners (1,323) have the lowest median family income of $49,464, accounting for 17.8% and 10.1% of families, respectively.
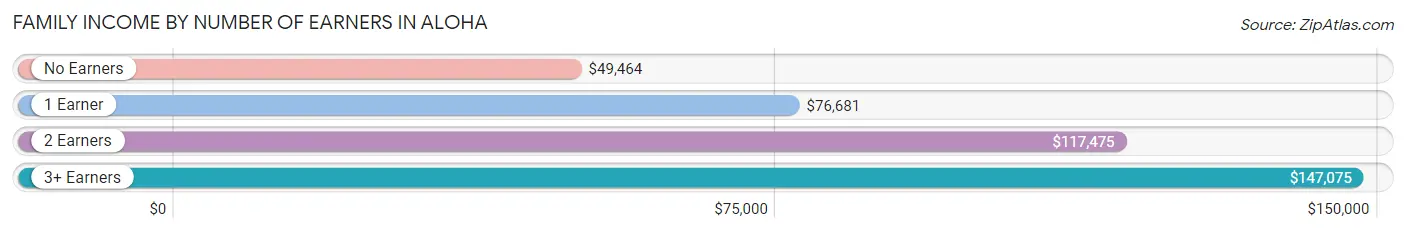
| Number of Earners | # Families | Median Income |
| No Earners | 1,323 (10.1%) | $49,464 |
| 1 Earner | 3,627 (27.7%) | $76,681 |
| 2 Earners | 5,816 (44.4%) | $117,475 |
| 3+ Earners | 2,330 (17.8%) | $147,075 |
| Total | 13,096 (100.0%) | $96,409 |
Household Income in Aloha
Household Income Brackets in Aloha
With 4,269 households falling in the category, the $100,000 to $149,999 income range is the most frequent in Aloha, accounting for 23.1% of all households. In contrast, only 388 households (2.1%) fall into the less than $10,000 income bracket, making it the least populous group.
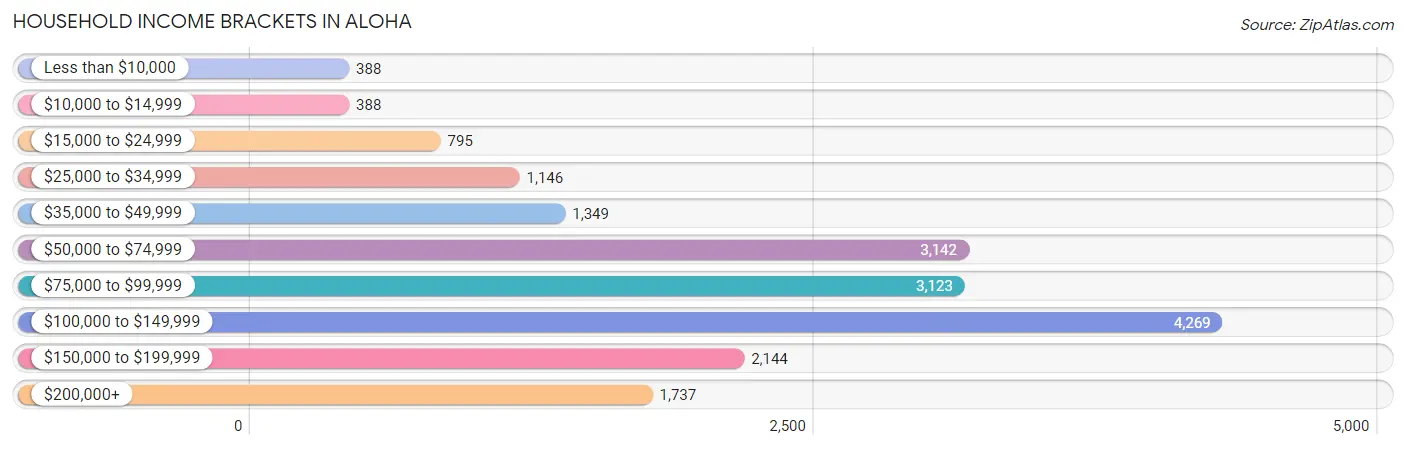
| Income Bracket | # Households | % Households |
| Less than $10,000 | 388 | 2.1% |
| $10,000 to $14,999 | 388 | 2.1% |
| $15,000 to $24,999 | 795 | 4.3% |
| $25,000 to $34,999 | 1,146 | 6.2% |
| $35,000 to $49,999 | 1,349 | 7.3% |
| $50,000 to $74,999 | 3,142 | 17.0% |
| $75,000 to $99,999 | 3,123 | 16.9% |
| $100,000 to $149,999 | 4,269 | 23.1% |
| $150,000 to $199,999 | 2,144 | 11.6% |
| $200,000+ | 1,737 | 9.4% |
Household Income by Householder Age in Aloha
The median household income in Aloha is $90,533, with the highest median household income of $102,593 found in the 25 to 44 years age bracket for the primary householder. A total of 7,187 households (38.9%) fall into this category. Meanwhile, the 15 to 24 years age bracket for the primary householder has the lowest median household income of $57,273, with 806 households (4.4%) in this group.
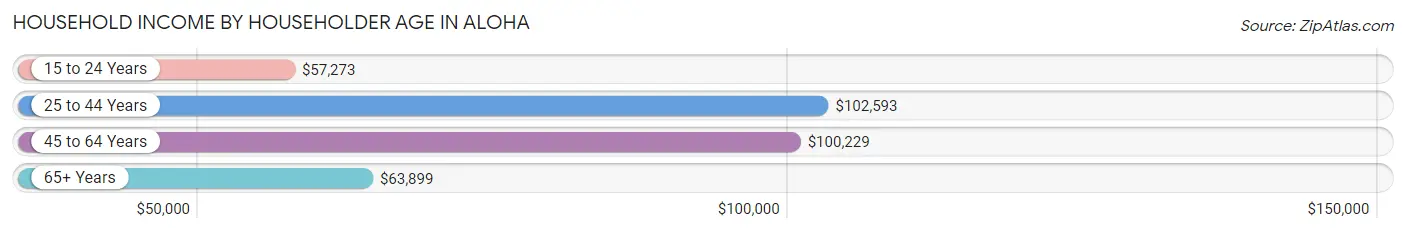
| Income Bracket | # Households | Median Income |
| 15 to 24 Years | 806 (4.4%) | $57,273 |
| 25 to 44 Years | 7,187 (38.9%) | $102,593 |
| 45 to 64 Years | 7,073 (38.3%) | $100,229 |
| 65+ Years | 3,415 (18.5%) | $63,899 |
| Total | 18,481 (100.0%) | $90,533 |
Poverty in Aloha
Income Below Poverty by Sex and Age in Aloha
With 7.7% poverty level for males and 11.6% for females among the residents of Aloha, 6 to 11 year old males and 16 and 17 year old females are the most vulnerable to poverty, with 295 males (16.0%) and 203 females (27.5%) in their respective age groups living below the poverty level.
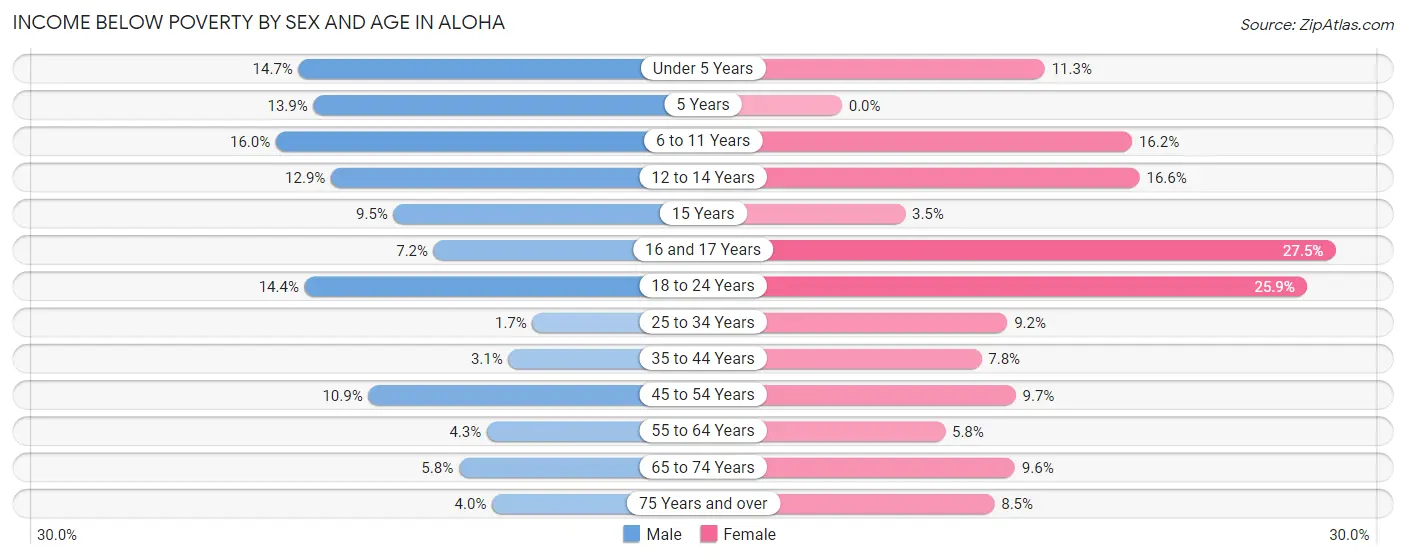
| Age Bracket | Male | Female |
| Under 5 Years | 210 (14.7%) | 146 (11.3%) |
| 5 Years | 21 (13.9%) | 0 (0.0%) |
| 6 to 11 Years | 295 (16.0%) | 317 (16.2%) |
| 12 to 14 Years | 134 (12.9%) | 188 (16.6%) |
| 15 Years | 46 (9.5%) | 17 (3.5%) |
| 16 and 17 Years | 69 (7.2%) | 203 (27.5%) |
| 18 to 24 Years | 420 (14.4%) | 671 (25.9%) |
| 25 to 34 Years | 75 (1.7%) | 359 (9.2%) |
| 35 to 44 Years | 128 (3.0%) | 327 (7.8%) |
| 45 to 54 Years | 409 (10.8%) | 314 (9.7%) |
| 55 to 64 Years | 127 (4.3%) | 176 (5.8%) |
| 65 to 74 Years | 104 (5.8%) | 231 (9.6%) |
| 75 Years and over | 39 (4.0%) | 102 (8.5%) |
| Total | 2,077 (7.7%) | 3,051 (11.6%) |
Income Above Poverty by Sex and Age in Aloha
According to the poverty statistics in Aloha, males aged 25 to 34 years and females aged 5 years are the age groups that are most secure financially, with 98.3% of males and 100.0% of females in these age groups living above the poverty line.
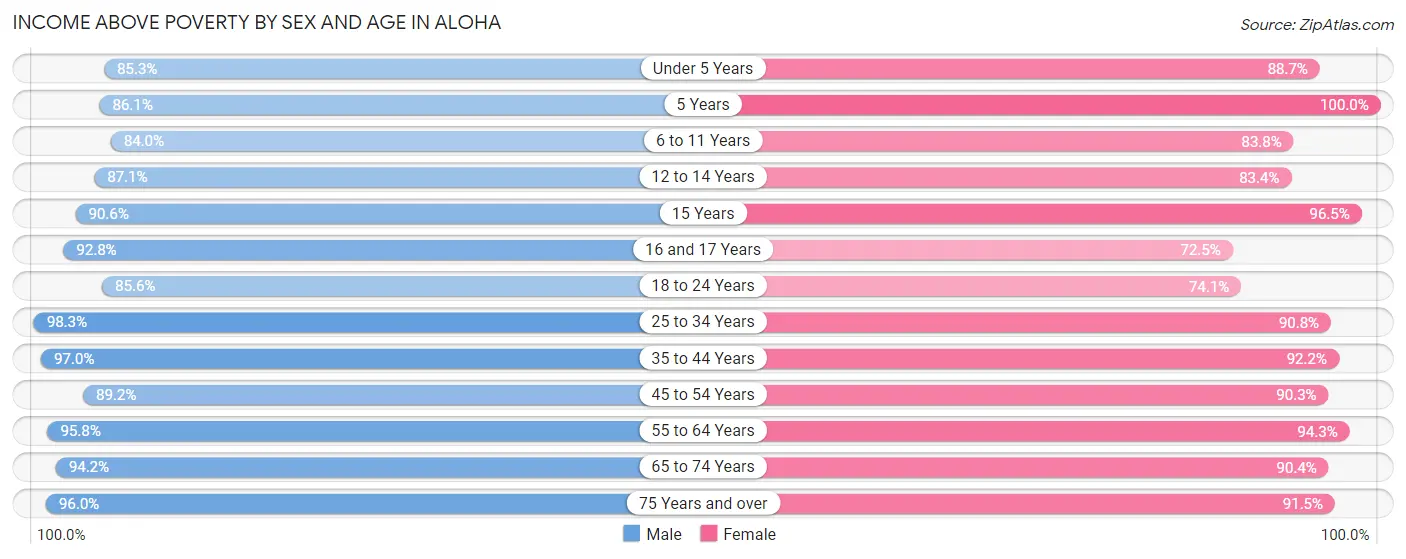
| Age Bracket | Male | Female |
| Under 5 Years | 1,215 (85.3%) | 1,146 (88.7%) |
| 5 Years | 130 (86.1%) | 182 (100.0%) |
| 6 to 11 Years | 1,549 (84.0%) | 1,645 (83.8%) |
| 12 to 14 Years | 902 (87.1%) | 946 (83.4%) |
| 15 Years | 441 (90.5%) | 466 (96.5%) |
| 16 and 17 Years | 888 (92.8%) | 536 (72.5%) |
| 18 to 24 Years | 2,496 (85.6%) | 1,922 (74.1%) |
| 25 to 34 Years | 4,300 (98.3%) | 3,541 (90.8%) |
| 35 to 44 Years | 4,062 (97.0%) | 3,881 (92.2%) |
| 45 to 54 Years | 3,361 (89.1%) | 2,929 (90.3%) |
| 55 to 64 Years | 2,860 (95.8%) | 2,883 (94.3%) |
| 65 to 74 Years | 1,687 (94.2%) | 2,165 (90.4%) |
| 75 Years and over | 945 (96.0%) | 1,100 (91.5%) |
| Total | 24,836 (92.3%) | 23,342 (88.4%) |
Income Below Poverty Among Married-Couple Families in Aloha
The poverty statistics for married-couple families in Aloha show that 3.0% or 302 of the total 9,922 families live below the poverty line. Families with 5 or more children have the highest poverty rate of 45.9%, comprising of 56 families. On the other hand, families with no children have the lowest poverty rate of 1.2%, which includes 63 families.
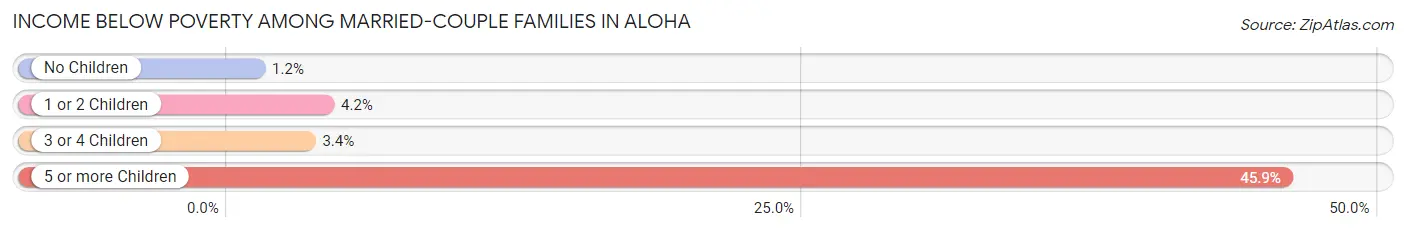
| Children | Above Poverty | Below Poverty |
| No Children | 5,255 (98.8%) | 63 (1.2%) |
| 1 or 2 Children | 3,783 (95.8%) | 165 (4.2%) |
| 3 or 4 Children | 516 (96.6%) | 18 (3.4%) |
| 5 or more Children | 66 (54.1%) | 56 (45.9%) |
| Total | 9,620 (97.0%) | 302 (3.0%) |
Income Below Poverty Among Single-Parent Households in Aloha
According to the poverty data in Aloha, 5.3% or 69 single-father households and 17.2% or 323 single-mother households are living below the poverty line. Among single-father households, those with 1 or 2 children have the highest poverty rate, with 69 households (8.1%) experiencing poverty. Likewise, among single-mother households, those with 3 or 4 children have the highest poverty rate, with 156 households (93.4%) falling below the poverty line.
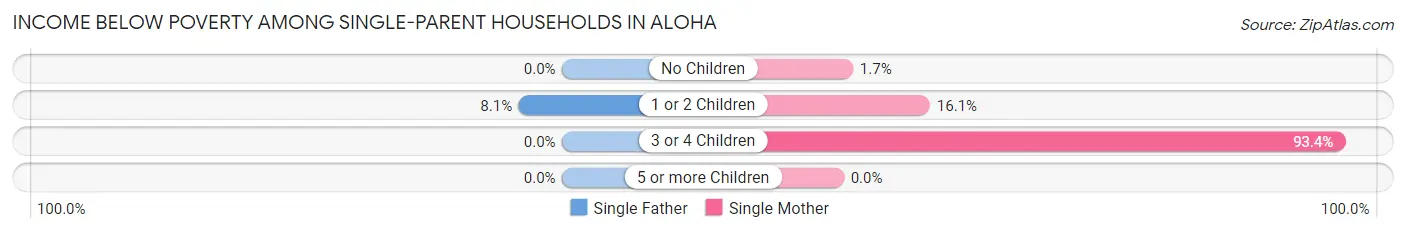
| Children | Single Father | Single Mother |
| No Children | 0 (0.0%) | 13 (1.7%) |
| 1 or 2 Children | 69 (8.1%) | 154 (16.1%) |
| 3 or 4 Children | 0 (0.0%) | 156 (93.4%) |
| 5 or more Children | 0 (0.0%) | 0 (0.0%) |
| Total | 69 (5.3%) | 323 (17.2%) |
Income Below Poverty Among Married-Couple vs Single-Parent Households in Aloha
The poverty data for Aloha shows that 302 of the married-couple family households (3.0%) and 392 of the single-parent households (12.3%) are living below the poverty level. Within the married-couple family households, those with 5 or more children have the highest poverty rate, with 56 households (45.9%) falling below the poverty line. Among the single-parent households, those with 3 or 4 children have the highest poverty rate, with 156 household (88.6%) living below poverty.
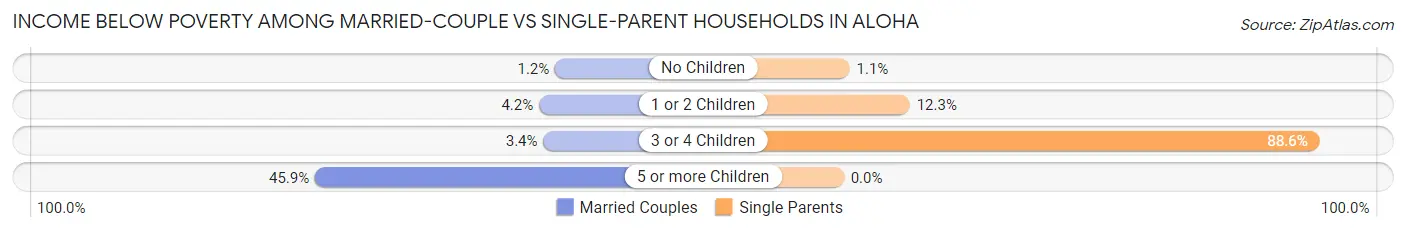
| Children | Married-Couple Families | Single-Parent Households |
| No Children | 63 (1.2%) | 13 (1.1%) |
| 1 or 2 Children | 165 (4.2%) | 223 (12.3%) |
| 3 or 4 Children | 18 (3.4%) | 156 (88.6%) |
| 5 or more Children | 56 (45.9%) | 0 (0.0%) |
| Total | 302 (3.0%) | 392 (12.3%) |
Race in Aloha
The most populous races in Aloha are White / Caucasian (32,310 | 60.4%), Hispanic or Latino (13,625 | 25.5%), and Two or more Races (8,115 | 15.2%).
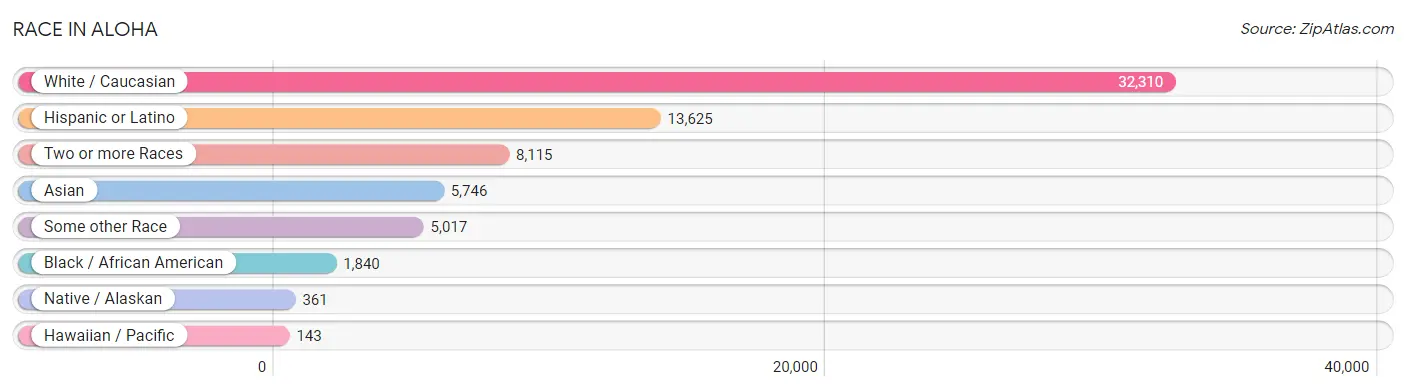
| Race | # Population | % Population |
| Asian | 5,746 | 10.7% |
| Black / African American | 1,840 | 3.4% |
| Hawaiian / Pacific | 143 | 0.3% |
| Hispanic or Latino | 13,625 | 25.5% |
| Native / Alaskan | 361 | 0.7% |
| White / Caucasian | 32,310 | 60.4% |
| Two or more Races | 8,115 | 15.2% |
| Some other Race | 5,017 | 9.4% |
| Total | 53,532 | 100.0% |
Ancestry in Aloha
The most populous ancestries reported in Aloha are Mexican (11,326 | 21.2%), German (5,746 | 10.7%), English (5,220 | 9.8%), Irish (3,427 | 6.4%), and American (2,243 | 4.2%), together accounting for 52.2% of all Aloha residents.

| Ancestry | # Population | % Population |
| Afghan | 107 | 0.2% |
| African | 197 | 0.4% |
| Aleut | 9 | 0.0% |
| American | 2,243 | 4.2% |
| Apache | 3 | 0.0% |
| Arab | 549 | 1.0% |
| Argentinean | 14 | 0.0% |
| Armenian | 19 | 0.0% |
| Assyrian / Chaldean / Syriac | 9 | 0.0% |
| Australian | 6 | 0.0% |
| Austrian | 122 | 0.2% |
| Bangladeshi | 24 | 0.0% |
| Basque | 21 | 0.0% |
| Belgian | 24 | 0.0% |
| Belizean | 7 | 0.0% |
| Bhutanese | 949 | 1.8% |
| Blackfeet | 97 | 0.2% |
| Brazilian | 10 | 0.0% |
| British | 565 | 1.1% |
| Bulgarian | 17 | 0.0% |
| Burmese | 506 | 0.9% |
| Canadian | 81 | 0.2% |
| Celtic | 5 | 0.0% |
| Central American | 758 | 1.4% |
| Central American Indian | 91 | 0.2% |
| Cherokee | 327 | 0.6% |
| Chilean | 65 | 0.1% |
| Chippewa | 27 | 0.1% |
| Choctaw | 7 | 0.0% |
| Colombian | 156 | 0.3% |
| Croatian | 24 | 0.0% |
| Cuban | 29 | 0.1% |
| Czech | 118 | 0.2% |
| Czechoslovakian | 35 | 0.1% |
| Danish | 529 | 1.0% |
| Dutch | 582 | 1.1% |
| Eastern European | 125 | 0.2% |
| Ecuadorian | 64 | 0.1% |
| English | 5,220 | 9.8% |
| Ethiopian | 159 | 0.3% |
| European | 2,092 | 3.9% |
| Filipino | 42 | 0.1% |
| Finnish | 162 | 0.3% |
| French | 1,093 | 2.0% |
| French Canadian | 147 | 0.3% |
| German | 5,746 | 10.7% |
| Greek | 141 | 0.3% |
| Guamanian / Chamorro | 182 | 0.3% |
| Guatemalan | 275 | 0.5% |
| Honduran | 133 | 0.3% |
| Hungarian | 137 | 0.3% |
| Icelander | 37 | 0.1% |
| Indian (Asian) | 1,016 | 1.9% |
| Iranian | 33 | 0.1% |
| Iraqi | 323 | 0.6% |
| Irish | 3,427 | 6.4% |
| Iroquois | 9 | 0.0% |
| Israeli | 38 | 0.1% |
| Italian | 1,238 | 2.3% |
| Jamaican | 30 | 0.1% |
| Japanese | 606 | 1.1% |
| Kenyan | 79 | 0.2% |
| Korean | 1,566 | 2.9% |
| Lebanese | 91 | 0.2% |
| Liberian | 37 | 0.1% |
| Lithuanian | 5 | 0.0% |
| Luxembourger | 15 | 0.0% |
| Macedonian | 14 | 0.0% |
| Malaysian | 120 | 0.2% |
| Maltese | 30 | 0.1% |
| Mexican | 11,326 | 21.2% |
| Mexican American Indian | 161 | 0.3% |
| Mongolian | 18 | 0.0% |
| Native Hawaiian | 329 | 0.6% |
| Navajo | 85 | 0.2% |
| New Zealander | 17 | 0.0% |
| Nicaraguan | 64 | 0.1% |
| Nigerian | 22 | 0.0% |
| Northern European | 368 | 0.7% |
| Norwegian | 1,583 | 3.0% |
| Ottawa | 4 | 0.0% |
| Pakistani | 83 | 0.2% |
| Palestinian | 64 | 0.1% |
| Panamanian | 10 | 0.0% |
| Pennsylvania German | 8 | 0.0% |
| Peruvian | 34 | 0.1% |
| Polish | 572 | 1.1% |
| Portuguese | 71 | 0.1% |
| Puerto Rican | 250 | 0.5% |
| Puget Sound Salish | 33 | 0.1% |
| Romanian | 213 | 0.4% |
| Russian | 251 | 0.5% |
| Salvadoran | 276 | 0.5% |
| Samoan | 9 | 0.0% |
| Scandinavian | 390 | 0.7% |
| Scotch-Irish | 474 | 0.9% |
| Scottish | 1,091 | 2.0% |
| Serbian | 98 | 0.2% |
| Shoshone | 67 | 0.1% |
| Sioux | 96 | 0.2% |
| Slavic | 54 | 0.1% |
| Slovak | 15 | 0.0% |
| Slovene | 12 | 0.0% |
| Somali | 170 | 0.3% |
| South African | 32 | 0.1% |
| South American | 743 | 1.4% |
| Spaniard | 213 | 0.4% |
| Spanish | 104 | 0.2% |
| Sri Lankan | 1,939 | 3.6% |
| Subsaharan African | 707 | 1.3% |
| Swedish | 741 | 1.4% |
| Swiss | 211 | 0.4% |
| Thai | 762 | 1.4% |
| Trinidadian and Tobagonian | 30 | 0.1% |
| Turkish | 13 | 0.0% |
| Ukrainian | 162 | 0.3% |
| Uruguayan | 372 | 0.7% |
| Venezuelan | 38 | 0.1% |
| Vietnamese | 24 | 0.0% |
| Welsh | 350 | 0.6% |
| Yugoslavian | 11 | 0.0% | View All 121 Rows |
Immigrants in Aloha
The most numerous immigrant groups reported in Aloha came from Latin America (5,209 | 9.7%), Central America (4,820 | 9.0%), Asia (4,660 | 8.7%), Mexico (4,307 | 8.1%), and South Eastern Asia (2,369 | 4.4%), together accounting for 39.9% of all Aloha residents.
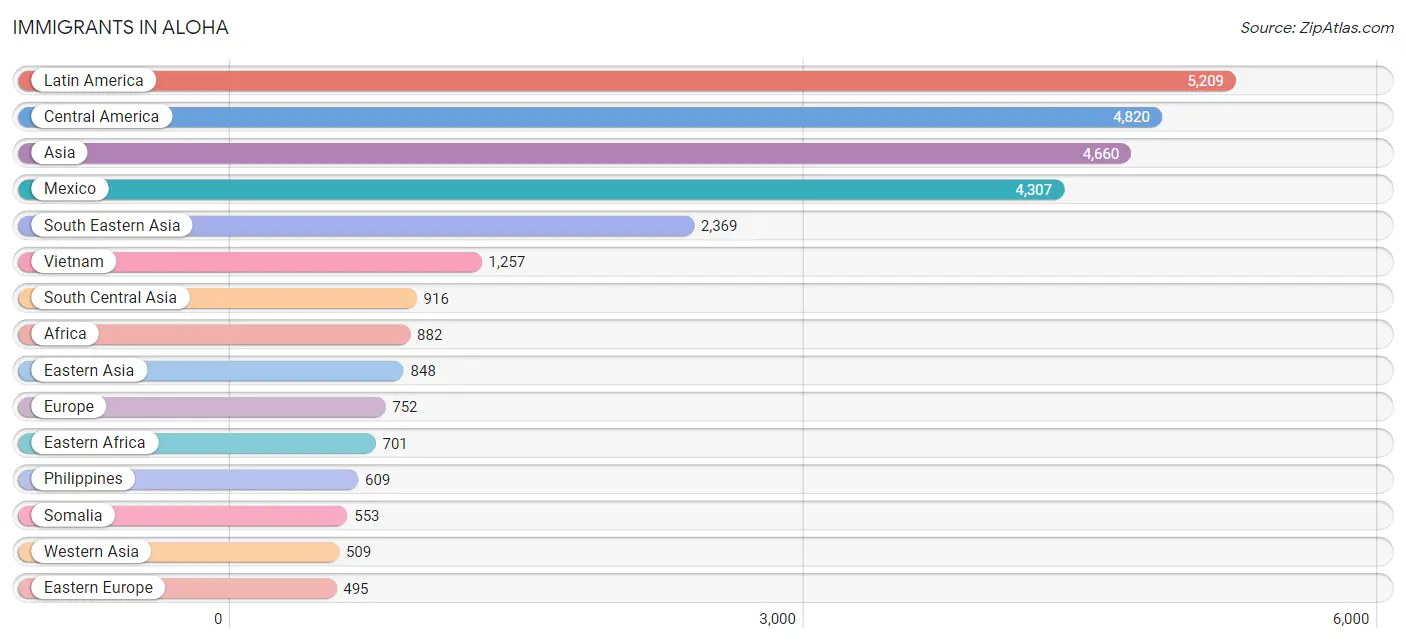
| Immigration Origin | # Population | % Population |
| Afghanistan | 123 | 0.2% |
| Africa | 882 | 1.7% |
| Argentina | 14 | 0.0% |
| Armenia | 19 | 0.0% |
| Asia | 4,660 | 8.7% |
| Bangladesh | 24 | 0.0% |
| Brazil | 34 | 0.1% |
| Bulgaria | 9 | 0.0% |
| Cambodia | 409 | 0.8% |
| Canada | 63 | 0.1% |
| Central America | 4,820 | 9.0% |
| Chile | 65 | 0.1% |
| China | 423 | 0.8% |
| Colombia | 38 | 0.1% |
| Congo | 25 | 0.1% |
| Czechoslovakia | 7 | 0.0% |
| Denmark | 19 | 0.0% |
| Eastern Africa | 701 | 1.3% |
| Eastern Asia | 848 | 1.6% |
| Eastern Europe | 495 | 0.9% |
| Ecuador | 17 | 0.0% |
| El Salvador | 142 | 0.3% |
| England | 33 | 0.1% |
| Ethiopia | 111 | 0.2% |
| Europe | 752 | 1.4% |
| Fiji | 22 | 0.0% |
| France | 9 | 0.0% |
| Germany | 55 | 0.1% |
| Guatemala | 276 | 0.5% |
| India | 376 | 0.7% |
| Iran | 15 | 0.0% |
| Iraq | 347 | 0.6% |
| Ireland | 26 | 0.1% |
| Israel | 42 | 0.1% |
| Japan | 118 | 0.2% |
| Kazakhstan | 32 | 0.1% |
| Kenya | 37 | 0.1% |
| Korea | 307 | 0.6% |
| Laos | 38 | 0.1% |
| Latin America | 5,209 | 9.7% |
| Lebanon | 21 | 0.0% |
| Liberia | 19 | 0.0% |
| Malaysia | 13 | 0.0% |
| Mexico | 4,307 | 8.1% |
| Middle Africa | 43 | 0.1% |
| Nepal | 122 | 0.2% |
| Netherlands | 9 | 0.0% |
| Nicaragua | 64 | 0.1% |
| Nigeria | 23 | 0.0% |
| North Macedonia | 43 | 0.1% |
| Northern Africa | 76 | 0.1% |
| Northern Europe | 165 | 0.3% |
| Oceania | 39 | 0.1% |
| Pakistan | 97 | 0.2% |
| Panama | 31 | 0.1% |
| Peru | 65 | 0.1% |
| Philippines | 609 | 1.1% |
| Poland | 7 | 0.0% |
| Romania | 121 | 0.2% |
| Russia | 91 | 0.2% |
| Saudi Arabia | 67 | 0.1% |
| Serbia | 91 | 0.2% |
| Somalia | 553 | 1.0% |
| South Africa | 20 | 0.0% |
| South America | 389 | 0.7% |
| South Central Asia | 916 | 1.7% |
| South Eastern Asia | 2,369 | 4.4% |
| Southern Europe | 19 | 0.0% |
| Spain | 19 | 0.0% |
| Sri Lanka | 86 | 0.2% |
| Sudan | 76 | 0.1% |
| Taiwan | 46 | 0.1% |
| Thailand | 43 | 0.1% |
| Turkey | 13 | 0.0% |
| Ukraine | 126 | 0.2% |
| Uruguay | 133 | 0.3% |
| Uzbekistan | 41 | 0.1% |
| Venezuela | 23 | 0.0% |
| Vietnam | 1,257 | 2.4% |
| Western Africa | 42 | 0.1% |
| Western Asia | 509 | 0.9% |
| Western Europe | 73 | 0.1% |
| Zaire | 18 | 0.0% | View All 83 Rows |
Sex and Age in Aloha
Sex and Age in Aloha
The most populous age groups in Aloha are 30 to 34 Years (2,449 | 9.1%) for men and 40 to 44 Years (2,181 | 8.2%) for women.
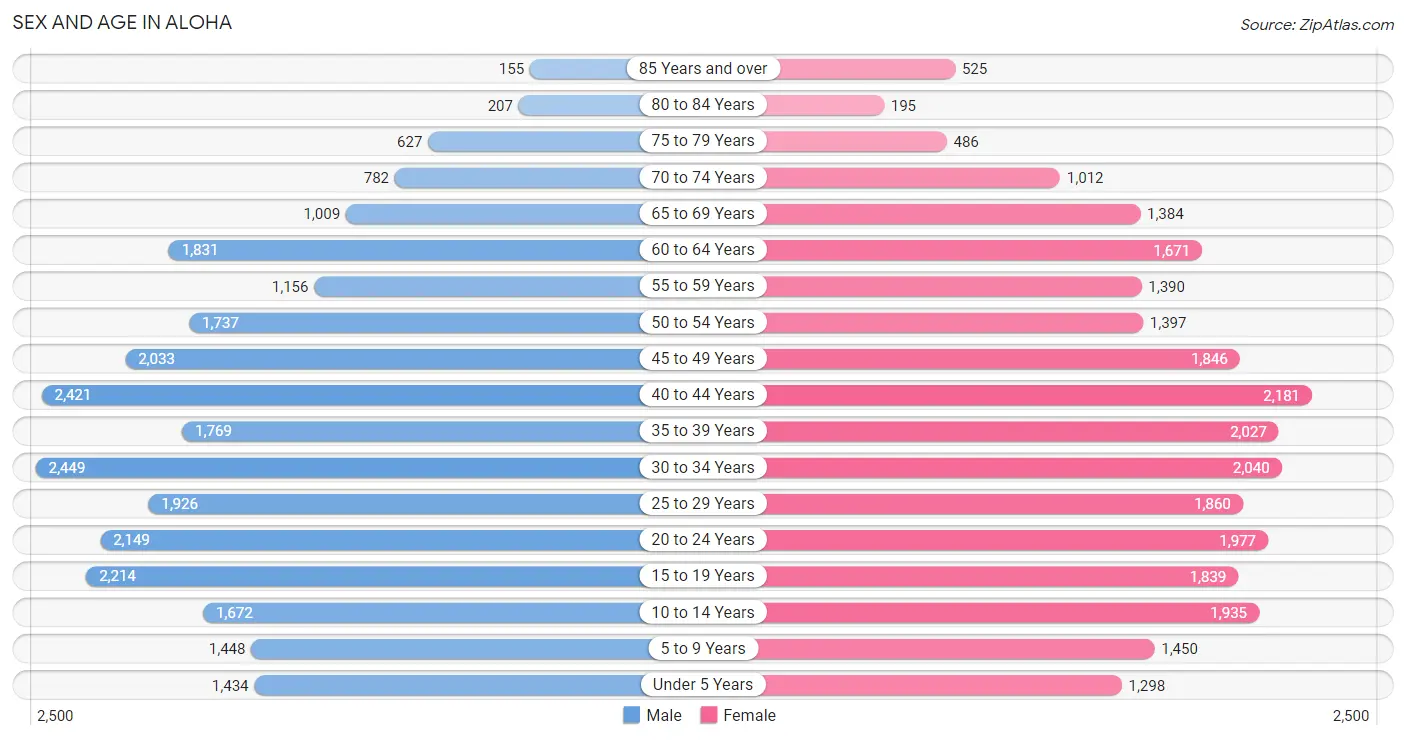
| Age Bracket | Male | Female |
| Under 5 Years | 1,434 (5.3%) | 1,298 (4.9%) |
| 5 to 9 Years | 1,448 (5.4%) | 1,450 (5.5%) |
| 10 to 14 Years | 1,672 (6.2%) | 1,935 (7.3%) |
| 15 to 19 Years | 2,214 (8.2%) | 1,839 (6.9%) |
| 20 to 24 Years | 2,149 (8.0%) | 1,977 (7.5%) |
| 25 to 29 Years | 1,926 (7.1%) | 1,860 (7.0%) |
| 30 to 34 Years | 2,449 (9.1%) | 2,040 (7.7%) |
| 35 to 39 Years | 1,769 (6.6%) | 2,027 (7.6%) |
| 40 to 44 Years | 2,421 (9.0%) | 2,181 (8.2%) |
| 45 to 49 Years | 2,033 (7.5%) | 1,846 (7.0%) |
| 50 to 54 Years | 1,737 (6.4%) | 1,397 (5.3%) |
| 55 to 59 Years | 1,156 (4.3%) | 1,390 (5.2%) |
| 60 to 64 Years | 1,831 (6.8%) | 1,671 (6.3%) |
| 65 to 69 Years | 1,009 (3.7%) | 1,384 (5.2%) |
| 70 to 74 Years | 782 (2.9%) | 1,012 (3.8%) |
| 75 to 79 Years | 627 (2.3%) | 486 (1.8%) |
| 80 to 84 Years | 207 (0.8%) | 195 (0.7%) |
| 85 Years and over | 155 (0.6%) | 525 (2.0%) |
| Total | 27,019 (100.0%) | 26,513 (100.0%) |
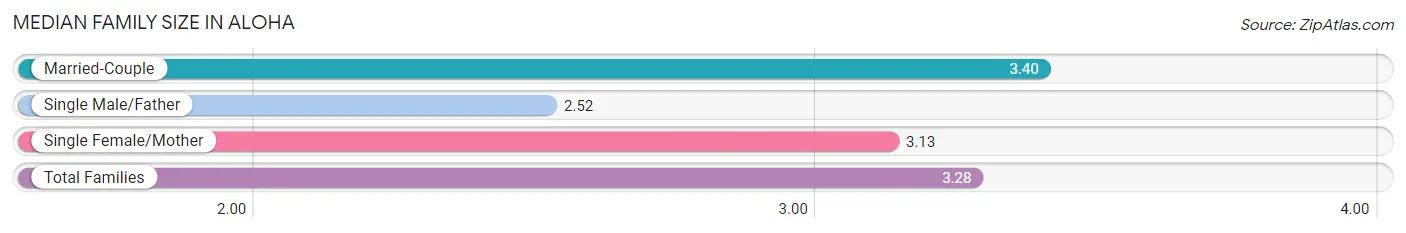
Families and Households in Aloha
Median Family Size in Aloha
The median family size in Aloha is 3.28 persons per family, with married-couple families (9,922 | 75.8%) accounting for the largest median family size of 3.4 persons per family. On the other hand, single male/father families (1,292 | 9.9%) represent the smallest median family size with 2.52 persons per family.
| Family Type | # Families | Family Size |
| Married-Couple | 9,922 (75.8%) | 3.40 |
| Single Male/Father | 1,292 (9.9%) | 2.52 |
| Single Female/Mother | 1,882 (14.4%) | 3.13 |
| Total Families | 13,096 (100.0%) | 3.28 |
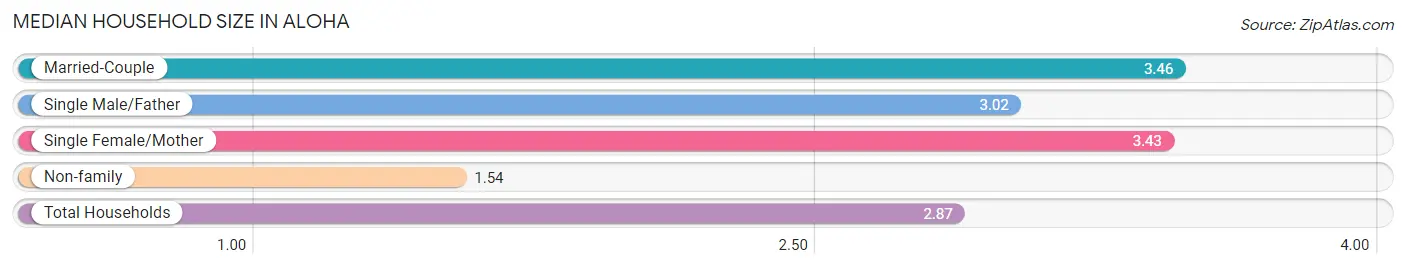
Median Household Size in Aloha
The median household size in Aloha is 2.87 persons per household, with married-couple households (9,922 | 53.7%) accounting for the largest median household size of 3.46 persons per household. non-family households (5,385 | 29.1%) represent the smallest median household size with 1.54 persons per household.
| Household Type | # Households | Household Size |
| Married-Couple | 9,922 (53.7%) | 3.46 |
| Single Male/Father | 1,292 (7.0%) | 3.02 |
| Single Female/Mother | 1,882 (10.2%) | 3.43 |
| Non-family | 5,385 (29.1%) | 1.54 |
| Total Households | 18,481 (100.0%) | 2.87 |
Household Size by Marriage Status in Aloha
Out of a total of 18,481 households in Aloha, 13,096 (70.9%) are family households, while 5,385 (29.1%) are nonfamily households. The most numerous type of family households are 2-person households, comprising 4,751, and the most common type of nonfamily households are 1-person households, comprising 3,441.
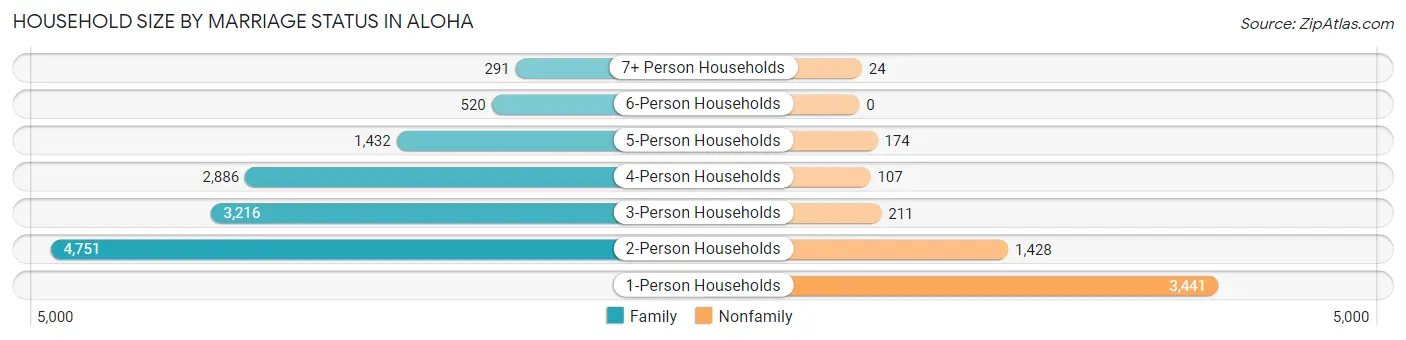
| Household Size | Family Households | Nonfamily Households |
| 1-Person Households | - | 3,441 (18.6%) |
| 2-Person Households | 4,751 (25.7%) | 1,428 (7.7%) |
| 3-Person Households | 3,216 (17.4%) | 211 (1.1%) |
| 4-Person Households | 2,886 (15.6%) | 107 (0.6%) |
| 5-Person Households | 1,432 (7.7%) | 174 (0.9%) |
| 6-Person Households | 520 (2.8%) | 0 (0.0%) |
| 7+ Person Households | 291 (1.6%) | 24 (0.1%) |
| Total | 13,096 (70.9%) | 5,385 (29.1%) |
Female Fertility in Aloha
Fertility by Age in Aloha
Average fertility rate in Aloha is 36.0 births per 1,000 women. Women in the age bracket of 20 to 34 years have the highest fertility rate with 69.0 births per 1,000 women. Women in the age bracket of 20 to 34 years acount for 80.1% of all women with births.
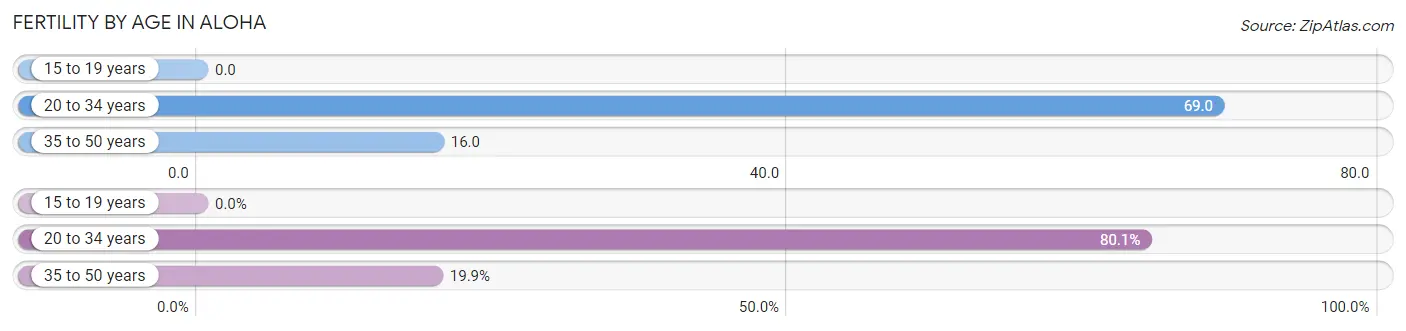
| Age Bracket | Women with Births | Births / 1,000 Women |
| 15 to 19 years | 0 (0.0%) | 0.0 |
| 20 to 34 years | 406 (80.1%) | 69.0 |
| 35 to 50 years | 101 (19.9%) | 16.0 |
| Total | 507 (100.0%) | 36.0 |
Fertility by Age by Marriage Status in Aloha
69.6% of women with births (507) in Aloha are married. The highest percentage of unmarried women with births falls into 20 to 34 years age bracket with 32.3% of them unmarried at the time of birth, while the lowest percentage of unmarried women with births belong to 35 to 50 years age bracket with 22.8% of them unmarried.
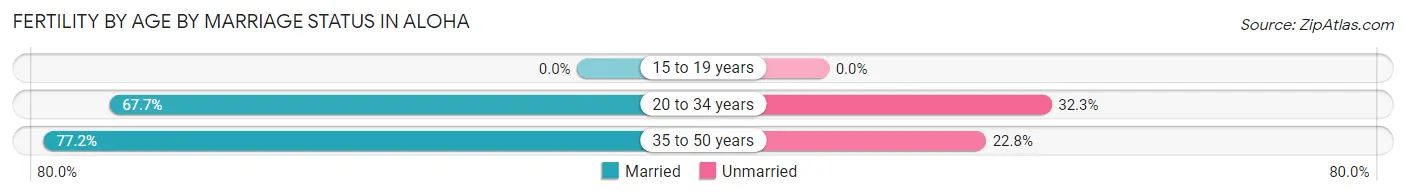
| Age Bracket | Married | Unmarried |
| 15 to 19 years | 0 (0.0%) | 0 (0.0%) |
| 20 to 34 years | 275 (67.7%) | 131 (32.3%) |
| 35 to 50 years | 78 (77.2%) | 23 (22.8%) |
| Total | 353 (69.6%) | 154 (30.4%) |
Fertility by Education in Aloha
Average fertility rate in Aloha is 36.0 births per 1,000 women. Women with the education attainment of bachelor's degree have the highest fertility rate of 52.0 births per 1,000 women, while women with the education attainment of graduate degree have the lowest fertility at 20.0 births per 1,000 women. Women with the education attainment of bachelor's degree represent 30.4% of all women with births.
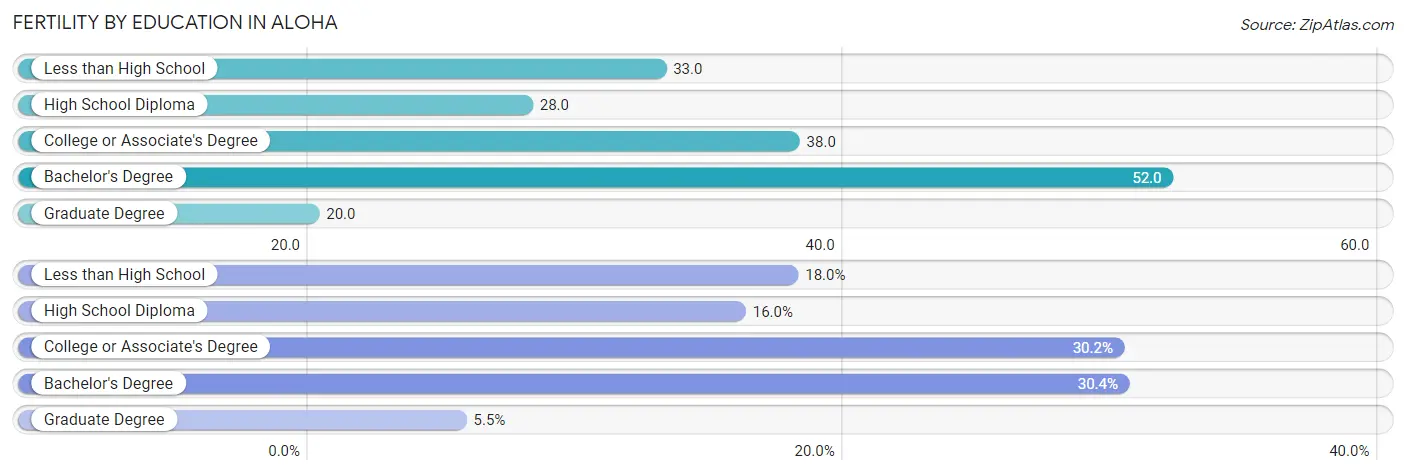
| Educational Attainment | Women with Births | Births / 1,000 Women |
| Less than High School | 91 (17.9%) | 33.0 |
| High School Diploma | 81 (16.0%) | 28.0 |
| College or Associate's Degree | 153 (30.2%) | 38.0 |
| Bachelor's Degree | 154 (30.4%) | 52.0 |
| Graduate Degree | 28 (5.5%) | 20.0 |
| Total | 507 (100.0%) | 36.0 |
Fertility by Education by Marriage Status in Aloha
30.4% of women with births in Aloha are unmarried. Women with the educational attainment of bachelor's degree are most likely to be married with 100.0% of them married at childbirth, while women with the educational attainment of less than high school are least likely to be married with 100.0% of them unmarried at childbirth.
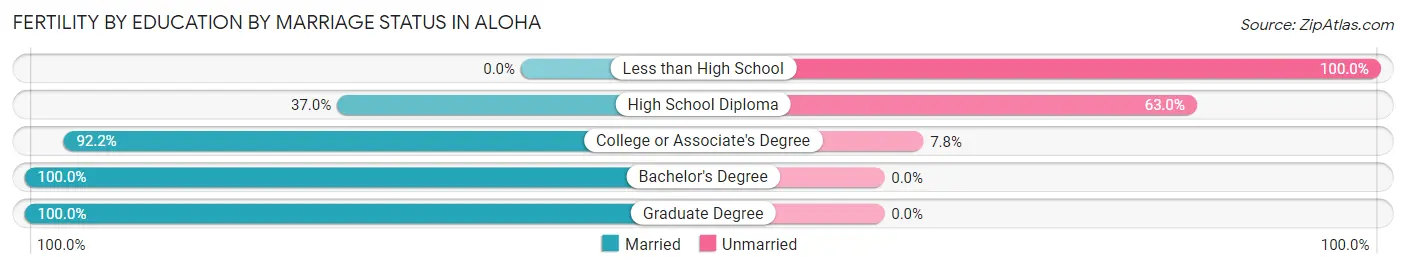
| Educational Attainment | Married | Unmarried |
| Less than High School | 0 (0.0%) | 91 (100.0%) |
| High School Diploma | 30 (37.0%) | 51 (63.0%) |
| College or Associate's Degree | 141 (92.2%) | 12 (7.8%) |
| Bachelor's Degree | 154 (100.0%) | 0 (0.0%) |
| Graduate Degree | 28 (100.0%) | 0 (0.0%) |
| Total | 353 (69.6%) | 154 (30.4%) |
Employment Characteristics in Aloha
Employment by Class of Employer in Aloha
Among the 27,599 employed individuals in Aloha, private company employees (20,871 | 75.6%), not-for-profit organizations (1,989 | 7.2%), and self-employed (not incorporated) (1,627 | 5.9%) make up the most common classes of employment.
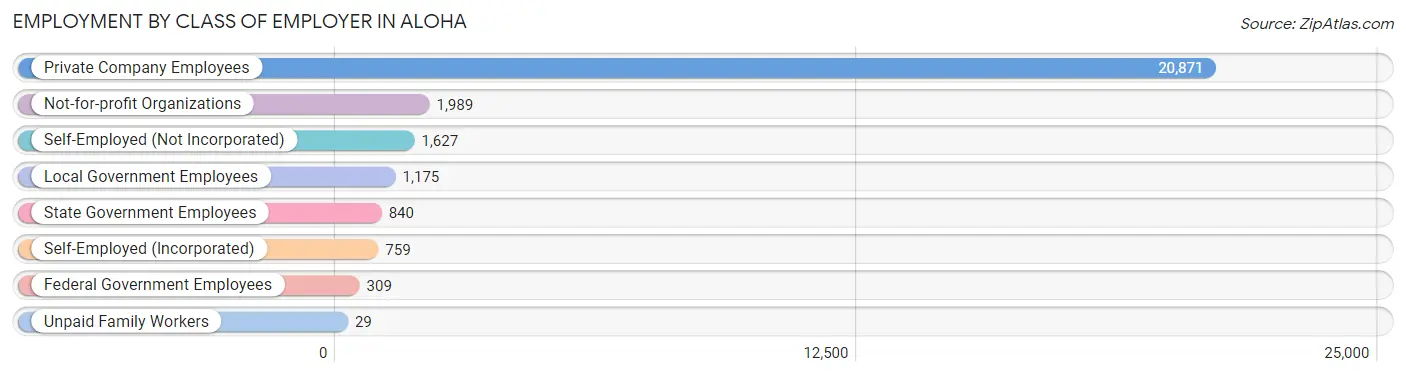
| Employer Class | # Employees | % Employees |
| Private Company Employees | 20,871 | 75.6% |
| Self-Employed (Incorporated) | 759 | 2.8% |
| Self-Employed (Not Incorporated) | 1,627 | 5.9% |
| Not-for-profit Organizations | 1,989 | 7.2% |
| Local Government Employees | 1,175 | 4.3% |
| State Government Employees | 840 | 3.0% |
| Federal Government Employees | 309 | 1.1% |
| Unpaid Family Workers | 29 | 0.1% |
| Total | 27,599 | 100.0% |
Employment Status by Age in Aloha
According to the labor force statistics for Aloha, out of the total population over 16 years of age (43,324), 69.1% or 29,937 individuals are in the labor force, with 5.1% or 1,527 of them unemployed. The age group with the highest labor force participation rate is 30 to 34 years, with 88.6% or 3,977 individuals in the labor force. Within the labor force, the 75 years and over age range has the highest percentage of unemployed individuals, with 33.8% or 26 of them being unemployed.
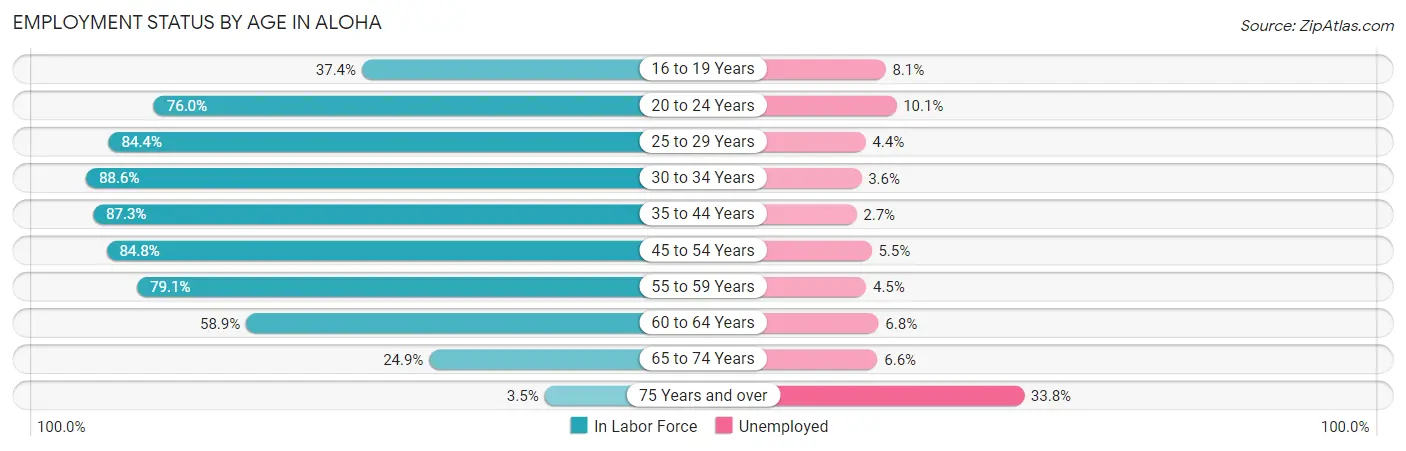
| Age Bracket | In Labor Force | Unemployed |
| 16 to 19 Years | 1,153 (37.4%) | 93 (8.1%) |
| 20 to 24 Years | 3,136 (76.0%) | 317 (10.1%) |
| 25 to 29 Years | 3,195 (84.4%) | 141 (4.4%) |
| 30 to 34 Years | 3,977 (88.6%) | 143 (3.6%) |
| 35 to 44 Years | 7,331 (87.3%) | 198 (2.7%) |
| 45 to 54 Years | 5,947 (84.8%) | 327 (5.5%) |
| 55 to 59 Years | 2,014 (79.1%) | 91 (4.5%) |
| 60 to 64 Years | 2,063 (58.9%) | 140 (6.8%) |
| 65 to 74 Years | 1,043 (24.9%) | 69 (6.6%) |
| 75 Years and over | 77 (3.5%) | 26 (33.8%) |
| Total | 29,937 (69.1%) | 1,527 (5.1%) |
Employment Status by Educational Attainment in Aloha
According to labor force statistics for Aloha, 82.5% of individuals (24,531) out of the total population between 25 and 64 years of age (29,734) are in the labor force, with 4.2% or 1,030 of them being unemployed. The group with the highest labor force participation rate are those with the educational attainment of bachelor's degree or higher, with 90.3% or 8,350 individuals in the labor force. Within the labor force, individuals with less than high school education have the highest percentage of unemployment, with 7.4% or 205 of them being unemployed.
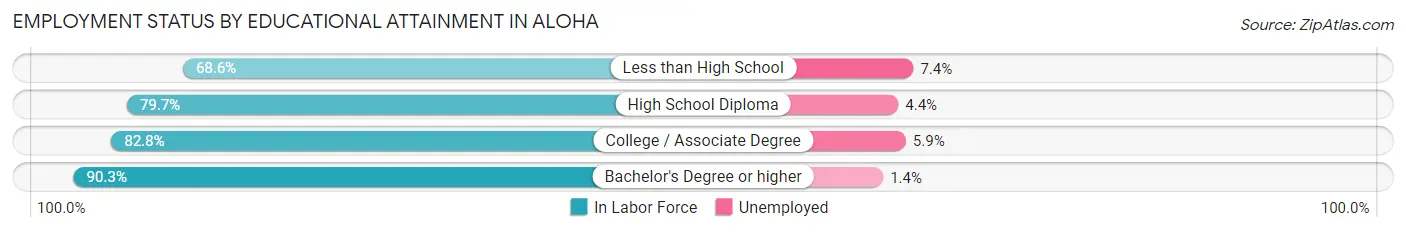
| Educational Attainment | In Labor Force | Unemployed |
| Less than High School | 2,771 (68.6%) | 299 (7.4%) |
| High School Diploma | 5,557 (79.7%) | 307 (4.4%) |
| College / Associate Degree | 7,845 (82.8%) | 559 (5.9%) |
| Bachelor's Degree or higher | 8,350 (90.3%) | 129 (1.4%) |
| Total | 24,531 (82.5%) | 1,249 (4.2%) |
Employment Occupations by Sex in Aloha
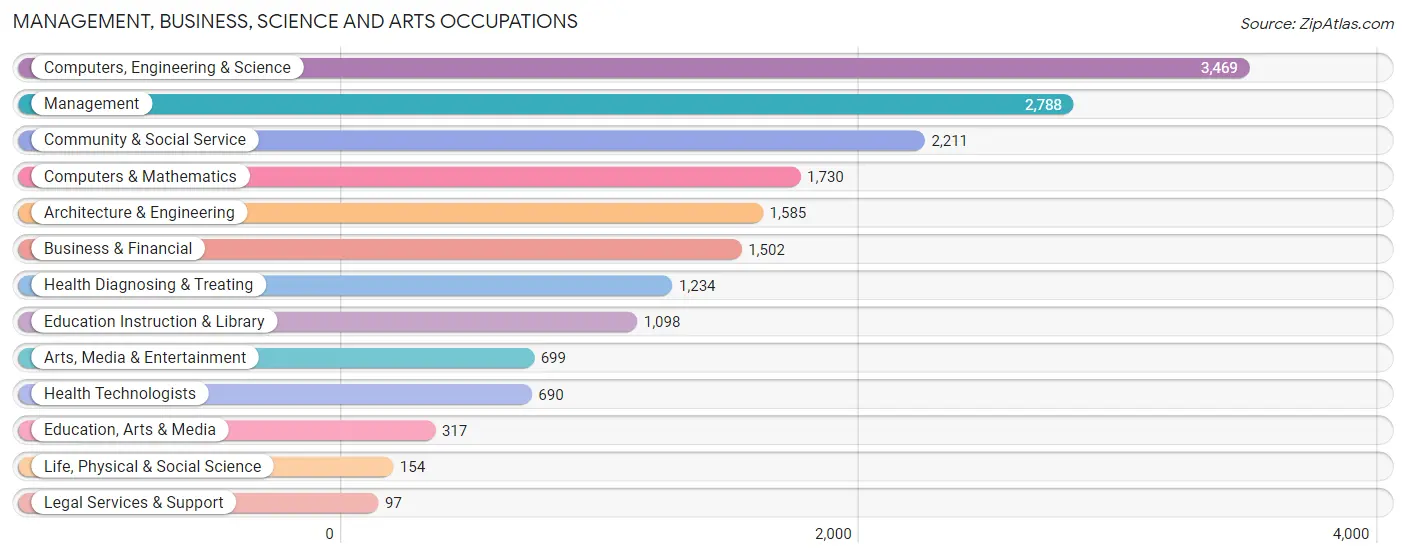
Management, Business, Science and Arts Occupations
The most common Management, Business, Science and Arts occupations in Aloha are Computers, Engineering & Science (3,469 | 12.2%), Management (2,788 | 9.8%), Community & Social Service (2,211 | 7.8%), Computers & Mathematics (1,730 | 6.1%), and Architecture & Engineering (1,585 | 5.6%).
Management, Business, Science and Arts Occupations by Sex
Within the Management, Business, Science and Arts occupations in Aloha, the most male-oriented occupations are Architecture & Engineering (83.4%), Computers, Engineering & Science (75.8%), and Computers & Mathematics (71.9%), while the most female-oriented occupations are Health Technologists (85.9%), Legal Services & Support (84.5%), and Education, Arts & Media (81.4%).
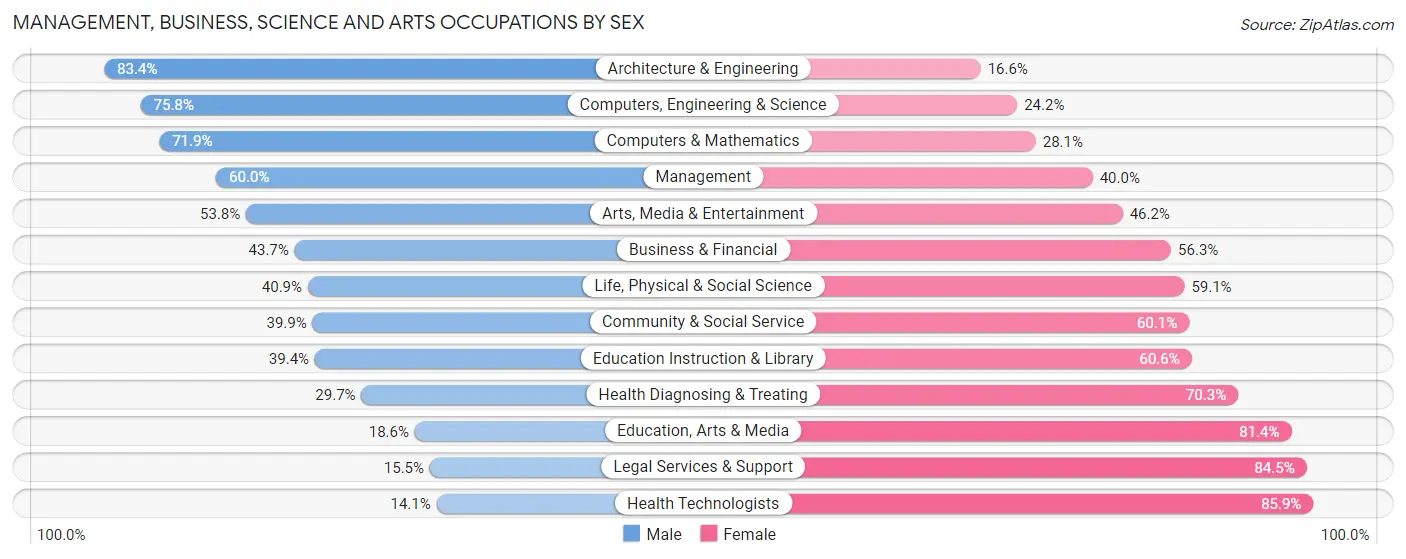
| Occupation | Male | Female |
| Management | 1,674 (60.0%) | 1,114 (40.0%) |
| Business & Financial | 656 (43.7%) | 846 (56.3%) |
| Computers, Engineering & Science | 2,629 (75.8%) | 840 (24.2%) |
| Computers & Mathematics | 1,244 (71.9%) | 486 (28.1%) |
| Architecture & Engineering | 1,322 (83.4%) | 263 (16.6%) |
| Life, Physical & Social Science | 63 (40.9%) | 91 (59.1%) |
| Community & Social Service | 883 (39.9%) | 1,328 (60.1%) |
| Education, Arts & Media | 59 (18.6%) | 258 (81.4%) |
| Legal Services & Support | 15 (15.5%) | 82 (84.5%) |
| Education Instruction & Library | 433 (39.4%) | 665 (60.6%) |
| Arts, Media & Entertainment | 376 (53.8%) | 323 (46.2%) |
| Health Diagnosing & Treating | 367 (29.7%) | 867 (70.3%) |
| Health Technologists | 97 (14.1%) | 593 (85.9%) |
| Total (Category) | 6,209 (55.4%) | 4,995 (44.6%) |
| Total (Overall) | 15,598 (55.0%) | 12,785 (45.0%) |
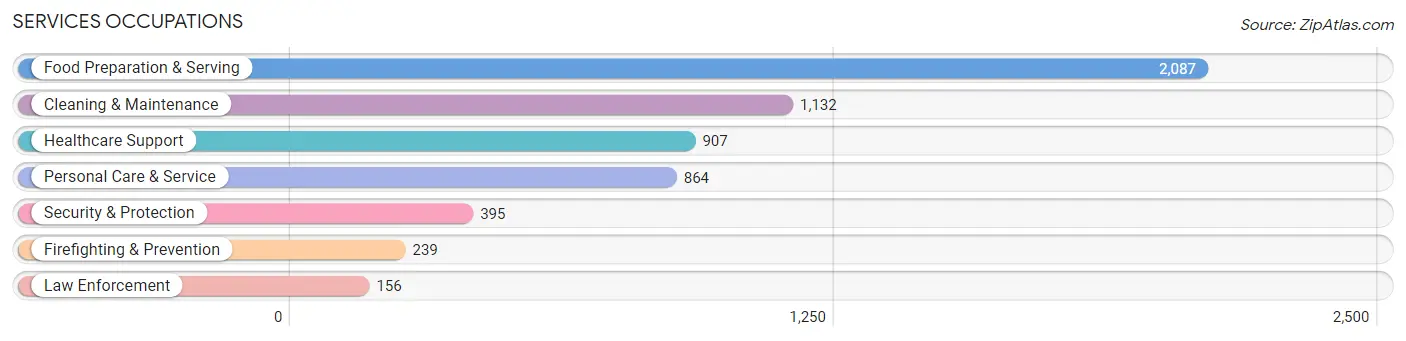
Services Occupations
The most common Services occupations in Aloha are Food Preparation & Serving (2,087 | 7.3%), Cleaning & Maintenance (1,132 | 4.0%), Healthcare Support (907 | 3.2%), Personal Care & Service (864 | 3.0%), and Security & Protection (395 | 1.4%).
Services Occupations by Sex
Within the Services occupations in Aloha, the most male-oriented occupations are Firefighting & Prevention (84.1%), Security & Protection (69.6%), and Law Enforcement (47.4%), while the most female-oriented occupations are Healthcare Support (90.5%), Personal Care & Service (79.0%), and Cleaning & Maintenance (56.1%).
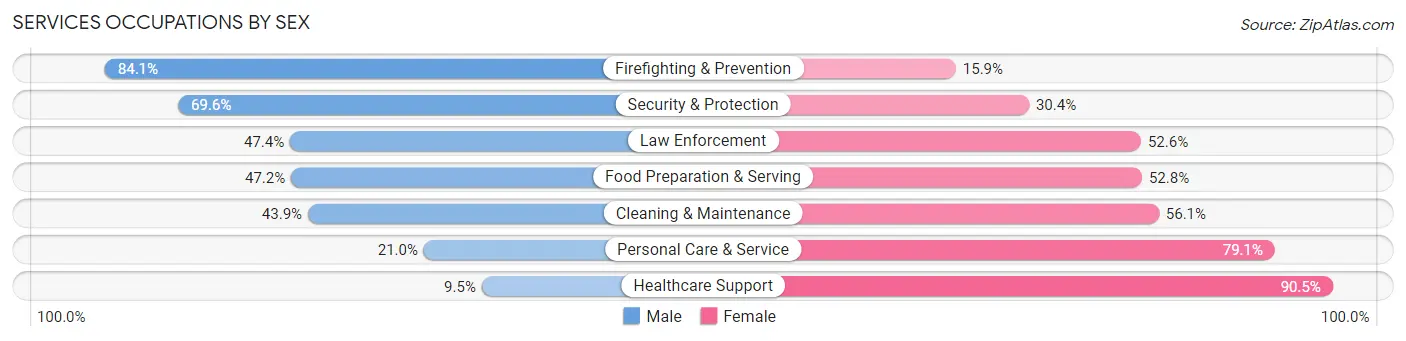
| Occupation | Male | Female |
| Healthcare Support | 86 (9.5%) | 821 (90.5%) |
| Security & Protection | 275 (69.6%) | 120 (30.4%) |
| Firefighting & Prevention | 201 (84.1%) | 38 (15.9%) |
| Law Enforcement | 74 (47.4%) | 82 (52.6%) |
| Food Preparation & Serving | 986 (47.2%) | 1,101 (52.8%) |
| Cleaning & Maintenance | 497 (43.9%) | 635 (56.1%) |
| Personal Care & Service | 181 (20.9%) | 683 (79.0%) |
| Total (Category) | 2,025 (37.6%) | 3,360 (62.4%) |
| Total (Overall) | 15,598 (55.0%) | 12,785 (45.0%) |
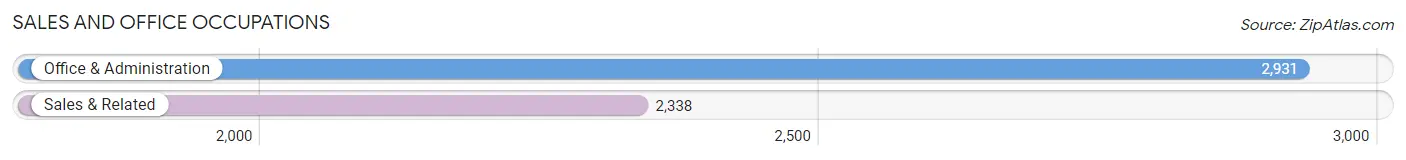
Sales and Office Occupations
The most common Sales and Office occupations in Aloha are Office & Administration (2,931 | 10.3%), and Sales & Related (2,338 | 8.2%).
Sales and Office Occupations by Sex
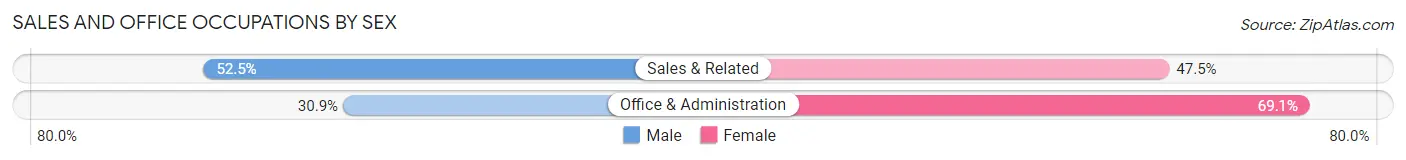
| Occupation | Male | Female |
| Sales & Related | 1,227 (52.5%) | 1,111 (47.5%) |
| Office & Administration | 905 (30.9%) | 2,026 (69.1%) |
| Total (Category) | 2,132 (40.5%) | 3,137 (59.5%) |
| Total (Overall) | 15,598 (55.0%) | 12,785 (45.0%) |
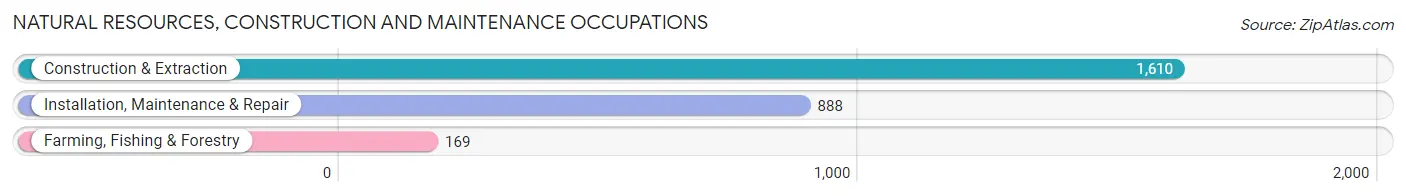
Natural Resources, Construction and Maintenance Occupations
The most common Natural Resources, Construction and Maintenance occupations in Aloha are Construction & Extraction (1,610 | 5.7%), Installation, Maintenance & Repair (888 | 3.1%), and Farming, Fishing & Forestry (169 | 0.6%).
Natural Resources, Construction and Maintenance Occupations by Sex
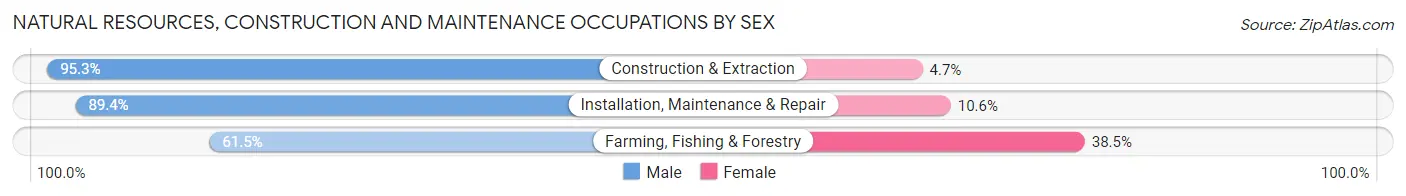
| Occupation | Male | Female |
| Farming, Fishing & Forestry | 104 (61.5%) | 65 (38.5%) |
| Construction & Extraction | 1,534 (95.3%) | 76 (4.7%) |
| Installation, Maintenance & Repair | 794 (89.4%) | 94 (10.6%) |
| Total (Category) | 2,432 (91.2%) | 235 (8.8%) |
| Total (Overall) | 15,598 (55.0%) | 12,785 (45.0%) |
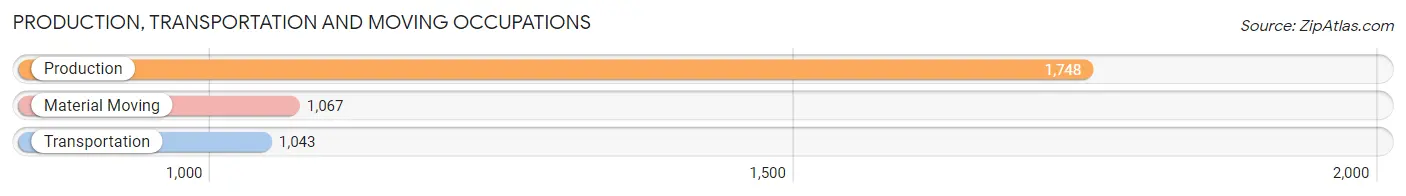
Production, Transportation and Moving Occupations
The most common Production, Transportation and Moving occupations in Aloha are Production (1,748 | 6.2%), Material Moving (1,067 | 3.8%), and Transportation (1,043 | 3.7%).
Production, Transportation and Moving Occupations by Sex
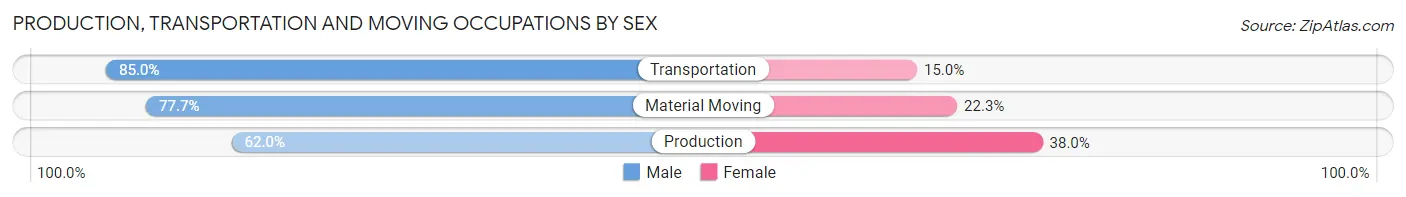
| Occupation | Male | Female |
| Production | 1,084 (62.0%) | 664 (38.0%) |
| Transportation | 887 (85.0%) | 156 (15.0%) |
| Material Moving | 829 (77.7%) | 238 (22.3%) |
| Total (Category) | 2,800 (72.6%) | 1,058 (27.4%) |
| Total (Overall) | 15,598 (55.0%) | 12,785 (45.0%) |
Employment Industries by Sex in Aloha
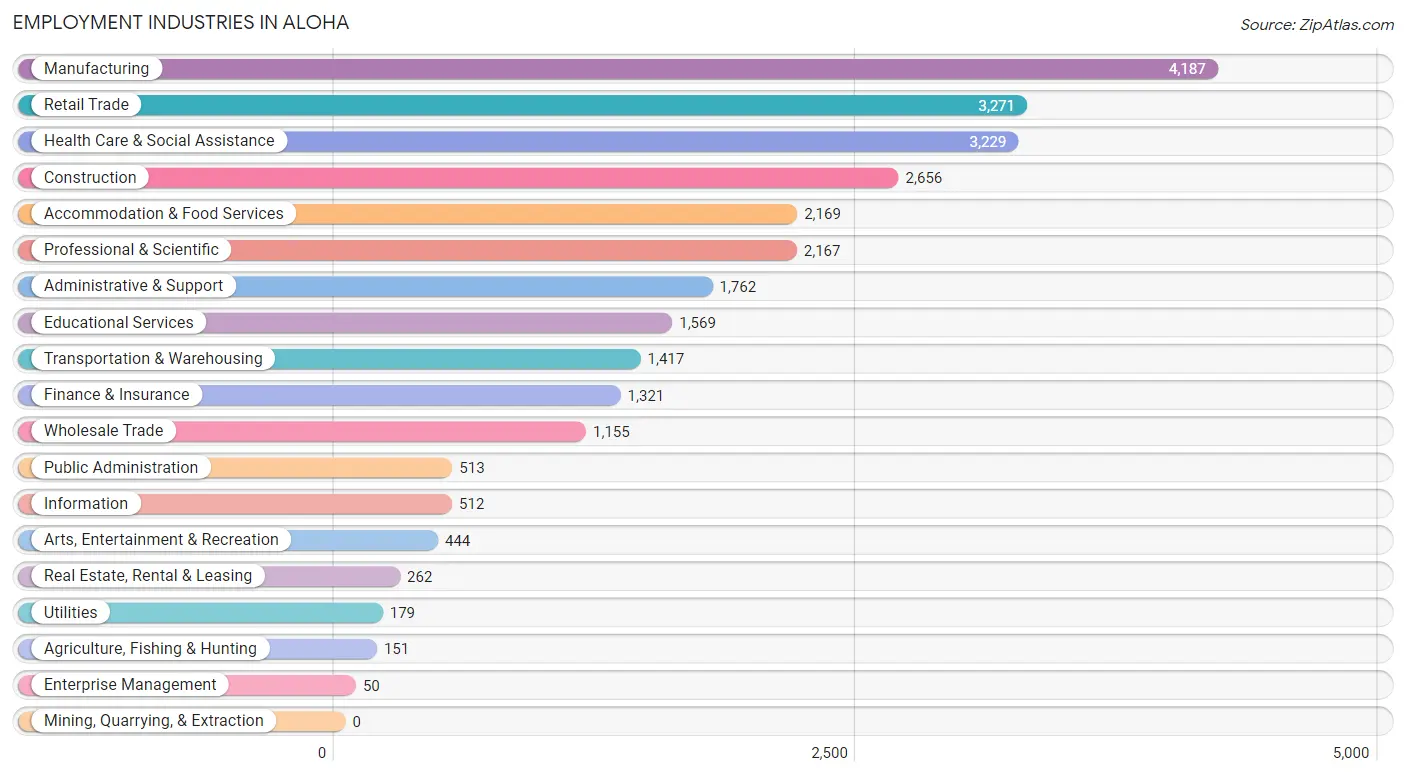
Employment Industries in Aloha
The major employment industries in Aloha include Manufacturing (4,187 | 14.7%), Retail Trade (3,271 | 11.5%), Health Care & Social Assistance (3,229 | 11.4%), Construction (2,656 | 9.4%), and Accommodation & Food Services (2,169 | 7.6%).
Employment Industries by Sex in Aloha
The Aloha industries that see more men than women are Construction (90.9%), Wholesale Trade (76.9%), and Agriculture, Fishing & Hunting (76.2%), whereas the industries that tend to have a higher number of women are Health Care & Social Assistance (80.9%), Enterprise Management (70.0%), and Public Administration (58.9%).
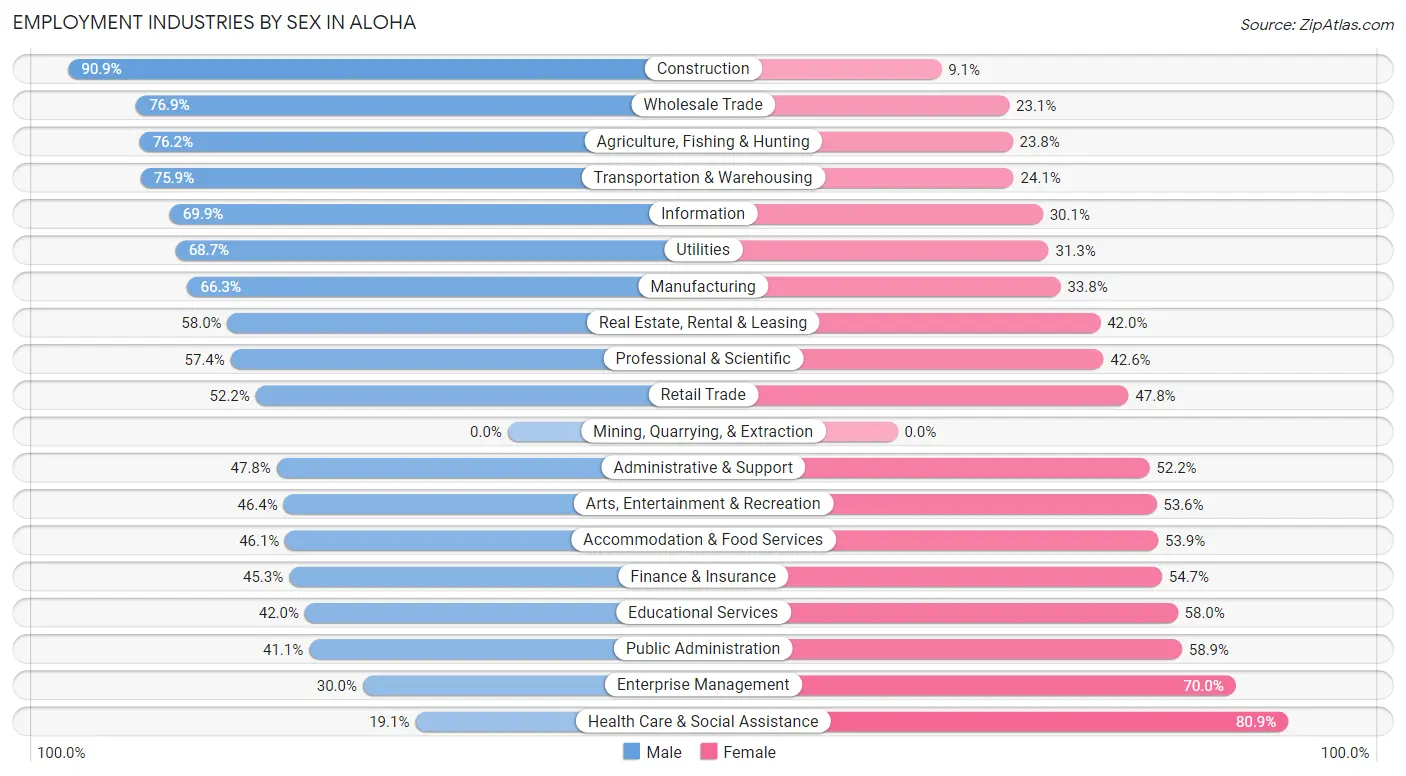
| Industry | Male | Female |
| Agriculture, Fishing & Hunting | 115 (76.2%) | 36 (23.8%) |
| Mining, Quarrying, & Extraction | 0 (0.0%) | 0 (0.0%) |
| Construction | 2,415 (90.9%) | 241 (9.1%) |
| Manufacturing | 2,774 (66.2%) | 1,413 (33.8%) |
| Wholesale Trade | 888 (76.9%) | 267 (23.1%) |
| Retail Trade | 1,707 (52.2%) | 1,564 (47.8%) |
| Transportation & Warehousing | 1,076 (75.9%) | 341 (24.1%) |
| Utilities | 123 (68.7%) | 56 (31.3%) |
| Information | 358 (69.9%) | 154 (30.1%) |
| Finance & Insurance | 598 (45.3%) | 723 (54.7%) |
| Real Estate, Rental & Leasing | 152 (58.0%) | 110 (42.0%) |
| Professional & Scientific | 1,243 (57.4%) | 924 (42.6%) |
| Enterprise Management | 15 (30.0%) | 35 (70.0%) |
| Administrative & Support | 843 (47.8%) | 919 (52.2%) |
| Educational Services | 659 (42.0%) | 910 (58.0%) |
| Health Care & Social Assistance | 618 (19.1%) | 2,611 (80.9%) |
| Arts, Entertainment & Recreation | 206 (46.4%) | 238 (53.6%) |
| Accommodation & Food Services | 999 (46.1%) | 1,170 (53.9%) |
| Public Administration | 211 (41.1%) | 302 (58.9%) |
| Total | 15,598 (55.0%) | 12,785 (45.0%) |
Education in Aloha
School Enrollment in Aloha
The most common levels of schooling among the 13,034 students in Aloha are high school (3,408 | 26.2%), college / undergraduate (2,882 | 22.1%), and middle school (2,874 | 22.1%).
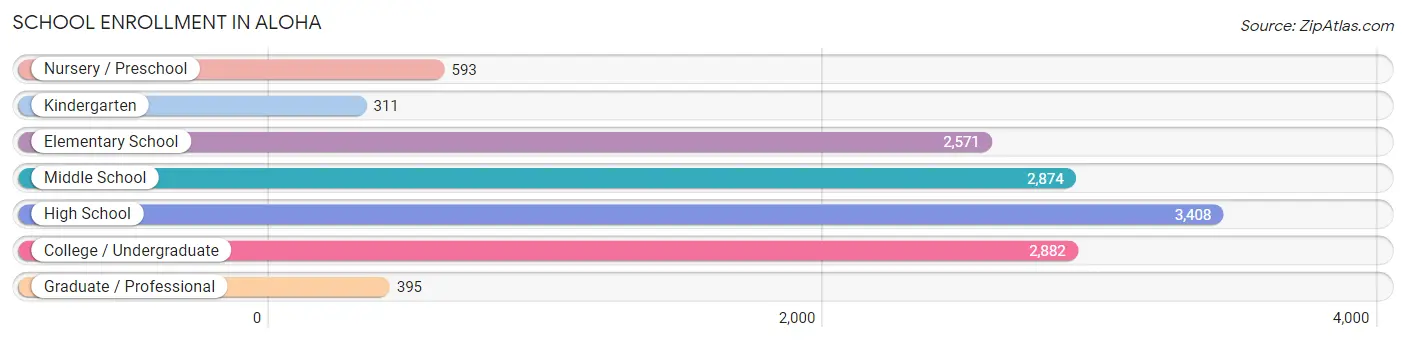
| School Level | # Students | % Students |
| Nursery / Preschool | 593 | 4.5% |
| Kindergarten | 311 | 2.4% |
| Elementary School | 2,571 | 19.7% |
| Middle School | 2,874 | 22.1% |
| High School | 3,408 | 26.2% |
| College / Undergraduate | 2,882 | 22.1% |
| Graduate / Professional | 395 | 3.0% |
| Total | 13,034 | 100.0% |
School Enrollment by Age by Funding Source in Aloha
Out of a total of 13,034 students who are enrolled in schools in Aloha, 1,968 (15.1%) attend a private institution, while the remaining 11,066 (84.9%) are enrolled in public schools. The age group of 3 to 4 year olds has the highest likelihood of being enrolled in private schools, with 335 (73.6% in the age bracket) enrolled. Conversely, the age group of 18 to 19 year olds has the lowest likelihood of being enrolled in a private school, with 895 (96.7% in the age bracket) attending a public institution.
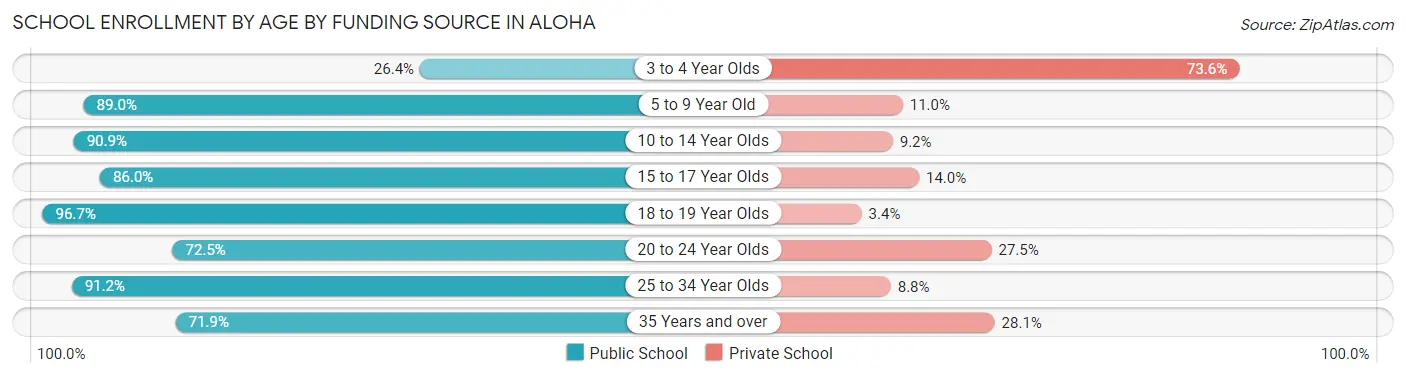
| Age Bracket | Public School | Private School |
| 3 to 4 Year Olds | 120 (26.4%) | 335 (73.6%) |
| 5 to 9 Year Old | 2,433 (89.0%) | 301 (11.0%) |
| 10 to 14 Year Olds | 3,147 (90.8%) | 317 (9.1%) |
| 15 to 17 Year Olds | 2,180 (86.0%) | 356 (14.0%) |
| 18 to 19 Year Olds | 895 (96.7%) | 31 (3.4%) |
| 20 to 24 Year Olds | 847 (72.5%) | 322 (27.5%) |
| 25 to 34 Year Olds | 873 (91.2%) | 84 (8.8%) |
| 35 Years and over | 570 (71.9%) | 223 (28.1%) |
| Total | 11,066 (84.9%) | 1,968 (15.1%) |
Educational Attainment by Field of Study in Aloha
Business (2,333 | 19.3%), engineering (1,647 | 13.6%), education (1,087 | 9.0%), computers & mathematics (1,008 | 8.3%), and science & technology (826 | 6.8%) are the most common fields of study among 12,093 individuals in Aloha who have obtained a bachelor's degree or higher.
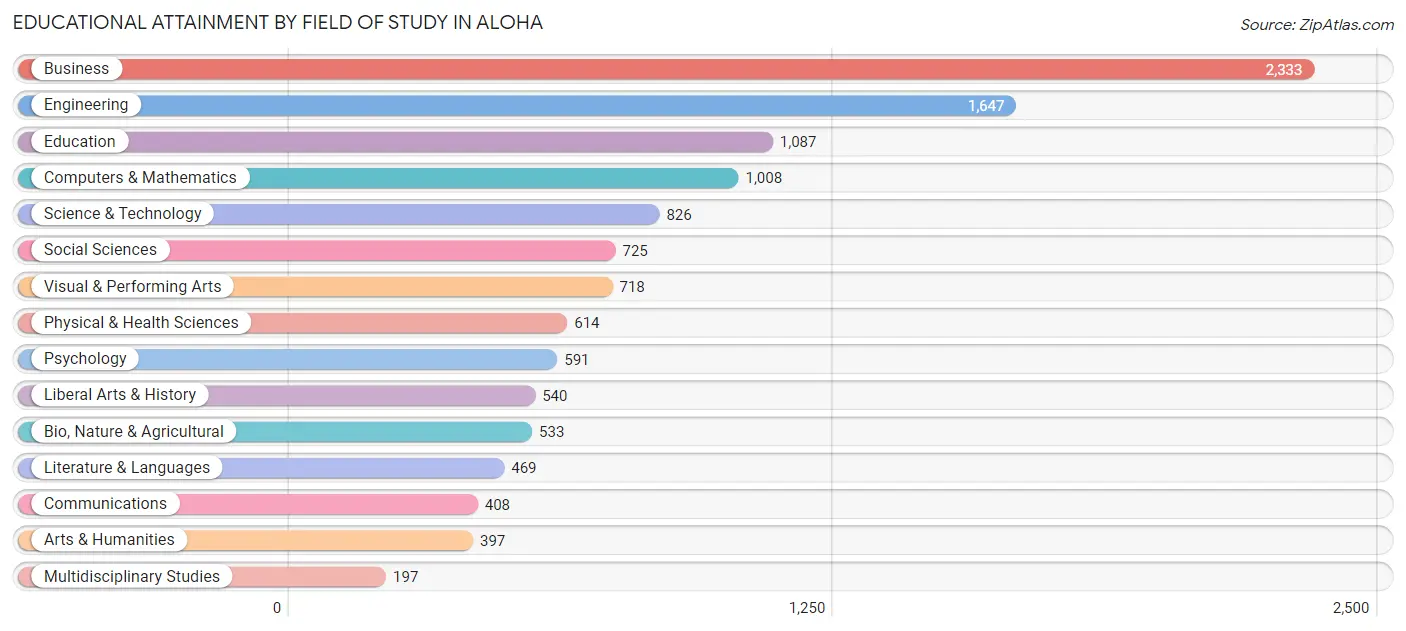
| Field of Study | # Graduates | % Graduates |
| Computers & Mathematics | 1,008 | 8.3% |
| Bio, Nature & Agricultural | 533 | 4.4% |
| Physical & Health Sciences | 614 | 5.1% |
| Psychology | 591 | 4.9% |
| Social Sciences | 725 | 6.0% |
| Engineering | 1,647 | 13.6% |
| Multidisciplinary Studies | 197 | 1.6% |
| Science & Technology | 826 | 6.8% |
| Business | 2,333 | 19.3% |
| Education | 1,087 | 9.0% |
| Literature & Languages | 469 | 3.9% |
| Liberal Arts & History | 540 | 4.5% |
| Visual & Performing Arts | 718 | 5.9% |
| Communications | 408 | 3.4% |
| Arts & Humanities | 397 | 3.3% |
| Total | 12,093 | 100.0% |
Transportation & Commute in Aloha
Vehicle Availability by Sex in Aloha
The most prevalent vehicle ownership categories in Aloha are males with 2 vehicles (6,120, accounting for 40.5%) and females with 2 vehicles (4,860, making up 49.4%).
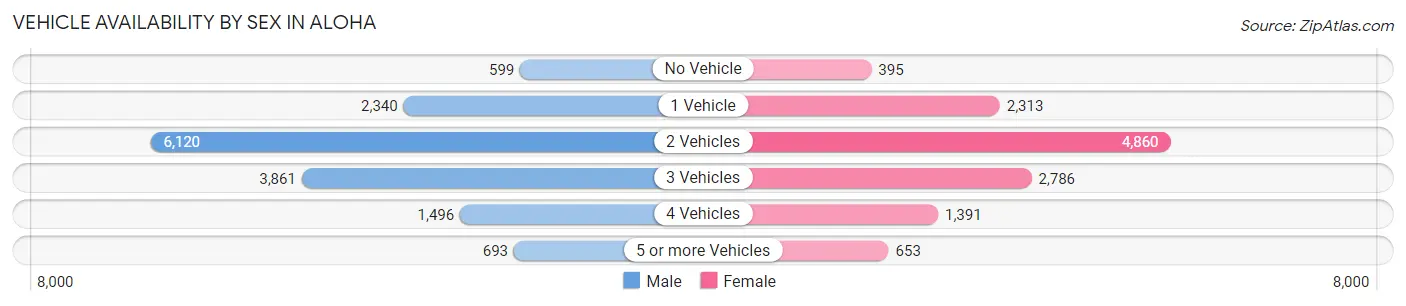
| Vehicles Available | Male | Female |
| No Vehicle | 599 (4.0%) | 395 (3.2%) |
| 1 Vehicle | 2,340 (15.5%) | 2,313 (18.7%) |
| 2 Vehicles | 6,120 (40.5%) | 4,860 (39.2%) |
| 3 Vehicles | 3,861 (25.6%) | 2,786 (22.5%) |
| 4 Vehicles | 1,496 (9.9%) | 1,391 (11.2%) |
| 5 or more Vehicles | 693 (4.6%) | 653 (5.3%) |
| Total | 15,109 (100.0%) | 12,398 (100.0%) |
Commute Time in Aloha
The most frequently occuring commute durations in Aloha are 10 to 14 minutes (4,020 commuters, 17.3%), 15 to 19 minutes (3,987 commuters, 17.2%), and 20 to 24 minutes (3,476 commuters, 15.0%).
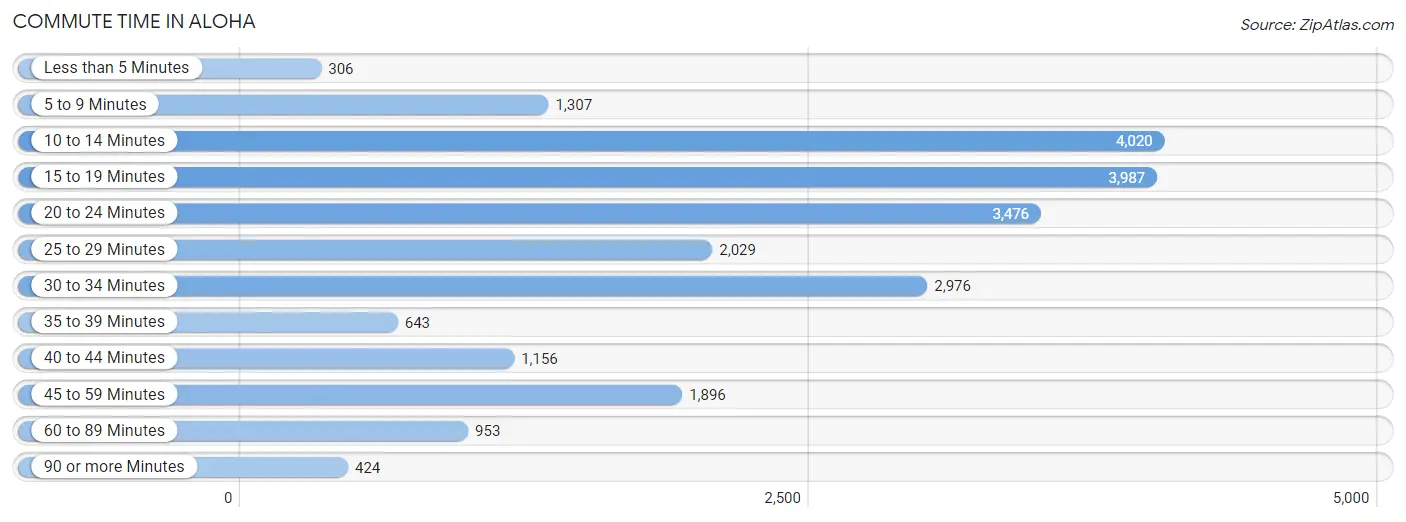
| Commute Time | # Commuters | % Commuters |
| Less than 5 Minutes | 306 | 1.3% |
| 5 to 9 Minutes | 1,307 | 5.6% |
| 10 to 14 Minutes | 4,020 | 17.3% |
| 15 to 19 Minutes | 3,987 | 17.2% |
| 20 to 24 Minutes | 3,476 | 15.0% |
| 25 to 29 Minutes | 2,029 | 8.8% |
| 30 to 34 Minutes | 2,976 | 12.8% |
| 35 to 39 Minutes | 643 | 2.8% |
| 40 to 44 Minutes | 1,156 | 5.0% |
| 45 to 59 Minutes | 1,896 | 8.2% |
| 60 to 89 Minutes | 953 | 4.1% |
| 90 or more Minutes | 424 | 1.8% |
Commute Time by Sex in Aloha
The most common commute times in Aloha are 10 to 14 minutes (2,226 commuters, 17.5%) for males and 20 to 24 minutes (1,816 commuters, 17.4%) for females.
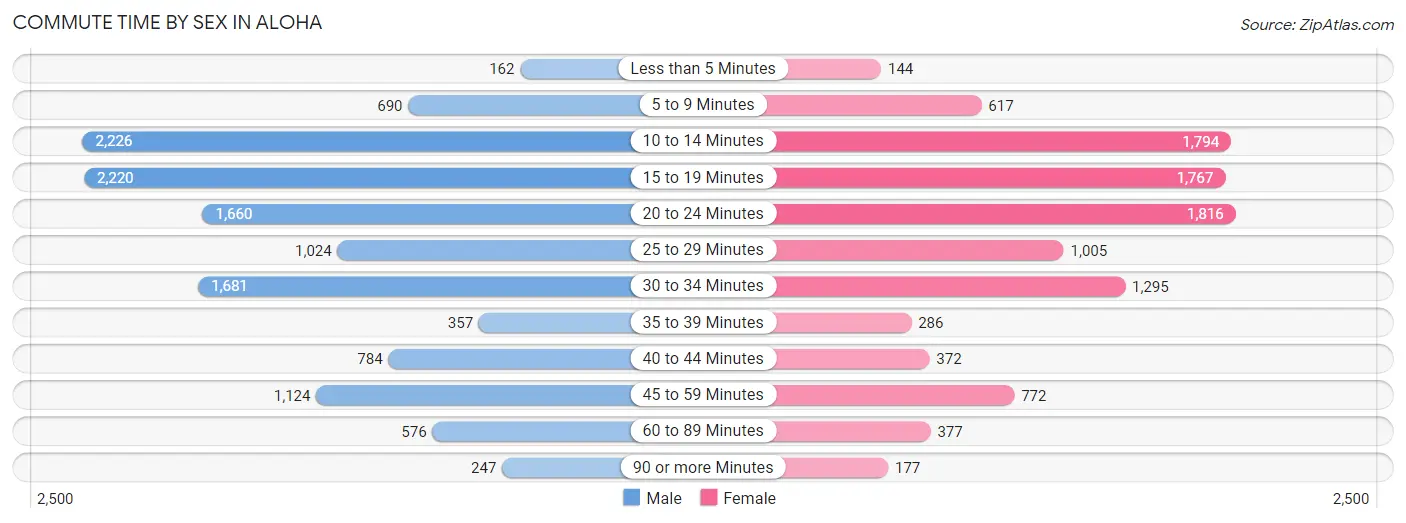
| Commute Time | Male | Female |
| Less than 5 Minutes | 162 (1.3%) | 144 (1.4%) |
| 5 to 9 Minutes | 690 (5.4%) | 617 (5.9%) |
| 10 to 14 Minutes | 2,226 (17.5%) | 1,794 (17.2%) |
| 15 to 19 Minutes | 2,220 (17.4%) | 1,767 (17.0%) |
| 20 to 24 Minutes | 1,660 (13.0%) | 1,816 (17.4%) |
| 25 to 29 Minutes | 1,024 (8.0%) | 1,005 (9.6%) |
| 30 to 34 Minutes | 1,681 (13.2%) | 1,295 (12.4%) |
| 35 to 39 Minutes | 357 (2.8%) | 286 (2.7%) |
| 40 to 44 Minutes | 784 (6.1%) | 372 (3.6%) |
| 45 to 59 Minutes | 1,124 (8.8%) | 772 (7.4%) |
| 60 to 89 Minutes | 576 (4.5%) | 377 (3.6%) |
| 90 or more Minutes | 247 (1.9%) | 177 (1.7%) |
Time of Departure to Work by Sex in Aloha
The most frequent times of departure to work in Aloha are 7:00 AM to 7:29 AM (1,816, 14.2%) for males and 7:00 AM to 7:29 AM (1,606, 15.4%) for females.
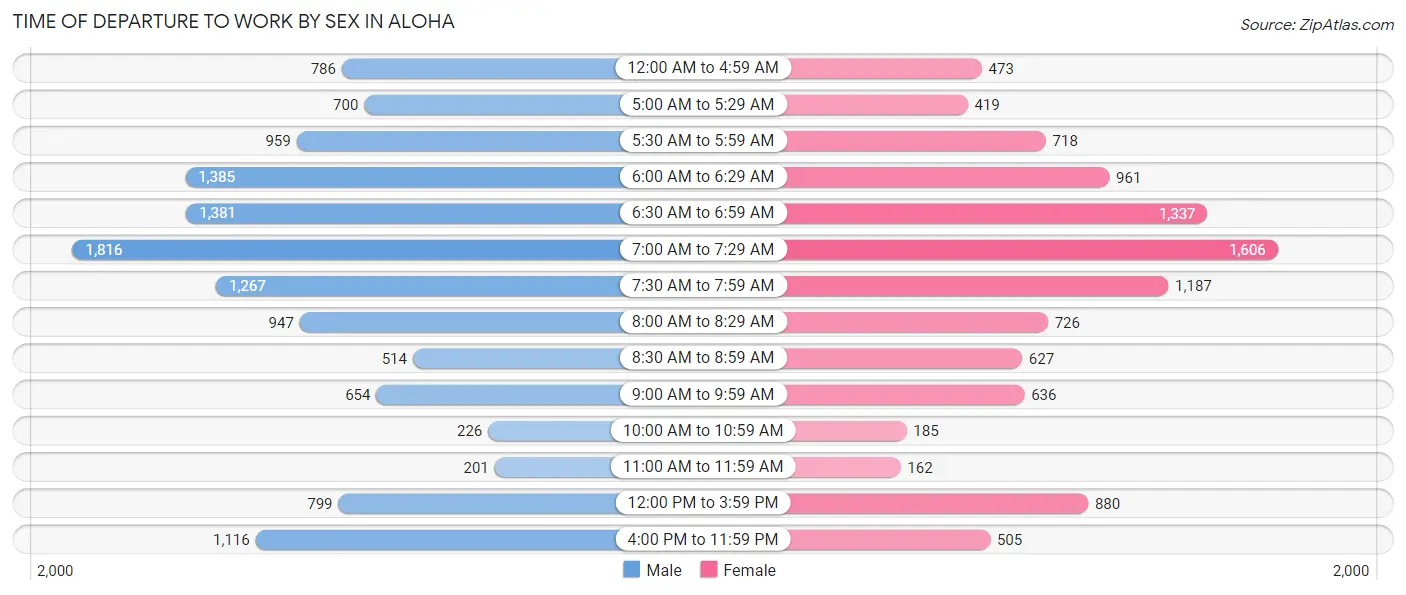
| Time of Departure | Male | Female |
| 12:00 AM to 4:59 AM | 786 (6.2%) | 473 (4.5%) |
| 5:00 AM to 5:29 AM | 700 (5.5%) | 419 (4.0%) |
| 5:30 AM to 5:59 AM | 959 (7.5%) | 718 (6.9%) |
| 6:00 AM to 6:29 AM | 1,385 (10.9%) | 961 (9.2%) |
| 6:30 AM to 6:59 AM | 1,381 (10.8%) | 1,337 (12.8%) |
| 7:00 AM to 7:29 AM | 1,816 (14.2%) | 1,606 (15.4%) |
| 7:30 AM to 7:59 AM | 1,267 (9.9%) | 1,187 (11.4%) |
| 8:00 AM to 8:29 AM | 947 (7.4%) | 726 (7.0%) |
| 8:30 AM to 8:59 AM | 514 (4.0%) | 627 (6.0%) |
| 9:00 AM to 9:59 AM | 654 (5.1%) | 636 (6.1%) |
| 10:00 AM to 10:59 AM | 226 (1.8%) | 185 (1.8%) |
| 11:00 AM to 11:59 AM | 201 (1.6%) | 162 (1.5%) |
| 12:00 PM to 3:59 PM | 799 (6.3%) | 880 (8.4%) |
| 4:00 PM to 11:59 PM | 1,116 (8.7%) | 505 (4.9%) |
| Total | 12,751 (100.0%) | 10,422 (100.0%) |
Housing Occupancy in Aloha
Occupancy by Ownership in Aloha
Of the total 18,481 dwellings in Aloha, owner-occupied units account for 12,336 (66.7%), while renter-occupied units make up 6,145 (33.3%).
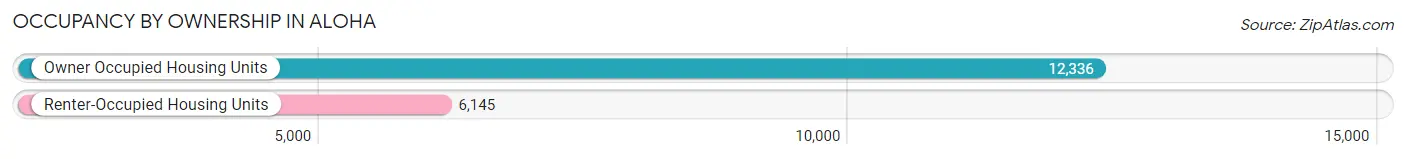
| Occupancy | # Housing Units | % Housing Units |
| Owner Occupied Housing Units | 12,336 | 66.7% |
| Renter-Occupied Housing Units | 6,145 | 33.3% |
| Total Occupied Housing Units | 18,481 | 100.0% |
Occupancy by Household Size in Aloha
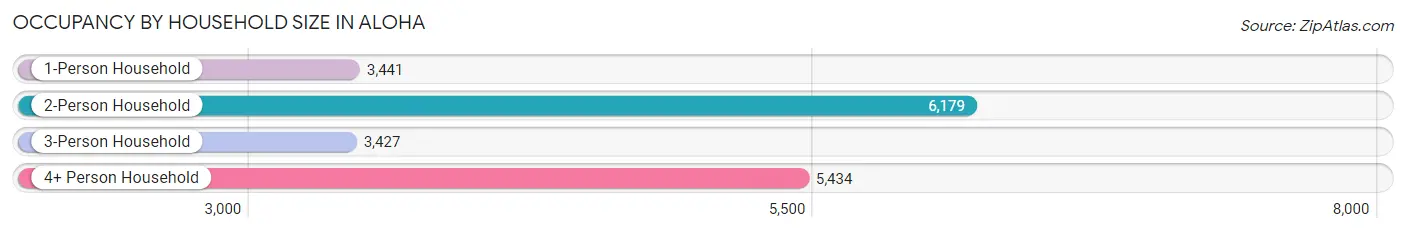
| Household Size | # Housing Units | % Housing Units |
| 1-Person Household | 3,441 | 18.6% |
| 2-Person Household | 6,179 | 33.4% |
| 3-Person Household | 3,427 | 18.5% |
| 4+ Person Household | 5,434 | 29.4% |
| Total Housing Units | 18,481 | 100.0% |
Occupancy by Ownership by Household Size in Aloha
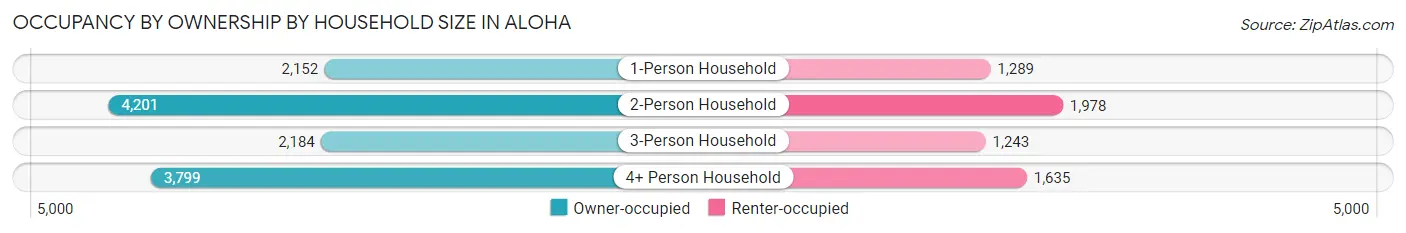
| Household Size | Owner-occupied | Renter-occupied |
| 1-Person Household | 2,152 (62.5%) | 1,289 (37.5%) |
| 2-Person Household | 4,201 (68.0%) | 1,978 (32.0%) |
| 3-Person Household | 2,184 (63.7%) | 1,243 (36.3%) |
| 4+ Person Household | 3,799 (69.9%) | 1,635 (30.1%) |
| Total Housing Units | 12,336 (66.7%) | 6,145 (33.3%) |
Occupancy by Educational Attainment in Aloha
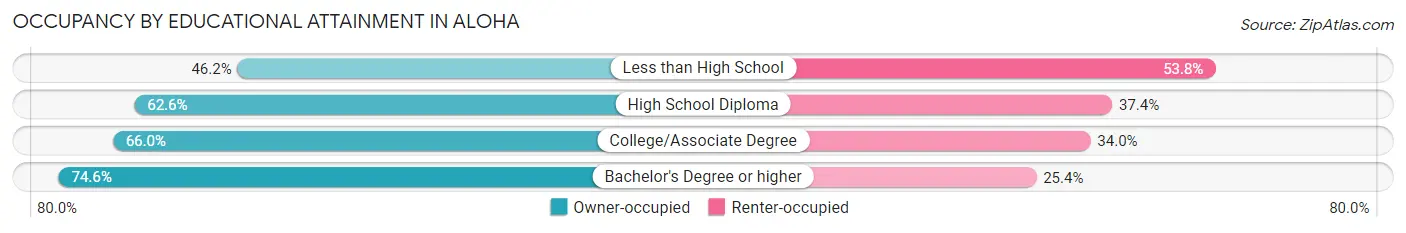
| Household Size | Owner-occupied | Renter-occupied |
| Less than High School | 626 (46.2%) | 728 (53.8%) |
| High School Diploma | 2,792 (62.6%) | 1,669 (37.4%) |
| College/Associate Degree | 4,089 (66.0%) | 2,105 (34.0%) |
| Bachelor's Degree or higher | 4,829 (74.6%) | 1,643 (25.4%) |
Occupancy by Age of Householder in Aloha
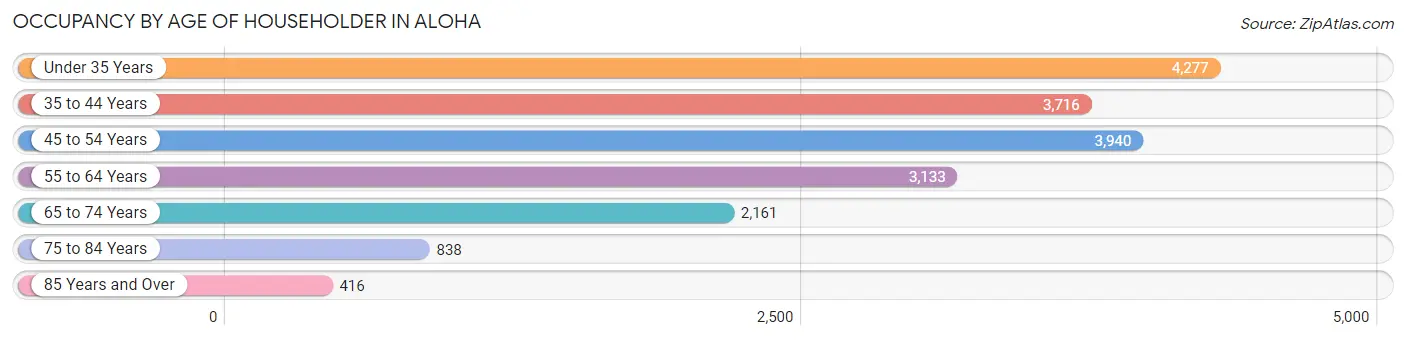
| Age Bracket | # Households | % Households |
| Under 35 Years | 4,277 | 23.1% |
| 35 to 44 Years | 3,716 | 20.1% |
| 45 to 54 Years | 3,940 | 21.3% |
| 55 to 64 Years | 3,133 | 17.0% |
| 65 to 74 Years | 2,161 | 11.7% |
| 75 to 84 Years | 838 | 4.5% |
| 85 Years and Over | 416 | 2.2% |
| Total | 18,481 | 100.0% |
Housing Finances in Aloha
Median Income by Occupancy in Aloha
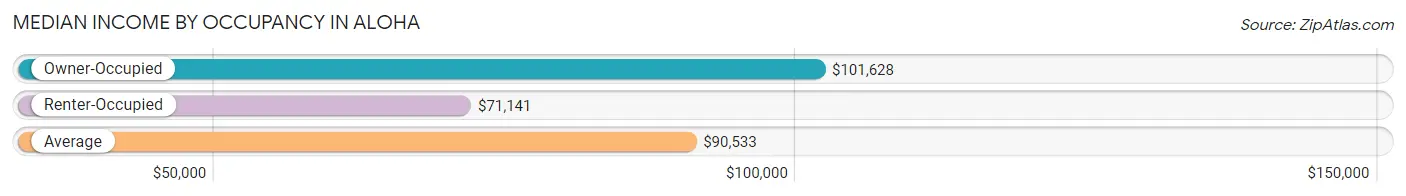
| Occupancy Type | # Households | Median Income |
| Owner-Occupied | 12,336 (66.7%) | $101,628 |
| Renter-Occupied | 6,145 (33.3%) | $71,141 |
| Average | 18,481 (100.0%) | $90,533 |
Occupancy by Householder Income Bracket in Aloha
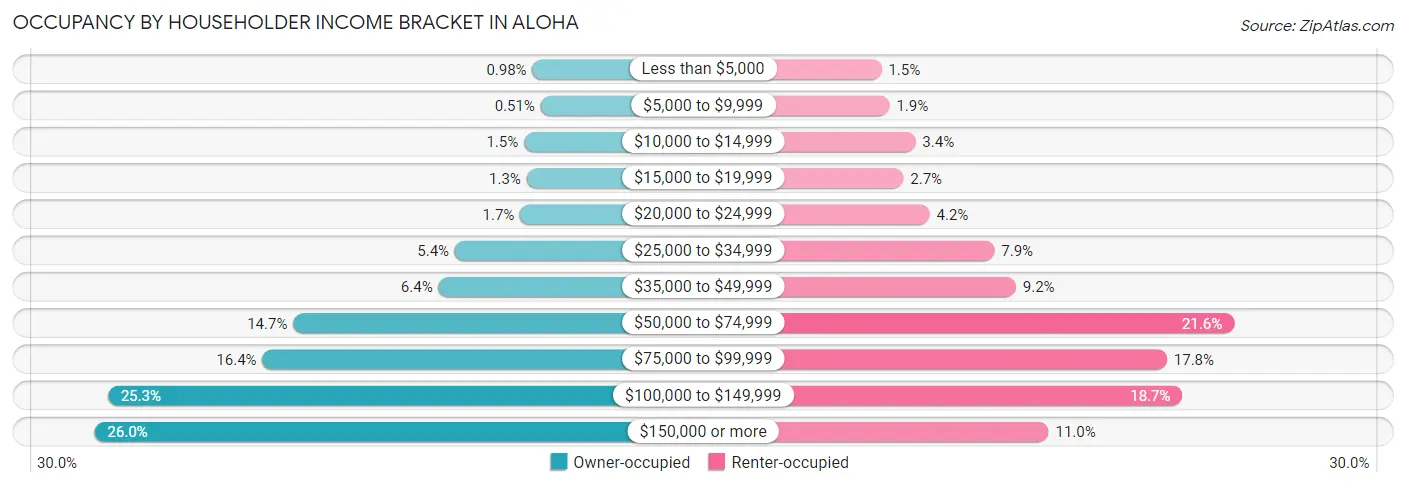
| Income Bracket | Owner-occupied | Renter-occupied |
| Less than $5,000 | 121 (1.0%) | 91 (1.5%) |
| $5,000 to $9,999 | 63 (0.5%) | 119 (1.9%) |
| $10,000 to $14,999 | 180 (1.5%) | 210 (3.4%) |
| $15,000 to $19,999 | 161 (1.3%) | 168 (2.7%) |
| $20,000 to $24,999 | 207 (1.7%) | 260 (4.2%) |
| $25,000 to $34,999 | 667 (5.4%) | 487 (7.9%) |
| $35,000 to $49,999 | 783 (6.4%) | 563 (9.2%) |
| $50,000 to $74,999 | 1,807 (14.6%) | 1,329 (21.6%) |
| $75,000 to $99,999 | 2,024 (16.4%) | 1,093 (17.8%) |
| $100,000 to $149,999 | 3,115 (25.3%) | 1,147 (18.7%) |
| $150,000 or more | 3,208 (26.0%) | 678 (11.0%) |
| Total | 12,336 (100.0%) | 6,145 (100.0%) |
Monthly Housing Cost Tiers in Aloha
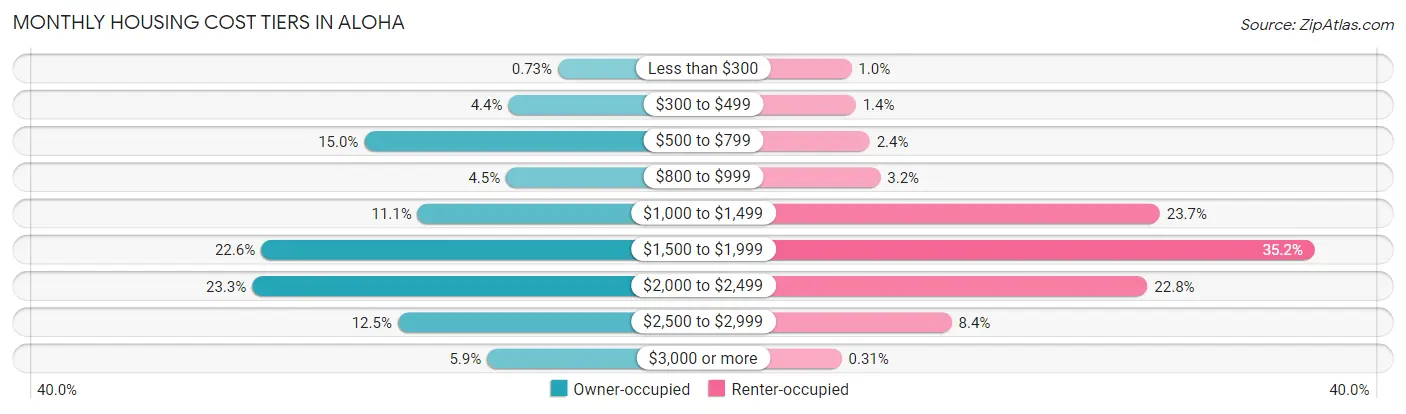
| Monthly Cost | Owner-occupied | Renter-occupied |
| Less than $300 | 90 (0.7%) | 63 (1.0%) |
| $300 to $499 | 540 (4.4%) | 83 (1.3%) |
| $500 to $799 | 1,849 (15.0%) | 146 (2.4%) |
| $800 to $999 | 560 (4.5%) | 194 (3.2%) |
| $1,000 to $1,499 | 1,364 (11.1%) | 1,459 (23.7%) |
| $1,500 to $1,999 | 2,787 (22.6%) | 2,160 (35.1%) |
| $2,000 to $2,499 | 2,868 (23.3%) | 1,403 (22.8%) |
| $2,500 to $2,999 | 1,545 (12.5%) | 517 (8.4%) |
| $3,000 or more | 733 (5.9%) | 19 (0.3%) |
| Total | 12,336 (100.0%) | 6,145 (100.0%) |
Physical Housing Characteristics in Aloha
Housing Structures in Aloha
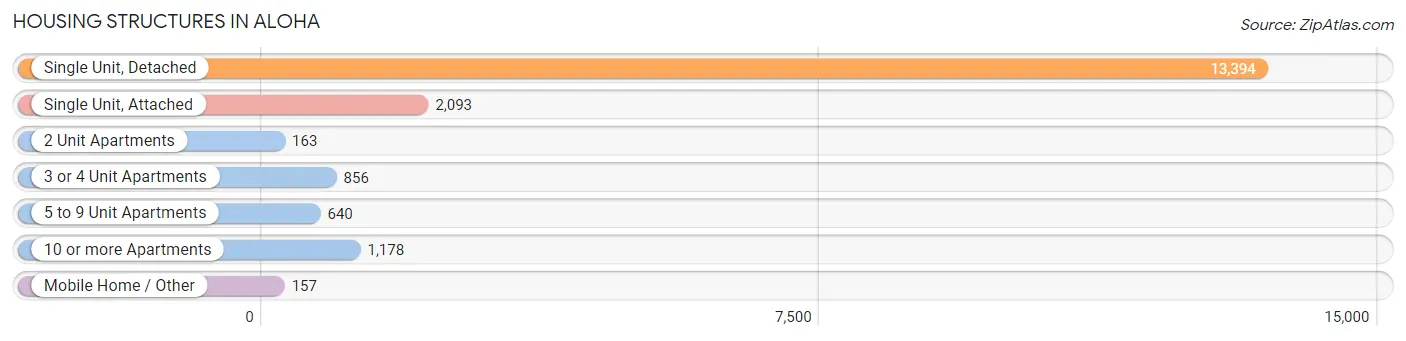
| Structure Type | # Housing Units | % Housing Units |
| Single Unit, Detached | 13,394 | 72.5% |
| Single Unit, Attached | 2,093 | 11.3% |
| 2 Unit Apartments | 163 | 0.9% |
| 3 or 4 Unit Apartments | 856 | 4.6% |
| 5 to 9 Unit Apartments | 640 | 3.5% |
| 10 or more Apartments | 1,178 | 6.4% |
| Mobile Home / Other | 157 | 0.9% |
| Total | 18,481 | 100.0% |
Housing Structures by Occupancy in Aloha
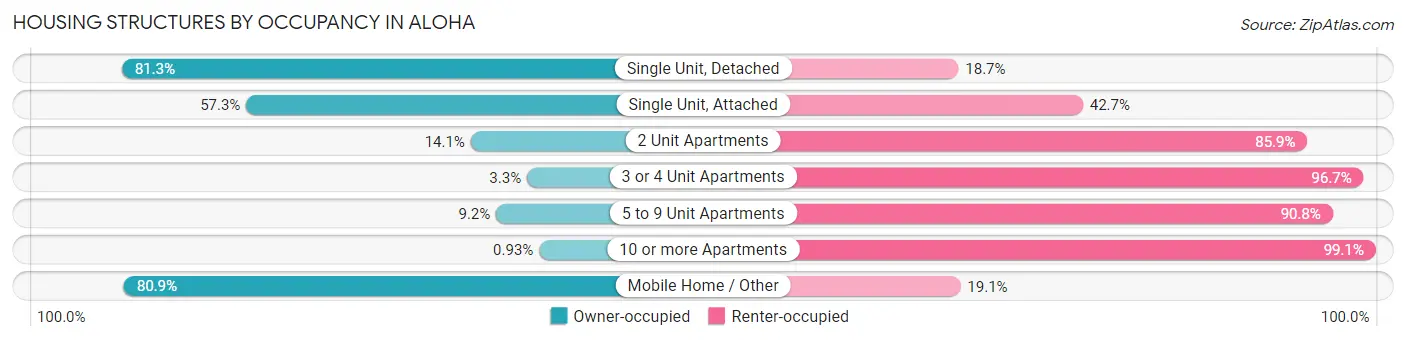
| Structure Type | Owner-occupied | Renter-occupied |
| Single Unit, Detached | 10,888 (81.3%) | 2,506 (18.7%) |
| Single Unit, Attached | 1,200 (57.3%) | 893 (42.7%) |
| 2 Unit Apartments | 23 (14.1%) | 140 (85.9%) |
| 3 or 4 Unit Apartments | 28 (3.3%) | 828 (96.7%) |
| 5 to 9 Unit Apartments | 59 (9.2%) | 581 (90.8%) |
| 10 or more Apartments | 11 (0.9%) | 1,167 (99.1%) |
| Mobile Home / Other | 127 (80.9%) | 30 (19.1%) |
| Total | 12,336 (66.7%) | 6,145 (33.3%) |
Housing Structures by Number of Rooms in Aloha
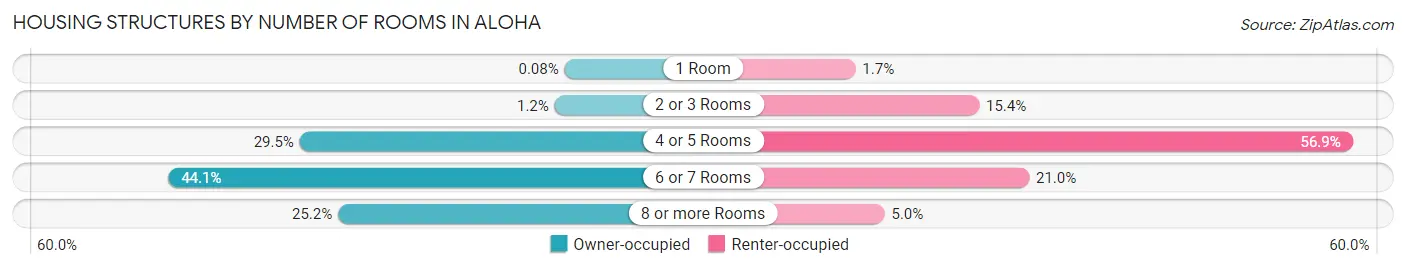
| Number of Rooms | Owner-occupied | Renter-occupied |
| 1 Room | 10 (0.1%) | 106 (1.7%) |
| 2 or 3 Rooms | 145 (1.2%) | 949 (15.4%) |
| 4 or 5 Rooms | 3,636 (29.5%) | 3,496 (56.9%) |
| 6 or 7 Rooms | 5,435 (44.1%) | 1,290 (21.0%) |
| 8 or more Rooms | 3,110 (25.2%) | 304 (5.0%) |
| Total | 12,336 (100.0%) | 6,145 (100.0%) |
Housing Structure by Heating Type in Aloha
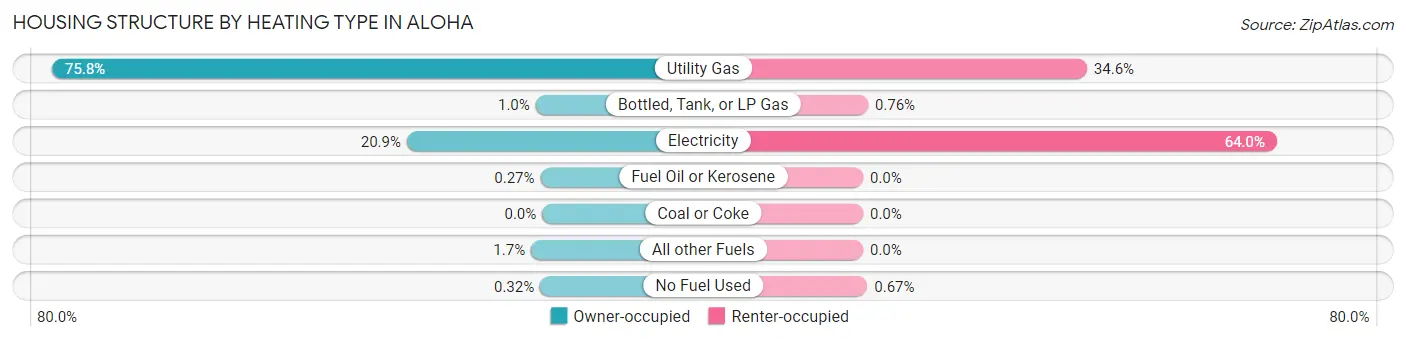
| Heating Type | Owner-occupied | Renter-occupied |
| Utility Gas | 9,347 (75.8%) | 2,127 (34.6%) |
| Bottled, Tank, or LP Gas | 123 (1.0%) | 47 (0.8%) |
| Electricity | 2,581 (20.9%) | 3,930 (63.9%) |
| Fuel Oil or Kerosene | 33 (0.3%) | 0 (0.0%) |
| Coal or Coke | 0 (0.0%) | 0 (0.0%) |
| All other Fuels | 212 (1.7%) | 0 (0.0%) |
| No Fuel Used | 40 (0.3%) | 41 (0.7%) |
| Total | 12,336 (100.0%) | 6,145 (100.0%) |
Household Vehicle Usage in Aloha
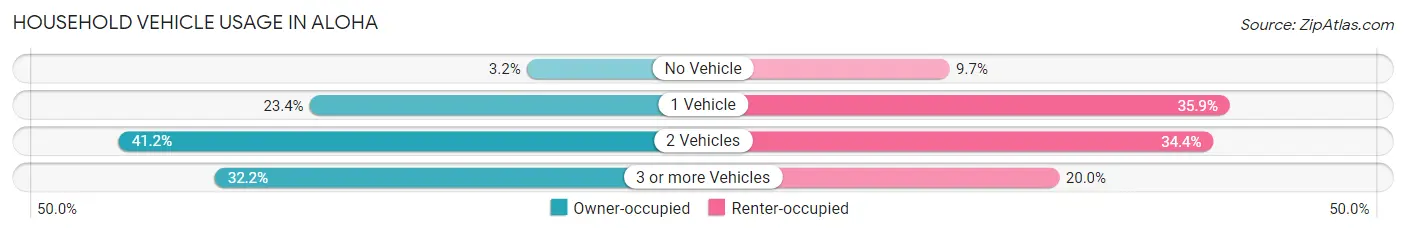
| Vehicles per Household | Owner-occupied | Renter-occupied |
| No Vehicle | 389 (3.2%) | 598 (9.7%) |
| 1 Vehicle | 2,888 (23.4%) | 2,207 (35.9%) |
| 2 Vehicles | 5,082 (41.2%) | 2,113 (34.4%) |
| 3 or more Vehicles | 3,977 (32.2%) | 1,227 (20.0%) |
| Total | 12,336 (100.0%) | 6,145 (100.0%) |
Real Estate & Mortgages in Aloha
Real Estate and Mortgage Overview in Aloha
| Characteristic | Without Mortgage | With Mortgage |
| Housing Units | 3,078 | 9,258 |
| Median Property Value | $428,400 | $439,500 |
| Median Household Income | $67,343 | $2,775 |
| Monthly Housing Costs | $644 | $704 |
| Real Estate Taxes | $3,656 | $170 |
Property Value by Mortgage Status in Aloha
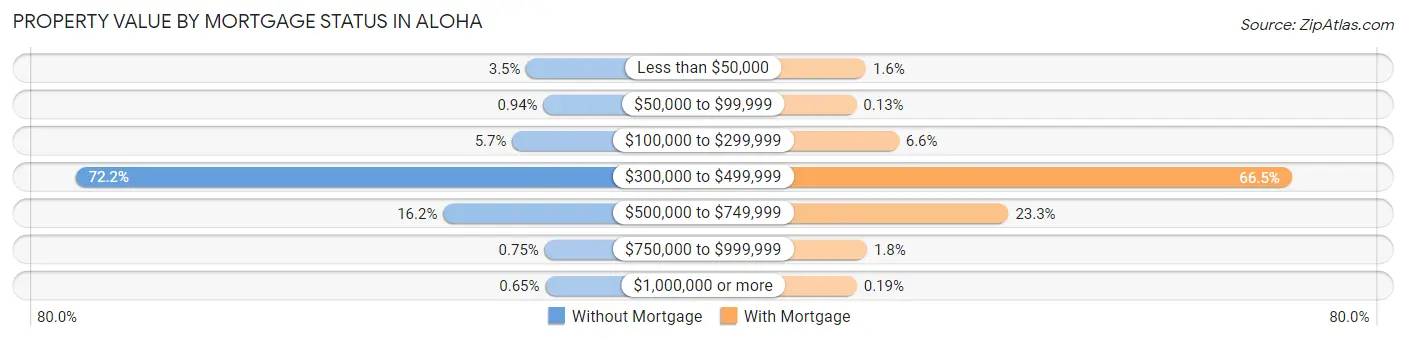
| Property Value | Without Mortgage | With Mortgage |
| Less than $50,000 | 109 (3.5%) | 147 (1.6%) |
| $50,000 to $99,999 | 29 (0.9%) | 12 (0.1%) |
| $100,000 to $299,999 | 175 (5.7%) | 610 (6.6%) |
| $300,000 to $499,999 | 2,223 (72.2%) | 6,152 (66.4%) |
| $500,000 to $749,999 | 499 (16.2%) | 2,157 (23.3%) |
| $750,000 to $999,999 | 23 (0.7%) | 162 (1.8%) |
| $1,000,000 or more | 20 (0.6%) | 18 (0.2%) |
| Total | 3,078 (100.0%) | 9,258 (100.0%) |
Household Income by Mortgage Status in Aloha
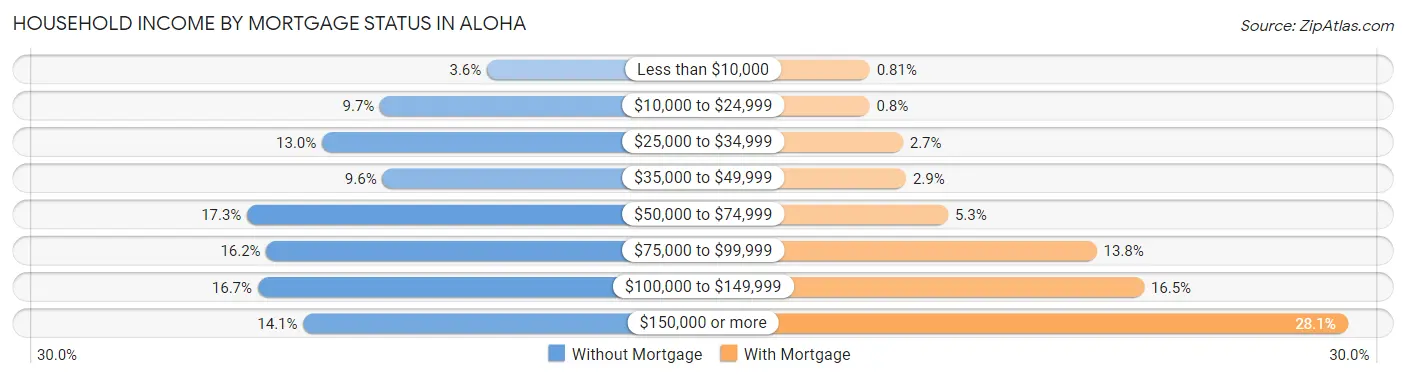
| Household Income | Without Mortgage | With Mortgage |
| Less than $10,000 | 110 (3.6%) | 75 (0.8%) |
| $10,000 to $24,999 | 298 (9.7%) | 74 (0.8%) |
| $25,000 to $34,999 | 400 (13.0%) | 250 (2.7%) |
| $35,000 to $49,999 | 294 (9.6%) | 267 (2.9%) |
| $50,000 to $74,999 | 532 (17.3%) | 489 (5.3%) |
| $75,000 to $99,999 | 498 (16.2%) | 1,275 (13.8%) |
| $100,000 to $149,999 | 513 (16.7%) | 1,526 (16.5%) |
| $150,000 or more | 433 (14.1%) | 2,602 (28.1%) |
| Total | 3,078 (100.0%) | 9,258 (100.0%) |
Property Value to Household Income Ratio in Aloha
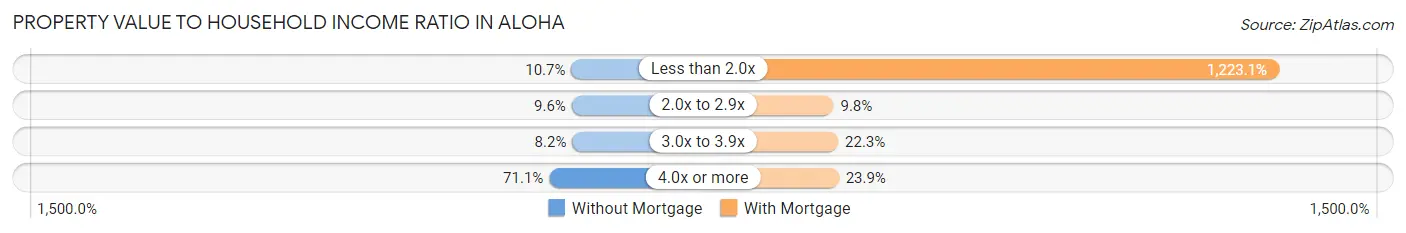
| Value-to-Income Ratio | Without Mortgage | With Mortgage |
| Less than 2.0x | 330 (10.7%) | 113,233 (1,223.1%) |
| 2.0x to 2.9x | 296 (9.6%) | 908 (9.8%) |
| 3.0x to 3.9x | 251 (8.2%) | 2,067 (22.3%) |
| 4.0x or more | 2,187 (71.1%) | 2,214 (23.9%) |
| Total | 3,078 (100.0%) | 9,258 (100.0%) |
Real Estate Taxes by Mortgage Status in Aloha
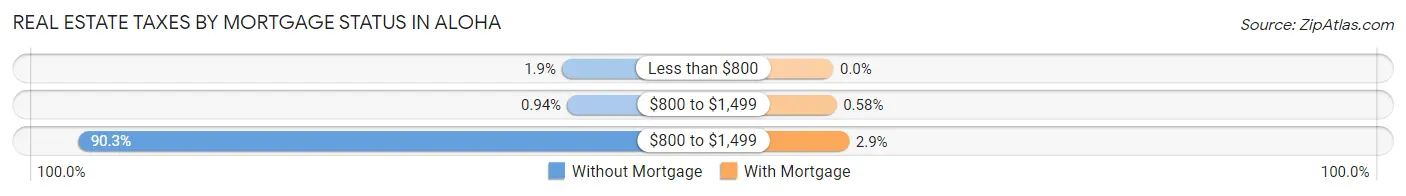
| Property Taxes | Without Mortgage | With Mortgage |
| Less than $800 | 58 (1.9%) | 0 (0.0%) |
| $800 to $1,499 | 29 (0.9%) | 54 (0.6%) |
| $800 to $1,499 | 2,779 (90.3%) | 268 (2.9%) |
| Total | 3,078 (100.0%) | 9,258 (100.0%) |
Health & Disability in Aloha
Health Insurance Coverage by Age in Aloha
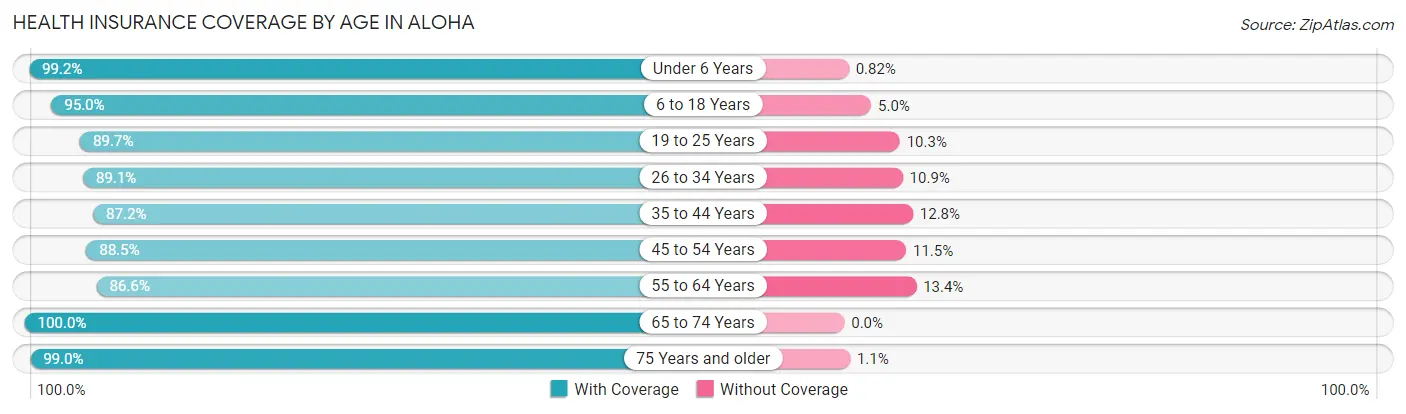
| Age Bracket | With Coverage | Without Coverage |
| Under 6 Years | 3,040 (99.2%) | 25 (0.8%) |
| 6 to 18 Years | 9,058 (95.0%) | 477 (5.0%) |
| 19 to 25 Years | 4,893 (89.7%) | 564 (10.3%) |
| 26 to 34 Years | 6,799 (89.1%) | 830 (10.9%) |
| 35 to 44 Years | 7,319 (87.2%) | 1,073 (12.8%) |
| 45 to 54 Years | 6,206 (88.5%) | 807 (11.5%) |
| 55 to 64 Years | 5,235 (86.6%) | 811 (13.4%) |
| 65 to 74 Years | 4,187 (100.0%) | 0 (0.0%) |
| 75 Years and older | 2,163 (99.0%) | 23 (1.1%) |
| Total | 48,900 (91.4%) | 4,610 (8.6%) |
Health Insurance Coverage by Citizenship Status in Aloha
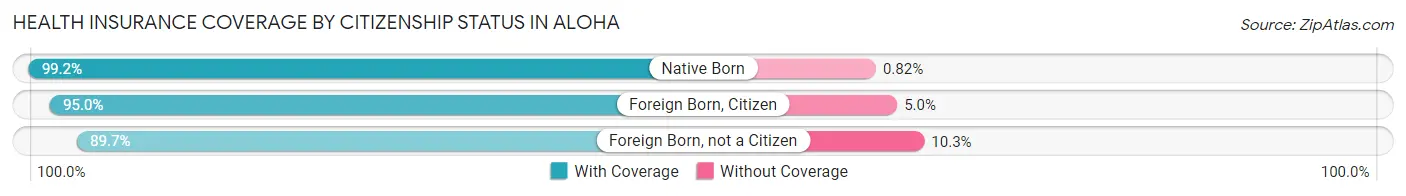
| Citizenship Status | With Coverage | Without Coverage |
| Native Born | 3,040 (99.2%) | 25 (0.8%) |
| Foreign Born, Citizen | 9,058 (95.0%) | 477 (5.0%) |
| Foreign Born, not a Citizen | 4,893 (89.7%) | 564 (10.3%) |
Health Insurance Coverage by Household Income in Aloha
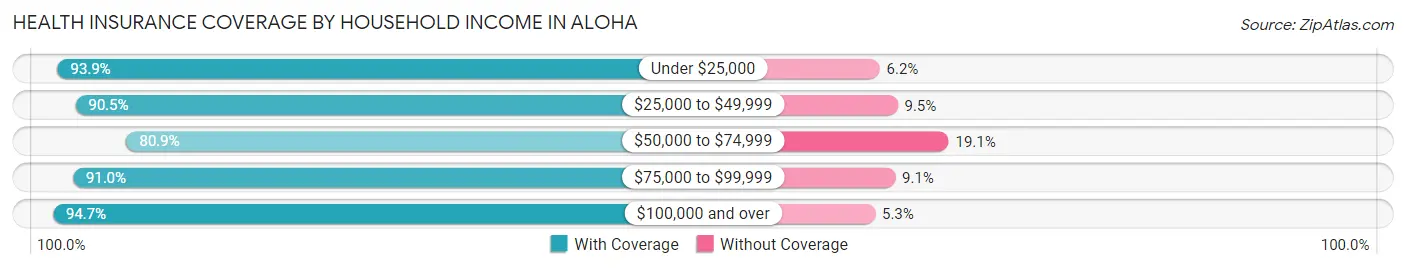
| Household Income | With Coverage | Without Coverage |
| Under $25,000 | 2,639 (93.9%) | 173 (6.1%) |
| $25,000 to $49,999 | 5,841 (90.5%) | 614 (9.5%) |
| $50,000 to $74,999 | 6,701 (80.9%) | 1,578 (19.1%) |
| $75,000 to $99,999 | 7,968 (90.9%) | 793 (9.0%) |
| $100,000 and over | 25,226 (94.7%) | 1,410 (5.3%) |
Public vs Private Health Insurance Coverage by Age in Aloha
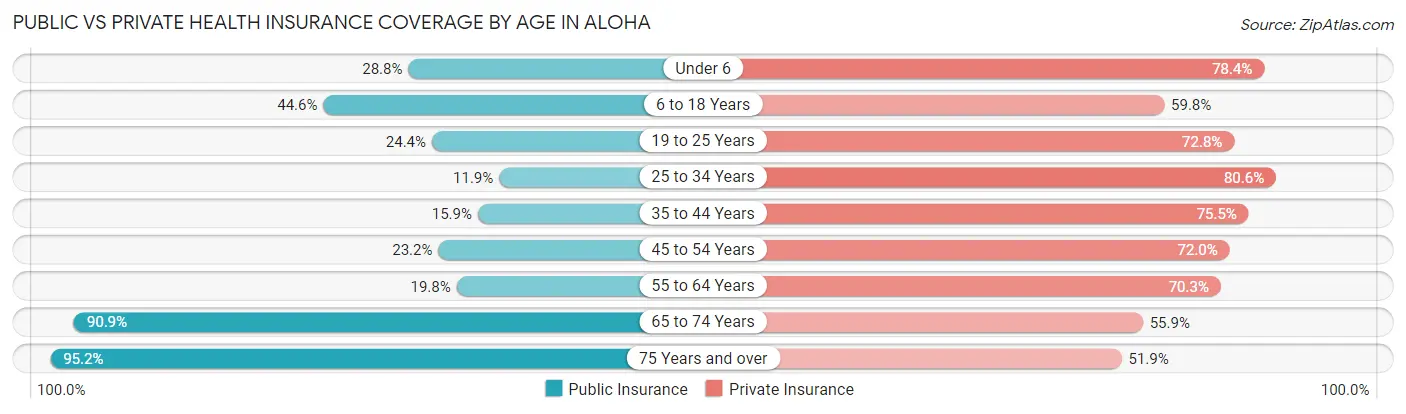
| Age Bracket | Public Insurance | Private Insurance |
| Under 6 | 882 (28.8%) | 2,403 (78.4%) |
| 6 to 18 Years | 4,249 (44.6%) | 5,705 (59.8%) |
| 19 to 25 Years | 1,332 (24.4%) | 3,974 (72.8%) |
| 25 to 34 Years | 909 (11.9%) | 6,148 (80.6%) |
| 35 to 44 Years | 1,333 (15.9%) | 6,338 (75.5%) |
| 45 to 54 Years | 1,628 (23.2%) | 5,048 (72.0%) |
| 55 to 64 Years | 1,199 (19.8%) | 4,252 (70.3%) |
| 65 to 74 Years | 3,804 (90.8%) | 2,339 (55.9%) |
| 75 Years and over | 2,082 (95.2%) | 1,135 (51.9%) |
| Total | 17,418 (32.6%) | 37,342 (69.8%) |
Disability Status by Sex by Age in Aloha
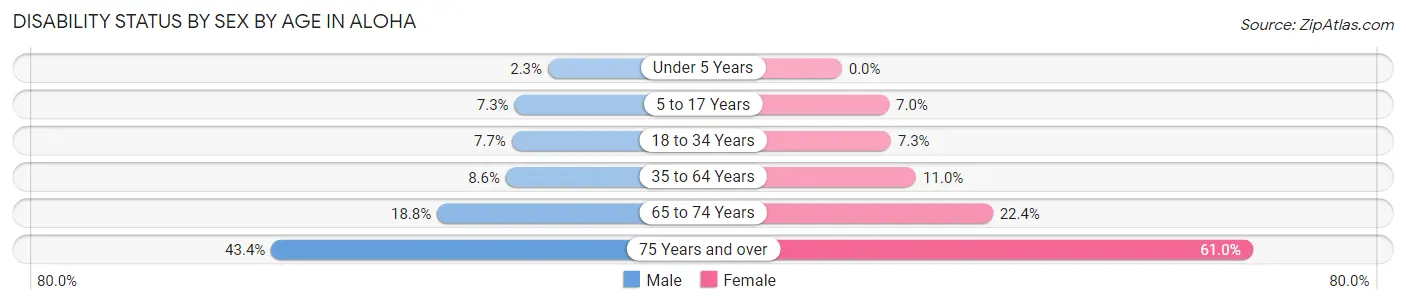
| Age Bracket | Male | Female |
| Under 5 Years | 33 (2.3%) | 0 (0.0%) |
| 5 to 17 Years | 332 (7.3%) | 324 (7.0%) |
| 18 to 34 Years | 559 (7.7%) | 473 (7.3%) |
| 35 to 64 Years | 935 (8.6%) | 1,160 (11.0%) |
| 65 to 74 Years | 336 (18.8%) | 537 (22.4%) |
| 75 Years and over | 427 (43.4%) | 733 (61.0%) |
Disability Class by Sex by Age in Aloha
Disability Class: Hearing Difficulty
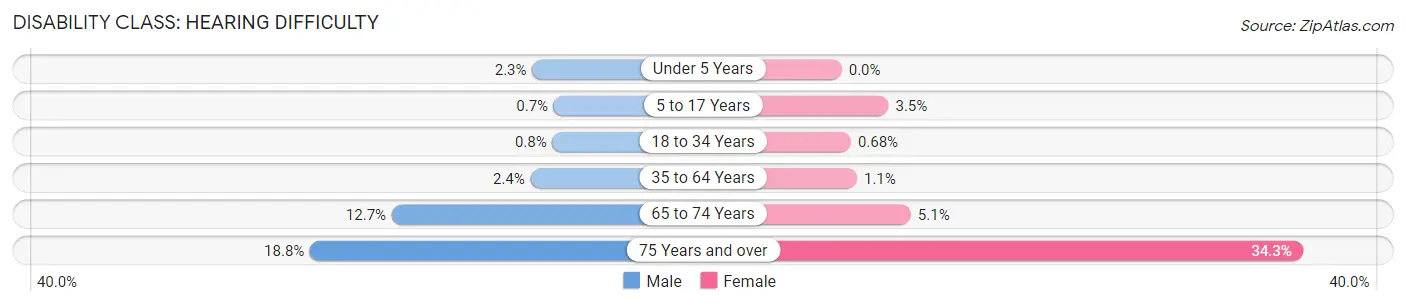
| Age Bracket | Male | Female |
| Under 5 Years | 33 (2.3%) | 0 (0.0%) |
| 5 to 17 Years | 32 (0.7%) | 160 (3.5%) |
| 18 to 34 Years | 58 (0.8%) | 44 (0.7%) |
| 35 to 64 Years | 266 (2.4%) | 119 (1.1%) |
| 65 to 74 Years | 228 (12.7%) | 123 (5.1%) |
| 75 Years and over | 185 (18.8%) | 412 (34.3%) |
Disability Class: Vision Difficulty

| Age Bracket | Male | Female |
| Under 5 Years | 0 (0.0%) | 0 (0.0%) |
| 5 to 17 Years | 60 (1.3%) | 94 (2.0%) |
| 18 to 34 Years | 73 (1.0%) | 65 (1.0%) |
| 35 to 64 Years | 240 (2.2%) | 149 (1.4%) |
| 65 to 74 Years | 15 (0.8%) | 124 (5.2%) |
| 75 Years and over | 46 (4.7%) | 258 (21.5%) |
Disability Class: Cognitive Difficulty
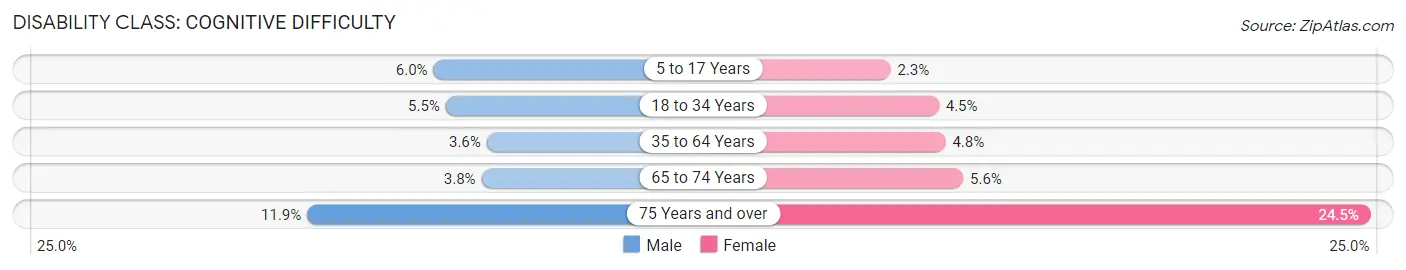
| Age Bracket | Male | Female |
| 5 to 17 Years | 275 (6.0%) | 104 (2.3%) |
| 18 to 34 Years | 398 (5.5%) | 292 (4.5%) |
| 35 to 64 Years | 389 (3.6%) | 506 (4.8%) |
| 65 to 74 Years | 68 (3.8%) | 135 (5.6%) |
| 75 Years and over | 117 (11.9%) | 295 (24.5%) |
Disability Class: Ambulatory Difficulty
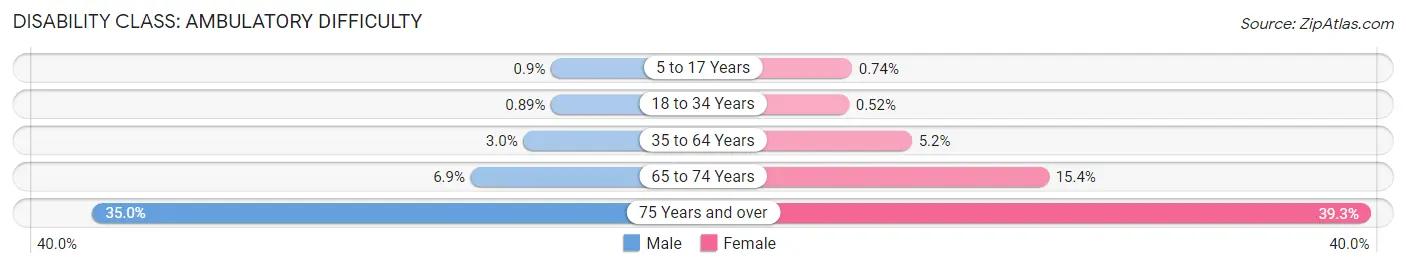
| Age Bracket | Male | Female |
| 5 to 17 Years | 41 (0.9%) | 34 (0.7%) |
| 18 to 34 Years | 65 (0.9%) | 34 (0.5%) |
| 35 to 64 Years | 324 (3.0%) | 545 (5.2%) |
| 65 to 74 Years | 123 (6.9%) | 368 (15.4%) |
| 75 Years and over | 344 (35.0%) | 472 (39.3%) |
Disability Class: Self-Care Difficulty
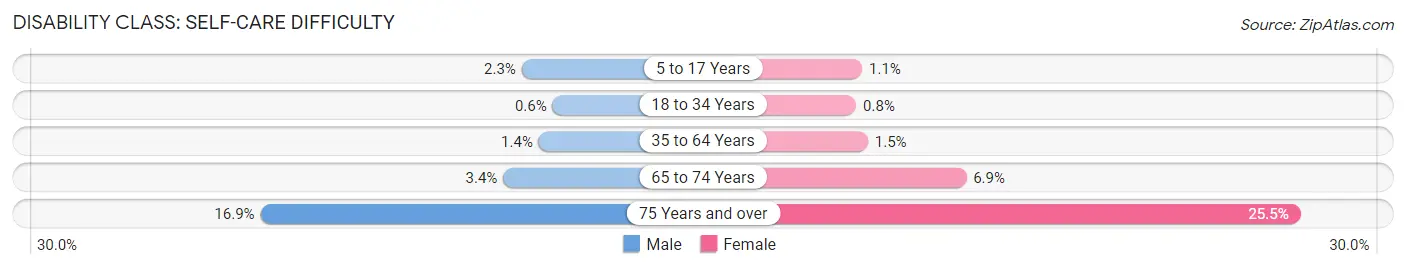
| Age Bracket | Male | Female |
| 5 to 17 Years | 106 (2.3%) | 52 (1.1%) |
| 18 to 34 Years | 44 (0.6%) | 52 (0.8%) |
| 35 to 64 Years | 150 (1.4%) | 152 (1.5%) |
| 65 to 74 Years | 60 (3.4%) | 166 (6.9%) |
| 75 Years and over | 166 (16.9%) | 307 (25.5%) |
Technology Access in Aloha
Computing Device Access in Aloha
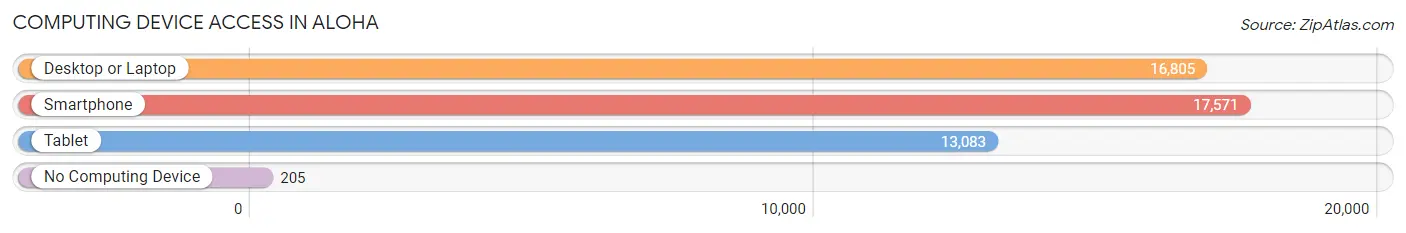
| Device Type | # Households | % Households |
| Desktop or Laptop | 16,805 | 90.9% |
| Smartphone | 17,571 | 95.1% |
| Tablet | 13,083 | 70.8% |
| No Computing Device | 205 | 1.1% |
| Total | 18,481 | 100.0% |
Internet Access in Aloha
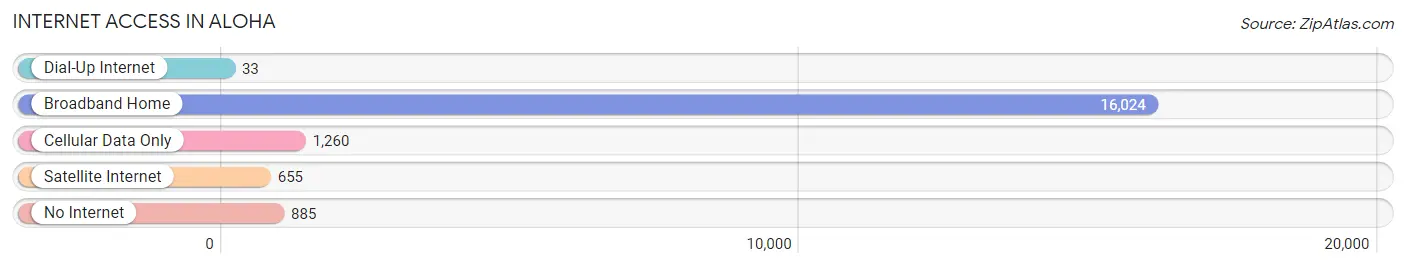
| Internet Type | # Households | % Households |
| Dial-Up Internet | 33 | 0.2% |
| Broadband Home | 16,024 | 86.7% |
| Cellular Data Only | 1,260 | 6.8% |
| Satellite Internet | 655 | 3.5% |
| No Internet | 885 | 4.8% |
| Total | 18,481 | 100.0% |
Aloha Summary
Aloha is an unincorporated community located in Washington County, Oregon, United States. It is a suburb of Portland and is located in the Tualatin Valley, between Beaverton and Hillsboro. Aloha is bordered by the cities of Beaverton, Hillsboro, and Cornelius. The population of Aloha was 49,425 as of the 2010 census.
History
The area now known as Aloha was originally inhabited by the Atfalati tribe of the Kalapuya Native American people. The first non-native settlers arrived in the area in the early 1840s, and the area was officially established as the Aloha post office in 1876. The name Aloha was chosen by the first postmaster, who was inspired by the Hawaiian greeting.
The area remained largely rural until the 1950s, when the population began to grow rapidly due to the influx of people moving to the Portland metropolitan area. The area was officially incorporated as the City of Aloha in 1974, but was later disincorporated in 1980 due to financial difficulties.
Geography
Aloha is located in the Tualatin Valley, between Beaverton and Hillsboro. It is bordered by the cities of Beaverton, Hillsboro, and Cornelius. The area is characterized by rolling hills and valleys, with elevations ranging from 200 to 500 feet above sea level. The climate is mild and temperate, with warm summers and cool winters.
Economy
Aloha is home to a variety of businesses, including retail stores, restaurants, and professional services. The area is also home to several large employers, including Intel, Nike, and Tektronix. The area is also home to several technology companies, including Oracle, Symantec, and Xerox.
Demographics
As of the 2010 census, the population of Aloha was 49,425. The racial makeup of the city was 73.3% White, 8.2% Asian, 6.2% Hispanic or Latino, 5.2% African American, and 4.3% from other races. The median household income was $63,945, and the median family income was $76,945.
Conclusion
Aloha is a vibrant and diverse community located in Washington County, Oregon. It is a suburb of Portland and is located in the Tualatin Valley, between Beaverton and Hillsboro. The area has a rich history, and is home to a variety of businesses and employers. The population of Aloha is 49,425, and is composed of a variety of racial and ethnic backgrounds. Aloha is a great place to live, work, and play.
Common Questions
What is Per Capita Income in Aloha?
Per Capita income in Aloha is $37,909.
What is the Median Family Income in Aloha?
Median Family Income in Aloha is $96,409.
What is the Median Household income in Aloha?
Median Household Income in Aloha is $90,533.
What is Income or Wage Gap in Aloha?
Income or Wage Gap in Aloha is 24.2%.
Women in Aloha earn 75.8 cents for every dollar earned by a man.
What is Inequality or Gini Index in Aloha?
Inequality or Gini Index in Aloha is 0.38.
What is the Total Population of Aloha?
Total Population of Aloha is 53,532.
What is the Total Male Population of Aloha?
Total Male Population of Aloha is 27,019.
What is the Total Female Population of Aloha?
Total Female Population of Aloha is 26,513.
What is the Ratio of Males per 100 Females in Aloha?
There are 101.91 Males per 100 Females in Aloha.
What is the Ratio of Females per 100 Males in Aloha?
There are 98.13 Females per 100 Males in Aloha.
What is the Median Population Age in Aloha?
Median Population Age in Aloha is 36.0 Years.
What is the Average Family Size in Aloha
Average Family Size in Aloha is 3.3 People.
What is the Average Household Size in Aloha
Average Household Size in Aloha is 2.9 People.
How Large is the Labor Force in Aloha?
There are 29,937 People in the Labor Forcein in Aloha.
What is the Percentage of People in the Labor Force in Aloha?
69.1% of People are in the Labor Force in Aloha.
What is the Unemployment Rate in Aloha?
Unemployment Rate in Aloha is 5.1%.