Alafaya, FL Map & Demographics
Alafaya Map
Alafaya Overview
$37,338
PER CAPITA INCOME
$108,275
AVG FAMILY INCOME
$93,251
AVG HOUSEHOLD INCOME
28.7%
WAGE / INCOME GAP [ % ]
71.3¢/ $1
WAGE / INCOME GAP [ $ ]
$9,309
FAMILY INCOME DEFICIT
0.38
INEQUALITY / GINI INDEX
91,531
TOTAL POPULATION
45,201
MALE POPULATION
46,330
FEMALE POPULATION
97.56
MALES / 100 FEMALES
102.50
FEMALES / 100 MALES
35.9
MEDIAN AGE
3.4
AVG FAMILY SIZE
2.9
AVG HOUSEHOLD SIZE
52,509
LABOR FORCE [ PEOPLE ]
70.9%
PERCENT IN LABOR FORCE
4.4%
UNEMPLOYMENT RATE
Income in Alafaya
Income Overview in Alafaya
Per Capita Income in Alafaya is $37,338, while median incomes of families and households are $108,275 and $93,251 respectively.
| Characteristic | Number | Measure |
| Per Capita Income | 91,531 | $37,338 |
| Median Family Income | 21,841 | $108,275 |
| Mean Family Income | 21,841 | $118,728 |
| Median Household Income | 31,506 | $93,251 |
| Mean Household Income | 31,506 | $104,378 |
| Income Deficit | 21,841 | $9,309 |
| Wage / Income Gap (%) | 91,531 | 28.69% |
| Wage / Income Gap ($) | 91,531 | 71.31¢ per $1 |
| Gini / Inequality Index | 91,531 | 0.38 |
Earnings by Sex in Alafaya
Average Earnings in Alafaya are $42,194, $50,826 for men and $36,244 for women, a difference of 28.7%.
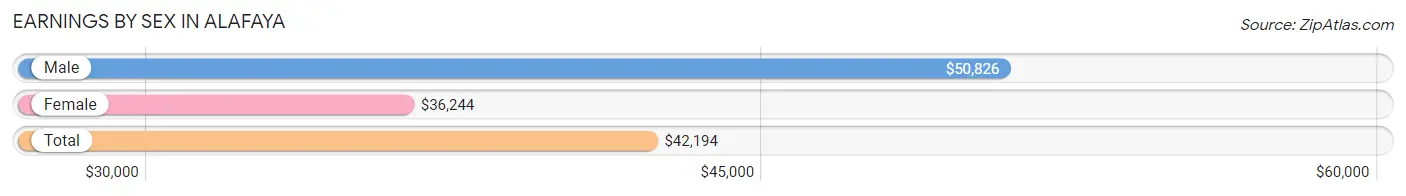
| Sex | Number | Average Earnings |
| Male | 28,561 (54.0%) | $50,826 |
| Female | 24,309 (46.0%) | $36,244 |
| Total | 52,870 (100.0%) | $42,194 |
Earnings by Sex by Income Bracket in Alafaya
The most common earnings brackets in Alafaya are $100,000+ for men (6,766 | 23.7%) and $75,000 to $99,999 for women (2,773 | 11.4%).
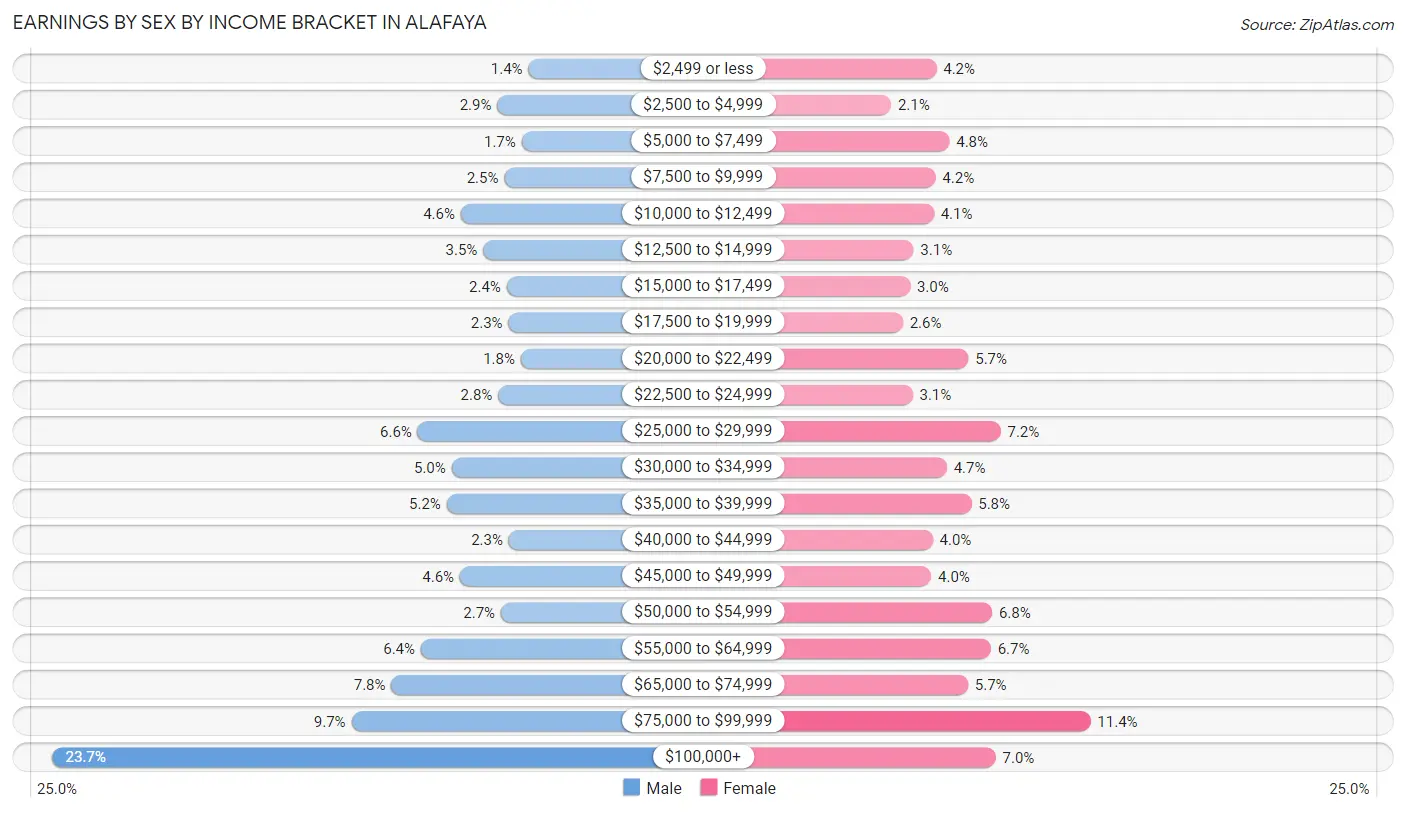
| Income | Male | Female |
| $2,499 or less | 399 (1.4%) | 1,018 (4.2%) |
| $2,500 to $4,999 | 817 (2.9%) | 504 (2.1%) |
| $5,000 to $7,499 | 492 (1.7%) | 1,168 (4.8%) |
| $7,500 to $9,999 | 723 (2.5%) | 1,008 (4.2%) |
| $10,000 to $12,499 | 1,305 (4.6%) | 989 (4.1%) |
| $12,500 to $14,999 | 1,005 (3.5%) | 758 (3.1%) |
| $15,000 to $17,499 | 690 (2.4%) | 720 (3.0%) |
| $17,500 to $19,999 | 667 (2.3%) | 636 (2.6%) |
| $20,000 to $22,499 | 503 (1.8%) | 1,382 (5.7%) |
| $22,500 to $24,999 | 804 (2.8%) | 748 (3.1%) |
| $25,000 to $29,999 | 1,882 (6.6%) | 1,750 (7.2%) |
| $30,000 to $34,999 | 1,428 (5.0%) | 1,137 (4.7%) |
| $35,000 to $39,999 | 1,495 (5.2%) | 1,417 (5.8%) |
| $40,000 to $44,999 | 663 (2.3%) | 978 (4.0%) |
| $45,000 to $49,999 | 1,316 (4.6%) | 959 (4.0%) |
| $50,000 to $54,999 | 768 (2.7%) | 1,652 (6.8%) |
| $55,000 to $64,999 | 1,838 (6.4%) | 1,638 (6.7%) |
| $65,000 to $74,999 | 2,233 (7.8%) | 1,379 (5.7%) |
| $75,000 to $99,999 | 2,767 (9.7%) | 2,773 (11.4%) |
| $100,000+ | 6,766 (23.7%) | 1,695 (7.0%) |
| Total | 28,561 (100.0%) | 24,309 (100.0%) |
Earnings by Sex by Educational Attainment in Alafaya
Average earnings in Alafaya are $63,814 for men and $41,727 for women, a difference of 34.6%. Men with an educational attainment of graduate degree enjoy the highest average annual earnings of $104,289, while those with less than high school education earn the least with $34,347. Women with an educational attainment of graduate degree earn the most with the average annual earnings of $72,321, while those with less than high school education have the smallest earnings of $26,133.
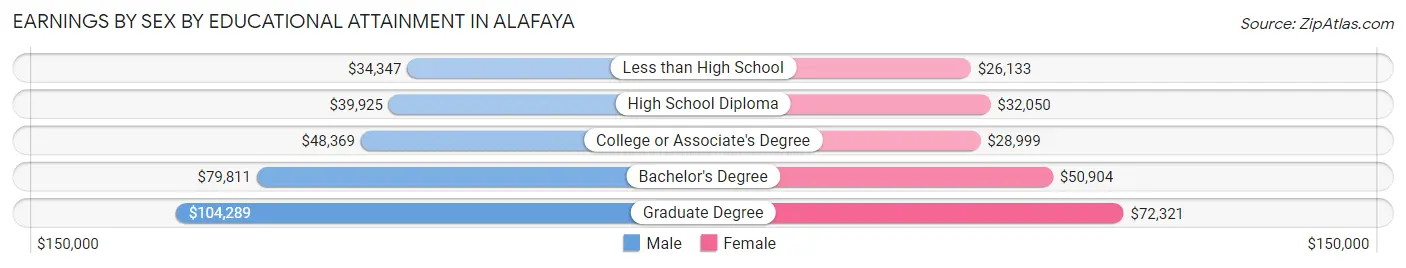
| Educational Attainment | Male Income | Female Income |
| Less than High School | $34,347 | $26,133 |
| High School Diploma | $39,925 | $32,050 |
| College or Associate's Degree | $48,369 | $28,999 |
| Bachelor's Degree | $79,811 | $50,904 |
| Graduate Degree | $104,289 | $72,321 |
| Total | $63,814 | $41,727 |
Family Income in Alafaya
Family Income Brackets in Alafaya
According to the Alafaya family income data, there are 6,487 families falling into the $100,000 to $149,999 income range, which is the most common income bracket and makes up 29.7% of all families. Conversely, the $10,000 to $14,999 income bracket is the least frequent group with only 109 families (0.5%) belonging to this category.
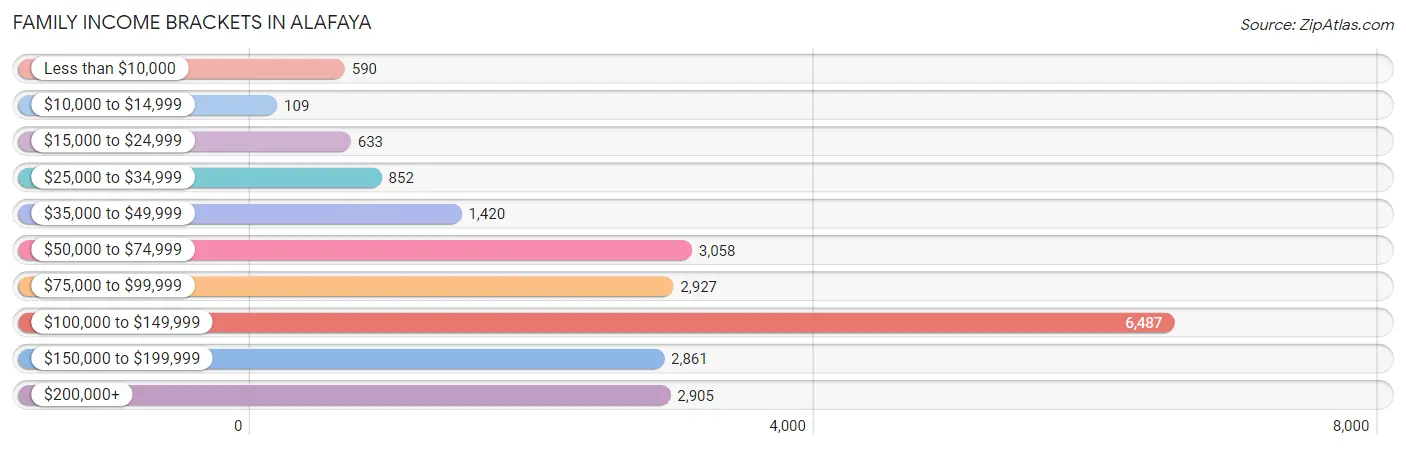
| Income Bracket | # Families | % Families |
| Less than $10,000 | 590 | 2.7% |
| $10,000 to $14,999 | 109 | 0.5% |
| $15,000 to $24,999 | 633 | 2.9% |
| $25,000 to $34,999 | 852 | 3.9% |
| $35,000 to $49,999 | 1,420 | 6.5% |
| $50,000 to $74,999 | 3,058 | 14.0% |
| $75,000 to $99,999 | 2,927 | 13.4% |
| $100,000 to $149,999 | 6,487 | 29.7% |
| $150,000 to $199,999 | 2,861 | 13.1% |
| $200,000+ | 2,905 | 13.3% |
Family Income by Famaliy Size in Alafaya
7+ person families (335 | 1.5%) account for the highest median family income in Alafaya with $139,816 per family, while 2-person families (8,186 | 37.5%) have the highest median income of $44,219 per family member.
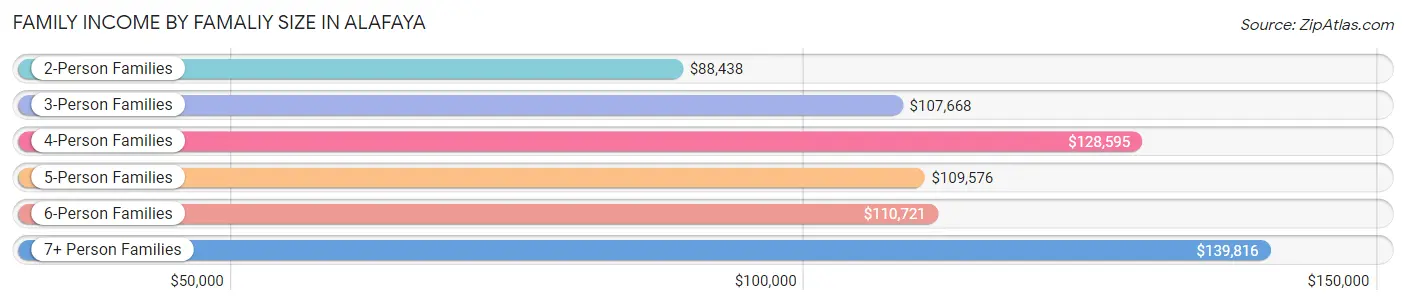
| Income Bracket | # Families | Median Income |
| 2-Person Families | 8,186 (37.5%) | $88,438 |
| 3-Person Families | 4,781 (21.9%) | $107,668 |
| 4-Person Families | 5,633 (25.8%) | $128,595 |
| 5-Person Families | 2,265 (10.4%) | $109,576 |
| 6-Person Families | 641 (2.9%) | $110,721 |
| 7+ Person Families | 335 (1.5%) | $139,816 |
| Total | 21,841 (100.0%) | $108,275 |
Family Income by Number of Earners in Alafaya
The median family income in Alafaya is $108,275, with families comprising 2 earners (9,809) having the highest median family income of $124,980, while families with no earners (2,080) have the lowest median family income of $38,229, accounting for 44.9% and 9.5% of families, respectively.
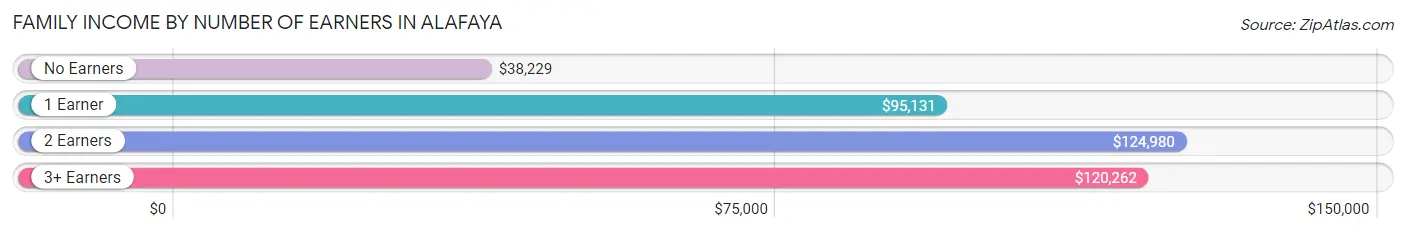
| Number of Earners | # Families | Median Income |
| No Earners | 2,080 (9.5%) | $38,229 |
| 1 Earner | 6,391 (29.3%) | $95,131 |
| 2 Earners | 9,809 (44.9%) | $124,980 |
| 3+ Earners | 3,561 (16.3%) | $120,262 |
| Total | 21,841 (100.0%) | $108,275 |
Household Income in Alafaya
Household Income Brackets in Alafaya
With 7,876 households falling in the category, the $100,000 to $149,999 income range is the most frequent in Alafaya, accounting for 25.0% of all households. In contrast, only 473 households (1.5%) fall into the $10,000 to $14,999 income bracket, making it the least populous group.
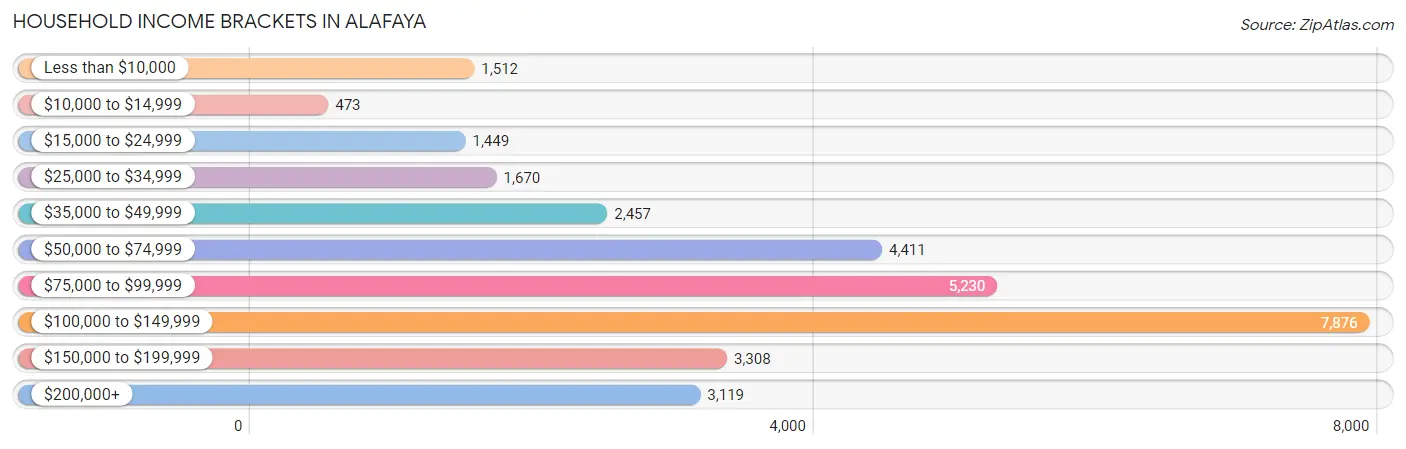
| Income Bracket | # Households | % Households |
| Less than $10,000 | 1,512 | 4.8% |
| $10,000 to $14,999 | 473 | 1.5% |
| $15,000 to $24,999 | 1,449 | 4.6% |
| $25,000 to $34,999 | 1,670 | 5.3% |
| $35,000 to $49,999 | 2,457 | 7.8% |
| $50,000 to $74,999 | 4,411 | 14.0% |
| $75,000 to $99,999 | 5,230 | 16.6% |
| $100,000 to $149,999 | 7,876 | 25.0% |
| $150,000 to $199,999 | 3,308 | 10.5% |
| $200,000+ | 3,119 | 9.9% |
Household Income by Householder Age in Alafaya
The median household income in Alafaya is $93,251, with the highest median household income of $109,709 found in the 45 to 64 years age bracket for the primary householder. A total of 12,285 households (39.0%) fall into this category. Meanwhile, the 15 to 24 years age bracket for the primary householder has the lowest median household income of $56,923, with 1,968 households (6.2%) in this group.
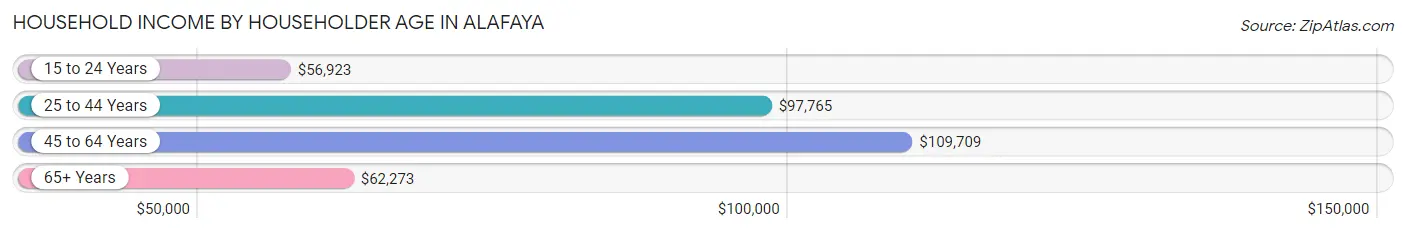
| Income Bracket | # Households | Median Income |
| 15 to 24 Years | 1,968 (6.2%) | $56,923 |
| 25 to 44 Years | 12,204 (38.7%) | $97,765 |
| 45 to 64 Years | 12,285 (39.0%) | $109,709 |
| 65+ Years | 5,049 (16.0%) | $62,273 |
| Total | 31,506 (100.0%) | $93,251 |
Poverty in Alafaya
Income Below Poverty by Sex and Age in Alafaya
With 7.6% poverty level for males and 10.3% for females among the residents of Alafaya, 18 to 24 year old males and 18 to 24 year old females are the most vulnerable to poverty, with 1,093 males (18.0%) and 1,393 females (24.5%) in their respective age groups living below the poverty level.
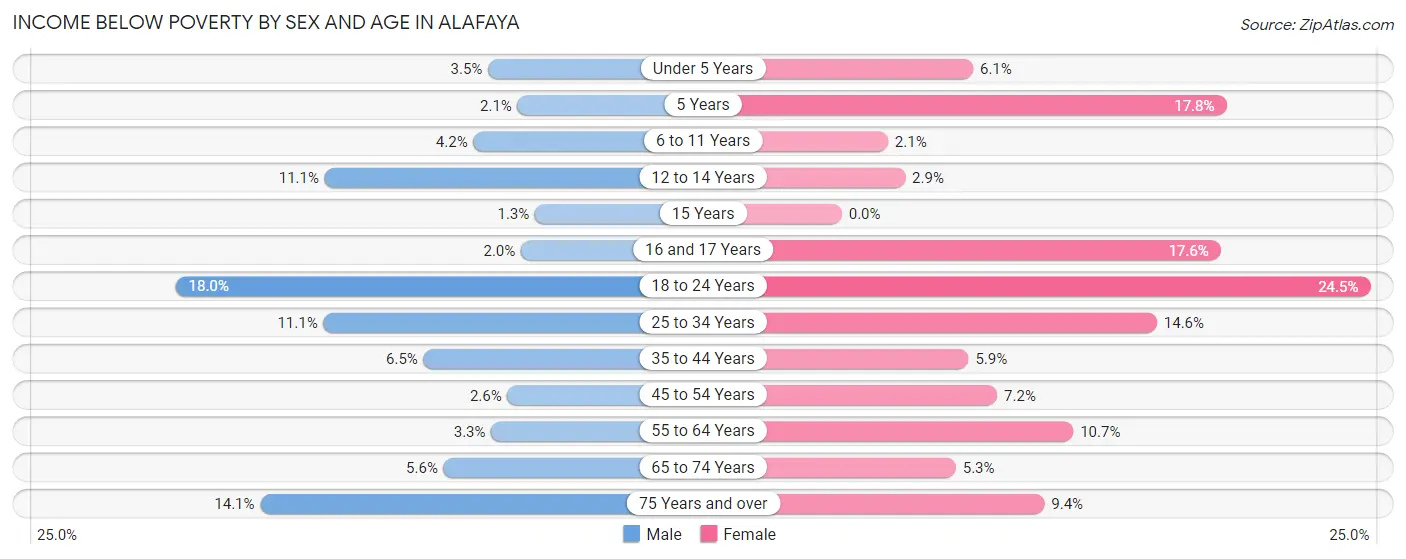
| Age Bracket | Male | Female |
| Under 5 Years | 88 (3.5%) | 155 (6.1%) |
| 5 Years | 12 (2.1%) | 61 (17.8%) |
| 6 to 11 Years | 147 (4.2%) | 61 (2.1%) |
| 12 to 14 Years | 179 (11.1%) | 64 (2.9%) |
| 15 Years | 10 (1.3%) | 0 (0.0%) |
| 16 and 17 Years | 17 (2.0%) | 164 (17.6%) |
| 18 to 24 Years | 1,093 (18.0%) | 1,393 (24.5%) |
| 25 to 34 Years | 739 (11.1%) | 1,022 (14.6%) |
| 35 to 44 Years | 477 (6.5%) | 383 (5.9%) |
| 45 to 54 Years | 175 (2.6%) | 508 (7.2%) |
| 55 to 64 Years | 147 (3.3%) | 527 (10.7%) |
| 65 to 74 Years | 150 (5.6%) | 177 (5.3%) |
| 75 Years and over | 199 (14.1%) | 228 (9.4%) |
| Total | 3,433 (7.6%) | 4,743 (10.3%) |
Income Above Poverty by Sex and Age in Alafaya
According to the poverty statistics in Alafaya, males aged 15 years and females aged 15 years are the age groups that are most secure financially, with 98.7% of males and 100.0% of females in these age groups living above the poverty line.
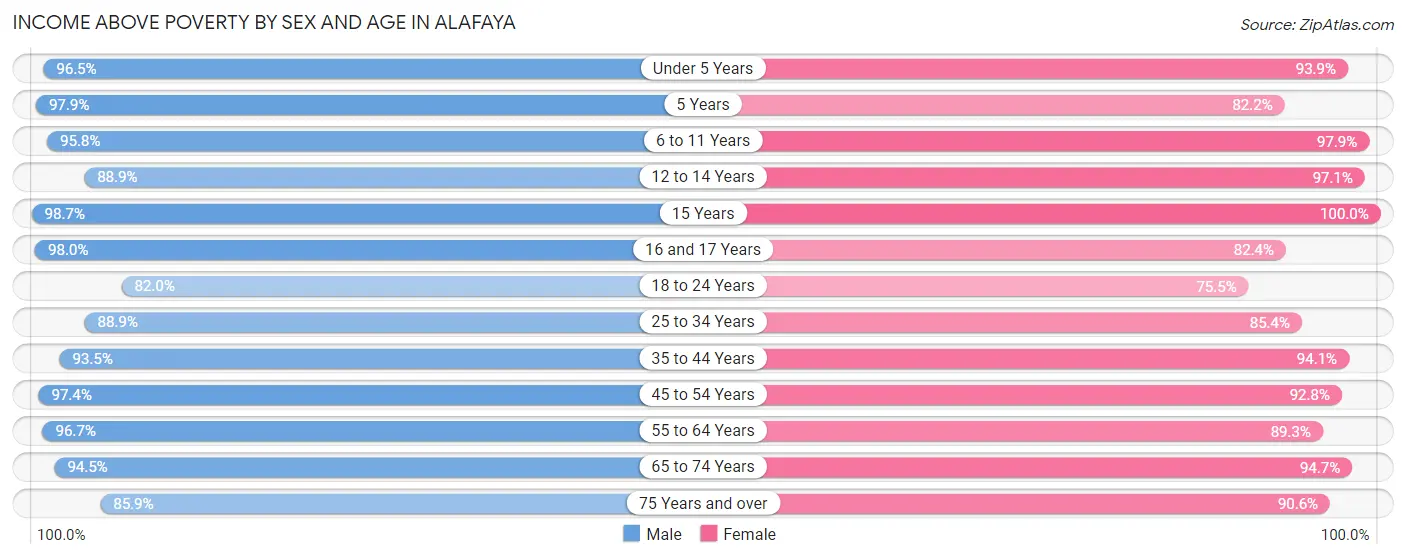
| Age Bracket | Male | Female |
| Under 5 Years | 2,430 (96.5%) | 2,390 (93.9%) |
| 5 Years | 555 (97.9%) | 281 (82.2%) |
| 6 to 11 Years | 3,377 (95.8%) | 2,796 (97.9%) |
| 12 to 14 Years | 1,438 (88.9%) | 2,112 (97.1%) |
| 15 Years | 753 (98.7%) | 458 (100.0%) |
| 16 and 17 Years | 852 (98.0%) | 769 (82.4%) |
| 18 to 24 Years | 4,983 (82.0%) | 4,288 (75.5%) |
| 25 to 34 Years | 5,898 (88.9%) | 5,968 (85.4%) |
| 35 to 44 Years | 6,887 (93.5%) | 6,134 (94.1%) |
| 45 to 54 Years | 6,579 (97.4%) | 6,542 (92.8%) |
| 55 to 64 Years | 4,249 (96.7%) | 4,379 (89.3%) |
| 65 to 74 Years | 2,551 (94.5%) | 3,169 (94.7%) |
| 75 Years and over | 1,216 (85.9%) | 2,197 (90.6%) |
| Total | 41,768 (92.4%) | 41,483 (89.7%) |
Income Below Poverty Among Married-Couple Families in Alafaya
The poverty statistics for married-couple families in Alafaya show that 3.1% or 540 of the total 17,333 families live below the poverty line. Families with 1 or 2 children have the highest poverty rate of 3.7%, comprising of 222 families. On the other hand, families with 5 or more children have the lowest poverty rate of 0.0%, which includes 0 families.
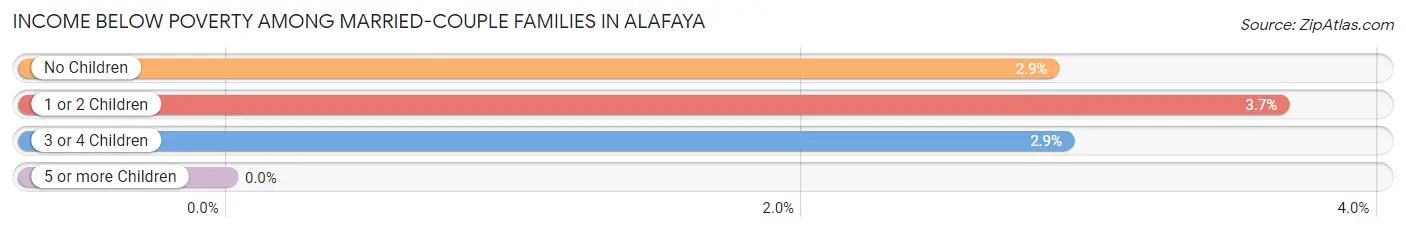
| Children | Above Poverty | Below Poverty |
| No Children | 9,207 (97.1%) | 271 (2.9%) |
| 1 or 2 Children | 5,844 (96.3%) | 222 (3.7%) |
| 3 or 4 Children | 1,567 (97.1%) | 47 (2.9%) |
| 5 or more Children | 175 (100.0%) | 0 (0.0%) |
| Total | 16,793 (96.9%) | 540 (3.1%) |
Income Below Poverty Among Single-Parent Households in Alafaya
According to the poverty data in Alafaya, 14.7% or 254 single-father households and 17.1% or 475 single-mother households are living below the poverty line. Among single-father households, those with no children have the highest poverty rate, with 207 households (18.3%) experiencing poverty. Likewise, among single-mother households, those with no children have the highest poverty rate, with 228 households (21.6%) falling below the poverty line.
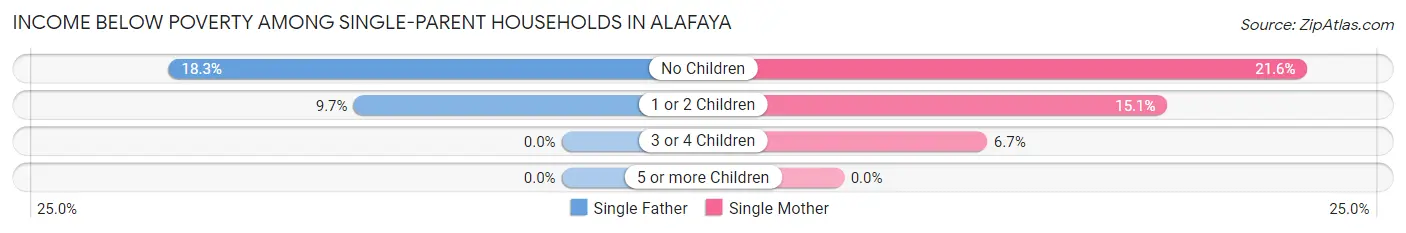
| Children | Single Father | Single Mother |
| No Children | 207 (18.3%) | 228 (21.6%) |
| 1 or 2 Children | 47 (9.7%) | 237 (15.1%) |
| 3 or 4 Children | 0 (0.0%) | 10 (6.7%) |
| 5 or more Children | 0 (0.0%) | 0 (0.0%) |
| Total | 254 (14.7%) | 475 (17.1%) |
Income Below Poverty Among Married-Couple vs Single-Parent Households in Alafaya
The poverty data for Alafaya shows that 540 of the married-couple family households (3.1%) and 729 of the single-parent households (16.2%) are living below the poverty level. Within the married-couple family households, those with 1 or 2 children have the highest poverty rate, with 222 households (3.7%) falling below the poverty line. Among the single-parent households, those with no children have the highest poverty rate, with 435 household (19.9%) living below poverty.
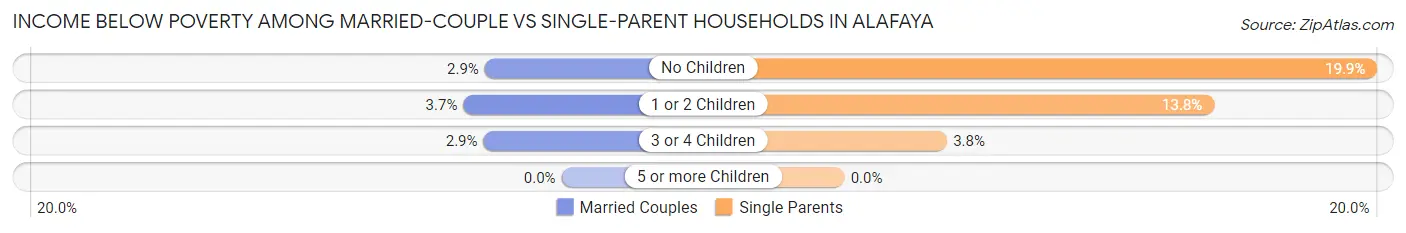
| Children | Married-Couple Families | Single-Parent Households |
| No Children | 271 (2.9%) | 435 (19.9%) |
| 1 or 2 Children | 222 (3.7%) | 284 (13.8%) |
| 3 or 4 Children | 47 (2.9%) | 10 (3.8%) |
| 5 or more Children | 0 (0.0%) | 0 (0.0%) |
| Total | 540 (3.1%) | 729 (16.2%) |
Race in Alafaya
The most populous races in Alafaya are White / Caucasian (56,658 | 61.9%), Hispanic or Latino (30,430 | 33.3%), and Two or more Races (13,757 | 15.0%).
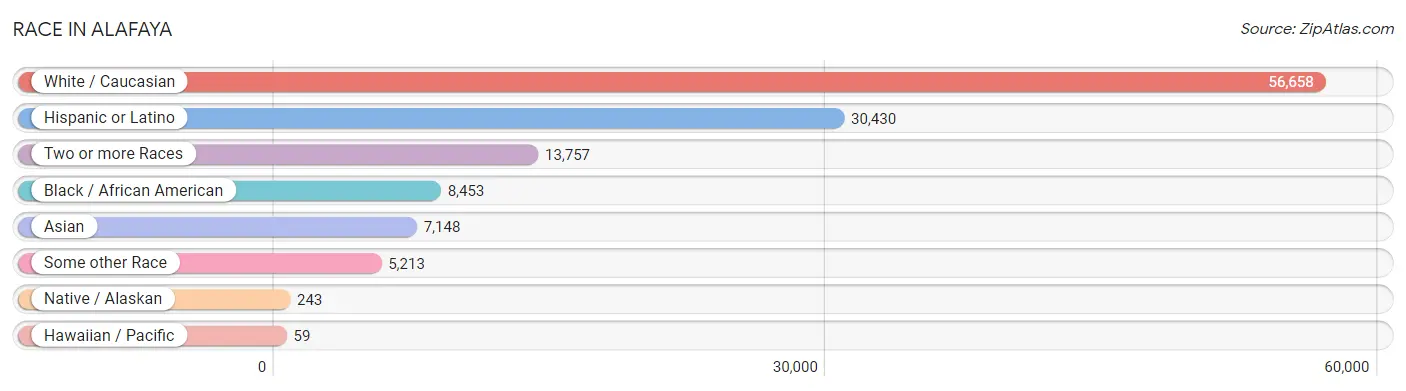
| Race | # Population | % Population |
| Asian | 7,148 | 7.8% |
| Black / African American | 8,453 | 9.2% |
| Hawaiian / Pacific | 59 | 0.1% |
| Hispanic or Latino | 30,430 | 33.3% |
| Native / Alaskan | 243 | 0.3% |
| White / Caucasian | 56,658 | 61.9% |
| Two or more Races | 13,757 | 15.0% |
| Some other Race | 5,213 | 5.7% |
| Total | 91,531 | 100.0% |
Ancestry in Alafaya
The most populous ancestries reported in Alafaya are Puerto Rican (15,292 | 16.7%), American (8,639 | 9.4%), South American (7,265 | 7.9%), Irish (6,110 | 6.7%), and German (6,058 | 6.6%), together accounting for 47.4% of all Alafaya residents.
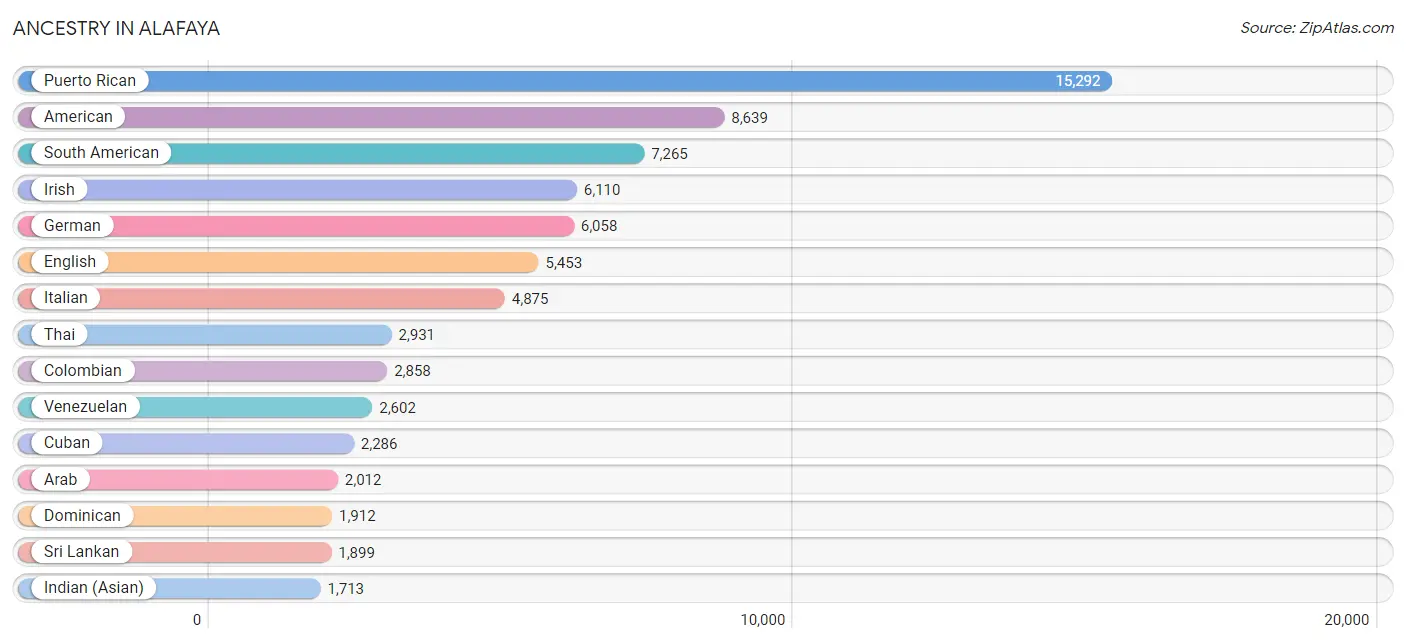
| Ancestry | # Population | % Population |
| African | 163 | 0.2% |
| Albanian | 124 | 0.1% |
| American | 8,639 | 9.4% |
| Arab | 2,012 | 2.2% |
| Argentinean | 398 | 0.4% |
| Austrian | 141 | 0.2% |
| Bahamian | 263 | 0.3% |
| Bhutanese | 8 | 0.0% |
| Bolivian | 115 | 0.1% |
| Brazilian | 363 | 0.4% |
| British | 376 | 0.4% |
| British West Indian | 33 | 0.0% |
| Burmese | 265 | 0.3% |
| Canadian | 224 | 0.2% |
| Cape Verdean | 12 | 0.0% |
| Celtic | 29 | 0.0% |
| Central American | 1,164 | 1.3% |
| Central American Indian | 217 | 0.2% |
| Cherokee | 145 | 0.2% |
| Chilean | 17 | 0.0% |
| Colombian | 2,858 | 3.1% |
| Comanche | 15 | 0.0% |
| Costa Rican | 137 | 0.2% |
| Croatian | 52 | 0.1% |
| Cuban | 2,286 | 2.5% |
| Czech | 192 | 0.2% |
| Czechoslovakian | 34 | 0.0% |
| Danish | 24 | 0.0% |
| Dominican | 1,912 | 2.1% |
| Dutch | 185 | 0.2% |
| Eastern European | 106 | 0.1% |
| Ecuadorian | 560 | 0.6% |
| Egyptian | 187 | 0.2% |
| English | 5,453 | 6.0% |
| European | 1,039 | 1.1% |
| Filipino | 139 | 0.2% |
| Finnish | 27 | 0.0% |
| French | 1,147 | 1.3% |
| French Canadian | 241 | 0.3% |
| German | 6,058 | 6.6% |
| Greek | 95 | 0.1% |
| Guatemalan | 82 | 0.1% |
| Guyanese | 211 | 0.2% |
| Haitian | 630 | 0.7% |
| Honduran | 351 | 0.4% |
| Hungarian | 36 | 0.0% |
| Indian (Asian) | 1,713 | 1.9% |
| Indonesian | 105 | 0.1% |
| Iranian | 138 | 0.2% |
| Iraqi | 26 | 0.0% |
| Irish | 6,110 | 6.7% |
| Iroquois | 10 | 0.0% |
| Israeli | 15 | 0.0% |
| Italian | 4,875 | 5.3% |
| Jamaican | 979 | 1.1% |
| Japanese | 540 | 0.6% |
| Jordanian | 14 | 0.0% |
| Korean | 1,249 | 1.4% |
| Lebanese | 150 | 0.2% |
| Lithuanian | 45 | 0.1% |
| Malaysian | 28 | 0.0% |
| Mexican | 1,152 | 1.3% |
| Mexican American Indian | 77 | 0.1% |
| Native Hawaiian | 18 | 0.0% |
| Nicaraguan | 55 | 0.1% |
| Nigerian | 288 | 0.3% |
| Norwegian | 468 | 0.5% |
| Osage | 31 | 0.0% |
| Pakistani | 377 | 0.4% |
| Palestinian | 1,170 | 1.3% |
| Panamanian | 161 | 0.2% |
| Paraguayan | 119 | 0.1% |
| Pennsylvania German | 16 | 0.0% |
| Peruvian | 559 | 0.6% |
| Polish | 1,656 | 1.8% |
| Portuguese | 267 | 0.3% |
| Puerto Rican | 15,292 | 16.7% |
| Romanian | 14 | 0.0% |
| Russian | 348 | 0.4% |
| Salvadoran | 378 | 0.4% |
| Scotch-Irish | 784 | 0.9% |
| Scottish | 1,519 | 1.7% |
| Serbian | 43 | 0.1% |
| Slovak | 230 | 0.3% |
| South African | 16 | 0.0% |
| South American | 7,265 | 7.9% |
| South American Indian | 188 | 0.2% |
| Spaniard | 137 | 0.2% |
| Spanish | 131 | 0.1% |
| Sri Lankan | 1,899 | 2.1% |
| Subsaharan African | 685 | 0.7% |
| Swedish | 438 | 0.5% |
| Swiss | 214 | 0.2% |
| Syrian | 44 | 0.1% |
| Thai | 2,931 | 3.2% |
| Trinidadian and Tobagonian | 249 | 0.3% |
| Turkish | 408 | 0.4% |
| U.S. Virgin Islander | 59 | 0.1% |
| Ukrainian | 197 | 0.2% |
| Uruguayan | 37 | 0.0% |
| Venezuelan | 2,602 | 2.8% |
| Vietnamese | 64 | 0.1% |
| Welsh | 558 | 0.6% |
| West Indian | 286 | 0.3% |
| Zimbabwean | 206 | 0.2% | View All 105 Rows |
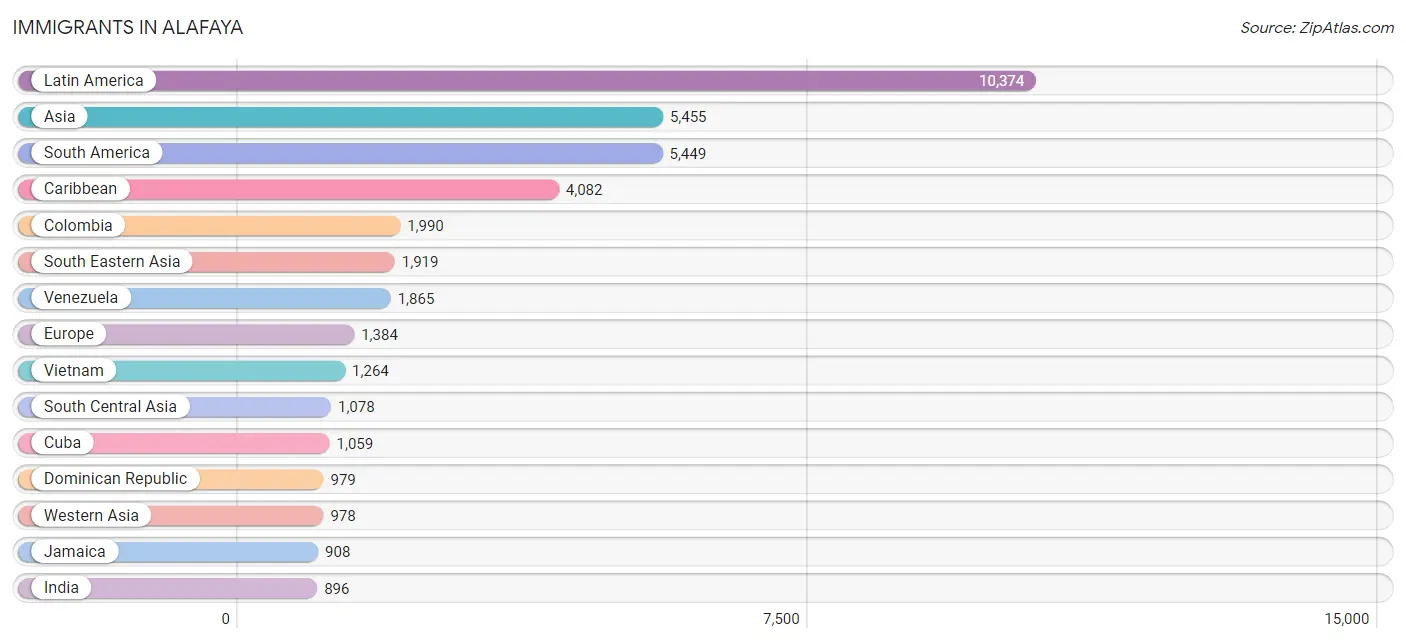
Immigrants in Alafaya
The most numerous immigrant groups reported in Alafaya came from Latin America (10,374 | 11.3%), Asia (5,455 | 6.0%), South America (5,449 | 5.9%), Caribbean (4,082 | 4.5%), and Colombia (1,990 | 2.2%), together accounting for 29.9% of all Alafaya residents.
| Immigration Origin | # Population | % Population |
| Africa | 245 | 0.3% |
| Albania | 112 | 0.1% |
| Argentina | 273 | 0.3% |
| Asia | 5,455 | 6.0% |
| Bahamas | 125 | 0.1% |
| Bangladesh | 66 | 0.1% |
| Belarus | 331 | 0.4% |
| Bolivia | 64 | 0.1% |
| Brazil | 260 | 0.3% |
| Cambodia | 51 | 0.1% |
| Canada | 560 | 0.6% |
| Caribbean | 4,082 | 4.5% |
| Central America | 843 | 0.9% |
| Chile | 17 | 0.0% |
| China | 796 | 0.9% |
| Colombia | 1,990 | 2.2% |
| Costa Rica | 74 | 0.1% |
| Cuba | 1,059 | 1.2% |
| Czechoslovakia | 83 | 0.1% |
| Dominican Republic | 979 | 1.1% |
| Eastern Asia | 854 | 0.9% |
| Eastern Europe | 769 | 0.8% |
| Ecuador | 262 | 0.3% |
| Egypt | 37 | 0.0% |
| El Salvador | 45 | 0.1% |
| England | 58 | 0.1% |
| Europe | 1,384 | 1.5% |
| France | 16 | 0.0% |
| Germany | 341 | 0.4% |
| Grenada | 53 | 0.1% |
| Guatemala | 63 | 0.1% |
| Guyana | 266 | 0.3% |
| Haiti | 502 | 0.5% |
| Honduras | 331 | 0.4% |
| Hong Kong | 86 | 0.1% |
| India | 896 | 1.0% |
| Iran | 106 | 0.1% |
| Iraq | 108 | 0.1% |
| Israel | 227 | 0.3% |
| Italy | 53 | 0.1% |
| Jamaica | 908 | 1.0% |
| Jordan | 7 | 0.0% |
| Korea | 58 | 0.1% |
| Kuwait | 13 | 0.0% |
| Laos | 40 | 0.0% |
| Latin America | 10,374 | 11.3% |
| Liberia | 15 | 0.0% |
| Lithuania | 10 | 0.0% |
| Malaysia | 38 | 0.0% |
| Mexico | 237 | 0.3% |
| Netherlands | 19 | 0.0% |
| Nicaragua | 40 | 0.0% |
| Nigeria | 156 | 0.2% |
| Northern Africa | 37 | 0.0% |
| Northern Europe | 186 | 0.2% |
| Pakistan | 10 | 0.0% |
| Panama | 47 | 0.1% |
| Peru | 296 | 0.3% |
| Philippines | 367 | 0.4% |
| Poland | 66 | 0.1% |
| Romania | 126 | 0.1% |
| Saudi Arabia | 209 | 0.2% |
| South Africa | 37 | 0.0% |
| South America | 5,449 | 5.9% |
| South Central Asia | 1,078 | 1.2% |
| South Eastern Asia | 1,919 | 2.1% |
| Southern Europe | 53 | 0.1% |
| St. Vincent and the Grenadines | 16 | 0.0% |
| Taiwan | 240 | 0.3% |
| Thailand | 93 | 0.1% |
| Trinidad and Tobago | 346 | 0.4% |
| Turkey | 414 | 0.4% |
| Ukraine | 14 | 0.0% |
| Uruguay | 37 | 0.0% |
| Venezuela | 1,865 | 2.0% |
| Vietnam | 1,264 | 1.4% |
| West Indies | 47 | 0.1% |
| Western Africa | 171 | 0.2% |
| Western Asia | 978 | 1.1% |
| Western Europe | 376 | 0.4% | View All 80 Rows |
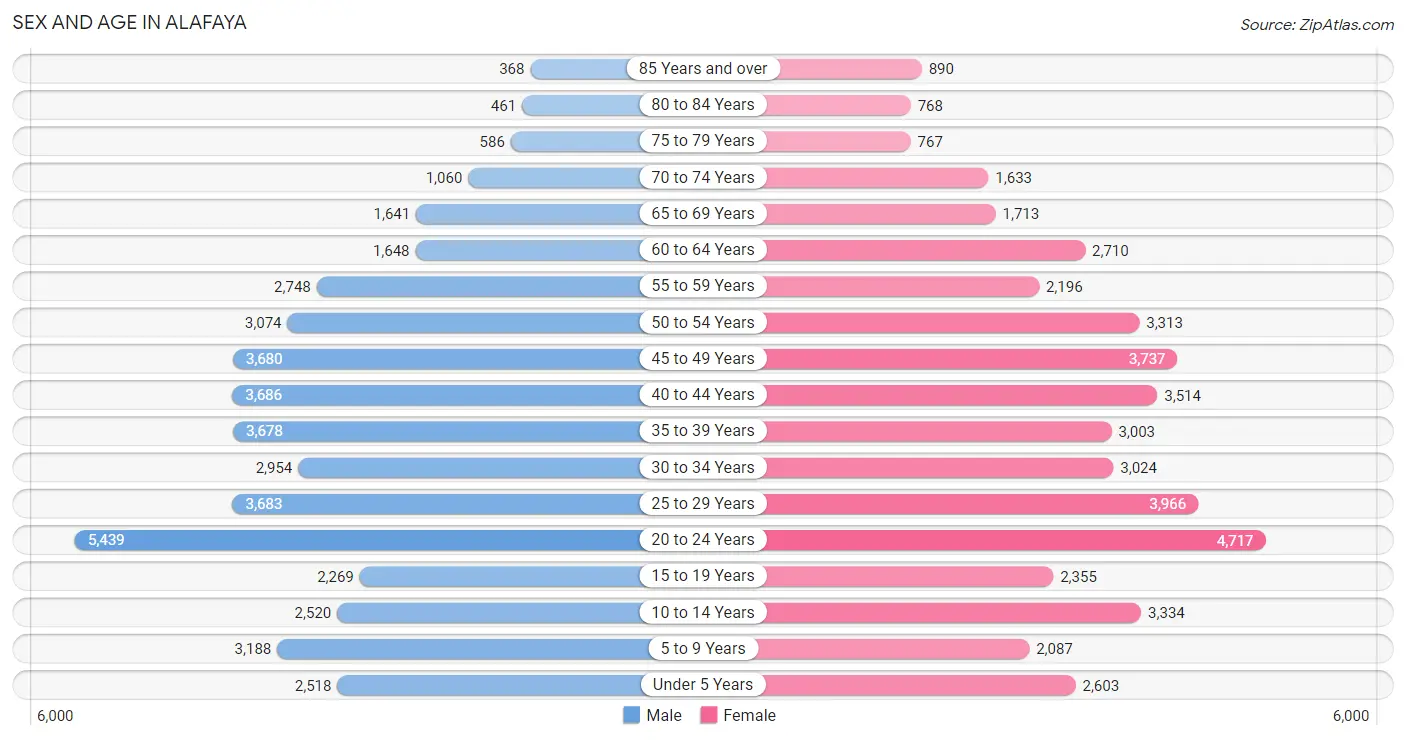
Sex and Age in Alafaya
Sex and Age in Alafaya
The most populous age groups in Alafaya are 20 to 24 Years (5,439 | 12.0%) for men and 20 to 24 Years (4,717 | 10.2%) for women.
| Age Bracket | Male | Female |
| Under 5 Years | 2,518 (5.6%) | 2,603 (5.6%) |
| 5 to 9 Years | 3,188 (7.0%) | 2,087 (4.5%) |
| 10 to 14 Years | 2,520 (5.6%) | 3,334 (7.2%) |
| 15 to 19 Years | 2,269 (5.0%) | 2,355 (5.1%) |
| 20 to 24 Years | 5,439 (12.0%) | 4,717 (10.2%) |
| 25 to 29 Years | 3,683 (8.2%) | 3,966 (8.6%) |
| 30 to 34 Years | 2,954 (6.5%) | 3,024 (6.5%) |
| 35 to 39 Years | 3,678 (8.1%) | 3,003 (6.5%) |
| 40 to 44 Years | 3,686 (8.2%) | 3,514 (7.6%) |
| 45 to 49 Years | 3,680 (8.1%) | 3,737 (8.1%) |
| 50 to 54 Years | 3,074 (6.8%) | 3,313 (7.1%) |
| 55 to 59 Years | 2,748 (6.1%) | 2,196 (4.7%) |
| 60 to 64 Years | 1,648 (3.6%) | 2,710 (5.9%) |
| 65 to 69 Years | 1,641 (3.6%) | 1,713 (3.7%) |
| 70 to 74 Years | 1,060 (2.4%) | 1,633 (3.5%) |
| 75 to 79 Years | 586 (1.3%) | 767 (1.7%) |
| 80 to 84 Years | 461 (1.0%) | 768 (1.7%) |
| 85 Years and over | 368 (0.8%) | 890 (1.9%) |
| Total | 45,201 (100.0%) | 46,330 (100.0%) |
Families and Households in Alafaya
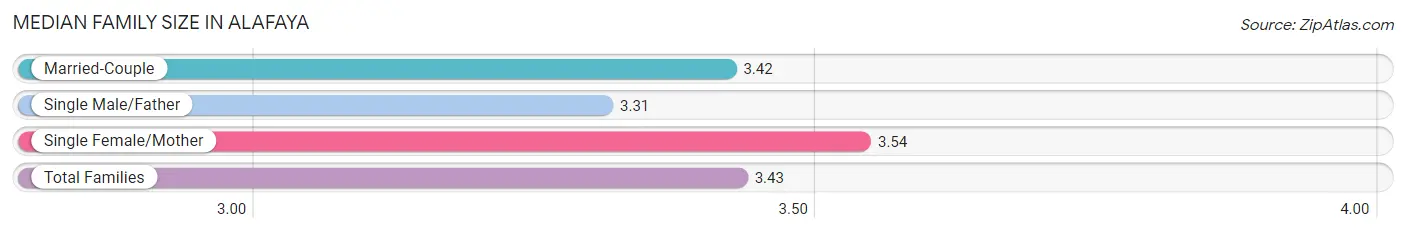
Median Family Size in Alafaya
The median family size in Alafaya is 3.43 persons per family, with single female/mother families (2,779 | 12.7%) accounting for the largest median family size of 3.54 persons per family. On the other hand, single male/father families (1,729 | 7.9%) represent the smallest median family size with 3.31 persons per family.
| Family Type | # Families | Family Size |
| Married-Couple | 17,333 (79.4%) | 3.42 |
| Single Male/Father | 1,729 (7.9%) | 3.31 |
| Single Female/Mother | 2,779 (12.7%) | 3.54 |
| Total Families | 21,841 (100.0%) | 3.43 |
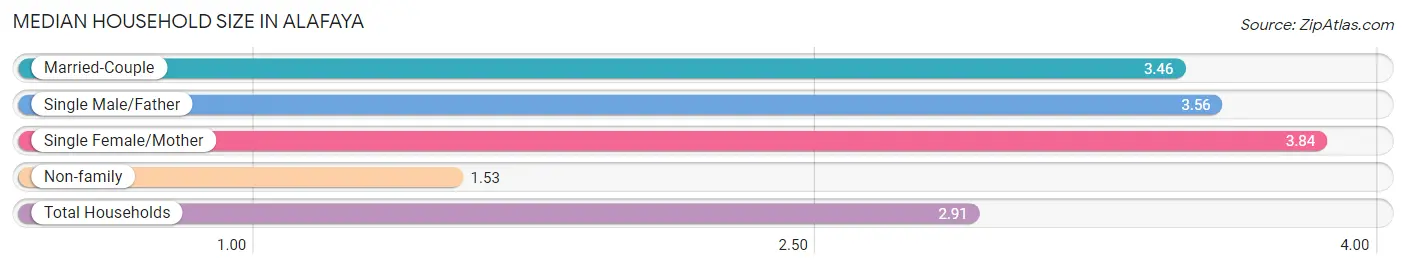
Median Household Size in Alafaya
The median household size in Alafaya is 2.91 persons per household, with single female/mother households (2,779 | 8.8%) accounting for the largest median household size of 3.84 persons per household. non-family households (9,665 | 30.7%) represent the smallest median household size with 1.53 persons per household.
| Household Type | # Households | Household Size |
| Married-Couple | 17,333 (55.0%) | 3.46 |
| Single Male/Father | 1,729 (5.5%) | 3.56 |
| Single Female/Mother | 2,779 (8.8%) | 3.84 |
| Non-family | 9,665 (30.7%) | 1.53 |
| Total Households | 31,506 (100.0%) | 2.91 |
Household Size by Marriage Status in Alafaya
Out of a total of 31,506 households in Alafaya, 21,841 (69.3%) are family households, while 9,665 (30.7%) are nonfamily households. The most numerous type of family households are 2-person households, comprising 7,716, and the most common type of nonfamily households are 1-person households, comprising 7,107.
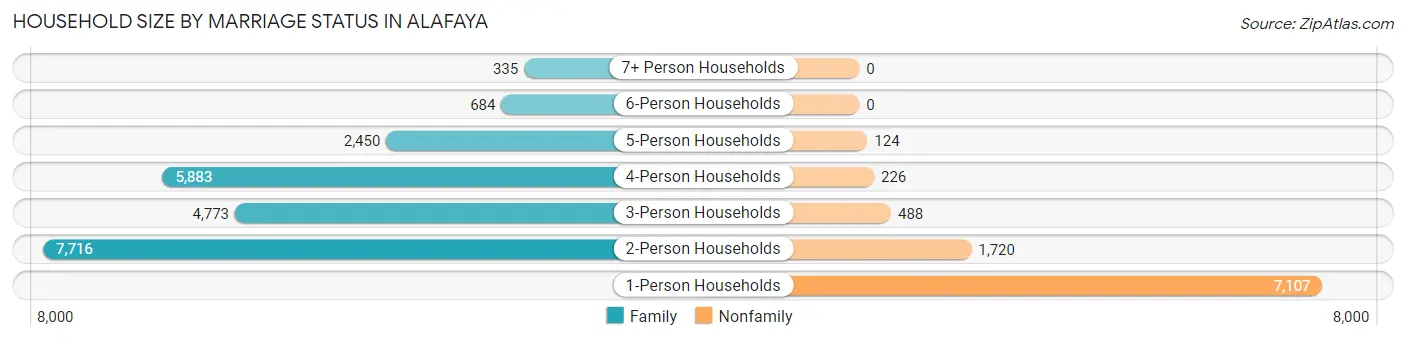
| Household Size | Family Households | Nonfamily Households |
| 1-Person Households | - | 7,107 (22.6%) |
| 2-Person Households | 7,716 (24.5%) | 1,720 (5.5%) |
| 3-Person Households | 4,773 (15.1%) | 488 (1.5%) |
| 4-Person Households | 5,883 (18.7%) | 226 (0.7%) |
| 5-Person Households | 2,450 (7.8%) | 124 (0.4%) |
| 6-Person Households | 684 (2.2%) | 0 (0.0%) |
| 7+ Person Households | 335 (1.1%) | 0 (0.0%) |
| Total | 21,841 (69.3%) | 9,665 (30.7%) |
Female Fertility in Alafaya
Fertility by Age in Alafaya
Average fertility rate in Alafaya is 28.0 births per 1,000 women. Women in the age bracket of 20 to 34 years have the highest fertility rate with 48.0 births per 1,000 women. Women in the age bracket of 20 to 34 years acount for 79.1% of all women with births.
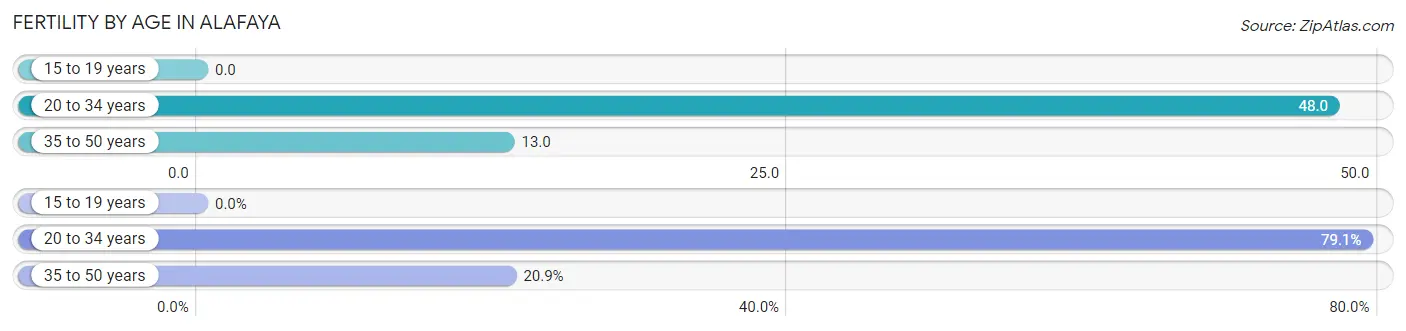
| Age Bracket | Women with Births | Births / 1,000 Women |
| 15 to 19 years | 0 (0.0%) | 0.0 |
| 20 to 34 years | 563 (79.1%) | 48.0 |
| 35 to 50 years | 149 (20.9%) | 13.0 |
| Total | 712 (100.0%) | 28.0 |
Fertility by Age by Marriage Status in Alafaya
82.4% of women with births (712) in Alafaya are married. The highest percentage of unmarried women with births falls into 35 to 50 years age bracket with 21.5% of them unmarried at the time of birth, while the lowest percentage of unmarried women with births belong to 20 to 34 years age bracket with 16.5% of them unmarried.
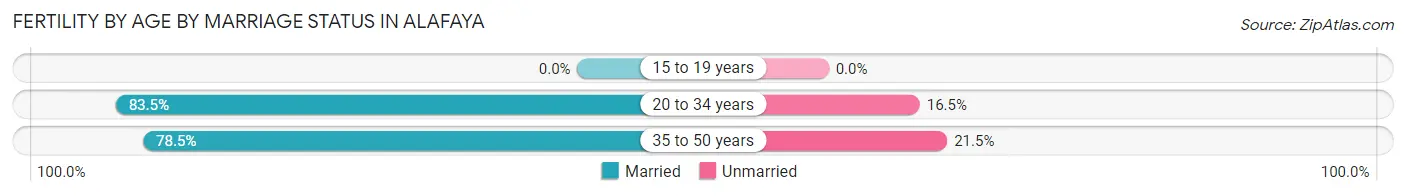
| Age Bracket | Married | Unmarried |
| 15 to 19 years | 0 (0.0%) | 0 (0.0%) |
| 20 to 34 years | 470 (83.5%) | 93 (16.5%) |
| 35 to 50 years | 117 (78.5%) | 32 (21.5%) |
| Total | 587 (82.4%) | 125 (17.6%) |
Fertility by Education in Alafaya
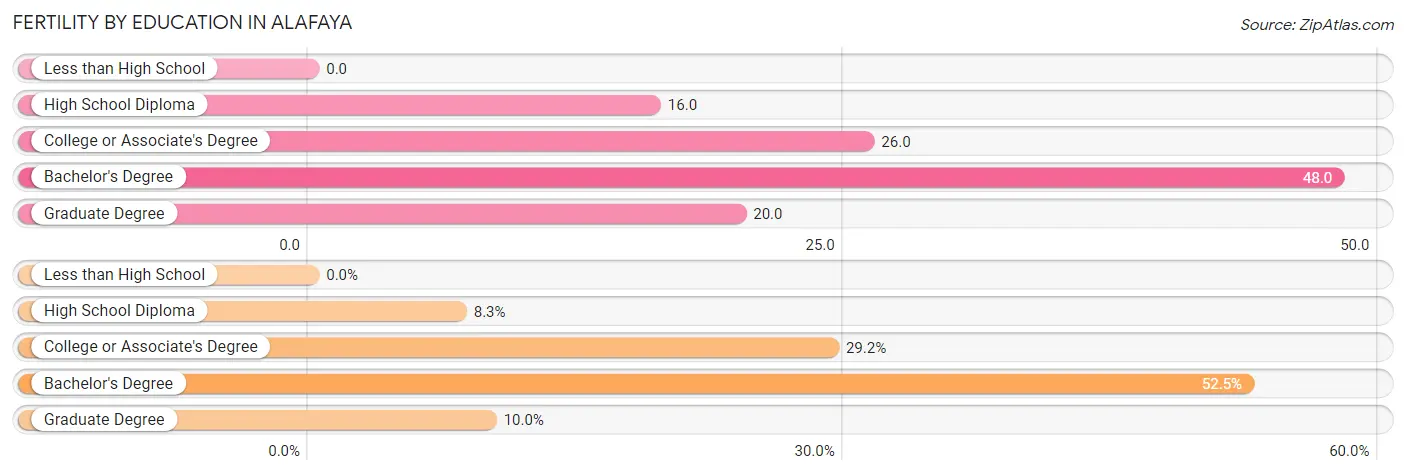
| Educational Attainment | Women with Births | Births / 1,000 Women |
| Less than High School | 0 (0.0%) | 0.0 |
| High School Diploma | 59 (8.3%) | 16.0 |
| College or Associate's Degree | 208 (29.2%) | 26.0 |
| Bachelor's Degree | 374 (52.5%) | 48.0 |
| Graduate Degree | 71 (10.0%) | 20.0 |
| Total | 712 (100.0%) | 28.0 |
Fertility by Education by Marriage Status in Alafaya
17.6% of women with births in Alafaya are unmarried. Women with the educational attainment of bachelor's degree are most likely to be married with 100.0% of them married at childbirth, while women with the educational attainment of high school diploma are least likely to be married with 69.5% of them unmarried at childbirth.
| Educational Attainment | Married | Unmarried |
| Less than High School | 0 (0.0%) | 0 (0.0%) |
| High School Diploma | 18 (30.5%) | 41 (69.5%) |
| College or Associate's Degree | 124 (59.6%) | 84 (40.4%) |
| Bachelor's Degree | 374 (100.0%) | 0 (0.0%) |
| Graduate Degree | 71 (100.0%) | 0 (0.0%) |
| Total | 587 (82.4%) | 125 (17.6%) |
Employment Characteristics in Alafaya
Employment by Class of Employer in Alafaya
Among the 49,585 employed individuals in Alafaya, private company employees (35,086 | 70.8%), not-for-profit organizations (4,163 | 8.4%), and local government employees (2,648 | 5.3%) make up the most common classes of employment.
| Employer Class | # Employees | % Employees |
| Private Company Employees | 35,086 | 70.8% |
| Self-Employed (Incorporated) | 1,974 | 4.0% |
| Self-Employed (Not Incorporated) | 2,289 | 4.6% |
| Not-for-profit Organizations | 4,163 | 8.4% |
| Local Government Employees | 2,648 | 5.3% |
| State Government Employees | 1,455 | 2.9% |
| Federal Government Employees | 1,871 | 3.8% |
| Unpaid Family Workers | 99 | 0.2% |
| Total | 49,585 | 100.0% |
Employment Status by Age in Alafaya
According to the labor force statistics for Alafaya, out of the total population over 16 years of age (74,060), 70.9% or 52,509 individuals are in the labor force, with 4.4% or 2,310 of them unemployed. The age group with the highest labor force participation rate is 35 to 44 years, with 88.9% or 12,340 individuals in the labor force. Within the labor force, the 16 to 19 years age range has the highest percentage of unemployed individuals, with 30.5% or 425 of them being unemployed.
| Age Bracket | In Labor Force | Unemployed |
| 16 to 19 Years | 1,392 (40.9%) | 425 (30.5%) |
| 20 to 24 Years | 7,455 (73.4%) | 522 (7.0%) |
| 25 to 29 Years | 6,746 (88.2%) | 290 (4.3%) |
| 30 to 34 Years | 5,051 (84.5%) | 146 (2.9%) |
| 35 to 44 Years | 12,340 (88.9%) | 321 (2.6%) |
| 45 to 54 Years | 11,140 (80.7%) | 379 (3.4%) |
| 55 to 59 Years | 3,688 (74.6%) | 118 (3.2%) |
| 60 to 64 Years | 2,593 (59.5%) | 44 (1.7%) |
| 65 to 74 Years | 2,050 (33.9%) | 39 (1.9%) |
| 75 Years and over | 23 (0.6%) | 0 (0.0%) |
| Total | 52,509 (70.9%) | 2,310 (4.4%) |
Employment Status by Educational Attainment in Alafaya
According to labor force statistics for Alafaya, 82.1% of individuals (41,554) out of the total population between 25 and 64 years of age (50,614) are in the labor force, with 3.1% or 1,288 of them being unemployed. The group with the highest labor force participation rate are those with the educational attainment of bachelor's degree or higher, with 87.9% or 22,308 individuals in the labor force. Within the labor force, individuals with bachelor's degree or higher education have the highest percentage of unemployment, with 3.5% or 781 of them being unemployed.
| Educational Attainment | In Labor Force | Unemployed |
| Less than High School | 1,449 (62.1%) | 0 (0.0%) |
| High School Diploma | 6,218 (73.1%) | 272 (3.2%) |
| College / Associate Degree | 11,589 (80.5%) | 403 (2.8%) |
| Bachelor's Degree or higher | 22,308 (87.9%) | 888 (3.5%) |
| Total | 41,554 (82.1%) | 1,569 (3.1%) |
Employment Occupations by Sex in Alafaya
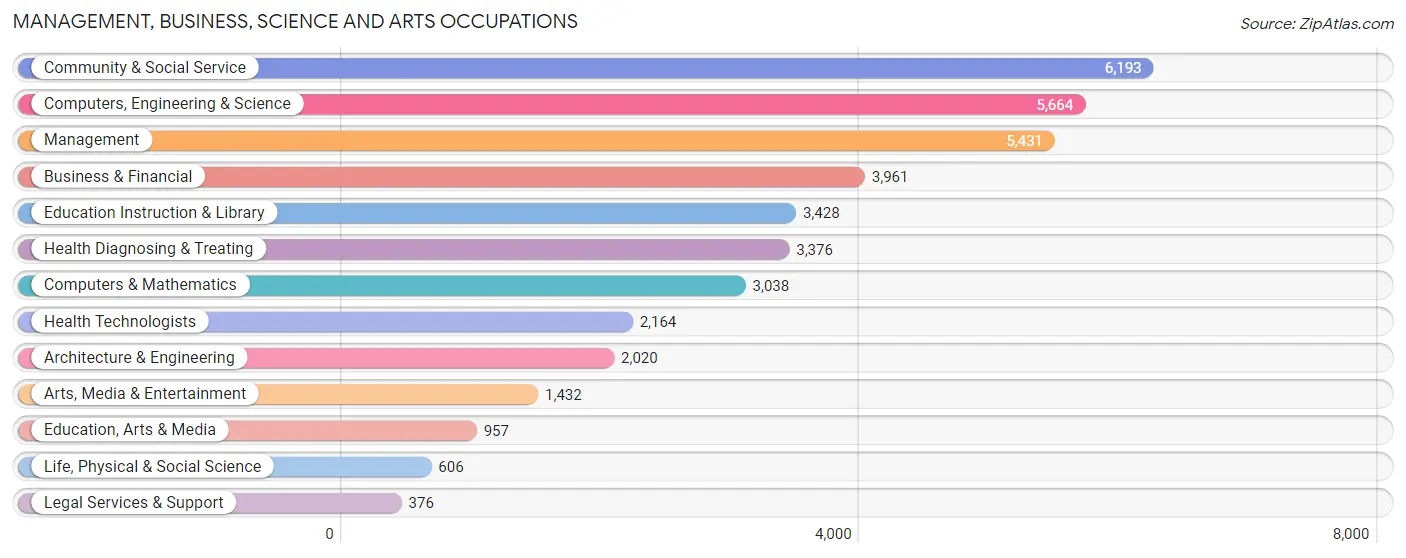
Management, Business, Science and Arts Occupations
The most common Management, Business, Science and Arts occupations in Alafaya are Community & Social Service (6,193 | 12.4%), Computers, Engineering & Science (5,664 | 11.4%), Management (5,431 | 10.9%), Business & Financial (3,961 | 7.9%), and Education Instruction & Library (3,428 | 6.9%).
Management, Business, Science and Arts Occupations by Sex
Within the Management, Business, Science and Arts occupations in Alafaya, the most male-oriented occupations are Computers & Mathematics (86.7%), Computers, Engineering & Science (73.7%), and Architecture & Engineering (71.1%), while the most female-oriented occupations are Life, Physical & Social Science (82.8%), Health Technologists (81.1%), and Health Diagnosing & Treating (73.1%).
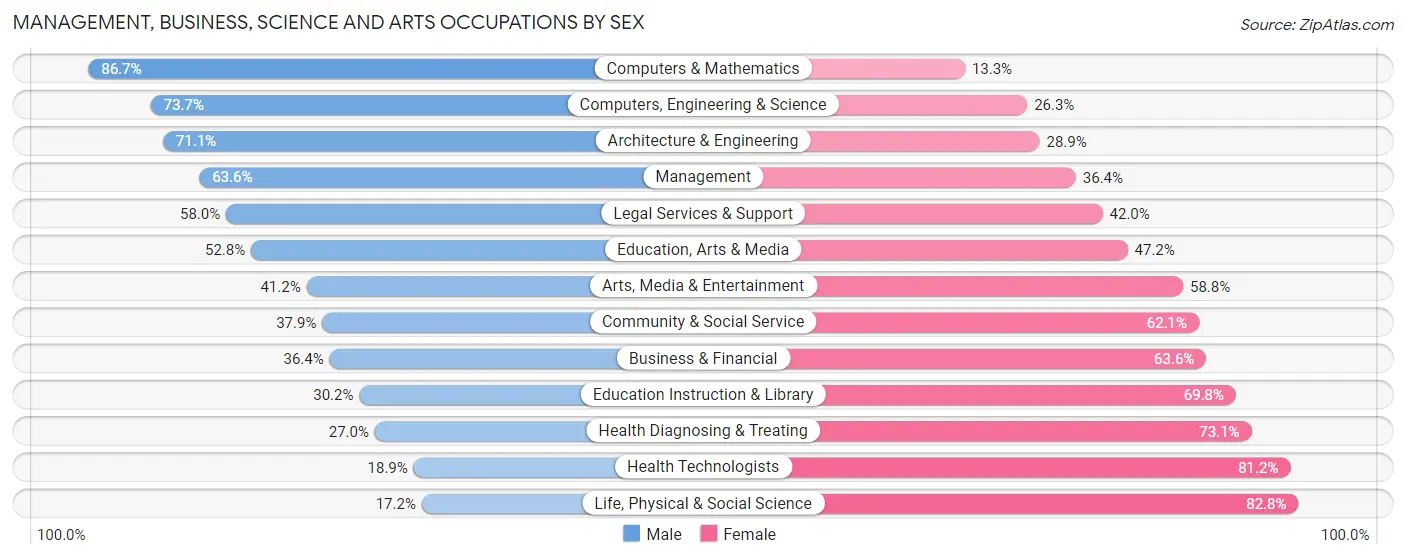
| Occupation | Male | Female |
| Management | 3,452 (63.6%) | 1,979 (36.4%) |
| Business & Financial | 1,441 (36.4%) | 2,520 (63.6%) |
| Computers, Engineering & Science | 4,175 (73.7%) | 1,489 (26.3%) |
| Computers & Mathematics | 2,634 (86.7%) | 404 (13.3%) |
| Architecture & Engineering | 1,437 (71.1%) | 583 (28.9%) |
| Life, Physical & Social Science | 104 (17.2%) | 502 (82.8%) |
| Community & Social Service | 2,348 (37.9%) | 3,845 (62.1%) |
| Education, Arts & Media | 505 (52.8%) | 452 (47.2%) |
| Legal Services & Support | 218 (58.0%) | 158 (42.0%) |
| Education Instruction & Library | 1,035 (30.2%) | 2,393 (69.8%) |
| Arts, Media & Entertainment | 590 (41.2%) | 842 (58.8%) |
| Health Diagnosing & Treating | 910 (27.0%) | 2,466 (73.1%) |
| Health Technologists | 408 (18.9%) | 1,756 (81.1%) |
| Total (Category) | 12,326 (50.0%) | 12,299 (49.9%) |
| Total (Overall) | 26,677 (53.5%) | 23,202 (46.5%) |
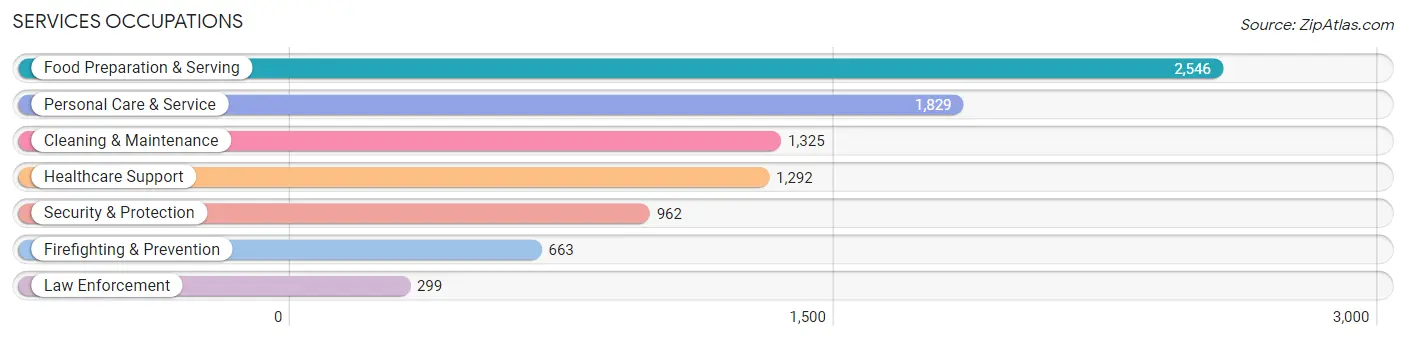
Services Occupations
The most common Services occupations in Alafaya are Food Preparation & Serving (2,546 | 5.1%), Personal Care & Service (1,829 | 3.7%), Cleaning & Maintenance (1,325 | 2.7%), Healthcare Support (1,292 | 2.6%), and Security & Protection (962 | 1.9%).
Services Occupations by Sex
Within the Services occupations in Alafaya, the most male-oriented occupations are Law Enforcement (100.0%), Security & Protection (78.5%), and Firefighting & Prevention (68.8%), while the most female-oriented occupations are Healthcare Support (82.7%), Personal Care & Service (72.0%), and Cleaning & Maintenance (57.1%).
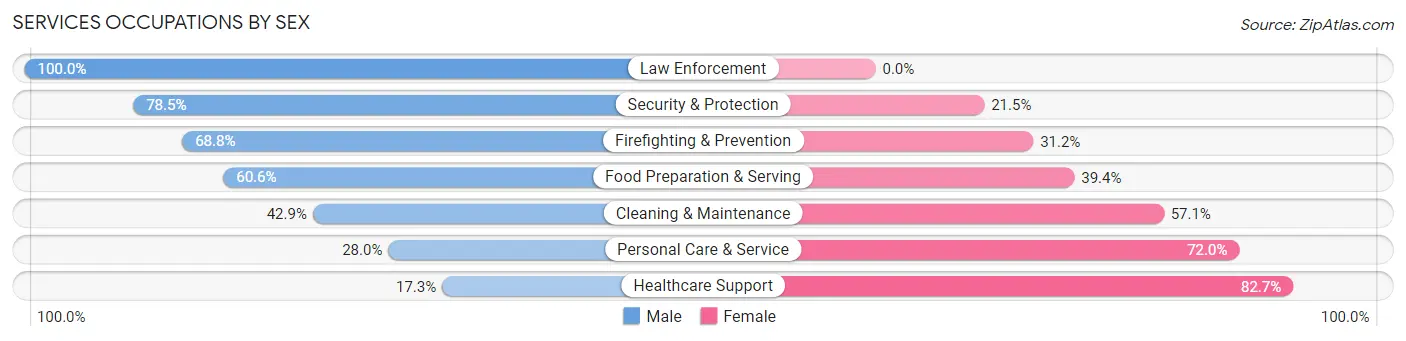
| Occupation | Male | Female |
| Healthcare Support | 224 (17.3%) | 1,068 (82.7%) |
| Security & Protection | 755 (78.5%) | 207 (21.5%) |
| Firefighting & Prevention | 456 (68.8%) | 207 (31.2%) |
| Law Enforcement | 299 (100.0%) | 0 (0.0%) |
| Food Preparation & Serving | 1,544 (60.6%) | 1,002 (39.4%) |
| Cleaning & Maintenance | 569 (42.9%) | 756 (57.1%) |
| Personal Care & Service | 512 (28.0%) | 1,317 (72.0%) |
| Total (Category) | 3,604 (45.3%) | 4,350 (54.7%) |
| Total (Overall) | 26,677 (53.5%) | 23,202 (46.5%) |
Sales and Office Occupations
The most common Sales and Office occupations in Alafaya are Office & Administration (6,049 | 12.1%), and Sales & Related (4,572 | 9.2%).

Sales and Office Occupations by Sex
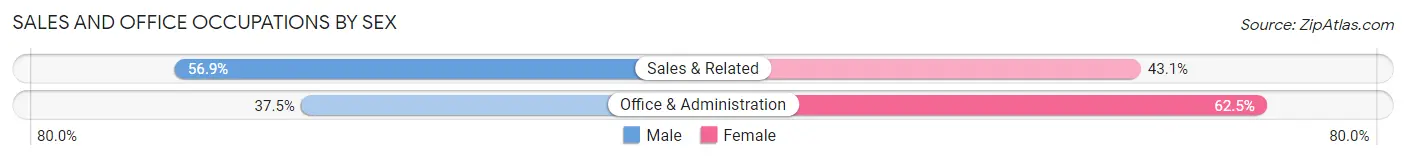
| Occupation | Male | Female |
| Sales & Related | 2,600 (56.9%) | 1,972 (43.1%) |
| Office & Administration | 2,270 (37.5%) | 3,779 (62.5%) |
| Total (Category) | 4,870 (45.9%) | 5,751 (54.1%) |
| Total (Overall) | 26,677 (53.5%) | 23,202 (46.5%) |
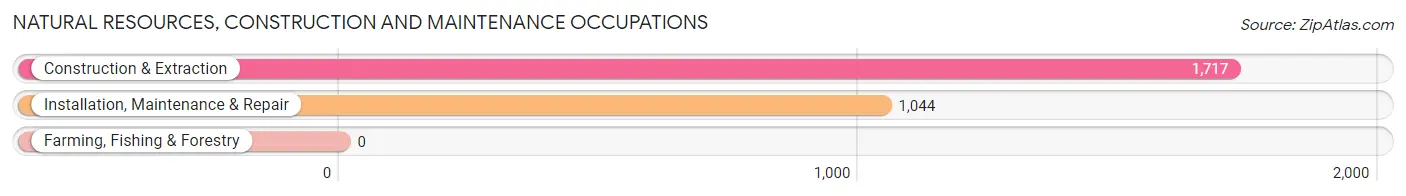
Natural Resources, Construction and Maintenance Occupations
The most common Natural Resources, Construction and Maintenance occupations in Alafaya are Construction & Extraction (1,717 | 3.4%), and Installation, Maintenance & Repair (1,044 | 2.1%).
Natural Resources, Construction and Maintenance Occupations by Sex
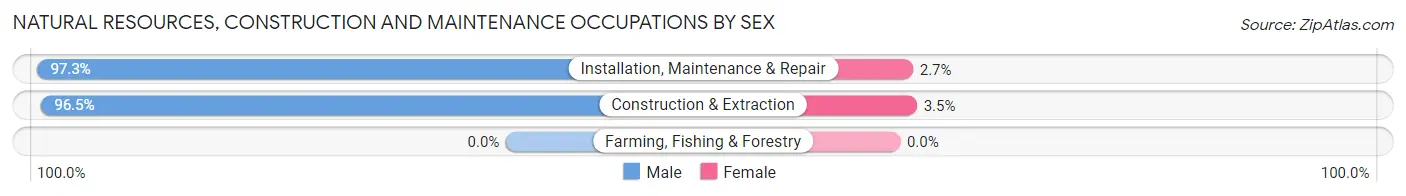
| Occupation | Male | Female |
| Farming, Fishing & Forestry | 0 (0.0%) | 0 (0.0%) |
| Construction & Extraction | 1,657 (96.5%) | 60 (3.5%) |
| Installation, Maintenance & Repair | 1,016 (97.3%) | 28 (2.7%) |
| Total (Category) | 2,673 (96.8%) | 88 (3.2%) |
| Total (Overall) | 26,677 (53.5%) | 23,202 (46.5%) |
Production, Transportation and Moving Occupations
The most common Production, Transportation and Moving occupations in Alafaya are Transportation (1,840 | 3.7%), Material Moving (1,074 | 2.1%), and Production (1,004 | 2.0%).
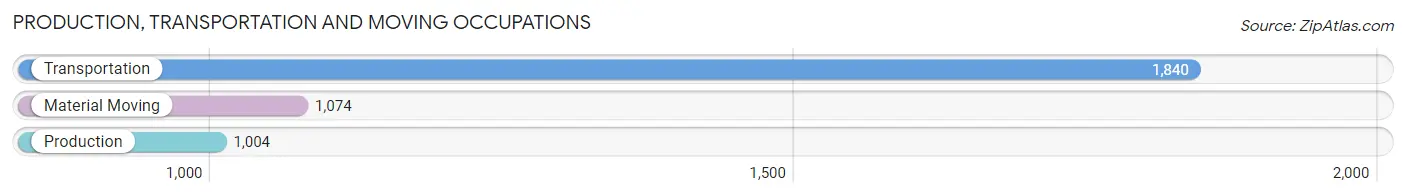
Production, Transportation and Moving Occupations by Sex
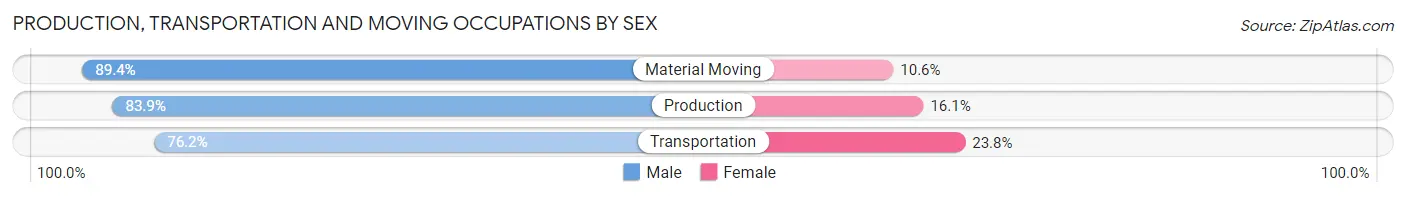
| Occupation | Male | Female |
| Production | 842 (83.9%) | 162 (16.1%) |
| Transportation | 1,402 (76.2%) | 438 (23.8%) |
| Material Moving | 960 (89.4%) | 114 (10.6%) |
| Total (Category) | 3,204 (81.8%) | 714 (18.2%) |
| Total (Overall) | 26,677 (53.5%) | 23,202 (46.5%) |
Employment Industries by Sex in Alafaya
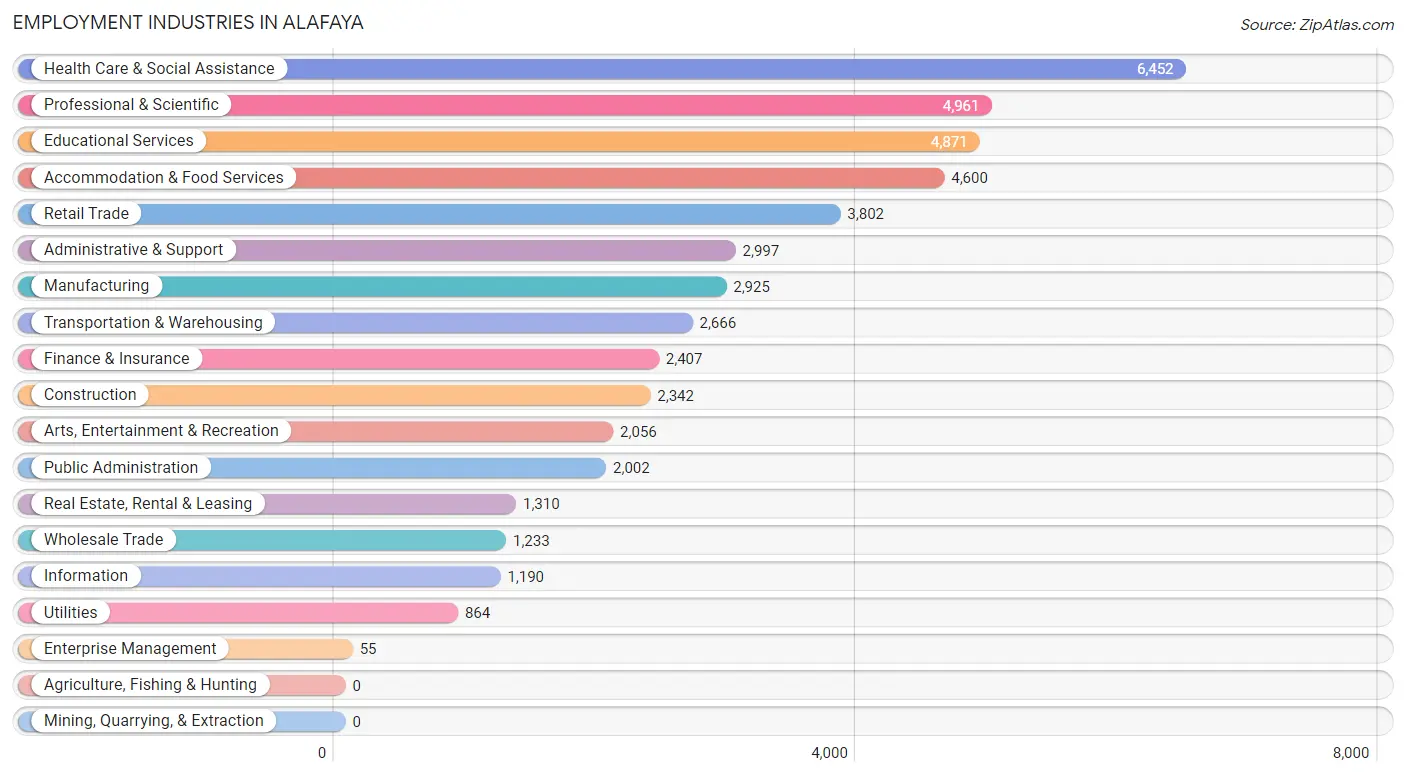
Employment Industries in Alafaya
The major employment industries in Alafaya include Health Care & Social Assistance (6,452 | 12.9%), Professional & Scientific (4,961 | 10.0%), Educational Services (4,871 | 9.8%), Accommodation & Food Services (4,600 | 9.2%), and Retail Trade (3,802 | 7.6%).
Employment Industries by Sex in Alafaya
The Alafaya industries that see more men than women are Construction (89.1%), Utilities (78.6%), and Wholesale Trade (75.6%), whereas the industries that tend to have a higher number of women are Health Care & Social Assistance (76.5%), Enterprise Management (72.7%), and Educational Services (62.3%).
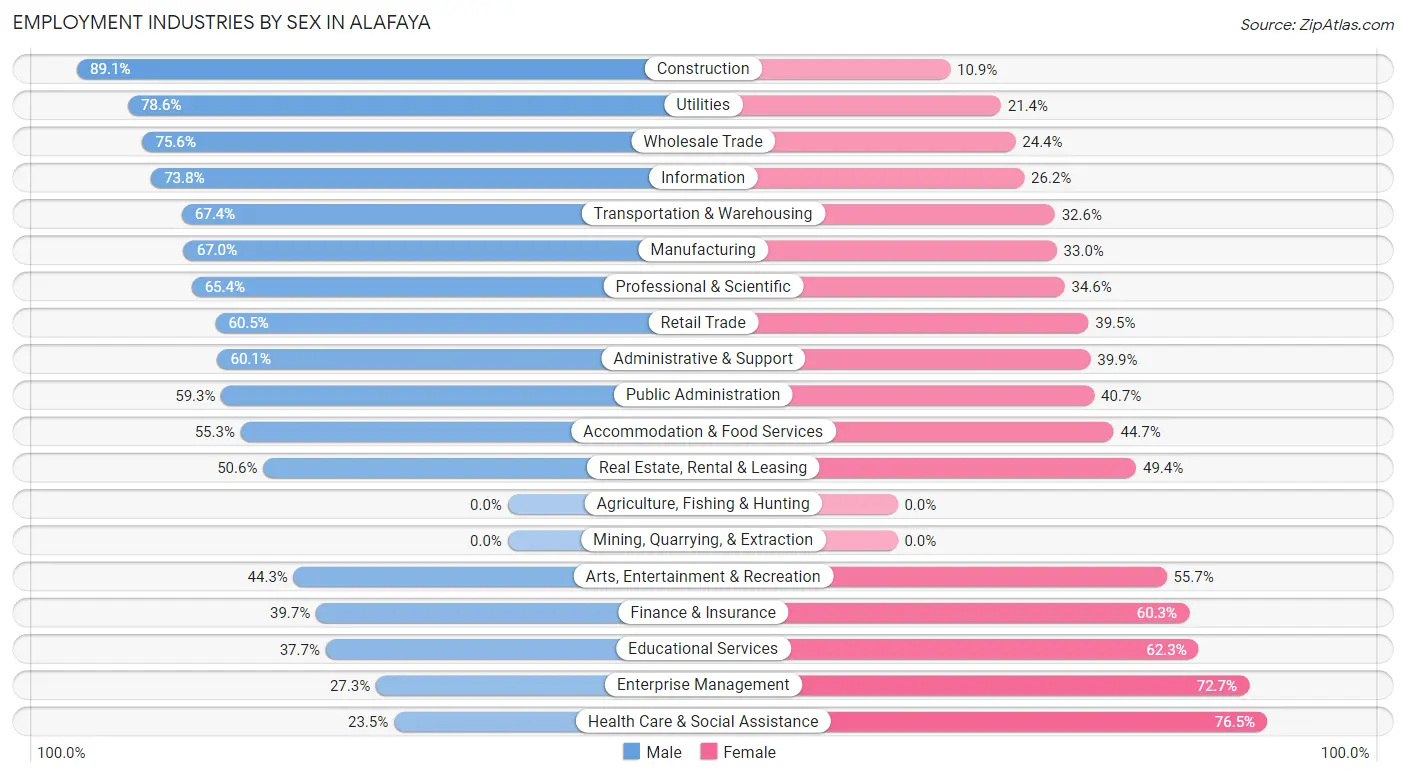
| Industry | Male | Female |
| Agriculture, Fishing & Hunting | 0 (0.0%) | 0 (0.0%) |
| Mining, Quarrying, & Extraction | 0 (0.0%) | 0 (0.0%) |
| Construction | 2,087 (89.1%) | 255 (10.9%) |
| Manufacturing | 1,961 (67.0%) | 964 (33.0%) |
| Wholesale Trade | 932 (75.6%) | 301 (24.4%) |
| Retail Trade | 2,300 (60.5%) | 1,502 (39.5%) |
| Transportation & Warehousing | 1,798 (67.4%) | 868 (32.6%) |
| Utilities | 679 (78.6%) | 185 (21.4%) |
| Information | 878 (73.8%) | 312 (26.2%) |
| Finance & Insurance | 955 (39.7%) | 1,452 (60.3%) |
| Real Estate, Rental & Leasing | 663 (50.6%) | 647 (49.4%) |
| Professional & Scientific | 3,245 (65.4%) | 1,716 (34.6%) |
| Enterprise Management | 15 (27.3%) | 40 (72.7%) |
| Administrative & Support | 1,800 (60.1%) | 1,197 (39.9%) |
| Educational Services | 1,835 (37.7%) | 3,036 (62.3%) |
| Health Care & Social Assistance | 1,518 (23.5%) | 4,934 (76.5%) |
| Arts, Entertainment & Recreation | 911 (44.3%) | 1,145 (55.7%) |
| Accommodation & Food Services | 2,542 (55.3%) | 2,058 (44.7%) |
| Public Administration | 1,187 (59.3%) | 815 (40.7%) |
| Total | 26,677 (53.5%) | 23,202 (46.5%) |
Education in Alafaya
School Enrollment in Alafaya
The most common levels of schooling among the 26,847 students in Alafaya are college / undergraduate (8,498 | 31.7%), middle school (4,594 | 17.1%), and elementary school (4,285 | 16.0%).
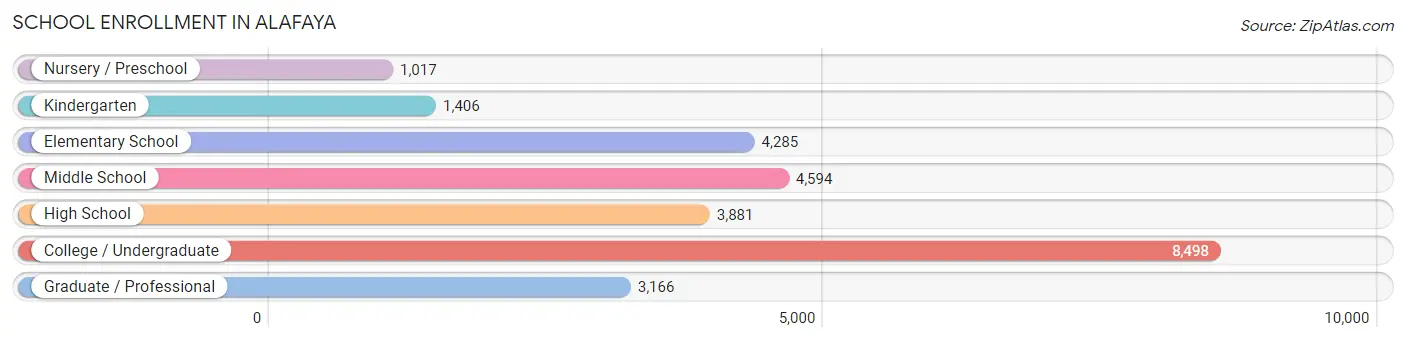
| School Level | # Students | % Students |
| Nursery / Preschool | 1,017 | 3.8% |
| Kindergarten | 1,406 | 5.2% |
| Elementary School | 4,285 | 16.0% |
| Middle School | 4,594 | 17.1% |
| High School | 3,881 | 14.5% |
| College / Undergraduate | 8,498 | 31.7% |
| Graduate / Professional | 3,166 | 11.8% |
| Total | 26,847 | 100.0% |
School Enrollment by Age by Funding Source in Alafaya
Out of a total of 26,847 students who are enrolled in schools in Alafaya, 3,034 (11.3%) attend a private institution, while the remaining 23,813 (88.7%) are enrolled in public schools. The age group of 3 to 4 year olds has the highest likelihood of being enrolled in private schools, with 402 (44.9% in the age bracket) enrolled. Conversely, the age group of 15 to 17 year olds has the lowest likelihood of being enrolled in a private school, with 2,859 (94.6% in the age bracket) attending a public institution.
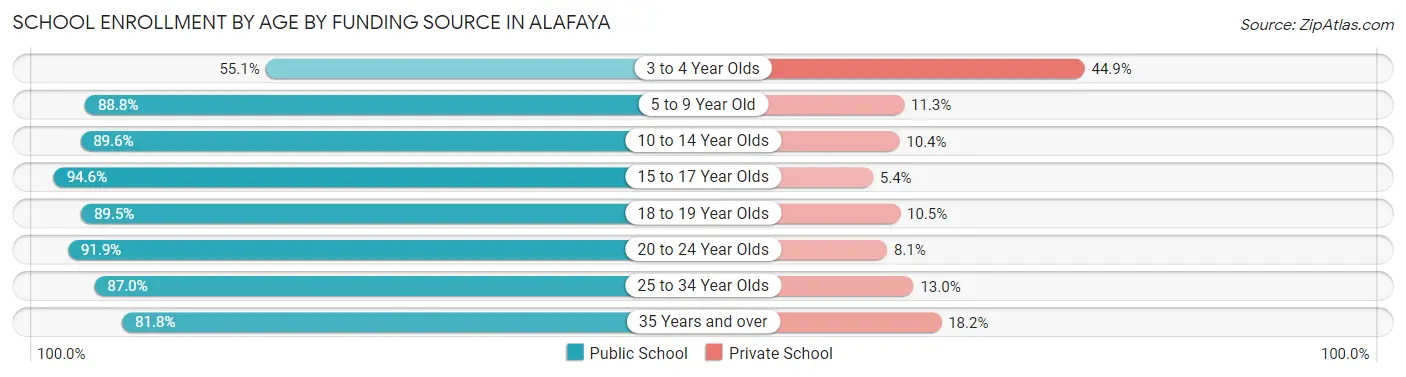
| Age Bracket | Public School | Private School |
| 3 to 4 Year Olds | 494 (55.1%) | 402 (44.9%) |
| 5 to 9 Year Old | 4,637 (88.7%) | 588 (11.3%) |
| 10 to 14 Year Olds | 5,184 (89.6%) | 600 (10.4%) |
| 15 to 17 Year Olds | 2,859 (94.6%) | 164 (5.4%) |
| 18 to 19 Year Olds | 1,211 (89.5%) | 142 (10.5%) |
| 20 to 24 Year Olds | 5,662 (91.9%) | 497 (8.1%) |
| 25 to 34 Year Olds | 2,723 (87.0%) | 407 (13.0%) |
| 35 Years and over | 1,045 (81.8%) | 232 (18.2%) |
| Total | 23,813 (88.7%) | 3,034 (11.3%) |
Educational Attainment by Field of Study in Alafaya
Business (8,103 | 26.6%), engineering (4,355 | 14.3%), education (2,783 | 9.1%), science & technology (2,735 | 9.0%), and social sciences (2,389 | 7.8%) are the most common fields of study among 30,497 individuals in Alafaya who have obtained a bachelor's degree or higher.
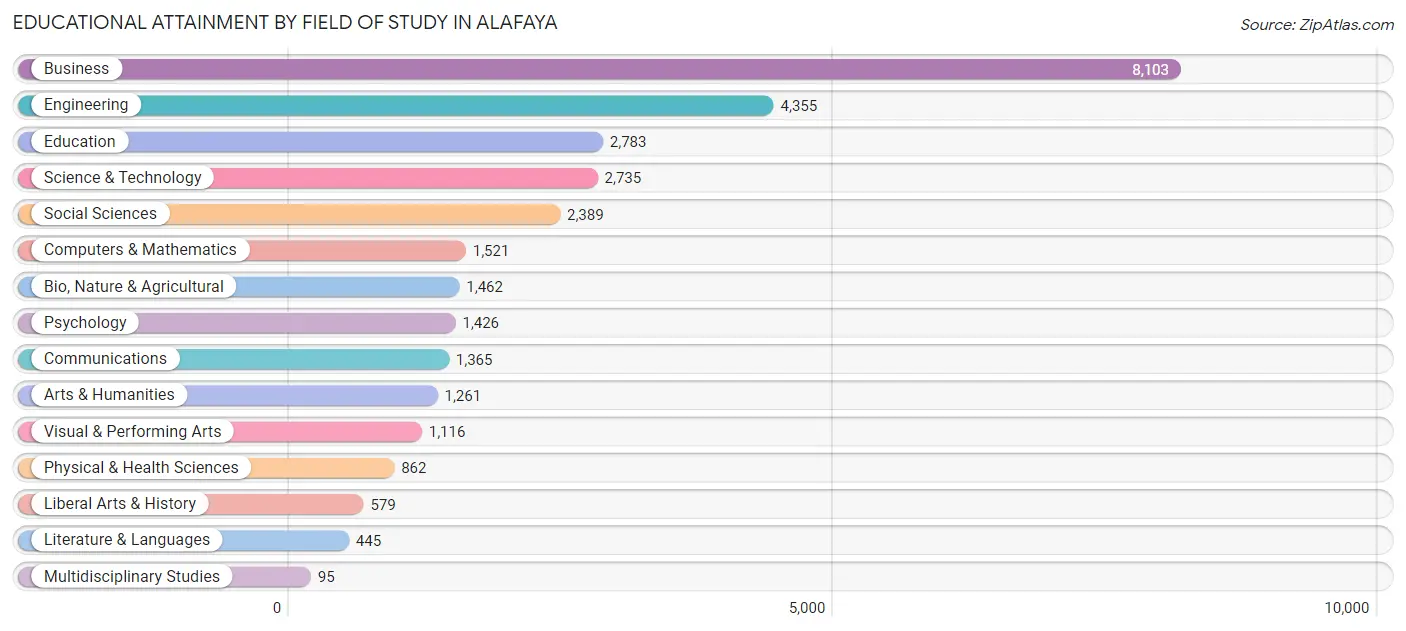
| Field of Study | # Graduates | % Graduates |
| Computers & Mathematics | 1,521 | 5.0% |
| Bio, Nature & Agricultural | 1,462 | 4.8% |
| Physical & Health Sciences | 862 | 2.8% |
| Psychology | 1,426 | 4.7% |
| Social Sciences | 2,389 | 7.8% |
| Engineering | 4,355 | 14.3% |
| Multidisciplinary Studies | 95 | 0.3% |
| Science & Technology | 2,735 | 9.0% |
| Business | 8,103 | 26.6% |
| Education | 2,783 | 9.1% |
| Literature & Languages | 445 | 1.5% |
| Liberal Arts & History | 579 | 1.9% |
| Visual & Performing Arts | 1,116 | 3.7% |
| Communications | 1,365 | 4.5% |
| Arts & Humanities | 1,261 | 4.1% |
| Total | 30,497 | 100.0% |
Transportation & Commute in Alafaya
Vehicle Availability by Sex in Alafaya
The most prevalent vehicle ownership categories in Alafaya are males with 2 vehicles (13,049, accounting for 48.5%) and females with 2 vehicles (9,879, making up 57.5%).
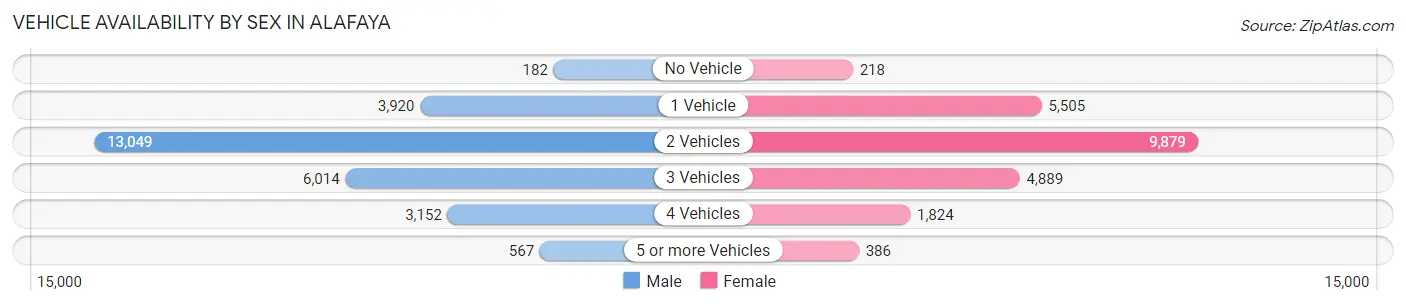
| Vehicles Available | Male | Female |
| No Vehicle | 182 (0.7%) | 218 (1.0%) |
| 1 Vehicle | 3,920 (14.6%) | 5,505 (24.2%) |
| 2 Vehicles | 13,049 (48.5%) | 9,879 (43.5%) |
| 3 Vehicles | 6,014 (22.4%) | 4,889 (21.5%) |
| 4 Vehicles | 3,152 (11.7%) | 1,824 (8.0%) |
| 5 or more Vehicles | 567 (2.1%) | 386 (1.7%) |
| Total | 26,884 (100.0%) | 22,701 (100.0%) |
Commute Time in Alafaya
The most frequently occuring commute durations in Alafaya are 30 to 34 minutes (8,385 commuters, 20.2%), 20 to 24 minutes (6,195 commuters, 14.9%), and 45 to 59 minutes (5,992 commuters, 14.4%).
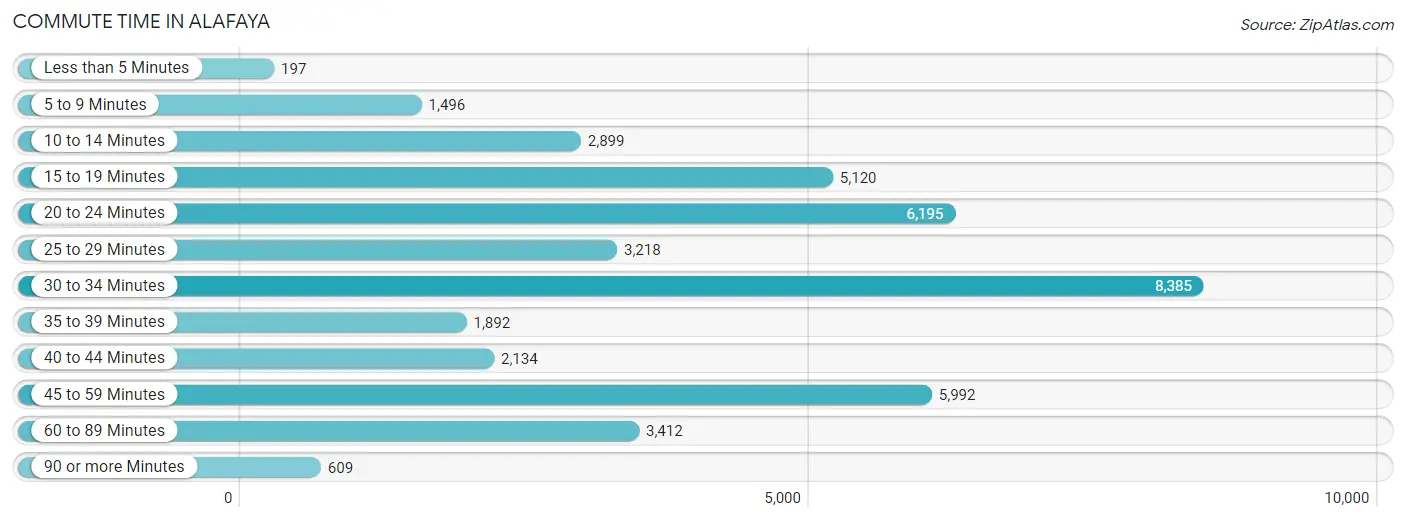
| Commute Time | # Commuters | % Commuters |
| Less than 5 Minutes | 197 | 0.5% |
| 5 to 9 Minutes | 1,496 | 3.6% |
| 10 to 14 Minutes | 2,899 | 7.0% |
| 15 to 19 Minutes | 5,120 | 12.3% |
| 20 to 24 Minutes | 6,195 | 14.9% |
| 25 to 29 Minutes | 3,218 | 7.7% |
| 30 to 34 Minutes | 8,385 | 20.2% |
| 35 to 39 Minutes | 1,892 | 4.5% |
| 40 to 44 Minutes | 2,134 | 5.1% |
| 45 to 59 Minutes | 5,992 | 14.4% |
| 60 to 89 Minutes | 3,412 | 8.2% |
| 90 or more Minutes | 609 | 1.5% |
Commute Time by Sex in Alafaya
The most common commute times in Alafaya are 30 to 34 minutes (4,391 commuters, 19.2%) for males and 30 to 34 minutes (3,994 commuters, 21.3%) for females.
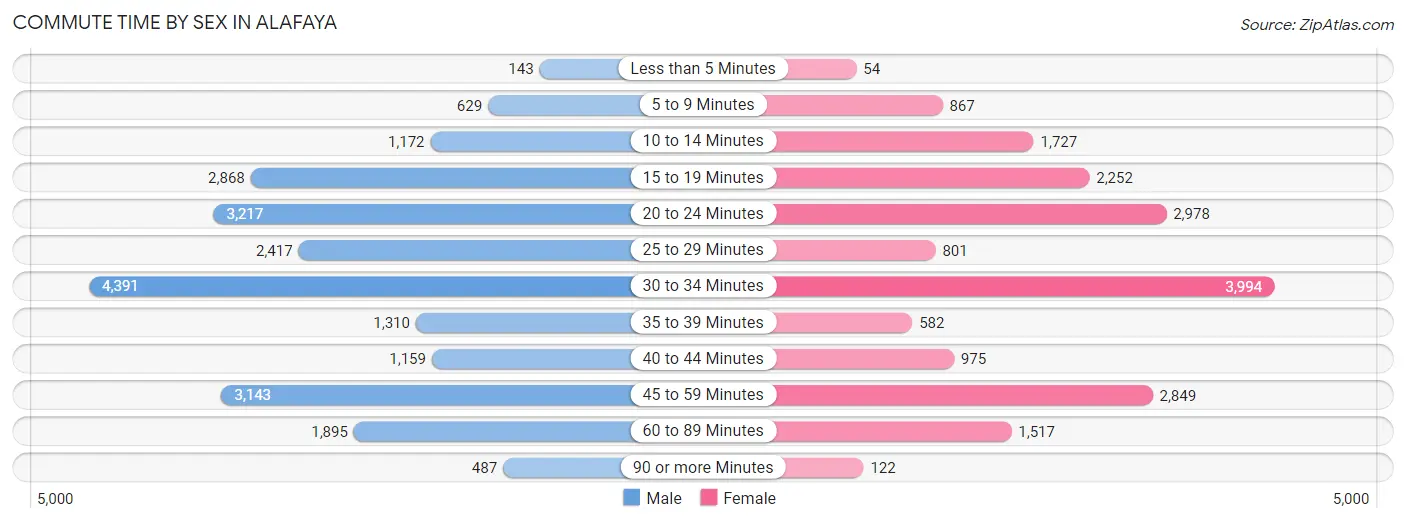
| Commute Time | Male | Female |
| Less than 5 Minutes | 143 (0.6%) | 54 (0.3%) |
| 5 to 9 Minutes | 629 (2.8%) | 867 (4.6%) |
| 10 to 14 Minutes | 1,172 (5.1%) | 1,727 (9.2%) |
| 15 to 19 Minutes | 2,868 (12.6%) | 2,252 (12.0%) |
| 20 to 24 Minutes | 3,217 (14.1%) | 2,978 (15.9%) |
| 25 to 29 Minutes | 2,417 (10.6%) | 801 (4.3%) |
| 30 to 34 Minutes | 4,391 (19.2%) | 3,994 (21.3%) |
| 35 to 39 Minutes | 1,310 (5.7%) | 582 (3.1%) |
| 40 to 44 Minutes | 1,159 (5.1%) | 975 (5.2%) |
| 45 to 59 Minutes | 3,143 (13.8%) | 2,849 (15.2%) |
| 60 to 89 Minutes | 1,895 (8.3%) | 1,517 (8.1%) |
| 90 or more Minutes | 487 (2.1%) | 122 (0.6%) |
Time of Departure to Work by Sex in Alafaya
The most frequent times of departure to work in Alafaya are 7:00 AM to 7:29 AM (4,057, 17.8%) for males and 8:00 AM to 8:29 AM (3,280, 17.5%) for females.
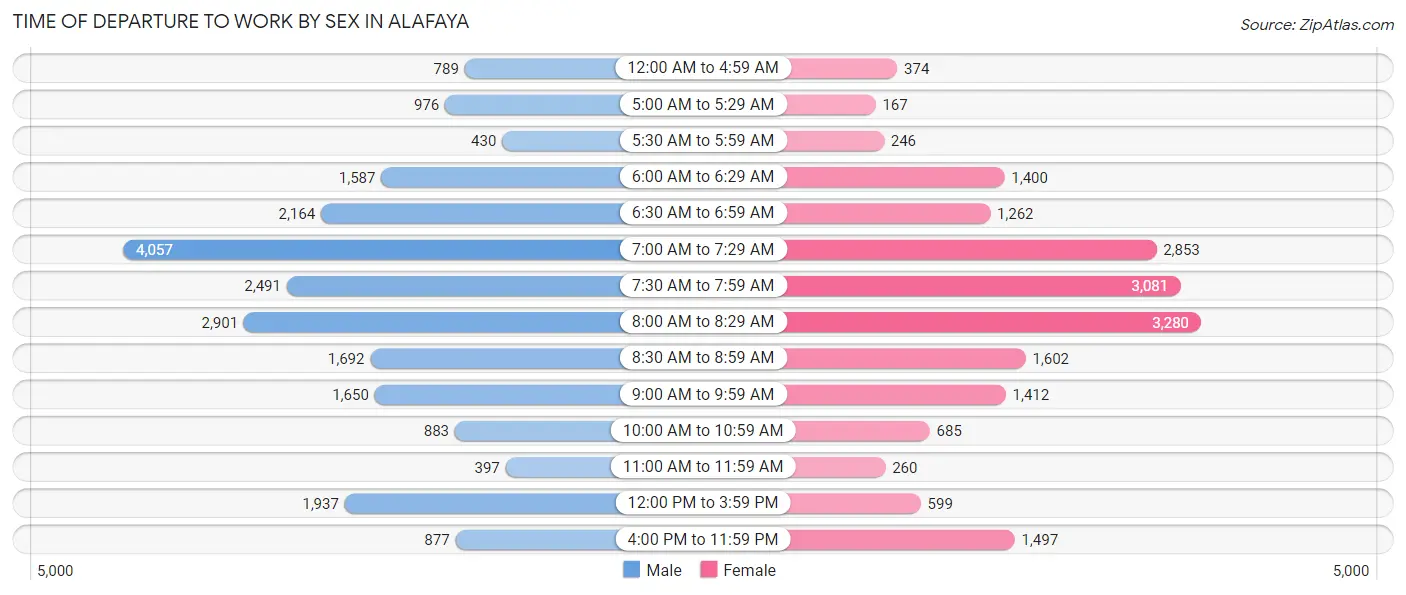
| Time of Departure | Male | Female |
| 12:00 AM to 4:59 AM | 789 (3.5%) | 374 (2.0%) |
| 5:00 AM to 5:29 AM | 976 (4.3%) | 167 (0.9%) |
| 5:30 AM to 5:59 AM | 430 (1.9%) | 246 (1.3%) |
| 6:00 AM to 6:29 AM | 1,587 (7.0%) | 1,400 (7.5%) |
| 6:30 AM to 6:59 AM | 2,164 (9.5%) | 1,262 (6.7%) |
| 7:00 AM to 7:29 AM | 4,057 (17.8%) | 2,853 (15.2%) |
| 7:30 AM to 7:59 AM | 2,491 (10.9%) | 3,081 (16.5%) |
| 8:00 AM to 8:29 AM | 2,901 (12.7%) | 3,280 (17.5%) |
| 8:30 AM to 8:59 AM | 1,692 (7.4%) | 1,602 (8.6%) |
| 9:00 AM to 9:59 AM | 1,650 (7.2%) | 1,412 (7.5%) |
| 10:00 AM to 10:59 AM | 883 (3.9%) | 685 (3.7%) |
| 11:00 AM to 11:59 AM | 397 (1.7%) | 260 (1.4%) |
| 12:00 PM to 3:59 PM | 1,937 (8.5%) | 599 (3.2%) |
| 4:00 PM to 11:59 PM | 877 (3.8%) | 1,497 (8.0%) |
| Total | 22,831 (100.0%) | 18,718 (100.0%) |
Housing Occupancy in Alafaya
Occupancy by Ownership in Alafaya
Of the total 31,506 dwellings in Alafaya, owner-occupied units account for 19,965 (63.4%), while renter-occupied units make up 11,541 (36.6%).
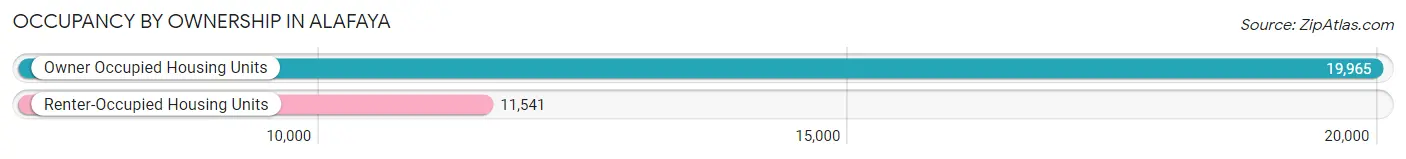
| Occupancy | # Housing Units | % Housing Units |
| Owner Occupied Housing Units | 19,965 | 63.4% |
| Renter-Occupied Housing Units | 11,541 | 36.6% |
| Total Occupied Housing Units | 31,506 | 100.0% |
Occupancy by Household Size in Alafaya
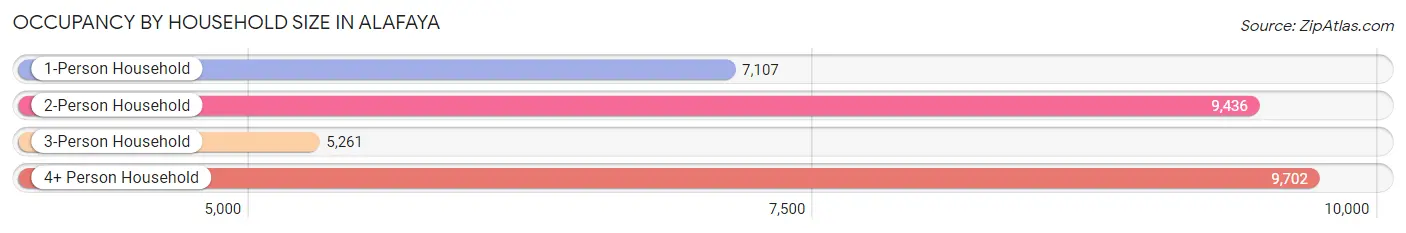
| Household Size | # Housing Units | % Housing Units |
| 1-Person Household | 7,107 | 22.6% |
| 2-Person Household | 9,436 | 29.9% |
| 3-Person Household | 5,261 | 16.7% |
| 4+ Person Household | 9,702 | 30.8% |
| Total Housing Units | 31,506 | 100.0% |
Occupancy by Ownership by Household Size in Alafaya
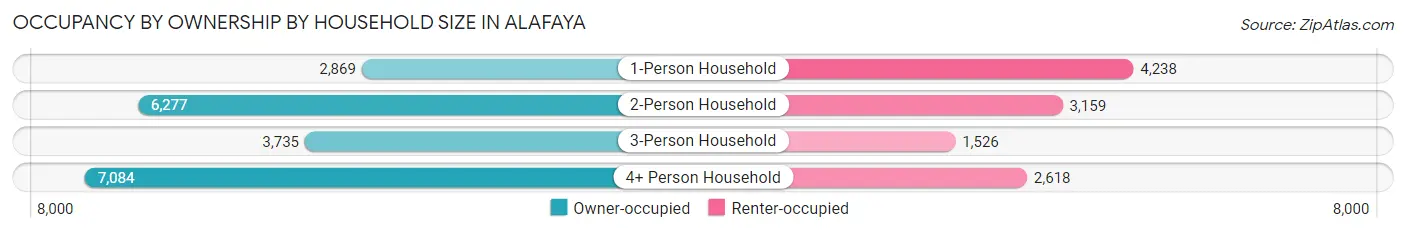
| Household Size | Owner-occupied | Renter-occupied |
| 1-Person Household | 2,869 (40.4%) | 4,238 (59.6%) |
| 2-Person Household | 6,277 (66.5%) | 3,159 (33.5%) |
| 3-Person Household | 3,735 (71.0%) | 1,526 (29.0%) |
| 4+ Person Household | 7,084 (73.0%) | 2,618 (27.0%) |
| Total Housing Units | 19,965 (63.4%) | 11,541 (36.6%) |
Occupancy by Educational Attainment in Alafaya
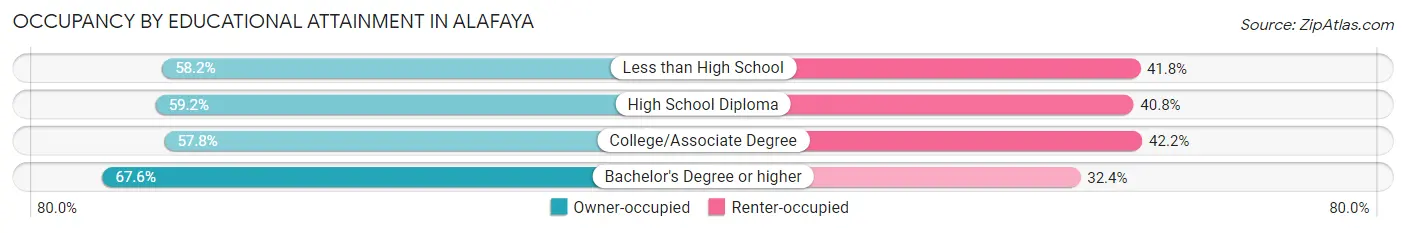
| Household Size | Owner-occupied | Renter-occupied |
| Less than High School | 991 (58.2%) | 713 (41.8%) |
| High School Diploma | 2,501 (59.2%) | 1,724 (40.8%) |
| College/Associate Degree | 4,861 (57.8%) | 3,547 (42.2%) |
| Bachelor's Degree or higher | 11,612 (67.6%) | 5,557 (32.4%) |
Occupancy by Age of Householder in Alafaya
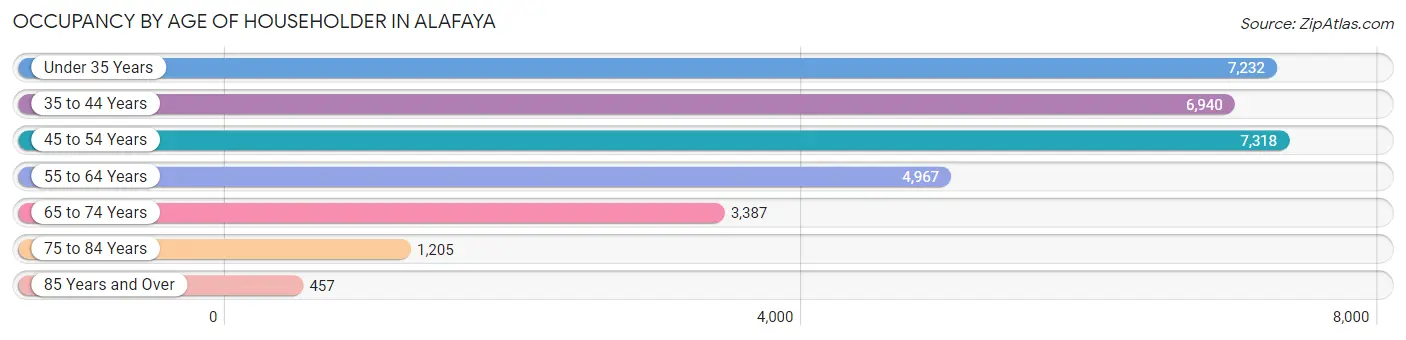
| Age Bracket | # Households | % Households |
| Under 35 Years | 7,232 | 23.0% |
| 35 to 44 Years | 6,940 | 22.0% |
| 45 to 54 Years | 7,318 | 23.2% |
| 55 to 64 Years | 4,967 | 15.8% |
| 65 to 74 Years | 3,387 | 10.7% |
| 75 to 84 Years | 1,205 | 3.8% |
| 85 Years and Over | 457 | 1.5% |
| Total | 31,506 | 100.0% |
Housing Finances in Alafaya
Median Income by Occupancy in Alafaya
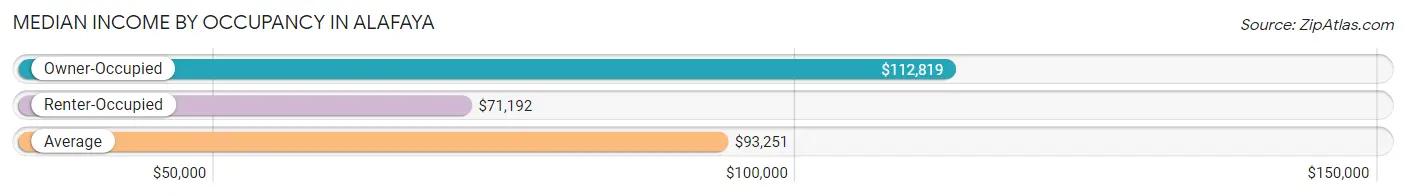
| Occupancy Type | # Households | Median Income |
| Owner-Occupied | 19,965 (63.4%) | $112,819 |
| Renter-Occupied | 11,541 (36.6%) | $71,192 |
| Average | 31,506 (100.0%) | $93,251 |
Occupancy by Householder Income Bracket in Alafaya
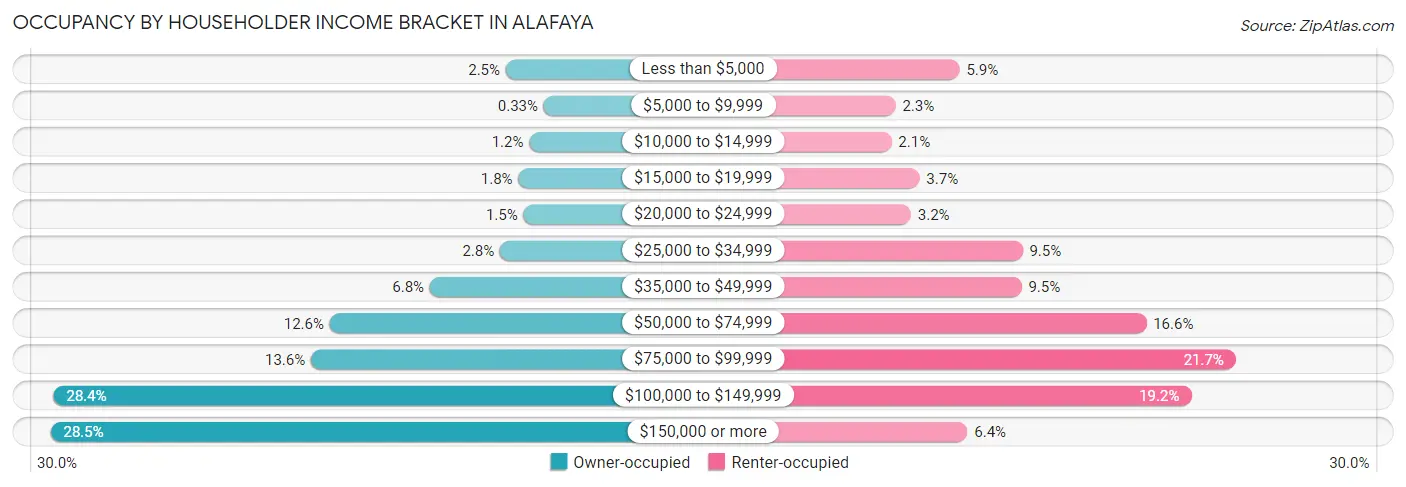
| Income Bracket | Owner-occupied | Renter-occupied |
| Less than $5,000 | 499 (2.5%) | 685 (5.9%) |
| $5,000 to $9,999 | 65 (0.3%) | 263 (2.3%) |
| $10,000 to $14,999 | 232 (1.2%) | 237 (2.1%) |
| $15,000 to $19,999 | 355 (1.8%) | 421 (3.6%) |
| $20,000 to $24,999 | 297 (1.5%) | 365 (3.2%) |
| $25,000 to $34,999 | 565 (2.8%) | 1,101 (9.5%) |
| $35,000 to $49,999 | 1,365 (6.8%) | 1,094 (9.5%) |
| $50,000 to $74,999 | 2,508 (12.6%) | 1,917 (16.6%) |
| $75,000 to $99,999 | 2,721 (13.6%) | 2,507 (21.7%) |
| $100,000 to $149,999 | 5,662 (28.4%) | 2,214 (19.2%) |
| $150,000 or more | 5,696 (28.5%) | 737 (6.4%) |
| Total | 19,965 (100.0%) | 11,541 (100.0%) |
Monthly Housing Cost Tiers in Alafaya
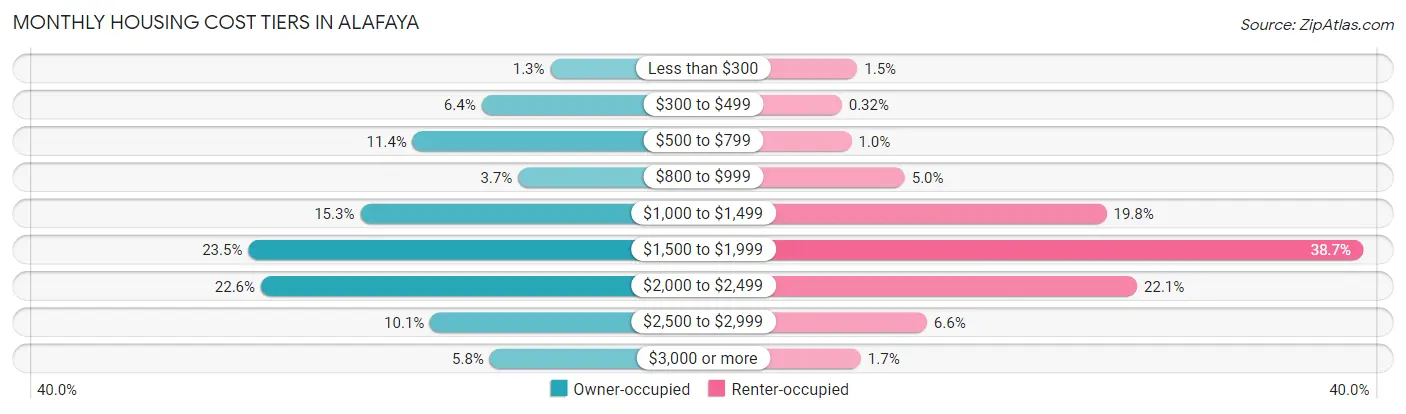
| Monthly Cost | Owner-occupied | Renter-occupied |
| Less than $300 | 255 (1.3%) | 170 (1.5%) |
| $300 to $499 | 1,268 (6.4%) | 37 (0.3%) |
| $500 to $799 | 2,281 (11.4%) | 120 (1.0%) |
| $800 to $999 | 731 (3.7%) | 573 (5.0%) |
| $1,000 to $1,499 | 3,051 (15.3%) | 2,288 (19.8%) |
| $1,500 to $1,999 | 4,697 (23.5%) | 4,465 (38.7%) |
| $2,000 to $2,499 | 4,512 (22.6%) | 2,547 (22.1%) |
| $2,500 to $2,999 | 2,022 (10.1%) | 760 (6.6%) |
| $3,000 or more | 1,148 (5.8%) | 200 (1.7%) |
| Total | 19,965 (100.0%) | 11,541 (100.0%) |
Physical Housing Characteristics in Alafaya
Housing Structures in Alafaya
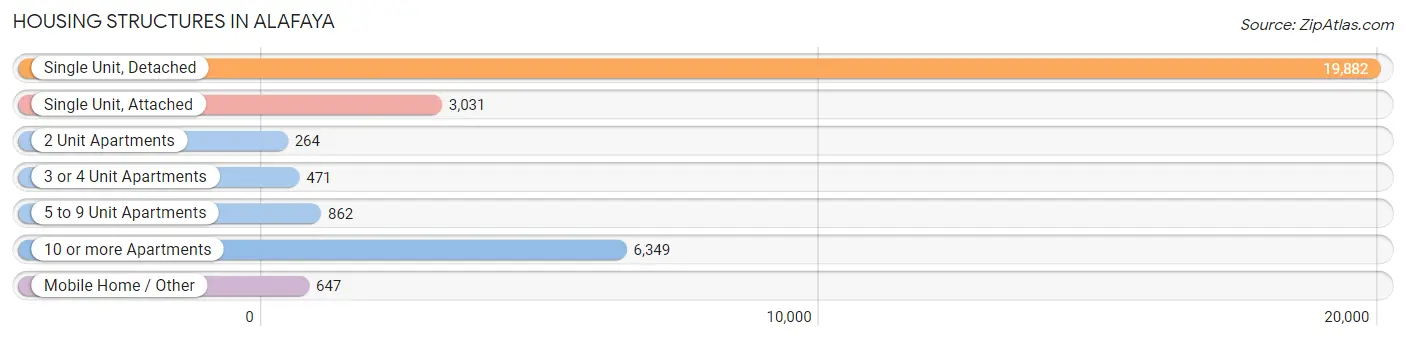
| Structure Type | # Housing Units | % Housing Units |
| Single Unit, Detached | 19,882 | 63.1% |
| Single Unit, Attached | 3,031 | 9.6% |
| 2 Unit Apartments | 264 | 0.8% |
| 3 or 4 Unit Apartments | 471 | 1.5% |
| 5 to 9 Unit Apartments | 862 | 2.7% |
| 10 or more Apartments | 6,349 | 20.2% |
| Mobile Home / Other | 647 | 2.1% |
| Total | 31,506 | 100.0% |
Housing Structures by Occupancy in Alafaya
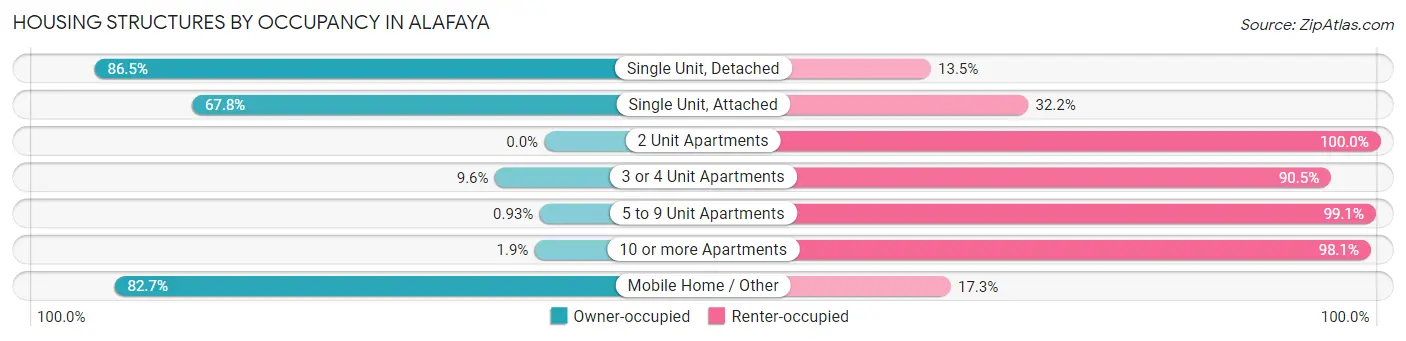
| Structure Type | Owner-occupied | Renter-occupied |
| Single Unit, Detached | 17,203 (86.5%) | 2,679 (13.5%) |
| Single Unit, Attached | 2,054 (67.8%) | 977 (32.2%) |
| 2 Unit Apartments | 0 (0.0%) | 264 (100.0%) |
| 3 or 4 Unit Apartments | 45 (9.6%) | 426 (90.4%) |
| 5 to 9 Unit Apartments | 8 (0.9%) | 854 (99.1%) |
| 10 or more Apartments | 120 (1.9%) | 6,229 (98.1%) |
| Mobile Home / Other | 535 (82.7%) | 112 (17.3%) |
| Total | 19,965 (63.4%) | 11,541 (36.6%) |
Housing Structures by Number of Rooms in Alafaya
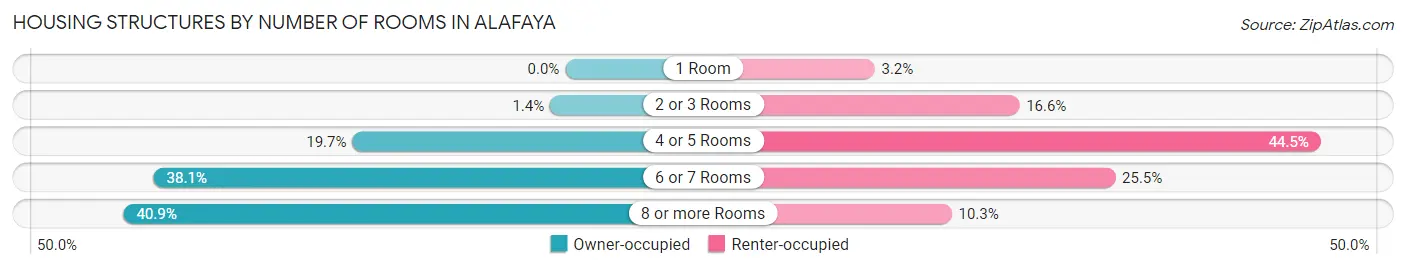
| Number of Rooms | Owner-occupied | Renter-occupied |
| 1 Room | 0 (0.0%) | 369 (3.2%) |
| 2 or 3 Rooms | 279 (1.4%) | 1,913 (16.6%) |
| 4 or 5 Rooms | 3,932 (19.7%) | 5,131 (44.5%) |
| 6 or 7 Rooms | 7,599 (38.1%) | 2,937 (25.5%) |
| 8 or more Rooms | 8,155 (40.8%) | 1,191 (10.3%) |
| Total | 19,965 (100.0%) | 11,541 (100.0%) |
Housing Structure by Heating Type in Alafaya
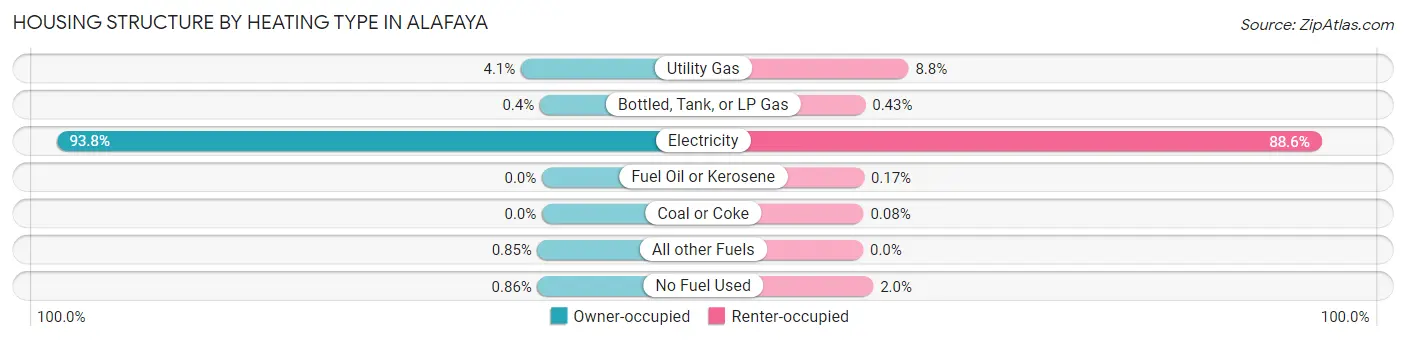
| Heating Type | Owner-occupied | Renter-occupied |
| Utility Gas | 811 (4.1%) | 1,013 (8.8%) |
| Bottled, Tank, or LP Gas | 79 (0.4%) | 50 (0.4%) |
| Electricity | 18,734 (93.8%) | 10,223 (88.6%) |
| Fuel Oil or Kerosene | 0 (0.0%) | 20 (0.2%) |
| Coal or Coke | 0 (0.0%) | 9 (0.1%) |
| All other Fuels | 169 (0.9%) | 0 (0.0%) |
| No Fuel Used | 172 (0.9%) | 226 (2.0%) |
| Total | 19,965 (100.0%) | 11,541 (100.0%) |
Household Vehicle Usage in Alafaya
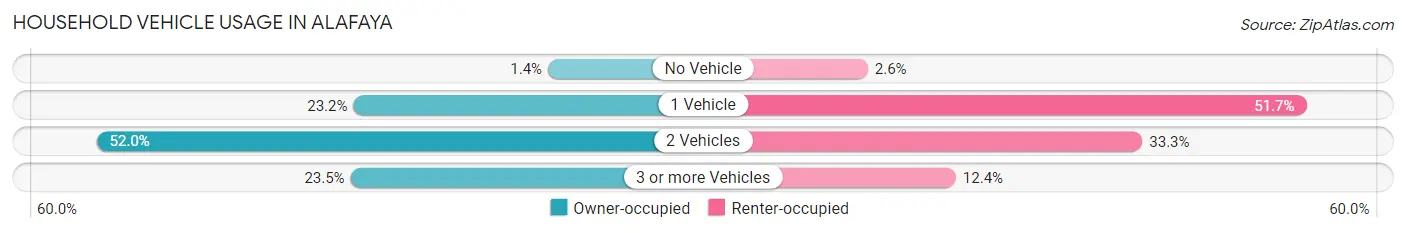
| Vehicles per Household | Owner-occupied | Renter-occupied |
| No Vehicle | 276 (1.4%) | 297 (2.6%) |
| 1 Vehicle | 4,627 (23.2%) | 5,964 (51.7%) |
| 2 Vehicles | 10,371 (51.9%) | 3,845 (33.3%) |
| 3 or more Vehicles | 4,691 (23.5%) | 1,435 (12.4%) |
| Total | 19,965 (100.0%) | 11,541 (100.0%) |
Real Estate & Mortgages in Alafaya
Real Estate and Mortgage Overview in Alafaya
| Characteristic | Without Mortgage | With Mortgage |
| Housing Units | 4,676 | 15,289 |
| Median Property Value | $344,300 | $367,300 |
| Median Household Income | $67,083 | $5,030 |
| Monthly Housing Costs | $632 | $1,089 |
| Real Estate Taxes | $2,599 | $331 |
Property Value by Mortgage Status in Alafaya
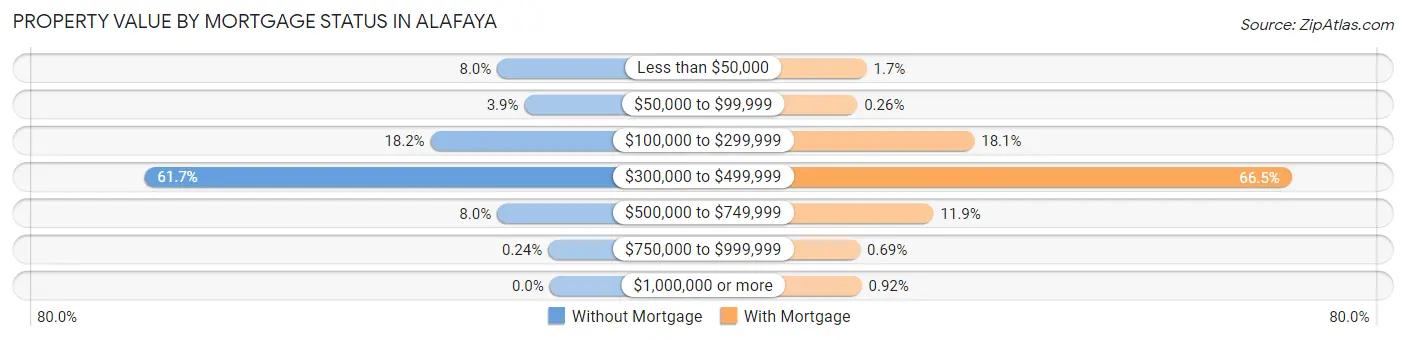
| Property Value | Without Mortgage | With Mortgage |
| Less than $50,000 | 374 (8.0%) | 258 (1.7%) |
| $50,000 to $99,999 | 180 (3.8%) | 40 (0.3%) |
| $100,000 to $299,999 | 849 (18.2%) | 2,766 (18.1%) |
| $300,000 to $499,999 | 2,887 (61.7%) | 10,160 (66.4%) |
| $500,000 to $749,999 | 375 (8.0%) | 1,818 (11.9%) |
| $750,000 to $999,999 | 11 (0.2%) | 106 (0.7%) |
| $1,000,000 or more | 0 (0.0%) | 141 (0.9%) |
| Total | 4,676 (100.0%) | 15,289 (100.0%) |
Household Income by Mortgage Status in Alafaya
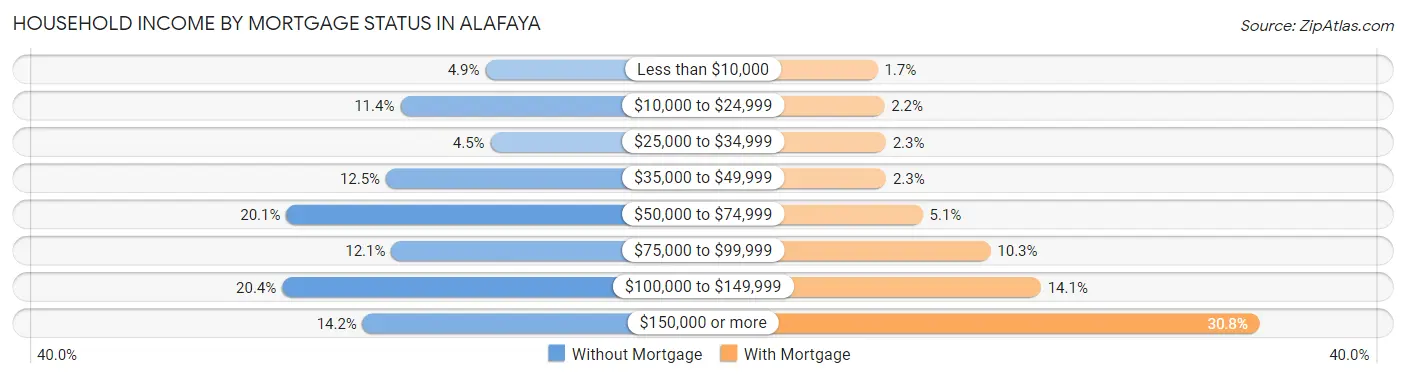
| Household Income | Without Mortgage | With Mortgage |
| Less than $10,000 | 229 (4.9%) | 256 (1.7%) |
| $10,000 to $24,999 | 532 (11.4%) | 335 (2.2%) |
| $25,000 to $34,999 | 211 (4.5%) | 352 (2.3%) |
| $35,000 to $49,999 | 583 (12.5%) | 354 (2.3%) |
| $50,000 to $74,999 | 938 (20.1%) | 782 (5.1%) |
| $75,000 to $99,999 | 564 (12.1%) | 1,570 (10.3%) |
| $100,000 to $149,999 | 953 (20.4%) | 2,157 (14.1%) |
| $150,000 or more | 666 (14.2%) | 4,709 (30.8%) |
| Total | 4,676 (100.0%) | 15,289 (100.0%) |
Property Value to Household Income Ratio in Alafaya
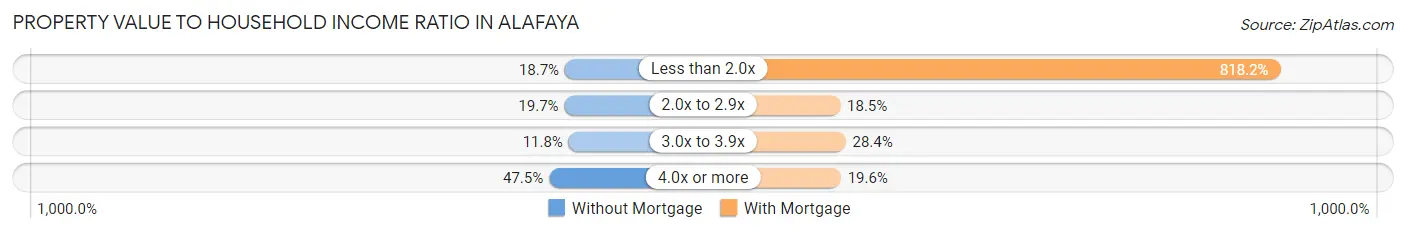
| Value-to-Income Ratio | Without Mortgage | With Mortgage |
| Less than 2.0x | 874 (18.7%) | 125,090 (818.2%) |
| 2.0x to 2.9x | 919 (19.7%) | 2,831 (18.5%) |
| 3.0x to 3.9x | 553 (11.8%) | 4,345 (28.4%) |
| 4.0x or more | 2,220 (47.5%) | 2,992 (19.6%) |
| Total | 4,676 (100.0%) | 15,289 (100.0%) |
Real Estate Taxes by Mortgage Status in Alafaya
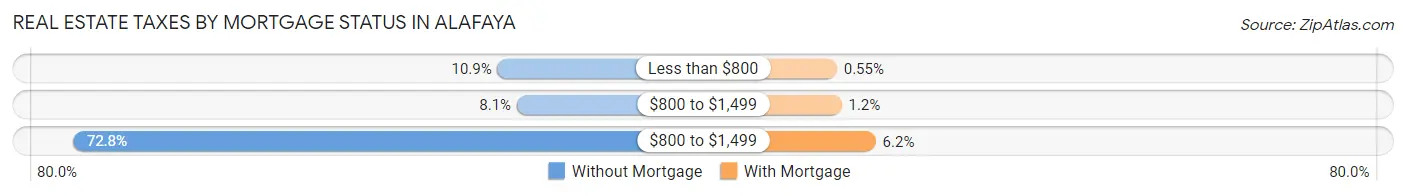
| Property Taxes | Without Mortgage | With Mortgage |
| Less than $800 | 509 (10.9%) | 84 (0.5%) |
| $800 to $1,499 | 377 (8.1%) | 190 (1.2%) |
| $800 to $1,499 | 3,404 (72.8%) | 953 (6.2%) |
| Total | 4,676 (100.0%) | 15,289 (100.0%) |
Health & Disability in Alafaya
Health Insurance Coverage by Age in Alafaya
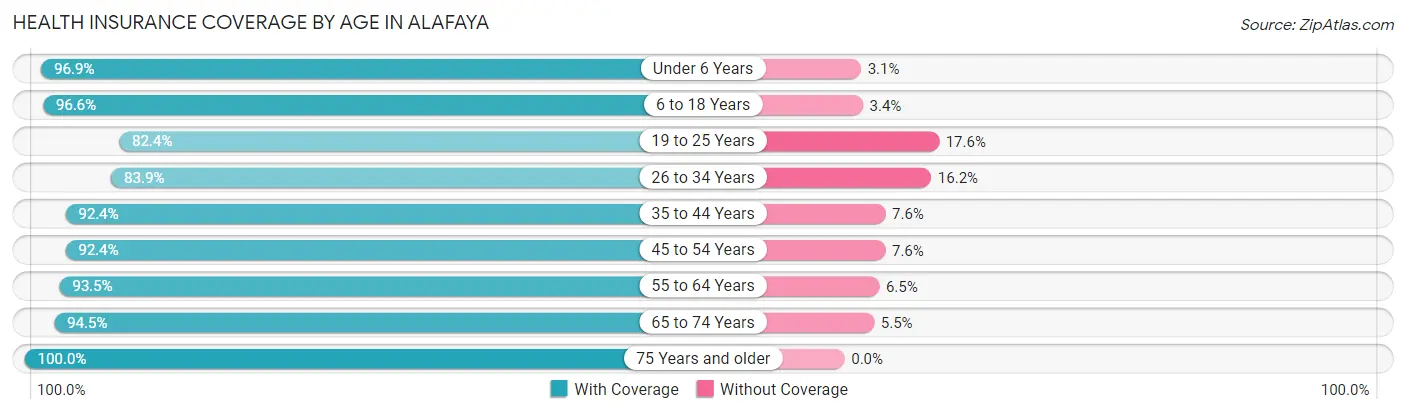
| Age Bracket | With Coverage | Without Coverage |
| Under 6 Years | 5,845 (96.9%) | 185 (3.1%) |
| 6 to 18 Years | 13,373 (96.6%) | 472 (3.4%) |
| 19 to 25 Years | 11,364 (82.4%) | 2,429 (17.6%) |
| 26 to 34 Years | 9,015 (83.9%) | 1,736 (16.2%) |
| 35 to 44 Years | 12,741 (92.4%) | 1,050 (7.6%) |
| 45 to 54 Years | 12,755 (92.4%) | 1,049 (7.6%) |
| 55 to 64 Years | 8,700 (93.5%) | 602 (6.5%) |
| 65 to 74 Years | 5,714 (94.5%) | 333 (5.5%) |
| 75 Years and older | 3,840 (100.0%) | 0 (0.0%) |
| Total | 83,347 (91.4%) | 7,856 (8.6%) |
Health Insurance Coverage by Citizenship Status in Alafaya
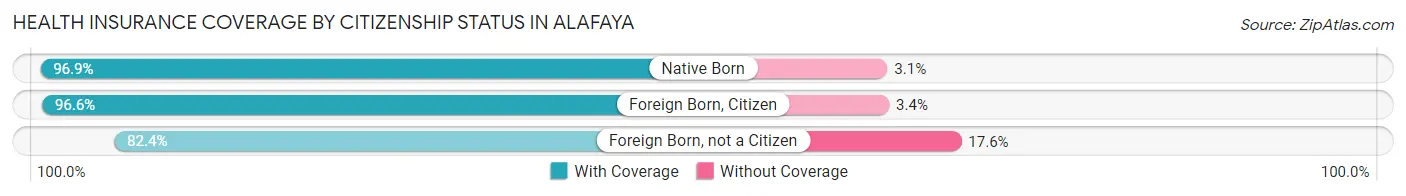
| Citizenship Status | With Coverage | Without Coverage |
| Native Born | 5,845 (96.9%) | 185 (3.1%) |
| Foreign Born, Citizen | 13,373 (96.6%) | 472 (3.4%) |
| Foreign Born, not a Citizen | 11,364 (82.4%) | 2,429 (17.6%) |
Health Insurance Coverage by Household Income in Alafaya
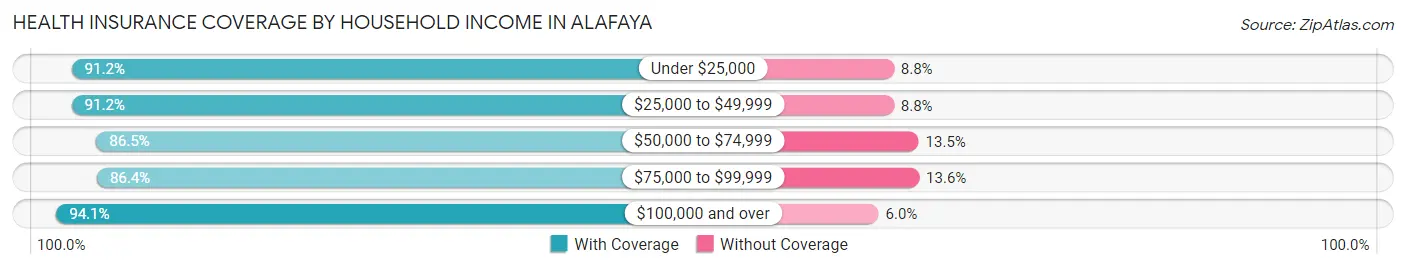
| Household Income | With Coverage | Without Coverage |
| Under $25,000 | 5,457 (91.2%) | 528 (8.8%) |
| $25,000 to $49,999 | 9,220 (91.2%) | 892 (8.8%) |
| $50,000 to $74,999 | 10,362 (86.5%) | 1,611 (13.5%) |
| $75,000 to $99,999 | 12,140 (86.4%) | 1,904 (13.6%) |
| $100,000 and over | 46,168 (94.1%) | 2,921 (5.9%) |
Public vs Private Health Insurance Coverage by Age in Alafaya
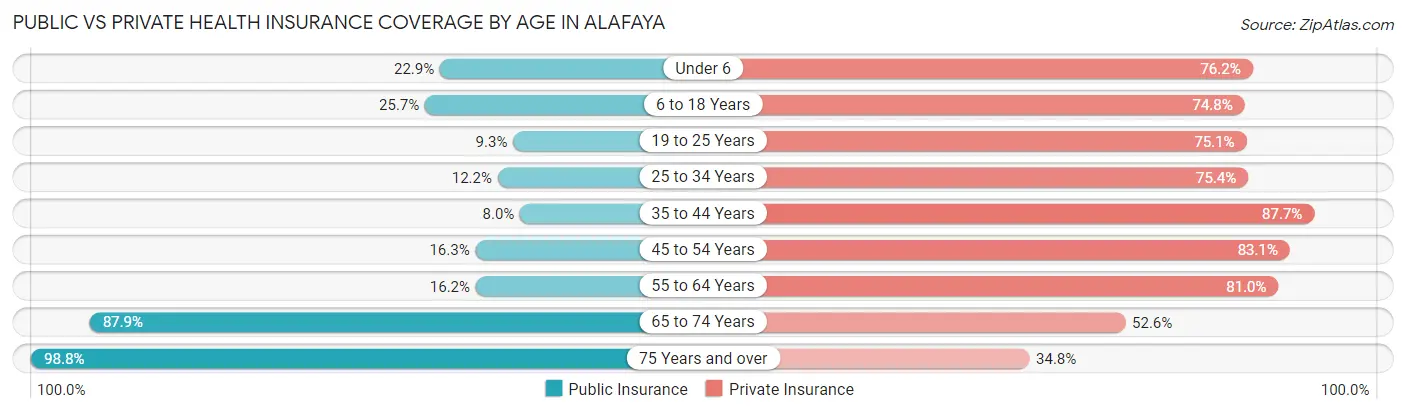
| Age Bracket | Public Insurance | Private Insurance |
| Under 6 | 1,380 (22.9%) | 4,596 (76.2%) |
| 6 to 18 Years | 3,552 (25.7%) | 10,349 (74.8%) |
| 19 to 25 Years | 1,283 (9.3%) | 10,359 (75.1%) |
| 25 to 34 Years | 1,308 (12.2%) | 8,106 (75.4%) |
| 35 to 44 Years | 1,104 (8.0%) | 12,090 (87.7%) |
| 45 to 54 Years | 2,251 (16.3%) | 11,477 (83.1%) |
| 55 to 64 Years | 1,511 (16.2%) | 7,537 (81.0%) |
| 65 to 74 Years | 5,316 (87.9%) | 3,180 (52.6%) |
| 75 Years and over | 3,793 (98.8%) | 1,335 (34.8%) |
| Total | 21,498 (23.6%) | 69,029 (75.7%) |
Disability Status by Sex by Age in Alafaya
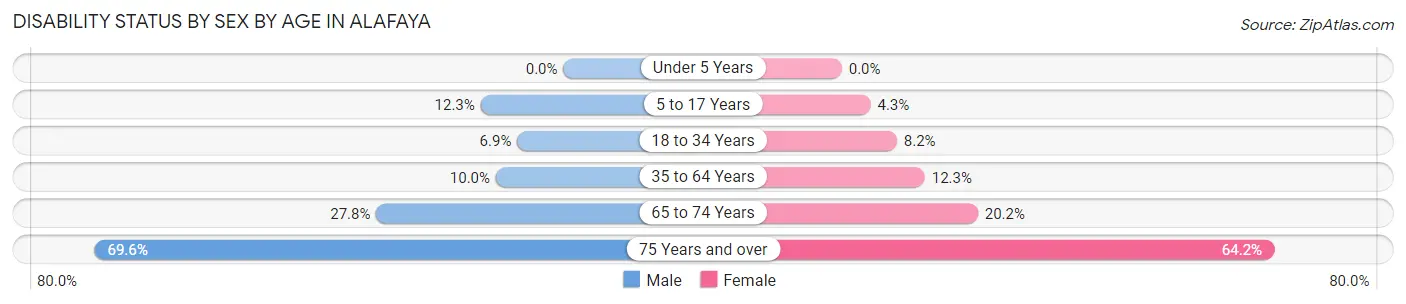
| Age Bracket | Male | Female |
| Under 5 Years | 0 (0.0%) | 0 (0.0%) |
| 5 to 17 Years | 902 (12.3%) | 291 (4.3%) |
| 18 to 34 Years | 854 (6.9%) | 1,036 (8.2%) |
| 35 to 64 Years | 1,846 (10.0%) | 2,278 (12.3%) |
| 65 to 74 Years | 750 (27.8%) | 676 (20.2%) |
| 75 Years and over | 985 (69.6%) | 1,556 (64.2%) |
Disability Class by Sex by Age in Alafaya
Disability Class: Hearing Difficulty
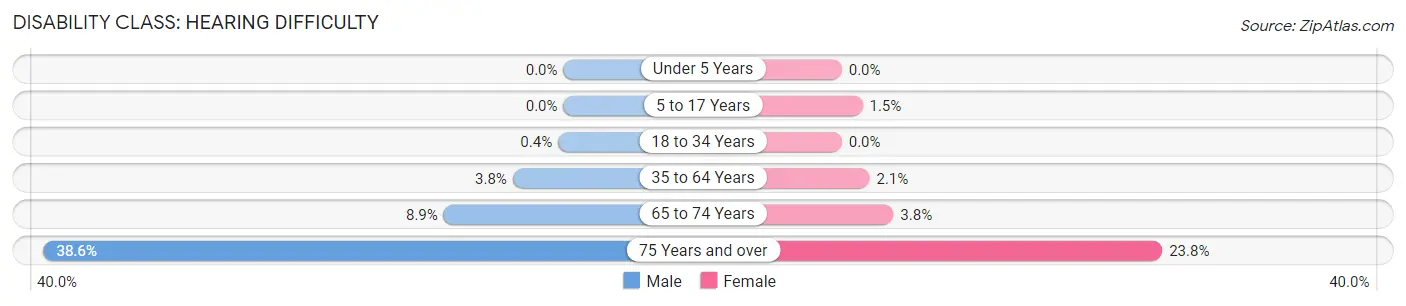
| Age Bracket | Male | Female |
| Under 5 Years | 0 (0.0%) | 0 (0.0%) |
| 5 to 17 Years | 0 (0.0%) | 105 (1.5%) |
| 18 to 34 Years | 50 (0.4%) | 0 (0.0%) |
| 35 to 64 Years | 692 (3.8%) | 380 (2.1%) |
| 65 to 74 Years | 240 (8.9%) | 128 (3.8%) |
| 75 Years and over | 546 (38.6%) | 577 (23.8%) |
Disability Class: Vision Difficulty
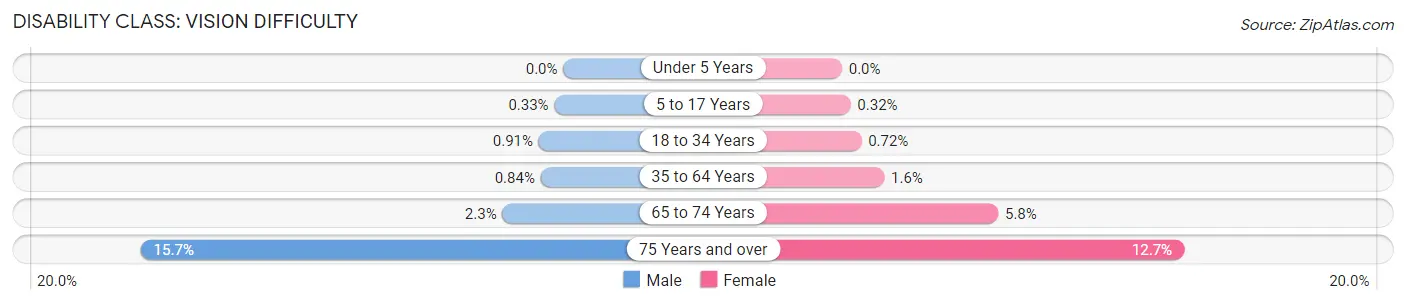
| Age Bracket | Male | Female |
| Under 5 Years | 0 (0.0%) | 0 (0.0%) |
| 5 to 17 Years | 24 (0.3%) | 22 (0.3%) |
| 18 to 34 Years | 113 (0.9%) | 91 (0.7%) |
| 35 to 64 Years | 155 (0.8%) | 290 (1.6%) |
| 65 to 74 Years | 61 (2.3%) | 194 (5.8%) |
| 75 Years and over | 222 (15.7%) | 308 (12.7%) |
Disability Class: Cognitive Difficulty
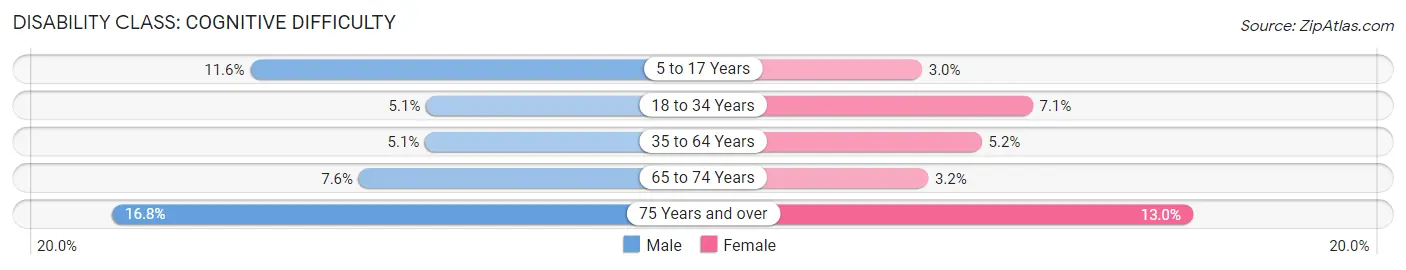
| Age Bracket | Male | Female |
| 5 to 17 Years | 853 (11.6%) | 202 (3.0%) |
| 18 to 34 Years | 635 (5.1%) | 897 (7.1%) |
| 35 to 64 Years | 946 (5.1%) | 959 (5.2%) |
| 65 to 74 Years | 205 (7.6%) | 107 (3.2%) |
| 75 Years and over | 237 (16.8%) | 316 (13.0%) |
Disability Class: Ambulatory Difficulty
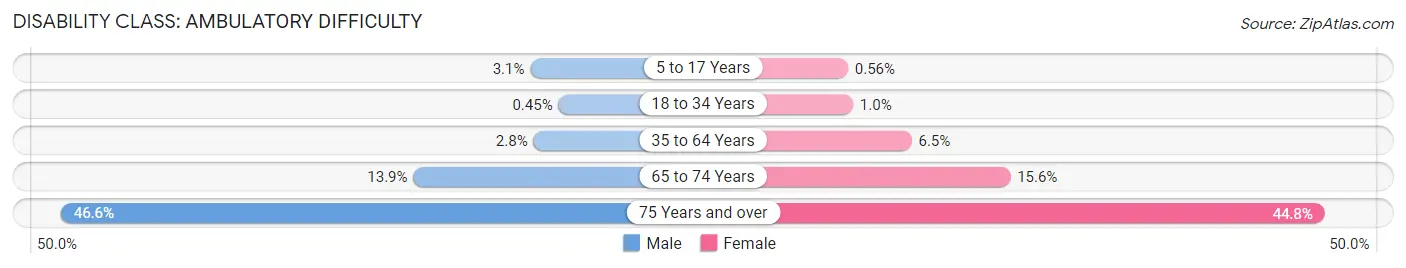
| Age Bracket | Male | Female |
| 5 to 17 Years | 225 (3.1%) | 38 (0.6%) |
| 18 to 34 Years | 56 (0.4%) | 130 (1.0%) |
| 35 to 64 Years | 511 (2.8%) | 1,195 (6.5%) |
| 65 to 74 Years | 376 (13.9%) | 523 (15.6%) |
| 75 Years and over | 660 (46.6%) | 1,087 (44.8%) |
Disability Class: Self-Care Difficulty
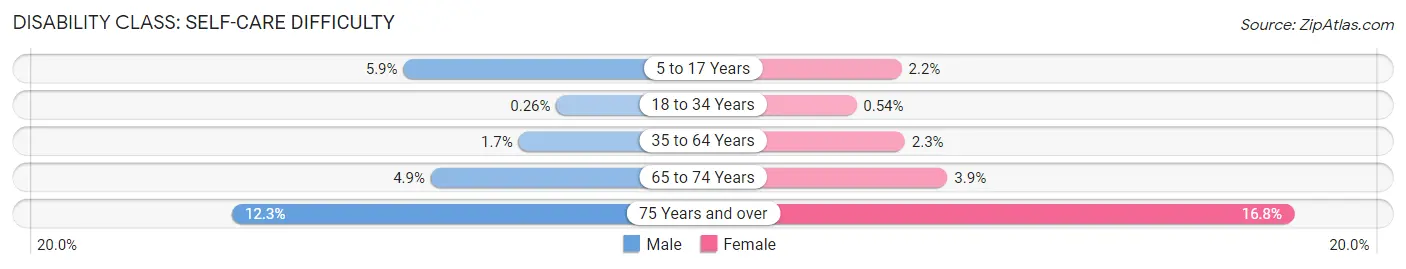
| Age Bracket | Male | Female |
| 5 to 17 Years | 436 (5.9%) | 151 (2.2%) |
| 18 to 34 Years | 33 (0.3%) | 69 (0.5%) |
| 35 to 64 Years | 306 (1.7%) | 432 (2.3%) |
| 65 to 74 Years | 133 (4.9%) | 131 (3.9%) |
| 75 Years and over | 174 (12.3%) | 407 (16.8%) |
Technology Access in Alafaya
Computing Device Access in Alafaya
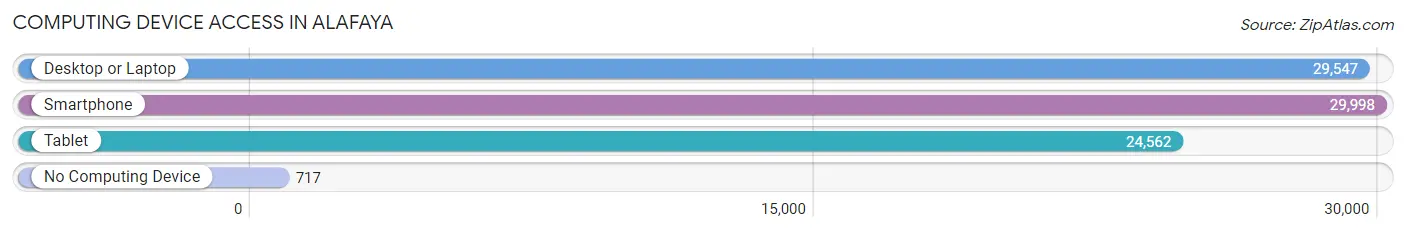
| Device Type | # Households | % Households |
| Desktop or Laptop | 29,547 | 93.8% |
| Smartphone | 29,998 | 95.2% |
| Tablet | 24,562 | 78.0% |
| No Computing Device | 717 | 2.3% |
| Total | 31,506 | 100.0% |
Internet Access in Alafaya
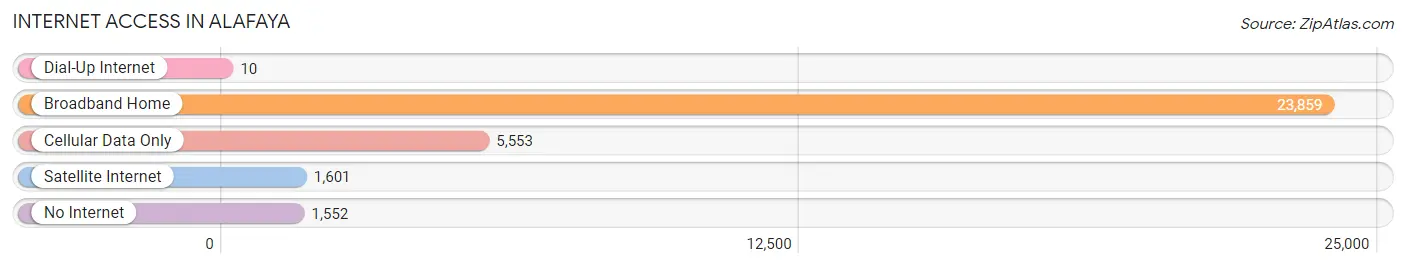
| Internet Type | # Households | % Households |
| Dial-Up Internet | 10 | 0.0% |
| Broadband Home | 23,859 | 75.7% |
| Cellular Data Only | 5,553 | 17.6% |
| Satellite Internet | 1,601 | 5.1% |
| No Internet | 1,552 | 4.9% |
| Total | 31,506 | 100.0% |
Alafaya Summary
Alafaya is a census-designated place (CDP) located in Orange County, Florida, United States. It is part of the Orlando–Kissimmee–Sanford Metropolitan Statistical Area. The population was 73,158 at the 2010 census.
History
Alafaya was originally part of the Seminole County area, but was annexed by Orange County in the late 1960s. The area was originally known as “Seminole Woods” and was home to a few small farms and ranches. In the late 1970s, the area began to experience rapid growth as developers began to build new homes and businesses. The area was officially named Alafaya in 1984, after the Alafia River, which runs through the area.
Geography
Alafaya is located at 28°33′N 81°17′W (28.55, -81.28). According to the United States Census Bureau, the CDP has a total area of 16.2 square miles (41.8 km2), of which 16.1 square miles (41.6 km2) is land and 0.1 square miles (0.2 km2) (0.62%) is water.
Economy
Alafaya is home to a variety of businesses, including retail stores, restaurants, and professional services. The University of Central Florida is located in Alafaya, and is the largest employer in the area. Other major employers include Lockheed Martin, Siemens, and the Orange County Public Schools.
Demographics
As of the census of 2010, there were 73,158 people, 24,945 households, and 17,945 families residing in the CDP. The population density was 4,541.3 people per square mile (1,753.7/km2). There were 26,845 housing units at an average density of 1,664.7/sq mi (642.2/km2). The racial makeup of the CDP was 68.2% White, 16.2% African American, 0.4% Native American, 8.2% Asian, 0.1% Pacific Islander, 4.2% from other races, and 2.9% from two or more races. Hispanic or Latino of any race were 15.2% of the population.
There were 24,945 households, out of which 37.2% had children under the age of 18 living with them, 51.2% were married couples living together, 13.2% had a female householder with no husband present, and 30.2% were non-families. 22.2% of all households were made up of individuals, and 5.2% had someone living alone who was 65 years of age or older. The average household size was 2.86 and the average family size was 3.37.
In the CDP, the population was spread out, with 25.7% under the age of 18, 14.2% from 18 to 24, 33.2% from 25 to 44, 19.3% from 45 to 64, and 7.6% who were 65 years of age or older. The median age was 30 years. For every 100 females, there were 97.2 males. For every 100 females age 18 and over, there were 94.3 males.
The median income for a household in the CDP was $50,945, and the median income for a family was $56,945. Males had a median income of $40,945 versus $30,945 for females. The per capita income for the CDP was $20,945. About 6.2% of families and 8.2% of the population were below the poverty line, including 10.2% of those under age 18 and 6.2% of those age 65 or over.
Common Questions
What is Per Capita Income in Alafaya?
Per Capita income in Alafaya is $37,338.
What is the Median Family Income in Alafaya?
Median Family Income in Alafaya is $108,275.
What is the Median Household income in Alafaya?
Median Household Income in Alafaya is $93,251.
What is Income or Wage Gap in Alafaya?
Income or Wage Gap in Alafaya is 28.7%.
Women in Alafaya earn 71.3 cents for every dollar earned by a man.
What is Family Income Deficit in Alafaya?
Family Income Deficit in Alafaya is $9,309.
Families that are below poverty line in Alafaya earn $9,309 less on average than the poverty threshold level.
What is Inequality or Gini Index in Alafaya?
Inequality or Gini Index in Alafaya is 0.38.
What is the Total Population of Alafaya?
Total Population of Alafaya is 91,531.
What is the Total Male Population of Alafaya?
Total Male Population of Alafaya is 45,201.
What is the Total Female Population of Alafaya?
Total Female Population of Alafaya is 46,330.
What is the Ratio of Males per 100 Females in Alafaya?
There are 97.56 Males per 100 Females in Alafaya.
What is the Ratio of Females per 100 Males in Alafaya?
There are 102.50 Females per 100 Males in Alafaya.
What is the Median Population Age in Alafaya?
Median Population Age in Alafaya is 35.9 Years.
What is the Average Family Size in Alafaya
Average Family Size in Alafaya is 3.4 People.
What is the Average Household Size in Alafaya
Average Household Size in Alafaya is 2.9 People.
How Large is the Labor Force in Alafaya?
There are 52,509 People in the Labor Forcein in Alafaya.
What is the Percentage of People in the Labor Force in Alafaya?
70.9% of People are in the Labor Force in Alafaya.
What is the Unemployment Rate in Alafaya?
Unemployment Rate in Alafaya is 4.4%.