Elk River, MN Map & Demographics
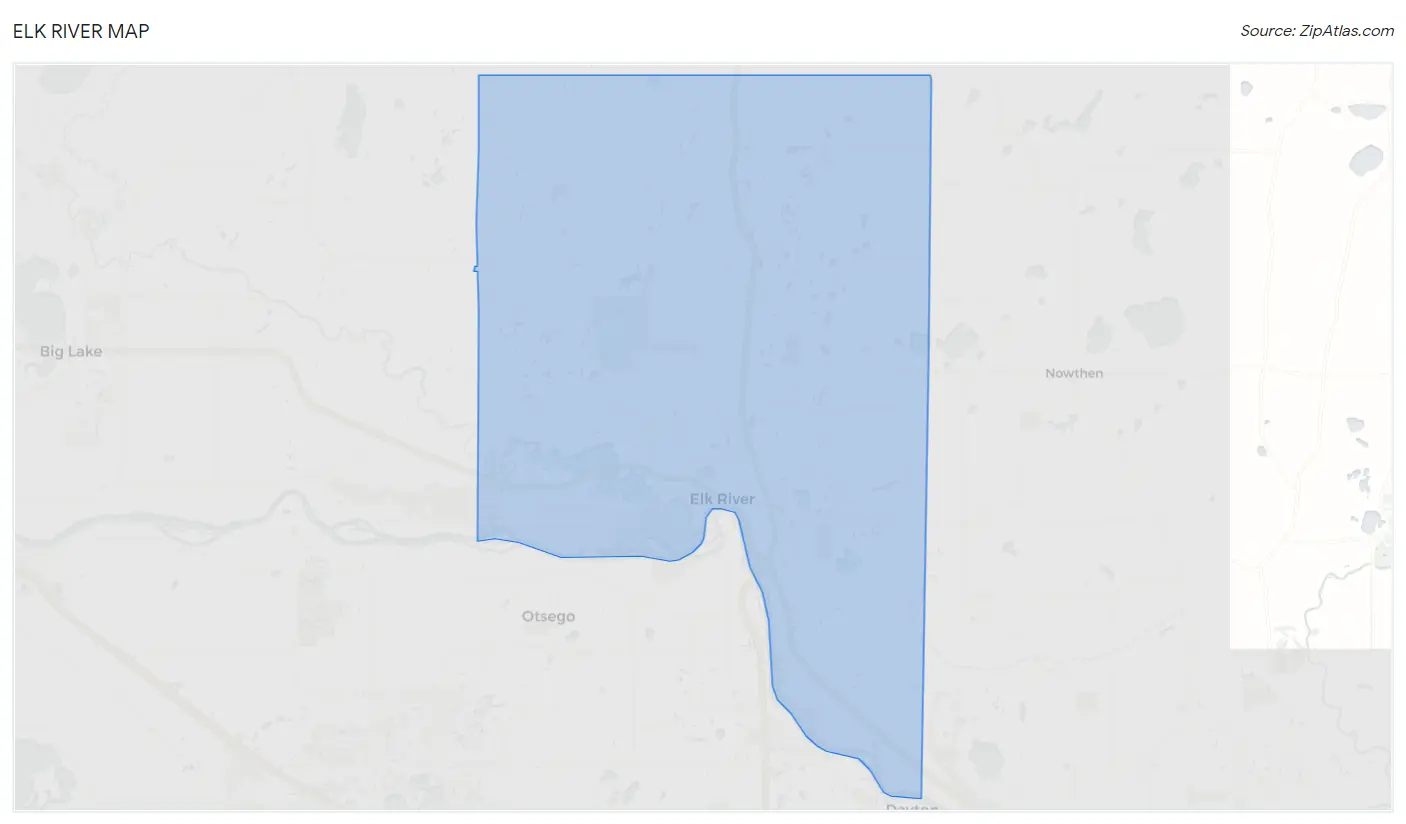
Elk River Map
Elk River Overview
$42,745
PER CAPITA INCOME
$115,089
AVG FAMILY INCOME
$95,597
AVG HOUSEHOLD INCOME
16.1%
WAGE / INCOME GAP [ % ]
83.9¢/ $1
WAGE / INCOME GAP [ $ ]
$8,961
FAMILY INCOME DEFICIT
0.38
INEQUALITY / GINI INDEX
25,936
TOTAL POPULATION
13,216
MALE POPULATION
12,720
FEMALE POPULATION
103.90
MALES / 100 FEMALES
96.25
FEMALES / 100 MALES
35.7
MEDIAN AGE
3.2
AVG FAMILY SIZE
2.7
AVG HOUSEHOLD SIZE
14,737
LABOR FORCE [ PEOPLE ]
72.1%
PERCENT IN LABOR FORCE
2.0%
UNEMPLOYMENT RATE
Elk River Zip Codes
Income in Elk River
Income Overview in Elk River
Per Capita Income in Elk River is $42,745, while median incomes of families and households are $115,089 and $95,597 respectively.
| Characteristic | Number | Measure |
| Per Capita Income | 25,936 | $42,745 |
| Median Family Income | 6,343 | $115,089 |
| Mean Family Income | 6,343 | $128,345 |
| Median Household Income | 9,449 | $95,597 |
| Mean Household Income | 9,449 | $113,936 |
| Income Deficit | 6,343 | $8,961 |
| Wage / Income Gap (%) | 25,936 | 16.08% |
| Wage / Income Gap ($) | 25,936 | 83.92¢ per $1 |
| Gini / Inequality Index | 25,936 | 0.38 |
Earnings by Sex in Elk River
Average Earnings in Elk River are $53,571, $56,503 for men and $47,416 for women, a difference of 16.1%.
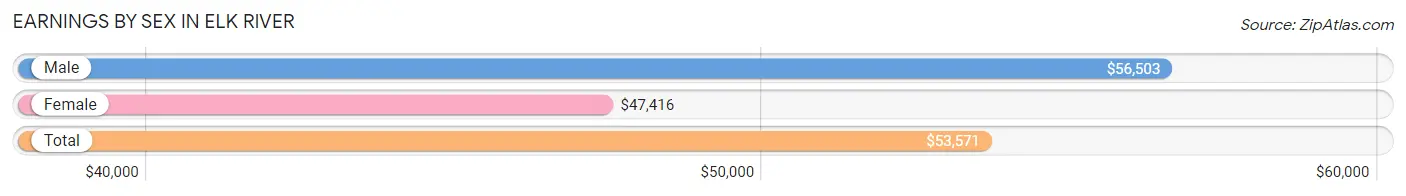
| Sex | Number | Average Earnings |
| Male | 8,336 (54.7%) | $56,503 |
| Female | 6,904 (45.3%) | $47,416 |
| Total | 15,240 (100.0%) | $53,571 |
Earnings by Sex by Income Bracket in Elk River
The most common earnings brackets in Elk River are $100,000+ for men (1,520 | 18.2%) and $75,000 to $99,999 for women (868 | 12.6%).
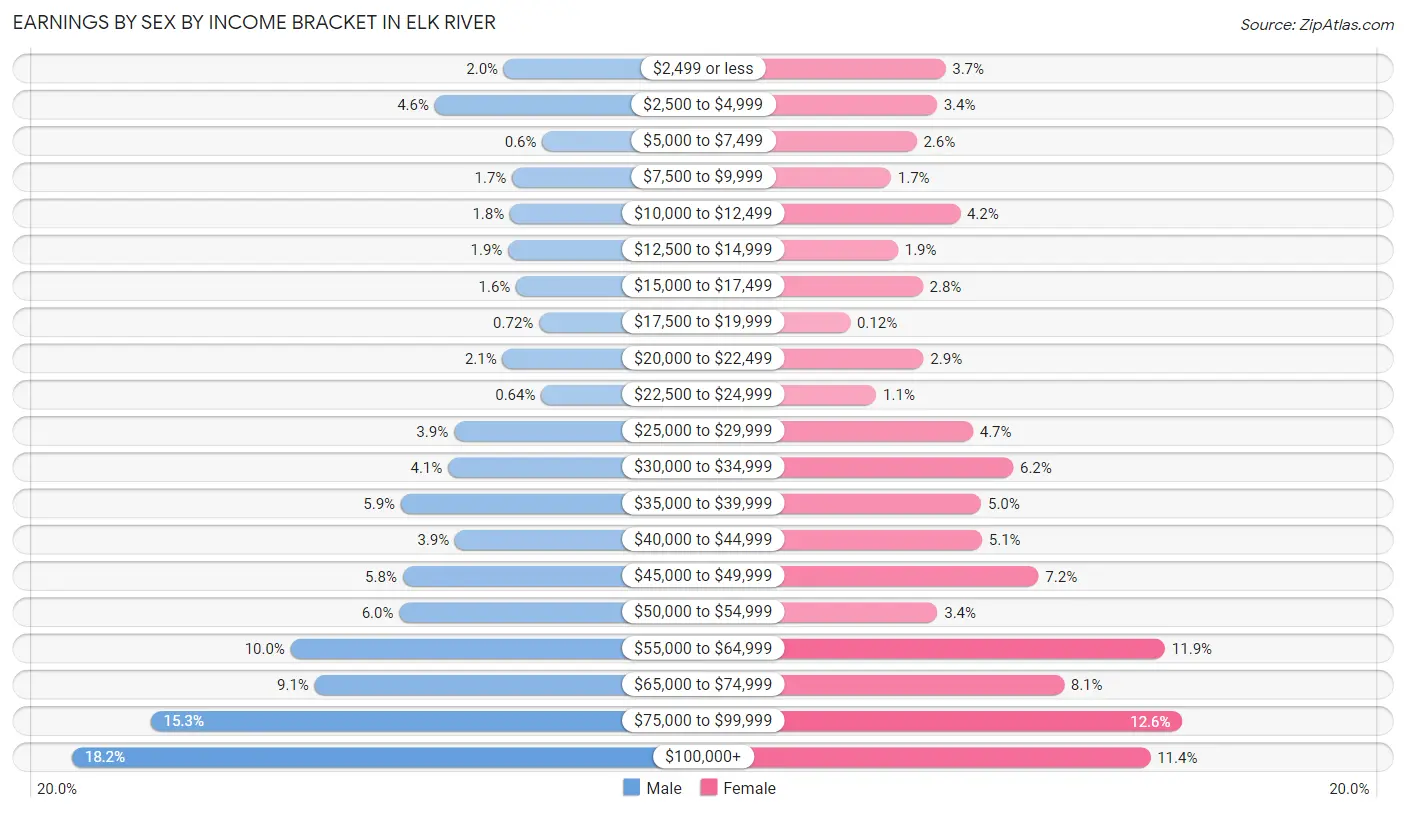
| Income | Male | Female |
| $2,499 or less | 170 (2.0%) | 255 (3.7%) |
| $2,500 to $4,999 | 386 (4.6%) | 233 (3.4%) |
| $5,000 to $7,499 | 50 (0.6%) | 180 (2.6%) |
| $7,500 to $9,999 | 144 (1.7%) | 114 (1.7%) |
| $10,000 to $12,499 | 151 (1.8%) | 293 (4.2%) |
| $12,500 to $14,999 | 157 (1.9%) | 132 (1.9%) |
| $15,000 to $17,499 | 132 (1.6%) | 196 (2.8%) |
| $17,500 to $19,999 | 60 (0.7%) | 8 (0.1%) |
| $20,000 to $22,499 | 174 (2.1%) | 198 (2.9%) |
| $22,500 to $24,999 | 53 (0.6%) | 76 (1.1%) |
| $25,000 to $29,999 | 326 (3.9%) | 326 (4.7%) |
| $30,000 to $34,999 | 344 (4.1%) | 430 (6.2%) |
| $35,000 to $39,999 | 492 (5.9%) | 347 (5.0%) |
| $40,000 to $44,999 | 323 (3.9%) | 349 (5.1%) |
| $45,000 to $49,999 | 486 (5.8%) | 496 (7.2%) |
| $50,000 to $54,999 | 497 (6.0%) | 234 (3.4%) |
| $55,000 to $64,999 | 836 (10.0%) | 823 (11.9%) |
| $65,000 to $74,999 | 761 (9.1%) | 561 (8.1%) |
| $75,000 to $99,999 | 1,274 (15.3%) | 868 (12.6%) |
| $100,000+ | 1,520 (18.2%) | 785 (11.4%) |
| Total | 8,336 (100.0%) | 6,904 (100.0%) |
Earnings by Sex by Educational Attainment in Elk River
Average earnings in Elk River are $61,561 for men and $54,706 for women, a difference of 11.1%. Men with an educational attainment of bachelor's degree enjoy the highest average annual earnings of $92,069, while those with high school diploma education earn the least with $49,180. Women with an educational attainment of graduate degree earn the most with the average annual earnings of $80,357, while those with high school diploma education have the smallest earnings of $37,610.
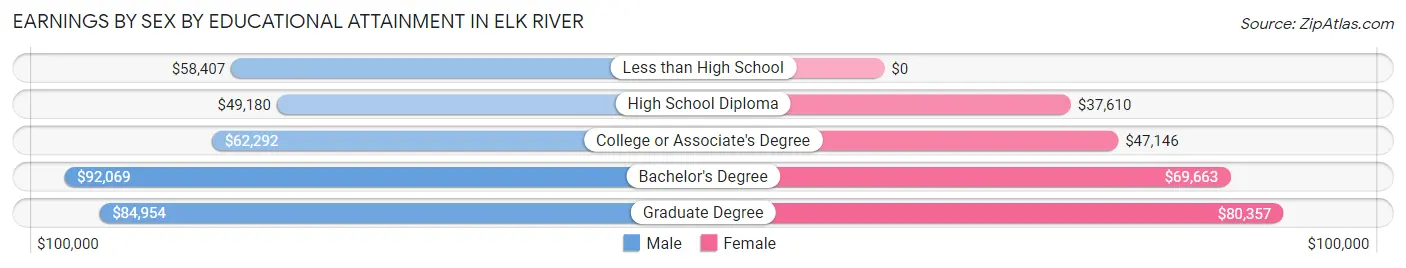
| Educational Attainment | Male Income | Female Income |
| Less than High School | $58,407 | $0 |
| High School Diploma | $49,180 | $37,610 |
| College or Associate's Degree | $62,292 | $47,146 |
| Bachelor's Degree | $92,069 | $69,663 |
| Graduate Degree | $84,954 | $80,357 |
| Total | $61,561 | $54,706 |
Family Income in Elk River
Family Income Brackets in Elk River
According to the Elk River family income data, there are 1,757 families falling into the $100,000 to $149,999 income range, which is the most common income bracket and makes up 27.7% of all families. Conversely, the $15,000 to $24,999 income bracket is the least frequent group with only 63 families (1.0%) belonging to this category.
| Income Bracket | # Families | % Families |
| Less than $10,000 | 70 | 1.1% |
| $10,000 to $14,999 | 127 | 2.0% |
| $15,000 to $24,999 | 63 | 1.0% |
| $25,000 to $34,999 | 82 | 1.3% |
| $35,000 to $49,999 | 330 | 5.2% |
| $50,000 to $74,999 | 1,104 | 17.4% |
| $75,000 to $99,999 | 812 | 12.8% |
| $100,000 to $149,999 | 1,757 | 27.7% |
| $150,000 to $199,999 | 1,237 | 19.5% |
| $200,000+ | 768 | 12.1% |
Family Income by Famaliy Size in Elk River
6-person families (150 | 2.4%) account for the highest median family income in Elk River with $195,547 per family, while 2-person families (2,591 | 40.8%) have the highest median income of $46,544 per family member.
| Income Bracket | # Families | Median Income |
| 2-Person Families | 2,591 (40.8%) | $93,087 |
| 3-Person Families | 1,327 (20.9%) | $127,361 |
| 4-Person Families | 1,621 (25.6%) | $127,697 |
| 5-Person Families | 516 (8.1%) | $140,183 |
| 6-Person Families | 150 (2.4%) | $195,547 |
| 7+ Person Families | 138 (2.2%) | $108,810 |
| Total | 6,343 (100.0%) | $115,089 |
Family Income by Number of Earners in Elk River
The median family income in Elk River is $115,089, with families comprising 3+ earners (1,079) having the highest median family income of $166,250, while families with no earners (647) have the lowest median family income of $70,052, accounting for 17.0% and 10.2% of families, respectively.
| Number of Earners | # Families | Median Income |
| No Earners | 647 (10.2%) | $70,052 |
| 1 Earner | 1,739 (27.4%) | $71,376 |
| 2 Earners | 2,878 (45.4%) | $136,296 |
| 3+ Earners | 1,079 (17.0%) | $166,250 |
| Total | 6,343 (100.0%) | $115,089 |
Household Income in Elk River
Household Income Brackets in Elk River
With 2,202 households falling in the category, the $100,000 to $149,999 income range is the most frequent in Elk River, accounting for 23.3% of all households. In contrast, only 38 households (0.4%) fall into the $10,000 to $14,999 income bracket, making it the least populous group.
| Income Bracket | # Households | % Households |
| Less than $10,000 | 274 | 2.9% |
| $10,000 to $14,999 | 38 | 0.4% |
| $15,000 to $24,999 | 482 | 5.1% |
| $25,000 to $34,999 | 397 | 4.2% |
| $35,000 to $49,999 | 832 | 8.8% |
| $50,000 to $74,999 | 1,672 | 17.7% |
| $75,000 to $99,999 | 1,124 | 11.9% |
| $100,000 to $149,999 | 2,202 | 23.3% |
| $150,000 to $199,999 | 1,493 | 15.8% |
| $200,000+ | 926 | 9.8% |
Household Income by Householder Age in Elk River
The median household income in Elk River is $95,597, with the highest median household income of $138,988 found in the 45 to 64 years age bracket for the primary householder. A total of 3,085 households (32.7%) fall into this category. Meanwhile, the 15 to 24 years age bracket for the primary householder has the lowest median household income of $0, with 216 households (2.3%) in this group.
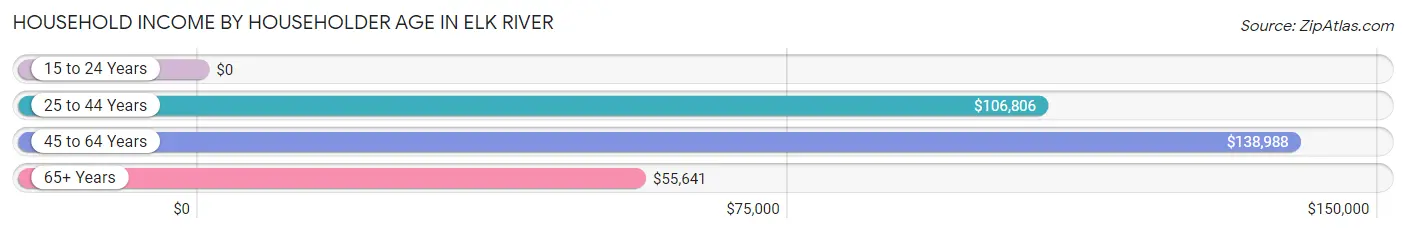
| Income Bracket | # Households | Median Income |
| 15 to 24 Years | 216 (2.3%) | $0 |
| 25 to 44 Years | 3,884 (41.1%) | $106,806 |
| 45 to 64 Years | 3,085 (32.7%) | $138,988 |
| 65+ Years | 2,264 (24.0%) | $55,641 |
| Total | 9,449 (100.0%) | $95,597 |
Poverty in Elk River
Income Below Poverty by Sex and Age in Elk River
With 3.2% poverty level for males and 6.4% for females among the residents of Elk River, 15 year old males and 18 to 24 year old females are the most vulnerable to poverty, with 39 males (19.2%) and 192 females (23.4%) in their respective age groups living below the poverty level.
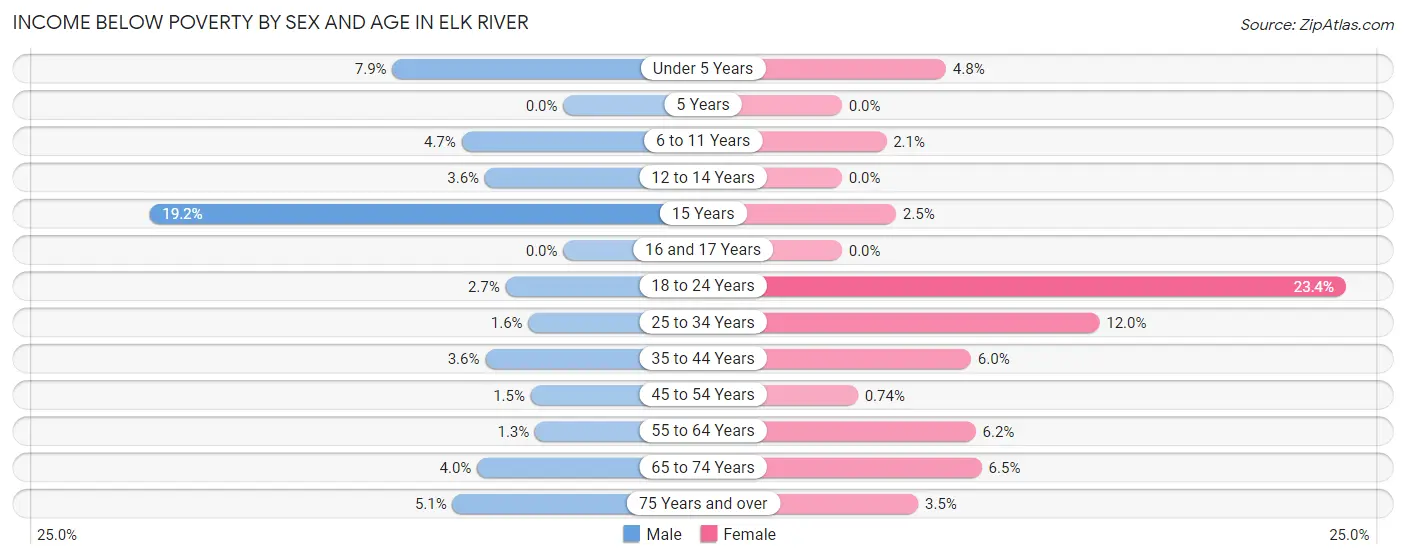
| Age Bracket | Male | Female |
| Under 5 Years | 60 (7.9%) | 45 (4.8%) |
| 5 Years | 0 (0.0%) | 0 (0.0%) |
| 6 to 11 Years | 50 (4.7%) | 17 (2.1%) |
| 12 to 14 Years | 19 (3.6%) | 0 (0.0%) |
| 15 Years | 39 (19.2%) | 6 (2.5%) |
| 16 and 17 Years | 0 (0.0%) | 0 (0.0%) |
| 18 to 24 Years | 27 (2.7%) | 192 (23.4%) |
| 25 to 34 Years | 40 (1.6%) | 232 (11.9%) |
| 35 to 44 Years | 64 (3.6%) | 114 (6.0%) |
| 45 to 54 Years | 22 (1.5%) | 11 (0.7%) |
| 55 to 64 Years | 19 (1.3%) | 94 (6.2%) |
| 65 to 74 Years | 35 (4.0%) | 72 (6.5%) |
| 75 Years and over | 34 (5.1%) | 24 (3.5%) |
| Total | 409 (3.2%) | 807 (6.4%) |
Income Above Poverty by Sex and Age in Elk River
According to the poverty statistics in Elk River, males aged 5 years and females aged 5 years are the age groups that are most secure financially, with 100.0% of males and 100.0% of females in these age groups living above the poverty line.
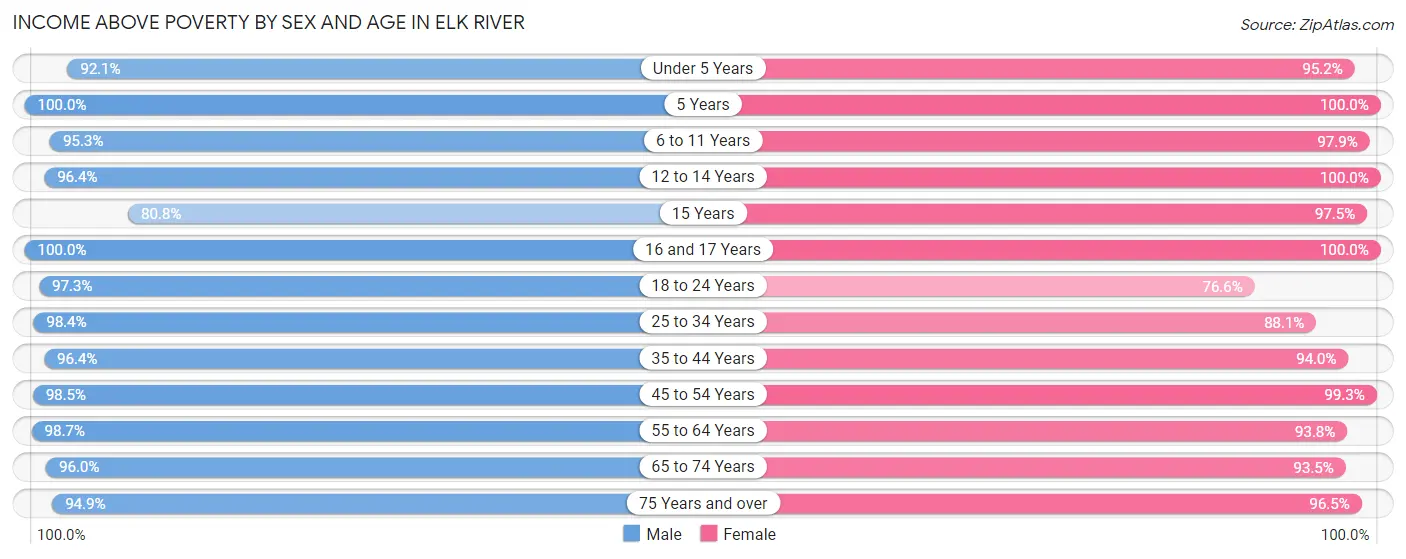
| Age Bracket | Male | Female |
| Under 5 Years | 697 (92.1%) | 886 (95.2%) |
| 5 Years | 137 (100.0%) | 223 (100.0%) |
| 6 to 11 Years | 1,009 (95.3%) | 809 (97.9%) |
| 12 to 14 Years | 503 (96.4%) | 536 (100.0%) |
| 15 Years | 164 (80.8%) | 233 (97.5%) |
| 16 and 17 Years | 307 (100.0%) | 363 (100.0%) |
| 18 to 24 Years | 982 (97.3%) | 629 (76.6%) |
| 25 to 34 Years | 2,434 (98.4%) | 1,710 (88.0%) |
| 35 to 44 Years | 1,702 (96.4%) | 1,788 (94.0%) |
| 45 to 54 Years | 1,436 (98.5%) | 1,476 (99.3%) |
| 55 to 64 Years | 1,436 (98.7%) | 1,419 (93.8%) |
| 65 to 74 Years | 840 (96.0%) | 1,037 (93.5%) |
| 75 Years and over | 627 (94.9%) | 654 (96.5%) |
| Total | 12,274 (96.8%) | 11,763 (93.6%) |
Income Below Poverty Among Married-Couple Families in Elk River
The poverty statistics for married-couple families in Elk River show that 1.2% or 56 of the total 4,829 families live below the poverty line. Families with 5 or more children have the highest poverty rate of 57.1%, comprising of 8 families. On the other hand, families with 1 or 2 children have the lowest poverty rate of 0.0%, which includes 0 families.
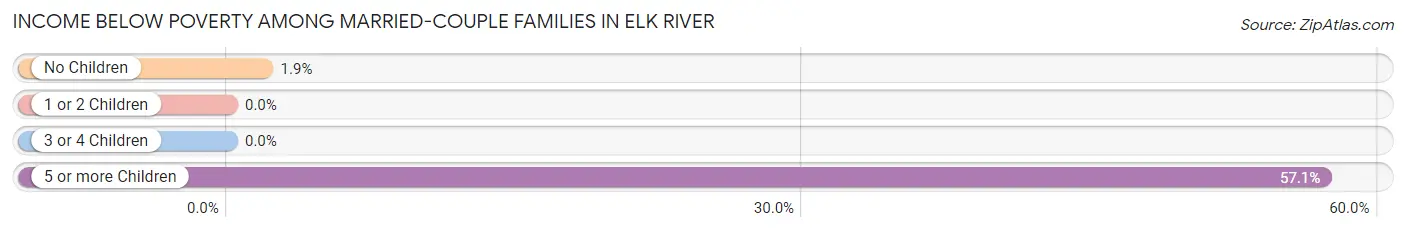
| Children | Above Poverty | Below Poverty |
| No Children | 2,535 (98.1%) | 48 (1.9%) |
| 1 or 2 Children | 1,688 (100.0%) | 0 (0.0%) |
| 3 or 4 Children | 544 (100.0%) | 0 (0.0%) |
| 5 or more Children | 6 (42.9%) | 8 (57.1%) |
| Total | 4,773 (98.8%) | 56 (1.2%) |
Income Below Poverty Among Single-Parent Households in Elk River
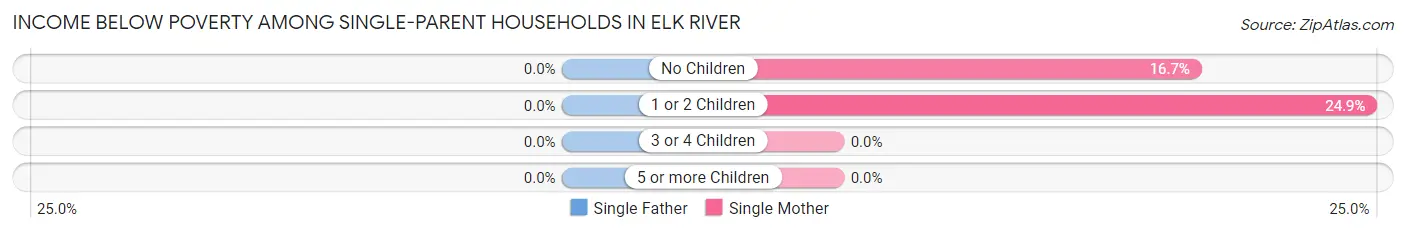
| Children | Single Father | Single Mother |
| No Children | 0 (0.0%) | 49 (16.7%) |
| 1 or 2 Children | 0 (0.0%) | 126 (24.8%) |
| 3 or 4 Children | 0 (0.0%) | 0 (0.0%) |
| 5 or more Children | 0 (0.0%) | 0 (0.0%) |
| Total | 0 (0.0%) | 175 (17.9%) |
Income Below Poverty Among Married-Couple vs Single-Parent Households in Elk River
The poverty data for Elk River shows that 56 of the married-couple family households (1.2%) and 175 of the single-parent households (11.6%) are living below the poverty level. Within the married-couple family households, those with 5 or more children have the highest poverty rate, with 8 households (57.1%) falling below the poverty line. Among the single-parent households, those with 1 or 2 children have the highest poverty rate, with 126 household (13.9%) living below poverty.
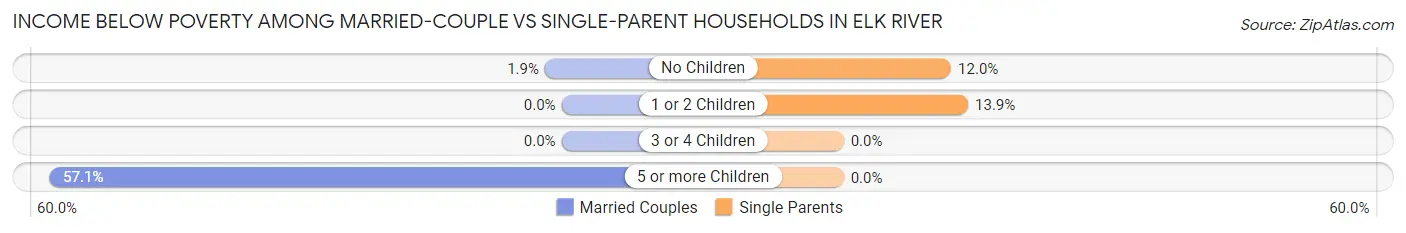
| Children | Married-Couple Families | Single-Parent Households |
| No Children | 48 (1.9%) | 49 (12.0%) |
| 1 or 2 Children | 0 (0.0%) | 126 (13.9%) |
| 3 or 4 Children | 0 (0.0%) | 0 (0.0%) |
| 5 or more Children | 8 (57.1%) | 0 (0.0%) |
| Total | 56 (1.2%) | 175 (11.6%) |
Race in Elk River
The most populous races in Elk River are White / Caucasian (22,448 | 86.6%), Two or more Races (1,533 | 5.9%), and Black / African American (1,012 | 3.9%).
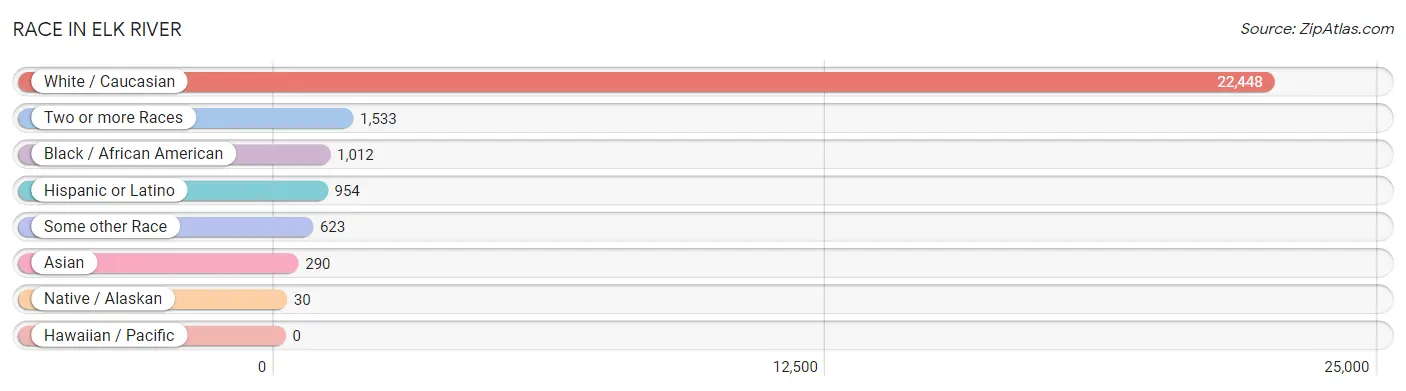
| Race | # Population | % Population |
| Asian | 290 | 1.1% |
| Black / African American | 1,012 | 3.9% |
| Hawaiian / Pacific | 0 | 0.0% |
| Hispanic or Latino | 954 | 3.7% |
| Native / Alaskan | 30 | 0.1% |
| White / Caucasian | 22,448 | 86.6% |
| Two or more Races | 1,533 | 5.9% |
| Some other Race | 623 | 2.4% |
| Total | 25,936 | 100.0% |
Ancestry in Elk River
The most populous ancestries reported in Elk River are German (8,388 | 32.3%), Norwegian (3,692 | 14.2%), Irish (2,429 | 9.4%), English (2,208 | 8.5%), and American (1,687 | 6.5%), together accounting for 71.0% of all Elk River residents.
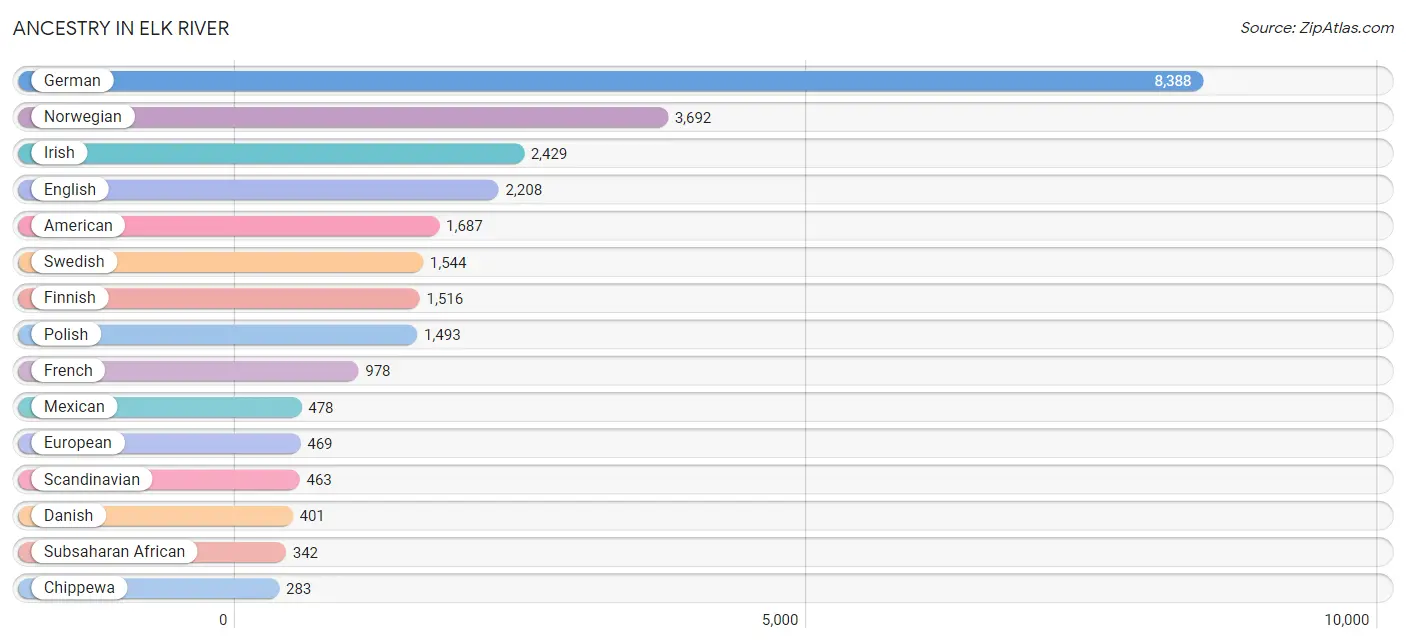
| Ancestry | # Population | % Population |
| African | 20 | 0.1% |
| American | 1,687 | 6.5% |
| Arab | 58 | 0.2% |
| Austrian | 27 | 0.1% |
| Bangladeshi | 94 | 0.4% |
| Belgian | 30 | 0.1% |
| Bhutanese | 42 | 0.2% |
| Bolivian | 7 | 0.0% |
| Brazilian | 7 | 0.0% |
| British | 167 | 0.6% |
| Burmese | 83 | 0.3% |
| Canadian | 1 | 0.0% |
| Central American | 117 | 0.4% |
| Cherokee | 7 | 0.0% |
| Chippewa | 283 | 1.1% |
| Croatian | 21 | 0.1% |
| Czech | 214 | 0.8% |
| Czechoslovakian | 27 | 0.1% |
| Danish | 401 | 1.5% |
| Dutch | 271 | 1.0% |
| English | 2,208 | 8.5% |
| European | 469 | 1.8% |
| Finnish | 1,516 | 5.9% |
| French | 978 | 3.8% |
| French Canadian | 278 | 1.1% |
| German | 8,388 | 32.3% |
| German Russian | 24 | 0.1% |
| Greek | 3 | 0.0% |
| Guatemalan | 46 | 0.2% |
| Hungarian | 83 | 0.3% |
| Indian (Asian) | 44 | 0.2% |
| Iraqi | 52 | 0.2% |
| Irish | 2,429 | 9.4% |
| Italian | 222 | 0.9% |
| Korean | 72 | 0.3% |
| Liberian | 6 | 0.0% |
| Malaysian | 77 | 0.3% |
| Mexican | 478 | 1.8% |
| Native Hawaiian | 26 | 0.1% |
| Nigerian | 7 | 0.0% |
| Northern European | 35 | 0.1% |
| Norwegian | 3,692 | 14.2% |
| Peruvian | 110 | 0.4% |
| Polish | 1,493 | 5.8% |
| Portuguese | 26 | 0.1% |
| Puerto Rican | 135 | 0.5% |
| Romanian | 16 | 0.1% |
| Russian | 229 | 0.9% |
| Salvadoran | 71 | 0.3% |
| Scandinavian | 463 | 1.8% |
| Scotch-Irish | 43 | 0.2% |
| Scottish | 194 | 0.7% |
| Sierra Leonean | 131 | 0.5% |
| Sioux | 16 | 0.1% |
| Slovak | 9 | 0.0% |
| Somali | 33 | 0.1% |
| South American | 117 | 0.4% |
| Spanish | 37 | 0.1% |
| Sri Lankan | 45 | 0.2% |
| Subsaharan African | 342 | 1.3% |
| Sudanese | 11 | 0.0% |
| Swedish | 1,544 | 5.9% |
| Swiss | 15 | 0.1% |
| Thai | 3 | 0.0% |
| Ukrainian | 108 | 0.4% |
| Welsh | 130 | 0.5% |
| Yugoslavian | 8 | 0.0% | View All 67 Rows |
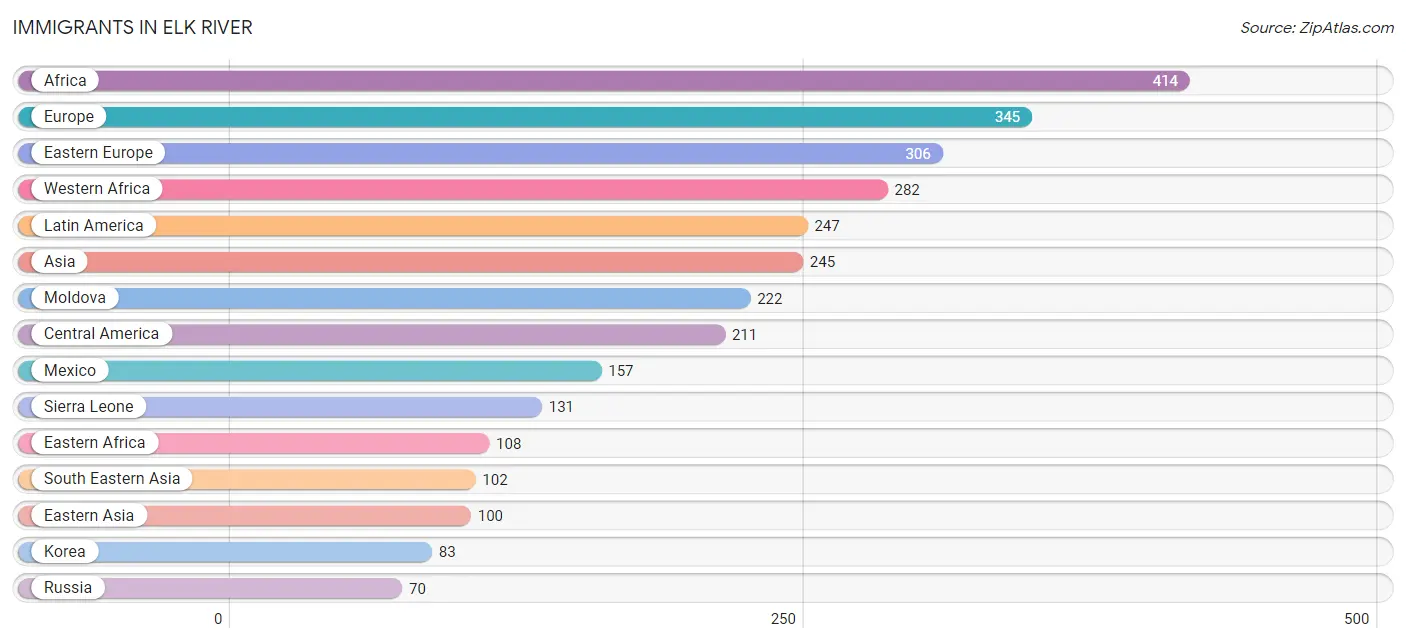
Immigrants in Elk River
The most numerous immigrant groups reported in Elk River came from Africa (414 | 1.6%), Europe (345 | 1.3%), Eastern Europe (306 | 1.2%), Western Africa (282 | 1.1%), and Latin America (247 | 0.9%), together accounting for 6.1% of all Elk River residents.
| Immigration Origin | # Population | % Population |
| Africa | 414 | 1.6% |
| Asia | 245 | 0.9% |
| Bolivia | 7 | 0.0% |
| Canada | 30 | 0.1% |
| Central America | 211 | 0.8% |
| China | 17 | 0.1% |
| Colombia | 1 | 0.0% |
| Eastern Africa | 108 | 0.4% |
| Eastern Asia | 100 | 0.4% |
| Eastern Europe | 306 | 1.2% |
| El Salvador | 9 | 0.0% |
| England | 6 | 0.0% |
| Europe | 345 | 1.3% |
| Germany | 10 | 0.0% |
| Guatemala | 39 | 0.2% |
| Honduras | 6 | 0.0% |
| India | 3 | 0.0% |
| Iraq | 6 | 0.0% |
| Kenya | 32 | 0.1% |
| Korea | 83 | 0.3% |
| Laos | 26 | 0.1% |
| Latin America | 247 | 0.9% |
| Liberia | 13 | 0.1% |
| Mexico | 157 | 0.6% |
| Moldova | 222 | 0.9% |
| Nigeria | 4 | 0.0% |
| Northern Africa | 24 | 0.1% |
| Northern Europe | 29 | 0.1% |
| Peru | 28 | 0.1% |
| Philippines | 31 | 0.1% |
| Russia | 70 | 0.3% |
| Sierra Leone | 131 | 0.5% |
| Somalia | 27 | 0.1% |
| South America | 36 | 0.1% |
| South Central Asia | 37 | 0.1% |
| South Eastern Asia | 102 | 0.4% |
| Sri Lanka | 34 | 0.1% |
| Sudan | 24 | 0.1% |
| Thailand | 27 | 0.1% |
| Ukraine | 14 | 0.1% |
| Vietnam | 18 | 0.1% |
| Western Africa | 282 | 1.1% |
| Western Asia | 6 | 0.0% |
| Western Europe | 10 | 0.0% | View All 44 Rows |
Sex and Age in Elk River
Sex and Age in Elk River
The most populous age groups in Elk River are 25 to 29 Years (1,489 | 11.3%) for men and 35 to 39 Years (1,176 | 9.2%) for women.
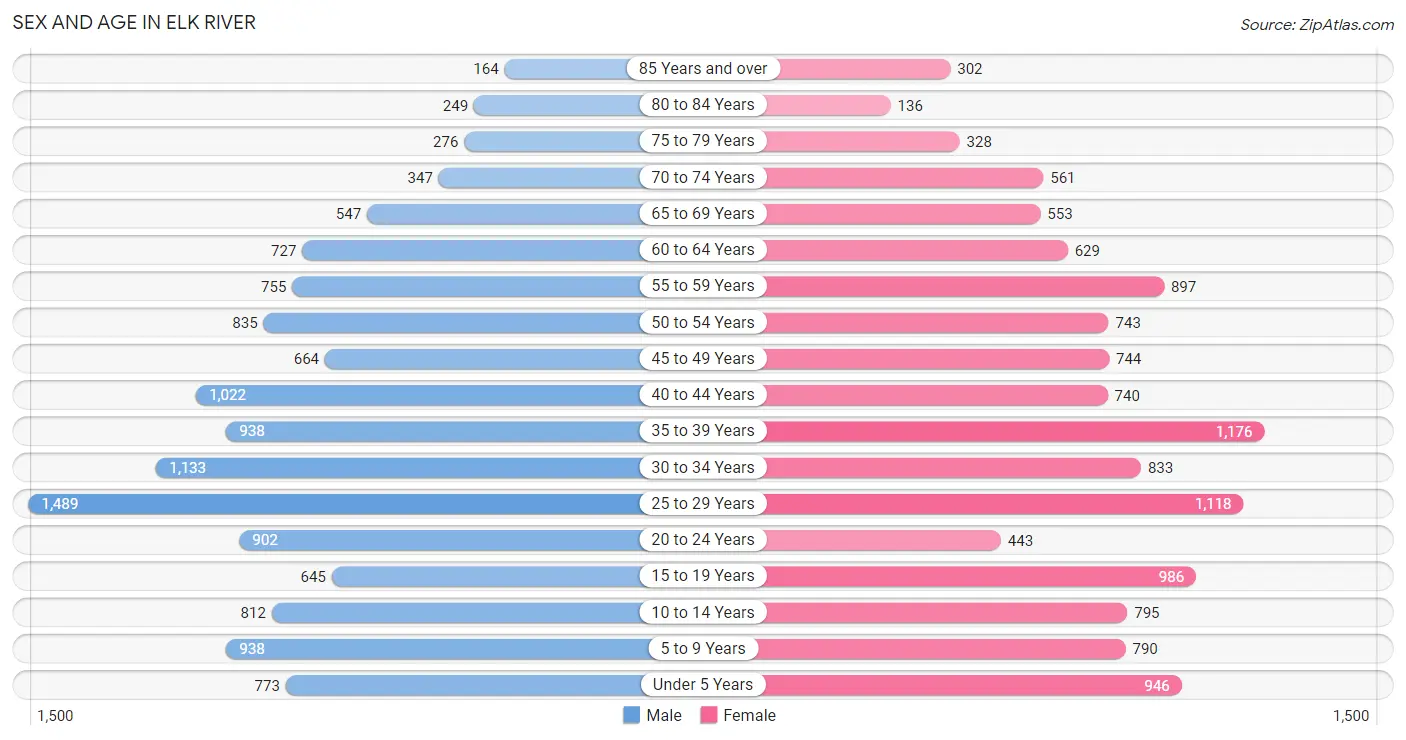
| Age Bracket | Male | Female |
| Under 5 Years | 773 (5.9%) | 946 (7.4%) |
| 5 to 9 Years | 938 (7.1%) | 790 (6.2%) |
| 10 to 14 Years | 812 (6.1%) | 795 (6.2%) |
| 15 to 19 Years | 645 (4.9%) | 986 (7.7%) |
| 20 to 24 Years | 902 (6.8%) | 443 (3.5%) |
| 25 to 29 Years | 1,489 (11.3%) | 1,118 (8.8%) |
| 30 to 34 Years | 1,133 (8.6%) | 833 (6.6%) |
| 35 to 39 Years | 938 (7.1%) | 1,176 (9.2%) |
| 40 to 44 Years | 1,022 (7.7%) | 740 (5.8%) |
| 45 to 49 Years | 664 (5.0%) | 744 (5.9%) |
| 50 to 54 Years | 835 (6.3%) | 743 (5.8%) |
| 55 to 59 Years | 755 (5.7%) | 897 (7.0%) |
| 60 to 64 Years | 727 (5.5%) | 629 (4.9%) |
| 65 to 69 Years | 547 (4.1%) | 553 (4.3%) |
| 70 to 74 Years | 347 (2.6%) | 561 (4.4%) |
| 75 to 79 Years | 276 (2.1%) | 328 (2.6%) |
| 80 to 84 Years | 249 (1.9%) | 136 (1.1%) |
| 85 Years and over | 164 (1.2%) | 302 (2.4%) |
| Total | 13,216 (100.0%) | 12,720 (100.0%) |
Families and Households in Elk River
Median Family Size in Elk River
The median family size in Elk River is 3.19 persons per family, with married-couple families (4,829 | 76.1%) accounting for the largest median family size of 3.32 persons per family. On the other hand, single female/mother families (980 | 15.4%) represent the smallest median family size with 2.67 persons per family.
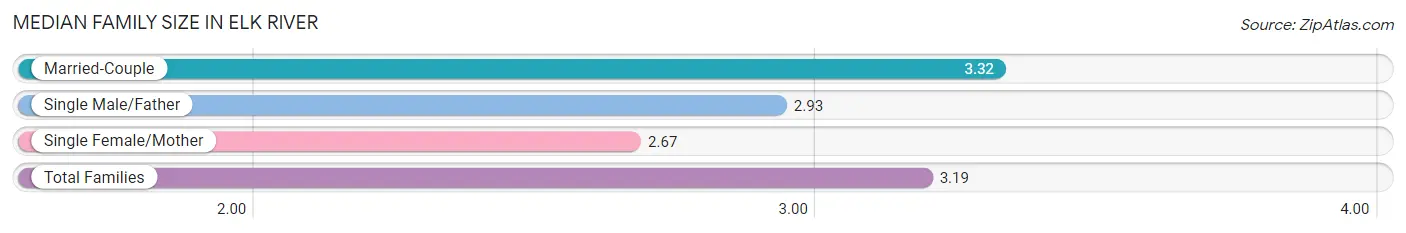
| Family Type | # Families | Family Size |
| Married-Couple | 4,829 (76.1%) | 3.32 |
| Single Male/Father | 534 (8.4%) | 2.93 |
| Single Female/Mother | 980 (15.4%) | 2.67 |
| Total Families | 6,343 (100.0%) | 3.19 |
Median Household Size in Elk River
The median household size in Elk River is 2.67 persons per household, with married-couple households (4,829 | 51.1%) accounting for the largest median household size of 3.35 persons per household. non-family households (3,106 | 32.9%) represent the smallest median household size with 1.35 persons per household.
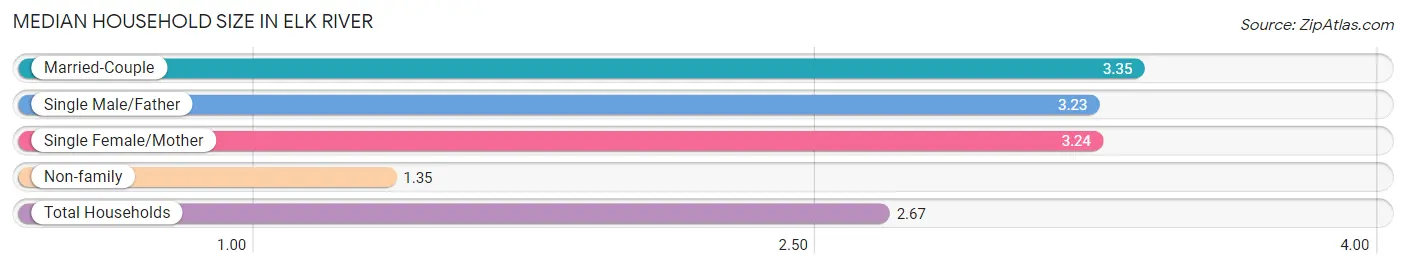
| Household Type | # Households | Household Size |
| Married-Couple | 4,829 (51.1%) | 3.35 |
| Single Male/Father | 534 (5.7%) | 3.23 |
| Single Female/Mother | 980 (10.4%) | 3.24 |
| Non-family | 3,106 (32.9%) | 1.35 |
| Total Households | 9,449 (100.0%) | 2.67 |
Household Size by Marriage Status in Elk River
Out of a total of 9,449 households in Elk River, 6,343 (67.1%) are family households, while 3,106 (32.9%) are nonfamily households. The most numerous type of family households are 2-person households, comprising 2,222, and the most common type of nonfamily households are 1-person households, comprising 2,325.
| Household Size | Family Households | Nonfamily Households |
| 1-Person Households | - | 2,325 (24.6%) |
| 2-Person Households | 2,222 (23.5%) | 613 (6.5%) |
| 3-Person Households | 1,394 (14.7%) | 143 (1.5%) |
| 4-Person Households | 1,877 (19.9%) | 12 (0.1%) |
| 5-Person Households | 520 (5.5%) | 13 (0.1%) |
| 6-Person Households | 139 (1.5%) | 0 (0.0%) |
| 7+ Person Households | 191 (2.0%) | 0 (0.0%) |
| Total | 6,343 (67.1%) | 3,106 (32.9%) |
Female Fertility in Elk River
Fertility by Age in Elk River
Average fertility rate in Elk River is 64.0 births per 1,000 women. Women in the age bracket of 20 to 34 years have the highest fertility rate with 140.0 births per 1,000 women. Women in the age bracket of 20 to 34 years acount for 82.7% of all women with births.
| Age Bracket | Women with Births | Births / 1,000 Women |
| 15 to 19 years | 0 (0.0%) | 0.0 |
| 20 to 34 years | 334 (82.7%) | 140.0 |
| 35 to 50 years | 70 (17.3%) | 24.0 |
| Total | 404 (100.0%) | 64.0 |
Fertility by Age by Marriage Status in Elk River
64.1% of women with births (404) in Elk River are married. The highest percentage of unmarried women with births falls into 20 to 34 years age bracket with 43.4% of them unmarried at the time of birth, while the lowest percentage of unmarried women with births belong to 35 to 50 years age bracket with 0.0% of them unmarried.
| Age Bracket | Married | Unmarried |
| 15 to 19 years | 0 (0.0%) | 0 (0.0%) |
| 20 to 34 years | 189 (56.6%) | 145 (43.4%) |
| 35 to 50 years | 70 (100.0%) | 0 (0.0%) |
| Total | 259 (64.1%) | 145 (35.9%) |
Fertility by Education in Elk River
Average fertility rate in Elk River is 64.0 births per 1,000 women. Women with the education attainment of bachelor's degree have the highest fertility rate of 80.0 births per 1,000 women, while women with the education attainment of graduate degree have the lowest fertility at 48.0 births per 1,000 women. Women with the education attainment of college or associate's degree represent 33.4% of all women with births.
| Educational Attainment | Women with Births | Births / 1,000 Women |
| Less than High School | 57 (14.1%) | 63.0 |
| High School Diploma | 83 (20.5%) | 73.0 |
| College or Associate's Degree | 135 (33.4%) | 55.0 |
| Bachelor's Degree | 107 (26.5%) | 80.0 |
| Graduate Degree | 22 (5.4%) | 48.0 |
| Total | 404 (100.0%) | 64.0 |
Fertility by Education by Marriage Status in Elk River
35.9% of women with births in Elk River are unmarried. Women with the educational attainment of high school diploma are most likely to be married with 100.0% of them married at childbirth, while women with the educational attainment of less than high school are least likely to be married with 100.0% of them unmarried at childbirth.
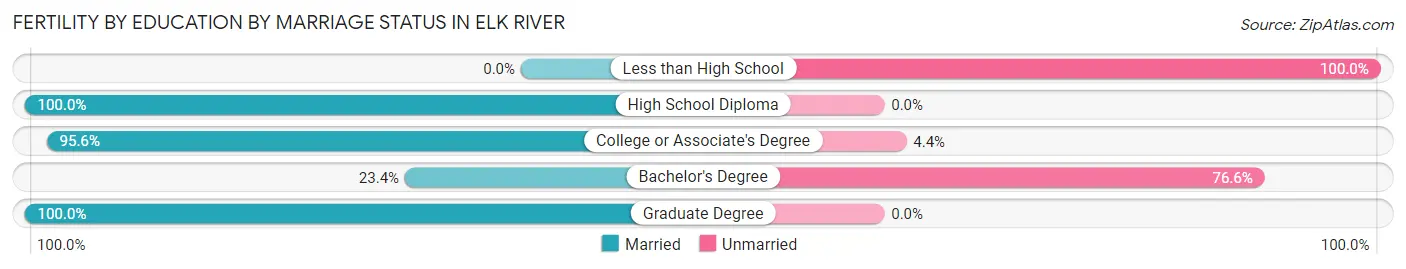
| Educational Attainment | Married | Unmarried |
| Less than High School | 0 (0.0%) | 57 (100.0%) |
| High School Diploma | 83 (100.0%) | 0 (0.0%) |
| College or Associate's Degree | 129 (95.6%) | 6 (4.4%) |
| Bachelor's Degree | 25 (23.4%) | 82 (76.6%) |
| Graduate Degree | 22 (100.0%) | 0 (0.0%) |
| Total | 259 (64.1%) | 145 (35.9%) |
Employment Characteristics in Elk River
Employment by Class of Employer in Elk River
Among the 14,096 employed individuals in Elk River, private company employees (10,482 | 74.4%), local government employees (1,273 | 9.0%), and not-for-profit organizations (886 | 6.3%) make up the most common classes of employment.
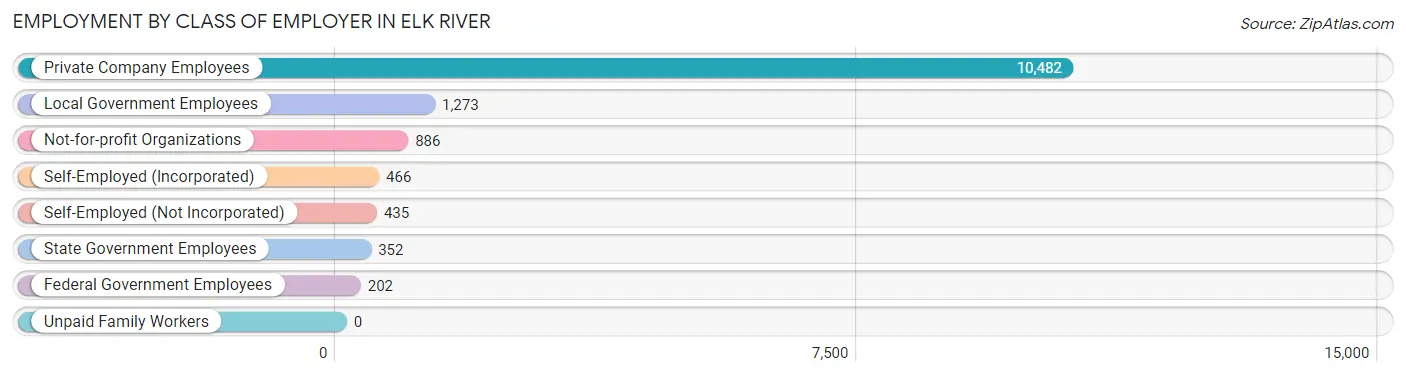
| Employer Class | # Employees | % Employees |
| Private Company Employees | 10,482 | 74.4% |
| Self-Employed (Incorporated) | 466 | 3.3% |
| Self-Employed (Not Incorporated) | 435 | 3.1% |
| Not-for-profit Organizations | 886 | 6.3% |
| Local Government Employees | 1,273 | 9.0% |
| State Government Employees | 352 | 2.5% |
| Federal Government Employees | 202 | 1.4% |
| Unpaid Family Workers | 0 | 0.0% |
| Total | 14,096 | 100.0% |
Employment Status by Age in Elk River
According to the labor force statistics for Elk River, out of the total population over 16 years of age (20,440), 72.1% or 14,737 individuals are in the labor force, with 2.0% or 295 of them unemployed. The age group with the highest labor force participation rate is 45 to 54 years, with 92.6% or 2,765 individuals in the labor force. Within the labor force, the 20 to 24 years age range has the highest percentage of unemployed individuals, with 4.4% or 53 of them being unemployed.
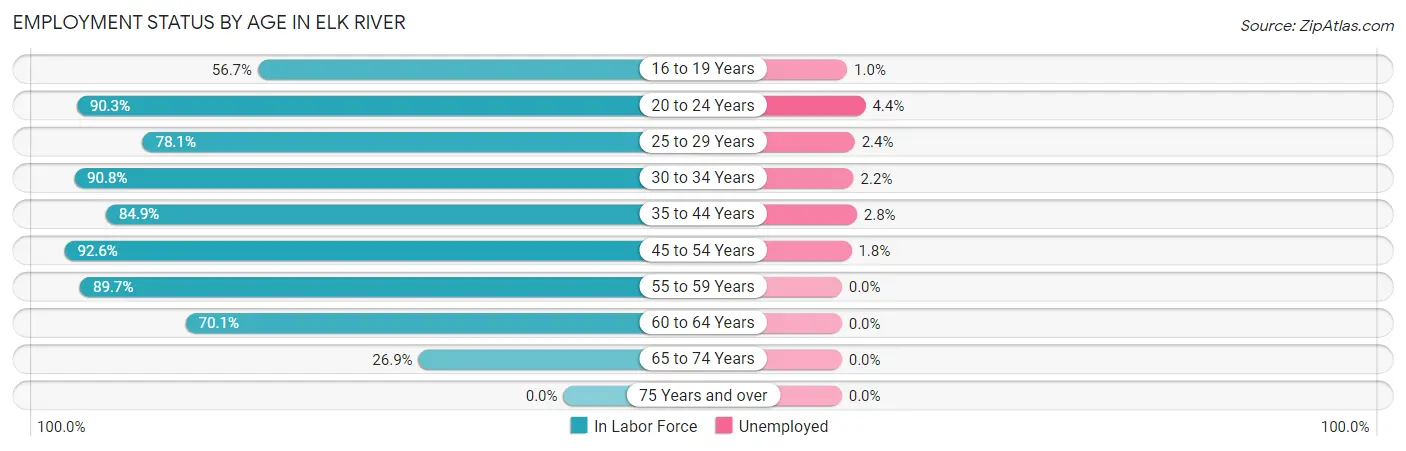
| Age Bracket | In Labor Force | Unemployed |
| 16 to 19 Years | 674 (56.7%) | 7 (1.0%) |
| 20 to 24 Years | 1,215 (90.3%) | 53 (4.4%) |
| 25 to 29 Years | 2,036 (78.1%) | 49 (2.4%) |
| 30 to 34 Years | 1,785 (90.8%) | 39 (2.2%) |
| 35 to 44 Years | 3,291 (84.9%) | 92 (2.8%) |
| 45 to 54 Years | 2,765 (92.6%) | 50 (1.8%) |
| 55 to 59 Years | 1,482 (89.7%) | 0 (0.0%) |
| 60 to 64 Years | 951 (70.1%) | 0 (0.0%) |
| 65 to 74 Years | 540 (26.9%) | 0 (0.0%) |
| 75 Years and over | 0 (0.0%) | 0 (0.0%) |
| Total | 14,737 (72.1%) | 295 (2.0%) |
Employment Status by Educational Attainment in Elk River
According to labor force statistics for Elk River, 85.2% of individuals (12,305) out of the total population between 25 and 64 years of age (14,443) are in the labor force, with 1.9% or 234 of them being unemployed. The group with the highest labor force participation rate are those with the educational attainment of bachelor's degree or higher, with 91.5% or 3,998 individuals in the labor force. Within the labor force, individuals with high school diploma education have the highest percentage of unemployment, with 3.7% or 111 of them being unemployed.

| Educational Attainment | In Labor Force | Unemployed |
| Less than High School | 340 (43.3%) | 0 (0.0%) |
| High School Diploma | 2,995 (79.1%) | 140 (3.7%) |
| College / Associate Degree | 4,979 (90.5%) | 132 (2.4%) |
| Bachelor's Degree or higher | 3,998 (91.5%) | 0 (0.0%) |
| Total | 12,305 (85.2%) | 274 (1.9%) |
Employment Occupations by Sex in Elk River
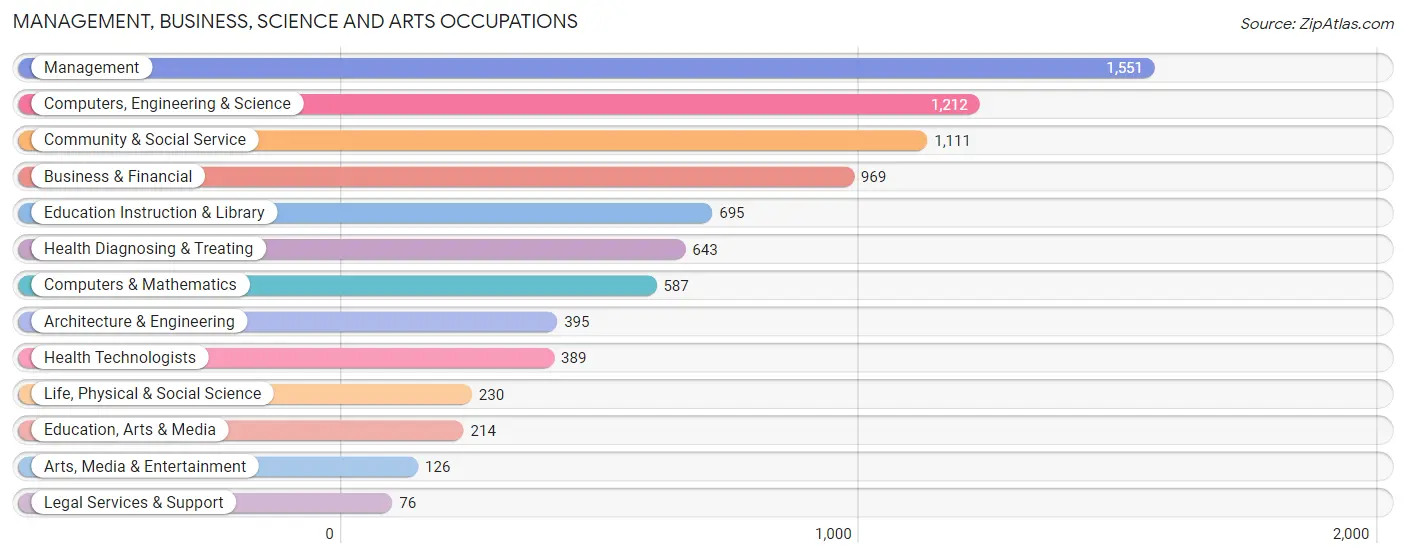
Management, Business, Science and Arts Occupations
The most common Management, Business, Science and Arts occupations in Elk River are Management (1,551 | 10.7%), Computers, Engineering & Science (1,212 | 8.4%), Community & Social Service (1,111 | 7.7%), Business & Financial (969 | 6.7%), and Education Instruction & Library (695 | 4.8%).
Management, Business, Science and Arts Occupations by Sex
Within the Management, Business, Science and Arts occupations in Elk River, the most male-oriented occupations are Architecture & Engineering (82.8%), Life, Physical & Social Science (82.6%), and Computers, Engineering & Science (79.6%), while the most female-oriented occupations are Health Diagnosing & Treating (92.1%), Health Technologists (86.9%), and Education Instruction & Library (84.6%).
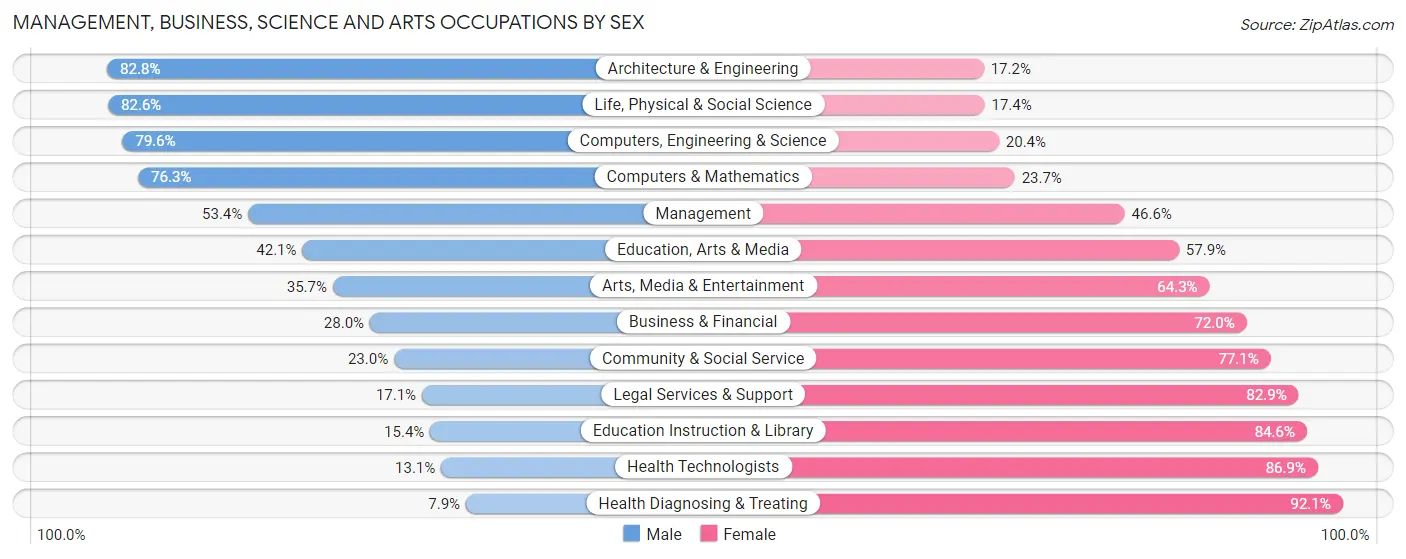
| Occupation | Male | Female |
| Management | 828 (53.4%) | 723 (46.6%) |
| Business & Financial | 271 (28.0%) | 698 (72.0%) |
| Computers, Engineering & Science | 965 (79.6%) | 247 (20.4%) |
| Computers & Mathematics | 448 (76.3%) | 139 (23.7%) |
| Architecture & Engineering | 327 (82.8%) | 68 (17.2%) |
| Life, Physical & Social Science | 190 (82.6%) | 40 (17.4%) |
| Community & Social Service | 255 (23.0%) | 856 (77.0%) |
| Education, Arts & Media | 90 (42.1%) | 124 (57.9%) |
| Legal Services & Support | 13 (17.1%) | 63 (82.9%) |
| Education Instruction & Library | 107 (15.4%) | 588 (84.6%) |
| Arts, Media & Entertainment | 45 (35.7%) | 81 (64.3%) |
| Health Diagnosing & Treating | 51 (7.9%) | 592 (92.1%) |
| Health Technologists | 51 (13.1%) | 338 (86.9%) |
| Total (Category) | 2,370 (43.2%) | 3,116 (56.8%) |
| Total (Overall) | 7,768 (53.8%) | 6,680 (46.2%) |
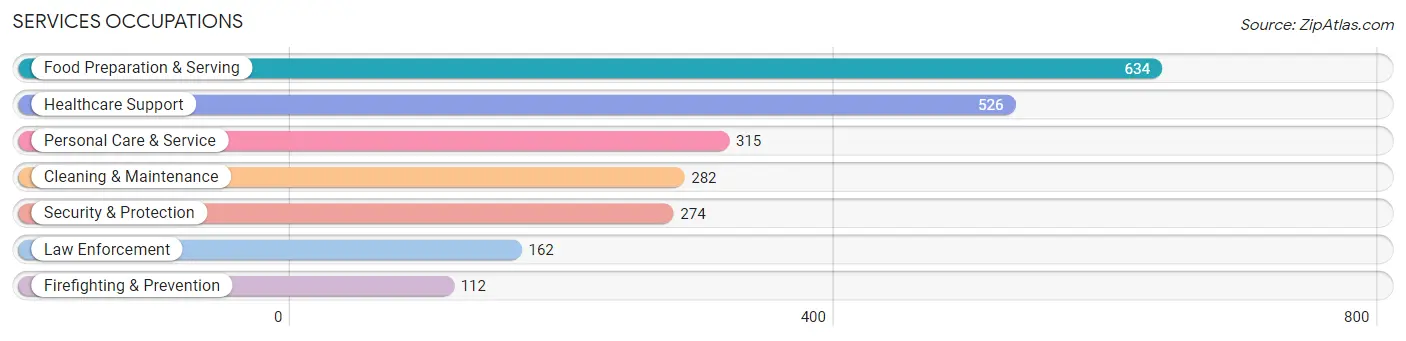
Services Occupations
The most common Services occupations in Elk River are Food Preparation & Serving (634 | 4.4%), Healthcare Support (526 | 3.6%), Personal Care & Service (315 | 2.2%), Cleaning & Maintenance (282 | 1.9%), and Security & Protection (274 | 1.9%).
Services Occupations by Sex
Within the Services occupations in Elk River, the most male-oriented occupations are Firefighting & Prevention (84.8%), Security & Protection (74.1%), and Cleaning & Maintenance (70.2%), while the most female-oriented occupations are Personal Care & Service (97.8%), Food Preparation & Serving (75.9%), and Healthcare Support (70.3%).
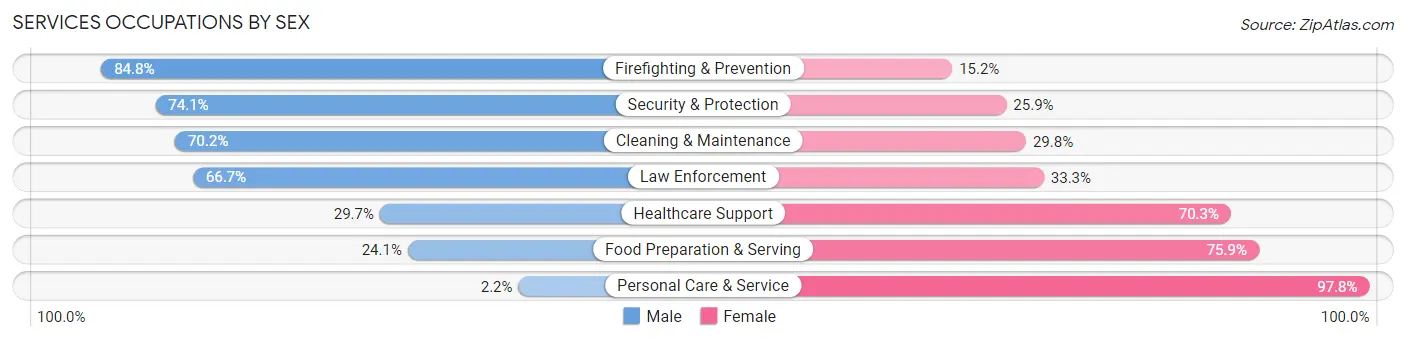
| Occupation | Male | Female |
| Healthcare Support | 156 (29.7%) | 370 (70.3%) |
| Security & Protection | 203 (74.1%) | 71 (25.9%) |
| Firefighting & Prevention | 95 (84.8%) | 17 (15.2%) |
| Law Enforcement | 108 (66.7%) | 54 (33.3%) |
| Food Preparation & Serving | 153 (24.1%) | 481 (75.9%) |
| Cleaning & Maintenance | 198 (70.2%) | 84 (29.8%) |
| Personal Care & Service | 7 (2.2%) | 308 (97.8%) |
| Total (Category) | 717 (35.3%) | 1,314 (64.7%) |
| Total (Overall) | 7,768 (53.8%) | 6,680 (46.2%) |
Sales and Office Occupations
The most common Sales and Office occupations in Elk River are Office & Administration (1,561 | 10.8%), and Sales & Related (1,214 | 8.4%).

Sales and Office Occupations by Sex

| Occupation | Male | Female |
| Sales & Related | 664 (54.7%) | 550 (45.3%) |
| Office & Administration | 367 (23.5%) | 1,194 (76.5%) |
| Total (Category) | 1,031 (37.1%) | 1,744 (62.8%) |
| Total (Overall) | 7,768 (53.8%) | 6,680 (46.2%) |
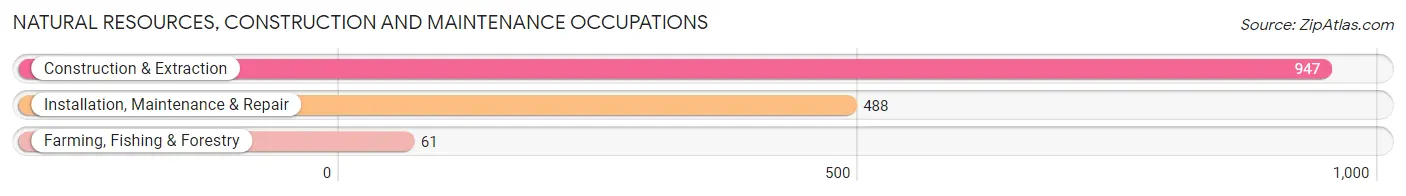
Natural Resources, Construction and Maintenance Occupations
The most common Natural Resources, Construction and Maintenance occupations in Elk River are Construction & Extraction (947 | 6.6%), Installation, Maintenance & Repair (488 | 3.4%), and Farming, Fishing & Forestry (61 | 0.4%).
Natural Resources, Construction and Maintenance Occupations by Sex

| Occupation | Male | Female |
| Farming, Fishing & Forestry | 34 (55.7%) | 27 (44.3%) |
| Construction & Extraction | 947 (100.0%) | 0 (0.0%) |
| Installation, Maintenance & Repair | 431 (88.3%) | 57 (11.7%) |
| Total (Category) | 1,412 (94.4%) | 84 (5.6%) |
| Total (Overall) | 7,768 (53.8%) | 6,680 (46.2%) |
Production, Transportation and Moving Occupations
The most common Production, Transportation and Moving occupations in Elk River are Production (1,424 | 9.9%), Material Moving (854 | 5.9%), and Transportation (382 | 2.6%).
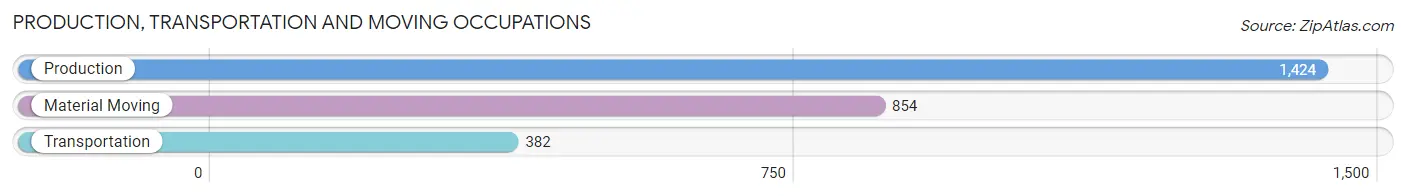
Production, Transportation and Moving Occupations by Sex
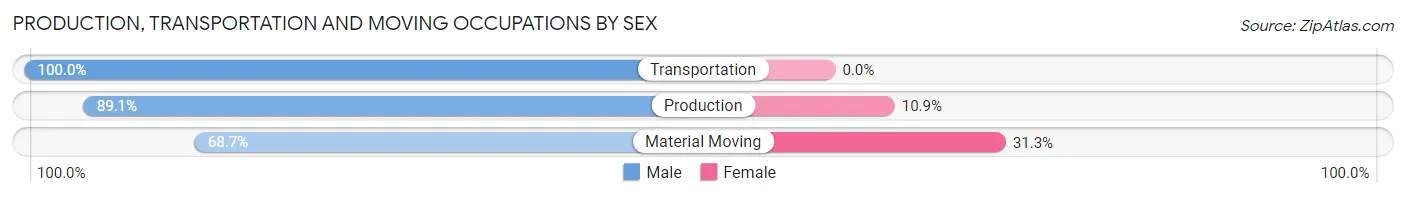
| Occupation | Male | Female |
| Production | 1,269 (89.1%) | 155 (10.9%) |
| Transportation | 382 (100.0%) | 0 (0.0%) |
| Material Moving | 587 (68.7%) | 267 (31.3%) |
| Total (Category) | 2,238 (84.1%) | 422 (15.9%) |
| Total (Overall) | 7,768 (53.8%) | 6,680 (46.2%) |
Employment Industries by Sex in Elk River
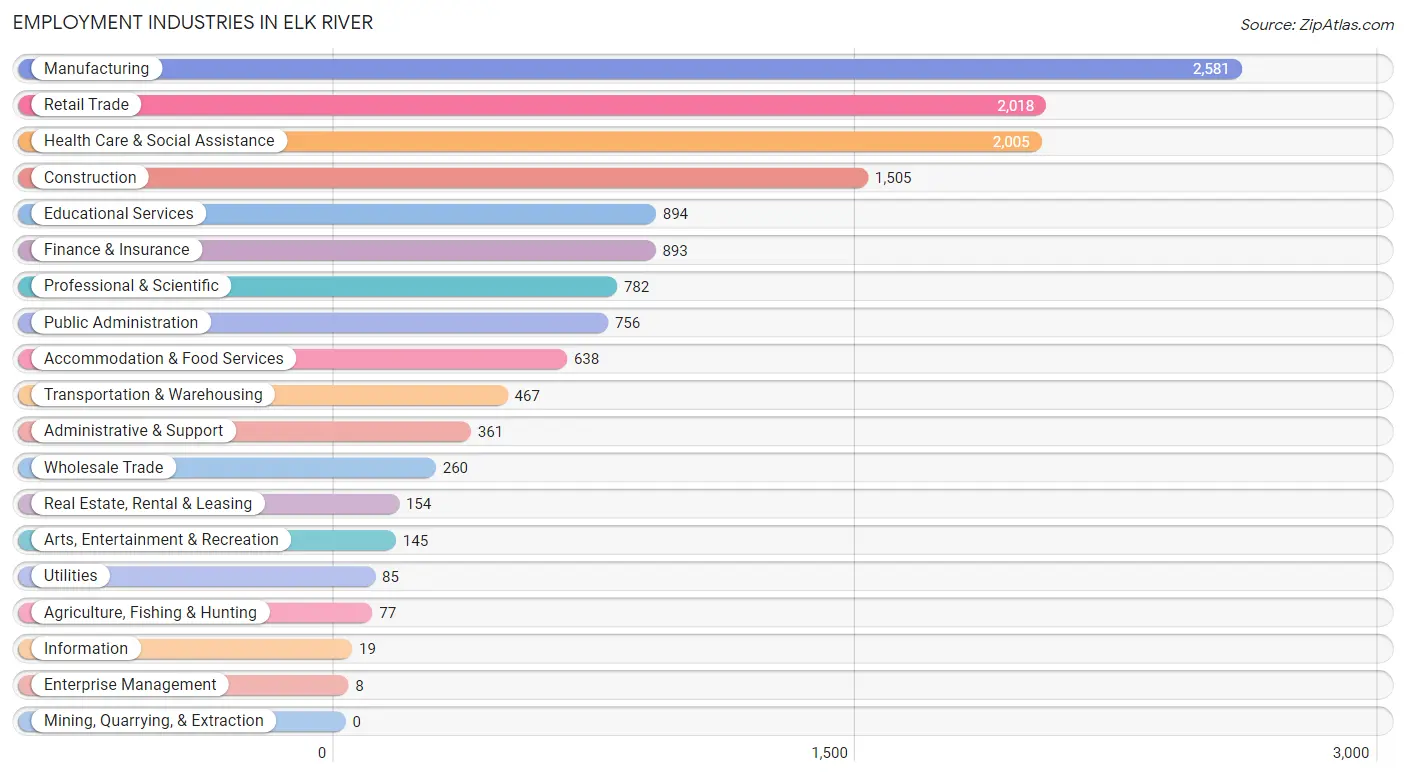
Employment Industries in Elk River
The major employment industries in Elk River include Manufacturing (2,581 | 17.9%), Retail Trade (2,018 | 14.0%), Health Care & Social Assistance (2,005 | 13.9%), Construction (1,505 | 10.4%), and Educational Services (894 | 6.2%).
Employment Industries by Sex in Elk River
The Elk River industries that see more men than women are Construction (85.0%), Administrative & Support (77.6%), and Manufacturing (74.4%), whereas the industries that tend to have a higher number of women are Enterprise Management (100.0%), Real Estate, Rental & Leasing (92.2%), and Educational Services (81.7%).
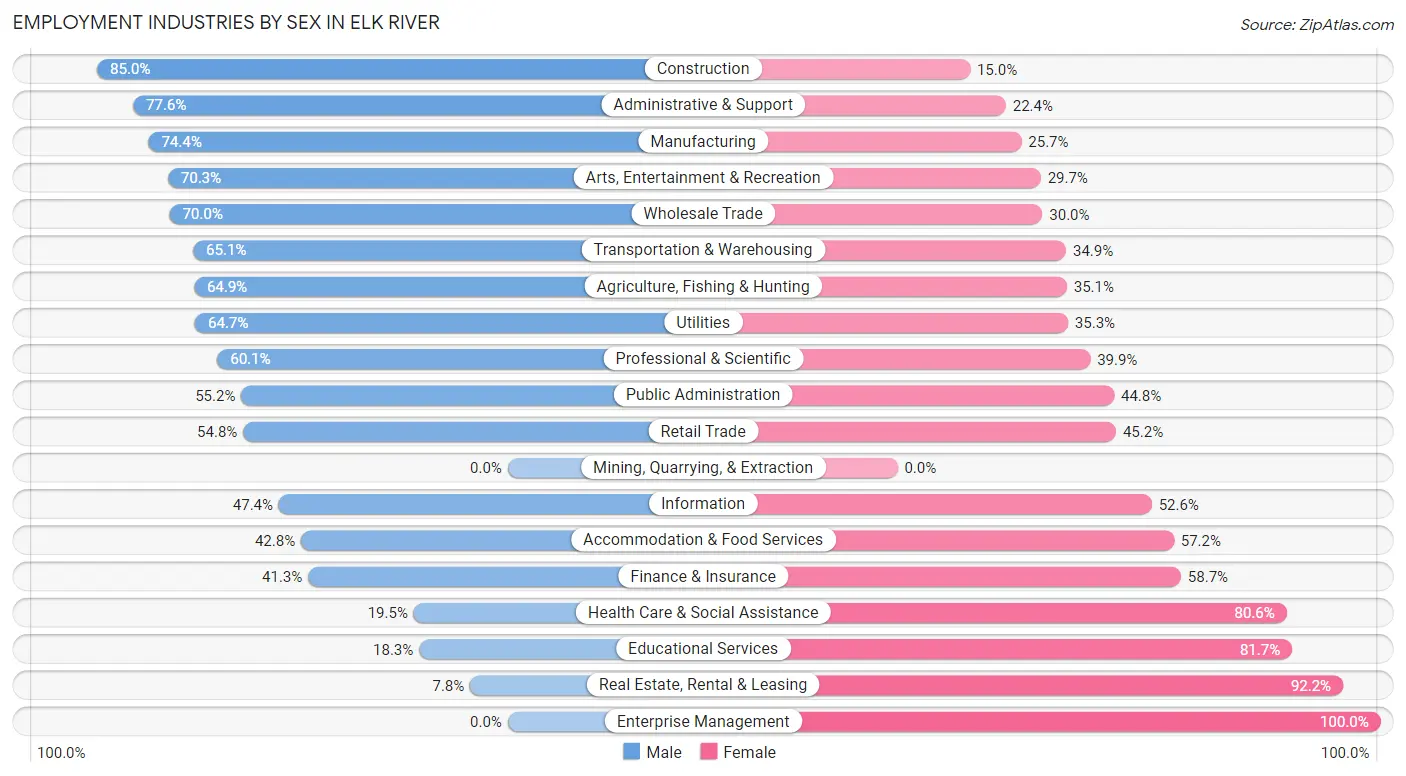
| Industry | Male | Female |
| Agriculture, Fishing & Hunting | 50 (64.9%) | 27 (35.1%) |
| Mining, Quarrying, & Extraction | 0 (0.0%) | 0 (0.0%) |
| Construction | 1,279 (85.0%) | 226 (15.0%) |
| Manufacturing | 1,919 (74.4%) | 662 (25.7%) |
| Wholesale Trade | 182 (70.0%) | 78 (30.0%) |
| Retail Trade | 1,105 (54.8%) | 913 (45.2%) |
| Transportation & Warehousing | 304 (65.1%) | 163 (34.9%) |
| Utilities | 55 (64.7%) | 30 (35.3%) |
| Information | 9 (47.4%) | 10 (52.6%) |
| Finance & Insurance | 369 (41.3%) | 524 (58.7%) |
| Real Estate, Rental & Leasing | 12 (7.8%) | 142 (92.2%) |
| Professional & Scientific | 470 (60.1%) | 312 (39.9%) |
| Enterprise Management | 0 (0.0%) | 8 (100.0%) |
| Administrative & Support | 280 (77.6%) | 81 (22.4%) |
| Educational Services | 164 (18.3%) | 730 (81.7%) |
| Health Care & Social Assistance | 390 (19.5%) | 1,615 (80.5%) |
| Arts, Entertainment & Recreation | 102 (70.3%) | 43 (29.7%) |
| Accommodation & Food Services | 273 (42.8%) | 365 (57.2%) |
| Public Administration | 417 (55.2%) | 339 (44.8%) |
| Total | 7,768 (53.8%) | 6,680 (46.2%) |
Education in Elk River
School Enrollment in Elk River
The most common levels of schooling among the 5,892 students in Elk River are high school (1,485 | 25.2%), middle school (1,270 | 21.5%), and college / undergraduate (1,030 | 17.5%).
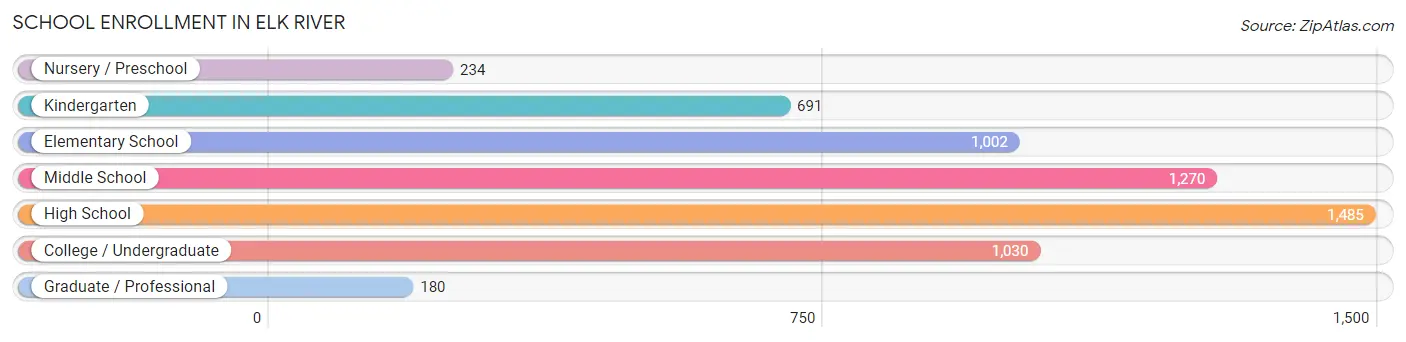
| School Level | # Students | % Students |
| Nursery / Preschool | 234 | 4.0% |
| Kindergarten | 691 | 11.7% |
| Elementary School | 1,002 | 17.0% |
| Middle School | 1,270 | 21.5% |
| High School | 1,485 | 25.2% |
| College / Undergraduate | 1,030 | 17.5% |
| Graduate / Professional | 180 | 3.0% |
| Total | 5,892 | 100.0% |
School Enrollment by Age by Funding Source in Elk River
Out of a total of 5,892 students who are enrolled in schools in Elk River, 648 (11.0%) attend a private institution, while the remaining 5,244 (89.0%) are enrolled in public schools. The age group of 25 to 34 year olds has the highest likelihood of being enrolled in private schools, with 128 (39.9% in the age bracket) enrolled. Conversely, the age group of 15 to 17 year olds has the lowest likelihood of being enrolled in a private school, with 1,044 (98.2% in the age bracket) attending a public institution.
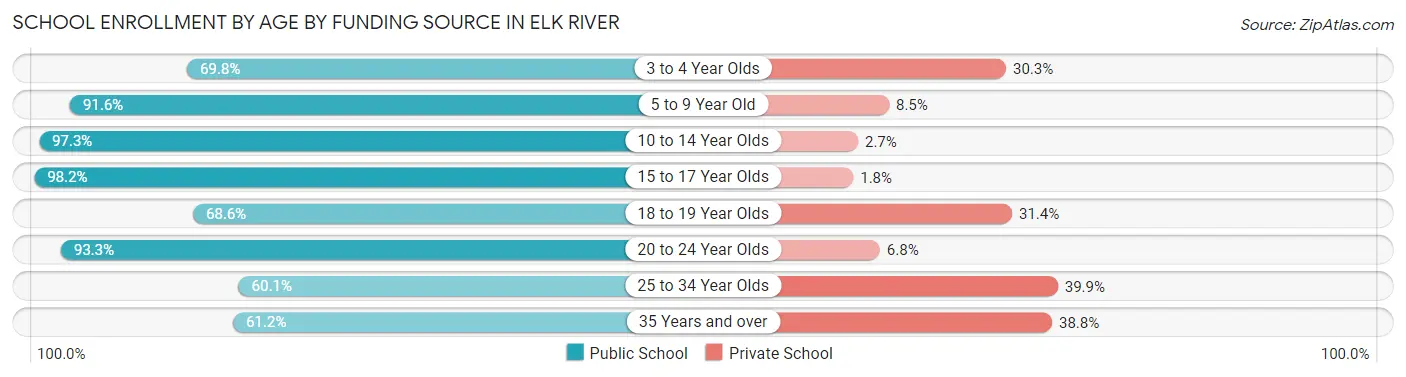
| Age Bracket | Public School | Private School |
| 3 to 4 Year Olds | 113 (69.8%) | 49 (30.2%) |
| 5 to 9 Year Old | 1,506 (91.5%) | 139 (8.5%) |
| 10 to 14 Year Olds | 1,564 (97.3%) | 43 (2.7%) |
| 15 to 17 Year Olds | 1,044 (98.2%) | 19 (1.8%) |
| 18 to 19 Year Olds | 243 (68.6%) | 111 (31.4%) |
| 20 to 24 Year Olds | 373 (93.2%) | 27 (6.8%) |
| 25 to 34 Year Olds | 193 (60.1%) | 128 (39.9%) |
| 35 Years and over | 208 (61.2%) | 132 (38.8%) |
| Total | 5,244 (89.0%) | 648 (11.0%) |
Educational Attainment by Field of Study in Elk River
Business (1,739 | 32.1%), education (650 | 12.0%), science & technology (506 | 9.3%), bio, nature & agricultural (448 | 8.3%), and engineering (368 | 6.8%) are the most common fields of study among 5,424 individuals in Elk River who have obtained a bachelor's degree or higher.
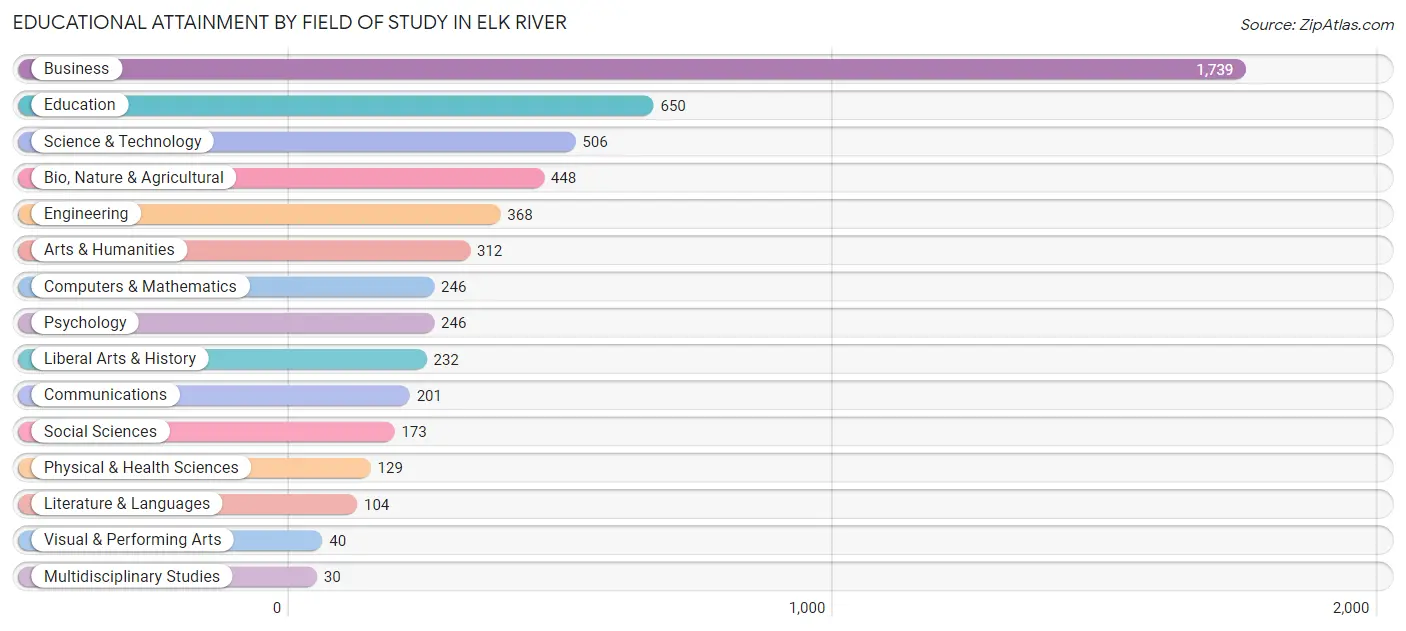
| Field of Study | # Graduates | % Graduates |
| Computers & Mathematics | 246 | 4.5% |
| Bio, Nature & Agricultural | 448 | 8.3% |
| Physical & Health Sciences | 129 | 2.4% |
| Psychology | 246 | 4.5% |
| Social Sciences | 173 | 3.2% |
| Engineering | 368 | 6.8% |
| Multidisciplinary Studies | 30 | 0.5% |
| Science & Technology | 506 | 9.3% |
| Business | 1,739 | 32.1% |
| Education | 650 | 12.0% |
| Literature & Languages | 104 | 1.9% |
| Liberal Arts & History | 232 | 4.3% |
| Visual & Performing Arts | 40 | 0.7% |
| Communications | 201 | 3.7% |
| Arts & Humanities | 312 | 5.8% |
| Total | 5,424 | 100.0% |
Transportation & Commute in Elk River
Vehicle Availability by Sex in Elk River
The most prevalent vehicle ownership categories in Elk River are males with 2 vehicles (3,163, accounting for 42.7%) and females with 2 vehicles (2,919, making up 47.4%).
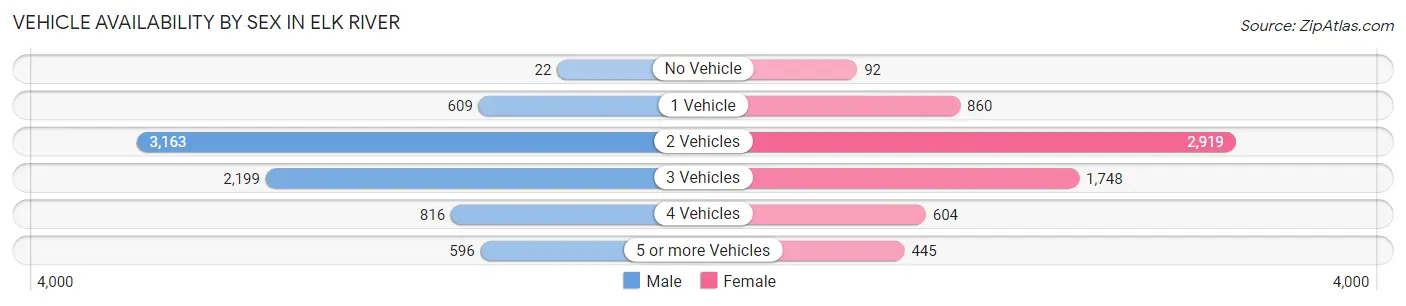
| Vehicles Available | Male | Female |
| No Vehicle | 22 (0.3%) | 92 (1.4%) |
| 1 Vehicle | 609 (8.2%) | 860 (12.9%) |
| 2 Vehicles | 3,163 (42.7%) | 2,919 (43.8%) |
| 3 Vehicles | 2,199 (29.7%) | 1,748 (26.2%) |
| 4 Vehicles | 816 (11.0%) | 604 (9.1%) |
| 5 or more Vehicles | 596 (8.1%) | 445 (6.7%) |
| Total | 7,405 (100.0%) | 6,668 (100.0%) |
Commute Time in Elk River
The most frequently occuring commute durations in Elk River are 10 to 14 minutes (1,644 commuters, 13.2%), 30 to 34 minutes (1,570 commuters, 12.6%), and 20 to 24 minutes (1,545 commuters, 12.4%).
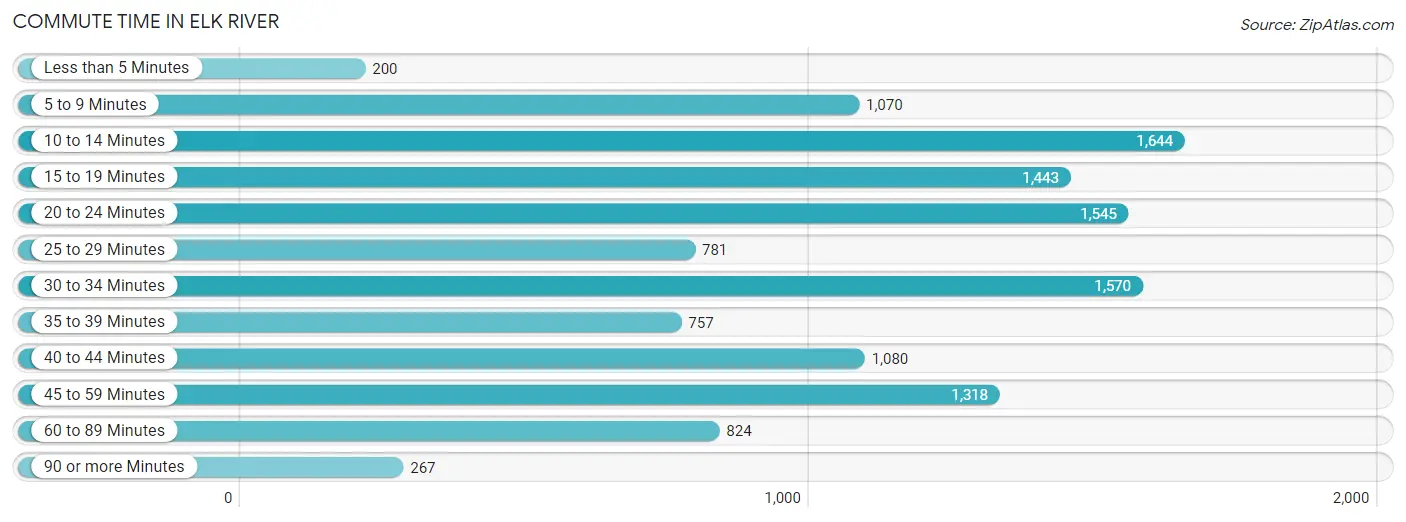
| Commute Time | # Commuters | % Commuters |
| Less than 5 Minutes | 200 | 1.6% |
| 5 to 9 Minutes | 1,070 | 8.6% |
| 10 to 14 Minutes | 1,644 | 13.2% |
| 15 to 19 Minutes | 1,443 | 11.5% |
| 20 to 24 Minutes | 1,545 | 12.4% |
| 25 to 29 Minutes | 781 | 6.2% |
| 30 to 34 Minutes | 1,570 | 12.6% |
| 35 to 39 Minutes | 757 | 6.1% |
| 40 to 44 Minutes | 1,080 | 8.6% |
| 45 to 59 Minutes | 1,318 | 10.5% |
| 60 to 89 Minutes | 824 | 6.6% |
| 90 or more Minutes | 267 | 2.1% |
Commute Time by Sex in Elk River
The most common commute times in Elk River are 30 to 34 minutes (942 commuters, 14.1%) for males and 10 to 14 minutes (840 commuters, 14.4%) for females.
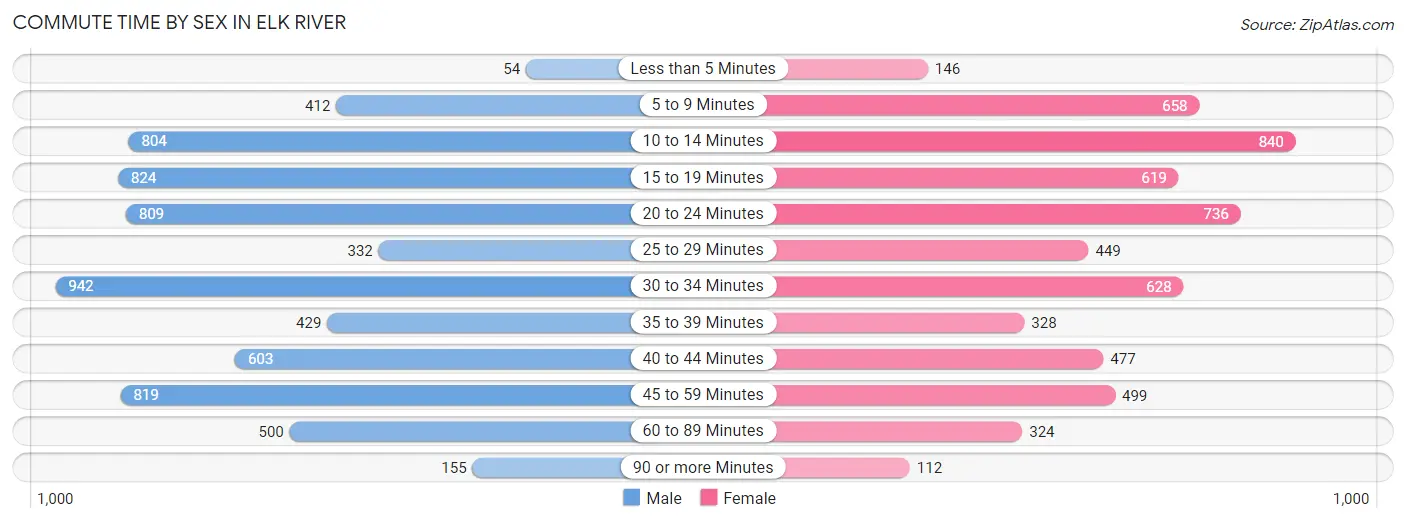
| Commute Time | Male | Female |
| Less than 5 Minutes | 54 (0.8%) | 146 (2.5%) |
| 5 to 9 Minutes | 412 (6.2%) | 658 (11.3%) |
| 10 to 14 Minutes | 804 (12.0%) | 840 (14.4%) |
| 15 to 19 Minutes | 824 (12.3%) | 619 (10.6%) |
| 20 to 24 Minutes | 809 (12.1%) | 736 (12.7%) |
| 25 to 29 Minutes | 332 (5.0%) | 449 (7.7%) |
| 30 to 34 Minutes | 942 (14.1%) | 628 (10.8%) |
| 35 to 39 Minutes | 429 (6.4%) | 328 (5.6%) |
| 40 to 44 Minutes | 603 (9.0%) | 477 (8.2%) |
| 45 to 59 Minutes | 819 (12.2%) | 499 (8.6%) |
| 60 to 89 Minutes | 500 (7.5%) | 324 (5.6%) |
| 90 or more Minutes | 155 (2.3%) | 112 (1.9%) |
Time of Departure to Work by Sex in Elk River
The most frequent times of departure to work in Elk River are 6:00 AM to 6:29 AM (1,117, 16.7%) for males and 7:00 AM to 7:29 AM (850, 14.6%) for females.
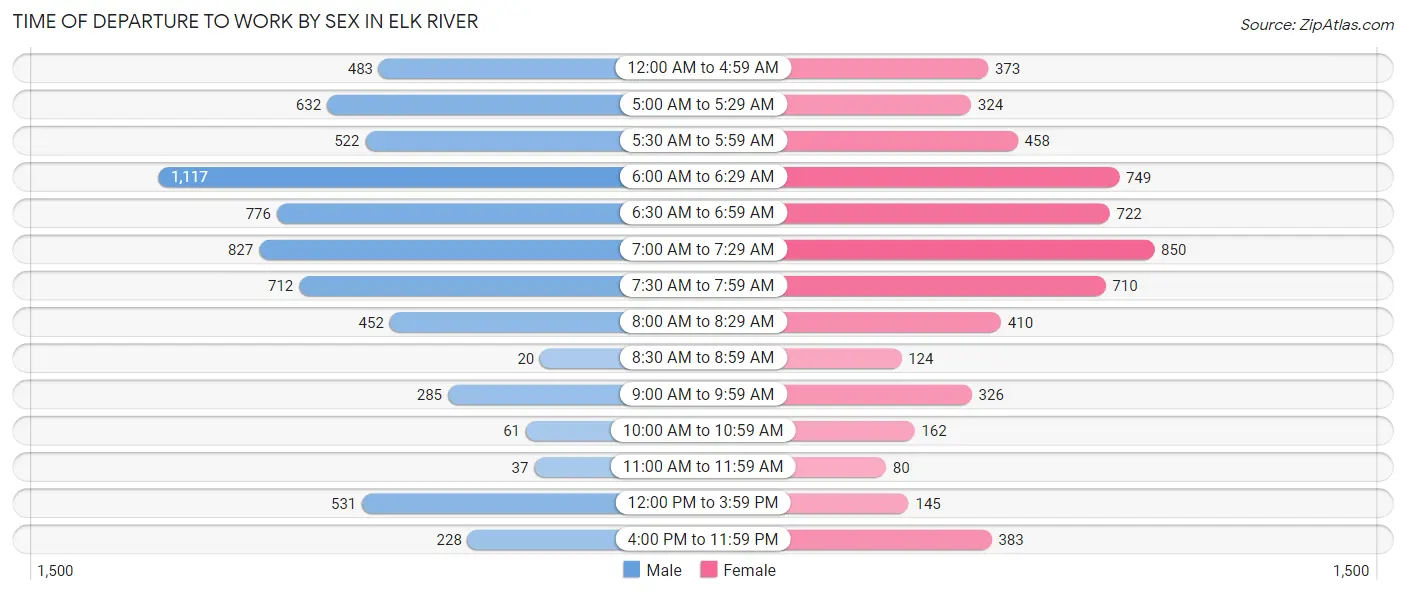
| Time of Departure | Male | Female |
| 12:00 AM to 4:59 AM | 483 (7.2%) | 373 (6.4%) |
| 5:00 AM to 5:29 AM | 632 (9.5%) | 324 (5.6%) |
| 5:30 AM to 5:59 AM | 522 (7.8%) | 458 (7.9%) |
| 6:00 AM to 6:29 AM | 1,117 (16.7%) | 749 (12.9%) |
| 6:30 AM to 6:59 AM | 776 (11.6%) | 722 (12.4%) |
| 7:00 AM to 7:29 AM | 827 (12.4%) | 850 (14.6%) |
| 7:30 AM to 7:59 AM | 712 (10.6%) | 710 (12.2%) |
| 8:00 AM to 8:29 AM | 452 (6.8%) | 410 (7.0%) |
| 8:30 AM to 8:59 AM | 20 (0.3%) | 124 (2.1%) |
| 9:00 AM to 9:59 AM | 285 (4.3%) | 326 (5.6%) |
| 10:00 AM to 10:59 AM | 61 (0.9%) | 162 (2.8%) |
| 11:00 AM to 11:59 AM | 37 (0.5%) | 80 (1.4%) |
| 12:00 PM to 3:59 PM | 531 (8.0%) | 145 (2.5%) |
| 4:00 PM to 11:59 PM | 228 (3.4%) | 383 (6.6%) |
| Total | 6,683 (100.0%) | 5,816 (100.0%) |
Housing Occupancy in Elk River
Occupancy by Ownership in Elk River
Of the total 9,449 dwellings in Elk River, owner-occupied units account for 7,420 (78.5%), while renter-occupied units make up 2,029 (21.5%).
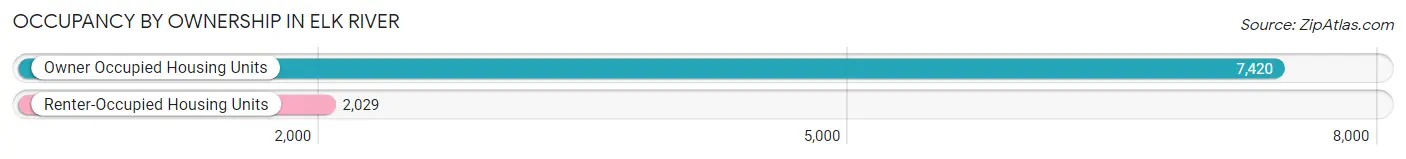
| Occupancy | # Housing Units | % Housing Units |
| Owner Occupied Housing Units | 7,420 | 78.5% |
| Renter-Occupied Housing Units | 2,029 | 21.5% |
| Total Occupied Housing Units | 9,449 | 100.0% |
Occupancy by Household Size in Elk River
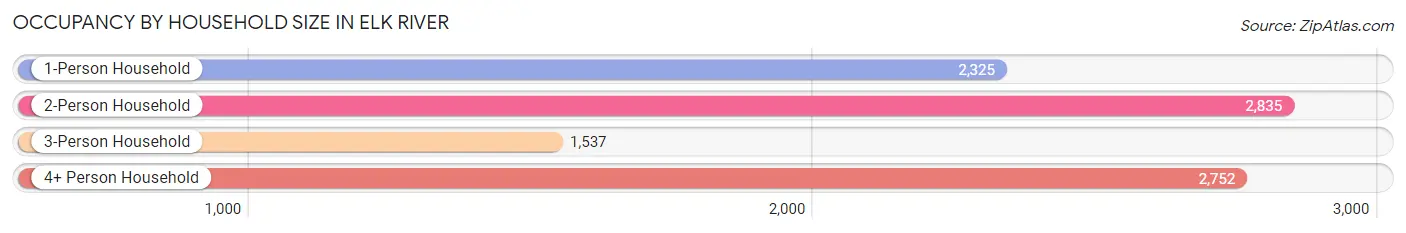
| Household Size | # Housing Units | % Housing Units |
| 1-Person Household | 2,325 | 24.6% |
| 2-Person Household | 2,835 | 30.0% |
| 3-Person Household | 1,537 | 16.3% |
| 4+ Person Household | 2,752 | 29.1% |
| Total Housing Units | 9,449 | 100.0% |
Occupancy by Ownership by Household Size in Elk River
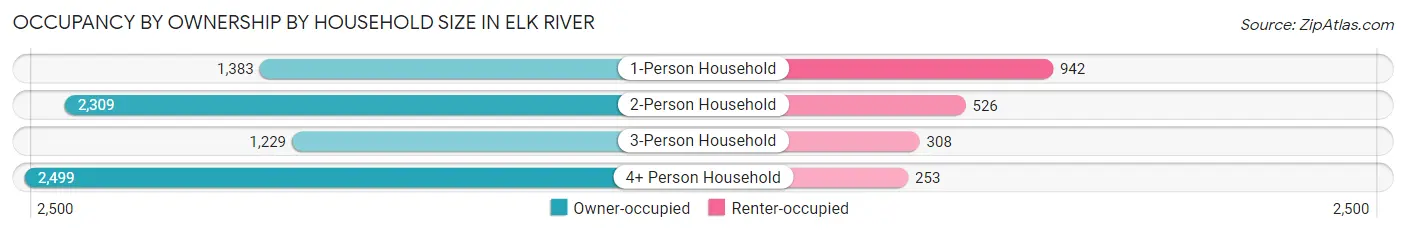
| Household Size | Owner-occupied | Renter-occupied |
| 1-Person Household | 1,383 (59.5%) | 942 (40.5%) |
| 2-Person Household | 2,309 (81.5%) | 526 (18.5%) |
| 3-Person Household | 1,229 (80.0%) | 308 (20.0%) |
| 4+ Person Household | 2,499 (90.8%) | 253 (9.2%) |
| Total Housing Units | 7,420 (78.5%) | 2,029 (21.5%) |
Occupancy by Educational Attainment in Elk River
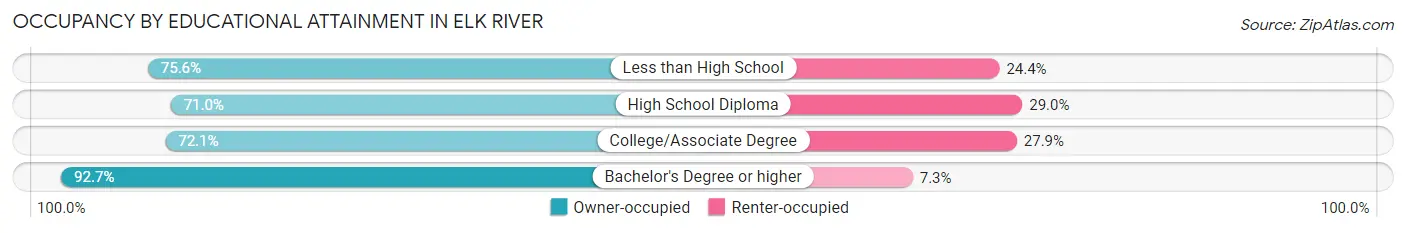
| Household Size | Owner-occupied | Renter-occupied |
| Less than High School | 374 (75.6%) | 121 (24.4%) |
| High School Diploma | 1,366 (71.0%) | 557 (29.0%) |
| College/Associate Degree | 2,935 (72.1%) | 1,136 (27.9%) |
| Bachelor's Degree or higher | 2,745 (92.7%) | 215 (7.3%) |
Occupancy by Age of Householder in Elk River
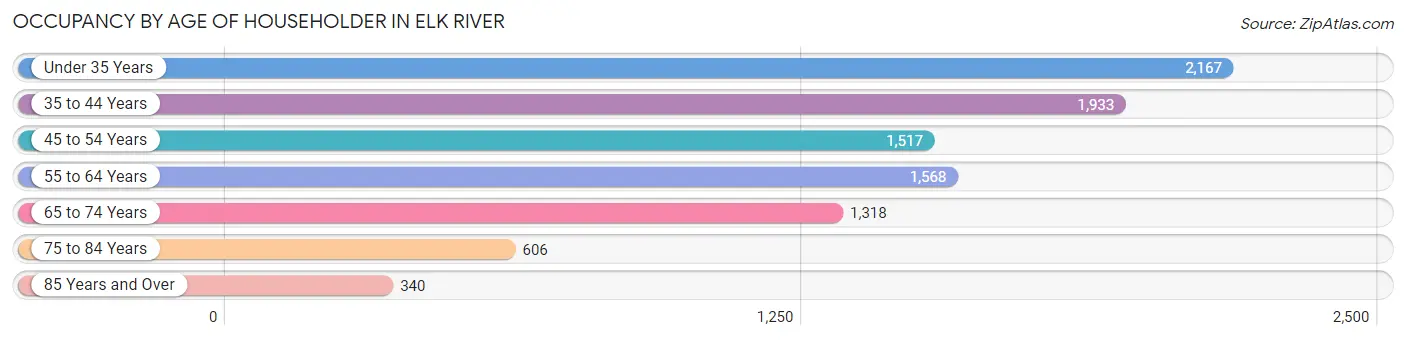
| Age Bracket | # Households | % Households |
| Under 35 Years | 2,167 | 22.9% |
| 35 to 44 Years | 1,933 | 20.5% |
| 45 to 54 Years | 1,517 | 16.1% |
| 55 to 64 Years | 1,568 | 16.6% |
| 65 to 74 Years | 1,318 | 14.0% |
| 75 to 84 Years | 606 | 6.4% |
| 85 Years and Over | 340 | 3.6% |
| Total | 9,449 | 100.0% |
Housing Finances in Elk River
Median Income by Occupancy in Elk River
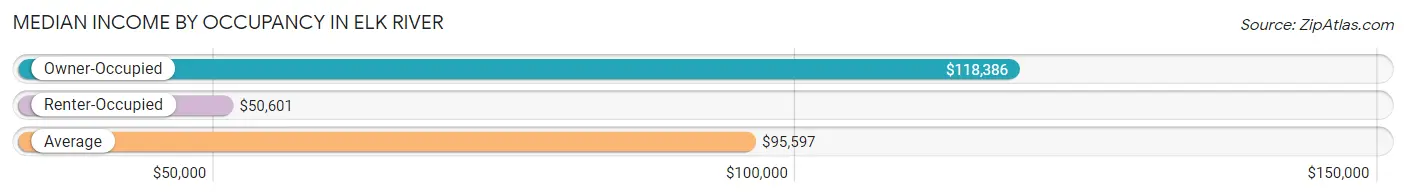
| Occupancy Type | # Households | Median Income |
| Owner-Occupied | 7,420 (78.5%) | $118,386 |
| Renter-Occupied | 2,029 (21.5%) | $50,601 |
| Average | 9,449 (100.0%) | $95,597 |
Occupancy by Householder Income Bracket in Elk River
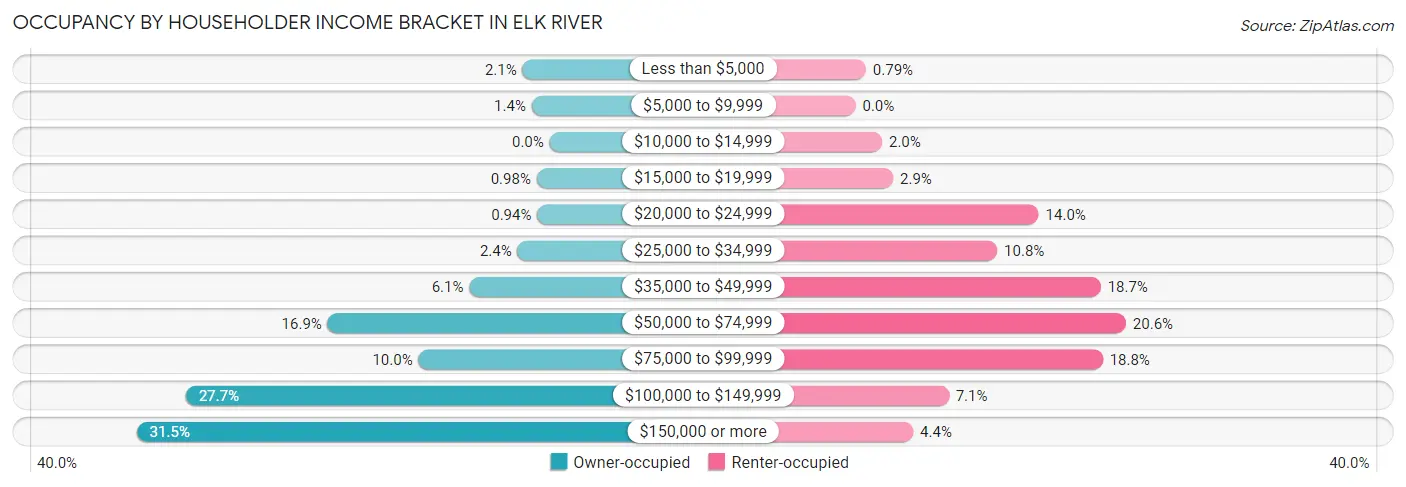
| Income Bracket | Owner-occupied | Renter-occupied |
| Less than $5,000 | 153 (2.1%) | 16 (0.8%) |
| $5,000 to $9,999 | 101 (1.4%) | 0 (0.0%) |
| $10,000 to $14,999 | 0 (0.0%) | 41 (2.0%) |
| $15,000 to $19,999 | 73 (1.0%) | 58 (2.9%) |
| $20,000 to $24,999 | 70 (0.9%) | 283 (14.0%) |
| $25,000 to $34,999 | 181 (2.4%) | 219 (10.8%) |
| $35,000 to $49,999 | 454 (6.1%) | 379 (18.7%) |
| $50,000 to $74,999 | 1,255 (16.9%) | 418 (20.6%) |
| $75,000 to $99,999 | 741 (10.0%) | 382 (18.8%) |
| $100,000 to $149,999 | 2,057 (27.7%) | 144 (7.1%) |
| $150,000 or more | 2,335 (31.5%) | 89 (4.4%) |
| Total | 7,420 (100.0%) | 2,029 (100.0%) |
Monthly Housing Cost Tiers in Elk River
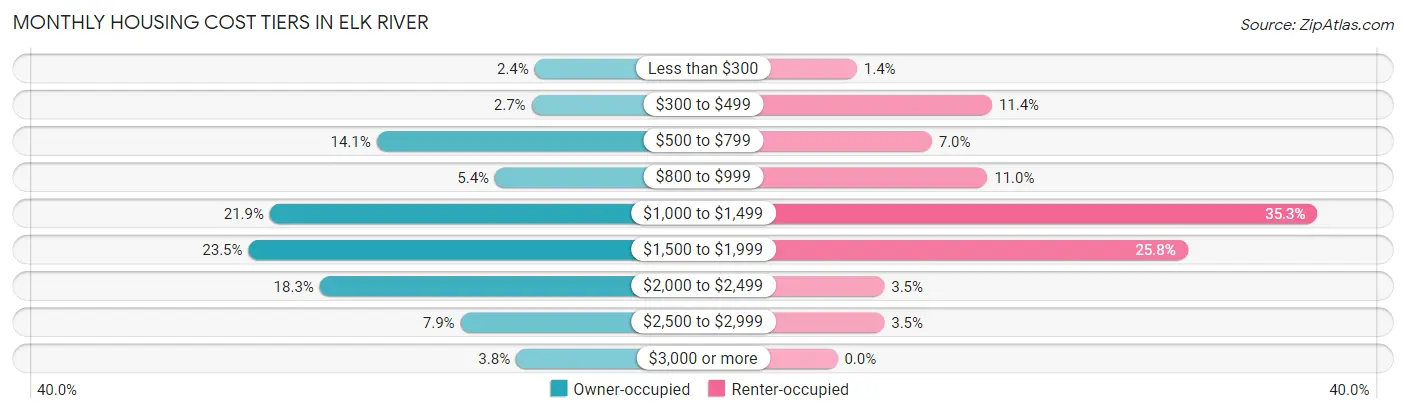
| Monthly Cost | Owner-occupied | Renter-occupied |
| Less than $300 | 181 (2.4%) | 29 (1.4%) |
| $300 to $499 | 198 (2.7%) | 231 (11.4%) |
| $500 to $799 | 1,045 (14.1%) | 141 (7.0%) |
| $800 to $999 | 398 (5.4%) | 224 (11.0%) |
| $1,000 to $1,499 | 1,628 (21.9%) | 717 (35.3%) |
| $1,500 to $1,999 | 1,745 (23.5%) | 523 (25.8%) |
| $2,000 to $2,499 | 1,356 (18.3%) | 70 (3.5%) |
| $2,500 to $2,999 | 586 (7.9%) | 70 (3.5%) |
| $3,000 or more | 283 (3.8%) | 0 (0.0%) |
| Total | 7,420 (100.0%) | 2,029 (100.0%) |
Physical Housing Characteristics in Elk River
Housing Structures in Elk River
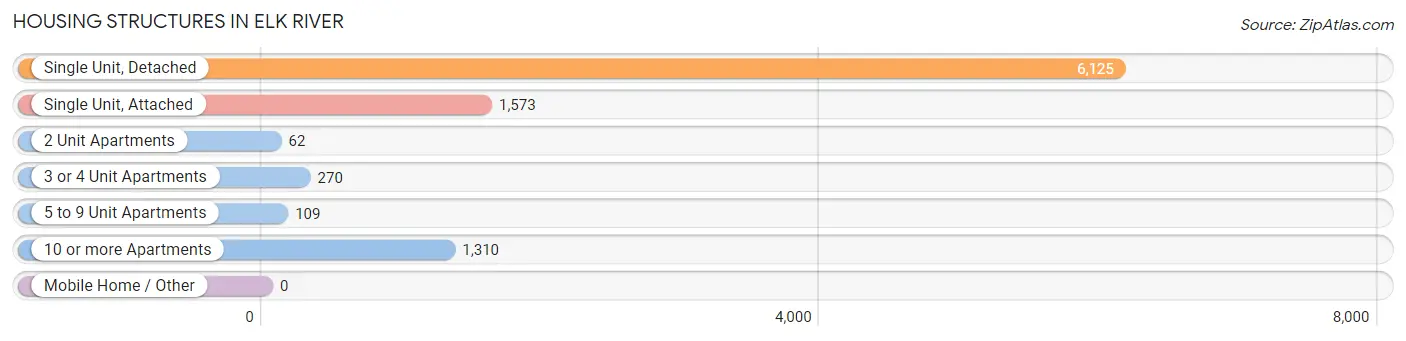
| Structure Type | # Housing Units | % Housing Units |
| Single Unit, Detached | 6,125 | 64.8% |
| Single Unit, Attached | 1,573 | 16.7% |
| 2 Unit Apartments | 62 | 0.7% |
| 3 or 4 Unit Apartments | 270 | 2.9% |
| 5 to 9 Unit Apartments | 109 | 1.1% |
| 10 or more Apartments | 1,310 | 13.9% |
| Mobile Home / Other | 0 | 0.0% |
| Total | 9,449 | 100.0% |
Housing Structures by Occupancy in Elk River
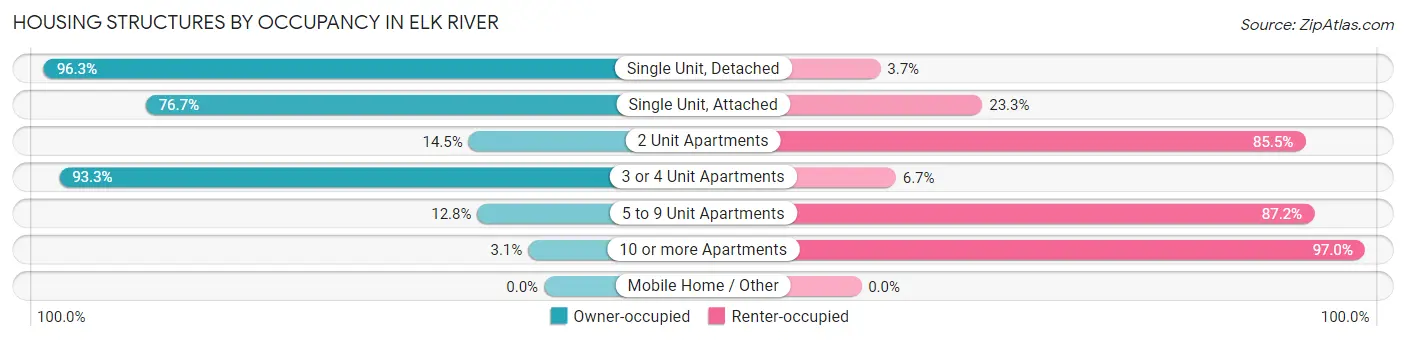
| Structure Type | Owner-occupied | Renter-occupied |
| Single Unit, Detached | 5,899 (96.3%) | 226 (3.7%) |
| Single Unit, Attached | 1,206 (76.7%) | 367 (23.3%) |
| 2 Unit Apartments | 9 (14.5%) | 53 (85.5%) |
| 3 or 4 Unit Apartments | 252 (93.3%) | 18 (6.7%) |
| 5 to 9 Unit Apartments | 14 (12.8%) | 95 (87.2%) |
| 10 or more Apartments | 40 (3.0%) | 1,270 (97.0%) |
| Mobile Home / Other | 0 (0.0%) | 0 (0.0%) |
| Total | 7,420 (78.5%) | 2,029 (21.5%) |
Housing Structures by Number of Rooms in Elk River
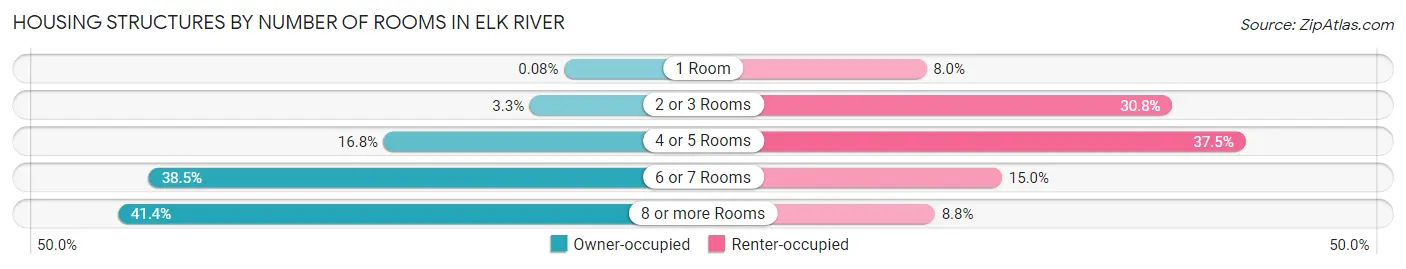
| Number of Rooms | Owner-occupied | Renter-occupied |
| 1 Room | 6 (0.1%) | 162 (8.0%) |
| 2 or 3 Rooms | 242 (3.3%) | 624 (30.7%) |
| 4 or 5 Rooms | 1,244 (16.8%) | 761 (37.5%) |
| 6 or 7 Rooms | 2,858 (38.5%) | 304 (15.0%) |
| 8 or more Rooms | 3,070 (41.4%) | 178 (8.8%) |
| Total | 7,420 (100.0%) | 2,029 (100.0%) |
Housing Structure by Heating Type in Elk River
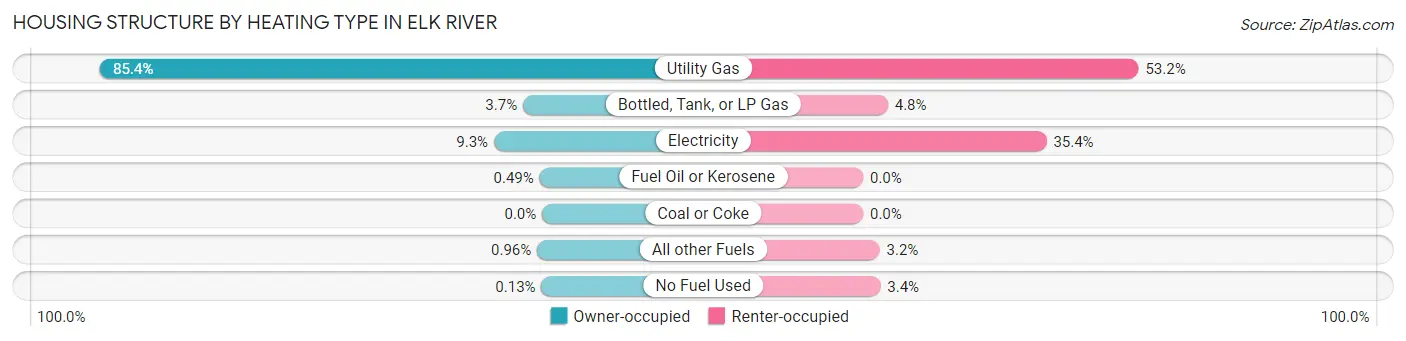
| Heating Type | Owner-occupied | Renter-occupied |
| Utility Gas | 6,339 (85.4%) | 1,080 (53.2%) |
| Bottled, Tank, or LP Gas | 274 (3.7%) | 97 (4.8%) |
| Electricity | 690 (9.3%) | 719 (35.4%) |
| Fuel Oil or Kerosene | 36 (0.5%) | 0 (0.0%) |
| Coal or Coke | 0 (0.0%) | 0 (0.0%) |
| All other Fuels | 71 (1.0%) | 65 (3.2%) |
| No Fuel Used | 10 (0.1%) | 68 (3.4%) |
| Total | 7,420 (100.0%) | 2,029 (100.0%) |
Household Vehicle Usage in Elk River
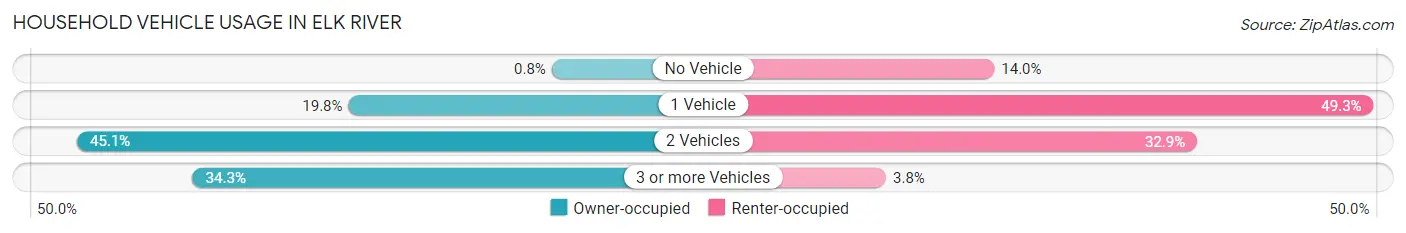
| Vehicles per Household | Owner-occupied | Renter-occupied |
| No Vehicle | 59 (0.8%) | 283 (14.0%) |
| 1 Vehicle | 1,468 (19.8%) | 1,001 (49.3%) |
| 2 Vehicles | 3,347 (45.1%) | 667 (32.9%) |
| 3 or more Vehicles | 2,546 (34.3%) | 78 (3.8%) |
| Total | 7,420 (100.0%) | 2,029 (100.0%) |
Real Estate & Mortgages in Elk River
Real Estate and Mortgage Overview in Elk River
| Characteristic | Without Mortgage | With Mortgage |
| Housing Units | 1,732 | 5,688 |
| Median Property Value | $307,500 | $305,100 |
| Median Household Income | $95,000 | $1,980 |
| Monthly Housing Costs | $730 | $283 |
| Real Estate Taxes | $3,915 | $21 |
Property Value by Mortgage Status in Elk River
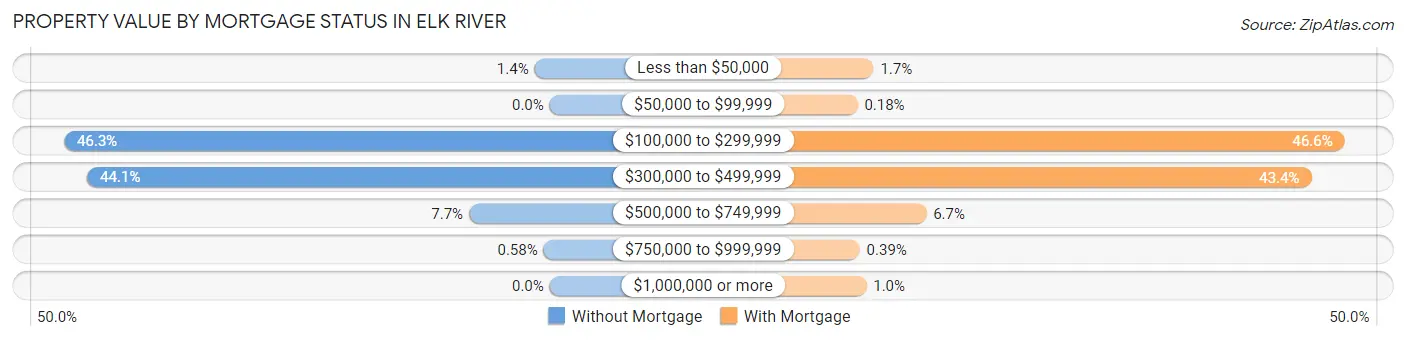
| Property Value | Without Mortgage | With Mortgage |
| Less than $50,000 | 25 (1.4%) | 97 (1.7%) |
| $50,000 to $99,999 | 0 (0.0%) | 10 (0.2%) |
| $100,000 to $299,999 | 801 (46.3%) | 2,649 (46.6%) |
| $300,000 to $499,999 | 763 (44.1%) | 2,469 (43.4%) |
| $500,000 to $749,999 | 133 (7.7%) | 383 (6.7%) |
| $750,000 to $999,999 | 10 (0.6%) | 22 (0.4%) |
| $1,000,000 or more | 0 (0.0%) | 58 (1.0%) |
| Total | 1,732 (100.0%) | 5,688 (100.0%) |
Household Income by Mortgage Status in Elk River
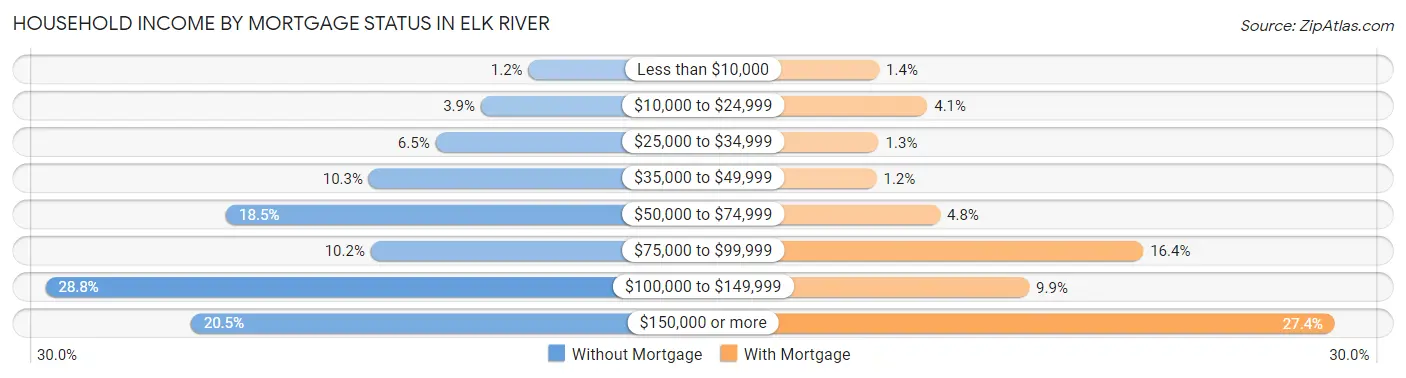
| Household Income | Without Mortgage | With Mortgage |
| Less than $10,000 | 21 (1.2%) | 77 (1.3%) |
| $10,000 to $24,999 | 68 (3.9%) | 233 (4.1%) |
| $25,000 to $34,999 | 113 (6.5%) | 75 (1.3%) |
| $35,000 to $49,999 | 179 (10.3%) | 68 (1.2%) |
| $50,000 to $74,999 | 320 (18.5%) | 275 (4.8%) |
| $75,000 to $99,999 | 177 (10.2%) | 935 (16.4%) |
| $100,000 to $149,999 | 499 (28.8%) | 564 (9.9%) |
| $150,000 or more | 355 (20.5%) | 1,558 (27.4%) |
| Total | 1,732 (100.0%) | 5,688 (100.0%) |
Property Value to Household Income Ratio in Elk River
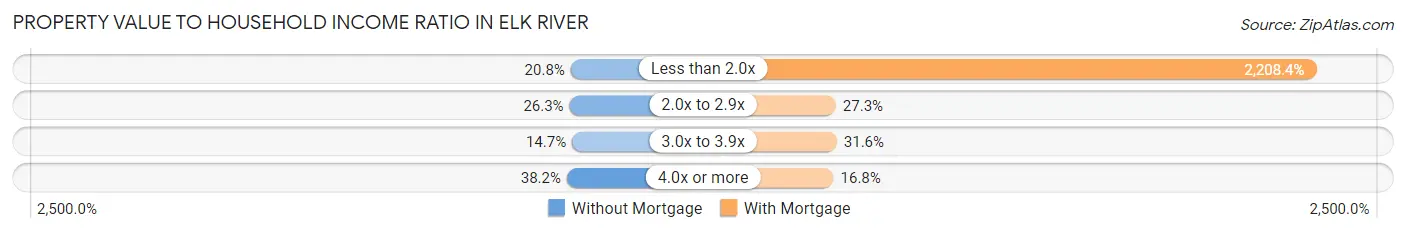
| Value-to-Income Ratio | Without Mortgage | With Mortgage |
| Less than 2.0x | 360 (20.8%) | 125,612 (2,208.4%) |
| 2.0x to 2.9x | 455 (26.3%) | 1,551 (27.3%) |
| 3.0x to 3.9x | 255 (14.7%) | 1,797 (31.6%) |
| 4.0x or more | 662 (38.2%) | 957 (16.8%) |
| Total | 1,732 (100.0%) | 5,688 (100.0%) |
Real Estate Taxes by Mortgage Status in Elk River

| Property Taxes | Without Mortgage | With Mortgage |
| Less than $800 | 8 (0.5%) | 0 (0.0%) |
| $800 to $1,499 | 98 (5.7%) | 189 (3.3%) |
| $800 to $1,499 | 1,590 (91.8%) | 328 (5.8%) |
| Total | 1,732 (100.0%) | 5,688 (100.0%) |
Health & Disability in Elk River
Health Insurance Coverage by Age in Elk River
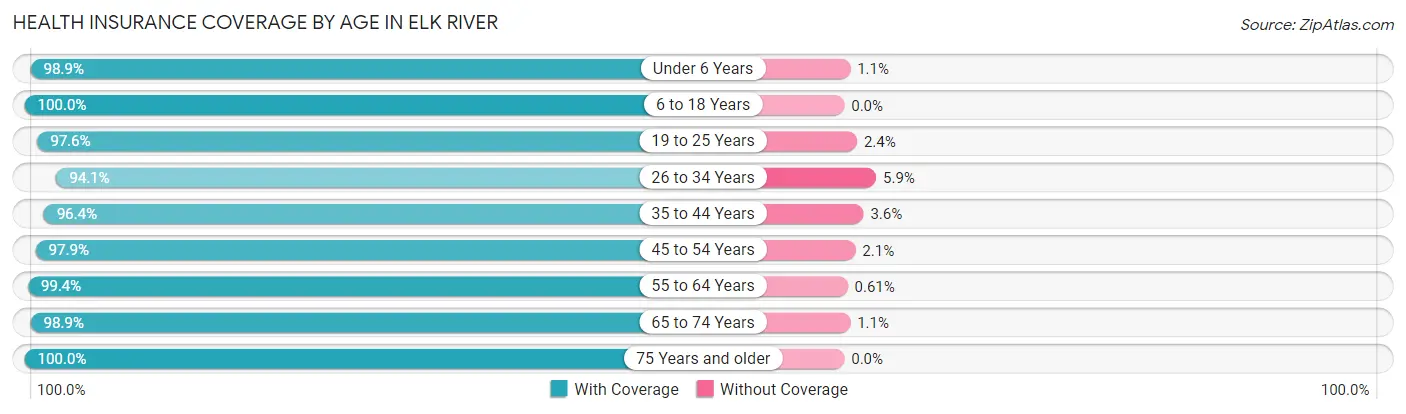
| Age Bracket | With Coverage | Without Coverage |
| Under 6 Years | 2,056 (98.9%) | 23 (1.1%) |
| 6 to 18 Years | 4,324 (100.0%) | 0 (0.0%) |
| 19 to 25 Years | 2,097 (97.6%) | 51 (2.4%) |
| 26 to 34 Years | 3,632 (94.1%) | 229 (5.9%) |
| 35 to 44 Years | 3,537 (96.4%) | 131 (3.6%) |
| 45 to 54 Years | 2,884 (97.9%) | 61 (2.1%) |
| 55 to 64 Years | 2,950 (99.4%) | 18 (0.6%) |
| 65 to 74 Years | 1,962 (98.9%) | 22 (1.1%) |
| 75 Years and older | 1,339 (100.0%) | 0 (0.0%) |
| Total | 24,781 (97.9%) | 535 (2.1%) |
Health Insurance Coverage by Citizenship Status in Elk River

| Citizenship Status | With Coverage | Without Coverage |
| Native Born | 2,056 (98.9%) | 23 (1.1%) |
| Foreign Born, Citizen | 4,324 (100.0%) | 0 (0.0%) |
| Foreign Born, not a Citizen | 2,097 (97.6%) | 51 (2.4%) |
Health Insurance Coverage by Household Income in Elk River
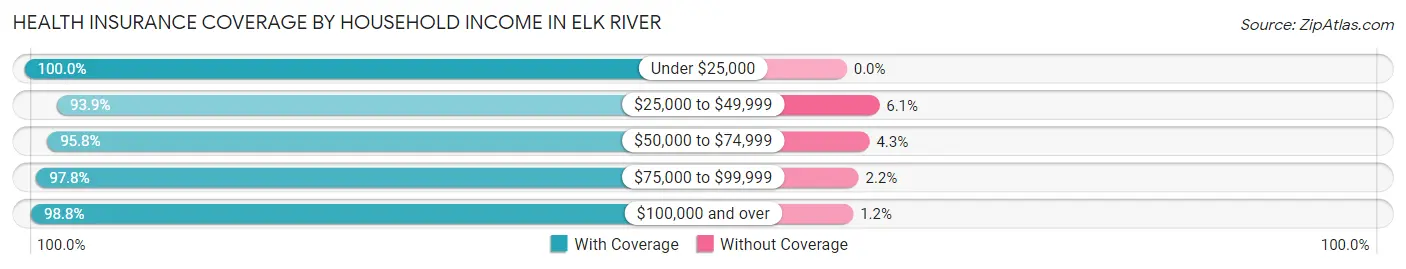
| Household Income | With Coverage | Without Coverage |
| Under $25,000 | 874 (100.0%) | 0 (0.0%) |
| $25,000 to $49,999 | 1,896 (93.9%) | 123 (6.1%) |
| $50,000 to $74,999 | 3,534 (95.8%) | 157 (4.3%) |
| $75,000 to $99,999 | 2,846 (97.8%) | 64 (2.2%) |
| $100,000 and over | 15,580 (98.8%) | 191 (1.2%) |
Public vs Private Health Insurance Coverage by Age in Elk River
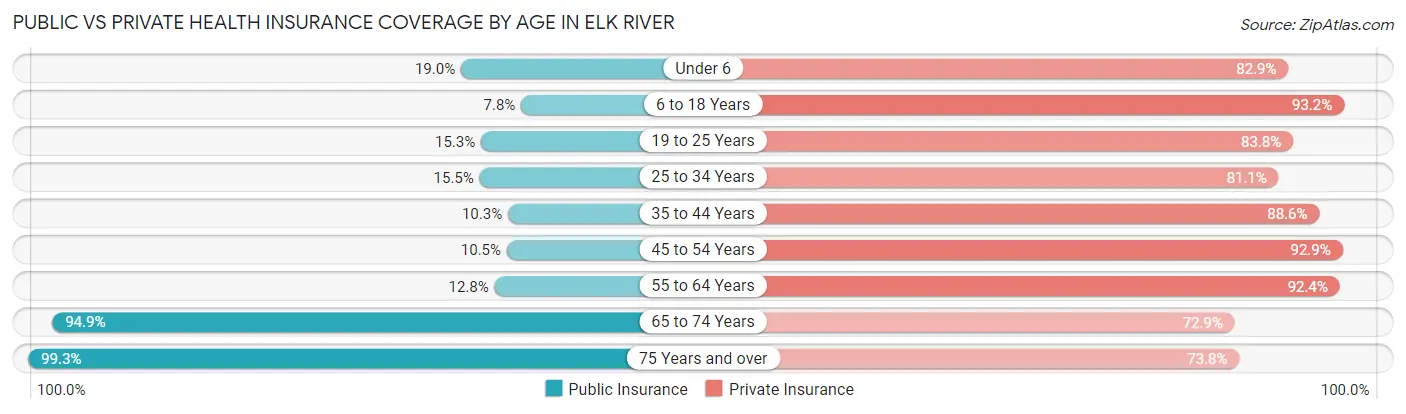
| Age Bracket | Public Insurance | Private Insurance |
| Under 6 | 395 (19.0%) | 1,723 (82.9%) |
| 6 to 18 Years | 338 (7.8%) | 4,031 (93.2%) |
| 19 to 25 Years | 328 (15.3%) | 1,799 (83.8%) |
| 25 to 34 Years | 600 (15.5%) | 3,131 (81.1%) |
| 35 to 44 Years | 377 (10.3%) | 3,251 (88.6%) |
| 45 to 54 Years | 309 (10.5%) | 2,737 (92.9%) |
| 55 to 64 Years | 379 (12.8%) | 2,743 (92.4%) |
| 65 to 74 Years | 1,882 (94.9%) | 1,447 (72.9%) |
| 75 Years and over | 1,330 (99.3%) | 988 (73.8%) |
| Total | 5,938 (23.5%) | 21,850 (86.3%) |
Disability Status by Sex by Age in Elk River
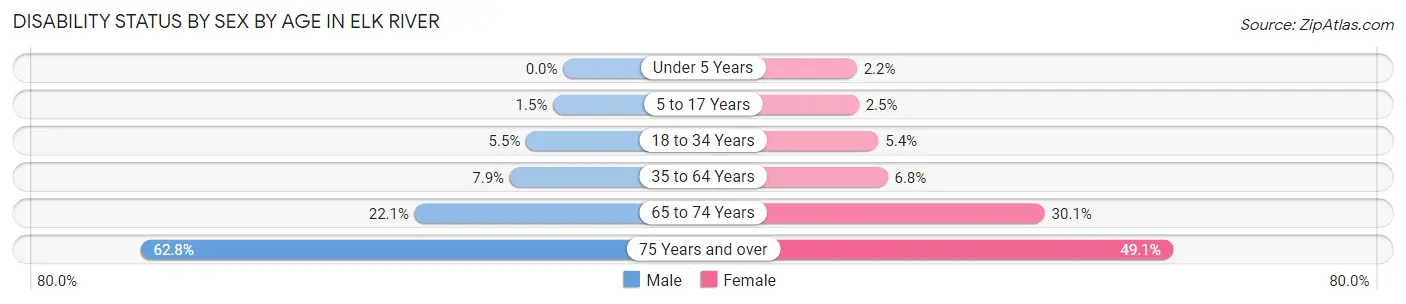
| Age Bracket | Male | Female |
| Under 5 Years | 0 (0.0%) | 21 (2.2%) |
| 5 to 17 Years | 34 (1.5%) | 55 (2.5%) |
| 18 to 34 Years | 192 (5.5%) | 150 (5.4%) |
| 35 to 64 Years | 371 (7.9%) | 333 (6.8%) |
| 65 to 74 Years | 193 (22.1%) | 334 (30.1%) |
| 75 Years and over | 415 (62.8%) | 333 (49.1%) |
Disability Class by Sex by Age in Elk River
Disability Class: Hearing Difficulty
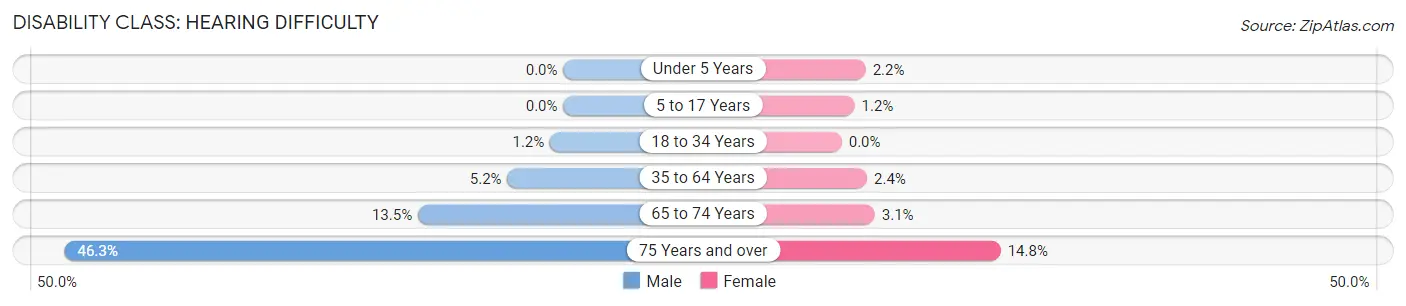
| Age Bracket | Male | Female |
| Under 5 Years | 0 (0.0%) | 21 (2.2%) |
| 5 to 17 Years | 0 (0.0%) | 26 (1.2%) |
| 18 to 34 Years | 43 (1.2%) | 0 (0.0%) |
| 35 to 64 Years | 243 (5.2%) | 115 (2.4%) |
| 65 to 74 Years | 118 (13.5%) | 34 (3.1%) |
| 75 Years and over | 306 (46.3%) | 100 (14.7%) |
Disability Class: Vision Difficulty
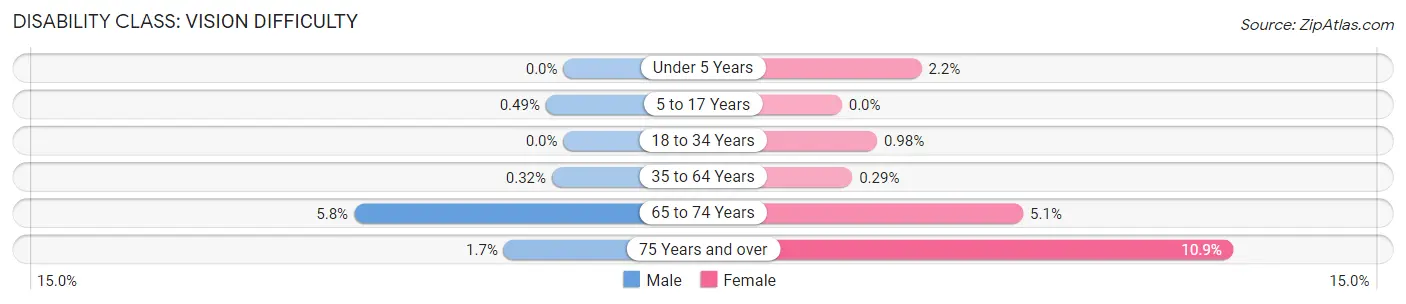
| Age Bracket | Male | Female |
| Under 5 Years | 0 (0.0%) | 21 (2.2%) |
| 5 to 17 Years | 11 (0.5%) | 0 (0.0%) |
| 18 to 34 Years | 0 (0.0%) | 27 (1.0%) |
| 35 to 64 Years | 15 (0.3%) | 14 (0.3%) |
| 65 to 74 Years | 51 (5.8%) | 56 (5.1%) |
| 75 Years and over | 11 (1.7%) | 74 (10.9%) |
Disability Class: Cognitive Difficulty
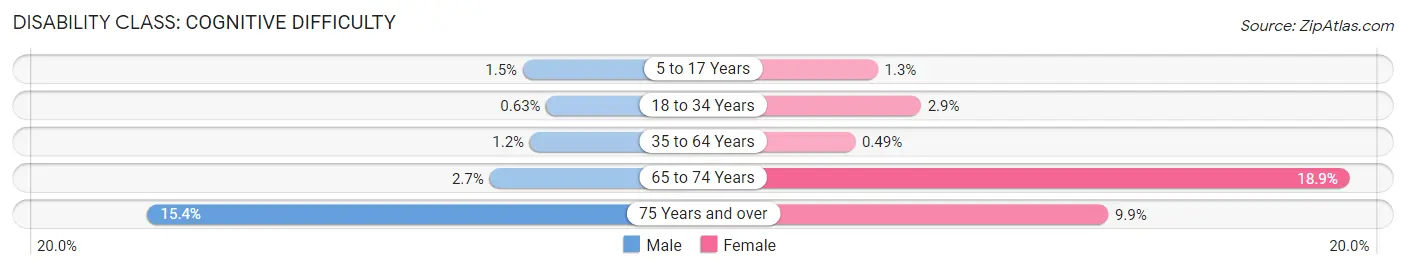
| Age Bracket | Male | Female |
| 5 to 17 Years | 34 (1.5%) | 29 (1.3%) |
| 18 to 34 Years | 22 (0.6%) | 81 (2.9%) |
| 35 to 64 Years | 58 (1.2%) | 24 (0.5%) |
| 65 to 74 Years | 24 (2.7%) | 209 (18.9%) |
| 75 Years and over | 102 (15.4%) | 67 (9.9%) |
Disability Class: Ambulatory Difficulty
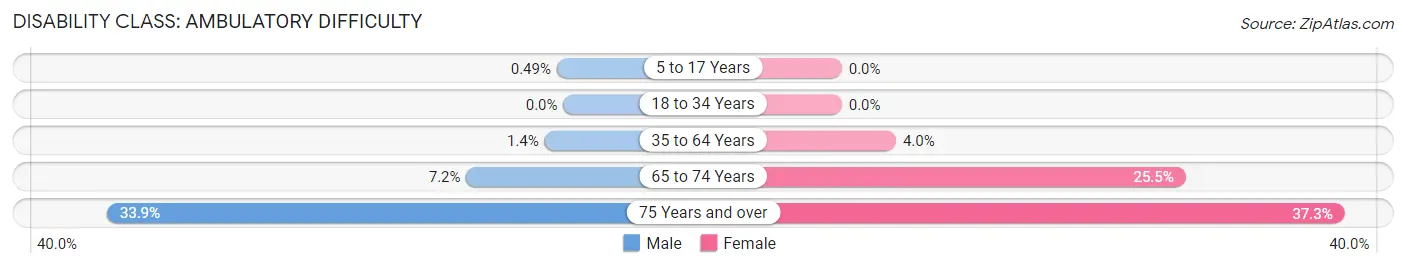
| Age Bracket | Male | Female |
| 5 to 17 Years | 11 (0.5%) | 0 (0.0%) |
| 18 to 34 Years | 0 (0.0%) | 0 (0.0%) |
| 35 to 64 Years | 65 (1.4%) | 197 (4.0%) |
| 65 to 74 Years | 63 (7.2%) | 283 (25.5%) |
| 75 Years and over | 224 (33.9%) | 253 (37.3%) |
Disability Class: Self-Care Difficulty
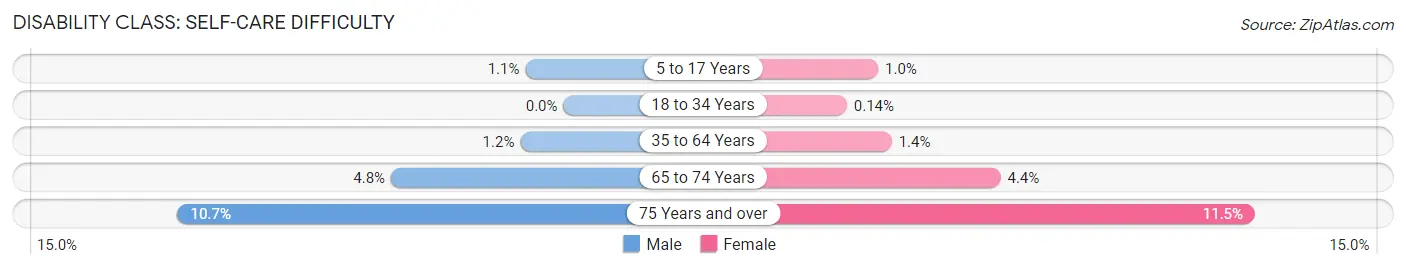
| Age Bracket | Male | Female |
| 5 to 17 Years | 24 (1.1%) | 22 (1.0%) |
| 18 to 34 Years | 0 (0.0%) | 4 (0.1%) |
| 35 to 64 Years | 56 (1.2%) | 68 (1.4%) |
| 65 to 74 Years | 42 (4.8%) | 49 (4.4%) |
| 75 Years and over | 71 (10.7%) | 78 (11.5%) |
Technology Access in Elk River
Computing Device Access in Elk River
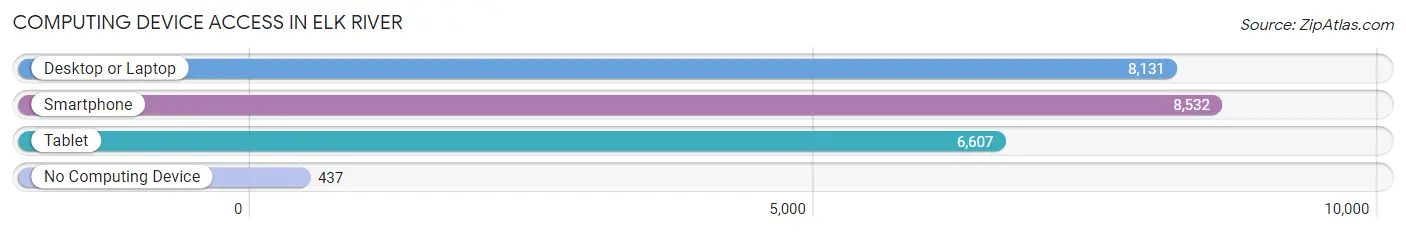
| Device Type | # Households | % Households |
| Desktop or Laptop | 8,131 | 86.1% |
| Smartphone | 8,532 | 90.3% |
| Tablet | 6,607 | 69.9% |
| No Computing Device | 437 | 4.6% |
| Total | 9,449 | 100.0% |
Internet Access in Elk River
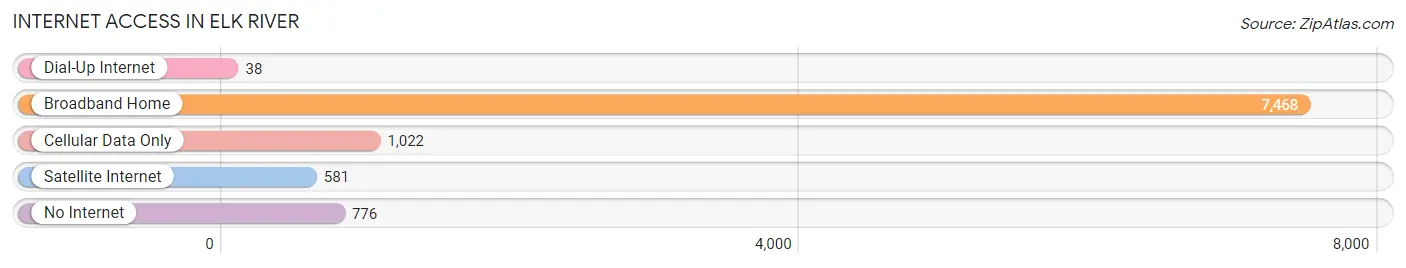
| Internet Type | # Households | % Households |
| Dial-Up Internet | 38 | 0.4% |
| Broadband Home | 7,468 | 79.0% |
| Cellular Data Only | 1,022 | 10.8% |
| Satellite Internet | 581 | 6.1% |
| No Internet | 776 | 8.2% |
| Total | 9,449 | 100.0% |
Elk River Summary
Elk River, Minnesota is a city located in Sherburne County, Minnesota, United States. The city is situated along the banks of the Elk River, which is a tributary of the Mississippi River. The city is located approximately 30 miles northwest of Minneapolis and is part of the Twin Cities metropolitan area. As of the 2010 census, the city had a population of 22,974.
History
The area that is now Elk River was first settled in the late 1800s by settlers from Sweden and Norway. The first permanent settlement was established in 1856 by a group of Swedish immigrants led by John Anderson. The settlement was originally known as Anderson’s Settlement, but was later renamed Elk River after the nearby river.
In 1872, the first post office was established in the settlement and the town was officially incorporated in 1877. The town grew slowly but steadily over the next several decades, and by the early 1900s, the population had grown to over 1,000.
In the early 20th century, the town began to experience rapid growth due to the construction of the Great Northern Railway. The railway connected the town to Minneapolis and St. Paul, and allowed for the easy transportation of goods and people. This led to an influx of new residents and businesses, and the population of the town grew to over 5,000 by the 1950s.
Geography
Elk River is located in Sherburne County, Minnesota, approximately 30 miles northwest of Minneapolis. The city is situated along the banks of the Elk River, which is a tributary of the Mississippi River. The city has a total area of 16.2 square miles, of which 15.9 square miles is land and 0.3 square miles is water.
The city is located in a region of rolling hills and forests, and is surrounded by several lakes, including Big Lake, Lake Orono, and Lake George. The city is also located near the Sherburne National Wildlife Refuge, which is a popular destination for bird watching and other outdoor activities.
Economy
Elk River’s economy is largely based on manufacturing and retail. The city is home to several large manufacturing companies, including 3M, Andersen Windows, and Polaris Industries. The city is also home to several large retail stores, including Target, Walmart, and Home Depot.
The city is also home to several smaller businesses, including restaurants, bars, and other retail stores. The city is also home to several medical facilities, including the Elk River Medical Center and the Elk River Surgery Center.
Demographics
As of the 2010 census, the city had a population of 22,974. The racial makeup of the city was 92.3% White, 2.3% African American, 0.5% Native American, 1.7% Asian, 0.1% Pacific Islander, 1.7% from other races, and 1.4% from two or more races. Hispanic or Latino of any race were 4.2% of the population.
The median income for a household in the city was $60,945, and the median income for a family was $71,945. The per capita income for the city was $27,945. About 4.3% of families and 6.2% of the population were below the poverty line, including 8.2% of those under age 18 and 4.2% of those age 65 or over.
Common Questions
What is Per Capita Income in Elk River?
Per Capita income in Elk River is $42,745.
What is the Median Family Income in Elk River?
Median Family Income in Elk River is $115,089.
What is the Median Household income in Elk River?
Median Household Income in Elk River is $95,597.
What is Income or Wage Gap in Elk River?
Income or Wage Gap in Elk River is 16.1%.
Women in Elk River earn 83.9 cents for every dollar earned by a man.
What is Family Income Deficit in Elk River?
Family Income Deficit in Elk River is $8,961.
Families that are below poverty line in Elk River earn $8,961 less on average than the poverty threshold level.
What is Inequality or Gini Index in Elk River?
Inequality or Gini Index in Elk River is 0.38.
What is the Total Population of Elk River?
Total Population of Elk River is 25,936.
What is the Total Male Population of Elk River?
Total Male Population of Elk River is 13,216.
What is the Total Female Population of Elk River?
Total Female Population of Elk River is 12,720.
What is the Ratio of Males per 100 Females in Elk River?
There are 103.90 Males per 100 Females in Elk River.
What is the Ratio of Females per 100 Males in Elk River?
There are 96.25 Females per 100 Males in Elk River.
What is the Median Population Age in Elk River?
Median Population Age in Elk River is 35.7 Years.
What is the Average Family Size in Elk River
Average Family Size in Elk River is 3.2 People.
What is the Average Household Size in Elk River
Average Household Size in Elk River is 2.7 People.
How Large is the Labor Force in Elk River?
There are 14,737 People in the Labor Forcein in Elk River.
What is the Percentage of People in the Labor Force in Elk River?
72.1% of People are in the Labor Force in Elk River.
What is the Unemployment Rate in Elk River?
Unemployment Rate in Elk River is 2.0%.